User login
Impact of Continuous Glucose Monitoring for American Indian/Alaska Native Adults With Type 2 Diabetes Mellitus Not Using Insulin
Impact of Continuous Glucose Monitoring for American Indian/Alaska Native Adults With Type 2 Diabetes Mellitus Not Using Insulin
Diabetes mellitus (DM) is a national health crisis affecting > 38 million people (11.6%) in the United States.1 American Indian and Alaska Native (AI/AN) adults are disproportionately affected, with a prevalence of 14.5%—the highest among all racial and ethnic groups.1 Type 2 DM (T2DM) accounts for 90% to 95% of all DM cases and is a leading cause of morbidity and mortality due to its association with cardiovascular disease, kidney failure, and other complications.2
Maintaining glycemic control is important for managing T2DM and preventing microvascular and macrovascular complications.3 The cornerstone of diabetes self-management has been patient self-monitored blood glucose (SMBG) using finger-stick glucometers.4 However, SMBG provides measurements from a single point in time and requires frequent, painful, and inconvenient finger pricks, leading to decreased adherence.5,6 These limitations negatively affect patient engagement and overall glycemic control.7
Continuous glucose monitors (CGMs) offer real-time, continuous glucose readings and trends.8 CGMs improve glycemic control and reduce hypoglycemic episodes in patients who are insulin-dependent.9,10 Flash glucose monitors, a type of CGM that requires scanning to obtain glucose readings, provide similar benefits.11 Despite these demonstrated advantages, research has primarily focused on insulin-dependent populations, leaving a significant gap in understanding the effect of CGMs on patients with T2DM who are not insulin-dependent.12
Given the high prevalence of T2DM among AI/AN populations and the potential benefits of CGMs, this study sought to evaluate the effect of CGM use on glycemic control and other health metrics in patients with non–insulin-dependent T2DM in an AI/AN population. This focus addresses a critical knowledge gap and may inform clinical practices and policies to improve diabetes management in this high-risk group.
Methods
A retrospective observational study was conducted using deidentified electronic health records (EHRs) from 2019 to 2024 at a federally operated outpatient Indian Health Service (IHS) clinic serving an AI/AN population in the IHS Portland Area (Oregon, Washington, Idaho). The study protocol was reviewed and deemed exempt by institutional review boards at Washington State University and the Portland Area IHS.
Study Population
This study included patients diagnosed with non–insulin-dependent T2DM, had used a CGM for ≥ 1 year, and had hemoglobin A1c (HbA1c) measurements within 4 months prior to CGM initiation (baseline) and within ± 4 months after 1 year of CGM use. For other health metrics, including blood pressure (BP), weight, low-density lipoprotein cholesterol (LDL-C), and estimated glomerular filtration rate (eGFR), this study required measurements within 6 months before CGM initiation and within 6 months after 1 year of CGM use. The baseline HbA1c in the dataset ranged from 5.3% to > 14%.
Patients were excluded if they used insulin during the study period, had incomplete laboratory or clinical data for the required time frame, or had < 1 year of CGM use. The dataset did not include detailed information on oral DM medications; thus, we could not report or account for the type or number of oral hypoglycemic agents used by the patients. The IHS clinical applications coordinator compiled the dataset from the EHR, identifying patients who were prescribed and received a CGM at the clinic. All patients used the Abbott Freestyle Libre CGM, the only formulary CGM available at the clinic during the study period.
A 1-year follow-up endpoint was selected for several reasons: (1) to capture potential seasonal variations in diet and activity; (2) to align with the clinic’s standard practice of annual comprehensive diabetes evaluations; and (3) to allow sufficient time for patients to adapt to CGM use and reflect any meaningful changes in glycemic control.
All patients received standard DM care according to clinic protocols, which included DM self-management education and training. Patients met with the diabetes educator at least once, during which the educator emphasized making informed decisions using CGM data, such as adjusting dietary choices and physical activity levels to manage blood glucose concentrations effectively.
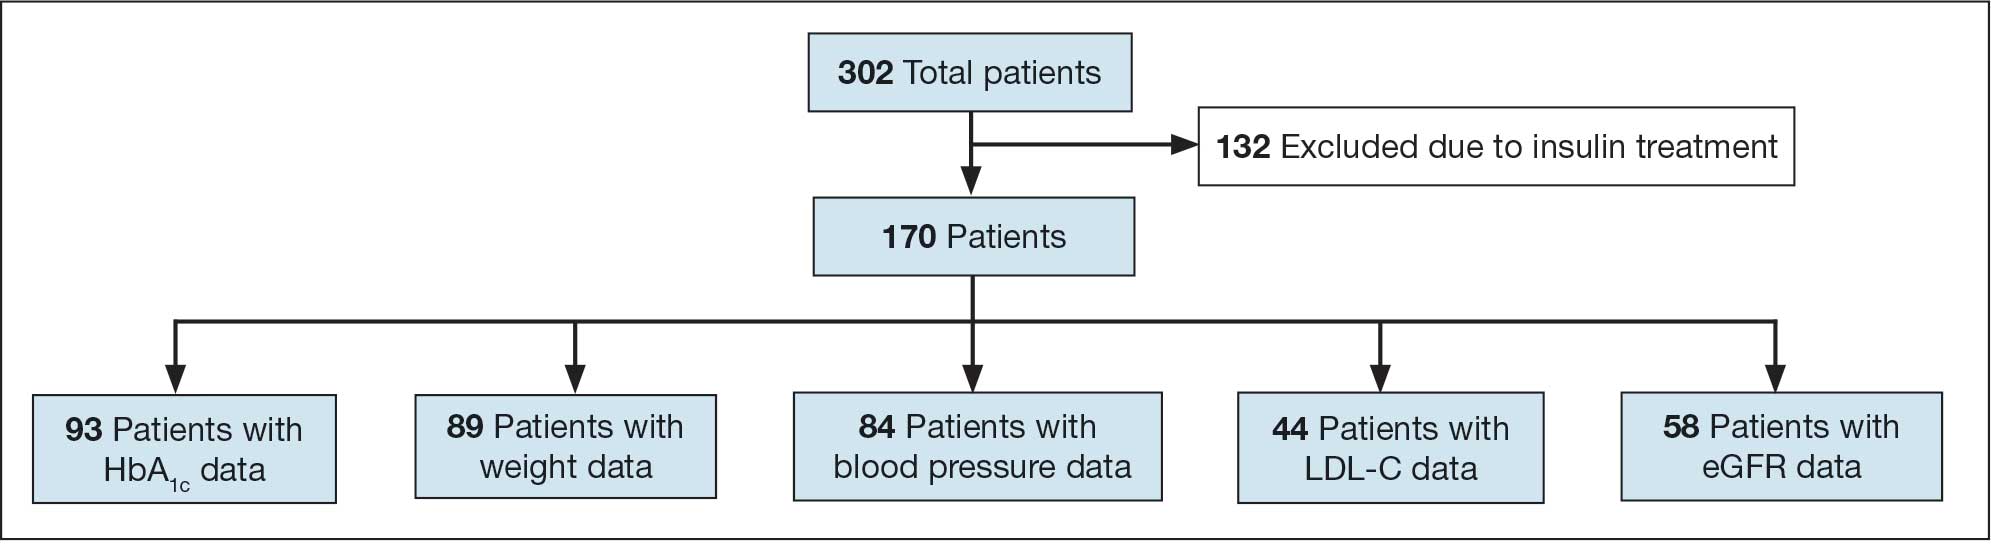
A total of 302 patients were initially identified. After applying exclusion criteria, 132 were excluded due to insulin use, and 77 were excluded due to incomplete HbA1c data within the specified time frames (Figure 1). The final sample included 93 patients.
Abbreviations: eGFR, estimated glomerular filtration rate; HbA1c, hemoglobin A1c; LDL-C, low-density lipoprotein cholesterol.
Measures
The primary outcome was the change in HbA1c levels from baseline to 1 year after CGM initiation. Secondary outcomes included changes in weight, systolic and diastolic BP, LDL-C concentrations, and eGFR. For the primary outcome, HbA1c values were collected within a grace period of ± 4 months from the baseline and 1-year time points. The laboratory’s upper reporting limit for HbA1c was 14%; values reported as “> 14%” were recorded as 14.1% for data analysis, although the actual values could have been higher.
For secondary outcomes, data were included if measurements were obtained within ± 6 months of the baseline and 1-year time points. Patients who did not have measurements within these time frames for specific metrics were excluded from secondary outcome analysis but remained in the overall study if they met the criteria for HbA1c and CGM use.
Statistical Analysis
Statistical analysis was performed using R statistical software version 4.4.2. Paired t tests were conducted to compare baseline and 1-year follow- up measurements for variables with parametric distributions. Wilcoxon signed-rank test was used for nonparametric data. A linear regression analysis was conducted to examine the relationship between baseline HbA1c levels and the change in HbA1c after 1 year of CGM use. Differences were considered significant at P < .05 set a priori. To guide future research, a posthoc power analysis was performed using Cohen’s d to estimate the required sample sizes for detecting significant effects, assuming a similar population.
Results
The study included 93 patients, with a mean (SD) age of 55 (13) years (range, 29-83 years). Of the participants, 56 were female (60%) and 37 were male (40%). All participants were identified as AI/AN and had non–insulin-dependent T2DM.
Primary Outcomes
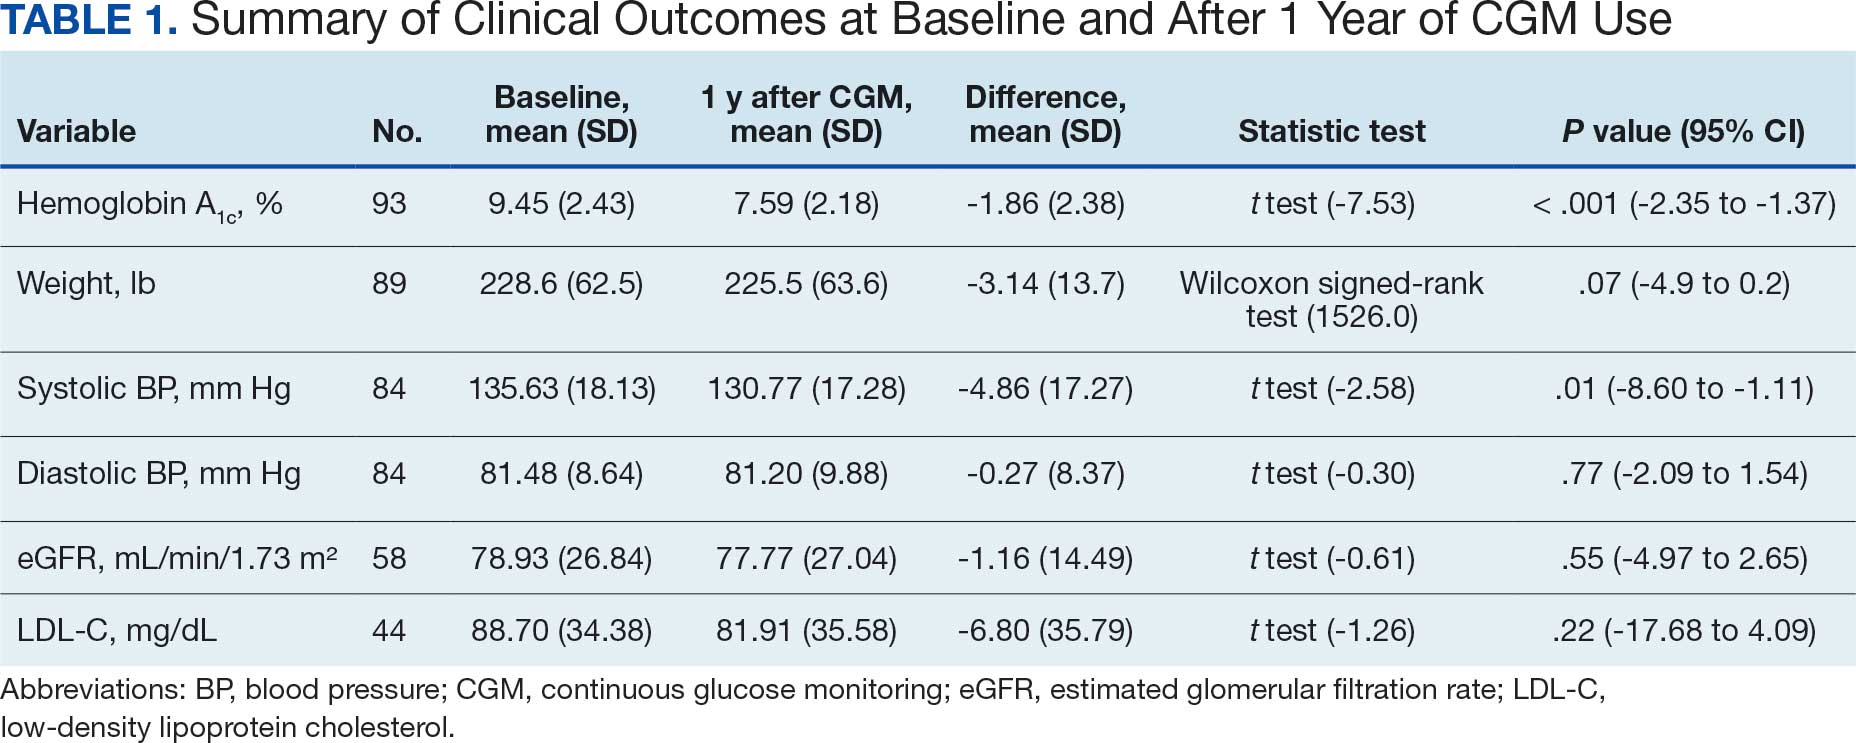
A significant reduction in HbA1c levels was observed after 1 year of CGM use. The mean (SD) baseline HbA1c was 9.5% (2.4%), which decreased to 7.6% (2.2%) at 1-year follow-up (Table 1). This difference represents a mean change of -1.86% (2.4%) (95% CI, -2.35 to -1.37; P < .001 [paired t test, -7.53]).
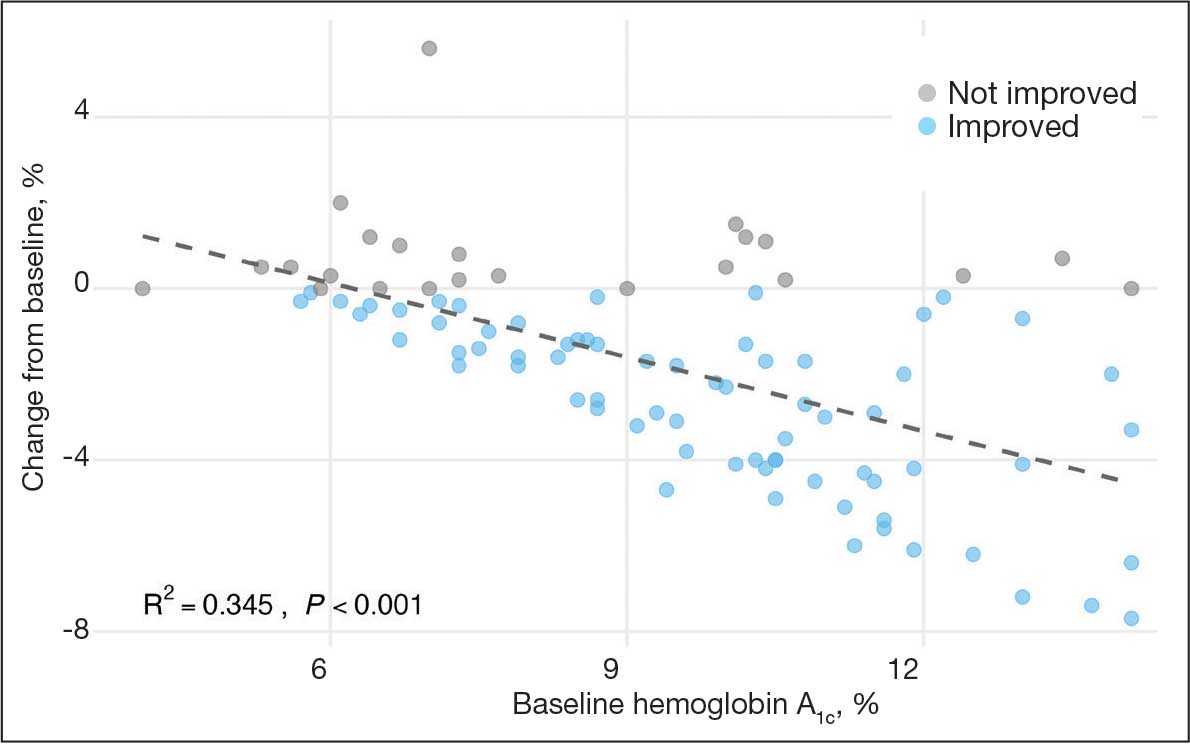
A linear regression model evaluated the relationship between baseline HbA1c (predictor) and the change in HbA1c after 1 year (outcome). The change in HbA1c was calculated as the difference between 1-year follow-up and baseline values. The regression model revealed a significant negative association between baseline HbA1c and the change in HbA1c (Β = -0.576; P < .001), indicating that higher baseline HbA1c values were associated with greater reductions in HbA1c over the year. The regression equation was: Change in HbA1c = 3.587 – 0.576 × Baseline HbA1c
The regression coefficient for baseline HbA1c was -0.576 (standard error, 0.083; t = -6.931; P < .001), indicating that for each 1% increase in baseline HbA1c, the reduction of HbA1c after 1 year increased by approximately 0.576% (Figure 2). The model explained 34.6% of the variance in HbA1c change (R2 = .345; adjusted R2 = .338).
Secondary Outcomes
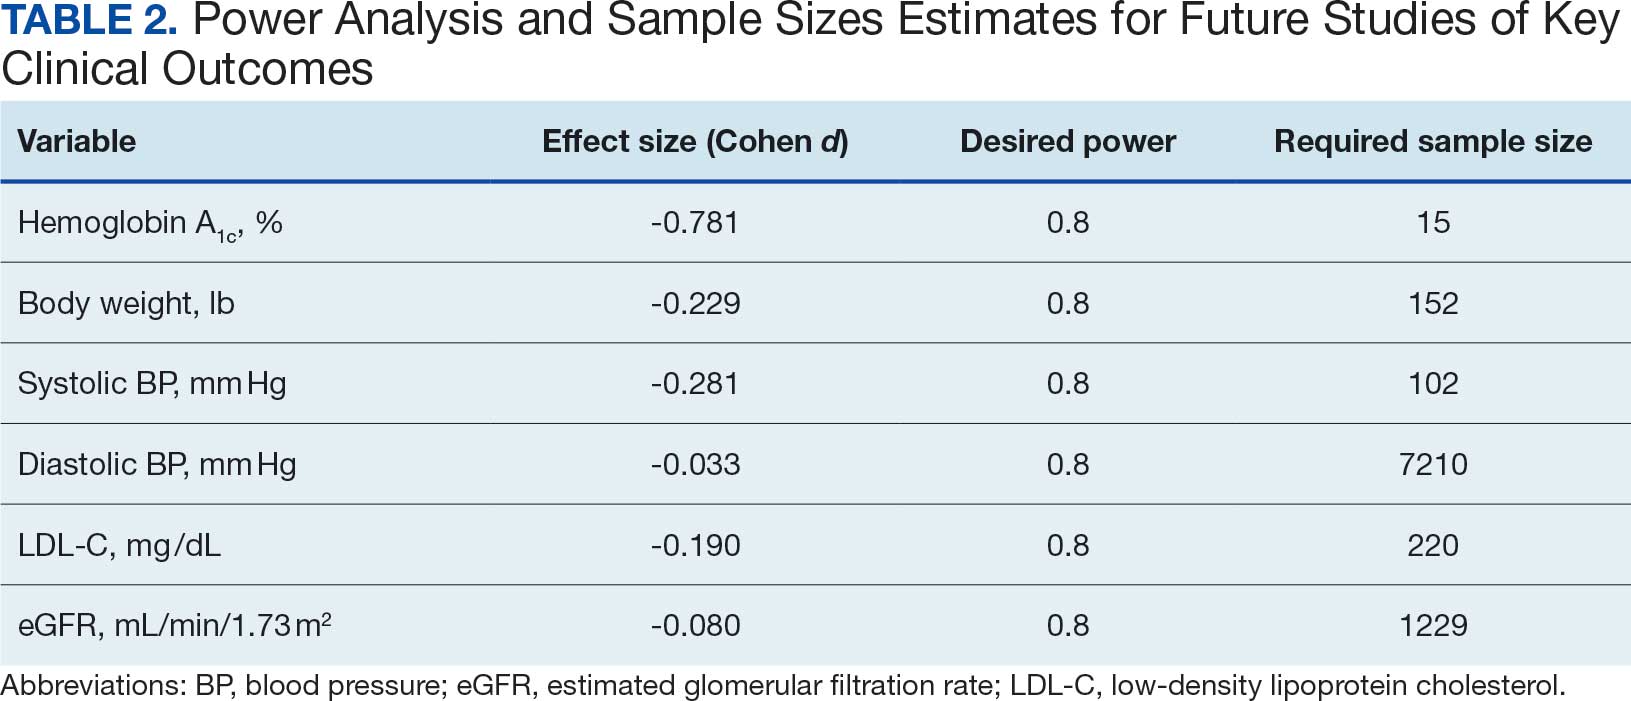
Systolic BP decreased by a mean (SD) -4.9 (17) mm Hg; 95% CI, -8.6 to -1.11; P = .01, paired t test). However, no significant change was observed for diastolic BP (P = .77, paired t test). Similarly, no significant changes were observed in weight, LDL-C concentrations, or eGFR after 1 year of CGM use. A posthoc power analysis indicated that the study was underpowered to detect smaller effect sizes in secondary outcomes. For example, sample size estimates indicated that detecting significant changes in weight and LDL-C concentrations would require sample sizes of 152 and 220 patients, respectively (Table 2).
Discussion
This study found a clinically significant reduction in HbA1c levels after 1 year among AI/AN patients with non–insulin-dependent T2DM who used CGMs. The mean HbA1c decreased 1.9%, from 9.5% at baseline to 7.6% after 1 year. This reduction is not only statistically significant (P < .001), it is clinically meaningful—even a 1% decrease in HbA1c is associated with substantial reductions in the risk of microvascular complications.3 The magnitude of the HbA1c reduction observed suggests CGM use may be associated with improved glycemic control in this high-risk population. By achieving lower HbA1c levels, patients may experience improved long-term health outcomes and a reduced burden of DM-related complications.
Changes in oral DM medications during the study period may have contributed to the observed improvements in HbA1c levels. While the dataset lacked detailed information on types or dosages of oral hypoglycemic agents used, adjustments in medication regimens are common in DM management and could significantly affect glycemic control. The inability to account for these changes results in an inability to attribute the improvements in HbA1c solely to CGM use. Future studies should collect comprehensive medication data to better isolate the effects of CGM use from other treatment modifications.
Another factor that may have contributed to the improved glycemic control is the DM self-management education and training patients received as part of standard care. Patients met with diabetes educators at least once and learned how to use the CGM device and interpret the data for self-management decisions. This education may have enhanced patient engagement and empowerment, enabling them to make informed choices about diet, physical activity, and medication adherence. Studies have shown that DM self-management education can significantly improve glycemic control and patient outcomes.13 By combining the CGM technology with targeted education, patients may have been better equipped to manage their condition, contributing to the observed reduction in HbA1c levels. Future studies should consider synergistic effects of CGM use and DM education when evaluating interventions for glycemic control.
The significant reduction in HbA1c indicates CGM use is associated with improved glycemic control in non–insulin-dependent T2DM. The linear regression analysis suggests patients with poorer glycemic control at baseline experienced greater reductions in HbA1c over the course of 1 year. This finding aligns with previous studies that have shown greater HbA1c reductions in patients with higher initial levels when using CGMs. Yaron et al reported similar findings: higher baseline HbA1c levels predicted more substantial improvements with CGM use in patients with T2DM on insulin therapy.14
This study contributes to existing research by examining the association between CGM use and glycemic control in patients with non– insulin-dependent T2DM within an AI/AN population, a group that has been underreported in previous studies. Most prior research has focused on insulin-dependent patients or populations with different ethnic backgrounds.12 By focusing on patients with non–insulin-dependent T2DM, this study highlights the broader applicability of CGMs beyond traditional use, showcasing their potential association with benefits in earlier stages of DM management. Targeting the AI/AN population addresses a critical knowledge gap, given the disproportionately high prevalence of T2DM and associated complications in this group. The findings of this study suggest integrating CGM technology into the standard care of AI/AN patients with non–insulin-dependent T2DM may be associated with improved glycemic control and may help reduce health disparities.
The modest decrease in systolic BP observed in this study may indicate potential cardiovascular benefits associated with CGM use, possibly due to improved glycemic control and increased patient engagement in self-management. However, given the limited sample size and exclusion criteria, the study lacked sufficient power to detect significant associations between CGM use and other secondary outcomes such as BP, weight, LDL-C, and eGFR. Therefore, the significant finding with systolic BP should be interpreted with caution.
The lack of significant changes in secondary outcomes may be attributed to the study’s limited sample size and the relatively short duration for observing changes in these parameters. Larger studies are needed to assess the full impact of CGM on these variables. The required sample sizes for achieving adequate power in future studies were calculated, highlighting the utility of our study as a pilot, providing critical data for the design of larger, adequately powered studies.
Limitations
The retrospective design of this study limits causal inferences. Moreover, potential confounding variables were not controlled, such as changes in medication regimens (other than insulin use), dietary counseling, or physical activity. Additionally, we could not account for the type or number of oral DM medications prescribed to patients. The dataset included only information on insulin use, without detailed records of other antidiabetic medications. This limitation may have influenced the observed change in glycemic control, as variations in medication regimens could affect HbA1c levels.
Because this study lacked a comparator group, the effect of CGM use cannot be definitively isolated from other factors (eg, medication changes, dietary modifications, or physical activity). Moreover, CGM devices can be costly and are not universally covered by all insurance or IHS programs, potentially limiting widespread implementation. Policy-level restrictions and patient-specific barriers may also hinder feasibility in other settings.
The small sample size may limit the generalizability of the findings. Of the initial 302 patients, about 69% were excluded due to insulin use or incomplete laboratory data. A ± 4-month window was selected to balance data quality with real-world practices. Extending this window further (eg, ± 6 months) might have included more participants but risked diluting the 1-year endpoint consistency. The lack of statistical significance in secondary metrics may be due to insufficient power rather than the absence of an effect.
Exclusion of patients due to incomplete data may have introduced selection bias. However, patients were included in the overall analysis if they met the criteria for HbA1c and CGM use, even if they lacked data for secondary outcomes. Additionally, the laboratory’s upper reporting limit for HbA1c was 14%, with values above this reported as “> 14%.” For analysis, these were recorded as 14.1%, which may underestimate the true baseline HbA1c levels and impact of the assessment of change. This occurred for 4 of the 93 patients included.
All patients used the Freestyle Libre CGM, which may limit the generalizability of the findings to other CGM brands or models. Differences in device features, accuracy, scanning frequency, and user experience may influence outcomes, and results might differ with other CGM technologies. The dataset did not include patients’ scanning frequency because this metric was not consistently included in the EHRs.
Conclusions
This study found that CGM use was significantly associated with improved glycemic control in patients with non–insulin-dependent T2DM within an AI/AN population, particularly among patients with higher baseline HbA1c levels. The findings suggest that CGMs may be a valuable tool for managing T2DM beyond insulin-dependent populations.
Additional research with larger sample sizes, control groups, and extended follow-up periods is recommended to explore long-term benefits and impacts on other health metrics. The sample size estimates derived from this study serve as a valuable resource for researchers designing future studies aimed at addressing these gaps. Future research that expands on our findings by including larger, more diverse cohorts, accounting for medication use, and exploring different CGM technologies will enhance understanding and contribute to more effective diabetes management strategies for varied populations.
- National diabetes statistics report. Centers for Disease Control and Prevention. May 15, 2024. Accessed October 7, 2025. https://www.cdc.gov/diabetes/php/data-research/index.html
- Elsayed NA, Aleppo G, Aroda VR, et al. 2. Classification and diagnosis of diabetes: standards of care in diabetes—2023. Diabetes Care. 2023;46:S19-S40. doi:10.2337/dc23-S002
- Fowler MJ. Microvascular and macrovascular complications of diabetes. Clin Diabetes. 2011;29:116-122. doi:10.2337/diaclin.29.3.116
- Pleus S, Freckmann G, Schauer S, et al. Self-monitoring of blood glucose as an integral part in the management of people with type 2 diabetes mellitus. Diabetes Ther. 2022;13:829-846. doi:10.1007/s13300-022-01254-8
- Polonsky WH, Fisher L, Schikman CH, et al. Structured self-monitoring of blood glucose significantly reduces A1C levels in poorly controlled, noninsulin-treated type 2 diabetes: results from the Structured Testing Program study. Diabetes Care. 2011;34:262-267. doi:10.2337/dc10-1732
- Tanaka N, Yabe D, Murotani K, et al. Mental distress and health-related quality of life among type 1 and type 2 diabetes patients using self-monitoring of blood glucose: a cross-sectional questionnaire study in Japan. J Diabetes Investig. 2018;9:1203-1211. doi:10.1111/jdi.12827
- Hortensius J, Kars MC, Wierenga WS, et al. Perspectives of patients with type 1 or insulin-treated type 2 diabetes on self-monitoring of blood glucose: a qualitative study. BMC Public Health. 2012;12:167. doi:10.1186/1471-2458-12-167
- Didyuk O, Econom N, Guardia A, Livingston K, Klueh U. Continuous glucose monitoring devices: past, present, and future focus on the history and evolution of technological innovation. J Diabetes Sci Technol. 2021;15:676-683. doi:10.1177/1932296819899394
- Beck RW, Riddlesworth TD, Ruedy K, et al. Effect of continuous glucose monitoring on glycemic control in adults with type 1 diabetes using insulin injections: the DIAMOND randomized clinical trial. JAMA. 2017;317:371-378. doi:10.1001/jama.2016.19975
- Lind M, Polonsky W, Hirsch IB, et al. Continuous glucose monitoring vs conventional therapy for glycemic control in adults with type 1 diabetes treated with multiple daily insulin injections: the GOLD randomized clinical trial. JAMA. 2017;317:379-387. doi:10.1001/jama.2016.19976
- Bolinder J, Antuna R, Geelhoed-Duijvestijn P, et al. Novel glucose-sensing technology and hypoglycemia in type 1 diabetes: a multicenter, non-masked, randomized controlled trial. Lancet. 2016;388:2254-2263. doi:10.1016/S0140-6736(16)31535-5
- Seidu S, Kunutsor SK, Ajjan RA, et al. Efficacy and safety of continuous glucose monitoring and intermittently scanned continuous glucose monitoring in patients with type 2 diabetes: a systematic review and meta-analysis of interventional evidence. Diabetes Care. 2024;47:169-179. doi:10.2337/dc23-1520
- ElSayed NA, Aleppo G, Aroda VR, et al. 5. Facilitating positive health behaviors and well-being to improve health outcomes: standards of care in diabetes-2023. Diabetes Care. 2023;46:S68-S96. doi:10.2337/dc23-S005
- Yaron M, Roitman E, Aharon-Hananel G, et al. Effect of flash glucose monitoring technology on glycemic control and treatment satisfaction in patients with type 2 diabetes. Diabetes Care. 2019;42:1178-1184. doi:10.2337/dc18-0166
Diabetes mellitus (DM) is a national health crisis affecting > 38 million people (11.6%) in the United States.1 American Indian and Alaska Native (AI/AN) adults are disproportionately affected, with a prevalence of 14.5%—the highest among all racial and ethnic groups.1 Type 2 DM (T2DM) accounts for 90% to 95% of all DM cases and is a leading cause of morbidity and mortality due to its association with cardiovascular disease, kidney failure, and other complications.2
Maintaining glycemic control is important for managing T2DM and preventing microvascular and macrovascular complications.3 The cornerstone of diabetes self-management has been patient self-monitored blood glucose (SMBG) using finger-stick glucometers.4 However, SMBG provides measurements from a single point in time and requires frequent, painful, and inconvenient finger pricks, leading to decreased adherence.5,6 These limitations negatively affect patient engagement and overall glycemic control.7
Continuous glucose monitors (CGMs) offer real-time, continuous glucose readings and trends.8 CGMs improve glycemic control and reduce hypoglycemic episodes in patients who are insulin-dependent.9,10 Flash glucose monitors, a type of CGM that requires scanning to obtain glucose readings, provide similar benefits.11 Despite these demonstrated advantages, research has primarily focused on insulin-dependent populations, leaving a significant gap in understanding the effect of CGMs on patients with T2DM who are not insulin-dependent.12
Given the high prevalence of T2DM among AI/AN populations and the potential benefits of CGMs, this study sought to evaluate the effect of CGM use on glycemic control and other health metrics in patients with non–insulin-dependent T2DM in an AI/AN population. This focus addresses a critical knowledge gap and may inform clinical practices and policies to improve diabetes management in this high-risk group.
Methods
A retrospective observational study was conducted using deidentified electronic health records (EHRs) from 2019 to 2024 at a federally operated outpatient Indian Health Service (IHS) clinic serving an AI/AN population in the IHS Portland Area (Oregon, Washington, Idaho). The study protocol was reviewed and deemed exempt by institutional review boards at Washington State University and the Portland Area IHS.
Study Population
This study included patients diagnosed with non–insulin-dependent T2DM, had used a CGM for ≥ 1 year, and had hemoglobin A1c (HbA1c) measurements within 4 months prior to CGM initiation (baseline) and within ± 4 months after 1 year of CGM use. For other health metrics, including blood pressure (BP), weight, low-density lipoprotein cholesterol (LDL-C), and estimated glomerular filtration rate (eGFR), this study required measurements within 6 months before CGM initiation and within 6 months after 1 year of CGM use. The baseline HbA1c in the dataset ranged from 5.3% to > 14%.
Patients were excluded if they used insulin during the study period, had incomplete laboratory or clinical data for the required time frame, or had < 1 year of CGM use. The dataset did not include detailed information on oral DM medications; thus, we could not report or account for the type or number of oral hypoglycemic agents used by the patients. The IHS clinical applications coordinator compiled the dataset from the EHR, identifying patients who were prescribed and received a CGM at the clinic. All patients used the Abbott Freestyle Libre CGM, the only formulary CGM available at the clinic during the study period.
A 1-year follow-up endpoint was selected for several reasons: (1) to capture potential seasonal variations in diet and activity; (2) to align with the clinic’s standard practice of annual comprehensive diabetes evaluations; and (3) to allow sufficient time for patients to adapt to CGM use and reflect any meaningful changes in glycemic control.
All patients received standard DM care according to clinic protocols, which included DM self-management education and training. Patients met with the diabetes educator at least once, during which the educator emphasized making informed decisions using CGM data, such as adjusting dietary choices and physical activity levels to manage blood glucose concentrations effectively.
A total of 302 patients were initially identified. After applying exclusion criteria, 132 were excluded due to insulin use, and 77 were excluded due to incomplete HbA1c data within the specified time frames (Figure 1). The final sample included 93 patients.
Abbreviations: eGFR, estimated glomerular filtration rate; HbA1c, hemoglobin A1c; LDL-C, low-density lipoprotein cholesterol.
Measures
The primary outcome was the change in HbA1c levels from baseline to 1 year after CGM initiation. Secondary outcomes included changes in weight, systolic and diastolic BP, LDL-C concentrations, and eGFR. For the primary outcome, HbA1c values were collected within a grace period of ± 4 months from the baseline and 1-year time points. The laboratory’s upper reporting limit for HbA1c was 14%; values reported as “> 14%” were recorded as 14.1% for data analysis, although the actual values could have been higher.
For secondary outcomes, data were included if measurements were obtained within ± 6 months of the baseline and 1-year time points. Patients who did not have measurements within these time frames for specific metrics were excluded from secondary outcome analysis but remained in the overall study if they met the criteria for HbA1c and CGM use.
Statistical Analysis
Statistical analysis was performed using R statistical software version 4.4.2. Paired t tests were conducted to compare baseline and 1-year follow- up measurements for variables with parametric distributions. Wilcoxon signed-rank test was used for nonparametric data. A linear regression analysis was conducted to examine the relationship between baseline HbA1c levels and the change in HbA1c after 1 year of CGM use. Differences were considered significant at P < .05 set a priori. To guide future research, a posthoc power analysis was performed using Cohen’s d to estimate the required sample sizes for detecting significant effects, assuming a similar population.
Results
The study included 93 patients, with a mean (SD) age of 55 (13) years (range, 29-83 years). Of the participants, 56 were female (60%) and 37 were male (40%). All participants were identified as AI/AN and had non–insulin-dependent T2DM.
Primary Outcomes
A significant reduction in HbA1c levels was observed after 1 year of CGM use. The mean (SD) baseline HbA1c was 9.5% (2.4%), which decreased to 7.6% (2.2%) at 1-year follow-up (Table 1). This difference represents a mean change of -1.86% (2.4%) (95% CI, -2.35 to -1.37; P < .001 [paired t test, -7.53]).
A linear regression model evaluated the relationship between baseline HbA1c (predictor) and the change in HbA1c after 1 year (outcome). The change in HbA1c was calculated as the difference between 1-year follow-up and baseline values. The regression model revealed a significant negative association between baseline HbA1c and the change in HbA1c (Β = -0.576; P < .001), indicating that higher baseline HbA1c values were associated with greater reductions in HbA1c over the year. The regression equation was: Change in HbA1c = 3.587 – 0.576 × Baseline HbA1c
The regression coefficient for baseline HbA1c was -0.576 (standard error, 0.083; t = -6.931; P < .001), indicating that for each 1% increase in baseline HbA1c, the reduction of HbA1c after 1 year increased by approximately 0.576% (Figure 2). The model explained 34.6% of the variance in HbA1c change (R2 = .345; adjusted R2 = .338).
Secondary Outcomes
Systolic BP decreased by a mean (SD) -4.9 (17) mm Hg; 95% CI, -8.6 to -1.11; P = .01, paired t test). However, no significant change was observed for diastolic BP (P = .77, paired t test). Similarly, no significant changes were observed in weight, LDL-C concentrations, or eGFR after 1 year of CGM use. A posthoc power analysis indicated that the study was underpowered to detect smaller effect sizes in secondary outcomes. For example, sample size estimates indicated that detecting significant changes in weight and LDL-C concentrations would require sample sizes of 152 and 220 patients, respectively (Table 2).
Discussion
This study found a clinically significant reduction in HbA1c levels after 1 year among AI/AN patients with non–insulin-dependent T2DM who used CGMs. The mean HbA1c decreased 1.9%, from 9.5% at baseline to 7.6% after 1 year. This reduction is not only statistically significant (P < .001), it is clinically meaningful—even a 1% decrease in HbA1c is associated with substantial reductions in the risk of microvascular complications.3 The magnitude of the HbA1c reduction observed suggests CGM use may be associated with improved glycemic control in this high-risk population. By achieving lower HbA1c levels, patients may experience improved long-term health outcomes and a reduced burden of DM-related complications.
Changes in oral DM medications during the study period may have contributed to the observed improvements in HbA1c levels. While the dataset lacked detailed information on types or dosages of oral hypoglycemic agents used, adjustments in medication regimens are common in DM management and could significantly affect glycemic control. The inability to account for these changes results in an inability to attribute the improvements in HbA1c solely to CGM use. Future studies should collect comprehensive medication data to better isolate the effects of CGM use from other treatment modifications.
Another factor that may have contributed to the improved glycemic control is the DM self-management education and training patients received as part of standard care. Patients met with diabetes educators at least once and learned how to use the CGM device and interpret the data for self-management decisions. This education may have enhanced patient engagement and empowerment, enabling them to make informed choices about diet, physical activity, and medication adherence. Studies have shown that DM self-management education can significantly improve glycemic control and patient outcomes.13 By combining the CGM technology with targeted education, patients may have been better equipped to manage their condition, contributing to the observed reduction in HbA1c levels. Future studies should consider synergistic effects of CGM use and DM education when evaluating interventions for glycemic control.
The significant reduction in HbA1c indicates CGM use is associated with improved glycemic control in non–insulin-dependent T2DM. The linear regression analysis suggests patients with poorer glycemic control at baseline experienced greater reductions in HbA1c over the course of 1 year. This finding aligns with previous studies that have shown greater HbA1c reductions in patients with higher initial levels when using CGMs. Yaron et al reported similar findings: higher baseline HbA1c levels predicted more substantial improvements with CGM use in patients with T2DM on insulin therapy.14
This study contributes to existing research by examining the association between CGM use and glycemic control in patients with non– insulin-dependent T2DM within an AI/AN population, a group that has been underreported in previous studies. Most prior research has focused on insulin-dependent patients or populations with different ethnic backgrounds.12 By focusing on patients with non–insulin-dependent T2DM, this study highlights the broader applicability of CGMs beyond traditional use, showcasing their potential association with benefits in earlier stages of DM management. Targeting the AI/AN population addresses a critical knowledge gap, given the disproportionately high prevalence of T2DM and associated complications in this group. The findings of this study suggest integrating CGM technology into the standard care of AI/AN patients with non–insulin-dependent T2DM may be associated with improved glycemic control and may help reduce health disparities.
The modest decrease in systolic BP observed in this study may indicate potential cardiovascular benefits associated with CGM use, possibly due to improved glycemic control and increased patient engagement in self-management. However, given the limited sample size and exclusion criteria, the study lacked sufficient power to detect significant associations between CGM use and other secondary outcomes such as BP, weight, LDL-C, and eGFR. Therefore, the significant finding with systolic BP should be interpreted with caution.
The lack of significant changes in secondary outcomes may be attributed to the study’s limited sample size and the relatively short duration for observing changes in these parameters. Larger studies are needed to assess the full impact of CGM on these variables. The required sample sizes for achieving adequate power in future studies were calculated, highlighting the utility of our study as a pilot, providing critical data for the design of larger, adequately powered studies.
Limitations
The retrospective design of this study limits causal inferences. Moreover, potential confounding variables were not controlled, such as changes in medication regimens (other than insulin use), dietary counseling, or physical activity. Additionally, we could not account for the type or number of oral DM medications prescribed to patients. The dataset included only information on insulin use, without detailed records of other antidiabetic medications. This limitation may have influenced the observed change in glycemic control, as variations in medication regimens could affect HbA1c levels.
Because this study lacked a comparator group, the effect of CGM use cannot be definitively isolated from other factors (eg, medication changes, dietary modifications, or physical activity). Moreover, CGM devices can be costly and are not universally covered by all insurance or IHS programs, potentially limiting widespread implementation. Policy-level restrictions and patient-specific barriers may also hinder feasibility in other settings.
The small sample size may limit the generalizability of the findings. Of the initial 302 patients, about 69% were excluded due to insulin use or incomplete laboratory data. A ± 4-month window was selected to balance data quality with real-world practices. Extending this window further (eg, ± 6 months) might have included more participants but risked diluting the 1-year endpoint consistency. The lack of statistical significance in secondary metrics may be due to insufficient power rather than the absence of an effect.
Exclusion of patients due to incomplete data may have introduced selection bias. However, patients were included in the overall analysis if they met the criteria for HbA1c and CGM use, even if they lacked data for secondary outcomes. Additionally, the laboratory’s upper reporting limit for HbA1c was 14%, with values above this reported as “> 14%.” For analysis, these were recorded as 14.1%, which may underestimate the true baseline HbA1c levels and impact of the assessment of change. This occurred for 4 of the 93 patients included.
All patients used the Freestyle Libre CGM, which may limit the generalizability of the findings to other CGM brands or models. Differences in device features, accuracy, scanning frequency, and user experience may influence outcomes, and results might differ with other CGM technologies. The dataset did not include patients’ scanning frequency because this metric was not consistently included in the EHRs.
Conclusions
This study found that CGM use was significantly associated with improved glycemic control in patients with non–insulin-dependent T2DM within an AI/AN population, particularly among patients with higher baseline HbA1c levels. The findings suggest that CGMs may be a valuable tool for managing T2DM beyond insulin-dependent populations.
Additional research with larger sample sizes, control groups, and extended follow-up periods is recommended to explore long-term benefits and impacts on other health metrics. The sample size estimates derived from this study serve as a valuable resource for researchers designing future studies aimed at addressing these gaps. Future research that expands on our findings by including larger, more diverse cohorts, accounting for medication use, and exploring different CGM technologies will enhance understanding and contribute to more effective diabetes management strategies for varied populations.
Diabetes mellitus (DM) is a national health crisis affecting > 38 million people (11.6%) in the United States.1 American Indian and Alaska Native (AI/AN) adults are disproportionately affected, with a prevalence of 14.5%—the highest among all racial and ethnic groups.1 Type 2 DM (T2DM) accounts for 90% to 95% of all DM cases and is a leading cause of morbidity and mortality due to its association with cardiovascular disease, kidney failure, and other complications.2
Maintaining glycemic control is important for managing T2DM and preventing microvascular and macrovascular complications.3 The cornerstone of diabetes self-management has been patient self-monitored blood glucose (SMBG) using finger-stick glucometers.4 However, SMBG provides measurements from a single point in time and requires frequent, painful, and inconvenient finger pricks, leading to decreased adherence.5,6 These limitations negatively affect patient engagement and overall glycemic control.7
Continuous glucose monitors (CGMs) offer real-time, continuous glucose readings and trends.8 CGMs improve glycemic control and reduce hypoglycemic episodes in patients who are insulin-dependent.9,10 Flash glucose monitors, a type of CGM that requires scanning to obtain glucose readings, provide similar benefits.11 Despite these demonstrated advantages, research has primarily focused on insulin-dependent populations, leaving a significant gap in understanding the effect of CGMs on patients with T2DM who are not insulin-dependent.12
Given the high prevalence of T2DM among AI/AN populations and the potential benefits of CGMs, this study sought to evaluate the effect of CGM use on glycemic control and other health metrics in patients with non–insulin-dependent T2DM in an AI/AN population. This focus addresses a critical knowledge gap and may inform clinical practices and policies to improve diabetes management in this high-risk group.
Methods
A retrospective observational study was conducted using deidentified electronic health records (EHRs) from 2019 to 2024 at a federally operated outpatient Indian Health Service (IHS) clinic serving an AI/AN population in the IHS Portland Area (Oregon, Washington, Idaho). The study protocol was reviewed and deemed exempt by institutional review boards at Washington State University and the Portland Area IHS.
Study Population
This study included patients diagnosed with non–insulin-dependent T2DM, had used a CGM for ≥ 1 year, and had hemoglobin A1c (HbA1c) measurements within 4 months prior to CGM initiation (baseline) and within ± 4 months after 1 year of CGM use. For other health metrics, including blood pressure (BP), weight, low-density lipoprotein cholesterol (LDL-C), and estimated glomerular filtration rate (eGFR), this study required measurements within 6 months before CGM initiation and within 6 months after 1 year of CGM use. The baseline HbA1c in the dataset ranged from 5.3% to > 14%.
Patients were excluded if they used insulin during the study period, had incomplete laboratory or clinical data for the required time frame, or had < 1 year of CGM use. The dataset did not include detailed information on oral DM medications; thus, we could not report or account for the type or number of oral hypoglycemic agents used by the patients. The IHS clinical applications coordinator compiled the dataset from the EHR, identifying patients who were prescribed and received a CGM at the clinic. All patients used the Abbott Freestyle Libre CGM, the only formulary CGM available at the clinic during the study period.
A 1-year follow-up endpoint was selected for several reasons: (1) to capture potential seasonal variations in diet and activity; (2) to align with the clinic’s standard practice of annual comprehensive diabetes evaluations; and (3) to allow sufficient time for patients to adapt to CGM use and reflect any meaningful changes in glycemic control.
All patients received standard DM care according to clinic protocols, which included DM self-management education and training. Patients met with the diabetes educator at least once, during which the educator emphasized making informed decisions using CGM data, such as adjusting dietary choices and physical activity levels to manage blood glucose concentrations effectively.
A total of 302 patients were initially identified. After applying exclusion criteria, 132 were excluded due to insulin use, and 77 were excluded due to incomplete HbA1c data within the specified time frames (Figure 1). The final sample included 93 patients.
Abbreviations: eGFR, estimated glomerular filtration rate; HbA1c, hemoglobin A1c; LDL-C, low-density lipoprotein cholesterol.
Measures
The primary outcome was the change in HbA1c levels from baseline to 1 year after CGM initiation. Secondary outcomes included changes in weight, systolic and diastolic BP, LDL-C concentrations, and eGFR. For the primary outcome, HbA1c values were collected within a grace period of ± 4 months from the baseline and 1-year time points. The laboratory’s upper reporting limit for HbA1c was 14%; values reported as “> 14%” were recorded as 14.1% for data analysis, although the actual values could have been higher.
For secondary outcomes, data were included if measurements were obtained within ± 6 months of the baseline and 1-year time points. Patients who did not have measurements within these time frames for specific metrics were excluded from secondary outcome analysis but remained in the overall study if they met the criteria for HbA1c and CGM use.
Statistical Analysis
Statistical analysis was performed using R statistical software version 4.4.2. Paired t tests were conducted to compare baseline and 1-year follow- up measurements for variables with parametric distributions. Wilcoxon signed-rank test was used for nonparametric data. A linear regression analysis was conducted to examine the relationship between baseline HbA1c levels and the change in HbA1c after 1 year of CGM use. Differences were considered significant at P < .05 set a priori. To guide future research, a posthoc power analysis was performed using Cohen’s d to estimate the required sample sizes for detecting significant effects, assuming a similar population.
Results
The study included 93 patients, with a mean (SD) age of 55 (13) years (range, 29-83 years). Of the participants, 56 were female (60%) and 37 were male (40%). All participants were identified as AI/AN and had non–insulin-dependent T2DM.
Primary Outcomes
A significant reduction in HbA1c levels was observed after 1 year of CGM use. The mean (SD) baseline HbA1c was 9.5% (2.4%), which decreased to 7.6% (2.2%) at 1-year follow-up (Table 1). This difference represents a mean change of -1.86% (2.4%) (95% CI, -2.35 to -1.37; P < .001 [paired t test, -7.53]).
A linear regression model evaluated the relationship between baseline HbA1c (predictor) and the change in HbA1c after 1 year (outcome). The change in HbA1c was calculated as the difference between 1-year follow-up and baseline values. The regression model revealed a significant negative association between baseline HbA1c and the change in HbA1c (Β = -0.576; P < .001), indicating that higher baseline HbA1c values were associated with greater reductions in HbA1c over the year. The regression equation was: Change in HbA1c = 3.587 – 0.576 × Baseline HbA1c
The regression coefficient for baseline HbA1c was -0.576 (standard error, 0.083; t = -6.931; P < .001), indicating that for each 1% increase in baseline HbA1c, the reduction of HbA1c after 1 year increased by approximately 0.576% (Figure 2). The model explained 34.6% of the variance in HbA1c change (R2 = .345; adjusted R2 = .338).
Secondary Outcomes
Systolic BP decreased by a mean (SD) -4.9 (17) mm Hg; 95% CI, -8.6 to -1.11; P = .01, paired t test). However, no significant change was observed for diastolic BP (P = .77, paired t test). Similarly, no significant changes were observed in weight, LDL-C concentrations, or eGFR after 1 year of CGM use. A posthoc power analysis indicated that the study was underpowered to detect smaller effect sizes in secondary outcomes. For example, sample size estimates indicated that detecting significant changes in weight and LDL-C concentrations would require sample sizes of 152 and 220 patients, respectively (Table 2).
Discussion
This study found a clinically significant reduction in HbA1c levels after 1 year among AI/AN patients with non–insulin-dependent T2DM who used CGMs. The mean HbA1c decreased 1.9%, from 9.5% at baseline to 7.6% after 1 year. This reduction is not only statistically significant (P < .001), it is clinically meaningful—even a 1% decrease in HbA1c is associated with substantial reductions in the risk of microvascular complications.3 The magnitude of the HbA1c reduction observed suggests CGM use may be associated with improved glycemic control in this high-risk population. By achieving lower HbA1c levels, patients may experience improved long-term health outcomes and a reduced burden of DM-related complications.
Changes in oral DM medications during the study period may have contributed to the observed improvements in HbA1c levels. While the dataset lacked detailed information on types or dosages of oral hypoglycemic agents used, adjustments in medication regimens are common in DM management and could significantly affect glycemic control. The inability to account for these changes results in an inability to attribute the improvements in HbA1c solely to CGM use. Future studies should collect comprehensive medication data to better isolate the effects of CGM use from other treatment modifications.
Another factor that may have contributed to the improved glycemic control is the DM self-management education and training patients received as part of standard care. Patients met with diabetes educators at least once and learned how to use the CGM device and interpret the data for self-management decisions. This education may have enhanced patient engagement and empowerment, enabling them to make informed choices about diet, physical activity, and medication adherence. Studies have shown that DM self-management education can significantly improve glycemic control and patient outcomes.13 By combining the CGM technology with targeted education, patients may have been better equipped to manage their condition, contributing to the observed reduction in HbA1c levels. Future studies should consider synergistic effects of CGM use and DM education when evaluating interventions for glycemic control.
The significant reduction in HbA1c indicates CGM use is associated with improved glycemic control in non–insulin-dependent T2DM. The linear regression analysis suggests patients with poorer glycemic control at baseline experienced greater reductions in HbA1c over the course of 1 year. This finding aligns with previous studies that have shown greater HbA1c reductions in patients with higher initial levels when using CGMs. Yaron et al reported similar findings: higher baseline HbA1c levels predicted more substantial improvements with CGM use in patients with T2DM on insulin therapy.14
This study contributes to existing research by examining the association between CGM use and glycemic control in patients with non– insulin-dependent T2DM within an AI/AN population, a group that has been underreported in previous studies. Most prior research has focused on insulin-dependent patients or populations with different ethnic backgrounds.12 By focusing on patients with non–insulin-dependent T2DM, this study highlights the broader applicability of CGMs beyond traditional use, showcasing their potential association with benefits in earlier stages of DM management. Targeting the AI/AN population addresses a critical knowledge gap, given the disproportionately high prevalence of T2DM and associated complications in this group. The findings of this study suggest integrating CGM technology into the standard care of AI/AN patients with non–insulin-dependent T2DM may be associated with improved glycemic control and may help reduce health disparities.
The modest decrease in systolic BP observed in this study may indicate potential cardiovascular benefits associated with CGM use, possibly due to improved glycemic control and increased patient engagement in self-management. However, given the limited sample size and exclusion criteria, the study lacked sufficient power to detect significant associations between CGM use and other secondary outcomes such as BP, weight, LDL-C, and eGFR. Therefore, the significant finding with systolic BP should be interpreted with caution.
The lack of significant changes in secondary outcomes may be attributed to the study’s limited sample size and the relatively short duration for observing changes in these parameters. Larger studies are needed to assess the full impact of CGM on these variables. The required sample sizes for achieving adequate power in future studies were calculated, highlighting the utility of our study as a pilot, providing critical data for the design of larger, adequately powered studies.
Limitations
The retrospective design of this study limits causal inferences. Moreover, potential confounding variables were not controlled, such as changes in medication regimens (other than insulin use), dietary counseling, or physical activity. Additionally, we could not account for the type or number of oral DM medications prescribed to patients. The dataset included only information on insulin use, without detailed records of other antidiabetic medications. This limitation may have influenced the observed change in glycemic control, as variations in medication regimens could affect HbA1c levels.
Because this study lacked a comparator group, the effect of CGM use cannot be definitively isolated from other factors (eg, medication changes, dietary modifications, or physical activity). Moreover, CGM devices can be costly and are not universally covered by all insurance or IHS programs, potentially limiting widespread implementation. Policy-level restrictions and patient-specific barriers may also hinder feasibility in other settings.
The small sample size may limit the generalizability of the findings. Of the initial 302 patients, about 69% were excluded due to insulin use or incomplete laboratory data. A ± 4-month window was selected to balance data quality with real-world practices. Extending this window further (eg, ± 6 months) might have included more participants but risked diluting the 1-year endpoint consistency. The lack of statistical significance in secondary metrics may be due to insufficient power rather than the absence of an effect.
Exclusion of patients due to incomplete data may have introduced selection bias. However, patients were included in the overall analysis if they met the criteria for HbA1c and CGM use, even if they lacked data for secondary outcomes. Additionally, the laboratory’s upper reporting limit for HbA1c was 14%, with values above this reported as “> 14%.” For analysis, these were recorded as 14.1%, which may underestimate the true baseline HbA1c levels and impact of the assessment of change. This occurred for 4 of the 93 patients included.
All patients used the Freestyle Libre CGM, which may limit the generalizability of the findings to other CGM brands or models. Differences in device features, accuracy, scanning frequency, and user experience may influence outcomes, and results might differ with other CGM technologies. The dataset did not include patients’ scanning frequency because this metric was not consistently included in the EHRs.
Conclusions
This study found that CGM use was significantly associated with improved glycemic control in patients with non–insulin-dependent T2DM within an AI/AN population, particularly among patients with higher baseline HbA1c levels. The findings suggest that CGMs may be a valuable tool for managing T2DM beyond insulin-dependent populations.
Additional research with larger sample sizes, control groups, and extended follow-up periods is recommended to explore long-term benefits and impacts on other health metrics. The sample size estimates derived from this study serve as a valuable resource for researchers designing future studies aimed at addressing these gaps. Future research that expands on our findings by including larger, more diverse cohorts, accounting for medication use, and exploring different CGM technologies will enhance understanding and contribute to more effective diabetes management strategies for varied populations.
- National diabetes statistics report. Centers for Disease Control and Prevention. May 15, 2024. Accessed October 7, 2025. https://www.cdc.gov/diabetes/php/data-research/index.html
- Elsayed NA, Aleppo G, Aroda VR, et al. 2. Classification and diagnosis of diabetes: standards of care in diabetes—2023. Diabetes Care. 2023;46:S19-S40. doi:10.2337/dc23-S002
- Fowler MJ. Microvascular and macrovascular complications of diabetes. Clin Diabetes. 2011;29:116-122. doi:10.2337/diaclin.29.3.116
- Pleus S, Freckmann G, Schauer S, et al. Self-monitoring of blood glucose as an integral part in the management of people with type 2 diabetes mellitus. Diabetes Ther. 2022;13:829-846. doi:10.1007/s13300-022-01254-8
- Polonsky WH, Fisher L, Schikman CH, et al. Structured self-monitoring of blood glucose significantly reduces A1C levels in poorly controlled, noninsulin-treated type 2 diabetes: results from the Structured Testing Program study. Diabetes Care. 2011;34:262-267. doi:10.2337/dc10-1732
- Tanaka N, Yabe D, Murotani K, et al. Mental distress and health-related quality of life among type 1 and type 2 diabetes patients using self-monitoring of blood glucose: a cross-sectional questionnaire study in Japan. J Diabetes Investig. 2018;9:1203-1211. doi:10.1111/jdi.12827
- Hortensius J, Kars MC, Wierenga WS, et al. Perspectives of patients with type 1 or insulin-treated type 2 diabetes on self-monitoring of blood glucose: a qualitative study. BMC Public Health. 2012;12:167. doi:10.1186/1471-2458-12-167
- Didyuk O, Econom N, Guardia A, Livingston K, Klueh U. Continuous glucose monitoring devices: past, present, and future focus on the history and evolution of technological innovation. J Diabetes Sci Technol. 2021;15:676-683. doi:10.1177/1932296819899394
- Beck RW, Riddlesworth TD, Ruedy K, et al. Effect of continuous glucose monitoring on glycemic control in adults with type 1 diabetes using insulin injections: the DIAMOND randomized clinical trial. JAMA. 2017;317:371-378. doi:10.1001/jama.2016.19975
- Lind M, Polonsky W, Hirsch IB, et al. Continuous glucose monitoring vs conventional therapy for glycemic control in adults with type 1 diabetes treated with multiple daily insulin injections: the GOLD randomized clinical trial. JAMA. 2017;317:379-387. doi:10.1001/jama.2016.19976
- Bolinder J, Antuna R, Geelhoed-Duijvestijn P, et al. Novel glucose-sensing technology and hypoglycemia in type 1 diabetes: a multicenter, non-masked, randomized controlled trial. Lancet. 2016;388:2254-2263. doi:10.1016/S0140-6736(16)31535-5
- Seidu S, Kunutsor SK, Ajjan RA, et al. Efficacy and safety of continuous glucose monitoring and intermittently scanned continuous glucose monitoring in patients with type 2 diabetes: a systematic review and meta-analysis of interventional evidence. Diabetes Care. 2024;47:169-179. doi:10.2337/dc23-1520
- ElSayed NA, Aleppo G, Aroda VR, et al. 5. Facilitating positive health behaviors and well-being to improve health outcomes: standards of care in diabetes-2023. Diabetes Care. 2023;46:S68-S96. doi:10.2337/dc23-S005
- Yaron M, Roitman E, Aharon-Hananel G, et al. Effect of flash glucose monitoring technology on glycemic control and treatment satisfaction in patients with type 2 diabetes. Diabetes Care. 2019;42:1178-1184. doi:10.2337/dc18-0166
- National diabetes statistics report. Centers for Disease Control and Prevention. May 15, 2024. Accessed October 7, 2025. https://www.cdc.gov/diabetes/php/data-research/index.html
- Elsayed NA, Aleppo G, Aroda VR, et al. 2. Classification and diagnosis of diabetes: standards of care in diabetes—2023. Diabetes Care. 2023;46:S19-S40. doi:10.2337/dc23-S002
- Fowler MJ. Microvascular and macrovascular complications of diabetes. Clin Diabetes. 2011;29:116-122. doi:10.2337/diaclin.29.3.116
- Pleus S, Freckmann G, Schauer S, et al. Self-monitoring of blood glucose as an integral part in the management of people with type 2 diabetes mellitus. Diabetes Ther. 2022;13:829-846. doi:10.1007/s13300-022-01254-8
- Polonsky WH, Fisher L, Schikman CH, et al. Structured self-monitoring of blood glucose significantly reduces A1C levels in poorly controlled, noninsulin-treated type 2 diabetes: results from the Structured Testing Program study. Diabetes Care. 2011;34:262-267. doi:10.2337/dc10-1732
- Tanaka N, Yabe D, Murotani K, et al. Mental distress and health-related quality of life among type 1 and type 2 diabetes patients using self-monitoring of blood glucose: a cross-sectional questionnaire study in Japan. J Diabetes Investig. 2018;9:1203-1211. doi:10.1111/jdi.12827
- Hortensius J, Kars MC, Wierenga WS, et al. Perspectives of patients with type 1 or insulin-treated type 2 diabetes on self-monitoring of blood glucose: a qualitative study. BMC Public Health. 2012;12:167. doi:10.1186/1471-2458-12-167
- Didyuk O, Econom N, Guardia A, Livingston K, Klueh U. Continuous glucose monitoring devices: past, present, and future focus on the history and evolution of technological innovation. J Diabetes Sci Technol. 2021;15:676-683. doi:10.1177/1932296819899394
- Beck RW, Riddlesworth TD, Ruedy K, et al. Effect of continuous glucose monitoring on glycemic control in adults with type 1 diabetes using insulin injections: the DIAMOND randomized clinical trial. JAMA. 2017;317:371-378. doi:10.1001/jama.2016.19975
- Lind M, Polonsky W, Hirsch IB, et al. Continuous glucose monitoring vs conventional therapy for glycemic control in adults with type 1 diabetes treated with multiple daily insulin injections: the GOLD randomized clinical trial. JAMA. 2017;317:379-387. doi:10.1001/jama.2016.19976
- Bolinder J, Antuna R, Geelhoed-Duijvestijn P, et al. Novel glucose-sensing technology and hypoglycemia in type 1 diabetes: a multicenter, non-masked, randomized controlled trial. Lancet. 2016;388:2254-2263. doi:10.1016/S0140-6736(16)31535-5
- Seidu S, Kunutsor SK, Ajjan RA, et al. Efficacy and safety of continuous glucose monitoring and intermittently scanned continuous glucose monitoring in patients with type 2 diabetes: a systematic review and meta-analysis of interventional evidence. Diabetes Care. 2024;47:169-179. doi:10.2337/dc23-1520
- ElSayed NA, Aleppo G, Aroda VR, et al. 5. Facilitating positive health behaviors and well-being to improve health outcomes: standards of care in diabetes-2023. Diabetes Care. 2023;46:S68-S96. doi:10.2337/dc23-S005
- Yaron M, Roitman E, Aharon-Hananel G, et al. Effect of flash glucose monitoring technology on glycemic control and treatment satisfaction in patients with type 2 diabetes. Diabetes Care. 2019;42:1178-1184. doi:10.2337/dc18-0166
Impact of Continuous Glucose Monitoring for American Indian/Alaska Native Adults With Type 2 Diabetes Mellitus Not Using Insulin
Impact of Continuous Glucose Monitoring for American Indian/Alaska Native Adults With Type 2 Diabetes Mellitus Not Using Insulin
Reducing Sex Disparities in Statin Therapy Among Female Veterans With Type 2 Diabetes and/or Cardiovascular Disease
Reducing Sex Disparities in Statin Therapy Among Female Veterans With Type 2 Diabetes and/or Cardiovascular Disease
Cardiovascular disease (CVD) is the leading cause of death among women in the United States.1 Most CVD is due to the buildup of plaque (ie, cholesterol, proteins, calcium, and inflammatory cells) in artery walls.2 The plaque may lead to atherosclerotic cardiovascular disease (ASCVD), which includes coronary heart disease, cerebrovascular disease, peripheral artery disease, and aortic atherosclerotic disease.2,3 Control and reduction of ASCVD risk factors, including high cholesterol levels, elevated blood pressure, insulin resistance, smoking, and a sedentary lifestyle, can contribute to a reduction in ASCVD morbidity and mortality.2 People with type 2 diabetes mellitus (T2DM) have an increased prevalence of lipid abnormalities, contributing to their high risk of ASCVD.4,5
The prescribing of statins (3-hydroxy-3-methyl-glutaryl-coenzmye A reductase inhibitors) is the cornerstone of lipid-lowering therapy and cardiovascular risk reduction for primary and secondary prevention of ASCVD.6 The American Diabetes Association (ADA) and American College of Cardiology/American Heart Association (ACC/AHA) recommend moderate- to high-intensity statins for primary prevention in patients with T2DM and high-intensity statins for secondary prevention in those with or without diabetes when not contraindicated.4,5,7 Despite eligibility according to guideline recommendations, research predominantly shows that women are less likely to receive statin therapy; however, this trend is improving. [6,8-11] To explain the sex differences in statin use, Nanna et al found that there is a combination of women being offered statin therapy less frequently, declining therapy more frequently, and discontinuing treatment more frequently.11 One possibility for discontinuing treatment could be statin-associated muscle symptoms (SAMS), which occur in about 10% of patients.12 The incidence of adverse effects (AEs) may be related to the way statins are metabolized.
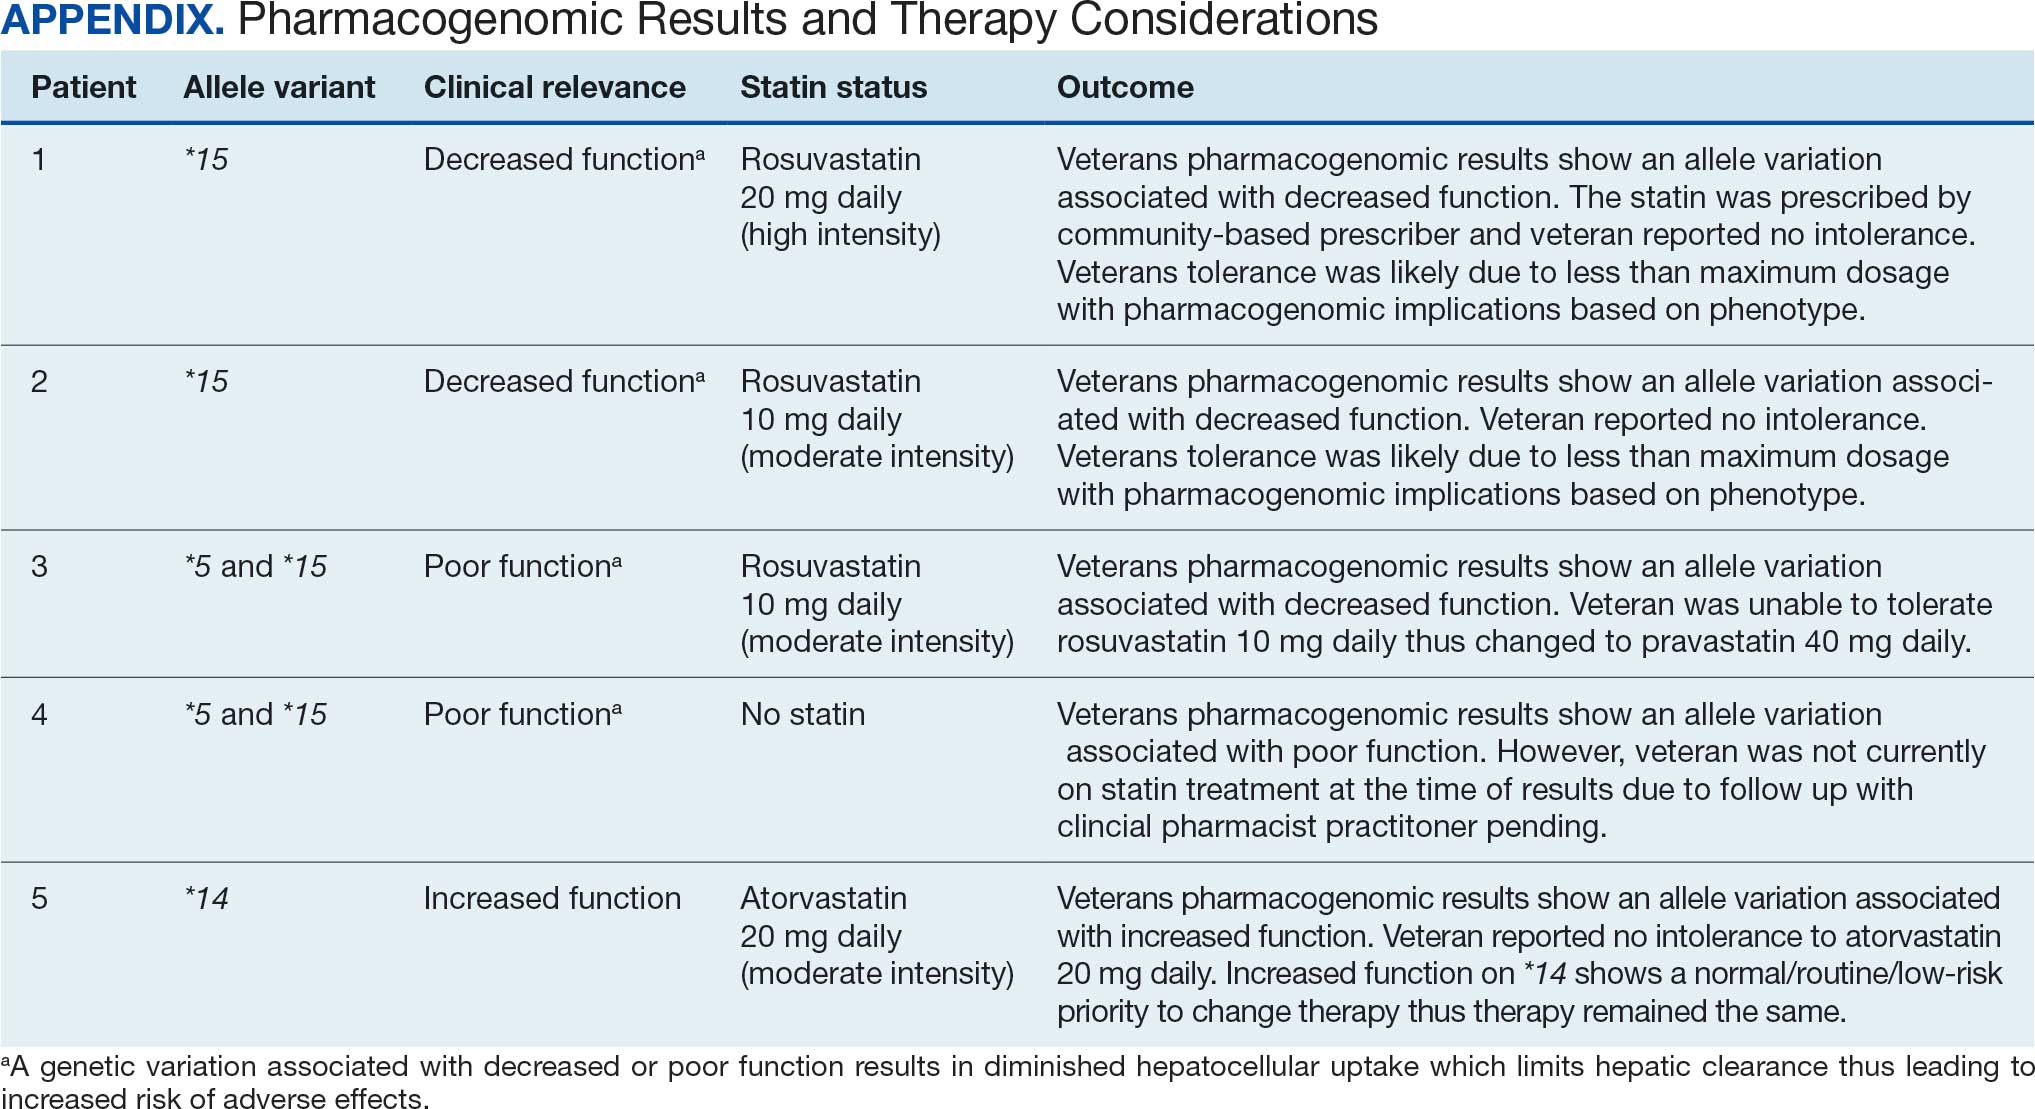
Pharmacogenomic testing is free for veterans through the US Department of Veterans Affairs (VA) PHASER program, which offers information and recommendations for a panel of 11 gene variants. The panel includes genes related to common medication classes such as anticoagulants, antiplatelets, proton pump inhibitors, nonsteroidal anti-inflammatory drugs, opioids, antidepressants, and statins. The VA PHASER panel includes the solute carrier organic anion transporter family member 1B1 (SLCO1B1) gene, which is predominantly expressed in the liver and facilitates the hepatic uptake of most statins.13,14 A reduced function of SLCO1B1 can lead to higher statin levels, resulting in increased concentrations that may potentially cause SAMS.13,14 Some alleles associated with reduced function include SLCO1B1*5, *15, *23, *31, and *46 to *49, whereas others are associated with increased function, such as SLCO1B1 *14 and *20 (Appendix).15 Supporting evidence shows the SLCO1B1*5 nucleotide polymorphism increases plasma levels of simvastatin and atorvastatin, affecting effectiveness or toxicity. 13 Females tend to have a lower body weight and higher percentage of body fat compared with males, which might lead to higher concentrations of lipophilic drugs, including atorvastatin and simvastatin, which may be exacerbated by decreased function of SLCO1B1*5.15 With pharmacogenomic testing, therapeutic recommendations can be made to improve the overall safety and efficacy of statins, thus improving adherence using a patient-specific approach.14,15
Methods
Carl Vinson VA Medical Center (CVVAMC) serves about 42,000 veterans in Central and South Georgia, of which about 15% are female. Of the female veterans enrolled in care, 63% identify as Black, 27% White, and 1.5% as Asian, American Indian/Alaska Native, or Native Hawaiian/Other Pacific Islander. The 2020 Veterans Chartbook report showed that female veterans and minority racial and ethnic groups had worse access to health care and higher mortality rates than their male and non-Hispanic White counterparts.16
The Primary Care Equity Dashboard (PCED) was developed to engage the VA health care workforce in the process of identifying and addressing inequities in local patient populations.17 Using electronic quality measure data, the PCED provides Veterans Integrated Service Network-level and facility-level performance on several metrics.18 The PCED had not been previously used at the CVVAMC, and few publications or quality improvement projects regarding its use have been reported by the VA Office of Health Equity. PCED helped identify disparities when comparing female to male patients in the prescribing of statin therapy for patients with CVD and statin therapy for patients with T2DM.
VA PHASER pharmacogenomic analyses provided an opportunity to expand this quality improvement project. Sanford Health and the VA collaborated on the PHASER program to offer free genetic testing for veterans. The program launched in 2019 and expanded to various VA sites, including CVVAMC in March 2023. This program has been extended to December 31, 2025.
The primary objective of this quality improvement project was to increase statin prescribing among female veterans with T2DM and/or CVD to reduce cardiovascular risk. Secondary outcomes included increased pharmacogenomic testing and the assessment of pharmacogenomic results related to statin therapy. This project was approved by the CVVAMC Pharmacy and Therapeutics Committee. The PCED was used to identify female veterans with T2DM and/or CVD without an active prescription for a statin between July and October 2023. A review of Computerized Patient Record System patient charts was completed to screen for prespecified inclusion and exclusion criteria. Veterans were included if they were assigned female at birth, were enrolled in care at CVVAMC, and had a diagnosis of T2DM or CVD (history of myocardial infarction, coronary bypass graft, percutaneous coronary intervention, or other revascularization in any setting).
Veterans were excluded if they were currently pregnant, trying to conceive, breastfeeding, had a T1DM diagnosis, had previously documented hypersensitivity to a statin, active liver failure or decompensated cirrhosis, previously documented statin-associated rhabdomyolysis or autoimmune myopathy, an active prescription for a proprotein convertase subtilisin/kexin type 9 inhibitor, or previously documented statin intolerance (defined as the inability to tolerate ≥ 3 statins, with ≥ 1 prescribed at low intensity or alternate-day dosing). The female veterans were compared to 2 comparators: the facility's male veterans and the VA national average, identified via the PCED.
Once a veteran was screened, they were telephoned between October 2023 and February 2024 and provided education on statin use and pharmacogenomic testing using a standardized note template. An order was placed for participants who provided verbal consent for pharmacogenomic testing. Those who agreed to statin initiation were referred to a clinical pharmacist practitioner (CPP) who contacted them at a later date to prescribe a statin following the recommendations of the 2019 ACC/AHA and 2023 ADA guidelines and pharmacogenomic testing, if applicable.4,5,7 Appropriate monitoring and follow-up occurred at the discretion of each CPP. Data collection included: age, race, diagnoses (T2DM, CVD, or both), baseline lipid panel (total cholesterol, triglycerides, high-density lipoprotein, low-density lipoprotein), hepatic function, name and dose of statin, reasons for declining statin therapy, and pharmacogenomic testing results related to SLCO1B1.
Results
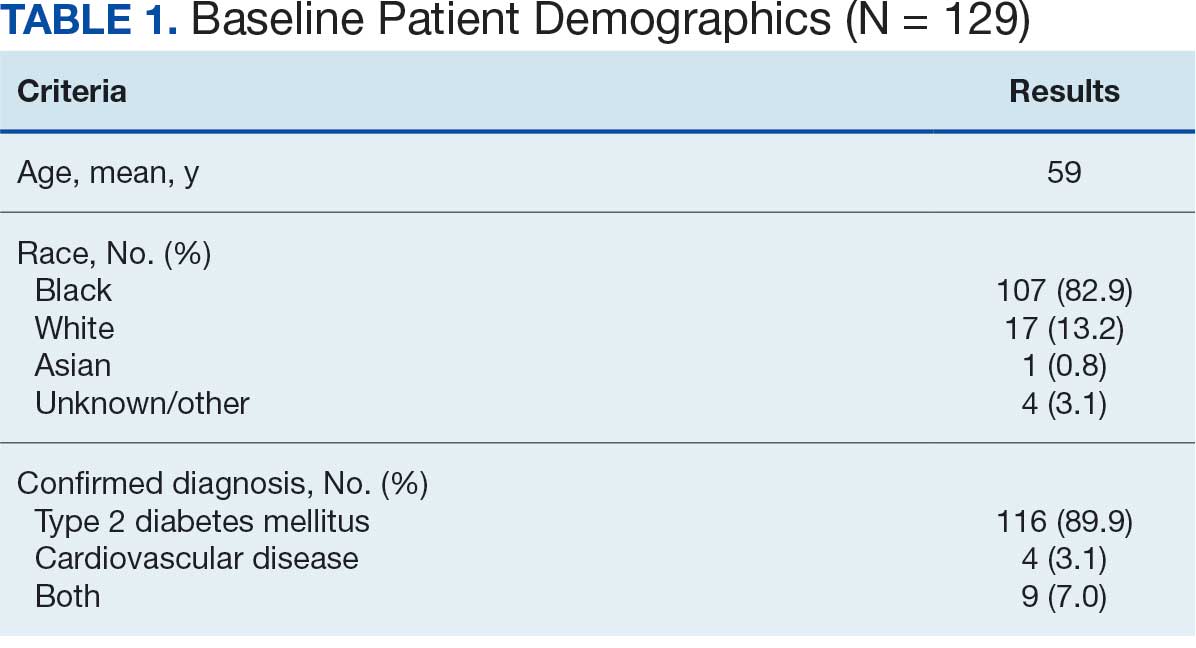
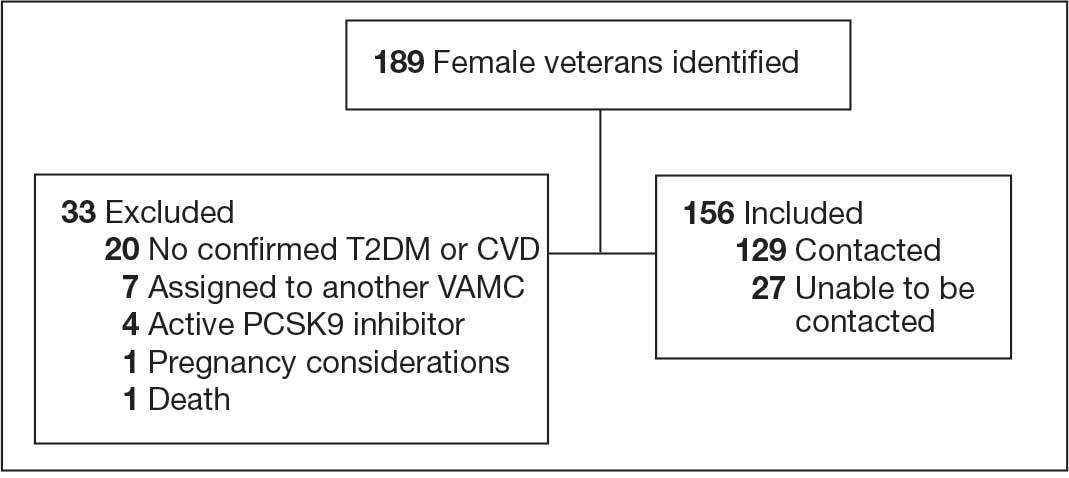
At baseline in July 2023, 77.8% of female veterans with T2DM were prescribed a statin, which exceeded the national VA average (77.0%), but was below the rate for male veterans (78.7%) in the facility comparator group.17 Additionally, 82.2% of females with CVD were prescribed a statin, which was below the national VA average of 86.0% and the 84.9% of male veterans in the facility comparator group.17 The PCED identified 189 female veterans from July 2023 to October 2023 who may benefit from statin therapy. Thirty-three females met the exclusion criteria. Of the 156 included veterans, 129 (82.7%) were successfully contacted and 27 (17.3%) could not be reached by telephone after 3 attempts (Figure 1). The 129 female veterans contacted had a mean age of 59 years and the majority were Black (82.9%) (Table 1).
Abbreviations: CVD, cardiovascular disease; PCSK9, proprotein convertase subtilisin/
kexin type 9; T2DM, type 2 diabetes mellitus; VAMC, Veterans Affairs medical center.
Primary Outcomes
Of the 129 contacted veterans, 31 (24.0%) had a non-VA statin prescription, 13 (10.1%) had an active VA statin prescription, and 85 (65.9%) did not have a statin prescription, despite being eligible. Statin adherence was confirmed with participants, and the medication list was updated accordingly.
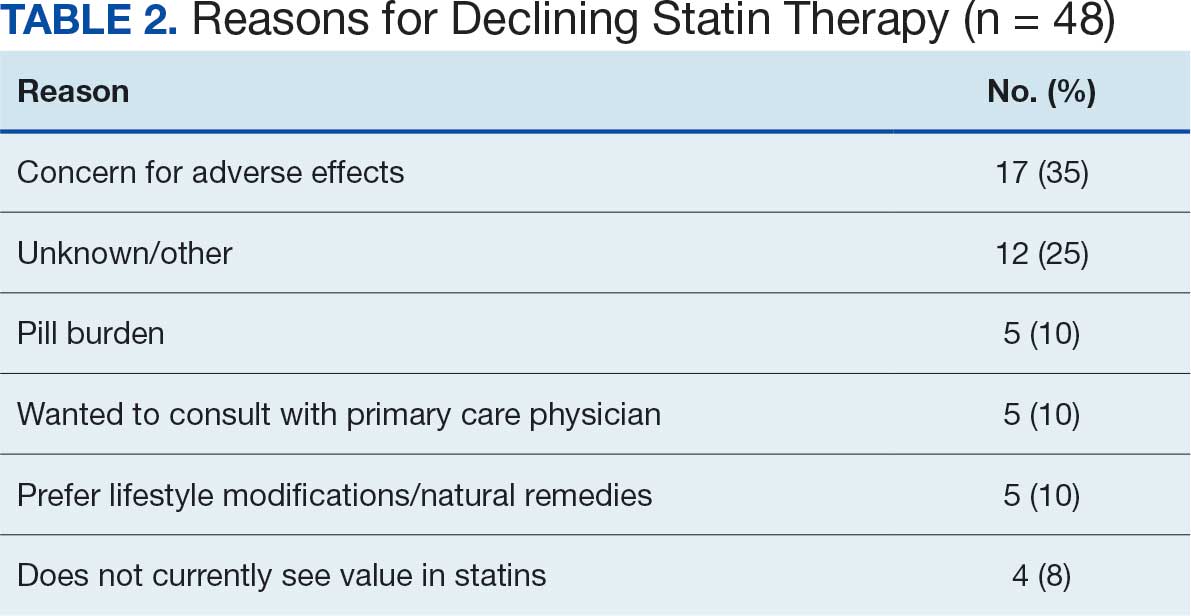
Of the 85 veterans with no active statin therapy, 37 (43.5%) accepted a new statin prescription and 48 (56.5%) declined. There were various reasons provided for declining statin therapy: 17 participants (35.4%) declined due to concern for AEs (Table 2).
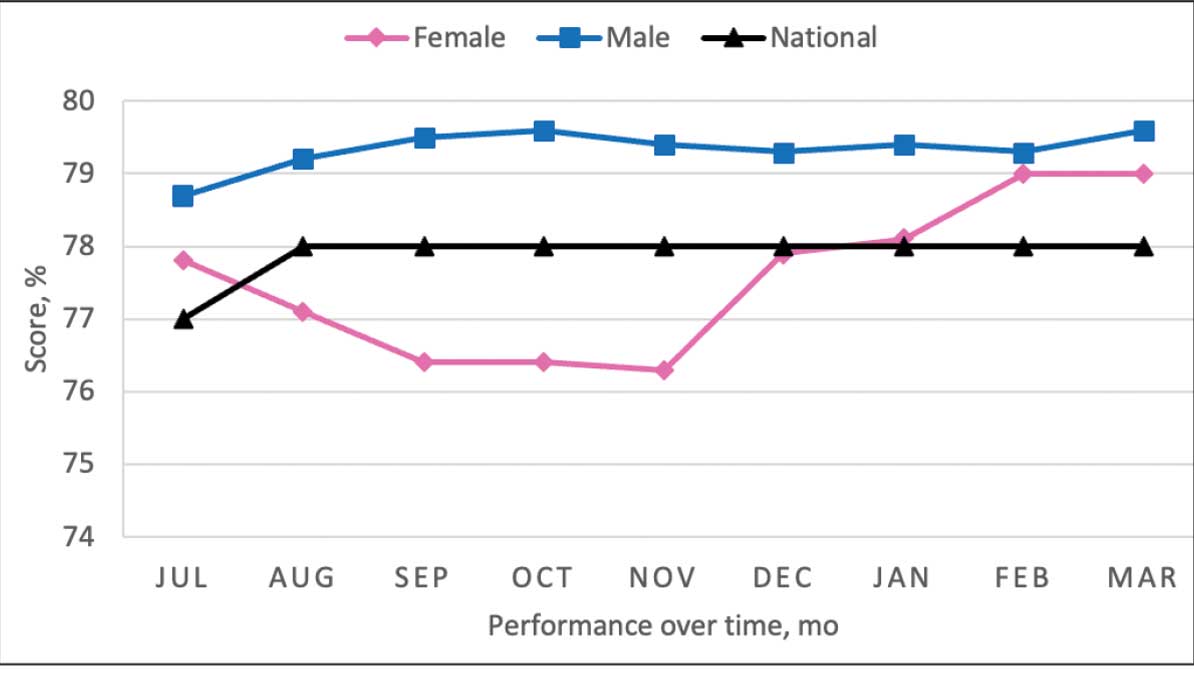
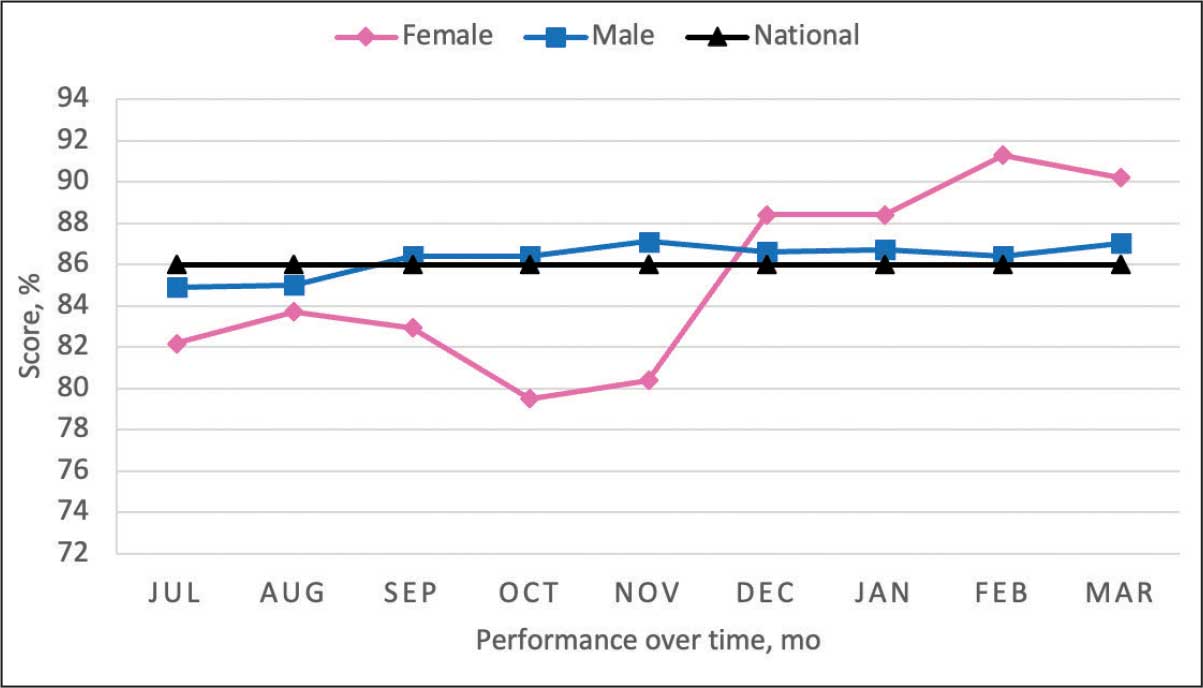
From July 2023 to March 2024, the percentage of female veterans with active statin therapy with T2DM increased from 77.8% to 79.0%. For those with active statin therapy with CVD, usage increased from 82.2% to 90.2%, which exceeded the national VA average and facility male comparator group (Figures 2 and 3).17
Secondary Outcomes
Seventy-one of 129 veterans (55.0%) gave verbal consent, and 47 (66.2%) completed the pharmacogenomic testing; 58 (45.0%) declined. Five veterans (10.6%) had a known SLCO1B1 allele variant present. One veteran required a change in statin therapy based on the results (eAppendix).
Discussion
This project aimed to increase statin prescribing among female veterans with T2DM and/or CVD to reduce cardiovascular risk and increase pharmacogenomic testing using the PCED and care managed by CPPs. The results of this quality improvement project illustrated that both metrics have improved at CVVAMC as a result of the intervention. The results in both metrics now exceed the PCED national VA average, and the CVD metric also exceeds that of the facility male comparator group. While there was only a 1.2% increase from July 2023 to March 2024 for patients with T2DM, there was an 8.0% increase for patients with CVD. Despite standardized education on statin use, more veterans declined therapy than accepted it, mostly due to concern for AEs. Recording the reasons for declining statin therapy offered valuable insight that can be used in additional discussions with veterans and clinicians.
Pharmacogenomics gives clinicians the unique opportunity to take a proactive approach to better predict drug responses, potentially allowing for less trial and error with medications, fewer AEs, greater trust in the clinician, and improved medication adherence. The CPPs incorporated pharmacogenomic testing into their practice, which led to identifying 5 SLCO1B1 gene abnormalities. The PCED served as a powerful tool for advancing equity-focused quality improvement initiatives on a local level and was crucial in prioritizing the detection of veterans potentially receiving suboptimal care.
Limitations
The nature of “cold calls” made it challenging to establish contact for inclusion in this study. An alternative to increase engagement could have been scheduled phone or face-to-face visits. While the use of the PCED was crucial, data did not account for statins listed in the non-VA medication list. All 31 patients with statins prescribed outside the VA had a start date added to provide the most accurate representation of the data moving forward.
Another limitation in this project was its small sample size and population. CVVAMC serves about 6200 female veterans, with roughly 63% identifying as Black. The preponderance of Black individuals (83%) in this project is typical for the female patient population at CVVAMC but may not reflect the demographics of other populations. Other limitations to this project consisted of scheduling conflicts. Appointments for laboratory draws at community-based outpatient clinics were subject to availability, which resulted in some delay in completion of pharmacogenomic testing.
Conclusions
CPPs can help reduce inequity in health care delivery. Increased incorporation of the PCED into regular practice within the VA is recommended to continue addressing sex disparities in statin use, diabetes control, blood pressure management, cancer screenings, and vaccination needs. CVVAMC plans to expand its use through another quality improvement project focused on reducing sex disparities in blood pressure management. Improving educational resources made available to veterans on the importance of statin therapy and potential to mitigate AEs through use of the VA PHASER program also would be helpful. This project successfully improved CVVAMC metrics for female veterans appropriately prescribed statin therapy and increased access to pharmacogenomic testing. Most importantly, it helped close the sex-based gap in CVD risk reduction care.
- Heron M. Deaths: leading causes for 2018. Nat Vital Stat Rep. 2021;70:1-114.
- US Department of Veterans Affairs, US Department of Defense. VA/DoD Clinical practice guideline for the management of dyslipidemia for cardiovascular risk reduction. Published June 2020. Accessed August 25, 2025. https://www.healthquality.va.gov/guidelines/CD/lipids/VADODDyslipidemiaCPG5087212020.pdf
- Atherosclerotic Cardiovascular Disease (ASCVD). American Heart Association. Accessed August 26, 2025. https:// www.heart.org/en/professional/quality-improvement/ascvd
- American Diabetes Association Professional Practice Committee. 10. Cardiovascular disease and risk management: standards of medical care in diabetes-2022. Diabetes Care. 2022;45(Suppl 1):S144-S174. doi:10.2337/dc22-S010
- American Diabetes Association. Standards of Care in Diabetes— 2023 abridged for primary care providers. Clinical Diabetes. 2022;41(1):4-31. doi:10.2337/cd23-as01
- Virani SS, Woodard LD, Ramsey DJ, et al. Gender disparities in evidence-based statin therapy in patients with cardiovascular disease. Am J Cardiol. 2015;115:21-26. doi:10.1016/j.amjcard.2014.09.041
- Arnett DK, Blumenthal RS, Albert MA, et al. 2019 ACC/ AHA Guideline on the primary prevention of cardiovascular disease: a report of the American College of Cardiology/ American Heart Association Task Force on Clinical Practice Guidelines. Circulation. 2019;140(11):e596-e646. doi:10.1161/CIR.0000000000000678
- Buchanan CH, Brown EA, Bishu KG, et al. The magnitude and potential causes of gender disparities in statin therapy in veterans with type 2 diabetes: a 10-year nationwide longitudinal cohort study. Womens Health Issues. 2022;32:274-283. doi:10.1016/j.whi.2021.10.003
- Ahmed F, Lin J, Ahmed T, et al. Health disparities: statin prescribing patterns among patients with diabetes in a family medicine clinic. Health Equity. 2022;6:291-297. doi:10.1089/heq.2021.0144
- Metser G, Bradley C, Moise N, Liyanage-Don N, Kronish I, Ye S. Gaps and disparities in primary prevention statin prescription during outpatient care. Am J Cardiol. 2021;161:36-41. doi:10.1016/j.amjcard.2021.08.070
- Nanna MG, Wang TY, Xiang Q, et al. Sex differences in the use of statins in community practice. Circ Cardiovasc Qual Outcomes. 2019;12(8):e005562. doi:10.1161/CIRCOUTCOMES.118.005562
- Kitzmiller JP, Mikulik EB, Dauki AM, Murkherjee C, Luzum JA. Pharmacogenomics of statins: understanding susceptibility to adverse effects. Pharmgenomics Pers Med. 2016;9:97-106. doi:10.2147/PGPM.S86013
- Türkmen D, Masoli JAH, Kuo CL, Bowden J, Melzer D, Pilling LC. Statin treatment effectiveness and the SLCO1B1*5 reduced function genotype: long-term outcomes in women and men. Br J Clin Pharmacol. 2022;88:3230-3240. doi:10.1111/bcp.15245
- Cooper-DeHoff RM, Niemi M, Ramsey LB, et al. The Clinical Pharmacogenetics Implementation Consortium guideline for SLCO1B1, ABCG2, and CYP2C9 genotypes and statin-associated musculoskeletal symptoms. Clin Pharmacol Ther. 2022;111:1007-1021. doi:10.1002/cpt.2557
- Ramsey LB, Gong L, Lee SB, et al. PharmVar GeneFocus: SLCO1B1. Clin Pharmacol Ther. 2023;113:782-793. doi:10.1002/cpt.2705
- National Healthcare Quality and Disparities Report: Chartbook on Healthcare for Veterans. Rockville (MD): Agency for Healthcare Research and Quality (US); November 2020.
- Procario G. Primary Care Equity Dashboard [database online]. Power Bi. 2023. Accessed August 26, 2025. https://app.powerbigov.us
- Hausmann LRM, Lamorte C, Estock JL. Understanding the context for incorporating equity into quality improvement throughout a national health care system. Health Equity. 2023;7(1):312-320. doi:10.1089/heq.2023.0009
Cardiovascular disease (CVD) is the leading cause of death among women in the United States.1 Most CVD is due to the buildup of plaque (ie, cholesterol, proteins, calcium, and inflammatory cells) in artery walls.2 The plaque may lead to atherosclerotic cardiovascular disease (ASCVD), which includes coronary heart disease, cerebrovascular disease, peripheral artery disease, and aortic atherosclerotic disease.2,3 Control and reduction of ASCVD risk factors, including high cholesterol levels, elevated blood pressure, insulin resistance, smoking, and a sedentary lifestyle, can contribute to a reduction in ASCVD morbidity and mortality.2 People with type 2 diabetes mellitus (T2DM) have an increased prevalence of lipid abnormalities, contributing to their high risk of ASCVD.4,5
The prescribing of statins (3-hydroxy-3-methyl-glutaryl-coenzmye A reductase inhibitors) is the cornerstone of lipid-lowering therapy and cardiovascular risk reduction for primary and secondary prevention of ASCVD.6 The American Diabetes Association (ADA) and American College of Cardiology/American Heart Association (ACC/AHA) recommend moderate- to high-intensity statins for primary prevention in patients with T2DM and high-intensity statins for secondary prevention in those with or without diabetes when not contraindicated.4,5,7 Despite eligibility according to guideline recommendations, research predominantly shows that women are less likely to receive statin therapy; however, this trend is improving. [6,8-11] To explain the sex differences in statin use, Nanna et al found that there is a combination of women being offered statin therapy less frequently, declining therapy more frequently, and discontinuing treatment more frequently.11 One possibility for discontinuing treatment could be statin-associated muscle symptoms (SAMS), which occur in about 10% of patients.12 The incidence of adverse effects (AEs) may be related to the way statins are metabolized.
Pharmacogenomic testing is free for veterans through the US Department of Veterans Affairs (VA) PHASER program, which offers information and recommendations for a panel of 11 gene variants. The panel includes genes related to common medication classes such as anticoagulants, antiplatelets, proton pump inhibitors, nonsteroidal anti-inflammatory drugs, opioids, antidepressants, and statins. The VA PHASER panel includes the solute carrier organic anion transporter family member 1B1 (SLCO1B1) gene, which is predominantly expressed in the liver and facilitates the hepatic uptake of most statins.13,14 A reduced function of SLCO1B1 can lead to higher statin levels, resulting in increased concentrations that may potentially cause SAMS.13,14 Some alleles associated with reduced function include SLCO1B1*5, *15, *23, *31, and *46 to *49, whereas others are associated with increased function, such as SLCO1B1 *14 and *20 (Appendix).15 Supporting evidence shows the SLCO1B1*5 nucleotide polymorphism increases plasma levels of simvastatin and atorvastatin, affecting effectiveness or toxicity. 13 Females tend to have a lower body weight and higher percentage of body fat compared with males, which might lead to higher concentrations of lipophilic drugs, including atorvastatin and simvastatin, which may be exacerbated by decreased function of SLCO1B1*5.15 With pharmacogenomic testing, therapeutic recommendations can be made to improve the overall safety and efficacy of statins, thus improving adherence using a patient-specific approach.14,15
Methods
Carl Vinson VA Medical Center (CVVAMC) serves about 42,000 veterans in Central and South Georgia, of which about 15% are female. Of the female veterans enrolled in care, 63% identify as Black, 27% White, and 1.5% as Asian, American Indian/Alaska Native, or Native Hawaiian/Other Pacific Islander. The 2020 Veterans Chartbook report showed that female veterans and minority racial and ethnic groups had worse access to health care and higher mortality rates than their male and non-Hispanic White counterparts.16
The Primary Care Equity Dashboard (PCED) was developed to engage the VA health care workforce in the process of identifying and addressing inequities in local patient populations.17 Using electronic quality measure data, the PCED provides Veterans Integrated Service Network-level and facility-level performance on several metrics.18 The PCED had not been previously used at the CVVAMC, and few publications or quality improvement projects regarding its use have been reported by the VA Office of Health Equity. PCED helped identify disparities when comparing female to male patients in the prescribing of statin therapy for patients with CVD and statin therapy for patients with T2DM.
VA PHASER pharmacogenomic analyses provided an opportunity to expand this quality improvement project. Sanford Health and the VA collaborated on the PHASER program to offer free genetic testing for veterans. The program launched in 2019 and expanded to various VA sites, including CVVAMC in March 2023. This program has been extended to December 31, 2025.
The primary objective of this quality improvement project was to increase statin prescribing among female veterans with T2DM and/or CVD to reduce cardiovascular risk. Secondary outcomes included increased pharmacogenomic testing and the assessment of pharmacogenomic results related to statin therapy. This project was approved by the CVVAMC Pharmacy and Therapeutics Committee. The PCED was used to identify female veterans with T2DM and/or CVD without an active prescription for a statin between July and October 2023. A review of Computerized Patient Record System patient charts was completed to screen for prespecified inclusion and exclusion criteria. Veterans were included if they were assigned female at birth, were enrolled in care at CVVAMC, and had a diagnosis of T2DM or CVD (history of myocardial infarction, coronary bypass graft, percutaneous coronary intervention, or other revascularization in any setting).
Veterans were excluded if they were currently pregnant, trying to conceive, breastfeeding, had a T1DM diagnosis, had previously documented hypersensitivity to a statin, active liver failure or decompensated cirrhosis, previously documented statin-associated rhabdomyolysis or autoimmune myopathy, an active prescription for a proprotein convertase subtilisin/kexin type 9 inhibitor, or previously documented statin intolerance (defined as the inability to tolerate ≥ 3 statins, with ≥ 1 prescribed at low intensity or alternate-day dosing). The female veterans were compared to 2 comparators: the facility's male veterans and the VA national average, identified via the PCED.
Once a veteran was screened, they were telephoned between October 2023 and February 2024 and provided education on statin use and pharmacogenomic testing using a standardized note template. An order was placed for participants who provided verbal consent for pharmacogenomic testing. Those who agreed to statin initiation were referred to a clinical pharmacist practitioner (CPP) who contacted them at a later date to prescribe a statin following the recommendations of the 2019 ACC/AHA and 2023 ADA guidelines and pharmacogenomic testing, if applicable.4,5,7 Appropriate monitoring and follow-up occurred at the discretion of each CPP. Data collection included: age, race, diagnoses (T2DM, CVD, or both), baseline lipid panel (total cholesterol, triglycerides, high-density lipoprotein, low-density lipoprotein), hepatic function, name and dose of statin, reasons for declining statin therapy, and pharmacogenomic testing results related to SLCO1B1.
Results
At baseline in July 2023, 77.8% of female veterans with T2DM were prescribed a statin, which exceeded the national VA average (77.0%), but was below the rate for male veterans (78.7%) in the facility comparator group.17 Additionally, 82.2% of females with CVD were prescribed a statin, which was below the national VA average of 86.0% and the 84.9% of male veterans in the facility comparator group.17 The PCED identified 189 female veterans from July 2023 to October 2023 who may benefit from statin therapy. Thirty-three females met the exclusion criteria. Of the 156 included veterans, 129 (82.7%) were successfully contacted and 27 (17.3%) could not be reached by telephone after 3 attempts (Figure 1). The 129 female veterans contacted had a mean age of 59 years and the majority were Black (82.9%) (Table 1).
Abbreviations: CVD, cardiovascular disease; PCSK9, proprotein convertase subtilisin/
kexin type 9; T2DM, type 2 diabetes mellitus; VAMC, Veterans Affairs medical center.
Primary Outcomes
Of the 129 contacted veterans, 31 (24.0%) had a non-VA statin prescription, 13 (10.1%) had an active VA statin prescription, and 85 (65.9%) did not have a statin prescription, despite being eligible. Statin adherence was confirmed with participants, and the medication list was updated accordingly.
Of the 85 veterans with no active statin therapy, 37 (43.5%) accepted a new statin prescription and 48 (56.5%) declined. There were various reasons provided for declining statin therapy: 17 participants (35.4%) declined due to concern for AEs (Table 2).
From July 2023 to March 2024, the percentage of female veterans with active statin therapy with T2DM increased from 77.8% to 79.0%. For those with active statin therapy with CVD, usage increased from 82.2% to 90.2%, which exceeded the national VA average and facility male comparator group (Figures 2 and 3).17
Secondary Outcomes
Seventy-one of 129 veterans (55.0%) gave verbal consent, and 47 (66.2%) completed the pharmacogenomic testing; 58 (45.0%) declined. Five veterans (10.6%) had a known SLCO1B1 allele variant present. One veteran required a change in statin therapy based on the results (eAppendix).
Discussion
This project aimed to increase statin prescribing among female veterans with T2DM and/or CVD to reduce cardiovascular risk and increase pharmacogenomic testing using the PCED and care managed by CPPs. The results of this quality improvement project illustrated that both metrics have improved at CVVAMC as a result of the intervention. The results in both metrics now exceed the PCED national VA average, and the CVD metric also exceeds that of the facility male comparator group. While there was only a 1.2% increase from July 2023 to March 2024 for patients with T2DM, there was an 8.0% increase for patients with CVD. Despite standardized education on statin use, more veterans declined therapy than accepted it, mostly due to concern for AEs. Recording the reasons for declining statin therapy offered valuable insight that can be used in additional discussions with veterans and clinicians.
Pharmacogenomics gives clinicians the unique opportunity to take a proactive approach to better predict drug responses, potentially allowing for less trial and error with medications, fewer AEs, greater trust in the clinician, and improved medication adherence. The CPPs incorporated pharmacogenomic testing into their practice, which led to identifying 5 SLCO1B1 gene abnormalities. The PCED served as a powerful tool for advancing equity-focused quality improvement initiatives on a local level and was crucial in prioritizing the detection of veterans potentially receiving suboptimal care.
Limitations
The nature of “cold calls” made it challenging to establish contact for inclusion in this study. An alternative to increase engagement could have been scheduled phone or face-to-face visits. While the use of the PCED was crucial, data did not account for statins listed in the non-VA medication list. All 31 patients with statins prescribed outside the VA had a start date added to provide the most accurate representation of the data moving forward.
Another limitation in this project was its small sample size and population. CVVAMC serves about 6200 female veterans, with roughly 63% identifying as Black. The preponderance of Black individuals (83%) in this project is typical for the female patient population at CVVAMC but may not reflect the demographics of other populations. Other limitations to this project consisted of scheduling conflicts. Appointments for laboratory draws at community-based outpatient clinics were subject to availability, which resulted in some delay in completion of pharmacogenomic testing.
Conclusions
CPPs can help reduce inequity in health care delivery. Increased incorporation of the PCED into regular practice within the VA is recommended to continue addressing sex disparities in statin use, diabetes control, blood pressure management, cancer screenings, and vaccination needs. CVVAMC plans to expand its use through another quality improvement project focused on reducing sex disparities in blood pressure management. Improving educational resources made available to veterans on the importance of statin therapy and potential to mitigate AEs through use of the VA PHASER program also would be helpful. This project successfully improved CVVAMC metrics for female veterans appropriately prescribed statin therapy and increased access to pharmacogenomic testing. Most importantly, it helped close the sex-based gap in CVD risk reduction care.
Cardiovascular disease (CVD) is the leading cause of death among women in the United States.1 Most CVD is due to the buildup of plaque (ie, cholesterol, proteins, calcium, and inflammatory cells) in artery walls.2 The plaque may lead to atherosclerotic cardiovascular disease (ASCVD), which includes coronary heart disease, cerebrovascular disease, peripheral artery disease, and aortic atherosclerotic disease.2,3 Control and reduction of ASCVD risk factors, including high cholesterol levels, elevated blood pressure, insulin resistance, smoking, and a sedentary lifestyle, can contribute to a reduction in ASCVD morbidity and mortality.2 People with type 2 diabetes mellitus (T2DM) have an increased prevalence of lipid abnormalities, contributing to their high risk of ASCVD.4,5
The prescribing of statins (3-hydroxy-3-methyl-glutaryl-coenzmye A reductase inhibitors) is the cornerstone of lipid-lowering therapy and cardiovascular risk reduction for primary and secondary prevention of ASCVD.6 The American Diabetes Association (ADA) and American College of Cardiology/American Heart Association (ACC/AHA) recommend moderate- to high-intensity statins for primary prevention in patients with T2DM and high-intensity statins for secondary prevention in those with or without diabetes when not contraindicated.4,5,7 Despite eligibility according to guideline recommendations, research predominantly shows that women are less likely to receive statin therapy; however, this trend is improving. [6,8-11] To explain the sex differences in statin use, Nanna et al found that there is a combination of women being offered statin therapy less frequently, declining therapy more frequently, and discontinuing treatment more frequently.11 One possibility for discontinuing treatment could be statin-associated muscle symptoms (SAMS), which occur in about 10% of patients.12 The incidence of adverse effects (AEs) may be related to the way statins are metabolized.
Pharmacogenomic testing is free for veterans through the US Department of Veterans Affairs (VA) PHASER program, which offers information and recommendations for a panel of 11 gene variants. The panel includes genes related to common medication classes such as anticoagulants, antiplatelets, proton pump inhibitors, nonsteroidal anti-inflammatory drugs, opioids, antidepressants, and statins. The VA PHASER panel includes the solute carrier organic anion transporter family member 1B1 (SLCO1B1) gene, which is predominantly expressed in the liver and facilitates the hepatic uptake of most statins.13,14 A reduced function of SLCO1B1 can lead to higher statin levels, resulting in increased concentrations that may potentially cause SAMS.13,14 Some alleles associated with reduced function include SLCO1B1*5, *15, *23, *31, and *46 to *49, whereas others are associated with increased function, such as SLCO1B1 *14 and *20 (Appendix).15 Supporting evidence shows the SLCO1B1*5 nucleotide polymorphism increases plasma levels of simvastatin and atorvastatin, affecting effectiveness or toxicity. 13 Females tend to have a lower body weight and higher percentage of body fat compared with males, which might lead to higher concentrations of lipophilic drugs, including atorvastatin and simvastatin, which may be exacerbated by decreased function of SLCO1B1*5.15 With pharmacogenomic testing, therapeutic recommendations can be made to improve the overall safety and efficacy of statins, thus improving adherence using a patient-specific approach.14,15
Methods
Carl Vinson VA Medical Center (CVVAMC) serves about 42,000 veterans in Central and South Georgia, of which about 15% are female. Of the female veterans enrolled in care, 63% identify as Black, 27% White, and 1.5% as Asian, American Indian/Alaska Native, or Native Hawaiian/Other Pacific Islander. The 2020 Veterans Chartbook report showed that female veterans and minority racial and ethnic groups had worse access to health care and higher mortality rates than their male and non-Hispanic White counterparts.16
The Primary Care Equity Dashboard (PCED) was developed to engage the VA health care workforce in the process of identifying and addressing inequities in local patient populations.17 Using electronic quality measure data, the PCED provides Veterans Integrated Service Network-level and facility-level performance on several metrics.18 The PCED had not been previously used at the CVVAMC, and few publications or quality improvement projects regarding its use have been reported by the VA Office of Health Equity. PCED helped identify disparities when comparing female to male patients in the prescribing of statin therapy for patients with CVD and statin therapy for patients with T2DM.
VA PHASER pharmacogenomic analyses provided an opportunity to expand this quality improvement project. Sanford Health and the VA collaborated on the PHASER program to offer free genetic testing for veterans. The program launched in 2019 and expanded to various VA sites, including CVVAMC in March 2023. This program has been extended to December 31, 2025.
The primary objective of this quality improvement project was to increase statin prescribing among female veterans with T2DM and/or CVD to reduce cardiovascular risk. Secondary outcomes included increased pharmacogenomic testing and the assessment of pharmacogenomic results related to statin therapy. This project was approved by the CVVAMC Pharmacy and Therapeutics Committee. The PCED was used to identify female veterans with T2DM and/or CVD without an active prescription for a statin between July and October 2023. A review of Computerized Patient Record System patient charts was completed to screen for prespecified inclusion and exclusion criteria. Veterans were included if they were assigned female at birth, were enrolled in care at CVVAMC, and had a diagnosis of T2DM or CVD (history of myocardial infarction, coronary bypass graft, percutaneous coronary intervention, or other revascularization in any setting).
Veterans were excluded if they were currently pregnant, trying to conceive, breastfeeding, had a T1DM diagnosis, had previously documented hypersensitivity to a statin, active liver failure or decompensated cirrhosis, previously documented statin-associated rhabdomyolysis or autoimmune myopathy, an active prescription for a proprotein convertase subtilisin/kexin type 9 inhibitor, or previously documented statin intolerance (defined as the inability to tolerate ≥ 3 statins, with ≥ 1 prescribed at low intensity or alternate-day dosing). The female veterans were compared to 2 comparators: the facility's male veterans and the VA national average, identified via the PCED.
Once a veteran was screened, they were telephoned between October 2023 and February 2024 and provided education on statin use and pharmacogenomic testing using a standardized note template. An order was placed for participants who provided verbal consent for pharmacogenomic testing. Those who agreed to statin initiation were referred to a clinical pharmacist practitioner (CPP) who contacted them at a later date to prescribe a statin following the recommendations of the 2019 ACC/AHA and 2023 ADA guidelines and pharmacogenomic testing, if applicable.4,5,7 Appropriate monitoring and follow-up occurred at the discretion of each CPP. Data collection included: age, race, diagnoses (T2DM, CVD, or both), baseline lipid panel (total cholesterol, triglycerides, high-density lipoprotein, low-density lipoprotein), hepatic function, name and dose of statin, reasons for declining statin therapy, and pharmacogenomic testing results related to SLCO1B1.
Results
At baseline in July 2023, 77.8% of female veterans with T2DM were prescribed a statin, which exceeded the national VA average (77.0%), but was below the rate for male veterans (78.7%) in the facility comparator group.17 Additionally, 82.2% of females with CVD were prescribed a statin, which was below the national VA average of 86.0% and the 84.9% of male veterans in the facility comparator group.17 The PCED identified 189 female veterans from July 2023 to October 2023 who may benefit from statin therapy. Thirty-three females met the exclusion criteria. Of the 156 included veterans, 129 (82.7%) were successfully contacted and 27 (17.3%) could not be reached by telephone after 3 attempts (Figure 1). The 129 female veterans contacted had a mean age of 59 years and the majority were Black (82.9%) (Table 1).
Abbreviations: CVD, cardiovascular disease; PCSK9, proprotein convertase subtilisin/
kexin type 9; T2DM, type 2 diabetes mellitus; VAMC, Veterans Affairs medical center.
Primary Outcomes
Of the 129 contacted veterans, 31 (24.0%) had a non-VA statin prescription, 13 (10.1%) had an active VA statin prescription, and 85 (65.9%) did not have a statin prescription, despite being eligible. Statin adherence was confirmed with participants, and the medication list was updated accordingly.
Of the 85 veterans with no active statin therapy, 37 (43.5%) accepted a new statin prescription and 48 (56.5%) declined. There were various reasons provided for declining statin therapy: 17 participants (35.4%) declined due to concern for AEs (Table 2).
From July 2023 to March 2024, the percentage of female veterans with active statin therapy with T2DM increased from 77.8% to 79.0%. For those with active statin therapy with CVD, usage increased from 82.2% to 90.2%, which exceeded the national VA average and facility male comparator group (Figures 2 and 3).17
Secondary Outcomes
Seventy-one of 129 veterans (55.0%) gave verbal consent, and 47 (66.2%) completed the pharmacogenomic testing; 58 (45.0%) declined. Five veterans (10.6%) had a known SLCO1B1 allele variant present. One veteran required a change in statin therapy based on the results (eAppendix).
Discussion
This project aimed to increase statin prescribing among female veterans with T2DM and/or CVD to reduce cardiovascular risk and increase pharmacogenomic testing using the PCED and care managed by CPPs. The results of this quality improvement project illustrated that both metrics have improved at CVVAMC as a result of the intervention. The results in both metrics now exceed the PCED national VA average, and the CVD metric also exceeds that of the facility male comparator group. While there was only a 1.2% increase from July 2023 to March 2024 for patients with T2DM, there was an 8.0% increase for patients with CVD. Despite standardized education on statin use, more veterans declined therapy than accepted it, mostly due to concern for AEs. Recording the reasons for declining statin therapy offered valuable insight that can be used in additional discussions with veterans and clinicians.
Pharmacogenomics gives clinicians the unique opportunity to take a proactive approach to better predict drug responses, potentially allowing for less trial and error with medications, fewer AEs, greater trust in the clinician, and improved medication adherence. The CPPs incorporated pharmacogenomic testing into their practice, which led to identifying 5 SLCO1B1 gene abnormalities. The PCED served as a powerful tool for advancing equity-focused quality improvement initiatives on a local level and was crucial in prioritizing the detection of veterans potentially receiving suboptimal care.
Limitations
The nature of “cold calls” made it challenging to establish contact for inclusion in this study. An alternative to increase engagement could have been scheduled phone or face-to-face visits. While the use of the PCED was crucial, data did not account for statins listed in the non-VA medication list. All 31 patients with statins prescribed outside the VA had a start date added to provide the most accurate representation of the data moving forward.
Another limitation in this project was its small sample size and population. CVVAMC serves about 6200 female veterans, with roughly 63% identifying as Black. The preponderance of Black individuals (83%) in this project is typical for the female patient population at CVVAMC but may not reflect the demographics of other populations. Other limitations to this project consisted of scheduling conflicts. Appointments for laboratory draws at community-based outpatient clinics were subject to availability, which resulted in some delay in completion of pharmacogenomic testing.
Conclusions
CPPs can help reduce inequity in health care delivery. Increased incorporation of the PCED into regular practice within the VA is recommended to continue addressing sex disparities in statin use, diabetes control, blood pressure management, cancer screenings, and vaccination needs. CVVAMC plans to expand its use through another quality improvement project focused on reducing sex disparities in blood pressure management. Improving educational resources made available to veterans on the importance of statin therapy and potential to mitigate AEs through use of the VA PHASER program also would be helpful. This project successfully improved CVVAMC metrics for female veterans appropriately prescribed statin therapy and increased access to pharmacogenomic testing. Most importantly, it helped close the sex-based gap in CVD risk reduction care.
- Heron M. Deaths: leading causes for 2018. Nat Vital Stat Rep. 2021;70:1-114.
- US Department of Veterans Affairs, US Department of Defense. VA/DoD Clinical practice guideline for the management of dyslipidemia for cardiovascular risk reduction. Published June 2020. Accessed August 25, 2025. https://www.healthquality.va.gov/guidelines/CD/lipids/VADODDyslipidemiaCPG5087212020.pdf
- Atherosclerotic Cardiovascular Disease (ASCVD). American Heart Association. Accessed August 26, 2025. https:// www.heart.org/en/professional/quality-improvement/ascvd
- American Diabetes Association Professional Practice Committee. 10. Cardiovascular disease and risk management: standards of medical care in diabetes-2022. Diabetes Care. 2022;45(Suppl 1):S144-S174. doi:10.2337/dc22-S010
- American Diabetes Association. Standards of Care in Diabetes— 2023 abridged for primary care providers. Clinical Diabetes. 2022;41(1):4-31. doi:10.2337/cd23-as01
- Virani SS, Woodard LD, Ramsey DJ, et al. Gender disparities in evidence-based statin therapy in patients with cardiovascular disease. Am J Cardiol. 2015;115:21-26. doi:10.1016/j.amjcard.2014.09.041
- Arnett DK, Blumenthal RS, Albert MA, et al. 2019 ACC/ AHA Guideline on the primary prevention of cardiovascular disease: a report of the American College of Cardiology/ American Heart Association Task Force on Clinical Practice Guidelines. Circulation. 2019;140(11):e596-e646. doi:10.1161/CIR.0000000000000678
- Buchanan CH, Brown EA, Bishu KG, et al. The magnitude and potential causes of gender disparities in statin therapy in veterans with type 2 diabetes: a 10-year nationwide longitudinal cohort study. Womens Health Issues. 2022;32:274-283. doi:10.1016/j.whi.2021.10.003
- Ahmed F, Lin J, Ahmed T, et al. Health disparities: statin prescribing patterns among patients with diabetes in a family medicine clinic. Health Equity. 2022;6:291-297. doi:10.1089/heq.2021.0144
- Metser G, Bradley C, Moise N, Liyanage-Don N, Kronish I, Ye S. Gaps and disparities in primary prevention statin prescription during outpatient care. Am J Cardiol. 2021;161:36-41. doi:10.1016/j.amjcard.2021.08.070
- Nanna MG, Wang TY, Xiang Q, et al. Sex differences in the use of statins in community practice. Circ Cardiovasc Qual Outcomes. 2019;12(8):e005562. doi:10.1161/CIRCOUTCOMES.118.005562
- Kitzmiller JP, Mikulik EB, Dauki AM, Murkherjee C, Luzum JA. Pharmacogenomics of statins: understanding susceptibility to adverse effects. Pharmgenomics Pers Med. 2016;9:97-106. doi:10.2147/PGPM.S86013
- Türkmen D, Masoli JAH, Kuo CL, Bowden J, Melzer D, Pilling LC. Statin treatment effectiveness and the SLCO1B1*5 reduced function genotype: long-term outcomes in women and men. Br J Clin Pharmacol. 2022;88:3230-3240. doi:10.1111/bcp.15245
- Cooper-DeHoff RM, Niemi M, Ramsey LB, et al. The Clinical Pharmacogenetics Implementation Consortium guideline for SLCO1B1, ABCG2, and CYP2C9 genotypes and statin-associated musculoskeletal symptoms. Clin Pharmacol Ther. 2022;111:1007-1021. doi:10.1002/cpt.2557
- Ramsey LB, Gong L, Lee SB, et al. PharmVar GeneFocus: SLCO1B1. Clin Pharmacol Ther. 2023;113:782-793. doi:10.1002/cpt.2705
- National Healthcare Quality and Disparities Report: Chartbook on Healthcare for Veterans. Rockville (MD): Agency for Healthcare Research and Quality (US); November 2020.
- Procario G. Primary Care Equity Dashboard [database online]. Power Bi. 2023. Accessed August 26, 2025. https://app.powerbigov.us
- Hausmann LRM, Lamorte C, Estock JL. Understanding the context for incorporating equity into quality improvement throughout a national health care system. Health Equity. 2023;7(1):312-320. doi:10.1089/heq.2023.0009
- Heron M. Deaths: leading causes for 2018. Nat Vital Stat Rep. 2021;70:1-114.
- US Department of Veterans Affairs, US Department of Defense. VA/DoD Clinical practice guideline for the management of dyslipidemia for cardiovascular risk reduction. Published June 2020. Accessed August 25, 2025. https://www.healthquality.va.gov/guidelines/CD/lipids/VADODDyslipidemiaCPG5087212020.pdf
- Atherosclerotic Cardiovascular Disease (ASCVD). American Heart Association. Accessed August 26, 2025. https:// www.heart.org/en/professional/quality-improvement/ascvd
- American Diabetes Association Professional Practice Committee. 10. Cardiovascular disease and risk management: standards of medical care in diabetes-2022. Diabetes Care. 2022;45(Suppl 1):S144-S174. doi:10.2337/dc22-S010
- American Diabetes Association. Standards of Care in Diabetes— 2023 abridged for primary care providers. Clinical Diabetes. 2022;41(1):4-31. doi:10.2337/cd23-as01
- Virani SS, Woodard LD, Ramsey DJ, et al. Gender disparities in evidence-based statin therapy in patients with cardiovascular disease. Am J Cardiol. 2015;115:21-26. doi:10.1016/j.amjcard.2014.09.041
- Arnett DK, Blumenthal RS, Albert MA, et al. 2019 ACC/ AHA Guideline on the primary prevention of cardiovascular disease: a report of the American College of Cardiology/ American Heart Association Task Force on Clinical Practice Guidelines. Circulation. 2019;140(11):e596-e646. doi:10.1161/CIR.0000000000000678
- Buchanan CH, Brown EA, Bishu KG, et al. The magnitude and potential causes of gender disparities in statin therapy in veterans with type 2 diabetes: a 10-year nationwide longitudinal cohort study. Womens Health Issues. 2022;32:274-283. doi:10.1016/j.whi.2021.10.003
- Ahmed F, Lin J, Ahmed T, et al. Health disparities: statin prescribing patterns among patients with diabetes in a family medicine clinic. Health Equity. 2022;6:291-297. doi:10.1089/heq.2021.0144
- Metser G, Bradley C, Moise N, Liyanage-Don N, Kronish I, Ye S. Gaps and disparities in primary prevention statin prescription during outpatient care. Am J Cardiol. 2021;161:36-41. doi:10.1016/j.amjcard.2021.08.070
- Nanna MG, Wang TY, Xiang Q, et al. Sex differences in the use of statins in community practice. Circ Cardiovasc Qual Outcomes. 2019;12(8):e005562. doi:10.1161/CIRCOUTCOMES.118.005562
- Kitzmiller JP, Mikulik EB, Dauki AM, Murkherjee C, Luzum JA. Pharmacogenomics of statins: understanding susceptibility to adverse effects. Pharmgenomics Pers Med. 2016;9:97-106. doi:10.2147/PGPM.S86013
- Türkmen D, Masoli JAH, Kuo CL, Bowden J, Melzer D, Pilling LC. Statin treatment effectiveness and the SLCO1B1*5 reduced function genotype: long-term outcomes in women and men. Br J Clin Pharmacol. 2022;88:3230-3240. doi:10.1111/bcp.15245
- Cooper-DeHoff RM, Niemi M, Ramsey LB, et al. The Clinical Pharmacogenetics Implementation Consortium guideline for SLCO1B1, ABCG2, and CYP2C9 genotypes and statin-associated musculoskeletal symptoms. Clin Pharmacol Ther. 2022;111:1007-1021. doi:10.1002/cpt.2557
- Ramsey LB, Gong L, Lee SB, et al. PharmVar GeneFocus: SLCO1B1. Clin Pharmacol Ther. 2023;113:782-793. doi:10.1002/cpt.2705
- National Healthcare Quality and Disparities Report: Chartbook on Healthcare for Veterans. Rockville (MD): Agency for Healthcare Research and Quality (US); November 2020.
- Procario G. Primary Care Equity Dashboard [database online]. Power Bi. 2023. Accessed August 26, 2025. https://app.powerbigov.us
- Hausmann LRM, Lamorte C, Estock JL. Understanding the context for incorporating equity into quality improvement throughout a national health care system. Health Equity. 2023;7(1):312-320. doi:10.1089/heq.2023.0009
Reducing Sex Disparities in Statin Therapy Among Female Veterans With Type 2 Diabetes and/or Cardiovascular Disease
Reducing Sex Disparities in Statin Therapy Among Female Veterans With Type 2 Diabetes and/or Cardiovascular Disease
Smooth Symmetric Plaques on the Face, Trunk, and Extremities
Smooth Symmetric Plaques on the Face, Trunk, and Extremities
THE DIAGNOSIS: Lepromatous Leprosy
Histopathology showed collections of epithelioid to sarcoidal granulomas throughout the dermis and clustered around nerve bundles with a grenz zone at the dermoepidermal junction. Fite stain was positive for acid-fast bacteria, which were confirmed to be Mycobacterium leprae by by the National Hansen’s Disease program. Based on these findings, a diagnosis of lepromatous leprosy (LL) was made. The patient was treated by the infectious disease department with multidrug therapy that included monthly rifampin, moxifloxacin, and minocycline; weekly methotrexate with daily folic acid; and an extended prednisone taper with prophylactic cholecalciferol.
Lepromatous leprosy is characterized by high antibody titers to the acid-fast, gram-positive bacillus Mycobacterium leprae as well as a high bacillary load.1 Patients typically present with muscle weakness, anesthetic skin patches, and claw hands. Patients also may present with foot drop, ulcerations of the hands and feet, autonomic dysfunction with anhidrosis or impaired sweating, and localized alopecia.2 Over months to years, LL may progress to extensive sensory loss and indurated lesions that infiltrate the skin and cause thickening, especially on the face (known as leonine facies). Furthermore, LL is characterized by extensive bilaterally symmetric cutaneous lesions with poorly defined borders and raised indurated centers.3
Lepromatous leprosy transmission is not fully understood but is thought to occur via airborne droplets from coughing/sneezing and nasal secretions.2 Histopathology generally shows a dense and diffuse granulomatous infiltrate that involves the dermis but is separated from the epidermis by a zone of collagen (grenz zone).3 Histology is characterized by the presence of lymphocytes and numerous foamy macrophages (lepra or Virchow cells) containing M leprae organisms. In persistent lesions, the high density of uncleared bacilli forms spherical cytoplasmic clumps known as globi within enlarged foamy histiocytes (Figure 1).4 The macrophages form granulomatous lesions in the skin and around nerve bundles, resulting in tissue damage and decreased sensation. The current standard of care for LL is a multidrug combination of dapsone, rifampin, and clofazimine. Early diagnosis and complete treatment of LL is crucial, as this approach typically leads to complete cure of the disease.
The differential diagnosis for LL includes granuloma annulare (GA), mycosis fungoides (MF), sarcoidosis, and subacute cutaneous lupus erythematosus (SCLE). Granuloma annulare is a noninfectious inflammatory granulomatous skin disease that manifests in a localized, generalized, or subcutaneous pattern. Localized GA is the most common form and manifests as self-resolving, flesh-colored or erythematous papules or plaques limited to the extremities.5,6 Generalized GA is defined by more than 10 widespread annular plaques involving the trunk and extremities and can persist for decades.6 This form can be associated with hyperlipidemia, diabetes, autoimmune disease and immunodeficiency (eg, HIV), and rarely with lymphoma or solid tumors. On histology, GA shows necrobiosis surrounded by palisading histiocytes and mucin (palisading GA) or patchy interstitial histiocytes and lymphocytes (interstitial GA)(Figure 2).6 This palisading pattern differs from the histiocytes in LL, which contain numerous acid-fast bacilli and bacterial clumps. Topical and intralesional corticosteroids are first-line therapies for GA.
Mycosis fungoides is a cutaneous T-cell lymphoma characterized by proliferation of CD4+ T cells.7 In the early stages of MF, patients may present with multiple erythematous and scaly patches, plaques, or nodules that most commonly develop on unexposed areas of the skin, but specific variants frequently may cause lesions on the face or scalp.8 Tumors may be solitary, localized, or generalized and may be observed alongside patches and plaques or in the absence of cutaneous lesions.7 The pathologic features of MF include fibrosis of the papillary dermis, individual haloed atypical lymphocytes in the epidermis, and atypical lymphoid cells with cerebriform nuclei (Figure 3).9 Granulomatous MF is characterized by diffuse nodular and perivascular infiltrates of histiocytes with small lymphocytes without atypia, eosinophils, and plasma cells. Small lymphocytes with cerebriform nuclei and larger lymphocytes with hyperconvoluted nuclei also may be seen, in addition to multinucleated histiocytic giant cells. Although MF commonly manifests with epidermotropism, it typically is absent in granulomatous MF (GMF).10 Granulomatous MF may manifest similarly to LL. Noduloulcerative lesions and infiltration of atypical lymphocytes into the epidermis (epidermotropism) are much more common in GMF than in LL; however, although ulcerative nodules are not a common feature in patients with leprosy (except during reactional states [ie, Lucio phenomenon]) or secondary to neuropathies, they also can occur in LL.11 In GMF, the infiltrate does not follow a specific pattern, whereas LL infiltrates tend to follow a nerve distribution. Treatment for MF is determined by disease severity.12 First-line therapy includes local corticosteroids and phototherapy with UVB irradiation.
Sarcoidosis is a multisystem disease that demonstrates nonspecific clinical manifestations affecting the lungs, eyes, liver, and skin.13 Environmental exposures to silica and inorganic matter have been linked to an increased risk for sarcoidosis, with patients presenting with fatigue, fever, and arthralgia.13 Skin manifestations include subcutaneous nodules, polymorphous plaques, and erythema nodosum—nodosum—the most common cutaneous presentation of sarcoidosis. Erythema nodosum manifests as symmetrically distributed, nonulcerative, painful red nodules on the skin, especially the lower legs. The histopathology of sarcoidosis shows noncaseating granulomas with activated T-lymphocytes, epithelioid cells, and multinucleated giant cells (Figure 4). Although granulomas occur in both LL and sarcoidosis, those in sarcoidosis typically consist of epithelioid cells surrounded by a rim of lymphocytes, whereas LL granulomas contain foamy histiocytes and multinucleated giant cells. Treatment of sarcoidosis depends on disease progression and generally involves oral corticosteroids, followed by corticosteroid-sparing regimens.
Subacute cutaneous lupus erythematosus is a chronic autoimmune disease that predominantly affects younger women. Common findings in SCLE include red scaly plaques and ring-shaped lesions on sun-exposed areas of the skin.14 Subacute cutaneous lupus erythematosus primarily is characterized by a photosensitive rash, often with arthralgia, myalgia, and/or oral ulcers; less commonly, a small percentage of patients can experience central nervous system involvement, vasculitis, or nephritis. The histologic findings of SCLE include hydropic degeneration of the basal cell layer and periadnexal infiltrates (Figure 5). The incidence of SCLE often is associated with anti-Ro (SSA) and anti-La (SSB) antibodies.15 Treatment of SCLE focuses on managing skin symptoms with corticosteroids, antimalarials, and sun protection.
- Bobosha K, Wilson L, van Meijgaarden KE, et al. T-cell regulation in lepromatous leprosy. PLoS Negl Trop Dis. 2014;8:E2773. doi:10.1371 /journal.pntd.0002773
- Fischer M. Leprosy–an overview of clinical features, diagnosis, and treatment. J Dtsch Dermatol Ges. 2017;15:801-827. doi:10.1111/ddg.13301
- Jolly M, Pickard SA, Mikolaitis RA, et al. Lupus QoL-US benchmarks for US patients with systemic lupus erythematosus. J Rheumatol. 2010;37:1828-1833. doi:10.3899/jrheum.091443
- Chan MMF, Smoller BR. Overview of the histopathology and other laboratory investigations in leprosy. Curr Trop Med Rep. 2016;3:131-137. doi:10.1007/s40475-016-0086-y
- Piette EW, Rosenbach M. Granuloma annulare: clinical and histologic variants, epidemiology, and genetics. J Am Acad Dermatol. 2016; 75:457-465. doi:10.1016/j.jaad.2015.03.054
- Lukács J, Schliemann S, Elsner P. Treatment of generalized granuloma annulare–a systematic review. J Eur Acad Dermatol Venereol. 2015;29:1467-1480. doi:10.1111/jdv.12976
- Zinzani PL, Ferreri AJM, Cerroni L. Mycosis fungoides. Crit Rev Oncol Hematol. 2008;65:172-182. doi:10.1016/j.critrevonc.2007.08.004
- Ahn CS, ALSayyah A, Sangüeza OP. Mycosis fungoides: an updated review of clinicopathologic variants. Am J Dermatopathol. 2014;36:933- 951. doi:10.1097/DAD.0000000000000207
- Gutte R, Kharkar V, Mahajan S, et al. Granulomatous mycosis fungoides with hypohidrosis mimicking lepromatous leprosy. Indian J Dermatol Venereol Leprol. 2010;76:686. doi:10.4103/0378-6323.72470
- Kempf W, Ostheeren-Michaelis S, Paulli M, et al. Granulomatous mycosis fungoides and granulomatous slack skin: a multicenter study of the cutaneous lymphoma histopathology task force group of the European Organization for Research and Treatment of Cancer (EORTC). Arch Dermatol. 2008;144:1609-1617. doi:10.1001 /archdermatol.2008.46
- Miyashiro D, Cardona C, Valente N, et al. Ulcers in leprosy patients, an unrecognized clinical manifestation: a report of 8 cases. BMC Infect Dis. 2019;19:1013. doi:10.1186/s12879-019-4639-2
- Cerroni L. Mycosis fungoides-clinical and histopathologic features, differential diagnosis, and treatment. Semin Cutan Med Surg. 2018;37:2-10. doi:10.12788/j.sder.2018.002
- Jain R, Yadav D, Puranik N, et al. Sarcoidosis: causes, diagnosis, clinical features, and treatments. J Clin Med. 2020;9:1081. doi:10.3390 /jcm9041081
- Zÿ ychowska M, Reich A. Dermoscopic features of acute, subacute, chronic and intermittent subtypes of cutaneous lupus erythematosus in Caucasians. J Clin Med. 2022;11:4088. doi:10.3390/jcm11144088
- Lazar AL. Subacute cutaneous lupus erythematosus: a facultative paraneoplastic dermatosis. Clin Dermatol. 2022;40:728-742. doi:10.1016 /j.clindermatol.2022.07.007
THE DIAGNOSIS: Lepromatous Leprosy
Histopathology showed collections of epithelioid to sarcoidal granulomas throughout the dermis and clustered around nerve bundles with a grenz zone at the dermoepidermal junction. Fite stain was positive for acid-fast bacteria, which were confirmed to be Mycobacterium leprae by by the National Hansen’s Disease program. Based on these findings, a diagnosis of lepromatous leprosy (LL) was made. The patient was treated by the infectious disease department with multidrug therapy that included monthly rifampin, moxifloxacin, and minocycline; weekly methotrexate with daily folic acid; and an extended prednisone taper with prophylactic cholecalciferol.
Lepromatous leprosy is characterized by high antibody titers to the acid-fast, gram-positive bacillus Mycobacterium leprae as well as a high bacillary load.1 Patients typically present with muscle weakness, anesthetic skin patches, and claw hands. Patients also may present with foot drop, ulcerations of the hands and feet, autonomic dysfunction with anhidrosis or impaired sweating, and localized alopecia.2 Over months to years, LL may progress to extensive sensory loss and indurated lesions that infiltrate the skin and cause thickening, especially on the face (known as leonine facies). Furthermore, LL is characterized by extensive bilaterally symmetric cutaneous lesions with poorly defined borders and raised indurated centers.3
Lepromatous leprosy transmission is not fully understood but is thought to occur via airborne droplets from coughing/sneezing and nasal secretions.2 Histopathology generally shows a dense and diffuse granulomatous infiltrate that involves the dermis but is separated from the epidermis by a zone of collagen (grenz zone).3 Histology is characterized by the presence of lymphocytes and numerous foamy macrophages (lepra or Virchow cells) containing M leprae organisms. In persistent lesions, the high density of uncleared bacilli forms spherical cytoplasmic clumps known as globi within enlarged foamy histiocytes (Figure 1).4 The macrophages form granulomatous lesions in the skin and around nerve bundles, resulting in tissue damage and decreased sensation. The current standard of care for LL is a multidrug combination of dapsone, rifampin, and clofazimine. Early diagnosis and complete treatment of LL is crucial, as this approach typically leads to complete cure of the disease.
The differential diagnosis for LL includes granuloma annulare (GA), mycosis fungoides (MF), sarcoidosis, and subacute cutaneous lupus erythematosus (SCLE). Granuloma annulare is a noninfectious inflammatory granulomatous skin disease that manifests in a localized, generalized, or subcutaneous pattern. Localized GA is the most common form and manifests as self-resolving, flesh-colored or erythematous papules or plaques limited to the extremities.5,6 Generalized GA is defined by more than 10 widespread annular plaques involving the trunk and extremities and can persist for decades.6 This form can be associated with hyperlipidemia, diabetes, autoimmune disease and immunodeficiency (eg, HIV), and rarely with lymphoma or solid tumors. On histology, GA shows necrobiosis surrounded by palisading histiocytes and mucin (palisading GA) or patchy interstitial histiocytes and lymphocytes (interstitial GA)(Figure 2).6 This palisading pattern differs from the histiocytes in LL, which contain numerous acid-fast bacilli and bacterial clumps. Topical and intralesional corticosteroids are first-line therapies for GA.
Mycosis fungoides is a cutaneous T-cell lymphoma characterized by proliferation of CD4+ T cells.7 In the early stages of MF, patients may present with multiple erythematous and scaly patches, plaques, or nodules that most commonly develop on unexposed areas of the skin, but specific variants frequently may cause lesions on the face or scalp.8 Tumors may be solitary, localized, or generalized and may be observed alongside patches and plaques or in the absence of cutaneous lesions.7 The pathologic features of MF include fibrosis of the papillary dermis, individual haloed atypical lymphocytes in the epidermis, and atypical lymphoid cells with cerebriform nuclei (Figure 3).9 Granulomatous MF is characterized by diffuse nodular and perivascular infiltrates of histiocytes with small lymphocytes without atypia, eosinophils, and plasma cells. Small lymphocytes with cerebriform nuclei and larger lymphocytes with hyperconvoluted nuclei also may be seen, in addition to multinucleated histiocytic giant cells. Although MF commonly manifests with epidermotropism, it typically is absent in granulomatous MF (GMF).10 Granulomatous MF may manifest similarly to LL. Noduloulcerative lesions and infiltration of atypical lymphocytes into the epidermis (epidermotropism) are much more common in GMF than in LL; however, although ulcerative nodules are not a common feature in patients with leprosy (except during reactional states [ie, Lucio phenomenon]) or secondary to neuropathies, they also can occur in LL.11 In GMF, the infiltrate does not follow a specific pattern, whereas LL infiltrates tend to follow a nerve distribution. Treatment for MF is determined by disease severity.12 First-line therapy includes local corticosteroids and phototherapy with UVB irradiation.
Sarcoidosis is a multisystem disease that demonstrates nonspecific clinical manifestations affecting the lungs, eyes, liver, and skin.13 Environmental exposures to silica and inorganic matter have been linked to an increased risk for sarcoidosis, with patients presenting with fatigue, fever, and arthralgia.13 Skin manifestations include subcutaneous nodules, polymorphous plaques, and erythema nodosum—nodosum—the most common cutaneous presentation of sarcoidosis. Erythema nodosum manifests as symmetrically distributed, nonulcerative, painful red nodules on the skin, especially the lower legs. The histopathology of sarcoidosis shows noncaseating granulomas with activated T-lymphocytes, epithelioid cells, and multinucleated giant cells (Figure 4). Although granulomas occur in both LL and sarcoidosis, those in sarcoidosis typically consist of epithelioid cells surrounded by a rim of lymphocytes, whereas LL granulomas contain foamy histiocytes and multinucleated giant cells. Treatment of sarcoidosis depends on disease progression and generally involves oral corticosteroids, followed by corticosteroid-sparing regimens.
Subacute cutaneous lupus erythematosus is a chronic autoimmune disease that predominantly affects younger women. Common findings in SCLE include red scaly plaques and ring-shaped lesions on sun-exposed areas of the skin.14 Subacute cutaneous lupus erythematosus primarily is characterized by a photosensitive rash, often with arthralgia, myalgia, and/or oral ulcers; less commonly, a small percentage of patients can experience central nervous system involvement, vasculitis, or nephritis. The histologic findings of SCLE include hydropic degeneration of the basal cell layer and periadnexal infiltrates (Figure 5). The incidence of SCLE often is associated with anti-Ro (SSA) and anti-La (SSB) antibodies.15 Treatment of SCLE focuses on managing skin symptoms with corticosteroids, antimalarials, and sun protection.
THE DIAGNOSIS: Lepromatous Leprosy
Histopathology showed collections of epithelioid to sarcoidal granulomas throughout the dermis and clustered around nerve bundles with a grenz zone at the dermoepidermal junction. Fite stain was positive for acid-fast bacteria, which were confirmed to be Mycobacterium leprae by by the National Hansen’s Disease program. Based on these findings, a diagnosis of lepromatous leprosy (LL) was made. The patient was treated by the infectious disease department with multidrug therapy that included monthly rifampin, moxifloxacin, and minocycline; weekly methotrexate with daily folic acid; and an extended prednisone taper with prophylactic cholecalciferol.
Lepromatous leprosy is characterized by high antibody titers to the acid-fast, gram-positive bacillus Mycobacterium leprae as well as a high bacillary load.1 Patients typically present with muscle weakness, anesthetic skin patches, and claw hands. Patients also may present with foot drop, ulcerations of the hands and feet, autonomic dysfunction with anhidrosis or impaired sweating, and localized alopecia.2 Over months to years, LL may progress to extensive sensory loss and indurated lesions that infiltrate the skin and cause thickening, especially on the face (known as leonine facies). Furthermore, LL is characterized by extensive bilaterally symmetric cutaneous lesions with poorly defined borders and raised indurated centers.3
Lepromatous leprosy transmission is not fully understood but is thought to occur via airborne droplets from coughing/sneezing and nasal secretions.2 Histopathology generally shows a dense and diffuse granulomatous infiltrate that involves the dermis but is separated from the epidermis by a zone of collagen (grenz zone).3 Histology is characterized by the presence of lymphocytes and numerous foamy macrophages (lepra or Virchow cells) containing M leprae organisms. In persistent lesions, the high density of uncleared bacilli forms spherical cytoplasmic clumps known as globi within enlarged foamy histiocytes (Figure 1).4 The macrophages form granulomatous lesions in the skin and around nerve bundles, resulting in tissue damage and decreased sensation. The current standard of care for LL is a multidrug combination of dapsone, rifampin, and clofazimine. Early diagnosis and complete treatment of LL is crucial, as this approach typically leads to complete cure of the disease.
The differential diagnosis for LL includes granuloma annulare (GA), mycosis fungoides (MF), sarcoidosis, and subacute cutaneous lupus erythematosus (SCLE). Granuloma annulare is a noninfectious inflammatory granulomatous skin disease that manifests in a localized, generalized, or subcutaneous pattern. Localized GA is the most common form and manifests as self-resolving, flesh-colored or erythematous papules or plaques limited to the extremities.5,6 Generalized GA is defined by more than 10 widespread annular plaques involving the trunk and extremities and can persist for decades.6 This form can be associated with hyperlipidemia, diabetes, autoimmune disease and immunodeficiency (eg, HIV), and rarely with lymphoma or solid tumors. On histology, GA shows necrobiosis surrounded by palisading histiocytes and mucin (palisading GA) or patchy interstitial histiocytes and lymphocytes (interstitial GA)(Figure 2).6 This palisading pattern differs from the histiocytes in LL, which contain numerous acid-fast bacilli and bacterial clumps. Topical and intralesional corticosteroids are first-line therapies for GA.
Mycosis fungoides is a cutaneous T-cell lymphoma characterized by proliferation of CD4+ T cells.7 In the early stages of MF, patients may present with multiple erythematous and scaly patches, plaques, or nodules that most commonly develop on unexposed areas of the skin, but specific variants frequently may cause lesions on the face or scalp.8 Tumors may be solitary, localized, or generalized and may be observed alongside patches and plaques or in the absence of cutaneous lesions.7 The pathologic features of MF include fibrosis of the papillary dermis, individual haloed atypical lymphocytes in the epidermis, and atypical lymphoid cells with cerebriform nuclei (Figure 3).9 Granulomatous MF is characterized by diffuse nodular and perivascular infiltrates of histiocytes with small lymphocytes without atypia, eosinophils, and plasma cells. Small lymphocytes with cerebriform nuclei and larger lymphocytes with hyperconvoluted nuclei also may be seen, in addition to multinucleated histiocytic giant cells. Although MF commonly manifests with epidermotropism, it typically is absent in granulomatous MF (GMF).10 Granulomatous MF may manifest similarly to LL. Noduloulcerative lesions and infiltration of atypical lymphocytes into the epidermis (epidermotropism) are much more common in GMF than in LL; however, although ulcerative nodules are not a common feature in patients with leprosy (except during reactional states [ie, Lucio phenomenon]) or secondary to neuropathies, they also can occur in LL.11 In GMF, the infiltrate does not follow a specific pattern, whereas LL infiltrates tend to follow a nerve distribution. Treatment for MF is determined by disease severity.12 First-line therapy includes local corticosteroids and phototherapy with UVB irradiation.
Sarcoidosis is a multisystem disease that demonstrates nonspecific clinical manifestations affecting the lungs, eyes, liver, and skin.13 Environmental exposures to silica and inorganic matter have been linked to an increased risk for sarcoidosis, with patients presenting with fatigue, fever, and arthralgia.13 Skin manifestations include subcutaneous nodules, polymorphous plaques, and erythema nodosum—nodosum—the most common cutaneous presentation of sarcoidosis. Erythema nodosum manifests as symmetrically distributed, nonulcerative, painful red nodules on the skin, especially the lower legs. The histopathology of sarcoidosis shows noncaseating granulomas with activated T-lymphocytes, epithelioid cells, and multinucleated giant cells (Figure 4). Although granulomas occur in both LL and sarcoidosis, those in sarcoidosis typically consist of epithelioid cells surrounded by a rim of lymphocytes, whereas LL granulomas contain foamy histiocytes and multinucleated giant cells. Treatment of sarcoidosis depends on disease progression and generally involves oral corticosteroids, followed by corticosteroid-sparing regimens.
Subacute cutaneous lupus erythematosus is a chronic autoimmune disease that predominantly affects younger women. Common findings in SCLE include red scaly plaques and ring-shaped lesions on sun-exposed areas of the skin.14 Subacute cutaneous lupus erythematosus primarily is characterized by a photosensitive rash, often with arthralgia, myalgia, and/or oral ulcers; less commonly, a small percentage of patients can experience central nervous system involvement, vasculitis, or nephritis. The histologic findings of SCLE include hydropic degeneration of the basal cell layer and periadnexal infiltrates (Figure 5). The incidence of SCLE often is associated with anti-Ro (SSA) and anti-La (SSB) antibodies.15 Treatment of SCLE focuses on managing skin symptoms with corticosteroids, antimalarials, and sun protection.
- Bobosha K, Wilson L, van Meijgaarden KE, et al. T-cell regulation in lepromatous leprosy. PLoS Negl Trop Dis. 2014;8:E2773. doi:10.1371 /journal.pntd.0002773
- Fischer M. Leprosy–an overview of clinical features, diagnosis, and treatment. J Dtsch Dermatol Ges. 2017;15:801-827. doi:10.1111/ddg.13301
- Jolly M, Pickard SA, Mikolaitis RA, et al. Lupus QoL-US benchmarks for US patients with systemic lupus erythematosus. J Rheumatol. 2010;37:1828-1833. doi:10.3899/jrheum.091443
- Chan MMF, Smoller BR. Overview of the histopathology and other laboratory investigations in leprosy. Curr Trop Med Rep. 2016;3:131-137. doi:10.1007/s40475-016-0086-y
- Piette EW, Rosenbach M. Granuloma annulare: clinical and histologic variants, epidemiology, and genetics. J Am Acad Dermatol. 2016; 75:457-465. doi:10.1016/j.jaad.2015.03.054
- Lukács J, Schliemann S, Elsner P. Treatment of generalized granuloma annulare–a systematic review. J Eur Acad Dermatol Venereol. 2015;29:1467-1480. doi:10.1111/jdv.12976
- Zinzani PL, Ferreri AJM, Cerroni L. Mycosis fungoides. Crit Rev Oncol Hematol. 2008;65:172-182. doi:10.1016/j.critrevonc.2007.08.004
- Ahn CS, ALSayyah A, Sangüeza OP. Mycosis fungoides: an updated review of clinicopathologic variants. Am J Dermatopathol. 2014;36:933- 951. doi:10.1097/DAD.0000000000000207
- Gutte R, Kharkar V, Mahajan S, et al. Granulomatous mycosis fungoides with hypohidrosis mimicking lepromatous leprosy. Indian J Dermatol Venereol Leprol. 2010;76:686. doi:10.4103/0378-6323.72470
- Kempf W, Ostheeren-Michaelis S, Paulli M, et al. Granulomatous mycosis fungoides and granulomatous slack skin: a multicenter study of the cutaneous lymphoma histopathology task force group of the European Organization for Research and Treatment of Cancer (EORTC). Arch Dermatol. 2008;144:1609-1617. doi:10.1001 /archdermatol.2008.46
- Miyashiro D, Cardona C, Valente N, et al. Ulcers in leprosy patients, an unrecognized clinical manifestation: a report of 8 cases. BMC Infect Dis. 2019;19:1013. doi:10.1186/s12879-019-4639-2
- Cerroni L. Mycosis fungoides-clinical and histopathologic features, differential diagnosis, and treatment. Semin Cutan Med Surg. 2018;37:2-10. doi:10.12788/j.sder.2018.002
- Jain R, Yadav D, Puranik N, et al. Sarcoidosis: causes, diagnosis, clinical features, and treatments. J Clin Med. 2020;9:1081. doi:10.3390 /jcm9041081
- Zÿ ychowska M, Reich A. Dermoscopic features of acute, subacute, chronic and intermittent subtypes of cutaneous lupus erythematosus in Caucasians. J Clin Med. 2022;11:4088. doi:10.3390/jcm11144088
- Lazar AL. Subacute cutaneous lupus erythematosus: a facultative paraneoplastic dermatosis. Clin Dermatol. 2022;40:728-742. doi:10.1016 /j.clindermatol.2022.07.007
- Bobosha K, Wilson L, van Meijgaarden KE, et al. T-cell regulation in lepromatous leprosy. PLoS Negl Trop Dis. 2014;8:E2773. doi:10.1371 /journal.pntd.0002773
- Fischer M. Leprosy–an overview of clinical features, diagnosis, and treatment. J Dtsch Dermatol Ges. 2017;15:801-827. doi:10.1111/ddg.13301
- Jolly M, Pickard SA, Mikolaitis RA, et al. Lupus QoL-US benchmarks for US patients with systemic lupus erythematosus. J Rheumatol. 2010;37:1828-1833. doi:10.3899/jrheum.091443
- Chan MMF, Smoller BR. Overview of the histopathology and other laboratory investigations in leprosy. Curr Trop Med Rep. 2016;3:131-137. doi:10.1007/s40475-016-0086-y
- Piette EW, Rosenbach M. Granuloma annulare: clinical and histologic variants, epidemiology, and genetics. J Am Acad Dermatol. 2016; 75:457-465. doi:10.1016/j.jaad.2015.03.054
- Lukács J, Schliemann S, Elsner P. Treatment of generalized granuloma annulare–a systematic review. J Eur Acad Dermatol Venereol. 2015;29:1467-1480. doi:10.1111/jdv.12976
- Zinzani PL, Ferreri AJM, Cerroni L. Mycosis fungoides. Crit Rev Oncol Hematol. 2008;65:172-182. doi:10.1016/j.critrevonc.2007.08.004
- Ahn CS, ALSayyah A, Sangüeza OP. Mycosis fungoides: an updated review of clinicopathologic variants. Am J Dermatopathol. 2014;36:933- 951. doi:10.1097/DAD.0000000000000207
- Gutte R, Kharkar V, Mahajan S, et al. Granulomatous mycosis fungoides with hypohidrosis mimicking lepromatous leprosy. Indian J Dermatol Venereol Leprol. 2010;76:686. doi:10.4103/0378-6323.72470
- Kempf W, Ostheeren-Michaelis S, Paulli M, et al. Granulomatous mycosis fungoides and granulomatous slack skin: a multicenter study of the cutaneous lymphoma histopathology task force group of the European Organization for Research and Treatment of Cancer (EORTC). Arch Dermatol. 2008;144:1609-1617. doi:10.1001 /archdermatol.2008.46
- Miyashiro D, Cardona C, Valente N, et al. Ulcers in leprosy patients, an unrecognized clinical manifestation: a report of 8 cases. BMC Infect Dis. 2019;19:1013. doi:10.1186/s12879-019-4639-2
- Cerroni L. Mycosis fungoides-clinical and histopathologic features, differential diagnosis, and treatment. Semin Cutan Med Surg. 2018;37:2-10. doi:10.12788/j.sder.2018.002
- Jain R, Yadav D, Puranik N, et al. Sarcoidosis: causes, diagnosis, clinical features, and treatments. J Clin Med. 2020;9:1081. doi:10.3390 /jcm9041081
- Zÿ ychowska M, Reich A. Dermoscopic features of acute, subacute, chronic and intermittent subtypes of cutaneous lupus erythematosus in Caucasians. J Clin Med. 2022;11:4088. doi:10.3390/jcm11144088
- Lazar AL. Subacute cutaneous lupus erythematosus: a facultative paraneoplastic dermatosis. Clin Dermatol. 2022;40:728-742. doi:10.1016 /j.clindermatol.2022.07.007
Smooth Symmetric Plaques on the Face, Trunk, and Extremities
Smooth Symmetric Plaques on the Face, Trunk, and Extremities
A 44-year-old woman presented to the dermatology clinic with a widespread red, itchy, bumpy rash of 1 year’s duration. Physical examination revealed smooth, coalescing, erythematous and edematous plaques on the face (notably the forehead, malar cheeks, and nose), back, arms, and legs. Several plaques on the back had central hypopigmentation. The patient also reported numbness and weakness in the fingers and toes, and hypoesthesia within the lesions was noted. A biopsy of one of the lesions on the left ventral forearm was performed.
Acute Generalized Exanthematous Pustulosis Secondary to Application of Tapinarof Cream 1%
Acute Generalized Exanthematous Pustulosis Secondary to Application of Tapinarof Cream 1%
To the Editor:
For many years, topical treatment of plaque psoriasis was limited to steroids, calcineurin inhibitors, vitamin D analogs, retinoids, coal tar products, and anthralin. In recent years, 2 new nonsteroidal treatment options with alternative mechanisms of action, roflumilast 0.3% and tapinarof 1%, have been approved by the US Food and Drug Administration.1 Roflumilast 0.3%, a topical phosphodiesterase 4 inhibitor, was shown in phase 3 clinical trials to reach an Investigator Global Assessment response of 37.5% to 42.2% in 8 weeks using once-daily application with minimal cutaneous adverse effects.1 Furthermore, it has demonstrated efficacy in treating psoriasis in intertriginous areas in subset analyses.1 Tapinarof is an aryl hydrocarbon receptor agonist that suppresses Th17 cell differentiation by downregulating IL-17, IL-22, and IL-23.1 In phase 3 clinical trials, 35% to 40% of patients who used tapinarof cream 1% once daily demonstrated improvement in psoriasis compared with 6% who used the vehicle alone.2 In these studies, 18% to 24% of patients who used tapinarof cream 1% experienced folliculitis.2
Acute generalized exanthematous pustulosis (AGEP) is a nonfollicular pustular drug reaction with systemic symptoms that typically occurs within 2 weeks of exposure to an inciting medication. Systemic antibiotics are the most commonly reported cause of AGEP.3 There are few reports in the literature of AGEP induced by topical agents.4,5 We report a case of AGEP in a young man following the use of tapinarof cream 1%.
A 23-year-old man with a history of psoriasis presented to the emergency department with fever and a pustular rash. One week prior to presentation, he developed a pustular eruption around plaques of psoriasis on the arms and legs. The patient had been prescribed tapinarof cream 1% by an outside dermatologist and was applying the medication to the affected areas once daily for 1 month prior to onset of symptoms. He discontinued tapinarof a few days prior to the eruption starting, but the rash progressed centrifugally and was associated with fevers and fatigue despite treatment with a brief course of empiric cephalexin prescribed by his primary care provider.
At presentation to our institution, the patient had widespread erythematous patches studded with pustules located on the arms, legs, and flexural areas as well as plaques of psoriasis involving approximately 20% of the body surface area (Figure 1). Furthermore, the patient was noted to have large noninflammatory bullae along the legs. The new eruption occurred on areas that were both treated and spared from the tapinarof cream 1%. Laboratory evaluation showed neutrophil-predominant leukocytosis (white blood cell count, 15.9×10³/µL [reference range, 4.0-11.0×10³/µL]; absolute neutrophil count, 10.3×10³/µL [reference range, 1.5-8.0×10³/µL]), absolute eosinophilia (1930/µL [reference range, 0-0.5×10³/µL]), hypocalcemia (8.4 mg/dL [reference range, 8.5-10.5 mg/dL]), and a mild transaminitis (aspartate aminotransferase, 37 IU/L [reference range, 10-40 IU/L]; alanine aminotransferase, 53 IU/L [reference range, 7-56 U/L]). Histopathology demonstrated spongiosis with subcorneal and intraepidermal pustules and mixed dermal inflammation containing eosinophils (Figure 2). Direct immunofluorescence revealed mild granular staining of C3 at the basement membrane zone.
The patient was started on 1 mg/kg/d of prednisone tapered over 20 days, and he rapidly improved. Alanine aminotransferase levels peaked at 120 IU/L 2 weeks later. At that time, he had complete resolution of the original eruption and was transitioned to topical steroids for continued management of the psoriasis (Figure 3).
The differential diagnosis for our patient included AGEP, generalized pustular psoriasis (GPP), miliaria pustulosa, generalized cutaneous candidiasis, exuberant allergic contact dermatitis (ACD), and linear IgA bullous dermatosis (LABD). Based on the clinical manifestations, laboratory results, and histopathologic evaluation, we made the diagnosis of AGEP secondary to tapinarof with systemic absorption. Acute generalized exanthematous pustulosis has been reported with topical use of morphine and diphenhydramine, among other agents.4,5 To our knowledge, AGEP due to tapinarof cream 1% has not been reported. In the original clinical trials of tapinarof, folliculitis was contained to sites of application.2 Our patient developed pustules at sites distant to areas of application, as well as systemic symptoms and laboratory abnormalities, indicating a systemic reaction. It can be difficult to distinguish AGEP clinically and histologically from GPP. Both conditions can manifest with fever, hypocalcemia, and sterile pustules on a background of erythema that favors intertriginous areas.6 Infection, rapid oral steroid withdrawal, pregnancy, and rarely oral medications have been reported causes of GPP.6 Our patient did not have any of these exposures. There is overlap in the histology of AGEP and GPP. One retrospective series compared histologic samples to help distinguish these 2 entities. Reliable markers that favored AGEP over GPP included eosinophilic spongiosis, interface dermatitis, and dermal eosinophilia (>2/mm2).7 In contrast, the presence of CD161 positivity in the dermis with at least 10 cells favored a diagnosis of GPP.7 In our case, the presence of spongiosis with eosinophils in the dermis favored a diagnosis of AGEP over GPP.
Miliaria pustulosa is a benign condition caused by the occlusion of the epidermal portion of eccrine glands related to either high fever or hot and humid environmental conditions. While it can be present in intertriginous areas like AGEP, miliaria pustulosa can be seen extensively on the back, most commonly in immobile hospitalized patients.8 Generalized cutaneous candidiasis usually is caused by the yeast Candida albicans and can take on multiple morphologies, including folliculitis.9 The eruption may be disseminated but often is accentuated in intertriginous areas and the anogenital folds. Predisposing factors include immunosuppression, endocrinopathies, recent use of systemic antibiotics or steroids, chemotherapy, and indwelling catheters.9 Outside of recent antibiotic use, our patient did not have any risk factors for miliaria pustulosa, making this diagnosis unlikely.
Given the presence of overlapping bullae along the lower extremities, an exuberant ACD and LABD were considered. Bullae formation can occur in ACD secondary to robust inflammation and edema leading to acantholysis.10 While a delayed hypersensitivity reaction to topical tapinarof cream 1% was considered given that the patient used the medication for approximately 1 month prior to the onset of symptoms, it would be unlikely for ACD to present with a concomitant pustular eruption. Linear IgA bullous dermatosis is an autoimmune blistering disease in which antibodies target bullous pemphigoid antigen 2, and there is characteristically linear deposition of IgA at the dermal-epidermal junction that leads to subepidermal blistering.11 This often manifests clinically as widespread tense vesicles in an annular or string-of-pearls appearance. However, morphologies can vary, and large bullae may be seen. In adults, LABD typically is associated with inflammatory bowel disease, malignancy, or medications, notably vancomycin.11,12 Our patient did not have any of these predisposing factors, and his biopsy for direct immunofluorescence did not reveal the classic pattern described above.
Interestingly, there have been reports in the literature of bullous AGEP in the setting of oral anti-infectives. One report described a 62-year-old woman who developed widespread nonfollicular pustules with multiple tense serous blisters 24 hours after taking oral terbinafine.13 Another case described an 80-year-old woman with a similar presentation following a course of ciprofloxacin (although the timeline of medication administration was not described).14 In this case, patch testing to the culprit medication reproduced the response.14 In both cases, a biopsy revealed subcorneal and intraepidermal pustules with marked dermal edema.13,14 As previously described, spongiosis is a common feature of AGEP. We hypothesize that, similar to these reports, our patient had a robust inflammatory response leading to spongiosis, acantholysis, and blister formation secondary to AGEP.
Dermatologists should be aware of this case of AGEP secondary to tapinarof cream 1%, as reports in the literature are rare and it is a reminder that topical medications can cause serious systemic reactions.
- Lebwohl MG, Kircik LH, Moore AY, et al. Effect of roflumilast cream vs vehicle cream on chronic plaque psoriasis: the DERMIS-1 and DERMIS-2 randomized clinical trials. JAMA. 2022;328:1073-1084. doi:10.1001/jama.2022.15632
- Lebwohl MG, Stein Gold L, Strober B, et al. Phase 3 trials of tapinarof cream for plaque psoriasis. N Engl J Med. 2021;385:2219-2229. doi:10.1056/NEJMoa2103629
- Szatkowski J, Schwartz RA. Acute generalized exanthematous pustulosis (AGEP): a review and update. J Am Acad Dermatol. 2015;73:843-848. doi:10.1016/j.jaad.2015.07.017
- Ghazawi FM, Colantonio S, Bradshaw S, et al. Acute generalized exanthematous pustulosis induced by topical morphine and confirmed by patch testing. Dermat Contact Atopic Occup Drug. 2020;31:E22-E23. doi:10.1097/DER.0000000000000573
- Hanafusa T, Igawa K, Azukizawa H, et al. Acute generalized exanthematous pustulosis induced by topical diphenhydramine. Eur J Dermatol. 2011;21:994-995. doi:10.1684/ejd.2011.1500
- Reynolds KA, Pithadia DJ, Lee EB, et al. Generalized pustular psoriasis: a review of the pathophysiology, clinical manifestations,diagnosis, and treatment. Cutis. 2022;110:19-25. doi:10.12788/cutis.0579
- Isom J, Braswell DS, Siroy A, et al. Clinical and histopathologic features differentiating acute generalized exanthematous pustulosis and pustular psoriasis: a retrospective series. J Am Acad Dermatol. 2020;83:265-267. doi:10.1016/j.jaad.2020.03.015
- Fealey RD, Hebert AA. Disorders of the eccrine sweat glands and sweating. In: Goldsmith LA, Katz SI, Gilchrest BA, et al, eds. Fitzpatrick’s Dermatology in General Medicine.8th ed. McGraw-Hill; 2012:946.
- Elewski BE, Hughey LC, Marchiony Hunt K, et al. Fungal diseases. In: Bolognia JL, Schaffer JV, Cerroni L, eds. Dermatology. 4th ed. Elsevier; 2017:1329-1363.
- Elmas ÖF, Akdeniz N, Atasoy M, et al. Contact dermatitis: a great imitator. Clin Dermatol. 2020;38:176-192. doi:10.1016/j.clindermatol.2019.10.003
- Hull CM, Zone JZ. Dermatitis herpetiforms and linear IgA bullous dermatosis. In: Bolognia JL, Schaffer JV, Cerroni L, eds. Dermatology. 4th ed. Elsevier; 2017:527-537.
- Yamagami J, Nakamura Y, Nagao K, et al. Vancomycin mediates IgA autoreactivity in drug-induced linear IgA bullous dermatosis. J Invest Dermatol. 2018;138:1473-1480.
- Bullous acute generalized exanthematous pustulosis due to oral terbinafine. J Am Acad Dermatol. 2005;52:P115. doi:10.1016/j.jaad.2004.10.468
- Hausermann P, Scherer K, Weber M, et al. Ciprofloxacin-induced acute generalized exanthematous pustulosis mimicking bullous drug eruption confirmed by a positive patch test. Dermatology. 2005;211:277-280. doi:10.1159/000087024
To the Editor:
For many years, topical treatment of plaque psoriasis was limited to steroids, calcineurin inhibitors, vitamin D analogs, retinoids, coal tar products, and anthralin. In recent years, 2 new nonsteroidal treatment options with alternative mechanisms of action, roflumilast 0.3% and tapinarof 1%, have been approved by the US Food and Drug Administration.1 Roflumilast 0.3%, a topical phosphodiesterase 4 inhibitor, was shown in phase 3 clinical trials to reach an Investigator Global Assessment response of 37.5% to 42.2% in 8 weeks using once-daily application with minimal cutaneous adverse effects.1 Furthermore, it has demonstrated efficacy in treating psoriasis in intertriginous areas in subset analyses.1 Tapinarof is an aryl hydrocarbon receptor agonist that suppresses Th17 cell differentiation by downregulating IL-17, IL-22, and IL-23.1 In phase 3 clinical trials, 35% to 40% of patients who used tapinarof cream 1% once daily demonstrated improvement in psoriasis compared with 6% who used the vehicle alone.2 In these studies, 18% to 24% of patients who used tapinarof cream 1% experienced folliculitis.2
Acute generalized exanthematous pustulosis (AGEP) is a nonfollicular pustular drug reaction with systemic symptoms that typically occurs within 2 weeks of exposure to an inciting medication. Systemic antibiotics are the most commonly reported cause of AGEP.3 There are few reports in the literature of AGEP induced by topical agents.4,5 We report a case of AGEP in a young man following the use of tapinarof cream 1%.
A 23-year-old man with a history of psoriasis presented to the emergency department with fever and a pustular rash. One week prior to presentation, he developed a pustular eruption around plaques of psoriasis on the arms and legs. The patient had been prescribed tapinarof cream 1% by an outside dermatologist and was applying the medication to the affected areas once daily for 1 month prior to onset of symptoms. He discontinued tapinarof a few days prior to the eruption starting, but the rash progressed centrifugally and was associated with fevers and fatigue despite treatment with a brief course of empiric cephalexin prescribed by his primary care provider.
At presentation to our institution, the patient had widespread erythematous patches studded with pustules located on the arms, legs, and flexural areas as well as plaques of psoriasis involving approximately 20% of the body surface area (Figure 1). Furthermore, the patient was noted to have large noninflammatory bullae along the legs. The new eruption occurred on areas that were both treated and spared from the tapinarof cream 1%. Laboratory evaluation showed neutrophil-predominant leukocytosis (white blood cell count, 15.9×10³/µL [reference range, 4.0-11.0×10³/µL]; absolute neutrophil count, 10.3×10³/µL [reference range, 1.5-8.0×10³/µL]), absolute eosinophilia (1930/µL [reference range, 0-0.5×10³/µL]), hypocalcemia (8.4 mg/dL [reference range, 8.5-10.5 mg/dL]), and a mild transaminitis (aspartate aminotransferase, 37 IU/L [reference range, 10-40 IU/L]; alanine aminotransferase, 53 IU/L [reference range, 7-56 U/L]). Histopathology demonstrated spongiosis with subcorneal and intraepidermal pustules and mixed dermal inflammation containing eosinophils (Figure 2). Direct immunofluorescence revealed mild granular staining of C3 at the basement membrane zone.
The patient was started on 1 mg/kg/d of prednisone tapered over 20 days, and he rapidly improved. Alanine aminotransferase levels peaked at 120 IU/L 2 weeks later. At that time, he had complete resolution of the original eruption and was transitioned to topical steroids for continued management of the psoriasis (Figure 3).
The differential diagnosis for our patient included AGEP, generalized pustular psoriasis (GPP), miliaria pustulosa, generalized cutaneous candidiasis, exuberant allergic contact dermatitis (ACD), and linear IgA bullous dermatosis (LABD). Based on the clinical manifestations, laboratory results, and histopathologic evaluation, we made the diagnosis of AGEP secondary to tapinarof with systemic absorption. Acute generalized exanthematous pustulosis has been reported with topical use of morphine and diphenhydramine, among other agents.4,5 To our knowledge, AGEP due to tapinarof cream 1% has not been reported. In the original clinical trials of tapinarof, folliculitis was contained to sites of application.2 Our patient developed pustules at sites distant to areas of application, as well as systemic symptoms and laboratory abnormalities, indicating a systemic reaction. It can be difficult to distinguish AGEP clinically and histologically from GPP. Both conditions can manifest with fever, hypocalcemia, and sterile pustules on a background of erythema that favors intertriginous areas.6 Infection, rapid oral steroid withdrawal, pregnancy, and rarely oral medications have been reported causes of GPP.6 Our patient did not have any of these exposures. There is overlap in the histology of AGEP and GPP. One retrospective series compared histologic samples to help distinguish these 2 entities. Reliable markers that favored AGEP over GPP included eosinophilic spongiosis, interface dermatitis, and dermal eosinophilia (>2/mm2).7 In contrast, the presence of CD161 positivity in the dermis with at least 10 cells favored a diagnosis of GPP.7 In our case, the presence of spongiosis with eosinophils in the dermis favored a diagnosis of AGEP over GPP.
Miliaria pustulosa is a benign condition caused by the occlusion of the epidermal portion of eccrine glands related to either high fever or hot and humid environmental conditions. While it can be present in intertriginous areas like AGEP, miliaria pustulosa can be seen extensively on the back, most commonly in immobile hospitalized patients.8 Generalized cutaneous candidiasis usually is caused by the yeast Candida albicans and can take on multiple morphologies, including folliculitis.9 The eruption may be disseminated but often is accentuated in intertriginous areas and the anogenital folds. Predisposing factors include immunosuppression, endocrinopathies, recent use of systemic antibiotics or steroids, chemotherapy, and indwelling catheters.9 Outside of recent antibiotic use, our patient did not have any risk factors for miliaria pustulosa, making this diagnosis unlikely.
Given the presence of overlapping bullae along the lower extremities, an exuberant ACD and LABD were considered. Bullae formation can occur in ACD secondary to robust inflammation and edema leading to acantholysis.10 While a delayed hypersensitivity reaction to topical tapinarof cream 1% was considered given that the patient used the medication for approximately 1 month prior to the onset of symptoms, it would be unlikely for ACD to present with a concomitant pustular eruption. Linear IgA bullous dermatosis is an autoimmune blistering disease in which antibodies target bullous pemphigoid antigen 2, and there is characteristically linear deposition of IgA at the dermal-epidermal junction that leads to subepidermal blistering.11 This often manifests clinically as widespread tense vesicles in an annular or string-of-pearls appearance. However, morphologies can vary, and large bullae may be seen. In adults, LABD typically is associated with inflammatory bowel disease, malignancy, or medications, notably vancomycin.11,12 Our patient did not have any of these predisposing factors, and his biopsy for direct immunofluorescence did not reveal the classic pattern described above.
Interestingly, there have been reports in the literature of bullous AGEP in the setting of oral anti-infectives. One report described a 62-year-old woman who developed widespread nonfollicular pustules with multiple tense serous blisters 24 hours after taking oral terbinafine.13 Another case described an 80-year-old woman with a similar presentation following a course of ciprofloxacin (although the timeline of medication administration was not described).14 In this case, patch testing to the culprit medication reproduced the response.14 In both cases, a biopsy revealed subcorneal and intraepidermal pustules with marked dermal edema.13,14 As previously described, spongiosis is a common feature of AGEP. We hypothesize that, similar to these reports, our patient had a robust inflammatory response leading to spongiosis, acantholysis, and blister formation secondary to AGEP.
Dermatologists should be aware of this case of AGEP secondary to tapinarof cream 1%, as reports in the literature are rare and it is a reminder that topical medications can cause serious systemic reactions.
To the Editor:
For many years, topical treatment of plaque psoriasis was limited to steroids, calcineurin inhibitors, vitamin D analogs, retinoids, coal tar products, and anthralin. In recent years, 2 new nonsteroidal treatment options with alternative mechanisms of action, roflumilast 0.3% and tapinarof 1%, have been approved by the US Food and Drug Administration.1 Roflumilast 0.3%, a topical phosphodiesterase 4 inhibitor, was shown in phase 3 clinical trials to reach an Investigator Global Assessment response of 37.5% to 42.2% in 8 weeks using once-daily application with minimal cutaneous adverse effects.1 Furthermore, it has demonstrated efficacy in treating psoriasis in intertriginous areas in subset analyses.1 Tapinarof is an aryl hydrocarbon receptor agonist that suppresses Th17 cell differentiation by downregulating IL-17, IL-22, and IL-23.1 In phase 3 clinical trials, 35% to 40% of patients who used tapinarof cream 1% once daily demonstrated improvement in psoriasis compared with 6% who used the vehicle alone.2 In these studies, 18% to 24% of patients who used tapinarof cream 1% experienced folliculitis.2
Acute generalized exanthematous pustulosis (AGEP) is a nonfollicular pustular drug reaction with systemic symptoms that typically occurs within 2 weeks of exposure to an inciting medication. Systemic antibiotics are the most commonly reported cause of AGEP.3 There are few reports in the literature of AGEP induced by topical agents.4,5 We report a case of AGEP in a young man following the use of tapinarof cream 1%.
A 23-year-old man with a history of psoriasis presented to the emergency department with fever and a pustular rash. One week prior to presentation, he developed a pustular eruption around plaques of psoriasis on the arms and legs. The patient had been prescribed tapinarof cream 1% by an outside dermatologist and was applying the medication to the affected areas once daily for 1 month prior to onset of symptoms. He discontinued tapinarof a few days prior to the eruption starting, but the rash progressed centrifugally and was associated with fevers and fatigue despite treatment with a brief course of empiric cephalexin prescribed by his primary care provider.
At presentation to our institution, the patient had widespread erythematous patches studded with pustules located on the arms, legs, and flexural areas as well as plaques of psoriasis involving approximately 20% of the body surface area (Figure 1). Furthermore, the patient was noted to have large noninflammatory bullae along the legs. The new eruption occurred on areas that were both treated and spared from the tapinarof cream 1%. Laboratory evaluation showed neutrophil-predominant leukocytosis (white blood cell count, 15.9×10³/µL [reference range, 4.0-11.0×10³/µL]; absolute neutrophil count, 10.3×10³/µL [reference range, 1.5-8.0×10³/µL]), absolute eosinophilia (1930/µL [reference range, 0-0.5×10³/µL]), hypocalcemia (8.4 mg/dL [reference range, 8.5-10.5 mg/dL]), and a mild transaminitis (aspartate aminotransferase, 37 IU/L [reference range, 10-40 IU/L]; alanine aminotransferase, 53 IU/L [reference range, 7-56 U/L]). Histopathology demonstrated spongiosis with subcorneal and intraepidermal pustules and mixed dermal inflammation containing eosinophils (Figure 2). Direct immunofluorescence revealed mild granular staining of C3 at the basement membrane zone.
The patient was started on 1 mg/kg/d of prednisone tapered over 20 days, and he rapidly improved. Alanine aminotransferase levels peaked at 120 IU/L 2 weeks later. At that time, he had complete resolution of the original eruption and was transitioned to topical steroids for continued management of the psoriasis (Figure 3).
The differential diagnosis for our patient included AGEP, generalized pustular psoriasis (GPP), miliaria pustulosa, generalized cutaneous candidiasis, exuberant allergic contact dermatitis (ACD), and linear IgA bullous dermatosis (LABD). Based on the clinical manifestations, laboratory results, and histopathologic evaluation, we made the diagnosis of AGEP secondary to tapinarof with systemic absorption. Acute generalized exanthematous pustulosis has been reported with topical use of morphine and diphenhydramine, among other agents.4,5 To our knowledge, AGEP due to tapinarof cream 1% has not been reported. In the original clinical trials of tapinarof, folliculitis was contained to sites of application.2 Our patient developed pustules at sites distant to areas of application, as well as systemic symptoms and laboratory abnormalities, indicating a systemic reaction. It can be difficult to distinguish AGEP clinically and histologically from GPP. Both conditions can manifest with fever, hypocalcemia, and sterile pustules on a background of erythema that favors intertriginous areas.6 Infection, rapid oral steroid withdrawal, pregnancy, and rarely oral medications have been reported causes of GPP.6 Our patient did not have any of these exposures. There is overlap in the histology of AGEP and GPP. One retrospective series compared histologic samples to help distinguish these 2 entities. Reliable markers that favored AGEP over GPP included eosinophilic spongiosis, interface dermatitis, and dermal eosinophilia (>2/mm2).7 In contrast, the presence of CD161 positivity in the dermis with at least 10 cells favored a diagnosis of GPP.7 In our case, the presence of spongiosis with eosinophils in the dermis favored a diagnosis of AGEP over GPP.
Miliaria pustulosa is a benign condition caused by the occlusion of the epidermal portion of eccrine glands related to either high fever or hot and humid environmental conditions. While it can be present in intertriginous areas like AGEP, miliaria pustulosa can be seen extensively on the back, most commonly in immobile hospitalized patients.8 Generalized cutaneous candidiasis usually is caused by the yeast Candida albicans and can take on multiple morphologies, including folliculitis.9 The eruption may be disseminated but often is accentuated in intertriginous areas and the anogenital folds. Predisposing factors include immunosuppression, endocrinopathies, recent use of systemic antibiotics or steroids, chemotherapy, and indwelling catheters.9 Outside of recent antibiotic use, our patient did not have any risk factors for miliaria pustulosa, making this diagnosis unlikely.
Given the presence of overlapping bullae along the lower extremities, an exuberant ACD and LABD were considered. Bullae formation can occur in ACD secondary to robust inflammation and edema leading to acantholysis.10 While a delayed hypersensitivity reaction to topical tapinarof cream 1% was considered given that the patient used the medication for approximately 1 month prior to the onset of symptoms, it would be unlikely for ACD to present with a concomitant pustular eruption. Linear IgA bullous dermatosis is an autoimmune blistering disease in which antibodies target bullous pemphigoid antigen 2, and there is characteristically linear deposition of IgA at the dermal-epidermal junction that leads to subepidermal blistering.11 This often manifests clinically as widespread tense vesicles in an annular or string-of-pearls appearance. However, morphologies can vary, and large bullae may be seen. In adults, LABD typically is associated with inflammatory bowel disease, malignancy, or medications, notably vancomycin.11,12 Our patient did not have any of these predisposing factors, and his biopsy for direct immunofluorescence did not reveal the classic pattern described above.
Interestingly, there have been reports in the literature of bullous AGEP in the setting of oral anti-infectives. One report described a 62-year-old woman who developed widespread nonfollicular pustules with multiple tense serous blisters 24 hours after taking oral terbinafine.13 Another case described an 80-year-old woman with a similar presentation following a course of ciprofloxacin (although the timeline of medication administration was not described).14 In this case, patch testing to the culprit medication reproduced the response.14 In both cases, a biopsy revealed subcorneal and intraepidermal pustules with marked dermal edema.13,14 As previously described, spongiosis is a common feature of AGEP. We hypothesize that, similar to these reports, our patient had a robust inflammatory response leading to spongiosis, acantholysis, and blister formation secondary to AGEP.
Dermatologists should be aware of this case of AGEP secondary to tapinarof cream 1%, as reports in the literature are rare and it is a reminder that topical medications can cause serious systemic reactions.
- Lebwohl MG, Kircik LH, Moore AY, et al. Effect of roflumilast cream vs vehicle cream on chronic plaque psoriasis: the DERMIS-1 and DERMIS-2 randomized clinical trials. JAMA. 2022;328:1073-1084. doi:10.1001/jama.2022.15632
- Lebwohl MG, Stein Gold L, Strober B, et al. Phase 3 trials of tapinarof cream for plaque psoriasis. N Engl J Med. 2021;385:2219-2229. doi:10.1056/NEJMoa2103629
- Szatkowski J, Schwartz RA. Acute generalized exanthematous pustulosis (AGEP): a review and update. J Am Acad Dermatol. 2015;73:843-848. doi:10.1016/j.jaad.2015.07.017
- Ghazawi FM, Colantonio S, Bradshaw S, et al. Acute generalized exanthematous pustulosis induced by topical morphine and confirmed by patch testing. Dermat Contact Atopic Occup Drug. 2020;31:E22-E23. doi:10.1097/DER.0000000000000573
- Hanafusa T, Igawa K, Azukizawa H, et al. Acute generalized exanthematous pustulosis induced by topical diphenhydramine. Eur J Dermatol. 2011;21:994-995. doi:10.1684/ejd.2011.1500
- Reynolds KA, Pithadia DJ, Lee EB, et al. Generalized pustular psoriasis: a review of the pathophysiology, clinical manifestations,diagnosis, and treatment. Cutis. 2022;110:19-25. doi:10.12788/cutis.0579
- Isom J, Braswell DS, Siroy A, et al. Clinical and histopathologic features differentiating acute generalized exanthematous pustulosis and pustular psoriasis: a retrospective series. J Am Acad Dermatol. 2020;83:265-267. doi:10.1016/j.jaad.2020.03.015
- Fealey RD, Hebert AA. Disorders of the eccrine sweat glands and sweating. In: Goldsmith LA, Katz SI, Gilchrest BA, et al, eds. Fitzpatrick’s Dermatology in General Medicine.8th ed. McGraw-Hill; 2012:946.
- Elewski BE, Hughey LC, Marchiony Hunt K, et al. Fungal diseases. In: Bolognia JL, Schaffer JV, Cerroni L, eds. Dermatology. 4th ed. Elsevier; 2017:1329-1363.
- Elmas ÖF, Akdeniz N, Atasoy M, et al. Contact dermatitis: a great imitator. Clin Dermatol. 2020;38:176-192. doi:10.1016/j.clindermatol.2019.10.003
- Hull CM, Zone JZ. Dermatitis herpetiforms and linear IgA bullous dermatosis. In: Bolognia JL, Schaffer JV, Cerroni L, eds. Dermatology. 4th ed. Elsevier; 2017:527-537.
- Yamagami J, Nakamura Y, Nagao K, et al. Vancomycin mediates IgA autoreactivity in drug-induced linear IgA bullous dermatosis. J Invest Dermatol. 2018;138:1473-1480.
- Bullous acute generalized exanthematous pustulosis due to oral terbinafine. J Am Acad Dermatol. 2005;52:P115. doi:10.1016/j.jaad.2004.10.468
- Hausermann P, Scherer K, Weber M, et al. Ciprofloxacin-induced acute generalized exanthematous pustulosis mimicking bullous drug eruption confirmed by a positive patch test. Dermatology. 2005;211:277-280. doi:10.1159/000087024
- Lebwohl MG, Kircik LH, Moore AY, et al. Effect of roflumilast cream vs vehicle cream on chronic plaque psoriasis: the DERMIS-1 and DERMIS-2 randomized clinical trials. JAMA. 2022;328:1073-1084. doi:10.1001/jama.2022.15632
- Lebwohl MG, Stein Gold L, Strober B, et al. Phase 3 trials of tapinarof cream for plaque psoriasis. N Engl J Med. 2021;385:2219-2229. doi:10.1056/NEJMoa2103629
- Szatkowski J, Schwartz RA. Acute generalized exanthematous pustulosis (AGEP): a review and update. J Am Acad Dermatol. 2015;73:843-848. doi:10.1016/j.jaad.2015.07.017
- Ghazawi FM, Colantonio S, Bradshaw S, et al. Acute generalized exanthematous pustulosis induced by topical morphine and confirmed by patch testing. Dermat Contact Atopic Occup Drug. 2020;31:E22-E23. doi:10.1097/DER.0000000000000573
- Hanafusa T, Igawa K, Azukizawa H, et al. Acute generalized exanthematous pustulosis induced by topical diphenhydramine. Eur J Dermatol. 2011;21:994-995. doi:10.1684/ejd.2011.1500
- Reynolds KA, Pithadia DJ, Lee EB, et al. Generalized pustular psoriasis: a review of the pathophysiology, clinical manifestations,diagnosis, and treatment. Cutis. 2022;110:19-25. doi:10.12788/cutis.0579
- Isom J, Braswell DS, Siroy A, et al. Clinical and histopathologic features differentiating acute generalized exanthematous pustulosis and pustular psoriasis: a retrospective series. J Am Acad Dermatol. 2020;83:265-267. doi:10.1016/j.jaad.2020.03.015
- Fealey RD, Hebert AA. Disorders of the eccrine sweat glands and sweating. In: Goldsmith LA, Katz SI, Gilchrest BA, et al, eds. Fitzpatrick’s Dermatology in General Medicine.8th ed. McGraw-Hill; 2012:946.
- Elewski BE, Hughey LC, Marchiony Hunt K, et al. Fungal diseases. In: Bolognia JL, Schaffer JV, Cerroni L, eds. Dermatology. 4th ed. Elsevier; 2017:1329-1363.
- Elmas ÖF, Akdeniz N, Atasoy M, et al. Contact dermatitis: a great imitator. Clin Dermatol. 2020;38:176-192. doi:10.1016/j.clindermatol.2019.10.003
- Hull CM, Zone JZ. Dermatitis herpetiforms and linear IgA bullous dermatosis. In: Bolognia JL, Schaffer JV, Cerroni L, eds. Dermatology. 4th ed. Elsevier; 2017:527-537.
- Yamagami J, Nakamura Y, Nagao K, et al. Vancomycin mediates IgA autoreactivity in drug-induced linear IgA bullous dermatosis. J Invest Dermatol. 2018;138:1473-1480.
- Bullous acute generalized exanthematous pustulosis due to oral terbinafine. J Am Acad Dermatol. 2005;52:P115. doi:10.1016/j.jaad.2004.10.468
- Hausermann P, Scherer K, Weber M, et al. Ciprofloxacin-induced acute generalized exanthematous pustulosis mimicking bullous drug eruption confirmed by a positive patch test. Dermatology. 2005;211:277-280. doi:10.1159/000087024
Acute Generalized Exanthematous Pustulosis Secondary to Application of Tapinarof Cream 1%
Acute Generalized Exanthematous Pustulosis Secondary to Application of Tapinarof Cream 1%
PRACTICE POINTS
- Tapinarof cream 1% can be absorbed systemically and cause acute generalized exanthematous pustulosis (AGEP).
- Clinical configuration and histology can be useful to distinguish AGEP from mimickers.
- Topical application of drugs in general, particularly over large body surface areas, may lead to systemic drug eruptions.

Longitudinal Erythronychia Manifesting With Pain and Cold Sensitivity
The Diagnosis: Glomangiomyoma
The nail unit excision specimen showed collections of cuboidal cells and spindled cells within the corium that were consistent with a diagnosis of a glomangiomyoma, a rare glomus tumor variant (Figure). Glomus tumors are benign neoplasms comprising glomus bodies, which are arteriovenous anastomoses involved in thermoregulation.1 They develop in areas densely populated by glomus bodies, including the fingers, toes, and subungual areas. Glomus tumors most commonly develop in middle-aged women.2 Clinically, they manifest with a characteristic triad of intense pain, point tenderness, and cold sensitivity and may appear as reddish-pink or blue macules under the nail plate and/or longitudinal erythronychia.2-6 The presence of multiple glomus tumors is associated with neurofibromatosis type 1.7
Advanced imaging including ultrasonography and magnetic resonance imaging (MRI) may help confirm the diagnosis but may not be cost effective, as excision with histopathology is needed to relieve symptoms and render a definitive diagnosis. Radiography is highly insensitive in identifying bone erosions associated with glomus tumors.8 With ultrasonography, glomus tumors appear hypoechoic; with Doppler ultrasonography, they appear hypervascular. With MRI, glomus tumors appear as well-defined nodular lesions with hypointense signal intensity on T1-weighted sequence and hyperintense signal intensity on T2-weighted sequence, with strong enhancement using gadolinium-based contrast.9,10 On histopathology, a glomus tumor appears as a nodular tumor with sheets of oval-nucleated cells arranged in multicellular layers surrounding blood vessels and are immunoreactive for α-smooth muscle actin, muscle-specific actin, and type IV collagen.11,12
There are several glomus tumor variants. The most common is a solid glomus tumor, which predominantly is composed of glomus cells, followed by glomangioma, which mainly is composed of blood vessels. Glomangiomyoma, which mostly is composed of smooth muscle cells, is the rarest variant.13
While glomus tumors are common in the subungual areas, it is an uncommon location for glomangiomyomas, which have been reported in the nail unit in only 7 prior case reports identified through searches of PubMed and Google Scholar using the terms glomangiomyoma, glomangiomyoma nail, and subungual glomangiomyoma (Table).13-19 Glomangiomyomas more commonly are described in solid organs, including the stomach, kidney, pancreas, and bladder.16 The mean age of patients with subungual glomangiomyomas, including our patient, was 40.4 years (range, 3-61 years), with the majority being female (75.0% [6/8]). Most patients presented with fingernail involvement (75.0% [6/8]), nail dystrophy (eg, nail plate thinning, longitudinal grooves, splinter hemorrhages, longitudinal erythronychia)(62.5% [5/8]), and intermittent pain and/or point tenderness in the affected nail (75.0% [6/8]).13-19 Notably, only our patient had longitudinal erythronychia as a clinical feature, and only one other case described MRI findings, which included a lobulated mass with intense contrast and distal phalanx destruction.18 One patient was a 3-year-old girl with a family history of generalized multiple glomangiomyomas. Although subungual glomangiomyoma was not confirmed on histopathology, the diagnosis in this patient was presumed based on her family history.13 On histopathology, glomangiomyomas are composed of oval-nucleated cells surrounding blood vessels. These oval-nucleated cells then gradually transition to smooth muscle cells.20
A myxoid cyst is composed of a pseudocyst, which lacks a cyst lining, and is a result of synovial fluid from the distal interphalangeal joint entering the pseudocyst space.2 It typically manifests with a longitudinal groove in the nail plate. A flesh-colored nodule may be appreciated between the cuticle and the distal interphalangeal joint.2 The depth of the longitudinal groove may vary depending on the volume of synovial fluid within the myxoid cyst.21 In a series of 35 cases of subungual myxoid cysts, none manifested with longitudinal erythronychia. Due to their composition, myxoid cysts can be distinguished easily from solid tumors of the nail unit via transillumination.22 Pain is a much less common with myxoid cysts vs glomus tumors, as the filling of the pseudocyst space with synovial fluid typically is gradual, allowing the surrounding tissue to accommodate and adapt over time.21 In equivocal cases, MRI or high-resolution ultrasonography may be used to distinguish myxoid cysts and glomus tumors.8 Histopathology shows accumulation of mucin in the dermis with surrounding fibrous stroma.23
Subungual neuromas are painful benign tumors that develop due to disorganized neural proliferation following disruption to peripheral nerves secondary to trauma or surgery. In 3 case reports, subungual neuromas manifested as painful subungual nodules, with proximal nail plate ridging, or onycholysis.24-26 Since neuromas have only rarely been described in the subungual region, reports of MRI and ultrasonography findings are unknown. Histopathology is needed to distinguish neuromas from glomus tumors. Histopathology shows an acapsular structure consisting of disorganized spindle-cell proliferation and nerve fibers arranged in a tangle of fascicles within fibrotic tissue.25 On immunochemistry, spindle cells typically are positive for cellular antigen protein S100.26
Leiomyomas are benign neoplasms derived from smooth muscle, typically localized to the uterus or gastrointestinal tract, and have been described rarely in the nail unit.27,28 It is hypothesized that subungual leiomyomas originate from the vascular smooth muscle in the subcutaneous layer of the nail unit.28 Like glomus tumors, leiomyomas of the subungual region often manifest with pain and longitudinal erythronychia.27-30 Subungual leiomyomas may be distinguished from glomus tumors via advanced imaging techniques, including ultrasonography and MRI. Cutaneous leiomyomas have been described with mild to moderate internal low flow vascularity on Doppler ultrasonography, while glomus tumors typically reveal high internal vascularity.28 Biopsy with histopathology is needed for definitive diagnosis. On histopathology, leiomyomas demonstrate bland-appearing spindle-shaped cells with elongated nuclei arranged in fascicles.27 They typically are positive for α-smooth muscle actin and caldesmon on immunostaining.
Eccrine spiradenomas are benign adnexal tumors likely of apocrine origin with limited case reports in the literature.31,32 Clinically, eccrine spiradenomas involving the nail unit may manifest with longitudinal nail splitting of the nail or as a papule on the proximal nail fold, with associated tenderness.31,32 In a report of a 50-year-old woman with a histopathologically confirmed eccrine spiradenoma manifesting with longitudinal splitting of the nail and pain in the proximal nail fold, the mass appeared hypoechoic on ultrasonography with increased intramass vascularity on Doppler, while MRI showed an intensely enhancing lesion.31 These imaging features, combined with a classically manifesting feature of pain, make eccrine spiradenomas difficult to distinguish from glomus tumors; therefore, histopathologic examination can provide a definitive diagnosis, and surgical excision is used for treatment.31 On histopathology, these tumors are well circumscribed and composed of both small dark basaloid cells with peripheral compact nuclei and larger cells with central pale nuclei, which may be arranged in tubules.31,32
- Gombos Z, Zhang PJ. Glomus tumor. Arch Pathol Lab Med. 2008;132: 1448-1452. doi:10.5858/2008-132-1448-gt
- Hare AQ, Rich P. Nail tumors. Dermatol Clin. 2021;39:281-292. doi:10.1016/j.det.2020.12.007
- Hazani R, Houle JM, Kasdan ML, et al. Glomus tumors of the hand. Eplasty. 2008;8:E48.
- Hwang JK, Lipner SR. Blue nail discoloration: literature review and diagnostic algorithms. Am J Clin Dermatol. 2023;24:419-441. doi:10.1007/s40257-023-00768-6
- Lipner SR, Scher RK. Longitudinal erythronychia of the fingernail. JAMA Dermatol. 2016;152:1271-1272. doi:10.1001/jamadermatol.2016.2747
- Jellinek NJ, Lipner SR. Longitudinal erythronychia: retrospective single-center study evaluating differential diagnosis and the likelihood of malignancy. Dermatol Surg. 2016;42:310-319. doi:10.1097 /DSS.0000000000000594
- Lipner SR, Scher RK. Subungual glomus tumors: underrecognized clinical findings in neurofibromatosis 1. J Am Acad Dermatol. 2021;84:E269. doi:10.1016/j.jaad.2020.08.129
- Dhami A, Vale SM, Richardson ML, et al. Comparing ultrasound with magnetic resonance imaging in the evaluation of subungual glomus tumors and subungual myxoid cysts. Skin Appendage Disord. 2023;9:262-267. doi:10.1159/000530397
- Baek HJ, Lee SJ, Cho KH, et al. Subungual tumors: clinicopathologic correlation with US and MR imaging findings. Radiographics. 2010;30:1621-1636. doi:10.1148/rg.306105514
- Patel T, Meena V, Meena P. Hand and foot glomus tumors: significance of MRI diagnosis followed by histopathological assessment. Cureus. 2022;14:E30038. doi:10.7759/cureus.30038
- Mravic M, LaChaud G, Nguyen A, et al. Clinical and histopathological diagnosis of glomus tumor: an institutional experience of 138 cases. Int J Surg Pathol. 2015;23:181-188. doi:10.1177/1066896914567330
- Folpe AL, Fanburg-Smith JC, Miettinen M, et al. Atypical and malignant glomus tumors: analysis of 52 cases, with a proposal for the reclassification of glomus tumors. Am J Surg Pathol. 2001;25:1-12. doi:10.1097/00000478-200101000-00001
- Calduch L, Monteagudo C, Martínez-Ruiz E, et al. Familial generalized multiple glomangiomyoma: report of a new family, with immunohistochemical and ultrastructural studies and review of the literature. Pediatr Dermatol. 2002;19:402-408. doi:10.1046/j.1525-1470.2002.00114.x
- Mentzel T, Hügel H, Kutzner H. CD34-positive glomus tumor: clinicopathologic and immunohistochemical analysis of six cases with myxoid stromal changes. J Cutan Pathol. 2002;29:421-425. doi:10.1034 /j.1600-0560.2002.290706.x
- Kang TW, Lee KH, Park CJ. A case of subungual glomangiomyoma with myxoid stromal change. Korean J Dermatol. 2008;46:550-553.
- Wollstein A, Wollstein R. Subungual glomangiomyoma—a case report. Hand Surg. 2012;17:271-273. doi:10.1142/S021881041272032X
- Aqil N, Gallouj S, Moustaide K, et al. Painful tumors in a patient with neurofibromatosis type 1: a case report. J Med Case Rep. 2018;12:319. doi:10.1186/s13256-018-1847-0
- Demirdag HG, Akay BN, Kirmizi A, et al. Subungual glomangiomyoma. J Am Podiatr Med Assoc. 2020;110:Article_13. doi:10.7547/19-051
- Vega SML, Ruiz SJA, Ramírez CS, et al. Subungual glomangiomyoma: a case report. Dermatol Cosmet Med Quir. 2022;20:258-262.
- Chalise S, Jha A, Neupane PR. Glomangiomyoma of uncertain malignant potential in the urinary bladder: a case report. JNMA J Nepal Med Assoc. 2021;59:719-722. doi:10.31729/jnma.5388
- de Berker D, Goettman S, Baran R. Subungual myxoid cysts: clinical manifestations and response to therapy. J Am Acad Dermatol. 2002;46:394-398. doi:10.1067/mjd.2002.119652
- Gupta MK, Lipner SR. Transillumination for improved diagnosis of digital myxoid cysts. Cutis. 2020;105:82.
- Fernandez-Flores A, Saeb-Lima M. Mucin as a diagnostic clue in dermatopathology. J Cutan Pathol. 2016;43:1005-1016. doi:10.1111/cup.12782
- Choi R, Kim SR, Glusac EJ, et al. Subungual neuroma masquerading as green nail syndrome. JAAD Case Rep. 2022;20:17-19. doi:10.1016 /j.jdcr.2021.11.025
- Rashid RM, Rashid RM, Thomas V. Subungal traumatic neuroma. J Am Acad Dermatol. 2010;63:E7-E8. doi:10.1016/j.jaad.2010.01.028
- Whitehouse HJ, Urwin R, Stables G. Traumatic subungual neuroma. Clin Exp Dermatol. 2018;43:65-66. doi:10.1111/ced.13247
- Lipner SR, Ko D, Husain S. Subungual leiyomyoma presenting as erythronychia: case report and review of the literature. J Drugs Dermatol. 2019;18:465-467.
- Taleb E, Saldías C, Gonzalez S, et al. Sonographic characteristics of leiomyomatous tumors of skin and nail: a case series. Dermatol Pract Concept. 2022;12:e2022082. doi:10.5826/dpc.1203a82
- Baran R, Requena L, Drapé JL. Subungual angioleiomyoma masquerading as a glomus tumour. Br J Dermatol. 2000;142:1239-1241. doi:10.1046/ j.1365-2133.2000.03560.x
- Watabe D, Sakurai E, Mori S, et al. Subungual angioleiomyoma. Indian J Dermatol Venereol Leprol. 2017;83:74-75. doi:10.4103/0378-6323 .185045
- Jha AK, Sinha R, Kumar A, et al. Spiradenoma causing longitudinal splitting of the nail. Clin Exp Dermatol. 2016;41:754-756. doi:10.1111 /ced.12886
- Leach BC, Graham BS. Papular lesion of the proximal nail fold. eccrine spiradenoma. Arch Dermatol. 2004;140:1003-1008. doi:10.1001 /archderm.140.8.1003-a
The Diagnosis: Glomangiomyoma
The nail unit excision specimen showed collections of cuboidal cells and spindled cells within the corium that were consistent with a diagnosis of a glomangiomyoma, a rare glomus tumor variant (Figure). Glomus tumors are benign neoplasms comprising glomus bodies, which are arteriovenous anastomoses involved in thermoregulation.1 They develop in areas densely populated by glomus bodies, including the fingers, toes, and subungual areas. Glomus tumors most commonly develop in middle-aged women.2 Clinically, they manifest with a characteristic triad of intense pain, point tenderness, and cold sensitivity and may appear as reddish-pink or blue macules under the nail plate and/or longitudinal erythronychia.2-6 The presence of multiple glomus tumors is associated with neurofibromatosis type 1.7
Advanced imaging including ultrasonography and magnetic resonance imaging (MRI) may help confirm the diagnosis but may not be cost effective, as excision with histopathology is needed to relieve symptoms and render a definitive diagnosis. Radiography is highly insensitive in identifying bone erosions associated with glomus tumors.8 With ultrasonography, glomus tumors appear hypoechoic; with Doppler ultrasonography, they appear hypervascular. With MRI, glomus tumors appear as well-defined nodular lesions with hypointense signal intensity on T1-weighted sequence and hyperintense signal intensity on T2-weighted sequence, with strong enhancement using gadolinium-based contrast.9,10 On histopathology, a glomus tumor appears as a nodular tumor with sheets of oval-nucleated cells arranged in multicellular layers surrounding blood vessels and are immunoreactive for α-smooth muscle actin, muscle-specific actin, and type IV collagen.11,12
There are several glomus tumor variants. The most common is a solid glomus tumor, which predominantly is composed of glomus cells, followed by glomangioma, which mainly is composed of blood vessels. Glomangiomyoma, which mostly is composed of smooth muscle cells, is the rarest variant.13
While glomus tumors are common in the subungual areas, it is an uncommon location for glomangiomyomas, which have been reported in the nail unit in only 7 prior case reports identified through searches of PubMed and Google Scholar using the terms glomangiomyoma, glomangiomyoma nail, and subungual glomangiomyoma (Table).13-19 Glomangiomyomas more commonly are described in solid organs, including the stomach, kidney, pancreas, and bladder.16 The mean age of patients with subungual glomangiomyomas, including our patient, was 40.4 years (range, 3-61 years), with the majority being female (75.0% [6/8]). Most patients presented with fingernail involvement (75.0% [6/8]), nail dystrophy (eg, nail plate thinning, longitudinal grooves, splinter hemorrhages, longitudinal erythronychia)(62.5% [5/8]), and intermittent pain and/or point tenderness in the affected nail (75.0% [6/8]).13-19 Notably, only our patient had longitudinal erythronychia as a clinical feature, and only one other case described MRI findings, which included a lobulated mass with intense contrast and distal phalanx destruction.18 One patient was a 3-year-old girl with a family history of generalized multiple glomangiomyomas. Although subungual glomangiomyoma was not confirmed on histopathology, the diagnosis in this patient was presumed based on her family history.13 On histopathology, glomangiomyomas are composed of oval-nucleated cells surrounding blood vessels. These oval-nucleated cells then gradually transition to smooth muscle cells.20
A myxoid cyst is composed of a pseudocyst, which lacks a cyst lining, and is a result of synovial fluid from the distal interphalangeal joint entering the pseudocyst space.2 It typically manifests with a longitudinal groove in the nail plate. A flesh-colored nodule may be appreciated between the cuticle and the distal interphalangeal joint.2 The depth of the longitudinal groove may vary depending on the volume of synovial fluid within the myxoid cyst.21 In a series of 35 cases of subungual myxoid cysts, none manifested with longitudinal erythronychia. Due to their composition, myxoid cysts can be distinguished easily from solid tumors of the nail unit via transillumination.22 Pain is a much less common with myxoid cysts vs glomus tumors, as the filling of the pseudocyst space with synovial fluid typically is gradual, allowing the surrounding tissue to accommodate and adapt over time.21 In equivocal cases, MRI or high-resolution ultrasonography may be used to distinguish myxoid cysts and glomus tumors.8 Histopathology shows accumulation of mucin in the dermis with surrounding fibrous stroma.23
Subungual neuromas are painful benign tumors that develop due to disorganized neural proliferation following disruption to peripheral nerves secondary to trauma or surgery. In 3 case reports, subungual neuromas manifested as painful subungual nodules, with proximal nail plate ridging, or onycholysis.24-26 Since neuromas have only rarely been described in the subungual region, reports of MRI and ultrasonography findings are unknown. Histopathology is needed to distinguish neuromas from glomus tumors. Histopathology shows an acapsular structure consisting of disorganized spindle-cell proliferation and nerve fibers arranged in a tangle of fascicles within fibrotic tissue.25 On immunochemistry, spindle cells typically are positive for cellular antigen protein S100.26
Leiomyomas are benign neoplasms derived from smooth muscle, typically localized to the uterus or gastrointestinal tract, and have been described rarely in the nail unit.27,28 It is hypothesized that subungual leiomyomas originate from the vascular smooth muscle in the subcutaneous layer of the nail unit.28 Like glomus tumors, leiomyomas of the subungual region often manifest with pain and longitudinal erythronychia.27-30 Subungual leiomyomas may be distinguished from glomus tumors via advanced imaging techniques, including ultrasonography and MRI. Cutaneous leiomyomas have been described with mild to moderate internal low flow vascularity on Doppler ultrasonography, while glomus tumors typically reveal high internal vascularity.28 Biopsy with histopathology is needed for definitive diagnosis. On histopathology, leiomyomas demonstrate bland-appearing spindle-shaped cells with elongated nuclei arranged in fascicles.27 They typically are positive for α-smooth muscle actin and caldesmon on immunostaining.
Eccrine spiradenomas are benign adnexal tumors likely of apocrine origin with limited case reports in the literature.31,32 Clinically, eccrine spiradenomas involving the nail unit may manifest with longitudinal nail splitting of the nail or as a papule on the proximal nail fold, with associated tenderness.31,32 In a report of a 50-year-old woman with a histopathologically confirmed eccrine spiradenoma manifesting with longitudinal splitting of the nail and pain in the proximal nail fold, the mass appeared hypoechoic on ultrasonography with increased intramass vascularity on Doppler, while MRI showed an intensely enhancing lesion.31 These imaging features, combined with a classically manifesting feature of pain, make eccrine spiradenomas difficult to distinguish from glomus tumors; therefore, histopathologic examination can provide a definitive diagnosis, and surgical excision is used for treatment.31 On histopathology, these tumors are well circumscribed and composed of both small dark basaloid cells with peripheral compact nuclei and larger cells with central pale nuclei, which may be arranged in tubules.31,32
The Diagnosis: Glomangiomyoma
The nail unit excision specimen showed collections of cuboidal cells and spindled cells within the corium that were consistent with a diagnosis of a glomangiomyoma, a rare glomus tumor variant (Figure). Glomus tumors are benign neoplasms comprising glomus bodies, which are arteriovenous anastomoses involved in thermoregulation.1 They develop in areas densely populated by glomus bodies, including the fingers, toes, and subungual areas. Glomus tumors most commonly develop in middle-aged women.2 Clinically, they manifest with a characteristic triad of intense pain, point tenderness, and cold sensitivity and may appear as reddish-pink or blue macules under the nail plate and/or longitudinal erythronychia.2-6 The presence of multiple glomus tumors is associated with neurofibromatosis type 1.7
Advanced imaging including ultrasonography and magnetic resonance imaging (MRI) may help confirm the diagnosis but may not be cost effective, as excision with histopathology is needed to relieve symptoms and render a definitive diagnosis. Radiography is highly insensitive in identifying bone erosions associated with glomus tumors.8 With ultrasonography, glomus tumors appear hypoechoic; with Doppler ultrasonography, they appear hypervascular. With MRI, glomus tumors appear as well-defined nodular lesions with hypointense signal intensity on T1-weighted sequence and hyperintense signal intensity on T2-weighted sequence, with strong enhancement using gadolinium-based contrast.9,10 On histopathology, a glomus tumor appears as a nodular tumor with sheets of oval-nucleated cells arranged in multicellular layers surrounding blood vessels and are immunoreactive for α-smooth muscle actin, muscle-specific actin, and type IV collagen.11,12
There are several glomus tumor variants. The most common is a solid glomus tumor, which predominantly is composed of glomus cells, followed by glomangioma, which mainly is composed of blood vessels. Glomangiomyoma, which mostly is composed of smooth muscle cells, is the rarest variant.13
While glomus tumors are common in the subungual areas, it is an uncommon location for glomangiomyomas, which have been reported in the nail unit in only 7 prior case reports identified through searches of PubMed and Google Scholar using the terms glomangiomyoma, glomangiomyoma nail, and subungual glomangiomyoma (Table).13-19 Glomangiomyomas more commonly are described in solid organs, including the stomach, kidney, pancreas, and bladder.16 The mean age of patients with subungual glomangiomyomas, including our patient, was 40.4 years (range, 3-61 years), with the majority being female (75.0% [6/8]). Most patients presented with fingernail involvement (75.0% [6/8]), nail dystrophy (eg, nail plate thinning, longitudinal grooves, splinter hemorrhages, longitudinal erythronychia)(62.5% [5/8]), and intermittent pain and/or point tenderness in the affected nail (75.0% [6/8]).13-19 Notably, only our patient had longitudinal erythronychia as a clinical feature, and only one other case described MRI findings, which included a lobulated mass with intense contrast and distal phalanx destruction.18 One patient was a 3-year-old girl with a family history of generalized multiple glomangiomyomas. Although subungual glomangiomyoma was not confirmed on histopathology, the diagnosis in this patient was presumed based on her family history.13 On histopathology, glomangiomyomas are composed of oval-nucleated cells surrounding blood vessels. These oval-nucleated cells then gradually transition to smooth muscle cells.20
A myxoid cyst is composed of a pseudocyst, which lacks a cyst lining, and is a result of synovial fluid from the distal interphalangeal joint entering the pseudocyst space.2 It typically manifests with a longitudinal groove in the nail plate. A flesh-colored nodule may be appreciated between the cuticle and the distal interphalangeal joint.2 The depth of the longitudinal groove may vary depending on the volume of synovial fluid within the myxoid cyst.21 In a series of 35 cases of subungual myxoid cysts, none manifested with longitudinal erythronychia. Due to their composition, myxoid cysts can be distinguished easily from solid tumors of the nail unit via transillumination.22 Pain is a much less common with myxoid cysts vs glomus tumors, as the filling of the pseudocyst space with synovial fluid typically is gradual, allowing the surrounding tissue to accommodate and adapt over time.21 In equivocal cases, MRI or high-resolution ultrasonography may be used to distinguish myxoid cysts and glomus tumors.8 Histopathology shows accumulation of mucin in the dermis with surrounding fibrous stroma.23
Subungual neuromas are painful benign tumors that develop due to disorganized neural proliferation following disruption to peripheral nerves secondary to trauma or surgery. In 3 case reports, subungual neuromas manifested as painful subungual nodules, with proximal nail plate ridging, or onycholysis.24-26 Since neuromas have only rarely been described in the subungual region, reports of MRI and ultrasonography findings are unknown. Histopathology is needed to distinguish neuromas from glomus tumors. Histopathology shows an acapsular structure consisting of disorganized spindle-cell proliferation and nerve fibers arranged in a tangle of fascicles within fibrotic tissue.25 On immunochemistry, spindle cells typically are positive for cellular antigen protein S100.26
Leiomyomas are benign neoplasms derived from smooth muscle, typically localized to the uterus or gastrointestinal tract, and have been described rarely in the nail unit.27,28 It is hypothesized that subungual leiomyomas originate from the vascular smooth muscle in the subcutaneous layer of the nail unit.28 Like glomus tumors, leiomyomas of the subungual region often manifest with pain and longitudinal erythronychia.27-30 Subungual leiomyomas may be distinguished from glomus tumors via advanced imaging techniques, including ultrasonography and MRI. Cutaneous leiomyomas have been described with mild to moderate internal low flow vascularity on Doppler ultrasonography, while glomus tumors typically reveal high internal vascularity.28 Biopsy with histopathology is needed for definitive diagnosis. On histopathology, leiomyomas demonstrate bland-appearing spindle-shaped cells with elongated nuclei arranged in fascicles.27 They typically are positive for α-smooth muscle actin and caldesmon on immunostaining.
Eccrine spiradenomas are benign adnexal tumors likely of apocrine origin with limited case reports in the literature.31,32 Clinically, eccrine spiradenomas involving the nail unit may manifest with longitudinal nail splitting of the nail or as a papule on the proximal nail fold, with associated tenderness.31,32 In a report of a 50-year-old woman with a histopathologically confirmed eccrine spiradenoma manifesting with longitudinal splitting of the nail and pain in the proximal nail fold, the mass appeared hypoechoic on ultrasonography with increased intramass vascularity on Doppler, while MRI showed an intensely enhancing lesion.31 These imaging features, combined with a classically manifesting feature of pain, make eccrine spiradenomas difficult to distinguish from glomus tumors; therefore, histopathologic examination can provide a definitive diagnosis, and surgical excision is used for treatment.31 On histopathology, these tumors are well circumscribed and composed of both small dark basaloid cells with peripheral compact nuclei and larger cells with central pale nuclei, which may be arranged in tubules.31,32
- Gombos Z, Zhang PJ. Glomus tumor. Arch Pathol Lab Med. 2008;132: 1448-1452. doi:10.5858/2008-132-1448-gt
- Hare AQ, Rich P. Nail tumors. Dermatol Clin. 2021;39:281-292. doi:10.1016/j.det.2020.12.007
- Hazani R, Houle JM, Kasdan ML, et al. Glomus tumors of the hand. Eplasty. 2008;8:E48.
- Hwang JK, Lipner SR. Blue nail discoloration: literature review and diagnostic algorithms. Am J Clin Dermatol. 2023;24:419-441. doi:10.1007/s40257-023-00768-6
- Lipner SR, Scher RK. Longitudinal erythronychia of the fingernail. JAMA Dermatol. 2016;152:1271-1272. doi:10.1001/jamadermatol.2016.2747
- Jellinek NJ, Lipner SR. Longitudinal erythronychia: retrospective single-center study evaluating differential diagnosis and the likelihood of malignancy. Dermatol Surg. 2016;42:310-319. doi:10.1097 /DSS.0000000000000594
- Lipner SR, Scher RK. Subungual glomus tumors: underrecognized clinical findings in neurofibromatosis 1. J Am Acad Dermatol. 2021;84:E269. doi:10.1016/j.jaad.2020.08.129
- Dhami A, Vale SM, Richardson ML, et al. Comparing ultrasound with magnetic resonance imaging in the evaluation of subungual glomus tumors and subungual myxoid cysts. Skin Appendage Disord. 2023;9:262-267. doi:10.1159/000530397
- Baek HJ, Lee SJ, Cho KH, et al. Subungual tumors: clinicopathologic correlation with US and MR imaging findings. Radiographics. 2010;30:1621-1636. doi:10.1148/rg.306105514
- Patel T, Meena V, Meena P. Hand and foot glomus tumors: significance of MRI diagnosis followed by histopathological assessment. Cureus. 2022;14:E30038. doi:10.7759/cureus.30038
- Mravic M, LaChaud G, Nguyen A, et al. Clinical and histopathological diagnosis of glomus tumor: an institutional experience of 138 cases. Int J Surg Pathol. 2015;23:181-188. doi:10.1177/1066896914567330
- Folpe AL, Fanburg-Smith JC, Miettinen M, et al. Atypical and malignant glomus tumors: analysis of 52 cases, with a proposal for the reclassification of glomus tumors. Am J Surg Pathol. 2001;25:1-12. doi:10.1097/00000478-200101000-00001
- Calduch L, Monteagudo C, Martínez-Ruiz E, et al. Familial generalized multiple glomangiomyoma: report of a new family, with immunohistochemical and ultrastructural studies and review of the literature. Pediatr Dermatol. 2002;19:402-408. doi:10.1046/j.1525-1470.2002.00114.x
- Mentzel T, Hügel H, Kutzner H. CD34-positive glomus tumor: clinicopathologic and immunohistochemical analysis of six cases with myxoid stromal changes. J Cutan Pathol. 2002;29:421-425. doi:10.1034 /j.1600-0560.2002.290706.x
- Kang TW, Lee KH, Park CJ. A case of subungual glomangiomyoma with myxoid stromal change. Korean J Dermatol. 2008;46:550-553.
- Wollstein A, Wollstein R. Subungual glomangiomyoma—a case report. Hand Surg. 2012;17:271-273. doi:10.1142/S021881041272032X
- Aqil N, Gallouj S, Moustaide K, et al. Painful tumors in a patient with neurofibromatosis type 1: a case report. J Med Case Rep. 2018;12:319. doi:10.1186/s13256-018-1847-0
- Demirdag HG, Akay BN, Kirmizi A, et al. Subungual glomangiomyoma. J Am Podiatr Med Assoc. 2020;110:Article_13. doi:10.7547/19-051
- Vega SML, Ruiz SJA, Ramírez CS, et al. Subungual glomangiomyoma: a case report. Dermatol Cosmet Med Quir. 2022;20:258-262.
- Chalise S, Jha A, Neupane PR. Glomangiomyoma of uncertain malignant potential in the urinary bladder: a case report. JNMA J Nepal Med Assoc. 2021;59:719-722. doi:10.31729/jnma.5388
- de Berker D, Goettman S, Baran R. Subungual myxoid cysts: clinical manifestations and response to therapy. J Am Acad Dermatol. 2002;46:394-398. doi:10.1067/mjd.2002.119652
- Gupta MK, Lipner SR. Transillumination for improved diagnosis of digital myxoid cysts. Cutis. 2020;105:82.
- Fernandez-Flores A, Saeb-Lima M. Mucin as a diagnostic clue in dermatopathology. J Cutan Pathol. 2016;43:1005-1016. doi:10.1111/cup.12782
- Choi R, Kim SR, Glusac EJ, et al. Subungual neuroma masquerading as green nail syndrome. JAAD Case Rep. 2022;20:17-19. doi:10.1016 /j.jdcr.2021.11.025
- Rashid RM, Rashid RM, Thomas V. Subungal traumatic neuroma. J Am Acad Dermatol. 2010;63:E7-E8. doi:10.1016/j.jaad.2010.01.028
- Whitehouse HJ, Urwin R, Stables G. Traumatic subungual neuroma. Clin Exp Dermatol. 2018;43:65-66. doi:10.1111/ced.13247
- Lipner SR, Ko D, Husain S. Subungual leiyomyoma presenting as erythronychia: case report and review of the literature. J Drugs Dermatol. 2019;18:465-467.
- Taleb E, Saldías C, Gonzalez S, et al. Sonographic characteristics of leiomyomatous tumors of skin and nail: a case series. Dermatol Pract Concept. 2022;12:e2022082. doi:10.5826/dpc.1203a82
- Baran R, Requena L, Drapé JL. Subungual angioleiomyoma masquerading as a glomus tumour. Br J Dermatol. 2000;142:1239-1241. doi:10.1046/ j.1365-2133.2000.03560.x
- Watabe D, Sakurai E, Mori S, et al. Subungual angioleiomyoma. Indian J Dermatol Venereol Leprol. 2017;83:74-75. doi:10.4103/0378-6323 .185045
- Jha AK, Sinha R, Kumar A, et al. Spiradenoma causing longitudinal splitting of the nail. Clin Exp Dermatol. 2016;41:754-756. doi:10.1111 /ced.12886
- Leach BC, Graham BS. Papular lesion of the proximal nail fold. eccrine spiradenoma. Arch Dermatol. 2004;140:1003-1008. doi:10.1001 /archderm.140.8.1003-a
- Gombos Z, Zhang PJ. Glomus tumor. Arch Pathol Lab Med. 2008;132: 1448-1452. doi:10.5858/2008-132-1448-gt
- Hare AQ, Rich P. Nail tumors. Dermatol Clin. 2021;39:281-292. doi:10.1016/j.det.2020.12.007
- Hazani R, Houle JM, Kasdan ML, et al. Glomus tumors of the hand. Eplasty. 2008;8:E48.
- Hwang JK, Lipner SR. Blue nail discoloration: literature review and diagnostic algorithms. Am J Clin Dermatol. 2023;24:419-441. doi:10.1007/s40257-023-00768-6
- Lipner SR, Scher RK. Longitudinal erythronychia of the fingernail. JAMA Dermatol. 2016;152:1271-1272. doi:10.1001/jamadermatol.2016.2747
- Jellinek NJ, Lipner SR. Longitudinal erythronychia: retrospective single-center study evaluating differential diagnosis and the likelihood of malignancy. Dermatol Surg. 2016;42:310-319. doi:10.1097 /DSS.0000000000000594
- Lipner SR, Scher RK. Subungual glomus tumors: underrecognized clinical findings in neurofibromatosis 1. J Am Acad Dermatol. 2021;84:E269. doi:10.1016/j.jaad.2020.08.129
- Dhami A, Vale SM, Richardson ML, et al. Comparing ultrasound with magnetic resonance imaging in the evaluation of subungual glomus tumors and subungual myxoid cysts. Skin Appendage Disord. 2023;9:262-267. doi:10.1159/000530397
- Baek HJ, Lee SJ, Cho KH, et al. Subungual tumors: clinicopathologic correlation with US and MR imaging findings. Radiographics. 2010;30:1621-1636. doi:10.1148/rg.306105514
- Patel T, Meena V, Meena P. Hand and foot glomus tumors: significance of MRI diagnosis followed by histopathological assessment. Cureus. 2022;14:E30038. doi:10.7759/cureus.30038
- Mravic M, LaChaud G, Nguyen A, et al. Clinical and histopathological diagnosis of glomus tumor: an institutional experience of 138 cases. Int J Surg Pathol. 2015;23:181-188. doi:10.1177/1066896914567330
- Folpe AL, Fanburg-Smith JC, Miettinen M, et al. Atypical and malignant glomus tumors: analysis of 52 cases, with a proposal for the reclassification of glomus tumors. Am J Surg Pathol. 2001;25:1-12. doi:10.1097/00000478-200101000-00001
- Calduch L, Monteagudo C, Martínez-Ruiz E, et al. Familial generalized multiple glomangiomyoma: report of a new family, with immunohistochemical and ultrastructural studies and review of the literature. Pediatr Dermatol. 2002;19:402-408. doi:10.1046/j.1525-1470.2002.00114.x
- Mentzel T, Hügel H, Kutzner H. CD34-positive glomus tumor: clinicopathologic and immunohistochemical analysis of six cases with myxoid stromal changes. J Cutan Pathol. 2002;29:421-425. doi:10.1034 /j.1600-0560.2002.290706.x
- Kang TW, Lee KH, Park CJ. A case of subungual glomangiomyoma with myxoid stromal change. Korean J Dermatol. 2008;46:550-553.
- Wollstein A, Wollstein R. Subungual glomangiomyoma—a case report. Hand Surg. 2012;17:271-273. doi:10.1142/S021881041272032X
- Aqil N, Gallouj S, Moustaide K, et al. Painful tumors in a patient with neurofibromatosis type 1: a case report. J Med Case Rep. 2018;12:319. doi:10.1186/s13256-018-1847-0
- Demirdag HG, Akay BN, Kirmizi A, et al. Subungual glomangiomyoma. J Am Podiatr Med Assoc. 2020;110:Article_13. doi:10.7547/19-051
- Vega SML, Ruiz SJA, Ramírez CS, et al. Subungual glomangiomyoma: a case report. Dermatol Cosmet Med Quir. 2022;20:258-262.
- Chalise S, Jha A, Neupane PR. Glomangiomyoma of uncertain malignant potential in the urinary bladder: a case report. JNMA J Nepal Med Assoc. 2021;59:719-722. doi:10.31729/jnma.5388
- de Berker D, Goettman S, Baran R. Subungual myxoid cysts: clinical manifestations and response to therapy. J Am Acad Dermatol. 2002;46:394-398. doi:10.1067/mjd.2002.119652
- Gupta MK, Lipner SR. Transillumination for improved diagnosis of digital myxoid cysts. Cutis. 2020;105:82.
- Fernandez-Flores A, Saeb-Lima M. Mucin as a diagnostic clue in dermatopathology. J Cutan Pathol. 2016;43:1005-1016. doi:10.1111/cup.12782
- Choi R, Kim SR, Glusac EJ, et al. Subungual neuroma masquerading as green nail syndrome. JAAD Case Rep. 2022;20:17-19. doi:10.1016 /j.jdcr.2021.11.025
- Rashid RM, Rashid RM, Thomas V. Subungal traumatic neuroma. J Am Acad Dermatol. 2010;63:E7-E8. doi:10.1016/j.jaad.2010.01.028
- Whitehouse HJ, Urwin R, Stables G. Traumatic subungual neuroma. Clin Exp Dermatol. 2018;43:65-66. doi:10.1111/ced.13247
- Lipner SR, Ko D, Husain S. Subungual leiyomyoma presenting as erythronychia: case report and review of the literature. J Drugs Dermatol. 2019;18:465-467.
- Taleb E, Saldías C, Gonzalez S, et al. Sonographic characteristics of leiomyomatous tumors of skin and nail: a case series. Dermatol Pract Concept. 2022;12:e2022082. doi:10.5826/dpc.1203a82
- Baran R, Requena L, Drapé JL. Subungual angioleiomyoma masquerading as a glomus tumour. Br J Dermatol. 2000;142:1239-1241. doi:10.1046/ j.1365-2133.2000.03560.x
- Watabe D, Sakurai E, Mori S, et al. Subungual angioleiomyoma. Indian J Dermatol Venereol Leprol. 2017;83:74-75. doi:10.4103/0378-6323 .185045
- Jha AK, Sinha R, Kumar A, et al. Spiradenoma causing longitudinal splitting of the nail. Clin Exp Dermatol. 2016;41:754-756. doi:10.1111 /ced.12886
- Leach BC, Graham BS. Papular lesion of the proximal nail fold. eccrine spiradenoma. Arch Dermatol. 2004;140:1003-1008. doi:10.1001 /archderm.140.8.1003-a
A 38-year-old woman presented to our nail specialty clinic with a red line and associated pain on the left fourth fingernail of 2 and 3 years’ duration, respectively. The patient described the pain as throbbing, with sensitivity to pressure and cold. She noted that the nail grew slowly and would sometimes split at the distal edge. She did not recall any discrete trauma to the digit or nail. The patient was right-handed, making the symptoms less likely to be due to overuse from daily activities. She had received no prior treatment for these symptoms.
The patient’s medical history included iron deficiency as well as acne and eczema. She had no personal or family history of skin cancer. Physical examination of the affected digit and nail revealed a longitudinal red line and distal onycholysis. With contact dermoscopy, the red line blanched. Pressure applied using a #11 scalpel blade elicited pinpoint tenderness (positive Love test), and application of an ice pack caused pain (positive cold test). A radiograph of the left hand was negative for bone erosions, and magnetic resonance imaging showed a 0.3-cm subungual lesion at the level of the fourth distal phalanx. An excision of the nail unit was performed.
American Hunger Games: Food Insecurity Among the Military and Veterans
American Hunger Games: Food Insecurity Among the Military and Veterans
The requisites of government are that there be sufficiency of food, sufficiency of military equipment, and the confidence of the people in their ruler.
Analects by Confucius1
From ancient festivals to modern holidays, autumn has long been associated with the gathering of the harvest. Friends and families come together around tables laden with delicious food to enjoy the pleasures of peace and plenty. During these celebrations, we must never forget that without the strength of the nation’s military and the service of its veterans, this freedom and abundance would not be possible. Our debt of gratitude to the current and former members of the armed services makes the fact that a substantial minority experiences food insecurity not only a human tragedy, but a travesty of the nation’s promise to support those who wear or have worn the uniform.
The National Defense Authorization Act for Fiscal Year 2020 charged the Secretary of Defense to investigate food insecurity among active-duty service members and their dependents.2 The RAND Corporation conducted the assessment and, based on the results of its analysis, made recommendations to reduce hunger among armed forces members and their families.3
The RAND study found that 10% of active-duty military met US Department of Agriculture (USDA) criteria for very low food security; another 15% were classified as having low food security. The USDA defines food insecurity with hunger as “reports of multiple indications of disrupted eating patterns and reduced food intake.” USDA defines low food security as “reports of reduced quality, variety, or desirability of diet. Little or no indication of reduced food intake.”4
As someone who grew up on an Army base with the commissary a short trip from military housing, I was unpleasantly surprised that food insecurity was more common among in-service members living on post. I was even more dismayed to read that a variety of factors constrained 14% of active-duty military experiencing food insecurity to seek public assistance to feed themselves and their families. As with so many health care and social services, (eg, mental health care), those wearing the uniform were concerned that participating in a food assistance program would damage their career or stigmatize them. Others did not seek help, perhaps because they believed they were not eligible, and in many cases were correct: they did not qualify for food banks or food stamps due to receiving other benefits. A variety of factors contribute to periods of food insecurity among military families, including remote or rural bases that lack access to grocery stores or jobs for partners or other family members, and low base military pay.5
Food insecurity is an even more serious concern among veterans who are frequently older and have more comorbidities, often leading to unemployment and homelessness. Feeding America, the nation’s largest organization of community food banks, estimates that 1 in 9 working-age veterans are food insecure.5 US Department of Veterans Affairs (VA) statistics indicate that veterans are 7% more likely to experience food insecurity than other sectors of the population.6 The Veterans Health Administration has recognized that food insecurity is directly related to medical problems already common among veterans, including diabetes, obesity, and depression. Women and minority veterans are the most at risk of food insecurity.7
Recognizing that many veterans are at risk of food insecurity, the US Department of Defense and VA have taken steps to try and reduce hunger among those who serve. In response to the shocking statistic that food insecurity was found in 27% of Iraq and Afghanistan veterans, the VA and Rockefeller Foundation are partnering on the Food as Medicine initiative to improve veteran nutrition as a means of improving nutrition-related health consequences of food insecurity.8

Like many federal practitioners, I was unaware of the food insecurity assistance available to active-duty service members or veterans, or how to help individuals access it. In addition to the resources outlined in the Table, there are many community-based options open to anyone, including veterans and service members.
I have written columns on many difficult issues in my years as the Editor-in-Chief of Federal Practitioner, but personally this is one of the most distressing editorials I have ever published. That individuals dedicated to defending our rights and protecting our safety should be compelled to go hungry or not know if they have enough money at the end of the month to buy food is manifestly unjust. It is challenging when faced with such a large-scale injustice to think we cannot make a difference, but that resignation or abdication only magnifies this inequity. I have a friend who kept giving back even after they retired from federal service: they volunteered at a community garden and brought produce to the local food bank and helped distribute it. That may seem too much for those still working yet almost anyone can pick up a few items on their weekly shopping trip and donate them to a food drive.
As we approach Veterans Day, let’s not just express our gratitude to our military and veterans in words but in deeds like feeding the hungry and urging elected representatives to fulfill their commitment to ensure that service members and veterans and their families do not experience food insecurity. Confucian wisdom written in a very distant time and vastly dissimilar context still rings true: there are direct and critical links between food and trust and between hunger and the military.1
Dawson MM. The Wisdom of Confucius: A Collection of the Ethical Sayings of Confucius and of his disciples. International Pocket Library; 1932.
National Defense Authorization Act for Fiscal Year 2020. 116th Cong (2019), Public Law 116-92. U.S. Government Printing Office. https://www.govinfo.gov/content/pkg/PLAW-116publ92/html/PLAW-116publ92.htm
Asch BJ, Rennane S, Trail TE, et al. Food insecurity among members of the armed forces and their dependents. RAND Corporation. January 3, 2023. Accessed September 22, 2025. https://www.rand.org/pubs/research_reports/RRA1230-1.html
US Department of Agriculture Economic Research Service. Food Security in the U.S.—Definitions of Food Security. US Department of Agriculture Economic Research Service. January 10, 2025. https://www.ers.usda.gov/topics/food-nutrition-assistance/food-security-in-the-us/definitions-of-food-security
Active military and veteran food insecurity. Feeding America. Accessed September 22, 2025. https://www.feedingamerica.org/hunger-in-america/food-insecurity-in-veterans
Pradun S. Find access to stop food insecurity in your community. VA News. September 19, 2025. Accessed September 22, 2025. https://news.va.gov/142733/find-access-stop-food-insecurity-your-community/
Cohen AJ, Dosa DM, Rudolph JL, et al. Risk factors for veteran food insecurity: findings from a National US Department of Veterans Affairs Food Insecurity Screener. Public Health Nutr. 2022;25:819-828. doi:10.1017/S1368980021004584
Chen C. VA and Rockefeller Foundation collaborate to access food for Veterans. VA News. September 5, 2023. Accessed September 22, 2025. https://news.va.gov/123228/va-rockefeller-foundation-expand-access-to-food/
The requisites of government are that there be sufficiency of food, sufficiency of military equipment, and the confidence of the people in their ruler.
Analects by Confucius1
From ancient festivals to modern holidays, autumn has long been associated with the gathering of the harvest. Friends and families come together around tables laden with delicious food to enjoy the pleasures of peace and plenty. During these celebrations, we must never forget that without the strength of the nation’s military and the service of its veterans, this freedom and abundance would not be possible. Our debt of gratitude to the current and former members of the armed services makes the fact that a substantial minority experiences food insecurity not only a human tragedy, but a travesty of the nation’s promise to support those who wear or have worn the uniform.
The National Defense Authorization Act for Fiscal Year 2020 charged the Secretary of Defense to investigate food insecurity among active-duty service members and their dependents.2 The RAND Corporation conducted the assessment and, based on the results of its analysis, made recommendations to reduce hunger among armed forces members and their families.3
The RAND study found that 10% of active-duty military met US Department of Agriculture (USDA) criteria for very low food security; another 15% were classified as having low food security. The USDA defines food insecurity with hunger as “reports of multiple indications of disrupted eating patterns and reduced food intake.” USDA defines low food security as “reports of reduced quality, variety, or desirability of diet. Little or no indication of reduced food intake.”4
As someone who grew up on an Army base with the commissary a short trip from military housing, I was unpleasantly surprised that food insecurity was more common among in-service members living on post. I was even more dismayed to read that a variety of factors constrained 14% of active-duty military experiencing food insecurity to seek public assistance to feed themselves and their families. As with so many health care and social services, (eg, mental health care), those wearing the uniform were concerned that participating in a food assistance program would damage their career or stigmatize them. Others did not seek help, perhaps because they believed they were not eligible, and in many cases were correct: they did not qualify for food banks or food stamps due to receiving other benefits. A variety of factors contribute to periods of food insecurity among military families, including remote or rural bases that lack access to grocery stores or jobs for partners or other family members, and low base military pay.5
Food insecurity is an even more serious concern among veterans who are frequently older and have more comorbidities, often leading to unemployment and homelessness. Feeding America, the nation’s largest organization of community food banks, estimates that 1 in 9 working-age veterans are food insecure.5 US Department of Veterans Affairs (VA) statistics indicate that veterans are 7% more likely to experience food insecurity than other sectors of the population.6 The Veterans Health Administration has recognized that food insecurity is directly related to medical problems already common among veterans, including diabetes, obesity, and depression. Women and minority veterans are the most at risk of food insecurity.7
Recognizing that many veterans are at risk of food insecurity, the US Department of Defense and VA have taken steps to try and reduce hunger among those who serve. In response to the shocking statistic that food insecurity was found in 27% of Iraq and Afghanistan veterans, the VA and Rockefeller Foundation are partnering on the Food as Medicine initiative to improve veteran nutrition as a means of improving nutrition-related health consequences of food insecurity.8
Like many federal practitioners, I was unaware of the food insecurity assistance available to active-duty service members or veterans, or how to help individuals access it. In addition to the resources outlined in the Table, there are many community-based options open to anyone, including veterans and service members.
I have written columns on many difficult issues in my years as the Editor-in-Chief of Federal Practitioner, but personally this is one of the most distressing editorials I have ever published. That individuals dedicated to defending our rights and protecting our safety should be compelled to go hungry or not know if they have enough money at the end of the month to buy food is manifestly unjust. It is challenging when faced with such a large-scale injustice to think we cannot make a difference, but that resignation or abdication only magnifies this inequity. I have a friend who kept giving back even after they retired from federal service: they volunteered at a community garden and brought produce to the local food bank and helped distribute it. That may seem too much for those still working yet almost anyone can pick up a few items on their weekly shopping trip and donate them to a food drive.
As we approach Veterans Day, let’s not just express our gratitude to our military and veterans in words but in deeds like feeding the hungry and urging elected representatives to fulfill their commitment to ensure that service members and veterans and their families do not experience food insecurity. Confucian wisdom written in a very distant time and vastly dissimilar context still rings true: there are direct and critical links between food and trust and between hunger and the military.1
The requisites of government are that there be sufficiency of food, sufficiency of military equipment, and the confidence of the people in their ruler.
Analects by Confucius1
From ancient festivals to modern holidays, autumn has long been associated with the gathering of the harvest. Friends and families come together around tables laden with delicious food to enjoy the pleasures of peace and plenty. During these celebrations, we must never forget that without the strength of the nation’s military and the service of its veterans, this freedom and abundance would not be possible. Our debt of gratitude to the current and former members of the armed services makes the fact that a substantial minority experiences food insecurity not only a human tragedy, but a travesty of the nation’s promise to support those who wear or have worn the uniform.
The National Defense Authorization Act for Fiscal Year 2020 charged the Secretary of Defense to investigate food insecurity among active-duty service members and their dependents.2 The RAND Corporation conducted the assessment and, based on the results of its analysis, made recommendations to reduce hunger among armed forces members and their families.3
The RAND study found that 10% of active-duty military met US Department of Agriculture (USDA) criteria for very low food security; another 15% were classified as having low food security. The USDA defines food insecurity with hunger as “reports of multiple indications of disrupted eating patterns and reduced food intake.” USDA defines low food security as “reports of reduced quality, variety, or desirability of diet. Little or no indication of reduced food intake.”4
As someone who grew up on an Army base with the commissary a short trip from military housing, I was unpleasantly surprised that food insecurity was more common among in-service members living on post. I was even more dismayed to read that a variety of factors constrained 14% of active-duty military experiencing food insecurity to seek public assistance to feed themselves and their families. As with so many health care and social services, (eg, mental health care), those wearing the uniform were concerned that participating in a food assistance program would damage their career or stigmatize them. Others did not seek help, perhaps because they believed they were not eligible, and in many cases were correct: they did not qualify for food banks or food stamps due to receiving other benefits. A variety of factors contribute to periods of food insecurity among military families, including remote or rural bases that lack access to grocery stores or jobs for partners or other family members, and low base military pay.5
Food insecurity is an even more serious concern among veterans who are frequently older and have more comorbidities, often leading to unemployment and homelessness. Feeding America, the nation’s largest organization of community food banks, estimates that 1 in 9 working-age veterans are food insecure.5 US Department of Veterans Affairs (VA) statistics indicate that veterans are 7% more likely to experience food insecurity than other sectors of the population.6 The Veterans Health Administration has recognized that food insecurity is directly related to medical problems already common among veterans, including diabetes, obesity, and depression. Women and minority veterans are the most at risk of food insecurity.7
Recognizing that many veterans are at risk of food insecurity, the US Department of Defense and VA have taken steps to try and reduce hunger among those who serve. In response to the shocking statistic that food insecurity was found in 27% of Iraq and Afghanistan veterans, the VA and Rockefeller Foundation are partnering on the Food as Medicine initiative to improve veteran nutrition as a means of improving nutrition-related health consequences of food insecurity.8
Like many federal practitioners, I was unaware of the food insecurity assistance available to active-duty service members or veterans, or how to help individuals access it. In addition to the resources outlined in the Table, there are many community-based options open to anyone, including veterans and service members.
I have written columns on many difficult issues in my years as the Editor-in-Chief of Federal Practitioner, but personally this is one of the most distressing editorials I have ever published. That individuals dedicated to defending our rights and protecting our safety should be compelled to go hungry or not know if they have enough money at the end of the month to buy food is manifestly unjust. It is challenging when faced with such a large-scale injustice to think we cannot make a difference, but that resignation or abdication only magnifies this inequity. I have a friend who kept giving back even after they retired from federal service: they volunteered at a community garden and brought produce to the local food bank and helped distribute it. That may seem too much for those still working yet almost anyone can pick up a few items on their weekly shopping trip and donate them to a food drive.
As we approach Veterans Day, let’s not just express our gratitude to our military and veterans in words but in deeds like feeding the hungry and urging elected representatives to fulfill their commitment to ensure that service members and veterans and their families do not experience food insecurity. Confucian wisdom written in a very distant time and vastly dissimilar context still rings true: there are direct and critical links between food and trust and between hunger and the military.1
Dawson MM. The Wisdom of Confucius: A Collection of the Ethical Sayings of Confucius and of his disciples. International Pocket Library; 1932.
National Defense Authorization Act for Fiscal Year 2020. 116th Cong (2019), Public Law 116-92. U.S. Government Printing Office. https://www.govinfo.gov/content/pkg/PLAW-116publ92/html/PLAW-116publ92.htm
Asch BJ, Rennane S, Trail TE, et al. Food insecurity among members of the armed forces and their dependents. RAND Corporation. January 3, 2023. Accessed September 22, 2025. https://www.rand.org/pubs/research_reports/RRA1230-1.html
US Department of Agriculture Economic Research Service. Food Security in the U.S.—Definitions of Food Security. US Department of Agriculture Economic Research Service. January 10, 2025. https://www.ers.usda.gov/topics/food-nutrition-assistance/food-security-in-the-us/definitions-of-food-security
Active military and veteran food insecurity. Feeding America. Accessed September 22, 2025. https://www.feedingamerica.org/hunger-in-america/food-insecurity-in-veterans
Pradun S. Find access to stop food insecurity in your community. VA News. September 19, 2025. Accessed September 22, 2025. https://news.va.gov/142733/find-access-stop-food-insecurity-your-community/
Cohen AJ, Dosa DM, Rudolph JL, et al. Risk factors for veteran food insecurity: findings from a National US Department of Veterans Affairs Food Insecurity Screener. Public Health Nutr. 2022;25:819-828. doi:10.1017/S1368980021004584
Chen C. VA and Rockefeller Foundation collaborate to access food for Veterans. VA News. September 5, 2023. Accessed September 22, 2025. https://news.va.gov/123228/va-rockefeller-foundation-expand-access-to-food/
Dawson MM. The Wisdom of Confucius: A Collection of the Ethical Sayings of Confucius and of his disciples. International Pocket Library; 1932.
National Defense Authorization Act for Fiscal Year 2020. 116th Cong (2019), Public Law 116-92. U.S. Government Printing Office. https://www.govinfo.gov/content/pkg/PLAW-116publ92/html/PLAW-116publ92.htm
Asch BJ, Rennane S, Trail TE, et al. Food insecurity among members of the armed forces and their dependents. RAND Corporation. January 3, 2023. Accessed September 22, 2025. https://www.rand.org/pubs/research_reports/RRA1230-1.html
US Department of Agriculture Economic Research Service. Food Security in the U.S.—Definitions of Food Security. US Department of Agriculture Economic Research Service. January 10, 2025. https://www.ers.usda.gov/topics/food-nutrition-assistance/food-security-in-the-us/definitions-of-food-security
Active military and veteran food insecurity. Feeding America. Accessed September 22, 2025. https://www.feedingamerica.org/hunger-in-america/food-insecurity-in-veterans
Pradun S. Find access to stop food insecurity in your community. VA News. September 19, 2025. Accessed September 22, 2025. https://news.va.gov/142733/find-access-stop-food-insecurity-your-community/
Cohen AJ, Dosa DM, Rudolph JL, et al. Risk factors for veteran food insecurity: findings from a National US Department of Veterans Affairs Food Insecurity Screener. Public Health Nutr. 2022;25:819-828. doi:10.1017/S1368980021004584
Chen C. VA and Rockefeller Foundation collaborate to access food for Veterans. VA News. September 5, 2023. Accessed September 22, 2025. https://news.va.gov/123228/va-rockefeller-foundation-expand-access-to-food/
American Hunger Games: Food Insecurity Among the Military and Veterans
American Hunger Games: Food Insecurity Among the Military and Veterans

Updates in Multiple Sclerosis Imaging
Updates in Multiple Sclerosis Imaging
Multiple sclerosis (MS) is a complex, chronic immune-mediated disease of the central nervous system characterized by focal inflammation, demyelination, and neurodegeneration. Magnetic resonance imaging (MRI), first incorporated into the McDonald Criteria for the diagnosis of MS in 2001, is an integral tool in the diagnosis, prognosis, and therapeutic monitoring of people with MS (PwMS).1
MRI research in MS is rapidly expanding and offers insights into the pathophysiology of MS with important implications for the routine clinical care of PwMS. At the Consortium of Multiple Sclerosis Centers 2024 Annual Meeting, the US Department of Veterans Affairs (VA) MS Centers of Excellence hosted an educational symposium highlighting MRI biomarkers in MS, including T2-lesions, chronic black holes (cBHs), brain atrophy, paramagnetic rim lesions (PRLs), and the central vein sign (CVS). The symposium also provided a brief overview of quantitative MRI techniques used to characterize MS lesion severity and research applications of these techniques. This clinical review summarizes the main points of that symposium with the goal of introducing key concepts to federal health care practitioners caring for PwMS.
MRI Biomarkers in MS
T2-lesions, Chronic Black Holes, and Brain Atrophy
Focal immune-mediated inflammation and demyelination in MS may be detected by MRI as hyperintense foci on T2-weighted (T2-w) imaging (eg, T2-w turbo spin echo or T2-w fluid attenuated inversion recovery sequences). These T2-lesions, critical for diagnosing MS, are typically ovoid and occur in the periventricular, juxtacortical, infratentorial spinal cord white matter (Figure 1A). T2-lesion number and volume show some association with disability and optic nerve.
Wattjes et al highlight 2 cases to demonstrate this point: a man aged 52 years with MS for 23 years and a woman aged 50 years with MS for 11 years. Despite having MS for a much shorter duration, the woman had worse disability due to a higher lesion number and volume.2 T2-lesion volume also impacts disability progression in PwMS. Gauthier et al compared the probability of progression in 3 women, all of whom were aged 39 years and had MS for 6 years. The profile with highest probability of disability progression had the highest quartile of T2-lesion volume.3 T2-lesion volume over 2 years correlates with worse scores on disability metrics such as the MS functional composite, paced auditory serial addition task, and brain volume.4 A 2024 systematic review and meta-analysis demonstrated that T2-lesion volume is significantly correlated with clinical disability in PwMS.5
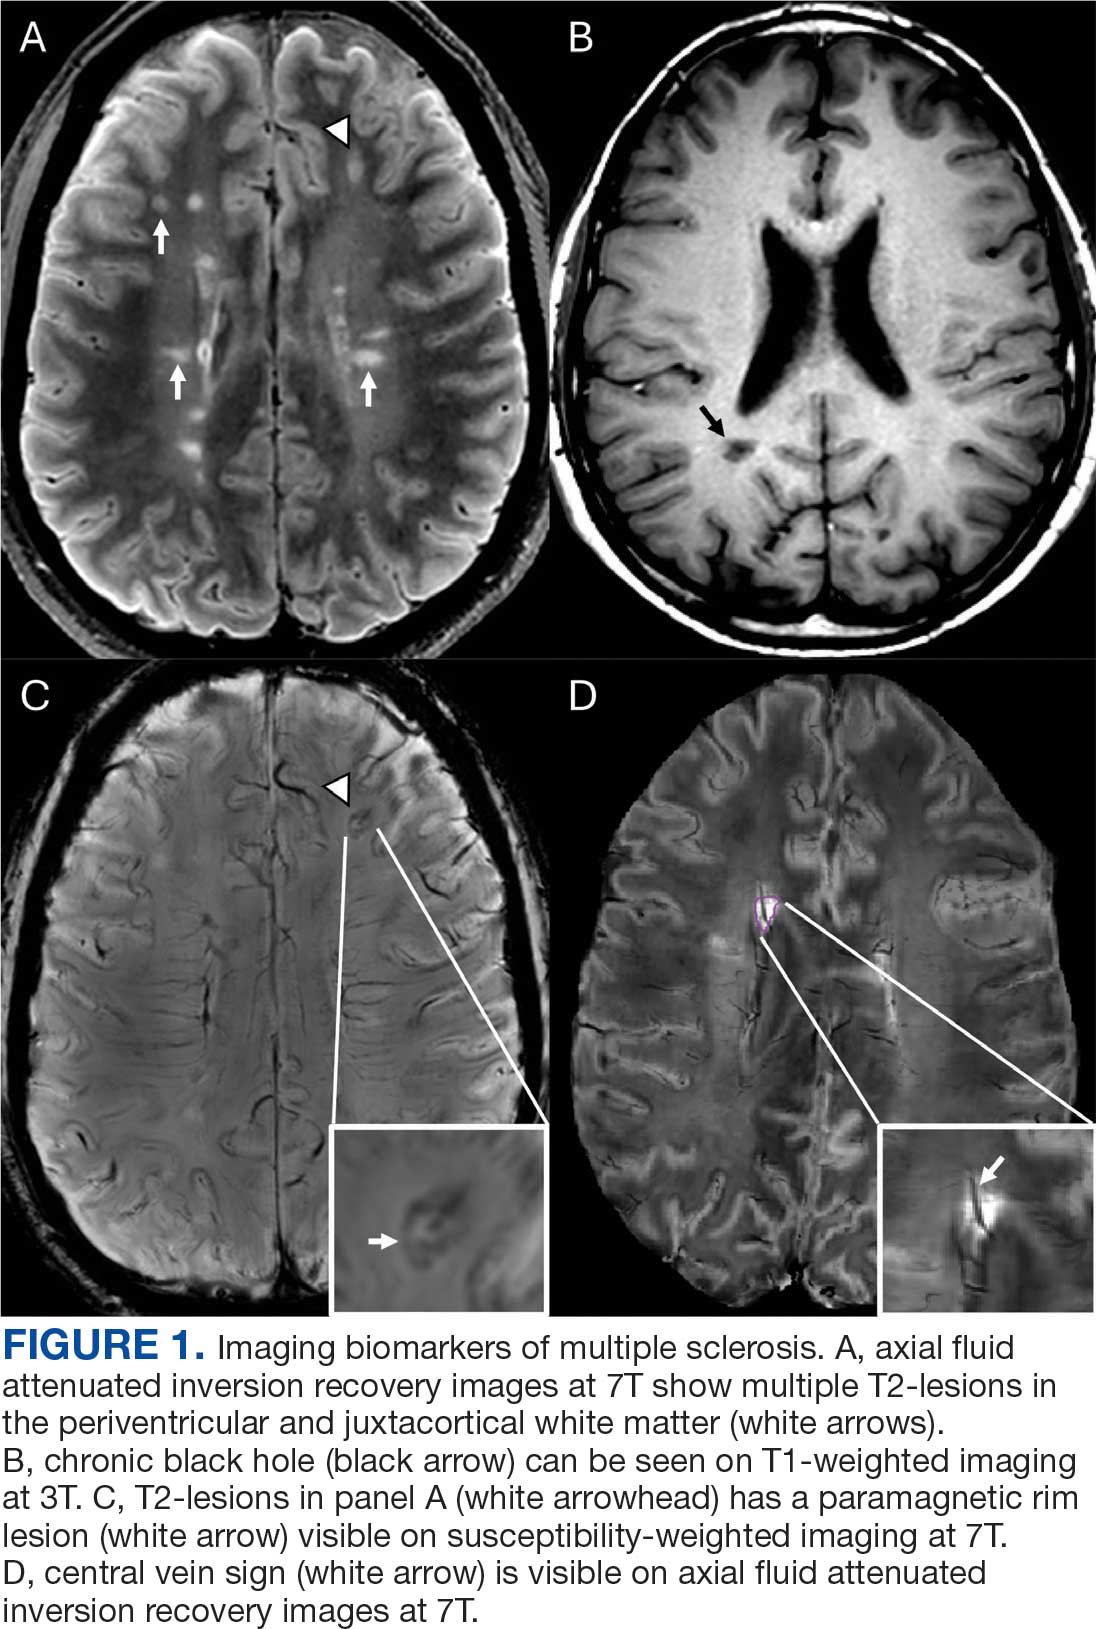
Select T2-lesions are also hypointense on T1-w spin echo images and are known as cBHs (Figure 1B). Histologically, T2-lesions with cBHs have more severe architectural disruption than those without cBHs.6 cBH number and volume are significantly correlated with disability, regardless of the degree of hypointensity on T1-w imaging.5,7 A 10-year longitudinal study demonstrated that cBHs were associated with disease progression after 5 years while T2-lesion volume was not, indicating that cBHs may be a more accurate predictor of disability.8
Brain atrophy, another imaging biomarker of MS, affects both the cerebral white and gray matter. White matter fraction (the volume of white matter relative to the intracranial compartment volume) and gray matter fraction (the volume of gray matter relative to the intracranial compartment) are significantly lower among PwMS compared with healthy controls. In addition, gray matter fraction is lower among patients with primary and secondary progressive MS compared with those with relapsing-remitting MS, clinically isolated syndrome (CIS), and radiologically isolated syndrome (RIS). Gray matter fraction is also correlated with several motor and cognitive disability indices.9
Paramagnetic Rim Lesions
Neurologic worsening in PwMS occurs by 2 distinct mechanisms: relapse-associated worsening, a stepwise worsening of symptoms due to incomplete recovery following a relapse; and progression independent of relapse activity (PIRA), which is an irreversible neurologic deterioration in the absence of clinical or radiological relapses.10 PIRA is associated with neurodegeneration and predominates in both primary and secondary progressive MS. However, recent data demonstrated that PIRA may contribute to as much as 50% of disability worsening in relapsing MS and occurs early in the RMS disease course.10,11 Current high-efficacy disease modifying therapy, such as ocrelizumab, are extraordinarily successful at preventing focal inflammation and relapses but are less effective for preventing the slow march of disability progression characterizing PIRA.12,13 The prevention of PIRA is therefore an unmet treatment need.
Chronic active lesions (CALs) are an important driver of PIRA. When an acute gadolinium-enhancing lesion develops in PwMS, there are 3 possible fates of this lesion. The lesion may become chronically inactive, remyelinate, or transition to CALs.14 The histopathologic signature of CALs is compartmentalized, low-grade inflammation behind an intact blood-brain barrier with evidence of both active and chronic components.15 CALs may be found not only in cerebral white matter but also in the cerebral cortex and spinal cord.16,17 Combined MRI and histopathological studies have shown that iron-laden microglia/macrophages can be detected by susceptibility-based MRI as a rim of paramagnetic signal surrounding select T2-lesions.19 These PRLs represent an in vivo imaging biomarker of CAL (Figure 1C). According to the North American Imaging in MS Cooperative (NAIMS) consensus criteria, a PRL must surround at least two-thirds of the outer edge of a T2-lesion, be visible in ≥ 2 consecutive MRI slices, and cannot be contrast enhancing.20
PRLs can be visualized on multiple susceptibility-based imaging methods, including multiecho derived R2*/T2*, phase maps, susceptibility-weighted imaging, and quantitative susceptibility mapping.21-23 Retrospective analyses have shown no significant differences in sensitivity across these imaging modalities.24 Although first visualized with 7T MRI, PRLs may also be detected by 1.5T and 3T MRI with comparable sensitivities.25-27 However, there remains a significant knowledge gap regarding the accuracy of each imaging modality. Systematic, prospectively designed studies are needed to ascertain the comparative value of each method.
The presence of PRL is a poor prognostic indicator. PwMS without PRLs have higher levels of disability, are more likely to progress, and demonstrate greater gray matter atrophy and cognitive dysfunction when compared with PwMS with PRLs.27-29 Lesions with PRL tend to slowly expand, exhibit greater demyelination, and have diminished white matter integrity.21,22,30
PRLs may also be used as a diagnostic tool. PRLs are highly specific for MS/CIS with a 99.7% specificity and 98.4% positive predictive value, although the sensitivity is limited to 24%.31 Taken together, these data indicate that the presence of a PRL substantially increases the likelihood of an MS/CIS diagnosis, whereas the absence of a PRL does not exclude these diagnoses.
Several unanswered questions remain: Why do select acute MS lesions transition to CALs? How may investigators utilize PRLs as outcome measures in future clinical trials? How should PRLs be incorporated into the routine care of PwMS? As the role of this imaging biomarker is clarified both in the research and clinical settings, clinicians caring for PwMS can expect to increasingly encounter the topic of PRLs in the near future.
Central Vein Sign
A CVS is defined by the presence of a central vessel within a demyelinating plaque (Figure 1D). As early as the 1820s, MS plaques on gross pathology were noted to follow the course of a vessel. Early histological studies reported that up to 91% of MS plaques had a central vessel present.32 Lesion formation is dependent on the movement of lymphocytes and other inflammatory cells from the systemic circulation across the blood brain barrier into the perivascular space, a privileged site where immune cells interact with antigen presenting cells to launch an inflammatory cascade and eventual demyelinating lesion.33
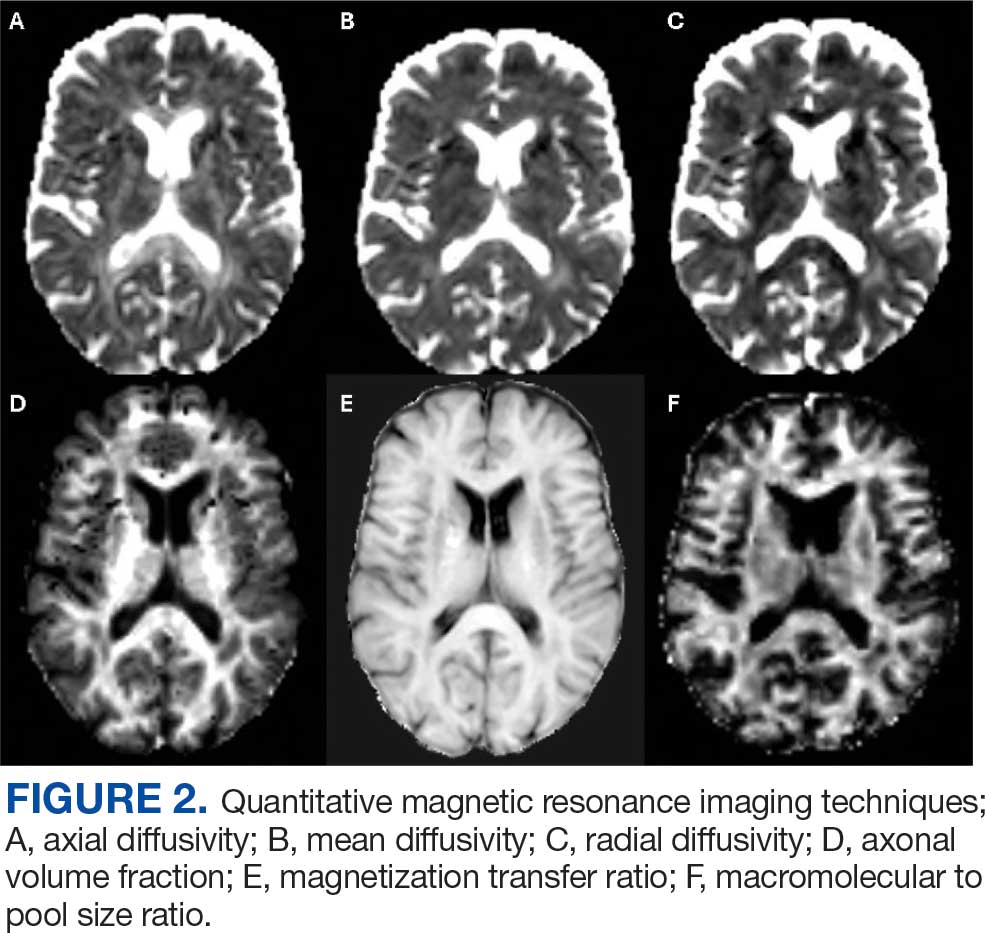
CVS can be visualized on 1.5T, 3T and 7T MRI. However, 7T MRI is superior to 3T in the detection of CVS, with 85% of MS lesions having CVS visible compared with 45% on 3T.34 With advances in 7T MRI, fluid attenuated inversion recovery and T2* susceptibility, weighted sequences can be overlaid, allowing simultaneous visualization of the vessel and the demyelinating lesion. With higher density of parenchymal veins in the periventricular regions, the CVS is most seen in lesions of this territory but can also be present in juxtacortical, thalamic and infratentorial lesions with decreasing prevalence as these approach the cortex.35
MS lesions are more likely to have CVS than T2 hyperintense white matter lesions of other causes, with a large study reporting 78% of MS lesions were CVS positive. Further, CVS positive lesions can be found across all MS phenotypes including relapsing remitting, primary progressive, and secondary progressive.35 The CVS is also specific to MS lesions and is an effective tool for differentiating MS lesions from other common causes of T2 hyperintense lesions including chronic ischemic white matter disease,36 migraines,37 neuromyelitis optica spectrum disorders,38,39 Susac syndrome,40 and systemic autoimmune diseases (Behcet disease, systemic lupus erythematosus, and antiphospholipid syndrome).41
With CVS emerging as a promising radiographic biomarker for MS, NAIMS issued a consensus statement on necessary properties of a CVS. These criteria included appearance of a thin hypointense line or small dot, visualized in ≥ 2 perpendicular planes, with diameter < 2 mm, and running partially or entirely through the center of the lesion. They also clarified that lesions < 3 mm, confluent lesions, lesions with multiple vessels present or poorly visualized lesions were excluded.42
A shared CVS definition was a necessary step toward routine use of CVS as a radiographic biomarker and its incorporation in the 2024 revised McDonald criteria.43 Remaining limitations including 7T MRI is primarily available in research settings and the lack of consensus on a diagnostic threshold. There have been many proposed methods, including a 40% cut off,44 60% cut off,45 and Select 3* or Select 6* methods.46 The goal of each method is to optimize sensitivity and specificity while not compromising efficiency of MRI review for both neurologists and radiologists.
The CVS has significant potential as a radiographic biomarker for MS and may allow the early stages of MS to be differentiated from other common causes of white matter lesions on MRI. However, it remains unclear whether CVS holds prognostic value for patients, if CVS is suggestive of differing underlying pathology, or if the presence of a CVS is dynamic over time. Progress in these areas is anticipated as CVS is incorporated into routine clinical practice.
Quantitative MRI Techniques
In the research setting, several imaging modalities can be used to quantify the degree of microstructural injury in PwMS. The goal of these methods is to identify and quantify myelin and axonal damage, the major drivers of neurodegeneration. Among these methods, diffusion-based imaging is a measure of the amount of diffusion or fluid mobility across the tissues of the brain.47 Diffusion-weighted imaging (DWI) yields several parametric maps including axial diffusivity (AD), radial diffusivity (RD), and mean diffusivity (Figure 2 A, B, and C). These parametric maps provide information on different directions of water molecules’ movements. Myelin surrounds the axons preventing water molecules diffusion perpendicular to axons (RD) while axonal content prevents water diffusion horizontal to the axons (AD).Thus, AD is considered more specific to axonal injury, whereas RD is specific to myelin content.48 A higher value of any of these metrics is associated with a higher degree of tissue injury.
Although sensitive to axonal and myelin injury, AD and RD computed from single b-shell DWI experience several limitations including being affected by nonpathologic factors such as fiber orientation, distribution, and crossing, and by various nonmyelin specific pathologies including fluid accumulation during inflammation, myelin sheath thickness, and axonal intactness.48 Several multi b-shell methods have been developed to overcome diffusion imaging limitations. For example, work at the Nashville VA MS Center of Excellence has focused on the use of the multicompartment diffusion MRI with spherical mean technique (SMT). This method removes the orientation dependency of the diffusion MRI signal, increasing the signal-to-noise ratio and reducing biases from fiber undulation, crossing, and dispersion.49 SMT generates the apparent axonal volume fraction (Vax), which is a direct measure of axonal integrity with lower values indicating lower axonal content and higher tissue destruction (Figure 2D). Vax was previously validated in MS as a measure of axonal integrity.49
In terms of myelin, several other specific measures have been developed. Magnetization transfer ratio (MTR) is another measure of tissue integrity that has been validated as a measure of tissue injury in MS (Figure 2E).50,51 Zheng et al found that the percentage of lesions with low MTR was significantly higher among patients whose disease disability progressed compared with patients who did not.52Selective inversion recovery with quantitative magnetization transfer (SIR-qMT) was developed to account for the limitations of MTR, including its sensitivity to edema and axonal density.52 Germane to myelin measurements, SIR-qMT generates the macromolecular to free size ratio (PSR). PSR represents the ratio of protons bound to macromolecules (myelin) to free protons (Figure 2F). PSR is considered a marker of myelin integrity, with lower values correlating with disability severity and indicating higher tissue damage and lower myelin content. Previous studies from the Nashville VA MS Center of Excellence validated the use of SIR-qMT among patients with MS, CIS, RIS, and healthy controls.53
Quantitative MRI has several research applications in the field of MS. We demonstrated that PRL harbor a higher degree of myelin injury indicated by PSR compared with rimless lesions.54 These MRI techniques are also helpful to investigate tissues surrounding the lesions, called normal appearing white matter (NAWM). Using quantitative MRI techniques such as MTR,52 PSR,53 and Vax,49 investigators have demonstrated that NAWM is injured in PwMS, and proximal NAWM may have higher degree of tissue damage compared with distant NAWM.55
Anticipated Innovations and Challenges
In the field of quantitative MRI, several new techniques are being adopted. Researchers are developing techniques such as myelin water fraction which evaluates the interaction between water and protons to measure myelin content. This is considered an advancement as it takes into account edema resulting from MS injury.56 Another example is multicompartment diffusion imaging, such as standard model imaging,57 and neurite orientation dispersion and density imaging,58 which considers water as an additional compartment compared with the SMT derived Vax. For PRL identification, more advanced methodologic techniques are developing such quantitative susceptibility mapping (QSM), which can detect iron deposits that surround the lesions with relatively high sensitivity and specificity of identifying PRL.59
Despite these innovations, several challenges remain before possible incorporation into the clinical setting. These limitations include longer scan time, familiarity of clinicians in using these maps, higher financial cost, and the necessity of advanced imaging processing skills. Artificial intelligence is a promising tool that may overcome these challenges through creating automated processing pipelines and developing synthetic maps without the need for additional acquisition.60
Conclusions
MRI is the most important tool for diagnosing and treating PwMS. Imaging biomarkers such as T2-lesions, cBHs, brain atrophy, PRLs, and CVS provide insight into the disease’s pathogenesis and are invaluable for the accurate diagnosis and prognostication of MS. Quantitative MRI techniques, while not available in the clinical setting, are important tools for translational research that may help direct the development of future therapeutics. In the near future, clinicians caring for PwMS should expect to encounter these imaging biomarkers more frequently in the clinical setting, especially with the inclusion of PRLs and CVS in the next iteration of the McDonald diagnostic criteria.
McDonald WI, Compston A, Edan G, et al. Recommended diagnostic criteria for multiple sclerosis: guidelines from the International Panel on the diagnosis of multiple sclerosis. Ann Neurol. 2001;50:121-127. doi:10.1002/ana.1032
Wattjes MP, Steenwijk MD, Stangel M. MRI in the diagnosis and monitoring of multiple sclerosis: an update. Clin Neuroradiol. 2015;25:157-165. doi:10.1007/s00062-015-0430-y
Gauthier SA, Mandel M, Guttmann CR, et al. Predicting short-term disability in multiple sclerosis. Neurology. 2007;68:2059-2065.doi:10.1212/01.wnl.0000264890.97479.b1
Rudick RA, Lee JC, Simon J, Fisher E. Significance of T2 lesions in multiple sclerosis: a 13-year longitudinal study. Ann Neurol. 2006;60:236-242. doi:10.1002/ana.20883
Nabizadeh F, Zafari R, Mohamadi M, et al. MRI features and disability in multiple sclerosis: a systematic review and meta-analysis. J Neuroradiol. 2024;51:24-37. doi:10.1016/j.neurad.2023.11.007
Bagnato F, Jeffries N, Richert ND, et al. Evolution of T1 black holes in patients with multiple sclerosis imaged monthly for 4 years. Brain. 2003;126:1782-1789. doi:10.1093/brain/awg182
Jacobsen C, Hagemeier J, Myhr KM, et al. Brain atrophy and disability progression in multiple sclerosis patients: a 10-year follow-up study. J Neurol Neurosurg Psychiatry. 2014;85:1109-1115. doi:10.1136/jnnp-2013-306906
Rovaris M, Gass A, Bammer R, et al. Diffusion MRI in multiple sclerosis. Neurology. 2005;65:1526-1532. doi:10.1212/01.wnl.0000184471.83948.e0
Fisniku LK, Chard DT, Jackson JS, et al. Gray matter atrophy is related to long-term disability in multiple sclerosis. Ann Neurol. 2008;64:247-254. doi:10.1002/ana.21423
Lublin FD, Häring DA, Ganjgahi H, et al. How patients with multiple sclerosis acquire disability. Brain. 2022;145:3147-3161. doi:10.1093/brain/awac016
Kappos L, Wolinsky JS, Giovannoni G, et al. Contribution of relapse-independent progression vs relapse-associated worsening to overall confirmed disability accumulation in typical relapsing multiple sclerosis in a pooled analysis of 2 randomized clinical trials. JAMA Neurol. 2020;77:1132-1140. doi:10.1001/jamaneurol.2020.1568
Hauser SL, Bar-Or A, Comi G, et al. Ocrelizumab versus interferon beta-1a in relapsing multiple sclerosis. N Engl J Med. 2017;376:221-234. doi:10.1056/NEJMoa1601277
Montalban X, Hauser SL, Kappos L, et al. Ocrelizumab versus placebo in primary progressive multiple sclerosis. N Engl J Med. 2017;376:209-220. doi:10.1056/NEJMoa1606468
Prineas JW, Kwon EE, Cho ES, et al. Immunopathology of secondary-progressive multiple sclerosis. Ann Neurol. 2001;50:646-657. doi:10.1002/ana.1255
Kuhlmann T, Ludwin S, Prat A, Antel J, Brück W, Lassmann H. An updated histological classification system for multiple sclerosis lesions. Acta Neuropathol. 2017;133:13-24. doi:10.1007/s00401-016-1653-y
Pitt D, Boster A, Pei W, et al. Imaging cortical lesions in multiple sclerosis with ultra-high-field magnetic resonance imaging. Arch Neurol. 2010;67:812-818. doi:10.1001/archneurol.2010.148
Gilmore CP, Geurts JJ, Evangelou N, et al. Spinal cord grey matter lesions in multiple sclerosis detected by post-mortem high field MR imaging. Mult Scler. 2009;15:180-188. doi:10.1177/1352458508096876
Lassmann H, Brück W, Lucchinetti CF. The immunopathology of multiple sclerosis: an overview. Brain Pathol. 2007;17:210-218. doi:10.1111/j.1750-3639.2007.00064.x
Bagnato F, Hametner S, Yao B, et al. Tracking iron in multiple sclerosis: a combined imaging and histopathological study at 7 Tesla. Brain. 2011;134:3602-3615. doi:10.1093/brain/awr278
Bagnato F, Sati P, Hemond CC, et al. Imaging chronic active lesions in multiple sclerosis: a consensus statement. Brain. 2024;147:2913-2933. doi:10.1093/brain/awae013
Dal-Bianco A, Grabner G, Kronnerwetter C, et al. Slow expansion of multiple sclerosis iron rim lesions: pathology and 7 T magnetic resonance imaging. Acta Neuropathol. 2017;133:25-42. doi:10.1007/s00401-016-1636-z
Absinta M, Sati P, Schindler M, et al. Persistent 7-tesla phase rim predicts poor outcome in new multiple sclerosis patient lesions. J Clin Invest. 2016;126:2597-2609. doi:10.1172/JCI86198
Gillen KM, Mubarak M, Park C, et al. QSM is an imaging biomarker for chronic glial activation in multiple sclerosis lesions. Ann Clin Transl Neurol. 2021;8:877-886. doi:10.1002/acn3.51338
Ng Kee Kwong KC, Mollison D, Meijboom R, et al. The prevalence of paramagnetic rim lesions in multiple sclerosis: a systematic review and meta-analysis. PLoS One. 2021;16:e0256845. doi:10.1371/journal.pone.0256845
Absinta M, Sati P, Fechner A, et al. Identification of chronic active multiple sclerosis lesions on 3T MRI. AJNR Am J Neuroradiol. 2018;39:1233-1238. doi:10.3174/ajnr.A5660
Hemond CC, Reich DS, Dundamadappa SK. Paramagnetic rim lesions in multiple sclerosis: comparison of visualization at 1.5-T and 3-T MRI. AJR Am J Roentgenol. 2022;219:120-131. doi:10.2214/AJR.21.26777
Altokhis AI, Hibbert AM, Allen CM, et al. Longitudinal clinical study of patients with iron rim lesions in multiple sclerosis. Mult Scler. 2022;28:2202-2211. doi:10.1177/13524585221114750
Choi S, Lake S, Harrison DM. Evaluation of the blood-brain barrier, demyelination, and neurodegeneration in paramagnetic rim lesions in multiple sclerosis on 7 tesla MRI. J Magn Reson Imaging. 2024;59:941-951. doi:10.1002/jmri.28847
Kazimuddin HF, Wang J, Hernandez B, et al. Paramagnetic rim lesions and their relationship with neurodegeneration and clinical disability at the time of multiple sclerosis diagnosis. Poster presented at: 2024 Americas Committee for Treatment and Research in Multiple Sclerosis (ACTRIMS) Forum; February 26-March 2; West Palm Beach, FL.
Rohm Z, Koch C, Kazimuddin H, et al. Longitudinal characterization of paramagnetic rim lesions in early multiple sclerosis. Poster presented at: 2024 Americas Committee for Treatment and Research in Multiple Sclerosis (ACTRIMS) Forum; February 26-March 2; West Palm Beach, FL.
Meaton I, Altokhis A, Allen CM, et al. Paramagnetic rims are a promising diagnostic imaging biomarker in multiple sclerosis. Mult Scler. 2022;28:2212-2220. doi:10.1177/13524585221118677
Fog T. On the vessel-plaque relationships in the brain in multiple sclerosis. Acta Neurol Scand Suppl. 1964;40:9-15.
Ineichen BV, Okar SV, Proulx ST, et al. Perivascular spaces and their role in neuroinflammation. Neuron. 2022;110:3566-3581. doi:10.1016/j.neuron.2022.10.024
Tallantyre EC, Morgan PS, Dixon JE, et al. A comparison of 3T and 7T in the detection of small parenchymal veins within MS lesions. Invest Radiol. 2009;44:491-494. doi:10.1097/RLI.0b013e3181b4c144
Kilsdonk ID, Lopez-Soriano A, Kuijer JP, et al. Morphological features of MS lesions on FLAIR* at 7 T and their relation to patient characteristics. J Neurol. 2014;261:1356-1364. doi:10.1007/s00415-014-7351-6
Tallantyre EC, Dixon JE, Donaldson I, et al. Ultra-high-field imaging distinguishes MS lesions from asymptomatic white matter lesions. Neurology. 2011;76:534-539. doi:10.1212/WNL.0b013e31820b7630
Solomon AJ, Schindler MK, Howard DB, et al. “Central vessel sign” on 3T FLAIR* MRI for the differentiation of multiple sclerosis from migraine. Ann Clin Transl Neurol. 2015;3:82-87. doi:10.1002/acn3.273
Sinnecker T, Dörr J, Pfueller CF, et al. Distinct lesion morphology at 7-T MRI differentiates neuromyelitis optica from multiple sclerosis. Neurology. 2012;79:708-714. doi:10.1212/WNL.0b013e3182648bc8
Kister I, Herbert J, Zhou Y, Ge Y. Ultrahigh-field MR (7 T) imaging of brain lesions in neuromyelitis optica. Mult Scler Int. 2013;2013:398259. doi:10.1155/2013/398259
Wuerfel J, Sinnecker T, Ringelstein EB, et al. Lesion morphology at 7 Tesla MRI differentiates Susac syndrome from multiple sclerosis. Mult Scler. 2012;18:1592-1599. doi:10.1177/1352458512441270
Massacesi L. Perivenular distribution of white matter lesions evaluated by MRI can differentiate MS lesions from inflammatory small vessel diseases. Eur J Neurol. 2016;23:86. doi:10.1212/WNL.86.16_supplement.P6.121
Sati P, Oh J, Constable RT, et al. The central vein sign and its clinical evaluation for the diagnosis of multiple sclerosis: a consensus statement from the North American Imaging in Multiple Sclerosis Cooperative. Nat Rev Neurol. 2016;12:714-722. doi:10.1038/nrneurol.2016.166
Montalban X, Lebrun-Frénay C, Oh J, et al. Diagnosis of multiple sclerosis: 2024 revisions of the McDonald criteria. Lancet Neurol. 2025;24:850-865. doi:10.1016/S1474-4422(25)00270-4
Mistry N, Dixon J, Tallantyre E, et al. Central veins in brain lesions visualized with high-field magnetic resonance imaging: a pathologically specific diagnostic biomarker for inflammatory demyelination in the brain. JAMA Neurol. 2013;70:623-628. doi:10.1001/jamaneurol.2013.1405
Campion T, Smith RJP, Altmann DR, et al. FLAIR* to visualize veins in white matter lesions: a new tool for the diagnosis of multiple sclerosis? Eur Radiol. 2017;27:4257-4263. doi:10.1007/s00330-017-4822-z
Solomon AJ, Watts R, Ontaneda D, et al. Diagnostic performance of central vein sign for multiple sclerosis with a simplified three-lesion algorithm. Mult Scler. 2018;24:750-757. doi:10.1177/1352458517726383
Cercignani M, Bozzali M, Iannucci G, Comi G, Filippi M. Intra-voxel and inter-voxel coherence in patients with multiple sclerosis assessed using diffusion tensor MRI. J Neurol. 2002;249:875-883. doi:10.1007/s00415-002-0752-y
Song SK, Yoshino J, Le TQ, et al. Demyelination increases radial diffusivity in corpus callosum of mouse brain. Neuroimage. 2005;26:132-140. doi:10.1016/j.neuroimage.2005.01.028
Bagnato F, Franco G, Li H, et al. Probing axons using multi-compartmental diffusion in multiple sclerosis. Ann Clin Transl Neurol. 2019;6:1595-1605. doi:10.1002/acn3.50836
Filippi M, Cercignani M, Inglese M, et al. Diffusion tensor magnetic resonance imaging in multiple sclerosis. Neurology. 2001;56:304-311. doi:10.1212/wnl.56.3.304
Bagnato F. Clinical application of magnetization transfer imaging. In: Advanced Neuro MR Techniques and Applications. Elsevier; 2022:403-417. doi:10.1016/B978-0-12-822479-3.00041-5
Zheng Y, Lee JC, Rudick R, Fisher E. Long-term magnetization transfer ratio evolution in multiple sclerosis white matter lesions. J Neuroimaging. 2018;28:191-198. doi:10.1111/jon.12480
Bagnato F, Hametner S, Franco G, et al. Selective inversion recovery quantitative magnetization transfer brain MRI at 7T: clinical and postmortem validation in multiple sclerosis. J Neuroimaging. 2018;28:380-388. doi:10.1111/jon.12511
Clarke MA, Cheek R, Hernandez B, et al. Paramagnetic rim lesions and the central vein sign: characterizing multiple sclerosis imaging markers. J Neuroimaging. 2024;34:86-94. doi:10.1111/jon.13173
Clarke MA, Lakhani DA, Wen S, et al. Perilesional neurodegenerative injury in multiple sclerosis: relation to focal lesions and impact on disability. Mult Scler Relat Disord. 2021;49:102738. doi:10.1016/j.msard.2021.102738
Laule C, Moore GRW. Myelin water imaging to detect demyelination and remyelination and its validation in pathology. Brain Pathol. 2018;28:750-764. doi:10.1111/bpa.12645
Coelho S, Baete SH, Lemberskiy G, et al. Reproducibility of the standard model of diffusion in white matter on clinical MRI systems. Neuroimage. 2022;257:119290. doi:10.1016/j.neuroimage.2022.119290
Novikov DS, Veraart J, Jelescu IO, et al. Rotationally-invariant mapping of scalar and orientational metrics of neuronal microstructure with diffusion MRI. Neuroimage. 2018;174:518-538. doi:10.1016/j.neuroimage.2018.03.006
Langkammer C, Liu T, Khalil M, et al. Quantitative susceptibility mapping in multiple sclerosis. Radiology. 2013;267:551-559. doi:10.1148/radiol.12120707
Collorone S, Coll L, Lorenzi M, et al. Artificial intelligence applied to MRI data to tackle key challenges in multiple sclerosis. Mult Scler. 2024;30:767-784. doi:10.1177/13524585241249422
Multiple sclerosis (MS) is a complex, chronic immune-mediated disease of the central nervous system characterized by focal inflammation, demyelination, and neurodegeneration. Magnetic resonance imaging (MRI), first incorporated into the McDonald Criteria for the diagnosis of MS in 2001, is an integral tool in the diagnosis, prognosis, and therapeutic monitoring of people with MS (PwMS).1
MRI research in MS is rapidly expanding and offers insights into the pathophysiology of MS with important implications for the routine clinical care of PwMS. At the Consortium of Multiple Sclerosis Centers 2024 Annual Meeting, the US Department of Veterans Affairs (VA) MS Centers of Excellence hosted an educational symposium highlighting MRI biomarkers in MS, including T2-lesions, chronic black holes (cBHs), brain atrophy, paramagnetic rim lesions (PRLs), and the central vein sign (CVS). The symposium also provided a brief overview of quantitative MRI techniques used to characterize MS lesion severity and research applications of these techniques. This clinical review summarizes the main points of that symposium with the goal of introducing key concepts to federal health care practitioners caring for PwMS.
MRI Biomarkers in MS
T2-lesions, Chronic Black Holes, and Brain Atrophy
Focal immune-mediated inflammation and demyelination in MS may be detected by MRI as hyperintense foci on T2-weighted (T2-w) imaging (eg, T2-w turbo spin echo or T2-w fluid attenuated inversion recovery sequences). These T2-lesions, critical for diagnosing MS, are typically ovoid and occur in the periventricular, juxtacortical, infratentorial spinal cord white matter (Figure 1A). T2-lesion number and volume show some association with disability and optic nerve.
Wattjes et al highlight 2 cases to demonstrate this point: a man aged 52 years with MS for 23 years and a woman aged 50 years with MS for 11 years. Despite having MS for a much shorter duration, the woman had worse disability due to a higher lesion number and volume.2 T2-lesion volume also impacts disability progression in PwMS. Gauthier et al compared the probability of progression in 3 women, all of whom were aged 39 years and had MS for 6 years. The profile with highest probability of disability progression had the highest quartile of T2-lesion volume.3 T2-lesion volume over 2 years correlates with worse scores on disability metrics such as the MS functional composite, paced auditory serial addition task, and brain volume.4 A 2024 systematic review and meta-analysis demonstrated that T2-lesion volume is significantly correlated with clinical disability in PwMS.5
Select T2-lesions are also hypointense on T1-w spin echo images and are known as cBHs (Figure 1B). Histologically, T2-lesions with cBHs have more severe architectural disruption than those without cBHs.6 cBH number and volume are significantly correlated with disability, regardless of the degree of hypointensity on T1-w imaging.5,7 A 10-year longitudinal study demonstrated that cBHs were associated with disease progression after 5 years while T2-lesion volume was not, indicating that cBHs may be a more accurate predictor of disability.8
Brain atrophy, another imaging biomarker of MS, affects both the cerebral white and gray matter. White matter fraction (the volume of white matter relative to the intracranial compartment volume) and gray matter fraction (the volume of gray matter relative to the intracranial compartment) are significantly lower among PwMS compared with healthy controls. In addition, gray matter fraction is lower among patients with primary and secondary progressive MS compared with those with relapsing-remitting MS, clinically isolated syndrome (CIS), and radiologically isolated syndrome (RIS). Gray matter fraction is also correlated with several motor and cognitive disability indices.9
Paramagnetic Rim Lesions
Neurologic worsening in PwMS occurs by 2 distinct mechanisms: relapse-associated worsening, a stepwise worsening of symptoms due to incomplete recovery following a relapse; and progression independent of relapse activity (PIRA), which is an irreversible neurologic deterioration in the absence of clinical or radiological relapses.10 PIRA is associated with neurodegeneration and predominates in both primary and secondary progressive MS. However, recent data demonstrated that PIRA may contribute to as much as 50% of disability worsening in relapsing MS and occurs early in the RMS disease course.10,11 Current high-efficacy disease modifying therapy, such as ocrelizumab, are extraordinarily successful at preventing focal inflammation and relapses but are less effective for preventing the slow march of disability progression characterizing PIRA.12,13 The prevention of PIRA is therefore an unmet treatment need.
Chronic active lesions (CALs) are an important driver of PIRA. When an acute gadolinium-enhancing lesion develops in PwMS, there are 3 possible fates of this lesion. The lesion may become chronically inactive, remyelinate, or transition to CALs.14 The histopathologic signature of CALs is compartmentalized, low-grade inflammation behind an intact blood-brain barrier with evidence of both active and chronic components.15 CALs may be found not only in cerebral white matter but also in the cerebral cortex and spinal cord.16,17 Combined MRI and histopathological studies have shown that iron-laden microglia/macrophages can be detected by susceptibility-based MRI as a rim of paramagnetic signal surrounding select T2-lesions.19 These PRLs represent an in vivo imaging biomarker of CAL (Figure 1C). According to the North American Imaging in MS Cooperative (NAIMS) consensus criteria, a PRL must surround at least two-thirds of the outer edge of a T2-lesion, be visible in ≥ 2 consecutive MRI slices, and cannot be contrast enhancing.20
PRLs can be visualized on multiple susceptibility-based imaging methods, including multiecho derived R2*/T2*, phase maps, susceptibility-weighted imaging, and quantitative susceptibility mapping.21-23 Retrospective analyses have shown no significant differences in sensitivity across these imaging modalities.24 Although first visualized with 7T MRI, PRLs may also be detected by 1.5T and 3T MRI with comparable sensitivities.25-27 However, there remains a significant knowledge gap regarding the accuracy of each imaging modality. Systematic, prospectively designed studies are needed to ascertain the comparative value of each method.
The presence of PRL is a poor prognostic indicator. PwMS without PRLs have higher levels of disability, are more likely to progress, and demonstrate greater gray matter atrophy and cognitive dysfunction when compared with PwMS with PRLs.27-29 Lesions with PRL tend to slowly expand, exhibit greater demyelination, and have diminished white matter integrity.21,22,30
PRLs may also be used as a diagnostic tool. PRLs are highly specific for MS/CIS with a 99.7% specificity and 98.4% positive predictive value, although the sensitivity is limited to 24%.31 Taken together, these data indicate that the presence of a PRL substantially increases the likelihood of an MS/CIS diagnosis, whereas the absence of a PRL does not exclude these diagnoses.
Several unanswered questions remain: Why do select acute MS lesions transition to CALs? How may investigators utilize PRLs as outcome measures in future clinical trials? How should PRLs be incorporated into the routine care of PwMS? As the role of this imaging biomarker is clarified both in the research and clinical settings, clinicians caring for PwMS can expect to increasingly encounter the topic of PRLs in the near future.
Central Vein Sign
A CVS is defined by the presence of a central vessel within a demyelinating plaque (Figure 1D). As early as the 1820s, MS plaques on gross pathology were noted to follow the course of a vessel. Early histological studies reported that up to 91% of MS plaques had a central vessel present.32 Lesion formation is dependent on the movement of lymphocytes and other inflammatory cells from the systemic circulation across the blood brain barrier into the perivascular space, a privileged site where immune cells interact with antigen presenting cells to launch an inflammatory cascade and eventual demyelinating lesion.33
CVS can be visualized on 1.5T, 3T and 7T MRI. However, 7T MRI is superior to 3T in the detection of CVS, with 85% of MS lesions having CVS visible compared with 45% on 3T.34 With advances in 7T MRI, fluid attenuated inversion recovery and T2* susceptibility, weighted sequences can be overlaid, allowing simultaneous visualization of the vessel and the demyelinating lesion. With higher density of parenchymal veins in the periventricular regions, the CVS is most seen in lesions of this territory but can also be present in juxtacortical, thalamic and infratentorial lesions with decreasing prevalence as these approach the cortex.35
MS lesions are more likely to have CVS than T2 hyperintense white matter lesions of other causes, with a large study reporting 78% of MS lesions were CVS positive. Further, CVS positive lesions can be found across all MS phenotypes including relapsing remitting, primary progressive, and secondary progressive.35 The CVS is also specific to MS lesions and is an effective tool for differentiating MS lesions from other common causes of T2 hyperintense lesions including chronic ischemic white matter disease,36 migraines,37 neuromyelitis optica spectrum disorders,38,39 Susac syndrome,40 and systemic autoimmune diseases (Behcet disease, systemic lupus erythematosus, and antiphospholipid syndrome).41
With CVS emerging as a promising radiographic biomarker for MS, NAIMS issued a consensus statement on necessary properties of a CVS. These criteria included appearance of a thin hypointense line or small dot, visualized in ≥ 2 perpendicular planes, with diameter < 2 mm, and running partially or entirely through the center of the lesion. They also clarified that lesions < 3 mm, confluent lesions, lesions with multiple vessels present or poorly visualized lesions were excluded.42
A shared CVS definition was a necessary step toward routine use of CVS as a radiographic biomarker and its incorporation in the 2024 revised McDonald criteria.43 Remaining limitations including 7T MRI is primarily available in research settings and the lack of consensus on a diagnostic threshold. There have been many proposed methods, including a 40% cut off,44 60% cut off,45 and Select 3* or Select 6* methods.46 The goal of each method is to optimize sensitivity and specificity while not compromising efficiency of MRI review for both neurologists and radiologists.
The CVS has significant potential as a radiographic biomarker for MS and may allow the early stages of MS to be differentiated from other common causes of white matter lesions on MRI. However, it remains unclear whether CVS holds prognostic value for patients, if CVS is suggestive of differing underlying pathology, or if the presence of a CVS is dynamic over time. Progress in these areas is anticipated as CVS is incorporated into routine clinical practice.
Quantitative MRI Techniques
In the research setting, several imaging modalities can be used to quantify the degree of microstructural injury in PwMS. The goal of these methods is to identify and quantify myelin and axonal damage, the major drivers of neurodegeneration. Among these methods, diffusion-based imaging is a measure of the amount of diffusion or fluid mobility across the tissues of the brain.47 Diffusion-weighted imaging (DWI) yields several parametric maps including axial diffusivity (AD), radial diffusivity (RD), and mean diffusivity (Figure 2 A, B, and C). These parametric maps provide information on different directions of water molecules’ movements. Myelin surrounds the axons preventing water molecules diffusion perpendicular to axons (RD) while axonal content prevents water diffusion horizontal to the axons (AD).Thus, AD is considered more specific to axonal injury, whereas RD is specific to myelin content.48 A higher value of any of these metrics is associated with a higher degree of tissue injury.
Although sensitive to axonal and myelin injury, AD and RD computed from single b-shell DWI experience several limitations including being affected by nonpathologic factors such as fiber orientation, distribution, and crossing, and by various nonmyelin specific pathologies including fluid accumulation during inflammation, myelin sheath thickness, and axonal intactness.48 Several multi b-shell methods have been developed to overcome diffusion imaging limitations. For example, work at the Nashville VA MS Center of Excellence has focused on the use of the multicompartment diffusion MRI with spherical mean technique (SMT). This method removes the orientation dependency of the diffusion MRI signal, increasing the signal-to-noise ratio and reducing biases from fiber undulation, crossing, and dispersion.49 SMT generates the apparent axonal volume fraction (Vax), which is a direct measure of axonal integrity with lower values indicating lower axonal content and higher tissue destruction (Figure 2D). Vax was previously validated in MS as a measure of axonal integrity.49
In terms of myelin, several other specific measures have been developed. Magnetization transfer ratio (MTR) is another measure of tissue integrity that has been validated as a measure of tissue injury in MS (Figure 2E).50,51 Zheng et al found that the percentage of lesions with low MTR was significantly higher among patients whose disease disability progressed compared with patients who did not.52Selective inversion recovery with quantitative magnetization transfer (SIR-qMT) was developed to account for the limitations of MTR, including its sensitivity to edema and axonal density.52 Germane to myelin measurements, SIR-qMT generates the macromolecular to free size ratio (PSR). PSR represents the ratio of protons bound to macromolecules (myelin) to free protons (Figure 2F). PSR is considered a marker of myelin integrity, with lower values correlating with disability severity and indicating higher tissue damage and lower myelin content. Previous studies from the Nashville VA MS Center of Excellence validated the use of SIR-qMT among patients with MS, CIS, RIS, and healthy controls.53
Quantitative MRI has several research applications in the field of MS. We demonstrated that PRL harbor a higher degree of myelin injury indicated by PSR compared with rimless lesions.54 These MRI techniques are also helpful to investigate tissues surrounding the lesions, called normal appearing white matter (NAWM). Using quantitative MRI techniques such as MTR,52 PSR,53 and Vax,49 investigators have demonstrated that NAWM is injured in PwMS, and proximal NAWM may have higher degree of tissue damage compared with distant NAWM.55
Anticipated Innovations and Challenges
In the field of quantitative MRI, several new techniques are being adopted. Researchers are developing techniques such as myelin water fraction which evaluates the interaction between water and protons to measure myelin content. This is considered an advancement as it takes into account edema resulting from MS injury.56 Another example is multicompartment diffusion imaging, such as standard model imaging,57 and neurite orientation dispersion and density imaging,58 which considers water as an additional compartment compared with the SMT derived Vax. For PRL identification, more advanced methodologic techniques are developing such quantitative susceptibility mapping (QSM), which can detect iron deposits that surround the lesions with relatively high sensitivity and specificity of identifying PRL.59
Despite these innovations, several challenges remain before possible incorporation into the clinical setting. These limitations include longer scan time, familiarity of clinicians in using these maps, higher financial cost, and the necessity of advanced imaging processing skills. Artificial intelligence is a promising tool that may overcome these challenges through creating automated processing pipelines and developing synthetic maps without the need for additional acquisition.60
Conclusions
MRI is the most important tool for diagnosing and treating PwMS. Imaging biomarkers such as T2-lesions, cBHs, brain atrophy, PRLs, and CVS provide insight into the disease’s pathogenesis and are invaluable for the accurate diagnosis and prognostication of MS. Quantitative MRI techniques, while not available in the clinical setting, are important tools for translational research that may help direct the development of future therapeutics. In the near future, clinicians caring for PwMS should expect to encounter these imaging biomarkers more frequently in the clinical setting, especially with the inclusion of PRLs and CVS in the next iteration of the McDonald diagnostic criteria.
Multiple sclerosis (MS) is a complex, chronic immune-mediated disease of the central nervous system characterized by focal inflammation, demyelination, and neurodegeneration. Magnetic resonance imaging (MRI), first incorporated into the McDonald Criteria for the diagnosis of MS in 2001, is an integral tool in the diagnosis, prognosis, and therapeutic monitoring of people with MS (PwMS).1
MRI research in MS is rapidly expanding and offers insights into the pathophysiology of MS with important implications for the routine clinical care of PwMS. At the Consortium of Multiple Sclerosis Centers 2024 Annual Meeting, the US Department of Veterans Affairs (VA) MS Centers of Excellence hosted an educational symposium highlighting MRI biomarkers in MS, including T2-lesions, chronic black holes (cBHs), brain atrophy, paramagnetic rim lesions (PRLs), and the central vein sign (CVS). The symposium also provided a brief overview of quantitative MRI techniques used to characterize MS lesion severity and research applications of these techniques. This clinical review summarizes the main points of that symposium with the goal of introducing key concepts to federal health care practitioners caring for PwMS.
MRI Biomarkers in MS
T2-lesions, Chronic Black Holes, and Brain Atrophy
Focal immune-mediated inflammation and demyelination in MS may be detected by MRI as hyperintense foci on T2-weighted (T2-w) imaging (eg, T2-w turbo spin echo or T2-w fluid attenuated inversion recovery sequences). These T2-lesions, critical for diagnosing MS, are typically ovoid and occur in the periventricular, juxtacortical, infratentorial spinal cord white matter (Figure 1A). T2-lesion number and volume show some association with disability and optic nerve.
Wattjes et al highlight 2 cases to demonstrate this point: a man aged 52 years with MS for 23 years and a woman aged 50 years with MS for 11 years. Despite having MS for a much shorter duration, the woman had worse disability due to a higher lesion number and volume.2 T2-lesion volume also impacts disability progression in PwMS. Gauthier et al compared the probability of progression in 3 women, all of whom were aged 39 years and had MS for 6 years. The profile with highest probability of disability progression had the highest quartile of T2-lesion volume.3 T2-lesion volume over 2 years correlates with worse scores on disability metrics such as the MS functional composite, paced auditory serial addition task, and brain volume.4 A 2024 systematic review and meta-analysis demonstrated that T2-lesion volume is significantly correlated with clinical disability in PwMS.5
Select T2-lesions are also hypointense on T1-w spin echo images and are known as cBHs (Figure 1B). Histologically, T2-lesions with cBHs have more severe architectural disruption than those without cBHs.6 cBH number and volume are significantly correlated with disability, regardless of the degree of hypointensity on T1-w imaging.5,7 A 10-year longitudinal study demonstrated that cBHs were associated with disease progression after 5 years while T2-lesion volume was not, indicating that cBHs may be a more accurate predictor of disability.8
Brain atrophy, another imaging biomarker of MS, affects both the cerebral white and gray matter. White matter fraction (the volume of white matter relative to the intracranial compartment volume) and gray matter fraction (the volume of gray matter relative to the intracranial compartment) are significantly lower among PwMS compared with healthy controls. In addition, gray matter fraction is lower among patients with primary and secondary progressive MS compared with those with relapsing-remitting MS, clinically isolated syndrome (CIS), and radiologically isolated syndrome (RIS). Gray matter fraction is also correlated with several motor and cognitive disability indices.9
Paramagnetic Rim Lesions
Neurologic worsening in PwMS occurs by 2 distinct mechanisms: relapse-associated worsening, a stepwise worsening of symptoms due to incomplete recovery following a relapse; and progression independent of relapse activity (PIRA), which is an irreversible neurologic deterioration in the absence of clinical or radiological relapses.10 PIRA is associated with neurodegeneration and predominates in both primary and secondary progressive MS. However, recent data demonstrated that PIRA may contribute to as much as 50% of disability worsening in relapsing MS and occurs early in the RMS disease course.10,11 Current high-efficacy disease modifying therapy, such as ocrelizumab, are extraordinarily successful at preventing focal inflammation and relapses but are less effective for preventing the slow march of disability progression characterizing PIRA.12,13 The prevention of PIRA is therefore an unmet treatment need.
Chronic active lesions (CALs) are an important driver of PIRA. When an acute gadolinium-enhancing lesion develops in PwMS, there are 3 possible fates of this lesion. The lesion may become chronically inactive, remyelinate, or transition to CALs.14 The histopathologic signature of CALs is compartmentalized, low-grade inflammation behind an intact blood-brain barrier with evidence of both active and chronic components.15 CALs may be found not only in cerebral white matter but also in the cerebral cortex and spinal cord.16,17 Combined MRI and histopathological studies have shown that iron-laden microglia/macrophages can be detected by susceptibility-based MRI as a rim of paramagnetic signal surrounding select T2-lesions.19 These PRLs represent an in vivo imaging biomarker of CAL (Figure 1C). According to the North American Imaging in MS Cooperative (NAIMS) consensus criteria, a PRL must surround at least two-thirds of the outer edge of a T2-lesion, be visible in ≥ 2 consecutive MRI slices, and cannot be contrast enhancing.20
PRLs can be visualized on multiple susceptibility-based imaging methods, including multiecho derived R2*/T2*, phase maps, susceptibility-weighted imaging, and quantitative susceptibility mapping.21-23 Retrospective analyses have shown no significant differences in sensitivity across these imaging modalities.24 Although first visualized with 7T MRI, PRLs may also be detected by 1.5T and 3T MRI with comparable sensitivities.25-27 However, there remains a significant knowledge gap regarding the accuracy of each imaging modality. Systematic, prospectively designed studies are needed to ascertain the comparative value of each method.
The presence of PRL is a poor prognostic indicator. PwMS without PRLs have higher levels of disability, are more likely to progress, and demonstrate greater gray matter atrophy and cognitive dysfunction when compared with PwMS with PRLs.27-29 Lesions with PRL tend to slowly expand, exhibit greater demyelination, and have diminished white matter integrity.21,22,30
PRLs may also be used as a diagnostic tool. PRLs are highly specific for MS/CIS with a 99.7% specificity and 98.4% positive predictive value, although the sensitivity is limited to 24%.31 Taken together, these data indicate that the presence of a PRL substantially increases the likelihood of an MS/CIS diagnosis, whereas the absence of a PRL does not exclude these diagnoses.
Several unanswered questions remain: Why do select acute MS lesions transition to CALs? How may investigators utilize PRLs as outcome measures in future clinical trials? How should PRLs be incorporated into the routine care of PwMS? As the role of this imaging biomarker is clarified both in the research and clinical settings, clinicians caring for PwMS can expect to increasingly encounter the topic of PRLs in the near future.
Central Vein Sign
A CVS is defined by the presence of a central vessel within a demyelinating plaque (Figure 1D). As early as the 1820s, MS plaques on gross pathology were noted to follow the course of a vessel. Early histological studies reported that up to 91% of MS plaques had a central vessel present.32 Lesion formation is dependent on the movement of lymphocytes and other inflammatory cells from the systemic circulation across the blood brain barrier into the perivascular space, a privileged site where immune cells interact with antigen presenting cells to launch an inflammatory cascade and eventual demyelinating lesion.33
CVS can be visualized on 1.5T, 3T and 7T MRI. However, 7T MRI is superior to 3T in the detection of CVS, with 85% of MS lesions having CVS visible compared with 45% on 3T.34 With advances in 7T MRI, fluid attenuated inversion recovery and T2* susceptibility, weighted sequences can be overlaid, allowing simultaneous visualization of the vessel and the demyelinating lesion. With higher density of parenchymal veins in the periventricular regions, the CVS is most seen in lesions of this territory but can also be present in juxtacortical, thalamic and infratentorial lesions with decreasing prevalence as these approach the cortex.35
MS lesions are more likely to have CVS than T2 hyperintense white matter lesions of other causes, with a large study reporting 78% of MS lesions were CVS positive. Further, CVS positive lesions can be found across all MS phenotypes including relapsing remitting, primary progressive, and secondary progressive.35 The CVS is also specific to MS lesions and is an effective tool for differentiating MS lesions from other common causes of T2 hyperintense lesions including chronic ischemic white matter disease,36 migraines,37 neuromyelitis optica spectrum disorders,38,39 Susac syndrome,40 and systemic autoimmune diseases (Behcet disease, systemic lupus erythematosus, and antiphospholipid syndrome).41
With CVS emerging as a promising radiographic biomarker for MS, NAIMS issued a consensus statement on necessary properties of a CVS. These criteria included appearance of a thin hypointense line or small dot, visualized in ≥ 2 perpendicular planes, with diameter < 2 mm, and running partially or entirely through the center of the lesion. They also clarified that lesions < 3 mm, confluent lesions, lesions with multiple vessels present or poorly visualized lesions were excluded.42
A shared CVS definition was a necessary step toward routine use of CVS as a radiographic biomarker and its incorporation in the 2024 revised McDonald criteria.43 Remaining limitations including 7T MRI is primarily available in research settings and the lack of consensus on a diagnostic threshold. There have been many proposed methods, including a 40% cut off,44 60% cut off,45 and Select 3* or Select 6* methods.46 The goal of each method is to optimize sensitivity and specificity while not compromising efficiency of MRI review for both neurologists and radiologists.
The CVS has significant potential as a radiographic biomarker for MS and may allow the early stages of MS to be differentiated from other common causes of white matter lesions on MRI. However, it remains unclear whether CVS holds prognostic value for patients, if CVS is suggestive of differing underlying pathology, or if the presence of a CVS is dynamic over time. Progress in these areas is anticipated as CVS is incorporated into routine clinical practice.
Quantitative MRI Techniques
In the research setting, several imaging modalities can be used to quantify the degree of microstructural injury in PwMS. The goal of these methods is to identify and quantify myelin and axonal damage, the major drivers of neurodegeneration. Among these methods, diffusion-based imaging is a measure of the amount of diffusion or fluid mobility across the tissues of the brain.47 Diffusion-weighted imaging (DWI) yields several parametric maps including axial diffusivity (AD), radial diffusivity (RD), and mean diffusivity (Figure 2 A, B, and C). These parametric maps provide information on different directions of water molecules’ movements. Myelin surrounds the axons preventing water molecules diffusion perpendicular to axons (RD) while axonal content prevents water diffusion horizontal to the axons (AD).Thus, AD is considered more specific to axonal injury, whereas RD is specific to myelin content.48 A higher value of any of these metrics is associated with a higher degree of tissue injury.
Although sensitive to axonal and myelin injury, AD and RD computed from single b-shell DWI experience several limitations including being affected by nonpathologic factors such as fiber orientation, distribution, and crossing, and by various nonmyelin specific pathologies including fluid accumulation during inflammation, myelin sheath thickness, and axonal intactness.48 Several multi b-shell methods have been developed to overcome diffusion imaging limitations. For example, work at the Nashville VA MS Center of Excellence has focused on the use of the multicompartment diffusion MRI with spherical mean technique (SMT). This method removes the orientation dependency of the diffusion MRI signal, increasing the signal-to-noise ratio and reducing biases from fiber undulation, crossing, and dispersion.49 SMT generates the apparent axonal volume fraction (Vax), which is a direct measure of axonal integrity with lower values indicating lower axonal content and higher tissue destruction (Figure 2D). Vax was previously validated in MS as a measure of axonal integrity.49
In terms of myelin, several other specific measures have been developed. Magnetization transfer ratio (MTR) is another measure of tissue integrity that has been validated as a measure of tissue injury in MS (Figure 2E).50,51 Zheng et al found that the percentage of lesions with low MTR was significantly higher among patients whose disease disability progressed compared with patients who did not.52Selective inversion recovery with quantitative magnetization transfer (SIR-qMT) was developed to account for the limitations of MTR, including its sensitivity to edema and axonal density.52 Germane to myelin measurements, SIR-qMT generates the macromolecular to free size ratio (PSR). PSR represents the ratio of protons bound to macromolecules (myelin) to free protons (Figure 2F). PSR is considered a marker of myelin integrity, with lower values correlating with disability severity and indicating higher tissue damage and lower myelin content. Previous studies from the Nashville VA MS Center of Excellence validated the use of SIR-qMT among patients with MS, CIS, RIS, and healthy controls.53
Quantitative MRI has several research applications in the field of MS. We demonstrated that PRL harbor a higher degree of myelin injury indicated by PSR compared with rimless lesions.54 These MRI techniques are also helpful to investigate tissues surrounding the lesions, called normal appearing white matter (NAWM). Using quantitative MRI techniques such as MTR,52 PSR,53 and Vax,49 investigators have demonstrated that NAWM is injured in PwMS, and proximal NAWM may have higher degree of tissue damage compared with distant NAWM.55
Anticipated Innovations and Challenges
In the field of quantitative MRI, several new techniques are being adopted. Researchers are developing techniques such as myelin water fraction which evaluates the interaction between water and protons to measure myelin content. This is considered an advancement as it takes into account edema resulting from MS injury.56 Another example is multicompartment diffusion imaging, such as standard model imaging,57 and neurite orientation dispersion and density imaging,58 which considers water as an additional compartment compared with the SMT derived Vax. For PRL identification, more advanced methodologic techniques are developing such quantitative susceptibility mapping (QSM), which can detect iron deposits that surround the lesions with relatively high sensitivity and specificity of identifying PRL.59
Despite these innovations, several challenges remain before possible incorporation into the clinical setting. These limitations include longer scan time, familiarity of clinicians in using these maps, higher financial cost, and the necessity of advanced imaging processing skills. Artificial intelligence is a promising tool that may overcome these challenges through creating automated processing pipelines and developing synthetic maps without the need for additional acquisition.60
Conclusions
MRI is the most important tool for diagnosing and treating PwMS. Imaging biomarkers such as T2-lesions, cBHs, brain atrophy, PRLs, and CVS provide insight into the disease’s pathogenesis and are invaluable for the accurate diagnosis and prognostication of MS. Quantitative MRI techniques, while not available in the clinical setting, are important tools for translational research that may help direct the development of future therapeutics. In the near future, clinicians caring for PwMS should expect to encounter these imaging biomarkers more frequently in the clinical setting, especially with the inclusion of PRLs and CVS in the next iteration of the McDonald diagnostic criteria.
McDonald WI, Compston A, Edan G, et al. Recommended diagnostic criteria for multiple sclerosis: guidelines from the International Panel on the diagnosis of multiple sclerosis. Ann Neurol. 2001;50:121-127. doi:10.1002/ana.1032
Wattjes MP, Steenwijk MD, Stangel M. MRI in the diagnosis and monitoring of multiple sclerosis: an update. Clin Neuroradiol. 2015;25:157-165. doi:10.1007/s00062-015-0430-y
Gauthier SA, Mandel M, Guttmann CR, et al. Predicting short-term disability in multiple sclerosis. Neurology. 2007;68:2059-2065.doi:10.1212/01.wnl.0000264890.97479.b1
Rudick RA, Lee JC, Simon J, Fisher E. Significance of T2 lesions in multiple sclerosis: a 13-year longitudinal study. Ann Neurol. 2006;60:236-242. doi:10.1002/ana.20883
Nabizadeh F, Zafari R, Mohamadi M, et al. MRI features and disability in multiple sclerosis: a systematic review and meta-analysis. J Neuroradiol. 2024;51:24-37. doi:10.1016/j.neurad.2023.11.007
Bagnato F, Jeffries N, Richert ND, et al. Evolution of T1 black holes in patients with multiple sclerosis imaged monthly for 4 years. Brain. 2003;126:1782-1789. doi:10.1093/brain/awg182
Jacobsen C, Hagemeier J, Myhr KM, et al. Brain atrophy and disability progression in multiple sclerosis patients: a 10-year follow-up study. J Neurol Neurosurg Psychiatry. 2014;85:1109-1115. doi:10.1136/jnnp-2013-306906
Rovaris M, Gass A, Bammer R, et al. Diffusion MRI in multiple sclerosis. Neurology. 2005;65:1526-1532. doi:10.1212/01.wnl.0000184471.83948.e0
Fisniku LK, Chard DT, Jackson JS, et al. Gray matter atrophy is related to long-term disability in multiple sclerosis. Ann Neurol. 2008;64:247-254. doi:10.1002/ana.21423
Lublin FD, Häring DA, Ganjgahi H, et al. How patients with multiple sclerosis acquire disability. Brain. 2022;145:3147-3161. doi:10.1093/brain/awac016
Kappos L, Wolinsky JS, Giovannoni G, et al. Contribution of relapse-independent progression vs relapse-associated worsening to overall confirmed disability accumulation in typical relapsing multiple sclerosis in a pooled analysis of 2 randomized clinical trials. JAMA Neurol. 2020;77:1132-1140. doi:10.1001/jamaneurol.2020.1568
Hauser SL, Bar-Or A, Comi G, et al. Ocrelizumab versus interferon beta-1a in relapsing multiple sclerosis. N Engl J Med. 2017;376:221-234. doi:10.1056/NEJMoa1601277
Montalban X, Hauser SL, Kappos L, et al. Ocrelizumab versus placebo in primary progressive multiple sclerosis. N Engl J Med. 2017;376:209-220. doi:10.1056/NEJMoa1606468
Prineas JW, Kwon EE, Cho ES, et al. Immunopathology of secondary-progressive multiple sclerosis. Ann Neurol. 2001;50:646-657. doi:10.1002/ana.1255
Kuhlmann T, Ludwin S, Prat A, Antel J, Brück W, Lassmann H. An updated histological classification system for multiple sclerosis lesions. Acta Neuropathol. 2017;133:13-24. doi:10.1007/s00401-016-1653-y
Pitt D, Boster A, Pei W, et al. Imaging cortical lesions in multiple sclerosis with ultra-high-field magnetic resonance imaging. Arch Neurol. 2010;67:812-818. doi:10.1001/archneurol.2010.148
Gilmore CP, Geurts JJ, Evangelou N, et al. Spinal cord grey matter lesions in multiple sclerosis detected by post-mortem high field MR imaging. Mult Scler. 2009;15:180-188. doi:10.1177/1352458508096876
Lassmann H, Brück W, Lucchinetti CF. The immunopathology of multiple sclerosis: an overview. Brain Pathol. 2007;17:210-218. doi:10.1111/j.1750-3639.2007.00064.x
Bagnato F, Hametner S, Yao B, et al. Tracking iron in multiple sclerosis: a combined imaging and histopathological study at 7 Tesla. Brain. 2011;134:3602-3615. doi:10.1093/brain/awr278
Bagnato F, Sati P, Hemond CC, et al. Imaging chronic active lesions in multiple sclerosis: a consensus statement. Brain. 2024;147:2913-2933. doi:10.1093/brain/awae013
Dal-Bianco A, Grabner G, Kronnerwetter C, et al. Slow expansion of multiple sclerosis iron rim lesions: pathology and 7 T magnetic resonance imaging. Acta Neuropathol. 2017;133:25-42. doi:10.1007/s00401-016-1636-z
Absinta M, Sati P, Schindler M, et al. Persistent 7-tesla phase rim predicts poor outcome in new multiple sclerosis patient lesions. J Clin Invest. 2016;126:2597-2609. doi:10.1172/JCI86198
Gillen KM, Mubarak M, Park C, et al. QSM is an imaging biomarker for chronic glial activation in multiple sclerosis lesions. Ann Clin Transl Neurol. 2021;8:877-886. doi:10.1002/acn3.51338
Ng Kee Kwong KC, Mollison D, Meijboom R, et al. The prevalence of paramagnetic rim lesions in multiple sclerosis: a systematic review and meta-analysis. PLoS One. 2021;16:e0256845. doi:10.1371/journal.pone.0256845
Absinta M, Sati P, Fechner A, et al. Identification of chronic active multiple sclerosis lesions on 3T MRI. AJNR Am J Neuroradiol. 2018;39:1233-1238. doi:10.3174/ajnr.A5660
Hemond CC, Reich DS, Dundamadappa SK. Paramagnetic rim lesions in multiple sclerosis: comparison of visualization at 1.5-T and 3-T MRI. AJR Am J Roentgenol. 2022;219:120-131. doi:10.2214/AJR.21.26777
Altokhis AI, Hibbert AM, Allen CM, et al. Longitudinal clinical study of patients with iron rim lesions in multiple sclerosis. Mult Scler. 2022;28:2202-2211. doi:10.1177/13524585221114750
Choi S, Lake S, Harrison DM. Evaluation of the blood-brain barrier, demyelination, and neurodegeneration in paramagnetic rim lesions in multiple sclerosis on 7 tesla MRI. J Magn Reson Imaging. 2024;59:941-951. doi:10.1002/jmri.28847
Kazimuddin HF, Wang J, Hernandez B, et al. Paramagnetic rim lesions and their relationship with neurodegeneration and clinical disability at the time of multiple sclerosis diagnosis. Poster presented at: 2024 Americas Committee for Treatment and Research in Multiple Sclerosis (ACTRIMS) Forum; February 26-March 2; West Palm Beach, FL.
Rohm Z, Koch C, Kazimuddin H, et al. Longitudinal characterization of paramagnetic rim lesions in early multiple sclerosis. Poster presented at: 2024 Americas Committee for Treatment and Research in Multiple Sclerosis (ACTRIMS) Forum; February 26-March 2; West Palm Beach, FL.
Meaton I, Altokhis A, Allen CM, et al. Paramagnetic rims are a promising diagnostic imaging biomarker in multiple sclerosis. Mult Scler. 2022;28:2212-2220. doi:10.1177/13524585221118677
Fog T. On the vessel-plaque relationships in the brain in multiple sclerosis. Acta Neurol Scand Suppl. 1964;40:9-15.
Ineichen BV, Okar SV, Proulx ST, et al. Perivascular spaces and their role in neuroinflammation. Neuron. 2022;110:3566-3581. doi:10.1016/j.neuron.2022.10.024
Tallantyre EC, Morgan PS, Dixon JE, et al. A comparison of 3T and 7T in the detection of small parenchymal veins within MS lesions. Invest Radiol. 2009;44:491-494. doi:10.1097/RLI.0b013e3181b4c144
Kilsdonk ID, Lopez-Soriano A, Kuijer JP, et al. Morphological features of MS lesions on FLAIR* at 7 T and their relation to patient characteristics. J Neurol. 2014;261:1356-1364. doi:10.1007/s00415-014-7351-6
Tallantyre EC, Dixon JE, Donaldson I, et al. Ultra-high-field imaging distinguishes MS lesions from asymptomatic white matter lesions. Neurology. 2011;76:534-539. doi:10.1212/WNL.0b013e31820b7630
Solomon AJ, Schindler MK, Howard DB, et al. “Central vessel sign” on 3T FLAIR* MRI for the differentiation of multiple sclerosis from migraine. Ann Clin Transl Neurol. 2015;3:82-87. doi:10.1002/acn3.273
Sinnecker T, Dörr J, Pfueller CF, et al. Distinct lesion morphology at 7-T MRI differentiates neuromyelitis optica from multiple sclerosis. Neurology. 2012;79:708-714. doi:10.1212/WNL.0b013e3182648bc8
Kister I, Herbert J, Zhou Y, Ge Y. Ultrahigh-field MR (7 T) imaging of brain lesions in neuromyelitis optica. Mult Scler Int. 2013;2013:398259. doi:10.1155/2013/398259
Wuerfel J, Sinnecker T, Ringelstein EB, et al. Lesion morphology at 7 Tesla MRI differentiates Susac syndrome from multiple sclerosis. Mult Scler. 2012;18:1592-1599. doi:10.1177/1352458512441270
Massacesi L. Perivenular distribution of white matter lesions evaluated by MRI can differentiate MS lesions from inflammatory small vessel diseases. Eur J Neurol. 2016;23:86. doi:10.1212/WNL.86.16_supplement.P6.121
Sati P, Oh J, Constable RT, et al. The central vein sign and its clinical evaluation for the diagnosis of multiple sclerosis: a consensus statement from the North American Imaging in Multiple Sclerosis Cooperative. Nat Rev Neurol. 2016;12:714-722. doi:10.1038/nrneurol.2016.166
Montalban X, Lebrun-Frénay C, Oh J, et al. Diagnosis of multiple sclerosis: 2024 revisions of the McDonald criteria. Lancet Neurol. 2025;24:850-865. doi:10.1016/S1474-4422(25)00270-4
Mistry N, Dixon J, Tallantyre E, et al. Central veins in brain lesions visualized with high-field magnetic resonance imaging: a pathologically specific diagnostic biomarker for inflammatory demyelination in the brain. JAMA Neurol. 2013;70:623-628. doi:10.1001/jamaneurol.2013.1405
Campion T, Smith RJP, Altmann DR, et al. FLAIR* to visualize veins in white matter lesions: a new tool for the diagnosis of multiple sclerosis? Eur Radiol. 2017;27:4257-4263. doi:10.1007/s00330-017-4822-z
Solomon AJ, Watts R, Ontaneda D, et al. Diagnostic performance of central vein sign for multiple sclerosis with a simplified three-lesion algorithm. Mult Scler. 2018;24:750-757. doi:10.1177/1352458517726383
Cercignani M, Bozzali M, Iannucci G, Comi G, Filippi M. Intra-voxel and inter-voxel coherence in patients with multiple sclerosis assessed using diffusion tensor MRI. J Neurol. 2002;249:875-883. doi:10.1007/s00415-002-0752-y
Song SK, Yoshino J, Le TQ, et al. Demyelination increases radial diffusivity in corpus callosum of mouse brain. Neuroimage. 2005;26:132-140. doi:10.1016/j.neuroimage.2005.01.028
Bagnato F, Franco G, Li H, et al. Probing axons using multi-compartmental diffusion in multiple sclerosis. Ann Clin Transl Neurol. 2019;6:1595-1605. doi:10.1002/acn3.50836
Filippi M, Cercignani M, Inglese M, et al. Diffusion tensor magnetic resonance imaging in multiple sclerosis. Neurology. 2001;56:304-311. doi:10.1212/wnl.56.3.304
Bagnato F. Clinical application of magnetization transfer imaging. In: Advanced Neuro MR Techniques and Applications. Elsevier; 2022:403-417. doi:10.1016/B978-0-12-822479-3.00041-5
Zheng Y, Lee JC, Rudick R, Fisher E. Long-term magnetization transfer ratio evolution in multiple sclerosis white matter lesions. J Neuroimaging. 2018;28:191-198. doi:10.1111/jon.12480
Bagnato F, Hametner S, Franco G, et al. Selective inversion recovery quantitative magnetization transfer brain MRI at 7T: clinical and postmortem validation in multiple sclerosis. J Neuroimaging. 2018;28:380-388. doi:10.1111/jon.12511
Clarke MA, Cheek R, Hernandez B, et al. Paramagnetic rim lesions and the central vein sign: characterizing multiple sclerosis imaging markers. J Neuroimaging. 2024;34:86-94. doi:10.1111/jon.13173
Clarke MA, Lakhani DA, Wen S, et al. Perilesional neurodegenerative injury in multiple sclerosis: relation to focal lesions and impact on disability. Mult Scler Relat Disord. 2021;49:102738. doi:10.1016/j.msard.2021.102738
Laule C, Moore GRW. Myelin water imaging to detect demyelination and remyelination and its validation in pathology. Brain Pathol. 2018;28:750-764. doi:10.1111/bpa.12645
Coelho S, Baete SH, Lemberskiy G, et al. Reproducibility of the standard model of diffusion in white matter on clinical MRI systems. Neuroimage. 2022;257:119290. doi:10.1016/j.neuroimage.2022.119290
Novikov DS, Veraart J, Jelescu IO, et al. Rotationally-invariant mapping of scalar and orientational metrics of neuronal microstructure with diffusion MRI. Neuroimage. 2018;174:518-538. doi:10.1016/j.neuroimage.2018.03.006
Langkammer C, Liu T, Khalil M, et al. Quantitative susceptibility mapping in multiple sclerosis. Radiology. 2013;267:551-559. doi:10.1148/radiol.12120707
Collorone S, Coll L, Lorenzi M, et al. Artificial intelligence applied to MRI data to tackle key challenges in multiple sclerosis. Mult Scler. 2024;30:767-784. doi:10.1177/13524585241249422
McDonald WI, Compston A, Edan G, et al. Recommended diagnostic criteria for multiple sclerosis: guidelines from the International Panel on the diagnosis of multiple sclerosis. Ann Neurol. 2001;50:121-127. doi:10.1002/ana.1032
Wattjes MP, Steenwijk MD, Stangel M. MRI in the diagnosis and monitoring of multiple sclerosis: an update. Clin Neuroradiol. 2015;25:157-165. doi:10.1007/s00062-015-0430-y
Gauthier SA, Mandel M, Guttmann CR, et al. Predicting short-term disability in multiple sclerosis. Neurology. 2007;68:2059-2065.doi:10.1212/01.wnl.0000264890.97479.b1
Rudick RA, Lee JC, Simon J, Fisher E. Significance of T2 lesions in multiple sclerosis: a 13-year longitudinal study. Ann Neurol. 2006;60:236-242. doi:10.1002/ana.20883
Nabizadeh F, Zafari R, Mohamadi M, et al. MRI features and disability in multiple sclerosis: a systematic review and meta-analysis. J Neuroradiol. 2024;51:24-37. doi:10.1016/j.neurad.2023.11.007
Bagnato F, Jeffries N, Richert ND, et al. Evolution of T1 black holes in patients with multiple sclerosis imaged monthly for 4 years. Brain. 2003;126:1782-1789. doi:10.1093/brain/awg182
Jacobsen C, Hagemeier J, Myhr KM, et al. Brain atrophy and disability progression in multiple sclerosis patients: a 10-year follow-up study. J Neurol Neurosurg Psychiatry. 2014;85:1109-1115. doi:10.1136/jnnp-2013-306906
Rovaris M, Gass A, Bammer R, et al. Diffusion MRI in multiple sclerosis. Neurology. 2005;65:1526-1532. doi:10.1212/01.wnl.0000184471.83948.e0
Fisniku LK, Chard DT, Jackson JS, et al. Gray matter atrophy is related to long-term disability in multiple sclerosis. Ann Neurol. 2008;64:247-254. doi:10.1002/ana.21423
Lublin FD, Häring DA, Ganjgahi H, et al. How patients with multiple sclerosis acquire disability. Brain. 2022;145:3147-3161. doi:10.1093/brain/awac016
Kappos L, Wolinsky JS, Giovannoni G, et al. Contribution of relapse-independent progression vs relapse-associated worsening to overall confirmed disability accumulation in typical relapsing multiple sclerosis in a pooled analysis of 2 randomized clinical trials. JAMA Neurol. 2020;77:1132-1140. doi:10.1001/jamaneurol.2020.1568
Hauser SL, Bar-Or A, Comi G, et al. Ocrelizumab versus interferon beta-1a in relapsing multiple sclerosis. N Engl J Med. 2017;376:221-234. doi:10.1056/NEJMoa1601277
Montalban X, Hauser SL, Kappos L, et al. Ocrelizumab versus placebo in primary progressive multiple sclerosis. N Engl J Med. 2017;376:209-220. doi:10.1056/NEJMoa1606468
Prineas JW, Kwon EE, Cho ES, et al. Immunopathology of secondary-progressive multiple sclerosis. Ann Neurol. 2001;50:646-657. doi:10.1002/ana.1255
Kuhlmann T, Ludwin S, Prat A, Antel J, Brück W, Lassmann H. An updated histological classification system for multiple sclerosis lesions. Acta Neuropathol. 2017;133:13-24. doi:10.1007/s00401-016-1653-y
Pitt D, Boster A, Pei W, et al. Imaging cortical lesions in multiple sclerosis with ultra-high-field magnetic resonance imaging. Arch Neurol. 2010;67:812-818. doi:10.1001/archneurol.2010.148
Gilmore CP, Geurts JJ, Evangelou N, et al. Spinal cord grey matter lesions in multiple sclerosis detected by post-mortem high field MR imaging. Mult Scler. 2009;15:180-188. doi:10.1177/1352458508096876
Lassmann H, Brück W, Lucchinetti CF. The immunopathology of multiple sclerosis: an overview. Brain Pathol. 2007;17:210-218. doi:10.1111/j.1750-3639.2007.00064.x
Bagnato F, Hametner S, Yao B, et al. Tracking iron in multiple sclerosis: a combined imaging and histopathological study at 7 Tesla. Brain. 2011;134:3602-3615. doi:10.1093/brain/awr278
Bagnato F, Sati P, Hemond CC, et al. Imaging chronic active lesions in multiple sclerosis: a consensus statement. Brain. 2024;147:2913-2933. doi:10.1093/brain/awae013
Dal-Bianco A, Grabner G, Kronnerwetter C, et al. Slow expansion of multiple sclerosis iron rim lesions: pathology and 7 T magnetic resonance imaging. Acta Neuropathol. 2017;133:25-42. doi:10.1007/s00401-016-1636-z
Absinta M, Sati P, Schindler M, et al. Persistent 7-tesla phase rim predicts poor outcome in new multiple sclerosis patient lesions. J Clin Invest. 2016;126:2597-2609. doi:10.1172/JCI86198
Gillen KM, Mubarak M, Park C, et al. QSM is an imaging biomarker for chronic glial activation in multiple sclerosis lesions. Ann Clin Transl Neurol. 2021;8:877-886. doi:10.1002/acn3.51338
Ng Kee Kwong KC, Mollison D, Meijboom R, et al. The prevalence of paramagnetic rim lesions in multiple sclerosis: a systematic review and meta-analysis. PLoS One. 2021;16:e0256845. doi:10.1371/journal.pone.0256845
Absinta M, Sati P, Fechner A, et al. Identification of chronic active multiple sclerosis lesions on 3T MRI. AJNR Am J Neuroradiol. 2018;39:1233-1238. doi:10.3174/ajnr.A5660
Hemond CC, Reich DS, Dundamadappa SK. Paramagnetic rim lesions in multiple sclerosis: comparison of visualization at 1.5-T and 3-T MRI. AJR Am J Roentgenol. 2022;219:120-131. doi:10.2214/AJR.21.26777
Altokhis AI, Hibbert AM, Allen CM, et al. Longitudinal clinical study of patients with iron rim lesions in multiple sclerosis. Mult Scler. 2022;28:2202-2211. doi:10.1177/13524585221114750
Choi S, Lake S, Harrison DM. Evaluation of the blood-brain barrier, demyelination, and neurodegeneration in paramagnetic rim lesions in multiple sclerosis on 7 tesla MRI. J Magn Reson Imaging. 2024;59:941-951. doi:10.1002/jmri.28847
Kazimuddin HF, Wang J, Hernandez B, et al. Paramagnetic rim lesions and their relationship with neurodegeneration and clinical disability at the time of multiple sclerosis diagnosis. Poster presented at: 2024 Americas Committee for Treatment and Research in Multiple Sclerosis (ACTRIMS) Forum; February 26-March 2; West Palm Beach, FL.
Rohm Z, Koch C, Kazimuddin H, et al. Longitudinal characterization of paramagnetic rim lesions in early multiple sclerosis. Poster presented at: 2024 Americas Committee for Treatment and Research in Multiple Sclerosis (ACTRIMS) Forum; February 26-March 2; West Palm Beach, FL.
Meaton I, Altokhis A, Allen CM, et al. Paramagnetic rims are a promising diagnostic imaging biomarker in multiple sclerosis. Mult Scler. 2022;28:2212-2220. doi:10.1177/13524585221118677
Fog T. On the vessel-plaque relationships in the brain in multiple sclerosis. Acta Neurol Scand Suppl. 1964;40:9-15.
Ineichen BV, Okar SV, Proulx ST, et al. Perivascular spaces and their role in neuroinflammation. Neuron. 2022;110:3566-3581. doi:10.1016/j.neuron.2022.10.024
Tallantyre EC, Morgan PS, Dixon JE, et al. A comparison of 3T and 7T in the detection of small parenchymal veins within MS lesions. Invest Radiol. 2009;44:491-494. doi:10.1097/RLI.0b013e3181b4c144
Kilsdonk ID, Lopez-Soriano A, Kuijer JP, et al. Morphological features of MS lesions on FLAIR* at 7 T and their relation to patient characteristics. J Neurol. 2014;261:1356-1364. doi:10.1007/s00415-014-7351-6
Tallantyre EC, Dixon JE, Donaldson I, et al. Ultra-high-field imaging distinguishes MS lesions from asymptomatic white matter lesions. Neurology. 2011;76:534-539. doi:10.1212/WNL.0b013e31820b7630
Solomon AJ, Schindler MK, Howard DB, et al. “Central vessel sign” on 3T FLAIR* MRI for the differentiation of multiple sclerosis from migraine. Ann Clin Transl Neurol. 2015;3:82-87. doi:10.1002/acn3.273
Sinnecker T, Dörr J, Pfueller CF, et al. Distinct lesion morphology at 7-T MRI differentiates neuromyelitis optica from multiple sclerosis. Neurology. 2012;79:708-714. doi:10.1212/WNL.0b013e3182648bc8
Kister I, Herbert J, Zhou Y, Ge Y. Ultrahigh-field MR (7 T) imaging of brain lesions in neuromyelitis optica. Mult Scler Int. 2013;2013:398259. doi:10.1155/2013/398259
Wuerfel J, Sinnecker T, Ringelstein EB, et al. Lesion morphology at 7 Tesla MRI differentiates Susac syndrome from multiple sclerosis. Mult Scler. 2012;18:1592-1599. doi:10.1177/1352458512441270
Massacesi L. Perivenular distribution of white matter lesions evaluated by MRI can differentiate MS lesions from inflammatory small vessel diseases. Eur J Neurol. 2016;23:86. doi:10.1212/WNL.86.16_supplement.P6.121
Sati P, Oh J, Constable RT, et al. The central vein sign and its clinical evaluation for the diagnosis of multiple sclerosis: a consensus statement from the North American Imaging in Multiple Sclerosis Cooperative. Nat Rev Neurol. 2016;12:714-722. doi:10.1038/nrneurol.2016.166
Montalban X, Lebrun-Frénay C, Oh J, et al. Diagnosis of multiple sclerosis: 2024 revisions of the McDonald criteria. Lancet Neurol. 2025;24:850-865. doi:10.1016/S1474-4422(25)00270-4
Mistry N, Dixon J, Tallantyre E, et al. Central veins in brain lesions visualized with high-field magnetic resonance imaging: a pathologically specific diagnostic biomarker for inflammatory demyelination in the brain. JAMA Neurol. 2013;70:623-628. doi:10.1001/jamaneurol.2013.1405
Campion T, Smith RJP, Altmann DR, et al. FLAIR* to visualize veins in white matter lesions: a new tool for the diagnosis of multiple sclerosis? Eur Radiol. 2017;27:4257-4263. doi:10.1007/s00330-017-4822-z
Solomon AJ, Watts R, Ontaneda D, et al. Diagnostic performance of central vein sign for multiple sclerosis with a simplified three-lesion algorithm. Mult Scler. 2018;24:750-757. doi:10.1177/1352458517726383
Cercignani M, Bozzali M, Iannucci G, Comi G, Filippi M. Intra-voxel and inter-voxel coherence in patients with multiple sclerosis assessed using diffusion tensor MRI. J Neurol. 2002;249:875-883. doi:10.1007/s00415-002-0752-y
Song SK, Yoshino J, Le TQ, et al. Demyelination increases radial diffusivity in corpus callosum of mouse brain. Neuroimage. 2005;26:132-140. doi:10.1016/j.neuroimage.2005.01.028
Bagnato F, Franco G, Li H, et al. Probing axons using multi-compartmental diffusion in multiple sclerosis. Ann Clin Transl Neurol. 2019;6:1595-1605. doi:10.1002/acn3.50836
Filippi M, Cercignani M, Inglese M, et al. Diffusion tensor magnetic resonance imaging in multiple sclerosis. Neurology. 2001;56:304-311. doi:10.1212/wnl.56.3.304
Bagnato F. Clinical application of magnetization transfer imaging. In: Advanced Neuro MR Techniques and Applications. Elsevier; 2022:403-417. doi:10.1016/B978-0-12-822479-3.00041-5
Zheng Y, Lee JC, Rudick R, Fisher E. Long-term magnetization transfer ratio evolution in multiple sclerosis white matter lesions. J Neuroimaging. 2018;28:191-198. doi:10.1111/jon.12480
Bagnato F, Hametner S, Franco G, et al. Selective inversion recovery quantitative magnetization transfer brain MRI at 7T: clinical and postmortem validation in multiple sclerosis. J Neuroimaging. 2018;28:380-388. doi:10.1111/jon.12511
Clarke MA, Cheek R, Hernandez B, et al. Paramagnetic rim lesions and the central vein sign: characterizing multiple sclerosis imaging markers. J Neuroimaging. 2024;34:86-94. doi:10.1111/jon.13173
Clarke MA, Lakhani DA, Wen S, et al. Perilesional neurodegenerative injury in multiple sclerosis: relation to focal lesions and impact on disability. Mult Scler Relat Disord. 2021;49:102738. doi:10.1016/j.msard.2021.102738
Laule C, Moore GRW. Myelin water imaging to detect demyelination and remyelination and its validation in pathology. Brain Pathol. 2018;28:750-764. doi:10.1111/bpa.12645
Coelho S, Baete SH, Lemberskiy G, et al. Reproducibility of the standard model of diffusion in white matter on clinical MRI systems. Neuroimage. 2022;257:119290. doi:10.1016/j.neuroimage.2022.119290
Novikov DS, Veraart J, Jelescu IO, et al. Rotationally-invariant mapping of scalar and orientational metrics of neuronal microstructure with diffusion MRI. Neuroimage. 2018;174:518-538. doi:10.1016/j.neuroimage.2018.03.006
Langkammer C, Liu T, Khalil M, et al. Quantitative susceptibility mapping in multiple sclerosis. Radiology. 2013;267:551-559. doi:10.1148/radiol.12120707
Collorone S, Coll L, Lorenzi M, et al. Artificial intelligence applied to MRI data to tackle key challenges in multiple sclerosis. Mult Scler. 2024;30:767-784. doi:10.1177/13524585241249422
Updates in Multiple Sclerosis Imaging
Updates in Multiple Sclerosis Imaging
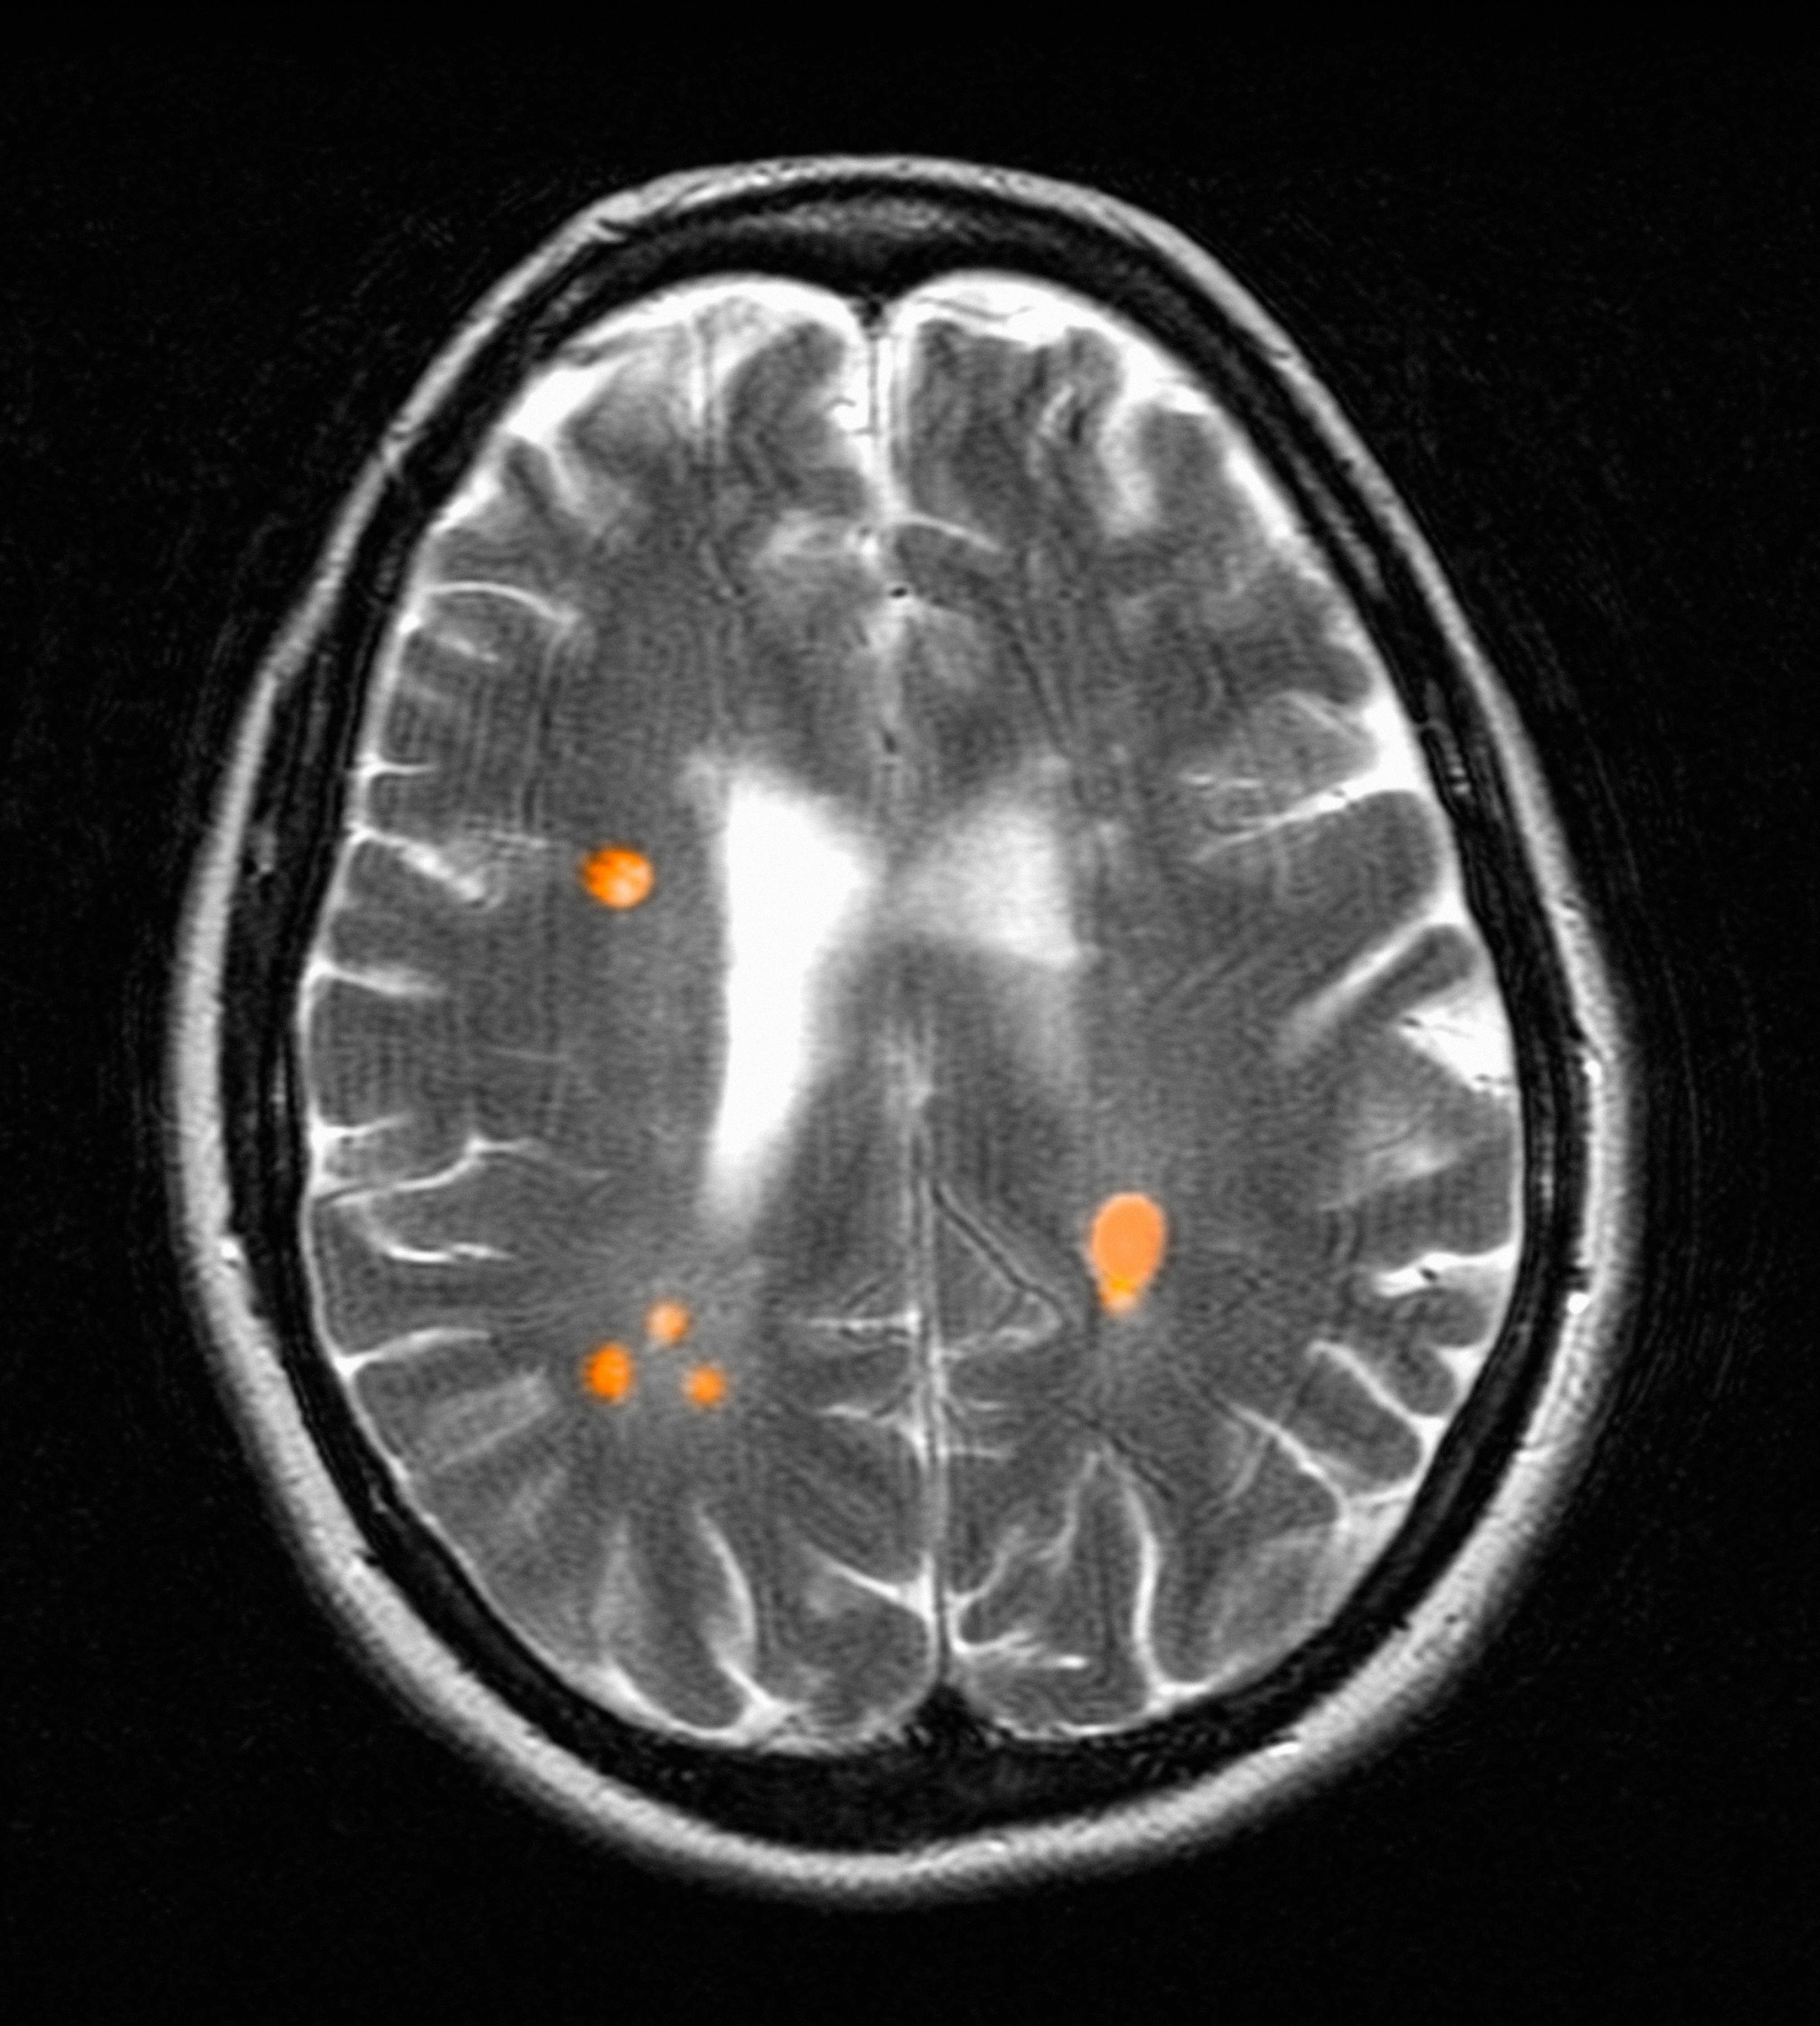
Impact of Retroactive Application of Updated Surveillance Guidelines on Endoscopy Center Capacity at a Large VA Health Care System
Impact of Retroactive Application of Updated Surveillance Guidelines on Endoscopy Center Capacity at a Large VA Health Care System
In 2020, the US Multi-Society Task Force (USMSTF) on Colorectal Cancer (CRC) increased the recommended colon polyp surveillance interval for 1 to 2 subcentimeter tubular adenomas from 5 to 10 years to 7 to 10 years.1 This change was prompted by emerging research indicating that rates of CRC and advanced neoplasia among patients with a history of only 1 to 2 subcentimeter tubular adenomas are lower than initially estimated.2,3 This extension provides an opportunity to increase endoscopy capacity and improve access to colonoscopies by retroactively applying the 2020 guidelines to surveillance interval recommendations made before their introduction. For example, based on the updated guidelines, patients previously recommended to undergo colon polyp surveillance colonoscopy 5 years after an index colonoscopy could extend their surveillance interval by 2 to 5 years. Increasing endoscopic capacity could address the growing demand for colonoscopies from new screening guidelines that reduced the age of initial CRC screening from 50 years to 45 years and the backlog of procedures due to COVID-19 restrictions.4
As part of a project to increase endoscopic capacity at the US Department of Veterans Affairs (VA) Pittsburgh Healthcare System (VAPHS), this study assessed the potential impact of retroactively applying the 2020 USMSTF polyp surveillance guidelines on endoscopic capacity. These results may be informative for other VA and private-sector health care systems seeking to identify strategies to improve endoscopy capacity.
Methods
VAPHS is an integrated health care system in the Veterans Health Administration (VHA) serving 85,000 patients across 8 health care institutions in Pennsylvania, Ohio, and West Virginia. VAPHS manages colorectal screening recommendations for patients receiving medical care in the health care system regardless of whether their prior colonoscopy was performed at VAPHS or external facilities. The VA maintains a national CRC screening and surveillance electronic medical record reminder that prompts health care practitioners to order colon polyp surveillance based on interval recommendations from the index colonoscopy. This study reviewed all patients from the VAPHS panel with a reminder to undergo colonoscopy for screening for CRC or surveillance of colon polyps within 12 months from September 1, 2022.
Among patients with a reminder, 3 investigators reviewed index colonoscopy and pathology reports to identify CRC risk category, colonoscopy indication, procedural quality, and recommended repeat colonoscopy interval. Per the USMSTF guidelines, patients with incomplete colonoscopy or pathology records, high-risk indications (ie, personal history of inflammatory bowel disease, personal history of CRC, or family history of CRC), or inadequate bowel preparation (Boston Bowel Preparation Score < 6) were excluded. Additionally, patients who had CRC screening or surveillance discontinued due to age or comorbidities, had completed a subsequent follow-up colonoscopy, or were deceased at the time of review were excluded.
Retroactive Interval Reclassification
Among eligible patients, this study compared the repeat colonoscopy interval recommended by the prior endoscopist with those from the 2020 USMSTF guidelines. In cases where the interval was documented as a range of years, the lower end was considered the recommendation. Similarly, the lower end of the range from the 2020 USMSTF guidelines was used for the reclassified surveillance interval. Years extended per patient were quantified relative to September 1, 2023 (ie, 1 year after the review date). For example, if the index colonoscopy was completed on September 1, 2016, the initial surveillance recommendation was 5 years, and the reclassified recommendation was 7 years, the interval extension beyond September 1, 2023, was 0 years.
Furthermore, because index surveillance recommendations are not always guideline concordant, the years extended per patient were calculated by harmonizing the index endoscopist’s recommendations with the guidelines at the time of the index colonoscopy.5 For example, if the index colonoscopy was completed on September 1, 2018, and the endoscopist recommended a 5-year follow-up for a patient with average risk for CRC, adequate bowel preparation, and no colorectal polyps, that patient is eligible to extend their colonoscopy to September 1, 2028, based on guideline recommendations at the time of index endoscopy recommending that the next colonoscopy occur in 10 years. In this analysis the 2012 USMSTF guidelines were applied to all index colonoscopies completed in 2021 or earlier to allow time for adoption of the 2020 guidelines.
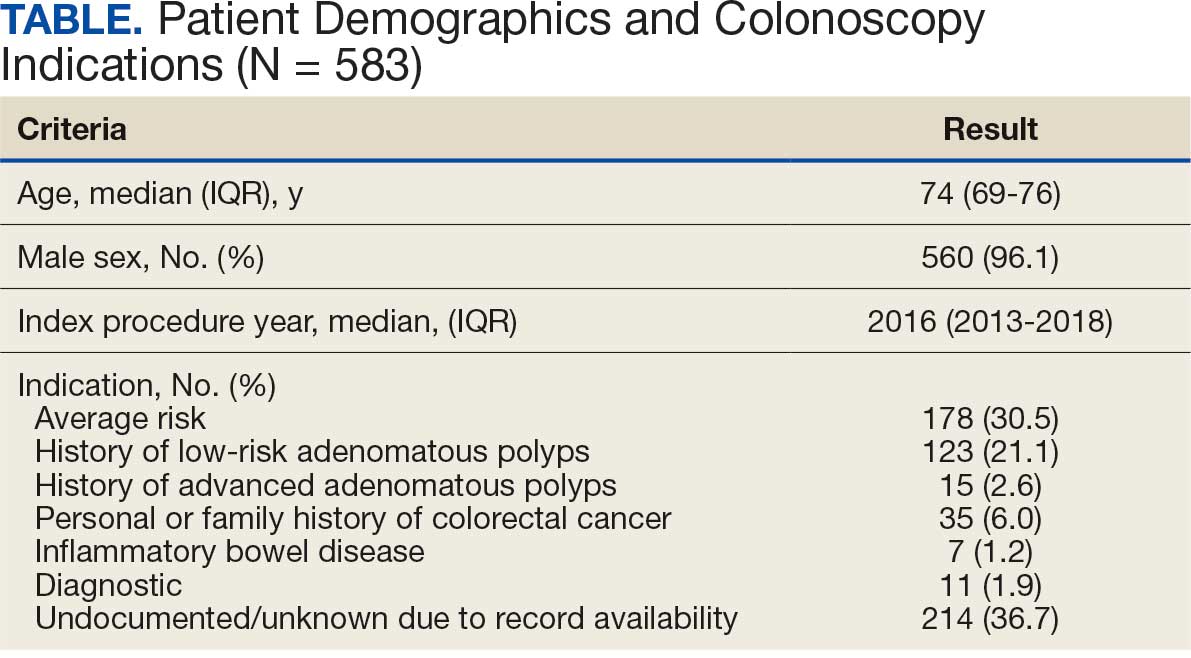
This project fulfilled a facility mandate to increase capacity to conduct endoscopic procedures. Institutional review board approval was not required by VAPHS policy relating to clinical operations projects. Approval for publication of clinical operations activity was obtained from the VAPHS facility director.
Results
Within 1 year of the September 1, 2022, review date, 637 patients receiving care at VAPHS had clinical reminders for an upcoming colonoscopy. Of these, 54 (8.4%) were already up to date or were deceased at the time of review. Of the 583 eligible patients, 96% were male, the median age was 74 years, the median index colonoscopy year was 2016, and 178 (30.5%) had an average-risk CRC screening indication at the index colonoscopy (Table).
Of the 583 patients due for colonoscopy, 331 (56.7%) had both colonoscopy and pathology reports available. The majority of those with incomplete records had the index colonoscopy completed outside VAPHS. Among these patients, 222 (67.0%) had adequate bowel preparation. Of those with adequate bowel preparation, 43 were not eligible for interval extension because of high-risk conditions and 13 were not eligible because there was no index surveillance interval recommendation from the index endoscopist. Of the patients due for colonoscopy, 166 (28.4%) were potentially eligible for surveillance interval extension (Figure).
Sixty-five (39.2%) of the 166 patients had 1 to 2 subcentimeter tubular adenomas on their index colonoscopy. Sixty-two patients were eligible for interval extension to 7 years, but this only resulted in ≥ 1 year of extension beyond the review date for 36 (6% of all 583 patients due for colonoscopy). The 36 patients were extended 63 years. By harmonizing the index endoscopists’ surveillance interval recommendation with the guideline at the time of the index colonoscopy, 29 additional patients could have their colonoscopy extended by ≥ 1 year. Harmonization extended colonoscopy intervals by 93 years. Retroactively applying the 2020 USMSTF polyp surveillance guidelines and harmonizing recommendations to guidelines extended the time of index colonoscopy by 153 years.
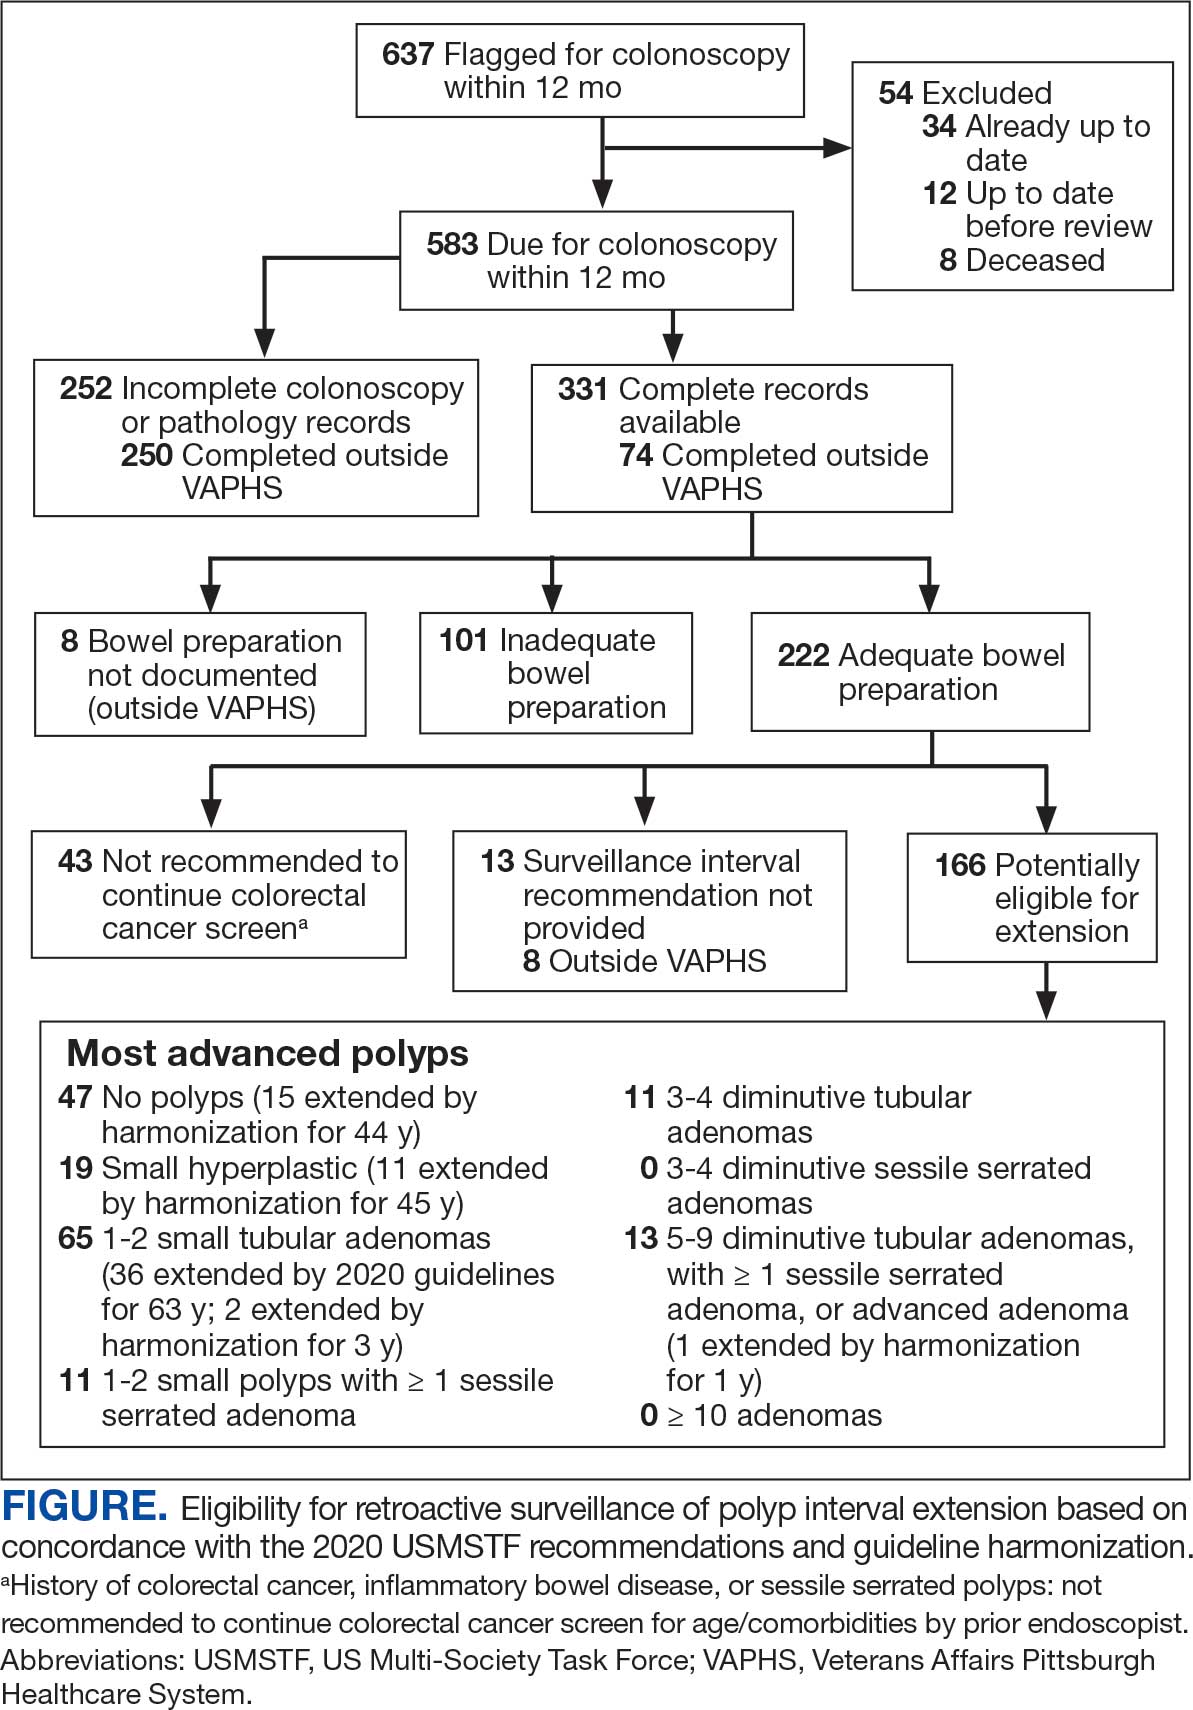
Discussion
With retroactive application of the 2020 USMSTF polyp surveillance guidelines, 6% of patients due for an upcoming colonoscopy could extend their follow-up by ≥ 1 year by extending the surveillance interval for 1 to 2 subcentimeter tubular adenomas to 7 years. An additional 5% of patients could extend their interval by harmonizing the index endoscopist’s interval recommendation with polyp surveillance guidelines at the time of the index colonoscopy. These findings are consistent with the results of 2 studies that demonstrated that about 14% of patients due for colonoscopy could have their interval extended.6,7 The current study enhances those insights by separating the contribution of 2020 USMSTF polyp surveillance guidelines from the contribution of harmonizing surveillance intervals with guidelines for other polyp histologies. This study found that there is an opportunity to improve endoscopic capacity by harmonizing recommendations with guidelines. This complements a 2023 study showing that even when knowledgeable about guidelines, clinicians do not necessarily follow recommendations.8 While this and previous research have identified that 11% to 14% of patients are eligible for extension, these individuals would also have to be willing to have their polyp surveillance intervals extended for there to be a real-world impact on endoscopic capacity. A 2024 study found that only 19% to 37% of patients with 1 to 2 small tubular adenomas were willing to have polyps surveillance interval extension.9 This suggests the actual effect on capacity may be even lower than reported.
Limitations
The overall impact of the 2020 USMSTF polyp surveillance guidelines on endoscopic capacity was blunted by the high prevalence of incomplete index colonoscopy records among the study population. Without data on bowel preparation quality or procedure indications, this study could not assess whether 43% of patients were eligible for surveillance interval extension. Most index colonoscopies with incomplete documentation were completed at community-care gastroenterology facilities. This high rate of incomplete documentation is likely generalizable to other VA health care systems—especially in the era of the Veterans Access, Choice, and Accountability Act of 2014, which increased veteran access to non-VA community care.10 Veterans due for colon polyp surveillance colonoscopies are more likely to have had their prior colonoscopy in community care compared with prior eras.11 Furthermore, because the VHA is among the most established integrated health care systems offering primary and subspecialty care in the US, private sector health care systems may have even greater rates of care fragmentation for longitudinal CRC screening and colon polyp surveillance, as these systems have only begun to regionally integrate recently.12,13
Another limitation is that nearly one-third of the individuals with documentation had inadequate bowel preparation for surveillance recommendations. This results in shorter surveillance follow-up colonoscopies and increases downstream demand for future colonoscopies. The low yield of extending colon polyp surveillance interval in this study emphasizes that improved efforts to obtain colonoscopy and pathology reports from community care, right-sizing the colon polyp surveillance intervals recommended by endoscopists, and improving quality of bowel preparation could have downstream health care system benefits in the future. These efforts could increase colonoscopy capacity at VA health care systems, thereby shortening colonoscopy wait times, decreasing fragmentation of care, and increasing the number of veterans who receive high-quality colonoscopies at VA health care systems.14
Conclusions
Eleven percent of patients in this study due for a colonoscopy could extend their follow-up by ≥ 1 year. About half of these extensions were directly due to the 2020 USMSTF polyp surveillance interval extension for 1 to 2 subcentimeter tubular adenomas. The rest resulted from harmonizing recommendations with guidelines at the time of the procedure. To determine whether retroactively applying polyp surveillance guidelines to follow-up interval recommendations will result in improved endoscopic capacity, health care system administrators should consider the degree of CRC screening care fragmentation in their patient population. Greater long-term gains in endoscopic capacity may be achieved by proactively supporting endoscopists in making guideline-concordant screening recommendations at the time of colonoscopy.
Gupta S, Lieberman D, Anderson JC, et al. Recommendations for follow-up after colonoscopy and polypectomy: a consensus update by the US Multi-Society Task Force on Colorectal Cancer. Gastrointest Endosc. 2020;91:463-485. doi:10.1016/j.gie.2020.01.014
Dubé C, Yakubu M, McCurdy BR, et al. Risk of advanced adenoma, colorectal cancer, and colorectal cancer mortality in people with low-risk adenomas at baseline colonoscopy: a systematic review and meta-analysis. Am J Gastroenterol. 2017;112:1790-1801. doi:10.1038/ajg.2017.360
Click B, Pinsky PF, Hickey T, Doroudi M, Shoen RE. Association of colonoscopy adenoma findings with long-term colorectal cancer incidence. JAMA. 2018;319:2021-2031. doi:10.1001/jama.2018.5809
US Preventive Services Task Force, Davidson KW, Barry MJ, et al. Screening for colorectal cancer: US Preventive Services Task Force recommendation statement. JAMA. 2021;325:1965-1977. doi:10.1001/jama.2021.6238
Djinbachian R, Dubé AJ, Durand M, et al. Adherence to post-polypectomy surveillance guidelines: a systematic review and meta-analysis. Endoscopy. 2019;51:673-683. doi:10.1055/a-0865-2082
Gawron AJ, Kaltenbach T, Dominitz JA. The impact of the coronavirus disease-19 pandemic on access to endoscopy procedures in the VA healthcare system. Gastroenterology. 2020;159:1216-1220.e1. doi:10.1053/j.gastro.2020.07.033
Xiao AH, Chang SY, Stevoff CG, Komanduri S, Pandolfino JE, Keswani RN. Adoption of multi-society guidelines facilitates value-based reduction in screening and surveillance colonoscopy volume during COVID-19 pandemic. Dig Dis Sci. 2021;66:2578-2584. doi:10.1007/s10620-020-06539-1
Dong J, Wang LF, Ardolino E, Feuerstein JD. Real-world compliance with the 2020 U.S. Multi-Society Task Force on Colorectal Cancer polypectomy surveillance guidelines: an observational study. Gastrointest Endosc. 2023;97:350-356.e3. doi:10.1016/j.gie.2022.08.020
Lee JK, Koripella PC, Jensen CD, et al. Randomized trial of patient outreach approaches to de-implement outdated colonoscopy surveillance intervals. Clin Gastroenterol Hepatol. 2024;22:1315-1322.e7. doi:10.1016/j.cgh.2023.12.027
Veterans Access, Choice, and Accountability Act of 2014, HR 3230, 113th Cong (2014). Accessed September 8, 2025. https://www.congress.gov/bill/113th-congress/house-bill/3230
Dueker JM, Khalid A. Performance of the Veterans Choice Program for improving access to colonoscopy at a tertiary VA facility. Fed Pract. 2020;37:224-228.
Oliver A. The Veterans Health Administration: an American success story? Milbank Q. 2007;85:5-35. doi:10.1111/j.1468-0009.2007.00475.x
Furukawa MF, Machta RM, Barrett KA, et al. Landscape of health systems in the United States. Med Care Res Rev. 2020;77:357-366. doi:10.1177/1077558718823130
Petros V, Tsambikos E, Madhoun M, Tierney WM. Impact of community referral on colonoscopy quality metrics in a Veterans Affairs Medical Center. Clin Transl Gastroenterol. 2022;13:e00460. doi:10.14309/ctg.0000000000000460
In 2020, the US Multi-Society Task Force (USMSTF) on Colorectal Cancer (CRC) increased the recommended colon polyp surveillance interval for 1 to 2 subcentimeter tubular adenomas from 5 to 10 years to 7 to 10 years.1 This change was prompted by emerging research indicating that rates of CRC and advanced neoplasia among patients with a history of only 1 to 2 subcentimeter tubular adenomas are lower than initially estimated.2,3 This extension provides an opportunity to increase endoscopy capacity and improve access to colonoscopies by retroactively applying the 2020 guidelines to surveillance interval recommendations made before their introduction. For example, based on the updated guidelines, patients previously recommended to undergo colon polyp surveillance colonoscopy 5 years after an index colonoscopy could extend their surveillance interval by 2 to 5 years. Increasing endoscopic capacity could address the growing demand for colonoscopies from new screening guidelines that reduced the age of initial CRC screening from 50 years to 45 years and the backlog of procedures due to COVID-19 restrictions.4
As part of a project to increase endoscopic capacity at the US Department of Veterans Affairs (VA) Pittsburgh Healthcare System (VAPHS), this study assessed the potential impact of retroactively applying the 2020 USMSTF polyp surveillance guidelines on endoscopic capacity. These results may be informative for other VA and private-sector health care systems seeking to identify strategies to improve endoscopy capacity.
Methods
VAPHS is an integrated health care system in the Veterans Health Administration (VHA) serving 85,000 patients across 8 health care institutions in Pennsylvania, Ohio, and West Virginia. VAPHS manages colorectal screening recommendations for patients receiving medical care in the health care system regardless of whether their prior colonoscopy was performed at VAPHS or external facilities. The VA maintains a national CRC screening and surveillance electronic medical record reminder that prompts health care practitioners to order colon polyp surveillance based on interval recommendations from the index colonoscopy. This study reviewed all patients from the VAPHS panel with a reminder to undergo colonoscopy for screening for CRC or surveillance of colon polyps within 12 months from September 1, 2022.
Among patients with a reminder, 3 investigators reviewed index colonoscopy and pathology reports to identify CRC risk category, colonoscopy indication, procedural quality, and recommended repeat colonoscopy interval. Per the USMSTF guidelines, patients with incomplete colonoscopy or pathology records, high-risk indications (ie, personal history of inflammatory bowel disease, personal history of CRC, or family history of CRC), or inadequate bowel preparation (Boston Bowel Preparation Score < 6) were excluded. Additionally, patients who had CRC screening or surveillance discontinued due to age or comorbidities, had completed a subsequent follow-up colonoscopy, or were deceased at the time of review were excluded.
Retroactive Interval Reclassification
Among eligible patients, this study compared the repeat colonoscopy interval recommended by the prior endoscopist with those from the 2020 USMSTF guidelines. In cases where the interval was documented as a range of years, the lower end was considered the recommendation. Similarly, the lower end of the range from the 2020 USMSTF guidelines was used for the reclassified surveillance interval. Years extended per patient were quantified relative to September 1, 2023 (ie, 1 year after the review date). For example, if the index colonoscopy was completed on September 1, 2016, the initial surveillance recommendation was 5 years, and the reclassified recommendation was 7 years, the interval extension beyond September 1, 2023, was 0 years.
Furthermore, because index surveillance recommendations are not always guideline concordant, the years extended per patient were calculated by harmonizing the index endoscopist’s recommendations with the guidelines at the time of the index colonoscopy.5 For example, if the index colonoscopy was completed on September 1, 2018, and the endoscopist recommended a 5-year follow-up for a patient with average risk for CRC, adequate bowel preparation, and no colorectal polyps, that patient is eligible to extend their colonoscopy to September 1, 2028, based on guideline recommendations at the time of index endoscopy recommending that the next colonoscopy occur in 10 years. In this analysis the 2012 USMSTF guidelines were applied to all index colonoscopies completed in 2021 or earlier to allow time for adoption of the 2020 guidelines.
This project fulfilled a facility mandate to increase capacity to conduct endoscopic procedures. Institutional review board approval was not required by VAPHS policy relating to clinical operations projects. Approval for publication of clinical operations activity was obtained from the VAPHS facility director.
Results
Within 1 year of the September 1, 2022, review date, 637 patients receiving care at VAPHS had clinical reminders for an upcoming colonoscopy. Of these, 54 (8.4%) were already up to date or were deceased at the time of review. Of the 583 eligible patients, 96% were male, the median age was 74 years, the median index colonoscopy year was 2016, and 178 (30.5%) had an average-risk CRC screening indication at the index colonoscopy (Table).
Of the 583 patients due for colonoscopy, 331 (56.7%) had both colonoscopy and pathology reports available. The majority of those with incomplete records had the index colonoscopy completed outside VAPHS. Among these patients, 222 (67.0%) had adequate bowel preparation. Of those with adequate bowel preparation, 43 were not eligible for interval extension because of high-risk conditions and 13 were not eligible because there was no index surveillance interval recommendation from the index endoscopist. Of the patients due for colonoscopy, 166 (28.4%) were potentially eligible for surveillance interval extension (Figure).
Sixty-five (39.2%) of the 166 patients had 1 to 2 subcentimeter tubular adenomas on their index colonoscopy. Sixty-two patients were eligible for interval extension to 7 years, but this only resulted in ≥ 1 year of extension beyond the review date for 36 (6% of all 583 patients due for colonoscopy). The 36 patients were extended 63 years. By harmonizing the index endoscopists’ surveillance interval recommendation with the guideline at the time of the index colonoscopy, 29 additional patients could have their colonoscopy extended by ≥ 1 year. Harmonization extended colonoscopy intervals by 93 years. Retroactively applying the 2020 USMSTF polyp surveillance guidelines and harmonizing recommendations to guidelines extended the time of index colonoscopy by 153 years.
Discussion
With retroactive application of the 2020 USMSTF polyp surveillance guidelines, 6% of patients due for an upcoming colonoscopy could extend their follow-up by ≥ 1 year by extending the surveillance interval for 1 to 2 subcentimeter tubular adenomas to 7 years. An additional 5% of patients could extend their interval by harmonizing the index endoscopist’s interval recommendation with polyp surveillance guidelines at the time of the index colonoscopy. These findings are consistent with the results of 2 studies that demonstrated that about 14% of patients due for colonoscopy could have their interval extended.6,7 The current study enhances those insights by separating the contribution of 2020 USMSTF polyp surveillance guidelines from the contribution of harmonizing surveillance intervals with guidelines for other polyp histologies. This study found that there is an opportunity to improve endoscopic capacity by harmonizing recommendations with guidelines. This complements a 2023 study showing that even when knowledgeable about guidelines, clinicians do not necessarily follow recommendations.8 While this and previous research have identified that 11% to 14% of patients are eligible for extension, these individuals would also have to be willing to have their polyp surveillance intervals extended for there to be a real-world impact on endoscopic capacity. A 2024 study found that only 19% to 37% of patients with 1 to 2 small tubular adenomas were willing to have polyps surveillance interval extension.9 This suggests the actual effect on capacity may be even lower than reported.
Limitations
The overall impact of the 2020 USMSTF polyp surveillance guidelines on endoscopic capacity was blunted by the high prevalence of incomplete index colonoscopy records among the study population. Without data on bowel preparation quality or procedure indications, this study could not assess whether 43% of patients were eligible for surveillance interval extension. Most index colonoscopies with incomplete documentation were completed at community-care gastroenterology facilities. This high rate of incomplete documentation is likely generalizable to other VA health care systems—especially in the era of the Veterans Access, Choice, and Accountability Act of 2014, which increased veteran access to non-VA community care.10 Veterans due for colon polyp surveillance colonoscopies are more likely to have had their prior colonoscopy in community care compared with prior eras.11 Furthermore, because the VHA is among the most established integrated health care systems offering primary and subspecialty care in the US, private sector health care systems may have even greater rates of care fragmentation for longitudinal CRC screening and colon polyp surveillance, as these systems have only begun to regionally integrate recently.12,13
Another limitation is that nearly one-third of the individuals with documentation had inadequate bowel preparation for surveillance recommendations. This results in shorter surveillance follow-up colonoscopies and increases downstream demand for future colonoscopies. The low yield of extending colon polyp surveillance interval in this study emphasizes that improved efforts to obtain colonoscopy and pathology reports from community care, right-sizing the colon polyp surveillance intervals recommended by endoscopists, and improving quality of bowel preparation could have downstream health care system benefits in the future. These efforts could increase colonoscopy capacity at VA health care systems, thereby shortening colonoscopy wait times, decreasing fragmentation of care, and increasing the number of veterans who receive high-quality colonoscopies at VA health care systems.14
Conclusions
Eleven percent of patients in this study due for a colonoscopy could extend their follow-up by ≥ 1 year. About half of these extensions were directly due to the 2020 USMSTF polyp surveillance interval extension for 1 to 2 subcentimeter tubular adenomas. The rest resulted from harmonizing recommendations with guidelines at the time of the procedure. To determine whether retroactively applying polyp surveillance guidelines to follow-up interval recommendations will result in improved endoscopic capacity, health care system administrators should consider the degree of CRC screening care fragmentation in their patient population. Greater long-term gains in endoscopic capacity may be achieved by proactively supporting endoscopists in making guideline-concordant screening recommendations at the time of colonoscopy.
In 2020, the US Multi-Society Task Force (USMSTF) on Colorectal Cancer (CRC) increased the recommended colon polyp surveillance interval for 1 to 2 subcentimeter tubular adenomas from 5 to 10 years to 7 to 10 years.1 This change was prompted by emerging research indicating that rates of CRC and advanced neoplasia among patients with a history of only 1 to 2 subcentimeter tubular adenomas are lower than initially estimated.2,3 This extension provides an opportunity to increase endoscopy capacity and improve access to colonoscopies by retroactively applying the 2020 guidelines to surveillance interval recommendations made before their introduction. For example, based on the updated guidelines, patients previously recommended to undergo colon polyp surveillance colonoscopy 5 years after an index colonoscopy could extend their surveillance interval by 2 to 5 years. Increasing endoscopic capacity could address the growing demand for colonoscopies from new screening guidelines that reduced the age of initial CRC screening from 50 years to 45 years and the backlog of procedures due to COVID-19 restrictions.4
As part of a project to increase endoscopic capacity at the US Department of Veterans Affairs (VA) Pittsburgh Healthcare System (VAPHS), this study assessed the potential impact of retroactively applying the 2020 USMSTF polyp surveillance guidelines on endoscopic capacity. These results may be informative for other VA and private-sector health care systems seeking to identify strategies to improve endoscopy capacity.
Methods
VAPHS is an integrated health care system in the Veterans Health Administration (VHA) serving 85,000 patients across 8 health care institutions in Pennsylvania, Ohio, and West Virginia. VAPHS manages colorectal screening recommendations for patients receiving medical care in the health care system regardless of whether their prior colonoscopy was performed at VAPHS or external facilities. The VA maintains a national CRC screening and surveillance electronic medical record reminder that prompts health care practitioners to order colon polyp surveillance based on interval recommendations from the index colonoscopy. This study reviewed all patients from the VAPHS panel with a reminder to undergo colonoscopy for screening for CRC or surveillance of colon polyps within 12 months from September 1, 2022.
Among patients with a reminder, 3 investigators reviewed index colonoscopy and pathology reports to identify CRC risk category, colonoscopy indication, procedural quality, and recommended repeat colonoscopy interval. Per the USMSTF guidelines, patients with incomplete colonoscopy or pathology records, high-risk indications (ie, personal history of inflammatory bowel disease, personal history of CRC, or family history of CRC), or inadequate bowel preparation (Boston Bowel Preparation Score < 6) were excluded. Additionally, patients who had CRC screening or surveillance discontinued due to age or comorbidities, had completed a subsequent follow-up colonoscopy, or were deceased at the time of review were excluded.
Retroactive Interval Reclassification
Among eligible patients, this study compared the repeat colonoscopy interval recommended by the prior endoscopist with those from the 2020 USMSTF guidelines. In cases where the interval was documented as a range of years, the lower end was considered the recommendation. Similarly, the lower end of the range from the 2020 USMSTF guidelines was used for the reclassified surveillance interval. Years extended per patient were quantified relative to September 1, 2023 (ie, 1 year after the review date). For example, if the index colonoscopy was completed on September 1, 2016, the initial surveillance recommendation was 5 years, and the reclassified recommendation was 7 years, the interval extension beyond September 1, 2023, was 0 years.
Furthermore, because index surveillance recommendations are not always guideline concordant, the years extended per patient were calculated by harmonizing the index endoscopist’s recommendations with the guidelines at the time of the index colonoscopy.5 For example, if the index colonoscopy was completed on September 1, 2018, and the endoscopist recommended a 5-year follow-up for a patient with average risk for CRC, adequate bowel preparation, and no colorectal polyps, that patient is eligible to extend their colonoscopy to September 1, 2028, based on guideline recommendations at the time of index endoscopy recommending that the next colonoscopy occur in 10 years. In this analysis the 2012 USMSTF guidelines were applied to all index colonoscopies completed in 2021 or earlier to allow time for adoption of the 2020 guidelines.
This project fulfilled a facility mandate to increase capacity to conduct endoscopic procedures. Institutional review board approval was not required by VAPHS policy relating to clinical operations projects. Approval for publication of clinical operations activity was obtained from the VAPHS facility director.
Results
Within 1 year of the September 1, 2022, review date, 637 patients receiving care at VAPHS had clinical reminders for an upcoming colonoscopy. Of these, 54 (8.4%) were already up to date or were deceased at the time of review. Of the 583 eligible patients, 96% were male, the median age was 74 years, the median index colonoscopy year was 2016, and 178 (30.5%) had an average-risk CRC screening indication at the index colonoscopy (Table).
Of the 583 patients due for colonoscopy, 331 (56.7%) had both colonoscopy and pathology reports available. The majority of those with incomplete records had the index colonoscopy completed outside VAPHS. Among these patients, 222 (67.0%) had adequate bowel preparation. Of those with adequate bowel preparation, 43 were not eligible for interval extension because of high-risk conditions and 13 were not eligible because there was no index surveillance interval recommendation from the index endoscopist. Of the patients due for colonoscopy, 166 (28.4%) were potentially eligible for surveillance interval extension (Figure).
Sixty-five (39.2%) of the 166 patients had 1 to 2 subcentimeter tubular adenomas on their index colonoscopy. Sixty-two patients were eligible for interval extension to 7 years, but this only resulted in ≥ 1 year of extension beyond the review date for 36 (6% of all 583 patients due for colonoscopy). The 36 patients were extended 63 years. By harmonizing the index endoscopists’ surveillance interval recommendation with the guideline at the time of the index colonoscopy, 29 additional patients could have their colonoscopy extended by ≥ 1 year. Harmonization extended colonoscopy intervals by 93 years. Retroactively applying the 2020 USMSTF polyp surveillance guidelines and harmonizing recommendations to guidelines extended the time of index colonoscopy by 153 years.
Discussion
With retroactive application of the 2020 USMSTF polyp surveillance guidelines, 6% of patients due for an upcoming colonoscopy could extend their follow-up by ≥ 1 year by extending the surveillance interval for 1 to 2 subcentimeter tubular adenomas to 7 years. An additional 5% of patients could extend their interval by harmonizing the index endoscopist’s interval recommendation with polyp surveillance guidelines at the time of the index colonoscopy. These findings are consistent with the results of 2 studies that demonstrated that about 14% of patients due for colonoscopy could have their interval extended.6,7 The current study enhances those insights by separating the contribution of 2020 USMSTF polyp surveillance guidelines from the contribution of harmonizing surveillance intervals with guidelines for other polyp histologies. This study found that there is an opportunity to improve endoscopic capacity by harmonizing recommendations with guidelines. This complements a 2023 study showing that even when knowledgeable about guidelines, clinicians do not necessarily follow recommendations.8 While this and previous research have identified that 11% to 14% of patients are eligible for extension, these individuals would also have to be willing to have their polyp surveillance intervals extended for there to be a real-world impact on endoscopic capacity. A 2024 study found that only 19% to 37% of patients with 1 to 2 small tubular adenomas were willing to have polyps surveillance interval extension.9 This suggests the actual effect on capacity may be even lower than reported.
Limitations
The overall impact of the 2020 USMSTF polyp surveillance guidelines on endoscopic capacity was blunted by the high prevalence of incomplete index colonoscopy records among the study population. Without data on bowel preparation quality or procedure indications, this study could not assess whether 43% of patients were eligible for surveillance interval extension. Most index colonoscopies with incomplete documentation were completed at community-care gastroenterology facilities. This high rate of incomplete documentation is likely generalizable to other VA health care systems—especially in the era of the Veterans Access, Choice, and Accountability Act of 2014, which increased veteran access to non-VA community care.10 Veterans due for colon polyp surveillance colonoscopies are more likely to have had their prior colonoscopy in community care compared with prior eras.11 Furthermore, because the VHA is among the most established integrated health care systems offering primary and subspecialty care in the US, private sector health care systems may have even greater rates of care fragmentation for longitudinal CRC screening and colon polyp surveillance, as these systems have only begun to regionally integrate recently.12,13
Another limitation is that nearly one-third of the individuals with documentation had inadequate bowel preparation for surveillance recommendations. This results in shorter surveillance follow-up colonoscopies and increases downstream demand for future colonoscopies. The low yield of extending colon polyp surveillance interval in this study emphasizes that improved efforts to obtain colonoscopy and pathology reports from community care, right-sizing the colon polyp surveillance intervals recommended by endoscopists, and improving quality of bowel preparation could have downstream health care system benefits in the future. These efforts could increase colonoscopy capacity at VA health care systems, thereby shortening colonoscopy wait times, decreasing fragmentation of care, and increasing the number of veterans who receive high-quality colonoscopies at VA health care systems.14
Conclusions
Eleven percent of patients in this study due for a colonoscopy could extend their follow-up by ≥ 1 year. About half of these extensions were directly due to the 2020 USMSTF polyp surveillance interval extension for 1 to 2 subcentimeter tubular adenomas. The rest resulted from harmonizing recommendations with guidelines at the time of the procedure. To determine whether retroactively applying polyp surveillance guidelines to follow-up interval recommendations will result in improved endoscopic capacity, health care system administrators should consider the degree of CRC screening care fragmentation in their patient population. Greater long-term gains in endoscopic capacity may be achieved by proactively supporting endoscopists in making guideline-concordant screening recommendations at the time of colonoscopy.
Gupta S, Lieberman D, Anderson JC, et al. Recommendations for follow-up after colonoscopy and polypectomy: a consensus update by the US Multi-Society Task Force on Colorectal Cancer. Gastrointest Endosc. 2020;91:463-485. doi:10.1016/j.gie.2020.01.014
Dubé C, Yakubu M, McCurdy BR, et al. Risk of advanced adenoma, colorectal cancer, and colorectal cancer mortality in people with low-risk adenomas at baseline colonoscopy: a systematic review and meta-analysis. Am J Gastroenterol. 2017;112:1790-1801. doi:10.1038/ajg.2017.360
Click B, Pinsky PF, Hickey T, Doroudi M, Shoen RE. Association of colonoscopy adenoma findings with long-term colorectal cancer incidence. JAMA. 2018;319:2021-2031. doi:10.1001/jama.2018.5809
US Preventive Services Task Force, Davidson KW, Barry MJ, et al. Screening for colorectal cancer: US Preventive Services Task Force recommendation statement. JAMA. 2021;325:1965-1977. doi:10.1001/jama.2021.6238
Djinbachian R, Dubé AJ, Durand M, et al. Adherence to post-polypectomy surveillance guidelines: a systematic review and meta-analysis. Endoscopy. 2019;51:673-683. doi:10.1055/a-0865-2082
Gawron AJ, Kaltenbach T, Dominitz JA. The impact of the coronavirus disease-19 pandemic on access to endoscopy procedures in the VA healthcare system. Gastroenterology. 2020;159:1216-1220.e1. doi:10.1053/j.gastro.2020.07.033
Xiao AH, Chang SY, Stevoff CG, Komanduri S, Pandolfino JE, Keswani RN. Adoption of multi-society guidelines facilitates value-based reduction in screening and surveillance colonoscopy volume during COVID-19 pandemic. Dig Dis Sci. 2021;66:2578-2584. doi:10.1007/s10620-020-06539-1
Dong J, Wang LF, Ardolino E, Feuerstein JD. Real-world compliance with the 2020 U.S. Multi-Society Task Force on Colorectal Cancer polypectomy surveillance guidelines: an observational study. Gastrointest Endosc. 2023;97:350-356.e3. doi:10.1016/j.gie.2022.08.020
Lee JK, Koripella PC, Jensen CD, et al. Randomized trial of patient outreach approaches to de-implement outdated colonoscopy surveillance intervals. Clin Gastroenterol Hepatol. 2024;22:1315-1322.e7. doi:10.1016/j.cgh.2023.12.027
Veterans Access, Choice, and Accountability Act of 2014, HR 3230, 113th Cong (2014). Accessed September 8, 2025. https://www.congress.gov/bill/113th-congress/house-bill/3230
Dueker JM, Khalid A. Performance of the Veterans Choice Program for improving access to colonoscopy at a tertiary VA facility. Fed Pract. 2020;37:224-228.
Oliver A. The Veterans Health Administration: an American success story? Milbank Q. 2007;85:5-35. doi:10.1111/j.1468-0009.2007.00475.x
Furukawa MF, Machta RM, Barrett KA, et al. Landscape of health systems in the United States. Med Care Res Rev. 2020;77:357-366. doi:10.1177/1077558718823130
Petros V, Tsambikos E, Madhoun M, Tierney WM. Impact of community referral on colonoscopy quality metrics in a Veterans Affairs Medical Center. Clin Transl Gastroenterol. 2022;13:e00460. doi:10.14309/ctg.0000000000000460
Gupta S, Lieberman D, Anderson JC, et al. Recommendations for follow-up after colonoscopy and polypectomy: a consensus update by the US Multi-Society Task Force on Colorectal Cancer. Gastrointest Endosc. 2020;91:463-485. doi:10.1016/j.gie.2020.01.014
Dubé C, Yakubu M, McCurdy BR, et al. Risk of advanced adenoma, colorectal cancer, and colorectal cancer mortality in people with low-risk adenomas at baseline colonoscopy: a systematic review and meta-analysis. Am J Gastroenterol. 2017;112:1790-1801. doi:10.1038/ajg.2017.360
Click B, Pinsky PF, Hickey T, Doroudi M, Shoen RE. Association of colonoscopy adenoma findings with long-term colorectal cancer incidence. JAMA. 2018;319:2021-2031. doi:10.1001/jama.2018.5809
US Preventive Services Task Force, Davidson KW, Barry MJ, et al. Screening for colorectal cancer: US Preventive Services Task Force recommendation statement. JAMA. 2021;325:1965-1977. doi:10.1001/jama.2021.6238
Djinbachian R, Dubé AJ, Durand M, et al. Adherence to post-polypectomy surveillance guidelines: a systematic review and meta-analysis. Endoscopy. 2019;51:673-683. doi:10.1055/a-0865-2082
Gawron AJ, Kaltenbach T, Dominitz JA. The impact of the coronavirus disease-19 pandemic on access to endoscopy procedures in the VA healthcare system. Gastroenterology. 2020;159:1216-1220.e1. doi:10.1053/j.gastro.2020.07.033
Xiao AH, Chang SY, Stevoff CG, Komanduri S, Pandolfino JE, Keswani RN. Adoption of multi-society guidelines facilitates value-based reduction in screening and surveillance colonoscopy volume during COVID-19 pandemic. Dig Dis Sci. 2021;66:2578-2584. doi:10.1007/s10620-020-06539-1
Dong J, Wang LF, Ardolino E, Feuerstein JD. Real-world compliance with the 2020 U.S. Multi-Society Task Force on Colorectal Cancer polypectomy surveillance guidelines: an observational study. Gastrointest Endosc. 2023;97:350-356.e3. doi:10.1016/j.gie.2022.08.020
Lee JK, Koripella PC, Jensen CD, et al. Randomized trial of patient outreach approaches to de-implement outdated colonoscopy surveillance intervals. Clin Gastroenterol Hepatol. 2024;22:1315-1322.e7. doi:10.1016/j.cgh.2023.12.027
Veterans Access, Choice, and Accountability Act of 2014, HR 3230, 113th Cong (2014). Accessed September 8, 2025. https://www.congress.gov/bill/113th-congress/house-bill/3230
Dueker JM, Khalid A. Performance of the Veterans Choice Program for improving access to colonoscopy at a tertiary VA facility. Fed Pract. 2020;37:224-228.
Oliver A. The Veterans Health Administration: an American success story? Milbank Q. 2007;85:5-35. doi:10.1111/j.1468-0009.2007.00475.x
Furukawa MF, Machta RM, Barrett KA, et al. Landscape of health systems in the United States. Med Care Res Rev. 2020;77:357-366. doi:10.1177/1077558718823130
Petros V, Tsambikos E, Madhoun M, Tierney WM. Impact of community referral on colonoscopy quality metrics in a Veterans Affairs Medical Center. Clin Transl Gastroenterol. 2022;13:e00460. doi:10.14309/ctg.0000000000000460
Impact of Retroactive Application of Updated Surveillance Guidelines on Endoscopy Center Capacity at a Large VA Health Care System
Impact of Retroactive Application of Updated Surveillance Guidelines on Endoscopy Center Capacity at a Large VA Health Care System
A Case Report of Unanticipated Difficult Intubation Due to Posterior Tracheal Angulation
A Case Report of Unanticipated Difficult Intubation Due to Posterior Tracheal Angulation
Tracheal deviation mostly occurs from mechanical compression of the trachea, and can be caused by a variety of clinical conditions, including trauma,¹ pharyngeal abscess,² neck hematoma,³ thyroid enlargement,4 and kyphoscoliosis.5 These conditions often result in lateral tracheal deviation, which can be associated with tracheal compression and reduction in tracheal caliber.
Anterior-posterior (A-P) tracheal deviation has rarely been reported. Kyphoscoliosis, scarring after a tracheostomy, or innominate vein compression are probable causes of A-P tracheal deviation and can be associated with tracheal narrowing and vascular fistula formation. This report describes a case of difficult endotracheal tube (ETT) advancement secondary to unexpected acute posterior tracheal deviation encountered during cardiopulmonary resuscitation (CPR). A waiver of patient consent was obtained from the Human Research Protection Program at the US Department of Veterans Affairs (VA) Puget Sound Health Care System.
Case Presentation
A 50-year-old male with a history of chronic cerebral venous sinus thrombosis and taking enoxaparin, presented to the emergency department for recurrent headaches. He experienced sudden cardiac arrest, and CPR in the form of chest compression and bag mask ventilation was immediately initiated. With the patient's head in an extended position and using a video laryngoscope, a Cormack–Lehane grade 1 view of the glottic opening was obtained and the trachea was intubated with an 8 mm (internal diameter) polyvinyl chloride ETT. Tracheal intubation was confirmed by utilizing continuous EtCO2 monitoring. The ETT was secured at 22 cm measured at the teeth.
After about 40 minutes of CPR, spontaneous circulation restarted and a portable A-P chest X-ray with the head in a neutral position indicated the ETT tip was at the level of the first rib (Figure 1). This finding, along with a persistent air leak, prompted blind advancement of the ETT to 26 cm at the teeth, but resistance to advancement was noted. A subsequent chest computed tomography (CT) with the head in a neutral position revealed the ETT remained inappropriately positioned with the tip measured 8.2 cm above the carina (Figure 2A). Concurrently, a sagittal CT view demonstrated significant posterior deviation of the mid and lower trachea. This deviation was determined to be the most likely cause of the difficulty encountered in advancing the ETT. No masses or lesions contributing to the acute tracheal angulation could be identified. Comparing CT imaging from 2 months prior, the trachea was of normal caliber and ordinarily aligned with the vertebral column (Figure 2B).
With the patient in Fowler position with the head midline, a flexible fiber-optic bronchoscopy was performed. Acute, almost 90-degree tracheal angulation was encountered and navigated by retroflexion of the flexible bronchoscope. Once the posterior tracheal wall was encountered, retroflexion was relaxed and the carina was visualized. The bronchoscope tip was placed near the carina, and the ETT was advanced over the fiber-optic bronchoscope to terminate 3 cm above the carina. A subsequent chest X-ray confirmed appropriate ETT position (Figure 3).
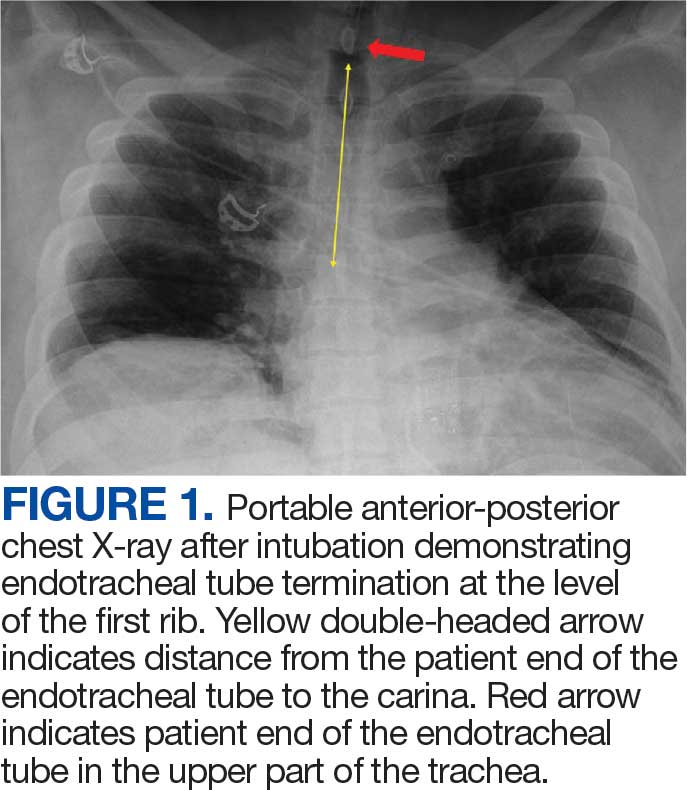
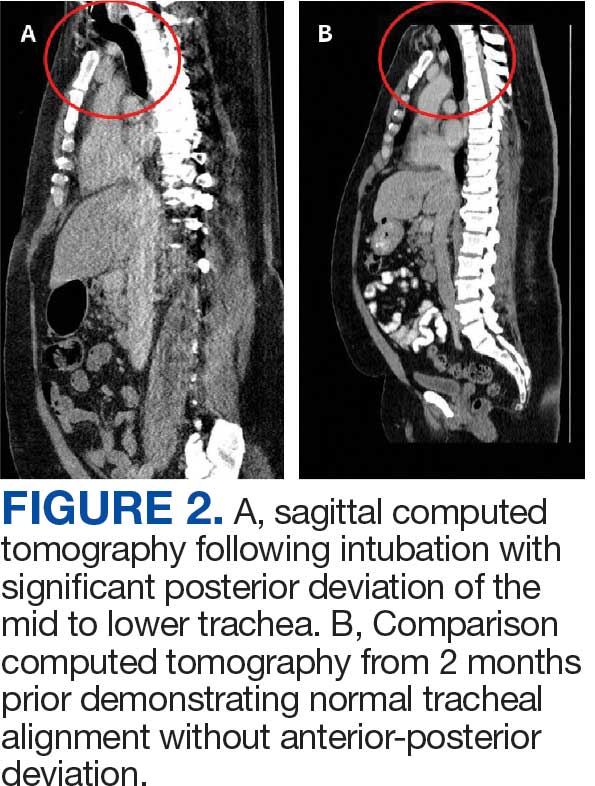
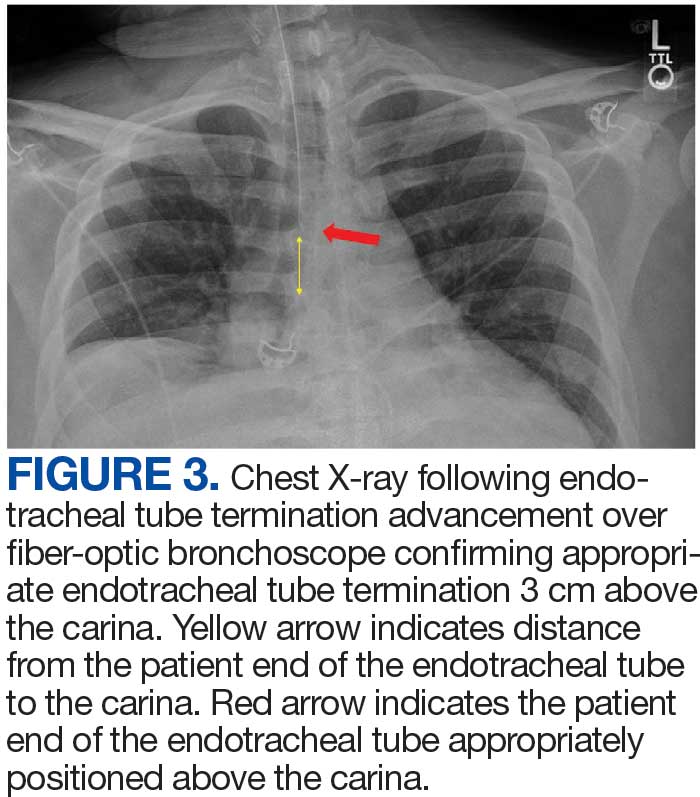
Discussion
Tracheal deviation in the A-P dimension resulting in difficult tracheal intubation has rarely been reported. Previous reports have described anatomical lesions contributing to similar tracheal deviation, such as retro-tracheal thyroid tissue, pronounced cervical lordosis, and severe kyphoscoliosis with destructive cervical fusion.5-8 In a study of the anatomical correlation of double lumen tube placement while using positron emission tomography CT, Cameron et al evaluated the size and angulation of the glottis and proximal trachea using calibrated CT measurements and an online digital protractor and note nearly perfect alignment of the pharynx and glottis.9 However, the trachea turned posteriorly relative to the glottis, resulting in an overall posterior angle of the proximal trachea compared to the glottis of 30.4 to 50.1 degrees, with no sex differences. The need to maneuver similar proximal tracheal angulation during endotracheal intubation has been reported as a cause of difficult intubation.10
In this case, the posterior angulation was not encountered in the proximal trachea but rather in the more distal trachea. The extreme A-P tracheal deviation was not associated with any identifiable masses or lesions. A CT performed 2 months prior demonstrated normal tracheal anatomy, and there was no interval history of neck trauma or tracheal obstruction suggestive of a likely cause for this deviation. This change in the patient’s tracheal anatomy was only discovered after CPR had been performed and as part of the workup for cardiac arrest. Iatrogenic injuries are known to occur during CPR. Common CPR-related airway injuries include tracheal mucosal injury from traumatic intubation and bony injuries to the chest wall from compressions.11 Laryngeal cartilage damage from intubation may also occur, but tracheal displacement following CPR has not been previously reported.11
This case of tracheal deviation is unlikely to be related to patient positioning, as the A-P deviation persisted in 3 separate head and neck alignments. First, during indirect laryngoscopy, performed in a standard sniffing position. Second, during the CT, performed in the supine position, with no head support. The acute A-P deviation seen in Figure 2 was clearly noted in this position. Lastly, flexible fiber-optic bronchoscopy was performed in a semiupright position with the head supported on a pillow. A-P deviation was encountered and navigated in this position during flexible fiber-optic guided ETT repositioning.
Using magnetic resonance imaging, alterations in the alignment of pharyngeal and tracheal axes have been described with changes in neck positioning; however, tracheal deviation has not been described with changes in head and neck alignment.12 Although the clinical presentation in this case was consistent with prior reports, we were unable to identify any previously reported anatomic cause for the tracheal deviation.5,6,8 Initial glottic visualization with a video laryngoscope was unremarkable, but resistance to sufficient ETT advancement past the vocal cords and a persistent air leak due to cuff herniation through the glottic opening was noticeable. The ETT was maneuvered to an appropriate position in the trachea using a flexible fiber-optic bronchoscope. The acute angulation of the trachea that was appreciated on bronchoscopy did not result in kinking of the ETT both initially and after in-situ thermosoftening of the polyvinyl chloride tube.13 Previously reported instances of A-P tracheal deviation have outlined the necessity of using alternative techniques to establish a patent airway, including the use of a laryngeal mask airway and a cuffless ETT with saline-soaked gauze packing.5,8 In 1 reported case, awake fiber-optic intubation was performed when difficult tracheal intubation was anticipated due to known A-P tracheal deviation.6
Failure of ETT advancement can be due to obstruction from the arytenoids and at the level of the vocal cords.14 When the ETT has been visualized to have traversed the vocal cords, tracheal A-P deviation should be considered as a cause of difficult ETT advancement. If an adequate endotracheal airway cannot be established, prompt consideration should be given to placement of a supraglottic airway. Early fiber-optic bronchoscopy should be used to establish the diagnosis and assist with proper ETT positioning.
Conclusions
This case illustrates the rare occurrence of A-P tracheal deviation leading to difficult intubation during CPR. The findings underscore the importance of considering A-P deviation as a potential cause of airway complications in emergency settings, especially in patients with previously normal tracheal anatomy. The successful use of flexible fiber-optic bronchoscopy in this case provides a valuable technique for addressing acute tracheal angulation. This report contributes to the limited literature on A-P tracheal deviation and serves as a reminder for clinicians to maintain a high index of suspicion for unusual airway challenges during critical interventions.
Creasy JD, Chiles C, Routh WD, et al. Overview of traumatic injury of the thoracic aorta. Radiogr Rev Publ Radiol Soc N Am Inc. 1997;17:27-45. doi:10.1148/radiographics.17.1.9017797
Yee AM, Christensen DN, Waterbrook AL, et al. Parapharyngeal abscess with tracheal deviation. Intern Emerg Med. 2017;12:1077-1078.doi:10.1007/s11739-017-1634-8
Querney J, Singh SI, Sebbag I. Tracheal deviation with phrenic nerve palsy after brachial plexus block. Anaesth Rep. 2021;9:41-43. doi:10.1002/anr3.12100
Geissler B, Wagner T, Dorn R, et al. Extensive sterile abscess in an invasive fibrous thyroiditis (Riedel’s thyroiditis) caused by an occlusive vasculitis. J Endocrinol Invest. 2001;24:111-115. doi:10.1007/BF03343824
Kim HJ, Choi YS, Park SH, et al. Difficult endotracheal intubation secondary to tracheal deviation and stenosis in a patient with severe kyphoscoliosis: a case report. Korean J Anesthesiol. 2016;69:386-389. doi:10.4097/kjae.2016.69.4.386
Crabb IJ. Anterior deviation of the trachea. Anaesthesia. 2001;56:284-286.doi:10.1046/j.1365-2044.2001.01918-17.x
De Cassai A, Boscolo A, Rose K, et al. Predictive parameters of difficult intubation in thyroid surgery: a meta-analysis. Minerva Anestesiol. 2020;86:317-326. doi:10.23736/S0375-9393.19.14127-2
Davies R. Difficult tracheal intubation secondary to a tracheal diverticulum and a 90 degree deviation in the trachea. Anaesthesia. 2000;55:923-925. doi:10.1046/j.1365-2044.2000.01664-18.x
Cameron RB, Peacock WJ, Chang XG, et al. Double lumen endobronchial tube intubation: lessons learned from anatomy. BMC Anesthesiol. 2024;24:150. doi:10.1186/s12871-024-02517-6
Walls RM, Samuels-Kalow M, Perkins A. A new maneuver for endotracheal tube insertion during difficult GlideScope intubation. J Emerg Med. 2010;39:86-88. doi:10.1016/j.jemermed.2009.11.005
Buschmann CT, Tsokos M. Frequent and rare complications of resuscitation attempts. Intensive Care Med. 2009;35:397-404. doi:10.1007/s00134-008-1255-9
Greenland KB, Edwards MJ, Hutton NJ, et al. Changes in airway configuration with different head and neck positions using magnetic resonance imaging of normal airways: a new concept with possible clinical applications. Br J Anaesth. 2010;105:683-690. doi:10.1093/bja/aeq239
Takasugi Y, Futagawa K, Umeda T, et al. Thermophysical Properties of Thermosoftening Nasotracheal Tubes. Anesth Prog. 2018;65:100-105. doi:10.2344/anpr-65-02-06
Phelan MP. Use of the endotracheal bougie introducer for difficult intubations. Am J Emerg Med. 2004;22:479-482. doi:10.1016/j.ajem.2004.07.017
Tracheal deviation mostly occurs from mechanical compression of the trachea, and can be caused by a variety of clinical conditions, including trauma,¹ pharyngeal abscess,² neck hematoma,³ thyroid enlargement,4 and kyphoscoliosis.5 These conditions often result in lateral tracheal deviation, which can be associated with tracheal compression and reduction in tracheal caliber.
Anterior-posterior (A-P) tracheal deviation has rarely been reported. Kyphoscoliosis, scarring after a tracheostomy, or innominate vein compression are probable causes of A-P tracheal deviation and can be associated with tracheal narrowing and vascular fistula formation. This report describes a case of difficult endotracheal tube (ETT) advancement secondary to unexpected acute posterior tracheal deviation encountered during cardiopulmonary resuscitation (CPR). A waiver of patient consent was obtained from the Human Research Protection Program at the US Department of Veterans Affairs (VA) Puget Sound Health Care System.
Case Presentation
A 50-year-old male with a history of chronic cerebral venous sinus thrombosis and taking enoxaparin, presented to the emergency department for recurrent headaches. He experienced sudden cardiac arrest, and CPR in the form of chest compression and bag mask ventilation was immediately initiated. With the patient's head in an extended position and using a video laryngoscope, a Cormack–Lehane grade 1 view of the glottic opening was obtained and the trachea was intubated with an 8 mm (internal diameter) polyvinyl chloride ETT. Tracheal intubation was confirmed by utilizing continuous EtCO2 monitoring. The ETT was secured at 22 cm measured at the teeth.
After about 40 minutes of CPR, spontaneous circulation restarted and a portable A-P chest X-ray with the head in a neutral position indicated the ETT tip was at the level of the first rib (Figure 1). This finding, along with a persistent air leak, prompted blind advancement of the ETT to 26 cm at the teeth, but resistance to advancement was noted. A subsequent chest computed tomography (CT) with the head in a neutral position revealed the ETT remained inappropriately positioned with the tip measured 8.2 cm above the carina (Figure 2A). Concurrently, a sagittal CT view demonstrated significant posterior deviation of the mid and lower trachea. This deviation was determined to be the most likely cause of the difficulty encountered in advancing the ETT. No masses or lesions contributing to the acute tracheal angulation could be identified. Comparing CT imaging from 2 months prior, the trachea was of normal caliber and ordinarily aligned with the vertebral column (Figure 2B).
With the patient in Fowler position with the head midline, a flexible fiber-optic bronchoscopy was performed. Acute, almost 90-degree tracheal angulation was encountered and navigated by retroflexion of the flexible bronchoscope. Once the posterior tracheal wall was encountered, retroflexion was relaxed and the carina was visualized. The bronchoscope tip was placed near the carina, and the ETT was advanced over the fiber-optic bronchoscope to terminate 3 cm above the carina. A subsequent chest X-ray confirmed appropriate ETT position (Figure 3).
Discussion
Tracheal deviation in the A-P dimension resulting in difficult tracheal intubation has rarely been reported. Previous reports have described anatomical lesions contributing to similar tracheal deviation, such as retro-tracheal thyroid tissue, pronounced cervical lordosis, and severe kyphoscoliosis with destructive cervical fusion.5-8 In a study of the anatomical correlation of double lumen tube placement while using positron emission tomography CT, Cameron et al evaluated the size and angulation of the glottis and proximal trachea using calibrated CT measurements and an online digital protractor and note nearly perfect alignment of the pharynx and glottis.9 However, the trachea turned posteriorly relative to the glottis, resulting in an overall posterior angle of the proximal trachea compared to the glottis of 30.4 to 50.1 degrees, with no sex differences. The need to maneuver similar proximal tracheal angulation during endotracheal intubation has been reported as a cause of difficult intubation.10
In this case, the posterior angulation was not encountered in the proximal trachea but rather in the more distal trachea. The extreme A-P tracheal deviation was not associated with any identifiable masses or lesions. A CT performed 2 months prior demonstrated normal tracheal anatomy, and there was no interval history of neck trauma or tracheal obstruction suggestive of a likely cause for this deviation. This change in the patient’s tracheal anatomy was only discovered after CPR had been performed and as part of the workup for cardiac arrest. Iatrogenic injuries are known to occur during CPR. Common CPR-related airway injuries include tracheal mucosal injury from traumatic intubation and bony injuries to the chest wall from compressions.11 Laryngeal cartilage damage from intubation may also occur, but tracheal displacement following CPR has not been previously reported.11
This case of tracheal deviation is unlikely to be related to patient positioning, as the A-P deviation persisted in 3 separate head and neck alignments. First, during indirect laryngoscopy, performed in a standard sniffing position. Second, during the CT, performed in the supine position, with no head support. The acute A-P deviation seen in Figure 2 was clearly noted in this position. Lastly, flexible fiber-optic bronchoscopy was performed in a semiupright position with the head supported on a pillow. A-P deviation was encountered and navigated in this position during flexible fiber-optic guided ETT repositioning.
Using magnetic resonance imaging, alterations in the alignment of pharyngeal and tracheal axes have been described with changes in neck positioning; however, tracheal deviation has not been described with changes in head and neck alignment.12 Although the clinical presentation in this case was consistent with prior reports, we were unable to identify any previously reported anatomic cause for the tracheal deviation.5,6,8 Initial glottic visualization with a video laryngoscope was unremarkable, but resistance to sufficient ETT advancement past the vocal cords and a persistent air leak due to cuff herniation through the glottic opening was noticeable. The ETT was maneuvered to an appropriate position in the trachea using a flexible fiber-optic bronchoscope. The acute angulation of the trachea that was appreciated on bronchoscopy did not result in kinking of the ETT both initially and after in-situ thermosoftening of the polyvinyl chloride tube.13 Previously reported instances of A-P tracheal deviation have outlined the necessity of using alternative techniques to establish a patent airway, including the use of a laryngeal mask airway and a cuffless ETT with saline-soaked gauze packing.5,8 In 1 reported case, awake fiber-optic intubation was performed when difficult tracheal intubation was anticipated due to known A-P tracheal deviation.6
Failure of ETT advancement can be due to obstruction from the arytenoids and at the level of the vocal cords.14 When the ETT has been visualized to have traversed the vocal cords, tracheal A-P deviation should be considered as a cause of difficult ETT advancement. If an adequate endotracheal airway cannot be established, prompt consideration should be given to placement of a supraglottic airway. Early fiber-optic bronchoscopy should be used to establish the diagnosis and assist with proper ETT positioning.
Conclusions
This case illustrates the rare occurrence of A-P tracheal deviation leading to difficult intubation during CPR. The findings underscore the importance of considering A-P deviation as a potential cause of airway complications in emergency settings, especially in patients with previously normal tracheal anatomy. The successful use of flexible fiber-optic bronchoscopy in this case provides a valuable technique for addressing acute tracheal angulation. This report contributes to the limited literature on A-P tracheal deviation and serves as a reminder for clinicians to maintain a high index of suspicion for unusual airway challenges during critical interventions.
Tracheal deviation mostly occurs from mechanical compression of the trachea, and can be caused by a variety of clinical conditions, including trauma,¹ pharyngeal abscess,² neck hematoma,³ thyroid enlargement,4 and kyphoscoliosis.5 These conditions often result in lateral tracheal deviation, which can be associated with tracheal compression and reduction in tracheal caliber.
Anterior-posterior (A-P) tracheal deviation has rarely been reported. Kyphoscoliosis, scarring after a tracheostomy, or innominate vein compression are probable causes of A-P tracheal deviation and can be associated with tracheal narrowing and vascular fistula formation. This report describes a case of difficult endotracheal tube (ETT) advancement secondary to unexpected acute posterior tracheal deviation encountered during cardiopulmonary resuscitation (CPR). A waiver of patient consent was obtained from the Human Research Protection Program at the US Department of Veterans Affairs (VA) Puget Sound Health Care System.
Case Presentation
A 50-year-old male with a history of chronic cerebral venous sinus thrombosis and taking enoxaparin, presented to the emergency department for recurrent headaches. He experienced sudden cardiac arrest, and CPR in the form of chest compression and bag mask ventilation was immediately initiated. With the patient's head in an extended position and using a video laryngoscope, a Cormack–Lehane grade 1 view of the glottic opening was obtained and the trachea was intubated with an 8 mm (internal diameter) polyvinyl chloride ETT. Tracheal intubation was confirmed by utilizing continuous EtCO2 monitoring. The ETT was secured at 22 cm measured at the teeth.
After about 40 minutes of CPR, spontaneous circulation restarted and a portable A-P chest X-ray with the head in a neutral position indicated the ETT tip was at the level of the first rib (Figure 1). This finding, along with a persistent air leak, prompted blind advancement of the ETT to 26 cm at the teeth, but resistance to advancement was noted. A subsequent chest computed tomography (CT) with the head in a neutral position revealed the ETT remained inappropriately positioned with the tip measured 8.2 cm above the carina (Figure 2A). Concurrently, a sagittal CT view demonstrated significant posterior deviation of the mid and lower trachea. This deviation was determined to be the most likely cause of the difficulty encountered in advancing the ETT. No masses or lesions contributing to the acute tracheal angulation could be identified. Comparing CT imaging from 2 months prior, the trachea was of normal caliber and ordinarily aligned with the vertebral column (Figure 2B).
With the patient in Fowler position with the head midline, a flexible fiber-optic bronchoscopy was performed. Acute, almost 90-degree tracheal angulation was encountered and navigated by retroflexion of the flexible bronchoscope. Once the posterior tracheal wall was encountered, retroflexion was relaxed and the carina was visualized. The bronchoscope tip was placed near the carina, and the ETT was advanced over the fiber-optic bronchoscope to terminate 3 cm above the carina. A subsequent chest X-ray confirmed appropriate ETT position (Figure 3).
Discussion
Tracheal deviation in the A-P dimension resulting in difficult tracheal intubation has rarely been reported. Previous reports have described anatomical lesions contributing to similar tracheal deviation, such as retro-tracheal thyroid tissue, pronounced cervical lordosis, and severe kyphoscoliosis with destructive cervical fusion.5-8 In a study of the anatomical correlation of double lumen tube placement while using positron emission tomography CT, Cameron et al evaluated the size and angulation of the glottis and proximal trachea using calibrated CT measurements and an online digital protractor and note nearly perfect alignment of the pharynx and glottis.9 However, the trachea turned posteriorly relative to the glottis, resulting in an overall posterior angle of the proximal trachea compared to the glottis of 30.4 to 50.1 degrees, with no sex differences. The need to maneuver similar proximal tracheal angulation during endotracheal intubation has been reported as a cause of difficult intubation.10
In this case, the posterior angulation was not encountered in the proximal trachea but rather in the more distal trachea. The extreme A-P tracheal deviation was not associated with any identifiable masses or lesions. A CT performed 2 months prior demonstrated normal tracheal anatomy, and there was no interval history of neck trauma or tracheal obstruction suggestive of a likely cause for this deviation. This change in the patient’s tracheal anatomy was only discovered after CPR had been performed and as part of the workup for cardiac arrest. Iatrogenic injuries are known to occur during CPR. Common CPR-related airway injuries include tracheal mucosal injury from traumatic intubation and bony injuries to the chest wall from compressions.11 Laryngeal cartilage damage from intubation may also occur, but tracheal displacement following CPR has not been previously reported.11
This case of tracheal deviation is unlikely to be related to patient positioning, as the A-P deviation persisted in 3 separate head and neck alignments. First, during indirect laryngoscopy, performed in a standard sniffing position. Second, during the CT, performed in the supine position, with no head support. The acute A-P deviation seen in Figure 2 was clearly noted in this position. Lastly, flexible fiber-optic bronchoscopy was performed in a semiupright position with the head supported on a pillow. A-P deviation was encountered and navigated in this position during flexible fiber-optic guided ETT repositioning.
Using magnetic resonance imaging, alterations in the alignment of pharyngeal and tracheal axes have been described with changes in neck positioning; however, tracheal deviation has not been described with changes in head and neck alignment.12 Although the clinical presentation in this case was consistent with prior reports, we were unable to identify any previously reported anatomic cause for the tracheal deviation.5,6,8 Initial glottic visualization with a video laryngoscope was unremarkable, but resistance to sufficient ETT advancement past the vocal cords and a persistent air leak due to cuff herniation through the glottic opening was noticeable. The ETT was maneuvered to an appropriate position in the trachea using a flexible fiber-optic bronchoscope. The acute angulation of the trachea that was appreciated on bronchoscopy did not result in kinking of the ETT both initially and after in-situ thermosoftening of the polyvinyl chloride tube.13 Previously reported instances of A-P tracheal deviation have outlined the necessity of using alternative techniques to establish a patent airway, including the use of a laryngeal mask airway and a cuffless ETT with saline-soaked gauze packing.5,8 In 1 reported case, awake fiber-optic intubation was performed when difficult tracheal intubation was anticipated due to known A-P tracheal deviation.6
Failure of ETT advancement can be due to obstruction from the arytenoids and at the level of the vocal cords.14 When the ETT has been visualized to have traversed the vocal cords, tracheal A-P deviation should be considered as a cause of difficult ETT advancement. If an adequate endotracheal airway cannot be established, prompt consideration should be given to placement of a supraglottic airway. Early fiber-optic bronchoscopy should be used to establish the diagnosis and assist with proper ETT positioning.
Conclusions
This case illustrates the rare occurrence of A-P tracheal deviation leading to difficult intubation during CPR. The findings underscore the importance of considering A-P deviation as a potential cause of airway complications in emergency settings, especially in patients with previously normal tracheal anatomy. The successful use of flexible fiber-optic bronchoscopy in this case provides a valuable technique for addressing acute tracheal angulation. This report contributes to the limited literature on A-P tracheal deviation and serves as a reminder for clinicians to maintain a high index of suspicion for unusual airway challenges during critical interventions.
Creasy JD, Chiles C, Routh WD, et al. Overview of traumatic injury of the thoracic aorta. Radiogr Rev Publ Radiol Soc N Am Inc. 1997;17:27-45. doi:10.1148/radiographics.17.1.9017797
Yee AM, Christensen DN, Waterbrook AL, et al. Parapharyngeal abscess with tracheal deviation. Intern Emerg Med. 2017;12:1077-1078.doi:10.1007/s11739-017-1634-8
Querney J, Singh SI, Sebbag I. Tracheal deviation with phrenic nerve palsy after brachial plexus block. Anaesth Rep. 2021;9:41-43. doi:10.1002/anr3.12100
Geissler B, Wagner T, Dorn R, et al. Extensive sterile abscess in an invasive fibrous thyroiditis (Riedel’s thyroiditis) caused by an occlusive vasculitis. J Endocrinol Invest. 2001;24:111-115. doi:10.1007/BF03343824
Kim HJ, Choi YS, Park SH, et al. Difficult endotracheal intubation secondary to tracheal deviation and stenosis in a patient with severe kyphoscoliosis: a case report. Korean J Anesthesiol. 2016;69:386-389. doi:10.4097/kjae.2016.69.4.386
Crabb IJ. Anterior deviation of the trachea. Anaesthesia. 2001;56:284-286.doi:10.1046/j.1365-2044.2001.01918-17.x
De Cassai A, Boscolo A, Rose K, et al. Predictive parameters of difficult intubation in thyroid surgery: a meta-analysis. Minerva Anestesiol. 2020;86:317-326. doi:10.23736/S0375-9393.19.14127-2
Davies R. Difficult tracheal intubation secondary to a tracheal diverticulum and a 90 degree deviation in the trachea. Anaesthesia. 2000;55:923-925. doi:10.1046/j.1365-2044.2000.01664-18.x
Cameron RB, Peacock WJ, Chang XG, et al. Double lumen endobronchial tube intubation: lessons learned from anatomy. BMC Anesthesiol. 2024;24:150. doi:10.1186/s12871-024-02517-6
Walls RM, Samuels-Kalow M, Perkins A. A new maneuver for endotracheal tube insertion during difficult GlideScope intubation. J Emerg Med. 2010;39:86-88. doi:10.1016/j.jemermed.2009.11.005
Buschmann CT, Tsokos M. Frequent and rare complications of resuscitation attempts. Intensive Care Med. 2009;35:397-404. doi:10.1007/s00134-008-1255-9
Greenland KB, Edwards MJ, Hutton NJ, et al. Changes in airway configuration with different head and neck positions using magnetic resonance imaging of normal airways: a new concept with possible clinical applications. Br J Anaesth. 2010;105:683-690. doi:10.1093/bja/aeq239
Takasugi Y, Futagawa K, Umeda T, et al. Thermophysical Properties of Thermosoftening Nasotracheal Tubes. Anesth Prog. 2018;65:100-105. doi:10.2344/anpr-65-02-06
Phelan MP. Use of the endotracheal bougie introducer for difficult intubations. Am J Emerg Med. 2004;22:479-482. doi:10.1016/j.ajem.2004.07.017
Creasy JD, Chiles C, Routh WD, et al. Overview of traumatic injury of the thoracic aorta. Radiogr Rev Publ Radiol Soc N Am Inc. 1997;17:27-45. doi:10.1148/radiographics.17.1.9017797
Yee AM, Christensen DN, Waterbrook AL, et al. Parapharyngeal abscess with tracheal deviation. Intern Emerg Med. 2017;12:1077-1078.doi:10.1007/s11739-017-1634-8
Querney J, Singh SI, Sebbag I. Tracheal deviation with phrenic nerve palsy after brachial plexus block. Anaesth Rep. 2021;9:41-43. doi:10.1002/anr3.12100
Geissler B, Wagner T, Dorn R, et al. Extensive sterile abscess in an invasive fibrous thyroiditis (Riedel’s thyroiditis) caused by an occlusive vasculitis. J Endocrinol Invest. 2001;24:111-115. doi:10.1007/BF03343824
Kim HJ, Choi YS, Park SH, et al. Difficult endotracheal intubation secondary to tracheal deviation and stenosis in a patient with severe kyphoscoliosis: a case report. Korean J Anesthesiol. 2016;69:386-389. doi:10.4097/kjae.2016.69.4.386
Crabb IJ. Anterior deviation of the trachea. Anaesthesia. 2001;56:284-286.doi:10.1046/j.1365-2044.2001.01918-17.x
De Cassai A, Boscolo A, Rose K, et al. Predictive parameters of difficult intubation in thyroid surgery: a meta-analysis. Minerva Anestesiol. 2020;86:317-326. doi:10.23736/S0375-9393.19.14127-2
Davies R. Difficult tracheal intubation secondary to a tracheal diverticulum and a 90 degree deviation in the trachea. Anaesthesia. 2000;55:923-925. doi:10.1046/j.1365-2044.2000.01664-18.x
Cameron RB, Peacock WJ, Chang XG, et al. Double lumen endobronchial tube intubation: lessons learned from anatomy. BMC Anesthesiol. 2024;24:150. doi:10.1186/s12871-024-02517-6
Walls RM, Samuels-Kalow M, Perkins A. A new maneuver for endotracheal tube insertion during difficult GlideScope intubation. J Emerg Med. 2010;39:86-88. doi:10.1016/j.jemermed.2009.11.005
Buschmann CT, Tsokos M. Frequent and rare complications of resuscitation attempts. Intensive Care Med. 2009;35:397-404. doi:10.1007/s00134-008-1255-9
Greenland KB, Edwards MJ, Hutton NJ, et al. Changes in airway configuration with different head and neck positions using magnetic resonance imaging of normal airways: a new concept with possible clinical applications. Br J Anaesth. 2010;105:683-690. doi:10.1093/bja/aeq239
Takasugi Y, Futagawa K, Umeda T, et al. Thermophysical Properties of Thermosoftening Nasotracheal Tubes. Anesth Prog. 2018;65:100-105. doi:10.2344/anpr-65-02-06
Phelan MP. Use of the endotracheal bougie introducer for difficult intubations. Am J Emerg Med. 2004;22:479-482. doi:10.1016/j.ajem.2004.07.017
A Case Report of Unanticipated Difficult Intubation Due to Posterior Tracheal Angulation
A Case Report of Unanticipated Difficult Intubation Due to Posterior Tracheal Angulation

Rare Case of Necrobiotic Xanthogranuloma on the Scalp
Rare Case of Necrobiotic Xanthogranuloma on the Scalp
To the Editor:
Necrobiotic xanthogranuloma (NXG) is classified as a cutaneous non–Langerhans cell histiocytosis, often seen with monoclonal gammopathy of undetermined significance or multiple myeloma.1 Clinically, it appears as a red or yellow plaque with occasional ulceration and telangiectasias, most commonly seen periorbitally and on the trunk. On pathology, NXG appears as necrobiosis, giant cells, and various inflammatory cells extending into the subcutaneous tissue.2 In this article, we describe a rare presentation of NXG in location and skin type.
A 52-year-old woman with a history of systemic lupus erythematosus (SLE) presented with alopecia and a tender lesion on the scalp of 5 years’ duration (Figure 1). The patient had no history of a similar lesion, and no other lesions were present. A biopsy performed at an outside clinic a few weeks to months prior to the initial presentation to our clinic showed NXG (Figure 2). Evaluation at our clinic revealed a 4x4-cm orange-brown annular plaque on the left parietal scalp. Serum and urine protein electrophoresis studies were negative. The patient reported she was up to date with recommended screenings such as mammography and colonoscopy.
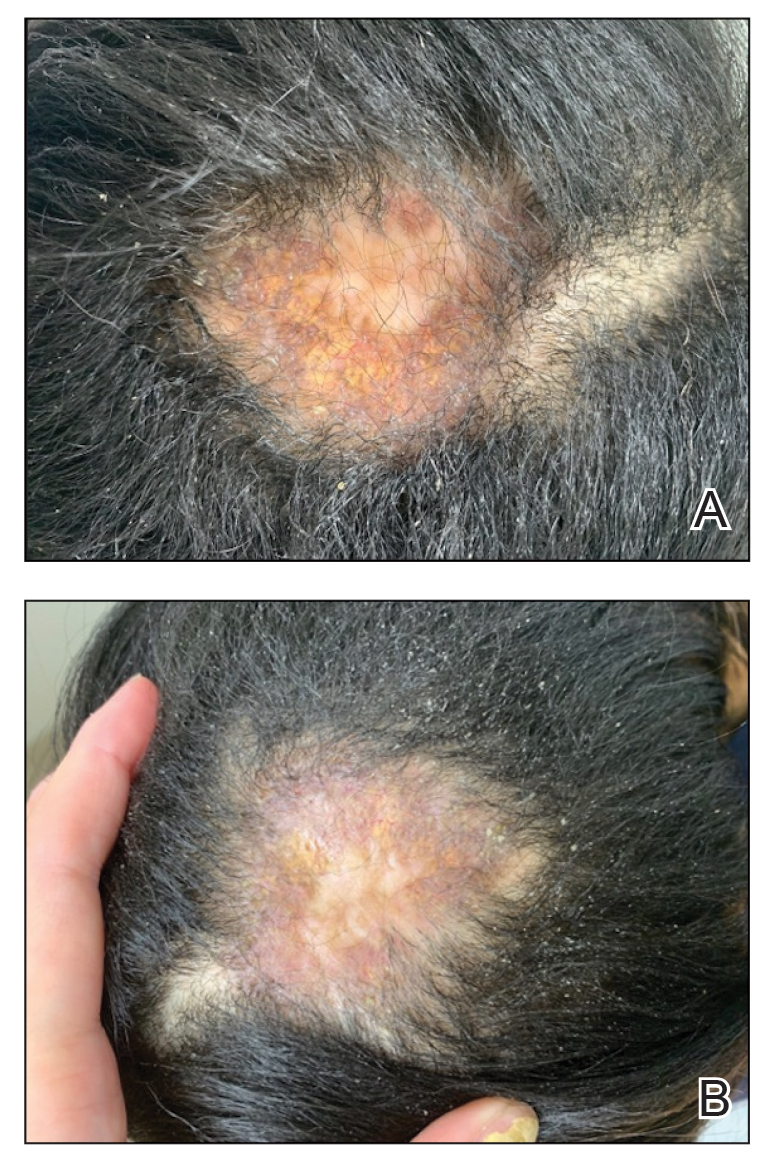
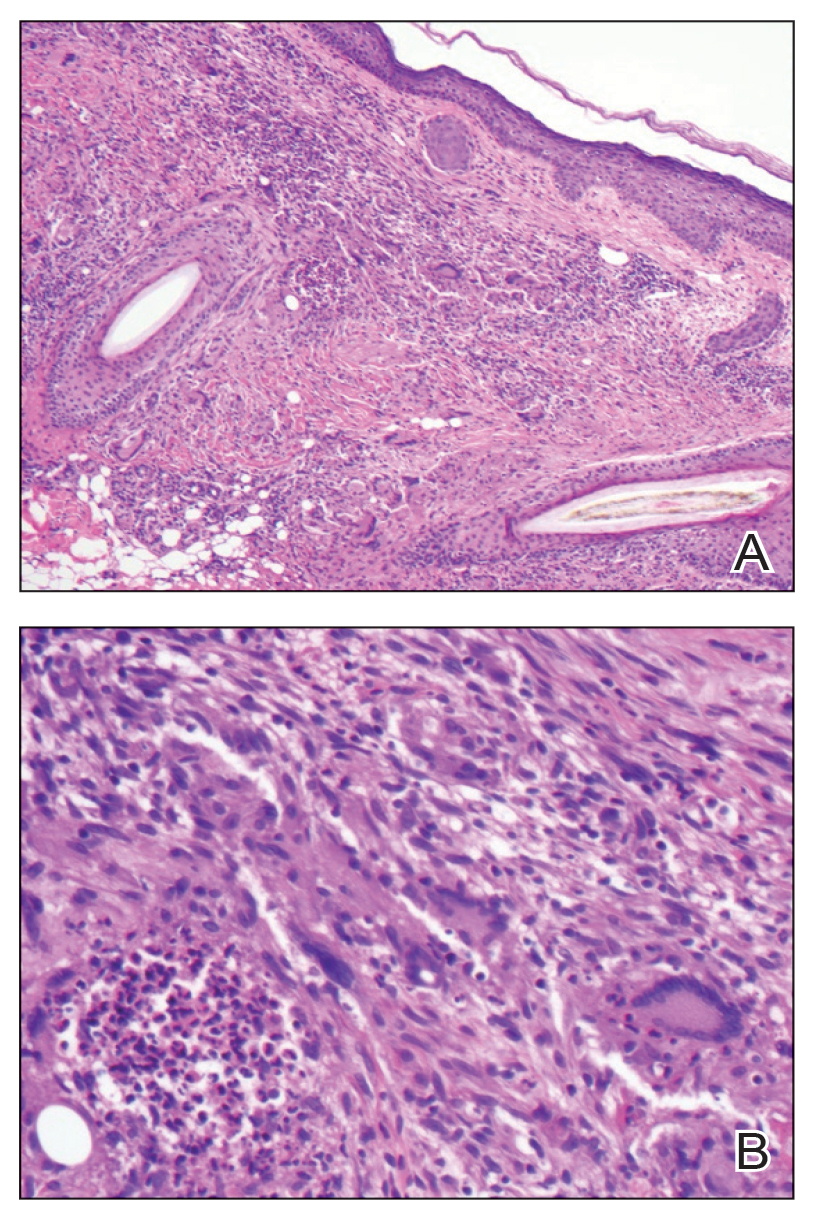
We started the patient on topical triamcinolone and topical ruxolitinib and administered intralesional triamcinolone. She was already taking hydroxychloroquine and leflunomide for SLE. Three weeks later, she returned with improved symptoms and appearance (Figure 1). She remained on intralesional triamcinolone and ruxolitinib and continues to experience improvement.
Necrobiotic xanthogranuloma is rare and typically is associated with monoclonal gammopathy.2 In one study, 83 of 100 of patients with NXG presented with or were found to have a monoclonal gammopathy.2 In another study, paraproteinemia was detected in 82.1% of patients.3 The majority of case reports and systematic reviews detail periorbital or thoracic lesions.4 The location on the scalp and lack of association with paraproteinemia make this a rare presentation of NXG. Studies may be warranted to explore any association of SLE with NXG if more cases present.
In a multicenter cross-sectional study and systematic review of 235 patients with NXG, 87% were White, 12% were Asian, and only 1% were Black or African American.3 The limited representation of skin of color raises concern for the possibility of missed diagnoses and delays in care.
Treatment of NXG often is multimodal with use of intravenous immunoglobulin, oral steroids, chlorambucil, melphalan, and other alkylating agents, and response is variable.3-6 Recent studies show treatment effectiveness with Janus kinase inhibitors in granulomatous dermatitides.7-9 As our patient was not responding to prior treatments, we decided to try ruxolitinib, and she has continued to improve with it.10,11 Interestingly, the patient experienced continued improvement with intralesional triamcinolone, which is not often reported in the literature.2-6 Overall, NXG is an extremely rare condition that requires special care in workup to rule out paraproteinemia and a thoughtful approach to treatment modalities.
- Emile JF, Abla O, Fraitag S, et al. Revised classification of histiocytoses and neoplasms of the macrophage-dendritic cell lineages. Blood. 2016;127:2672-2681.
- Spicknall KE, Mehregan DA. Necrobiotic xanthogranuloma. Int J Dermatol. 2009;48:1-10.
- Nelson CA, Zhong CS, Hashemi DA, et al. A multicenter cross-sectional study and systematic review of necrobiotic xanthogranuloma with proposed diagnostic criteria. JAMA Dermatol. 2020;156:270-279.
- Huynh KN, Nguyen BD. Histiocytosis and neoplasms of macrophagedendritic cell lineages: multimodality imaging with emphasis on PET/CT. Radiographics. 2021;41:576-594. doi: 10.1148/rg.2021200096
- Hilal T, DiCaudo DJ, Connolly SM, et al. Necrobiotic xanthogranuloma: a 30-year single-center experience. Ann Hematol. 2018;97:1471-1479.
- Oumeish OY, Oumeish I, Tarawneh M, et al. Necrobiotic xanthogranuloma associated with paraproteinemia and non- Hodgkin’s lymphoma developing into chronic lymphocytic leukemia: the first case reported in the literature and review of the literature. Int J Dermatol. 2006;45:306-310.
- Damsky W, Thakral D, McGeary MK, et al. Janus kinase inhibition induces disease remission in cutaneous sarcoidosis and granuloma annulare. J Am Acad Dermatol. 2020;82:612-621. doi:10.1016 /j.jaad.2019.05.098
- Wang A, Rahman NT, McGeary MK, et al. Treatment of granuloma annulare and suppression of proinflammatory cytokine activity with tofacitinib. J Allergy Clin Immunol. 2021;147:1795-1809. doi:10.1016 /j.jaci.2020.10.012
- Stratman S, Amara S, Tan KJ, et al. Systemic Janus kinase inhibitors in the management of granuloma annulare. Arch Dermatol Res. 2025;317:743. doi:10.1007/s00403-025-04248-1
- McPhie ML, Swales WC, Gooderham MJ. Improvement of granulomatous skin conditions with tofacitinib in three patients: a case report. SAGE Open Med Case Rep. 2021;9:2050313X211039477. doi: 10.1177/2050313X211039477
- Sood S, Heung M, Georgakopoulos JR, et al. Use of Janus kinase inhibitors for granulomatous dermatoses: a systematic review. J Am Acad Dermatol. 2023;89:357-359. doi: 10.1016/j.jaad.2023.03.024
To the Editor:
Necrobiotic xanthogranuloma (NXG) is classified as a cutaneous non–Langerhans cell histiocytosis, often seen with monoclonal gammopathy of undetermined significance or multiple myeloma.1 Clinically, it appears as a red or yellow plaque with occasional ulceration and telangiectasias, most commonly seen periorbitally and on the trunk. On pathology, NXG appears as necrobiosis, giant cells, and various inflammatory cells extending into the subcutaneous tissue.2 In this article, we describe a rare presentation of NXG in location and skin type.
A 52-year-old woman with a history of systemic lupus erythematosus (SLE) presented with alopecia and a tender lesion on the scalp of 5 years’ duration (Figure 1). The patient had no history of a similar lesion, and no other lesions were present. A biopsy performed at an outside clinic a few weeks to months prior to the initial presentation to our clinic showed NXG (Figure 2). Evaluation at our clinic revealed a 4x4-cm orange-brown annular plaque on the left parietal scalp. Serum and urine protein electrophoresis studies were negative. The patient reported she was up to date with recommended screenings such as mammography and colonoscopy.
We started the patient on topical triamcinolone and topical ruxolitinib and administered intralesional triamcinolone. She was already taking hydroxychloroquine and leflunomide for SLE. Three weeks later, she returned with improved symptoms and appearance (Figure 1). She remained on intralesional triamcinolone and ruxolitinib and continues to experience improvement.
Necrobiotic xanthogranuloma is rare and typically is associated with monoclonal gammopathy.2 In one study, 83 of 100 of patients with NXG presented with or were found to have a monoclonal gammopathy.2 In another study, paraproteinemia was detected in 82.1% of patients.3 The majority of case reports and systematic reviews detail periorbital or thoracic lesions.4 The location on the scalp and lack of association with paraproteinemia make this a rare presentation of NXG. Studies may be warranted to explore any association of SLE with NXG if more cases present.
In a multicenter cross-sectional study and systematic review of 235 patients with NXG, 87% were White, 12% were Asian, and only 1% were Black or African American.3 The limited representation of skin of color raises concern for the possibility of missed diagnoses and delays in care.
Treatment of NXG often is multimodal with use of intravenous immunoglobulin, oral steroids, chlorambucil, melphalan, and other alkylating agents, and response is variable.3-6 Recent studies show treatment effectiveness with Janus kinase inhibitors in granulomatous dermatitides.7-9 As our patient was not responding to prior treatments, we decided to try ruxolitinib, and she has continued to improve with it.10,11 Interestingly, the patient experienced continued improvement with intralesional triamcinolone, which is not often reported in the literature.2-6 Overall, NXG is an extremely rare condition that requires special care in workup to rule out paraproteinemia and a thoughtful approach to treatment modalities.
To the Editor:
Necrobiotic xanthogranuloma (NXG) is classified as a cutaneous non–Langerhans cell histiocytosis, often seen with monoclonal gammopathy of undetermined significance or multiple myeloma.1 Clinically, it appears as a red or yellow plaque with occasional ulceration and telangiectasias, most commonly seen periorbitally and on the trunk. On pathology, NXG appears as necrobiosis, giant cells, and various inflammatory cells extending into the subcutaneous tissue.2 In this article, we describe a rare presentation of NXG in location and skin type.
A 52-year-old woman with a history of systemic lupus erythematosus (SLE) presented with alopecia and a tender lesion on the scalp of 5 years’ duration (Figure 1). The patient had no history of a similar lesion, and no other lesions were present. A biopsy performed at an outside clinic a few weeks to months prior to the initial presentation to our clinic showed NXG (Figure 2). Evaluation at our clinic revealed a 4x4-cm orange-brown annular plaque on the left parietal scalp. Serum and urine protein electrophoresis studies were negative. The patient reported she was up to date with recommended screenings such as mammography and colonoscopy.
We started the patient on topical triamcinolone and topical ruxolitinib and administered intralesional triamcinolone. She was already taking hydroxychloroquine and leflunomide for SLE. Three weeks later, she returned with improved symptoms and appearance (Figure 1). She remained on intralesional triamcinolone and ruxolitinib and continues to experience improvement.
Necrobiotic xanthogranuloma is rare and typically is associated with monoclonal gammopathy.2 In one study, 83 of 100 of patients with NXG presented with or were found to have a monoclonal gammopathy.2 In another study, paraproteinemia was detected in 82.1% of patients.3 The majority of case reports and systematic reviews detail periorbital or thoracic lesions.4 The location on the scalp and lack of association with paraproteinemia make this a rare presentation of NXG. Studies may be warranted to explore any association of SLE with NXG if more cases present.
In a multicenter cross-sectional study and systematic review of 235 patients with NXG, 87% were White, 12% were Asian, and only 1% were Black or African American.3 The limited representation of skin of color raises concern for the possibility of missed diagnoses and delays in care.
Treatment of NXG often is multimodal with use of intravenous immunoglobulin, oral steroids, chlorambucil, melphalan, and other alkylating agents, and response is variable.3-6 Recent studies show treatment effectiveness with Janus kinase inhibitors in granulomatous dermatitides.7-9 As our patient was not responding to prior treatments, we decided to try ruxolitinib, and she has continued to improve with it.10,11 Interestingly, the patient experienced continued improvement with intralesional triamcinolone, which is not often reported in the literature.2-6 Overall, NXG is an extremely rare condition that requires special care in workup to rule out paraproteinemia and a thoughtful approach to treatment modalities.
- Emile JF, Abla O, Fraitag S, et al. Revised classification of histiocytoses and neoplasms of the macrophage-dendritic cell lineages. Blood. 2016;127:2672-2681.
- Spicknall KE, Mehregan DA. Necrobiotic xanthogranuloma. Int J Dermatol. 2009;48:1-10.
- Nelson CA, Zhong CS, Hashemi DA, et al. A multicenter cross-sectional study and systematic review of necrobiotic xanthogranuloma with proposed diagnostic criteria. JAMA Dermatol. 2020;156:270-279.
- Huynh KN, Nguyen BD. Histiocytosis and neoplasms of macrophagedendritic cell lineages: multimodality imaging with emphasis on PET/CT. Radiographics. 2021;41:576-594. doi: 10.1148/rg.2021200096
- Hilal T, DiCaudo DJ, Connolly SM, et al. Necrobiotic xanthogranuloma: a 30-year single-center experience. Ann Hematol. 2018;97:1471-1479.
- Oumeish OY, Oumeish I, Tarawneh M, et al. Necrobiotic xanthogranuloma associated with paraproteinemia and non- Hodgkin’s lymphoma developing into chronic lymphocytic leukemia: the first case reported in the literature and review of the literature. Int J Dermatol. 2006;45:306-310.
- Damsky W, Thakral D, McGeary MK, et al. Janus kinase inhibition induces disease remission in cutaneous sarcoidosis and granuloma annulare. J Am Acad Dermatol. 2020;82:612-621. doi:10.1016 /j.jaad.2019.05.098
- Wang A, Rahman NT, McGeary MK, et al. Treatment of granuloma annulare and suppression of proinflammatory cytokine activity with tofacitinib. J Allergy Clin Immunol. 2021;147:1795-1809. doi:10.1016 /j.jaci.2020.10.012
- Stratman S, Amara S, Tan KJ, et al. Systemic Janus kinase inhibitors in the management of granuloma annulare. Arch Dermatol Res. 2025;317:743. doi:10.1007/s00403-025-04248-1
- McPhie ML, Swales WC, Gooderham MJ. Improvement of granulomatous skin conditions with tofacitinib in three patients: a case report. SAGE Open Med Case Rep. 2021;9:2050313X211039477. doi: 10.1177/2050313X211039477
- Sood S, Heung M, Georgakopoulos JR, et al. Use of Janus kinase inhibitors for granulomatous dermatoses: a systematic review. J Am Acad Dermatol. 2023;89:357-359. doi: 10.1016/j.jaad.2023.03.024
- Emile JF, Abla O, Fraitag S, et al. Revised classification of histiocytoses and neoplasms of the macrophage-dendritic cell lineages. Blood. 2016;127:2672-2681.
- Spicknall KE, Mehregan DA. Necrobiotic xanthogranuloma. Int J Dermatol. 2009;48:1-10.
- Nelson CA, Zhong CS, Hashemi DA, et al. A multicenter cross-sectional study and systematic review of necrobiotic xanthogranuloma with proposed diagnostic criteria. JAMA Dermatol. 2020;156:270-279.
- Huynh KN, Nguyen BD. Histiocytosis and neoplasms of macrophagedendritic cell lineages: multimodality imaging with emphasis on PET/CT. Radiographics. 2021;41:576-594. doi: 10.1148/rg.2021200096
- Hilal T, DiCaudo DJ, Connolly SM, et al. Necrobiotic xanthogranuloma: a 30-year single-center experience. Ann Hematol. 2018;97:1471-1479.
- Oumeish OY, Oumeish I, Tarawneh M, et al. Necrobiotic xanthogranuloma associated with paraproteinemia and non- Hodgkin’s lymphoma developing into chronic lymphocytic leukemia: the first case reported in the literature and review of the literature. Int J Dermatol. 2006;45:306-310.
- Damsky W, Thakral D, McGeary MK, et al. Janus kinase inhibition induces disease remission in cutaneous sarcoidosis and granuloma annulare. J Am Acad Dermatol. 2020;82:612-621. doi:10.1016 /j.jaad.2019.05.098
- Wang A, Rahman NT, McGeary MK, et al. Treatment of granuloma annulare and suppression of proinflammatory cytokine activity with tofacitinib. J Allergy Clin Immunol. 2021;147:1795-1809. doi:10.1016 /j.jaci.2020.10.012
- Stratman S, Amara S, Tan KJ, et al. Systemic Janus kinase inhibitors in the management of granuloma annulare. Arch Dermatol Res. 2025;317:743. doi:10.1007/s00403-025-04248-1
- McPhie ML, Swales WC, Gooderham MJ. Improvement of granulomatous skin conditions with tofacitinib in three patients: a case report. SAGE Open Med Case Rep. 2021;9:2050313X211039477. doi: 10.1177/2050313X211039477
- Sood S, Heung M, Georgakopoulos JR, et al. Use of Janus kinase inhibitors for granulomatous dermatoses: a systematic review. J Am Acad Dermatol. 2023;89:357-359. doi: 10.1016/j.jaad.2023.03.024
Rare Case of Necrobiotic Xanthogranuloma on the Scalp
Rare Case of Necrobiotic Xanthogranuloma on the Scalp
PRACTICE POINTS
- In skin of color, necrobiotic xanthogranuloma can appear orange or brown compared to its yellow appearance in lighter skin types.
- When necrobiotic xanthogranuloma is suspected, a thorough malignancy workup should be conducted.