User login
Bringing you the latest news, research and reviews, exclusive interviews, podcasts, quizzes, and more.
Powered by CHEST Physician, Clinician Reviews, MDedge Family Medicine, Internal Medicine News, and The Journal of Clinical Outcomes Management.
Nontuberculous mycobacterial lung disease cases on the rise across U.S.

To assess the NTM lung disease burden on a national level, Kevin L. Winthrop, MD, of Oregon Health & Science University, Portland, and associates analyzed patient data from a U.S. managed care claims database between 2008 and 2015. Their findings were published in the Annals of the American Thoracic Society.
A case of NTM lung disease was defined as a patient with at least two medical claims with the disease’s diagnostic codes – 031.0 and A31.0 – that were at least 30 days apart. Of the 74,984,596 beneficiaries in the database, 9,476 met the case definition for NTM lung disease; 69% (n = 6,530) were women.
From 2008 to 2015, the annual incidence of NTM lung disease increased from 3.13 (95% confidence interval, 2.88-3.40) to 4.73 (95% CI, 4.43-5.05) per 100,000 person-years, with the average rate of yearly change being +5.2% (95% CI, 4.0%-6.4%; P less than .01).The annual prevalence increased from 6.78 (95% CI, 6.45-7.14) to 11.70 (95% CI, 11.26-12.16) per 100,000 persons, with the average rate of yearly change being +7.5% (95% CI, 6.7-8.2%; P less than .01).
The majority of NTM lung disease in the United States is caused by Mycobacterium avium complex (17), although other species such as M. abscessus, M. kansasii, M. xenopi, and others contribute to this disease burden.
“It’s a classic chicken-or-egg scenario,” said Sachin Gupta, MD, a pulmonologist in San Francisco, in regard to the rising numbers. “Increased awareness of NTM lung disease is, in part, why we’re seeing prevalence and incidence go up. And yet the disease itself may also be growing in clusters and pockets, as the data show, in various places across the nation.
“The worrisome aspect here,” he added, “is that future studies will likely show that, as incidence is increasing, mortality is increasing as well. That speaks to the challenges with these bugs: Very hard to diagnose, very hard to treat.”
The authors acknowledged their study’s limitations, including the lack of microbiologic or radiographic confirmation of the NTM infection and the inherent shortcomings of claims data–based studies overall. They did note a previous report, however, that “claims-based case identification has a high positive predictive value of approximately 82% for NTM lung disease.”
The study was funded by Insmed; the Intramural Research Programs of the National Institute of Allergy and Infectious Diseases; and the National Heart, Lung, and Blood Institute. The authors reported no conflicts of interest.
SOURCE: Winthrop KL et al. Ann Am Thorac Soc. 2019 Dec 13. doi: 10.1513/AnnalsATS.201804-236OC.
FROM ANNALS OF THE AMERICAN THORACIC SOCIETY
Travelers to three U.S. airports to be screened for novel coronavirus
according to an announcement from the Centers for Disease Control and Prevention.
Starting today, Jan. 17, 2020, people traveling from Wuhan to New York (JFK), San Francisco (SFO), and Los Angeles (LAX) airports will be screened for symptoms associated with 2019-nCoV, which include fever, cough, and difficulty breathing.
“Based on the information that CDC has today, we believe the current risk for this virus to the general public is low,” Nancy Messonnier, MD, director of the National Center for Immunization and Respiratory Diseases, said during a CDC telebriefing.
To date, 45 cases of 2019-nCoV have been reported in Wuhan, according to the CDC. The Wuhan Municipal Health Commission said 15 patients have been cured and discharged, 5 severe cases are still being treated, and 2 patients have died. Both deaths occurred in older patients, one of whom was aged 69 years and one aged 61 years. One of the patients was known to have underlying health conditions.
Three cases of 2019-nCoV have been confirmed outside of Wuhan, one in Japan and two in Thailand. All three were travelers from Wuhan.
The virus is believed to have originated at Wuhan South China Seafood City, a market that sold seafood, chickens, bats, cats, marmots, and other wild animals. (The market has since been closed and disinfected.) The origin suggests animal-to-human transmission of 2019-nCoV, but it appears that human-to-human transmission can occur as well.
“While most of these infections seem to be happening from animals to people, there is some indication that limited person-to-person spread is happening,” Dr. Messonnier said.
Because of this potential risk, the CDC is working with the Department of Homeland Security’s Customs and Border Protection to screen travelers from Wuhan to the United States. The CDC is deploying about 100 additional staff to JFK, SFO, and LAX, where direct flights (JFK and SFO) or connecting flights (LAX) from Wuhan land.
The CDC could not confirm if exit screening is planned for people traveling abroad from Wuhan.
At the U.S. airports, travelers from Wuhan will be given a questionnaire asking about symptoms of 2019-nCoV (fever, cough, and difficulty breathing). People who exhibit symptoms will be assessed and questioned further. If they are believed to have 2019-nCoV, they will be sent to designated hospitals, where they will be examined, and samples will be collected.
Samples from patients with suspected 2019-nCoV will be sent to the CDC for analysis. Chinese health authorities made the full genome of 2019-nCoV publicly available, which will allow the CDC to confirm any cases that may arise in the United States. The CDC is currently working on a test to detect 2019-nCoV, which can be distributed to state health departments.
Earlier this month, the CDC issued a Level 1 Travel Health Notice for travelers to Wuhan and a Health Alert on 2019-nCoV. The latest information on 2019-nCoV can be found on the CDC’s Novel Coronavirus 2019 webpage.
Flu activity declines for second straight week
Flu activity dropped nationally for a second consecutive week, but the changing predominance in type from influenza B to A suggests that “it is too early to know whether the season has peaked,” the Centers for Disease Control and Prevention said Jan. 17.
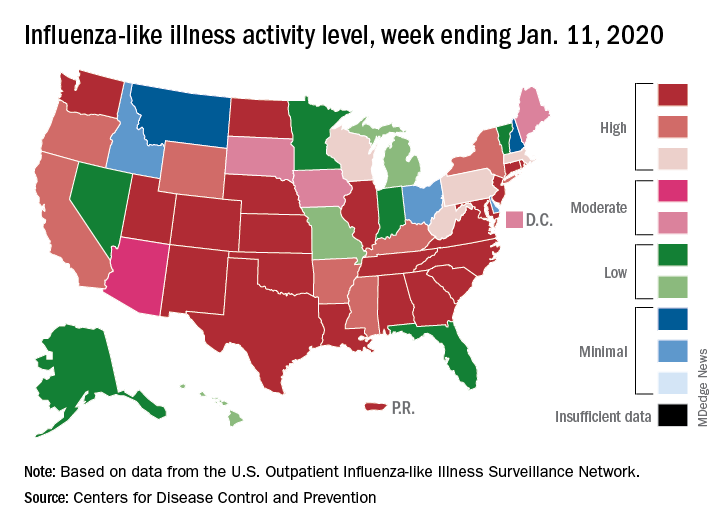
Patients with influenza-like illness (ILI) dropped from 5.7% to 4.7% of all visits to outpatient providers for the week ending Jan. 11, and the proportion of respiratory specimens positive for influenza decreased from 23.6% the week before to 22.9%, the CDC’s influenza division reported.
Despite that overall drop in positive specimens, however, “the percent positive for influenza A viruses increased and some regions are seeing increases in the proportion of influenza A(H1N1)pdm09 viruses compared to other influenza viruses,” the influenza division noted.
Outpatient activity on the state level also was down for the week. There were 23 jurisdictions – 21 states, New York City, and Puerto Rico – at level 10 on the CDC’s 1-10 scale of ILI activity for the week ending Jan. 11, compared with 33 the previous week, data from the CDC’s Outpatient Influenza-like Illness Surveillance Network show.
Indicators of ILI severity have not risen to high levels. “The percentage of deaths attributed to pneumonia and influenza increased from 6.0% to 6.9% but remains below the epidemic threshold” of 7.0% for the week, and the hospitalization rate remains at a fairly typical level for this time of year, the influenza division said.
For the week ending Jan. 11, 7 new ILI-related pediatric deaths were reported, which brings the total to 39 for the 2019-2020 season. Children aged 0-4 years are the second-most likely age group to be hospitalized with the flu (34.4/100,000 population) after adults aged 65 years and older, who have a cumulative rate of 47.6/100,000 for the season, the CDC reported.
Flu activity dropped nationally for a second consecutive week, but the changing predominance in type from influenza B to A suggests that “it is too early to know whether the season has peaked,” the Centers for Disease Control and Prevention said Jan. 17.
Patients with influenza-like illness (ILI) dropped from 5.7% to 4.7% of all visits to outpatient providers for the week ending Jan. 11, and the proportion of respiratory specimens positive for influenza decreased from 23.6% the week before to 22.9%, the CDC’s influenza division reported.
Despite that overall drop in positive specimens, however, “the percent positive for influenza A viruses increased and some regions are seeing increases in the proportion of influenza A(H1N1)pdm09 viruses compared to other influenza viruses,” the influenza division noted.
Outpatient activity on the state level also was down for the week. There were 23 jurisdictions – 21 states, New York City, and Puerto Rico – at level 10 on the CDC’s 1-10 scale of ILI activity for the week ending Jan. 11, compared with 33 the previous week, data from the CDC’s Outpatient Influenza-like Illness Surveillance Network show.
Indicators of ILI severity have not risen to high levels. “The percentage of deaths attributed to pneumonia and influenza increased from 6.0% to 6.9% but remains below the epidemic threshold” of 7.0% for the week, and the hospitalization rate remains at a fairly typical level for this time of year, the influenza division said.
For the week ending Jan. 11, 7 new ILI-related pediatric deaths were reported, which brings the total to 39 for the 2019-2020 season. Children aged 0-4 years are the second-most likely age group to be hospitalized with the flu (34.4/100,000 population) after adults aged 65 years and older, who have a cumulative rate of 47.6/100,000 for the season, the CDC reported.
Cannabis users struggle to quit cigarettes
a large national survey has found.

“Over the past decade, there has been an increase in the use of cannabis among cigarette smokers and prevalence of cigarettes and cannabis co-use, suggesting that the negative consequences of cigarette–cannabis co-use may also become more prevalent over time,” wrote Andrea H. Weinberger, PhD, of Yeshiva University, New York, and colleagues. They noted that the prevalence of cigarette smoking is nearly three times higher among persons who use cannabis and have cannabis use disorders relative to those who do not.
The 2019 National Survey of Drug Use and Health estimated that 15.9% of Americans aged 12 years or older used cannabis in the past year. This number has been rising throughout the 2000s.
In that same report, cannabis use disorder (or marijuana use disorder) was defined as when an individual experiences clinically significant impairment caused by the recurrent use of marijuana, including health problems, persistent or increasing use, and failure to meet major responsibilities at work, school, or home. The report stated that approximately 1.6% of Americans aged 12 or older in 2018 had marijuana use disorder.
In the study published in Tobacco Control, the researchers used the National Survey on Drug Use and Health data to analyze cigarette smoking quit ratios among U.S. adults with and without cannabis use and cannabis use disorders. “Quit ratio was calculated as the proportion of former smokers among lifetime smokers and is considered a measure of total cessation in a population,” the researchers said.
In 2016, the quit ratios for adults with a history of cannabis use or cannabis use disorders were 23% and 15%, respectively, compared with 51% and 48%, respectively, in those with no cannabis use or cannabis use disorders.
Overall, quit ratios did not change significantly from 2002 to 2016 for individuals with cannabis use disorders after controlling for multiple demographic factors and other substance use disorders. However, during the same time period, quit ratios showed a nonlinear increase in cannabis users, nonusers, and individuals without cannabis use disorders.
The study findings were limited by several factors including the inability to generalize results to youth or individuals living outside the United States, the use of DSM-IV criteria to identify cannabis use disorder, the use of self-reports, and the inability to examine the timing of cannabis use as related to attempts to quit smoking, the researchers noted. However, the results highlight the need to consider offering smoking cessation treatment to individuals being treated for cannabis use disorders, and to include cannabis users in smoking cessation programs, the researchers noted.
“Based on our results, both public health and clinical efforts to improve cigarette quit outcomes may benefit from including those with any cannabis use,” they said. More research is needed to determine whether trends in the quit ratio change over time for cannabis users or those with cannabis use disorder, they added.
The study was funded by the National Institute on Drug Abuse. The researchers had no financial conflicts to disclose.
SOURCE: Weinberger AH et al. Tob Control. 2020;29(1):74-80. doi: 10.1136/tobaccocontrol-2018-054590.
a large national survey has found.
“Over the past decade, there has been an increase in the use of cannabis among cigarette smokers and prevalence of cigarettes and cannabis co-use, suggesting that the negative consequences of cigarette–cannabis co-use may also become more prevalent over time,” wrote Andrea H. Weinberger, PhD, of Yeshiva University, New York, and colleagues. They noted that the prevalence of cigarette smoking is nearly three times higher among persons who use cannabis and have cannabis use disorders relative to those who do not.
The 2019 National Survey of Drug Use and Health estimated that 15.9% of Americans aged 12 years or older used cannabis in the past year. This number has been rising throughout the 2000s.
In that same report, cannabis use disorder (or marijuana use disorder) was defined as when an individual experiences clinically significant impairment caused by the recurrent use of marijuana, including health problems, persistent or increasing use, and failure to meet major responsibilities at work, school, or home. The report stated that approximately 1.6% of Americans aged 12 or older in 2018 had marijuana use disorder.
In the study published in Tobacco Control, the researchers used the National Survey on Drug Use and Health data to analyze cigarette smoking quit ratios among U.S. adults with and without cannabis use and cannabis use disorders. “Quit ratio was calculated as the proportion of former smokers among lifetime smokers and is considered a measure of total cessation in a population,” the researchers said.
In 2016, the quit ratios for adults with a history of cannabis use or cannabis use disorders were 23% and 15%, respectively, compared with 51% and 48%, respectively, in those with no cannabis use or cannabis use disorders.
Overall, quit ratios did not change significantly from 2002 to 2016 for individuals with cannabis use disorders after controlling for multiple demographic factors and other substance use disorders. However, during the same time period, quit ratios showed a nonlinear increase in cannabis users, nonusers, and individuals without cannabis use disorders.
The study findings were limited by several factors including the inability to generalize results to youth or individuals living outside the United States, the use of DSM-IV criteria to identify cannabis use disorder, the use of self-reports, and the inability to examine the timing of cannabis use as related to attempts to quit smoking, the researchers noted. However, the results highlight the need to consider offering smoking cessation treatment to individuals being treated for cannabis use disorders, and to include cannabis users in smoking cessation programs, the researchers noted.
“Based on our results, both public health and clinical efforts to improve cigarette quit outcomes may benefit from including those with any cannabis use,” they said. More research is needed to determine whether trends in the quit ratio change over time for cannabis users or those with cannabis use disorder, they added.
The study was funded by the National Institute on Drug Abuse. The researchers had no financial conflicts to disclose.
SOURCE: Weinberger AH et al. Tob Control. 2020;29(1):74-80. doi: 10.1136/tobaccocontrol-2018-054590.
FROM TOBACCO CONTROL
Two new cases of coronavirus pneumonia in Thailand, Japan

Health authorities in Wuhan, Hubei Province, China, identified the novel coronavirus, 2019-nCoV, responsible for the outbreak of a mysterious pneumonia that resulted in hospitalization of more than 40 patients and one death, according to the Centers for Disease Control and Prevention in a statement on the CDC website.
On Jan. 13, the Thailand’s Ministry of Public Health reported the first imported case of lab-confirmed 2019-nCoV from Wuhan. The Centers for Disease Control and Prevention stated: “The traveler with febrile illness was detected on the same day by thermal surveillance at Suvarnabhumi Airport, Thailand, and was hospitalized the same day. After temperature check and initial assessment, she was transferred to the hospital for further investigations and treatment.”
Samples from this patient tested positive for coronaviruses by reverse transcriptase-polymerase chain reaction. The genomic sequencing analysis was performed by Emerging Infectious Diseases Health Science Center, the Thai Red Cross Society, and the Thai National Institute of Health. The patient is reported to be in stable condition.
The New York Times has reported a case of 2019-nCoV in Japan in a traveler returning from Wuhan. That patient is reported to have recovered and been discharged.
Chinese health authorities transmitted the full genome of “2019 novel coronavirus,” or “2019-nCoV,” to GenBank, the genetic sequence database managed by the National Institutes of Health, and in the Global Initiative on Sharing All Influenza Data portal.
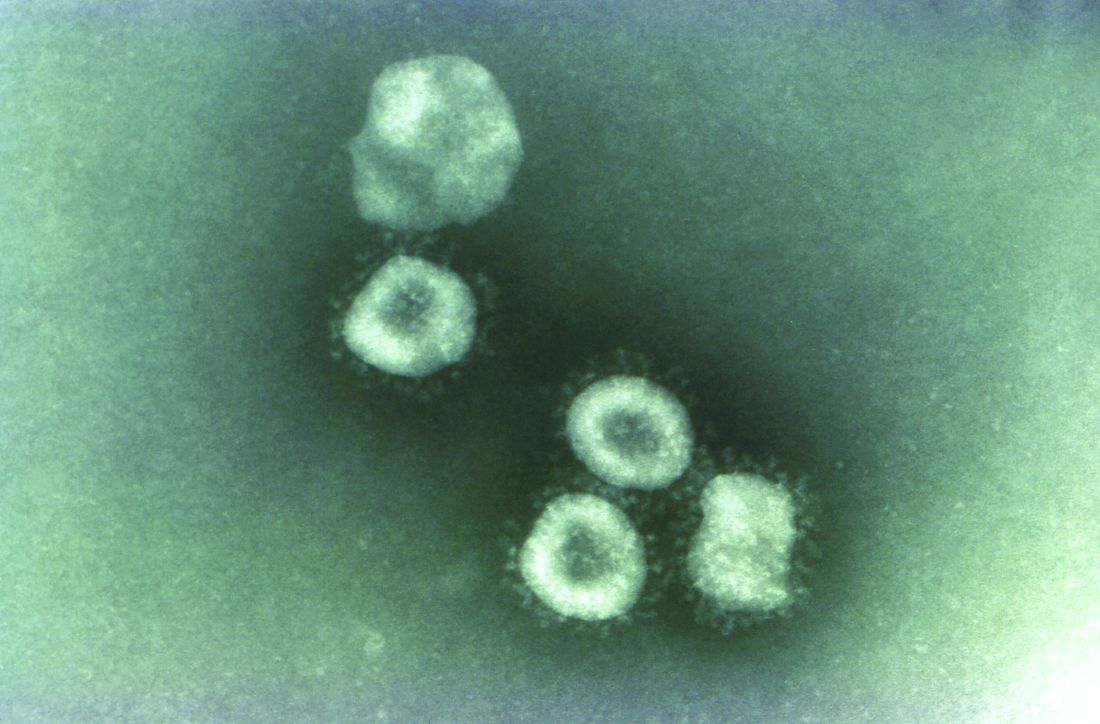
Coronaviruses are a large family of viruses. Most known human coronaviruses only cause mild respiratory disease, such as the common cold. But several coronaviruses have emerged to infect people and cause severe disease, such as has been seen with severe acute respiratory syndrome (SARS) and Middle East respiratory syndrome (MERS). The cases in the Wuhan pneumonia outbreak have tested negative for both SARS and MERS.
The outbreak in Wuhan appears to be contained. The World Health Organization reported that the Wuhan health authorities identified and followed 763 close contacts, including health care workers. No additional cases of infection with the novel coronavirus have been identified. The cluster of cases is linked to the Wuhan South China Seafood City market where – in addition to seafood – chickens, bats, marmots, and other animals were sold. That market has been closed since Jan. 1, 2020, for cleaning and disinfection.
The WHO is monitoring the situation closely and is in close contact with Chinese health authorities.
The CDC has issued a Level 1 travel alert and recommended that travelers to Wuhan, a city of over 19 million people, avoid animal and meat markets, avoid contact with sick people, and wash hands often with soap and water. Travelers who have been in Wuhan recently and who experience respiratory symptoms should notify the local health department immediately.
In addition, the CDC recommends that, for symptomatic patients with a history of travel to Wuhan, caution should be exercised in the health care setting. “Ask such patients to don a surgical mask as soon as they are identified. Conduct their evaluation in a private room with the door closed. Personnel entering the room to evaluate the patient should use contact precautions and wear an N95 disposable facepiece respirator. For patients admitted for inpatient care, implement contact and airborne isolation precautions, in addition to standard precautions, until further information becomes available. For additional infection control guidance see: www.cdc.gov/infectioncontrol/guidelines/isolation/index.html.”
Health authorities in Wuhan, Hubei Province, China, identified the novel coronavirus, 2019-nCoV, responsible for the outbreak of a mysterious pneumonia that resulted in hospitalization of more than 40 patients and one death, according to the Centers for Disease Control and Prevention in a statement on the CDC website.
On Jan. 13, the Thailand’s Ministry of Public Health reported the first imported case of lab-confirmed 2019-nCoV from Wuhan. The Centers for Disease Control and Prevention stated: “The traveler with febrile illness was detected on the same day by thermal surveillance at Suvarnabhumi Airport, Thailand, and was hospitalized the same day. After temperature check and initial assessment, she was transferred to the hospital for further investigations and treatment.”
Samples from this patient tested positive for coronaviruses by reverse transcriptase-polymerase chain reaction. The genomic sequencing analysis was performed by Emerging Infectious Diseases Health Science Center, the Thai Red Cross Society, and the Thai National Institute of Health. The patient is reported to be in stable condition.
The New York Times has reported a case of 2019-nCoV in Japan in a traveler returning from Wuhan. That patient is reported to have recovered and been discharged.
Chinese health authorities transmitted the full genome of “2019 novel coronavirus,” or “2019-nCoV,” to GenBank, the genetic sequence database managed by the National Institutes of Health, and in the Global Initiative on Sharing All Influenza Data portal.
Coronaviruses are a large family of viruses. Most known human coronaviruses only cause mild respiratory disease, such as the common cold. But several coronaviruses have emerged to infect people and cause severe disease, such as has been seen with severe acute respiratory syndrome (SARS) and Middle East respiratory syndrome (MERS). The cases in the Wuhan pneumonia outbreak have tested negative for both SARS and MERS.
The outbreak in Wuhan appears to be contained. The World Health Organization reported that the Wuhan health authorities identified and followed 763 close contacts, including health care workers. No additional cases of infection with the novel coronavirus have been identified. The cluster of cases is linked to the Wuhan South China Seafood City market where – in addition to seafood – chickens, bats, marmots, and other animals were sold. That market has been closed since Jan. 1, 2020, for cleaning and disinfection.
The WHO is monitoring the situation closely and is in close contact with Chinese health authorities.
The CDC has issued a Level 1 travel alert and recommended that travelers to Wuhan, a city of over 19 million people, avoid animal and meat markets, avoid contact with sick people, and wash hands often with soap and water. Travelers who have been in Wuhan recently and who experience respiratory symptoms should notify the local health department immediately.
In addition, the CDC recommends that, for symptomatic patients with a history of travel to Wuhan, caution should be exercised in the health care setting. “Ask such patients to don a surgical mask as soon as they are identified. Conduct their evaluation in a private room with the door closed. Personnel entering the room to evaluate the patient should use contact precautions and wear an N95 disposable facepiece respirator. For patients admitted for inpatient care, implement contact and airborne isolation precautions, in addition to standard precautions, until further information becomes available. For additional infection control guidance see: www.cdc.gov/infectioncontrol/guidelines/isolation/index.html.”

Drop in flu activity may not signal seasonal peak
A key indicator of flu activity dropped but remains high, but measures of severity have not yet shown any unusual increases, according to the Centers for Disease Control and Prevention.
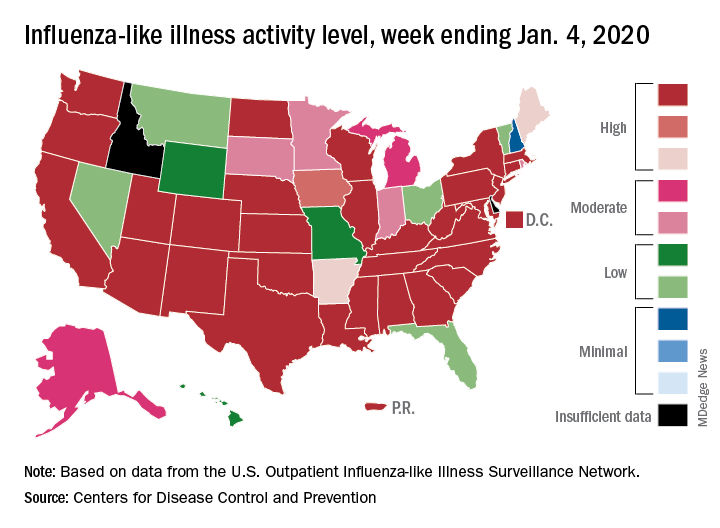
Patients with influenza-like illness (ILI) made up an estimated 5.8% of the visits to outpatient providers during the week ending Jan. 4, and that’s a decline from 7.0% for the last full week of 2019, the CDC’s influenza division reported.
That 7.0% outpatient ILI visit rate was the highest seen in December since 2003, but “hospitalization rates and percent of deaths due to pneumonia and influenza remain low,” the influenza division said in its weekly report.
Influenza B/Victoria and influenza A(H1N1)pdm09 viruses have been the predominant strains so far this season, and they “are more likely to affect children and younger adults than the elderly. Because the majority of hospitalizations and deaths occur among people age 65 and older, with fewer illnesses among that group, we expect, on a population level, to see less impact in flu-related hospitalizations and deaths,” the CDC said.
Last year, there was a similar drop in the outpatient ILI rate in early January after visits rose through December. The rate then increased for another 5 weeks before peaking at 5.0% in February. A similar pattern also occurred during the 2016-2017 and 2015-2016 seasons, CDC data show.
The nationwide ILI hospitalization rate, which is cumulative through the season, was up to 14.6 per 100,000 population for the week ending Jan. 4, the CDC said. Here are the corresponding rates for each of the last five seasons:
- 11.6 (2018-2019).
- 30.5 (2017-2018).
- 12.2 (2016-2017).
- 1.8 (2015-2016).
- 38.3 (2014-2015).
There were five new ILI-related pediatric deaths reported for the week ending Jan. 4, two of which occurred the week before. The total is now up to 32 for the 2019-2020 season, the CDC said in the weekly report. Last season, there were 21 pediatric deaths through the first January report, compared with 42 during the 2017-2018 season and 13 in 2016-2017.
A key indicator of flu activity dropped but remains high, but measures of severity have not yet shown any unusual increases, according to the Centers for Disease Control and Prevention.
Patients with influenza-like illness (ILI) made up an estimated 5.8% of the visits to outpatient providers during the week ending Jan. 4, and that’s a decline from 7.0% for the last full week of 2019, the CDC’s influenza division reported.
That 7.0% outpatient ILI visit rate was the highest seen in December since 2003, but “hospitalization rates and percent of deaths due to pneumonia and influenza remain low,” the influenza division said in its weekly report.
Influenza B/Victoria and influenza A(H1N1)pdm09 viruses have been the predominant strains so far this season, and they “are more likely to affect children and younger adults than the elderly. Because the majority of hospitalizations and deaths occur among people age 65 and older, with fewer illnesses among that group, we expect, on a population level, to see less impact in flu-related hospitalizations and deaths,” the CDC said.
Last year, there was a similar drop in the outpatient ILI rate in early January after visits rose through December. The rate then increased for another 5 weeks before peaking at 5.0% in February. A similar pattern also occurred during the 2016-2017 and 2015-2016 seasons, CDC data show.
The nationwide ILI hospitalization rate, which is cumulative through the season, was up to 14.6 per 100,000 population for the week ending Jan. 4, the CDC said. Here are the corresponding rates for each of the last five seasons:
- 11.6 (2018-2019).
- 30.5 (2017-2018).
- 12.2 (2016-2017).
- 1.8 (2015-2016).
- 38.3 (2014-2015).
There were five new ILI-related pediatric deaths reported for the week ending Jan. 4, two of which occurred the week before. The total is now up to 32 for the 2019-2020 season, the CDC said in the weekly report. Last season, there were 21 pediatric deaths through the first January report, compared with 42 during the 2017-2018 season and 13 in 2016-2017.
Mystery pneumonia in China has health officials on alert
An according to a statement from the Centers for Disease Control and Prevention.![]()
As of Jan. 5, 2020, 59 cases of the disease have been reported by the Wuhan Municipal Health Commission. The cluster of cases is linked to the Wuhan South China Seafood City market where – in addition to seafood – chickens, bats, marmots, and other animals were sold. That market has been closed since Jan. 1, 2020, for cleaning and disinfection.
Wuhan health authorities are closely monitoring over 150 contacts for symptoms. Laboratory results have been negative for influenza, avian influenza, adenovirus, and the viruses that caused SARS (severe acute respiratory syndrome) and MERS (Middle East respiratory syndrome). So far, there are no reports of person-to-person transmission or health care worker infection of this pneumonia.
The World Health Organization reported that, as of Dec. 31, 2019, about one-quarter of patients were severely ill with the pneumonia and the rest were stable. Symptoms reported include fever, difficulty breathing, and chest radiographs showing invasive lesions in both lungs. All patients are being treated in isolation and efforts to identify the pathogen are ongoing.

The WHO is monitoring the situation closely and is in close contact with Chinese health authorities.
The CDC has recommended that travelers to Wuhan, a city of over 19 million people, avoid animal and meat markets, avoid contact with sick people, and wash hands often with soap and water. Travelers who have been in Wuhan recently and who experience respiratory symptoms should notify the local health department immediately. In addition, the CDC has issued a Level 1 travel alert, which recommends travelers observe usual precautions against infectious disease.
In addition, the CDC recommends that, for symptomatic patients with a history of travel to Wuhan, caution should be exercised in the health care setting. “Ask such patients to don a surgical mask as soon as they are identified. Conduct their evaluation in a private room with the door closed. Personnel entering the room to evaluate the patient should use contact precautions and wear an N95 disposable facepiece respirator. For patients admitted for inpatient care, implement contact and airborne isolation precautions, in addition to standard precautions, until further information becomes available. For additional infection control guidance see: www.cdc.gov/infectioncontrol/guidelines/isolation/index.html.”
An according to a statement from the Centers for Disease Control and Prevention.![]()
As of Jan. 5, 2020, 59 cases of the disease have been reported by the Wuhan Municipal Health Commission. The cluster of cases is linked to the Wuhan South China Seafood City market where – in addition to seafood – chickens, bats, marmots, and other animals were sold. That market has been closed since Jan. 1, 2020, for cleaning and disinfection.
Wuhan health authorities are closely monitoring over 150 contacts for symptoms. Laboratory results have been negative for influenza, avian influenza, adenovirus, and the viruses that caused SARS (severe acute respiratory syndrome) and MERS (Middle East respiratory syndrome). So far, there are no reports of person-to-person transmission or health care worker infection of this pneumonia.
The World Health Organization reported that, as of Dec. 31, 2019, about one-quarter of patients were severely ill with the pneumonia and the rest were stable. Symptoms reported include fever, difficulty breathing, and chest radiographs showing invasive lesions in both lungs. All patients are being treated in isolation and efforts to identify the pathogen are ongoing.
The WHO is monitoring the situation closely and is in close contact with Chinese health authorities.
The CDC has recommended that travelers to Wuhan, a city of over 19 million people, avoid animal and meat markets, avoid contact with sick people, and wash hands often with soap and water. Travelers who have been in Wuhan recently and who experience respiratory symptoms should notify the local health department immediately. In addition, the CDC has issued a Level 1 travel alert, which recommends travelers observe usual precautions against infectious disease.
In addition, the CDC recommends that, for symptomatic patients with a history of travel to Wuhan, caution should be exercised in the health care setting. “Ask such patients to don a surgical mask as soon as they are identified. Conduct their evaluation in a private room with the door closed. Personnel entering the room to evaluate the patient should use contact precautions and wear an N95 disposable facepiece respirator. For patients admitted for inpatient care, implement contact and airborne isolation precautions, in addition to standard precautions, until further information becomes available. For additional infection control guidance see: www.cdc.gov/infectioncontrol/guidelines/isolation/index.html.”
Flu records most active December since 2003
The 2019-2020 flu season took a big jump in severity during the last full week of 2019, according to the Centers for Disease Control and Prevention.
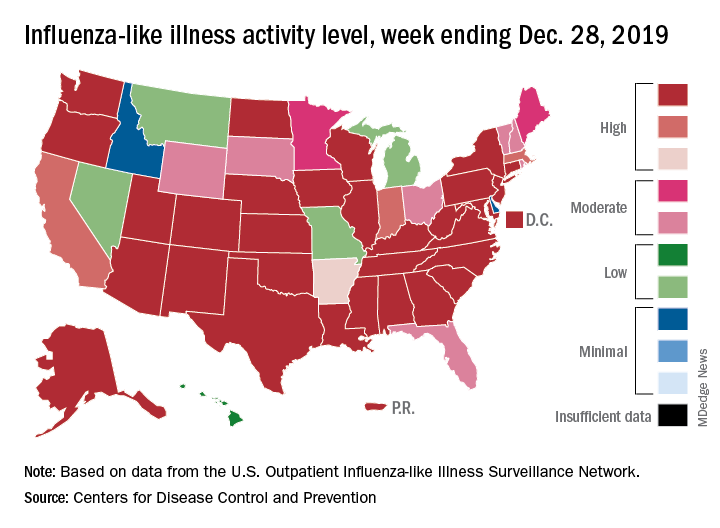
For the week ending Dec. 28, 6.9% of all outpatient visits to health care providers were for influenza-like illness (ILI), the CDC’s influenza division reported Jan. 3. That is up from 5.1% the previous week and is the highest rate recorded in December since 2003. During the flu pandemic season of 2009-2010, the rate peaked in October and dropped to relatively normal levels by the end of November, CDC data show.
This marks the eighth consecutive week that the outpatient visit rate has been at or above the nation’s baseline level of 2.4%, but the data for this week “may in part be influenced by changes in healthcare-seeking behavior that can occur during the holidays,” the CDC suggested.
All those outpatient visits mean that the ILI activity map is getting quite red. Thirty states, as well as the District of Columbia and Puerto Rico, were at the highest level on the CDC’s 1-10 activity scale during the week ending Dec. 28, compared with 20 the week before. Four states were categorized in the “high” range with activity levels of 8 and 9.
There have been approximately 6.4 million flu illnesses so far this season, the CDC estimated, along with 55,000 hospitalizations, although the ILI admission rate of 9.2 per 100,000 population is fairly typical for this time of year.
The week of Dec. 28 also brought reports of five more ILI-related pediatric deaths, which all occurred in the two previous weeks. A total of 27 children have died from the flu so far during the 2019-2020 season, the CDC said.
The 2019-2020 flu season took a big jump in severity during the last full week of 2019, according to the Centers for Disease Control and Prevention.
For the week ending Dec. 28, 6.9% of all outpatient visits to health care providers were for influenza-like illness (ILI), the CDC’s influenza division reported Jan. 3. That is up from 5.1% the previous week and is the highest rate recorded in December since 2003. During the flu pandemic season of 2009-2010, the rate peaked in October and dropped to relatively normal levels by the end of November, CDC data show.
This marks the eighth consecutive week that the outpatient visit rate has been at or above the nation’s baseline level of 2.4%, but the data for this week “may in part be influenced by changes in healthcare-seeking behavior that can occur during the holidays,” the CDC suggested.
All those outpatient visits mean that the ILI activity map is getting quite red. Thirty states, as well as the District of Columbia and Puerto Rico, were at the highest level on the CDC’s 1-10 activity scale during the week ending Dec. 28, compared with 20 the week before. Four states were categorized in the “high” range with activity levels of 8 and 9.
There have been approximately 6.4 million flu illnesses so far this season, the CDC estimated, along with 55,000 hospitalizations, although the ILI admission rate of 9.2 per 100,000 population is fairly typical for this time of year.
The week of Dec. 28 also brought reports of five more ILI-related pediatric deaths, which all occurred in the two previous weeks. A total of 27 children have died from the flu so far during the 2019-2020 season, the CDC said.
Despite PCV, pediatric asthma patients face pneumococcal risks
Even on-time pneumococcal vaccines don’t completely protect children with asthma from developing invasive pneumococcal disease, a meta-analysis has determined.
Despite receiving pneumococcal valent 7, 10, or 13, children with asthma were still almost twice as likely to develop the disease as were children without asthma, Jose A. Castro-Rodriguez, MD, PhD, and colleagues reported in Pediatrics (2020 Jan. doi: 10.1542/peds.2019-1200). None of the studies included rates for those who received the pneumococcal polysaccharide vaccine (PPSV23).
“For the first time, this meta-analysis reveals 90% increased odds of invasive pneumococcal disease (IPD) among [vaccinated] children with asthma,” said Dr. Castro-Rodriguez, of Pontificia Universidad Católica de Chile, Santiago, and colleagues. “If confirmed, these findings will bear clinical and public health importance,” they noted, because guidelines now recommend PPSV23 after age 2 in children with asthma only if they’re treated with prolonged high-dose oral corticosteroids.
However, because the analysis comprised only four studies, the authors cautioned that the results aren’t enough to justify changes to practice recommendations.
Asthma treatment with inhaled corticosteroids (ICS) may be driving the increased risk, Dr. Castro-Rodriguez and his coauthors suggested. ICS deposition in the oropharynx could boost oropharyngeal candidiasis risk by weakening the mucosal immune response, the researchers noted. And that same process may be at work with Streptococcus pneumoniae.
A prior study found that children with asthma who received ICS for at least 1 month were almost four times more likely to have oropharyngeal colonization by S. pneumoniae as were those who didn’t get the drugs. Thus, a higher carrier rate of S. pneumoniae in the oropharynx, along with asthma’s impaired airway clearance, might increase the risk of pneumococcal diseases, the investigators explained.
Dr. Castro-Rodriguez and colleagues analyzed four studies with more than 4,000 cases and controls, and about 26 million person-years of follow-up.
Rates and risks of IPD in the four studies were as follows:
- Among those with IPD, 27% had asthma, with 18% of those without, an adjusted odds ratio (aOR) of 1.8.
- In a European of patients who received at least 3 doses of PCV7, IPD rates per 100,000 person-years for 5-year-olds were 11.6 for children with asthma and 7.3 for those without. For 5- to 17-year-olds with and without asthma, the rates were 2.3 and 1.6, respectively.
- In 2001, a Korean found an aOR of 2.08 for IPD in children with asthma, compared with those without. In 2010, the aOR was 3.26. No vaccine types were reported in the study.
- of IPD were 3.7 per 100,000 person-years for children with asthma, compared with 2.5 for healthy controls – an adjusted relative risk of 1.5.
The pooled estimate of the four studies revealed an aOR of 1.9 for IPD among children with asthma, compared with those without, Dr. Castro-Rodriguez and his team concluded.
None of the studies reported hospital admissions, mortality, length of hospital stay, intensive care admission, invasive respiratory support, or additional medication use.
One, however, did find asthma severity was significantly associated with increasing IPD treatment costs per 100,000 person-years: $72,581 for healthy controls, compared with $100,020 for children with mild asthma, $172,002 for moderate asthma, and $638,452 for severe asthma.
In addition, treating all-cause pneumonia was more expensive in children with asthma. For all-cause pneumonia, the researchers found that estimated costs per 100,000 person-years for mild, moderate, and severe asthma were $7.5 million, $14.6 million, and $46.8 million, respectively, compared with $1.7 million for healthy controls.
The authors had no relevant financial disclosures.
SOURCE: Castro-Rodriguez J et al. Pediatrics. 2020 Jan. doi: 10.1542/peds.2019-1200.
The meta-analysis contains some important lessons for pediatricians, Tina Q. Tan, MD, wrote in an accompanying editorial.
“First, asthma remains a risk factor for invasive pneumococcal disease and pneumococcal pneumonia, even in the era of widespread use of PCV,” Dr. Tan noted. “Second, it is important that all patients, especially those with asthma, are receiving their vaccinations on time and, most notably, are up to date on their pneumococcal vaccinations. This will provide the best protection against pneumococcal infections and their complications for pediatric patients with asthma.”
Pneumococcal conjugate vaccines (PCV) have impressively decreased rates of invasive pneumococcal disease (IPD) and pneumonia in children in the United States, Dr. Tan explained. Overall, incidence dropped from 95 cases per 100,000 person-years in 1998 to only 9 cases per 100,000 in 2016.
In addition, the incidence of IPD caused by 13-valent PCV serotypes fell, from 88 cases per 100,000 in 1998 to 2 cases per 100,000 in 2016.
The threat is not over, however.
“IPD still remains a leading cause of morbidity and mortality in the United States and worldwide,” Dr. Tan cautioned. “In 2017, the CDC’s Active Bacterial Core surveillance network reported that there were 31,000 cases of IPD (meningitis, bacteremia, and bacteremic pneumonia) and 3,590 deaths, of which 147 cases and 9 deaths occurred in children younger than 5 years of age.”
Dr. Tan is a professor of pediatrics at Northwestern University, Chicago. Her comments appear in Pediatrics 2020 Jan. doi: 10.1542/peds.2019-3360 .
Even on-time pneumococcal vaccines don’t completely protect children with asthma from developing invasive pneumococcal disease, a meta-analysis has determined.
Despite receiving pneumococcal valent 7, 10, or 13, children with asthma were still almost twice as likely to develop the disease as were children without asthma, Jose A. Castro-Rodriguez, MD, PhD, and colleagues reported in Pediatrics (2020 Jan. doi: 10.1542/peds.2019-1200). None of the studies included rates for those who received the pneumococcal polysaccharide vaccine (PPSV23).
“For the first time, this meta-analysis reveals 90% increased odds of invasive pneumococcal disease (IPD) among [vaccinated] children with asthma,” said Dr. Castro-Rodriguez, of Pontificia Universidad Católica de Chile, Santiago, and colleagues. “If confirmed, these findings will bear clinical and public health importance,” they noted, because guidelines now recommend PPSV23 after age 2 in children with asthma only if they’re treated with prolonged high-dose oral corticosteroids.
However, because the analysis comprised only four studies, the authors cautioned that the results aren’t enough to justify changes to practice recommendations.
Asthma treatment with inhaled corticosteroids (ICS) may be driving the increased risk, Dr. Castro-Rodriguez and his coauthors suggested. ICS deposition in the oropharynx could boost oropharyngeal candidiasis risk by weakening the mucosal immune response, the researchers noted. And that same process may be at work with Streptococcus pneumoniae.
A prior study found that children with asthma who received ICS for at least 1 month were almost four times more likely to have oropharyngeal colonization by S. pneumoniae as were those who didn’t get the drugs. Thus, a higher carrier rate of S. pneumoniae in the oropharynx, along with asthma’s impaired airway clearance, might increase the risk of pneumococcal diseases, the investigators explained.
Dr. Castro-Rodriguez and colleagues analyzed four studies with more than 4,000 cases and controls, and about 26 million person-years of follow-up.
Rates and risks of IPD in the four studies were as follows:
- Among those with IPD, 27% had asthma, with 18% of those without, an adjusted odds ratio (aOR) of 1.8.
- In a European of patients who received at least 3 doses of PCV7, IPD rates per 100,000 person-years for 5-year-olds were 11.6 for children with asthma and 7.3 for those without. For 5- to 17-year-olds with and without asthma, the rates were 2.3 and 1.6, respectively.
- In 2001, a Korean found an aOR of 2.08 for IPD in children with asthma, compared with those without. In 2010, the aOR was 3.26. No vaccine types were reported in the study.
- of IPD were 3.7 per 100,000 person-years for children with asthma, compared with 2.5 for healthy controls – an adjusted relative risk of 1.5.
The pooled estimate of the four studies revealed an aOR of 1.9 for IPD among children with asthma, compared with those without, Dr. Castro-Rodriguez and his team concluded.
None of the studies reported hospital admissions, mortality, length of hospital stay, intensive care admission, invasive respiratory support, or additional medication use.
One, however, did find asthma severity was significantly associated with increasing IPD treatment costs per 100,000 person-years: $72,581 for healthy controls, compared with $100,020 for children with mild asthma, $172,002 for moderate asthma, and $638,452 for severe asthma.
In addition, treating all-cause pneumonia was more expensive in children with asthma. For all-cause pneumonia, the researchers found that estimated costs per 100,000 person-years for mild, moderate, and severe asthma were $7.5 million, $14.6 million, and $46.8 million, respectively, compared with $1.7 million for healthy controls.
The authors had no relevant financial disclosures.
SOURCE: Castro-Rodriguez J et al. Pediatrics. 2020 Jan. doi: 10.1542/peds.2019-1200.
FROM PEDIATRICS