User login
Technique Using Isoelastic Tension Band for Treatment of Olecranon Fractures
Olecranon fractures are relatively common in adults and constitute 10% of all upper extremity injuries.1,2 An olecranon fracture may be sustained either directly (from blunt trauma or a fall onto the tip of the elbow) or indirectly (as a result of forceful hyperextension of the triceps during a fall onto an outstretched arm). Displaced olecranon fractures with extensor discontinuity require reduction and stabilization. One treatment option is tension band wiring (TBW), which is used to manage noncomminuted fractures.3 TBW, first described by Weber and Vasey4 in 1963, involves transforming the distractive forces of the triceps into dynamic compression forces across the olecranon articular surface using 2 intramedullary Kirschner wires (K-wires) and stainless steel wires looped in figure-of-8 fashion.
Various modifications of the TBW technique of Weber and Vasey4 have been proposed to reduce the frequency of complications. These modifications include substituting screws for K-wires, aiming the angle of the K-wires into the anterior coronoid cortex or loop configuration of the stainless steel wire, using double knots and twisting procedures to finalize fixation, and using alternative materials for the loop construct.5-8 In the literature and in our experience, patients often complain after surgery about prominent K-wires and the twisted knots used to tension the construct.9-12 Surgeons also must address the technical difficulties of positioning the brittle wire without kinking, and avoiding slack while tensioning.
In this article, we report on the clinical outcomes of a series of 7 patients with olecranon fracture treated with a US Food and Drug Administration–approved novel isoelastic ultrahigh-molecular-weight polyethylene (UHMWPE) cerclage cable (Iso-Elastic Cerclage System, Kinamed).
Materials and Methods
Surgical Technique
The patient is arranged in a sloppy lateral position to allow access to the posterior elbow. A nonsterile tourniquet is placed on the upper arm, and the limb is sterilely prepared and draped in standard fashion. A posterolateral incision is made around the olecranon and extended proximally 6 cm and distally 6 cm along the subcutaneous border of the ulna. The fracture is visualized and comminution identified.
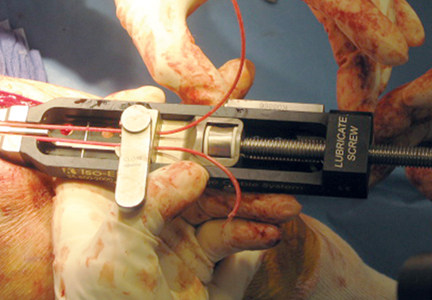
To provide anchorage for a pointed reduction clamp, the surgeon drills a 2.5-mm hole in the subcutaneous border of the ulnar shaft. The fracture is reduced in extension and the clamp affixed. The elbow is then flexed and the reduction confirmed visually and by imaging. After realignment of the articular surfaces, 2 longitudinal, parallel K-wires (diameter, 1.6-2.0 mm) are passed in antegrade direction through the proximal olecranon within the medullary canal of the shaft. The proximal ends must not cross the cortex so they may fully capture the figure-of-8 wire during subsequent, final advancement, and the distal ends must not pierce the anterior cortex. A 2.5-mm transverse hole is created distal to the fracture in the dorsal aspect of the ulnar shaft from medial to lateral at 2 times the distance from the tip of the olecranon to the fracture site. This hole is expanded with a 3.5-mm drill bit, allowing both strands of the cable to be passed simultaneously medial to lateral, making the figure-of-8. The 3.5-mm hole represents about 20% of the overall width of the bone, which we have not found to create a significant stress riser in either laboratory or clinical tests of this construct. Proximally, the cables are placed on the periosteum of the olecranon but deep to the triceps tendon and adjacent to the K-wires. The locking clip is placed on the posterolateral aspect of the elbow joint in a location where it can be covered with local tissue for adequate padding. The cable is then threaded through the clamping bracket and tightened slowly and gradually with a tensioning device to low torque level (Figure 1). At this stage, tension may be released to make any necessary adjustments. Last, the locking clip is deployed, securing the tension band in the clip, and the excess cable is trimmed with a scalpel. Softening and pliability of the cable during its insertion and tensioning should be noted.

The ends of the K-wires are now curved in a hook configuration. The tines of the hooks should be parallel to accommodate the cable, and then the triceps is sharply incised to bone. If the bone is hard, an awl is used to create a pilot hole so the hook may be impaled into bone while capturing the cable. Next, the triceps is closed over the pins, minimizing the potential for pin migration and backout. The 2 K-wires are left in place to keep the fragments in proper anatomical alignment during healing and to prevent displacement with elbow motion. Figure 2 is a schematic of the final construct, and Figure 3 shows the construct in a patient.
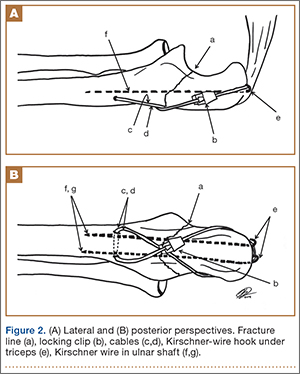
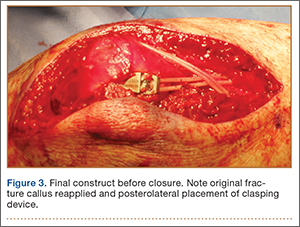
Reduction of the olecranon fracture is assessed by imaging in full extension to check for possible implant impingement. Last, we apply the previously harvested fracture callus to the fracture site. Layered closure is performed, and bulky soft dressings are applied. Postoperative immobilization with a splint is used. Gentle range-of-motion exercises begin in about 2 weeks and progress as pain allows.
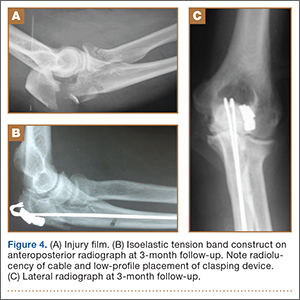
A case example with preoperative and postoperative images taken at 3-month follow-up is provided in Figure 4. The entire surgical technique can be viewed in the Video.
The video associated with this article is no longer available on this site. Please view all of our videos on the MDedge YouTube channel
Clinical Cases
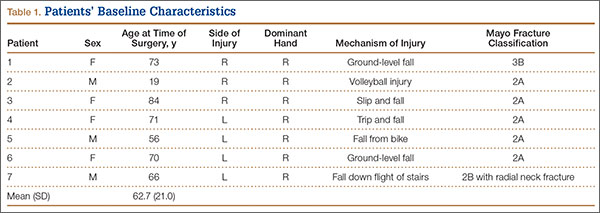
Between July 2007 and February 2011, 7 patients with displaced olecranon fractures underwent osteosynthesis using the isoelastic tension band (Table 1). According to the Mayo classification system, 5 of these patients had type 2A fractures, 1 had a type 2B fracture with an ipsilateral nondisplaced radial neck fracture, and 1 had a type 3B fracture. There were 4 female and 3 male patients. The injury was on the dominant side in 3 patients. All patients gave informed consent to evaluation at subsequent office visits and completed outcomes questionnaires by mail several years after surgery. Mean follow-up at which outcome measures questionnaires were obtained was 3.3 years (range, 2.1-6.8 years). Exclusion criteria were age under 18 years and inability to provide informed consent, fracture patterns with extensive articular comminution, and open fractures. Permission to conduct this research was granted by institutional review board.
At each visit, patients completed the Disabilities of the Arm, Shoulder, and Hand (DASH) functional outcome survey and were evaluated according to Broberg and Morrey’s elbow scoring system.13,14 Chart review consisted of evaluation of medical records, including radiographs and orthopedic physician notes in which preoperative examination was documented, mechanism of injury was noted, radiologic fracture pattern was evaluated, and time to bony union was recorded. Elbow motion was documented. Grip strength was measured with a calibrated Jamar dynamometer (Sammons Preston Rolyan) set at level 2, as delineated in Broberg and Morrey’s functional elbow scoring system.
Results
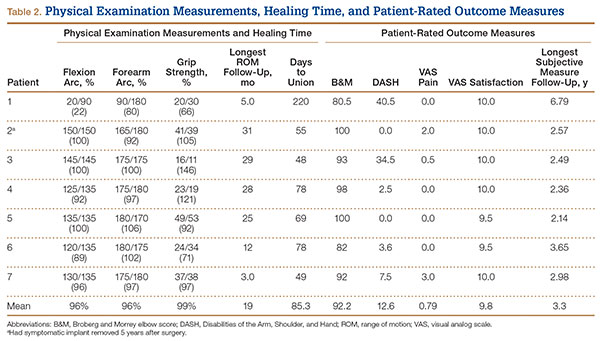
The 7 patients were assessed at a mean final follow-up of 19 months after surgery and received a mean Broberg and Morrey score of good (92.2/100) (Table 2). Restoration of motion and strength was excellent; compared with contralateral extremity, mean flexion arc was 96%, and mean forearm rotation was 96%. Grip was 99% of the noninjured side, perhaps the result of increased conditioning from physical therapy. Patients completed outcomes questionnaires at a mean of 3.3 years after surgery. Mean (SD) DASH score at this longest follow-up was 12.6 (17.2) (Table 2). Patients were satisfied (mean, 9.8/10; range, 9.5-10) and had little pain (mean, 0.8/10; range, 0-3). All fractures united, and there were no infections. One patient had a satisfactory union with complete restoration of motion and continued to play sports vocationally but developed pain over the locking clip 5 years after the index procedure and decided to have the implant removed. He had no radiographic evidence of K-wire or implant migration. Another patient had a minor degree of implant irritation at longest follow-up but did not request hardware removal.
Discussion
Stainless steel wire is often used in TBW because of its widespread availability, low cost, lack of immunogenicity, and relative strength.7 However, stainless steel wire has several disadvantages. It is susceptible to low-cycle fatigue failure, and fatigue strength may be seriously reduced secondary to incidental trauma to the wire on implantation.15,16 Other complications are kinking, skin irritation, implant prominence, fixation loss caused by wire loosening, and inadequate initial reduction potentially requiring revision.10,12,17-21
Isoelastic cable is a new type of cerclage cable that consists of UHMWPE strands braided over a nylon core. The particular property profile of the isoelastic tension band gives the cable intrinsic elastic and pliable qualities. In addition, unlike stainless steel, the band maintains a uniform, continuous compression force across a fracture site.22 Multifilament braided cables fatigue and fray, but the isoelastic cerclage cable showed no evidence of fraying or breakage after 1 million loading cycles.22,23 Compared with metal wire or braided metal cable, the band also has higher fatigue strength and higher ultimate tensile strength.7 Furthermore, the cable is less abrasive than stainless steel, so theoretically it is less irritating to surrounding subcutaneous tissue. Last, the pliability of the band allows the surgeon to create multiple loops of cable without the wire-failure side effects related to kinking, which is common with the metal construct.
In 2010, Ting and colleagues24 retrospectively studied implant failure complications associated with use of isoelastic cerclage cables in the treatment of periprosthetic fractures in total hip arthroplasty. They reported a breakage rate of 0% and noted that previously published breakage data for metallic cerclage devices ranged from 0% to 44%. They concluded that isoelastic cables were not associated with material failure, and there were no direct complications related to the cables. Similarly, Edwards and colleagues25 evaluated the same type of cable used in revision shoulder arthroplasty and reported excellent success and no failures. Although these data stem from use in the femur and humerus, we think the noted benefits apply to fractures of the elbow as well, as we observed a similar breakage rate (0%).
Various studies have addressed the clinical complaints and reoperation rates associated with retained metal implants after olecranon fixation. Traditional AO (Arbeitsgemeinschaft für Osteosynthesefragen) technique involves subcutaneous placement of stainless steel wires, which often results in tissue irritation. Reoperation rates as high as 80% have been reported, and a proportion of implant removals may in fact be caused by factors related to the subcutaneous placement of the metallic implants rather than K-wire migration alone.5,12,18 A nonmetallic isoelastic tension band can provide a more comfortable and less irritating implant, which could reduce the need for secondary intervention related to painful subcutaneous implant. One of our 7 patients had a symptomatic implant removed 5 years after surgery. This patient complained of pain over the area of the tension band device clip, so after fracture healing the entire fixation device was removed in the operating room. If reoperation is necessary, removal of intramedullary K-wires is relatively simple using a minimal incision; removal of stainless steel TBW may require a larger approach if the twisted knots cannot be easily retrieved.
A study of compression forces created by stainless steel wire demonstrated that a “finely tuned mechanical sense” was needed to produce optimal fixation compression when using stainless steel wire.26 It was observed that a submaximal twist created insufficient compressive force, while an ostensibly minimal increase in twisting force above optimum abruptly caused wire failure through breakage. Cerclage cables using clasping devices, such as the current isoelastic cerclage cable, were superior in ease of application. Furthermore, a clasping device allows for cable tension readjustment that is not possible with stainless steel wire. The clasping mechanism precludes the surgeon from having to bury the stainless steel knot and allows for the objective cable-tensioning not possible with stainless steel wire. Last, the tensioning device is titratable, which allows the surgeon to set the construct at a predetermined quantitative tension, which is of benefit in patients with osteopenia.
One limitation of this study is that it did not resolve the potential for K-wire migration, and we agree with previous recommendations that careful attention to surgical technique may avoid such a complication.10 In addition, the sample was small, and the study lacked a control group; a larger sample and a control group would have boosted study power. Nevertheless, the physical and functional outcomes associated with use of this technique were excellent. These results demonstrate an efficacious attempt to decrease secondary surgery rates and are therefore proof of concept that the isoelastic tension band may be used as an alternative to stainless steel in the TBW of displaced olecranon fractures with minimal or no comminution.
Conclusion
This easily reproducible technique for use of an isoelastic tension band in olecranon fracture fixation was associated with excellent physical and functional outcomes in a series of 7 patients. The rate of secondary intervention was slightly better for these patients than for patients treated with wire tension band fixation. Although more rigorous study of this device is needed, we think it is a promising alternative to wire tension band techniques.
1. Rommens PM, Küchle R, Schneider RU, Reuter M. Olecranon fractures in adults: factors influencing outcome. Injury. 2004;35(11):1149-1157.
2. Veillette CJ, Steinmann SP. Olecranon fractures. Orthop Clin North Am. 2008;39(2):229-236.
3. Newman SD, Mauffrey C, Krikler S. Olecranon fractures. Injury. 2009;40(6):575-581.
4. Weber BG, Vasey H. Osteosynthesis in olecranon fractures [in German]. Z Unfallmed Berufskr. 1963;56:90-96.
5. Netz P, Strömberg L. Non-sliding pins in traction absorbing wiring of fractures: a modified technique. Acta Orthop Scand. 1982;53(3):355-360.
6. Prayson MJ, Williams JL, Marshall MP, Scilaris TA, Lingenfelter EJ. Biomechanical comparison of fixation methods in transverse olecranon fractures: a cadaveric study. J Orthop Trauma. 1997;11(8):565-572.
7. Rothaug PG, Boston RC, Richardson DW, Nunamaker DM. A comparison of ultra-high-molecular weight polyethylene cable and stainless steel wire using two fixation techniques for repair of equine midbody sesamoid fractures: an in vitro biomechanical study. Vet Surg. 2002;31(5):445-454.
8. Harrell RM, Tong J, Weinhold PS, Dahners LE. Comparison of the mechanical properties of different tension band materials and suture techniques. J Orthop Trauma. 2003;17(2):119-122.
9. Nimura A, Nakagawa T, Wakabayashi Y, Sekiya I, Okawa A, Muneta T. Repair of olecranon fractures using FiberWire without metallic implants: report of two cases. J Orthop Surg Res. 2010;5:73.
10. Macko D, Szabo RM. Complications of tension-band wiring of olecranon fractures. J Bone Joint Surg Am. 1985;67(9):1396-1401.
11. Helm RH, Hornby R, Miller SW. The complications of surgical treatment of displaced fractures of the olecranon. Injury. 1987;18(1):48-50.
12. Romero JM, Miran A, Jensen CH. Complications and re-operation rate after tension-band wiring of olecranon fractures. J Orthop Sci. 2000;5(4):318-320.
13. Beaton DE, Katz JN, Fossel AH, Wright JG, Tarasuk V, Bombardier C. Measuring the whole or the parts? Validity, reliability, and responsiveness of the Disabilities of the Arm, Shoulder and Hand outcome measure in different regions of the upper extremity. J Hand Ther. 2001;14(2):128-146.
14. Broberg MA, Morrey BF. Results of delayed excision of the radial head after fracture. J Bone Joint Surg Am. 1986;68(5):669-674.
15. Bostrom MP, Asnis SE, Ernberg JJ, et al. Fatigue testing of cerclage stainless steel wire fixation. J Orthop Trauma. 1994;8(5):422-428.
16. Oh I, Sander TW, Treharne RW. The fatigue resistance of orthopaedic wire. Clin Orthop Relat Res. 1985;(192):228-236.
17. Amstutz HC, Maki S. Complications of trochanteric osteotomy in total hip replacement. J Bone Joint Surg Am. 1978;60(2):214-216.
18. Jensen CM, Olsen BB. Drawbacks of traction-absorbing wiring (TAW) in displaced fractures of the olecranon. Injury. 1986;17(3):174-175.
19. Kumar G, Mereddy PK, Hakkalamani S, Donnachie NJ. Implant removal following surgical stabilization of patella fracture. Orthopedics. 2010;33(5).
20. Hume MC, Wiss DA. Olecranon fractures. A clinical and radiographic comparison of tension band wiring and plate fixation. Clin Orthop Relat Res. 1992;(285):229-235.
21. Wolfgang G, Burke F, Bush D, et al. Surgical treatment of displaced olecranon fractures by tension band wiring technique. Clin Orthop Relat Res. 1987;(224):192-204.
22. Sarin VK, Mattchen TM, Hack B. A novel iso-elastic cerclage cable for treatment of fractures. Paper presented at: Annual Meeting of the Orthopaedic Research Society; February 20-23, 2005; Washington, DC. Paper 739.
23. Silverton CD, Jacobs JJ, Rosenberg AG, Kull L, Conley A, Galante JO. Complications of a cable grip system. J Arthroplasty. 1996;11(4):400-404.
24. Ting NT, Wera GD, Levine BR, Della Valle CJ. Early experience with a novel nonmetallic cable in reconstructive hip surgery. Clin Orthop Relat Res. 2010;468(9):2382-2386.
25. Edwards TB, Stuart KD, Trappey GJ, O’Connor DP, Sarin VK. Utility of polymer cerclage cables in revision shoulder arthroplasty. Orthopedics. 2011;34(4).
26. Shaw JA, Daubert HB. Compression capability of cerclage fixation systems. A biomechanical study. Orthopedics. 1988;11(8):1169-1174.
Olecranon fractures are relatively common in adults and constitute 10% of all upper extremity injuries.1,2 An olecranon fracture may be sustained either directly (from blunt trauma or a fall onto the tip of the elbow) or indirectly (as a result of forceful hyperextension of the triceps during a fall onto an outstretched arm). Displaced olecranon fractures with extensor discontinuity require reduction and stabilization. One treatment option is tension band wiring (TBW), which is used to manage noncomminuted fractures.3 TBW, first described by Weber and Vasey4 in 1963, involves transforming the distractive forces of the triceps into dynamic compression forces across the olecranon articular surface using 2 intramedullary Kirschner wires (K-wires) and stainless steel wires looped in figure-of-8 fashion.
Various modifications of the TBW technique of Weber and Vasey4 have been proposed to reduce the frequency of complications. These modifications include substituting screws for K-wires, aiming the angle of the K-wires into the anterior coronoid cortex or loop configuration of the stainless steel wire, using double knots and twisting procedures to finalize fixation, and using alternative materials for the loop construct.5-8 In the literature and in our experience, patients often complain after surgery about prominent K-wires and the twisted knots used to tension the construct.9-12 Surgeons also must address the technical difficulties of positioning the brittle wire without kinking, and avoiding slack while tensioning.
In this article, we report on the clinical outcomes of a series of 7 patients with olecranon fracture treated with a US Food and Drug Administration–approved novel isoelastic ultrahigh-molecular-weight polyethylene (UHMWPE) cerclage cable (Iso-Elastic Cerclage System, Kinamed).
Materials and Methods
Surgical Technique
The patient is arranged in a sloppy lateral position to allow access to the posterior elbow. A nonsterile tourniquet is placed on the upper arm, and the limb is sterilely prepared and draped in standard fashion. A posterolateral incision is made around the olecranon and extended proximally 6 cm and distally 6 cm along the subcutaneous border of the ulna. The fracture is visualized and comminution identified.
To provide anchorage for a pointed reduction clamp, the surgeon drills a 2.5-mm hole in the subcutaneous border of the ulnar shaft. The fracture is reduced in extension and the clamp affixed. The elbow is then flexed and the reduction confirmed visually and by imaging. After realignment of the articular surfaces, 2 longitudinal, parallel K-wires (diameter, 1.6-2.0 mm) are passed in antegrade direction through the proximal olecranon within the medullary canal of the shaft. The proximal ends must not cross the cortex so they may fully capture the figure-of-8 wire during subsequent, final advancement, and the distal ends must not pierce the anterior cortex. A 2.5-mm transverse hole is created distal to the fracture in the dorsal aspect of the ulnar shaft from medial to lateral at 2 times the distance from the tip of the olecranon to the fracture site. This hole is expanded with a 3.5-mm drill bit, allowing both strands of the cable to be passed simultaneously medial to lateral, making the figure-of-8. The 3.5-mm hole represents about 20% of the overall width of the bone, which we have not found to create a significant stress riser in either laboratory or clinical tests of this construct. Proximally, the cables are placed on the periosteum of the olecranon but deep to the triceps tendon and adjacent to the K-wires. The locking clip is placed on the posterolateral aspect of the elbow joint in a location where it can be covered with local tissue for adequate padding. The cable is then threaded through the clamping bracket and tightened slowly and gradually with a tensioning device to low torque level (Figure 1). At this stage, tension may be released to make any necessary adjustments. Last, the locking clip is deployed, securing the tension band in the clip, and the excess cable is trimmed with a scalpel. Softening and pliability of the cable during its insertion and tensioning should be noted.
The ends of the K-wires are now curved in a hook configuration. The tines of the hooks should be parallel to accommodate the cable, and then the triceps is sharply incised to bone. If the bone is hard, an awl is used to create a pilot hole so the hook may be impaled into bone while capturing the cable. Next, the triceps is closed over the pins, minimizing the potential for pin migration and backout. The 2 K-wires are left in place to keep the fragments in proper anatomical alignment during healing and to prevent displacement with elbow motion. Figure 2 is a schematic of the final construct, and Figure 3 shows the construct in a patient.
Reduction of the olecranon fracture is assessed by imaging in full extension to check for possible implant impingement. Last, we apply the previously harvested fracture callus to the fracture site. Layered closure is performed, and bulky soft dressings are applied. Postoperative immobilization with a splint is used. Gentle range-of-motion exercises begin in about 2 weeks and progress as pain allows.
A case example with preoperative and postoperative images taken at 3-month follow-up is provided in Figure 4. The entire surgical technique can be viewed in the Video.
The video associated with this article is no longer available on this site. Please view all of our videos on the MDedge YouTube channel
Clinical Cases
Between July 2007 and February 2011, 7 patients with displaced olecranon fractures underwent osteosynthesis using the isoelastic tension band (Table 1). According to the Mayo classification system, 5 of these patients had type 2A fractures, 1 had a type 2B fracture with an ipsilateral nondisplaced radial neck fracture, and 1 had a type 3B fracture. There were 4 female and 3 male patients. The injury was on the dominant side in 3 patients. All patients gave informed consent to evaluation at subsequent office visits and completed outcomes questionnaires by mail several years after surgery. Mean follow-up at which outcome measures questionnaires were obtained was 3.3 years (range, 2.1-6.8 years). Exclusion criteria were age under 18 years and inability to provide informed consent, fracture patterns with extensive articular comminution, and open fractures. Permission to conduct this research was granted by institutional review board.
At each visit, patients completed the Disabilities of the Arm, Shoulder, and Hand (DASH) functional outcome survey and were evaluated according to Broberg and Morrey’s elbow scoring system.13,14 Chart review consisted of evaluation of medical records, including radiographs and orthopedic physician notes in which preoperative examination was documented, mechanism of injury was noted, radiologic fracture pattern was evaluated, and time to bony union was recorded. Elbow motion was documented. Grip strength was measured with a calibrated Jamar dynamometer (Sammons Preston Rolyan) set at level 2, as delineated in Broberg and Morrey’s functional elbow scoring system.
Results
The 7 patients were assessed at a mean final follow-up of 19 months after surgery and received a mean Broberg and Morrey score of good (92.2/100) (Table 2). Restoration of motion and strength was excellent; compared with contralateral extremity, mean flexion arc was 96%, and mean forearm rotation was 96%. Grip was 99% of the noninjured side, perhaps the result of increased conditioning from physical therapy. Patients completed outcomes questionnaires at a mean of 3.3 years after surgery. Mean (SD) DASH score at this longest follow-up was 12.6 (17.2) (Table 2). Patients were satisfied (mean, 9.8/10; range, 9.5-10) and had little pain (mean, 0.8/10; range, 0-3). All fractures united, and there were no infections. One patient had a satisfactory union with complete restoration of motion and continued to play sports vocationally but developed pain over the locking clip 5 years after the index procedure and decided to have the implant removed. He had no radiographic evidence of K-wire or implant migration. Another patient had a minor degree of implant irritation at longest follow-up but did not request hardware removal.
Discussion
Stainless steel wire is often used in TBW because of its widespread availability, low cost, lack of immunogenicity, and relative strength.7 However, stainless steel wire has several disadvantages. It is susceptible to low-cycle fatigue failure, and fatigue strength may be seriously reduced secondary to incidental trauma to the wire on implantation.15,16 Other complications are kinking, skin irritation, implant prominence, fixation loss caused by wire loosening, and inadequate initial reduction potentially requiring revision.10,12,17-21
Isoelastic cable is a new type of cerclage cable that consists of UHMWPE strands braided over a nylon core. The particular property profile of the isoelastic tension band gives the cable intrinsic elastic and pliable qualities. In addition, unlike stainless steel, the band maintains a uniform, continuous compression force across a fracture site.22 Multifilament braided cables fatigue and fray, but the isoelastic cerclage cable showed no evidence of fraying or breakage after 1 million loading cycles.22,23 Compared with metal wire or braided metal cable, the band also has higher fatigue strength and higher ultimate tensile strength.7 Furthermore, the cable is less abrasive than stainless steel, so theoretically it is less irritating to surrounding subcutaneous tissue. Last, the pliability of the band allows the surgeon to create multiple loops of cable without the wire-failure side effects related to kinking, which is common with the metal construct.
In 2010, Ting and colleagues24 retrospectively studied implant failure complications associated with use of isoelastic cerclage cables in the treatment of periprosthetic fractures in total hip arthroplasty. They reported a breakage rate of 0% and noted that previously published breakage data for metallic cerclage devices ranged from 0% to 44%. They concluded that isoelastic cables were not associated with material failure, and there were no direct complications related to the cables. Similarly, Edwards and colleagues25 evaluated the same type of cable used in revision shoulder arthroplasty and reported excellent success and no failures. Although these data stem from use in the femur and humerus, we think the noted benefits apply to fractures of the elbow as well, as we observed a similar breakage rate (0%).
Various studies have addressed the clinical complaints and reoperation rates associated with retained metal implants after olecranon fixation. Traditional AO (Arbeitsgemeinschaft für Osteosynthesefragen) technique involves subcutaneous placement of stainless steel wires, which often results in tissue irritation. Reoperation rates as high as 80% have been reported, and a proportion of implant removals may in fact be caused by factors related to the subcutaneous placement of the metallic implants rather than K-wire migration alone.5,12,18 A nonmetallic isoelastic tension band can provide a more comfortable and less irritating implant, which could reduce the need for secondary intervention related to painful subcutaneous implant. One of our 7 patients had a symptomatic implant removed 5 years after surgery. This patient complained of pain over the area of the tension band device clip, so after fracture healing the entire fixation device was removed in the operating room. If reoperation is necessary, removal of intramedullary K-wires is relatively simple using a minimal incision; removal of stainless steel TBW may require a larger approach if the twisted knots cannot be easily retrieved.
A study of compression forces created by stainless steel wire demonstrated that a “finely tuned mechanical sense” was needed to produce optimal fixation compression when using stainless steel wire.26 It was observed that a submaximal twist created insufficient compressive force, while an ostensibly minimal increase in twisting force above optimum abruptly caused wire failure through breakage. Cerclage cables using clasping devices, such as the current isoelastic cerclage cable, were superior in ease of application. Furthermore, a clasping device allows for cable tension readjustment that is not possible with stainless steel wire. The clasping mechanism precludes the surgeon from having to bury the stainless steel knot and allows for the objective cable-tensioning not possible with stainless steel wire. Last, the tensioning device is titratable, which allows the surgeon to set the construct at a predetermined quantitative tension, which is of benefit in patients with osteopenia.
One limitation of this study is that it did not resolve the potential for K-wire migration, and we agree with previous recommendations that careful attention to surgical technique may avoid such a complication.10 In addition, the sample was small, and the study lacked a control group; a larger sample and a control group would have boosted study power. Nevertheless, the physical and functional outcomes associated with use of this technique were excellent. These results demonstrate an efficacious attempt to decrease secondary surgery rates and are therefore proof of concept that the isoelastic tension band may be used as an alternative to stainless steel in the TBW of displaced olecranon fractures with minimal or no comminution.
Conclusion
This easily reproducible technique for use of an isoelastic tension band in olecranon fracture fixation was associated with excellent physical and functional outcomes in a series of 7 patients. The rate of secondary intervention was slightly better for these patients than for patients treated with wire tension band fixation. Although more rigorous study of this device is needed, we think it is a promising alternative to wire tension band techniques.
1. Rommens PM, Küchle R, Schneider RU, Reuter M. Olecranon fractures in adults: factors influencing outcome. Injury. 2004;35(11):1149-1157.
2. Veillette CJ, Steinmann SP. Olecranon fractures. Orthop Clin North Am. 2008;39(2):229-236.
3. Newman SD, Mauffrey C, Krikler S. Olecranon fractures. Injury. 2009;40(6):575-581.
4. Weber BG, Vasey H. Osteosynthesis in olecranon fractures [in German]. Z Unfallmed Berufskr. 1963;56:90-96.
5. Netz P, Strömberg L. Non-sliding pins in traction absorbing wiring of fractures: a modified technique. Acta Orthop Scand. 1982;53(3):355-360.
6. Prayson MJ, Williams JL, Marshall MP, Scilaris TA, Lingenfelter EJ. Biomechanical comparison of fixation methods in transverse olecranon fractures: a cadaveric study. J Orthop Trauma. 1997;11(8):565-572.
7. Rothaug PG, Boston RC, Richardson DW, Nunamaker DM. A comparison of ultra-high-molecular weight polyethylene cable and stainless steel wire using two fixation techniques for repair of equine midbody sesamoid fractures: an in vitro biomechanical study. Vet Surg. 2002;31(5):445-454.
8. Harrell RM, Tong J, Weinhold PS, Dahners LE. Comparison of the mechanical properties of different tension band materials and suture techniques. J Orthop Trauma. 2003;17(2):119-122.
9. Nimura A, Nakagawa T, Wakabayashi Y, Sekiya I, Okawa A, Muneta T. Repair of olecranon fractures using FiberWire without metallic implants: report of two cases. J Orthop Surg Res. 2010;5:73.
10. Macko D, Szabo RM. Complications of tension-band wiring of olecranon fractures. J Bone Joint Surg Am. 1985;67(9):1396-1401.
11. Helm RH, Hornby R, Miller SW. The complications of surgical treatment of displaced fractures of the olecranon. Injury. 1987;18(1):48-50.
12. Romero JM, Miran A, Jensen CH. Complications and re-operation rate after tension-band wiring of olecranon fractures. J Orthop Sci. 2000;5(4):318-320.
13. Beaton DE, Katz JN, Fossel AH, Wright JG, Tarasuk V, Bombardier C. Measuring the whole or the parts? Validity, reliability, and responsiveness of the Disabilities of the Arm, Shoulder and Hand outcome measure in different regions of the upper extremity. J Hand Ther. 2001;14(2):128-146.
14. Broberg MA, Morrey BF. Results of delayed excision of the radial head after fracture. J Bone Joint Surg Am. 1986;68(5):669-674.
15. Bostrom MP, Asnis SE, Ernberg JJ, et al. Fatigue testing of cerclage stainless steel wire fixation. J Orthop Trauma. 1994;8(5):422-428.
16. Oh I, Sander TW, Treharne RW. The fatigue resistance of orthopaedic wire. Clin Orthop Relat Res. 1985;(192):228-236.
17. Amstutz HC, Maki S. Complications of trochanteric osteotomy in total hip replacement. J Bone Joint Surg Am. 1978;60(2):214-216.
18. Jensen CM, Olsen BB. Drawbacks of traction-absorbing wiring (TAW) in displaced fractures of the olecranon. Injury. 1986;17(3):174-175.
19. Kumar G, Mereddy PK, Hakkalamani S, Donnachie NJ. Implant removal following surgical stabilization of patella fracture. Orthopedics. 2010;33(5).
20. Hume MC, Wiss DA. Olecranon fractures. A clinical and radiographic comparison of tension band wiring and plate fixation. Clin Orthop Relat Res. 1992;(285):229-235.
21. Wolfgang G, Burke F, Bush D, et al. Surgical treatment of displaced olecranon fractures by tension band wiring technique. Clin Orthop Relat Res. 1987;(224):192-204.
22. Sarin VK, Mattchen TM, Hack B. A novel iso-elastic cerclage cable for treatment of fractures. Paper presented at: Annual Meeting of the Orthopaedic Research Society; February 20-23, 2005; Washington, DC. Paper 739.
23. Silverton CD, Jacobs JJ, Rosenberg AG, Kull L, Conley A, Galante JO. Complications of a cable grip system. J Arthroplasty. 1996;11(4):400-404.
24. Ting NT, Wera GD, Levine BR, Della Valle CJ. Early experience with a novel nonmetallic cable in reconstructive hip surgery. Clin Orthop Relat Res. 2010;468(9):2382-2386.
25. Edwards TB, Stuart KD, Trappey GJ, O’Connor DP, Sarin VK. Utility of polymer cerclage cables in revision shoulder arthroplasty. Orthopedics. 2011;34(4).
26. Shaw JA, Daubert HB. Compression capability of cerclage fixation systems. A biomechanical study. Orthopedics. 1988;11(8):1169-1174.
Orthopedics in US Health Care
In the United States, the landscape of health care is changing. Health care reform and fluctuating political and economic climates have affected and will continue to affect the practice of orthopedic surgery. Demand for musculoskeletal care and the costs of providing this care are exceeding available resources—which has led to an evolution in how we practice as individuals and in the institutions where we provide care. Patient safety, quality, and value have become the outcomes of importance. Orthopedic surgeons, as experts in musculoskeletal care, must be a part of these changes. In this review, we offer perspective on the changing face of orthopedic surgery in the modern US health care system.
1. Meeting the demand
Musculoskeletal conditions represent one of the most common and costly health issues in the United States, affecting individuals medically and economically and compromising their quality of life.1,2 In 2008, more than 110 million US adults (1 in 2) reported having a musculoskeletal condition for more than 3 months, and almost 7% reported that a chronic musculoskeletal condition made routine activities of daily living significantly difficult.1 Overall, in the United States, some of the most common chronic conditions are musculoskeletal in origin. These conditions include osteoarthritis and back pain.
Osteoarthritis is the leading cause of chronic pain and disability. Physician-diagnosed arthritis is expected to affect 25% of US adults by 2030,3 and in more than one-third of these patients arthritis limits work or other activity.4 Back pain is another of the most common debilitating conditions in the United States.3,5 St Sauver and colleagues6 found that back pain is the third most common condition (23.9%) that prompts patients to seek health care—following skin-related problems (42.7%) and osteoarthritis/joint pain (33.6%).
As life expectancy increases, so do expectations of enjoying higher levels of activity into the later years. Patients expect to be as active in their geriatric years as they were in middle age, and many are able to do so. Amid the growing obesity epidemic and increased incidence of chronic comorbidities, however, the aging population not only is at substantial risk for developing a chronic musculoskeletal disorder but may face new challenges in accessing care.
Although orthopedic surgeons specialize in treating musculoskeletal conditions, up to 90% of common nonsurgical musculoskeletal complaints are thought to be manageable in the primary care setting.7 With a disproportionate increase in musculoskeletal demand against a relatively constant number of orthopedic providers,8 it is becoming increasingly important for nonorthopedists to adequately manage musculoskeletal conditions. Physiatrists, rheumatologists, internists, family practitioners, and the expanding field of sports medicine specialists provide primary care of musculoskeletal conditions. To meet the growing demand and to ensure that patients receive quality, sustainable, effective, and efficient care, orthopedic surgeons should be actively involved in training these providers. As high as the cost of managing musculoskeletal conditions can be, it is far less than the cost resulting from inadequate or improper management. There is already justification for formal development of a specialization in nonoperative management of musculoskeletal care. Establishing this specialization requires a multidisciplinary approach, with orthopedic surgery taking a lead role.
2. The cost equation
As the prevalence of orthopedic conditions increases, so does the cost of delivering musculoskeletal care. The economic implications of meeting this growing demand are an important area of concern for our health care system. Steadily increasing hospital expenses for personnel and services, rising costs of pharmaceuticals and laboratory tests, constant evolution of costly technology, and insurance/reimbursement rates that do not keep pace with rising costs all contribute to the rapid escalation of the “cost of care.”
Health care expenditures accounted for 17.2% of the US gross domestic product (GDP) in 2012 and are expected to represent 19.3% by 2023.9 For musculoskeletal disease, direct costs alone are expected to approach $510 billion, equaling 5% of GDP and representing almost 30% of all health care expenditures. In Medicare patients, osteoarthritis is the most expensive condition to treat overall, and 3 other musculoskeletal problems rank highly as well: femoral neck fractures (3rd), back pain (10th), and fractures of all types (16th).10 Clearly, musculoskeletal care is one of the most prevalent and expensive health conditions in the United States.
Part of the direct costs of care that consistently increase each year are the steadily increasing costs of technology, which is often considered synonymous with orthopedic care. Promotion of new and more costly implants is common in the absence of evidence supporting their use. However, use of new implants and technology is being scrutinized in an effort to strike the proper cost–benefit balance.
To change the slope of the cost curve, orthopedic surgeons should utilize technological advances that are proven to be clinically significant and economically feasible and should avoid modest improvements with limited clinical benefit and higher price tags. Unfortunately, this approach is not being taken. Minor modifications of implant designs are often marketed as “new and improved” to justify increased costs, and these implants often gain widespread use. A few may prove to be clinically better, but most will be only comparable to older, less expensive designs, and some may end up being clinical failures, discovered at great cost to patients and the health care system.11,12
Orthopedic surgeons have an important role in this decision-making. We should strive for the best, most cost-effective outcomes for our patients. We should reject new technology that does not clearly improve outcomes. At the least, we should use the technology in a manufacturer-supported clinical trial to determine its superiority. Whether the improvement is in technique, implant design, or workflow efficiency, orthopedic surgeons must be actively involved in researching and developing the latest innovations and must help determine their prospective value by considering not only their potential clinical benefits but also their economic implications.
As the political and economic environment becomes more directed at the cost-containment and sustainability of care, there has been a clear shift in focus to quality and value rather than volume, giving rise to the “value-based care” approach. The “value equation,” in which value equals quality divided by cost, requires a clear measure of outcomes and an equally clear understanding of costs. Delivering high-quality care in a cost-conscious environment is an approach that every orthopedic surgeon should adopt. Widespread adoption of the value-based strategy by hospital systems and insurance companies is resulting in a paradigm shift away from more traditional volume-based metrics and in favor of value-based metrics, including quality measures, patient-reported outcomes, Hospital Consumer Assessment of Healthcare Providers and Systems, and physician-specific outcome measures.
The new paradigm has brought the bundled payment initiative (BPI), a strategy included in the Patient Protection and Affordable Care Act. The philosophy behind the BPI model is for hospital systems and physicians to control costs while maintaining and improving the quality of care. Measured by patient metrics (eg, clinical outcomes, patient satisfaction) and hospital metrics (eg, readmission rates, cost of care), bundled payments reimburse hospitals on the basis of cost of an entire episode of care rather than on the basis of individual procedures and services. This approach provides incentives for both physicians and hospitals to promote value-based care while emphasizing coordination of care among all members of the health care team.
Providing the best possible care for our patients while holding our practice to the highest standards is a central tenet of the practice of orthopedic surgery and should be independent of reimbursement strategies. Thus, to increase the value of care, we must establish practice models and strategies to optimize cost-efficiency while improving outcomes. As explained by Porter and Teisberg,13 it is important to be conscientious about cost, but above all we must not allow quality of health care delivery to be compromised when trying to improve the “value” of care. Through evidence-based management and a clear understanding of costs, we must develop cost-efficient practice models that sustainably deliver the highest value of care.
3. Evolving practice models
As the health care landscape continues to change, physician practice models evolve accordingly. Although the private practice model once dominated the physician workforce, this is no longer true, as there has been a significant shift to employer-based practice models. The multiple factors at work relate to changing patterns of reimbursement, increasing government regulations, and a general change in recent residency graduates’ expectations regarding work–life balance. Other catalysts are the shift from volume- to value-based care and the recognition that cost-effective health care is more easily achieved when physicians and their institutions are in alignment. Ultimately, physician–institution alignment is crucial in improving care and outcomes.
Physician–institution alignment requires further discussion. Ideally, it should strike the proper balance between physician autonomy and institutional priorities to ensure the highest quality care. Physicians and their institutions should align their interests in terms of patient safety, quality, and economics to create a work environment conducive to both patient/physician satisfaction and institutional success.14 As identified by Page and colleagues,15 the primary drivers of physician–institution alignment, specific to orthopedic surgery, are economic, regulatory, and cultural. In economics, implant selection and ancillary services are the important issues; in the regulatory area, cooperative efforts to address expanding state and federal requirements are needed; last, the primary cultural driver is delivery of care to an expanding, diverse patient population.
Physician–institution alignment brings opportunities for “gainsharing,” which can directly benefit individual physicians, physician groups, and departments. Gainsharing is classically defined as “arrangements in which a hospital gives physicians a percentage share of any reduction in the hospital’s costs for patient care attributable in part to the physicians’ efforts.”16 Modern gainsharing programs can be used by institutions to align the economic interests of physicians and hospitals, with the ultimate goal being to achieve a sustainable increase in the value and quality of care delivered to patients.13 Examples include efforts to reduce the cost of orthopedic implants, which is a major cost driver in orthopedic surgery. Our institution realized significant savings when surgeons were directly involved in the implant contracting process with strategic sourcing personnel. These savings were shared with the department to enhance research and education programs. BPI, a risk-sharing program in which Medicare and hospitals participate, incorporates gainsharing opportunities in which each participating physician can receive up to 50% of his or her previous Medicare billings when specific targets are achieved. BPI included 27 musculoskeletal diagnosis–related groups that could be developed into a bundled payment proposal. Our institution participated in a 90-day episode, for primary hip and knee arthroplasty and non–cervical spine fusion, that had very promising results.
Gainsharing offers physicians incentives to meet institution goals of improved outcomes and increased patient satisfaction while increasing oversight and accountability. When physician-specific outcomes do not meet the established goals in key areas (readmissions, thromboembolic complications, infections), it is only logical that steps will be taken to improve outcomes. Although physicians may not be used to this increased scrutiny, the goal of improving outcomes, even if it necessitates a change in an established approach to care, should be welcomed.
Physicians should be rewarded for good outcomes but not suboptimal outcomes. When outcomes are suboptimal, physicians should take a constructive approach to improve them. On the other hand, not being rewarded for unachieved goals can be perceived as being penalized. Additional monitoring may paradoxically lead physicians to avoid more “complex” cases, such as those of patients at higher risk for complications and poorer outcomes. An example is found in patient selection for surgery, in which issues like obesity, diabetes, and heart disease are known to negatively affect outcomes. In these models, “cherry-picking” is a well-recognized risk17,18 that can compromise our ethical obligation to provide equal access for all patients. To offset this tendency, we should use a risk-stratification model in which all patients are not considered equal in the risks they present. A risk-adjustment approach benefits both patients and providers by identifying modifiable risk factors that can be addressed to positively affect outcomes. This risk-stratification approach further incentivizes the orthopedist to closely work with other health care providers to address the medical comorbidities that may negatively affect surgical outcomes.
4. Patient and physician expectations
Living in a technology-driven society in the age of information has had a major impact on patients’ attitudes and expectations about their care—and therefore on physicians’ practice methods. It is uncommon to evaluate a patient who has not already consulted the Internet about a problem. Patients now have much more information they can use to make decisions about their treatment, and, though many question the accuracy of Internet information, there is no argument that being more informed is beneficial. In this time of shared decision-making, it is absolutely essential that patients keep themselves informed.
It is crucial to align the expectations of both physicians and patients in order to achieve the best outcomes. Gaining a clear understanding of treatment goals, management, and potential complications consistently leads to improved patient satisfaction, more favorable clinical outcomes, and reduced risk of litigation.19-22 Addressing patient concerns and expectations is significantly enhanced by a strong patient–physician relationship through clinical models focused on patient-centered care.
Now considered a standard of care, the patient-centered model has changed the way we practice. The foundation of the patient-centered approach is to strengthen the patient–physician relationship by empowering patients to become active decision-makers in the management of their own health. The role of orthopedists in this model is to provide patients with information and insight into their conditions in order to facilitate shared decision-making. Our role should be to guide patients to make educated and informed decisions. Doing so enhances communication, thereby strengthening the patient–physician relationship, and places both patient and physician expectations in perspective. Patient-reported outcomes, satisfaction rates, symptomatic burdens, and costs of care are all positively correlated with strong communication and realistic expectations achieved through a patient-centered approach.21,23
The evolution of clinical practice has been influenced by factors ranging from external forces (eg, changing political and economic climates) to social trends (use of social media and the Internet). Technology has been a driving force in our rapidly changing clinical environment, significantly altering the way we practice. Although we must be careful in how we use it, new technology can certainly work to our advantage. We have a plethora of medical information at our fingertips, and, with physician-directed guidance, our patients can become more informed than ever before. This is the principle of patient-centered medicine and shared decision-making, and its utility will only increase in importance.
5. The role of advocacy
The central tenet of orthopedic practice has always been a focus on patients. We continually strive to improve patient outcomes, reduce costs, and work efficiently in our practices and facilities. Although we can focus on our individual practices, we cannot ignore the influence and impact of the political system on our performance. Federal and state regulations give physicians and insurance companies an uneven playing field. This imbalance requires that physicians be more active in health care policymaking and advocacy. Although we are more involved than ever before, our influence is far less than what we would like it to be, perhaps partly because of the nature of the political process but perhaps also because of physicians’ resistance to becoming involved.
As experts in the treatment of musculoskeletal conditions, we should be at the forefront of health care policy development—a position we have not been able to attain. Although many factors contribute to our lack of a “seat at the table,” we must recognize our reluctance as a group to support advocacy, either financially or through personal time commitment. The American Association of Orthopaedic Surgeons (AAOS) Orthopaedic Political Action Committee has never been able to obtain donations from more than 30% of AAOS members. Although this committee historically has been successful, we could be much more so if we had financial support from 90% of members. There are many ways to be actively involved in advocacy. One way is to join local and state orthopedic societies and support their advocacy efforts. State orthopedic societies work closely with the AAOS Office of Government Relations to coordinate advocacy and direct efforts and resources to areas of greatest need. Knowing local congressional representatives and communicating with them about issues we face in our practices make our issues “real.” Some of our colleagues have even successfully run for office in Congress, and they certainly deserve our support. Advocacy will absolutely play an increasingly important role as federal and state governments expand their involvement in health care. Our role should be to get involved, at least to some degree. We need to recognize that our strength is in our numbers, as the few cannot accomplish nearly as much as the many.
Summary
Orthopedic surgeons are practicing in the midst of almost constant change—evolving patient care, shifts in employment models, advances in technology, modern patient expectations, and an increasingly complex regulatory environment. Even in this context, however, our goal remains unchanged: to give our patients the highest-quality care possible. Our core values as orthopedic surgeons and physicians are dedication, commitment, and service to patients and to our profession. As US health care continues to evolve, we must evolve as well, with an emphasis on expanding our role in the health care policy debate.
1. US Bone and Joint Initiative. Burden of Musculoskeletal Diseases in the United States: Prevalence, Societal, and Economic Cost. Rosemont, IL: US Bone and Joint Initiative; 2008. http://www.boneandjointburden.org. Accessed October 26, 2015.
2. US Bone and Joint Initiative. Burden of Musculoskeletal Diseases in the United States: Prevalence, Societal, and Economic Cost. 2nd ed. Rosemont, IL: US Bone and Joint Initiative; 2011. http://www.boneandjointburden.org. Accessed October 26, 2015.
3. Ma VY, Chan L, Carruthers KJ. Incidence, prevalence, costs, and impact on disability of common conditions requiring rehabilitation in the United States: stroke, spinal cord injury, traumatic brain injury, multiple sclerosis, osteoarthritis, rheumatoid arthritis, limb loss, and back pain. Arch Phys Med Rehabil. 2014;95(5):986-995.e1.
4. Hootman JM, Helmick CG. Projections of US prevalence of arthritis and associated activity limitations. Arthritis Rheum. 2006;54(1):226-229.
5. Freburger JK, Holmes GM, Agans RP, et al. The rising prevalence of chronic low back pain. Arch Intern Med. 2009;169(3):251-258.
6. St Sauver JL, Warner DO, Yawn BP, et al. Why patients visit their doctors: assessing the most prevalent conditions in a defined American population. Mayo Clin Proc. 2013;88(1):56-67.
7. Anderson BC. Office Orthopedics for Primary Care: Diagnosis and Treatment. 2nd ed. Philadelphia, PA: Saunders; 1999.
8. American Academy of Orthopaedic Surgeons, Department of Research and Scientific Affairs. Orthopaedic Practice in the U.S. 2012 [2012 Orthopaedic Surgeon Census Report]. Rosemont, IL: American Academy of Orthopaedic Surgeons; January 2013.
9. US Department of Health and Human Services, Centers for Medicare & Medicaid Services, Office of the Actuary, National Health Statistics Group. NHE [National Health Expenditure] Fact Sheet, 2014. Centers for Medicare & Medicaid Services website. http://www.cms.gov/Research-Statistics-Data-and-Systems/Statistics-Trends-and-Reports/NationalHealthExpendData/NHE-Fact-Sheet.html. Updated July 28, 2015. Accessed October 26, 2015.
10. Cutler DM, Ghosh K. The potential for cost savings through bundled episode payments. N Engl J Med. 2012;366(12):1075-1077.
11. Langton DJ, Jameson SS, Joyce TJ, Hallab NJ, Natu S, Nargol AV. Early failure of metal-on-metal bearings in hip resurfacing and large-diameter total hip replacement: a consequence of excess wear. J Bone Joint Surg Br. 2010;92(1):38-46.
12. Dahlstrand H, Stark A, Anissian L, Hailer NP. Elevated serum concentrations of cobalt, chromium, nickel, and manganese after metal-on-metal alloarthroplasty of the hip: a prospective randomized study. J Arthroplasty. 2009;24(6):837-845.
13. Porter ME, Teisberg EO. Redefining Health Care: Creating Value-Based Competition on Results. Boston, MA: Harvard Business School Press; 2006.
14. American Association of Orthopaedic Surgeons. Alignment of physician and facility payment and incentives. Position statement 1171. American Association of Orthopaedic Surgeons website. http://www.aaos.org/about/papers/position/1171.asp. Published September 2006. Revised February 2009. Accessed October 26, 2015.
15. Page AE, Butler CA, Bozic KJ. Factors driving physician–hospital alignment in orthopaedic surgery. Clin Orthop Relat Res. 2013;471(6):1809-1817.
16. US Department of Health and Human Services, Office of Inspector General. Gainsharing arrangements and CMPs for hospital payments to physicians to reduce or limit services to beneficiaries [special advisory bulletin]. Office of Inspector General website. http://oig.hhs.gov/fraud/docs/alertsandbulletins/gainsh.htm. Published July 1999. Accessed October 26, 2015.
17. Bronson WH, Fewer M, Godlewski K, et al. The ethics of patient risk modification prior to elective joint replacement surgery. J Bone Joint Surg Am. 2014;96(13):e113.
18. Bosco J. To cherry pick or not: the unintended ethical consequences of pay for performance. Presented at: New York University Colloquium on Medical Ethics; New York, NY; November 2014.
19. Hageman MG, Briët JP, Bossen JK, Blok RD, Ring DC, Vranceanu AM. Do previsit expectations correlate with satisfaction of new patients presenting for evaluation with an orthopaedic surgical practice? Clin Orthop Relat Res. 2015;473(2):716-721.
20. Jourdan C, Poiraudeau S, Descamps S, et al. Comparison of patient and surgeon expectations of total hip arthroplasty. PLoS One. 2012;7(1):e30195.
21. McMillan S, Kendall E, Sav A, et al. Patient-centered approaches to health care: a systematic review of randomized controlled trials. Med Care Res Rev. 2013;70(6):567-596.
22. Forster HP, Schwartz J, DeRenzo E. Reducing legal risk by practicing patient-centered medicine. Arch Intern Med. 2002;162(11):1217-1219.
23. Van Citters AD, Fahlman C, Goldmann DA, et al. Developing a pathway for high-value, patient-centered total joint arthroplasty. Clin Orthop Relat Res. 2014;472(5):1619-1635.
In the United States, the landscape of health care is changing. Health care reform and fluctuating political and economic climates have affected and will continue to affect the practice of orthopedic surgery. Demand for musculoskeletal care and the costs of providing this care are exceeding available resources—which has led to an evolution in how we practice as individuals and in the institutions where we provide care. Patient safety, quality, and value have become the outcomes of importance. Orthopedic surgeons, as experts in musculoskeletal care, must be a part of these changes. In this review, we offer perspective on the changing face of orthopedic surgery in the modern US health care system.
1. Meeting the demand
Musculoskeletal conditions represent one of the most common and costly health issues in the United States, affecting individuals medically and economically and compromising their quality of life.1,2 In 2008, more than 110 million US adults (1 in 2) reported having a musculoskeletal condition for more than 3 months, and almost 7% reported that a chronic musculoskeletal condition made routine activities of daily living significantly difficult.1 Overall, in the United States, some of the most common chronic conditions are musculoskeletal in origin. These conditions include osteoarthritis and back pain.
Osteoarthritis is the leading cause of chronic pain and disability. Physician-diagnosed arthritis is expected to affect 25% of US adults by 2030,3 and in more than one-third of these patients arthritis limits work or other activity.4 Back pain is another of the most common debilitating conditions in the United States.3,5 St Sauver and colleagues6 found that back pain is the third most common condition (23.9%) that prompts patients to seek health care—following skin-related problems (42.7%) and osteoarthritis/joint pain (33.6%).
As life expectancy increases, so do expectations of enjoying higher levels of activity into the later years. Patients expect to be as active in their geriatric years as they were in middle age, and many are able to do so. Amid the growing obesity epidemic and increased incidence of chronic comorbidities, however, the aging population not only is at substantial risk for developing a chronic musculoskeletal disorder but may face new challenges in accessing care.
Although orthopedic surgeons specialize in treating musculoskeletal conditions, up to 90% of common nonsurgical musculoskeletal complaints are thought to be manageable in the primary care setting.7 With a disproportionate increase in musculoskeletal demand against a relatively constant number of orthopedic providers,8 it is becoming increasingly important for nonorthopedists to adequately manage musculoskeletal conditions. Physiatrists, rheumatologists, internists, family practitioners, and the expanding field of sports medicine specialists provide primary care of musculoskeletal conditions. To meet the growing demand and to ensure that patients receive quality, sustainable, effective, and efficient care, orthopedic surgeons should be actively involved in training these providers. As high as the cost of managing musculoskeletal conditions can be, it is far less than the cost resulting from inadequate or improper management. There is already justification for formal development of a specialization in nonoperative management of musculoskeletal care. Establishing this specialization requires a multidisciplinary approach, with orthopedic surgery taking a lead role.
2. The cost equation
As the prevalence of orthopedic conditions increases, so does the cost of delivering musculoskeletal care. The economic implications of meeting this growing demand are an important area of concern for our health care system. Steadily increasing hospital expenses for personnel and services, rising costs of pharmaceuticals and laboratory tests, constant evolution of costly technology, and insurance/reimbursement rates that do not keep pace with rising costs all contribute to the rapid escalation of the “cost of care.”
Health care expenditures accounted for 17.2% of the US gross domestic product (GDP) in 2012 and are expected to represent 19.3% by 2023.9 For musculoskeletal disease, direct costs alone are expected to approach $510 billion, equaling 5% of GDP and representing almost 30% of all health care expenditures. In Medicare patients, osteoarthritis is the most expensive condition to treat overall, and 3 other musculoskeletal problems rank highly as well: femoral neck fractures (3rd), back pain (10th), and fractures of all types (16th).10 Clearly, musculoskeletal care is one of the most prevalent and expensive health conditions in the United States.
Part of the direct costs of care that consistently increase each year are the steadily increasing costs of technology, which is often considered synonymous with orthopedic care. Promotion of new and more costly implants is common in the absence of evidence supporting their use. However, use of new implants and technology is being scrutinized in an effort to strike the proper cost–benefit balance.
To change the slope of the cost curve, orthopedic surgeons should utilize technological advances that are proven to be clinically significant and economically feasible and should avoid modest improvements with limited clinical benefit and higher price tags. Unfortunately, this approach is not being taken. Minor modifications of implant designs are often marketed as “new and improved” to justify increased costs, and these implants often gain widespread use. A few may prove to be clinically better, but most will be only comparable to older, less expensive designs, and some may end up being clinical failures, discovered at great cost to patients and the health care system.11,12
Orthopedic surgeons have an important role in this decision-making. We should strive for the best, most cost-effective outcomes for our patients. We should reject new technology that does not clearly improve outcomes. At the least, we should use the technology in a manufacturer-supported clinical trial to determine its superiority. Whether the improvement is in technique, implant design, or workflow efficiency, orthopedic surgeons must be actively involved in researching and developing the latest innovations and must help determine their prospective value by considering not only their potential clinical benefits but also their economic implications.
As the political and economic environment becomes more directed at the cost-containment and sustainability of care, there has been a clear shift in focus to quality and value rather than volume, giving rise to the “value-based care” approach. The “value equation,” in which value equals quality divided by cost, requires a clear measure of outcomes and an equally clear understanding of costs. Delivering high-quality care in a cost-conscious environment is an approach that every orthopedic surgeon should adopt. Widespread adoption of the value-based strategy by hospital systems and insurance companies is resulting in a paradigm shift away from more traditional volume-based metrics and in favor of value-based metrics, including quality measures, patient-reported outcomes, Hospital Consumer Assessment of Healthcare Providers and Systems, and physician-specific outcome measures.
The new paradigm has brought the bundled payment initiative (BPI), a strategy included in the Patient Protection and Affordable Care Act. The philosophy behind the BPI model is for hospital systems and physicians to control costs while maintaining and improving the quality of care. Measured by patient metrics (eg, clinical outcomes, patient satisfaction) and hospital metrics (eg, readmission rates, cost of care), bundled payments reimburse hospitals on the basis of cost of an entire episode of care rather than on the basis of individual procedures and services. This approach provides incentives for both physicians and hospitals to promote value-based care while emphasizing coordination of care among all members of the health care team.
Providing the best possible care for our patients while holding our practice to the highest standards is a central tenet of the practice of orthopedic surgery and should be independent of reimbursement strategies. Thus, to increase the value of care, we must establish practice models and strategies to optimize cost-efficiency while improving outcomes. As explained by Porter and Teisberg,13 it is important to be conscientious about cost, but above all we must not allow quality of health care delivery to be compromised when trying to improve the “value” of care. Through evidence-based management and a clear understanding of costs, we must develop cost-efficient practice models that sustainably deliver the highest value of care.
3. Evolving practice models
As the health care landscape continues to change, physician practice models evolve accordingly. Although the private practice model once dominated the physician workforce, this is no longer true, as there has been a significant shift to employer-based practice models. The multiple factors at work relate to changing patterns of reimbursement, increasing government regulations, and a general change in recent residency graduates’ expectations regarding work–life balance. Other catalysts are the shift from volume- to value-based care and the recognition that cost-effective health care is more easily achieved when physicians and their institutions are in alignment. Ultimately, physician–institution alignment is crucial in improving care and outcomes.
Physician–institution alignment requires further discussion. Ideally, it should strike the proper balance between physician autonomy and institutional priorities to ensure the highest quality care. Physicians and their institutions should align their interests in terms of patient safety, quality, and economics to create a work environment conducive to both patient/physician satisfaction and institutional success.14 As identified by Page and colleagues,15 the primary drivers of physician–institution alignment, specific to orthopedic surgery, are economic, regulatory, and cultural. In economics, implant selection and ancillary services are the important issues; in the regulatory area, cooperative efforts to address expanding state and federal requirements are needed; last, the primary cultural driver is delivery of care to an expanding, diverse patient population.
Physician–institution alignment brings opportunities for “gainsharing,” which can directly benefit individual physicians, physician groups, and departments. Gainsharing is classically defined as “arrangements in which a hospital gives physicians a percentage share of any reduction in the hospital’s costs for patient care attributable in part to the physicians’ efforts.”16 Modern gainsharing programs can be used by institutions to align the economic interests of physicians and hospitals, with the ultimate goal being to achieve a sustainable increase in the value and quality of care delivered to patients.13 Examples include efforts to reduce the cost of orthopedic implants, which is a major cost driver in orthopedic surgery. Our institution realized significant savings when surgeons were directly involved in the implant contracting process with strategic sourcing personnel. These savings were shared with the department to enhance research and education programs. BPI, a risk-sharing program in which Medicare and hospitals participate, incorporates gainsharing opportunities in which each participating physician can receive up to 50% of his or her previous Medicare billings when specific targets are achieved. BPI included 27 musculoskeletal diagnosis–related groups that could be developed into a bundled payment proposal. Our institution participated in a 90-day episode, for primary hip and knee arthroplasty and non–cervical spine fusion, that had very promising results.
Gainsharing offers physicians incentives to meet institution goals of improved outcomes and increased patient satisfaction while increasing oversight and accountability. When physician-specific outcomes do not meet the established goals in key areas (readmissions, thromboembolic complications, infections), it is only logical that steps will be taken to improve outcomes. Although physicians may not be used to this increased scrutiny, the goal of improving outcomes, even if it necessitates a change in an established approach to care, should be welcomed.
Physicians should be rewarded for good outcomes but not suboptimal outcomes. When outcomes are suboptimal, physicians should take a constructive approach to improve them. On the other hand, not being rewarded for unachieved goals can be perceived as being penalized. Additional monitoring may paradoxically lead physicians to avoid more “complex” cases, such as those of patients at higher risk for complications and poorer outcomes. An example is found in patient selection for surgery, in which issues like obesity, diabetes, and heart disease are known to negatively affect outcomes. In these models, “cherry-picking” is a well-recognized risk17,18 that can compromise our ethical obligation to provide equal access for all patients. To offset this tendency, we should use a risk-stratification model in which all patients are not considered equal in the risks they present. A risk-adjustment approach benefits both patients and providers by identifying modifiable risk factors that can be addressed to positively affect outcomes. This risk-stratification approach further incentivizes the orthopedist to closely work with other health care providers to address the medical comorbidities that may negatively affect surgical outcomes.
4. Patient and physician expectations
Living in a technology-driven society in the age of information has had a major impact on patients’ attitudes and expectations about their care—and therefore on physicians’ practice methods. It is uncommon to evaluate a patient who has not already consulted the Internet about a problem. Patients now have much more information they can use to make decisions about their treatment, and, though many question the accuracy of Internet information, there is no argument that being more informed is beneficial. In this time of shared decision-making, it is absolutely essential that patients keep themselves informed.
It is crucial to align the expectations of both physicians and patients in order to achieve the best outcomes. Gaining a clear understanding of treatment goals, management, and potential complications consistently leads to improved patient satisfaction, more favorable clinical outcomes, and reduced risk of litigation.19-22 Addressing patient concerns and expectations is significantly enhanced by a strong patient–physician relationship through clinical models focused on patient-centered care.
Now considered a standard of care, the patient-centered model has changed the way we practice. The foundation of the patient-centered approach is to strengthen the patient–physician relationship by empowering patients to become active decision-makers in the management of their own health. The role of orthopedists in this model is to provide patients with information and insight into their conditions in order to facilitate shared decision-making. Our role should be to guide patients to make educated and informed decisions. Doing so enhances communication, thereby strengthening the patient–physician relationship, and places both patient and physician expectations in perspective. Patient-reported outcomes, satisfaction rates, symptomatic burdens, and costs of care are all positively correlated with strong communication and realistic expectations achieved through a patient-centered approach.21,23
The evolution of clinical practice has been influenced by factors ranging from external forces (eg, changing political and economic climates) to social trends (use of social media and the Internet). Technology has been a driving force in our rapidly changing clinical environment, significantly altering the way we practice. Although we must be careful in how we use it, new technology can certainly work to our advantage. We have a plethora of medical information at our fingertips, and, with physician-directed guidance, our patients can become more informed than ever before. This is the principle of patient-centered medicine and shared decision-making, and its utility will only increase in importance.
5. The role of advocacy
The central tenet of orthopedic practice has always been a focus on patients. We continually strive to improve patient outcomes, reduce costs, and work efficiently in our practices and facilities. Although we can focus on our individual practices, we cannot ignore the influence and impact of the political system on our performance. Federal and state regulations give physicians and insurance companies an uneven playing field. This imbalance requires that physicians be more active in health care policymaking and advocacy. Although we are more involved than ever before, our influence is far less than what we would like it to be, perhaps partly because of the nature of the political process but perhaps also because of physicians’ resistance to becoming involved.
As experts in the treatment of musculoskeletal conditions, we should be at the forefront of health care policy development—a position we have not been able to attain. Although many factors contribute to our lack of a “seat at the table,” we must recognize our reluctance as a group to support advocacy, either financially or through personal time commitment. The American Association of Orthopaedic Surgeons (AAOS) Orthopaedic Political Action Committee has never been able to obtain donations from more than 30% of AAOS members. Although this committee historically has been successful, we could be much more so if we had financial support from 90% of members. There are many ways to be actively involved in advocacy. One way is to join local and state orthopedic societies and support their advocacy efforts. State orthopedic societies work closely with the AAOS Office of Government Relations to coordinate advocacy and direct efforts and resources to areas of greatest need. Knowing local congressional representatives and communicating with them about issues we face in our practices make our issues “real.” Some of our colleagues have even successfully run for office in Congress, and they certainly deserve our support. Advocacy will absolutely play an increasingly important role as federal and state governments expand their involvement in health care. Our role should be to get involved, at least to some degree. We need to recognize that our strength is in our numbers, as the few cannot accomplish nearly as much as the many.
Summary
Orthopedic surgeons are practicing in the midst of almost constant change—evolving patient care, shifts in employment models, advances in technology, modern patient expectations, and an increasingly complex regulatory environment. Even in this context, however, our goal remains unchanged: to give our patients the highest-quality care possible. Our core values as orthopedic surgeons and physicians are dedication, commitment, and service to patients and to our profession. As US health care continues to evolve, we must evolve as well, with an emphasis on expanding our role in the health care policy debate.
1. US Bone and Joint Initiative. Burden of Musculoskeletal Diseases in the United States: Prevalence, Societal, and Economic Cost. Rosemont, IL: US Bone and Joint Initiative; 2008. http://www.boneandjointburden.org. Accessed October 26, 2015.
2. US Bone and Joint Initiative. Burden of Musculoskeletal Diseases in the United States: Prevalence, Societal, and Economic Cost. 2nd ed. Rosemont, IL: US Bone and Joint Initiative; 2011. http://www.boneandjointburden.org. Accessed October 26, 2015.
3. Ma VY, Chan L, Carruthers KJ. Incidence, prevalence, costs, and impact on disability of common conditions requiring rehabilitation in the United States: stroke, spinal cord injury, traumatic brain injury, multiple sclerosis, osteoarthritis, rheumatoid arthritis, limb loss, and back pain. Arch Phys Med Rehabil. 2014;95(5):986-995.e1.
4. Hootman JM, Helmick CG. Projections of US prevalence of arthritis and associated activity limitations. Arthritis Rheum. 2006;54(1):226-229.
5. Freburger JK, Holmes GM, Agans RP, et al. The rising prevalence of chronic low back pain. Arch Intern Med. 2009;169(3):251-258.
6. St Sauver JL, Warner DO, Yawn BP, et al. Why patients visit their doctors: assessing the most prevalent conditions in a defined American population. Mayo Clin Proc. 2013;88(1):56-67.
7. Anderson BC. Office Orthopedics for Primary Care: Diagnosis and Treatment. 2nd ed. Philadelphia, PA: Saunders; 1999.
8. American Academy of Orthopaedic Surgeons, Department of Research and Scientific Affairs. Orthopaedic Practice in the U.S. 2012 [2012 Orthopaedic Surgeon Census Report]. Rosemont, IL: American Academy of Orthopaedic Surgeons; January 2013.
9. US Department of Health and Human Services, Centers for Medicare & Medicaid Services, Office of the Actuary, National Health Statistics Group. NHE [National Health Expenditure] Fact Sheet, 2014. Centers for Medicare & Medicaid Services website. http://www.cms.gov/Research-Statistics-Data-and-Systems/Statistics-Trends-and-Reports/NationalHealthExpendData/NHE-Fact-Sheet.html. Updated July 28, 2015. Accessed October 26, 2015.
10. Cutler DM, Ghosh K. The potential for cost savings through bundled episode payments. N Engl J Med. 2012;366(12):1075-1077.
11. Langton DJ, Jameson SS, Joyce TJ, Hallab NJ, Natu S, Nargol AV. Early failure of metal-on-metal bearings in hip resurfacing and large-diameter total hip replacement: a consequence of excess wear. J Bone Joint Surg Br. 2010;92(1):38-46.
12. Dahlstrand H, Stark A, Anissian L, Hailer NP. Elevated serum concentrations of cobalt, chromium, nickel, and manganese after metal-on-metal alloarthroplasty of the hip: a prospective randomized study. J Arthroplasty. 2009;24(6):837-845.
13. Porter ME, Teisberg EO. Redefining Health Care: Creating Value-Based Competition on Results. Boston, MA: Harvard Business School Press; 2006.
14. American Association of Orthopaedic Surgeons. Alignment of physician and facility payment and incentives. Position statement 1171. American Association of Orthopaedic Surgeons website. http://www.aaos.org/about/papers/position/1171.asp. Published September 2006. Revised February 2009. Accessed October 26, 2015.
15. Page AE, Butler CA, Bozic KJ. Factors driving physician–hospital alignment in orthopaedic surgery. Clin Orthop Relat Res. 2013;471(6):1809-1817.
16. US Department of Health and Human Services, Office of Inspector General. Gainsharing arrangements and CMPs for hospital payments to physicians to reduce or limit services to beneficiaries [special advisory bulletin]. Office of Inspector General website. http://oig.hhs.gov/fraud/docs/alertsandbulletins/gainsh.htm. Published July 1999. Accessed October 26, 2015.
17. Bronson WH, Fewer M, Godlewski K, et al. The ethics of patient risk modification prior to elective joint replacement surgery. J Bone Joint Surg Am. 2014;96(13):e113.
18. Bosco J. To cherry pick or not: the unintended ethical consequences of pay for performance. Presented at: New York University Colloquium on Medical Ethics; New York, NY; November 2014.
19. Hageman MG, Briët JP, Bossen JK, Blok RD, Ring DC, Vranceanu AM. Do previsit expectations correlate with satisfaction of new patients presenting for evaluation with an orthopaedic surgical practice? Clin Orthop Relat Res. 2015;473(2):716-721.
20. Jourdan C, Poiraudeau S, Descamps S, et al. Comparison of patient and surgeon expectations of total hip arthroplasty. PLoS One. 2012;7(1):e30195.
21. McMillan S, Kendall E, Sav A, et al. Patient-centered approaches to health care: a systematic review of randomized controlled trials. Med Care Res Rev. 2013;70(6):567-596.
22. Forster HP, Schwartz J, DeRenzo E. Reducing legal risk by practicing patient-centered medicine. Arch Intern Med. 2002;162(11):1217-1219.
23. Van Citters AD, Fahlman C, Goldmann DA, et al. Developing a pathway for high-value, patient-centered total joint arthroplasty. Clin Orthop Relat Res. 2014;472(5):1619-1635.

Interhospital Transfer Patients
Interhospital transfers (IHTs) to academic medical centers (AMCs) or their affiliated hospitals may benefit patients who require unique specialty and procedural services. However, IHTs also introduce a potentially risky transition of care for patients suffering from complex or unstable medical problems.[1] Components of this risk include the dangers associated with transportation and the disrupted continuity of care that may lead to delays or errors in care.[2, 3] Furthermore, referring and accepting providers may face barriers to optimal handoffs including a lack of shared communication standards and difficulty accessing external medical records.[3, 4, 5] Although some authors have recommended the creation of formal guidelines for interhospital transfer processes for all patients to mitigate the risks of transfer, the available guidelines governing the IHT triage and communication process are limited to critically ill patients.[6]
A recent study of a diverse patient and hospital dataset demonstrated that interhospital transfer patients have a higher risk of mortality, increased length of stay (LOS), and increased risk of adverse events as compared with non‐transfer patients.[7] However, it is unknown if these findings persist in the population of patients transferred specifically to AMCs or their affiliated hospitals (the combination is hereafter referred to as academic health systems [AHSs]). AMCs provide a disproportionate share of IHT care for complex patients and have a vested interest in improving the outcomes of these transitions.[8] Prior single‐center studies of acute care adult medical patients accepted to AMCs have shown that IHT is associated with a longer LOS, increased in‐hospital mortality, and higher resource use.[9, 10] However, it is difficult to generalize from single‐center studies due to the variation in referral practices, geography, and network characteristics. Additionally, AMC referral systems, patient mix, and utilization of hospitalists have likely changed substantially in the nearly 2 decades since those reports were published.
Hospitalists and general internists often manage the transfer acceptance processes for internal medicine services at receiving hospitals, helping to triage and coordinate care for IHT patients. As a result, it is important for hospitalists to understand the characteristics and outcomes of the IHT population. In addition to informing the decision making around transfer for a given patient, such an understanding is the foundation for helping providers and institutions begin to systematically identify and mitigate peritransfer risks.
We conducted this large multicenter study to describe the characteristics and outcomes of a current, nationally representative IHT patient population discharged by hospitalists and general internists at AHSs. To identify unique features of the IHT population, we compared patients transferred from another hospital to an AHS to those admitted to the AHS directly from the AHS's emergency department (ED). Based on our anecdotal experiences and the prior single‐center study findings in adult medical populations,[9, 10] we hypothesized that the IHT population would be sicker, stay in the hospital and intensive care unit (ICU) longer, and have higher costs and in‐hospital mortality than ED patients. Although there may be fundamental differences between the 2 groups related to disease and patient condition, we hypothesized that outcome differences would persist even after adjusting for patient factors such as demographics, disease‐specific risk of mortality, and ICU utilization.
PATIENTS AND METHODS
We conducted a retrospective cohort study using data from the University HealthSystem Consortium (UHC) Clinical Database and Resource Manager (CDB/RM). UHC is an alliance of 120 academic medical centers and 300 of their affiliated hospitals for the purposes of collaboration on performance improvement. Each year, a subset of participating hospitals submits data on all of their inpatient discharges to the CDB/RM, which totals approximately 5 million records. The CDB/RM includes information from billing forms including demographics, diagnoses, and procedures as captured by International Classification of Diseases, Ninth Revision (ICD‐9) codes, discharge disposition, and line item charge detail for the type of bed (eg, floor, ICU). Most hospitals also provide detailed charge information including pharmacy, imaging, blood products, lab tests, and supplies. Some hospitals do not provide any charge data. The Beth Israel Deaconess Medical Center and University of Washington institutional review boards reviewed and approved the conduct of this study.
We included all inpatients discharged by hospitalists or general internal medicine physicians from UHC hospitals between April 1, 2011 and March 31, 2012. We excluded minors, pregnant patients, and prisoners. One hundred fifty‐eight adult academic medical centers and affiliated hospitals submitted data throughout this time period. Our primary independent variable, IHT status, was defined by patients whose admission source was another acute care institution. ED admissions were defined as patients admitted from the AHS ED whose source of origination was not another hospital or ambulatory surgery site.
Admission Characteristics
Admission characteristics of interest included age, gender, insurance status, the most common diagnoses in each cohort based on Medicare Severity Diagnosis‐Related Group (MS‐DRG), the most common Agency for Healthcare Research and Quality (AHRQ) comorbitidies,[11] the most common procedures, and the admission 3M All‐Patient Refined Diagnosis‐Related Group (APR‐DRG) risk of mortality (ROM) scores. 3M APR‐DRG ROM scores are proprietary categorical measures specific to the base APR‐DRG to which a patient is assigned, which are calculated using data available at the time of admission, including comorbid condition diagnosis codes, age, procedure codes, and principal diagnosis codes. A patient can fall into 1 of 4 categories with this score: minor, moderate, major, or extreme.[12]
Outcomes
Our primary outcome of interest was in‐hospital mortality. Secondary outcomes included LOS, the cost of care, ICU utilization, and discharge destination. The cost of care is a standardized estimate of the direct costs based on an adjustment of the charges submitted by CDB/RM participants. If an IHT is triaged through a receiving hospital's ED, the cost of care reflects those charges as well as the inpatient charges.
Statistical Analysis
We used descriptive statistics to characterize the IHT and ED patient populations. For bivariate comparisons of continuous variables, 2‐sample t tests with unequal variance were used. For categorical variables, 2 analysis was performed. We assessed the impact of IHT status on in‐hospital mortality using logistic regression to estimate unadjusted and adjusted relative risks, 95% confidence intervals (CIs), and P values. We included age, gender, insurance status, race, timing of ICU utilization, and 3M APR‐DRG ROM scores as independent variables. Prior studies have used this type of risk‐adjustment methodology with 3M APR‐DRG ROM scores,[13, 14, 15] including with interhospital transfer patients.[16] For all comparisons, a P value of <0.05 was considered statistically significant. Our sample size was determined by the data available for the 1‐year period.
Subgroup Analyses
We performed a stratified analysis based on the timing of ICU transfer to allow for additional comparisons of mortality within more homogeneous patient groups, and to control for the possibility that delays in ICU transfer could explain the association between IHT and in‐hospital mortality. We determined whether and when a patient spent time in the ICU based on daily accommodation charges. If a patient was charged for an ICU bed on the day of admission, we coded them as a direct ICU admission, and if the first ICU bed charge was on a subsequent day, they were coded as a delayed ICU admission. Approximately 20% of patients did not have the data necessary to determine the timing of ICU utilization, because the hospitals where they received care did not submit detailed charge data to the UHC.
Data analysis was performed by the UHC. Analysis was performed using Stata version 10 (StataCorp, College Station, TX). For all comparisons, a P value of <0.05 was considered significant.
RESULTS
Patient Characteristics
We identified 885,392 patients who met study criteria: 75,524 patients admitted as an IHT and 809,868 patients admitted from the ED. The proportion of each hospital's admissions that were IHTs that met our study criteria varied widely (median 9%, 25th percentile 3%, 75th percentile 14%). The average age and gender of the IHT and ED populations were similar and reflective of a nationally representative adult inpatient sample (Table 1). Racial compositions of the populations were notable for a higher portion of black patients in the ED admission group than the IHT group (25.4% vs 13.2%, P < 0.001). A slightly higher portion of the IHT population was covered by commercial insurance compared with the ED admissions (22.7% vs 19.1%, P < 0.001).
| Demographic/Clinical Variables | ED | IHT | ||||
|---|---|---|---|---|---|---|
| 1st | 2nd | 3rd | 4th | Rank | ||
| ||||||
| No. of patients | 809,868 | 91.5 | 75,524 | 8.5 | ||
| Age, y | 62.2 19.1 | 60.2 18.2 | ||||
| Male | 381,563 | 47.1 | 38,850 | 51.4 | ||
| Female | 428,303 | 52.9 | 36,672 | 48.6 | ||
| Race | ||||||
| White | 492,894 | 60.9 | 54,780 | 72.5 | ||
| Black | 205,309 | 25.4 | 9,968 | 13.2 | ||
| Other | 66,709 | 8.1 | 7,777 | 10.3 | ||
| Hispanic | 44,956 | 5.6 | 2,999 | 4.0 | ||
| Primary payer | ||||||
| Commercial | 154,826 | 19.1 | 17,130 | 22.7 | ||
| Medicaid | 193,585 | 23.9 | 15,924 | 21.1 | ||
| Medicare | 445,227 | 55.0 | 39,301 | 52.0 | ||
| Other | 16,230 | 2.0 | 3,169 | 4.2 | ||
| Most common MS‐DRGs (top 5 for each group) | ||||||
| Esophagitis, gastroenteritis, and miscellaneous digest disorders without MCC | 34,116 | 4.2 | 1st | 1,517 | 2.1 | 2nd |
| Septicemia or severe sepsis without MV 96+ hours with MCC | 25,710 | 3.2 | 2nd | 2,625 | 3.7 | 1st |
| Cellulitis without MCC | 21,686 | 2.7 | 3rd | 871 | 1.2 | 8th |
| Kidney and urinary tract infections without MCC | 19,937 | 2.5 | 4th | 631 | 0.9 | 21st |
| Chest pain | 18,056 | 2.2 | 5th | 495 | 0.7 | 34th |
| Renal failure with CC | 15,478 | 1.9 | 9th | 1,018 | 1.4 | 5th |
| GI hemorrhage with CC | 12,855 | 1.6 | 12th | 1,234 | 1.7 | 3rd |
| Respiratory system diagnosis w ventilator support | 4,773 | 0.6 | 47th | 1,118 | 1.6 | 4th |
| AHRQ comorbidities (top 5 for each group) | ||||||
| Hypertension | 468,026 | 17.8 | 1st | 39,340 | 16.4 | 1st |
| Fluid and electrolyte disorders | 251,339 | 9.5 | 2nd | 19,825 | 8.3 | 2nd |
| Deficiency anemia | 208,722 | 7.9 | 3rd | 19,663 | 8.2 | 3rd |
| Diabetes without CCs | 190,140 | 7.2 | 4th | 17,131 | 7.1 | 4th |
| Chronic pulmonary disease | 178,164 | 6.8 | 5th | 16,319 | 6.8 | 5th |
| Most common procedures (top 5 for each group) | ||||||
| Packed cell transfusion | 72,590 | 7.0 | 1st | 9,756 | 5.0 | 2nd |
| (Central) venous catheter insertion | 68,687 | 6.7 | 2nd | 13,755 | 7.0 | 1st |
| Hemodialysis | 41,557 | 4.0 | 3rd | 5,351 | 2.7 | 4th |
| Heart ultrasound (echocardiogram) | 37,762 | 3.7 | 4th | 5,441 | 2.8 | 3rd |
| Insert endotracheal tube | 25,360 | 2.5 | 5th | 4,705 | 2.4 | 6th |
| Continuous invasive mechanical ventilation | 19,221 | 1.9 | 9th | 5,280 | 2.7 | 5th |
| 3M APR‐DRG admission ROM score | ||||||
| Minor | 271,702 | 33.6 | 18,620 | 26.1 | ||
| Moderate | 286,427 | 35.4 | 21,775 | 30.5 | ||
| Major | 193,652 | 23.9 | 20,531 | 28.7 | ||
| Extreme | 58,081 | 7.2 | 10,527 | 14.7 | ||
Primary discharge diagnoses (MS‐DRGs) varied widely, with no single diagnosis accounting for more than 4.2% of admissions in either group. The most common primary diagnoses among IHTs included severe sepsis (3.7%), esophagitis and gastroenteritis (2.1%), and gastrointestinal bleeding (1.7%). The top 5 most common AHRQ comorbidities were the same between the IHT and ED populations. A higher proportion of IHTs had at least 1 procedure performed during their hospitalization (68.5% vs 49.8%, P < 0.001). Note that ICD‐9 procedure codes include interventions such as blood transfusions and dialysis (Table 1), which may not be considered procedures in common medical parlance.
As compared with those admitted from the ED, IHTs had a higher proportion of patients categorized with major or extreme admission risk of mortality score (major + extreme, ED 31.1% vs IHT 43.5%, P < 0.001).
Overall Outcomes
IHT patients experienced a 60% longer average LOS, and a higher proportion spent time in the ICU than patients admitted through the ED (Table 2). On average, care for IHT patients cost more per day than for ED patients (Table 2). A lower proportion of IHTs were discharged home (68.6% vs 77.4% of ED patients), and a higher proportion died in the hospital (4.1% vs 1.8%) (P < 0.001 for both). Of the ED or IHT patients who died during their admission, there was no significant difference between the proportion who died within 48 hours of admission (26.4% vs 25.6%, P = 0.3693). After adjusting for age, gender, insurance status, race, ICU utilization and 3M APR‐DRG admission ROM scores, IHT was independently associated with the risk of in‐hospital death (odds ratio [OR]: 1.36, 95% CI: 1.291.43) (Table 3). The C statistic for the in‐hospital mortality model was 0.88.
| ED, n = 809,868 | IHT, n = 75,524 | |
|---|---|---|
| ||
| LOS, mean SD | 5.0 6.9 | 8.0 13.4 |
| ICU days, mean SD | 0.6 2.4 | 1.7 5.2 |
| Patients who spent some time in the ICU | 14.3% | 29.8% |
| % LOS in the ICU (ICU days LOS) | 11.0% | 21.6% |
| Average total cost SD | $10,731 $16,593 | $19,818 $34,665 |
| Average cost per day (total cost LOS) | $2,139 | $2,492 |
| Discharged home | 77.4% | 68.6% |
| Died as inpatient | 14,869 (1.8%) | 3,051 (4.0%) |
| Died within 48 hours of admission (% total deaths) | 3,918 (26.4%) | 780 (25.6%) |
| Variable | Unadjusted OR (95% CI) | Adjusted OR (95% CI) |
|---|---|---|
| ||
| Age, y | 1.00 (1.001.00) | 1.03 (1.031.03) |
| Gender | ||
| Female | Ref. | Ref. |
| Male | 1.13 (1.091.70) | 1.05 (1.011.09) |
| Medicare status | ||
| No | Ref. | Ref. |
| Yes | 2.14 (2.062.22) | 1.39 (1.331.47) |
| Race | ||
| Nonblack | Ref. | Ref. |
| Black | 0.57 (0.550.60) | 0.77 (0.730.81) |
| ICU utilization | ||
| No ICU admission | Ref. | Ref. |
| Direct admission to the ICU | 5.56 (5.295.84) | 2.25 (2.132.38) |
| Delayed ICU admission | 5.48 (5.275.69) | 2.46 (2.362.57) |
| 3M APR‐DRG admission ROM score | ||
| Minor | Ref. | Ref. |
| Moderate | 8.71 (7.5510.05) | 6.28 (5.437.25) |
| Major | 43.97 (38.3150.47) | 25.84 (22.4729.71) |
| Extreme | 238.65 (207.69273.80) | 107.17 (93.07123.40) |
| IHT | ||
| No | Ref. | Ref. |
| Yes | 2.36 (2.262.48) | 1.36 (1.29 1.43) |
Subgroup Analyses
Table 4 demonstrates the unadjusted and adjusted results from our analysis stratified by timing of ICU utilization. IHT remained independently associated with in‐hospital mortality regardless of timing of ICU utilization.
| Subgroup | In‐hospital Mortality, n (%) | Unadjusted OR [95% CI] | Adjusted OR [95% CI] |
|---|---|---|---|
| |||
| No ICU admission, n = 552,171 | |||
| ED, n = 519,421 | 4,913 (0.95%) | Ref. | Ref. |
| IHT, n = 32,750 | 590 (1.80%) | 1.92 [1.762.09] | 1.68 [1.531.84] |
| Direct admission to the ICU, n = 44,537 | |||
| ED, n = 35,614 | 1,733 (4.87%) | Ref. | Ref. |
| IHT, n = 8,923 | 628 (7.04%) | 1.48 [1.351.63] | 1.24 [1.121.37] |
| Delayed ICU admission, n = 110,540 | |||
| ED, n = 95,573 | 4,706 (4.92%) | Ref. | Ref. |
| IHT, n = 14,967 | 1,068 (7.14%) | 1.48 [1.391.59] | 1.25 [1.171.35] |
DISCUSSION
Our study of IHT patients ultimately discharged by hospitalists and general internists at US academic referral centers found significantly increased average LOS, costs, and in‐hospital mortality compared with patients admitted from the ED. The increased risk of mortality persisted after adjustment for patient characteristics and variables representing endogenous risk of mortality, and in more homogeneous subgroups after stratification by presence and timing of ICU utilization. These data confirm findings from single‐center studies and suggest that observations about the difference between IHT and ED populations may be generalizable across US academic hospitals.
Our work builds on 2 single‐center studies that examined mixed medical and surgical academic IHT populations from the late 1980s and early 1990s,[9, 10] and 1 studying surgical ICU patients in 2013.[17] These studies demonstrated longer average LOS, higher costs, and higher mortality rates (in both adjusted and unadjusted analyses). Our work confirmed these findings utilizing a more current, multicenter large dataset of IHT patients ultimately discharged by hospitalists and general internists. Our work is unique from a larger, more recent study[7] in that it focuses on patients transferred to academic health systems, and therefore has particular relevance to those settings. In addition, we divided patients into subpopulations based on the timing of ICU utilization, and found that in each of these populations, IHT remained independently associated with in‐hospital mortality.
Our analysis does not explain why the outcomes of IHTs are worse, but plausible contributing factors include that (1) patients chosen for IHT are at higher risk of death in ways uncaptured by established mortality risk scores, (2) referring, transferring, or accepting providers and institutions have provided inadequate care, (3) the transfer process itself involves harm, (4) socioeconomic bias in selection for IHT,[18] or (5) some combination of the above. Regardless of the causes of the worse outcomes observed in these outside‐hospital transfers, as these patients are colloquially known at accepting hospitals, they present challenges to everyone involved. Referring providers may feel a sense of urgency as these patients' needs exceed their management capabilities. The process is often time consuming and burdensome for referring and accepting providers because of poorly developed systems.[19] The transfer often takes patients further from their home and may make it more difficult for family to participate in their care. The transfer may delay care if the accepting institution cannot immediately accept the patient or if the time in transport is prolonged, which could result in decompensation at a critical juncture. For providers inheriting such patients, the stress of caring for these patients is compounded by the difficulty obtaining records about the prior hospitalization.[20] This frustrating experience is often translated into unfounded judgment of the institution that referred the patient and the care provided there.[21] It is important for hospitalists making decisions throughout the transfer process and for hospital leaders who determine staffing levels, measure the quality of care, manage hospital networks, or write hospital policy to appreciate that the transfer process itself may contribute to the challenges and poor outcomes we observe. Furthermore, regardless of the cause for the increased mortality that we observed, our findings imply that IHT patients require careful evaluation, management, and treatment.
Many accepting institutions have transfer centers that facilitate these transitions, utilizing protocols and templates to standardize the process.[22, 23] Future research should focus on the characteristics of these centers to learn which practices are most efficacious. Interventions to mitigate the known challenges of transfer (including patient selection and triage, handoff communication, and information sharing) could be tested by randomized studies at referring and accepting institutions. There may be a role for health information exchange or the development of enhanced pretransfer evaluation processes using telemedicine models; there is evidence that information sharing may reduce redundant imaging.[24] Perhaps targeted review of IHTs admitted to a non‐ICU portion of the hospital and subsequently transferred to the ICU could identify opportunities to improve triaging protocols and thus avert some of the bad outcomes observed in this subpopulation. A related future direction could be to create protected forumsusing the patient safety organization framework[25]to facilitate the discussion of interhospital transfer outcomes among the referring, transporting, and receiving parties. Lastly, future work should investigate the reasons for the different proportions of black patients in the ED versus IHT cohorts. Our finding that black race was associated with lower risk of mortality has been previously reported but may also benefit from more investigation.[26]
There are several limitations of our work. First, despite extensive adjustment for patient characteristics, due to the observational nature of our study it is still possible that IHTs differ from ED admissions in ways that were unaccounted for in our analysis, and which could be associated with increased mortality independent of the transfer process itself. We are unable to characterize features of the transfer process, such as the reason for transfer, differences in transfer processes among hospitals, or the distance and mode of travel, which may influence outcomes.[27] Because we used administrative data, variations in coding could incorrectly estimate the complexity or severity of illness on admission, which is a previously described risk.[28] In addition, although our dataset was very large, it was limited by incomplete charge data, which limited our ability to measure ICU utilization in our full cohort. The hospitals missing ICU charge data are of variable sizes and are distributed around the country, limiting the chance of systematic bias. Finally, in some settings, hospitalists may serve as the discharging physician for patients admitted to other services such as the ICU, introducing heterogeneity and bias to the sample. We attempted to mitigate such bias through our subgroup analysis, which allowed for comparisons within more homogeneous patient groupings.
In conclusion, our large multicenter study of academic health systems confirms the findings of prior single‐center academic studies and a large general population study that interhospital transfer patients have an increased average LOS, costs, and adjusted in‐hospital mortality than patients admitted from the ED. This difference in mortality persisted even after controlling for several other predictors of mortality. Our findings emphasize the need for future studies designed to clarify the reason for the increased risk and identify targets for interventions to improve outcomes for the interhospital transfer population.
Acknowledgements
The authors gratefully acknowledge Zachary Goldberger and Tom Gallagher for their critical reviews of this article.
Disclosures
Dr. Herzig was funded by grant number K23AG042459 from the National Institute on Aging. The funding organization had no involvement in any aspect of the study, including design and conduct of the study; collection, management, analysis, and interpretation of the data; and preparation, review, or approval of the manuscript. The authors report no conflicts of interest.
- . The incomplete infrastructure for interhospital patient transfer. Crit Care Med. 2012;40(8):2470–2478.
- . AHRQ WebM23(1):68–75.
- , . Improving the quality of inter‐hospital transfers. J Qual Assur. 1991;13(4):16–20.
- , . Communication errors in dispatch of air medical transport. Prehosp Emerg Care. 2011;15(1):39–43.
- , , , , . Guidelines for the inter‐ and intrahospital transport of critically ill patients. Crit Care Med. 2004;32(1):256–262.
- , , , . Interhospital facility transfers in the United States: a nationwide outcomes study [published online November 13, 2014]. J Patient Saf. doi: 10.1097/PTS.0000000000000148.
- , , , et al. Patients transferred to academic medical centers and other hospitals: characteristics, resource use, and outcomes. Acad Med. 1997;72(10):921–930.
- , , , , . Comparing the hospitalizations of transfer and non‐transfer patients in an academic medical center. Acad Med. 1996;71(3):262–266.
- , . Impact of interhospital transfers on outcomes in an academic medical center. Implications for profiling hospital quality. Med Care. 1996;34(4):295–309.
- , , , . Comorbidity measures for use with administrative data. Med Care. 1998;36(1):8–27.
- . 3M HIS: APR DRG classification software—overview. Mortality Measurement. Available at: http://archive.ahrq.gov/professionals/quality‐patient‐safety/quality‐resources/tools/mortality/Hughessumm.html. Accessed June 14, 2011.
- , . Risk‐adjusting acute myocardial infarction mortality: are APR‐DRGs the right tool? Health Serv Res. 2000;34(7):1469–1489.
- , , , , . Hospital volume and surgical outcomes after elective hip/knee arthroplasty: a risk‐adjusted analysis of a large regional database. Arthritis Rheum. 2011;63(8):2531–2539.
- , , , . Examination of hospital characteristics and patient quality outcomes using four inpatient quality indicators and 30‐day all‐cause mortality. Am J Med Qual. 2013;28(1):46–55.
- , , , , . Observed and expected outcomes in transfer and nontransfer patients with a hip fracture. J Orthop Trauma. 2011;25(11):666–669.
- , , , et al. Interhospital transfer: an independent risk factor for mortality in the surgical intensive care unit. Am Surg. 2013;79(9):909–913.
- , , , . Insurance status and the transfer of hospitalized patients: an observational study. Ann Intern Med. 2014;160(2):81–90.
- , , . Which patients and where: a qualitative study of patient transfers from community hospitals. Med Care. 2011;49(6):592–598.
- . Overwhelmed and uninspired by lack of coordinated care: a call to action for new physicians. Acad Med. 2013;88(11):1600–1602.
- . The outside hospital. Ann Intern Med. 2013;159(7):500–501.
- , , . Untangling the lines: using a transfer center to assist with interfacility transfers. Nurs Econ. 2003;21(2):94–96.
- , , , et al. Ticket to ride: reducing handoff risk during hospital patient transport. J Nurs Care Qual. 2009;24(2):109–115.
- , , . Outside imaging in emergency department transfer patients: CD import reduces rates of subsequent imaging utilization. Radiology. 2011;260(2):408–413.
- Agency for Healthcare Research and Quality. Patient Safety Organization (PSO) Program. Available at: http://www.pso.ahrq.gov. Accessed July 7, 2011.
- , , , , , . Socioeconomic status, race, and mortality: a prospective cohort study. Am J Public Health. 2014;104(12):e98–e107.
- , , , . Prognostic factors for mortality following interhospital transfers to the medical intensive care unit of a tertiary referral center. Crit Care Med. 2003;31(7):1981–1986.
- , , , . The accuracy of present‐on‐admission reporting in administrative data. Health Serv Res. 2011;46(6 pt 1):1946–1962.
Interhospital transfers (IHTs) to academic medical centers (AMCs) or their affiliated hospitals may benefit patients who require unique specialty and procedural services. However, IHTs also introduce a potentially risky transition of care for patients suffering from complex or unstable medical problems.[1] Components of this risk include the dangers associated with transportation and the disrupted continuity of care that may lead to delays or errors in care.[2, 3] Furthermore, referring and accepting providers may face barriers to optimal handoffs including a lack of shared communication standards and difficulty accessing external medical records.[3, 4, 5] Although some authors have recommended the creation of formal guidelines for interhospital transfer processes for all patients to mitigate the risks of transfer, the available guidelines governing the IHT triage and communication process are limited to critically ill patients.[6]
A recent study of a diverse patient and hospital dataset demonstrated that interhospital transfer patients have a higher risk of mortality, increased length of stay (LOS), and increased risk of adverse events as compared with non‐transfer patients.[7] However, it is unknown if these findings persist in the population of patients transferred specifically to AMCs or their affiliated hospitals (the combination is hereafter referred to as academic health systems [AHSs]). AMCs provide a disproportionate share of IHT care for complex patients and have a vested interest in improving the outcomes of these transitions.[8] Prior single‐center studies of acute care adult medical patients accepted to AMCs have shown that IHT is associated with a longer LOS, increased in‐hospital mortality, and higher resource use.[9, 10] However, it is difficult to generalize from single‐center studies due to the variation in referral practices, geography, and network characteristics. Additionally, AMC referral systems, patient mix, and utilization of hospitalists have likely changed substantially in the nearly 2 decades since those reports were published.
Hospitalists and general internists often manage the transfer acceptance processes for internal medicine services at receiving hospitals, helping to triage and coordinate care for IHT patients. As a result, it is important for hospitalists to understand the characteristics and outcomes of the IHT population. In addition to informing the decision making around transfer for a given patient, such an understanding is the foundation for helping providers and institutions begin to systematically identify and mitigate peritransfer risks.
We conducted this large multicenter study to describe the characteristics and outcomes of a current, nationally representative IHT patient population discharged by hospitalists and general internists at AHSs. To identify unique features of the IHT population, we compared patients transferred from another hospital to an AHS to those admitted to the AHS directly from the AHS's emergency department (ED). Based on our anecdotal experiences and the prior single‐center study findings in adult medical populations,[9, 10] we hypothesized that the IHT population would be sicker, stay in the hospital and intensive care unit (ICU) longer, and have higher costs and in‐hospital mortality than ED patients. Although there may be fundamental differences between the 2 groups related to disease and patient condition, we hypothesized that outcome differences would persist even after adjusting for patient factors such as demographics, disease‐specific risk of mortality, and ICU utilization.
PATIENTS AND METHODS
We conducted a retrospective cohort study using data from the University HealthSystem Consortium (UHC) Clinical Database and Resource Manager (CDB/RM). UHC is an alliance of 120 academic medical centers and 300 of their affiliated hospitals for the purposes of collaboration on performance improvement. Each year, a subset of participating hospitals submits data on all of their inpatient discharges to the CDB/RM, which totals approximately 5 million records. The CDB/RM includes information from billing forms including demographics, diagnoses, and procedures as captured by International Classification of Diseases, Ninth Revision (ICD‐9) codes, discharge disposition, and line item charge detail for the type of bed (eg, floor, ICU). Most hospitals also provide detailed charge information including pharmacy, imaging, blood products, lab tests, and supplies. Some hospitals do not provide any charge data. The Beth Israel Deaconess Medical Center and University of Washington institutional review boards reviewed and approved the conduct of this study.
We included all inpatients discharged by hospitalists or general internal medicine physicians from UHC hospitals between April 1, 2011 and March 31, 2012. We excluded minors, pregnant patients, and prisoners. One hundred fifty‐eight adult academic medical centers and affiliated hospitals submitted data throughout this time period. Our primary independent variable, IHT status, was defined by patients whose admission source was another acute care institution. ED admissions were defined as patients admitted from the AHS ED whose source of origination was not another hospital or ambulatory surgery site.
Admission Characteristics
Admission characteristics of interest included age, gender, insurance status, the most common diagnoses in each cohort based on Medicare Severity Diagnosis‐Related Group (MS‐DRG), the most common Agency for Healthcare Research and Quality (AHRQ) comorbitidies,[11] the most common procedures, and the admission 3M All‐Patient Refined Diagnosis‐Related Group (APR‐DRG) risk of mortality (ROM) scores. 3M APR‐DRG ROM scores are proprietary categorical measures specific to the base APR‐DRG to which a patient is assigned, which are calculated using data available at the time of admission, including comorbid condition diagnosis codes, age, procedure codes, and principal diagnosis codes. A patient can fall into 1 of 4 categories with this score: minor, moderate, major, or extreme.[12]
Outcomes
Our primary outcome of interest was in‐hospital mortality. Secondary outcomes included LOS, the cost of care, ICU utilization, and discharge destination. The cost of care is a standardized estimate of the direct costs based on an adjustment of the charges submitted by CDB/RM participants. If an IHT is triaged through a receiving hospital's ED, the cost of care reflects those charges as well as the inpatient charges.
Statistical Analysis
We used descriptive statistics to characterize the IHT and ED patient populations. For bivariate comparisons of continuous variables, 2‐sample t tests with unequal variance were used. For categorical variables, 2 analysis was performed. We assessed the impact of IHT status on in‐hospital mortality using logistic regression to estimate unadjusted and adjusted relative risks, 95% confidence intervals (CIs), and P values. We included age, gender, insurance status, race, timing of ICU utilization, and 3M APR‐DRG ROM scores as independent variables. Prior studies have used this type of risk‐adjustment methodology with 3M APR‐DRG ROM scores,[13, 14, 15] including with interhospital transfer patients.[16] For all comparisons, a P value of <0.05 was considered statistically significant. Our sample size was determined by the data available for the 1‐year period.
Subgroup Analyses
We performed a stratified analysis based on the timing of ICU transfer to allow for additional comparisons of mortality within more homogeneous patient groups, and to control for the possibility that delays in ICU transfer could explain the association between IHT and in‐hospital mortality. We determined whether and when a patient spent time in the ICU based on daily accommodation charges. If a patient was charged for an ICU bed on the day of admission, we coded them as a direct ICU admission, and if the first ICU bed charge was on a subsequent day, they were coded as a delayed ICU admission. Approximately 20% of patients did not have the data necessary to determine the timing of ICU utilization, because the hospitals where they received care did not submit detailed charge data to the UHC.
Data analysis was performed by the UHC. Analysis was performed using Stata version 10 (StataCorp, College Station, TX). For all comparisons, a P value of <0.05 was considered significant.
RESULTS
Patient Characteristics
We identified 885,392 patients who met study criteria: 75,524 patients admitted as an IHT and 809,868 patients admitted from the ED. The proportion of each hospital's admissions that were IHTs that met our study criteria varied widely (median 9%, 25th percentile 3%, 75th percentile 14%). The average age and gender of the IHT and ED populations were similar and reflective of a nationally representative adult inpatient sample (Table 1). Racial compositions of the populations were notable for a higher portion of black patients in the ED admission group than the IHT group (25.4% vs 13.2%, P < 0.001). A slightly higher portion of the IHT population was covered by commercial insurance compared with the ED admissions (22.7% vs 19.1%, P < 0.001).
| Demographic/Clinical Variables | ED | IHT | ||||
|---|---|---|---|---|---|---|
| 1st | 2nd | 3rd | 4th | Rank | ||
| ||||||
| No. of patients | 809,868 | 91.5 | 75,524 | 8.5 | ||
| Age, y | 62.2 19.1 | 60.2 18.2 | ||||
| Male | 381,563 | 47.1 | 38,850 | 51.4 | ||
| Female | 428,303 | 52.9 | 36,672 | 48.6 | ||
| Race | ||||||
| White | 492,894 | 60.9 | 54,780 | 72.5 | ||
| Black | 205,309 | 25.4 | 9,968 | 13.2 | ||
| Other | 66,709 | 8.1 | 7,777 | 10.3 | ||
| Hispanic | 44,956 | 5.6 | 2,999 | 4.0 | ||
| Primary payer | ||||||
| Commercial | 154,826 | 19.1 | 17,130 | 22.7 | ||
| Medicaid | 193,585 | 23.9 | 15,924 | 21.1 | ||
| Medicare | 445,227 | 55.0 | 39,301 | 52.0 | ||
| Other | 16,230 | 2.0 | 3,169 | 4.2 | ||
| Most common MS‐DRGs (top 5 for each group) | ||||||
| Esophagitis, gastroenteritis, and miscellaneous digest disorders without MCC | 34,116 | 4.2 | 1st | 1,517 | 2.1 | 2nd |
| Septicemia or severe sepsis without MV 96+ hours with MCC | 25,710 | 3.2 | 2nd | 2,625 | 3.7 | 1st |
| Cellulitis without MCC | 21,686 | 2.7 | 3rd | 871 | 1.2 | 8th |
| Kidney and urinary tract infections without MCC | 19,937 | 2.5 | 4th | 631 | 0.9 | 21st |
| Chest pain | 18,056 | 2.2 | 5th | 495 | 0.7 | 34th |
| Renal failure with CC | 15,478 | 1.9 | 9th | 1,018 | 1.4 | 5th |
| GI hemorrhage with CC | 12,855 | 1.6 | 12th | 1,234 | 1.7 | 3rd |
| Respiratory system diagnosis w ventilator support | 4,773 | 0.6 | 47th | 1,118 | 1.6 | 4th |
| AHRQ comorbidities (top 5 for each group) | ||||||
| Hypertension | 468,026 | 17.8 | 1st | 39,340 | 16.4 | 1st |
| Fluid and electrolyte disorders | 251,339 | 9.5 | 2nd | 19,825 | 8.3 | 2nd |
| Deficiency anemia | 208,722 | 7.9 | 3rd | 19,663 | 8.2 | 3rd |
| Diabetes without CCs | 190,140 | 7.2 | 4th | 17,131 | 7.1 | 4th |
| Chronic pulmonary disease | 178,164 | 6.8 | 5th | 16,319 | 6.8 | 5th |
| Most common procedures (top 5 for each group) | ||||||
| Packed cell transfusion | 72,590 | 7.0 | 1st | 9,756 | 5.0 | 2nd |
| (Central) venous catheter insertion | 68,687 | 6.7 | 2nd | 13,755 | 7.0 | 1st |
| Hemodialysis | 41,557 | 4.0 | 3rd | 5,351 | 2.7 | 4th |
| Heart ultrasound (echocardiogram) | 37,762 | 3.7 | 4th | 5,441 | 2.8 | 3rd |
| Insert endotracheal tube | 25,360 | 2.5 | 5th | 4,705 | 2.4 | 6th |
| Continuous invasive mechanical ventilation | 19,221 | 1.9 | 9th | 5,280 | 2.7 | 5th |
| 3M APR‐DRG admission ROM score | ||||||
| Minor | 271,702 | 33.6 | 18,620 | 26.1 | ||
| Moderate | 286,427 | 35.4 | 21,775 | 30.5 | ||
| Major | 193,652 | 23.9 | 20,531 | 28.7 | ||
| Extreme | 58,081 | 7.2 | 10,527 | 14.7 | ||
Primary discharge diagnoses (MS‐DRGs) varied widely, with no single diagnosis accounting for more than 4.2% of admissions in either group. The most common primary diagnoses among IHTs included severe sepsis (3.7%), esophagitis and gastroenteritis (2.1%), and gastrointestinal bleeding (1.7%). The top 5 most common AHRQ comorbidities were the same between the IHT and ED populations. A higher proportion of IHTs had at least 1 procedure performed during their hospitalization (68.5% vs 49.8%, P < 0.001). Note that ICD‐9 procedure codes include interventions such as blood transfusions and dialysis (Table 1), which may not be considered procedures in common medical parlance.
As compared with those admitted from the ED, IHTs had a higher proportion of patients categorized with major or extreme admission risk of mortality score (major + extreme, ED 31.1% vs IHT 43.5%, P < 0.001).
Overall Outcomes
IHT patients experienced a 60% longer average LOS, and a higher proportion spent time in the ICU than patients admitted through the ED (Table 2). On average, care for IHT patients cost more per day than for ED patients (Table 2). A lower proportion of IHTs were discharged home (68.6% vs 77.4% of ED patients), and a higher proportion died in the hospital (4.1% vs 1.8%) (P < 0.001 for both). Of the ED or IHT patients who died during their admission, there was no significant difference between the proportion who died within 48 hours of admission (26.4% vs 25.6%, P = 0.3693). After adjusting for age, gender, insurance status, race, ICU utilization and 3M APR‐DRG admission ROM scores, IHT was independently associated with the risk of in‐hospital death (odds ratio [OR]: 1.36, 95% CI: 1.291.43) (Table 3). The C statistic for the in‐hospital mortality model was 0.88.
| ED, n = 809,868 | IHT, n = 75,524 | |
|---|---|---|
| ||
| LOS, mean SD | 5.0 6.9 | 8.0 13.4 |
| ICU days, mean SD | 0.6 2.4 | 1.7 5.2 |
| Patients who spent some time in the ICU | 14.3% | 29.8% |
| % LOS in the ICU (ICU days LOS) | 11.0% | 21.6% |
| Average total cost SD | $10,731 $16,593 | $19,818 $34,665 |
| Average cost per day (total cost LOS) | $2,139 | $2,492 |
| Discharged home | 77.4% | 68.6% |
| Died as inpatient | 14,869 (1.8%) | 3,051 (4.0%) |
| Died within 48 hours of admission (% total deaths) | 3,918 (26.4%) | 780 (25.6%) |
| Variable | Unadjusted OR (95% CI) | Adjusted OR (95% CI) |
|---|---|---|
| ||
| Age, y | 1.00 (1.001.00) | 1.03 (1.031.03) |
| Gender | ||
| Female | Ref. | Ref. |
| Male | 1.13 (1.091.70) | 1.05 (1.011.09) |
| Medicare status | ||
| No | Ref. | Ref. |
| Yes | 2.14 (2.062.22) | 1.39 (1.331.47) |
| Race | ||
| Nonblack | Ref. | Ref. |
| Black | 0.57 (0.550.60) | 0.77 (0.730.81) |
| ICU utilization | ||
| No ICU admission | Ref. | Ref. |
| Direct admission to the ICU | 5.56 (5.295.84) | 2.25 (2.132.38) |
| Delayed ICU admission | 5.48 (5.275.69) | 2.46 (2.362.57) |
| 3M APR‐DRG admission ROM score | ||
| Minor | Ref. | Ref. |
| Moderate | 8.71 (7.5510.05) | 6.28 (5.437.25) |
| Major | 43.97 (38.3150.47) | 25.84 (22.4729.71) |
| Extreme | 238.65 (207.69273.80) | 107.17 (93.07123.40) |
| IHT | ||
| No | Ref. | Ref. |
| Yes | 2.36 (2.262.48) | 1.36 (1.29 1.43) |
Subgroup Analyses
Table 4 demonstrates the unadjusted and adjusted results from our analysis stratified by timing of ICU utilization. IHT remained independently associated with in‐hospital mortality regardless of timing of ICU utilization.
| Subgroup | In‐hospital Mortality, n (%) | Unadjusted OR [95% CI] | Adjusted OR [95% CI] |
|---|---|---|---|
| |||
| No ICU admission, n = 552,171 | |||
| ED, n = 519,421 | 4,913 (0.95%) | Ref. | Ref. |
| IHT, n = 32,750 | 590 (1.80%) | 1.92 [1.762.09] | 1.68 [1.531.84] |
| Direct admission to the ICU, n = 44,537 | |||
| ED, n = 35,614 | 1,733 (4.87%) | Ref. | Ref. |
| IHT, n = 8,923 | 628 (7.04%) | 1.48 [1.351.63] | 1.24 [1.121.37] |
| Delayed ICU admission, n = 110,540 | |||
| ED, n = 95,573 | 4,706 (4.92%) | Ref. | Ref. |
| IHT, n = 14,967 | 1,068 (7.14%) | 1.48 [1.391.59] | 1.25 [1.171.35] |
DISCUSSION
Our study of IHT patients ultimately discharged by hospitalists and general internists at US academic referral centers found significantly increased average LOS, costs, and in‐hospital mortality compared with patients admitted from the ED. The increased risk of mortality persisted after adjustment for patient characteristics and variables representing endogenous risk of mortality, and in more homogeneous subgroups after stratification by presence and timing of ICU utilization. These data confirm findings from single‐center studies and suggest that observations about the difference between IHT and ED populations may be generalizable across US academic hospitals.
Our work builds on 2 single‐center studies that examined mixed medical and surgical academic IHT populations from the late 1980s and early 1990s,[9, 10] and 1 studying surgical ICU patients in 2013.[17] These studies demonstrated longer average LOS, higher costs, and higher mortality rates (in both adjusted and unadjusted analyses). Our work confirmed these findings utilizing a more current, multicenter large dataset of IHT patients ultimately discharged by hospitalists and general internists. Our work is unique from a larger, more recent study[7] in that it focuses on patients transferred to academic health systems, and therefore has particular relevance to those settings. In addition, we divided patients into subpopulations based on the timing of ICU utilization, and found that in each of these populations, IHT remained independently associated with in‐hospital mortality.
Our analysis does not explain why the outcomes of IHTs are worse, but plausible contributing factors include that (1) patients chosen for IHT are at higher risk of death in ways uncaptured by established mortality risk scores, (2) referring, transferring, or accepting providers and institutions have provided inadequate care, (3) the transfer process itself involves harm, (4) socioeconomic bias in selection for IHT,[18] or (5) some combination of the above. Regardless of the causes of the worse outcomes observed in these outside‐hospital transfers, as these patients are colloquially known at accepting hospitals, they present challenges to everyone involved. Referring providers may feel a sense of urgency as these patients' needs exceed their management capabilities. The process is often time consuming and burdensome for referring and accepting providers because of poorly developed systems.[19] The transfer often takes patients further from their home and may make it more difficult for family to participate in their care. The transfer may delay care if the accepting institution cannot immediately accept the patient or if the time in transport is prolonged, which could result in decompensation at a critical juncture. For providers inheriting such patients, the stress of caring for these patients is compounded by the difficulty obtaining records about the prior hospitalization.[20] This frustrating experience is often translated into unfounded judgment of the institution that referred the patient and the care provided there.[21] It is important for hospitalists making decisions throughout the transfer process and for hospital leaders who determine staffing levels, measure the quality of care, manage hospital networks, or write hospital policy to appreciate that the transfer process itself may contribute to the challenges and poor outcomes we observe. Furthermore, regardless of the cause for the increased mortality that we observed, our findings imply that IHT patients require careful evaluation, management, and treatment.
Many accepting institutions have transfer centers that facilitate these transitions, utilizing protocols and templates to standardize the process.[22, 23] Future research should focus on the characteristics of these centers to learn which practices are most efficacious. Interventions to mitigate the known challenges of transfer (including patient selection and triage, handoff communication, and information sharing) could be tested by randomized studies at referring and accepting institutions. There may be a role for health information exchange or the development of enhanced pretransfer evaluation processes using telemedicine models; there is evidence that information sharing may reduce redundant imaging.[24] Perhaps targeted review of IHTs admitted to a non‐ICU portion of the hospital and subsequently transferred to the ICU could identify opportunities to improve triaging protocols and thus avert some of the bad outcomes observed in this subpopulation. A related future direction could be to create protected forumsusing the patient safety organization framework[25]to facilitate the discussion of interhospital transfer outcomes among the referring, transporting, and receiving parties. Lastly, future work should investigate the reasons for the different proportions of black patients in the ED versus IHT cohorts. Our finding that black race was associated with lower risk of mortality has been previously reported but may also benefit from more investigation.[26]
There are several limitations of our work. First, despite extensive adjustment for patient characteristics, due to the observational nature of our study it is still possible that IHTs differ from ED admissions in ways that were unaccounted for in our analysis, and which could be associated with increased mortality independent of the transfer process itself. We are unable to characterize features of the transfer process, such as the reason for transfer, differences in transfer processes among hospitals, or the distance and mode of travel, which may influence outcomes.[27] Because we used administrative data, variations in coding could incorrectly estimate the complexity or severity of illness on admission, which is a previously described risk.[28] In addition, although our dataset was very large, it was limited by incomplete charge data, which limited our ability to measure ICU utilization in our full cohort. The hospitals missing ICU charge data are of variable sizes and are distributed around the country, limiting the chance of systematic bias. Finally, in some settings, hospitalists may serve as the discharging physician for patients admitted to other services such as the ICU, introducing heterogeneity and bias to the sample. We attempted to mitigate such bias through our subgroup analysis, which allowed for comparisons within more homogeneous patient groupings.
In conclusion, our large multicenter study of academic health systems confirms the findings of prior single‐center academic studies and a large general population study that interhospital transfer patients have an increased average LOS, costs, and adjusted in‐hospital mortality than patients admitted from the ED. This difference in mortality persisted even after controlling for several other predictors of mortality. Our findings emphasize the need for future studies designed to clarify the reason for the increased risk and identify targets for interventions to improve outcomes for the interhospital transfer population.
Acknowledgements
The authors gratefully acknowledge Zachary Goldberger and Tom Gallagher for their critical reviews of this article.
Disclosures
Dr. Herzig was funded by grant number K23AG042459 from the National Institute on Aging. The funding organization had no involvement in any aspect of the study, including design and conduct of the study; collection, management, analysis, and interpretation of the data; and preparation, review, or approval of the manuscript. The authors report no conflicts of interest.
- . The incomplete infrastructure for interhospital patient transfer. Crit Care Med. 2012;40(8):2470–2478.
- . AHRQ WebM23(1):68–75.
- , . Improving the quality of inter‐hospital transfers. J Qual Assur. 1991;13(4):16–20.
- , . Communication errors in dispatch of air medical transport. Prehosp Emerg Care. 2011;15(1):39–43.
- , , , , . Guidelines for the inter‐ and intrahospital transport of critically ill patients. Crit Care Med. 2004;32(1):256–262.
- , , , . Interhospital facility transfers in the United States: a nationwide outcomes study [published online November 13, 2014]. J Patient Saf. doi: 10.1097/PTS.0000000000000148.
- , , , et al. Patients transferred to academic medical centers and other hospitals: characteristics, resource use, and outcomes. Acad Med. 1997;72(10):921–930.
- , , , , . Comparing the hospitalizations of transfer and non‐transfer patients in an academic medical center. Acad Med. 1996;71(3):262–266.
- , . Impact of interhospital transfers on outcomes in an academic medical center. Implications for profiling hospital quality. Med Care. 1996;34(4):295–309.
- , , , . Comorbidity measures for use with administrative data. Med Care. 1998;36(1):8–27.
- . 3M HIS: APR DRG classification software—overview. Mortality Measurement. Available at: http://archive.ahrq.gov/professionals/quality‐patient‐safety/quality‐resources/tools/mortality/Hughessumm.html. Accessed June 14, 2011.
- , . Risk‐adjusting acute myocardial infarction mortality: are APR‐DRGs the right tool? Health Serv Res. 2000;34(7):1469–1489.
- , , , , . Hospital volume and surgical outcomes after elective hip/knee arthroplasty: a risk‐adjusted analysis of a large regional database. Arthritis Rheum. 2011;63(8):2531–2539.
- , , , . Examination of hospital characteristics and patient quality outcomes using four inpatient quality indicators and 30‐day all‐cause mortality. Am J Med Qual. 2013;28(1):46–55.
- , , , , . Observed and expected outcomes in transfer and nontransfer patients with a hip fracture. J Orthop Trauma. 2011;25(11):666–669.
- , , , et al. Interhospital transfer: an independent risk factor for mortality in the surgical intensive care unit. Am Surg. 2013;79(9):909–913.
- , , , . Insurance status and the transfer of hospitalized patients: an observational study. Ann Intern Med. 2014;160(2):81–90.
- , , . Which patients and where: a qualitative study of patient transfers from community hospitals. Med Care. 2011;49(6):592–598.
- . Overwhelmed and uninspired by lack of coordinated care: a call to action for new physicians. Acad Med. 2013;88(11):1600–1602.
- . The outside hospital. Ann Intern Med. 2013;159(7):500–501.
- , , . Untangling the lines: using a transfer center to assist with interfacility transfers. Nurs Econ. 2003;21(2):94–96.
- , , , et al. Ticket to ride: reducing handoff risk during hospital patient transport. J Nurs Care Qual. 2009;24(2):109–115.
- , , . Outside imaging in emergency department transfer patients: CD import reduces rates of subsequent imaging utilization. Radiology. 2011;260(2):408–413.
- Agency for Healthcare Research and Quality. Patient Safety Organization (PSO) Program. Available at: http://www.pso.ahrq.gov. Accessed July 7, 2011.
- , , , , , . Socioeconomic status, race, and mortality: a prospective cohort study. Am J Public Health. 2014;104(12):e98–e107.
- , , , . Prognostic factors for mortality following interhospital transfers to the medical intensive care unit of a tertiary referral center. Crit Care Med. 2003;31(7):1981–1986.
- , , , . The accuracy of present‐on‐admission reporting in administrative data. Health Serv Res. 2011;46(6 pt 1):1946–1962.
© 2015 Society of Hospital Medicine
A Novel Cream Formulation Containing Nicotinamide 4%, Arbutin 3%, Bisabolol 1%, and Retinaldehyde 0.05% for Treatment of Epidermal Melasma
Epidermal melasma is a common hyperpigmentation disorder that can be challenging to treat. The pathogenesis of melasma is not fully understood but has been associated with increased melanin and melanocyte activity.1,2 Melasma is characterized by jagged, light- to dark-brown patches on areas of the skin most often exposed to the sun—primarily the cheeks, forehead, upper lip, nose, and chin.3 Although it can affect both sexes and all races, melasma is more common in Fitzpatrick skin types II to IV and frequently is seen in Asian or Hispanic women residing in geographic locations with high levels of sun exposure (eg, tropical areas).2 Melasma presents more frequently in adult women of childbearing age, especially during pregnancy, but also can begin postmenopause. Onset may occur as early as menarche but typically is observed between the ages of 30 and 55 years.3,4 Only 10% of melasma cases are known to occur in males4 and are influenced by such factors as ethnicity, hormones, and level of sun exposure.2
Topical therapies for melasma attempt to inhibit melanocytic activation at each level of melanin formation until the deposited pigment is removed; however, results may vary greatly, as melasma often recurs due to the migration of new melanocytes from hair follicles to the skin’s surface, leading to new development of hyperpigmentation. The current standard of treatment for melasma involves the use of hydroquinone and other bleaching agents, but long-term use of these treatments has been associated with concerns regarding unstable preparations (which may lose their therapeutic properties) and adverse effects (eg, ochronosis, depigmentation).5 Cosmetic agents that recently have been evaluated for melasma treatment include nicotinamide (a form of vitamin B3), which inhibits the transfer of melanosomes from melanocytes to keratinocytes; arbutin, which inhibits melanin synthesis by inhibiting tyrosinase activity6; bisabolol, which prevents anti-inflammatory activity7; and retinaldehyde (RAL), a precursor of retinoic acid (RA) that has powerful bleaching action and low levels of cutaneous irritability.8
This prospective, single-arm, open-label study, evaluated the efficacy and safety of a novel cream formulation containing nicotinamide 4%, arbutin 3%, bisabolol 1%, and retinaldehyde 0.05% in the treatment of epidermal melasma.
Study Product Ingredients and Background
Nicotinamide
Nicotinamide is a water-soluble amide of nicotinic acid (niacin) and one of the 2 principal forms of vitamin B3. It is a component of the coenzymes nicotinamide adenine dinucleotide and nicotinamide adenine dinucleotide phosphate. Nicotinamide essentially acts as an antioxidant, with most of its effects exerted through poly(adenosine diphosphate–ribose) polymerase inhibition. Interest has increased in the role of nicotinamide in the prevention and treatment of several skin diseases, such as acne and UV radiation–induced deleterious molecular and immunological events. Nicotinamide also has gained consideration as a potential agent in sunscreen preparations due to its possible skin-lightening effects, stimulation of DNA repair, suppression of UV photocarcinogenesis, and other antiaging effects.9
Arbutin
Arbutin is a molecule that has proven effective in treating melasma.10 Its pigment-lightening ingredients include botanicals that are structurally similar to hydroquinone. Arbutin is obtained from the leaves of the bearberry plant but also is found in lesser quantities in cranberry and blueberry leaves. A naturally occurring gluconopyranoside, arbutin reduces tyrosinase activity without affecting messenger RNA expression.11 Arbutin also inhibits melanosome maturation, is nontoxic to melanocytes, and is used in Japan in a variety of pigment-lightening preparations at 3% concentrations.12
Bisabolol
Bisabolol is a natural monocyclic sesquiterpene alcohol found in the oils of chamomile and other plants. Bisabolol often is included in cosmetics due to its favorable anti-inflammatory and depigmentation properties. Its downregulation of inducible nitric oxide synthase and cyclooxygenase-2 suggests that it may have anti-inflammatory effects.7
Retinaldehyde
Retinaldehyde is an RA precursor that forms as an intermediate metabolite in the transformation of retinol to RA in human keratinocytes. Topical RAL is well tolerated by human skin, and several of its biologic effects are identical to those of RA. Using the tails of C57BL/6 mouse models, RAL 0.05% has been found to have significantly more potent depigmenting effects than RA 0.05% (P<.001 vs P<.01, respectively) when compared to vehicle.13
Although combination therapy with RAL and arbutin could potentially cause skin irritation, the addition of bisabolol to the combination cream used in this study is believed to have conferred anti-inflammatory properties because it inhibits the release of histamine and relieves irritation.
Methods
This single-center, single-arm, prospective, open-label study evaluated the efficacy and safety of a novel cream formulation containing nicotinamide 4%, arbutin 3%, bisabolol 1%, and RAL 0.05% in treating epidermal melasma. Clinical evaluation included assessment of Melasma Area and Severity Index (MASI) score, photographic analysis, and in vivo reflectance confocal microscopy (RCM) analysis.
The study population included women aged 18 to 50 years with Fitzpatrick skin types I through V who had clinically diagnosed epidermal melasma on the face. Eligibility requirements included confirmation of epidermal pigmentation on Wood lamp examination and RCM analysis and a MASI score of less than 10.5. A total of 35 participants were enrolled in the study (intention to treat [ITT] population). Thirty-three participants were included in the analysis of treatment effectiveness (ITTe population), as 2 were excluded due to lack of follow-up postbaseline. Four participants were prematurely withdrawn from the study—3 due to loss to follow-up and 1 due to treatment discontinuation following an adverse event (AE). The last observation carried forward method was used to input missing data from these 4 participants excluding repeated measure analysis that used the generalized estimated equation method.
At baseline, a 25-g tube of the study cream containing nicotinamide 4%, arbutin 3%, bisabolol 1%, and RAL 0.05% was distributed to all participants for once-daily application to the entire face for 30 days. Participants were instructed to apply the product in the evening after using a gentle cleanser, which also was to be used in the morning to remove the product residue. Additionally, participants were given a sunscreen with a sun protection factor of 30 to apply daily on the entire face in the morning, after lunch, and midafternoon. During the 30-day treatment period, treatment interruption of up to 5 consecutive days or 10 nonconsecutive days in total was permitted. At day 30, participants received another 30-day supply of the study product and sunscreen to be applied according to the same regimen for an additional 30-day treatment period.
Clinical Evaluation
At baseline, demographic data and medical history was recorded for all participants and dermatologic and physical examination was performed documenting weight, height, blood pressure, heart rate, and baseline MASI score. Following Wood lamp examination, participants’ faces were photographed and catalogued using medical imaging software that allowed for measurement of the total melasma surface area (Figure 1A). The photographs also were cross-polarized for further analysis of the pigmentation (Figure 1B).

| 
| |
Figure 1. Clinical (A) and cross-polarized (B) photographs of a patient before treatment with the novel compound containing nicotinamide 4%, arbutin 3%, bisabolol 1%, and retinaldehyde 0.05%. | ||
A questionnaire evaluating treatment satisfaction was administered to participants (ITTe population [n=33]) at baseline and days 30 and 60. Questionnaire items pertained to skin blemishes, signs of facial aging, overall appearance, texture, oiliness, brightness, and hydration. Participants were instructed to rate their satisfaction for each item on a scale of 1 to 10 (1=bad, 10=excellent). For investigator analysis, scores of 1 to 4 were classified as “dissatisfied,” scores of 5 to 6 were classified as “satisfied,” and scores of 7 to 10 were classified as “completely satisfied.” A questionnaire evaluating product appreciation was administered at day 60 to participants who completed the study (n=29). Questionnaire items asked participants to rate the study cream’s ease of application, consistency, smell, absorption, and overall satisfaction using ratings of “bad,” “regular,” “good,” “very good,” or “excellent.”
Treatment efficacy in all participants was assessed by the investigators at days 30 and 60. Investigators evaluated reductions in pigmentation and total melasma surface area using ratings of “none,” “regular,” “good,” “very good,” or “excellent.” Local tolerance also was evaluated at both time points, and AEs were recorded and analyzed with respect to their duration, intensity, frequency, and severity.
Targeted hyperpigmented skin was selected for in vivo RCM analysis. At each time point, a sequence of block images was acquired at 4 levels of skin: (1) superficial dermis, (2) suprabasal layer/ dermoepidermal junction, (3) spinous layer, and (4) superficial granular layer. Blind evaluation of these images to assess the reduction in melanin quantity was conducted by a dermatopathologist at baseline and days 30 and 60. Melanin quantity present in each layer was graded according to 4 categories (0%–25%, 25.1%–50%, 50.1%–75%, 75.1%–100%). The mean value was used for statistical evaluation.
Results
Efficacy evaluation
The primary efficacy variable was the mean reduction in MASI score from baseline to the end of treatment (day 60), which was 2.25 ± 1.87 (P<.0001). The reduction in mean MASI score was significant from baseline to day 30 (P<.0001) and from day 30 to day 60 (P<.0001). The least root-mean-square error estimates of MASI score variation at days 30 and 60 were 1.40 and 2.25, respectively.
The mean total melasma surface area (as measured in analysis of clinical photographs using medical imaging software) was significantly reduced from 1398.5 mm2 at baseline to 1116.9 mm2 at day 30 (P<.0001) and 923.4 at day 60 (P<.0001). From baseline to end of treatment, the overall reduction in mean total melasma surface area was 475.1 mm2 (P<.0001)(Figure 2). Clinical and cross-polarized photographs taken at day 60 demonstrated a visible reduction in melasma surface area (Figure 3), which was confirmed using medical imaging software.
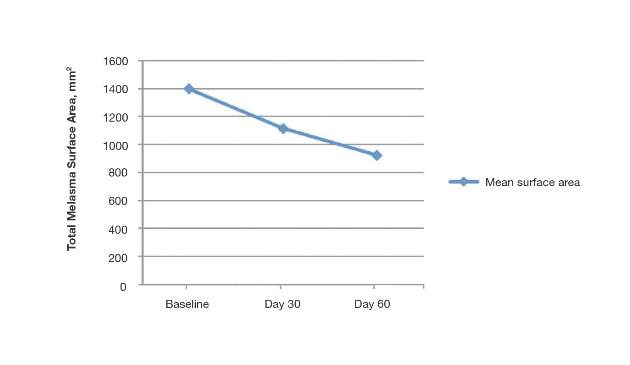

| 
| |
Figure 3. Clinical (A) and cross-polarized (B) photographs of a patient after 60 days of treatment with the novel compound containing nicotinamide 4%, arbutin 3%, bisabolol 1%, and retinaldehyde 0.05%. | ||
In vivo RCM analyses at each time point showed reduction in pigmentation in the 4 levels of the skin that were evaluated, but the results were not statistically significant.
Participant satisfaction
There was strong statistical evidence of patient satisfaction with the treatment results at the end of the study period (P<.0001). At baseline, 75.8% (25/33) of participants were dissatisfied with the appearance of their skin as compared with 15.2% (5/33) at day 60. Additionally, 18.1% (6/33) and 6.1% (2/33) of the participants were satisfied and completely satisfied at baseline compared with 33.3% (11/33) and 51.5% (17/33) at day 60, respectively. Participant satisfaction with signs of facial aging also increased over the study period (P=.0104). At baseline, 60.6% (20/33) were dissatisfied, 12.1% (4/33) were satisfied, and 27.3% (9/33) were completely satisfied; at the end of treatment, 30.3% (10/33) were dissatisfied, 36.4% (12/33) were satisfied, and 33.3% (11/33) were completely satisfied with the improvement in signs of facial aging.
Increased patient satisfaction with facial skin texture at baseline compared to day 60 also was statistically significant (P=.0157). At baseline, 39.4% (13/33) of the participants were dissatisfied, 30.3% (10/33) were satisfied, and 30.3% (10/33) were completely satisfied with facial texture; at day 60, 15.1% (5/33) were dissatisfied, 30.3% (10/33) were satisfied, and 54.6% (18/33) were completely satisfied. Significant improvement from baseline to day 60 also was observed in participant assessment of skin oiliness (P=.0210), brightness (P=.0003), overall appearance (P<.0001), and hydration (P<.0001).
Product appreciation
At day 60, 89.7% (26/29) of the participants who completed the study rated the product’s ease of application as being at least “good,” with more than half of participants (55.2% [16/29]) rating it as “very good” or “excellent.” Overall satisfaction with the product was rated as “very good” or “excellent” by 48.3% (14/29) of the participants. Similar results were observed in participant assessments of consistency, smell, and absorption (Figure 4).

Safety evaluation
A total of 52 AEs were observed in 23 (69.7%) participants, which were recorded by participants in diary entries throughout treatment and evaluated by investigators at each time point. Among these AEs, 48 (92.3%) were considered possibly, probably, or conditionally related to treatment by the investigators based on clinical observation. The most common presumed treatment-related AE was a burning sensation on the skin, reported by 30.3% (10/33) of the participants at day 30 and 13.8% (4/29) at day 60. Of the reported AEs related to treatment, 91.7% (44/48) were of mild intensity and 93.8% (45/48) required no treatment or other action. There were no reported serious AEs related to the investigational product. Blood pressure, heart rate, and weight remained stable among all participants throughout the study.
The intensity of the AEs was described as “light” in 91.7% (44/48) of cases and “moderate” in 8.3% (4/48) of cases. The frequency of AEs was classified as “unique,” “intermittent,” or “continuous” in 45.8% (22/48), 39.6% (19/48), and14.6% (7/48) of cases, respectively. Of the 48 AEs, 3 (6.3%) occurred in 1 participant, necessitating interruption of treatment, application of the topical corticosteroid cream mometasone, and removal from the study.
Comment
Following treatment with the study cream containing nicotinamide 4%, arbutin 3%, bisabolol 1%, and RAL 0.05%, the mean reduction in MASI score (P<.0001) and the mean reduction in total melasma surface area from baseline to end of treatment were statistically significant (P<.0001). The study product was associated with strong statistical evidence of patient satisfaction (P<.0001) regarding improvement in facial skin texture, skin oiliness, brightness, overall appearance, and hydration. Participants also responded favorably to the product and considered it safe and effective. In vivo RCM analysis demonstrated a reduction in the amount of melanin in 4 levels of the skin (superficial dermis, suprabasal layer/dermoepidermal junction, spinous layer, superficial granular layer) following treatment with the study cream; however, over the course of the 60-day treatment period, it did not reveal statistically significant reductions. This finding likely is due to the large ranges used to classify the amount of melanin present in each layer of the skin. These limitations suggest that scales used in future in vivo RCM analyses of melasma should be narrower.
Epidermal melasma is one of the most difficult dermatologic diseases to treat and control. Maintenance of clear, undamaged skin remains a treatment target for all dermatologists. This novel cream formulation containing nicotinamide 4%, arbutin 3%, bisabolol 1%, and RAL 0.05% has proven to be an effective, safe, and tolerable treatment option for patients with epidermal melasma.
1. Grimes PE, Yamada N, Bhawan J. Light microscopic, immunohistochemical, and ultrastructural alterations in patients with melasma. Am J Dermatopathol. 2005;27:96-101.
2. Kang WH, Yoon KH, Lee ES, et al. Melasma: histopathological characteristics in 56 Korean patients. Br J Dermatol. 2002;146:228-237.
3. Cestari T, Arellano I, Hexsel D, et al. Melasma in Latin America: options the therapy and treatment algorithm. JEADV. 2009;23:760-772.
4. Miot LDB, Miot HA, Silva MG, et al. Fisiopatologia do Melasma. An Bras Dermatol. 2009;84:623-635.
5. Draelos Z. Skin lightening preparations and the hydroquinone controversy. Dermatol Ther. 2007;20:308-313.
6. Parvez S, Kang M, Chung HS, et al. Survey and mechanism of skin depigmenting and lightening agents. Phytoter Res. 2006;20:921-934.
7. Kim S, Jung E, Kim JH, et al. Inhibitory effects of (-)-α-bisabolol on LPS-induced inflammatory response in RAW264.7 macrophages. Food Chem Toxicol. 2011;49:2580-2585.
8. Ortonne JP. Retinoid therapy of pigmentary disorders. Dermatol Ther. 2006;19:280-288.
9. Namazi MR. Nicotinamide-containing sunscreens for use in Australasian countries and cancer-provoking conditions. Med Hypotheses. 2003;60:544-545.
10. Ertam I, Mutlu B, Unal I, et al. Efficiency of ellagic acid and arbutin in melasma: a randomized, prospective, open-label study. J Dermatol. 2008;35:570-574.
11. Hori I, Nihei K, Kubo I. Structural criteria for depigmenting mechanism of arbutin. Phytother Res. 2004;18:475-469.
12. Ethnic skin and pigmentation. In: Draelos ZD. Cosmetics and Dermatologic Problems and Solutions. 3rd ed. Boca Raton, FL: CRC Press; 2011:52-55.
13. Kasraee B, Tran C, Sorg O, et al. The depigmenting effect of RALGA in C57BL/6 mice. Dermatology. 2005;210(suppl 1):30-34.
Epidermal melasma is a common hyperpigmentation disorder that can be challenging to treat. The pathogenesis of melasma is not fully understood but has been associated with increased melanin and melanocyte activity.1,2 Melasma is characterized by jagged, light- to dark-brown patches on areas of the skin most often exposed to the sun—primarily the cheeks, forehead, upper lip, nose, and chin.3 Although it can affect both sexes and all races, melasma is more common in Fitzpatrick skin types II to IV and frequently is seen in Asian or Hispanic women residing in geographic locations with high levels of sun exposure (eg, tropical areas).2 Melasma presents more frequently in adult women of childbearing age, especially during pregnancy, but also can begin postmenopause. Onset may occur as early as menarche but typically is observed between the ages of 30 and 55 years.3,4 Only 10% of melasma cases are known to occur in males4 and are influenced by such factors as ethnicity, hormones, and level of sun exposure.2
Topical therapies for melasma attempt to inhibit melanocytic activation at each level of melanin formation until the deposited pigment is removed; however, results may vary greatly, as melasma often recurs due to the migration of new melanocytes from hair follicles to the skin’s surface, leading to new development of hyperpigmentation. The current standard of treatment for melasma involves the use of hydroquinone and other bleaching agents, but long-term use of these treatments has been associated with concerns regarding unstable preparations (which may lose their therapeutic properties) and adverse effects (eg, ochronosis, depigmentation).5 Cosmetic agents that recently have been evaluated for melasma treatment include nicotinamide (a form of vitamin B3), which inhibits the transfer of melanosomes from melanocytes to keratinocytes; arbutin, which inhibits melanin synthesis by inhibiting tyrosinase activity6; bisabolol, which prevents anti-inflammatory activity7; and retinaldehyde (RAL), a precursor of retinoic acid (RA) that has powerful bleaching action and low levels of cutaneous irritability.8
This prospective, single-arm, open-label study, evaluated the efficacy and safety of a novel cream formulation containing nicotinamide 4%, arbutin 3%, bisabolol 1%, and retinaldehyde 0.05% in the treatment of epidermal melasma.
Study Product Ingredients and Background
Nicotinamide
Nicotinamide is a water-soluble amide of nicotinic acid (niacin) and one of the 2 principal forms of vitamin B3. It is a component of the coenzymes nicotinamide adenine dinucleotide and nicotinamide adenine dinucleotide phosphate. Nicotinamide essentially acts as an antioxidant, with most of its effects exerted through poly(adenosine diphosphate–ribose) polymerase inhibition. Interest has increased in the role of nicotinamide in the prevention and treatment of several skin diseases, such as acne and UV radiation–induced deleterious molecular and immunological events. Nicotinamide also has gained consideration as a potential agent in sunscreen preparations due to its possible skin-lightening effects, stimulation of DNA repair, suppression of UV photocarcinogenesis, and other antiaging effects.9
Arbutin
Arbutin is a molecule that has proven effective in treating melasma.10 Its pigment-lightening ingredients include botanicals that are structurally similar to hydroquinone. Arbutin is obtained from the leaves of the bearberry plant but also is found in lesser quantities in cranberry and blueberry leaves. A naturally occurring gluconopyranoside, arbutin reduces tyrosinase activity without affecting messenger RNA expression.11 Arbutin also inhibits melanosome maturation, is nontoxic to melanocytes, and is used in Japan in a variety of pigment-lightening preparations at 3% concentrations.12
Bisabolol
Bisabolol is a natural monocyclic sesquiterpene alcohol found in the oils of chamomile and other plants. Bisabolol often is included in cosmetics due to its favorable anti-inflammatory and depigmentation properties. Its downregulation of inducible nitric oxide synthase and cyclooxygenase-2 suggests that it may have anti-inflammatory effects.7
Retinaldehyde
Retinaldehyde is an RA precursor that forms as an intermediate metabolite in the transformation of retinol to RA in human keratinocytes. Topical RAL is well tolerated by human skin, and several of its biologic effects are identical to those of RA. Using the tails of C57BL/6 mouse models, RAL 0.05% has been found to have significantly more potent depigmenting effects than RA 0.05% (P<.001 vs P<.01, respectively) when compared to vehicle.13
Although combination therapy with RAL and arbutin could potentially cause skin irritation, the addition of bisabolol to the combination cream used in this study is believed to have conferred anti-inflammatory properties because it inhibits the release of histamine and relieves irritation.
Methods
This single-center, single-arm, prospective, open-label study evaluated the efficacy and safety of a novel cream formulation containing nicotinamide 4%, arbutin 3%, bisabolol 1%, and RAL 0.05% in treating epidermal melasma. Clinical evaluation included assessment of Melasma Area and Severity Index (MASI) score, photographic analysis, and in vivo reflectance confocal microscopy (RCM) analysis.
The study population included women aged 18 to 50 years with Fitzpatrick skin types I through V who had clinically diagnosed epidermal melasma on the face. Eligibility requirements included confirmation of epidermal pigmentation on Wood lamp examination and RCM analysis and a MASI score of less than 10.5. A total of 35 participants were enrolled in the study (intention to treat [ITT] population). Thirty-three participants were included in the analysis of treatment effectiveness (ITTe population), as 2 were excluded due to lack of follow-up postbaseline. Four participants were prematurely withdrawn from the study—3 due to loss to follow-up and 1 due to treatment discontinuation following an adverse event (AE). The last observation carried forward method was used to input missing data from these 4 participants excluding repeated measure analysis that used the generalized estimated equation method.
At baseline, a 25-g tube of the study cream containing nicotinamide 4%, arbutin 3%, bisabolol 1%, and RAL 0.05% was distributed to all participants for once-daily application to the entire face for 30 days. Participants were instructed to apply the product in the evening after using a gentle cleanser, which also was to be used in the morning to remove the product residue. Additionally, participants were given a sunscreen with a sun protection factor of 30 to apply daily on the entire face in the morning, after lunch, and midafternoon. During the 30-day treatment period, treatment interruption of up to 5 consecutive days or 10 nonconsecutive days in total was permitted. At day 30, participants received another 30-day supply of the study product and sunscreen to be applied according to the same regimen for an additional 30-day treatment period.
Clinical Evaluation
At baseline, demographic data and medical history was recorded for all participants and dermatologic and physical examination was performed documenting weight, height, blood pressure, heart rate, and baseline MASI score. Following Wood lamp examination, participants’ faces were photographed and catalogued using medical imaging software that allowed for measurement of the total melasma surface area (Figure 1A). The photographs also were cross-polarized for further analysis of the pigmentation (Figure 1B).
|
|
| |
Figure 1. Clinical (A) and cross-polarized (B) photographs of a patient before treatment with the novel compound containing nicotinamide 4%, arbutin 3%, bisabolol 1%, and retinaldehyde 0.05%. | ||
A questionnaire evaluating treatment satisfaction was administered to participants (ITTe population [n=33]) at baseline and days 30 and 60. Questionnaire items pertained to skin blemishes, signs of facial aging, overall appearance, texture, oiliness, brightness, and hydration. Participants were instructed to rate their satisfaction for each item on a scale of 1 to 10 (1=bad, 10=excellent). For investigator analysis, scores of 1 to 4 were classified as “dissatisfied,” scores of 5 to 6 were classified as “satisfied,” and scores of 7 to 10 were classified as “completely satisfied.” A questionnaire evaluating product appreciation was administered at day 60 to participants who completed the study (n=29). Questionnaire items asked participants to rate the study cream’s ease of application, consistency, smell, absorption, and overall satisfaction using ratings of “bad,” “regular,” “good,” “very good,” or “excellent.”
Treatment efficacy in all participants was assessed by the investigators at days 30 and 60. Investigators evaluated reductions in pigmentation and total melasma surface area using ratings of “none,” “regular,” “good,” “very good,” or “excellent.” Local tolerance also was evaluated at both time points, and AEs were recorded and analyzed with respect to their duration, intensity, frequency, and severity.
Targeted hyperpigmented skin was selected for in vivo RCM analysis. At each time point, a sequence of block images was acquired at 4 levels of skin: (1) superficial dermis, (2) suprabasal layer/ dermoepidermal junction, (3) spinous layer, and (4) superficial granular layer. Blind evaluation of these images to assess the reduction in melanin quantity was conducted by a dermatopathologist at baseline and days 30 and 60. Melanin quantity present in each layer was graded according to 4 categories (0%–25%, 25.1%–50%, 50.1%–75%, 75.1%–100%). The mean value was used for statistical evaluation.
Results
Efficacy evaluation
The primary efficacy variable was the mean reduction in MASI score from baseline to the end of treatment (day 60), which was 2.25 ± 1.87 (P<.0001). The reduction in mean MASI score was significant from baseline to day 30 (P<.0001) and from day 30 to day 60 (P<.0001). The least root-mean-square error estimates of MASI score variation at days 30 and 60 were 1.40 and 2.25, respectively.
The mean total melasma surface area (as measured in analysis of clinical photographs using medical imaging software) was significantly reduced from 1398.5 mm2 at baseline to 1116.9 mm2 at day 30 (P<.0001) and 923.4 at day 60 (P<.0001). From baseline to end of treatment, the overall reduction in mean total melasma surface area was 475.1 mm2 (P<.0001)(Figure 2). Clinical and cross-polarized photographs taken at day 60 demonstrated a visible reduction in melasma surface area (Figure 3), which was confirmed using medical imaging software.
|
|
| |
Figure 3. Clinical (A) and cross-polarized (B) photographs of a patient after 60 days of treatment with the novel compound containing nicotinamide 4%, arbutin 3%, bisabolol 1%, and retinaldehyde 0.05%. | ||
In vivo RCM analyses at each time point showed reduction in pigmentation in the 4 levels of the skin that were evaluated, but the results were not statistically significant.
Participant satisfaction
There was strong statistical evidence of patient satisfaction with the treatment results at the end of the study period (P<.0001). At baseline, 75.8% (25/33) of participants were dissatisfied with the appearance of their skin as compared with 15.2% (5/33) at day 60. Additionally, 18.1% (6/33) and 6.1% (2/33) of the participants were satisfied and completely satisfied at baseline compared with 33.3% (11/33) and 51.5% (17/33) at day 60, respectively. Participant satisfaction with signs of facial aging also increased over the study period (P=.0104). At baseline, 60.6% (20/33) were dissatisfied, 12.1% (4/33) were satisfied, and 27.3% (9/33) were completely satisfied; at the end of treatment, 30.3% (10/33) were dissatisfied, 36.4% (12/33) were satisfied, and 33.3% (11/33) were completely satisfied with the improvement in signs of facial aging.
Increased patient satisfaction with facial skin texture at baseline compared to day 60 also was statistically significant (P=.0157). At baseline, 39.4% (13/33) of the participants were dissatisfied, 30.3% (10/33) were satisfied, and 30.3% (10/33) were completely satisfied with facial texture; at day 60, 15.1% (5/33) were dissatisfied, 30.3% (10/33) were satisfied, and 54.6% (18/33) were completely satisfied. Significant improvement from baseline to day 60 also was observed in participant assessment of skin oiliness (P=.0210), brightness (P=.0003), overall appearance (P<.0001), and hydration (P<.0001).
Product appreciation
At day 60, 89.7% (26/29) of the participants who completed the study rated the product’s ease of application as being at least “good,” with more than half of participants (55.2% [16/29]) rating it as “very good” or “excellent.” Overall satisfaction with the product was rated as “very good” or “excellent” by 48.3% (14/29) of the participants. Similar results were observed in participant assessments of consistency, smell, and absorption (Figure 4).
Safety evaluation
A total of 52 AEs were observed in 23 (69.7%) participants, which were recorded by participants in diary entries throughout treatment and evaluated by investigators at each time point. Among these AEs, 48 (92.3%) were considered possibly, probably, or conditionally related to treatment by the investigators based on clinical observation. The most common presumed treatment-related AE was a burning sensation on the skin, reported by 30.3% (10/33) of the participants at day 30 and 13.8% (4/29) at day 60. Of the reported AEs related to treatment, 91.7% (44/48) were of mild intensity and 93.8% (45/48) required no treatment or other action. There were no reported serious AEs related to the investigational product. Blood pressure, heart rate, and weight remained stable among all participants throughout the study.
The intensity of the AEs was described as “light” in 91.7% (44/48) of cases and “moderate” in 8.3% (4/48) of cases. The frequency of AEs was classified as “unique,” “intermittent,” or “continuous” in 45.8% (22/48), 39.6% (19/48), and14.6% (7/48) of cases, respectively. Of the 48 AEs, 3 (6.3%) occurred in 1 participant, necessitating interruption of treatment, application of the topical corticosteroid cream mometasone, and removal from the study.
Comment
Following treatment with the study cream containing nicotinamide 4%, arbutin 3%, bisabolol 1%, and RAL 0.05%, the mean reduction in MASI score (P<.0001) and the mean reduction in total melasma surface area from baseline to end of treatment were statistically significant (P<.0001). The study product was associated with strong statistical evidence of patient satisfaction (P<.0001) regarding improvement in facial skin texture, skin oiliness, brightness, overall appearance, and hydration. Participants also responded favorably to the product and considered it safe and effective. In vivo RCM analysis demonstrated a reduction in the amount of melanin in 4 levels of the skin (superficial dermis, suprabasal layer/dermoepidermal junction, spinous layer, superficial granular layer) following treatment with the study cream; however, over the course of the 60-day treatment period, it did not reveal statistically significant reductions. This finding likely is due to the large ranges used to classify the amount of melanin present in each layer of the skin. These limitations suggest that scales used in future in vivo RCM analyses of melasma should be narrower.
Epidermal melasma is one of the most difficult dermatologic diseases to treat and control. Maintenance of clear, undamaged skin remains a treatment target for all dermatologists. This novel cream formulation containing nicotinamide 4%, arbutin 3%, bisabolol 1%, and RAL 0.05% has proven to be an effective, safe, and tolerable treatment option for patients with epidermal melasma.
1. Grimes PE, Yamada N, Bhawan J. Light microscopic, immunohistochemical, and ultrastructural alterations in patients with melasma. Am J Dermatopathol. 2005;27:96-101.
2. Kang WH, Yoon KH, Lee ES, et al. Melasma: histopathological characteristics in 56 Korean patients. Br J Dermatol. 2002;146:228-237.
3. Cestari T, Arellano I, Hexsel D, et al. Melasma in Latin America: options the therapy and treatment algorithm. JEADV. 2009;23:760-772.
4. Miot LDB, Miot HA, Silva MG, et al. Fisiopatologia do Melasma. An Bras Dermatol. 2009;84:623-635.
5. Draelos Z. Skin lightening preparations and the hydroquinone controversy. Dermatol Ther. 2007;20:308-313.
6. Parvez S, Kang M, Chung HS, et al. Survey and mechanism of skin depigmenting and lightening agents. Phytoter Res. 2006;20:921-934.
7. Kim S, Jung E, Kim JH, et al. Inhibitory effects of (-)-α-bisabolol on LPS-induced inflammatory response in RAW264.7 macrophages. Food Chem Toxicol. 2011;49:2580-2585.
8. Ortonne JP. Retinoid therapy of pigmentary disorders. Dermatol Ther. 2006;19:280-288.
9. Namazi MR. Nicotinamide-containing sunscreens for use in Australasian countries and cancer-provoking conditions. Med Hypotheses. 2003;60:544-545.
10. Ertam I, Mutlu B, Unal I, et al. Efficiency of ellagic acid and arbutin in melasma: a randomized, prospective, open-label study. J Dermatol. 2008;35:570-574.
11. Hori I, Nihei K, Kubo I. Structural criteria for depigmenting mechanism of arbutin. Phytother Res. 2004;18:475-469.
12. Ethnic skin and pigmentation. In: Draelos ZD. Cosmetics and Dermatologic Problems and Solutions. 3rd ed. Boca Raton, FL: CRC Press; 2011:52-55.
13. Kasraee B, Tran C, Sorg O, et al. The depigmenting effect of RALGA in C57BL/6 mice. Dermatology. 2005;210(suppl 1):30-34.
Practice Points
- Epidermal melasma is a common hyperpigmentation disorder characterized by the appearance of abnormal melanin deposits in different layers of the skin.
- Melasma can be difficult to treat and often recurs due to the migration of new melanocytes from hair follicles to the skin’s surface.
- A novel cream formulation containing nicotinamide 4%, arbutin 3%, bisabolol 1%, and retinaldehyde 0.05% offers a safe and effective option for treatment of epidermal melasma.

Evaluation of Clonidine and Prazosin for the Treatment of Nighttime Posttraumatic Stress Disorder Symptoms
Posttraumatic stress disorder (PTSD) remains a significant health concern in veterans and military personnel. Whereas the lifetime incidence of PTSD in the U.S. general population is about 7% to 8%, the estimated prevalence of PTSD in deployed U.S. military personnel is higher than the national average, ranging from 11% to 17%.1,2 These numbers may be even higher, depending on the branch of service, responsibilities within the military, and specific conflict in which the veteran served. For example, one study found that 31% of Vietnam veterans have PTSD, and another recent study has reported PTSD in 28.7% of veterans returning from military service in Iraq and Afghanistan.3,4
Posttraumatic stress disorder treatment guidelines from both the American Psychiatric Association and the VA and DoD recommend the use of selective serotonin reuptake inhibitors (SSRIs) or serotonin-norepinephrine reuptake inhibitors (SNRIs) as first-line pharmacotherapy for PTSD.5,6 However, SSRIs and SNRIs seem to be largely ineffective for the management of nighttime PTSD symptoms, such as insomnia and nightmares.7,8
Related: PTSD Increases Chance of Heart Failure
Researchers hypothesize that the sympathetic nervous system plays a significant role in the hyperarousal component of nighttime PTSD. The heightened responsiveness and disruption in restorative sleep seen in PTSD have been attributed to increased activity of norepinephrine in the central nervous system.9 Mechanistically, therapies that attenuate the increased noradrenergic signaling might be effective in the management of nighttime PTSD symptoms.
The body of evidence for the use of adrenergic agents for nighttime PTSD symptoms is growing. Prazosin, a peripherally acting α1-adrenergic receptor antagonist, has recently been demonstrated to be effective for nighttime PTSD symptoms in veterans in a series of small, randomized controlled trials.10-12 Data to support the use of clonidine, a centrally acting α2-adrenergic receptor agonist, are generally limited, with the most compelling data coming from a population of civilian Cambodian refugees.13,14 A 2007 article by Boehnlein and Kinzie includes a thorough review of the preclinical research, case reports, and early clinical studies that have led to the widespread use of these agents for PTSD despite the lack of FDA approval for this indication.13A previous retrospective review by Byers and colleagues compared the effectiveness and tolerability of prazosin and quetiapine for nighttime PTSD symptoms in veterans.15 The results of that review suggest that α1-adrenergic agents may be equally effective and better tolerated than alternative medication options (ie, atypical antipsychotics) for this purpose. The present study was adapted from this design to report concurrently on the real-world use of clonidine and prazosin for the treatment of nighttime PTSD symptoms.
Study Objectives
The primary objective of this retrospective chart review was to describe the experience of patients prescribed clonidine or prazosin for the treatment of nighttime PTSD symptoms, including initial effectiveness. The primary endpoint of initial drug effectiveness was documented improvement of nighttime PTSD symptoms in the patient’s chart within 6 months of the date of first prescription. Clonidine or prazosin was categorized as initially effective if a statement such as “frequency of nightmares decreased” or “patient’s nighttime PTSD symptoms have improved” was made within 6 months after initial prescription of the drug.
The secondary objectives of this study were to evaluate the long-term effectiveness and tolerability of prazosin. The endpoints used to assess these outcomes were the 2-year continuation rates of clonidine and prazosin (as a surrogate marker for long-term effectiveness) and the documented reasons for discontinuation of clonidine and prazosin for the treatment of nighttime PTSD symptoms (in order to assess tolerability).
Methods
An electronic database search was conducted to identify the VA Portland Health Care System (VAPHCS) patients with a diagnosis of PTSD who received a first prescription for clonidine or prazosin for nighttime PTSD symptoms from a VAPHCS mental health provider or primary care provider (PCP) from January 1, 2009, to December 31, 2011. Patients were excluded if they had any history of prior use of the drug being initiated, were co-initiated on both clonidine and prazosin (defined as starting the drugs within 30 days of each other), or had a concomitant diagnosis of schizophrenia, bipolar disorder, psychotic disorder, or cognitive disorder as defined in the Diagnostic and Statistical Manual of Mental Disorders, 5th Edition. Patients with traumatic brain injury (TBI) were excluded only if it could be determined that the event had resulted in lasting cognitive impairment.
Study Population
All patients with a diagnosis of PTSD who received a first prescription for clonidine during the period specified were screened for inclusion; patients with PTSD who were first prescribed prazosin during the same period were randomly sampled to equalize patient populations. This was done to maximize the data set while examining groups of roughly equal size for each drug, as prazosin is used much more commonly than clonidine for nighttime PTSD symptoms at VAPHCS. The patients in each resulting group were screened to determine whether they met inclusion and exclusion criteria. All subjects included were followed for 2 years from the date of the initial prescription.
Study Design
Initial effectiveness of each agent was determined by reviewing subjects’ progress notes after the initial prescription of clonidine or prazosin for documentation of improvement in symptoms within 6 months of the prescription start date. A decrease in frequency or intensity of nighttime PTSD symptoms, nightmares, or insomnia, as documented in the patient chart, was interpreted as improvement of symptoms.
Long-term continuation was assessed by reviewing subjects’ prescription records, to determine whether prescription(s) for clonidine or prazosin continued for 2 years after the date of the initial prescription.
Any gap between medication fills that resulted in an anticipated period without medication of ≥ 6 months (eg, 9 months after receiving a 90-day supply) was considered discontinuation of therapy. Prescription refill history was also reviewed, and medication possession ratio (MPR) was calculated to assess whether patients were adherent to the study drug as prescribed. Adherence was defined as an MPR of ≥ 80%. Patients who left the VAPHCS service area but continued to receive care at another VA were assessed for continuation of therapy, but refill data and/or MPR were not assessed.
Tolerability was assessed by reviewing subjects’ medical records to determine whether therapy with clonidine or prazosin was discontinued due to documented adverse effects (AEs). The occurrence of AEs was determined by reviewing progress notes and other chart documentation surrounding the date of discontinuation. If the drug was discontinued but the reason was not explicitly documented or if the prescription expired without a documented reason for nonrenewing, the reason for discontinuation was coded as “not specified.” Discontinuation due to treatment failure, change in symptoms, nonadherence, or other causes was also recorded. If multiple reasons for discontinuation were cited for a single patient, all were included in the data. This project was approved by the institutional review board at the VAPHCS.
Related:Depression and Substance Abuse Intensify Suicide Risk
Statistical Considerations
Based on clinical experience, it was presumed that many of the patients who were prescribed clonidine would be receiving it as a second-line therapy after failing prazosin. Therefore, statistical analysis of the relative effectiveness and tolerability of clonidine and prazosin could not be performed. Neither power nor sample size needed to demonstrate any difference in effectiveness or tolerability between the groups was calculated. All results are expressed using descriptive statistics.
Results
An initial database search for patients with PTSD who received a first prescription for clonidine between January 1, 2009, and December 31, 2011, from a VAPHCS provider yielded a list of 149 patients. The same search criteria applied for prazosin yielded 1,116 patients, 149 of whom were randomly selected for screening. After screening, 42 patients on clonidine and 60 patients on prazosin were included in this analysis (Figure).

Patient Demographics
The average age of the clonidine patients was 38.5 years (range 21-65 years) (Table 1). The clonidine group was primarily male (90%) and white (83%). Eighteen of the 42 patients in the clonidine group had a baseline PTSD Checklist-Civilian version (PCL-C) score available within the 90 days before the first prescription of clonidine; the average baseline PCL-C score in this subgroup was 62 ± 12.0 (median 65.5, range 31-82). Most of the clonidine patients (71%) had a concomitant diagnosis of a depressive disorder. About one-quarter of the group (24%) had previously tried prazosin per prescription records. In 24 patients (57%), the first prescription for clonidine was written by a psychiatrist or psychiatric nurse practitioner; 18 patients (43%) were started on clonidine by PCPs.
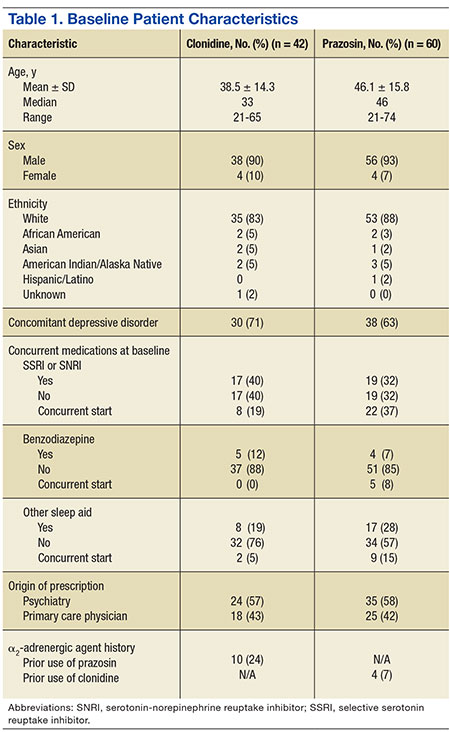
The average age of the prazosin patients was 46.1 years (range 21-74 years). The prazosin group was also primarily male (93%) and white (88%). Twenty of the 60 patients in the prazosin group had a baseline PCL-C score available within the 90 days before the first prescription of prazosin; the average baseline PCL-C score in this subgroup was 55 ± 16.1 (median 64, range 30-72). Most of the prazosin patients (63%) had a concomitant diagnosis of a depressive disorder. Four patients (7%) had previously tried clonidine per prescription records. In 35 patients (58%), the first prescription for prazosin was written by a psychiatrist or psychiatric nurse practitioner; 25 patients (42%) were started on prazosin by PCPs.
Data pertaining to initial and long-term effectiveness, tolerability, and MPR for both clonidine and prazosin are presented in Table 2.
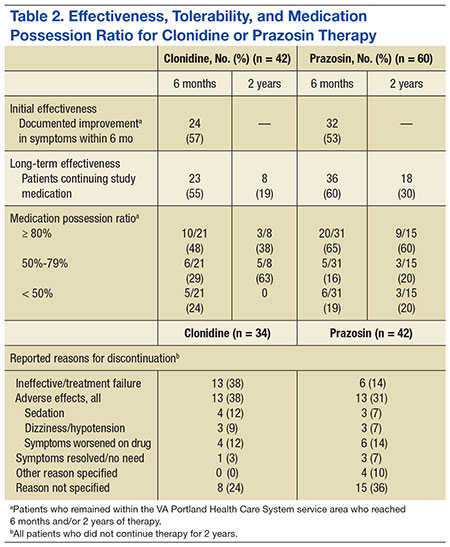
Clonidine
Of the 42 clonidine patients assessed, 24 (57%) had a positive response to the medication for nighttime PTSD symptoms documented in the Computerized Patient Record System (CPRS) within 6 months of starting therapy. Six months after starting clonidine, 23 patients (55%) continued to take clonidine. Two years after starting therapy, 8 of the original 42 patients continued on clonidine for an overall 2-year continuation rate of 19%.
Tolerability
Of the 34 patients who discontinued clonidine within 2 years, 13 patients (38%) cited ineffectiveness of therapy as a reason for discontinuation. Another 13 patients (38%) reported discontinuing therapy due to AEs. Sedation (4 patients, 12%), dizziness/hypotension (3 patients, 9%), and paradoxical worsening of PTSD symptoms (4 patients, 12%) were the most common AEs leading to discontinuation. Other AEs cited as reasons for discontinuation were syncope (2 patients), erectile dysfunction (1 patient), rash (1 patient), myoclonus (1 patient), increased depression (1 patient), and fatigue (1 patient). One patient reported that he had discontinued clonidine due to symptom resolution/lack of need for treatment. In 8 of the 34 patients, no reason for discontinuation was found in chart documentation.
Medication Possession Ratio
Among the 21 evaluable patients who continued to receive clonidine 6 months after initiation, 10 (48%) were determined to be highly adherent to therapy, with an MPR of ≥ 80%. Six of the 21 patients (29%) had an MPR between 50% and 79%, and 5 patients (24%) had an MPR < 50%.
Of the 8 patients who continued on clonidine at the 2-year mark, 3 (38%) were adherent to therapy, with an MPR of ≥ 80%. Three more patients (38%) had a 2-year MPR between 50% and 80%, and 2 patients (25%) had an MPR < 50%.
Prazosin
Of the 60 prazosin patients assessed, 32 (53%) had a positive response to the medication for nighttime PTSD symptoms documented in the CPRS within 6 months of starting therapy. Six months after starting prazosin, 36 patients (60%) continued to take prazosin. Two years after starting therapy, 18 of the original 60 patients continued on prazosin for an overall 2-year continuation rate of 30%.
Tolerability
Of the 42 patients who discontinued prazosin within 2 years, six patients (14%) cited ineffectiveness of therapy as a reason for discontinuation. Thirteen patients (31%) reported discontinuing therapy due to AEs. Sedation (3 patients, 7%), dizziness/hypotension (3 patients, 7%), and paradoxical worsening of PTSD symptoms (6 patients, 14%) were the most common AEs leading to discontinuation. Other AEs cited as reasons for discontinuation were headache (2 patients), altered mental status (1 patient), and fatigue (1 patient). Three patients reported that they had discontinued clonidine due to symptom resolution/lack of need for treatment. Other reasons for discontinuation not related to AEs included flight rules (1 patient), changes to antihypertensive regimen (1 patient), refill issues (1 patient), and cost (1 patient). In 15 of the 42 patients, no reason for discontinuation was found in chart documentation.
Medication Possession Ratio
Among the 31 evaluable patients who continued to receive prazosin 6 months after initiation, 20 (65%) were determined to be highly adherent to therapy, with an MPR of ≥ 80%. Five of the 31 patients (16%) had an MPR between 50% and 80%, and 6 patients (19%) had an MPR < 50%.
Of the 15 evaluable patients who continued on prazosin at the 2-year mark, 9 (60%) were adherent to therapy, with an MPR of ≥ 80%. Three patients (20%) had a 2-year MPR between 50% and 80%, and 3 patients (20%) had an MPR < 50%.
Discussion
Although prazosin has been shown to be effective for nighttime PTSD symptoms in both prospective and retrospective evaluations in veterans, this study provides the first evidence to support the use of clonidine in a veteran population.10-12,15
Interestingly, 42% of the patients assessed received their first prescription of an α2-adrenergic agent for nighttime PTSD symptoms from a PCP. Even with the recent increased focus on integrating mental health into primary care within the VA, this was a surprising finding. Primary care providers at VAPHCS may have a greater role in the outpatient management of PTSD than previously suspected. The information presented here may prove useful and applicable in both psychiatric and primary care treatment settings.
The study results indicated that a majority of subjects initially reported effectiveness with either clonidine or prazosin (53% and 57%, respectively). The initial effectiveness rate for prazosin is similar to those described in previous studies.10-13,15 The data also support a viable role for clonidine in the treatment of nighttime PTSD symptoms.
Regardless of initial improvement, the study results also suggest that the therapeutic benefit may not persist in the long term, as evidenced by a significant percentage of discontinuations attributed to ineffectiveness (38% for clonidine and 14% for prazosin) and a very low rate of long-term continuation (19% for clonidine and 30% for prazosin at 2 years). This latter observation contrasts with findings from previous studies; Byers and colleagues reported a 2-year prazosin continuation rate of 48.4% in a similar analysis, and Boehnlein and colleagues reported a sustained benefit of clonidine in responders over a 10-year period.14,15 The wide variety of reasons for discontinuation reported here may help providers who are considering clonidine or prazosin for their patients to anticipate barriers to long-term success.
Part of the discrepancy between these results and previously reported successes with clonidine and prazosin may be attributable to the classic issue of efficacy vs effectiveness. Many of the studies that have informed us on the efficacy and tolerability of prazosin for nighttime PTSD symptoms described outcomes of prospective clinical research. Furthermore, these prospective trials were limited to < 6 months in duration. To date, neither clonidine nor prazosin has been evaluated for long-term efficacy and effectiveness in well-designed, prospective trials. This retrospective analysis may help provide a realistic estimate of the long-term effectiveness of these therapies, especially within the veteran population.
Limitations
This was a single-center, retrospective study conducted primarily in white male patients. Although likely applicable to the U.S. veteran population at large, these data may be poorly generalizable to patient populations outside the VA health care system.
Aside from external validity, this study has several significant limitations. The primary limitation of this project is that it was not designed to allow for statistical comparison of clonidine and prazosin. Such an analysis would have better defined the role of clonidine in PTSD treatment, either by establishing similar effectiveness of clonidine and prazosin for nighttime symptoms or by providing evidence of the superiority of one over the other. In designing the project, investigators suspected based on experience that the majority of patients prescribed clonidine would receive the drug after having already failed first-line therapy with prazosin. Had this been the case, a direct comparison may have been biased in favor of prazosin. In retrospect, however, only 24% of the clonidine group had previously been prescribed prazosin, and only 7% of the prazosin group had been prescribed clonidine. This suggests that clonidine may be used first line more often than the investigators anticipated and that a future direct comparison would be worthwhile.
Second, the subjective data collected for this project required investigators to read and interpret chart notes, although the review of all records by a single investigator helped limit variability in interpretation. At times, information in the CPRS was incomplete in terms of determining continuation of therapy or cause for discontinuation.
Third, although it is implied that a significant number of veterans have combat-related PTSD, the nature of the traumatic event(s) leading to PTSD was not recorded in this study, and no subgroup analysis was done to compare the effect of α2-adrenergic agents between combat- and noncombat-related PTSD. Owing to their exclusion by design, it is also difficult to apply these results to veterans who have lasting cognitive impairment as a result of TBI, who are presumably among those most likely to have experienced traumas that could provoke PTSD.
The design of this project also did not include a subgroup analysis based on antidepressant type, and it is unclear whether the potential pharmacodynamic interaction between noradrenergic antidepressants (ie, SNRIs) and anti– α2-adrenergic agents had any impact on clinical outcomes. The use of complementary nonpharmacologic treatment modalities (ie, psychotherapy, eye movement desensitization and reprocessing) was also not evaluated.
Related: Female Service Members in the Long War
Finally, the primary outcome of patient-reported improvement in symptoms does not provide information on the magnitude or specific nature of benefits derived. Given the retrospective nature, data used in prospectively designed studies (eg, rating scales pertinent to PTSD), which might have helped to quantify the benefit of treatment, was not consistently available. Even a baseline PCL-C score, collected in order to describe the patient population, was available only in 37% of the patients assessed. Furthermore, nighttime PTSD symptoms vary among individuals, but the primary outcome of this study pools any benefits seen in areas such as nightmares, awakenings, night sweats, or sleep quality into a single outcome of symptom improvement.
Conclusions
This study indicates that both clonidine and prazosin may be effective for the treatment of nighttime PTSD symptoms in the veteran population but that their long-term utility may be limited by waning effectiveness, tolerability, and adherence issues. At this time, it is unclear whether either agent has an advantage over the other in terms of effectiveness or tolerability; further studies are needed to address that question.
Despite its limitations, the authors anticipate that this study will provide information regarding the effectiveness and tolerability of clonidine and prazosin to treat nighttime PTSD symptoms. Findings from this study may help clinicians to anticipate the needs and challenges of patients using β2-adrenergic agents for nighttime symptoms of PTSD.
Acknowledgements
The authors wish to acknowledge Brian Wilcox, PharmD, for his assistance in generating patient data reports, and Ronald Brown, RPh, MS, for his guidance regarding data analysis.
Author disclosures
The authors report no actual or potential conflicts of interest with regard to this article.
Disclaimer
The opinions expressed herein are those of the authors and do not necessarily reflect those of Federal Practitioner, Frontline Medical Communications Inc., the U.S. Government, or any of its agencies. This article may discuss unlabeled or investigational use of certain drugs. Please review the complete prescribing information for specific drugs or drug combinations—including indications, contraindications, warnings, and adverse effects—before administering pharmacologic therapy to patients.
1. Hoge CW, Castro CA, Messer SC, McGurk D, Cotting DI, Koffman RL. Combat duty in Iraq and Afghanistan, mental problems, and barriers to care. N Engl J Med. 2004;351(1):13-22.
2. Gates MA, Holowka DW, Vasterling JJ, Keane TM, Marx BP, Rosen RC. Posttraumatic stress disorder in veterans and military personnel: epidemiology, screening, and case recognition. Psychol Serv. 2012;9(4):361-382.
3. Kulka R, Schlenger WE, Fairbanks J, et al. Trauma and the Vietnam War Generation: Report of Findings From the National Vietnam Veterans Readjustment Study. New York, NY: Brunnel/Mazel; 1990.
4. Barrera TL, Graham DP, Dunn NJ, Teng EJ. Influence of trauma history on panic and posttraumatic stress disorder in returning veterans. Psychol Serv. 2013;10(2):168-176.
5. American Psychiatric Association. Practice Guideline for the Treatment of Patients With Acute Stress Disorder and Posttraumatic Stress Disorder. Arlington, VA: American Psychiatric Association; 2004.
6. U.S. Department of Veterans Affairs, Department of Defense. VA/DoD clinical practice guideline for management of post-traumatic stress. Version 2.0. U.S. Department of Veterans Affairs Website. http://www.healthquality.va.gov/guidelines/MH/ptsd/cpgPTSDFULL201011612c.pdf. Published October 2010. Accessed October 5, 2015.
7. Berger W, Mendlowicz MV, Marques-Portella C, et al. Pharmacologic alternatives to antidepressants in posttraumatic stress disorder: a systematic review. Prog Neuropsychopharmacol Biol Psychiatry. 2009;33(2):169-180.
8. Ravindran LN, Stein MB. Pharmacotherapy of post-traumatic stress disorder. In: Stein MB, Steckler T, eds. Behavioral Neurobiology of Anxiety and Its Treatment. Vol 2. Heidelberg, Germany: Springer; 2010:505-525.
9. Spoormaker VI, Montgomery P. Disturbed sleep in post-traumatic stress disorder: secondary symptom or core feature? Sleep Med Rev. 2008;12(3):169-184.
10. Raskind MA, Peskind ER, Kanter ED, et al. Reduction of nightmares and other PTSD symptoms in combat veterans by prazosin: a placebo controlled study. Am J Psychiatry. 2003;160(2):371-373.
11. Raskind MA, Peskind ER, Hoff DJ, et al. A parallel group placebo controlled study of prazosin for trauma nightmares and sleep disturbance in combat veterans with post-traumatic stress disorder. Biol Psychiatry. 2007;61(8):928-934.
12. Raskind MA, Peterson K, Williams T, et al. A trial of prazosin for combat trauma PTSD with nightmares in active-duty soldiers returned from Iraq and Afghanistan. Am J Psychiatry. 2013;170:1003-1010.
13. Boehnlein JK, Kinzie JD. Pharmacologic reduction of CNS noradrenergic activity in PTSD: the case for clonidine and prazosin. J Psychiatr Pract. 2007;13(2):72-78.
14. Boehnlein JK, Kinzie JD, Sekiya U, Riley C, Pou K, Rosborough B. A ten-year treatment outcome study of traumatized Cambodian refugees. J Nerve Ment Dis. 2004;192(10):658-663.
15. Byers MG, Allison KM, Wendel CS, Lee JK. Prazosin versus quetiapine for nighttime posttraumatic stress disorder symptoms in veterans: an assessment of long-term comparative effectiveness and safety. J Clin Psychopharmacol. 2010;30(3):225-229.
Posttraumatic stress disorder (PTSD) remains a significant health concern in veterans and military personnel. Whereas the lifetime incidence of PTSD in the U.S. general population is about 7% to 8%, the estimated prevalence of PTSD in deployed U.S. military personnel is higher than the national average, ranging from 11% to 17%.1,2 These numbers may be even higher, depending on the branch of service, responsibilities within the military, and specific conflict in which the veteran served. For example, one study found that 31% of Vietnam veterans have PTSD, and another recent study has reported PTSD in 28.7% of veterans returning from military service in Iraq and Afghanistan.3,4
Posttraumatic stress disorder treatment guidelines from both the American Psychiatric Association and the VA and DoD recommend the use of selective serotonin reuptake inhibitors (SSRIs) or serotonin-norepinephrine reuptake inhibitors (SNRIs) as first-line pharmacotherapy for PTSD.5,6 However, SSRIs and SNRIs seem to be largely ineffective for the management of nighttime PTSD symptoms, such as insomnia and nightmares.7,8
Related: PTSD Increases Chance of Heart Failure
Researchers hypothesize that the sympathetic nervous system plays a significant role in the hyperarousal component of nighttime PTSD. The heightened responsiveness and disruption in restorative sleep seen in PTSD have been attributed to increased activity of norepinephrine in the central nervous system.9 Mechanistically, therapies that attenuate the increased noradrenergic signaling might be effective in the management of nighttime PTSD symptoms.
The body of evidence for the use of adrenergic agents for nighttime PTSD symptoms is growing. Prazosin, a peripherally acting α1-adrenergic receptor antagonist, has recently been demonstrated to be effective for nighttime PTSD symptoms in veterans in a series of small, randomized controlled trials.10-12 Data to support the use of clonidine, a centrally acting α2-adrenergic receptor agonist, are generally limited, with the most compelling data coming from a population of civilian Cambodian refugees.13,14 A 2007 article by Boehnlein and Kinzie includes a thorough review of the preclinical research, case reports, and early clinical studies that have led to the widespread use of these agents for PTSD despite the lack of FDA approval for this indication.13A previous retrospective review by Byers and colleagues compared the effectiveness and tolerability of prazosin and quetiapine for nighttime PTSD symptoms in veterans.15 The results of that review suggest that α1-adrenergic agents may be equally effective and better tolerated than alternative medication options (ie, atypical antipsychotics) for this purpose. The present study was adapted from this design to report concurrently on the real-world use of clonidine and prazosin for the treatment of nighttime PTSD symptoms.
Study Objectives
The primary objective of this retrospective chart review was to describe the experience of patients prescribed clonidine or prazosin for the treatment of nighttime PTSD symptoms, including initial effectiveness. The primary endpoint of initial drug effectiveness was documented improvement of nighttime PTSD symptoms in the patient’s chart within 6 months of the date of first prescription. Clonidine or prazosin was categorized as initially effective if a statement such as “frequency of nightmares decreased” or “patient’s nighttime PTSD symptoms have improved” was made within 6 months after initial prescription of the drug.
The secondary objectives of this study were to evaluate the long-term effectiveness and tolerability of prazosin. The endpoints used to assess these outcomes were the 2-year continuation rates of clonidine and prazosin (as a surrogate marker for long-term effectiveness) and the documented reasons for discontinuation of clonidine and prazosin for the treatment of nighttime PTSD symptoms (in order to assess tolerability).
Methods
An electronic database search was conducted to identify the VA Portland Health Care System (VAPHCS) patients with a diagnosis of PTSD who received a first prescription for clonidine or prazosin for nighttime PTSD symptoms from a VAPHCS mental health provider or primary care provider (PCP) from January 1, 2009, to December 31, 2011. Patients were excluded if they had any history of prior use of the drug being initiated, were co-initiated on both clonidine and prazosin (defined as starting the drugs within 30 days of each other), or had a concomitant diagnosis of schizophrenia, bipolar disorder, psychotic disorder, or cognitive disorder as defined in the Diagnostic and Statistical Manual of Mental Disorders, 5th Edition. Patients with traumatic brain injury (TBI) were excluded only if it could be determined that the event had resulted in lasting cognitive impairment.
Study Population
All patients with a diagnosis of PTSD who received a first prescription for clonidine during the period specified were screened for inclusion; patients with PTSD who were first prescribed prazosin during the same period were randomly sampled to equalize patient populations. This was done to maximize the data set while examining groups of roughly equal size for each drug, as prazosin is used much more commonly than clonidine for nighttime PTSD symptoms at VAPHCS. The patients in each resulting group were screened to determine whether they met inclusion and exclusion criteria. All subjects included were followed for 2 years from the date of the initial prescription.
Study Design
Initial effectiveness of each agent was determined by reviewing subjects’ progress notes after the initial prescription of clonidine or prazosin for documentation of improvement in symptoms within 6 months of the prescription start date. A decrease in frequency or intensity of nighttime PTSD symptoms, nightmares, or insomnia, as documented in the patient chart, was interpreted as improvement of symptoms.
Long-term continuation was assessed by reviewing subjects’ prescription records, to determine whether prescription(s) for clonidine or prazosin continued for 2 years after the date of the initial prescription.
Any gap between medication fills that resulted in an anticipated period without medication of ≥ 6 months (eg, 9 months after receiving a 90-day supply) was considered discontinuation of therapy. Prescription refill history was also reviewed, and medication possession ratio (MPR) was calculated to assess whether patients were adherent to the study drug as prescribed. Adherence was defined as an MPR of ≥ 80%. Patients who left the VAPHCS service area but continued to receive care at another VA were assessed for continuation of therapy, but refill data and/or MPR were not assessed.
Tolerability was assessed by reviewing subjects’ medical records to determine whether therapy with clonidine or prazosin was discontinued due to documented adverse effects (AEs). The occurrence of AEs was determined by reviewing progress notes and other chart documentation surrounding the date of discontinuation. If the drug was discontinued but the reason was not explicitly documented or if the prescription expired without a documented reason for nonrenewing, the reason for discontinuation was coded as “not specified.” Discontinuation due to treatment failure, change in symptoms, nonadherence, or other causes was also recorded. If multiple reasons for discontinuation were cited for a single patient, all were included in the data. This project was approved by the institutional review board at the VAPHCS.
Related:Depression and Substance Abuse Intensify Suicide Risk
Statistical Considerations
Based on clinical experience, it was presumed that many of the patients who were prescribed clonidine would be receiving it as a second-line therapy after failing prazosin. Therefore, statistical analysis of the relative effectiveness and tolerability of clonidine and prazosin could not be performed. Neither power nor sample size needed to demonstrate any difference in effectiveness or tolerability between the groups was calculated. All results are expressed using descriptive statistics.
Results
An initial database search for patients with PTSD who received a first prescription for clonidine between January 1, 2009, and December 31, 2011, from a VAPHCS provider yielded a list of 149 patients. The same search criteria applied for prazosin yielded 1,116 patients, 149 of whom were randomly selected for screening. After screening, 42 patients on clonidine and 60 patients on prazosin were included in this analysis (Figure).
Patient Demographics
The average age of the clonidine patients was 38.5 years (range 21-65 years) (Table 1). The clonidine group was primarily male (90%) and white (83%). Eighteen of the 42 patients in the clonidine group had a baseline PTSD Checklist-Civilian version (PCL-C) score available within the 90 days before the first prescription of clonidine; the average baseline PCL-C score in this subgroup was 62 ± 12.0 (median 65.5, range 31-82). Most of the clonidine patients (71%) had a concomitant diagnosis of a depressive disorder. About one-quarter of the group (24%) had previously tried prazosin per prescription records. In 24 patients (57%), the first prescription for clonidine was written by a psychiatrist or psychiatric nurse practitioner; 18 patients (43%) were started on clonidine by PCPs.
The average age of the prazosin patients was 46.1 years (range 21-74 years). The prazosin group was also primarily male (93%) and white (88%). Twenty of the 60 patients in the prazosin group had a baseline PCL-C score available within the 90 days before the first prescription of prazosin; the average baseline PCL-C score in this subgroup was 55 ± 16.1 (median 64, range 30-72). Most of the prazosin patients (63%) had a concomitant diagnosis of a depressive disorder. Four patients (7%) had previously tried clonidine per prescription records. In 35 patients (58%), the first prescription for prazosin was written by a psychiatrist or psychiatric nurse practitioner; 25 patients (42%) were started on prazosin by PCPs.
Data pertaining to initial and long-term effectiveness, tolerability, and MPR for both clonidine and prazosin are presented in Table 2.
Clonidine
Of the 42 clonidine patients assessed, 24 (57%) had a positive response to the medication for nighttime PTSD symptoms documented in the Computerized Patient Record System (CPRS) within 6 months of starting therapy. Six months after starting clonidine, 23 patients (55%) continued to take clonidine. Two years after starting therapy, 8 of the original 42 patients continued on clonidine for an overall 2-year continuation rate of 19%.
Tolerability
Of the 34 patients who discontinued clonidine within 2 years, 13 patients (38%) cited ineffectiveness of therapy as a reason for discontinuation. Another 13 patients (38%) reported discontinuing therapy due to AEs. Sedation (4 patients, 12%), dizziness/hypotension (3 patients, 9%), and paradoxical worsening of PTSD symptoms (4 patients, 12%) were the most common AEs leading to discontinuation. Other AEs cited as reasons for discontinuation were syncope (2 patients), erectile dysfunction (1 patient), rash (1 patient), myoclonus (1 patient), increased depression (1 patient), and fatigue (1 patient). One patient reported that he had discontinued clonidine due to symptom resolution/lack of need for treatment. In 8 of the 34 patients, no reason for discontinuation was found in chart documentation.
Medication Possession Ratio
Among the 21 evaluable patients who continued to receive clonidine 6 months after initiation, 10 (48%) were determined to be highly adherent to therapy, with an MPR of ≥ 80%. Six of the 21 patients (29%) had an MPR between 50% and 79%, and 5 patients (24%) had an MPR < 50%.
Of the 8 patients who continued on clonidine at the 2-year mark, 3 (38%) were adherent to therapy, with an MPR of ≥ 80%. Three more patients (38%) had a 2-year MPR between 50% and 80%, and 2 patients (25%) had an MPR < 50%.
Prazosin
Of the 60 prazosin patients assessed, 32 (53%) had a positive response to the medication for nighttime PTSD symptoms documented in the CPRS within 6 months of starting therapy. Six months after starting prazosin, 36 patients (60%) continued to take prazosin. Two years after starting therapy, 18 of the original 60 patients continued on prazosin for an overall 2-year continuation rate of 30%.
Tolerability
Of the 42 patients who discontinued prazosin within 2 years, six patients (14%) cited ineffectiveness of therapy as a reason for discontinuation. Thirteen patients (31%) reported discontinuing therapy due to AEs. Sedation (3 patients, 7%), dizziness/hypotension (3 patients, 7%), and paradoxical worsening of PTSD symptoms (6 patients, 14%) were the most common AEs leading to discontinuation. Other AEs cited as reasons for discontinuation were headache (2 patients), altered mental status (1 patient), and fatigue (1 patient). Three patients reported that they had discontinued clonidine due to symptom resolution/lack of need for treatment. Other reasons for discontinuation not related to AEs included flight rules (1 patient), changes to antihypertensive regimen (1 patient), refill issues (1 patient), and cost (1 patient). In 15 of the 42 patients, no reason for discontinuation was found in chart documentation.
Medication Possession Ratio
Among the 31 evaluable patients who continued to receive prazosin 6 months after initiation, 20 (65%) were determined to be highly adherent to therapy, with an MPR of ≥ 80%. Five of the 31 patients (16%) had an MPR between 50% and 80%, and 6 patients (19%) had an MPR < 50%.
Of the 15 evaluable patients who continued on prazosin at the 2-year mark, 9 (60%) were adherent to therapy, with an MPR of ≥ 80%. Three patients (20%) had a 2-year MPR between 50% and 80%, and 3 patients (20%) had an MPR < 50%.
Discussion
Although prazosin has been shown to be effective for nighttime PTSD symptoms in both prospective and retrospective evaluations in veterans, this study provides the first evidence to support the use of clonidine in a veteran population.10-12,15
Interestingly, 42% of the patients assessed received their first prescription of an α2-adrenergic agent for nighttime PTSD symptoms from a PCP. Even with the recent increased focus on integrating mental health into primary care within the VA, this was a surprising finding. Primary care providers at VAPHCS may have a greater role in the outpatient management of PTSD than previously suspected. The information presented here may prove useful and applicable in both psychiatric and primary care treatment settings.
The study results indicated that a majority of subjects initially reported effectiveness with either clonidine or prazosin (53% and 57%, respectively). The initial effectiveness rate for prazosin is similar to those described in previous studies.10-13,15 The data also support a viable role for clonidine in the treatment of nighttime PTSD symptoms.
Regardless of initial improvement, the study results also suggest that the therapeutic benefit may not persist in the long term, as evidenced by a significant percentage of discontinuations attributed to ineffectiveness (38% for clonidine and 14% for prazosin) and a very low rate of long-term continuation (19% for clonidine and 30% for prazosin at 2 years). This latter observation contrasts with findings from previous studies; Byers and colleagues reported a 2-year prazosin continuation rate of 48.4% in a similar analysis, and Boehnlein and colleagues reported a sustained benefit of clonidine in responders over a 10-year period.14,15 The wide variety of reasons for discontinuation reported here may help providers who are considering clonidine or prazosin for their patients to anticipate barriers to long-term success.
Part of the discrepancy between these results and previously reported successes with clonidine and prazosin may be attributable to the classic issue of efficacy vs effectiveness. Many of the studies that have informed us on the efficacy and tolerability of prazosin for nighttime PTSD symptoms described outcomes of prospective clinical research. Furthermore, these prospective trials were limited to < 6 months in duration. To date, neither clonidine nor prazosin has been evaluated for long-term efficacy and effectiveness in well-designed, prospective trials. This retrospective analysis may help provide a realistic estimate of the long-term effectiveness of these therapies, especially within the veteran population.
Limitations
This was a single-center, retrospective study conducted primarily in white male patients. Although likely applicable to the U.S. veteran population at large, these data may be poorly generalizable to patient populations outside the VA health care system.
Aside from external validity, this study has several significant limitations. The primary limitation of this project is that it was not designed to allow for statistical comparison of clonidine and prazosin. Such an analysis would have better defined the role of clonidine in PTSD treatment, either by establishing similar effectiveness of clonidine and prazosin for nighttime symptoms or by providing evidence of the superiority of one over the other. In designing the project, investigators suspected based on experience that the majority of patients prescribed clonidine would receive the drug after having already failed first-line therapy with prazosin. Had this been the case, a direct comparison may have been biased in favor of prazosin. In retrospect, however, only 24% of the clonidine group had previously been prescribed prazosin, and only 7% of the prazosin group had been prescribed clonidine. This suggests that clonidine may be used first line more often than the investigators anticipated and that a future direct comparison would be worthwhile.
Second, the subjective data collected for this project required investigators to read and interpret chart notes, although the review of all records by a single investigator helped limit variability in interpretation. At times, information in the CPRS was incomplete in terms of determining continuation of therapy or cause for discontinuation.
Third, although it is implied that a significant number of veterans have combat-related PTSD, the nature of the traumatic event(s) leading to PTSD was not recorded in this study, and no subgroup analysis was done to compare the effect of α2-adrenergic agents between combat- and noncombat-related PTSD. Owing to their exclusion by design, it is also difficult to apply these results to veterans who have lasting cognitive impairment as a result of TBI, who are presumably among those most likely to have experienced traumas that could provoke PTSD.
The design of this project also did not include a subgroup analysis based on antidepressant type, and it is unclear whether the potential pharmacodynamic interaction between noradrenergic antidepressants (ie, SNRIs) and anti– α2-adrenergic agents had any impact on clinical outcomes. The use of complementary nonpharmacologic treatment modalities (ie, psychotherapy, eye movement desensitization and reprocessing) was also not evaluated.
Related: Female Service Members in the Long War
Finally, the primary outcome of patient-reported improvement in symptoms does not provide information on the magnitude or specific nature of benefits derived. Given the retrospective nature, data used in prospectively designed studies (eg, rating scales pertinent to PTSD), which might have helped to quantify the benefit of treatment, was not consistently available. Even a baseline PCL-C score, collected in order to describe the patient population, was available only in 37% of the patients assessed. Furthermore, nighttime PTSD symptoms vary among individuals, but the primary outcome of this study pools any benefits seen in areas such as nightmares, awakenings, night sweats, or sleep quality into a single outcome of symptom improvement.
Conclusions
This study indicates that both clonidine and prazosin may be effective for the treatment of nighttime PTSD symptoms in the veteran population but that their long-term utility may be limited by waning effectiveness, tolerability, and adherence issues. At this time, it is unclear whether either agent has an advantage over the other in terms of effectiveness or tolerability; further studies are needed to address that question.
Despite its limitations, the authors anticipate that this study will provide information regarding the effectiveness and tolerability of clonidine and prazosin to treat nighttime PTSD symptoms. Findings from this study may help clinicians to anticipate the needs and challenges of patients using β2-adrenergic agents for nighttime symptoms of PTSD.
Acknowledgements
The authors wish to acknowledge Brian Wilcox, PharmD, for his assistance in generating patient data reports, and Ronald Brown, RPh, MS, for his guidance regarding data analysis.
Author disclosures
The authors report no actual or potential conflicts of interest with regard to this article.
Disclaimer
The opinions expressed herein are those of the authors and do not necessarily reflect those of Federal Practitioner, Frontline Medical Communications Inc., the U.S. Government, or any of its agencies. This article may discuss unlabeled or investigational use of certain drugs. Please review the complete prescribing information for specific drugs or drug combinations—including indications, contraindications, warnings, and adverse effects—before administering pharmacologic therapy to patients.
1. Hoge CW, Castro CA, Messer SC, McGurk D, Cotting DI, Koffman RL. Combat duty in Iraq and Afghanistan, mental problems, and barriers to care. N Engl J Med. 2004;351(1):13-22.
2. Gates MA, Holowka DW, Vasterling JJ, Keane TM, Marx BP, Rosen RC. Posttraumatic stress disorder in veterans and military personnel: epidemiology, screening, and case recognition. Psychol Serv. 2012;9(4):361-382.
3. Kulka R, Schlenger WE, Fairbanks J, et al. Trauma and the Vietnam War Generation: Report of Findings From the National Vietnam Veterans Readjustment Study. New York, NY: Brunnel/Mazel; 1990.
4. Barrera TL, Graham DP, Dunn NJ, Teng EJ. Influence of trauma history on panic and posttraumatic stress disorder in returning veterans. Psychol Serv. 2013;10(2):168-176.
5. American Psychiatric Association. Practice Guideline for the Treatment of Patients With Acute Stress Disorder and Posttraumatic Stress Disorder. Arlington, VA: American Psychiatric Association; 2004.
6. U.S. Department of Veterans Affairs, Department of Defense. VA/DoD clinical practice guideline for management of post-traumatic stress. Version 2.0. U.S. Department of Veterans Affairs Website. http://www.healthquality.va.gov/guidelines/MH/ptsd/cpgPTSDFULL201011612c.pdf. Published October 2010. Accessed October 5, 2015.
7. Berger W, Mendlowicz MV, Marques-Portella C, et al. Pharmacologic alternatives to antidepressants in posttraumatic stress disorder: a systematic review. Prog Neuropsychopharmacol Biol Psychiatry. 2009;33(2):169-180.
8. Ravindran LN, Stein MB. Pharmacotherapy of post-traumatic stress disorder. In: Stein MB, Steckler T, eds. Behavioral Neurobiology of Anxiety and Its Treatment. Vol 2. Heidelberg, Germany: Springer; 2010:505-525.
9. Spoormaker VI, Montgomery P. Disturbed sleep in post-traumatic stress disorder: secondary symptom or core feature? Sleep Med Rev. 2008;12(3):169-184.
10. Raskind MA, Peskind ER, Kanter ED, et al. Reduction of nightmares and other PTSD symptoms in combat veterans by prazosin: a placebo controlled study. Am J Psychiatry. 2003;160(2):371-373.
11. Raskind MA, Peskind ER, Hoff DJ, et al. A parallel group placebo controlled study of prazosin for trauma nightmares and sleep disturbance in combat veterans with post-traumatic stress disorder. Biol Psychiatry. 2007;61(8):928-934.
12. Raskind MA, Peterson K, Williams T, et al. A trial of prazosin for combat trauma PTSD with nightmares in active-duty soldiers returned from Iraq and Afghanistan. Am J Psychiatry. 2013;170:1003-1010.
13. Boehnlein JK, Kinzie JD. Pharmacologic reduction of CNS noradrenergic activity in PTSD: the case for clonidine and prazosin. J Psychiatr Pract. 2007;13(2):72-78.
14. Boehnlein JK, Kinzie JD, Sekiya U, Riley C, Pou K, Rosborough B. A ten-year treatment outcome study of traumatized Cambodian refugees. J Nerve Ment Dis. 2004;192(10):658-663.
15. Byers MG, Allison KM, Wendel CS, Lee JK. Prazosin versus quetiapine for nighttime posttraumatic stress disorder symptoms in veterans: an assessment of long-term comparative effectiveness and safety. J Clin Psychopharmacol. 2010;30(3):225-229.

Association Between Proton Pump Inhibitor Exposure and Clostridium difficile Infection in Elderly, Hospitalized Patients
Clostridium difficile infection (CDI) is the result of a Gram-positive bacterium, whose exotoxins are commonly associated with infectious, watery diarrhea.1Clostridium difficile infection is associated with a significant cost burden, and over the past several years, the incidence and severity of CDI have been on the rise.2,3
There are several known risk factors for CDI. The most well-elucidated risk factor is the use of antibiotics, especially fluoroquinolones, clindamycin, broad-spectrum penicillins, and broad-spectrum cephalosporins.4,5 Other risk factors include advancing age, immunosuppression, a high burden of comorbidities, hospitalization, and antineoplastic agent use.6-8 Over the past decade, gastric acid suppression has come under increased scrutiny as a possible risk factor for CDI; specifically, exposure to proton pump inhibitors (PPIs) and histamine 2 receptor antagonists (H2RAs).8-14 With the reported overuse of PPIs, the importance of understanding safety risks associated with these agents is becoming increasingly necessary.15
In 2012, the FDA issued a public safety announcement reporting a possible association between CDI and patients undergoing treatment with PPIs.16 A large meta-analysis by Janarthanan and colleagues in 2012 evaluated 23 studies with nearly 300,000 patients, showing a 1.6-fold increase in CDI in patients exposed to a PPI.8 Another large meta-analysis noted that 39 studies showed a statistically significant association between PPI use and the risk of developing CDI (odds ratio [OR] 1.74) compared with nonusers.17 A recent study by McDonald and colleagues demonstrated patients with continuous PPI use had an elevated risk of CDI recurrence compared with patients not on continuous PPI therapy.18 These large studies did not focus analysis on elderly, hospitalized patients with significant comorbidities. There are several proposed mechanisms for the reported association between PPI use and CDI. The most widely accepted mechanism is that gastric acid suppression disrupts normal gastrointestinal flora and allows for bacterial overgrowth.19-21There are few studies that have evaluated the association between PPI use and CDI in elderly, hospitalized patients. Studies conducted in a similar patient population have demonstrated no association between PPI use and CDI.22,23 Shah and colleagues reported that treatment with gastric acid antisecretory agents does not increase the risk of developing CDI among elderly, hospitalized patients who also had severe disability.23 Lowe and colleagues demonstrated no association between PPI therapy and hospitalization for elderly outpatients with CDI.22 A study was needed to determine the association between PPI use and CDI in hospitalized, elderly patients with a high burden of comorbidities.
Related: Cleaning Up? Microfiber May Be Better
Objectives
The primary objective of this study was to determine whether there is an association between PPI exposure and CDI in elderly, hospitalized patients. The secondary objective was to determine the risk factors for the development of CDI in elderly, hospitalized patients.
Methods
Approval for this study was obtained from the Emory University Institutional Review Board and the VA Research and Development Committee. The study was a single-center, retrospective, medical record review of patients with a CDI polymerase chain reaction (PCR) assay, conducted at the Atlanta VAMC between August 20, 2011, and August 20, 2013.
Two reports for the study period were generated from TheraDoc (Premier Inc., Salt Lake City, UT) medical record software: all patients with a positive CDI PCR assay and all patients with a negative CDI PCR assay. All adult inpatients aged ≥ 18 years with a positive CDI PCR assay and diarrhea were included. Patients with CDI were randomly matched 1:1, based on age, with a control patient from a large sample of eligible CDI negative assays. Any duplicate positive CDI PCR assays were deleted, and only the first positive test was analyzed. Confirmation that PCR assay with liquid stool was being performed per manufacturer recommendations was obtained from microbiology laboratory staff.
Patient-specific data were collected from the VA Computerized Patient Record System (CPRS). Potential covariates for analyses were selected based on previous literature regarding possible associations between PPI and CDI. Data were collected on patient age, gender, PPI exposure, PPI agent, PPI dose, concomitant medications, high-risk antibiotic use, comorbidities (including diabetes, chronic renal failure, liver disease, anemia, coagulopathy, myocardial infarction, chronic heart failure, peripheral vascular disease, chronic obstructive pulmonary disease, hypertension, hypothyroidism, and any alcohol or drug abuse), length of hospital stay, bed location, and first vs recurrent CDI. Proton pump inhibitor exposure was defined as use of any PPI during hospitalization or within 2 months prior to hospitalization. High-risk antibiotics were defined as fluoroquinolones, broad-spectrum penicillins, broad-spectrum cephalosporins, and clindamycin.
Statistical Analysis
Two-sided Wilcoxon rank sum and chi-square tests were used to compare the selected variables between CDI cases and non-CDI controls. A multivariate logistic regression model was fitted to the data using CDI as the outcome and PPI use as the main exposure of interest. The large number of covariates of interest relative to the sample size suggests conditional maximum likelihood methods of estimation.24
Separate models were run using each case-control pair as a separate stratum in the model (125 pairs) as well as pooling similar-age strata to reduce the 125 pairs to 46 pooled sets. However, when comparing the Akaike information criterion (AIC; an objective measure to determine relative quality of multivariate models where a lower AIC value is preferred) between these individual and pooled strata models, the model that controlled for 125 individual case-control strata was overwhelmingly suggested as the better model (AIC, 175 vs 255, respectively).25 Analyses were conducted with SAS 9.2 (SAS Institute Inc., Cary, NC).
Results
A total of 128 patients were positive for CDI during the 2-year study period. Three of these patients were excluded from the study due to outpatient status. The remaining 125 patients were matched 1:1 with patients negative for CDI to yield a total study population of 250 patients.
Baseline demographics are shown in Table 1. The majority of patients included were males with a median age of 66 years. Nearly half of all patients in both groups had chronic renal failure, diabetes, or anemia. Comorbidities were numerous but were not significantly different between the positive and negative CDI groups. No significant difference in immunosuppression or PPI use was detected between the 2 groups. However, there were significantly more patients taking a high-risk antibiotic or an antineoplastic agent in the positive CDI group compared with the negative CDI group. The average length of hospital stay averaged 10 to 12 days and did not statistically differ between the 2 groups.
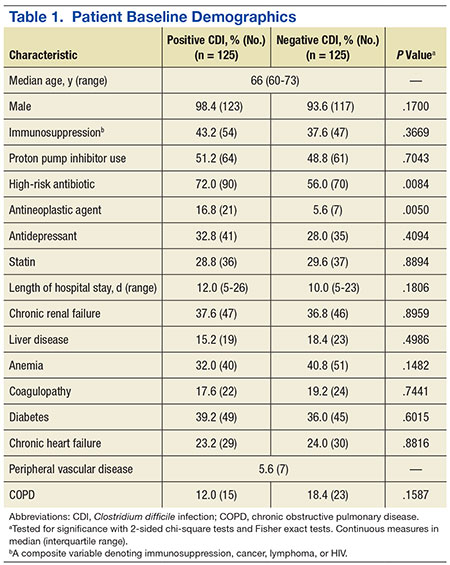
Crude ORs (cORs) and adjusted ORs (aORs) were calculated for the primary and secondary outcome measures (Table 2). There was not a statistically significant association between PPI use and CDI (cOR 1.10, 95% confidence interval [CI] 0.67-1.82; aOR 1.19, 95% CI 0.66-2.15). Other known risk factors were also evaluated for association. A statistically significant association did not exist between CDI and immunosuppression, antidepressant use, statin use, diabetes, chronic renal failure, liver disease, or anemia. However, the statistical analysis did suggest an association between CDI and high-risk antibiotic use (aOR 2.20, 95% CI 1.22-3.99) and antineoplastic agent use (aOR 5.52, 95% CI 1.77-17.26).
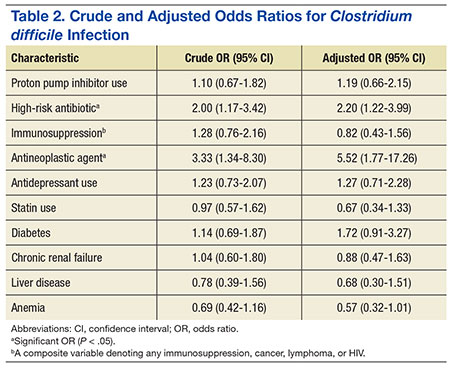
A sensitivity analysis was conducted to determine whether there were differing associations with CDI by PPI dose or specific agent. In both sensitivity analyses, there were no statistically significant differences in CDI between patients who took once-daily vs twice-daily PPI dosing or those who took pantoprazole vs omeprazole.
Discussion
The objective of this study was to evaluate the association between PPI use and CDI in an aging, hospitalized population. When adjusted for known risk factors, there was no association between CDI and patients exposed to PPI therapy.
Previous studies evaluating PPI use and CDI have shown conflicting results. Large meta-analyses have shown an increase in CDI in patients exposed to a PPI, whereas other studies have shown no association. In the studies that did not link PPI use and CDI, patients were elderly, hospitalized, and had other CDI risk factors. The patients in this study were hospitalized, with a median age of 66 years. They were significantly immunosuppressed and had a very high burden of comorbidities. A possible explanation for the lack of association between PPI use and CDI is that, in patients with several existing risk factors for CDI, adding a PPI confers no additional effect on CDI risk.
Well-known risk factors, including high-risk antibiotic use and antineoplastic chemotherapy use, were confirmed by this study. Other known risk factors, including immunosuppression and diabetes, were not observed to have an association with CDI in this study. This is perhaps for the same reason that PPI exposure did not show a significant association. In a study published in 2010, Howell and colleagues showed that the risk of CDI increased as acid suppression increased in a dose-dependent fashion.9 There was no association between PPI dose and PPI agent on the primary outcome measure.
About half of all patients in the current study were exposed to PPI therapy, which was a surprisingly high number. Although this study did not evaluate appropriate use of PPI therapy, it exposes the high rate of PPI use at the study site. It is known that PPI use has associated risks, and it is important that physicians continue to be vigilant in their prescribing habits.
Related: The Importance of an Antimicrobial Stewardship Program
Limitations and Future Directions
Several limitations of this study should be noted. A relatively narrow patient population was examined, which limits the generalizability of these findings. However, health care providers treating older, hospitalized patients with a high burden of comorbidities may find the results meaningful. This study was retrospective and included a relatively small sample size, which may limit the ability to detect a statistically significant difference.
Data were not collected on the duration of PPI therapy. A longer duration of therapy has been shown in previous studies to be significantly associated with CDI.26 It is unclear in this patient population whether there would have been an association between PPI duration of treatment and CDI.
Outpatient PPI exposure was determined using CPRS refill history. Patients were considered to have PPI exposure if they filled ≥ 1 prescription for a PPI within 2 months of hospitalization. Using this methodology to determine PPI exposure may not have identified patients who took over-the-counter PPIs or did not report filling a prescription for a PPI from an outside pharmacy, which would have resulted in an underestimation of PPI use in this sample. Furthermore, it is difficult to determine adherence to a prescribed regimen for outpatients.
Pantoprazole and omeprazole are the formulary PPIs at the study site. Conducting research at an institution with a formulary prevents evaluation of other PPIs, including esomeprazole, rabeprazole, dexlansoprazole, and lansoprazole. This is not seen as a significant limitation, as there have not been significant differences in the PPI agent and CDI widely reported in the literature.
Data on H2RA exposure were not collected. Any possible effect of H2RA exposure and CDI cannot be accounted for in this study. It is not likely that H2RA exposure would be associated with an increased risk of CDI in this patient population, as several studies have shown less of an association between CDI and H2RA compared with CDI and PPI use.
Further investigation to evaluate the association between CDI and PPI exposure in an elderly, hospitalized population is needed. Larger studies in these patients that evaluate duration of PPI therapy would be beneficial.
Related: Antidepressants Plus NSAIDs and the Risk of Intracranial Hemorrhage
Conclusion
In an elderly, hospitalized patient population with a high comorbidity burden, this study did not detect a statistically significant association between PPI exposure and CDI. Despite this, providers should continue to consider discontinuation of unnecessary PPI therapy.
Acknowledgements
The authors wish to thank Mehran Salles, PhD, PharmD, for her assistance. Study findings were presented at the 2014 Southeastern Residency Conference in Athens, Georgia, on May 1, 2014.
Author disclosures
The authors report no actual or potential conflicts of interest with regard to this article.
Disclaimer
The opinions expressed herein are those of the authors and do not necessarily reflect those of Federal Practitioner Frontline Medical Communications Inc., the U.S. Government, or any of its agencies. This article may discuss unlabeled or investigational use of certain drugs. Please review complete prescribing information for specific drugs or drug combinations—including indications, contraindications, warnings, and adverse effects—before administering pharmacologic therapy to patients.
1. Poutanen SM, Simor AE. Clostridium difficile-associated diarrhea in adults. CMAJ. 2004;171(1):51-58.
2. Clostridium difficile infection. Centers for Disease Control and Prevention Website. http://www.cdc.gov/HAI/organisms/cdiff/Cdiff_infect.html. Updated February 25, 2015. Accessed October 5, 2015.
3. Song X, Bartlett JG, Speck K, Naegeli A, Carroll K, Perl TM. Rising economic impact of Clostridium difficile-associated disease in adult hospitalized patient population. Infect Control Hosp Epidemiol. 2008;29(9):823-828.
4. Bartlett JG. Narrative review: the new epidemic of Clostridium difficile-associated enteric disease. Ann Intern Med. 2006;145(10):758-764.
5. Baxter R, Ray GT, Fireman BH. Case-control study of antibiotic use and subsequent Clostridium difficile-associated diarrhea in hospitalized patients. Infect Control Hosp Epidemiol. 2008;29(1):44-50.
6. Anand A, Glatt AE. Clostridium difficile infection associated with antineoplastic chemotherapy: a review. Clin Infect Dis. 1993;17(1):109-113.
7. Bignardi GE. Risk factors for Clostridium difficile infection. J Hosp Infect. 1998;40(1):1-15.
8. Janarthanan S, Ditah I, Adler DG, Ehrinpreis MN. Clostridium difficile-associated diarrhea and proton pump inhibitor therapy: a meta-analysis. Am J Gastroenterol. 2012;107(7):1001-1010.
9. Howell MD, Novack V, Grgurich P, et al. Iatrogenic gastric acid suppression and the risk of nosocomial Clostridium difficile infection. Arch Intern Med. 2010;170(9):784-790.
10. Aseeri M, Schroeder T, Kramer J, Zackula R. Gastric acid suppression by proton pump inhibitors as a risk factor for Clostridium difficile-associated diarrhea in hospitalized patients. Am J Gastroenterol. 2008;103(9):2308-2313.
11. Dalton BR, Lye-Maccannell T, Henderson EA, Maccannell DR, Louie TJ. Proton pump inhibitors increase significantly the risk of Clostridium difficile infection in a low-endemicity, non-outbreak hospital setting. Aliment Pharmacol Ther. 2009;29(6):626-634.
12. Dial S, Alrasadi K, Manoukian C, Huang A, Menzies D. Risk of Clostridium difficile diarrhea among hospital inpatients prescribed proton pump inhibitors: cohort and case-control studies. CMAJ. 2004;171(1):33-38.
13. Linsky A, Gupta K, Lawler EV, Fonda JR, Hermos JA. Proton pump inhibitors and risk for recurrent Clostridium difficile infection. Arch Intern Med. 2010;170(9):772-778.
14. Yearsley KA, Gilby LJ, Ramadas AV, Kubiak EM, Fone DL, Allison MC. Proton pump inhibitor therapy is a risk factor for Clostridium difficile-associated diarrhoea. Aliment Pharmacol Ther. 2006;24(4):613-619.
15. Nardino RJ, Vender RJ, Herbert PN. Overuse of acid-suppressive therapy in hospitalized patients. Am J Gastroenterol. 2000;95(11):3118-3122.
16. U.S. Food and Drug Administration. FDA drug safety communication: Clostridium difficile-associated diarrhea can be associated with stomach acid drugs known as proton pump inhibitors (PPIs). http://www.fda.gov/Drugs/DrugSafety/ucm290510.htm. Updated February 15, 2013. Accessed October 5, 2015.
17. Kwok CS, Arthur AK, Anibueze CI, Singh S, Cavallazzi R, Loke YK. Risk of Clostridium difficile infection with acid suppressing drugs and antibiotics: meta-analysis. Am J Gastroenterol. 2012;107(7):1011-1019.
18. McDonald EG, Milligan J, Frenette C, Lee TC. Continuous proton pump inhibitor therapy and the associated risk of recurrent Clostridium difficile infection. JAMA Intern Med. 2015;175(5):784-791.
19. Lewis SJ, Franco S, Young G, O'Keefe SJ. Altered bowel function and duodenal bacterial overgrowth in patients treated with omeprazole. Aliment Pharmacol Ther. 1996;10(4):557-561.
20. Theisen J, Nehra D, Citron D, et al. Suppression of gastric acid secretion in patients with gastroesophageal reflux disease results in gastric bacterial overgrowth and deconjugation of bile acids. J Gastrointest Surg. 2000;4(1):50-54.
21. Williams C, McColl KE. Review article: proton pump inhibitors and bacterial overgrowth. Aliment Pharmacol Ther. 2006;23(1):3-10.
22. Lowe DO, Mamdani MM, Kopp A, Low DE, Juurlink DN. Proton pump inhibitors and hospitalization for Clostridium difficile-associated disease: a population-based study. Clin Infect Dis. 2006;43(10):1272-1276.
23. Shah S, Lewis A, Leopold D, Dunstan F, Woodhouse K. Gastric acid suppression does not promote clostridial diarrhoea in the elderly. QJM. 2000;93(3):175-181.
24. Kleinbaum DG, Klein M. Logistic Regression: A Self-Learning Text. 3rd ed. New York, NY: Springer; 2010.
25. Akaike H. A new look at the statistical model identification. IEEE Transact Autom Contr. 1974;19(6):716-723.
26. Barletta JF, El-Ibiary SY, Davis LE, Nguyen B, Raney CR. Proton pump inhibitors and the risk for hospital-acquired Clostridium difficile infection. Mayo Clin Proc. 2013;88(10):1085-1090.
Clostridium difficile infection (CDI) is the result of a Gram-positive bacterium, whose exotoxins are commonly associated with infectious, watery diarrhea.1Clostridium difficile infection is associated with a significant cost burden, and over the past several years, the incidence and severity of CDI have been on the rise.2,3
There are several known risk factors for CDI. The most well-elucidated risk factor is the use of antibiotics, especially fluoroquinolones, clindamycin, broad-spectrum penicillins, and broad-spectrum cephalosporins.4,5 Other risk factors include advancing age, immunosuppression, a high burden of comorbidities, hospitalization, and antineoplastic agent use.6-8 Over the past decade, gastric acid suppression has come under increased scrutiny as a possible risk factor for CDI; specifically, exposure to proton pump inhibitors (PPIs) and histamine 2 receptor antagonists (H2RAs).8-14 With the reported overuse of PPIs, the importance of understanding safety risks associated with these agents is becoming increasingly necessary.15
In 2012, the FDA issued a public safety announcement reporting a possible association between CDI and patients undergoing treatment with PPIs.16 A large meta-analysis by Janarthanan and colleagues in 2012 evaluated 23 studies with nearly 300,000 patients, showing a 1.6-fold increase in CDI in patients exposed to a PPI.8 Another large meta-analysis noted that 39 studies showed a statistically significant association between PPI use and the risk of developing CDI (odds ratio [OR] 1.74) compared with nonusers.17 A recent study by McDonald and colleagues demonstrated patients with continuous PPI use had an elevated risk of CDI recurrence compared with patients not on continuous PPI therapy.18 These large studies did not focus analysis on elderly, hospitalized patients with significant comorbidities. There are several proposed mechanisms for the reported association between PPI use and CDI. The most widely accepted mechanism is that gastric acid suppression disrupts normal gastrointestinal flora and allows for bacterial overgrowth.19-21There are few studies that have evaluated the association between PPI use and CDI in elderly, hospitalized patients. Studies conducted in a similar patient population have demonstrated no association between PPI use and CDI.22,23 Shah and colleagues reported that treatment with gastric acid antisecretory agents does not increase the risk of developing CDI among elderly, hospitalized patients who also had severe disability.23 Lowe and colleagues demonstrated no association between PPI therapy and hospitalization for elderly outpatients with CDI.22 A study was needed to determine the association between PPI use and CDI in hospitalized, elderly patients with a high burden of comorbidities.
Related: Cleaning Up? Microfiber May Be Better
Objectives
The primary objective of this study was to determine whether there is an association between PPI exposure and CDI in elderly, hospitalized patients. The secondary objective was to determine the risk factors for the development of CDI in elderly, hospitalized patients.
Methods
Approval for this study was obtained from the Emory University Institutional Review Board and the VA Research and Development Committee. The study was a single-center, retrospective, medical record review of patients with a CDI polymerase chain reaction (PCR) assay, conducted at the Atlanta VAMC between August 20, 2011, and August 20, 2013.
Two reports for the study period were generated from TheraDoc (Premier Inc., Salt Lake City, UT) medical record software: all patients with a positive CDI PCR assay and all patients with a negative CDI PCR assay. All adult inpatients aged ≥ 18 years with a positive CDI PCR assay and diarrhea were included. Patients with CDI were randomly matched 1:1, based on age, with a control patient from a large sample of eligible CDI negative assays. Any duplicate positive CDI PCR assays were deleted, and only the first positive test was analyzed. Confirmation that PCR assay with liquid stool was being performed per manufacturer recommendations was obtained from microbiology laboratory staff.
Patient-specific data were collected from the VA Computerized Patient Record System (CPRS). Potential covariates for analyses were selected based on previous literature regarding possible associations between PPI and CDI. Data were collected on patient age, gender, PPI exposure, PPI agent, PPI dose, concomitant medications, high-risk antibiotic use, comorbidities (including diabetes, chronic renal failure, liver disease, anemia, coagulopathy, myocardial infarction, chronic heart failure, peripheral vascular disease, chronic obstructive pulmonary disease, hypertension, hypothyroidism, and any alcohol or drug abuse), length of hospital stay, bed location, and first vs recurrent CDI. Proton pump inhibitor exposure was defined as use of any PPI during hospitalization or within 2 months prior to hospitalization. High-risk antibiotics were defined as fluoroquinolones, broad-spectrum penicillins, broad-spectrum cephalosporins, and clindamycin.
Statistical Analysis
Two-sided Wilcoxon rank sum and chi-square tests were used to compare the selected variables between CDI cases and non-CDI controls. A multivariate logistic regression model was fitted to the data using CDI as the outcome and PPI use as the main exposure of interest. The large number of covariates of interest relative to the sample size suggests conditional maximum likelihood methods of estimation.24
Separate models were run using each case-control pair as a separate stratum in the model (125 pairs) as well as pooling similar-age strata to reduce the 125 pairs to 46 pooled sets. However, when comparing the Akaike information criterion (AIC; an objective measure to determine relative quality of multivariate models where a lower AIC value is preferred) between these individual and pooled strata models, the model that controlled for 125 individual case-control strata was overwhelmingly suggested as the better model (AIC, 175 vs 255, respectively).25 Analyses were conducted with SAS 9.2 (SAS Institute Inc., Cary, NC).
Results
A total of 128 patients were positive for CDI during the 2-year study period. Three of these patients were excluded from the study due to outpatient status. The remaining 125 patients were matched 1:1 with patients negative for CDI to yield a total study population of 250 patients.
Baseline demographics are shown in Table 1. The majority of patients included were males with a median age of 66 years. Nearly half of all patients in both groups had chronic renal failure, diabetes, or anemia. Comorbidities were numerous but were not significantly different between the positive and negative CDI groups. No significant difference in immunosuppression or PPI use was detected between the 2 groups. However, there were significantly more patients taking a high-risk antibiotic or an antineoplastic agent in the positive CDI group compared with the negative CDI group. The average length of hospital stay averaged 10 to 12 days and did not statistically differ between the 2 groups.
Crude ORs (cORs) and adjusted ORs (aORs) were calculated for the primary and secondary outcome measures (Table 2). There was not a statistically significant association between PPI use and CDI (cOR 1.10, 95% confidence interval [CI] 0.67-1.82; aOR 1.19, 95% CI 0.66-2.15). Other known risk factors were also evaluated for association. A statistically significant association did not exist between CDI and immunosuppression, antidepressant use, statin use, diabetes, chronic renal failure, liver disease, or anemia. However, the statistical analysis did suggest an association between CDI and high-risk antibiotic use (aOR 2.20, 95% CI 1.22-3.99) and antineoplastic agent use (aOR 5.52, 95% CI 1.77-17.26).
A sensitivity analysis was conducted to determine whether there were differing associations with CDI by PPI dose or specific agent. In both sensitivity analyses, there were no statistically significant differences in CDI between patients who took once-daily vs twice-daily PPI dosing or those who took pantoprazole vs omeprazole.
Discussion
The objective of this study was to evaluate the association between PPI use and CDI in an aging, hospitalized population. When adjusted for known risk factors, there was no association between CDI and patients exposed to PPI therapy.
Previous studies evaluating PPI use and CDI have shown conflicting results. Large meta-analyses have shown an increase in CDI in patients exposed to a PPI, whereas other studies have shown no association. In the studies that did not link PPI use and CDI, patients were elderly, hospitalized, and had other CDI risk factors. The patients in this study were hospitalized, with a median age of 66 years. They were significantly immunosuppressed and had a very high burden of comorbidities. A possible explanation for the lack of association between PPI use and CDI is that, in patients with several existing risk factors for CDI, adding a PPI confers no additional effect on CDI risk.
Well-known risk factors, including high-risk antibiotic use and antineoplastic chemotherapy use, were confirmed by this study. Other known risk factors, including immunosuppression and diabetes, were not observed to have an association with CDI in this study. This is perhaps for the same reason that PPI exposure did not show a significant association. In a study published in 2010, Howell and colleagues showed that the risk of CDI increased as acid suppression increased in a dose-dependent fashion.9 There was no association between PPI dose and PPI agent on the primary outcome measure.
About half of all patients in the current study were exposed to PPI therapy, which was a surprisingly high number. Although this study did not evaluate appropriate use of PPI therapy, it exposes the high rate of PPI use at the study site. It is known that PPI use has associated risks, and it is important that physicians continue to be vigilant in their prescribing habits.
Related: The Importance of an Antimicrobial Stewardship Program
Limitations and Future Directions
Several limitations of this study should be noted. A relatively narrow patient population was examined, which limits the generalizability of these findings. However, health care providers treating older, hospitalized patients with a high burden of comorbidities may find the results meaningful. This study was retrospective and included a relatively small sample size, which may limit the ability to detect a statistically significant difference.
Data were not collected on the duration of PPI therapy. A longer duration of therapy has been shown in previous studies to be significantly associated with CDI.26 It is unclear in this patient population whether there would have been an association between PPI duration of treatment and CDI.
Outpatient PPI exposure was determined using CPRS refill history. Patients were considered to have PPI exposure if they filled ≥ 1 prescription for a PPI within 2 months of hospitalization. Using this methodology to determine PPI exposure may not have identified patients who took over-the-counter PPIs or did not report filling a prescription for a PPI from an outside pharmacy, which would have resulted in an underestimation of PPI use in this sample. Furthermore, it is difficult to determine adherence to a prescribed regimen for outpatients.
Pantoprazole and omeprazole are the formulary PPIs at the study site. Conducting research at an institution with a formulary prevents evaluation of other PPIs, including esomeprazole, rabeprazole, dexlansoprazole, and lansoprazole. This is not seen as a significant limitation, as there have not been significant differences in the PPI agent and CDI widely reported in the literature.
Data on H2RA exposure were not collected. Any possible effect of H2RA exposure and CDI cannot be accounted for in this study. It is not likely that H2RA exposure would be associated with an increased risk of CDI in this patient population, as several studies have shown less of an association between CDI and H2RA compared with CDI and PPI use.
Further investigation to evaluate the association between CDI and PPI exposure in an elderly, hospitalized population is needed. Larger studies in these patients that evaluate duration of PPI therapy would be beneficial.
Related: Antidepressants Plus NSAIDs and the Risk of Intracranial Hemorrhage
Conclusion
In an elderly, hospitalized patient population with a high comorbidity burden, this study did not detect a statistically significant association between PPI exposure and CDI. Despite this, providers should continue to consider discontinuation of unnecessary PPI therapy.
Acknowledgements
The authors wish to thank Mehran Salles, PhD, PharmD, for her assistance. Study findings were presented at the 2014 Southeastern Residency Conference in Athens, Georgia, on May 1, 2014.
Author disclosures
The authors report no actual or potential conflicts of interest with regard to this article.
Disclaimer
The opinions expressed herein are those of the authors and do not necessarily reflect those of Federal Practitioner Frontline Medical Communications Inc., the U.S. Government, or any of its agencies. This article may discuss unlabeled or investigational use of certain drugs. Please review complete prescribing information for specific drugs or drug combinations—including indications, contraindications, warnings, and adverse effects—before administering pharmacologic therapy to patients.
1. Poutanen SM, Simor AE. Clostridium difficile-associated diarrhea in adults. CMAJ. 2004;171(1):51-58.
2. Clostridium difficile infection. Centers for Disease Control and Prevention Website. http://www.cdc.gov/HAI/organisms/cdiff/Cdiff_infect.html. Updated February 25, 2015. Accessed October 5, 2015.
3. Song X, Bartlett JG, Speck K, Naegeli A, Carroll K, Perl TM. Rising economic impact of Clostridium difficile-associated disease in adult hospitalized patient population. Infect Control Hosp Epidemiol. 2008;29(9):823-828.
4. Bartlett JG. Narrative review: the new epidemic of Clostridium difficile-associated enteric disease. Ann Intern Med. 2006;145(10):758-764.
5. Baxter R, Ray GT, Fireman BH. Case-control study of antibiotic use and subsequent Clostridium difficile-associated diarrhea in hospitalized patients. Infect Control Hosp Epidemiol. 2008;29(1):44-50.
6. Anand A, Glatt AE. Clostridium difficile infection associated with antineoplastic chemotherapy: a review. Clin Infect Dis. 1993;17(1):109-113.
7. Bignardi GE. Risk factors for Clostridium difficile infection. J Hosp Infect. 1998;40(1):1-15.
8. Janarthanan S, Ditah I, Adler DG, Ehrinpreis MN. Clostridium difficile-associated diarrhea and proton pump inhibitor therapy: a meta-analysis. Am J Gastroenterol. 2012;107(7):1001-1010.
9. Howell MD, Novack V, Grgurich P, et al. Iatrogenic gastric acid suppression and the risk of nosocomial Clostridium difficile infection. Arch Intern Med. 2010;170(9):784-790.
10. Aseeri M, Schroeder T, Kramer J, Zackula R. Gastric acid suppression by proton pump inhibitors as a risk factor for Clostridium difficile-associated diarrhea in hospitalized patients. Am J Gastroenterol. 2008;103(9):2308-2313.
11. Dalton BR, Lye-Maccannell T, Henderson EA, Maccannell DR, Louie TJ. Proton pump inhibitors increase significantly the risk of Clostridium difficile infection in a low-endemicity, non-outbreak hospital setting. Aliment Pharmacol Ther. 2009;29(6):626-634.
12. Dial S, Alrasadi K, Manoukian C, Huang A, Menzies D. Risk of Clostridium difficile diarrhea among hospital inpatients prescribed proton pump inhibitors: cohort and case-control studies. CMAJ. 2004;171(1):33-38.
13. Linsky A, Gupta K, Lawler EV, Fonda JR, Hermos JA. Proton pump inhibitors and risk for recurrent Clostridium difficile infection. Arch Intern Med. 2010;170(9):772-778.
14. Yearsley KA, Gilby LJ, Ramadas AV, Kubiak EM, Fone DL, Allison MC. Proton pump inhibitor therapy is a risk factor for Clostridium difficile-associated diarrhoea. Aliment Pharmacol Ther. 2006;24(4):613-619.
15. Nardino RJ, Vender RJ, Herbert PN. Overuse of acid-suppressive therapy in hospitalized patients. Am J Gastroenterol. 2000;95(11):3118-3122.
16. U.S. Food and Drug Administration. FDA drug safety communication: Clostridium difficile-associated diarrhea can be associated with stomach acid drugs known as proton pump inhibitors (PPIs). http://www.fda.gov/Drugs/DrugSafety/ucm290510.htm. Updated February 15, 2013. Accessed October 5, 2015.
17. Kwok CS, Arthur AK, Anibueze CI, Singh S, Cavallazzi R, Loke YK. Risk of Clostridium difficile infection with acid suppressing drugs and antibiotics: meta-analysis. Am J Gastroenterol. 2012;107(7):1011-1019.
18. McDonald EG, Milligan J, Frenette C, Lee TC. Continuous proton pump inhibitor therapy and the associated risk of recurrent Clostridium difficile infection. JAMA Intern Med. 2015;175(5):784-791.
19. Lewis SJ, Franco S, Young G, O'Keefe SJ. Altered bowel function and duodenal bacterial overgrowth in patients treated with omeprazole. Aliment Pharmacol Ther. 1996;10(4):557-561.
20. Theisen J, Nehra D, Citron D, et al. Suppression of gastric acid secretion in patients with gastroesophageal reflux disease results in gastric bacterial overgrowth and deconjugation of bile acids. J Gastrointest Surg. 2000;4(1):50-54.
21. Williams C, McColl KE. Review article: proton pump inhibitors and bacterial overgrowth. Aliment Pharmacol Ther. 2006;23(1):3-10.
22. Lowe DO, Mamdani MM, Kopp A, Low DE, Juurlink DN. Proton pump inhibitors and hospitalization for Clostridium difficile-associated disease: a population-based study. Clin Infect Dis. 2006;43(10):1272-1276.
23. Shah S, Lewis A, Leopold D, Dunstan F, Woodhouse K. Gastric acid suppression does not promote clostridial diarrhoea in the elderly. QJM. 2000;93(3):175-181.
24. Kleinbaum DG, Klein M. Logistic Regression: A Self-Learning Text. 3rd ed. New York, NY: Springer; 2010.
25. Akaike H. A new look at the statistical model identification. IEEE Transact Autom Contr. 1974;19(6):716-723.
26. Barletta JF, El-Ibiary SY, Davis LE, Nguyen B, Raney CR. Proton pump inhibitors and the risk for hospital-acquired Clostridium difficile infection. Mayo Clin Proc. 2013;88(10):1085-1090.
Evaluating Sorafenib in Veterans With Advanced Hepatocellular Carcinoma
In 2015, more than 35,660 new cases of liver cancer and 24,550 liver cancer-related deaths are expected to occur in the U.S. About 80% of these cases will consist of hepatocellular carcinoma, (HCC).1 The incidence of HCC varies throughout the world: Incidence is as low as 5 in 100,000 individuals in North America and ranges up to > 20 in 100,000 individuals in sub-Saharan Africa and Eastern Asia.2 Nearly half of all cases of HCC are associated with hepatitis B virus (HBV), and another 25% are associated with hepatitis C virus (HCV). Other risk factors for developing HCC include alcoholic liver disease, nonalcoholic steatohepatitis, flatoxin-contaminated food, diabetes, and obesity.3
Therapeutic options for advanced HCC are limited. The FDA approved sorafenib in 2008 for the treatment of unresectable HCC.4 According to the American Association for the Study of Liver Diseases (AASLD) and the Barcelona Clinic Liver Cancer (BCLC) staging system, patients with Stage C liver cancer may undergo a trial of sorafenib.4 National Comprehensive Cancer Network (NCCN) clinical guidelines for hepatobiliary cancers reserve sorafenib for patients with inoperable tumors, metastatic disease, or extensive liver tumor burden.5 Sorafenib is shown to inhibit multiple intracellular and cell surface kinases. Several of these kinases are thought to be involved in tumor cell signaling, angiogenesis, and apoptosis.4 In the Sorafenib HCC Assessment Randomized Protocol (SHARP) trial, median overall survival (OS) was 10.7 months in the sorafenib group and 7.9 months in the placebo group.6 The predicted survival rates at 1 year were 44% in the sorafenib group and 33% in the placebo group.6The economic impact of oral chemotherapy on health care cannot be discounted. At about $50,000 to $100,000 per quality- adjusted life-year, the incremental cost-effectiveness ratio (ICER) of sorafenib over placebo was $62,473 per quality-adjusted life-year in 2007.7The purpose of this retrospective chart review was to evaluate sorafenib for efficacy and safety in a veteran population. Veterans have poorer health and more medical conditions compared with nonveterans.8 Furthermore, in the VHA, about 170,000 veterans have HCV.9 The rate of progression from HCV to HCC is about 3% to 5% annually. More than half of those diagnosed with HCC are late stage, and unfortunately, the 5-year OS rate for patients with liver cancer is 9% and 4% for those patients who are diagnosed at regional and distant stages of the disease.1 As the practice of oncology grows, it is necessary for pharmacists to be involved in the selection of chemotherapeutic agents in order to provide optimal pharmaceutical care.10
Related: VIDEO: NAFLD increasingly causing U.S. hepatocellular carcinoma
Methods
A retrospective chart review was conducted to identify patients who were prescribed sorafenib from November 1, 2007, to September 30, 2011, at the VA Greater Los Angeles Healthcare System (VAGLAHS). Inclusion criteria included patients who had a diagnosis of advanced HCC, who were initiated and managed by a VAGLAHS provider and who were eligible for a 1-year safety evaluation period. The study was approved by the VAGLAHS institutional review board.
Baseline demographic, clinical, laboratory, and medication data were collected. Demographic, clinical, laboratory, and medication data were obtained from CPRS (Computerized Patient Record System) and VistA (Veterans Health Information Systems and Technology Architecture). Data were collected on secured servers and saved on encrypted files. The master list was destroyed once the records control schedule was finalized. No identifiers were collected on the data collection sheet.
Standard practice at VAGLAHS is to monitor European Cooperative Oncology Group Performance Status (ECOG-PS), Child-Pugh class, and alpha-fetoprotein (AFP) at initiation and every 3 months and to obtain laboratory data at initiation and every month before each medication refill. Patients were seen in the Oncology Clinic periodically at the provider’s discretion. The time of drug discontinuation and the reason for drug discontinuation were recorded. Time of death at any point was collected to measure OS.
It was determined that a total sample size of 42 patients would be insufficient to achieve 80% power to demonstrate any hypothesized effects. However, the Fisher exact test was used to calculate P values for simple comparison. Patient demographics and clinical characteristics were reported as total numbers and frequencies when applicable. Survival rate was measured from the time of sorafenib initiation to 1 year after therapy initiation. Overall survival was measured from the time of sorafenib initiation to time of death. Duration of therapy was measured from the time of sorafenib initiation to time of discontinuation, either by provider or by patient.
Results
There were 83 patients who were prescribed sorafenib between November 1, 2007, and September 30, 2011. Of the 83 patients, 27 patients were ineligible for a 1-year follow-up period, 9 patients were diagnosed with non-HCC, 3 were initiated or managed by providers outside the institution, and 2 were not started on therapy. In all, 42 patients met inclusion criteria and had received at least 1 dose of sorafenib. The primary etiologies for HCC were history of alcohol abuse, HCV, and HBV. The primary risk factors were obesity, smoking, and diabetes. Many patients presented with multiple etiologies and risk factors. Ten patients (23.8%) had moderate-to-severe hepatic impairment (Child-Pugh class B or C). Baseline characteristics of these patients are listed in Table 1.
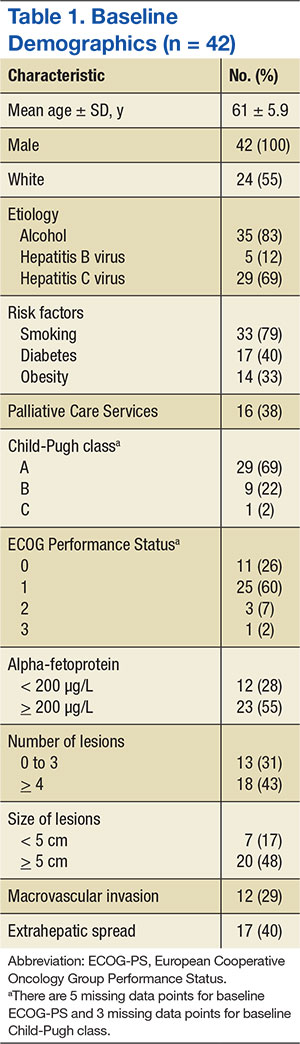
Efficacy
The median OS was 5.9 months and ranged from 21 days to 60 months. There were 17 patients who survived at the 1-year follow-up, including 1 patient who survived 363 days after treatment initiation, yielding an OS rate of 40.5%. Table 2 presents 1-year survival rates with respect to select baseline data. Baseline factors found to be negligible were age, smoking, alcohol abuse, obesity, presence of HCV, medication possession ratio (MPR), prior treatment, macrovascular invasion, and AFP. Neither initial dose regimen, final dose regimen achieved, or average dose correlated with the survival rate at the 1-year follow-up.
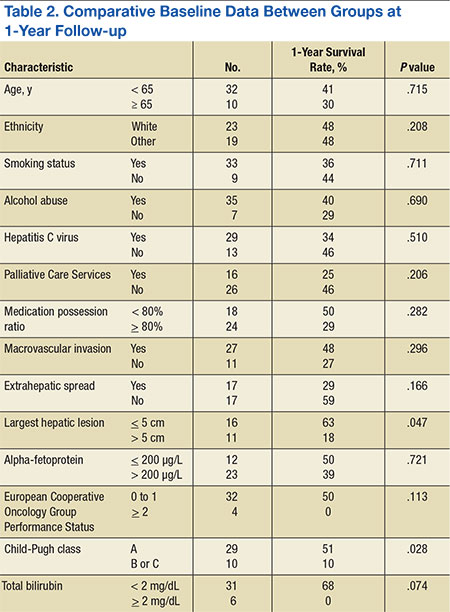
Factors possibly associated with a higher probability of survival were baseline ECOG-PS score and baseline Child-Pugh class (Table 2). Patients with an ECOG-PS score of 0 or 1 had a higher survival rate at 1 year than did patients with an ECOG-PS score of ≥ 2 (50% vs 0%, respectively; P = .113). Patients with Child-Pugh class B or C had a lower survival rate at 1 year than did patients with Child-Pugh class A (51% vs 10%, respectively; P = .028). Other indicators were size of largest hepatic lesion ≤ 5 cm, total bilirubin ≤ 2 mg/dL, concurrent treatment, almost exclusively embolization, and treatment after sorafenib discontinuation, such as another oral chemotherapeutic agent or embolization.
The 17 patients who survived at 1 year were reviewed to see if they shared characteristics that indicated a higher probability of survival. The figure shows the baseline ECOG-PS score and the Child-Pugh class the patients who did and did not survive at the 1-year follow-up. In the first group, all patient possessed an ECOG-PS score of 0 or 1, and only 1 patient presented with Child-Pugh class B or C. In contrast, in the group who did not survive at the 1-year follow-up, there were 4 patients with ECOG-PS scores of > 1 and 9 patients who presented with Child-Pugh class B or C. The mean AFP level of this group was < 200 µg/mL, and only 4 patients were followed by Palliative Care Services. The average normalized MPR of this group was 71.9% compared with 85.3% for those who did not survive at the 1-year follow-up.
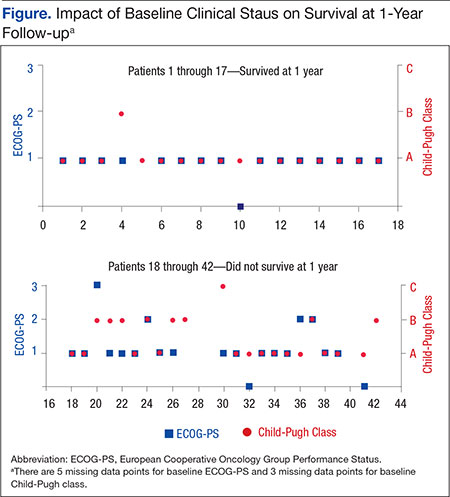
In patients who experienced at least 1 adverse event (AE), 16 survived, whereas only 1 who did not experience an AE survived (45.7% vs 14.3%, respectively; P = .210). Thirteen patients who experienced ≥ 3 AEs survived at 1 year; and only 3 patients who reported < 3 AEs survived at 1 year (61.9% vs 14.0%, respectively; P = .011). However, when the number of AEs was normalized to duration of treatment per patient, the median frequency of AEs for all patients was 0.61 AEs per month treated. The difference in survival rates grew smaller and less significant between patients who had a frequency of AEs lower than the median compared with those with a higher ratio (52.4% vs 28.6%, respectively; P = .208). Patients affected by AEs in the first 30 days and 90 days of treatment had a survival rate at the 1-year follow-up of 42.4% and 30.2%, respectively. Patients who experienced dermatologic AEs had a higher survival rate than those who did not have dermatologic AEs (60.0% vs 29.6%, respectively; P = .099). This correlation was not found with 2 other classes of AEs, gastrointestinal (50.0% vs 27.8%; P = .208) or neurologic (64.0% vs 41.2%; P = .209).
The median overall time to discontinuation was 3.4 months. The main reasons cited for discontinuing sorafenib at 1 year included symptomatic progression (52.4%), radiographic progression (23.8%), severe AEs (16.7%), and mild-to-moderate AEs (11.9%). There was overlap, as 15 patients discontinued treatment for multiple reasons. For the 22 patients who discontinued medication due to symptomatic progression at 1 year, the median time to discontinuation was 3.8 months. For the 10 patients who discontinued medication due to radiographic progression at 1 year, median time to discontinuation was 5.6 months. Seven patients (16.7%) were still on therapy at 1 year.The study considered the impact of potential dose adjustments on survival rate and safety. The authors compared patients’ prescribed dose with the recommended dose based on the package insert and monthly laboratory values if recorded. The prescribed dose was recorded as appropriate dose, below dose, above dose, or indeterminate due to the lack of current laboratory values. Patients who survived at the 1-year follow-up had a composition of 26%, 21%, 10%, and 43%, respectively. These results were similar to those of patients who did not survive at the 1-year follow-up, 29%, 12%, 30%, and 29%, respectively.
Based on medication refill history and VA acquisition cost, the total prescription drug cost of treating 42 patients with sorafenib was $388,370.40. The total number of days survived for these patients was 16,607 days, which equates to $8,535.87 per year lived.
Safety
Of the 42 patients, 35 patients experienced ≥ 1 AE for a total of 122 AEs reported. The median number of AEs per patient was 2.5. The median time to the first AE was 21 days and ranged from 3 to 244 days. In the first 30 days of treatment, 23 patients (54.7%) reported 47 AEs (39.5%). In the first 90 days of treatment, 33 patients (78.6%) reported 88 AEs (73.9%). Common AEs in both instances were diarrhea, fatigue, erythematous plantar-palmar rash, and nausea (Table 3).
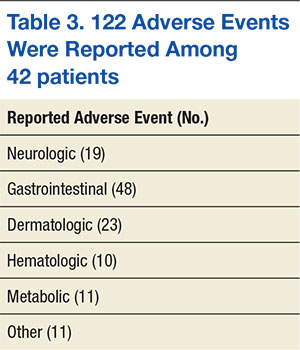
The predominant classes of AEs were GI (39.3%), dermatologic (18.9%), and neurologic (15.6%). Erythematous palmar-plantar rash, also known as hand-foot syndrome, has been noted as a potential dose-limiting sorafenib AE if the rash is recurrent or severe. One patient experienced recurrent grade-2 rashes, and sorafenib was immediately discontinued after an attempt to lower the dose. There were 8 patients who reported serious AEs, and 5 were hospitalized. One patient continued therapy despite GI hemorrhage. The other 4 patients discontinued therapy on hospitalization and were seen for intracranial hemorrhage, GI perforation, acute renal failure, and acute liver failure. In the first 3 cases, sorafenib could not be ruled out as the primary cause of death. None of these patients presented with comorbidities, such as hypertension, which predisposed them to AEs.
Overall, 38 patients ended therapy at the recommended regimen of 400 mg twice daily, and the average total daily dose was 619 mg, just below 80% of the recommended daily dose. Reasons for not achieving 400 mg twice daily included slow titration, AEs, and dose adjustments for compromised renal and hepatic function such as dialysis. Patients who had an ECOG-PS score of 0 or 1 or Child-Pugh class A reported ≥ 3 AEs, but when normalized to duration of treatment, no difference was observed. No correlations were found for average dose, creatinine clearance, aspartate aminotransferase, platelets, total bilirubin, or weight and number or frequency of AEs.
In regard to potential dose adjustments, the doses (400 mg twice daily, 600 mg daily [400 mg + 200 mg in 2 doses], 200 mg twice daily, and 200 mg daily) did not correlate well with AEs. Patients who had < 3 AEs presented with the breakdown 23%, 16%, 22%, and 38%, similar to patients who had ≥ 3 AEs—30%, 19%, 14%, and 37%. Likewise, patients who had a frequency of AEs lower than the median presented with the breakdown 22%, 22%, 15%, and 40% compared with patients who had more AEs than the median—37%, 9%, 23%, and 31%.
Related: Hepatocellular Carcinoma: To Biopsy or Not?
Discussion
Sorafenib is the only oral oncology medication approved by the FDA for treatment of unresectable HCC.3 Prior to sorafenib, the AASLD recommendation was supportive care for patients presenting with BCLC-Stage C liver cancer. However, guidelines changed when SHARP showed that sorafenib provided a survival benefit with a tolerable AE profile. The survival benefit of sorafenib has been replicated in a few large, multicenter trials. In Asia, Cheng and colleagues saw improved median OS of 6.5 months for sorafenib compared with 4.2 months with placebo, and in Italy, Iavarone and colleagues showed a median OS of 10.5 months without a placebo comparator.11,12
In the veteran population for this study, the OS rate of 40.5% was similar to the rate reported in the SHARP study, although the patients’ median OS fell short of the time described in SHARP and other trials. The medical complexities involved in treating veterans may explain this difference. The veteran population is heterogeneous with diverse ethnic backgrounds, several comorbidities, and varying degrees of organ dysfunction. The authors compared survival rates of different subgroups to test the hypothesis that the probability of survival while on therapy should not depend on demographics or medical history. However, in this study, patients with minimal impact from HCC, such as mild hepatic impairment and high-functional status, demonstrated higher survival rates at 1-year follow-up than did those without significant compromise.Although the high prevalence of HCV and alcohol abuse in the veteran population has resulted in a high incidence of hepatic dysfunction, this study suggests that these factors are independent of survival if liver function or integrity has not been compromised.9
Some researchers have hypothesized that clinical toxicities from tyrosine kinase inhibitors may correlate with survival.13 The authors noticed that the presentation of dermatologic AEs may reflect improved survival. In this study, patients who experienced ≥ 1 AE and ≥ 3 AEs had survival rates at the 1-year follow-up of 45.7% and 61.9%, respectively. Moreover, patients affected by AEs in the first 90 days of treatment had a survival rate at the 1-year follow-up of 42.4%.
Caution is advised when drawing conclusions from the number of AEs or when they appear, because this may falsely favor correlation. Patients who survive longer have additional time to report an AE. Therefore, the authors also looked at the ratio of AEs over time per patient to consider the number of AEs per duration of treatment and saw that there was little difference in survival rate in this regard. When considering patients affected by AEs only in the first 30 days of treatment, the survival rate at the 1-year follow-up fell to 30.2%.
A more likely factor for the survival of the 17 patients who were alive at the 1-year follow-up was their overall health relative to the rest of the study group. Overall health may indicate survival independent of sorafenib. The group of 17 who survived at the 1-year follow-up reflected a population that was different from the rest of the study population. The subset was generally healthier with better ECOG-PS scores and Child-Pugh classes, was not followed by Palliative Care Services, and had a mean AFP level under the threshold for diagnosis of HCC in patients who present with hepatic lesions and elevated AFP.14 This subset’s MPR, a surrogate marker for adherence, was less than the accepted threshold in clinical practice for oral medications.15Evaluating the patient’s dose regimen was expected to reveal a relationship between dosing and clinical outcomes, such as low survival rates with low doses or more AEs with high doses. However, the authors were not able to establish this link. In fact, the median time to discontinuation of 3.4 months for the study group, or duration of treatment, was much shorter than the median OS of 5.9 months.
These findings were consistent with Cabibbo and colleagues, who conducted a meta-analysis of survival rates for untreated patients and found that impaired performance status and Child-Pugh class B or C were independently associated with shorter survival.16 The SHARP study and Cheng and colleagues also attempted to exclude patients who were not Child-Pugh class A in their studies, which suggests a negligible correlation between sorafenib and survival time and a close relationship between baseline clinical status and survival.
The authors determined that prior treatment, including locoregional therapy, was not a factor in predicting survival. This observation is confirmed by the results of a phase 3 study that looked at sorafenib as adjuvant treatment for patients who had no detectable disease after surgical resection or local ablation.17 The trial did not meet its primary endpoint of improved recurrence-free survival. However, the authors observed in this study that 4 patients who underwent resection of the liver before sorafenib had a mean OS of 2.9 years. One patient, who was alive at the time of the study conclusion, received only 22 days of sorafenib treatment and survived for 4.9 years after sorafenib discontinuation. Patients who received concurrent or postsorafenib treatment had higher survival rates.
The cost of treatment in this study was found to be $8,535.87 per year lived. Although formal quality of life assessments were not captured, medication was discontinued at the first sign of disease progression or AE as determined by the provider or patient. When the cost of treatment was adjusted to account for median OS time and VA drug acquisition costs, estimated at average wholesale price minus 40%, the cost of treatment was within the threshold of $50,000-$100,000 per quality-adjusted life-year.7,18Of the 42 patients in this study, 28.6% discontinued therapy due to AEs, compared with 32% observed in the SHARP study. Common GI, dermatologic, and CNS AEs were comparable between the 2 studies. Serious AEs included intracranial hemorrhage, GI hemorrhage, GI perforation, acute liver failure, and acute renal failure; 3 of these events led to death. About 12% of patients experienced bleeding, regardless of severity, compared with the 18% seen in SHARP, despite no prior history of hemorrhage or GI perforation.5 The authors did not find any clinical factors at baseline that predisposed patients to AEs. It was also difficult to distinguish between drug-related AEs and general disease progression.
Although the authors did not find a relationship between dose or dose adjustments and the number or frequency of AEs, there were serious adverse outcomes in this study that were also rare complications observed in SHARP. The decision to start sorafenib should not be taken lightly.
Related: Diagnostic Dilemma of Hepatocellular Carcinoma Presenting as Hepatic Angiomyolipoma
Limitations
This retrospective review had several limitations. In SHARP and other large, multicenter trials, patients were continued on therapy until they experienced both symptomatic and radiographic progression. In this study, patients were discontinued at the first sign of progression, either symptomatic or radiographic or both. Had all patients remained on therapy until symptomatic and radiographic signs of progression were observed, there could have been a better correlation between duration of treatment and OS, symptomatic progression, or radiographic progression. The authors acknowledge, however, that there is diminishing benefit of administering chemotherapy when there are known and potentially serious AEs.
The data for this study were limited due to a small sample size, and it was not powered to evaluate for statistically significant characteristics between the patients who survived at the 1-year follow-up and the patients who did not survive at the 1-year follow-up. This information would be useful to identify potential prognostic factors and guide providers in sorafenib management. Finally, a long-term safety profile could not be established, as patients were evaluated for a 1-year period.
Ultimately, HCC is a multifactorial disease, and it is difficult to account for all potential confounding factors. Additional research, including studies comparing sunitinib or a control group to sorafenib, may provide further insight.
Conclusions
In light of these results, the authors believe that sorafenib may be considered for veterans with unresectable HCC and who are contraindicated for alternative treatments. One-year survival rates were similar to those seen in previous studies. However, there was no clear association between the duration of treatment and OS, and although the medication was well tolerated, there were also serious AEs. It is prudent to continually assess the need for therapy throughout the treatment period.
Pharmacists have a critical role in care for oncology patients, from the integration of certified clinical pharmacist practitioners into hematology-oncology clinics to patient monitoring through oral oncology pharmacy programs.19,20 These programs have been shown to improve patient outcomes and decrease overall health care use and may benefit the veteran population.
In this study, a veteran population achieved a survival rate at the 1-year follow-up similar to that found in SHARP: 40.5% vs 44%. However, OS was markedly shorter: 5.9 months vs 10.7 months. Patients with minimal impact from HCC, such as mild hepatic impairment and high functional status, demonstrated higher survival rates at the 1-year follow-up than did those with significant compromise. Thirty-five patients experienced ≥1 AE, most observed within the first 90 days of treatment, and for 3 patients, sorafenib could not be ruled out as the cause of death.
Sorafenib remains a viable therapeutic option for veterans with advanced HCC. However, it is uncertain how much benefit sorafenib affords to the veteran population, especially with the associated risks.
Author disclosures
The authors report no actual or potential conflicts of interest with regard to this article.
Disclaimer
The opinions expressed herein are those of the authors and do not necessarily reflect those of Federal Practitioner, Frontline Medical Communications Inc., the U.S. Government, or any of its agencies. This article may discuss unlabeled or investigational use of certain drugs. Please review the complete prescribing information for specific drugs or drug combinations—including indications, contraindications, warnings, and adverse effects—before administering pharmacologic therapy to patients.
1. American Cancer Society. Cancer Facts & Figures 2015. Atlanta, GA: American Cancer Society; 2015.
2. El-Serag HB. Epidemiology of viral hepatitis and hepatocellular carcinoma. Gastroenterology. 2012;142(6):1264-1273.
3. Sanyal AJ, Yoon SK, Lencioni R. The etiology of hepatocellular carcinoma and consequences for treatment. Oncologist. 2010;15(suppl 4):14-22.
4. Nexavar [package insert]. Emeryville, CA: Bayer HealthCare Pharmaceuticals, Inc; 2009.
5. National Comprehensive Cancer Network. NCCN clinical practice guidelines in oncology: hepatobiliary cancers. Version 2. 2015. National Comprehensive Cancer Network Website. http://www.nccn.org/professionals/physician_gls/pdf/hepatobiliary.pdf. Accessed October 13, 2015.
6. Llovet JM, Ricci S, Mazzaferro V, et al; SHARP Investigators Study Group. Sorafenib in advanced hepatocellular carcinoma. N Engl J Med. 2008;359(4):378-390.
7. Carr BI, Carroll S, Muszbek N, Gondek K. Economic evaluation of sorafenib in unresectable hepatocellular carcinoma. J Gastroenterol Hepatol. 2010;25(11):1739-1746.
8. Agha Z, Lofgren RP, VanRuiswyk JV, Layde PM. Are patients at Veterans Affairs medical centers sicker? A comparative analysis of health status and medical resource use. Arch Intern Med. 2000;160(21):3252-3257.
9. U.S. Department of Veterans Affairs, Veterans Health Administration. National Viral Hepatitis Program. VHA Directive 1300.01. U.S. Department of Veterans Affairs Website. http://www1.va.gov/vhapublications/ViewPublication.asp?pub_ID=1586. Updated February 22, 2013. Accessed October 13, 2015.
10. Patterson CJ. Best practices in specialty pharmacy management. J Manag Care Pharm. 2013;19(1):42-48.
11. Cheng AL, Kang YK, Chen Z, et al. Efficacy and safety of sorafenib in patients in the Asia-Pacific region with advanced hepatocellular carcinoma: a phase III randomised, double-blind, placebo-controlled trial. Lancet Oncol. 2009;10(1):25-34.
12. Iavarone M, Cabibbo G, Piscaglia F, et al; SOFIA (SOraFenib Italian Assessment) study group. Field-practice study of sorafenib therapy for hepatocellular carcinoma: a prospective multicenter study in Italy. Hepatology. 2011;54(6):2055-2063.
13. Di Fiore F, Rigal O, Ménager C, Michel P, Pfister C. Severe clinical toxicities are correlated with survival in patients with advanced renal cell carcinoma treated with sunitinib and sorafenib. Br J Cancer. 2011;105(12):1811-1813.
14. Bruix J, Sherman M; American Association for the Study of Liver Diseases. Management of hepatocellular carcinoma: an update. Hepatology. 2011;53(3):1020-1022.
15. Blandford L, Dans PE, Ober JD, Wheelock C. Analyzing variations in medication compliance related to individual drug, drug class, and prescribing physician. J Managed Care Pharm. 1999;5(1):47-51.
16. Cabibbo G, Enea M, Attanasio M, Bruix J, Craxì A, Cammà C. A meta-analysis of survival rates of untreated patients in randomized clinical trials of hepatocellular carcinoma. Hepatology. 2010;51(4):1274-1283.
17. Bayer HealthCare. Sorafenib as Adjuvant Treatment in the Prevention of Recurrence of Hepatocellular Carcinoma (STORM). ClinicalTrials.gov Website. https://clinicaltrials.gov/ct2/show/NCT00692770. Updated May 28, 2015. Accessed October 21, 2015.
18. Academy of Managed Care Pharmacy. AMCP Guide to Pharmaceutical Payment Methods, 2009 Update (Version 2.0). J Manag Care Pharm. 2009;15(suppl 6-a):S3-S57.
19. Valgus JM, Faso A, Gregory KM, et al. Integration of a clinical pharmacist into the hematology-oncology clinics at an academic medical center. Am J Health Syst Pharm. 2011;68(7):613-619.
20. Tschida SJ, Aslam S, Lal LS, et al. Outcomes of a specialty pharmacy program for oral oncology medications. Am J Pharm Benefits. 2012;4(4):165-174.
In 2015, more than 35,660 new cases of liver cancer and 24,550 liver cancer-related deaths are expected to occur in the U.S. About 80% of these cases will consist of hepatocellular carcinoma, (HCC).1 The incidence of HCC varies throughout the world: Incidence is as low as 5 in 100,000 individuals in North America and ranges up to > 20 in 100,000 individuals in sub-Saharan Africa and Eastern Asia.2 Nearly half of all cases of HCC are associated with hepatitis B virus (HBV), and another 25% are associated with hepatitis C virus (HCV). Other risk factors for developing HCC include alcoholic liver disease, nonalcoholic steatohepatitis, flatoxin-contaminated food, diabetes, and obesity.3
Therapeutic options for advanced HCC are limited. The FDA approved sorafenib in 2008 for the treatment of unresectable HCC.4 According to the American Association for the Study of Liver Diseases (AASLD) and the Barcelona Clinic Liver Cancer (BCLC) staging system, patients with Stage C liver cancer may undergo a trial of sorafenib.4 National Comprehensive Cancer Network (NCCN) clinical guidelines for hepatobiliary cancers reserve sorafenib for patients with inoperable tumors, metastatic disease, or extensive liver tumor burden.5 Sorafenib is shown to inhibit multiple intracellular and cell surface kinases. Several of these kinases are thought to be involved in tumor cell signaling, angiogenesis, and apoptosis.4 In the Sorafenib HCC Assessment Randomized Protocol (SHARP) trial, median overall survival (OS) was 10.7 months in the sorafenib group and 7.9 months in the placebo group.6 The predicted survival rates at 1 year were 44% in the sorafenib group and 33% in the placebo group.6The economic impact of oral chemotherapy on health care cannot be discounted. At about $50,000 to $100,000 per quality- adjusted life-year, the incremental cost-effectiveness ratio (ICER) of sorafenib over placebo was $62,473 per quality-adjusted life-year in 2007.7The purpose of this retrospective chart review was to evaluate sorafenib for efficacy and safety in a veteran population. Veterans have poorer health and more medical conditions compared with nonveterans.8 Furthermore, in the VHA, about 170,000 veterans have HCV.9 The rate of progression from HCV to HCC is about 3% to 5% annually. More than half of those diagnosed with HCC are late stage, and unfortunately, the 5-year OS rate for patients with liver cancer is 9% and 4% for those patients who are diagnosed at regional and distant stages of the disease.1 As the practice of oncology grows, it is necessary for pharmacists to be involved in the selection of chemotherapeutic agents in order to provide optimal pharmaceutical care.10
Related: VIDEO: NAFLD increasingly causing U.S. hepatocellular carcinoma
Methods
A retrospective chart review was conducted to identify patients who were prescribed sorafenib from November 1, 2007, to September 30, 2011, at the VA Greater Los Angeles Healthcare System (VAGLAHS). Inclusion criteria included patients who had a diagnosis of advanced HCC, who were initiated and managed by a VAGLAHS provider and who were eligible for a 1-year safety evaluation period. The study was approved by the VAGLAHS institutional review board.
Baseline demographic, clinical, laboratory, and medication data were collected. Demographic, clinical, laboratory, and medication data were obtained from CPRS (Computerized Patient Record System) and VistA (Veterans Health Information Systems and Technology Architecture). Data were collected on secured servers and saved on encrypted files. The master list was destroyed once the records control schedule was finalized. No identifiers were collected on the data collection sheet.
Standard practice at VAGLAHS is to monitor European Cooperative Oncology Group Performance Status (ECOG-PS), Child-Pugh class, and alpha-fetoprotein (AFP) at initiation and every 3 months and to obtain laboratory data at initiation and every month before each medication refill. Patients were seen in the Oncology Clinic periodically at the provider’s discretion. The time of drug discontinuation and the reason for drug discontinuation were recorded. Time of death at any point was collected to measure OS.
It was determined that a total sample size of 42 patients would be insufficient to achieve 80% power to demonstrate any hypothesized effects. However, the Fisher exact test was used to calculate P values for simple comparison. Patient demographics and clinical characteristics were reported as total numbers and frequencies when applicable. Survival rate was measured from the time of sorafenib initiation to 1 year after therapy initiation. Overall survival was measured from the time of sorafenib initiation to time of death. Duration of therapy was measured from the time of sorafenib initiation to time of discontinuation, either by provider or by patient.
Results
There were 83 patients who were prescribed sorafenib between November 1, 2007, and September 30, 2011. Of the 83 patients, 27 patients were ineligible for a 1-year follow-up period, 9 patients were diagnosed with non-HCC, 3 were initiated or managed by providers outside the institution, and 2 were not started on therapy. In all, 42 patients met inclusion criteria and had received at least 1 dose of sorafenib. The primary etiologies for HCC were history of alcohol abuse, HCV, and HBV. The primary risk factors were obesity, smoking, and diabetes. Many patients presented with multiple etiologies and risk factors. Ten patients (23.8%) had moderate-to-severe hepatic impairment (Child-Pugh class B or C). Baseline characteristics of these patients are listed in Table 1.
Efficacy
The median OS was 5.9 months and ranged from 21 days to 60 months. There were 17 patients who survived at the 1-year follow-up, including 1 patient who survived 363 days after treatment initiation, yielding an OS rate of 40.5%. Table 2 presents 1-year survival rates with respect to select baseline data. Baseline factors found to be negligible were age, smoking, alcohol abuse, obesity, presence of HCV, medication possession ratio (MPR), prior treatment, macrovascular invasion, and AFP. Neither initial dose regimen, final dose regimen achieved, or average dose correlated with the survival rate at the 1-year follow-up.
Factors possibly associated with a higher probability of survival were baseline ECOG-PS score and baseline Child-Pugh class (Table 2). Patients with an ECOG-PS score of 0 or 1 had a higher survival rate at 1 year than did patients with an ECOG-PS score of ≥ 2 (50% vs 0%, respectively; P = .113). Patients with Child-Pugh class B or C had a lower survival rate at 1 year than did patients with Child-Pugh class A (51% vs 10%, respectively; P = .028). Other indicators were size of largest hepatic lesion ≤ 5 cm, total bilirubin ≤ 2 mg/dL, concurrent treatment, almost exclusively embolization, and treatment after sorafenib discontinuation, such as another oral chemotherapeutic agent or embolization.
The 17 patients who survived at 1 year were reviewed to see if they shared characteristics that indicated a higher probability of survival. The figure shows the baseline ECOG-PS score and the Child-Pugh class the patients who did and did not survive at the 1-year follow-up. In the first group, all patient possessed an ECOG-PS score of 0 or 1, and only 1 patient presented with Child-Pugh class B or C. In contrast, in the group who did not survive at the 1-year follow-up, there were 4 patients with ECOG-PS scores of > 1 and 9 patients who presented with Child-Pugh class B or C. The mean AFP level of this group was < 200 µg/mL, and only 4 patients were followed by Palliative Care Services. The average normalized MPR of this group was 71.9% compared with 85.3% for those who did not survive at the 1-year follow-up.
In patients who experienced at least 1 adverse event (AE), 16 survived, whereas only 1 who did not experience an AE survived (45.7% vs 14.3%, respectively; P = .210). Thirteen patients who experienced ≥ 3 AEs survived at 1 year; and only 3 patients who reported < 3 AEs survived at 1 year (61.9% vs 14.0%, respectively; P = .011). However, when the number of AEs was normalized to duration of treatment per patient, the median frequency of AEs for all patients was 0.61 AEs per month treated. The difference in survival rates grew smaller and less significant between patients who had a frequency of AEs lower than the median compared with those with a higher ratio (52.4% vs 28.6%, respectively; P = .208). Patients affected by AEs in the first 30 days and 90 days of treatment had a survival rate at the 1-year follow-up of 42.4% and 30.2%, respectively. Patients who experienced dermatologic AEs had a higher survival rate than those who did not have dermatologic AEs (60.0% vs 29.6%, respectively; P = .099). This correlation was not found with 2 other classes of AEs, gastrointestinal (50.0% vs 27.8%; P = .208) or neurologic (64.0% vs 41.2%; P = .209).
The median overall time to discontinuation was 3.4 months. The main reasons cited for discontinuing sorafenib at 1 year included symptomatic progression (52.4%), radiographic progression (23.8%), severe AEs (16.7%), and mild-to-moderate AEs (11.9%). There was overlap, as 15 patients discontinued treatment for multiple reasons. For the 22 patients who discontinued medication due to symptomatic progression at 1 year, the median time to discontinuation was 3.8 months. For the 10 patients who discontinued medication due to radiographic progression at 1 year, median time to discontinuation was 5.6 months. Seven patients (16.7%) were still on therapy at 1 year.The study considered the impact of potential dose adjustments on survival rate and safety. The authors compared patients’ prescribed dose with the recommended dose based on the package insert and monthly laboratory values if recorded. The prescribed dose was recorded as appropriate dose, below dose, above dose, or indeterminate due to the lack of current laboratory values. Patients who survived at the 1-year follow-up had a composition of 26%, 21%, 10%, and 43%, respectively. These results were similar to those of patients who did not survive at the 1-year follow-up, 29%, 12%, 30%, and 29%, respectively.
Based on medication refill history and VA acquisition cost, the total prescription drug cost of treating 42 patients with sorafenib was $388,370.40. The total number of days survived for these patients was 16,607 days, which equates to $8,535.87 per year lived.
Safety
Of the 42 patients, 35 patients experienced ≥ 1 AE for a total of 122 AEs reported. The median number of AEs per patient was 2.5. The median time to the first AE was 21 days and ranged from 3 to 244 days. In the first 30 days of treatment, 23 patients (54.7%) reported 47 AEs (39.5%). In the first 90 days of treatment, 33 patients (78.6%) reported 88 AEs (73.9%). Common AEs in both instances were diarrhea, fatigue, erythematous plantar-palmar rash, and nausea (Table 3).
The predominant classes of AEs were GI (39.3%), dermatologic (18.9%), and neurologic (15.6%). Erythematous palmar-plantar rash, also known as hand-foot syndrome, has been noted as a potential dose-limiting sorafenib AE if the rash is recurrent or severe. One patient experienced recurrent grade-2 rashes, and sorafenib was immediately discontinued after an attempt to lower the dose. There were 8 patients who reported serious AEs, and 5 were hospitalized. One patient continued therapy despite GI hemorrhage. The other 4 patients discontinued therapy on hospitalization and were seen for intracranial hemorrhage, GI perforation, acute renal failure, and acute liver failure. In the first 3 cases, sorafenib could not be ruled out as the primary cause of death. None of these patients presented with comorbidities, such as hypertension, which predisposed them to AEs.
Overall, 38 patients ended therapy at the recommended regimen of 400 mg twice daily, and the average total daily dose was 619 mg, just below 80% of the recommended daily dose. Reasons for not achieving 400 mg twice daily included slow titration, AEs, and dose adjustments for compromised renal and hepatic function such as dialysis. Patients who had an ECOG-PS score of 0 or 1 or Child-Pugh class A reported ≥ 3 AEs, but when normalized to duration of treatment, no difference was observed. No correlations were found for average dose, creatinine clearance, aspartate aminotransferase, platelets, total bilirubin, or weight and number or frequency of AEs.
In regard to potential dose adjustments, the doses (400 mg twice daily, 600 mg daily [400 mg + 200 mg in 2 doses], 200 mg twice daily, and 200 mg daily) did not correlate well with AEs. Patients who had < 3 AEs presented with the breakdown 23%, 16%, 22%, and 38%, similar to patients who had ≥ 3 AEs—30%, 19%, 14%, and 37%. Likewise, patients who had a frequency of AEs lower than the median presented with the breakdown 22%, 22%, 15%, and 40% compared with patients who had more AEs than the median—37%, 9%, 23%, and 31%.
Related: Hepatocellular Carcinoma: To Biopsy or Not?
Discussion
Sorafenib is the only oral oncology medication approved by the FDA for treatment of unresectable HCC.3 Prior to sorafenib, the AASLD recommendation was supportive care for patients presenting with BCLC-Stage C liver cancer. However, guidelines changed when SHARP showed that sorafenib provided a survival benefit with a tolerable AE profile. The survival benefit of sorafenib has been replicated in a few large, multicenter trials. In Asia, Cheng and colleagues saw improved median OS of 6.5 months for sorafenib compared with 4.2 months with placebo, and in Italy, Iavarone and colleagues showed a median OS of 10.5 months without a placebo comparator.11,12
In the veteran population for this study, the OS rate of 40.5% was similar to the rate reported in the SHARP study, although the patients’ median OS fell short of the time described in SHARP and other trials. The medical complexities involved in treating veterans may explain this difference. The veteran population is heterogeneous with diverse ethnic backgrounds, several comorbidities, and varying degrees of organ dysfunction. The authors compared survival rates of different subgroups to test the hypothesis that the probability of survival while on therapy should not depend on demographics or medical history. However, in this study, patients with minimal impact from HCC, such as mild hepatic impairment and high-functional status, demonstrated higher survival rates at 1-year follow-up than did those without significant compromise.Although the high prevalence of HCV and alcohol abuse in the veteran population has resulted in a high incidence of hepatic dysfunction, this study suggests that these factors are independent of survival if liver function or integrity has not been compromised.9
Some researchers have hypothesized that clinical toxicities from tyrosine kinase inhibitors may correlate with survival.13 The authors noticed that the presentation of dermatologic AEs may reflect improved survival. In this study, patients who experienced ≥ 1 AE and ≥ 3 AEs had survival rates at the 1-year follow-up of 45.7% and 61.9%, respectively. Moreover, patients affected by AEs in the first 90 days of treatment had a survival rate at the 1-year follow-up of 42.4%.
Caution is advised when drawing conclusions from the number of AEs or when they appear, because this may falsely favor correlation. Patients who survive longer have additional time to report an AE. Therefore, the authors also looked at the ratio of AEs over time per patient to consider the number of AEs per duration of treatment and saw that there was little difference in survival rate in this regard. When considering patients affected by AEs only in the first 30 days of treatment, the survival rate at the 1-year follow-up fell to 30.2%.
A more likely factor for the survival of the 17 patients who were alive at the 1-year follow-up was their overall health relative to the rest of the study group. Overall health may indicate survival independent of sorafenib. The group of 17 who survived at the 1-year follow-up reflected a population that was different from the rest of the study population. The subset was generally healthier with better ECOG-PS scores and Child-Pugh classes, was not followed by Palliative Care Services, and had a mean AFP level under the threshold for diagnosis of HCC in patients who present with hepatic lesions and elevated AFP.14 This subset’s MPR, a surrogate marker for adherence, was less than the accepted threshold in clinical practice for oral medications.15Evaluating the patient’s dose regimen was expected to reveal a relationship between dosing and clinical outcomes, such as low survival rates with low doses or more AEs with high doses. However, the authors were not able to establish this link. In fact, the median time to discontinuation of 3.4 months for the study group, or duration of treatment, was much shorter than the median OS of 5.9 months.
These findings were consistent with Cabibbo and colleagues, who conducted a meta-analysis of survival rates for untreated patients and found that impaired performance status and Child-Pugh class B or C were independently associated with shorter survival.16 The SHARP study and Cheng and colleagues also attempted to exclude patients who were not Child-Pugh class A in their studies, which suggests a negligible correlation between sorafenib and survival time and a close relationship between baseline clinical status and survival.
The authors determined that prior treatment, including locoregional therapy, was not a factor in predicting survival. This observation is confirmed by the results of a phase 3 study that looked at sorafenib as adjuvant treatment for patients who had no detectable disease after surgical resection or local ablation.17 The trial did not meet its primary endpoint of improved recurrence-free survival. However, the authors observed in this study that 4 patients who underwent resection of the liver before sorafenib had a mean OS of 2.9 years. One patient, who was alive at the time of the study conclusion, received only 22 days of sorafenib treatment and survived for 4.9 years after sorafenib discontinuation. Patients who received concurrent or postsorafenib treatment had higher survival rates.
The cost of treatment in this study was found to be $8,535.87 per year lived. Although formal quality of life assessments were not captured, medication was discontinued at the first sign of disease progression or AE as determined by the provider or patient. When the cost of treatment was adjusted to account for median OS time and VA drug acquisition costs, estimated at average wholesale price minus 40%, the cost of treatment was within the threshold of $50,000-$100,000 per quality-adjusted life-year.7,18Of the 42 patients in this study, 28.6% discontinued therapy due to AEs, compared with 32% observed in the SHARP study. Common GI, dermatologic, and CNS AEs were comparable between the 2 studies. Serious AEs included intracranial hemorrhage, GI hemorrhage, GI perforation, acute liver failure, and acute renal failure; 3 of these events led to death. About 12% of patients experienced bleeding, regardless of severity, compared with the 18% seen in SHARP, despite no prior history of hemorrhage or GI perforation.5 The authors did not find any clinical factors at baseline that predisposed patients to AEs. It was also difficult to distinguish between drug-related AEs and general disease progression.
Although the authors did not find a relationship between dose or dose adjustments and the number or frequency of AEs, there were serious adverse outcomes in this study that were also rare complications observed in SHARP. The decision to start sorafenib should not be taken lightly.
Related: Diagnostic Dilemma of Hepatocellular Carcinoma Presenting as Hepatic Angiomyolipoma
Limitations
This retrospective review had several limitations. In SHARP and other large, multicenter trials, patients were continued on therapy until they experienced both symptomatic and radiographic progression. In this study, patients were discontinued at the first sign of progression, either symptomatic or radiographic or both. Had all patients remained on therapy until symptomatic and radiographic signs of progression were observed, there could have been a better correlation between duration of treatment and OS, symptomatic progression, or radiographic progression. The authors acknowledge, however, that there is diminishing benefit of administering chemotherapy when there are known and potentially serious AEs.
The data for this study were limited due to a small sample size, and it was not powered to evaluate for statistically significant characteristics between the patients who survived at the 1-year follow-up and the patients who did not survive at the 1-year follow-up. This information would be useful to identify potential prognostic factors and guide providers in sorafenib management. Finally, a long-term safety profile could not be established, as patients were evaluated for a 1-year period.
Ultimately, HCC is a multifactorial disease, and it is difficult to account for all potential confounding factors. Additional research, including studies comparing sunitinib or a control group to sorafenib, may provide further insight.
Conclusions
In light of these results, the authors believe that sorafenib may be considered for veterans with unresectable HCC and who are contraindicated for alternative treatments. One-year survival rates were similar to those seen in previous studies. However, there was no clear association between the duration of treatment and OS, and although the medication was well tolerated, there were also serious AEs. It is prudent to continually assess the need for therapy throughout the treatment period.
Pharmacists have a critical role in care for oncology patients, from the integration of certified clinical pharmacist practitioners into hematology-oncology clinics to patient monitoring through oral oncology pharmacy programs.19,20 These programs have been shown to improve patient outcomes and decrease overall health care use and may benefit the veteran population.
In this study, a veteran population achieved a survival rate at the 1-year follow-up similar to that found in SHARP: 40.5% vs 44%. However, OS was markedly shorter: 5.9 months vs 10.7 months. Patients with minimal impact from HCC, such as mild hepatic impairment and high functional status, demonstrated higher survival rates at the 1-year follow-up than did those with significant compromise. Thirty-five patients experienced ≥1 AE, most observed within the first 90 days of treatment, and for 3 patients, sorafenib could not be ruled out as the cause of death.
Sorafenib remains a viable therapeutic option for veterans with advanced HCC. However, it is uncertain how much benefit sorafenib affords to the veteran population, especially with the associated risks.
Author disclosures
The authors report no actual or potential conflicts of interest with regard to this article.
Disclaimer
The opinions expressed herein are those of the authors and do not necessarily reflect those of Federal Practitioner, Frontline Medical Communications Inc., the U.S. Government, or any of its agencies. This article may discuss unlabeled or investigational use of certain drugs. Please review the complete prescribing information for specific drugs or drug combinations—including indications, contraindications, warnings, and adverse effects—before administering pharmacologic therapy to patients.
1. American Cancer Society. Cancer Facts & Figures 2015. Atlanta, GA: American Cancer Society; 2015.
2. El-Serag HB. Epidemiology of viral hepatitis and hepatocellular carcinoma. Gastroenterology. 2012;142(6):1264-1273.
3. Sanyal AJ, Yoon SK, Lencioni R. The etiology of hepatocellular carcinoma and consequences for treatment. Oncologist. 2010;15(suppl 4):14-22.
4. Nexavar [package insert]. Emeryville, CA: Bayer HealthCare Pharmaceuticals, Inc; 2009.
5. National Comprehensive Cancer Network. NCCN clinical practice guidelines in oncology: hepatobiliary cancers. Version 2. 2015. National Comprehensive Cancer Network Website. http://www.nccn.org/professionals/physician_gls/pdf/hepatobiliary.pdf. Accessed October 13, 2015.
6. Llovet JM, Ricci S, Mazzaferro V, et al; SHARP Investigators Study Group. Sorafenib in advanced hepatocellular carcinoma. N Engl J Med. 2008;359(4):378-390.
7. Carr BI, Carroll S, Muszbek N, Gondek K. Economic evaluation of sorafenib in unresectable hepatocellular carcinoma. J Gastroenterol Hepatol. 2010;25(11):1739-1746.
8. Agha Z, Lofgren RP, VanRuiswyk JV, Layde PM. Are patients at Veterans Affairs medical centers sicker? A comparative analysis of health status and medical resource use. Arch Intern Med. 2000;160(21):3252-3257.
9. U.S. Department of Veterans Affairs, Veterans Health Administration. National Viral Hepatitis Program. VHA Directive 1300.01. U.S. Department of Veterans Affairs Website. http://www1.va.gov/vhapublications/ViewPublication.asp?pub_ID=1586. Updated February 22, 2013. Accessed October 13, 2015.
10. Patterson CJ. Best practices in specialty pharmacy management. J Manag Care Pharm. 2013;19(1):42-48.
11. Cheng AL, Kang YK, Chen Z, et al. Efficacy and safety of sorafenib in patients in the Asia-Pacific region with advanced hepatocellular carcinoma: a phase III randomised, double-blind, placebo-controlled trial. Lancet Oncol. 2009;10(1):25-34.
12. Iavarone M, Cabibbo G, Piscaglia F, et al; SOFIA (SOraFenib Italian Assessment) study group. Field-practice study of sorafenib therapy for hepatocellular carcinoma: a prospective multicenter study in Italy. Hepatology. 2011;54(6):2055-2063.
13. Di Fiore F, Rigal O, Ménager C, Michel P, Pfister C. Severe clinical toxicities are correlated with survival in patients with advanced renal cell carcinoma treated with sunitinib and sorafenib. Br J Cancer. 2011;105(12):1811-1813.
14. Bruix J, Sherman M; American Association for the Study of Liver Diseases. Management of hepatocellular carcinoma: an update. Hepatology. 2011;53(3):1020-1022.
15. Blandford L, Dans PE, Ober JD, Wheelock C. Analyzing variations in medication compliance related to individual drug, drug class, and prescribing physician. J Managed Care Pharm. 1999;5(1):47-51.
16. Cabibbo G, Enea M, Attanasio M, Bruix J, Craxì A, Cammà C. A meta-analysis of survival rates of untreated patients in randomized clinical trials of hepatocellular carcinoma. Hepatology. 2010;51(4):1274-1283.
17. Bayer HealthCare. Sorafenib as Adjuvant Treatment in the Prevention of Recurrence of Hepatocellular Carcinoma (STORM). ClinicalTrials.gov Website. https://clinicaltrials.gov/ct2/show/NCT00692770. Updated May 28, 2015. Accessed October 21, 2015.
18. Academy of Managed Care Pharmacy. AMCP Guide to Pharmaceutical Payment Methods, 2009 Update (Version 2.0). J Manag Care Pharm. 2009;15(suppl 6-a):S3-S57.
19. Valgus JM, Faso A, Gregory KM, et al. Integration of a clinical pharmacist into the hematology-oncology clinics at an academic medical center. Am J Health Syst Pharm. 2011;68(7):613-619.
20. Tschida SJ, Aslam S, Lal LS, et al. Outcomes of a specialty pharmacy program for oral oncology medications. Am J Pharm Benefits. 2012;4(4):165-174.
Idiopathic Intracranial Hypertension in Pregnancy
A 27-year-old white woman presented to the clinic with headaches and decreased vision through her reading glasses while performing near tasks. Her medical history was significant for herpes simplex, hyperlipidemia, and migraine headaches with aura. Her migraines began following an earlier motor vehicle accident, and her most recent magnetic resonance imaging (MRI) showed no abnormalities. Her current medications included prophylactic acyclovir for herpes and acetaminophen and caffeine tablets as needed for headache. She reported no other trauma or surgery and no known allergies. The patient’s best-corrected Snellen visual acuities in both eyes were 20/20 (distance) and 20/30 (near).
Preliminary testing, including pupils, extraocular motilities, confrontation fields, and color vision, were all within normal limits. Her slit-lamp examination was unremarkable. A dilated fundus examination revealed crowded, elevated discs without vessel obscuration, hemorrhage, hyperemia, or drusen (Figure 1). The fundus examination was otherwise unremarkable. Optical coherence tomography of the optic nerves showed increased nerve fiber layer thickness in both eyes (Figure 2). Her blood pressure (BP) at this visit was 106/77 mm/Hg.
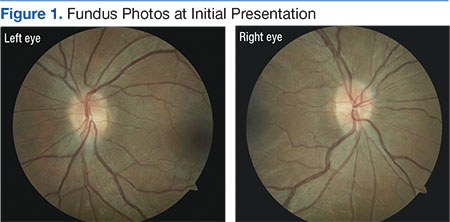
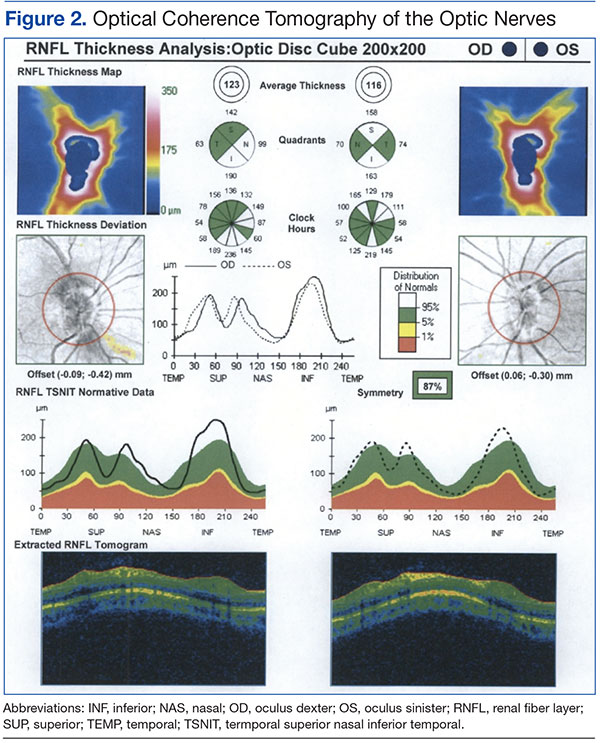
The diagnosis based on these findings was bilateral optic nerve elevation with long-standing migraine headaches. The plan was for the patient to return to the clinic for repeat visual field testing and B-scan ultrasonography to rule out buried optic nerve head drusen.
Two months later, the patient presented to the clinic 19 weeks pregnant and reported that her headaches had increased in frequency, but she had no diplopia. All preliminary testing, including visual acuities, pupil reaction, color vision, and slit-lamp examination remained normal. Fundus examination showed the patient’s nerves were unchanged in appearance from the initial presentation. Visual fields revealed an enlarged blind spot in the right eye and paracentral defects in the left eye. The B-scan testing was negative for optic nerve drusen. Due to the increased frequency of headaches, pregnancy, and suspicious optic nerves, an urgent consult was placed to neurology.
At the neurology appointment 1 month later, the patient was diagnosed with migraine headache syndrome and idiopathic intracranial hypertension (IIH). The neurologist believed her headaches might have been resulting from analgesic rebound. He suggested that the patient discontinue or decrease use of oral butalbital, acetaminophen and caffeine tablets, and other forms of caffeine. It was decided that divalproxen sodium and verapamil were not feasible due to pregnancy. The neurologist started her on oral acetazolamide 500 mg twice daily.
The patient returned to her obstetrician 1 month later for a routine follow-up; the headaches had worsened and were now accompanied by nausea and vomiting twice daily on average. Her medications still included acetaminophen and caffeine tablets, although it had been recommended she discontinue them, prochlorperazine, and acetazolamide. Due to the worsening of her symptoms and visual fields (eFigure 1), the obstetrician recommended that the patient deliver by cesarean section at 38 to 39 weeks.
(eFigure 1.Visual Fields at Follow-up 1 and 2)
Right eye
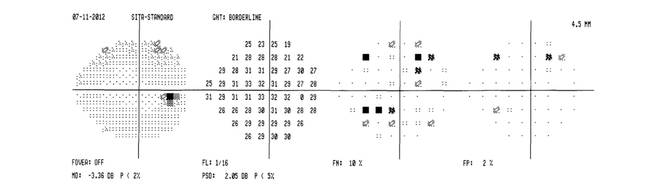
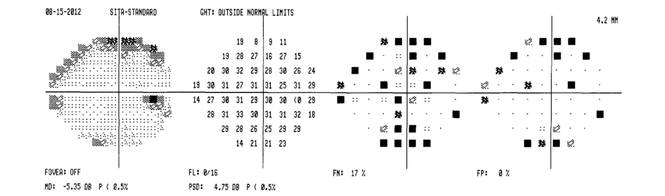
Left Eye
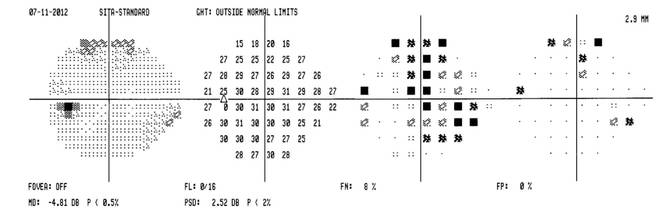
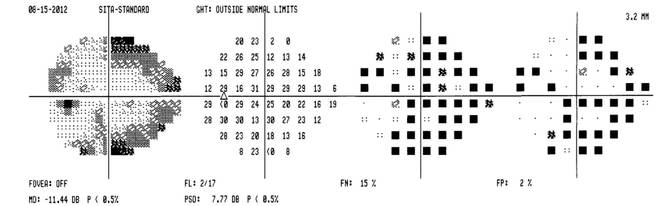
Following an uncomplicated cesarean delivery at 38 weeks, the patient returned to the clinic for visual field testing. Humphrey visual fields were full in the right eye and showed some scattered central depressions in the left. Both eyes were significantly improved from previous fields (eFigure 2) . The patient had discontinued acetazolamide and reported minor tension headaches she believed were due to lack of sleep but stated that she was no longer having migraines. There was no papilledema noted on fundus examination, and Snellen distance visual acuity measured 20/20 in both eyes. An MRI had been performed after delivery and was negative for intracranial hemorrhage, mass, or hydrocephalus).
(eFigure 2. Visual Fields Postpartum)
Right eye
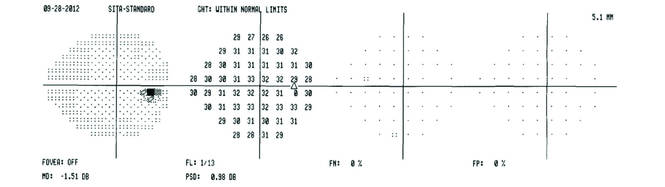
Left eye
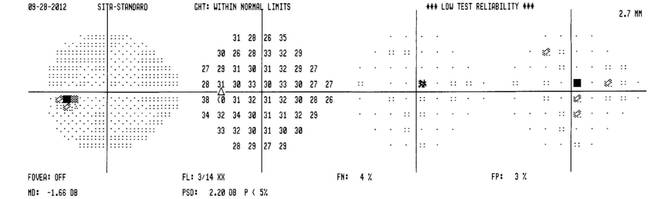
Three months later, the patient returned for her yearly comprehensive examination. At that visit, she reported a decrease in frequency of the migraine headaches. Optical coherence tomography was performed and showed a significant decrease in optic nerve head swelling.
Related: Diabetes on the Rise Among Other Pregnancy Problems
Clinical Picture
Idiopathic intracranial hypertension presents clinically with signs and symptoms of increased intracranial pressure (ICP). Headache is the most common symptom, usually presenting as daily and pulsatile.1 Nausea may be associated with the headache, although vomiting is rare, and the headache may awaken the patient. The headache may remain after resolution of elevated ICP (Table).2
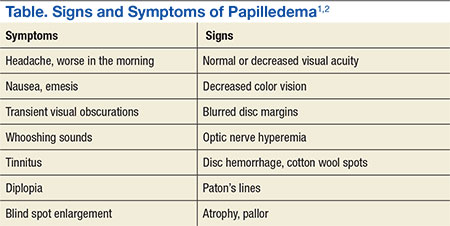
Papilledema is the most common sign of IIH.1,2 Visual loss associated with papilledema is generally mild at first but progressive. Transient blur lasts usually 30 seconds and may be monocular or binocular.1 The cause is thought to be related to transient ischemia of the optic nerve.1 Vision loss is typically reversible with resolution of optic nerve swelling, but 25% of patients may develop optic atrophy, which results in permanent vision loss.2 Common patterns of visual abnormalities include enlargement of the physiologic blind spot, inferonasal and arcuate defects, and eventually severe peripheral constriction.1,2 It is imperative that all patients with IIH have visual field testing performed.
About one-third of patients with IIH experience diplopia. This binocular, horizontal diplopia is caused by a sixth nerve palsy in 10% to 20% of patients.1 Cranial nerves II, VI, and VII make a 90-degree bend and seem to be prone to damage at the site of the bend.1
Pulse-synchronous tinnitus is common in IIH as well.2,3 This generally occurs unilaterally and may be eliminated by jugular compression or the head turning to the ipsilateral side.1,3 The sound is caused by the transmission of an increase in the vascular pulse due to high pressure on the cerebrospinal fluid (CSF).1,3
Idiopathic intracranial hypertension most typically presents in obese women of childbearing age.1-3 An increasing degree of obesity is generally associated with an increased risk of vision loss.1,2 Men seem to have worse acuity and visual fields at presentation than do women.2 Men are less likely to report headaches than are women and, therefore, have double the likelihood of severe vision loss.2 Hence, closer monitoring and more aggressive intervention is recommended for men due to their lesser tendency for headaches.2 Black patients also demonstrate more aggressive disease and, therefore, require closer monitoring and early aggressive intervention.1,2
Papilledema is the most common sign of IIH and may be caused by several processes. In this case, most were ruled out given the patient’s normal visual acuities, pupillary reaction, color vision testing, BP measurement, and B-scan imaging. The patient’s systemic history was negative for thyroid-related disease, diabetes, hypertension, autoimmune disease, or infection. She had no family history of vision loss or hereditary ocular conditions. The most recent MRI was negative for any long-standing space-occupying lesion or hydrocephalus.
Pathophysiology
Several mechanisms leading to increased ICP have been proposed. These include increased brain water content, excess CSF production, reduced CSF absorption, and increased cerebral venous pressure.2,3 There is also a suspicion of the role of sex hormones in IIH due to its high predilection for females.2
The role of vitamin A metabolism has also been studied in IIH.1 Retinol levels are elevated in the CSF of patients with IIH. Patients may ingest an abnormally large amount of vitamin A, metabolize it abnormally, or be sensitive to its effects.2,4 The function of adipose tissue as an actively secreting endocrine tissue may play a role in IIH due to its release of adipose tissue-derived retinol binding protein.2 Other adipose-produced cytokines include leptin, which has been implicated in IIH due to its elevated levels found in the CSF of patients with IIH.2
Stenosis of the cerebral sinuses is another proposed mechanism of IIH.1-3 Cerebrospinal fluid exits the cranium into the venous sinuses via the arachnoid villi.2 An obstruction in these sinuses may impair CSF outflow and result in intracranial hypertension. Microthrombosis caused by hypercoaguable disorders may result in increased cerebral venous pressure and impaired CSF absorption as well.2,4
Some medications have been found in association with IIH. These include tetracycline, cyclosporine, lithium, nalidixic acid, nitrofurantoin, oral contraceptives, levonorgestrel, danaxol, and tamoxifen.1-4 Tetracycline seems to have the strongest association with IIH and should be discontinued in those patients where the association is very likely to be the causative factor.2 The link to oral contraceptives may occur simply due to their association with young women most at risk for IIH.1-3
Related:Young Man With Headache, Confusion, and Hearing Loss
Management
The goals of treatment with IIH are to preserve vision and relieve symptoms, particularly headache. The general recommendation is that pregnant women with IIH should be managed and treated the same as any other patient with IIH. However, imaging and some drug contraindications exist between these 2 groups.
The diagnostic test for IIH is a lumbar puncture, which is also the most effective treatment.1-3,5 Lumbar puncture should be performed in the relaxed lateral decubitus position without sedation.1-3 The opening pressure should be measured and is the most clinically significant diagnostic tool for diagnosis of IIH. Opening pressures of > 250 mm H2O are diagnostic of IIH.1-3,5
Weight loss is an essential part of treatment in obese patients with IIH.1-3 A low-calorie, low-salt diet with mild fluid restriction seems to reverse the symptoms of IIH. A 5% to 10% reduction in body weight may reduce symptoms and signs of IIH.2
Carbonic anhydrase inhibitors (CAIs), such as acetalzolamide, have a multifactorial role in IIH.4 They are usually prescribed in 1 to 2 grams over several doses and function by decreasing CSF production.1 Carbonic anhydrase inhibitors also are known to change the taste of foods and may, therefore, aid in weight loss.1,2 Patients prescribed CAIs commonly experience a tingling in their fingers, toes, and perioral region, an indication that the medication is working.1,2 A rare but serious adverse effect (AE) is aplastic anemia, which generally occurs in the first 6 months of treatment in elderly patients.1 The use of CAIs in pregnancy is controversial, and although rare complications are reported, it is considered a class C drug.5
In patients with rapidly progressive vision loss but with minimal headache, optic nerve sheath fenestration (ONSF) is the surgical treatment of choice.2,3,6 In this procedure, a window or series of slits are created behind the globe in the optic nerve sheath.1 About 50% of patients achieve adequate headache control with ONSF, especially for frontal headaches.1,2
For patients with vision loss, papilledema, and headache that do not respond to medical therapy, a CSF diversion procedure is the preferred treatment. Cerebrospinal fluid diversion with ventriculoperitoneal or lumboperitoneal shunts may prevent progressive loss of vision.1,4,6 However, variable response rates and shunt failure requiring subsequent revisions are common and may occur in as many as half of patients undergoing these procedures.1
Increased intracranial venous pressure due to stenosis of the venous sinuses has been thought to be a possible cause of IIH. Stenting of the transverse venous sinus stenosis has been shown to reduce cerebral venous pressure, reduce ICP, and improve symptoms in patients with IIH.1-3 It is unclear whether elevations in ICP cause transverse sinus stenosis or whether transverse sinus stenosis causes increased ICP.2 Regardless, stents have a high rate of complications, including subdural hemorrhage, venous sinus perforation, in-stent thrombosis, and recurrent stenosis proximal to the stent.2
Steroids have been used to treat IIH in the past, although their mechanism of action remains unclear.2 There may be recurrence of papilledema if they are tapered too quickly. Due to their association with long-term AEs, including weight gain, they should be avoided.2
Management in Pregnancy
Several studies agree that vision loss occurs in the same frequency in pregnant and nonpregnant patients with IIH.4,7 Idiopathic intracranial hypertension can occur in any trimester in pregnancy. It has been found that patients have the same spontaneous abortion rate and visual outcomes as the general population.6-8 It has also been concluded that treatment should be the same in both patient populations with slight variability in the use of acetazolamide.4,6,7
The use of dilating drops during pregnancy is controversial. Although there have been no teratogenic effects reported with use of topical anesthetics and dilating drops, all drugs should be avoided during the first trimester.7-10 Guidelines have been established by the American Congress of Obstetricians and Gynecologists for X-ray examination and exposure during pregnancy. It has been determined that exposure from a single diagnostic X-ray procedure does not result in harmful fetal effects.11 Magnetic resonance imaging is not associated with any known adverse fetal effects and is a better imaging option during pregnancy, because it is not associated with the use of ionizing radiation.11
The use of CAIs in the first trimester is controversial.4,7 Some believe it should be avoided because it is a Pregnancy Category C drug. However, a single case of sacrococcygeal teratoma has been reported in humans; therefore, some believe this is not a strong basis for withholding the medication in patients with the potential risk for severe vision loss.4,7 In this case, a consult to the patient’s obstetrician was made, and the use of acetazolamide had no effect on the health of the baby.
In pregnant women with IIH with progressive vision loss, failed treatment, or nonadherence, surgery may be necessary. Optic nerve sheath fenestration is preferred due to lower morbidity and mortality compared with shunting procedures.1,2,4,6 The growing fetus may be affected by the peritoneal end of the shunt.4
Related: 49-Year-Old Woman With a Broken Heart
Conclusions
Vision loss associated with IIH can be severe and permanent if left untreated. The best treatments and often the most effective involve weight loss and lumbar puncture. Acetazolamide has been a proven effective treatment in some patients, but some debate exists over the safety of its use during pregnancy. This patient did not have any AEs from its use; however, it did not prove valuable in her treatment. Studies often disagree on the use of acetazolamide in pregnancy; however, all agree that proper patient counseling on potential AEs and management by an obstetrician are important. With proper management, pregnant women with IIH have had outcomes similar to those of the general population.
Author disclosures
The authors report no actual or potential conflicts of interest with regard to this article.
Disclaimer
The opinions expressed herein are those of the authors and do not necessarily reflect those of Federal Practitioner, Frontline Medical Communications Inc., the U.S. Government, or any of its agencies. This article may discuss unlabeled or investigational use of certain drugs. Please review the complete prescribing information for specific drugs or drug combinations—including indications, contraindications, warnings, and adverse effects—before administering pharmacologic therapy to patients.
1. Wall M. Idiopathic intracranial hypertension. Neurol Clin. 2010;28(3):593-617.
2. Bruce BB, Biousee V, Newman NJ. Update on idiopathic intracranial hypertension. Am J Ophthalmol. 2011;152(2):163-169.
3. Fields JD, Javendani PP, Falardeau J, et al. Dural venous sinus angioplasty and stenting for the treatment of idiopathic intracranial hypertension. J Neurointerv Surg. 2013;5(1):62-68.
4. Evans RW, Lee AG. Idiopathic intracranial hypertension in pregnancy. Headache. 2010;50(9):1513-1515.
5. Friedman DI, Jacobson DM. Diagnostic criteria for idiopathic intracranial hypertension. Neurology. 2002;59(10):1492-1495.
6. Martínez-Varea A, Diago-Almela VJ, Abad-Carrascosa A, Perales-Marín A. Progressive visual loss in a pregnant woman with idiopathic intracranial hypertension. Eur J Obstet Gynecol Reprod Biol. 2012;163(1):117-122.
7. Falardeau J, Lobb B, Golden S, Maxfield SD, Tanne E. The use of acetazolamide during pregnancy in intracranial hypertension patients. J Neuroophthalmol. 2013;33(1):9-12.
8. Dinn RB, Harris A, Marcus PS. Ocular changes in pregnancy. Obstet Gynecol Surg. 2003;58(2):137-144.
9. Shultz KL, Birnbaum AD, Goldstein DA. Ocular disease in pregnancy. Curr Opin Ophthalmol. 2005;16(5):308-314.
10. Chung CY, Kwok AKH, Chung KL. Use of ophthalmic medications during pregnancy. Hong Kong Med J. 2004;10(3):191-195.
11. American Congress of Obstetricians and Gynecologists. Committee Opinion. Guidelines for diagnostic imaging during pregnancy. American Congress of Obstetricians and Gynecologists Website. http://www.acog.org/-/media/Committee-Opinions/Committee-on-Obstetric-Practice/co299.pdf. Published 2004. Accessed October 9, 2015.
A 27-year-old white woman presented to the clinic with headaches and decreased vision through her reading glasses while performing near tasks. Her medical history was significant for herpes simplex, hyperlipidemia, and migraine headaches with aura. Her migraines began following an earlier motor vehicle accident, and her most recent magnetic resonance imaging (MRI) showed no abnormalities. Her current medications included prophylactic acyclovir for herpes and acetaminophen and caffeine tablets as needed for headache. She reported no other trauma or surgery and no known allergies. The patient’s best-corrected Snellen visual acuities in both eyes were 20/20 (distance) and 20/30 (near).
Preliminary testing, including pupils, extraocular motilities, confrontation fields, and color vision, were all within normal limits. Her slit-lamp examination was unremarkable. A dilated fundus examination revealed crowded, elevated discs without vessel obscuration, hemorrhage, hyperemia, or drusen (Figure 1). The fundus examination was otherwise unremarkable. Optical coherence tomography of the optic nerves showed increased nerve fiber layer thickness in both eyes (Figure 2). Her blood pressure (BP) at this visit was 106/77 mm/Hg.
The diagnosis based on these findings was bilateral optic nerve elevation with long-standing migraine headaches. The plan was for the patient to return to the clinic for repeat visual field testing and B-scan ultrasonography to rule out buried optic nerve head drusen.
Two months later, the patient presented to the clinic 19 weeks pregnant and reported that her headaches had increased in frequency, but she had no diplopia. All preliminary testing, including visual acuities, pupil reaction, color vision, and slit-lamp examination remained normal. Fundus examination showed the patient’s nerves were unchanged in appearance from the initial presentation. Visual fields revealed an enlarged blind spot in the right eye and paracentral defects in the left eye. The B-scan testing was negative for optic nerve drusen. Due to the increased frequency of headaches, pregnancy, and suspicious optic nerves, an urgent consult was placed to neurology.
At the neurology appointment 1 month later, the patient was diagnosed with migraine headache syndrome and idiopathic intracranial hypertension (IIH). The neurologist believed her headaches might have been resulting from analgesic rebound. He suggested that the patient discontinue or decrease use of oral butalbital, acetaminophen and caffeine tablets, and other forms of caffeine. It was decided that divalproxen sodium and verapamil were not feasible due to pregnancy. The neurologist started her on oral acetazolamide 500 mg twice daily.
The patient returned to her obstetrician 1 month later for a routine follow-up; the headaches had worsened and were now accompanied by nausea and vomiting twice daily on average. Her medications still included acetaminophen and caffeine tablets, although it had been recommended she discontinue them, prochlorperazine, and acetazolamide. Due to the worsening of her symptoms and visual fields (eFigure 1), the obstetrician recommended that the patient deliver by cesarean section at 38 to 39 weeks.
(eFigure 1.Visual Fields at Follow-up 1 and 2)
Right eye
Left Eye
Following an uncomplicated cesarean delivery at 38 weeks, the patient returned to the clinic for visual field testing. Humphrey visual fields were full in the right eye and showed some scattered central depressions in the left. Both eyes were significantly improved from previous fields (eFigure 2) . The patient had discontinued acetazolamide and reported minor tension headaches she believed were due to lack of sleep but stated that she was no longer having migraines. There was no papilledema noted on fundus examination, and Snellen distance visual acuity measured 20/20 in both eyes. An MRI had been performed after delivery and was negative for intracranial hemorrhage, mass, or hydrocephalus).
(eFigure 2. Visual Fields Postpartum)
Right eye
Left eye
Three months later, the patient returned for her yearly comprehensive examination. At that visit, she reported a decrease in frequency of the migraine headaches. Optical coherence tomography was performed and showed a significant decrease in optic nerve head swelling.
Related: Diabetes on the Rise Among Other Pregnancy Problems
Clinical Picture
Idiopathic intracranial hypertension presents clinically with signs and symptoms of increased intracranial pressure (ICP). Headache is the most common symptom, usually presenting as daily and pulsatile.1 Nausea may be associated with the headache, although vomiting is rare, and the headache may awaken the patient. The headache may remain after resolution of elevated ICP (Table).2
Papilledema is the most common sign of IIH.1,2 Visual loss associated with papilledema is generally mild at first but progressive. Transient blur lasts usually 30 seconds and may be monocular or binocular.1 The cause is thought to be related to transient ischemia of the optic nerve.1 Vision loss is typically reversible with resolution of optic nerve swelling, but 25% of patients may develop optic atrophy, which results in permanent vision loss.2 Common patterns of visual abnormalities include enlargement of the physiologic blind spot, inferonasal and arcuate defects, and eventually severe peripheral constriction.1,2 It is imperative that all patients with IIH have visual field testing performed.
About one-third of patients with IIH experience diplopia. This binocular, horizontal diplopia is caused by a sixth nerve palsy in 10% to 20% of patients.1 Cranial nerves II, VI, and VII make a 90-degree bend and seem to be prone to damage at the site of the bend.1
Pulse-synchronous tinnitus is common in IIH as well.2,3 This generally occurs unilaterally and may be eliminated by jugular compression or the head turning to the ipsilateral side.1,3 The sound is caused by the transmission of an increase in the vascular pulse due to high pressure on the cerebrospinal fluid (CSF).1,3
Idiopathic intracranial hypertension most typically presents in obese women of childbearing age.1-3 An increasing degree of obesity is generally associated with an increased risk of vision loss.1,2 Men seem to have worse acuity and visual fields at presentation than do women.2 Men are less likely to report headaches than are women and, therefore, have double the likelihood of severe vision loss.2 Hence, closer monitoring and more aggressive intervention is recommended for men due to their lesser tendency for headaches.2 Black patients also demonstrate more aggressive disease and, therefore, require closer monitoring and early aggressive intervention.1,2
Papilledema is the most common sign of IIH and may be caused by several processes. In this case, most were ruled out given the patient’s normal visual acuities, pupillary reaction, color vision testing, BP measurement, and B-scan imaging. The patient’s systemic history was negative for thyroid-related disease, diabetes, hypertension, autoimmune disease, or infection. She had no family history of vision loss or hereditary ocular conditions. The most recent MRI was negative for any long-standing space-occupying lesion or hydrocephalus.
Pathophysiology
Several mechanisms leading to increased ICP have been proposed. These include increased brain water content, excess CSF production, reduced CSF absorption, and increased cerebral venous pressure.2,3 There is also a suspicion of the role of sex hormones in IIH due to its high predilection for females.2
The role of vitamin A metabolism has also been studied in IIH.1 Retinol levels are elevated in the CSF of patients with IIH. Patients may ingest an abnormally large amount of vitamin A, metabolize it abnormally, or be sensitive to its effects.2,4 The function of adipose tissue as an actively secreting endocrine tissue may play a role in IIH due to its release of adipose tissue-derived retinol binding protein.2 Other adipose-produced cytokines include leptin, which has been implicated in IIH due to its elevated levels found in the CSF of patients with IIH.2
Stenosis of the cerebral sinuses is another proposed mechanism of IIH.1-3 Cerebrospinal fluid exits the cranium into the venous sinuses via the arachnoid villi.2 An obstruction in these sinuses may impair CSF outflow and result in intracranial hypertension. Microthrombosis caused by hypercoaguable disorders may result in increased cerebral venous pressure and impaired CSF absorption as well.2,4
Some medications have been found in association with IIH. These include tetracycline, cyclosporine, lithium, nalidixic acid, nitrofurantoin, oral contraceptives, levonorgestrel, danaxol, and tamoxifen.1-4 Tetracycline seems to have the strongest association with IIH and should be discontinued in those patients where the association is very likely to be the causative factor.2 The link to oral contraceptives may occur simply due to their association with young women most at risk for IIH.1-3
Related:Young Man With Headache, Confusion, and Hearing Loss
Management
The goals of treatment with IIH are to preserve vision and relieve symptoms, particularly headache. The general recommendation is that pregnant women with IIH should be managed and treated the same as any other patient with IIH. However, imaging and some drug contraindications exist between these 2 groups.
The diagnostic test for IIH is a lumbar puncture, which is also the most effective treatment.1-3,5 Lumbar puncture should be performed in the relaxed lateral decubitus position without sedation.1-3 The opening pressure should be measured and is the most clinically significant diagnostic tool for diagnosis of IIH. Opening pressures of > 250 mm H2O are diagnostic of IIH.1-3,5
Weight loss is an essential part of treatment in obese patients with IIH.1-3 A low-calorie, low-salt diet with mild fluid restriction seems to reverse the symptoms of IIH. A 5% to 10% reduction in body weight may reduce symptoms and signs of IIH.2
Carbonic anhydrase inhibitors (CAIs), such as acetalzolamide, have a multifactorial role in IIH.4 They are usually prescribed in 1 to 2 grams over several doses and function by decreasing CSF production.1 Carbonic anhydrase inhibitors also are known to change the taste of foods and may, therefore, aid in weight loss.1,2 Patients prescribed CAIs commonly experience a tingling in their fingers, toes, and perioral region, an indication that the medication is working.1,2 A rare but serious adverse effect (AE) is aplastic anemia, which generally occurs in the first 6 months of treatment in elderly patients.1 The use of CAIs in pregnancy is controversial, and although rare complications are reported, it is considered a class C drug.5
In patients with rapidly progressive vision loss but with minimal headache, optic nerve sheath fenestration (ONSF) is the surgical treatment of choice.2,3,6 In this procedure, a window or series of slits are created behind the globe in the optic nerve sheath.1 About 50% of patients achieve adequate headache control with ONSF, especially for frontal headaches.1,2
For patients with vision loss, papilledema, and headache that do not respond to medical therapy, a CSF diversion procedure is the preferred treatment. Cerebrospinal fluid diversion with ventriculoperitoneal or lumboperitoneal shunts may prevent progressive loss of vision.1,4,6 However, variable response rates and shunt failure requiring subsequent revisions are common and may occur in as many as half of patients undergoing these procedures.1
Increased intracranial venous pressure due to stenosis of the venous sinuses has been thought to be a possible cause of IIH. Stenting of the transverse venous sinus stenosis has been shown to reduce cerebral venous pressure, reduce ICP, and improve symptoms in patients with IIH.1-3 It is unclear whether elevations in ICP cause transverse sinus stenosis or whether transverse sinus stenosis causes increased ICP.2 Regardless, stents have a high rate of complications, including subdural hemorrhage, venous sinus perforation, in-stent thrombosis, and recurrent stenosis proximal to the stent.2
Steroids have been used to treat IIH in the past, although their mechanism of action remains unclear.2 There may be recurrence of papilledema if they are tapered too quickly. Due to their association with long-term AEs, including weight gain, they should be avoided.2
Management in Pregnancy
Several studies agree that vision loss occurs in the same frequency in pregnant and nonpregnant patients with IIH.4,7 Idiopathic intracranial hypertension can occur in any trimester in pregnancy. It has been found that patients have the same spontaneous abortion rate and visual outcomes as the general population.6-8 It has also been concluded that treatment should be the same in both patient populations with slight variability in the use of acetazolamide.4,6,7
The use of dilating drops during pregnancy is controversial. Although there have been no teratogenic effects reported with use of topical anesthetics and dilating drops, all drugs should be avoided during the first trimester.7-10 Guidelines have been established by the American Congress of Obstetricians and Gynecologists for X-ray examination and exposure during pregnancy. It has been determined that exposure from a single diagnostic X-ray procedure does not result in harmful fetal effects.11 Magnetic resonance imaging is not associated with any known adverse fetal effects and is a better imaging option during pregnancy, because it is not associated with the use of ionizing radiation.11
The use of CAIs in the first trimester is controversial.4,7 Some believe it should be avoided because it is a Pregnancy Category C drug. However, a single case of sacrococcygeal teratoma has been reported in humans; therefore, some believe this is not a strong basis for withholding the medication in patients with the potential risk for severe vision loss.4,7 In this case, a consult to the patient’s obstetrician was made, and the use of acetazolamide had no effect on the health of the baby.
In pregnant women with IIH with progressive vision loss, failed treatment, or nonadherence, surgery may be necessary. Optic nerve sheath fenestration is preferred due to lower morbidity and mortality compared with shunting procedures.1,2,4,6 The growing fetus may be affected by the peritoneal end of the shunt.4
Related: 49-Year-Old Woman With a Broken Heart
Conclusions
Vision loss associated with IIH can be severe and permanent if left untreated. The best treatments and often the most effective involve weight loss and lumbar puncture. Acetazolamide has been a proven effective treatment in some patients, but some debate exists over the safety of its use during pregnancy. This patient did not have any AEs from its use; however, it did not prove valuable in her treatment. Studies often disagree on the use of acetazolamide in pregnancy; however, all agree that proper patient counseling on potential AEs and management by an obstetrician are important. With proper management, pregnant women with IIH have had outcomes similar to those of the general population.
Author disclosures
The authors report no actual or potential conflicts of interest with regard to this article.
Disclaimer
The opinions expressed herein are those of the authors and do not necessarily reflect those of Federal Practitioner, Frontline Medical Communications Inc., the U.S. Government, or any of its agencies. This article may discuss unlabeled or investigational use of certain drugs. Please review the complete prescribing information for specific drugs or drug combinations—including indications, contraindications, warnings, and adverse effects—before administering pharmacologic therapy to patients.
1. Wall M. Idiopathic intracranial hypertension. Neurol Clin. 2010;28(3):593-617.
2. Bruce BB, Biousee V, Newman NJ. Update on idiopathic intracranial hypertension. Am J Ophthalmol. 2011;152(2):163-169.
3. Fields JD, Javendani PP, Falardeau J, et al. Dural venous sinus angioplasty and stenting for the treatment of idiopathic intracranial hypertension. J Neurointerv Surg. 2013;5(1):62-68.
4. Evans RW, Lee AG. Idiopathic intracranial hypertension in pregnancy. Headache. 2010;50(9):1513-1515.
5. Friedman DI, Jacobson DM. Diagnostic criteria for idiopathic intracranial hypertension. Neurology. 2002;59(10):1492-1495.
6. Martínez-Varea A, Diago-Almela VJ, Abad-Carrascosa A, Perales-Marín A. Progressive visual loss in a pregnant woman with idiopathic intracranial hypertension. Eur J Obstet Gynecol Reprod Biol. 2012;163(1):117-122.
7. Falardeau J, Lobb B, Golden S, Maxfield SD, Tanne E. The use of acetazolamide during pregnancy in intracranial hypertension patients. J Neuroophthalmol. 2013;33(1):9-12.
8. Dinn RB, Harris A, Marcus PS. Ocular changes in pregnancy. Obstet Gynecol Surg. 2003;58(2):137-144.
9. Shultz KL, Birnbaum AD, Goldstein DA. Ocular disease in pregnancy. Curr Opin Ophthalmol. 2005;16(5):308-314.
10. Chung CY, Kwok AKH, Chung KL. Use of ophthalmic medications during pregnancy. Hong Kong Med J. 2004;10(3):191-195.
11. American Congress of Obstetricians and Gynecologists. Committee Opinion. Guidelines for diagnostic imaging during pregnancy. American Congress of Obstetricians and Gynecologists Website. http://www.acog.org/-/media/Committee-Opinions/Committee-on-Obstetric-Practice/co299.pdf. Published 2004. Accessed October 9, 2015.
Efficacy of Patient Aligned Care Team Pharmacist Services in Reaching Diabetes and Hyperlipidemia Treatment Goals
According to the CDC, diabetes mellitus (DM) and hyperlipidemia have been distinguished as major contributors to death and disability among adults within the U.S. Although these diseases may often escape a directly malignant etiology, the complications of these metabolic disorders are correlated with long-term disability. Uncontrolled diabetes contributes to 5 major complications in U.S. adults, including myocardial infarction, cerebral vascular accident, lower extremity amputation, renal failure, and hyperglycemic crisis. Hyperlipidemia is another major risk factor listed for advancing heart disease and ischemic stroke. Medical and preventive care are effective means for declining complication rates, but these chronic diseases continue to increase in frequency.1,2
The prevalence of DM and hyperlipidemia among U.S. veterans is uniquely higher than that of the general population. About 9.3% of the U.S. population has been diagnosed with diabetes compared with almost 25% of veterans receiving care through the VHA.3,4 According to the 2012 National Ambulatory Medical Care Survey, 15.2% of patients receiving nonfederal care had a hyperlipidemia diagnosis compared with > 20% of the U.S. veteran population.5,6
Patient-Centered Care
A key initiative of the VHA Office of Patient Care Services in providing coordinated health care is the patient aligned care team (PACT). The PACT model seeks to provide communicative patient-centered care and involves primary care providers (PCPs) as well as other clinical and nonclinical affiliates.7 These team members often include a PCP, a registered and licensed practical nurse, a dietitian, a social worker, clerical support, and a clinical pharmacy specialist (CPS). Each professional uses his or her unique specialty to provide evidence-based care to the veteran. Clinical pharmacy specialist integration into the PACT model is one way to provide greater continuity of care for patients and more comprehensive treatment of chronic diseases. Given the need for regular medication titration, these patients may require a greater allocation of time and resources than PCPs can feasibly give. For this reason, CPSs were integrated into PACTs to allow for focused management of chronic conditions.
Most PACT CPSs at the VA Illiana Health Care System (VAIHCS) have advanced residency training and/or board certification, making them proficient in patient communication, drug knowledge, pharmacology, and therapeutics. Within the VHA, CPSs practice as midlevel providers with a scope of practice. This scope grants them the ability to clinically assess drug therapy, order and evaluate laboratory data, prescribe pertinent medications to treat the disease within the scope, and order consults with other professionals of the PACT team.8
Research Studies
Several studies have revealed that pharmacist-driven outpatient interventions for patients with dyslipidemia have significantly reduced low-density lipoprotein cholesterol (LDL-C).9-14 Mazzolini and colleagues found that VHA pharmacist intervention produced a mean LDL-C reduction of 24.5 mg/dL and increased the percentage of patients reaching their LDL-C goal from 36.8% to 64.3%.9 Similarly, at another VHA facility, telephone interventions with patients were also effective in reducing veterans’ LDL-C levels. Fabbio and colleagues found a mean LDL-C reduction of 44.3 mg/dL when performing retrospective chart reviews of pharmacist interventions.10 Other pharmacist-driven LDL-C outcomes were also positive compared with that of usual care by PCPs, showing mean LDL-C reductions of 10.7 mg/dL and 10.4 mg/dL.11,12 All these studies showed positive impacts on outcomes for patients with dyslipidemia. Additionally, these types of interventions have been shown to maintain both patient and PCP satisfaction.15
Clinical pharmacist interventions in the primary care setting have shown positive impacts in DM control with hemoglobin A1c (A1c) reductions by as much as 1.3% to 3.4%.16-19 The highest A1c reductions were evident when pharmacists had the ability to prescribe medications or work in a collaborative practice model with PCPs.16-18 Independent practice and the ability to prescribe medications have been shown to have more impact than recommendations to physicians alone. Recommendation letters from pharmacists did not produce a significant reduction of A1c in one physician group compared with another physician group not receiving DM management recommendations.20Given the increased prevalence of chronic diseases in the veteran population and the literature to support the value of CPSs as provider extenders, the focus of this analysis was to determine the potential benefit of CPS services to the PACT.
The primary objectives of this analysis were to determine the true impact of PACT CPSs on LDL-C and A1c in the veterans enrolled in VAIHCS Disease State Management (DSM) clinics. If positive impacts were revealed, this study would support expansion of CPS services to include additional staff and the management of additional diseases.
Related: Experiences of Veterans With Diabetes From Shared Medical Appointments
Methods
This analysis was a retrospective chart review approved by the VA Illiana Publication and Presentation Committee as a quality improvement (QI) project. Data were collected through the VistA electronic medical record. Subject data were analyzed in a multicenter fashion. A total of 5 sites within VAIHCS were included for review. The study subjects acted as their own controls and were distributed proportionally by volume of DSM visits at each VAIHCS location.
The primary objectives of this QI analysis were to determine the efficacy of PACT CPSs in reducing LDL-C and/or A1c levels in veterans enrolled in VAIHCS DSM clinics. The primary endpoints of this study were change from baseline LDL-C to first LDL-C drawn between 6 and 9 months and change from baseline A1c to first A1c drawn between 9 and 12 months after enrollment in DSM clinics.
The secondary objectives of this QI analysis were to determine the efficacy of PACT CPSs in improving high-density lipoprotein cholesterol (HDL-C), triglycerides (TGs), and total cholesterol (TC) levels in veterans enrolled in DSM clinics. The secondary hyperlipidemia endpoints were the change from baseline HDL-C, TG, and TC to first blood work results and percentage of patients who achieved National Cholesterol Education Program Adult Treatment Panel III (NCEP-ATP III) LDL-C goal between 6 and 9 months after clinic enrollment.21 The secondary DM endpoint was the percentage of patients who achieved the recommended American Diabetes Association A1c goal between 9 and 12 months after enrollment. Mean percentage reduction of primary and relevant secondary endpoints were determined for each study subject.
Subjects selected for inclusion within this analysis were U.S. veterans aged 18 to 75 years who were enrolled in DSM clinics for hyperlipidemia or type 2 DM (T2DM) between September 1, 2011, and September 1, 2013. These subjects did not meet VA performance measures for hyperlipidemia or T2DM at baseline. The key focus of these measures was to include disease prevention and management of diagnosed disease by clinical practice guideline standards. To be included in the analysis, subjects were required to attend DSM clinic appointments for a minimum of 3 months for hyperlipidemia or 6 months for T2DM.
Subjects were excluded from this study if they were nonadherent to clinic visits (defined as missing > 50% of their appointments), were discharged from the clinic due to nonadherence to drug therapy and/or lifestyle interventions, met LDL-C or A1c goals prior to the laboratory collection interval, or had a baseline LDL-C of < 110 mg/dL or baseline A1c of < 8%. Subjects were also excluded if they failed to receive any antihyperlipidemic or antidiabetic agents through the course of their enrollment. Statistics were derived by averaging the percentage change of laboratory parameters per subject. The time frame used was from baseline to the time of primary and secondary endpoint collection. Due to the QI nature of this analysis, power was not targeted for attainment. A randomized sample of 49 subjects was pulled from the population for complete analysis, which was determined by using a random number generator and analyzing corresponding alphabetized patient charts.
Related:Diabetes Patient-Centered Medical Home Approach
Results
Two hundred ninety-five charts were reviewed to yield 49 subjects eligible for the analysis (Figure 1). One subject was eligible for both hyperlipidemia and T2DM. The primary reasons for exclusion were consults for DSM services not related to T2DM or hyperlipidemia (49.4%) and inadequate time of enrollment (30.2%). Less than 10% of exclusions were due to baseline LDL-C < 110 mg/dL or A1c < 8%, unavailable blood work within the collection interval, nonadherence to clinic visits or medications, or other reasons.
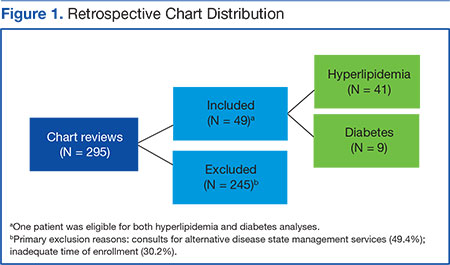
Hyperlipidemia
Means and ranges for LDL-C, TG, and TC were all significantly reduced from baseline (Figure 2). The primary endpoint for hyperlipidemia included a 25.1% reduction in mean LDL-C (95% CI, 0.173-0.327). Secondary endpoints included a 12.9% reduction in mean TG from baseline (95% CI, 0.017-0.241) and a 22.5% reduction in mean TC from baseline (95% CI, 0.174-0.276). A 2.1% increase in mean HDL-C was considered nonsignificant (95% CI, -0.082 to -0.042). The percentage of subjects meeting LDL-C goal between 6 and 9 months after enrollment was 36.7% (Table 1).
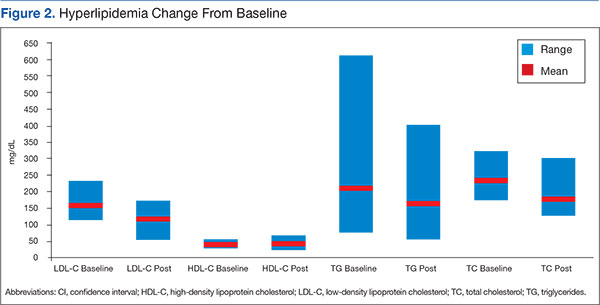
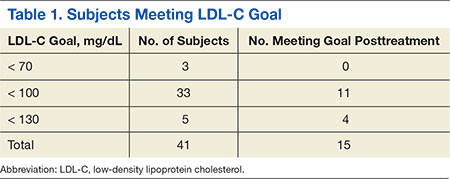
Twenty-six subjects (63.4%) did not reach their LDL-C goal between 6 and 9 months after clinic enrollment. Of these subjects, an additional analysis was performed to determine potential contributing factors. Eleven of these subjects received moderate- to high-intensity statin therapy, 2 received low-intensity statin therapy, and 3 (without documented statin intolerance) received no statin therapy. Seven subjects had statin intolerance documented in their charts at baseline or during treatment in DSM clinics. Three subjects had documented nonadherence. Subjects receiving no statin therapy due to intolerance or other reasons were prescribed fibrates, cholestyramine, psyllium, or therapeutic lifestyle changes.
Diabetes
Mean A1c and A1c range resulted in a significant reduction from baseline (Figure 3). The primary endpoint for T2DM included a 3.1% reduction in mean A1c (95% CI, 1.45-5.52). The percentage meeting A1c goal between 9 and 12 months after enrollment was 44.4% (Table 2).
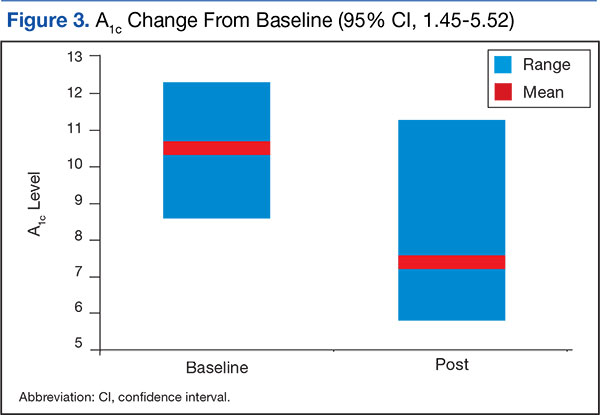
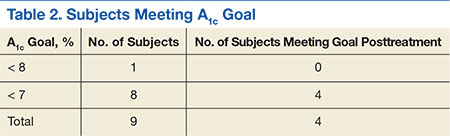
Discussion
The results of this analysis suggest a positive impact of CPSs on the care of veterans within VAIHCS, consistent with previous literature. The strengths of this study include a true measure of pharmacist intervention via an extended length of enrollment and regular CPS follow-up visits. Additionally, this was a multicenter design across numerous sites within VAIHCS. The variety of sites showed the impact of differing prescribing practice or consulting habits among CPSs and their associated PACT providers. Subjects were analyzed only if they received a prescription for antihyperlipidemic or antidiabetic medications. This exclusion allowed the analysis to focus on CPS medication adjustment skills.
Related: The Clinical Impact of Electronic Consultation in Diabetes Care
Limitations
This analysis is limited by its retrospective design and the reliance on chart reviews to collect data. As a retrospective analysis, a direct causality between CPS intervention and change in endpoints cannot be determined. Retrospective chart reviews are also subject to both bias and influence from confounding variables due to inability to establish blinding. One confounding variable not assessed was the impact of ancillary PACT members on subject outcomes. Therapeutic lifestyle changes implemented by registered dietitians could have confounded A1c and lipid profile improvements throughout the course of the analysis.
A specific limitation for hyperlipidemia included an early exclusion for meeting LDL-C goal before 3 months. After the completion of several chart reviews, it was determined that many of these patients required rapid or minimal medication adjustment to meet their therapeutic goals. The major limitation for T2DM included a small sample size. This limitation was partially due to the establishment of hyperlipidemia services before T2DM services within VAIHCS DSM clinics. Due to earlier establishment, hyperlipidemia management was better recognized, and consults for this disease were more prevalent. Sample size was also limited for T2DM due to the nature of the chart review and the original data attainment. The review of both diseases was limited due to some subjects not acquiring laboratory values within the predefined collection periods. In some cases, useful data outside the collection interval could not be used.
Although CPSs produced significant reductions in LDL-C, TG, and TC, their ability to provide more impactful results was likely limited due to enrollment for statin intolerance. Some studies indicated the incidence of statin intolerance to be about 5% to 10% of the general population.22 However, in this analysis, 17.1% of patients who did not meet LDL-C goal had some history of or current statin intolerance. Despite this high degree of intolerance, CPS management was still able to effectively improve lipid profiles but to a less significant degree.
A final point to consider is the design of the analysis before the release of the American College of Cardiology/American Heart Association (ACC/AHA) 2013 cholesterol guidelines.23 Target LDL-C reduction is no longer considered the most appropriate management technique for reducing the risk of atherosclerotic cardiovascular disease (ASCVD). However, the hyperlipidemia endpoints in this analysis were directly related to NCEP-ATP III recommendations. The current guidelines focus on the intensity of statin therapy for patients with ASCVD or elevated risk for ASCVD. With the release of this new guideline, a poststudy analysis was completed to apply the new information to previous practice in VAIHCS DSM clinics. Many subjects were already meeting their statin intensity goal without further intervention. In fact, 46.3% of subjects were meeting their goal at the time of primary endpoint collection. Between the release of the new clinical guideline and February 2014, another 14.6% of subjects had changed therapy and were meeting their statin-intensity goal, with or without pharmacist intervention. Another 17.1% of patients had statin intolerance that may have limited their ability to reach their statin-intensity goal. The remaining 22% of subjects (without statin intolerance) did not have any adjustments in hyperlipidemia profiles since the release of the updated guideline; these patients were scheduled to be contacted as a result of this analysis. Further review of patients meeting LDL-C goal at primary endpoint collection would also be beneficial to ensure appropriate management per current ACC/AHA 2013 guidelines.
Conclusion
Pharmacists were able to produce significant improvements in LDL-C and A1c profiles despite the confounding factors mentioned previously. With further analysis, VAIHCS may demonstrate efficacy in other CPS services and have greater potential to expand its services.
Author disclosures
The authors report no actual or potential conflicts of interest with regard to this article.
Disclaimer
This quality improvement analysis was performed to improve patient care at the VAIHCS, Danville, IL. It was reviewed by the VHA education department, privacy officer, information security officer, and VAIHCS leadership and was determined to meet guidelines for nonresearch, which is exempt from IRB review. As a quality improvement project, these data are not generalizable.
The opinions expressed herein are those of the authors and do not necessarily reflect those of Federal Practitioner, Frontline Medical Communications Inc., the U.S. Government, or any of its agencies. This article may discuss unlabeled or investigational use of certain drugs. Please review the complete prescribing information for specific drugs or drug combinations—including indications, contraindications, warnings, and adverse effects—before administering pharmacologic therapy to patients.
1. Centers for Disease Control and Prevention. Diabetes report card, 2014. Atlanta, GA: Centers for Disease Control and Prevention, U.S. Department of Health and Human Services; 2014. www .cdc.gov/diabetes/pdfs/library/diabetesreport card2014.pdf. Accessed August 25, 2015.
2. Fryar CD, Chen T-C, Li X. Prevalence of uncontrolled risk factors for cardiovascular disease: United States, 1999-2010. National Center for Health Statistics Data Brief, No. 103. National Center for Health Statistics, Centers for Disease Control and Prevention, U.S. Department of Health and Human Services Website. http://www.cdc.gov /nchs/data/databriefs/db103.htm. Updated August 3, 2012. Accessed August 10, 2015.
3. American Diabetes Association. Statistics about diabetes. American Diabetes Association Website. http://www.diabetes.org/diabetes-basics/statistics. Updated May 18, 2015. Accessed August 10, 2015.
4. U.S. Department of Veterans Affairs. Close to 25% of VA patients have diabetes. U.S. Department of Veterans Affairs Website. http://www.va.gov/health /NewsFeatures/20111115a.asp. Updated April 17, 2015. Accessed August 11, 2015.
5. Centers for Disease Control and Prevention. National ambulatory medical care survey: 2012 summary tables. Centers for Disease Control and Prevention Website. http://www.cdc.gov/nchs /data/ahcd/namcs_summary/2012_namcs_web _tables.pdf. Accessed August 25, 2015.
6. Utilization of Veterans Affairs Medical Care Services by United States Veterans. New York, NY: Pfizer Inc; 2003.
7. U.S. Department of Veterans Affairs. Primary care services. U.S. Department of Veterans Affairs Website. http://www.va.gov/primarycare/pcmh. Updated May 13, 2015. Accessed August 11, 2015.
8. U.S. Department of Veterans Affairs. Clinical Pharmacy Services. VHA Handbook 1108.11. http://www.va.gov/vhapublications/ViewPublication .asp?pub_ID=3120. Accessed August 25, 2015.
9. Mazzolini TA, Irons BK, Schell EC, Seifert CF. Lipid levels and use of lipid-lowering drugs for patients in pharmacist-managed lipid clinics versus usual care in 2 VA medical centers. J Manag Care Pharm. 2005;11(9):763-771.
10. Fabbio KL, Bradley M, Chrymko M. Evaluation of a pharmacist-managed telephone lipid clinic at a Veterans Affairs Medical Center. Ann Pharmacother. 2010;44(1):50-56.
11. Charrois TL, Zolezzi M, Koshman SL, et al. A systematic review of the evidence for pharmacist care of patients with dyslipidemia. Pharmacother. 2012;32(3):222-233.
12. Smith MC, Boldt AS, Walston CM, Zillich AJ. Effectiveness of a pharmacy care management program for veterans with dyslipidemia. Pharmacother. 2013;33(7):736-743.
13. Till LT, Voris JC, Horst JB. Assessment of clinical pharmacist management of lipid-lowering therapy in a primary care setting. J Manag Care Pharm. 2003;9(3):269-273.
14. Machado M, Nassor N, Bajcar JM, Guzzo GC, Einarson TR. Sensitivity of patient outcomes to pharmacist interventions. Part III: systematic review and meta-analysis in hyperlipidemia management. Ann Pharmacother. 2008;42(9):1195-1207.
15. Collins C, Kramer A, O’Day ME, Low MB. Evaluation of patient and provider satisfaction with a pharmacist-managed lipid clinic in a Veterans Affairs medical center. Am J Health Syst Pharm. 2006;63(18):1723-1727.
16. American Association of Diabetes Educators. The scope and standards for the practice of diabetes education by pharmacists. American Association of Diabetes Educators Website. http://www .diabeteseducator.org/docs/default-source/legacy -docs/_resources/pdf/PharmDScopeStandards.pdf. Updated 2011. Accessed August 11, 2015.
17. Wubben DP, Vivian EM. Effects of pharmacist outpatient interventions on adults with diabetes mellitus: a systematic review. Pharmacother. 2008;28(4):421-436.
18. Armor BL, Britton ML, Dennis VC, Letassy NA. A review of pharmacist contributions to diabetes care in the United States. J Pharm Pract. 2010;23(3):250-264.
19. Jarab AS, Alqudah SG, Mukattash TL, Shattat G, Al-Qirim T. Randomized controlled trial of clinical pharmacy management of patients with type 2 diabetes in an outpatient diabetes clinic in Jordan. J Manag Care Pharm. 2012;18(7):516-526.
20. Kirwin JL, Cunningham RJ, Sequist TD. Pharmacist recommendations to improve the quality of diabetes care: a randomized controlled trial. J Manag Care Pharm. 2010;16(2):104-113.
21. Expert Panel on Detection, Evaluation, and Treatment of High Blood Cholesterol in Adults. Executive Summary of the Third Report of the National Cholesterol Education Program (NCEP) Expert Panel on Detection, Evaluation, and Treatment of High Blood Cholesterol in Adults (Adult Treatment Panel III). JAMA. 2001;285(19):2486-2497.
22. Kennedy SP, Barnas GP, Schmidt MJ, Glisczinski MS, Paniagua AC. Efficacy and tolerability of once-weekly rosuvastatin in patients with previous statin intolerance. J Clin Lipidol. 2011;5(4):308-315.
23. Stone NJ, Robinson JG, Lichtenstein AH, et al; American College of Cardiology/American Heart Association Task Force on Practice Guidelines. 2013 ACC/AHA guideline on the treatment of blood cholesterol to reduce atherosclerotic cardiovascular risk in adults: a report of the American College of Cardiology/American Heart Association Task Force on Practice Guidelines. J Am Coll Cardiol. 2014;63(25, pt B):2889-2934.
According to the CDC, diabetes mellitus (DM) and hyperlipidemia have been distinguished as major contributors to death and disability among adults within the U.S. Although these diseases may often escape a directly malignant etiology, the complications of these metabolic disorders are correlated with long-term disability. Uncontrolled diabetes contributes to 5 major complications in U.S. adults, including myocardial infarction, cerebral vascular accident, lower extremity amputation, renal failure, and hyperglycemic crisis. Hyperlipidemia is another major risk factor listed for advancing heart disease and ischemic stroke. Medical and preventive care are effective means for declining complication rates, but these chronic diseases continue to increase in frequency.1,2
The prevalence of DM and hyperlipidemia among U.S. veterans is uniquely higher than that of the general population. About 9.3% of the U.S. population has been diagnosed with diabetes compared with almost 25% of veterans receiving care through the VHA.3,4 According to the 2012 National Ambulatory Medical Care Survey, 15.2% of patients receiving nonfederal care had a hyperlipidemia diagnosis compared with > 20% of the U.S. veteran population.5,6
Patient-Centered Care
A key initiative of the VHA Office of Patient Care Services in providing coordinated health care is the patient aligned care team (PACT). The PACT model seeks to provide communicative patient-centered care and involves primary care providers (PCPs) as well as other clinical and nonclinical affiliates.7 These team members often include a PCP, a registered and licensed practical nurse, a dietitian, a social worker, clerical support, and a clinical pharmacy specialist (CPS). Each professional uses his or her unique specialty to provide evidence-based care to the veteran. Clinical pharmacy specialist integration into the PACT model is one way to provide greater continuity of care for patients and more comprehensive treatment of chronic diseases. Given the need for regular medication titration, these patients may require a greater allocation of time and resources than PCPs can feasibly give. For this reason, CPSs were integrated into PACTs to allow for focused management of chronic conditions.
Most PACT CPSs at the VA Illiana Health Care System (VAIHCS) have advanced residency training and/or board certification, making them proficient in patient communication, drug knowledge, pharmacology, and therapeutics. Within the VHA, CPSs practice as midlevel providers with a scope of practice. This scope grants them the ability to clinically assess drug therapy, order and evaluate laboratory data, prescribe pertinent medications to treat the disease within the scope, and order consults with other professionals of the PACT team.8
Research Studies
Several studies have revealed that pharmacist-driven outpatient interventions for patients with dyslipidemia have significantly reduced low-density lipoprotein cholesterol (LDL-C).9-14 Mazzolini and colleagues found that VHA pharmacist intervention produced a mean LDL-C reduction of 24.5 mg/dL and increased the percentage of patients reaching their LDL-C goal from 36.8% to 64.3%.9 Similarly, at another VHA facility, telephone interventions with patients were also effective in reducing veterans’ LDL-C levels. Fabbio and colleagues found a mean LDL-C reduction of 44.3 mg/dL when performing retrospective chart reviews of pharmacist interventions.10 Other pharmacist-driven LDL-C outcomes were also positive compared with that of usual care by PCPs, showing mean LDL-C reductions of 10.7 mg/dL and 10.4 mg/dL.11,12 All these studies showed positive impacts on outcomes for patients with dyslipidemia. Additionally, these types of interventions have been shown to maintain both patient and PCP satisfaction.15
Clinical pharmacist interventions in the primary care setting have shown positive impacts in DM control with hemoglobin A1c (A1c) reductions by as much as 1.3% to 3.4%.16-19 The highest A1c reductions were evident when pharmacists had the ability to prescribe medications or work in a collaborative practice model with PCPs.16-18 Independent practice and the ability to prescribe medications have been shown to have more impact than recommendations to physicians alone. Recommendation letters from pharmacists did not produce a significant reduction of A1c in one physician group compared with another physician group not receiving DM management recommendations.20Given the increased prevalence of chronic diseases in the veteran population and the literature to support the value of CPSs as provider extenders, the focus of this analysis was to determine the potential benefit of CPS services to the PACT.
The primary objectives of this analysis were to determine the true impact of PACT CPSs on LDL-C and A1c in the veterans enrolled in VAIHCS Disease State Management (DSM) clinics. If positive impacts were revealed, this study would support expansion of CPS services to include additional staff and the management of additional diseases.
Related: Experiences of Veterans With Diabetes From Shared Medical Appointments
Methods
This analysis was a retrospective chart review approved by the VA Illiana Publication and Presentation Committee as a quality improvement (QI) project. Data were collected through the VistA electronic medical record. Subject data were analyzed in a multicenter fashion. A total of 5 sites within VAIHCS were included for review. The study subjects acted as their own controls and were distributed proportionally by volume of DSM visits at each VAIHCS location.
The primary objectives of this QI analysis were to determine the efficacy of PACT CPSs in reducing LDL-C and/or A1c levels in veterans enrolled in VAIHCS DSM clinics. The primary endpoints of this study were change from baseline LDL-C to first LDL-C drawn between 6 and 9 months and change from baseline A1c to first A1c drawn between 9 and 12 months after enrollment in DSM clinics.
The secondary objectives of this QI analysis were to determine the efficacy of PACT CPSs in improving high-density lipoprotein cholesterol (HDL-C), triglycerides (TGs), and total cholesterol (TC) levels in veterans enrolled in DSM clinics. The secondary hyperlipidemia endpoints were the change from baseline HDL-C, TG, and TC to first blood work results and percentage of patients who achieved National Cholesterol Education Program Adult Treatment Panel III (NCEP-ATP III) LDL-C goal between 6 and 9 months after clinic enrollment.21 The secondary DM endpoint was the percentage of patients who achieved the recommended American Diabetes Association A1c goal between 9 and 12 months after enrollment. Mean percentage reduction of primary and relevant secondary endpoints were determined for each study subject.
Subjects selected for inclusion within this analysis were U.S. veterans aged 18 to 75 years who were enrolled in DSM clinics for hyperlipidemia or type 2 DM (T2DM) between September 1, 2011, and September 1, 2013. These subjects did not meet VA performance measures for hyperlipidemia or T2DM at baseline. The key focus of these measures was to include disease prevention and management of diagnosed disease by clinical practice guideline standards. To be included in the analysis, subjects were required to attend DSM clinic appointments for a minimum of 3 months for hyperlipidemia or 6 months for T2DM.
Subjects were excluded from this study if they were nonadherent to clinic visits (defined as missing > 50% of their appointments), were discharged from the clinic due to nonadherence to drug therapy and/or lifestyle interventions, met LDL-C or A1c goals prior to the laboratory collection interval, or had a baseline LDL-C of < 110 mg/dL or baseline A1c of < 8%. Subjects were also excluded if they failed to receive any antihyperlipidemic or antidiabetic agents through the course of their enrollment. Statistics were derived by averaging the percentage change of laboratory parameters per subject. The time frame used was from baseline to the time of primary and secondary endpoint collection. Due to the QI nature of this analysis, power was not targeted for attainment. A randomized sample of 49 subjects was pulled from the population for complete analysis, which was determined by using a random number generator and analyzing corresponding alphabetized patient charts.
Related:Diabetes Patient-Centered Medical Home Approach
Results
Two hundred ninety-five charts were reviewed to yield 49 subjects eligible for the analysis (Figure 1). One subject was eligible for both hyperlipidemia and T2DM. The primary reasons for exclusion were consults for DSM services not related to T2DM or hyperlipidemia (49.4%) and inadequate time of enrollment (30.2%). Less than 10% of exclusions were due to baseline LDL-C < 110 mg/dL or A1c < 8%, unavailable blood work within the collection interval, nonadherence to clinic visits or medications, or other reasons.
Hyperlipidemia
Means and ranges for LDL-C, TG, and TC were all significantly reduced from baseline (Figure 2). The primary endpoint for hyperlipidemia included a 25.1% reduction in mean LDL-C (95% CI, 0.173-0.327). Secondary endpoints included a 12.9% reduction in mean TG from baseline (95% CI, 0.017-0.241) and a 22.5% reduction in mean TC from baseline (95% CI, 0.174-0.276). A 2.1% increase in mean HDL-C was considered nonsignificant (95% CI, -0.082 to -0.042). The percentage of subjects meeting LDL-C goal between 6 and 9 months after enrollment was 36.7% (Table 1).
Twenty-six subjects (63.4%) did not reach their LDL-C goal between 6 and 9 months after clinic enrollment. Of these subjects, an additional analysis was performed to determine potential contributing factors. Eleven of these subjects received moderate- to high-intensity statin therapy, 2 received low-intensity statin therapy, and 3 (without documented statin intolerance) received no statin therapy. Seven subjects had statin intolerance documented in their charts at baseline or during treatment in DSM clinics. Three subjects had documented nonadherence. Subjects receiving no statin therapy due to intolerance or other reasons were prescribed fibrates, cholestyramine, psyllium, or therapeutic lifestyle changes.
Diabetes
Mean A1c and A1c range resulted in a significant reduction from baseline (Figure 3). The primary endpoint for T2DM included a 3.1% reduction in mean A1c (95% CI, 1.45-5.52). The percentage meeting A1c goal between 9 and 12 months after enrollment was 44.4% (Table 2).
Discussion
The results of this analysis suggest a positive impact of CPSs on the care of veterans within VAIHCS, consistent with previous literature. The strengths of this study include a true measure of pharmacist intervention via an extended length of enrollment and regular CPS follow-up visits. Additionally, this was a multicenter design across numerous sites within VAIHCS. The variety of sites showed the impact of differing prescribing practice or consulting habits among CPSs and their associated PACT providers. Subjects were analyzed only if they received a prescription for antihyperlipidemic or antidiabetic medications. This exclusion allowed the analysis to focus on CPS medication adjustment skills.
Related: The Clinical Impact of Electronic Consultation in Diabetes Care
Limitations
This analysis is limited by its retrospective design and the reliance on chart reviews to collect data. As a retrospective analysis, a direct causality between CPS intervention and change in endpoints cannot be determined. Retrospective chart reviews are also subject to both bias and influence from confounding variables due to inability to establish blinding. One confounding variable not assessed was the impact of ancillary PACT members on subject outcomes. Therapeutic lifestyle changes implemented by registered dietitians could have confounded A1c and lipid profile improvements throughout the course of the analysis.
A specific limitation for hyperlipidemia included an early exclusion for meeting LDL-C goal before 3 months. After the completion of several chart reviews, it was determined that many of these patients required rapid or minimal medication adjustment to meet their therapeutic goals. The major limitation for T2DM included a small sample size. This limitation was partially due to the establishment of hyperlipidemia services before T2DM services within VAIHCS DSM clinics. Due to earlier establishment, hyperlipidemia management was better recognized, and consults for this disease were more prevalent. Sample size was also limited for T2DM due to the nature of the chart review and the original data attainment. The review of both diseases was limited due to some subjects not acquiring laboratory values within the predefined collection periods. In some cases, useful data outside the collection interval could not be used.
Although CPSs produced significant reductions in LDL-C, TG, and TC, their ability to provide more impactful results was likely limited due to enrollment for statin intolerance. Some studies indicated the incidence of statin intolerance to be about 5% to 10% of the general population.22 However, in this analysis, 17.1% of patients who did not meet LDL-C goal had some history of or current statin intolerance. Despite this high degree of intolerance, CPS management was still able to effectively improve lipid profiles but to a less significant degree.
A final point to consider is the design of the analysis before the release of the American College of Cardiology/American Heart Association (ACC/AHA) 2013 cholesterol guidelines.23 Target LDL-C reduction is no longer considered the most appropriate management technique for reducing the risk of atherosclerotic cardiovascular disease (ASCVD). However, the hyperlipidemia endpoints in this analysis were directly related to NCEP-ATP III recommendations. The current guidelines focus on the intensity of statin therapy for patients with ASCVD or elevated risk for ASCVD. With the release of this new guideline, a poststudy analysis was completed to apply the new information to previous practice in VAIHCS DSM clinics. Many subjects were already meeting their statin intensity goal without further intervention. In fact, 46.3% of subjects were meeting their goal at the time of primary endpoint collection. Between the release of the new clinical guideline and February 2014, another 14.6% of subjects had changed therapy and were meeting their statin-intensity goal, with or without pharmacist intervention. Another 17.1% of patients had statin intolerance that may have limited their ability to reach their statin-intensity goal. The remaining 22% of subjects (without statin intolerance) did not have any adjustments in hyperlipidemia profiles since the release of the updated guideline; these patients were scheduled to be contacted as a result of this analysis. Further review of patients meeting LDL-C goal at primary endpoint collection would also be beneficial to ensure appropriate management per current ACC/AHA 2013 guidelines.
Conclusion
Pharmacists were able to produce significant improvements in LDL-C and A1c profiles despite the confounding factors mentioned previously. With further analysis, VAIHCS may demonstrate efficacy in other CPS services and have greater potential to expand its services.
Author disclosures
The authors report no actual or potential conflicts of interest with regard to this article.
Disclaimer
This quality improvement analysis was performed to improve patient care at the VAIHCS, Danville, IL. It was reviewed by the VHA education department, privacy officer, information security officer, and VAIHCS leadership and was determined to meet guidelines for nonresearch, which is exempt from IRB review. As a quality improvement project, these data are not generalizable.
The opinions expressed herein are those of the authors and do not necessarily reflect those of Federal Practitioner, Frontline Medical Communications Inc., the U.S. Government, or any of its agencies. This article may discuss unlabeled or investigational use of certain drugs. Please review the complete prescribing information for specific drugs or drug combinations—including indications, contraindications, warnings, and adverse effects—before administering pharmacologic therapy to patients.
1. Centers for Disease Control and Prevention. Diabetes report card, 2014. Atlanta, GA: Centers for Disease Control and Prevention, U.S. Department of Health and Human Services; 2014. www .cdc.gov/diabetes/pdfs/library/diabetesreport card2014.pdf. Accessed August 25, 2015.
2. Fryar CD, Chen T-C, Li X. Prevalence of uncontrolled risk factors for cardiovascular disease: United States, 1999-2010. National Center for Health Statistics Data Brief, No. 103. National Center for Health Statistics, Centers for Disease Control and Prevention, U.S. Department of Health and Human Services Website. http://www.cdc.gov /nchs/data/databriefs/db103.htm. Updated August 3, 2012. Accessed August 10, 2015.
3. American Diabetes Association. Statistics about diabetes. American Diabetes Association Website. http://www.diabetes.org/diabetes-basics/statistics. Updated May 18, 2015. Accessed August 10, 2015.
4. U.S. Department of Veterans Affairs. Close to 25% of VA patients have diabetes. U.S. Department of Veterans Affairs Website. http://www.va.gov/health /NewsFeatures/20111115a.asp. Updated April 17, 2015. Accessed August 11, 2015.
5. Centers for Disease Control and Prevention. National ambulatory medical care survey: 2012 summary tables. Centers for Disease Control and Prevention Website. http://www.cdc.gov/nchs /data/ahcd/namcs_summary/2012_namcs_web _tables.pdf. Accessed August 25, 2015.
6. Utilization of Veterans Affairs Medical Care Services by United States Veterans. New York, NY: Pfizer Inc; 2003.
7. U.S. Department of Veterans Affairs. Primary care services. U.S. Department of Veterans Affairs Website. http://www.va.gov/primarycare/pcmh. Updated May 13, 2015. Accessed August 11, 2015.
8. U.S. Department of Veterans Affairs. Clinical Pharmacy Services. VHA Handbook 1108.11. http://www.va.gov/vhapublications/ViewPublication .asp?pub_ID=3120. Accessed August 25, 2015.
9. Mazzolini TA, Irons BK, Schell EC, Seifert CF. Lipid levels and use of lipid-lowering drugs for patients in pharmacist-managed lipid clinics versus usual care in 2 VA medical centers. J Manag Care Pharm. 2005;11(9):763-771.
10. Fabbio KL, Bradley M, Chrymko M. Evaluation of a pharmacist-managed telephone lipid clinic at a Veterans Affairs Medical Center. Ann Pharmacother. 2010;44(1):50-56.
11. Charrois TL, Zolezzi M, Koshman SL, et al. A systematic review of the evidence for pharmacist care of patients with dyslipidemia. Pharmacother. 2012;32(3):222-233.
12. Smith MC, Boldt AS, Walston CM, Zillich AJ. Effectiveness of a pharmacy care management program for veterans with dyslipidemia. Pharmacother. 2013;33(7):736-743.
13. Till LT, Voris JC, Horst JB. Assessment of clinical pharmacist management of lipid-lowering therapy in a primary care setting. J Manag Care Pharm. 2003;9(3):269-273.
14. Machado M, Nassor N, Bajcar JM, Guzzo GC, Einarson TR. Sensitivity of patient outcomes to pharmacist interventions. Part III: systematic review and meta-analysis in hyperlipidemia management. Ann Pharmacother. 2008;42(9):1195-1207.
15. Collins C, Kramer A, O’Day ME, Low MB. Evaluation of patient and provider satisfaction with a pharmacist-managed lipid clinic in a Veterans Affairs medical center. Am J Health Syst Pharm. 2006;63(18):1723-1727.
16. American Association of Diabetes Educators. The scope and standards for the practice of diabetes education by pharmacists. American Association of Diabetes Educators Website. http://www .diabeteseducator.org/docs/default-source/legacy -docs/_resources/pdf/PharmDScopeStandards.pdf. Updated 2011. Accessed August 11, 2015.
17. Wubben DP, Vivian EM. Effects of pharmacist outpatient interventions on adults with diabetes mellitus: a systematic review. Pharmacother. 2008;28(4):421-436.
18. Armor BL, Britton ML, Dennis VC, Letassy NA. A review of pharmacist contributions to diabetes care in the United States. J Pharm Pract. 2010;23(3):250-264.
19. Jarab AS, Alqudah SG, Mukattash TL, Shattat G, Al-Qirim T. Randomized controlled trial of clinical pharmacy management of patients with type 2 diabetes in an outpatient diabetes clinic in Jordan. J Manag Care Pharm. 2012;18(7):516-526.
20. Kirwin JL, Cunningham RJ, Sequist TD. Pharmacist recommendations to improve the quality of diabetes care: a randomized controlled trial. J Manag Care Pharm. 2010;16(2):104-113.
21. Expert Panel on Detection, Evaluation, and Treatment of High Blood Cholesterol in Adults. Executive Summary of the Third Report of the National Cholesterol Education Program (NCEP) Expert Panel on Detection, Evaluation, and Treatment of High Blood Cholesterol in Adults (Adult Treatment Panel III). JAMA. 2001;285(19):2486-2497.
22. Kennedy SP, Barnas GP, Schmidt MJ, Glisczinski MS, Paniagua AC. Efficacy and tolerability of once-weekly rosuvastatin in patients with previous statin intolerance. J Clin Lipidol. 2011;5(4):308-315.
23. Stone NJ, Robinson JG, Lichtenstein AH, et al; American College of Cardiology/American Heart Association Task Force on Practice Guidelines. 2013 ACC/AHA guideline on the treatment of blood cholesterol to reduce atherosclerotic cardiovascular risk in adults: a report of the American College of Cardiology/American Heart Association Task Force on Practice Guidelines. J Am Coll Cardiol. 2014;63(25, pt B):2889-2934.
Assessment of High Staphylococcus aureus MIC and Poor Patient Outcomes
Staphylococcus aureus (S aureus) is a common cause of infection within the hospital and in the community.1 Treatment is based on the organism’s susceptibility to methicillin and is referred to as either MRSA (methicillin-resistant S aureus) or MSSA (methicillin-susceptible S aureus). As antibiotic resistance has evolved, patients with S aureus (especially MRSA) infections have become more difficult to treat. Susceptibility testing guides treatment of these infections and determines the minimum inhibitory concentration (MIC) for each antibiotic. A MIC is the minimum concentration of an antibiotic that will inhibit the visible growth of the organism after incubation.
Related: Experts Debate Infection Control Merits of ‘Bare Beneath the Elbows’
Vancomycin has remained the mainstay for treatment of patients with MRSA infections. An increasing number of infections with high documented MICs to vancomycin are raising concern that resistance may be developing. Clinical controversy exists within the infectious disease community as to whether vancomycin is less effective against S aureus infections with a vancomycin MIC of ≥ 2 µg/mL, contributing to poor patient outcomes.2
The Clinical and Laboratory Standards Institute (CLSI) lowered the breakpoint for vancomycin in 2006 from > 4 µg/mL to > 2 µg/mL.3 Breakpoints delineate MIC values that are considered susceptible, nonsusceptible, or resistant to an antibiotic. The CLSI breakpoint change points to an increase in vancomycin resistance and supports the need for further discussion and insight.
A 2012 meta-analysis was conducted to determine whether an association exists between S aureus infections with vancomycin MIC values ≥ 2 µg/mL and the effectiveness of the therapy.2 Twenty-two studies were included with a primary outcome of 30-day mortality. A review of MRSA data revealed a statistically significant association between high vancomycin MICs (≥ 1.5 µg/mL) and increased mortality (P < .01), regardless of the source of infection. When limiting the data to Etest (bioMérieux, Marcy L’Etoile, France) MIC testing for MRSA bloodstream infections (BSIs), a vancomycin MIC ≥ 1.5 µg/mL was not associated with increased mortality (P = .08). Comparing data for MIC ≥ 2 µg/mL and ≤ 1.5 µg/mL, found that MICs ≥ 2 µg/mL were associated with increased mortality (P < .01). Analysis of the 11 studies that included data on treatment failure concluded that S aureus infections with a vancomycin MIC ≥ 1.5 µg/mL were associated with an increased risk of treatment failure in both MSSA and MRSA infections (P < .01) and that treatment failure was more likely in MRSA BSIs than in non-BSIs (P < .01).Evidence to support a possible correlation between high S aureus vancomycin MICs and poor patient outcomes came from a 2013 meta-analysis.3 The specific aim of this study was to examine the correlations between vancomycin MIC, patient mortality, and treatment failure. A MIC ≥ 1.5 µg/mL and ≥ 1.0 µg/mL were used to classify MICs as high when determined by Etest and broth microdilution (BMD), respectively. Analysis revealed an association between high vancomycin MICs and increased risk of treatment failure (relative risk [RR] 1.40, 95% confidence interval [CI] 1.15-1.71) and overall mortality (RR 1.42, 95% CI 1.08-1.87). Similarly, a sensitivity analysis on S aureus BSIs with high vancomycin MICs revealed an increased risk of mortality (RR 1.46, 95% CI 1.06-2.01) and treatment failure (RR 1.37, 95% CI 1.09-1.73).
Related: The Importance of an Antimicrobial Stewardship Program
The most recent meta-analysis (published in 2014) included patients with S aureus bacteremia and evaluated the association of high S aureus vancomycin MIC with an increased risk of mortality.4 A high MIC was defined as ≥ 1.5 µg/mL by Etest and ≥ 2.0 µg/mL by BMD. The analysis of 38 studies found a nonstatistically significant difference in mortality risk (P = .43). Further analysis was performed to determine whether the vancomycin MIC cutoff plays a role in increased mortality. No statistically significant difference in mortality was found when using a vancomycin MIC ≥ 1.5 µg/mL, ≥ 2.0 µg/mL, ≥ 4.0 µg/mL, or ≥ 8.0 µg/mL. The authors argued that their differing conclusions from other meta-analyses may be due to the inclusion of only bacteremias rather than all infection types, and although there was not a statistically significant difference, increased risk of mortality could not be excluded.
Related: Results Mixed in Hospital Efforts to Tackle Antimicrobial Resistance
Although conclusions of published meta-analyses differ, the results highlight the necessity of using clinical judgment in treating patients with S aureus infections with high MIC values and to consider the primary source and severity of infection. A confounding factor to direct comparison of the literature is the variations based on the method of MIC determination and testing (Etest vs BMD).
Additionally, all 3 studies addressed the importance of considering clinical patient factors that may lead to poorer prognosis as well as the difficultly in achieving necessary vancomycin levels with limited toxicity. The risk of increased mortality in patients with high vancomycin MICs cannot be ruled out at this time. Therefore, additional patient factors as well as the potential toxicities that may result from vancomycin therapy should be considered when using vancomycin in treating patients with S aureus infections.
Additional Note
An earlier version of this article appeared in the Pharmacy Related Newsletter: The Capsule, of the William S. Middleton Memorial Veterans Hospital.
Author disclosures
The authors report no actual or potential conflicts of interest with regard to this article.
Disclaimer
The opinions expressed herein are those of the authors and do not necessarily reflect those of Federal Practitioner, Frontline Medical Communications Inc., the U.S. Government, or any of its agencies. This article may discuss unlabeled or investigational use of certain drugs. Please review complete prescribing information for specific drugs or drug combinations—including indications, contraindications, warnings, and adverse effects—before administering pharmacologic therapy to patients.
1. Martin JH, Norris R, Barras M, et al. Therapeutic monitoring of vancomycin in adult patients: a consensus review of the American Society of Health-System Pharmacists, the Infectious Diseases Society of America, and the Society of Infectious Diseases Pharmacists. Clin Biochem Rev. 2010;31(1):21-24.
2. van Hal SJ, Lodise TP, Paterson DL. The clinical significance of vancomycin minimum inhibitory concentration in Staphylococcus aureus infections: a systematic review and meta-analysis. Clin Infect Dis. 2012;54(6):755-771.
3. Jacob JT, DiazGranados CA. High vancomycin minimum inhibitory concentration and clinical outcomes in adults with methicillin-resistant Staphylococcus aureus infections: a meta-analysis. Int J Infect Dis. 2013;17(2):e93-e100.
4. Kalil AC, Van Schooneveld TC, Fey PD, Rupp ME. Association between vancomycin minimum inhibitory concentration and mortality among patients with Staphylococcus aureus bloodstream infections: a systematic review and meta-analysis. JAMA. 2014;312(15):1552-1564.
Staphylococcus aureus (S aureus) is a common cause of infection within the hospital and in the community.1 Treatment is based on the organism’s susceptibility to methicillin and is referred to as either MRSA (methicillin-resistant S aureus) or MSSA (methicillin-susceptible S aureus). As antibiotic resistance has evolved, patients with S aureus (especially MRSA) infections have become more difficult to treat. Susceptibility testing guides treatment of these infections and determines the minimum inhibitory concentration (MIC) for each antibiotic. A MIC is the minimum concentration of an antibiotic that will inhibit the visible growth of the organism after incubation.
Related: Experts Debate Infection Control Merits of ‘Bare Beneath the Elbows’
Vancomycin has remained the mainstay for treatment of patients with MRSA infections. An increasing number of infections with high documented MICs to vancomycin are raising concern that resistance may be developing. Clinical controversy exists within the infectious disease community as to whether vancomycin is less effective against S aureus infections with a vancomycin MIC of ≥ 2 µg/mL, contributing to poor patient outcomes.2
The Clinical and Laboratory Standards Institute (CLSI) lowered the breakpoint for vancomycin in 2006 from > 4 µg/mL to > 2 µg/mL.3 Breakpoints delineate MIC values that are considered susceptible, nonsusceptible, or resistant to an antibiotic. The CLSI breakpoint change points to an increase in vancomycin resistance and supports the need for further discussion and insight.
A 2012 meta-analysis was conducted to determine whether an association exists between S aureus infections with vancomycin MIC values ≥ 2 µg/mL and the effectiveness of the therapy.2 Twenty-two studies were included with a primary outcome of 30-day mortality. A review of MRSA data revealed a statistically significant association between high vancomycin MICs (≥ 1.5 µg/mL) and increased mortality (P < .01), regardless of the source of infection. When limiting the data to Etest (bioMérieux, Marcy L’Etoile, France) MIC testing for MRSA bloodstream infections (BSIs), a vancomycin MIC ≥ 1.5 µg/mL was not associated with increased mortality (P = .08). Comparing data for MIC ≥ 2 µg/mL and ≤ 1.5 µg/mL, found that MICs ≥ 2 µg/mL were associated with increased mortality (P < .01). Analysis of the 11 studies that included data on treatment failure concluded that S aureus infections with a vancomycin MIC ≥ 1.5 µg/mL were associated with an increased risk of treatment failure in both MSSA and MRSA infections (P < .01) and that treatment failure was more likely in MRSA BSIs than in non-BSIs (P < .01).Evidence to support a possible correlation between high S aureus vancomycin MICs and poor patient outcomes came from a 2013 meta-analysis.3 The specific aim of this study was to examine the correlations between vancomycin MIC, patient mortality, and treatment failure. A MIC ≥ 1.5 µg/mL and ≥ 1.0 µg/mL were used to classify MICs as high when determined by Etest and broth microdilution (BMD), respectively. Analysis revealed an association between high vancomycin MICs and increased risk of treatment failure (relative risk [RR] 1.40, 95% confidence interval [CI] 1.15-1.71) and overall mortality (RR 1.42, 95% CI 1.08-1.87). Similarly, a sensitivity analysis on S aureus BSIs with high vancomycin MICs revealed an increased risk of mortality (RR 1.46, 95% CI 1.06-2.01) and treatment failure (RR 1.37, 95% CI 1.09-1.73).
Related: The Importance of an Antimicrobial Stewardship Program
The most recent meta-analysis (published in 2014) included patients with S aureus bacteremia and evaluated the association of high S aureus vancomycin MIC with an increased risk of mortality.4 A high MIC was defined as ≥ 1.5 µg/mL by Etest and ≥ 2.0 µg/mL by BMD. The analysis of 38 studies found a nonstatistically significant difference in mortality risk (P = .43). Further analysis was performed to determine whether the vancomycin MIC cutoff plays a role in increased mortality. No statistically significant difference in mortality was found when using a vancomycin MIC ≥ 1.5 µg/mL, ≥ 2.0 µg/mL, ≥ 4.0 µg/mL, or ≥ 8.0 µg/mL. The authors argued that their differing conclusions from other meta-analyses may be due to the inclusion of only bacteremias rather than all infection types, and although there was not a statistically significant difference, increased risk of mortality could not be excluded.
Related: Results Mixed in Hospital Efforts to Tackle Antimicrobial Resistance
Although conclusions of published meta-analyses differ, the results highlight the necessity of using clinical judgment in treating patients with S aureus infections with high MIC values and to consider the primary source and severity of infection. A confounding factor to direct comparison of the literature is the variations based on the method of MIC determination and testing (Etest vs BMD).
Additionally, all 3 studies addressed the importance of considering clinical patient factors that may lead to poorer prognosis as well as the difficultly in achieving necessary vancomycin levels with limited toxicity. The risk of increased mortality in patients with high vancomycin MICs cannot be ruled out at this time. Therefore, additional patient factors as well as the potential toxicities that may result from vancomycin therapy should be considered when using vancomycin in treating patients with S aureus infections.
Additional Note
An earlier version of this article appeared in the Pharmacy Related Newsletter: The Capsule, of the William S. Middleton Memorial Veterans Hospital.
Author disclosures
The authors report no actual or potential conflicts of interest with regard to this article.
Disclaimer
The opinions expressed herein are those of the authors and do not necessarily reflect those of Federal Practitioner, Frontline Medical Communications Inc., the U.S. Government, or any of its agencies. This article may discuss unlabeled or investigational use of certain drugs. Please review complete prescribing information for specific drugs or drug combinations—including indications, contraindications, warnings, and adverse effects—before administering pharmacologic therapy to patients.
1. Martin JH, Norris R, Barras M, et al. Therapeutic monitoring of vancomycin in adult patients: a consensus review of the American Society of Health-System Pharmacists, the Infectious Diseases Society of America, and the Society of Infectious Diseases Pharmacists. Clin Biochem Rev. 2010;31(1):21-24.
2. van Hal SJ, Lodise TP, Paterson DL. The clinical significance of vancomycin minimum inhibitory concentration in Staphylococcus aureus infections: a systematic review and meta-analysis. Clin Infect Dis. 2012;54(6):755-771.
3. Jacob JT, DiazGranados CA. High vancomycin minimum inhibitory concentration and clinical outcomes in adults with methicillin-resistant Staphylococcus aureus infections: a meta-analysis. Int J Infect Dis. 2013;17(2):e93-e100.
4. Kalil AC, Van Schooneveld TC, Fey PD, Rupp ME. Association between vancomycin minimum inhibitory concentration and mortality among patients with Staphylococcus aureus bloodstream infections: a systematic review and meta-analysis. JAMA. 2014;312(15):1552-1564.