User login
Current Evidence Does Not Support Medicare’s 3-Day Rule in Primary Total Joint Arthroplasty
Medicare beneficiaries’ demand for total hip arthroplasty (THA) and total knee arthroplasty (TKA) has increased significantly over the past several years, with recent studies reporting 209,945 primary THAs and 243,802 primary TKAs performed annually.1,2 With this demand has come an increase in the percentage of patients discharged to an extended-care facility (ECF) for skilled nursing care or acute rehabilitation—an estimated 49.3% for THA and 41.5% for TKA.1,2 To qualify for discharge to an ECF, Medicare beneficiaries are required to have an inpatient stay of at least 3 consecutive days.3 Although the basis of this rule is unclear, it is thought to prevent hasty discharge of unstable patients.
We conducted a study to explore the effect of this policy on length of stay (LOS) in a population of patients who underwent primary total joint arthroplasty (TJA). Based on a pilot study by our group, we hypothesized that such a statuary requirement would be associated with increased LOS and would not prevent discharge of potentially unstable patients. Specifically, we explored whether patients who could have been discharged earlier experienced any later inpatient complications or 30-day readmission to justify staying past their discharge readiness.
Materials and Methods
Institutional review board approval was obtained for this study. Between 2011 and 2012, the senior authors (Dr. Wellman, Dr. Attarian, Dr. Bolognesi) treated 985 patients with Current Procedural Terminology (CPT) codes 27130 (THA) and 27447 (TKA). Of the 985 patients, 287 (29.13%) were discharged to an ECF and were included in the study. Three of the 287 were excluded: 2 for requiring preadmission for medical optimization and 1 for having another procedure with plastic surgery. All patients were admitted from home on day of surgery and had a standardized clinical pathway with respect to pain control, mobilization, and anticoagulation. Physical therapy and occupational therapy (PT/OT) were initiated on day of surgery and were continued daily until discharge.
The primary outcome was discharge readiness, defined as meeting the criteria of stable blood pressure, pulse, and breathing; no fever over 101.5°F for 24 hours before discharge; wound healing with no concerns; pain controlled with oral medications; and ambulation or the potential for rehabilitation at the receiving facility. Secondary outcomes were changes in PT/OT progress, medical interventions, and 30-day readmission rate. PT/OT progress was categorized as either slow or steady by the therapist assigned to each patient at time of hospitalization. Steady progress indicated overall improvement on several measures, including transfers, ambulation distance, and ability to adhere to postoperative precautions; slow progress indicated no improvement on these measures.
Results for continuous variables were summarized with means, standard deviations, and ranges, and results for categorical variables were summarized with counts and percentages. Student t test was used to evaluate increase in LOS, and the McNemar test for paired data was used to analyze rehabilitation gains from readiness-for-discharge day to the next postoperative day (POD). SAS Version 9.2 software (SAS Institute) was used for all analyses.
Results
Of the 284 patients included in the study, 203 were female (71.5%), 81 male (28.5%). Mean (SD) age was 68 (11) years (range, 21-92 years). One hundred seventy-nine patients (63.0%) underwent TKA, and 105 (37.0%) underwent THA. Two hundred twenty-seven patients (80.0%) were discharged to skilled nursing care, and 57 (20.1%) to inpatient rehabilitation. Mean (SD) LOS was 3.44 (0.92) days (range, 3-9 days). One hundred eighty-three patients (64.4%) were ready for discharge on POD 2, 76 (26.8%) on POD 3, and 25 (8.8%) after POD 3. Delaying discharge until POD 3 increased LOS by 1.08 days (P < .001). Two hundred nine patients (73.6%) were discharged on POD 3, and 75 (26.4%) after POD 3. Reasons for being discharged after POD 3 were lack of ECF bed availability (48 patients, 64.0%) and postoperative complications (27 patients, 36.0%). Patients ready for discharge on POD 2 had fewer complications than patients ready after POD 2 (P < .001).
Analysis of the 183 patients who were ready for discharge on POD 2 demonstrated a statistically significant (P = .038) change in rehabilitation progress by staying an additional hospital day. However, this difference was not clinically significant: Only 17.5% of patients improved, while 82.5% remained unchanged or declined in progress. Most important, among patients who demonstrated rehabilitation gains, the improvement was not sufficient to change the decision regarding discharge destination. Three patients (1.6%) ready for discharge on POD 2 were readmitted within 30 days of discharge (2 for wound infection, 1 for syncope). Risk for 30-day readmission or development of an inpatient complication in patients ready for discharge on POD 2 was not significant (P = .073). Table 1 summarizes the statistical results.

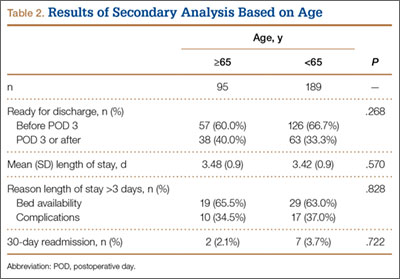
As age 65 years or older is one of the major criteria for Medicare eligibility, a secondary analysis was performed to explore whether there were age-related differences in the study outcomes. We found no significant differences between patients 65 years or older and patients younger than 65 years with respect to discharge readiness, LOS, postoperative complications, or 30-day readmission. Table 2 summarizes the statistical results based on age.
Discussion
Consistent with our pilot study,4 the majority of patients discharged to an ECF were ready for discharge on POD 2. Delaying discharge until POD 3 increased LOS by 1.08 days with no significant risk in 30-day readmission if patients were allowed to be discharged 1 day earlier. Different from our pilot study results, however, 17.5% of patients who stayed past their discharge readiness showed improvement in PT/OT progress, though this was not clinically sufficient to alter the decision regarding discharge destination. This difference can be attributed to the fact that the current study (vs the pilot study) was adequately powered for this outcome.
Our study was specifically designed to evaluate the effect of Medicare’s 3-day rule—the requirement of an inpatient hospital stay of at least 3 consecutive days to qualify for coverage for treatment at an ECF. This policy creates tremendous unnecessary hospitalization and resource utilization and denies patients earlier access to specialized postacute care. To put the economic implications of this policy in perspective, almost half of the 1 million TJAs performed annually are performed for Medicare beneficiaries, and almost half of those patients are discharged to an ECF.1,2,5 This equates to about 161,000 days of unnecessary hospitalization per year (64.4% of 250,000 patients), which translates into $310,730,000 in expenditures based on an average cost of $1930 per inpatient day for state/local government, nonprofit, and for-profit hospitals.6 Furthermore, with a growing trend toward outpatient TJA, the Medicare statute may leave substantial bills for patients who happen to require unplanned discharge to an ECF.
This study had its weaknesses. First, it was a retrospective review of charts at a single tertiary-care hospital. However, observer bias may have been eliminated, as the data were collected before a study was planned. An outcome such as discharge readiness, if prospectively assessed, could easily have been influenced by study personnel. Second, our patient sample was too small to definitively resolve this issue and be able to effect public policy change. However, there was sufficient power for the primary outcome. We also analyzed a consecutive group of patients who underwent a standardized postoperative clinical pathway with clear discharge-readiness criteria.
The effect of this study in the era of the Patient Protection and Affordable Care Act and its Bundled Payments for Care Improvement (BPCI) initiative deserves special attention. The BPCI initiative is divided into 4 models that reconcile payments associated with an episode of care (eg, TKA) against a predetermined payment amount.7 Relevant to our study, BPCI model 2 covers inpatient hospitalization up to 30, 60, or 90 days after discharge and includes a waiver of the 3-day rule for inpatient hospitalization. There are only 60 BPCI model 2–participating health care organizations. On the basis of our study results, we think the waiver is a step in the right direction, as no demonstrable benefits were realized from having patients stay hospitalized longer. However, the waiver should not be limited to select entities, and we hope that, with further research, the statutory requirement of 3-day inpatient hospitalization will be repealed.
Conclusion
Our study results call into question the validity of Medicare’s 3-day rule, and we hope they stimulate further research to definitively resolve this question. The majority of our study patients destined for discharge to an ECF could have been safely discharged on POD 2. The implications of reducing LOS cannot be overstated. From a hospital perspective, reducing LOS eliminates unnecessary hospitalization and resource utilization. From a patient perspective, it allows earlier access to specialized care and eliminates billing confusion. From a payer perspective, it may reduce costs significantly.
1. Cram P, Lu X, Kates SL, Singh JA, Li Y, Wolf BR. Total knee arthroplasty volume, utilization, and outcomes among Medicare beneficiaries, 1991–2010. JAMA. 2012;308(12):1227-1236.
2. Cram P, Lu X, Callaghan JJ, Vaughan-Sarrazin MS, Cai X, Li Y. Long-term trends in hip arthroplasty use and volume. J Arthroplasty. 2012;27(2):278-285.e2.
3. Centers for Medicare & Medicaid Services. Medicare Coverage of Skilled Nursing Facility Care. Baltimore, MD: US Dept of Health and Human Services, Centers for Medicare & Medicaid Services. CMS Product No. 10153. http://www.medicare.gov/pubs/pdf/10153.pdf. Revised January 2015. Accessed August 24, 2015.
4. Halawi MJ, Vovos TJ, Green CL, Wellman SS, Attarian DE, Bolognesi MP. Medicare’s 3-day rule: time for a rethink. J Arthroplasty. 2015;30(9):1483-1484.
5. Inpatient surgery. Centers for Disease Control and Prevention, National Center for Health Statistics website. http://www.cdc.gov/nchs/fastats/inpatient-surgery.htm. Updated April 29, 2015. Accessed August 24, 2015.
6 Hospital adjusted expenses per inpatient day by ownership. 2013. Kaiser Family Foundation website. http://kff.org/other/state-indicator/expenses-per-inpatient-day-by-ownership. Accessed August 24, 2015.
7. BPCI [Bundled Payments for Care Improvement] model 2: retrospective acute & post acute care episode. Centers for Medicare & Medicare Services website. http://innovation.cms.gov/initiatives/BPCI-Model-2. Updated August 20, 2015. Accessed August 24, 2015.
Medicare beneficiaries’ demand for total hip arthroplasty (THA) and total knee arthroplasty (TKA) has increased significantly over the past several years, with recent studies reporting 209,945 primary THAs and 243,802 primary TKAs performed annually.1,2 With this demand has come an increase in the percentage of patients discharged to an extended-care facility (ECF) for skilled nursing care or acute rehabilitation—an estimated 49.3% for THA and 41.5% for TKA.1,2 To qualify for discharge to an ECF, Medicare beneficiaries are required to have an inpatient stay of at least 3 consecutive days.3 Although the basis of this rule is unclear, it is thought to prevent hasty discharge of unstable patients.
We conducted a study to explore the effect of this policy on length of stay (LOS) in a population of patients who underwent primary total joint arthroplasty (TJA). Based on a pilot study by our group, we hypothesized that such a statuary requirement would be associated with increased LOS and would not prevent discharge of potentially unstable patients. Specifically, we explored whether patients who could have been discharged earlier experienced any later inpatient complications or 30-day readmission to justify staying past their discharge readiness.
Materials and Methods
Institutional review board approval was obtained for this study. Between 2011 and 2012, the senior authors (Dr. Wellman, Dr. Attarian, Dr. Bolognesi) treated 985 patients with Current Procedural Terminology (CPT) codes 27130 (THA) and 27447 (TKA). Of the 985 patients, 287 (29.13%) were discharged to an ECF and were included in the study. Three of the 287 were excluded: 2 for requiring preadmission for medical optimization and 1 for having another procedure with plastic surgery. All patients were admitted from home on day of surgery and had a standardized clinical pathway with respect to pain control, mobilization, and anticoagulation. Physical therapy and occupational therapy (PT/OT) were initiated on day of surgery and were continued daily until discharge.
The primary outcome was discharge readiness, defined as meeting the criteria of stable blood pressure, pulse, and breathing; no fever over 101.5°F for 24 hours before discharge; wound healing with no concerns; pain controlled with oral medications; and ambulation or the potential for rehabilitation at the receiving facility. Secondary outcomes were changes in PT/OT progress, medical interventions, and 30-day readmission rate. PT/OT progress was categorized as either slow or steady by the therapist assigned to each patient at time of hospitalization. Steady progress indicated overall improvement on several measures, including transfers, ambulation distance, and ability to adhere to postoperative precautions; slow progress indicated no improvement on these measures.
Results for continuous variables were summarized with means, standard deviations, and ranges, and results for categorical variables were summarized with counts and percentages. Student t test was used to evaluate increase in LOS, and the McNemar test for paired data was used to analyze rehabilitation gains from readiness-for-discharge day to the next postoperative day (POD). SAS Version 9.2 software (SAS Institute) was used for all analyses.
Results
Of the 284 patients included in the study, 203 were female (71.5%), 81 male (28.5%). Mean (SD) age was 68 (11) years (range, 21-92 years). One hundred seventy-nine patients (63.0%) underwent TKA, and 105 (37.0%) underwent THA. Two hundred twenty-seven patients (80.0%) were discharged to skilled nursing care, and 57 (20.1%) to inpatient rehabilitation. Mean (SD) LOS was 3.44 (0.92) days (range, 3-9 days). One hundred eighty-three patients (64.4%) were ready for discharge on POD 2, 76 (26.8%) on POD 3, and 25 (8.8%) after POD 3. Delaying discharge until POD 3 increased LOS by 1.08 days (P < .001). Two hundred nine patients (73.6%) were discharged on POD 3, and 75 (26.4%) after POD 3. Reasons for being discharged after POD 3 were lack of ECF bed availability (48 patients, 64.0%) and postoperative complications (27 patients, 36.0%). Patients ready for discharge on POD 2 had fewer complications than patients ready after POD 2 (P < .001).
Analysis of the 183 patients who were ready for discharge on POD 2 demonstrated a statistically significant (P = .038) change in rehabilitation progress by staying an additional hospital day. However, this difference was not clinically significant: Only 17.5% of patients improved, while 82.5% remained unchanged or declined in progress. Most important, among patients who demonstrated rehabilitation gains, the improvement was not sufficient to change the decision regarding discharge destination. Three patients (1.6%) ready for discharge on POD 2 were readmitted within 30 days of discharge (2 for wound infection, 1 for syncope). Risk for 30-day readmission or development of an inpatient complication in patients ready for discharge on POD 2 was not significant (P = .073). Table 1 summarizes the statistical results.
As age 65 years or older is one of the major criteria for Medicare eligibility, a secondary analysis was performed to explore whether there were age-related differences in the study outcomes. We found no significant differences between patients 65 years or older and patients younger than 65 years with respect to discharge readiness, LOS, postoperative complications, or 30-day readmission. Table 2 summarizes the statistical results based on age.
Discussion
Consistent with our pilot study,4 the majority of patients discharged to an ECF were ready for discharge on POD 2. Delaying discharge until POD 3 increased LOS by 1.08 days with no significant risk in 30-day readmission if patients were allowed to be discharged 1 day earlier. Different from our pilot study results, however, 17.5% of patients who stayed past their discharge readiness showed improvement in PT/OT progress, though this was not clinically sufficient to alter the decision regarding discharge destination. This difference can be attributed to the fact that the current study (vs the pilot study) was adequately powered for this outcome.
Our study was specifically designed to evaluate the effect of Medicare’s 3-day rule—the requirement of an inpatient hospital stay of at least 3 consecutive days to qualify for coverage for treatment at an ECF. This policy creates tremendous unnecessary hospitalization and resource utilization and denies patients earlier access to specialized postacute care. To put the economic implications of this policy in perspective, almost half of the 1 million TJAs performed annually are performed for Medicare beneficiaries, and almost half of those patients are discharged to an ECF.1,2,5 This equates to about 161,000 days of unnecessary hospitalization per year (64.4% of 250,000 patients), which translates into $310,730,000 in expenditures based on an average cost of $1930 per inpatient day for state/local government, nonprofit, and for-profit hospitals.6 Furthermore, with a growing trend toward outpatient TJA, the Medicare statute may leave substantial bills for patients who happen to require unplanned discharge to an ECF.
This study had its weaknesses. First, it was a retrospective review of charts at a single tertiary-care hospital. However, observer bias may have been eliminated, as the data were collected before a study was planned. An outcome such as discharge readiness, if prospectively assessed, could easily have been influenced by study personnel. Second, our patient sample was too small to definitively resolve this issue and be able to effect public policy change. However, there was sufficient power for the primary outcome. We also analyzed a consecutive group of patients who underwent a standardized postoperative clinical pathway with clear discharge-readiness criteria.
The effect of this study in the era of the Patient Protection and Affordable Care Act and its Bundled Payments for Care Improvement (BPCI) initiative deserves special attention. The BPCI initiative is divided into 4 models that reconcile payments associated with an episode of care (eg, TKA) against a predetermined payment amount.7 Relevant to our study, BPCI model 2 covers inpatient hospitalization up to 30, 60, or 90 days after discharge and includes a waiver of the 3-day rule for inpatient hospitalization. There are only 60 BPCI model 2–participating health care organizations. On the basis of our study results, we think the waiver is a step in the right direction, as no demonstrable benefits were realized from having patients stay hospitalized longer. However, the waiver should not be limited to select entities, and we hope that, with further research, the statutory requirement of 3-day inpatient hospitalization will be repealed.
Conclusion
Our study results call into question the validity of Medicare’s 3-day rule, and we hope they stimulate further research to definitively resolve this question. The majority of our study patients destined for discharge to an ECF could have been safely discharged on POD 2. The implications of reducing LOS cannot be overstated. From a hospital perspective, reducing LOS eliminates unnecessary hospitalization and resource utilization. From a patient perspective, it allows earlier access to specialized care and eliminates billing confusion. From a payer perspective, it may reduce costs significantly.
1. Cram P, Lu X, Kates SL, Singh JA, Li Y, Wolf BR. Total knee arthroplasty volume, utilization, and outcomes among Medicare beneficiaries, 1991–2010. JAMA. 2012;308(12):1227-1236.
2. Cram P, Lu X, Callaghan JJ, Vaughan-Sarrazin MS, Cai X, Li Y. Long-term trends in hip arthroplasty use and volume. J Arthroplasty. 2012;27(2):278-285.e2.
3. Centers for Medicare & Medicaid Services. Medicare Coverage of Skilled Nursing Facility Care. Baltimore, MD: US Dept of Health and Human Services, Centers for Medicare & Medicaid Services. CMS Product No. 10153. http://www.medicare.gov/pubs/pdf/10153.pdf. Revised January 2015. Accessed August 24, 2015.
4. Halawi MJ, Vovos TJ, Green CL, Wellman SS, Attarian DE, Bolognesi MP. Medicare’s 3-day rule: time for a rethink. J Arthroplasty. 2015;30(9):1483-1484.
5. Inpatient surgery. Centers for Disease Control and Prevention, National Center for Health Statistics website. http://www.cdc.gov/nchs/fastats/inpatient-surgery.htm. Updated April 29, 2015. Accessed August 24, 2015.
6 Hospital adjusted expenses per inpatient day by ownership. 2013. Kaiser Family Foundation website. http://kff.org/other/state-indicator/expenses-per-inpatient-day-by-ownership. Accessed August 24, 2015.
7. BPCI [Bundled Payments for Care Improvement] model 2: retrospective acute & post acute care episode. Centers for Medicare & Medicare Services website. http://innovation.cms.gov/initiatives/BPCI-Model-2. Updated August 20, 2015. Accessed August 24, 2015.
Using 3-Dimensional Fluoroscopy to Assess Acute Clavicle Fracture Displacement: A Radiographic Study
Clavicle fractures are common injuries, accounting for 2.6% to 5% of all adult fractures.1,2 Most clavicle fractures (69%-82%) occur in the middle third or midshaft.3,4 Midshaft clavicle fractures are often treated successfully with nonoperative means consisting of shoulder immobilization with either a sling or a figure-of-8 brace. Operative indications historically have been limited to open or impending open injuries and to patients with underlying neurovascular compromise. However, recent clinical studies have found that fractures with particular characteristics may benefit from surgical fixation. Important relative indications for open reduction and internal fixation of midshaft clavicle fractures are complete fracture fragment displacement with no cortical contact, and fractures with axial shortening of more than 20 mm.5,6
Accurately determining the extent of displacement and shortening can therefore be important in guiding treatment recommendations. The standard radiographic view for a clavicle fracture is upright or supine anteroposterior (AP). Typically, an AP radiograph with cephalic tilt of about 20° is obtained as well. On occasion, other supplemental radiographs, such as a 45° angulated view, as originally described by Quesada,7 are obtained. To our knowledge, the literature includes only 2 reports of studies that have compared different radiographic views and their accuracy in measuring fracture shortening8,9; no study has determined the best radiographic view for evaluating fracture displacement.
We conducted a study to determine which radiographic view best captures the most fracture fragment displacement. Acute midshaft clavicle fractures were assessed with simulated angled radiographs created from preoperative upright 3-dimensional (3-D) fluoroscopy scans. Our hypothesis was that a radiographic view with 20° of cephalic tilt would most often detect the most fracture displacement. In addition, we retrospectively reviewed our study patients’ initial AP injury radiographs to determine if obtaining a different view at maximum displacement would have helped identify a larger number of completely displaced midshaft clavicle fractures.
Patients and Methods
Institutional review board approval was obtained. Using our institution’s trauma registry database, we retrospectively identified 10 cases of patients who had undergone preoperative 3-D fluoroscopy for midshaft clavicle fractures. Study inclusion criteria were age 18 years or older, acute midshaft clavicle fracture, and preoperative 3-D fluoroscopy scan of clavicle available. Pediatric patients, nonacute injuries, and clavicle fractures of the lateral or medial third were excluded.
Three-dimensional fluoroscopy was used when the treating surgeon deemed it necessary for preoperative planning. All imaging was performed with a Philips MultiDiagnost Eleva 3-D fluoroscopy imager with patients in the upright standing position. (Informed patient consent was obtained.) Software bundled with the imager was used to create representative radiographs of differing angulation.
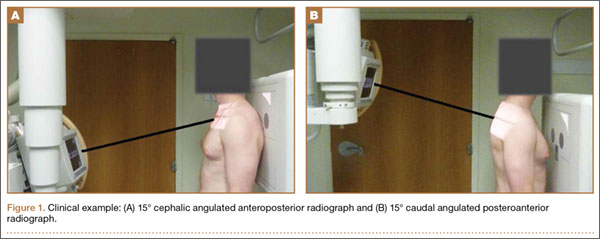
The common practice at most institutions is to obtain 2 radiographic views as part of a standard clavicle series. The additional AP angulated radiograph typically is obtained with 20° to 45° cephalic tilt from the horizontal axis. Therefore, simulated radiographs ranging from 15° to 50° of angulation in 5° increments were created, and the amount of superior displacement of the medial fragment was measured. As the simulated views were constructed from a 3-D composite image, there was none of the magnification error that occurs with AP or posteroanterior (PA) views. The stated degree of angulation mimics a radiograph’s AP cephalic tilt or PA caudal tilt (Figures 1A, 1B). For all radiographic images, displacement between fracture fragments was determined by measuring the distance between the superior cortices at the fracture site of the medial and lateral fragments. Each simulated radiograph was measured by 2 readers using standard computerized radiographic measurement tools. Final displacement was taken as the mean of the 2 measurements.
After determining which radiographic angulation demonstrated the largest number of maximally displaced fractures, we compared the simulated radiographs at that angulation with the injury AP images for all patients. Total number of patients with a completely displaced midshaft clavicle fracture and no cortical contact was recorded for the 2 radiographic views.
The Orthopaedic Trauma Association classification system8 was used to classify the clavicle fractures. Statistical analysis was performed with the Fisher exact test and a regression model, using SPSS Version 19.0 (IBM SPSS Statistics).
Results
Ten patients met the study inclusion criteria. Mean age was 32.9 years (range, 18-65 years). Seven of the 10 patients were male. Six patients had right-side clavicle fractures. Of the 10 patients, 5 had the comminuted wedge fracture pattern (15-B2.3), 2 had the simple spiral pattern (15-B1.1), 2 had the spiral wedge pattern (15-B2.1), and 1 had the oblique pattern (15-B1.2).
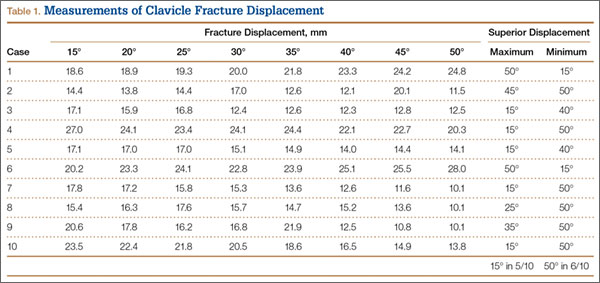
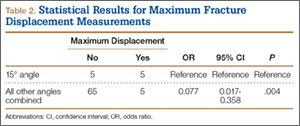
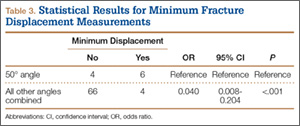
Table 1 summarizes the fracture displacement measurements obtained with the different radiographic views. Of the 10 cases, 5 showed the most displacement with the 15° tilted view (P = .004), and the other 5 showed maximum displacement with different radiographic angulations. In addition, 6 patients showed the least displacement with the 50° angulated view (P < .001). Results of the regression analysis are summarized in Tables 2 and 3.
Initial horizontal AP imaging showed completely displaced midshaft clavicle fractures in 9 of the 10 patients, and 15° simulated radiographs showed completely displaced fractures in all 10 patients (P = .50).
Discussion
Our study results demonstrated that an upright 15° radiographic tilt (AP cephalad or PA caudal) identified the most fracture displacement in the most patients with acute midshaft clavicle fractures. To our knowledge, this is the first study to identify the radiographic angulation that best shows the most clavicle fracture fragment displacement.
Other investigators have studied the accuracy of different radiographic views in the assessment of midshaft clavicle fractures, but they concentrated on fracture shortening. Smekal and colleagues9 used computed tomography (CT) and 3 different radiographic views to evaluate malunited midshaft clavicle fractures. Comparing the horizontal clavicular length measurements obtained with radiographs and CT scans, they determined that PA thoracic radiographs were in highest agreement with the CT scans. The results, however, were not statistically significant. In their study, supine CT was successful because the fractures were healed, and the displacement and shortening amounts were not affected by patient position. Sharr and Mohammed10 studied the accuracy of different views in the assessment of clavicle length in an articulated cadaver specimen. They obtained multiple AP and PA radiographs of different horizontal (medial, lateral) and vertical (cephalad, caudal) angulations. Actual clavicle length was then directly measured and compared with the length measured on the different views. The authors concluded that a PA 15° caudal radiograph was most accurate in assessing clavicular length. Both Smekal and colleagues9 and Sharr and Mohammed10 recommended the PA radiograph because it decreases the degree of magnification on AP radiographs by minimizing the film-to-object distance.
Our findings are important because more accurate determination of fracture displacement in patients with midshaft clavicle fractures may change clinical management. Nowak and colleagues11 investigated various patient and clavicle fracture characteristics that were predictive of a higher rate of long-term sequelae. They found that complete fracture displacement was the strongest radiographic predictor of patients’ beliefs that they were fully recovered from injury at final follow-up. The authors concluded that fractures with no bony contact should receive more “active” management. Robinson and colleagues12 studied a cohort of patients with nonoperatively managed midshaft clavicle fractures and concluded that complete fracture displacement significantly increased risk for nonunion (this risk was 2.3 times higher in patients with displaced fractures than in patients with nondisplaced fractures). Last, McKee and colleagues13 found that shoulder strength and endurance were significantly decreased in nonoperatively treated displaced midshaft clavicle fractures than in the same patients’ uninjured shoulders.
Extending the results of these studies, recent prospective randomized control trials and a meta-analysis have compared the clinical outcomes of nonoperatively and operatively managed displaced midshaft clavicle fractures.14-18 With few exceptions, these studies found improved clinical results with operative fixation. In one such study, the Canadian Orthopaedic Trauma Society14 randomized patients with displaced midshaft clavicle fractures to either operative plate fixation or sling immobilization. The operative group was found to have improved Disability of the Arm, Shoulder, and Hand scores, improved Constant shoulder scores, increased patient satisfaction, faster mean time to bony fracture union, higher satisfaction with shoulder appearance, and lower rates of nonunion and malunion. Given the results of these studies, accurate identification of a displaced midshaft clavicle fracture with no cortical contact is fundamental in deciding whether to recommend operative fixation.
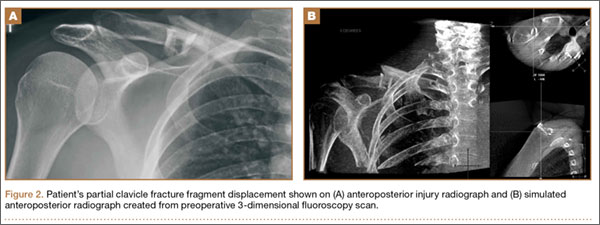
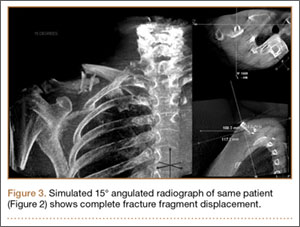
Retrospective review of our cohort’s initial radiographs revealed 1 case in which the patient’s completely displaced midshaft clavicle fracture would not have been diagnosed solely with an AP horizontal image. Cortical contact was seen on a standard AP clavicle radiograph (Figures 2A, 2B), and a 15° tilt radiograph created from 3-D fluoroscopy scan showed complete fracture fragment displacement (Figure 3). A change in fracture classification from partially displaced to fully displaced could alter the type of management used by a treating surgeon.
There were obvious weaknesses to this study. First, its sample size was small (10 patients). Nevertheless, we had sufficient numbers to find a statistically significant angulation. Second, a wider range of radiographic angles could have been studied. Our intent, however, was to investigate the accuracy of the 2 most common supplementary clavicle views (20° and 45° cephalic tilt). Therefore, we selected a range of simulated radiographs that began 5° outside these angulations. Third, we measured only the degree of fracture displacement; we were unable to accurately access fracture shortening, as the 3-D fluoroscopic images were limited to the injured clavicles. A potential solution to this problem is to widen the exposure field in order to include the entire chest and allow clavicular length comparison against the uninjured side. Doing this would have been possible, but at the expense of increasing the patient’s radiation exposure.
This innovative study used 3-D fluoroscopy to capture clavicle fracture images with patients in an upright position. Unlike standard CT, in which patients are supine, this 3-D imaging technology better emulates the patient positioning used for upright radiographs, thereby avoiding potential fracture fragment alignment changes caused by shifts in body position. In addition, 3-D fluoroscopy allows us to create multiple precise simulated radiographic angulations without the magnification error of AP radiographs and, to a lesser extent, PA radiographs. Having a standing PA 15° caudal tilt radiograph obviates the need for CT with 3-D reconstruction. More fine detail may be revealed by CT with 3-D reconstruction than by a standing PA 15° caudal tilt radiograph, but the patient faces less radiation risk and cost with the radiograph.
There is no consensus as to what constitutes the standard radiographic series for clavicle fractures. Radiographic technique can vary with respect to supplemental view angulation, supine or upright patient positioning, and AP or PA radiographic views. Although our study did not address the effect of supine versus upright patient positioning on acute midshaft clavicle fracture displacement, we think that, for all clinical and research purposes, upright 15° caudal PA radiographs should be obtained for patients with acute midshaft clavicle fractures.
Conclusion
Our retrospective study of 10 patients with acute midshaft clavicle fractures and preoperative upright 3-D fluoroscopy scans found that a 15° angulated radiograph most often demonstrated the most fracture fragment displacement. Given these findings, we recommend obtaining an additional PA 15° caudal radiograph in the upright position for patients with midshaft clavicle fractures to best assess the extent of fracture displacement. Accurately identifying the degree of fracture displacement is important, as operative management of completely displaced fractures has been shown to improve clinical outcomes.
1. Postacchini F, Gumina S, De Santis P, Albo F. Epidemiology of clavicle fractures. J Shoulder Elbow Surg. 2002;11(5):452-456.
2. Nordqvist A, Petersson C. The incidence of fractures of the clavicle. Clin Orthop Relat Res. 1994;(300):127-132.
3. Robinson CM. Fractures of the clavicle in the adult. Epidemiology and classification. J Bone Joint Surg Br. 1998;80(3):476-484.
4. Rowe CR. An atlas of anatomy and treatment of midclavicular fractures. Clin Orthop Relat Res. 1968;(58):29-42.
5. Jeray KJ. Acute midshaft clavicular fracture. J Am Acad Orthop Surg. 2007;15(4):239-248.
6. Khan LA, Bradnock TJ, Scott C, Robinson CM. Fractures of the clavicle. J Bone Joint Surg Am. 2009;91(2):447-460.
7. Quesada F. Technique for the roentgen diagnosis of fractures of the clavicle. Surg Gynecol Obstet. 1926;42:424-428.
8. Marsh JL, Slongo TF, Agel J, et al. Fracture and dislocation classification compendium—2007: Orthopaedic Trauma Association Classification, Database and Outcomes Committee. J Orthop Trauma. 2007;21(10 suppl):S1-S133.
9. Smekal V, Deml C, Irenberger A, et al. Length determination in midshaft clavicle fractures: validation of measurement. J Orthop Trauma. 2008;22(7):458-462.
10. Sharr JR, Mohammed KD. Optimizing the radiographic technique in clavicular fractures. J Shoulder Elbow Surg. 2003;12(2):170-172.
11. Nowak J, Holgersson M, Larsson S. Can we predict long-term sequelae after fractures of the clavicle based on initial findings? A prospective study with nine to ten years of follow-up. J Shoulder Elbow Surg. 2004;13(5):479-486.
12. Robinson CM, Court-Brown CM, McQueen MM, Wakefield AE. Estimating the risk of nonunion following nonoperative treatment of a clavicular fracture. J Bone Joint Surg Am. 2004;86(7):1359-1365.
13. McKee MD, Pedersen EM, Jones C, et al. Deficits following nonoperative treatment of displaced midshaft clavicular fractures. J Bone Joint Surg Am. 2006;88(1):35-40.
14. Canadian Orthopaedic Trauma Society. Nonoperative treatment compared with plate fixation of displaced midshaft clavicular fractures. A multicenter, randomized clinical trial. J Bone Joint Surg Am. 2007;89(1):1-10.
15. Judd DB, Pallis MP, Smith E, Bottoni CR. Acute operative stabilization versus nonoperative management of clavicle fractures. Am J Orthop. 2009;38(7):341-345.
16. Smekal V, Irenberger A, Struve P, Wambacher M, Krappinger D, Kralinger FS. Elastic stable intramedullary nailing versus nonoperative treatment of displaced midshaft clavicular fractures—a randomized, controlled, clinical trial. J Orthop Trauma. 2009;23(2):106-112.
17. Witzel K. Intramedullary osteosynthesis in fractures of the mid-third of the clavicle in sports traumatology [in German]. Z Orthop Unfall. 2007;145(5):639-642.
18. McKee RC, Whelan DB, Schemitsch EH, McKee MD. Operative versus nonoperative care of displaced midshaft clavicular fractures: a meta-analysis of randomized clinical trials. J Bone Joint Surg Am. 2012;94(8):675-684.
Clavicle fractures are common injuries, accounting for 2.6% to 5% of all adult fractures.1,2 Most clavicle fractures (69%-82%) occur in the middle third or midshaft.3,4 Midshaft clavicle fractures are often treated successfully with nonoperative means consisting of shoulder immobilization with either a sling or a figure-of-8 brace. Operative indications historically have been limited to open or impending open injuries and to patients with underlying neurovascular compromise. However, recent clinical studies have found that fractures with particular characteristics may benefit from surgical fixation. Important relative indications for open reduction and internal fixation of midshaft clavicle fractures are complete fracture fragment displacement with no cortical contact, and fractures with axial shortening of more than 20 mm.5,6
Accurately determining the extent of displacement and shortening can therefore be important in guiding treatment recommendations. The standard radiographic view for a clavicle fracture is upright or supine anteroposterior (AP). Typically, an AP radiograph with cephalic tilt of about 20° is obtained as well. On occasion, other supplemental radiographs, such as a 45° angulated view, as originally described by Quesada,7 are obtained. To our knowledge, the literature includes only 2 reports of studies that have compared different radiographic views and their accuracy in measuring fracture shortening8,9; no study has determined the best radiographic view for evaluating fracture displacement.
We conducted a study to determine which radiographic view best captures the most fracture fragment displacement. Acute midshaft clavicle fractures were assessed with simulated angled radiographs created from preoperative upright 3-dimensional (3-D) fluoroscopy scans. Our hypothesis was that a radiographic view with 20° of cephalic tilt would most often detect the most fracture displacement. In addition, we retrospectively reviewed our study patients’ initial AP injury radiographs to determine if obtaining a different view at maximum displacement would have helped identify a larger number of completely displaced midshaft clavicle fractures.
Patients and Methods
Institutional review board approval was obtained. Using our institution’s trauma registry database, we retrospectively identified 10 cases of patients who had undergone preoperative 3-D fluoroscopy for midshaft clavicle fractures. Study inclusion criteria were age 18 years or older, acute midshaft clavicle fracture, and preoperative 3-D fluoroscopy scan of clavicle available. Pediatric patients, nonacute injuries, and clavicle fractures of the lateral or medial third were excluded.
Three-dimensional fluoroscopy was used when the treating surgeon deemed it necessary for preoperative planning. All imaging was performed with a Philips MultiDiagnost Eleva 3-D fluoroscopy imager with patients in the upright standing position. (Informed patient consent was obtained.) Software bundled with the imager was used to create representative radiographs of differing angulation.
The common practice at most institutions is to obtain 2 radiographic views as part of a standard clavicle series. The additional AP angulated radiograph typically is obtained with 20° to 45° cephalic tilt from the horizontal axis. Therefore, simulated radiographs ranging from 15° to 50° of angulation in 5° increments were created, and the amount of superior displacement of the medial fragment was measured. As the simulated views were constructed from a 3-D composite image, there was none of the magnification error that occurs with AP or posteroanterior (PA) views. The stated degree of angulation mimics a radiograph’s AP cephalic tilt or PA caudal tilt (Figures 1A, 1B). For all radiographic images, displacement between fracture fragments was determined by measuring the distance between the superior cortices at the fracture site of the medial and lateral fragments. Each simulated radiograph was measured by 2 readers using standard computerized radiographic measurement tools. Final displacement was taken as the mean of the 2 measurements.
After determining which radiographic angulation demonstrated the largest number of maximally displaced fractures, we compared the simulated radiographs at that angulation with the injury AP images for all patients. Total number of patients with a completely displaced midshaft clavicle fracture and no cortical contact was recorded for the 2 radiographic views.
The Orthopaedic Trauma Association classification system8 was used to classify the clavicle fractures. Statistical analysis was performed with the Fisher exact test and a regression model, using SPSS Version 19.0 (IBM SPSS Statistics).
Results
Ten patients met the study inclusion criteria. Mean age was 32.9 years (range, 18-65 years). Seven of the 10 patients were male. Six patients had right-side clavicle fractures. Of the 10 patients, 5 had the comminuted wedge fracture pattern (15-B2.3), 2 had the simple spiral pattern (15-B1.1), 2 had the spiral wedge pattern (15-B2.1), and 1 had the oblique pattern (15-B1.2).
Table 1 summarizes the fracture displacement measurements obtained with the different radiographic views. Of the 10 cases, 5 showed the most displacement with the 15° tilted view (P = .004), and the other 5 showed maximum displacement with different radiographic angulations. In addition, 6 patients showed the least displacement with the 50° angulated view (P < .001). Results of the regression analysis are summarized in Tables 2 and 3.
Initial horizontal AP imaging showed completely displaced midshaft clavicle fractures in 9 of the 10 patients, and 15° simulated radiographs showed completely displaced fractures in all 10 patients (P = .50).
Discussion
Our study results demonstrated that an upright 15° radiographic tilt (AP cephalad or PA caudal) identified the most fracture displacement in the most patients with acute midshaft clavicle fractures. To our knowledge, this is the first study to identify the radiographic angulation that best shows the most clavicle fracture fragment displacement.
Other investigators have studied the accuracy of different radiographic views in the assessment of midshaft clavicle fractures, but they concentrated on fracture shortening. Smekal and colleagues9 used computed tomography (CT) and 3 different radiographic views to evaluate malunited midshaft clavicle fractures. Comparing the horizontal clavicular length measurements obtained with radiographs and CT scans, they determined that PA thoracic radiographs were in highest agreement with the CT scans. The results, however, were not statistically significant. In their study, supine CT was successful because the fractures were healed, and the displacement and shortening amounts were not affected by patient position. Sharr and Mohammed10 studied the accuracy of different views in the assessment of clavicle length in an articulated cadaver specimen. They obtained multiple AP and PA radiographs of different horizontal (medial, lateral) and vertical (cephalad, caudal) angulations. Actual clavicle length was then directly measured and compared with the length measured on the different views. The authors concluded that a PA 15° caudal radiograph was most accurate in assessing clavicular length. Both Smekal and colleagues9 and Sharr and Mohammed10 recommended the PA radiograph because it decreases the degree of magnification on AP radiographs by minimizing the film-to-object distance.
Our findings are important because more accurate determination of fracture displacement in patients with midshaft clavicle fractures may change clinical management. Nowak and colleagues11 investigated various patient and clavicle fracture characteristics that were predictive of a higher rate of long-term sequelae. They found that complete fracture displacement was the strongest radiographic predictor of patients’ beliefs that they were fully recovered from injury at final follow-up. The authors concluded that fractures with no bony contact should receive more “active” management. Robinson and colleagues12 studied a cohort of patients with nonoperatively managed midshaft clavicle fractures and concluded that complete fracture displacement significantly increased risk for nonunion (this risk was 2.3 times higher in patients with displaced fractures than in patients with nondisplaced fractures). Last, McKee and colleagues13 found that shoulder strength and endurance were significantly decreased in nonoperatively treated displaced midshaft clavicle fractures than in the same patients’ uninjured shoulders.
Extending the results of these studies, recent prospective randomized control trials and a meta-analysis have compared the clinical outcomes of nonoperatively and operatively managed displaced midshaft clavicle fractures.14-18 With few exceptions, these studies found improved clinical results with operative fixation. In one such study, the Canadian Orthopaedic Trauma Society14 randomized patients with displaced midshaft clavicle fractures to either operative plate fixation or sling immobilization. The operative group was found to have improved Disability of the Arm, Shoulder, and Hand scores, improved Constant shoulder scores, increased patient satisfaction, faster mean time to bony fracture union, higher satisfaction with shoulder appearance, and lower rates of nonunion and malunion. Given the results of these studies, accurate identification of a displaced midshaft clavicle fracture with no cortical contact is fundamental in deciding whether to recommend operative fixation.
Retrospective review of our cohort’s initial radiographs revealed 1 case in which the patient’s completely displaced midshaft clavicle fracture would not have been diagnosed solely with an AP horizontal image. Cortical contact was seen on a standard AP clavicle radiograph (Figures 2A, 2B), and a 15° tilt radiograph created from 3-D fluoroscopy scan showed complete fracture fragment displacement (Figure 3). A change in fracture classification from partially displaced to fully displaced could alter the type of management used by a treating surgeon.
There were obvious weaknesses to this study. First, its sample size was small (10 patients). Nevertheless, we had sufficient numbers to find a statistically significant angulation. Second, a wider range of radiographic angles could have been studied. Our intent, however, was to investigate the accuracy of the 2 most common supplementary clavicle views (20° and 45° cephalic tilt). Therefore, we selected a range of simulated radiographs that began 5° outside these angulations. Third, we measured only the degree of fracture displacement; we were unable to accurately access fracture shortening, as the 3-D fluoroscopic images were limited to the injured clavicles. A potential solution to this problem is to widen the exposure field in order to include the entire chest and allow clavicular length comparison against the uninjured side. Doing this would have been possible, but at the expense of increasing the patient’s radiation exposure.
This innovative study used 3-D fluoroscopy to capture clavicle fracture images with patients in an upright position. Unlike standard CT, in which patients are supine, this 3-D imaging technology better emulates the patient positioning used for upright radiographs, thereby avoiding potential fracture fragment alignment changes caused by shifts in body position. In addition, 3-D fluoroscopy allows us to create multiple precise simulated radiographic angulations without the magnification error of AP radiographs and, to a lesser extent, PA radiographs. Having a standing PA 15° caudal tilt radiograph obviates the need for CT with 3-D reconstruction. More fine detail may be revealed by CT with 3-D reconstruction than by a standing PA 15° caudal tilt radiograph, but the patient faces less radiation risk and cost with the radiograph.
There is no consensus as to what constitutes the standard radiographic series for clavicle fractures. Radiographic technique can vary with respect to supplemental view angulation, supine or upright patient positioning, and AP or PA radiographic views. Although our study did not address the effect of supine versus upright patient positioning on acute midshaft clavicle fracture displacement, we think that, for all clinical and research purposes, upright 15° caudal PA radiographs should be obtained for patients with acute midshaft clavicle fractures.
Conclusion
Our retrospective study of 10 patients with acute midshaft clavicle fractures and preoperative upright 3-D fluoroscopy scans found that a 15° angulated radiograph most often demonstrated the most fracture fragment displacement. Given these findings, we recommend obtaining an additional PA 15° caudal radiograph in the upright position for patients with midshaft clavicle fractures to best assess the extent of fracture displacement. Accurately identifying the degree of fracture displacement is important, as operative management of completely displaced fractures has been shown to improve clinical outcomes.
1. Postacchini F, Gumina S, De Santis P, Albo F. Epidemiology of clavicle fractures. J Shoulder Elbow Surg. 2002;11(5):452-456.
2. Nordqvist A, Petersson C. The incidence of fractures of the clavicle. Clin Orthop Relat Res. 1994;(300):127-132.
3. Robinson CM. Fractures of the clavicle in the adult. Epidemiology and classification. J Bone Joint Surg Br. 1998;80(3):476-484.
4. Rowe CR. An atlas of anatomy and treatment of midclavicular fractures. Clin Orthop Relat Res. 1968;(58):29-42.
5. Jeray KJ. Acute midshaft clavicular fracture. J Am Acad Orthop Surg. 2007;15(4):239-248.
6. Khan LA, Bradnock TJ, Scott C, Robinson CM. Fractures of the clavicle. J Bone Joint Surg Am. 2009;91(2):447-460.
7. Quesada F. Technique for the roentgen diagnosis of fractures of the clavicle. Surg Gynecol Obstet. 1926;42:424-428.
8. Marsh JL, Slongo TF, Agel J, et al. Fracture and dislocation classification compendium—2007: Orthopaedic Trauma Association Classification, Database and Outcomes Committee. J Orthop Trauma. 2007;21(10 suppl):S1-S133.
9. Smekal V, Deml C, Irenberger A, et al. Length determination in midshaft clavicle fractures: validation of measurement. J Orthop Trauma. 2008;22(7):458-462.
10. Sharr JR, Mohammed KD. Optimizing the radiographic technique in clavicular fractures. J Shoulder Elbow Surg. 2003;12(2):170-172.
11. Nowak J, Holgersson M, Larsson S. Can we predict long-term sequelae after fractures of the clavicle based on initial findings? A prospective study with nine to ten years of follow-up. J Shoulder Elbow Surg. 2004;13(5):479-486.
12. Robinson CM, Court-Brown CM, McQueen MM, Wakefield AE. Estimating the risk of nonunion following nonoperative treatment of a clavicular fracture. J Bone Joint Surg Am. 2004;86(7):1359-1365.
13. McKee MD, Pedersen EM, Jones C, et al. Deficits following nonoperative treatment of displaced midshaft clavicular fractures. J Bone Joint Surg Am. 2006;88(1):35-40.
14. Canadian Orthopaedic Trauma Society. Nonoperative treatment compared with plate fixation of displaced midshaft clavicular fractures. A multicenter, randomized clinical trial. J Bone Joint Surg Am. 2007;89(1):1-10.
15. Judd DB, Pallis MP, Smith E, Bottoni CR. Acute operative stabilization versus nonoperative management of clavicle fractures. Am J Orthop. 2009;38(7):341-345.
16. Smekal V, Irenberger A, Struve P, Wambacher M, Krappinger D, Kralinger FS. Elastic stable intramedullary nailing versus nonoperative treatment of displaced midshaft clavicular fractures—a randomized, controlled, clinical trial. J Orthop Trauma. 2009;23(2):106-112.
17. Witzel K. Intramedullary osteosynthesis in fractures of the mid-third of the clavicle in sports traumatology [in German]. Z Orthop Unfall. 2007;145(5):639-642.
18. McKee RC, Whelan DB, Schemitsch EH, McKee MD. Operative versus nonoperative care of displaced midshaft clavicular fractures: a meta-analysis of randomized clinical trials. J Bone Joint Surg Am. 2012;94(8):675-684.
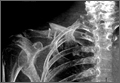
The Supination-Pronation Test for Distal Biceps Tendon Rupture
Distal biceps tendon ruptures have been reported with increasing frequency, occurring 1.2 times per 100,000 patients per year, representing 3% of tendinous avulsions involving this muscle.1,2 This injury occurs most commonly in men between the ages of 40 and 60 years, and more often in the dominant extremity after an unexpected or violent eccentric contraction.2,3 Generally, the patient is performing a task that is more strenuous than usual and only performed occasionally; usually, it is a flexion task. The biceps muscle is the most superficial muscle in the anterior compartment of the arm with the distal tendon passing deep in the antecubital fossa to insert at the radial tuberosity (Figure 1). Pronation of the forearm rotates the radial tuberosity medially and posteriorly, drawing the biceps tendon distally with it (Figures 1-3). The biceps muscle is primarily responsible for supination of the forearm, although it is also important in elbow flexion.4,5 The bicipital aponeurosis (lacertus fibrosus) arises from the medial aspect of the muscle belly at the junction of the musculotendinous unit and the distal biceps tendon. This passes distally and medially across the antecubital fossa, blending with the fascia overlying the proximal flexor mass of the forearm, and inserts on the subcutaneous border of the ulna.3 A complete rupture of the distal biceps insertion can produce a 40% loss of supination strength, a 47% loss of supination endurance, and a 21% to 30% loss of flexion strength at the elbow when compared with the contralateral intact extremity.1,2,4
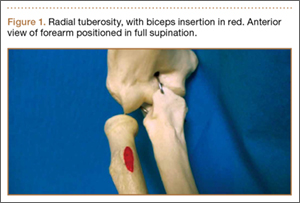
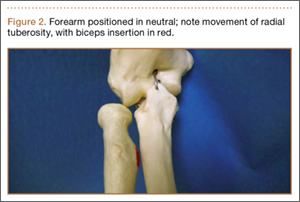
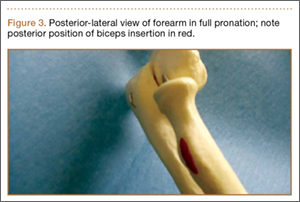
Background
Prompt diagnosis of a distal biceps tendon complete rupture increases the ability to perform a primary repair, and to restore motion and strength.3 Patients with acute ruptures of the distal biceps typically present with a history of experiencing a painful “pop” after a violent eccentric load force at the time of injury. Clinical examination of a patient with a distal biceps tendon rupture shows a loss of the normal upper arm contour, pain with flexion and supination of the forearm, ecchymosis, and an inability to palpate the distal biceps tendon in the antecubital fossa.5 It is important to note that a false-negative test can be elicited when examining the integrity of the muscle contour if the lacertus fibrosus remains intact when there is a complete rupture of the distal biceps tendon.6 This false negative also can occur with examination of the upper arm contour as the elbow flexes. Radiographic studies to evaluate the distal biceps tendon can aid in the diagnosis of ruptures but are not a substitute for a thorough history taking and physical examination.3 Plain radiographs may show hypertrophic bone formation at the radial tuberosity, although they are generally unrevealing.3,6 After a complete clinical examination of the distal biceps tendon, magnetic resonance imaging (MRI) can be an important tool for evaluation of the distal biceps tendon.3 This article introduces a special test used as a diagnostic tool during the physical examination to isolate the distal biceps tendon from the lacertus fibrosus and to evaluate the integrity of the distal biceps brachii tendon.
Test Description
To perform the supination-pronation test, the patient is positioned with both shoulders abducted to 90º and the elbows flexed to approximately 60º to 70º (Figures 4, 5). The examiner stands in front of the patient and observes the contour of the biceps muscle; the unaffected arm is used as a comparison. The examiner may either visually observe the contour of the muscle or may place a hand on the muscle belly throughout the test to feel for movement. The patient is asked to actively supinate and pronate the forearms by turning the hands. Through trial and error, we have found that the change in contour is most pronounced when placing the elbow in 60º to 70º of flexion. Additionally, through clinical experience, we have found testing the patient with both shoulders abducted to 90º provides the examiner with a reproducible examination that is easy to demonstrate to the patient; however, this shoulder position is not mandatory and can be modified if the patient struggles to get into testing position. Forearm position will maximize the size of the biceps, so the result is visually easier to appreciate. If the distal biceps tendon is intact, there is a substantial change in the shape of the biceps as the arm is supinated (the biceps moves proximally), then pronated (the biceps moves distally). Lack of migration of the biceps muscle during supination and pronation is considered a positive test, indicating rupture of the distal biceps tendon from its insertion on the radial tuberosity (Figure 6). We have found the anatomic correlations to a distal biceps injury may be clearly observed through the maneuver of the supination-pronation test and, therefore, provide a reliable clinical method to diagnose a complete distal biceps tendon rupture.
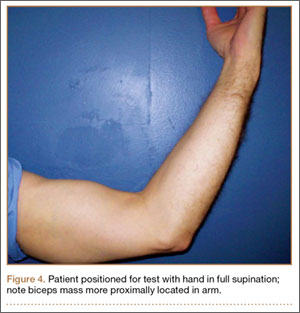
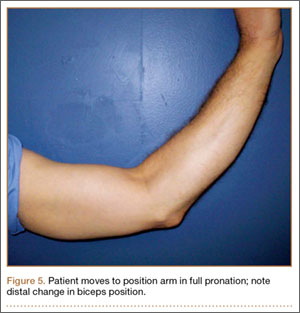
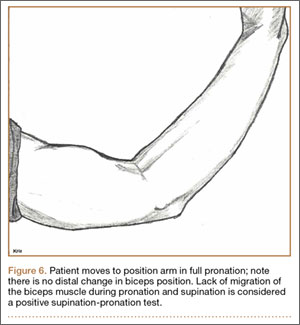
We have been using the supination-pronation test in our clinical practice for 2.5 years. In our experience, opportunities to use the supination-pronation test are very limited and specific. This type of tendon avulsion is rare, and the number of patients who warrant clinical examination using the supination-pronation test is small. We have had 5 positive supination-pronation tests in patients with suspected distal biceps tendon ruptures. To confirm if the supination-pronation test correctly demonstrated a full biceps tendon rupture in these 5 patients, we followed their clinical examination with MRI of the involved arm. Only 4 of the 5 patients were able to obtain MRI. Of these 4, all studies showed complete tearing of the distal biceps tendon from its attachment on the radial tuberosity. All 5 patients were taken into the operating room to confirm the clinical diagnosis and then repair it surgically. Through surgical exploration, we observed a full and complete tear of the distal biceps tendon in all patients, and the tears were repaired successfully. Postoperatively, all patients showed a full recovery with no complications, and all were able to regain full range of motion and strength in the involved arm. All 5 patients were discharged with no complaints.
Although we have not encountered false positive and false negatives using the supination-pronation test in clinical practice, we speculate that there would be a low rate of incidence for these outcomes. There is a possibility of a false-positive test in obese patients in whom the contours of the biceps are difficult to appreciate (although we have not observed this clinically). In these patients, the examiner may not see the migration of the biceps that is occurring. In practice, we have found that, if the contours of the bicep are difficult to appreciate, the test can be performed with the examiner placing his/her hand on the muscle belly during the test to actively feel for movement. This could decrease the risk of a false-positive supination-pronation test. A false negative may occur if the distal biceps tendon is almost completely torn. In this case, enough of the tendon fibers may remain intact to pull the biceps muscle belly distally as the hand is pronated. In our experience, this was not observed but should be noted as a potential risk for a false-negative test.
If the lacertus fibrosus is intact, and the distal biceps tendon is ruptured, the biceps will still change shape as the elbow is flexed and extended but will not change shape with supination and pronation. The biceps brachii muscle attaches distally to the radial tuberosity of the radius; contraction of the muscle pulls the tuberosity anteriorly, rotating the forearm into supination. When the forearm rotates into pronation, the tendon is pulled distally and the muscle lengthens, which causes the contour to be more elongated. Since the lacertus fibrosus attaches to the proximal ulna, it is not involved in forearm supination and pronation. It does, however, assist with elbow flexion.
It is very important to isolate the biceps brachii tendon from the lacertus fibrosus and the brachialis because the examiner may miss a distal tendon rupture by not isolating supination and pronation. The supination-pronation test is a novel clinical test that allows the examiner to isolate the biceps brachii tendon in supination and pronation to evaluate for distal biceps tendon rupture. It has been well established that early anatomic repair of distal biceps tendon rupture is advocated for optimal results in returning flexion and supination strength.3,4,6 Although some patients may choose nonoperative management of complete ruptures, prompt diagnosis of the injury is vital so that the option of surgical management at the time of presentation is not compromised by delay in diagnosis. Clinically, we have found that a delayed diagnosis results in more difficulty performing the surgery, and it may not be possible to obtain enough excursion for the biceps to be reattached with the passage of time. The literature suggests that patients with chronic ruptures (more than 4 weeks) often present with proximal retraction of the biceps muscles and scarring to the brachialis, which can make anatomic repair a difficult challenge.3,7
It is important to note the differences in treatment of proximal versus distal bicep tendon ruptures. Proximally, there are 2 tendon attachments. The tendon of the short head attaches to the coracoid process of the scapula. The tendon of the long head runs into the shoulder joint, attaching intra-articularly to the superior aspect of the glenoid. This tendon is often involved in degeneration concurrently with the adjacent rotator cuff and is vulnerable to rupture. Rupture of this tendon is usually treated nonoperatively. Because proximal rupture nearly always affects only the tendon to the long head, the muscle preserves 1 proximal attachment and continues to function, both as a supinator and as a flexor. Also, this type of rupture tends to occur in more elderly and less active patients who are less adversely affected by the modest loss of function associated with proximal ruptures.
Conclusion
The supination-pronation test properly isolates the distal biceps tendon and does not cause significant discomfort, which can be a problem with other physical examination tests for acute distal biceps ruptures. The squeeze test involves placing the patient in 60º to 80º of elbow flexion with the forearm pronated. The examiner places 1 hand at the distal myotendinous junction, and the other around the belly of the muscle and squeezes, looking for forearm supination.5 We have not found the squeeze test to be optimal because the amount of forearm supination obtained by performing this test can be subtle. Additionally, the patient commonly has significant ecchymosis and pain associated with this rupture, and it may be too painful to squeeze the muscle belly hard enough to have a reliable test. Another test is the hook test, which is performed by the examiner “hooking” an index finger under the intact biceps tendon from the lateral side.8 Clinically, we have found this test difficult to administer because it requires palpation of the tendon, which is often painful for the patient with an acute injury.
The supination-pronation test can easily be performed in the acute setting, and confirms attachment of the biceps tendon distally to the bicipital tuberosity of the radius. It will not show an incomplete tear, but in that case, the muscle retains its normal length, alleviating the urgency of surgical management. We have found the supination-pronation test to be a reliable and pain-free test that should be incorporated in the physical examination to evaluate patients for distal biceps injury.
1. Safran MR, Graham SM. Distal biceps tendon ruptures: incidence, demographics, and the effect of smoking. Clin Orthop Relat Res. 2002;(404):275-283.
2. McCarty III LP, Alpert JM, Bush-Joseph C. Reconstruction of a chronic distal biceps tendon rupture 4 years after initial injury. Am J Orthop. 2008;37(11):579-582.
3. Ramsey ML. Distal biceps tendon injuries: diagnosis and management. J Am Acad Orthop Surg. 1999;7(3):199-207.
4. Morrey BF, Askew L, An K, Dobyns J. Rupture of the distal tendon of the biceps brachii. A biomechanical study. J Bone Joint Surg Am. 1985;67(3):418-421.
5. Ruland RT, Dunbar RP, Bowen JD. The biceps squeeze test for diagnosis of distal biceps tendon ruptures. Clin Orthop Rel Res. 2005;(437):128-131.
6. Sutton KM, Dodds SD, Ahmad CS, Sethi PM. Surgical treatment of distal biceps rupture. J Am Acad Orthop Surg. 2010;18(3):139-148.
7. Leighton MM, Bush-Joseph CA, Bach BR Jr. Distal biceps brachii repair: results in dominant and nondominant extremities. Clin Orthop Relat Res. 1995;(317):114-121.
8. O’Driscoll SW, Goncalves LB, Dietz P. The hook test for distal biceps tendon avulsion. Am J Sports Med. 2007;35(11):1865-1869.
Distal biceps tendon ruptures have been reported with increasing frequency, occurring 1.2 times per 100,000 patients per year, representing 3% of tendinous avulsions involving this muscle.1,2 This injury occurs most commonly in men between the ages of 40 and 60 years, and more often in the dominant extremity after an unexpected or violent eccentric contraction.2,3 Generally, the patient is performing a task that is more strenuous than usual and only performed occasionally; usually, it is a flexion task. The biceps muscle is the most superficial muscle in the anterior compartment of the arm with the distal tendon passing deep in the antecubital fossa to insert at the radial tuberosity (Figure 1). Pronation of the forearm rotates the radial tuberosity medially and posteriorly, drawing the biceps tendon distally with it (Figures 1-3). The biceps muscle is primarily responsible for supination of the forearm, although it is also important in elbow flexion.4,5 The bicipital aponeurosis (lacertus fibrosus) arises from the medial aspect of the muscle belly at the junction of the musculotendinous unit and the distal biceps tendon. This passes distally and medially across the antecubital fossa, blending with the fascia overlying the proximal flexor mass of the forearm, and inserts on the subcutaneous border of the ulna.3 A complete rupture of the distal biceps insertion can produce a 40% loss of supination strength, a 47% loss of supination endurance, and a 21% to 30% loss of flexion strength at the elbow when compared with the contralateral intact extremity.1,2,4
Background
Prompt diagnosis of a distal biceps tendon complete rupture increases the ability to perform a primary repair, and to restore motion and strength.3 Patients with acute ruptures of the distal biceps typically present with a history of experiencing a painful “pop” after a violent eccentric load force at the time of injury. Clinical examination of a patient with a distal biceps tendon rupture shows a loss of the normal upper arm contour, pain with flexion and supination of the forearm, ecchymosis, and an inability to palpate the distal biceps tendon in the antecubital fossa.5 It is important to note that a false-negative test can be elicited when examining the integrity of the muscle contour if the lacertus fibrosus remains intact when there is a complete rupture of the distal biceps tendon.6 This false negative also can occur with examination of the upper arm contour as the elbow flexes. Radiographic studies to evaluate the distal biceps tendon can aid in the diagnosis of ruptures but are not a substitute for a thorough history taking and physical examination.3 Plain radiographs may show hypertrophic bone formation at the radial tuberosity, although they are generally unrevealing.3,6 After a complete clinical examination of the distal biceps tendon, magnetic resonance imaging (MRI) can be an important tool for evaluation of the distal biceps tendon.3 This article introduces a special test used as a diagnostic tool during the physical examination to isolate the distal biceps tendon from the lacertus fibrosus and to evaluate the integrity of the distal biceps brachii tendon.
Test Description
To perform the supination-pronation test, the patient is positioned with both shoulders abducted to 90º and the elbows flexed to approximately 60º to 70º (Figures 4, 5). The examiner stands in front of the patient and observes the contour of the biceps muscle; the unaffected arm is used as a comparison. The examiner may either visually observe the contour of the muscle or may place a hand on the muscle belly throughout the test to feel for movement. The patient is asked to actively supinate and pronate the forearms by turning the hands. Through trial and error, we have found that the change in contour is most pronounced when placing the elbow in 60º to 70º of flexion. Additionally, through clinical experience, we have found testing the patient with both shoulders abducted to 90º provides the examiner with a reproducible examination that is easy to demonstrate to the patient; however, this shoulder position is not mandatory and can be modified if the patient struggles to get into testing position. Forearm position will maximize the size of the biceps, so the result is visually easier to appreciate. If the distal biceps tendon is intact, there is a substantial change in the shape of the biceps as the arm is supinated (the biceps moves proximally), then pronated (the biceps moves distally). Lack of migration of the biceps muscle during supination and pronation is considered a positive test, indicating rupture of the distal biceps tendon from its insertion on the radial tuberosity (Figure 6). We have found the anatomic correlations to a distal biceps injury may be clearly observed through the maneuver of the supination-pronation test and, therefore, provide a reliable clinical method to diagnose a complete distal biceps tendon rupture.
We have been using the supination-pronation test in our clinical practice for 2.5 years. In our experience, opportunities to use the supination-pronation test are very limited and specific. This type of tendon avulsion is rare, and the number of patients who warrant clinical examination using the supination-pronation test is small. We have had 5 positive supination-pronation tests in patients with suspected distal biceps tendon ruptures. To confirm if the supination-pronation test correctly demonstrated a full biceps tendon rupture in these 5 patients, we followed their clinical examination with MRI of the involved arm. Only 4 of the 5 patients were able to obtain MRI. Of these 4, all studies showed complete tearing of the distal biceps tendon from its attachment on the radial tuberosity. All 5 patients were taken into the operating room to confirm the clinical diagnosis and then repair it surgically. Through surgical exploration, we observed a full and complete tear of the distal biceps tendon in all patients, and the tears were repaired successfully. Postoperatively, all patients showed a full recovery with no complications, and all were able to regain full range of motion and strength in the involved arm. All 5 patients were discharged with no complaints.
Although we have not encountered false positive and false negatives using the supination-pronation test in clinical practice, we speculate that there would be a low rate of incidence for these outcomes. There is a possibility of a false-positive test in obese patients in whom the contours of the biceps are difficult to appreciate (although we have not observed this clinically). In these patients, the examiner may not see the migration of the biceps that is occurring. In practice, we have found that, if the contours of the bicep are difficult to appreciate, the test can be performed with the examiner placing his/her hand on the muscle belly during the test to actively feel for movement. This could decrease the risk of a false-positive supination-pronation test. A false negative may occur if the distal biceps tendon is almost completely torn. In this case, enough of the tendon fibers may remain intact to pull the biceps muscle belly distally as the hand is pronated. In our experience, this was not observed but should be noted as a potential risk for a false-negative test.
If the lacertus fibrosus is intact, and the distal biceps tendon is ruptured, the biceps will still change shape as the elbow is flexed and extended but will not change shape with supination and pronation. The biceps brachii muscle attaches distally to the radial tuberosity of the radius; contraction of the muscle pulls the tuberosity anteriorly, rotating the forearm into supination. When the forearm rotates into pronation, the tendon is pulled distally and the muscle lengthens, which causes the contour to be more elongated. Since the lacertus fibrosus attaches to the proximal ulna, it is not involved in forearm supination and pronation. It does, however, assist with elbow flexion.
It is very important to isolate the biceps brachii tendon from the lacertus fibrosus and the brachialis because the examiner may miss a distal tendon rupture by not isolating supination and pronation. The supination-pronation test is a novel clinical test that allows the examiner to isolate the biceps brachii tendon in supination and pronation to evaluate for distal biceps tendon rupture. It has been well established that early anatomic repair of distal biceps tendon rupture is advocated for optimal results in returning flexion and supination strength.3,4,6 Although some patients may choose nonoperative management of complete ruptures, prompt diagnosis of the injury is vital so that the option of surgical management at the time of presentation is not compromised by delay in diagnosis. Clinically, we have found that a delayed diagnosis results in more difficulty performing the surgery, and it may not be possible to obtain enough excursion for the biceps to be reattached with the passage of time. The literature suggests that patients with chronic ruptures (more than 4 weeks) often present with proximal retraction of the biceps muscles and scarring to the brachialis, which can make anatomic repair a difficult challenge.3,7
It is important to note the differences in treatment of proximal versus distal bicep tendon ruptures. Proximally, there are 2 tendon attachments. The tendon of the short head attaches to the coracoid process of the scapula. The tendon of the long head runs into the shoulder joint, attaching intra-articularly to the superior aspect of the glenoid. This tendon is often involved in degeneration concurrently with the adjacent rotator cuff and is vulnerable to rupture. Rupture of this tendon is usually treated nonoperatively. Because proximal rupture nearly always affects only the tendon to the long head, the muscle preserves 1 proximal attachment and continues to function, both as a supinator and as a flexor. Also, this type of rupture tends to occur in more elderly and less active patients who are less adversely affected by the modest loss of function associated with proximal ruptures.
Conclusion
The supination-pronation test properly isolates the distal biceps tendon and does not cause significant discomfort, which can be a problem with other physical examination tests for acute distal biceps ruptures. The squeeze test involves placing the patient in 60º to 80º of elbow flexion with the forearm pronated. The examiner places 1 hand at the distal myotendinous junction, and the other around the belly of the muscle and squeezes, looking for forearm supination.5 We have not found the squeeze test to be optimal because the amount of forearm supination obtained by performing this test can be subtle. Additionally, the patient commonly has significant ecchymosis and pain associated with this rupture, and it may be too painful to squeeze the muscle belly hard enough to have a reliable test. Another test is the hook test, which is performed by the examiner “hooking” an index finger under the intact biceps tendon from the lateral side.8 Clinically, we have found this test difficult to administer because it requires palpation of the tendon, which is often painful for the patient with an acute injury.
The supination-pronation test can easily be performed in the acute setting, and confirms attachment of the biceps tendon distally to the bicipital tuberosity of the radius. It will not show an incomplete tear, but in that case, the muscle retains its normal length, alleviating the urgency of surgical management. We have found the supination-pronation test to be a reliable and pain-free test that should be incorporated in the physical examination to evaluate patients for distal biceps injury.
1. Safran MR, Graham SM. Distal biceps tendon ruptures: incidence, demographics, and the effect of smoking. Clin Orthop Relat Res. 2002;(404):275-283.
2. McCarty III LP, Alpert JM, Bush-Joseph C. Reconstruction of a chronic distal biceps tendon rupture 4 years after initial injury. Am J Orthop. 2008;37(11):579-582.
3. Ramsey ML. Distal biceps tendon injuries: diagnosis and management. J Am Acad Orthop Surg. 1999;7(3):199-207.
4. Morrey BF, Askew L, An K, Dobyns J. Rupture of the distal tendon of the biceps brachii. A biomechanical study. J Bone Joint Surg Am. 1985;67(3):418-421.
5. Ruland RT, Dunbar RP, Bowen JD. The biceps squeeze test for diagnosis of distal biceps tendon ruptures. Clin Orthop Rel Res. 2005;(437):128-131.
6. Sutton KM, Dodds SD, Ahmad CS, Sethi PM. Surgical treatment of distal biceps rupture. J Am Acad Orthop Surg. 2010;18(3):139-148.
7. Leighton MM, Bush-Joseph CA, Bach BR Jr. Distal biceps brachii repair: results in dominant and nondominant extremities. Clin Orthop Relat Res. 1995;(317):114-121.
8. O’Driscoll SW, Goncalves LB, Dietz P. The hook test for distal biceps tendon avulsion. Am J Sports Med. 2007;35(11):1865-1869.
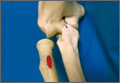
HCAHPS Surveys and Patient Satisfaction
The Hospital Consumer Assessment of Healthcare Providers and Systems (HCAHPS) is the first national, standardized, publicly reported survey of patients' perception of hospital care. HCAHPS mandates a standard method of collecting and reporting perception of health care by patients to enable valid comparisons across all hospitals.[1, 2, 3] Voluntary collection of HCAHPS data for public reporting began in July 2006, mandatory collection of data for hospitals that participate in Inpatient Prospective Payment Program of Medicare began in July 2007, and public reporting of mandated HCAHPS scores began in 2008.[2]
Using data from the first 2‐year period, an earlier study had reported an increase in HCAHPS patient satisfaction scores in all domains except in the domain of satisfaction with physician communication.[4] Since then, data from additional years have become available, allowing assessment of satisfaction of hospitalized patients with physician communication over a longer period. Therefore, our objective was to examine changes in patient satisfaction with physician communication from 2007 to 2013, the last reported date, and to explore hospital and local population characteristics that may be associated with patient satisfaction.
METHODS
Publicly available data from 3 sources were used for this study. Patient satisfaction scores with physician communication and hospital characteristics were obtained from the HCAHPS data files available at the Hospital Compare database maintained by the Centers for Medicare and Medicaid Services (CMS).[5] HCAHPS files contain data for the preceding 12 months and are updated quarterly. We used files that reported data from the first to the fourth quarter of the year for 2007 to 2013. The HCAHPS survey contains 32 questions, of which 3 questions are about physician communication.[6] We used the percentage of survey participants who responded that physicians always communicated well as a measure of patient satisfaction with physician communication (the other 2 questions were not included). Hospitals that reported data on patient satisfaction during 2007 were divided into quartiles based on their satisfaction scores, and this quartile allocation was maintained during each subsequent year. Survey response rate, in percentage, was obtained from HCAHPS data files for each year. Hospital characteristics, such as ownership of the hospital, teaching hospital status, and designation of critical access hospital were obtained from the Hospital Compare website. Hospital ownership was defined as government (owned by federal, state, Veterans Affairs, or tribal authorities), for profit (owned by physicians or another proprietary), or nonprofit (owned by a nonprofit organization such as a church). A hospital was considered a teaching hospital if it obtained graduate medical education funding from CMS.
We obtained local population data from 2010 decennial census files and from the American Community Survey 5‐year data profile from 2009 to 2013; both datasets are maintained by the Unites States Census Bureau.[7] Census is mandated by Article I, Section 2 of the United States Constitution and takes place every 10 years. The American Community Survey is also a mandatory, ongoing statistical survey that samples a small percentage of the population every year giving communities the information they need to plan investments and services. We chose to use 5‐year estimates as these are more precise and are reliable in analyzing small populations. For each zip code, we extracted data on total population, percentage of African Americans in the population, median income, poverty level, and insurance status from the Census Bureau data files.
Local population characteristics at zip code level were mapped to hospitals using hospital service area (HSA) crosswalk files from the Dartmouth Atlas of Health Care.[7, 8] The Dartmouth Atlas defined 3436 HSAs by assigning zip codes to the hospital area where the greatest proportion of its Medicare residents were hospitalized. The number of acute care hospital beds and the number of physicians within the HSA were also obtained from the Dartmouth Atlas. Merging data from these 3 sources generated a dataset that contained information about patient satisfaction scores from a particular hospital, hospital characteristics, and population characteristics of the healthcare market.
Data were summarized as mean and standard deviation (SD). To model the dependence of observations from the same hospital and the correlation between hospitals within the same state due to similar regulations, and to assess the relative contribution of satisfaction scores over time within hospital, hospitals within states, and across states, 3‐level hierarchical regression models were examined.[9, 10] At the within‐hospital level, survey response rate was used as a time‐varying variable in addition to the year of observation. However, only year of observation was used to explore differences in patient satisfaction trajectories between hospitals. At the hospitals‐within‐states level, hospital characteristics and local population characteristics within the HSA were included. At the states level, only random effects were obtained, and no additional variables were included in the models.
Four models were built to assess the relationship between satisfaction scores and predictors. The basic model used only random effects without any predictors to determine the relative contribution of each level (within hospitals, hospitals within states, and across states) to variation in patient satisfaction scores and thus was consistent with the variance component analysis. The first model included the year of observation as a predictor at the within‐hospital level to examine trends in patient satisfaction scores during the observation period. For the second model, we added baseline satisfaction quartiles to the second model, whereas remaining predictors (HSA population, African American percentage in HSA, survey response rate, HSA median income, ownership of hospital, percentage with private any insurance in HSA, acute care hospital beds in HSA, teaching hospital status, and percentage of people living in poverty within HSA) were added in the third model. Quartiles for baseline satisfaction were generated using satisfaction scores from 2007. As a larger number of hospitals reported results for 2008 than for 2007 (2273 vs 3746), we conducted a sensitivity analysis using satisfaction quartiles in 2008 as baseline and examined subsequent trends over time for the 4 models noted above. All multilevel models were specified using the nlme package in R to account for clustering of observations within hospitals and hospitals within states, using hospital and state level random effects.[11]
RESULTS
Of the 4353 hospitals with data for the 7‐year period, the majority were in the Southern region (South = 1669, Midwest = 1239, Northeast = 607, West = 838). Texas had the largest number of hospital (N = 358) followed by California (N = 340). The largest number of hospitals were nonprofit (N = 2637, 60.6%). Mean (SD) patient satisfaction with physician communication was 78.9% (5.7%) in 2007 that increased to 81.7% (5.4%) in 2013. Throughout the observation period, the highest patient satisfaction was in the South (80.6% [6.6%] in 2007 and 83.2% [5.4%] in 2013). Of the 2273 hospitals that reported data in 2007, the mean satisfaction score of the lowest quartile was 72% (3.2%), and the highest quartile was 86.9% (3.2%) (Table 1). As a group, hospitals in the highest quartile in 2007 still had higher satisfaction scores in 2013 than the hospitals in the lowest quartile (85% [4.2%] vs 77% [3.6%], respectively). Only 4 of the 584 hospitals in the lowest quartile in 2007 climbed up to the highest quartile in 2013, whereas 22 hospitals that were in the upper quartile in 2007 dropped to the lowest quartile in 2013.
| Characteristic | Quartiles Based on 2007 Satisfaction Scores | |||
|---|---|---|---|---|
| Highest Quartile | 2nd Quartile | 3rd Quartile | Lowest Quartile | |
| ||||
| Total no. of hospitals, N (%) | 461 (20.3) | 545 (24.0) | 683 (30.0) | 584 (25.7) |
| Hospital ownership, N (%) | ||||
| For profit | 50 (14.4) | 60 (17.3) | 96 (27.7) | 140 (40.5) |
| Nonprofit | 269 (17.4) | 380 (24.6) | 515 (33.4) | 378 (24.5) |
| Government | 142 (36.9) | 105 (27.3) | 72 (18.7) | 66 (17.1) |
| HSA population, in 1,000, median (IQR) | 33.2 (70.5) | 88.5 (186) | 161.8 (374) | 222.2 (534) |
| Racial distribution of HSA population, median (IQR) | ||||
| White, % | 82.6 (26.2) | 82.5 (28.5) | 74.2 (32.9) | 66.8 (35.3) |
| Black, % | 4.3 (21.7) | 3.7 (16.3) | 5.9 (14.8) | 7.4 (12.1) |
| Other, % | 6.4 (7.1) | 8.8 (10.8) | 12.9 (19.8) | 20.0 (33.1) |
| HSA mean median income in $1,000, mean (SD) | 44.6 (11.7) | 52.4 (17.8) | 58.4 (17.1) | 57.5 (15.7) |
| Satisfaction scores (at baseline), mean (SD) | 86.9 (3.1) | 81.4 (1.1) | 77.5 (1.1) | 72.0 (3.2) |
| Satisfaction scores (in 2013), mean (SD) | 85.0 (4.3) | 82.0 (3.4) | 79.7 (3.0) | 77.0 (3.5) |
| Survey response rate (at baseline), mean (SD) | 43.2 (19.8) | 34.5 (9.4) | 32.6 (8.0) | 30.3 (7.8) |
| Survey response rate (20072013), mean (SD) | 32.8 (7.8) | 32.6 (7.5) | 30.8 (6.5) | 29.3 (6.5) |
| Percentage with any insurance in HSA, mean (SD) | 84.0 (5.4) | 84.8 (6.6) | 85.5 (6.3) | 83.9 (6.6) |
| Teaching hospital, N (%) | 42 (9.1) | 155 (28.4) | 277 (40.5) | 274 (46.9%) |
| Acute care hospital beds in HSA (per 1,000), mean (SD) | 3.2 (1.2) | 2.6 (0.8) | 2.5 (0.8) | 2.4 (0.7) |
| Number of physicians in HSA (per 100,000), mean (SD) | 190 (36) | 197 (43) | 204 (47) | 199 (45) |
| Percentage with poverty in HSA, mean (SD)[7] | 16.9 (6.6) | 15.5 (6.5) | 14.4 (5.7) | 15.5 (6.0) |
Using variance component analysis, we found that 23% of the variation in patient satisfaction scores with physician communication was due to differences between states, 52% was due to differences between hospitals within states, and 24% was due to changes over time within a hospital. When examining time trends of satisfaction during the 7‐year period without adjusting for other predictors, we found a statistically significant increasing trend in patient satisfaction with physician communication (0.33% per year; P < 0.001). We also found a significant negative correlation (0.62, P < 0.001) between the random effects for baseline satisfaction (intercept) and change over time (slope), suggesting that initial patient satisfaction with physicians at a hospital was negatively correlated with subsequent change in satisfaction scores during the observation period.
When examining the effect of satisfaction ranking in 2007, hospitals within the lowest quartile of patient satisfaction in 2007 had significantly larger increase in satisfaction scores during the subsequent period as compared to the hospitals in each of the other 3 quartiles (all P < 0.001, Table 2). The difference in the magnitude of the rate of increase in satisfaction scores was greatest between the lowest quartile and the highest quartile (1.10% per year; P < 0.001). In fact, the highest quartile had a statistically significant absolute decrease in patient satisfaction during the observation period (0.23% per year; P < 0.001, Figure 1).
| Variable | Model 1: ; P Value | Model 2: ; P Value | Model 3: ; P Value |
|---|---|---|---|
| |||
| Time (in years) | 0.33; <0.001 | 0.87; <0.001 | 0.89; <0.001 |
| Satisfaction quartiles at baseline | |||
| Highest quartile | 12.1; <0.001 | 10.4; <0.001 | |
| 2nd quartile | 7.9; <0.001 | 7.1; <0.001 | |
| 3rd quartile | 4.5; <0.001 | 4.1; <0.001 | |
| Lowest quartile (REF) | REF | REF | |
| Interaction with time | |||
| Highest quartile | 1.10; <0.001 | 0.94; <0.001 | |
| 2nd quartile | 0.73; <0.001 | 0.71; <0.001 | |
| 3rd quartile | 0.48; <0.001 | 0.47;<0.001 | |
| Survey response rate (%) | 0.12; <0.001 | ||
| Total population, in 10,000 | 0.002; 0.02 | ||
| African American (%) | 0.004; 0.13 | ||
| HSA median Income in $10,000 | 0.02; 0.58 | ||
| Ownership | |||
| Government (REF) | REF | ||
| Nonprofit | 0.01; 0.88 | ||
| For profit | 0.21; 0.11 | ||
| Percentage with insurance in HSA | 0.007; 0.27 | ||
| Acute care beds in HSA (per 1,000) | 0.60; <0.001 | ||
| Physicians in HSA (per 100,000) | 0.003; 0.007 | ||
| Teaching hospital | 0.34; 0.001 | ||
| Percentage in poverty in HSA | 0.01; 0.27 | ||
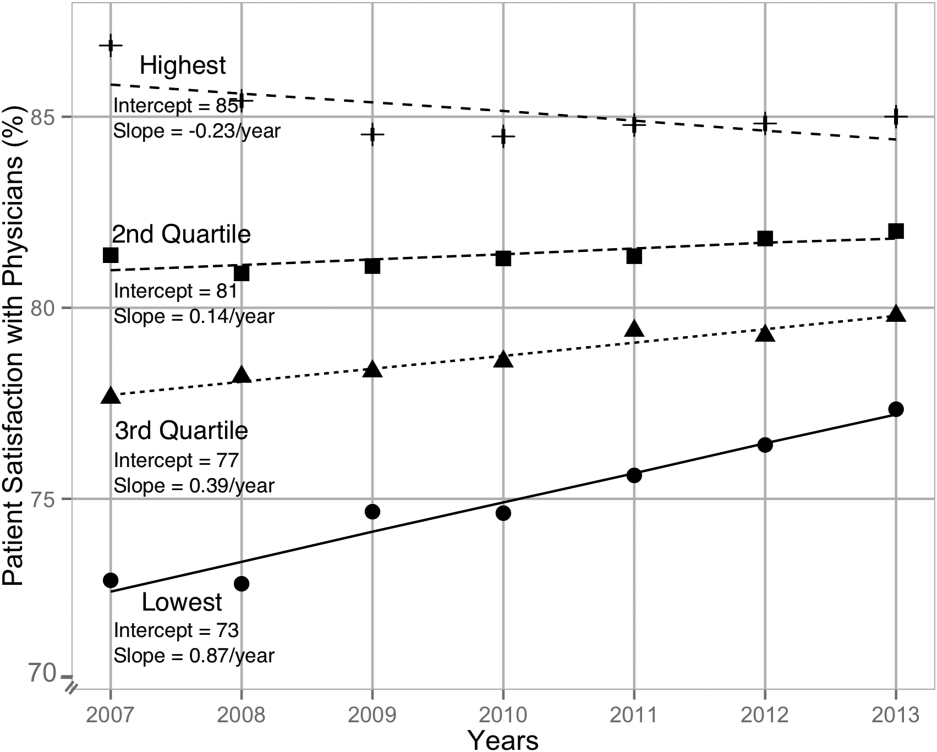
After adjusting for hospital characteristics and population characteristics of the HSA, the 2007 satisfaction quartiles remained significantly associated with subsequent change in satisfaction scores during the 7‐year observation period (Table 2). In addition, survey response rate, number of physicians, and the number of acute‐care hospital beds within the HSA were positively associated with patient satisfaction, whereas higher HSA population density and being a teaching hospital were negatively associated with patient satisfaction. Using 2008 satisfaction scores as baseline, the results did not change except that the number of physicians in the HSA and being a teaching hospital were no longer associated with satisfaction scores with physicians.
DISCUSSION
Using hierarchical modelling, we have shown that national patient satisfaction scores with physicians have consistently improved since 2007, the year when reporting of satisfaction scores began. We further show that the improvement in satisfaction scores has not been consistent through all hospitals. The largest increase in satisfaction scores was in hospitals that were in the lowest quartile of satisfaction scores in 2007. In contrast, satisfaction scores decreased in hospitals that were in the uppermost quartile of satisfaction scores. The difference between the lowest and uppermost quartile was so large in 2007 that despite the difference in the direction of change in satisfaction scores, hospitals in the uppermost quartile continued to have higher satisfaction scores in 2013 than hospitals in the lowest quartile.
Consistent with our findings for patient satisfaction, other studies have found that public reporting is associated with improvement in healthcare quality measures across nursing homes, physician groups, and hospitals.[12, 13, 14] However, it is unclear how public reporting can change patient satisfaction. The main purpose of public reporting of quality of healthcare measures, such as patient satisfaction with the healthcare they receive, is to generate value by increasing transparency and accountability, thereby increasing the quality of healthcare delivery. Healthcare consumers may also utilize the reported measures to choose providers that deliver high‐quality healthcare. Contrary to expectations, there is very little evidence that consumers choose healthcare facilities based on public reporting, and it is likely that other mechanisms may explain the observed association.[15, 16]
Physicians have historically had low adoption of strategies to improve patient satisfaction and often cite suboptimal data and lack of evidence for data‐driven strategies.[17, 18] Hospitals and healthcare organizations have deployed a broad range of strategies to engage physicians. These include emphasizing relationship between patient satisfaction and patient compliance, complaints and malpractice lawsuits, appealing to physicians' sense of competitiveness by publishing individual provider satisfaction scores, educating physicians on HCAHPS and providing them with regularly updated data, and development of specific techniques for improving patient‐physician interaction.[19, 20, 21, 22, 23, 24] Administrators may also enhance physician engagement by improving physician satisfaction, decreasing their turnover, support development of physicians in administrative leadership roles, and improving financial transparency.[25] Thus, involvement of hospital leadership has been instrumental in encouraging physicians to focus on quality measures including patient satisfaction. Some evidence suggests that public reporting exerts strong influence on hospital leaders for adequate resource allocation, local planning, and improvement efforts.[26, 27, 28]
Perhaps the most intriguing finding in our study is that hospitals in the uppermost quartile of satisfaction scores in 2007 had a statistically significant steady decline in scores during the following period as compared to hospitals in the lowest quartile that had a steady increase. A possible explanation for this finding can be that high‐performing hospitals become complacent and do not invest in developing the effort‐intensive resources required to maintain and improve performance in the physician‐related patient satisfaction domain. These resources may be diverted to competing needs that include addressing improvement efforts for a large number of other publicly reported healthcare quality measures. Thus, an unintended consequence of quality improvement may be that improvement in 1 domain may be at the expense of quality of care in another domain.[29, 30, 31] On the other hand, it is likely that hospitals in the lower quartile see a larger improvement in their scores for the same degree of investment as hospitals in the higher quartiles. It is also likely that hospitals, particularly those in the lowest quartile, develop their individual benchmarks and expend effort that is in line with their perceived need for improvement to achieve their strategic and marketing goals.
Our study has significant implications for the healthcare system, clinical practice, and future research. Whereas public reporting of quality measures is associated with an overall improvement in the reported quality measure, hospitals with high scores may move resources away from that metric or become complacent. Health policy makers need to design policies that encourage all hospitals and providers to perform better or continue to perform well. We further show that differences between hospitals and between local healthcare markets are the biggest factor determining the variation in patient satisfaction with physician communication, and an adjustment in reported score for these factors may be needed. Although local healthcare market factors may not be modifiable, an exchange of knowledge between hospitals with low and high patient satisfaction scores may improve overall satisfaction scores. Similarly, hospitals that are successful in increasing patient satisfaction scores should identify and share useful interventions.
The main strength of our study is that we used data on patient satisfaction with physician communication that were reported annually by most hospitals within the United States. These longitudinal data allowed us to examine not only the effect of public reporting on patient satisfaction with physician communication but also its trend over time. As we had 7 years of data, we were able to eliminate the possibility of regression to mean; an extreme result on first measurement is followed by a second measurement that tends to be closer to the average. Further, we adjusted satisfaction scores based on hospital and local healthcare market characteristics allowing us to compare satisfaction scores across hospitals. However, because units of observation were hospitals and not patients, we could not examine the effect of patient characteristics on satisfaction scores. In addition, HCAHPS surveys have low response rates and may have response and selection bias. Furthermore, we were unable to examine the strategies implemented by hospitals to improve satisfaction scores or the effect of such strategies on satisfaction scores. Data on hospital strategies to increase satisfaction scores are not available for most hospitals and could not have been included in the study.
In summary, we have found that public reporting was followed by an improvement in patient satisfaction scores with physician communication between 2007 and 2013. The rate of improvement was significantly greater in hospitals that had satisfaction scores in the lowest quartiles, whereas hospitals in the highest quartile had a small but statistically significant decline in patient satisfaction scores.
- Centers for Medicare Medicaid Services. Medicare program; hospital outpatient prospective payment system and CY 2007 payment rates; CY 2007 update to the ambulatory surgical center covered procedures list; Medicare administrative contractors; and reporting hospital quality data for FY 2008 inpatient prospective payment system annual payment update program‐‐HCAHPS survey, SCIP, and mortality. Final rule with comment period and final rule. Fed Regist. 2006;71(226):67959–68401.
- , , , , . Development, implementation, and public reporting of the HCAHPS survey. Med Care Res Rev. 2010;67(1):27–37.
- , , , . Comparison of Hospital Consumer Assessment of Healthcare Providers and Systems patient satisfaction scores for specialty hospitals and general medical hospitals: confounding effect of survey response rate. J Hosp Med. 2014;9(9):590–593.
- , , , et al. Hospital survey shows improvements in patient experience. Health Aff (Millwood). 2010;29(11):2061–2067.
- Centers for Medicare 2010:496829.
- , , , , , . The normal liver harbors the vitamin D nuclear receptor in nonparenchymal and biliary epithelial cells. Hepatology. 2003;37(5):1034–1042.
- , . Applied Longitudinal Data Analysis: Modeling Change and Event Occurrence. Oxford, United Kingdom: Oxford University Press; 2003.
- , . Data Analysis Using Regression and Multilevel/Hierarchical Models. Cambridge, United Kingdom: Cambridge University Press; 2007.
- nlme: Linear and Nonlinear Mixed Effects Models [computer program]. Version R package version 2015;3:1–121.
- , , , . Public reporting helped drive quality improvement in outpatient diabetes care among Wisconsin physician groups. Health Aff (Millwood). 2012;31(3):570–577.
- , , , , , . Governing healthcare through performance measurement in Massachusetts and the Netherlands. Health Policy. 2014;116(1):18–26.
- , , . Public reporting drove quality gains at nursing homes. Health Aff (Millwood). 2010;29(9):1706–1713.
- , , . Users of public reports of hospital quality: who, what, why, and how?: An aggregate analysis of 16 online public reporting Web sites and users' and experts' suggestions for improvement. Agency for Healthcare Research and Quality. Available at: http://archive.ahrq.gov/professionals/quality‐patient‐safety/quality‐resources/value/pubreportusers/index.html. Updated December 2011. Accessed April 2, 2015.
- Kaiser Family Foundation. 2008 update on consumers' views of patient safety and quality information. Available at: http://kff.org/health‐reform/poll‐finding/2008‐update‐on‐consumers‐views‐of‐patient‐2/. Published September 30, 2008. Accessed April 2, 2015.
- , . A report card on continuous quality improvement. Milbank Q. 1998;76(4):625–648, 511.
- , , . Assessing the impact of continuous quality improvement on clinical practice: what it will take to accelerate progress. Milbank Q. 1998;76(4):593–624, 510.
- , . Health care competition, strategic mission, and patient satisfaction: research model and propositions. J Health Organ Manag. 2008;22(6):627–641.
- , , . The effects of physician empathy on patient satisfaction and compliance. Eval Health Prof. 2004;27(3):237–251.
- , , , , . Association between vitamin D and hepatitis C virus infection: a meta‐analysis. World J Gastroenterol. 2013;19(35):5917–5924.
- , , , . The relation of patient satisfaction with complaints against physicians and malpractice lawsuits. Am J Med. 2005;118(10):1126–1133.
- , , , , , . Relation of patients' experiences with individual physicians to malpractice risk. Int J Qual Health Care. 2008;20(1):5–12.
- , , , . Association of patient satisfaction with complaints and risk management among emergency physicians. J Emerg Med. 2011;41(4):405–411.
- , , , , . Secrets of physician satisfaction. Study identifies pressure points and reveals life practices of highly satisfied doctors. Physician Exec. 2006;32(6):30–39.
- , , , et al. Attitudes of hospital leaders toward publicly reported measures of health care quality. JAMA Intern Med. 2014;174(12):1904–1911.
- , , , , , . Closing the quality gap: revisiting the state of the science (vol. 5: public reporting as a quality improvement strategy). Evid Rep Technol Assess (Full Rep). 2012(208.5):1–645.
- , , , , . Systematic review: the evidence that publishing patient care performance data improves quality of care. Ann Intern Med. 2008;148(2):111–123.
- , . The unintended consequences of quality improvement. Curr Opin Pediatr. 2009;21(6):777–782.
- , , , et al. Unintended consequences of implementing a national performance measurement system into local practice. J Gen Intern Med. 2012;27(4):405–412.
- , . Quality assessment by external bodies: intended and unintended impact on healthcare delivery. Curr Opin Anaesthesiol. 2009;22(2):237–241.
The Hospital Consumer Assessment of Healthcare Providers and Systems (HCAHPS) is the first national, standardized, publicly reported survey of patients' perception of hospital care. HCAHPS mandates a standard method of collecting and reporting perception of health care by patients to enable valid comparisons across all hospitals.[1, 2, 3] Voluntary collection of HCAHPS data for public reporting began in July 2006, mandatory collection of data for hospitals that participate in Inpatient Prospective Payment Program of Medicare began in July 2007, and public reporting of mandated HCAHPS scores began in 2008.[2]
Using data from the first 2‐year period, an earlier study had reported an increase in HCAHPS patient satisfaction scores in all domains except in the domain of satisfaction with physician communication.[4] Since then, data from additional years have become available, allowing assessment of satisfaction of hospitalized patients with physician communication over a longer period. Therefore, our objective was to examine changes in patient satisfaction with physician communication from 2007 to 2013, the last reported date, and to explore hospital and local population characteristics that may be associated with patient satisfaction.
METHODS
Publicly available data from 3 sources were used for this study. Patient satisfaction scores with physician communication and hospital characteristics were obtained from the HCAHPS data files available at the Hospital Compare database maintained by the Centers for Medicare and Medicaid Services (CMS).[5] HCAHPS files contain data for the preceding 12 months and are updated quarterly. We used files that reported data from the first to the fourth quarter of the year for 2007 to 2013. The HCAHPS survey contains 32 questions, of which 3 questions are about physician communication.[6] We used the percentage of survey participants who responded that physicians always communicated well as a measure of patient satisfaction with physician communication (the other 2 questions were not included). Hospitals that reported data on patient satisfaction during 2007 were divided into quartiles based on their satisfaction scores, and this quartile allocation was maintained during each subsequent year. Survey response rate, in percentage, was obtained from HCAHPS data files for each year. Hospital characteristics, such as ownership of the hospital, teaching hospital status, and designation of critical access hospital were obtained from the Hospital Compare website. Hospital ownership was defined as government (owned by federal, state, Veterans Affairs, or tribal authorities), for profit (owned by physicians or another proprietary), or nonprofit (owned by a nonprofit organization such as a church). A hospital was considered a teaching hospital if it obtained graduate medical education funding from CMS.
We obtained local population data from 2010 decennial census files and from the American Community Survey 5‐year data profile from 2009 to 2013; both datasets are maintained by the Unites States Census Bureau.[7] Census is mandated by Article I, Section 2 of the United States Constitution and takes place every 10 years. The American Community Survey is also a mandatory, ongoing statistical survey that samples a small percentage of the population every year giving communities the information they need to plan investments and services. We chose to use 5‐year estimates as these are more precise and are reliable in analyzing small populations. For each zip code, we extracted data on total population, percentage of African Americans in the population, median income, poverty level, and insurance status from the Census Bureau data files.
Local population characteristics at zip code level were mapped to hospitals using hospital service area (HSA) crosswalk files from the Dartmouth Atlas of Health Care.[7, 8] The Dartmouth Atlas defined 3436 HSAs by assigning zip codes to the hospital area where the greatest proportion of its Medicare residents were hospitalized. The number of acute care hospital beds and the number of physicians within the HSA were also obtained from the Dartmouth Atlas. Merging data from these 3 sources generated a dataset that contained information about patient satisfaction scores from a particular hospital, hospital characteristics, and population characteristics of the healthcare market.
Data were summarized as mean and standard deviation (SD). To model the dependence of observations from the same hospital and the correlation between hospitals within the same state due to similar regulations, and to assess the relative contribution of satisfaction scores over time within hospital, hospitals within states, and across states, 3‐level hierarchical regression models were examined.[9, 10] At the within‐hospital level, survey response rate was used as a time‐varying variable in addition to the year of observation. However, only year of observation was used to explore differences in patient satisfaction trajectories between hospitals. At the hospitals‐within‐states level, hospital characteristics and local population characteristics within the HSA were included. At the states level, only random effects were obtained, and no additional variables were included in the models.
Four models were built to assess the relationship between satisfaction scores and predictors. The basic model used only random effects without any predictors to determine the relative contribution of each level (within hospitals, hospitals within states, and across states) to variation in patient satisfaction scores and thus was consistent with the variance component analysis. The first model included the year of observation as a predictor at the within‐hospital level to examine trends in patient satisfaction scores during the observation period. For the second model, we added baseline satisfaction quartiles to the second model, whereas remaining predictors (HSA population, African American percentage in HSA, survey response rate, HSA median income, ownership of hospital, percentage with private any insurance in HSA, acute care hospital beds in HSA, teaching hospital status, and percentage of people living in poverty within HSA) were added in the third model. Quartiles for baseline satisfaction were generated using satisfaction scores from 2007. As a larger number of hospitals reported results for 2008 than for 2007 (2273 vs 3746), we conducted a sensitivity analysis using satisfaction quartiles in 2008 as baseline and examined subsequent trends over time for the 4 models noted above. All multilevel models were specified using the nlme package in R to account for clustering of observations within hospitals and hospitals within states, using hospital and state level random effects.[11]
RESULTS
Of the 4353 hospitals with data for the 7‐year period, the majority were in the Southern region (South = 1669, Midwest = 1239, Northeast = 607, West = 838). Texas had the largest number of hospital (N = 358) followed by California (N = 340). The largest number of hospitals were nonprofit (N = 2637, 60.6%). Mean (SD) patient satisfaction with physician communication was 78.9% (5.7%) in 2007 that increased to 81.7% (5.4%) in 2013. Throughout the observation period, the highest patient satisfaction was in the South (80.6% [6.6%] in 2007 and 83.2% [5.4%] in 2013). Of the 2273 hospitals that reported data in 2007, the mean satisfaction score of the lowest quartile was 72% (3.2%), and the highest quartile was 86.9% (3.2%) (Table 1). As a group, hospitals in the highest quartile in 2007 still had higher satisfaction scores in 2013 than the hospitals in the lowest quartile (85% [4.2%] vs 77% [3.6%], respectively). Only 4 of the 584 hospitals in the lowest quartile in 2007 climbed up to the highest quartile in 2013, whereas 22 hospitals that were in the upper quartile in 2007 dropped to the lowest quartile in 2013.
| Characteristic | Quartiles Based on 2007 Satisfaction Scores | |||
|---|---|---|---|---|
| Highest Quartile | 2nd Quartile | 3rd Quartile | Lowest Quartile | |
| ||||
| Total no. of hospitals, N (%) | 461 (20.3) | 545 (24.0) | 683 (30.0) | 584 (25.7) |
| Hospital ownership, N (%) | ||||
| For profit | 50 (14.4) | 60 (17.3) | 96 (27.7) | 140 (40.5) |
| Nonprofit | 269 (17.4) | 380 (24.6) | 515 (33.4) | 378 (24.5) |
| Government | 142 (36.9) | 105 (27.3) | 72 (18.7) | 66 (17.1) |
| HSA population, in 1,000, median (IQR) | 33.2 (70.5) | 88.5 (186) | 161.8 (374) | 222.2 (534) |
| Racial distribution of HSA population, median (IQR) | ||||
| White, % | 82.6 (26.2) | 82.5 (28.5) | 74.2 (32.9) | 66.8 (35.3) |
| Black, % | 4.3 (21.7) | 3.7 (16.3) | 5.9 (14.8) | 7.4 (12.1) |
| Other, % | 6.4 (7.1) | 8.8 (10.8) | 12.9 (19.8) | 20.0 (33.1) |
| HSA mean median income in $1,000, mean (SD) | 44.6 (11.7) | 52.4 (17.8) | 58.4 (17.1) | 57.5 (15.7) |
| Satisfaction scores (at baseline), mean (SD) | 86.9 (3.1) | 81.4 (1.1) | 77.5 (1.1) | 72.0 (3.2) |
| Satisfaction scores (in 2013), mean (SD) | 85.0 (4.3) | 82.0 (3.4) | 79.7 (3.0) | 77.0 (3.5) |
| Survey response rate (at baseline), mean (SD) | 43.2 (19.8) | 34.5 (9.4) | 32.6 (8.0) | 30.3 (7.8) |
| Survey response rate (20072013), mean (SD) | 32.8 (7.8) | 32.6 (7.5) | 30.8 (6.5) | 29.3 (6.5) |
| Percentage with any insurance in HSA, mean (SD) | 84.0 (5.4) | 84.8 (6.6) | 85.5 (6.3) | 83.9 (6.6) |
| Teaching hospital, N (%) | 42 (9.1) | 155 (28.4) | 277 (40.5) | 274 (46.9%) |
| Acute care hospital beds in HSA (per 1,000), mean (SD) | 3.2 (1.2) | 2.6 (0.8) | 2.5 (0.8) | 2.4 (0.7) |
| Number of physicians in HSA (per 100,000), mean (SD) | 190 (36) | 197 (43) | 204 (47) | 199 (45) |
| Percentage with poverty in HSA, mean (SD)[7] | 16.9 (6.6) | 15.5 (6.5) | 14.4 (5.7) | 15.5 (6.0) |
Using variance component analysis, we found that 23% of the variation in patient satisfaction scores with physician communication was due to differences between states, 52% was due to differences between hospitals within states, and 24% was due to changes over time within a hospital. When examining time trends of satisfaction during the 7‐year period without adjusting for other predictors, we found a statistically significant increasing trend in patient satisfaction with physician communication (0.33% per year; P < 0.001). We also found a significant negative correlation (0.62, P < 0.001) between the random effects for baseline satisfaction (intercept) and change over time (slope), suggesting that initial patient satisfaction with physicians at a hospital was negatively correlated with subsequent change in satisfaction scores during the observation period.
When examining the effect of satisfaction ranking in 2007, hospitals within the lowest quartile of patient satisfaction in 2007 had significantly larger increase in satisfaction scores during the subsequent period as compared to the hospitals in each of the other 3 quartiles (all P < 0.001, Table 2). The difference in the magnitude of the rate of increase in satisfaction scores was greatest between the lowest quartile and the highest quartile (1.10% per year; P < 0.001). In fact, the highest quartile had a statistically significant absolute decrease in patient satisfaction during the observation period (0.23% per year; P < 0.001, Figure 1).
| Variable | Model 1: ; P Value | Model 2: ; P Value | Model 3: ; P Value |
|---|---|---|---|
| |||
| Time (in years) | 0.33; <0.001 | 0.87; <0.001 | 0.89; <0.001 |
| Satisfaction quartiles at baseline | |||
| Highest quartile | 12.1; <0.001 | 10.4; <0.001 | |
| 2nd quartile | 7.9; <0.001 | 7.1; <0.001 | |
| 3rd quartile | 4.5; <0.001 | 4.1; <0.001 | |
| Lowest quartile (REF) | REF | REF | |
| Interaction with time | |||
| Highest quartile | 1.10; <0.001 | 0.94; <0.001 | |
| 2nd quartile | 0.73; <0.001 | 0.71; <0.001 | |
| 3rd quartile | 0.48; <0.001 | 0.47;<0.001 | |
| Survey response rate (%) | 0.12; <0.001 | ||
| Total population, in 10,000 | 0.002; 0.02 | ||
| African American (%) | 0.004; 0.13 | ||
| HSA median Income in $10,000 | 0.02; 0.58 | ||
| Ownership | |||
| Government (REF) | REF | ||
| Nonprofit | 0.01; 0.88 | ||
| For profit | 0.21; 0.11 | ||
| Percentage with insurance in HSA | 0.007; 0.27 | ||
| Acute care beds in HSA (per 1,000) | 0.60; <0.001 | ||
| Physicians in HSA (per 100,000) | 0.003; 0.007 | ||
| Teaching hospital | 0.34; 0.001 | ||
| Percentage in poverty in HSA | 0.01; 0.27 | ||
After adjusting for hospital characteristics and population characteristics of the HSA, the 2007 satisfaction quartiles remained significantly associated with subsequent change in satisfaction scores during the 7‐year observation period (Table 2). In addition, survey response rate, number of physicians, and the number of acute‐care hospital beds within the HSA were positively associated with patient satisfaction, whereas higher HSA population density and being a teaching hospital were negatively associated with patient satisfaction. Using 2008 satisfaction scores as baseline, the results did not change except that the number of physicians in the HSA and being a teaching hospital were no longer associated with satisfaction scores with physicians.
DISCUSSION
Using hierarchical modelling, we have shown that national patient satisfaction scores with physicians have consistently improved since 2007, the year when reporting of satisfaction scores began. We further show that the improvement in satisfaction scores has not been consistent through all hospitals. The largest increase in satisfaction scores was in hospitals that were in the lowest quartile of satisfaction scores in 2007. In contrast, satisfaction scores decreased in hospitals that were in the uppermost quartile of satisfaction scores. The difference between the lowest and uppermost quartile was so large in 2007 that despite the difference in the direction of change in satisfaction scores, hospitals in the uppermost quartile continued to have higher satisfaction scores in 2013 than hospitals in the lowest quartile.
Consistent with our findings for patient satisfaction, other studies have found that public reporting is associated with improvement in healthcare quality measures across nursing homes, physician groups, and hospitals.[12, 13, 14] However, it is unclear how public reporting can change patient satisfaction. The main purpose of public reporting of quality of healthcare measures, such as patient satisfaction with the healthcare they receive, is to generate value by increasing transparency and accountability, thereby increasing the quality of healthcare delivery. Healthcare consumers may also utilize the reported measures to choose providers that deliver high‐quality healthcare. Contrary to expectations, there is very little evidence that consumers choose healthcare facilities based on public reporting, and it is likely that other mechanisms may explain the observed association.[15, 16]
Physicians have historically had low adoption of strategies to improve patient satisfaction and often cite suboptimal data and lack of evidence for data‐driven strategies.[17, 18] Hospitals and healthcare organizations have deployed a broad range of strategies to engage physicians. These include emphasizing relationship between patient satisfaction and patient compliance, complaints and malpractice lawsuits, appealing to physicians' sense of competitiveness by publishing individual provider satisfaction scores, educating physicians on HCAHPS and providing them with regularly updated data, and development of specific techniques for improving patient‐physician interaction.[19, 20, 21, 22, 23, 24] Administrators may also enhance physician engagement by improving physician satisfaction, decreasing their turnover, support development of physicians in administrative leadership roles, and improving financial transparency.[25] Thus, involvement of hospital leadership has been instrumental in encouraging physicians to focus on quality measures including patient satisfaction. Some evidence suggests that public reporting exerts strong influence on hospital leaders for adequate resource allocation, local planning, and improvement efforts.[26, 27, 28]
Perhaps the most intriguing finding in our study is that hospitals in the uppermost quartile of satisfaction scores in 2007 had a statistically significant steady decline in scores during the following period as compared to hospitals in the lowest quartile that had a steady increase. A possible explanation for this finding can be that high‐performing hospitals become complacent and do not invest in developing the effort‐intensive resources required to maintain and improve performance in the physician‐related patient satisfaction domain. These resources may be diverted to competing needs that include addressing improvement efforts for a large number of other publicly reported healthcare quality measures. Thus, an unintended consequence of quality improvement may be that improvement in 1 domain may be at the expense of quality of care in another domain.[29, 30, 31] On the other hand, it is likely that hospitals in the lower quartile see a larger improvement in their scores for the same degree of investment as hospitals in the higher quartiles. It is also likely that hospitals, particularly those in the lowest quartile, develop their individual benchmarks and expend effort that is in line with their perceived need for improvement to achieve their strategic and marketing goals.
Our study has significant implications for the healthcare system, clinical practice, and future research. Whereas public reporting of quality measures is associated with an overall improvement in the reported quality measure, hospitals with high scores may move resources away from that metric or become complacent. Health policy makers need to design policies that encourage all hospitals and providers to perform better or continue to perform well. We further show that differences between hospitals and between local healthcare markets are the biggest factor determining the variation in patient satisfaction with physician communication, and an adjustment in reported score for these factors may be needed. Although local healthcare market factors may not be modifiable, an exchange of knowledge between hospitals with low and high patient satisfaction scores may improve overall satisfaction scores. Similarly, hospitals that are successful in increasing patient satisfaction scores should identify and share useful interventions.
The main strength of our study is that we used data on patient satisfaction with physician communication that were reported annually by most hospitals within the United States. These longitudinal data allowed us to examine not only the effect of public reporting on patient satisfaction with physician communication but also its trend over time. As we had 7 years of data, we were able to eliminate the possibility of regression to mean; an extreme result on first measurement is followed by a second measurement that tends to be closer to the average. Further, we adjusted satisfaction scores based on hospital and local healthcare market characteristics allowing us to compare satisfaction scores across hospitals. However, because units of observation were hospitals and not patients, we could not examine the effect of patient characteristics on satisfaction scores. In addition, HCAHPS surveys have low response rates and may have response and selection bias. Furthermore, we were unable to examine the strategies implemented by hospitals to improve satisfaction scores or the effect of such strategies on satisfaction scores. Data on hospital strategies to increase satisfaction scores are not available for most hospitals and could not have been included in the study.
In summary, we have found that public reporting was followed by an improvement in patient satisfaction scores with physician communication between 2007 and 2013. The rate of improvement was significantly greater in hospitals that had satisfaction scores in the lowest quartiles, whereas hospitals in the highest quartile had a small but statistically significant decline in patient satisfaction scores.
- Centers for Medicare Medicaid Services. Medicare program; hospital outpatient prospective payment system and CY 2007 payment rates; CY 2007 update to the ambulatory surgical center covered procedures list; Medicare administrative contractors; and reporting hospital quality data for FY 2008 inpatient prospective payment system annual payment update program‐‐HCAHPS survey, SCIP, and mortality. Final rule with comment period and final rule. Fed Regist. 2006;71(226):67959–68401.
- , , , , . Development, implementation, and public reporting of the HCAHPS survey. Med Care Res Rev. 2010;67(1):27–37.
- , , , . Comparison of Hospital Consumer Assessment of Healthcare Providers and Systems patient satisfaction scores for specialty hospitals and general medical hospitals: confounding effect of survey response rate. J Hosp Med. 2014;9(9):590–593.
- , , , et al. Hospital survey shows improvements in patient experience. Health Aff (Millwood). 2010;29(11):2061–2067.
- Centers for Medicare 2010:496829.
- , , , , , . The normal liver harbors the vitamin D nuclear receptor in nonparenchymal and biliary epithelial cells. Hepatology. 2003;37(5):1034–1042.
- , . Applied Longitudinal Data Analysis: Modeling Change and Event Occurrence. Oxford, United Kingdom: Oxford University Press; 2003.
- , . Data Analysis Using Regression and Multilevel/Hierarchical Models. Cambridge, United Kingdom: Cambridge University Press; 2007.
- nlme: Linear and Nonlinear Mixed Effects Models [computer program]. Version R package version 2015;3:1–121.
- , , , . Public reporting helped drive quality improvement in outpatient diabetes care among Wisconsin physician groups. Health Aff (Millwood). 2012;31(3):570–577.
- , , , , , . Governing healthcare through performance measurement in Massachusetts and the Netherlands. Health Policy. 2014;116(1):18–26.
- , , . Public reporting drove quality gains at nursing homes. Health Aff (Millwood). 2010;29(9):1706–1713.
- , , . Users of public reports of hospital quality: who, what, why, and how?: An aggregate analysis of 16 online public reporting Web sites and users' and experts' suggestions for improvement. Agency for Healthcare Research and Quality. Available at: http://archive.ahrq.gov/professionals/quality‐patient‐safety/quality‐resources/value/pubreportusers/index.html. Updated December 2011. Accessed April 2, 2015.
- Kaiser Family Foundation. 2008 update on consumers' views of patient safety and quality information. Available at: http://kff.org/health‐reform/poll‐finding/2008‐update‐on‐consumers‐views‐of‐patient‐2/. Published September 30, 2008. Accessed April 2, 2015.
- , . A report card on continuous quality improvement. Milbank Q. 1998;76(4):625–648, 511.
- , , . Assessing the impact of continuous quality improvement on clinical practice: what it will take to accelerate progress. Milbank Q. 1998;76(4):593–624, 510.
- , . Health care competition, strategic mission, and patient satisfaction: research model and propositions. J Health Organ Manag. 2008;22(6):627–641.
- , , . The effects of physician empathy on patient satisfaction and compliance. Eval Health Prof. 2004;27(3):237–251.
- , , , , . Association between vitamin D and hepatitis C virus infection: a meta‐analysis. World J Gastroenterol. 2013;19(35):5917–5924.
- , , , . The relation of patient satisfaction with complaints against physicians and malpractice lawsuits. Am J Med. 2005;118(10):1126–1133.
- , , , , , . Relation of patients' experiences with individual physicians to malpractice risk. Int J Qual Health Care. 2008;20(1):5–12.
- , , , . Association of patient satisfaction with complaints and risk management among emergency physicians. J Emerg Med. 2011;41(4):405–411.
- , , , , . Secrets of physician satisfaction. Study identifies pressure points and reveals life practices of highly satisfied doctors. Physician Exec. 2006;32(6):30–39.
- , , , et al. Attitudes of hospital leaders toward publicly reported measures of health care quality. JAMA Intern Med. 2014;174(12):1904–1911.
- , , , , , . Closing the quality gap: revisiting the state of the science (vol. 5: public reporting as a quality improvement strategy). Evid Rep Technol Assess (Full Rep). 2012(208.5):1–645.
- , , , , . Systematic review: the evidence that publishing patient care performance data improves quality of care. Ann Intern Med. 2008;148(2):111–123.
- , . The unintended consequences of quality improvement. Curr Opin Pediatr. 2009;21(6):777–782.
- , , , et al. Unintended consequences of implementing a national performance measurement system into local practice. J Gen Intern Med. 2012;27(4):405–412.
- , . Quality assessment by external bodies: intended and unintended impact on healthcare delivery. Curr Opin Anaesthesiol. 2009;22(2):237–241.
© 2015 Society of Hospital Medicine

Imaging Evaluation of Superior Labral Anteroposterior (SLAP) Tears
Superior labral anteroposterior (SLAP) tears are common labral injuries. They occur at the attachment of the long head of the biceps tendon on the superior glenoid and extend anterior and/or posterior to the biceps anchor. The mechanism of action for SLAP tears is traction on the superior labrum by the long head of the biceps tendon, resulting in “peeling” of the labrum off the glenoid. Such forces may result from repetitive overhead arm motion (pitching) or from direct trauma.
Clinical diagnosis is challenging with SLAP tears, as they often present with nonspecific shoulder pain and may not be associated with an acute injury. A further complication is that they are often associated with other shoulder pathology, such as rotator cuff tears.1 As physical examination is typically nonspecific, proper diagnostic imaging is essential for diagnosis.
We prefer to assess potential SLAP tears with magnetic resonance arthrography (MRA).2 Dilute (1:200) gadolinium contrast material (12-15 mL) is introduced into the glenohumeral joint under sonographic or fluoroscopic guidance. Capsular distention by dilute intra-articular contrast enables superior imaging resolution of the labroligamentous complex. We think the increase in diagnostic confidence enabled by direct arthrography outweighs the additional invasiveness and cost associated with MRA relative to noncontrast magnetic resonance imaging (MRI).
The MRA protocol differs from our routine noncontrast shoulder imaging. We perform a fat-saturated coronal oblique T1 sequence that maximizes the conspicuity of intra-articular contrast in the plane that optimally visualizes the superior labrum. Three planes of intermediate-weighted fast spin echo not only contrast the high-signal intra-articular fluid with the low-signal fibrocartilaginous labrum and the stratified intermediate signal of glenoid articular cartilage, but they also allow optimal assessment of the rotator cuff. In addition, we perform a fat-saturated coronal T2 sequence that highlights all fluid signal structures as well as edema.
SLAP tears appear on MRA as the insinuation of intra-articular contrast between the articular cartilage and the attachment of the superior labrum,3 within the substance of the labrum, or as detachment of the labrum from the glenoid rim4 (Figure 1). Findings can range from labral fraying to complete detachment with displacement. Tears can extend into other quadrants of the labrum, extend from a Bankart lesion, or involve the biceps tendon and/or the glenohumeral ligaments (Figures 2–4). Up to 10 types of SLAP tears have been described on arthroscopy. This classification scheme, however, is seldom helpful in the interpretation of SLAP tears on MRI. More important in guiding treatment is having a detailed description of the tear, including location, extent, and morphology, along with associated abnormalities.
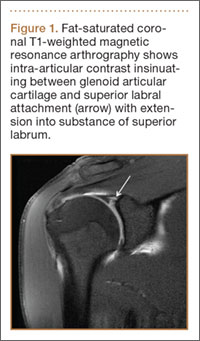
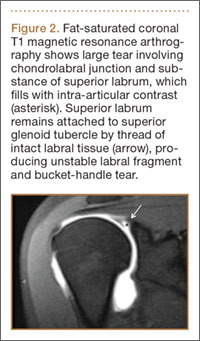
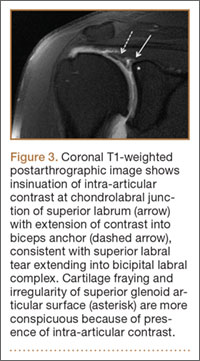
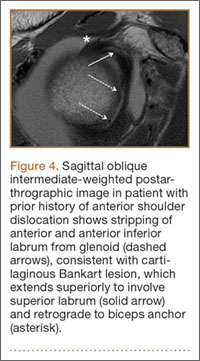
Several findings can aid in the diagnosis of SLAP tears. Normal anatomical variants of the anterior-superior labrum do not extend posterior to the biceps anchor—an important finding for discerning normal morphologic variants from tears. Therefore, high signal within the posterior third of the superior labrum or extension of high signal laterally within the labrum and away from the glenoid suggests a SLAP tear.5 A paralabral cyst is almost always associated with a labral tear,1 so signal abnormality of the superior labrum with a paralabral cyst suggests a SLAP tear (Figure 5).
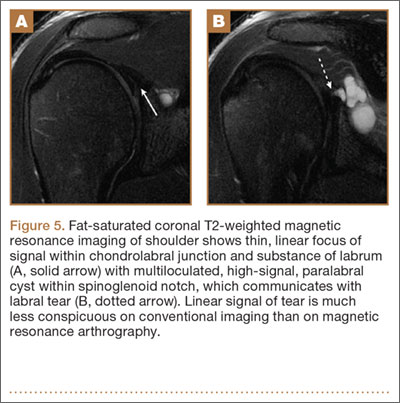
MRA is not the only method for diagnosing SLAP tears. Standard 3-Tesla MRI had 83% sensitivity and 99% specificity for diagnosing SLAP tears in a recent study, though MRA had 98% sensitivity and 99% specificity—a statistically significant sensitivity difference.6 In another study, computed tomography arthrography (CTA) had 95% sensitivity and 88% specificity for diagnosing recurrent SLAP tears after surgery.7 CTA is associated with ionizing radiation and is limited in its assessment of other structures that may show concomitant abnormalities, such as the articular cartilage and the rotator cuff. Indirect MRA, wherein magnetic resonance sequences are obtained after intravenous injection of gadolinium contrast and exercise of the affected shoulder, had a high sensitivity of detection of labral tears of all types.8
MRA is most sensitive and specific for diagnosing SLAP tears; 3-Tesla MRI, indirect MRA, and CTA are useful alternative modalities for cases in which MRA cannot be performed.
1. Chang D, Mohana-Borges A, Borso M, Chung CB. SLAP lesions: anatomy, clinical presentation, MR imaging diagnosis and characterization. Eur J Radiol. 2008;68(1):72-87.
2. Jee WH, McCauley TR, Katz LD, Matheny JM, Ruwe PA, Daigneault JP. Superior labral anterior posterior (SLAP) lesions of the glenoid labrum: reliability and accuracy of MR arthrography for diagnosis. Radiology. 2001;218(1):127-132.
3. Fitzpatrick D, Walz DM. Shoulder MR imaging normal variants and imaging artifacts. Magn Reson Imaging Clin N Am. 2010;18(4):615-632.
4. Bencardino JT, Beltran J, Rosenberg ZS, et al. Superior labrum anterior-posterior lesions: diagnosis with MR arthrography of the shoulder. Radiology. 2000;214(1):267-271.
5. Tuite MJ, Cirillo RL, De Smet AA, Orwin JF. Superior labrum anterior-posterior (SLAP) tears: evaluation of three MR signs on T2-weighted images. Radiology. 2000;215(3):841-845.
6. Magee T. 3-T MRI of the shoulder: is MR arthrography necessary? AJR Am J Roentgenol. 2009;192(1):86-92.
7. De Filippo M, Araoz PA, Pogliacomi F, et al. Recurrent superior labral anterior-to-posterior tears after surgery: detection and grading with CT arthrography. Radiology. 2009;252(3):781-788.
8. Fallahi F, Green N, Gadde S, Jeavons L, Armstrong P, Jonker L. Indirect magnetic resonance arthrography of the shoulder; a reliable diagnostic tool for investigation of suspected labral pathology. Skeletal Radiol. 2013;42(9):1225-1233.
Superior labral anteroposterior (SLAP) tears are common labral injuries. They occur at the attachment of the long head of the biceps tendon on the superior glenoid and extend anterior and/or posterior to the biceps anchor. The mechanism of action for SLAP tears is traction on the superior labrum by the long head of the biceps tendon, resulting in “peeling” of the labrum off the glenoid. Such forces may result from repetitive overhead arm motion (pitching) or from direct trauma.
Clinical diagnosis is challenging with SLAP tears, as they often present with nonspecific shoulder pain and may not be associated with an acute injury. A further complication is that they are often associated with other shoulder pathology, such as rotator cuff tears.1 As physical examination is typically nonspecific, proper diagnostic imaging is essential for diagnosis.
We prefer to assess potential SLAP tears with magnetic resonance arthrography (MRA).2 Dilute (1:200) gadolinium contrast material (12-15 mL) is introduced into the glenohumeral joint under sonographic or fluoroscopic guidance. Capsular distention by dilute intra-articular contrast enables superior imaging resolution of the labroligamentous complex. We think the increase in diagnostic confidence enabled by direct arthrography outweighs the additional invasiveness and cost associated with MRA relative to noncontrast magnetic resonance imaging (MRI).
The MRA protocol differs from our routine noncontrast shoulder imaging. We perform a fat-saturated coronal oblique T1 sequence that maximizes the conspicuity of intra-articular contrast in the plane that optimally visualizes the superior labrum. Three planes of intermediate-weighted fast spin echo not only contrast the high-signal intra-articular fluid with the low-signal fibrocartilaginous labrum and the stratified intermediate signal of glenoid articular cartilage, but they also allow optimal assessment of the rotator cuff. In addition, we perform a fat-saturated coronal T2 sequence that highlights all fluid signal structures as well as edema.
SLAP tears appear on MRA as the insinuation of intra-articular contrast between the articular cartilage and the attachment of the superior labrum,3 within the substance of the labrum, or as detachment of the labrum from the glenoid rim4 (Figure 1). Findings can range from labral fraying to complete detachment with displacement. Tears can extend into other quadrants of the labrum, extend from a Bankart lesion, or involve the biceps tendon and/or the glenohumeral ligaments (Figures 2–4). Up to 10 types of SLAP tears have been described on arthroscopy. This classification scheme, however, is seldom helpful in the interpretation of SLAP tears on MRI. More important in guiding treatment is having a detailed description of the tear, including location, extent, and morphology, along with associated abnormalities.
Several findings can aid in the diagnosis of SLAP tears. Normal anatomical variants of the anterior-superior labrum do not extend posterior to the biceps anchor—an important finding for discerning normal morphologic variants from tears. Therefore, high signal within the posterior third of the superior labrum or extension of high signal laterally within the labrum and away from the glenoid suggests a SLAP tear.5 A paralabral cyst is almost always associated with a labral tear,1 so signal abnormality of the superior labrum with a paralabral cyst suggests a SLAP tear (Figure 5).
MRA is not the only method for diagnosing SLAP tears. Standard 3-Tesla MRI had 83% sensitivity and 99% specificity for diagnosing SLAP tears in a recent study, though MRA had 98% sensitivity and 99% specificity—a statistically significant sensitivity difference.6 In another study, computed tomography arthrography (CTA) had 95% sensitivity and 88% specificity for diagnosing recurrent SLAP tears after surgery.7 CTA is associated with ionizing radiation and is limited in its assessment of other structures that may show concomitant abnormalities, such as the articular cartilage and the rotator cuff. Indirect MRA, wherein magnetic resonance sequences are obtained after intravenous injection of gadolinium contrast and exercise of the affected shoulder, had a high sensitivity of detection of labral tears of all types.8
MRA is most sensitive and specific for diagnosing SLAP tears; 3-Tesla MRI, indirect MRA, and CTA are useful alternative modalities for cases in which MRA cannot be performed.
1. Chang D, Mohana-Borges A, Borso M, Chung CB. SLAP lesions: anatomy, clinical presentation, MR imaging diagnosis and characterization. Eur J Radiol. 2008;68(1):72-87.
2. Jee WH, McCauley TR, Katz LD, Matheny JM, Ruwe PA, Daigneault JP. Superior labral anterior posterior (SLAP) lesions of the glenoid labrum: reliability and accuracy of MR arthrography for diagnosis. Radiology. 2001;218(1):127-132.
3. Fitzpatrick D, Walz DM. Shoulder MR imaging normal variants and imaging artifacts. Magn Reson Imaging Clin N Am. 2010;18(4):615-632.
4. Bencardino JT, Beltran J, Rosenberg ZS, et al. Superior labrum anterior-posterior lesions: diagnosis with MR arthrography of the shoulder. Radiology. 2000;214(1):267-271.
5. Tuite MJ, Cirillo RL, De Smet AA, Orwin JF. Superior labrum anterior-posterior (SLAP) tears: evaluation of three MR signs on T2-weighted images. Radiology. 2000;215(3):841-845.
6. Magee T. 3-T MRI of the shoulder: is MR arthrography necessary? AJR Am J Roentgenol. 2009;192(1):86-92.
7. De Filippo M, Araoz PA, Pogliacomi F, et al. Recurrent superior labral anterior-to-posterior tears after surgery: detection and grading with CT arthrography. Radiology. 2009;252(3):781-788.
8. Fallahi F, Green N, Gadde S, Jeavons L, Armstrong P, Jonker L. Indirect magnetic resonance arthrography of the shoulder; a reliable diagnostic tool for investigation of suspected labral pathology. Skeletal Radiol. 2013;42(9):1225-1233.
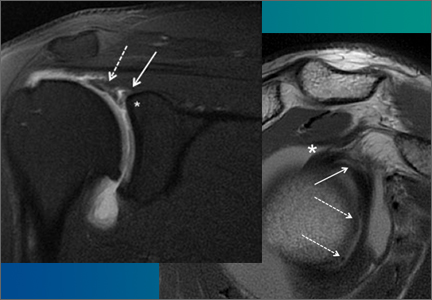
Measurement of Resource Utilization for Total and Reverse Shoulder Arthroplasty
As total health care costs reach almost $3 trillion per year—capturing more than 17% of the total US gross domestic product—payers are searching for more effective ways to limit health care spending.1,2 One increasingly discussed plan is payment bundling.3 This one-lump-sum payment model arose as a result of rapid year-on-year increases in total reimbursements under the current, fee-for-service model. The Centers for Medicare & Medicaid Services hypothesized that a single all-inclusive payment for a procedure or set of services would incentivize improvements in patient-centered care and disincentivize cost-shifting behaviors.4 Bundled reimbursement is becoming increasingly common in orthopedic practice. With the recent introduction of the Bundled Payment for Care Improvement Initiative, several orthopedic practices around the United States are already actively engaged in creating models for bundled payment for common elective procedures and for associated services provided up to 90 days after surgery.3,5
Bundled payment increases the burden on the provider to understand the cost of care provided during a care cycle. However, not only has the current system blinded physicians to the cost of care, but current antitrust legislation has made discussions of pricing with colleagues (so-called price collusion) illegal and subject to fines of up to $1 million per person and $100 million per organization,6 therefore limiting orthopedic physician involvement.
Given these legal constraints, instead of measuring direct costs of goods, we developed a “grocery list” approach in which direct comparisons are made of resources (goods and services) used and delivered during the entire 90-day cycle of care for patients who undergo anatomical total shoulder arthroplasty (TSA) or reverse shoulder arthroplasty (RSA). We used one surgeon’s practice experience as a model for measuring other orthopedic surgeons’ resource utilization, based on their electronic medical records (EMR) system data. By capturing the costs of the components of resource utilization rather than just the final cost of care, we can assess, compare, understand, endorse, and address these driving factors.
1. The significance of resource utilization
To maximize the efficiency of their practices, high-volume shoulder surgeons have introduced standardization to health care delivery.7 Identifying specific efficiencies makes uniform acceptance of beneficial practice patterns possible.
To facilitate comparison of goods and services used during an episode of surgical care, Virani and colleagues8,9 studied the costs of TSA and RSA and calculated the top 10 driving cost factors for these procedures (Figure 1). Their systematic analysis provided a framework for a common method of communication, allowing an orthopedic surgeon to gain a more complete understanding of the resources used during a particular operative procedure in his or her practice, and allowing several physicians to compare and contrast the resources collectively used for a single procedure, facilitating an understanding of different practice patterns within a local community. At a societal level, these data can be collected to help guide overall recommendations.
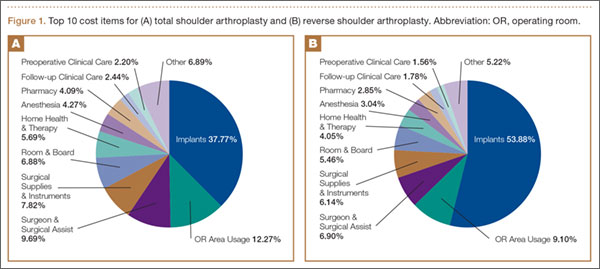
2. How we defined utilization
To define the resources used, we had to decide which procedure components cost the most. Virani and colleagues8,9 found that the top 10 cost drivers accounted for 93.11% and 94.77% of the total cost of the TSA and RSA care cycles, respectively (Figure 1). For each cost driver, information on resources used (goods, services, overhead) was collected on 2 forms, the Hospital Utilization Form (7 hospital-based items) and the Clinical Utilization Form (3 non-hospital-based items). To make hospital data easy to compile, we piloted use of a “smart form” in the EpicCare EMR system to isolate and auto-populate specific data fields.
3. EMR data collection
With EMR becoming mandatory for all public and private health care providers starting in 2014, utilization data are now included in a single unified system. Working with our in-house information technology department, we developed an algorithm to populate this information in a separate, easy-to-follow hospital utilization form. This form can be adopted by other institutions. Although EpicCare EMR is used by 52% of hospitals and at our institution, the data points required to make the same measurements are generalizable and exist in other EMRs.
Smartlinks, a tool in this EMR, allows utilization data to be quickly retrieved from different locations in a medical record and allows a form to be electronically completed in seconds. Data can be retrieved for any patient in the EMR system, regardless of when that patient’s hospital stay occurred. We populated data from surgeries performed 2 years before the start of this project.
4. What we can learn from these data
Data from a pilot study of 25 patients who underwent primary anatomical TSA for osteoarthritis and 25 patients who underwent primary RSA for massive rotator cuff tear allowed us to generate graphical representations of a single surgeon’s practice patterns that most affected the cost of care. Time in holding, time in the operating room, time in the postanesthesia care unit, and percentage of patients receiving different medications were recorded for each procedure (Figures 2–11). The study did not capture the wide variances in practice patterns in shoulder arthroplasty, and therefore other surgeons’ resource utilization may differ from ours. However, replicating this methodology at other institutions will produce a more robust data set from which conclusions about resource utilization and, indirectly, cost of care can be made.
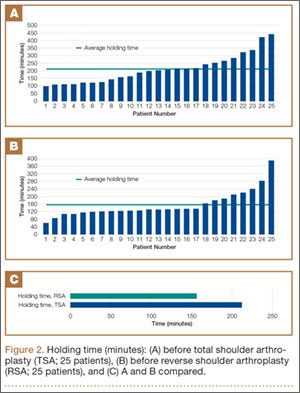
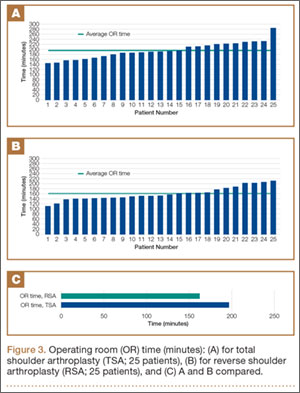
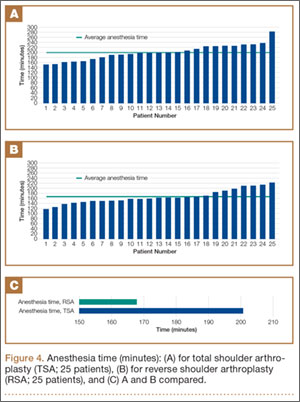
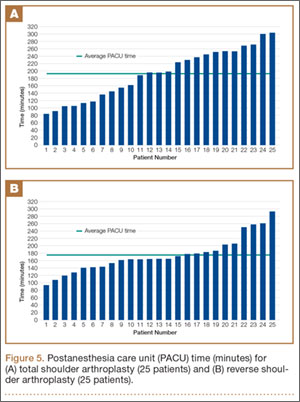
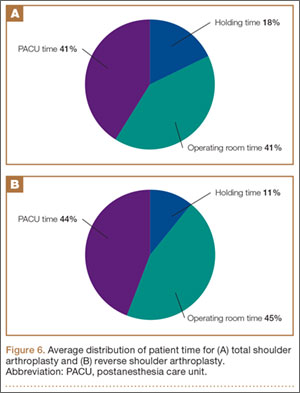
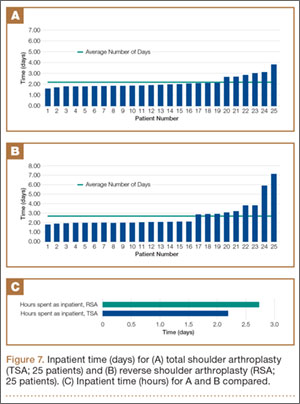
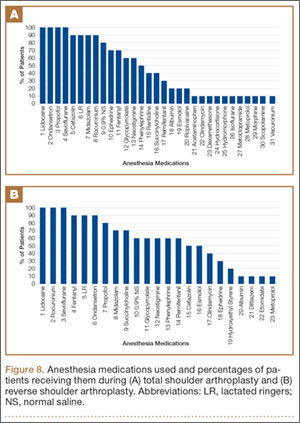
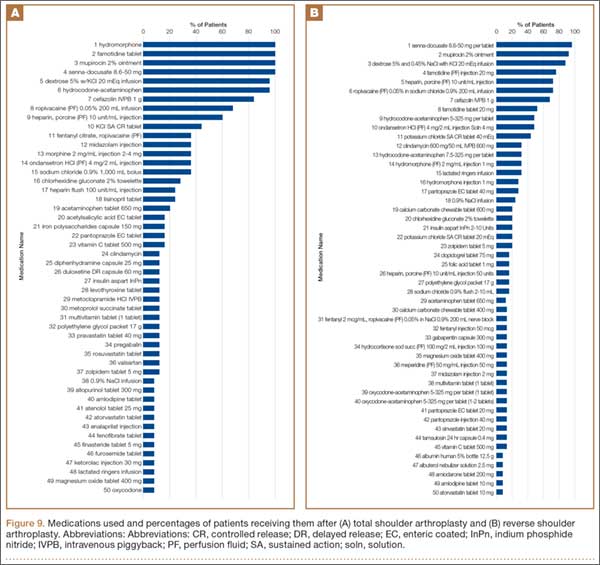
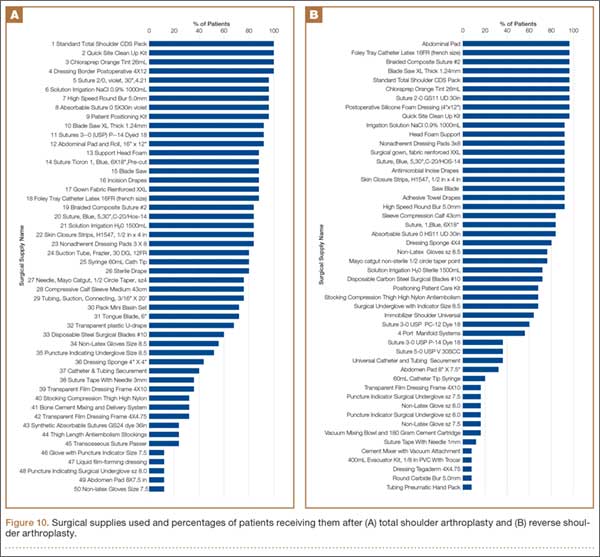
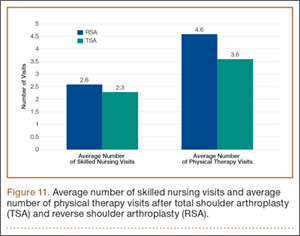
5. Future possibilities
By using existing EMR tools to better understand resource utilization, orthopedic surgeons can play a constructive role in the dialogue on health care costs and new reimbursement models. The data presented here are not meant to be interpreted as hard and fast numbers on global resource utilization, but instead we intend to establish a model for collecting data on resource utilization. Resource utilization begins the dialogue that allows orthopedic surgeons and specialty societies to speak a common language without discussing actual cost numbers, which is discouraged under antitrust regulation. The data presented will allow comparisons to be made between surgeons in all practice settings to highlight areas of inconsistency in order to further improve patient care. Although this work involved only 50 patients undergoing only 2 types of surgeries, the resource-capturing methodology can be expanded to include more procedures and orthopedic practices. As all hospitals are now required to have EMRs, the metrics tracked in this work can be found on any patient medical record and auto-populated using our open-source utilization forms. Starting this data collection at your hospital may require no more than a conversation with the informatics department, as the metrics can for the most part be populated into a database on surgeon request.
As orthopedic surgeons return to the economic health care discussion, this information could prove essential in helping the individual surgeon and the orthopedic community justify the cost of care as well as fully understand the cost drivers for musculoskeletal care.
Click here to read the commentary on this article by Peter D. McCann, MD
1. National health expenditures 2013 highlights. Centers for Medicare & Medicaid Services website. http://www.cms.gov/Research-Statistics-Data-and-Systems/Statistics-Trends-and-Reports/NationalHealthExpendData/downloads/highlights.pdf. Accessed September 14, 2015.
2. Wilson KB. Health care costs 101: slow growth persists. California HealthCare Foundation website. http://www.chcf.org/publications/2014/07/health-care-costs-101. Published July 2014. Accessed August 24, 2015.
3. Froimson MI, Rana A, White RE Jr, et al. Bundled Payments for Care Improvement Initiative: the next evolution of payment formulations: AAHKS Bundled Payment Task Force. J Arthroplasty. 2013;28(8 suppl):157-165.
4. Morley M, Bogasky S, Gage B, Flood S, Ingber MJ. Medicare post-acute care episodes and payment bundling. Medicare Medicaid Res Rev. 2014;4(1).
5. Teusink MJ, Virani NA, Polikandriotis JA, Frankle MA. Cost analysis in shoulder arthroplasty surgery. Adv Orthop. 2012;2012:692869.
6. Fassbender E, Pandya S. Legislation focuses on AAOS priorities. American Academy of Orthopaedic Surgeons website. http://www.aaos.org/news/aaosnow/may14/advocacy2.asp. AAOS Now. Published May 2014. Accessed August 24, 2015.
7. Porter ME, Teisberg EO. Redefining Health Care: Creating Value-Based Competition on Results. Boston, MA: Harvard Business School Press; 2006.
8. Virani NA, Williams CD, Clark R, Polikandriotis J, Downes KL, Frankle MA. Preparing for the bundled-payment initiative: the cost and clinical outcomes of reverse shoulder arthroplasty for the surgical treatment of advanced rotator cuff deficiency at an average 4-year follow-up. J Shoulder Elbow Surg. 2013;22(12):1612-1622.
9. Virani NA, Williams CD, Clark R, Polikandriotis J, Downes KL, Frankle MA. Preparing for the bundled-payment initiative: the cost and clinical outcomes of total shoulder arthroplasty for the surgical treatment of glenohumeral arthritis at an average 4-year follow-up. J Shoulder Elbow Surg. 2013;22(12):1601-1611.
As total health care costs reach almost $3 trillion per year—capturing more than 17% of the total US gross domestic product—payers are searching for more effective ways to limit health care spending.1,2 One increasingly discussed plan is payment bundling.3 This one-lump-sum payment model arose as a result of rapid year-on-year increases in total reimbursements under the current, fee-for-service model. The Centers for Medicare & Medicaid Services hypothesized that a single all-inclusive payment for a procedure or set of services would incentivize improvements in patient-centered care and disincentivize cost-shifting behaviors.4 Bundled reimbursement is becoming increasingly common in orthopedic practice. With the recent introduction of the Bundled Payment for Care Improvement Initiative, several orthopedic practices around the United States are already actively engaged in creating models for bundled payment for common elective procedures and for associated services provided up to 90 days after surgery.3,5
Bundled payment increases the burden on the provider to understand the cost of care provided during a care cycle. However, not only has the current system blinded physicians to the cost of care, but current antitrust legislation has made discussions of pricing with colleagues (so-called price collusion) illegal and subject to fines of up to $1 million per person and $100 million per organization,6 therefore limiting orthopedic physician involvement.
Given these legal constraints, instead of measuring direct costs of goods, we developed a “grocery list” approach in which direct comparisons are made of resources (goods and services) used and delivered during the entire 90-day cycle of care for patients who undergo anatomical total shoulder arthroplasty (TSA) or reverse shoulder arthroplasty (RSA). We used one surgeon’s practice experience as a model for measuring other orthopedic surgeons’ resource utilization, based on their electronic medical records (EMR) system data. By capturing the costs of the components of resource utilization rather than just the final cost of care, we can assess, compare, understand, endorse, and address these driving factors.
1. The significance of resource utilization
To maximize the efficiency of their practices, high-volume shoulder surgeons have introduced standardization to health care delivery.7 Identifying specific efficiencies makes uniform acceptance of beneficial practice patterns possible.
To facilitate comparison of goods and services used during an episode of surgical care, Virani and colleagues8,9 studied the costs of TSA and RSA and calculated the top 10 driving cost factors for these procedures (Figure 1). Their systematic analysis provided a framework for a common method of communication, allowing an orthopedic surgeon to gain a more complete understanding of the resources used during a particular operative procedure in his or her practice, and allowing several physicians to compare and contrast the resources collectively used for a single procedure, facilitating an understanding of different practice patterns within a local community. At a societal level, these data can be collected to help guide overall recommendations.
2. How we defined utilization
To define the resources used, we had to decide which procedure components cost the most. Virani and colleagues8,9 found that the top 10 cost drivers accounted for 93.11% and 94.77% of the total cost of the TSA and RSA care cycles, respectively (Figure 1). For each cost driver, information on resources used (goods, services, overhead) was collected on 2 forms, the Hospital Utilization Form (7 hospital-based items) and the Clinical Utilization Form (3 non-hospital-based items). To make hospital data easy to compile, we piloted use of a “smart form” in the EpicCare EMR system to isolate and auto-populate specific data fields.
3. EMR data collection
With EMR becoming mandatory for all public and private health care providers starting in 2014, utilization data are now included in a single unified system. Working with our in-house information technology department, we developed an algorithm to populate this information in a separate, easy-to-follow hospital utilization form. This form can be adopted by other institutions. Although EpicCare EMR is used by 52% of hospitals and at our institution, the data points required to make the same measurements are generalizable and exist in other EMRs.
Smartlinks, a tool in this EMR, allows utilization data to be quickly retrieved from different locations in a medical record and allows a form to be electronically completed in seconds. Data can be retrieved for any patient in the EMR system, regardless of when that patient’s hospital stay occurred. We populated data from surgeries performed 2 years before the start of this project.
4. What we can learn from these data
Data from a pilot study of 25 patients who underwent primary anatomical TSA for osteoarthritis and 25 patients who underwent primary RSA for massive rotator cuff tear allowed us to generate graphical representations of a single surgeon’s practice patterns that most affected the cost of care. Time in holding, time in the operating room, time in the postanesthesia care unit, and percentage of patients receiving different medications were recorded for each procedure (Figures 2–11). The study did not capture the wide variances in practice patterns in shoulder arthroplasty, and therefore other surgeons’ resource utilization may differ from ours. However, replicating this methodology at other institutions will produce a more robust data set from which conclusions about resource utilization and, indirectly, cost of care can be made.
5. Future possibilities
By using existing EMR tools to better understand resource utilization, orthopedic surgeons can play a constructive role in the dialogue on health care costs and new reimbursement models. The data presented here are not meant to be interpreted as hard and fast numbers on global resource utilization, but instead we intend to establish a model for collecting data on resource utilization. Resource utilization begins the dialogue that allows orthopedic surgeons and specialty societies to speak a common language without discussing actual cost numbers, which is discouraged under antitrust regulation. The data presented will allow comparisons to be made between surgeons in all practice settings to highlight areas of inconsistency in order to further improve patient care. Although this work involved only 50 patients undergoing only 2 types of surgeries, the resource-capturing methodology can be expanded to include more procedures and orthopedic practices. As all hospitals are now required to have EMRs, the metrics tracked in this work can be found on any patient medical record and auto-populated using our open-source utilization forms. Starting this data collection at your hospital may require no more than a conversation with the informatics department, as the metrics can for the most part be populated into a database on surgeon request.
As orthopedic surgeons return to the economic health care discussion, this information could prove essential in helping the individual surgeon and the orthopedic community justify the cost of care as well as fully understand the cost drivers for musculoskeletal care.
Click here to read the commentary on this article by Peter D. McCann, MD
1. National health expenditures 2013 highlights. Centers for Medicare & Medicaid Services website. http://www.cms.gov/Research-Statistics-Data-and-Systems/Statistics-Trends-and-Reports/NationalHealthExpendData/downloads/highlights.pdf. Accessed September 14, 2015.
2. Wilson KB. Health care costs 101: slow growth persists. California HealthCare Foundation website. http://www.chcf.org/publications/2014/07/health-care-costs-101. Published July 2014. Accessed August 24, 2015.
3. Froimson MI, Rana A, White RE Jr, et al. Bundled Payments for Care Improvement Initiative: the next evolution of payment formulations: AAHKS Bundled Payment Task Force. J Arthroplasty. 2013;28(8 suppl):157-165.
4. Morley M, Bogasky S, Gage B, Flood S, Ingber MJ. Medicare post-acute care episodes and payment bundling. Medicare Medicaid Res Rev. 2014;4(1).
5. Teusink MJ, Virani NA, Polikandriotis JA, Frankle MA. Cost analysis in shoulder arthroplasty surgery. Adv Orthop. 2012;2012:692869.
6. Fassbender E, Pandya S. Legislation focuses on AAOS priorities. American Academy of Orthopaedic Surgeons website. http://www.aaos.org/news/aaosnow/may14/advocacy2.asp. AAOS Now. Published May 2014. Accessed August 24, 2015.
7. Porter ME, Teisberg EO. Redefining Health Care: Creating Value-Based Competition on Results. Boston, MA: Harvard Business School Press; 2006.
8. Virani NA, Williams CD, Clark R, Polikandriotis J, Downes KL, Frankle MA. Preparing for the bundled-payment initiative: the cost and clinical outcomes of reverse shoulder arthroplasty for the surgical treatment of advanced rotator cuff deficiency at an average 4-year follow-up. J Shoulder Elbow Surg. 2013;22(12):1612-1622.
9. Virani NA, Williams CD, Clark R, Polikandriotis J, Downes KL, Frankle MA. Preparing for the bundled-payment initiative: the cost and clinical outcomes of total shoulder arthroplasty for the surgical treatment of glenohumeral arthritis at an average 4-year follow-up. J Shoulder Elbow Surg. 2013;22(12):1601-1611.

Technique of Open Reduction and Internal Fixation of Comminuted Proximal Humerus Fractures With Allograft Femoral Head Metaphyseal Reconstruction
Proximal humerus fractures are exceedingly common and account for almost 5% of all fractures. As osteoporosis is a risk factor for these fractures, their incidence rises with patient age.1
In 1970, Neer2 described these type of fractures and classified them as having 2, 3, or 4 parts based on the amount of angulation and displacement of the humeral head and the greater and lesser tuberosities with respect to the shaft.
Three- and 4-part proximal humerus fractures can be treated either nonoperatively, or surgically with closed reduction and percutaneous fixation, intramedullary fixation, open reduction and internal fixation (ORIF), or arthroplasty. There remains controversy over the best treatment, but a key component of any surgical treatment is anatomical reduction, stable fixation, and then healing of the tuberosities. A current common form of treatment is augmentation with an allograft fibula placed in the medullary canal. Although not formally reported, anecdotal evidence demonstrates that revision to arthroplasty is very difficult in the setting of an ingrown graft in the medullary canal of the humerus.
In this article, we present a novel technique of using allograft femoral head to reconstruct the metaphysis in ORIF of comminuted proximal humerus fractures.
Technique
Presented in Figure 1 are preoperative images of a representative displaced 4-part proximal humerus fracture treated surgically using the technique described here. General anesthesia is used. After intubation on the operating table, the patient is placed in the beach-chair position with about 75° of hip flexion. All bony prominences are padded, and the head and trunk are well secured. A pneumatic arm positioner is used to alleviate the need for an assistant to manipulate the arm. An image intensifier is used before preparing to verify that appropriate images of the proximal humerus can be obtained. Once adequate images are confirmed, the floor can be marked at the position of the fluoroscopic unit’s wheels to allow easy reproduction of images once the arm is prepared and draped. The intensifier is then removed from the field, the shoulder is prepared and draped in usual fashion, and prophylactic antibiotics are administered.
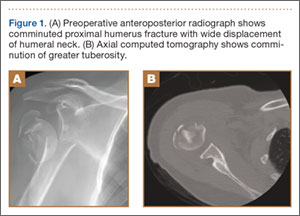
A deltopectoral incision is used, and sharp dissection is made through the subcutaneous tissue to raise full-thickness subcutaneous flaps on each side. The deltopectoral interval is sharply dissected while protecting the cephalic vein. Subdeltoid adhesions are then released. Palpation of the axillary nerve in the quadrilateral space to identify its location is helpful to avoid injury during the procedure.
The fracture is then identified, and No. 5 permanent suture is placed through the posterior and superior rotator cuff and through the subscapularis insertion (Figure 2). The tuberosities are freed from the humeral head sharply. A blunt elevator is then used to gently elevate the humeral head upward, with care taken to avoid comminuting the metaphyseal bone while levering. Reduction is achieved by manipulating the sutures and levering the head with the elevator while placing the arm in extension and posterior translation. Fluoroscopic images are used to verify correct anatomical alignment. Generally, the metaphysis demonstrates comminution and impaction, with poor bone quality necessitating use of bone graft.
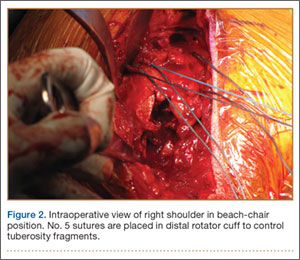
A frozen allograft femoral head is then obtained and split into 2 equal pieces using a saw (Figures 3–5). One piece is fashioned with a saw and a burr into a trapezoid such that the proximal portion is wider, and the distal, tapered portion is sized to fit the canal. The broad, proximal portion of the graft will serve as a pedestal to reduce the head to the shaft. Measuring the internal diameter of the humeral canal can be useful in estimating the necessary dimensions of the distal portion of the allograft. The graft often needs several small adjustments that necessitate attempting to place it in the intramedullary canal and then trimming as necessary to ensure proper fit distally within the shaft. For this reason, it is beneficial to perform the graft preparation near the surgical field. Once completed, the distal portion is then impacted into the humeral canal (Figure 6). Because of this impaction, there is no possibility for subsidence or pistoning of the graft within the canal, which can occur with a fibular graft. The humeral head is reduced onto the shaft with the already placed sutures; this is achieved by abducting the shoulder. The image intensifier is then used to confirm appropriate alignment and positioning of the fragments, making sure that both neck–shaft angle and medial calcar alignment have been restored (Figures 7, 8).
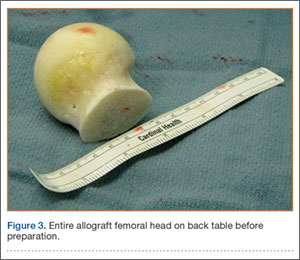
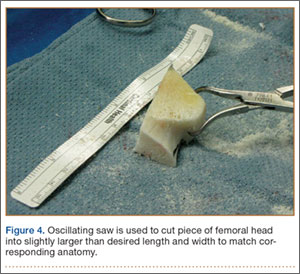
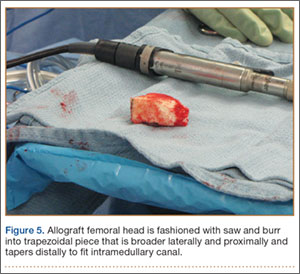
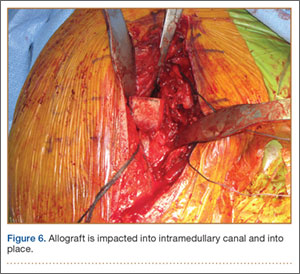
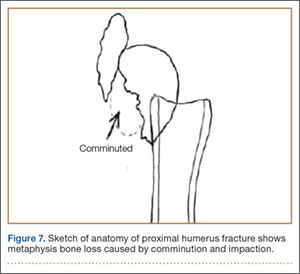
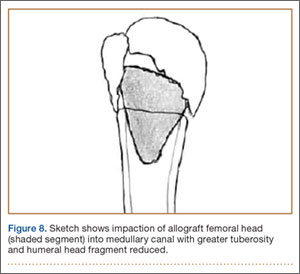
An appropriately sized proximal humerus plate is then selected based on the location of the fracture line. We have used standard lateral proximal humerus locking plates as well as laterality-specific anterolateral proximal humerus plates and found that both are suitable for incorporation of the screws through the graft and into the head. The plate is positioned on the humerus, and a guide pin is placed by hand through the proximal-most hole so that the appropriate height of the plate can be verified on fluoroscopy. The first screw is then a nonlocking bicortical screw placed through the oval hole in the shaft of the plate to allow further fine manipulation of the plate more proximally or distally as needed. The final height is confirmed, and the screw is firmly tightened (Figure 9). The locking-screw guide is fixed to the proximal portion of the plate, and 2 locking screws are then placed into the head. The arm is then rotated to an anteroposterior view by placing the arm in external rotation and neutral flexion and is then abducted and internally rotated to recreate a lateral view to perform final verification of the position of the plate on orthogonal images. If the surgeon is satisfied with the position of the plate, another nonlocking screw is placed distally, and then the proximal holes are used to place locking screws as needed. If the surgeon is not satisfied, the 2 proximal screws can be removed and the plate repositioned.
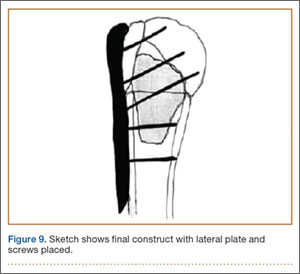
After each screw is placed, fluoroscopy is used to ensure there has been no breach of the articular surface. The number of proximal screws placed depends on fracture configuration and surgeon preference.
The sutures through the rotator cuff are then fixed to the plate, securing the tuberosities. Final intraoperative radiographs are used to confirm reduction, alignment, and final position of hardware (Figure 10). After copious irrigation, a surgical drain is placed as needed, and the wound is closed in layered fashion. Three years after surgery, follow-up examination revealed no radiographic change in alignment, no necrosis, and no varus collapse (Figure 11), and the patient was pain-free during activities.
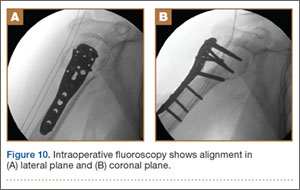
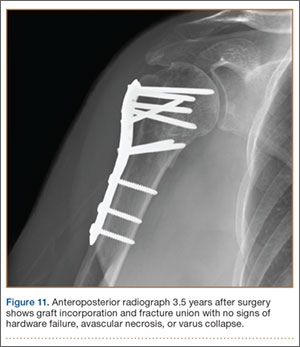
Discussion
Surgical treatment of comminuted proximal humerus fractures usually consists of some type of plate fixation with screw fixation of the shaft, screws or smooth pegs to support the chondral surfaces, and screw fixation or suture cerclage of the tuberosities.
Fixed-angle locking-plate-and-screw constructs increased the biomechanical stability and pullout strength of proximal humerus plates.3,4 Nevertheless, avascular necrosis, malunion, and nonunion are still known complications of proximal humerus fractures, especially those with comminution, with up to 14% of patients still experiencing loss of fixation.5
For this reason, several authors have proposed using allograft bone and/or augmentation with calcium-containing cement to supplement fixation and provide an endosteal form of support for the head and tuberosities to decrease the risk for varus collapse. Osteobiologics (eg, calcium phosphate or sulfate cement) have been shown to decrease the risk for loss of reduction of proximal humerus fractures and decrease the risk for intra-articular screw penetration.6,7 Many calcium phosphate cements are commercially available. Cost and availability are 2 reasons that these supplements are not more widely used. Cancellous chips have also been used to aid in the reduction of proximal humerus fractures.8 No randomized study has been conducted to show a clinical advantage of this technique, though retrospective studies have shown that it is not as advantageous as using calcium phosphate cement with respect to loss of reduction or screw penetration.6 Certainly, cancellous chips are easily available in most hospitals and are less expensive than some alternatives. A recent review of these techniques in osteoporotic proximal humerus fractures found no clear indication for using one of these supplements over another.9
However, some fracture patterns require a structural graft to reduce the tuberosities and head component. Although described more than 30 years ago as a treatment for nonunions with an intramedullary “peg” of iliac crest graft,10 the graft most commonly reported today is allograft fibula.11-15 This technique consists of preparing the humeral shaft and often the fractured head segment with reaming to create a channel to receive the graft. Even with use of a small fibula, it is often time-consuming to use a saw, rasp, or burr to size the fibular segment to fit the medullary canal of the humerus. Once in place, the graft provides a strut on which the head fragment can be reduced and around which the tuberosities can be reduced. Although this technique is successful clinically and is biomechanically superior to plate-only constructs,16,17 concerns remain.
One such concern is keeping this graft in routine supply at most hospitals. Supply and pricing from vendors can differ significantly between hospitals, and a surgeon may need to request grafts in advance, which makes their use nonviable in a trauma case. Certain grafts are often kept in routine supply based on their overall utilization. At our institution, allograft femoral heads meet this criterion and are routinely stocked.
Of more importance are the ramifications of these procedures for future revision surgeries. The need for arthroplasty revision is common after ORIF of a proximal humerus fracture.18
Arthroplasty revision is an already challenging procedure that becomes more complex with the need to remove 6 to 8 cm of ingrown endosteal bone from a shell of outer osteoporotic cortical bone. Our experience with these complex revisions provided the impetus to search for an alternate graft type that still provides a strut for reducing the head and tuberosities but limits the amount of endosteal bone that would need to be removed in arthroplasty revision in order to place a stemmed component into the humeral canal.
Some currently available arthroplasty fracture systems modify the previous anatomy of the stem to provide a more anatomical platform to reduce the tuberosities to a broader metaphyseal construct that incorporates bone grafting to assist with healing.
Because of these concerns and factors, we adapted our technique to create an individual-specific pedestal with allograft femoral head that can be anatomically matched to each patient. This provides a strut to reduce the head and tuberosity fragments but still limits the amount of allograft bone needed to seat into the existing canal. The geometry of the allograft can also be customized to the fracture, with most 3- and 4-part fractures needing a trapezoidal strut that resembles the metaphyseal portion of a fracture-specific shoulder arthroplasty implant.
We have used this technique for comminuted 3- and 4-part fractures of the proximal humerus in 14 cases with at least 2-year follow-up and in several more cases that have not reached 2-year follow-up. All cases have gone on to radiographic union; none have had to be revised either with revision ORIF or to an arthroplasty. Formal measurements of final postoperative range of motion have not been tabulated in all cases, as some cases have been lost to follow-up after radiographic union was achieved. Medium- and long-term results are not yet available, but no short-term complications have been noted.
Disadvantages of this technique are that, while an individualized graft is created, proper shaping still takes time, and a moderate amount of the femoral head is not used. However, we have found that, if a graft is inadvertently undersized, there is still ample femoral head remaining to create another sized graft. Other disadvantages are the added cost and the (rare) risk of disease transmission, which come with use of any allograft, but the technique is used instead of another type of allograft, so these disadvantages are largely equivalent. At our hospital, differences in cost and availability between femoral head or fibular allografts are negligible.
This procedure, which is easily performed in a short amount of time, allows a stable base of bone graft to be used as an aid in the anatomical reduction of proximal humerus fractures, without the need for reaming and preparation of the medullary canal and without further increasing the difficulty associated with a future revision procedure.
1. Barrett JA, Baron JA, Karagas MR, Beach ML. Fracture risk in the U.S. Medicare population. J Clin Epidemiol. 1999;52(3):243-249.
2. Neer CS 2nd. Displaced proximal humeral fractures. I. Classification and evaluation. J Bone Joint Surg Am. 1970;52(6):1077-1089.
3. Liew AS, Johnson JA, Patterson SD, King GJ, Chess DG. Effect of screw placement on fixation in the humeral head. J Shoulder Elbow Surg. 2000;9(5):423-426.
4. Weinstein DM, Bratton DR, Ciccone WJ 2nd, Elias JJ. Locking plates improve torsional resistance in the stabilization of three-part proximal humeral fractures. J Shoulder Elbow Surg. 2006;15(2):239-243.
5. Agudelo J, Schurmann M, Stahel P, et al. Analysis of efficacy and failure in proximal humerus fractures treated with locking plates. J Orthop Trauma. 2007;21(10):676-681.
6. Egol KA, Sugi MT, Ong CC, Montero N, Davidovitch R, Zuckerman JD. Fracture site augmentation with calcium phosphate cement reduces screw penetration after open reduction-internal fixation of proximal humeral fractures. J Shoulder Elbow Surg. 2012;21(6):741-748.
7. Gradl G, Knobe M, Stoffel M, Prescher A, Dirrichs T, Pape HC. Biomechanical evaluation of locking plate fixation of proximal humeral fractures augmented with calcium phosphate cement. J Orthop Trauma. 2013;27(7):399-404.
8. Ong CC, Kwon YW, Walsh M, Davidovitch R, Zuckerman JD, Egol KA. Outcomes of open reduction and internal fixation of proximal humerus fractures managed with locking plates. Am J Orthop. 2012;41(9):407-412.
9. Namdari S, Voleti PB, Mehta S. Evaluation of the osteoporotic proximal humeral fracture and strategies for structural augmentation during surgical treatment. J Shoulder Elbow Surg. 2012;21(12):1787-1795.
10. Scheck M. Surgical treatment of nonunions of the surgical neck of the humerus. Clin Orthop Relat Res. 1982;(167):255-259.
11. Hettrich CM, Neviaser A, Beamer BS, Paul O, Helfet DL, Lorich DG. Locked plating of the proximal humerus using an endosteal implant. J Orthop Trauma. 2012;26(4):212-215.
12. Neviaser AS, Hettrich CM, Beamer BS, Dines JS, Lorich DG. Endosteal strut augment reduces complications associated with proximal humeral locking plates. Clin Orthop Relat Res. 2011;469(12):3300-3306.
13. Gardner MJ, Boraiah S, Helfet DL, Lorich DG. Indirect medial reduction and strut support of proximal humerus fractures using an endosteal implant. J Orthop Trauma. 2008;22(3):195-200.
14. Matassi F, Angeloni R, Carulli C, et al. Locking plate and fibular allograft augmentation in unstable fractures of proximal humerus. Injury. 2012;43(11):1939-1942.
15. Little MT, Berkes MB, Schottel PC, et al. The impact of preoperative coronal plane deformity on proximal humerus fixation with endosteal augmentation. J Orthop Trauma. 2014;28(6):338-347.
16. Mathison C, Chaudhary R, Beaupre L, Reynolds M, Adeeb S, Bouliane M. Biomechanical analysis of proximal humeral fixation using locking plate fixation with an intramedullary fibular allograft. Clin Biomech. 2010;25(7):642-646.
17. Chow RM, Begum F, Beaupre LA, Carey JP, Adeeb S, Bouliane MJ. Proximal humeral fracture fixation: locking plate construct +/- intramedullary fibular allograft. J Shoulder Elbow Surg. 2012;21(7):894-901.
18. Jost B, Spross C, Grehn H, Gerber C. Locking plate fixation of fractures of the proximal humerus: analysis of complications, revision strategies and outcome. J Shoulder Elbow Surg. 2013;22(4):542-549.
Proximal humerus fractures are exceedingly common and account for almost 5% of all fractures. As osteoporosis is a risk factor for these fractures, their incidence rises with patient age.1
In 1970, Neer2 described these type of fractures and classified them as having 2, 3, or 4 parts based on the amount of angulation and displacement of the humeral head and the greater and lesser tuberosities with respect to the shaft.
Three- and 4-part proximal humerus fractures can be treated either nonoperatively, or surgically with closed reduction and percutaneous fixation, intramedullary fixation, open reduction and internal fixation (ORIF), or arthroplasty. There remains controversy over the best treatment, but a key component of any surgical treatment is anatomical reduction, stable fixation, and then healing of the tuberosities. A current common form of treatment is augmentation with an allograft fibula placed in the medullary canal. Although not formally reported, anecdotal evidence demonstrates that revision to arthroplasty is very difficult in the setting of an ingrown graft in the medullary canal of the humerus.
In this article, we present a novel technique of using allograft femoral head to reconstruct the metaphysis in ORIF of comminuted proximal humerus fractures.
Technique
Presented in Figure 1 are preoperative images of a representative displaced 4-part proximal humerus fracture treated surgically using the technique described here. General anesthesia is used. After intubation on the operating table, the patient is placed in the beach-chair position with about 75° of hip flexion. All bony prominences are padded, and the head and trunk are well secured. A pneumatic arm positioner is used to alleviate the need for an assistant to manipulate the arm. An image intensifier is used before preparing to verify that appropriate images of the proximal humerus can be obtained. Once adequate images are confirmed, the floor can be marked at the position of the fluoroscopic unit’s wheels to allow easy reproduction of images once the arm is prepared and draped. The intensifier is then removed from the field, the shoulder is prepared and draped in usual fashion, and prophylactic antibiotics are administered.
A deltopectoral incision is used, and sharp dissection is made through the subcutaneous tissue to raise full-thickness subcutaneous flaps on each side. The deltopectoral interval is sharply dissected while protecting the cephalic vein. Subdeltoid adhesions are then released. Palpation of the axillary nerve in the quadrilateral space to identify its location is helpful to avoid injury during the procedure.
The fracture is then identified, and No. 5 permanent suture is placed through the posterior and superior rotator cuff and through the subscapularis insertion (Figure 2). The tuberosities are freed from the humeral head sharply. A blunt elevator is then used to gently elevate the humeral head upward, with care taken to avoid comminuting the metaphyseal bone while levering. Reduction is achieved by manipulating the sutures and levering the head with the elevator while placing the arm in extension and posterior translation. Fluoroscopic images are used to verify correct anatomical alignment. Generally, the metaphysis demonstrates comminution and impaction, with poor bone quality necessitating use of bone graft.
A frozen allograft femoral head is then obtained and split into 2 equal pieces using a saw (Figures 3–5). One piece is fashioned with a saw and a burr into a trapezoid such that the proximal portion is wider, and the distal, tapered portion is sized to fit the canal. The broad, proximal portion of the graft will serve as a pedestal to reduce the head to the shaft. Measuring the internal diameter of the humeral canal can be useful in estimating the necessary dimensions of the distal portion of the allograft. The graft often needs several small adjustments that necessitate attempting to place it in the intramedullary canal and then trimming as necessary to ensure proper fit distally within the shaft. For this reason, it is beneficial to perform the graft preparation near the surgical field. Once completed, the distal portion is then impacted into the humeral canal (Figure 6). Because of this impaction, there is no possibility for subsidence or pistoning of the graft within the canal, which can occur with a fibular graft. The humeral head is reduced onto the shaft with the already placed sutures; this is achieved by abducting the shoulder. The image intensifier is then used to confirm appropriate alignment and positioning of the fragments, making sure that both neck–shaft angle and medial calcar alignment have been restored (Figures 7, 8).
An appropriately sized proximal humerus plate is then selected based on the location of the fracture line. We have used standard lateral proximal humerus locking plates as well as laterality-specific anterolateral proximal humerus plates and found that both are suitable for incorporation of the screws through the graft and into the head. The plate is positioned on the humerus, and a guide pin is placed by hand through the proximal-most hole so that the appropriate height of the plate can be verified on fluoroscopy. The first screw is then a nonlocking bicortical screw placed through the oval hole in the shaft of the plate to allow further fine manipulation of the plate more proximally or distally as needed. The final height is confirmed, and the screw is firmly tightened (Figure 9). The locking-screw guide is fixed to the proximal portion of the plate, and 2 locking screws are then placed into the head. The arm is then rotated to an anteroposterior view by placing the arm in external rotation and neutral flexion and is then abducted and internally rotated to recreate a lateral view to perform final verification of the position of the plate on orthogonal images. If the surgeon is satisfied with the position of the plate, another nonlocking screw is placed distally, and then the proximal holes are used to place locking screws as needed. If the surgeon is not satisfied, the 2 proximal screws can be removed and the plate repositioned.
After each screw is placed, fluoroscopy is used to ensure there has been no breach of the articular surface. The number of proximal screws placed depends on fracture configuration and surgeon preference.
The sutures through the rotator cuff are then fixed to the plate, securing the tuberosities. Final intraoperative radiographs are used to confirm reduction, alignment, and final position of hardware (Figure 10). After copious irrigation, a surgical drain is placed as needed, and the wound is closed in layered fashion. Three years after surgery, follow-up examination revealed no radiographic change in alignment, no necrosis, and no varus collapse (Figure 11), and the patient was pain-free during activities.
Discussion
Surgical treatment of comminuted proximal humerus fractures usually consists of some type of plate fixation with screw fixation of the shaft, screws or smooth pegs to support the chondral surfaces, and screw fixation or suture cerclage of the tuberosities.
Fixed-angle locking-plate-and-screw constructs increased the biomechanical stability and pullout strength of proximal humerus plates.3,4 Nevertheless, avascular necrosis, malunion, and nonunion are still known complications of proximal humerus fractures, especially those with comminution, with up to 14% of patients still experiencing loss of fixation.5
For this reason, several authors have proposed using allograft bone and/or augmentation with calcium-containing cement to supplement fixation and provide an endosteal form of support for the head and tuberosities to decrease the risk for varus collapse. Osteobiologics (eg, calcium phosphate or sulfate cement) have been shown to decrease the risk for loss of reduction of proximal humerus fractures and decrease the risk for intra-articular screw penetration.6,7 Many calcium phosphate cements are commercially available. Cost and availability are 2 reasons that these supplements are not more widely used. Cancellous chips have also been used to aid in the reduction of proximal humerus fractures.8 No randomized study has been conducted to show a clinical advantage of this technique, though retrospective studies have shown that it is not as advantageous as using calcium phosphate cement with respect to loss of reduction or screw penetration.6 Certainly, cancellous chips are easily available in most hospitals and are less expensive than some alternatives. A recent review of these techniques in osteoporotic proximal humerus fractures found no clear indication for using one of these supplements over another.9
However, some fracture patterns require a structural graft to reduce the tuberosities and head component. Although described more than 30 years ago as a treatment for nonunions with an intramedullary “peg” of iliac crest graft,10 the graft most commonly reported today is allograft fibula.11-15 This technique consists of preparing the humeral shaft and often the fractured head segment with reaming to create a channel to receive the graft. Even with use of a small fibula, it is often time-consuming to use a saw, rasp, or burr to size the fibular segment to fit the medullary canal of the humerus. Once in place, the graft provides a strut on which the head fragment can be reduced and around which the tuberosities can be reduced. Although this technique is successful clinically and is biomechanically superior to plate-only constructs,16,17 concerns remain.
One such concern is keeping this graft in routine supply at most hospitals. Supply and pricing from vendors can differ significantly between hospitals, and a surgeon may need to request grafts in advance, which makes their use nonviable in a trauma case. Certain grafts are often kept in routine supply based on their overall utilization. At our institution, allograft femoral heads meet this criterion and are routinely stocked.
Of more importance are the ramifications of these procedures for future revision surgeries. The need for arthroplasty revision is common after ORIF of a proximal humerus fracture.18
Arthroplasty revision is an already challenging procedure that becomes more complex with the need to remove 6 to 8 cm of ingrown endosteal bone from a shell of outer osteoporotic cortical bone. Our experience with these complex revisions provided the impetus to search for an alternate graft type that still provides a strut for reducing the head and tuberosities but limits the amount of endosteal bone that would need to be removed in arthroplasty revision in order to place a stemmed component into the humeral canal.
Some currently available arthroplasty fracture systems modify the previous anatomy of the stem to provide a more anatomical platform to reduce the tuberosities to a broader metaphyseal construct that incorporates bone grafting to assist with healing.
Because of these concerns and factors, we adapted our technique to create an individual-specific pedestal with allograft femoral head that can be anatomically matched to each patient. This provides a strut to reduce the head and tuberosity fragments but still limits the amount of allograft bone needed to seat into the existing canal. The geometry of the allograft can also be customized to the fracture, with most 3- and 4-part fractures needing a trapezoidal strut that resembles the metaphyseal portion of a fracture-specific shoulder arthroplasty implant.
We have used this technique for comminuted 3- and 4-part fractures of the proximal humerus in 14 cases with at least 2-year follow-up and in several more cases that have not reached 2-year follow-up. All cases have gone on to radiographic union; none have had to be revised either with revision ORIF or to an arthroplasty. Formal measurements of final postoperative range of motion have not been tabulated in all cases, as some cases have been lost to follow-up after radiographic union was achieved. Medium- and long-term results are not yet available, but no short-term complications have been noted.
Disadvantages of this technique are that, while an individualized graft is created, proper shaping still takes time, and a moderate amount of the femoral head is not used. However, we have found that, if a graft is inadvertently undersized, there is still ample femoral head remaining to create another sized graft. Other disadvantages are the added cost and the (rare) risk of disease transmission, which come with use of any allograft, but the technique is used instead of another type of allograft, so these disadvantages are largely equivalent. At our hospital, differences in cost and availability between femoral head or fibular allografts are negligible.
This procedure, which is easily performed in a short amount of time, allows a stable base of bone graft to be used as an aid in the anatomical reduction of proximal humerus fractures, without the need for reaming and preparation of the medullary canal and without further increasing the difficulty associated with a future revision procedure.
1. Barrett JA, Baron JA, Karagas MR, Beach ML. Fracture risk in the U.S. Medicare population. J Clin Epidemiol. 1999;52(3):243-249.
2. Neer CS 2nd. Displaced proximal humeral fractures. I. Classification and evaluation. J Bone Joint Surg Am. 1970;52(6):1077-1089.
3. Liew AS, Johnson JA, Patterson SD, King GJ, Chess DG. Effect of screw placement on fixation in the humeral head. J Shoulder Elbow Surg. 2000;9(5):423-426.
4. Weinstein DM, Bratton DR, Ciccone WJ 2nd, Elias JJ. Locking plates improve torsional resistance in the stabilization of three-part proximal humeral fractures. J Shoulder Elbow Surg. 2006;15(2):239-243.
5. Agudelo J, Schurmann M, Stahel P, et al. Analysis of efficacy and failure in proximal humerus fractures treated with locking plates. J Orthop Trauma. 2007;21(10):676-681.
6. Egol KA, Sugi MT, Ong CC, Montero N, Davidovitch R, Zuckerman JD. Fracture site augmentation with calcium phosphate cement reduces screw penetration after open reduction-internal fixation of proximal humeral fractures. J Shoulder Elbow Surg. 2012;21(6):741-748.
7. Gradl G, Knobe M, Stoffel M, Prescher A, Dirrichs T, Pape HC. Biomechanical evaluation of locking plate fixation of proximal humeral fractures augmented with calcium phosphate cement. J Orthop Trauma. 2013;27(7):399-404.
8. Ong CC, Kwon YW, Walsh M, Davidovitch R, Zuckerman JD, Egol KA. Outcomes of open reduction and internal fixation of proximal humerus fractures managed with locking plates. Am J Orthop. 2012;41(9):407-412.
9. Namdari S, Voleti PB, Mehta S. Evaluation of the osteoporotic proximal humeral fracture and strategies for structural augmentation during surgical treatment. J Shoulder Elbow Surg. 2012;21(12):1787-1795.
10. Scheck M. Surgical treatment of nonunions of the surgical neck of the humerus. Clin Orthop Relat Res. 1982;(167):255-259.
11. Hettrich CM, Neviaser A, Beamer BS, Paul O, Helfet DL, Lorich DG. Locked plating of the proximal humerus using an endosteal implant. J Orthop Trauma. 2012;26(4):212-215.
12. Neviaser AS, Hettrich CM, Beamer BS, Dines JS, Lorich DG. Endosteal strut augment reduces complications associated with proximal humeral locking plates. Clin Orthop Relat Res. 2011;469(12):3300-3306.
13. Gardner MJ, Boraiah S, Helfet DL, Lorich DG. Indirect medial reduction and strut support of proximal humerus fractures using an endosteal implant. J Orthop Trauma. 2008;22(3):195-200.
14. Matassi F, Angeloni R, Carulli C, et al. Locking plate and fibular allograft augmentation in unstable fractures of proximal humerus. Injury. 2012;43(11):1939-1942.
15. Little MT, Berkes MB, Schottel PC, et al. The impact of preoperative coronal plane deformity on proximal humerus fixation with endosteal augmentation. J Orthop Trauma. 2014;28(6):338-347.
16. Mathison C, Chaudhary R, Beaupre L, Reynolds M, Adeeb S, Bouliane M. Biomechanical analysis of proximal humeral fixation using locking plate fixation with an intramedullary fibular allograft. Clin Biomech. 2010;25(7):642-646.
17. Chow RM, Begum F, Beaupre LA, Carey JP, Adeeb S, Bouliane MJ. Proximal humeral fracture fixation: locking plate construct +/- intramedullary fibular allograft. J Shoulder Elbow Surg. 2012;21(7):894-901.
18. Jost B, Spross C, Grehn H, Gerber C. Locking plate fixation of fractures of the proximal humerus: analysis of complications, revision strategies and outcome. J Shoulder Elbow Surg. 2013;22(4):542-549.
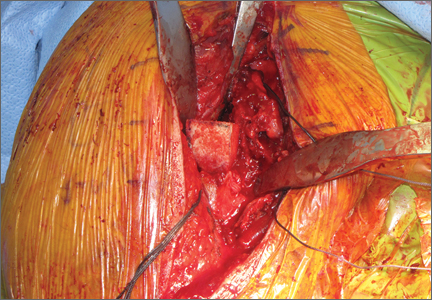
Treatment of Acetabular Fractures in Adolescents
In children, pelvic fractures are uncommon, with an incidence ranging from 1% to 4.6% of all pediatric fractures,1-4 and acetabular fractures make up only 0.8% to 15% of pelvic fractures.1,3,5,6 Acetabular fractures are so uncommon in children partly because of the cartilaginous nature of the immature acetabulum. The increased cartilage volume relative to adults provides greater capacity for energy absorption, resulting in greater elastic and plastic deformation before fracture occurrence. More force is therefore required to cause a fracture, and associated visceral injuries, head injuries, and long-bone fractures are common.3,7,8
The impact of acetabular fractures on adolescents warrants special attention because any resulting disability will affect them during their most productive years. Both avascular necrosis (AVN) and degenerative arthritis are particularly devastating complications in this age group. Complications such as premature physeal closure9-15 are unique to adolescents, and there is little information available on how injury in older children affects growth in this area.
There have been very few studies of the outcomes of these injuries in children. Mostly, there have been case reports and small series primarily dealing with nonoperative management of acetabular fractures in adolescents.3,10,11,16-20 By contrast, operative treatment of acetabular fractures in adults has been well described, and outcomes widely reported. As a result, much of our knowledge about managing these injuries is extrapolated from the adult literature. Although treatment of acetabular fractures in adults has evolved substantially, treatment of these injuries in adolescents remains primarily nonoperative. We conducted a study to evaluate outcomes of treatment of adolescent acetabular fractures.
Patients and Methods
After obtaining institutional review board approval for this study, we retrospectively reviewed the cases of all adolescent patients admitted with a diagnosis of acetabular fracture to 2 academic institutions between 1991 and 2003. Thirty-eight patients (28 males, 10 females) were identified. Mean age at time of injury was 15 years (range, 11-18 years). Mean follow-up was 3.2 years (range, 5-180 months).
Data on fracture types, treatment methods, associated injuries, complications, union rates, pain, and return to normal activities were collected. Acetabular fractures were classified according to the system of Letournel and Judet.21 There were 20 elementary and 18 associated fractures.
Of the 38 patients, 30 sustained high-energy trauma in motor vehicle accidents (25) or in falls from significant heights (5). The other 8 patients injured themselves playing sports (4 had severe traumatic brain injury, 2 had labial wounds, and 2 had injuries involving the abdominal viscera). Twelve patients had associated pelvic ring injuries, 18 had femoral head dislocations, 2 had femoral head fractures, and 13 had evidence of impaction injury to the femoral head articular cartilage. Twelve patients had marginal impaction of the acetabular wall. Fifteen patients had open triradiate physes at time of injury (Table 1).
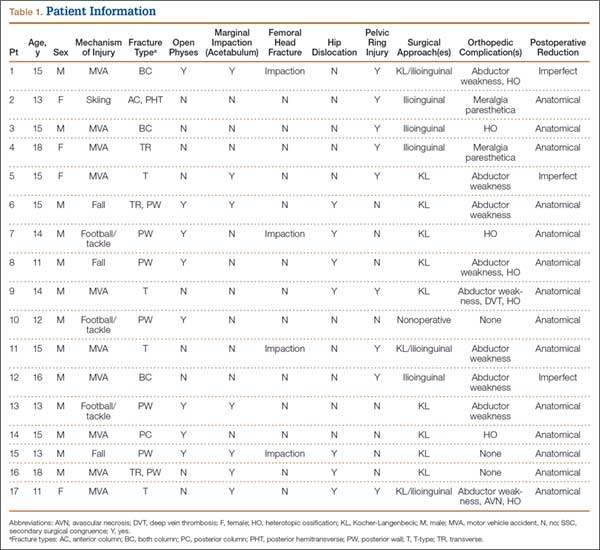
Thirty-seven of the 38 patients were treated with open reduction and internal fixation (ORIF) by an experienced orthopedic trauma surgeon; 1 patient with a stable posterior wall fracture was treated nonoperatively. Surgical indications were articular displacement of more than 1 mm, hip joint instability, irreducible hip dislocation, and intra-articular fracture fragments. In the 37 surgically treated cases, the approaches used were Kocher-Langenbeck (22), ilioinguinal (8), combined Kocher-Langenbeck/ilioinguinal (5), and triradiate (2).
Immediate postoperative radiographs were evaluated by 3 orthopedic surgeons blinded to the patients’ clinical outcomes. Displacement was evaluated on anteroposterior (AP) and Judet views of the pelvis, as described by Matta,22 and reductions were classified as anatomical (0-1 mm of displacement), imperfect (>1 to 3 mm), poor (>3 mm), or surgical secondary congruence (Table 2).
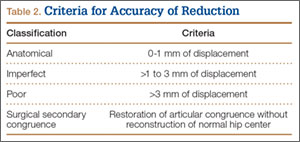
Results
Thirty-seven patients underwent acetabular fracture ORIF. Immediate postoperative radiographs showed 30 anatomical reductions and 7 imperfect reductions. One patient had surgical secondary congruence and developed AVN of the hip. We could not identify an association between the quality of the reduction and the outcome with respect to pain or return to activity. However, no patient had a poor reduction. An illustrative case is presented in Figures 1 to 4.
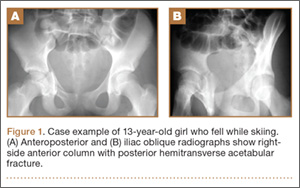
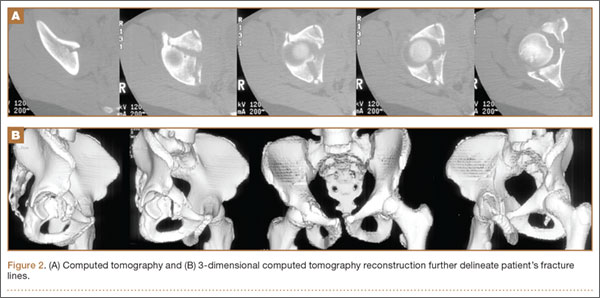
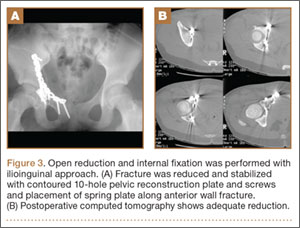
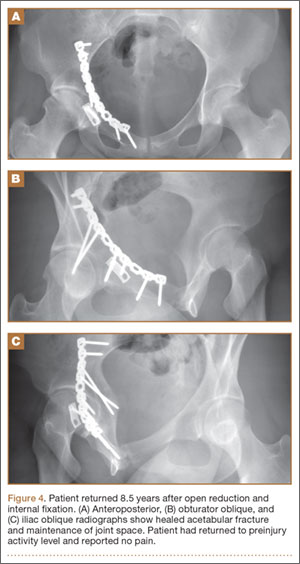
All acetabular fractures united within 4.5 months (range, 3.0-8.0 months) after the index procedure. Early postoperative complications included 3 cases of meralgia paresthetica and 13 cases of abductor weakness. Meralgia paresthetica resolved spontaneously in all 3 patients. Of the 13 patients with abductor weakness, 11 improved with physical therapy, 1 was limited by the head injury, and 1 subsequently underwent hip fusion. One patient had a deep vein thrombosis (DVT) that was identified before surgery and managed with warfarin.
Other complications included 1 case of deep infection of the surgical wound. This infection presented 4 months after surgery and was treated with débridement, hardware removal, and a 3-month course of antibiotics. Two patients who sustained hip dislocations at time of injury developed AVN of the femoral head. Both developed osteoarthritis, and 1 underwent hip fusion. Eight patients developed heterotopic ossification on the side of the acetabular fracture; 4 of them underwent surgical excision. Four patients required a separate operation for hardware removal. Four patients with triradiate cartilage involvement went on to premature closure. No patient had any leg-length discrepancy or dysplasia at time of follow-up.
Thirty-four of the 38 patients returned to their regular activities. For these patients, mean time to return to full activity was 7.0 months (range, 3-30 months); there was no difference in mean time to return to full activity between skeletally mature and skeletally immature patients (6.6 vs 7.4 months; P = .57). Of the other 4 patients, 1 had permanent cognitive and physical disability with an ataxic gait as a result of a traumatic brain injury, 2 were limited by AVN (1 underwent hip fusion), and 1 was limited by an ipsilateral knee injury.
Of the 38 patients, 29 were pain-free; 6 had occasional, intermittent mild pain that did not limit their activities; and 3 had severe, activity-limiting pain. Of the 6 patients with mild pain, 2 had femoral impaction injuries, and 4 had marginal impaction injuries. Of the 3 patients with severe pain, 2 developed femoral head AVN, and 1 had multiple ipsilateral extremity injuries involving the femur, knee, and tibia.
Discussion
The traditional treatment for acetabular fractures in children has been nonoperative,8,10 and there are few specific treatment guidelines.13 Recent recommendations are nonoperative treatment for minimally displaced fractures (<1 mm) and acetabular fracture ORIF for fractures displaced more than 2 mm.11 No clear consensus exists on management for fractures displaced 1 to 2 mm. Few studies have investigated the outcomes of operative management of these fractures in the pediatric or adolescent population.
In our series of adolescent acetabular fractures, we examined unions, complications, and return to activity. Of 38 patients with acetabular fractures, 37 were treated with ORIF. Anatomical reduction was achieved in the majority of patients. Posterior wall fractures were by far the most common fracture type, which is consistent with previous reports.10,11 All acetabular fractures united, and most patients were pain-free at latest follow-up. There was a low incidence of major complications in our patient population. One major complication was a DVT in a 14-year-old boy who was in a motor vehicle accident and sustained a T-type fracture of the right acetabulum with contralateral femoral shaft and ankle fractures. The DVT was in the right internal iliac and common femoral veins and was diagnosed on magnetic resonance venography. The patient was treated with warfarin for 3 months without incident.
Two patients developed AVN of the femoral head. One of these patients was an 11-year-old girl who was in a motor vehicle accident and sustained a T-type fracture with marginal impaction of the posterior wall, posterior hip dislocation, and a pelvic ring injury. She was treated with ORIF through combined Kocher-Langenbeck/ilioinguinal approaches. By 4 months after surgery, the acetabular fracture was united. Nine months after surgery, she still had pain (activity-limiting) and a 35° flexion contracture of the hip, and she was ambulating with a cane. The diagnosis was AVN of the hip. The patient underwent hip fusion 1 year after surgery.
The second patient with femoral head AVN was a 12-year-old boy who fell while skiing and sustained a fracture of the posterior wall and a hip dislocation with impaction of the femoral head. Initial treatment at an outside institution consisted of open reduction of the hip and excision of a “loose body” from the joint. Eight weeks after surgery, the patient continued to have pain and was referred to our institution. A second operation was performed. Findings included a defect involving 40% of the posterior wall, and signs that the posterior wall had been excised during the initial operation. The patient eventually developed AVN of the hip. This patient was also diagnosed with a deep wound infection 4 months after surgery. He presented with pain and a fluid collection around the hip. The infection was not confirmed through fluid culture, and, as he eventually developed AVN of the hip, his symptoms may have been the result of chondrolysis or AVN rather than infection.
There were no cases of nonunion or malunion, leg-length discrepancy, or permanent sciatic nerve palsy. Although there were a few cases of premature closure of the triradiate cartilage, no acetabular dysplasia was seen at latest follow-up, likely because of the relative maturity of our pediatric group (age range, 11-18 years). Age at time of injury is thought to be the most important factor influencing growth and development of the acetabulum.9,13 In addition, previous studies have demonstrated a tendency toward acetabular fractures in patients with mature triradiate cartilage—versus pelvic ring injuries in patients with immature triradiate cartilage.8,11 This may also account for the older age of our study group.
Minor complications (eg, meralgia paresthetica) resolved spontaneously. The most common complications were abductor weakness and heterotopic ossification. In only 4 cases was a secondary procedure for excision of the heterotopic bone required. Abductor weakness, more commonly associated with a Kocher-Langenbeck approach to the hip, resolved with therapy in almost all cases. Only 4 of our patients required removal of hardware from the acetabulum.
Although the majority of acetabular fractures resulted from high-energy trauma, 8 cases were sports-related. Six of these involved posterior wall fractures, suggesting the injury resulted from a fall on flexed knee and hip. This was not known to be a common mechanism of injury in this age group.3,7 An additional concern was how to size the posterior wall fragment when not ossified. At one center, preoperative magnetic resonance imaging (MRI) was effectively used to size the osteochondral posterior wall fragment as standard protocol for patients with posterior wall fractures in this age group—resulting in better decisions regarding the need for ORIF. At the other institution, preoperative MRI was not performed routinely for this subset of patients.
Thirty-four of our 38 patients returned to their normal activities. Of the other 4 patients, 1 was permanently disabled secondary to traumatic brain injury, 1 had other ipsilateral extremity injuries that limited his mobility, and 2 developed AVN of the femoral head. Both patients with AVN had hip dislocations. Four of the 6 patients who were symptomatic during activity sustained impaction injuries of the femoral head or posterior wall. This suggests that poorer outcomes may be associated with dislocation or with articular injuries—similar to what has been reported in the adult literature.
This study had several limitations. First, it was a retrospective case series, so there was no control group for comparison. Second, the relatively short follow-up did not allow evaluation of the incidence of degenerative arthritis secondary to articular injury, the symptoms of which may develop 1 to 2 decades after injury.13 This phenomenon was well described by Letournel and Judet21 in the adult population, and there is no reason to presume the adolescent population is any different. Third, our sample was small and unlikely to represent a uniform sampling of the general pediatric population. Fourth, it was not possible to draw detailed conclusions about the outcome of ORIF for a particular type of acetabular fracture. Fifth, we did not see as many of the associated visceral injuries that are so prevalent in the literature. This may reflect improvement in safety specifications for automobiles, or our group may not have had the most severe or high-energy injuries. Here our population sample may have skewed our results, leading to better than expected outcomes.
One last study limitation, a major one, was the age of our population, 11 to 18 years, which makes it difficult to extrapolate results to the entire pediatric population. On one hand, a more immature skeleton has a higher chance of remodeling and is more forgiving of deformities and small amounts of displacement. On the other hand, injury and premature triradiate cartilage fusion in a younger patient can lead to significant deformity and acetabular dysplasia.9 Whether ORIF of these fractures would alter the outcome of an injury to the triradiate cartilage is yet to be determined.
Conclusion
In agreement with earlier studies,10,11,15,18 the good outcomes in our series correlated with congruence of reduction. Outcome predictors such as dislocation, femoral head injury, and marginal impaction are similar to those described in the adult literature. Although our study did not have a nonoperative group for comparison, the favorable outcomes of ORIF of acetabular fractures suggest that a more aggressive approach to treatment should be considered. Given the added benefits of early, pain-free mobilization, we think that only stable, undisplaced fractures (<1 mm) should be managed nonoperatively. In the adolescent population, we recommend ORIF for optimal management of unstable acetabular fractures, fractures with any hip subluxation, and fractures displaced more than 1 mm.
1. Canale ST, Beaty JH. Fractures of the pelvis. In: Beaty JH, Kassler JR, eds. Rockwood and Wilkin’s Fractures in Children. Philadelphia, PA: Lippincott Williams & Wilkins; 2001:883-991.
2. Demetriades D, Karaiskakis M, Velmahos GC, Alo K, Murray J, Chan L. Pelvic fractures in pediatric and adult trauma patients: are they different injuries? J Trauma. 2003;54(6):1146-1151.
3. Grisoni N, Connor S, Marsh E, Thompson GH, Cooperman DR, Blakemore LC. Pelvic fractures in a pediatric level I trauma center. J Orthop Trauma. 2002;16(7):458-463.
4. Ismail N, Bellemare JF, Mollitt DL, Di Scala C, Koeppel B, Tepas JJ. Death from pelvic fracture: children are different. J Pediatr Surg. 1996;31(1):82-85.
5. Schlickwei W, Keck T. Pelvic and acetabular fractures in childhood. Injury. 2005;36(suppl 1):A57-A63.
6. Swiontkowski MF. Fractures and dislocations about the hip and pelvis. In: Green NE, Swiontkowski MF, eds. Skeletal Trauma in Children. Philadelphia, PA: Saunders; 2003:371-406.
7. Silber JS, Flynn JM, Koffler KM, Dormans JP, Drummond DS. Analysis of the cause, classification, and associated injuries of 166 consecutive pediatric pelvic fractures. J Pediatr Orthop. 2001;21(4):446-450.
8. Silber JS, Flynn JM. Changing patterns of pediatric pelvic fractures with skeletal maturation: implications for classification and management. J Pediatr Orthop. 2002;22(1):22-26.
9. Bucholz RW, Ezaki M, Ogden JA. Injury to the acetabular triradiate physeal cartilage. J Bone Joint Surg Am. 1982;64(4):600-609.
10. Heeg M, Klasen HJ, Visser JD. Acetabular fractures in children and adolescents. J Bone Joint Surg Br. 1989;71(3):418-421.
11. Heeg M, de Ridder VA, Tornetta P, de Lange S, Klasen HJ. Acetabular fractures in children and adolescents. Clin Orthop Relat Res. 2000;(376):80-86.
12. Heeg M, Visser JD, Oostvogel HJ. Injuries of the acetabular triradiate cartilage and sacroiliac joint. J Bone Joint Surg Br. 1988;70(1):34-37.
13. Liporace FA, Ong B, Mohaideen A, Ong A, Koval KJ. Development and injury of the triradiate cartilage with its effects on acetabular development: review of the literature. J Trauma. 2003;54(6):1245-1249.
14. Rodrigues KF. Injury of the acetabular epiphysis. Injury. 1973;4(3):258-260.
15. Trousdale RT, Ganz R. Posttraumatic acetabular dysplasia. Clin Orthop Relat Res. 1994;(305):124-132.
16. Brooks E, Rosman M. Central fracture-dislocation of the hip in a child. J Trauma. 1988;28(11):1590-1592.
17. Habacker TA, Heinrich SD, Dehne R. Fracture of the superior pelvic quadrant in a child. J Pediatr Orthop. 1995;15(1):69-72.
18. Karunakar MA, Goulet JA, Mueller KL, Bedi A, Le TT. Operative treatment of unstable pediatric pelvis and acetabular fractures. J Pediatr Orthop. 2005;25(1):34-38.
19. Rieger H, Brug E. Fractures of the pelvis in children. Clin Orthop Relat Res. 1997;(336);226-239.
20. Torode I, Zieg D. Pelvic fractures in children. J Pediatr Orthop. 1985;5(1):76-84.
21. Letournel E, Judet R. Fractures of the Acetabulum. 2nd ed. New York, NY: Springer-Verlag; 1993.
22. Matta JM. Fractures of the acetabulum: accuracy of reduction and clinical results in patients managed operatively within three weeks of the injury. J Bone Joint Surg Am. 1996;78(11):1632-1645.
In children, pelvic fractures are uncommon, with an incidence ranging from 1% to 4.6% of all pediatric fractures,1-4 and acetabular fractures make up only 0.8% to 15% of pelvic fractures.1,3,5,6 Acetabular fractures are so uncommon in children partly because of the cartilaginous nature of the immature acetabulum. The increased cartilage volume relative to adults provides greater capacity for energy absorption, resulting in greater elastic and plastic deformation before fracture occurrence. More force is therefore required to cause a fracture, and associated visceral injuries, head injuries, and long-bone fractures are common.3,7,8
The impact of acetabular fractures on adolescents warrants special attention because any resulting disability will affect them during their most productive years. Both avascular necrosis (AVN) and degenerative arthritis are particularly devastating complications in this age group. Complications such as premature physeal closure9-15 are unique to adolescents, and there is little information available on how injury in older children affects growth in this area.
There have been very few studies of the outcomes of these injuries in children. Mostly, there have been case reports and small series primarily dealing with nonoperative management of acetabular fractures in adolescents.3,10,11,16-20 By contrast, operative treatment of acetabular fractures in adults has been well described, and outcomes widely reported. As a result, much of our knowledge about managing these injuries is extrapolated from the adult literature. Although treatment of acetabular fractures in adults has evolved substantially, treatment of these injuries in adolescents remains primarily nonoperative. We conducted a study to evaluate outcomes of treatment of adolescent acetabular fractures.
Patients and Methods
After obtaining institutional review board approval for this study, we retrospectively reviewed the cases of all adolescent patients admitted with a diagnosis of acetabular fracture to 2 academic institutions between 1991 and 2003. Thirty-eight patients (28 males, 10 females) were identified. Mean age at time of injury was 15 years (range, 11-18 years). Mean follow-up was 3.2 years (range, 5-180 months).
Data on fracture types, treatment methods, associated injuries, complications, union rates, pain, and return to normal activities were collected. Acetabular fractures were classified according to the system of Letournel and Judet.21 There were 20 elementary and 18 associated fractures.
Of the 38 patients, 30 sustained high-energy trauma in motor vehicle accidents (25) or in falls from significant heights (5). The other 8 patients injured themselves playing sports (4 had severe traumatic brain injury, 2 had labial wounds, and 2 had injuries involving the abdominal viscera). Twelve patients had associated pelvic ring injuries, 18 had femoral head dislocations, 2 had femoral head fractures, and 13 had evidence of impaction injury to the femoral head articular cartilage. Twelve patients had marginal impaction of the acetabular wall. Fifteen patients had open triradiate physes at time of injury (Table 1).
Thirty-seven of the 38 patients were treated with open reduction and internal fixation (ORIF) by an experienced orthopedic trauma surgeon; 1 patient with a stable posterior wall fracture was treated nonoperatively. Surgical indications were articular displacement of more than 1 mm, hip joint instability, irreducible hip dislocation, and intra-articular fracture fragments. In the 37 surgically treated cases, the approaches used were Kocher-Langenbeck (22), ilioinguinal (8), combined Kocher-Langenbeck/ilioinguinal (5), and triradiate (2).
Immediate postoperative radiographs were evaluated by 3 orthopedic surgeons blinded to the patients’ clinical outcomes. Displacement was evaluated on anteroposterior (AP) and Judet views of the pelvis, as described by Matta,22 and reductions were classified as anatomical (0-1 mm of displacement), imperfect (>1 to 3 mm), poor (>3 mm), or surgical secondary congruence (Table 2).
Results
Thirty-seven patients underwent acetabular fracture ORIF. Immediate postoperative radiographs showed 30 anatomical reductions and 7 imperfect reductions. One patient had surgical secondary congruence and developed AVN of the hip. We could not identify an association between the quality of the reduction and the outcome with respect to pain or return to activity. However, no patient had a poor reduction. An illustrative case is presented in Figures 1 to 4.
All acetabular fractures united within 4.5 months (range, 3.0-8.0 months) after the index procedure. Early postoperative complications included 3 cases of meralgia paresthetica and 13 cases of abductor weakness. Meralgia paresthetica resolved spontaneously in all 3 patients. Of the 13 patients with abductor weakness, 11 improved with physical therapy, 1 was limited by the head injury, and 1 subsequently underwent hip fusion. One patient had a deep vein thrombosis (DVT) that was identified before surgery and managed with warfarin.
Other complications included 1 case of deep infection of the surgical wound. This infection presented 4 months after surgery and was treated with débridement, hardware removal, and a 3-month course of antibiotics. Two patients who sustained hip dislocations at time of injury developed AVN of the femoral head. Both developed osteoarthritis, and 1 underwent hip fusion. Eight patients developed heterotopic ossification on the side of the acetabular fracture; 4 of them underwent surgical excision. Four patients required a separate operation for hardware removal. Four patients with triradiate cartilage involvement went on to premature closure. No patient had any leg-length discrepancy or dysplasia at time of follow-up.
Thirty-four of the 38 patients returned to their regular activities. For these patients, mean time to return to full activity was 7.0 months (range, 3-30 months); there was no difference in mean time to return to full activity between skeletally mature and skeletally immature patients (6.6 vs 7.4 months; P = .57). Of the other 4 patients, 1 had permanent cognitive and physical disability with an ataxic gait as a result of a traumatic brain injury, 2 were limited by AVN (1 underwent hip fusion), and 1 was limited by an ipsilateral knee injury.
Of the 38 patients, 29 were pain-free; 6 had occasional, intermittent mild pain that did not limit their activities; and 3 had severe, activity-limiting pain. Of the 6 patients with mild pain, 2 had femoral impaction injuries, and 4 had marginal impaction injuries. Of the 3 patients with severe pain, 2 developed femoral head AVN, and 1 had multiple ipsilateral extremity injuries involving the femur, knee, and tibia.
Discussion
The traditional treatment for acetabular fractures in children has been nonoperative,8,10 and there are few specific treatment guidelines.13 Recent recommendations are nonoperative treatment for minimally displaced fractures (<1 mm) and acetabular fracture ORIF for fractures displaced more than 2 mm.11 No clear consensus exists on management for fractures displaced 1 to 2 mm. Few studies have investigated the outcomes of operative management of these fractures in the pediatric or adolescent population.
In our series of adolescent acetabular fractures, we examined unions, complications, and return to activity. Of 38 patients with acetabular fractures, 37 were treated with ORIF. Anatomical reduction was achieved in the majority of patients. Posterior wall fractures were by far the most common fracture type, which is consistent with previous reports.10,11 All acetabular fractures united, and most patients were pain-free at latest follow-up. There was a low incidence of major complications in our patient population. One major complication was a DVT in a 14-year-old boy who was in a motor vehicle accident and sustained a T-type fracture of the right acetabulum with contralateral femoral shaft and ankle fractures. The DVT was in the right internal iliac and common femoral veins and was diagnosed on magnetic resonance venography. The patient was treated with warfarin for 3 months without incident.
Two patients developed AVN of the femoral head. One of these patients was an 11-year-old girl who was in a motor vehicle accident and sustained a T-type fracture with marginal impaction of the posterior wall, posterior hip dislocation, and a pelvic ring injury. She was treated with ORIF through combined Kocher-Langenbeck/ilioinguinal approaches. By 4 months after surgery, the acetabular fracture was united. Nine months after surgery, she still had pain (activity-limiting) and a 35° flexion contracture of the hip, and she was ambulating with a cane. The diagnosis was AVN of the hip. The patient underwent hip fusion 1 year after surgery.
The second patient with femoral head AVN was a 12-year-old boy who fell while skiing and sustained a fracture of the posterior wall and a hip dislocation with impaction of the femoral head. Initial treatment at an outside institution consisted of open reduction of the hip and excision of a “loose body” from the joint. Eight weeks after surgery, the patient continued to have pain and was referred to our institution. A second operation was performed. Findings included a defect involving 40% of the posterior wall, and signs that the posterior wall had been excised during the initial operation. The patient eventually developed AVN of the hip. This patient was also diagnosed with a deep wound infection 4 months after surgery. He presented with pain and a fluid collection around the hip. The infection was not confirmed through fluid culture, and, as he eventually developed AVN of the hip, his symptoms may have been the result of chondrolysis or AVN rather than infection.
There were no cases of nonunion or malunion, leg-length discrepancy, or permanent sciatic nerve palsy. Although there were a few cases of premature closure of the triradiate cartilage, no acetabular dysplasia was seen at latest follow-up, likely because of the relative maturity of our pediatric group (age range, 11-18 years). Age at time of injury is thought to be the most important factor influencing growth and development of the acetabulum.9,13 In addition, previous studies have demonstrated a tendency toward acetabular fractures in patients with mature triradiate cartilage—versus pelvic ring injuries in patients with immature triradiate cartilage.8,11 This may also account for the older age of our study group.
Minor complications (eg, meralgia paresthetica) resolved spontaneously. The most common complications were abductor weakness and heterotopic ossification. In only 4 cases was a secondary procedure for excision of the heterotopic bone required. Abductor weakness, more commonly associated with a Kocher-Langenbeck approach to the hip, resolved with therapy in almost all cases. Only 4 of our patients required removal of hardware from the acetabulum.
Although the majority of acetabular fractures resulted from high-energy trauma, 8 cases were sports-related. Six of these involved posterior wall fractures, suggesting the injury resulted from a fall on flexed knee and hip. This was not known to be a common mechanism of injury in this age group.3,7 An additional concern was how to size the posterior wall fragment when not ossified. At one center, preoperative magnetic resonance imaging (MRI) was effectively used to size the osteochondral posterior wall fragment as standard protocol for patients with posterior wall fractures in this age group—resulting in better decisions regarding the need for ORIF. At the other institution, preoperative MRI was not performed routinely for this subset of patients.
Thirty-four of our 38 patients returned to their normal activities. Of the other 4 patients, 1 was permanently disabled secondary to traumatic brain injury, 1 had other ipsilateral extremity injuries that limited his mobility, and 2 developed AVN of the femoral head. Both patients with AVN had hip dislocations. Four of the 6 patients who were symptomatic during activity sustained impaction injuries of the femoral head or posterior wall. This suggests that poorer outcomes may be associated with dislocation or with articular injuries—similar to what has been reported in the adult literature.
This study had several limitations. First, it was a retrospective case series, so there was no control group for comparison. Second, the relatively short follow-up did not allow evaluation of the incidence of degenerative arthritis secondary to articular injury, the symptoms of which may develop 1 to 2 decades after injury.13 This phenomenon was well described by Letournel and Judet21 in the adult population, and there is no reason to presume the adolescent population is any different. Third, our sample was small and unlikely to represent a uniform sampling of the general pediatric population. Fourth, it was not possible to draw detailed conclusions about the outcome of ORIF for a particular type of acetabular fracture. Fifth, we did not see as many of the associated visceral injuries that are so prevalent in the literature. This may reflect improvement in safety specifications for automobiles, or our group may not have had the most severe or high-energy injuries. Here our population sample may have skewed our results, leading to better than expected outcomes.
One last study limitation, a major one, was the age of our population, 11 to 18 years, which makes it difficult to extrapolate results to the entire pediatric population. On one hand, a more immature skeleton has a higher chance of remodeling and is more forgiving of deformities and small amounts of displacement. On the other hand, injury and premature triradiate cartilage fusion in a younger patient can lead to significant deformity and acetabular dysplasia.9 Whether ORIF of these fractures would alter the outcome of an injury to the triradiate cartilage is yet to be determined.
Conclusion
In agreement with earlier studies,10,11,15,18 the good outcomes in our series correlated with congruence of reduction. Outcome predictors such as dislocation, femoral head injury, and marginal impaction are similar to those described in the adult literature. Although our study did not have a nonoperative group for comparison, the favorable outcomes of ORIF of acetabular fractures suggest that a more aggressive approach to treatment should be considered. Given the added benefits of early, pain-free mobilization, we think that only stable, undisplaced fractures (<1 mm) should be managed nonoperatively. In the adolescent population, we recommend ORIF for optimal management of unstable acetabular fractures, fractures with any hip subluxation, and fractures displaced more than 1 mm.
1. Canale ST, Beaty JH. Fractures of the pelvis. In: Beaty JH, Kassler JR, eds. Rockwood and Wilkin’s Fractures in Children. Philadelphia, PA: Lippincott Williams & Wilkins; 2001:883-991.
2. Demetriades D, Karaiskakis M, Velmahos GC, Alo K, Murray J, Chan L. Pelvic fractures in pediatric and adult trauma patients: are they different injuries? J Trauma. 2003;54(6):1146-1151.
3. Grisoni N, Connor S, Marsh E, Thompson GH, Cooperman DR, Blakemore LC. Pelvic fractures in a pediatric level I trauma center. J Orthop Trauma. 2002;16(7):458-463.
4. Ismail N, Bellemare JF, Mollitt DL, Di Scala C, Koeppel B, Tepas JJ. Death from pelvic fracture: children are different. J Pediatr Surg. 1996;31(1):82-85.
5. Schlickwei W, Keck T. Pelvic and acetabular fractures in childhood. Injury. 2005;36(suppl 1):A57-A63.
6. Swiontkowski MF. Fractures and dislocations about the hip and pelvis. In: Green NE, Swiontkowski MF, eds. Skeletal Trauma in Children. Philadelphia, PA: Saunders; 2003:371-406.
7. Silber JS, Flynn JM, Koffler KM, Dormans JP, Drummond DS. Analysis of the cause, classification, and associated injuries of 166 consecutive pediatric pelvic fractures. J Pediatr Orthop. 2001;21(4):446-450.
8. Silber JS, Flynn JM. Changing patterns of pediatric pelvic fractures with skeletal maturation: implications for classification and management. J Pediatr Orthop. 2002;22(1):22-26.
9. Bucholz RW, Ezaki M, Ogden JA. Injury to the acetabular triradiate physeal cartilage. J Bone Joint Surg Am. 1982;64(4):600-609.
10. Heeg M, Klasen HJ, Visser JD. Acetabular fractures in children and adolescents. J Bone Joint Surg Br. 1989;71(3):418-421.
11. Heeg M, de Ridder VA, Tornetta P, de Lange S, Klasen HJ. Acetabular fractures in children and adolescents. Clin Orthop Relat Res. 2000;(376):80-86.
12. Heeg M, Visser JD, Oostvogel HJ. Injuries of the acetabular triradiate cartilage and sacroiliac joint. J Bone Joint Surg Br. 1988;70(1):34-37.
13. Liporace FA, Ong B, Mohaideen A, Ong A, Koval KJ. Development and injury of the triradiate cartilage with its effects on acetabular development: review of the literature. J Trauma. 2003;54(6):1245-1249.
14. Rodrigues KF. Injury of the acetabular epiphysis. Injury. 1973;4(3):258-260.
15. Trousdale RT, Ganz R. Posttraumatic acetabular dysplasia. Clin Orthop Relat Res. 1994;(305):124-132.
16. Brooks E, Rosman M. Central fracture-dislocation of the hip in a child. J Trauma. 1988;28(11):1590-1592.
17. Habacker TA, Heinrich SD, Dehne R. Fracture of the superior pelvic quadrant in a child. J Pediatr Orthop. 1995;15(1):69-72.
18. Karunakar MA, Goulet JA, Mueller KL, Bedi A, Le TT. Operative treatment of unstable pediatric pelvis and acetabular fractures. J Pediatr Orthop. 2005;25(1):34-38.
19. Rieger H, Brug E. Fractures of the pelvis in children. Clin Orthop Relat Res. 1997;(336);226-239.
20. Torode I, Zieg D. Pelvic fractures in children. J Pediatr Orthop. 1985;5(1):76-84.
21. Letournel E, Judet R. Fractures of the Acetabulum. 2nd ed. New York, NY: Springer-Verlag; 1993.
22. Matta JM. Fractures of the acetabulum: accuracy of reduction and clinical results in patients managed operatively within three weeks of the injury. J Bone Joint Surg Am. 1996;78(11):1632-1645.
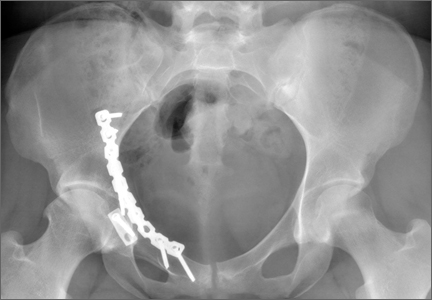
Hip Fracture and the Weekend Effect: Does Weekend Admission Affect Patient Outcomes?
Weekend admission has been hypothesized to be a risk factor for increased patient mortality and complications during hospital stays—commonly referred to as the weekend effect.1 Reduced hospital staffing on weekends, particularly of senior-level physicians and ancillary nursing services, may affect the quality of diagnosis and management for patients admitted for traumatic and emergent conditions. Investigators have found increased mortality in weekend admissions for stroke,2 subdural hematoma,3 gastrointestinal bleeding,4,5 atrial fibrillation,6 and pulmonary embolism.7 Investigators have not found increased mortality in weekend admissions for hip fracture, though the majority of the data was derived from European patient populations, which may be subject to management and staffing strategies different from those for US patients.8-10 Furthermore, data on this topic in US patients are limited to a multispecialty study of 50 different admission diagnoses, which used 1 year of data from a single US state.1
We conducted a study to comprehensively assess the effect of weekend admission on adverse outcomes during hospital stays. The literature suggests that surgery for hip fracture can be delayed up to 48 hours without significant additional risk of death,11-13 allowing orthopedic departments to stabilize routine hip fracture admissions on weekends and operate whenever limited surgical teams become available. Surgical delay has not been thoroughly analyzed by day of admission among US patients,14 but the combined potential of more conservative preoperative management and the availability of fewer senior physicians and ancillary providers may result in worse outcomes for weekend versus weekday admissions.
Materials and Methods
Study Population
Part of the Healthcare Cost and Utilization Project, the Nationwide Inpatient Sample (NIS) provides a 20% representative sample of annual US hospital admissions.15 For these admissions, the NIS includes data related to demographic and clinical variables, such as International Classification of Diseases, Ninth Revision, Clinical Modification (ICD-9-CM) diagnosis and procedure codes, as well as descriptive variables for the hospitals where the patients were admitted. The NIS is publicly available to researchers. As its health information is deidentified, we did not have to obtain institutional review board approval for this study.
Ascertainment of Cases
Our initial study population, drawn from the period 1998–2010, consisted of 821,531 patients with a principal ICD-9-CM diagnosis of femoral neck fracture (820.0-820.9). To best capture the typical presentation of hip fracture, we excluded:
- Patients with open femoral neck fractures (820.1, 820.3, 820.9).
- Patients who did not have open reduction and internal fixation (ORIF) (79.35), hemiarthroplasty (81.52), closed reduction and internal fixation (CRIF) (79.15), internal fixation (78.55), or total hip arthroplasty (THA) (81.51) as their primary surgical procedure.
- Patients admitted from sources other than the emergency department.
- Patients who underwent surgery before admission.
- Patients whose admission type was not classified as emergency or urgent.
Ascertainment of Covariates
For all patients, we extracted data on exposure of interest, day of admission (weekend or weekday), and demographic variables including age, sex, race (white, black, Hispanic, other, missing), and insurance (Medicare, Medicaid, private, other). We used the Elixhauser method to determine 30 different comorbidities from ICD-9-CM diagnosis coding16 and sorted patients by total number of comorbidities (0, 1, 2, 3 or 4, ≥5). As has been done before,17 we excluded blood loss anemia, coagulopathy, and fluid and electrolyte disorders from this comorbidity calculation, as these conditions can be secondary to trauma. We also extracted data on the admission itself, including hospital region (Northeast, Midwest, South, West), hospital bed size (small, medium, large), hospital teaching status (nonteaching, teaching), and hospital location (rural, urban). We used diagnosis codes to categorize fracture location as “not otherwise specified” (820.8), intracapsular (820.0), or extracapsular (820.2).
Because of low frequencies, we collapsed 2 race designations (Native American, Asian or Pacific Islander) into the “other race” category and 2 insurance designations (self-pay, no charge) into the “other insurance” category. For a substantial number of patients, race information was missing, so we included “missing” as its own category in analyses. Patients who were missing data on day of admission, age, sex, insurance, or hospital characteristics were excluded from our final cohort, as missing frequencies for each variable were small.
Ascertainment of Outcomes
For all patients, we extracted data on death status at discharge and length of hospital stay. We log-transformed length of stay because of its right skew, assigning the value of 12 hours to patients admitted and discharged the same day. Perioperative complications were calculated using ICD-9-CM codes as defined by a recent study of orthopedics-related complications by Lin and colleagues.18 There were 14 possible complications, including acute renal failure (584.5-9), tachycardia (427), wound hemorrhage (719.15, 998.31-2), wound disruption (998.3, 998.31-2), wound infection (682.6, 686.9, 891, 891.1-2, 894, 894.1-2, 998.5, 998.51, 998.6, 998.83, 998.59), deep vein thrombosis (453.4, 453.41-2, 453.9), acute myocardial infarction (410, 410.01, 410.11, 410.2, 410.21, 410.3, 410.31, 410.4, 410.41, 410.5, 410.51, 410.6, 410.9, 410.91, 997.1), pneumonia (480-480.9, 481, 482-482.9, 483, 483.1, 483.8, 484, 484.1, 484.3, 484.5-8, 485, 486, 487, 507), pulmonary embolism (415.11, 415.19), sepsis (995.91-2), stroke (997.02), urinary tract infection (599, 997.5), implant infection (996.66-7, 996.69), and incision and débridement (86.04, 86.09, 86.22, 86.28, 86.3). In our statistical analyses, we examined both the risk of having a complicated admission (≥1 perioperative complication) and the risk of having each specific complication.
Statistical Analysis
To assess similarity between weekend and weekday admissions, we used the Fisher exact test and χ2P values. Logistic regression was used to calculate the odds ratios (ORs) of mortality and perioperative complications for weekend versus weekday admissions. Linear regression was used to calculate parameter estimates for length of hospital stay for weekend versus weekday admissions. We interpreted parameter estimates as percentage differences using the formula 100(eb–1), where b is the estimated standardized regression coefficient of a log-transformed outcome variable.19 All regression models were controlled for age, sex, race, insurance, number of comorbidities, fracture location, hospital region, hospital bed size, hospital teaching status, and hospital location. We also stratified our study population by surgical delay in hours (<24, 24-48, 49-72, 73-120, ≥121) and by surgery performed (ORIF, hemiarthroplasty, CRIF, internal fixation only, THA, multiple procedures) to examine the effect of weekend admission on mortality, perioperative complications, and length of stay within each stratum. We did not control for these variables in our regression models because they were potential mediators of mortality, complications, and length of stay. All statistical analyses in this study were performed using SAS Version 9.1 (SAS Institute), and P < .05 was interpreted as statistically significant.
Results
After exclusions, our study population consisted of 96,892 weekend admissions and 248,097 weekday admissions. Among all admissions, mean age was 79.3 years (range, 0-113 years), with patients primarily being female and white, paying with Medicare, and having 1 to 4 comorbidities. Admissions were primarily for extracapsular femoral neck fractures and occurred most often in the South region, in hospitals with large beds, in nonteaching hospitals, and in urban locations. Table 1 lists details of baseline characteristics for weekend and weekday admissions.

Hospital stay details, including surgical delay and procedure performed, were examined for weekend and weekday admissions. Mean delay to surgery was 31.0 hours for weekend admissions and 30.2 hours for weekday admissions (P < .0001). The difference was driven by a higher proportion of weekend admissions in which surgery was performed 24 to 120 hours after admission. Patients admitted on the weekend also underwent more ORIF procedures and fewer hemiarthroplasties. Table 2 is a full list of hospital stay characteristics.

In regression analyses, weekend OR of mortality was 0.94 (95% CI, 0.89-0.99), weekend OR of having at least 1 complication was 1.00 (95% CI, 0.98-1.02), and weekend mean hospital stay was 3.74% shorter (95% CI, 3.40-4.08) in comparison with weekday figures. Within our models, risk of mortality and complications and mean length of stay increased as the number of patient comorbidities increased. Table 3 lists selected results from our regression models. Comprehensive tables for each outcome’s model are presented in Appendices 1 to 3.

In our analyses of specific complications, there were no significant associations between weekend admissions and risk of acute renal failure, wound hemorrhage, wound disruption, wound infection, deep vein thrombosis, myocardial infarction, pneumonia, pulmonary embolism, sepsis, urinary tract infection, implant infection, or incision and débridement. In addition, we found a lower risk of tachycardia (OR, 0.90; 95% CI, 0.82-1.00) and a higher risk (P < .10) of stroke (OR, 1.16; 95% CI, 0.99-1.35). Table 4 is a full list of the specific complications and their risks for weekend versus weekday admissions.

According to stratified analyses involving surgical delay, weekend admissions in which patients had surgery the same day as admission had decreased risk of mortality (OR, 0.81; 95% CI, 0.72-0.91) and perioperative complications (OR, 0.96; 95% CI, 0.92-0.99). In addition, hospital stay was shorter for weekend admissions with surgical delay of less than 24 hours (4.89% shorter; 95% CI, 4.22-5.55), 24 to 48 hours (5.93% shorter; 95% CI, 5.51-6.35), and 49 to 72 hours (3.50% shorter; 95% CI, 2.80-4.20). When admissions were stratified by procedure performed, patients who were admitted on the weekend and underwent ORIF, hemiarthroplasty, CRIF, internal fixation only, and THA had shorter stays than patients admitted on weekdays. For all surgeries performed, the risk of both mortality and complications did not significantly differ by day of admission. Table 5 lists the comprehensive results of all our stratified analyses.

Discussion
In this large, multiyear analysis of patients admitted for hip fracture in the United States, risk of mortality was slightly lower for weekend versus weekday admissions, hospital stay was significantly shorter, and risk of perioperative complications was not significantly different between admission types. In secondary analyses, shorter hospital stay was limited to patients who were admitted on weekends and underwent surgery within 48 hours. Our results therefore suggest that the weekend effect does not apply to hip fracture patients in the United States.
Our results are largely consistent with the literature on the topic.11-14 An Australian study of 4183 patients with acute hip fracture found no significant difference in 2- or 30-day mortality among weekend and weekday admissions.11 Similarly, 2 Danish studies did not find a difference in hospital-stay or 30-day mortality between weekend and weekday admissions among samples of 600 and 38,020 patients with hip fracture, respectively.12,13 In US patients, a cross-specialty study that included hip fractures did not find a difference in hospital-stay mortality among 22,001 admissions in the state of California in 1998.14 Our analysis significantly extended the findings of these studies by using comprehensive admission data from 46 US states over a 13-year period (1998–2010) and by examining outcomes other than mortality, including perioperative complications and length of hospital stay.
Our study had several limitations. First, the clinical data on fracture diagnoses and surgical procedures were based on ICD-9-CM codes, limiting our ability to account for the full details of fracture severity and subsequent management. Second, our analyses were limited to outcomes during the hospital stay, and we could not examine the effect of weekend admission on readmission and long-term mortality. Third, because of the dichotomization of admission day in the NIS database, we could not selectively examine the effect of Friday, Saturday, or Sunday admission on our outcomes. Fourth, we excluded admissions that were missing demographic and clinical data, potentially creating a complete-case bias. However, these exclusions were needed to accurately capture the common presentation of acute hip fracture, and there is no reason to believe that differences in record coding were nonrandom. Last, our study was observational, and we cannot rule out the effect of residual confounding on our results.
Our results failed to show a weekend effect on mortality, perioperative complications, or length of hospital stay in US patients with hip fracture. The reason for this, as suggested before,12 may be that hip fractures are becoming easier to diagnose. Furthermore, the observation that hospital stay was shorter for weekend admissions suggests that, despite decreased staffing of nursing and rehabilitation services, the lower volume of elective surgeries on weekends may actually increase staff availability to hip fracture patients.


1. Cram P, Hillis SL, Barnett M, Rosenthal GE. Effects of weekend admission and hospital teaching status on in-hospital mortality. Am J Med. 2004;117(3):151-157.
2. Saposnik G, Baibergenova A, Bayer N, Hachinski V. Weekends: a dangerous time for having a stroke? Stroke. 2007;38(4):1211-1215.
3. Busl KM, Prabhakaran S. Predictors of mortality in nontraumatic subdural hematoma. J Neurosurg. 2013;119(5):1296-1301.
4. Ananthakrishnan AN, McGinley EL, Saeian K. Outcomes of weekend admissions for upper gastrointestinal hemorrhage: a nationwide analysis. Clin Gastroenterol Hepatol. 2009;7(3):296e1-302e1.
5. Shaheen AA, Kaplan GG, Myers RP. Weekend versus weekday admission and mortality from gastrointestinal hemorrhage caused by peptic ulcer disease. Clin Gastroenterol Hepatol. 2009;7(3):303-310.
6. Deshmukh A, Pant S, Kumar G, Bursac Z, Paydak H, Mehta JL. Comparison of outcomes of weekend versus weekday admissions for atrial fibrillation. Am J Cardiol. 2012;110(2):208-211.
7. Aujesky D, Jiménez D, Mor MK, Geng M, Fine MJ, Ibrahim SA. Weekend versus weekday admission and mortality after acute pulmonary embolism. Circulation. 2009;119(7):962-968.
8. Clarke MS, Wills RA, Bowman RV, et al. Exploratory study of the ‘weekend effect’ for acute medical admissions to public hospitals in Queensland, Australia. Intern Med J. 2010;40(11):777-783.
9. Daugaard CL, Jørgensen HL, Riis T, Lauritzen JB, Duus BR, Van der mark S. Is mortality after hip fracture associated with surgical delay or admission during weekends and public holidays? A retrospective study of 38,020 patients. Acta Orthop. 2012;83(6):609-613.
10. Foss NB, Kehlet H. Short-term mortality in hip fracture patients admitted during weekends and holidays. Br J Anaesth. 2006;96(4):450-4514.
11. Shiga T, Wajima Z, Ohe Y. Is operative delay associated with increased mortality of hip fracture patients? Systematic review, meta-analysis and meta-regression. Can J Anaesth. 2008;55(3):146-154.
12. Zuckerman JD, Skovron ML, Koval KJ, Aharonoff G, Frankel VH. Postoperative complications and mortality associated with operative delay in older patients who have a fracture of the hip. J Bone Joint Surg Am. 1995;77(10):1551-1556.
13. Lefaivre KA, Macadam SA, Davidson DJ, Gandhi R, Chan H, Broekhuyse HM. Length of stay, mortality, morbidity and delay to surgery in hip fractures. J Bone Joint Surg Br. 2009;91(7):922-927.
14. Ho V, Hamilton BH, Roos LL. Multiple approaches to assessing the effects of delays for hip fracture patients in the United States and Canada. Health Serv Res. 2000;34(7):1499-1518.
15. Steiner C, Elixhauser A, Schnaier J. The Healthcare Cost and Utilization Project: an overview. Eff Clin Pract. 2002;5(3):143-151.
16. Elixhauser A, Steiner C, Harris DR, Coffey RM. Comorbidity measures for use with administrative data. Med Care. 1998;36(1):8-27.
17. Brasel KJ, Guse CE, Layde P, Weigelt JA. Rib fractures: relationship with pneumonia and mortality. Crit Care Med. 2006;34(6):1642-1646.
18. Lin CA, Kuo AC, Takemoto S. Comorbidities and perioperative complications in HIV-positive patients undergoing primary total hip and knee arthroplasty. J Bone Joint Surg Am. 2013;95(11):1028-1036.
19. Vittinghoff E, Glidden DV, Shiboski SC, McCulloch CE. Regression Methods in Biostatistics: Linear, Logistic, Survival, and Repeated Measures Models. 2nd ed. New York, NY: Springer-Verlag; 2012. Statistics for Biology and Health.
Weekend admission has been hypothesized to be a risk factor for increased patient mortality and complications during hospital stays—commonly referred to as the weekend effect.1 Reduced hospital staffing on weekends, particularly of senior-level physicians and ancillary nursing services, may affect the quality of diagnosis and management for patients admitted for traumatic and emergent conditions. Investigators have found increased mortality in weekend admissions for stroke,2 subdural hematoma,3 gastrointestinal bleeding,4,5 atrial fibrillation,6 and pulmonary embolism.7 Investigators have not found increased mortality in weekend admissions for hip fracture, though the majority of the data was derived from European patient populations, which may be subject to management and staffing strategies different from those for US patients.8-10 Furthermore, data on this topic in US patients are limited to a multispecialty study of 50 different admission diagnoses, which used 1 year of data from a single US state.1
We conducted a study to comprehensively assess the effect of weekend admission on adverse outcomes during hospital stays. The literature suggests that surgery for hip fracture can be delayed up to 48 hours without significant additional risk of death,11-13 allowing orthopedic departments to stabilize routine hip fracture admissions on weekends and operate whenever limited surgical teams become available. Surgical delay has not been thoroughly analyzed by day of admission among US patients,14 but the combined potential of more conservative preoperative management and the availability of fewer senior physicians and ancillary providers may result in worse outcomes for weekend versus weekday admissions.
Materials and Methods
Study Population
Part of the Healthcare Cost and Utilization Project, the Nationwide Inpatient Sample (NIS) provides a 20% representative sample of annual US hospital admissions.15 For these admissions, the NIS includes data related to demographic and clinical variables, such as International Classification of Diseases, Ninth Revision, Clinical Modification (ICD-9-CM) diagnosis and procedure codes, as well as descriptive variables for the hospitals where the patients were admitted. The NIS is publicly available to researchers. As its health information is deidentified, we did not have to obtain institutional review board approval for this study.
Ascertainment of Cases
Our initial study population, drawn from the period 1998–2010, consisted of 821,531 patients with a principal ICD-9-CM diagnosis of femoral neck fracture (820.0-820.9). To best capture the typical presentation of hip fracture, we excluded:
- Patients with open femoral neck fractures (820.1, 820.3, 820.9).
- Patients who did not have open reduction and internal fixation (ORIF) (79.35), hemiarthroplasty (81.52), closed reduction and internal fixation (CRIF) (79.15), internal fixation (78.55), or total hip arthroplasty (THA) (81.51) as their primary surgical procedure.
- Patients admitted from sources other than the emergency department.
- Patients who underwent surgery before admission.
- Patients whose admission type was not classified as emergency or urgent.
Ascertainment of Covariates
For all patients, we extracted data on exposure of interest, day of admission (weekend or weekday), and demographic variables including age, sex, race (white, black, Hispanic, other, missing), and insurance (Medicare, Medicaid, private, other). We used the Elixhauser method to determine 30 different comorbidities from ICD-9-CM diagnosis coding16 and sorted patients by total number of comorbidities (0, 1, 2, 3 or 4, ≥5). As has been done before,17 we excluded blood loss anemia, coagulopathy, and fluid and electrolyte disorders from this comorbidity calculation, as these conditions can be secondary to trauma. We also extracted data on the admission itself, including hospital region (Northeast, Midwest, South, West), hospital bed size (small, medium, large), hospital teaching status (nonteaching, teaching), and hospital location (rural, urban). We used diagnosis codes to categorize fracture location as “not otherwise specified” (820.8), intracapsular (820.0), or extracapsular (820.2).
Because of low frequencies, we collapsed 2 race designations (Native American, Asian or Pacific Islander) into the “other race” category and 2 insurance designations (self-pay, no charge) into the “other insurance” category. For a substantial number of patients, race information was missing, so we included “missing” as its own category in analyses. Patients who were missing data on day of admission, age, sex, insurance, or hospital characteristics were excluded from our final cohort, as missing frequencies for each variable were small.
Ascertainment of Outcomes
For all patients, we extracted data on death status at discharge and length of hospital stay. We log-transformed length of stay because of its right skew, assigning the value of 12 hours to patients admitted and discharged the same day. Perioperative complications were calculated using ICD-9-CM codes as defined by a recent study of orthopedics-related complications by Lin and colleagues.18 There were 14 possible complications, including acute renal failure (584.5-9), tachycardia (427), wound hemorrhage (719.15, 998.31-2), wound disruption (998.3, 998.31-2), wound infection (682.6, 686.9, 891, 891.1-2, 894, 894.1-2, 998.5, 998.51, 998.6, 998.83, 998.59), deep vein thrombosis (453.4, 453.41-2, 453.9), acute myocardial infarction (410, 410.01, 410.11, 410.2, 410.21, 410.3, 410.31, 410.4, 410.41, 410.5, 410.51, 410.6, 410.9, 410.91, 997.1), pneumonia (480-480.9, 481, 482-482.9, 483, 483.1, 483.8, 484, 484.1, 484.3, 484.5-8, 485, 486, 487, 507), pulmonary embolism (415.11, 415.19), sepsis (995.91-2), stroke (997.02), urinary tract infection (599, 997.5), implant infection (996.66-7, 996.69), and incision and débridement (86.04, 86.09, 86.22, 86.28, 86.3). In our statistical analyses, we examined both the risk of having a complicated admission (≥1 perioperative complication) and the risk of having each specific complication.
Statistical Analysis
To assess similarity between weekend and weekday admissions, we used the Fisher exact test and χ2P values. Logistic regression was used to calculate the odds ratios (ORs) of mortality and perioperative complications for weekend versus weekday admissions. Linear regression was used to calculate parameter estimates for length of hospital stay for weekend versus weekday admissions. We interpreted parameter estimates as percentage differences using the formula 100(eb–1), where b is the estimated standardized regression coefficient of a log-transformed outcome variable.19 All regression models were controlled for age, sex, race, insurance, number of comorbidities, fracture location, hospital region, hospital bed size, hospital teaching status, and hospital location. We also stratified our study population by surgical delay in hours (<24, 24-48, 49-72, 73-120, ≥121) and by surgery performed (ORIF, hemiarthroplasty, CRIF, internal fixation only, THA, multiple procedures) to examine the effect of weekend admission on mortality, perioperative complications, and length of stay within each stratum. We did not control for these variables in our regression models because they were potential mediators of mortality, complications, and length of stay. All statistical analyses in this study were performed using SAS Version 9.1 (SAS Institute), and P < .05 was interpreted as statistically significant.
Results
After exclusions, our study population consisted of 96,892 weekend admissions and 248,097 weekday admissions. Among all admissions, mean age was 79.3 years (range, 0-113 years), with patients primarily being female and white, paying with Medicare, and having 1 to 4 comorbidities. Admissions were primarily for extracapsular femoral neck fractures and occurred most often in the South region, in hospitals with large beds, in nonteaching hospitals, and in urban locations. Table 1 lists details of baseline characteristics for weekend and weekday admissions.
Hospital stay details, including surgical delay and procedure performed, were examined for weekend and weekday admissions. Mean delay to surgery was 31.0 hours for weekend admissions and 30.2 hours for weekday admissions (P < .0001). The difference was driven by a higher proportion of weekend admissions in which surgery was performed 24 to 120 hours after admission. Patients admitted on the weekend also underwent more ORIF procedures and fewer hemiarthroplasties. Table 2 is a full list of hospital stay characteristics.
In regression analyses, weekend OR of mortality was 0.94 (95% CI, 0.89-0.99), weekend OR of having at least 1 complication was 1.00 (95% CI, 0.98-1.02), and weekend mean hospital stay was 3.74% shorter (95% CI, 3.40-4.08) in comparison with weekday figures. Within our models, risk of mortality and complications and mean length of stay increased as the number of patient comorbidities increased. Table 3 lists selected results from our regression models. Comprehensive tables for each outcome’s model are presented in Appendices 1 to 3.
In our analyses of specific complications, there were no significant associations between weekend admissions and risk of acute renal failure, wound hemorrhage, wound disruption, wound infection, deep vein thrombosis, myocardial infarction, pneumonia, pulmonary embolism, sepsis, urinary tract infection, implant infection, or incision and débridement. In addition, we found a lower risk of tachycardia (OR, 0.90; 95% CI, 0.82-1.00) and a higher risk (P < .10) of stroke (OR, 1.16; 95% CI, 0.99-1.35). Table 4 is a full list of the specific complications and their risks for weekend versus weekday admissions.
According to stratified analyses involving surgical delay, weekend admissions in which patients had surgery the same day as admission had decreased risk of mortality (OR, 0.81; 95% CI, 0.72-0.91) and perioperative complications (OR, 0.96; 95% CI, 0.92-0.99). In addition, hospital stay was shorter for weekend admissions with surgical delay of less than 24 hours (4.89% shorter; 95% CI, 4.22-5.55), 24 to 48 hours (5.93% shorter; 95% CI, 5.51-6.35), and 49 to 72 hours (3.50% shorter; 95% CI, 2.80-4.20). When admissions were stratified by procedure performed, patients who were admitted on the weekend and underwent ORIF, hemiarthroplasty, CRIF, internal fixation only, and THA had shorter stays than patients admitted on weekdays. For all surgeries performed, the risk of both mortality and complications did not significantly differ by day of admission. Table 5 lists the comprehensive results of all our stratified analyses.
Discussion
In this large, multiyear analysis of patients admitted for hip fracture in the United States, risk of mortality was slightly lower for weekend versus weekday admissions, hospital stay was significantly shorter, and risk of perioperative complications was not significantly different between admission types. In secondary analyses, shorter hospital stay was limited to patients who were admitted on weekends and underwent surgery within 48 hours. Our results therefore suggest that the weekend effect does not apply to hip fracture patients in the United States.
Our results are largely consistent with the literature on the topic.11-14 An Australian study of 4183 patients with acute hip fracture found no significant difference in 2- or 30-day mortality among weekend and weekday admissions.11 Similarly, 2 Danish studies did not find a difference in hospital-stay or 30-day mortality between weekend and weekday admissions among samples of 600 and 38,020 patients with hip fracture, respectively.12,13 In US patients, a cross-specialty study that included hip fractures did not find a difference in hospital-stay mortality among 22,001 admissions in the state of California in 1998.14 Our analysis significantly extended the findings of these studies by using comprehensive admission data from 46 US states over a 13-year period (1998–2010) and by examining outcomes other than mortality, including perioperative complications and length of hospital stay.
Our study had several limitations. First, the clinical data on fracture diagnoses and surgical procedures were based on ICD-9-CM codes, limiting our ability to account for the full details of fracture severity and subsequent management. Second, our analyses were limited to outcomes during the hospital stay, and we could not examine the effect of weekend admission on readmission and long-term mortality. Third, because of the dichotomization of admission day in the NIS database, we could not selectively examine the effect of Friday, Saturday, or Sunday admission on our outcomes. Fourth, we excluded admissions that were missing demographic and clinical data, potentially creating a complete-case bias. However, these exclusions were needed to accurately capture the common presentation of acute hip fracture, and there is no reason to believe that differences in record coding were nonrandom. Last, our study was observational, and we cannot rule out the effect of residual confounding on our results.
Our results failed to show a weekend effect on mortality, perioperative complications, or length of hospital stay in US patients with hip fracture. The reason for this, as suggested before,12 may be that hip fractures are becoming easier to diagnose. Furthermore, the observation that hospital stay was shorter for weekend admissions suggests that, despite decreased staffing of nursing and rehabilitation services, the lower volume of elective surgeries on weekends may actually increase staff availability to hip fracture patients.
1. Cram P, Hillis SL, Barnett M, Rosenthal GE. Effects of weekend admission and hospital teaching status on in-hospital mortality. Am J Med. 2004;117(3):151-157.
2. Saposnik G, Baibergenova A, Bayer N, Hachinski V. Weekends: a dangerous time for having a stroke? Stroke. 2007;38(4):1211-1215.
3. Busl KM, Prabhakaran S. Predictors of mortality in nontraumatic subdural hematoma. J Neurosurg. 2013;119(5):1296-1301.
4. Ananthakrishnan AN, McGinley EL, Saeian K. Outcomes of weekend admissions for upper gastrointestinal hemorrhage: a nationwide analysis. Clin Gastroenterol Hepatol. 2009;7(3):296e1-302e1.
5. Shaheen AA, Kaplan GG, Myers RP. Weekend versus weekday admission and mortality from gastrointestinal hemorrhage caused by peptic ulcer disease. Clin Gastroenterol Hepatol. 2009;7(3):303-310.
6. Deshmukh A, Pant S, Kumar G, Bursac Z, Paydak H, Mehta JL. Comparison of outcomes of weekend versus weekday admissions for atrial fibrillation. Am J Cardiol. 2012;110(2):208-211.
7. Aujesky D, Jiménez D, Mor MK, Geng M, Fine MJ, Ibrahim SA. Weekend versus weekday admission and mortality after acute pulmonary embolism. Circulation. 2009;119(7):962-968.
8. Clarke MS, Wills RA, Bowman RV, et al. Exploratory study of the ‘weekend effect’ for acute medical admissions to public hospitals in Queensland, Australia. Intern Med J. 2010;40(11):777-783.
9. Daugaard CL, Jørgensen HL, Riis T, Lauritzen JB, Duus BR, Van der mark S. Is mortality after hip fracture associated with surgical delay or admission during weekends and public holidays? A retrospective study of 38,020 patients. Acta Orthop. 2012;83(6):609-613.
10. Foss NB, Kehlet H. Short-term mortality in hip fracture patients admitted during weekends and holidays. Br J Anaesth. 2006;96(4):450-4514.
11. Shiga T, Wajima Z, Ohe Y. Is operative delay associated with increased mortality of hip fracture patients? Systematic review, meta-analysis and meta-regression. Can J Anaesth. 2008;55(3):146-154.
12. Zuckerman JD, Skovron ML, Koval KJ, Aharonoff G, Frankel VH. Postoperative complications and mortality associated with operative delay in older patients who have a fracture of the hip. J Bone Joint Surg Am. 1995;77(10):1551-1556.
13. Lefaivre KA, Macadam SA, Davidson DJ, Gandhi R, Chan H, Broekhuyse HM. Length of stay, mortality, morbidity and delay to surgery in hip fractures. J Bone Joint Surg Br. 2009;91(7):922-927.
14. Ho V, Hamilton BH, Roos LL. Multiple approaches to assessing the effects of delays for hip fracture patients in the United States and Canada. Health Serv Res. 2000;34(7):1499-1518.
15. Steiner C, Elixhauser A, Schnaier J. The Healthcare Cost and Utilization Project: an overview. Eff Clin Pract. 2002;5(3):143-151.
16. Elixhauser A, Steiner C, Harris DR, Coffey RM. Comorbidity measures for use with administrative data. Med Care. 1998;36(1):8-27.
17. Brasel KJ, Guse CE, Layde P, Weigelt JA. Rib fractures: relationship with pneumonia and mortality. Crit Care Med. 2006;34(6):1642-1646.
18. Lin CA, Kuo AC, Takemoto S. Comorbidities and perioperative complications in HIV-positive patients undergoing primary total hip and knee arthroplasty. J Bone Joint Surg Am. 2013;95(11):1028-1036.
19. Vittinghoff E, Glidden DV, Shiboski SC, McCulloch CE. Regression Methods in Biostatistics: Linear, Logistic, Survival, and Repeated Measures Models. 2nd ed. New York, NY: Springer-Verlag; 2012. Statistics for Biology and Health.

Taxonomy of Seven‐Day Readmissions
Unplanned hospital readmissions are regarded as a core measure of quality of care and may comprise a large avoidable cause of healthcare expenditures.[1, 2, 3, 4, 5] An estimated 20% of Medicare patients who are discharged from a hospital are readmitted within 30 days.[1, 6] This has led the Centers for Medicare & Medicaid Services and other payers to reduce reimbursements for unplanned 30‐day hospital readmissions.
Efforts to decrease readmission rates have been hampered by ineffective risk prediction models, and strategies to reduce readmissions have found limited success.[7] Understanding the mechanism of readmissions is necessary for accurate prediction and prevention. This can be achieved only through analysis of patient data and medical narratives obtained from patient interviews or detailed chart reviews.[8] Studies attempting to identify mechanisms of readmission using narrative chart reviews have been limited by small sample size, highly selected patient samples, and poor interobserver agreement.[8, 9, 10]
Our objective in this study was to identify specific mechanisms and risk factors of unplanned readmissions from the medicine service of a large urban hospital by reviewing medical charts for each case. Given the inverse relationship between time since discharge from the initial admission and the probability of an avoidable readmission,[8] we focused our review on 7‐day readmissions.
METHODS
Setting
The study took place within Bellevue Hospital Center, an 800‐bed teaching hospital that serves a culturally and racially diverse inner‐city population in New York City. Bellevue is 1 of 11 acute‐care facilities managed by Health and Hospitals Corporation. The Bellevue inpatient medicine service is staffed by board‐certified general internists (180 beds), oncologists (20 beds), and pulmonologists (20 beds), who function as hospitalists in supervision of housestaff and physicians. Their efforts are supported by case managers and social workers who meet every weekday with physicians and nurses to plan discharges as multidisciplinary teams. Weekend support is minimal, consisting of an on‐call social worker to assist with urgent matters only. Upon discharge, patients are referred directly to 1 or more of Bellevue's outpatient clinics or to their own primary care providers outside Bellevue. There is a single electronic medical record for Bellevue, which spans the full range of care provided in the outpatient clinics, emergency department, and inpatient service.
Patients
Eligible patients were discharged from the Bellevue medical service between July 1, 2010 and July 1, 2011, and readmitted to any service at Bellevue within 7 days. During the study period, there were 8421 discharges. Discharges included transfers to other hospitals or rehabilitation centers, and excluded patients who died during hospitalization. Of these, 6781 were not readmitted, 1581 were readmitted within 30 days (18.8%), and 549 were readmitted within 7 days (6.5%). From the latter group, 20 consecutive cases were excluded after use in an exploratory pilot study, 84 consecutive cases were excluded after use in a formal pilot study, leaving 445 cases, from which 400 cases were randomly selected via terminal digit of the medical record number. We selected 400 chart reviews as a reasonable sample size to provide a 95% confidence interval, with a margin of error less than 4.9% for any of the proportions of the 5 readmission categories. Of these, 65 were determined to be planned readmissions (eg, for elective chemotherapy). The remaining 335 unplanned 7‐day readmissions served as the subjects of this review. The study was approved by the institutional review board of New York University School of Medicine.
Reviewers
Three of the authors of this paper (Drs. Janjigian, Bails, and Link) were actively practicing board‐certified internal medicine physicians with 7, 19, and 26 years, respectively, of postresidency clinical experience during the review period of this study. Every case was reviewed by 2 investigators. One author (Drs. Janjigian) reviewed readmissions from the first 6 months of the calendar year, the second (Dr. Bails) reviewed readmissions from the last 6 months, and the third (Dr. Link) reviewed all 335 readmissions.
Data Collection
Using the electronic medical record, each readmission was reviewed with the intent to identify the sequence of events leading up to the readmission, most commonly achieved by analyzing the discharge summary from the initial admission and the admission note from the second admission. Further chart review was completed as necessary to establish the clearest narrative and to classify the readmission into 1 of 5 categories based on the cause. Narratives are defined here as the sequence of events leading to the readmission as determined by chart review and not by patient interviews. Narratives were recorded for each case to assist with understanding how each author determined the classification, and were used when disagreements required group consensus. Time spent on individual chart reviews varied widely, from 1 to 30 minutes, depending on the complexity of each case. For example, an against medical advice (AMA) discharge could be immediately identified in the medical record, whereas a determination that an incomplete workup was conducted would require reviewing the admission note from the readmission, the discharge summary from the index admission, review of progress and consult notes, and even vital signs, labs, and radiology.
An algorithm for classifying contributory causes of readmission into 1 of 5 categories was created from narratives compiled from a pilot of 84, 7‐day readmissions to Bellevue during the previous year. Six readmitted patients were interviewed by a study author during this pilot phase. These narratives were determined by consensus of the authors to provide no additional relevant information from that obtained through chart review alone. The 5 categories are identified in Figure 1 as follows:
- Second admission was not medically necessary.
- Second admission followed an elopement (patient left without knowledge of the hospital staff) or discharge AMA during the first admission.
- Second admission was caused by a deficiency in the discharge process of the first admission, attributable to the hospital system or providers.
- Second admission was caused by a factor attributable to the patient including substance use or nonadherence to the treatment plan from the first admission.
- Second admission was related to a complication of the primary disease or its treatment or an unrelated condition that could not reasonably have been predicted or prevented by a competent physician meeting the standard of care.
Categories 3, 4, and 5 were further divided into more specific subcategories as shown in Figure 1.
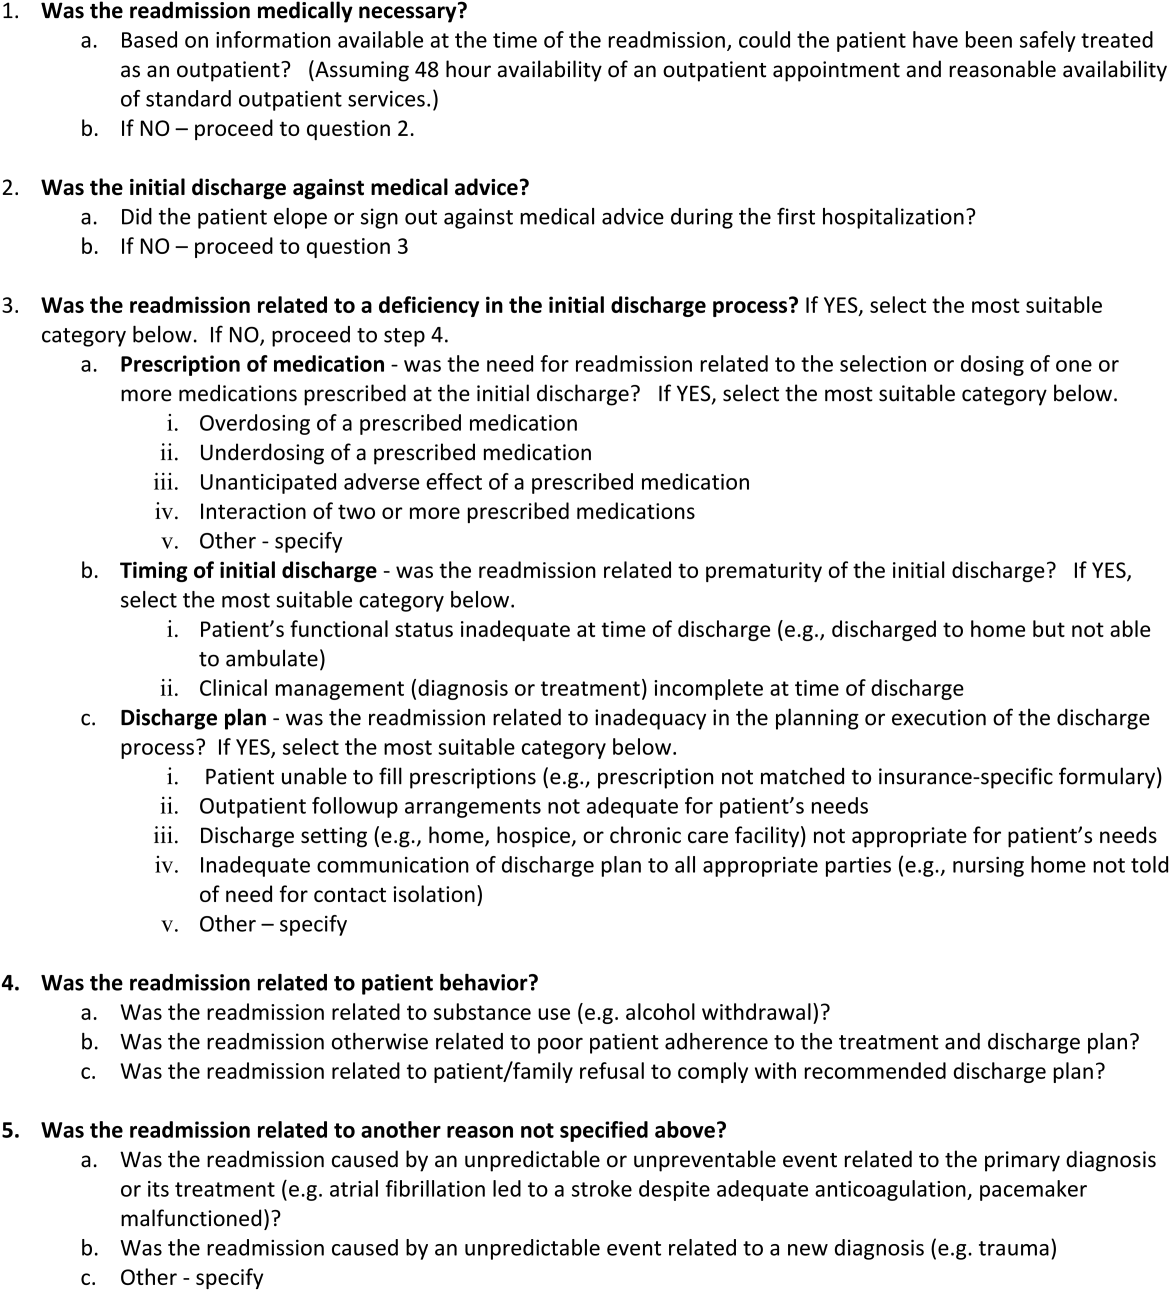
Each readmission was assigned a single category from the algorithm using a stepwise process in which a higher‐order cause excluded consideration of a downstream category. For example, if the second admission was not medically necessary (category 1), an incorrect decision to readmit the patient was considered the primary cause of the readmission, and no consideration was given to categories 2 through 5. In this manner, each patient was assigned to a single category. We considered readmissions attributable to provider error (categories 1 and 3) to be avoidable. Examples of readmissions in each category with narratives are shown in the Supporting Information, Appendix 1, in the online version of this article. Discrepancies in classification were resolved by consensus of all authors.
Statistical Analysis
Unweighted kappa values were measured to assess agreement between authors in the assignment of the major category among the 5 choices in the algorithm. [2] tests were used to compare categorical variables between 2 groups (readmitted vs not readmitted) or between several groups (5 categories of readmissions), whereas Kruskal‐Wallis tests were used for continuous variables.
Only the first readmission was used in analysis of patient characteristics when multiple readmissions occurred for an individual patient. Unique patients were used for analysis of nonreadmitted patients. The generalized estimating equation method was used to adjust for correlations between multiple readmissions within patients.
RESULTS
During this period, 270 patients accounted for 335 readmissions. Characteristics of patients readmitted within 7 days are shown in Table 1 and compared with those of patients who were not readmitted during the same study period. Patients who were readmitted were more likely to have had a longer length of stay during the first admission.
| Characteristic | Not Readmitted, n=6,781 | Readmitted, n=270 | P Value |
|---|---|---|---|
| |||
| Male gender (% of category) | 4,224 (62.3%) | 180 (66.7%) | 0.15 |
| Mean age, y (SD) | 56.1 (16.3) | 55.1 (16.3) | 0.65 |
| Median initial LOS [interquartile range] | 3 [2, 6] | 4 [2, 9] | 0.002 |
| Mean days between admissions (SD) | NA | 3.8 (2.1) | NA |
| AMA discharge (% of category) | 413 (6.1%) | 20 (7.4%) | 0.38 |
Results of categorization of readmission are shown in Table 2. Readmissions related to the discharge process (category 3) were further divided into subcategories (Table 3). Category 5 (unpredictable/unpreventable complication of primary diagnosis or unrelated event) constituted the highest percentage of readmissions at 46%, followed by category 4 (patient behavior) at 19%, category 3 (discharge process deficiency) at 17%, category 2 (AMA) at 12%, and category 1 (unnecessary admission) at 7%. Readmissions designated as preventable (categories 1 and 3) accounted for 24% of all readmissions. Readmissions due to patient factors (categories 2 and 4) accounted for 31% of all readmissions. Notably, 21% of all readmissions were due to patients who eloped or left AMA during the first discharge or who returned because of substance abuse during the interim (categories 2 and 4a). Among the preventable readmissions, the most commonly designated cause of readmission was a perceived premature discharge (category 3b2), accounting for 6% of all readmissions.
| Category 1: Second Admission Not Medically Necessary | Category 2: First Admission AMA | Category 3: Deficiency in the Discharge Process | Category 4: Patient Behavior | Category 5: Unpredictable Complication of Primary or Alternate Diagnosis | P Value* | |
|---|---|---|---|---|---|---|
| ||||||
| Total (%) | 22 (6.6%) | 39 (11.6%) | 56 (16.7%) | 63 (18.8%) | 155 (46.3%) | |
| Male (%) | 11 (50.0%) | 29 (74.4%) | 38 (67.9%) | 54 (85.7%) | 91 (58.7%) | 0.005 |
| Mean age, y (SD) | 61.8 (13.7) | 48.1 (13.2) | 58.6 (14.4) | 53.3 (11.8) | 55.1 (17.7) | 0.004 |
| Median LOS [IQR] | 2.5 [2.0, 7.0] | 2.0 [1.0, 6.0] | 5.0 [2.0, 8.5] | 4.0 [2.0, 6.0] | 5.0 [2.0, 10.0] | 0.03 |
| Mean days between admissions (SD) | 3.8 (2.2) | 3.1 (2.2) | 3.3 (2.0) | 3.8 (2.1) | 4.1 (2.1) | 0.27 |
| Category | Description | No. | % of Total |
|---|---|---|---|
| 3a1 | Overdosing of a prescribed medication | 3 | 0.9 |
| 3a2 | Underdosing of a prescribed medication | 5 | 1.5 |
| 3a3 | Adverse medication effect | 2 | 0.6 |
| 3b1 | Inadequate functional status | 3 | 0.9 |
| 3b2 | Premature discharge | 20 | 6.0 |
| 3c1 | Patient unable to fill prescriptions | 9 | 2.7 |
| 3c2 | Follow‐up arrangements inadequate | 6 | 1.8 |
| 3c3 | Discharge setting not appropriate | 5 | 1.5 |
| 3c4 | Inadequate communication of plan to receiving facility | 2 | 0.6 |
| 3c5 | Other | 1 | 0.3 |
| 4a | Patient behaviorsubstance use | 30 | 9 |
| 4b | Patient behavioradherence to discharge plan | 30 | 9 |
| 4c | Patient behaviorrefusal of discharge plan | 3 | 0.9 |
| 5a | Disease complication | 103 | 30.7 |
| 5b | Unrelated condition | 52 | 15.5 |
Variance was statistically significant across major categories for gender, mean age, and median length of stay. The interobserver level of agreement across the 5 major categories was substantial among both pairs of reviewers (Table 4).
| Pair of Reviewers | No. of Readmissions Reviewed | No. of Agreements (%) | Unweighted Kappa |
|---|---|---|---|
| Dr. LinkDr. Bails | 135 | 113 (83.7) | 0.78 |
| Dr. LinkDr. Janjigian | 200 | 163 (81.5) | 0.72 |
The 46 patients who had more than 1, 7‐day readmission during this study period were responsible for 106 readmissions. The majority of this group were readmitted twice (78%), with a range of 2 to 5 readmissions. Within this group, 24% were considered preventable readmissions (8 from category 1, 17 from category 3), and 76% were considered not preventable (10 from category 2, 27 from category 4, and 44 from category 5).
DISCUSSION
The purpose of this retrospective review was to identify causes of unplanned 7‐day readmissions after discharge from the medical service of a large urban teaching hospital. Rather than focus on risk factors for readmissions, which other studies have done, we reviewed charts of readmitted patients using a novel categorization algorithm to group patients into common mechanisms that elucidate why a particular patient was readmitted. By examining the chart in detail, we were able to identify etiologies of readmission that are potentially avoidable.
Some authors have questioned the use of readmissions as a measurement of the quality of care a hospital provides due to the high proportion of unavoidable readmissions in a given sample.[8, 10] We hoped to identify systems errors that could be targets of quality improvement initiatives, and therefore chose to focus entirely on 7‐day readmissions as these have been shown to be more preventable than 30‐day readmissions.[8] We had the ability to review any aspect of the medical chart (eg, vitals or labs on discharge, any clinical note), which provided the highest probability of discovering a systems error. Despite these efforts to identify preventable errors, we identified the most common mechanism of readmission as an unpredictable or unpreventable event related to the primary diagnosis or its treatment from the initial admission (category 5a, 30.7% of total readmissions). Review of examples from this category elucidates how an unpredictable readmission could occur within such a short time frame (see Supporting Information, Appendix 1, in the online version of this article). The 7‐day window precluded identification of clinic access barriers, thereby eliminating from analysis 1 mechanism for preventable readmissions.
Nonetheless, our study demonstrates room for improvement in provider behavior and hospital systems related to the discharge process. Nearly a quarter of all readmissions and the majority of preventable readmissions were related to systems issues, such as timing and coordination of the first discharge, and lack of medical necessity for the second admission (see Supporting Information, Appendix 1, in the online version of this article). Prior studies found that shorter length of stay was associated with increased preventable readmissions, a finding that our study does not support.[10, 11] We suspect that patients in this group had longer lengths of stay during the index hospitalization due to complexity of medical illness, limited social support network, or lack of insurance, among other factors, that exposed flaws in systems processes and provider judgment. The mechanisms of readmission related to discharge planning that we identified in this study, including comprehensiveness of care, coordination of care, and medication administration, all represent potential opportunities for intervention.
Of note, there was a high percentage of readmissions attributable to patient behaviors, such as AMA discharges, substance abuse following discharge, and nonadherence to the treatment plan. These factors are likely over‐represented in the Bellevue patient population compared to that of private hospital settings and no doubt exacerbate the readmission rates in urban hospitals treating patients with a high degree of social and behavioral health needs. Although patient‐related factors such as AMA discharges and substance abuse are potentially addressable, our reviewers felt that these were not preventable based on current knowledge and standards of care.
Studies that have attempted to classify readmissions as potentially avoidable have not shown good interobserver agreement when more than 1 reviewer was involved.[9, 10] Additionally, there is not a validated tool available to classify types of readmissions. By using a pilot sample of 84 cases to develop the model, confirming the accuracy of the chart by personally interviewing a sample of readmitted patients for comparison, and by employing experienced inpatient attending physicians to perform the reviews, we were able to develop an algorithm that achieved substantial reliability in assigning each readmission into 1 of 5 distinct categories.
Our literature search revealed only a single study that attempted to classify readmissions in a similar manner. Readmissions within 6 months at 9 Veterans Affairs hospitals were classified into causal categories of systems, provider, and patient etiology.[9] Overall, 34% of readmissions were deemed to be preventable compared to 24% in our study. Most readmissions (68%) were due to a worsening of a clinical condition, 4.5% were attributed to the admitting provider having too low a threshold to justify admission, and 2.7% were due to the patient not abstaining from drugs or alcohol. Though the study design and patient population differed from our own, the similarities in methods and results lend validity to the results and conclusions of our study.
Another limitation of our study is that readmissions to other hospitals were not included. In this respect, our estimate of the rate of readmission was an understatement of the true value. Nonetheless, the categorization of causes for readmission was not likely to be affected by the site of the second admission. Another limitation of this study was the small number of subjects reviewed relative to other studies that analyzed demographics and risk factors in large databases of readmissions.[12] However, the depth of the present review provides an understanding of the sequence of events leading to the readmission and permits development of strategies to prevent their occurrence.
We identified mechanisms of readmissions that can lay the groundwork for future interventions and safely reduce readmissions rates at little cost. To reduce admissions that may not be medically necessary, the narratives presented in the supplementary appendix suggest that improvement in communication between the admitting provider for the readmission and a provider familiar with the patient could have led to avoidance of the readmission. Similarly, enhanced communication to receiving nursing facilities would decrease the chances of the patient being immediately sent back as occurred multiple times in our cohort. Formal mandatory assessment of functional status for vulnerable patients would identify patients who may not be fully ready for discharge.
In conclusion, we found through detailed chart review of patients readmitted within 7 days to an urban teaching hospital that the majority of readmissions were not avoidable and were due to unpredictable complications of the primary diagnosis from the index hospitalization or a condition unrelated to the initial stay. This conclusion, in concurrence with those of other studies,[8, 10] questions the value of a readmission as a valid metric of quality though supports further improvements in hospital systems to reduce preventable readmissions.
Disclosure
Nothing to report.
- , , . Rehospitalizations among patients in the Medicare fee‐for‐service program. N Engl J Med. 2009;360(14):1418–1428.
- , . The rate and cost of hospital readmissions for preventable conditions. Med Care Res Rev. 2004;61(2):225–240.
- Centers for Medicare and Medicaid Services. 9th scope of work version #080108‐0. Available at: http://www.cms.gov/Medicare/Quality‐Initiatives‐Patient‐Assessment‐Instruments/QualityImprovementOrgs/downloads/9thSOWBaseContract_C_08‐01‐2008_2_.pdf. Accessed April 10, 2014.
- , . Hospital readmissions in the Medicare population. N Engl J Med. 1984;311(21):1349–1353.
- U.S. Department of Health 155(8):520–528.
- , , , et al. Incidence of potentially avoidable urgent readmissions and their relation to all‐cause urgent readmissions. CMAJ. 2011;183(14):E1067–E1072.
- , , , et al. Classifying general medicine readmissions. Are they preventable? Veterans Affairs Cooperative Studies in Health Services Group on Primary Care and Hospital Readmissions. J Gen Intern Med. 1996;11(10):597–607.
- , , , . Hospitalists assess the causes of early hospital readmissions. J Hosp Med. 2011;6(7):383–388.
- , , . Early readmissions to the department of medicine as a screening tool for monitoring quality of care problems. Medicine. 2008;87(5):294–300.
- , , , et al. Incidence and predictors of all and preventable adverse drug reactions in frail elderly persons after hospital stay. J Gerontol A Biol Sci Med Sci. 2006;61(5):511–515.
Unplanned hospital readmissions are regarded as a core measure of quality of care and may comprise a large avoidable cause of healthcare expenditures.[1, 2, 3, 4, 5] An estimated 20% of Medicare patients who are discharged from a hospital are readmitted within 30 days.[1, 6] This has led the Centers for Medicare & Medicaid Services and other payers to reduce reimbursements for unplanned 30‐day hospital readmissions.
Efforts to decrease readmission rates have been hampered by ineffective risk prediction models, and strategies to reduce readmissions have found limited success.[7] Understanding the mechanism of readmissions is necessary for accurate prediction and prevention. This can be achieved only through analysis of patient data and medical narratives obtained from patient interviews or detailed chart reviews.[8] Studies attempting to identify mechanisms of readmission using narrative chart reviews have been limited by small sample size, highly selected patient samples, and poor interobserver agreement.[8, 9, 10]
Our objective in this study was to identify specific mechanisms and risk factors of unplanned readmissions from the medicine service of a large urban hospital by reviewing medical charts for each case. Given the inverse relationship between time since discharge from the initial admission and the probability of an avoidable readmission,[8] we focused our review on 7‐day readmissions.
METHODS
Setting
The study took place within Bellevue Hospital Center, an 800‐bed teaching hospital that serves a culturally and racially diverse inner‐city population in New York City. Bellevue is 1 of 11 acute‐care facilities managed by Health and Hospitals Corporation. The Bellevue inpatient medicine service is staffed by board‐certified general internists (180 beds), oncologists (20 beds), and pulmonologists (20 beds), who function as hospitalists in supervision of housestaff and physicians. Their efforts are supported by case managers and social workers who meet every weekday with physicians and nurses to plan discharges as multidisciplinary teams. Weekend support is minimal, consisting of an on‐call social worker to assist with urgent matters only. Upon discharge, patients are referred directly to 1 or more of Bellevue's outpatient clinics or to their own primary care providers outside Bellevue. There is a single electronic medical record for Bellevue, which spans the full range of care provided in the outpatient clinics, emergency department, and inpatient service.
Patients
Eligible patients were discharged from the Bellevue medical service between July 1, 2010 and July 1, 2011, and readmitted to any service at Bellevue within 7 days. During the study period, there were 8421 discharges. Discharges included transfers to other hospitals or rehabilitation centers, and excluded patients who died during hospitalization. Of these, 6781 were not readmitted, 1581 were readmitted within 30 days (18.8%), and 549 were readmitted within 7 days (6.5%). From the latter group, 20 consecutive cases were excluded after use in an exploratory pilot study, 84 consecutive cases were excluded after use in a formal pilot study, leaving 445 cases, from which 400 cases were randomly selected via terminal digit of the medical record number. We selected 400 chart reviews as a reasonable sample size to provide a 95% confidence interval, with a margin of error less than 4.9% for any of the proportions of the 5 readmission categories. Of these, 65 were determined to be planned readmissions (eg, for elective chemotherapy). The remaining 335 unplanned 7‐day readmissions served as the subjects of this review. The study was approved by the institutional review board of New York University School of Medicine.
Reviewers
Three of the authors of this paper (Drs. Janjigian, Bails, and Link) were actively practicing board‐certified internal medicine physicians with 7, 19, and 26 years, respectively, of postresidency clinical experience during the review period of this study. Every case was reviewed by 2 investigators. One author (Drs. Janjigian) reviewed readmissions from the first 6 months of the calendar year, the second (Dr. Bails) reviewed readmissions from the last 6 months, and the third (Dr. Link) reviewed all 335 readmissions.
Data Collection
Using the electronic medical record, each readmission was reviewed with the intent to identify the sequence of events leading up to the readmission, most commonly achieved by analyzing the discharge summary from the initial admission and the admission note from the second admission. Further chart review was completed as necessary to establish the clearest narrative and to classify the readmission into 1 of 5 categories based on the cause. Narratives are defined here as the sequence of events leading to the readmission as determined by chart review and not by patient interviews. Narratives were recorded for each case to assist with understanding how each author determined the classification, and were used when disagreements required group consensus. Time spent on individual chart reviews varied widely, from 1 to 30 minutes, depending on the complexity of each case. For example, an against medical advice (AMA) discharge could be immediately identified in the medical record, whereas a determination that an incomplete workup was conducted would require reviewing the admission note from the readmission, the discharge summary from the index admission, review of progress and consult notes, and even vital signs, labs, and radiology.
An algorithm for classifying contributory causes of readmission into 1 of 5 categories was created from narratives compiled from a pilot of 84, 7‐day readmissions to Bellevue during the previous year. Six readmitted patients were interviewed by a study author during this pilot phase. These narratives were determined by consensus of the authors to provide no additional relevant information from that obtained through chart review alone. The 5 categories are identified in Figure 1 as follows:
- Second admission was not medically necessary.
- Second admission followed an elopement (patient left without knowledge of the hospital staff) or discharge AMA during the first admission.
- Second admission was caused by a deficiency in the discharge process of the first admission, attributable to the hospital system or providers.
- Second admission was caused by a factor attributable to the patient including substance use or nonadherence to the treatment plan from the first admission.
- Second admission was related to a complication of the primary disease or its treatment or an unrelated condition that could not reasonably have been predicted or prevented by a competent physician meeting the standard of care.
Categories 3, 4, and 5 were further divided into more specific subcategories as shown in Figure 1.
Each readmission was assigned a single category from the algorithm using a stepwise process in which a higher‐order cause excluded consideration of a downstream category. For example, if the second admission was not medically necessary (category 1), an incorrect decision to readmit the patient was considered the primary cause of the readmission, and no consideration was given to categories 2 through 5. In this manner, each patient was assigned to a single category. We considered readmissions attributable to provider error (categories 1 and 3) to be avoidable. Examples of readmissions in each category with narratives are shown in the Supporting Information, Appendix 1, in the online version of this article. Discrepancies in classification were resolved by consensus of all authors.
Statistical Analysis
Unweighted kappa values were measured to assess agreement between authors in the assignment of the major category among the 5 choices in the algorithm. [2] tests were used to compare categorical variables between 2 groups (readmitted vs not readmitted) or between several groups (5 categories of readmissions), whereas Kruskal‐Wallis tests were used for continuous variables.
Only the first readmission was used in analysis of patient characteristics when multiple readmissions occurred for an individual patient. Unique patients were used for analysis of nonreadmitted patients. The generalized estimating equation method was used to adjust for correlations between multiple readmissions within patients.
RESULTS
During this period, 270 patients accounted for 335 readmissions. Characteristics of patients readmitted within 7 days are shown in Table 1 and compared with those of patients who were not readmitted during the same study period. Patients who were readmitted were more likely to have had a longer length of stay during the first admission.
| Characteristic | Not Readmitted, n=6,781 | Readmitted, n=270 | P Value |
|---|---|---|---|
| |||
| Male gender (% of category) | 4,224 (62.3%) | 180 (66.7%) | 0.15 |
| Mean age, y (SD) | 56.1 (16.3) | 55.1 (16.3) | 0.65 |
| Median initial LOS [interquartile range] | 3 [2, 6] | 4 [2, 9] | 0.002 |
| Mean days between admissions (SD) | NA | 3.8 (2.1) | NA |
| AMA discharge (% of category) | 413 (6.1%) | 20 (7.4%) | 0.38 |
Results of categorization of readmission are shown in Table 2. Readmissions related to the discharge process (category 3) were further divided into subcategories (Table 3). Category 5 (unpredictable/unpreventable complication of primary diagnosis or unrelated event) constituted the highest percentage of readmissions at 46%, followed by category 4 (patient behavior) at 19%, category 3 (discharge process deficiency) at 17%, category 2 (AMA) at 12%, and category 1 (unnecessary admission) at 7%. Readmissions designated as preventable (categories 1 and 3) accounted for 24% of all readmissions. Readmissions due to patient factors (categories 2 and 4) accounted for 31% of all readmissions. Notably, 21% of all readmissions were due to patients who eloped or left AMA during the first discharge or who returned because of substance abuse during the interim (categories 2 and 4a). Among the preventable readmissions, the most commonly designated cause of readmission was a perceived premature discharge (category 3b2), accounting for 6% of all readmissions.
| Category 1: Second Admission Not Medically Necessary | Category 2: First Admission AMA | Category 3: Deficiency in the Discharge Process | Category 4: Patient Behavior | Category 5: Unpredictable Complication of Primary or Alternate Diagnosis | P Value* | |
|---|---|---|---|---|---|---|
| ||||||
| Total (%) | 22 (6.6%) | 39 (11.6%) | 56 (16.7%) | 63 (18.8%) | 155 (46.3%) | |
| Male (%) | 11 (50.0%) | 29 (74.4%) | 38 (67.9%) | 54 (85.7%) | 91 (58.7%) | 0.005 |
| Mean age, y (SD) | 61.8 (13.7) | 48.1 (13.2) | 58.6 (14.4) | 53.3 (11.8) | 55.1 (17.7) | 0.004 |
| Median LOS [IQR] | 2.5 [2.0, 7.0] | 2.0 [1.0, 6.0] | 5.0 [2.0, 8.5] | 4.0 [2.0, 6.0] | 5.0 [2.0, 10.0] | 0.03 |
| Mean days between admissions (SD) | 3.8 (2.2) | 3.1 (2.2) | 3.3 (2.0) | 3.8 (2.1) | 4.1 (2.1) | 0.27 |
| Category | Description | No. | % of Total |
|---|---|---|---|
| 3a1 | Overdosing of a prescribed medication | 3 | 0.9 |
| 3a2 | Underdosing of a prescribed medication | 5 | 1.5 |
| 3a3 | Adverse medication effect | 2 | 0.6 |
| 3b1 | Inadequate functional status | 3 | 0.9 |
| 3b2 | Premature discharge | 20 | 6.0 |
| 3c1 | Patient unable to fill prescriptions | 9 | 2.7 |
| 3c2 | Follow‐up arrangements inadequate | 6 | 1.8 |
| 3c3 | Discharge setting not appropriate | 5 | 1.5 |
| 3c4 | Inadequate communication of plan to receiving facility | 2 | 0.6 |
| 3c5 | Other | 1 | 0.3 |
| 4a | Patient behaviorsubstance use | 30 | 9 |
| 4b | Patient behavioradherence to discharge plan | 30 | 9 |
| 4c | Patient behaviorrefusal of discharge plan | 3 | 0.9 |
| 5a | Disease complication | 103 | 30.7 |
| 5b | Unrelated condition | 52 | 15.5 |
Variance was statistically significant across major categories for gender, mean age, and median length of stay. The interobserver level of agreement across the 5 major categories was substantial among both pairs of reviewers (Table 4).
| Pair of Reviewers | No. of Readmissions Reviewed | No. of Agreements (%) | Unweighted Kappa |
|---|---|---|---|
| Dr. LinkDr. Bails | 135 | 113 (83.7) | 0.78 |
| Dr. LinkDr. Janjigian | 200 | 163 (81.5) | 0.72 |
The 46 patients who had more than 1, 7‐day readmission during this study period were responsible for 106 readmissions. The majority of this group were readmitted twice (78%), with a range of 2 to 5 readmissions. Within this group, 24% were considered preventable readmissions (8 from category 1, 17 from category 3), and 76% were considered not preventable (10 from category 2, 27 from category 4, and 44 from category 5).
DISCUSSION
The purpose of this retrospective review was to identify causes of unplanned 7‐day readmissions after discharge from the medical service of a large urban teaching hospital. Rather than focus on risk factors for readmissions, which other studies have done, we reviewed charts of readmitted patients using a novel categorization algorithm to group patients into common mechanisms that elucidate why a particular patient was readmitted. By examining the chart in detail, we were able to identify etiologies of readmission that are potentially avoidable.
Some authors have questioned the use of readmissions as a measurement of the quality of care a hospital provides due to the high proportion of unavoidable readmissions in a given sample.[8, 10] We hoped to identify systems errors that could be targets of quality improvement initiatives, and therefore chose to focus entirely on 7‐day readmissions as these have been shown to be more preventable than 30‐day readmissions.[8] We had the ability to review any aspect of the medical chart (eg, vitals or labs on discharge, any clinical note), which provided the highest probability of discovering a systems error. Despite these efforts to identify preventable errors, we identified the most common mechanism of readmission as an unpredictable or unpreventable event related to the primary diagnosis or its treatment from the initial admission (category 5a, 30.7% of total readmissions). Review of examples from this category elucidates how an unpredictable readmission could occur within such a short time frame (see Supporting Information, Appendix 1, in the online version of this article). The 7‐day window precluded identification of clinic access barriers, thereby eliminating from analysis 1 mechanism for preventable readmissions.
Nonetheless, our study demonstrates room for improvement in provider behavior and hospital systems related to the discharge process. Nearly a quarter of all readmissions and the majority of preventable readmissions were related to systems issues, such as timing and coordination of the first discharge, and lack of medical necessity for the second admission (see Supporting Information, Appendix 1, in the online version of this article). Prior studies found that shorter length of stay was associated with increased preventable readmissions, a finding that our study does not support.[10, 11] We suspect that patients in this group had longer lengths of stay during the index hospitalization due to complexity of medical illness, limited social support network, or lack of insurance, among other factors, that exposed flaws in systems processes and provider judgment. The mechanisms of readmission related to discharge planning that we identified in this study, including comprehensiveness of care, coordination of care, and medication administration, all represent potential opportunities for intervention.
Of note, there was a high percentage of readmissions attributable to patient behaviors, such as AMA discharges, substance abuse following discharge, and nonadherence to the treatment plan. These factors are likely over‐represented in the Bellevue patient population compared to that of private hospital settings and no doubt exacerbate the readmission rates in urban hospitals treating patients with a high degree of social and behavioral health needs. Although patient‐related factors such as AMA discharges and substance abuse are potentially addressable, our reviewers felt that these were not preventable based on current knowledge and standards of care.
Studies that have attempted to classify readmissions as potentially avoidable have not shown good interobserver agreement when more than 1 reviewer was involved.[9, 10] Additionally, there is not a validated tool available to classify types of readmissions. By using a pilot sample of 84 cases to develop the model, confirming the accuracy of the chart by personally interviewing a sample of readmitted patients for comparison, and by employing experienced inpatient attending physicians to perform the reviews, we were able to develop an algorithm that achieved substantial reliability in assigning each readmission into 1 of 5 distinct categories.
Our literature search revealed only a single study that attempted to classify readmissions in a similar manner. Readmissions within 6 months at 9 Veterans Affairs hospitals were classified into causal categories of systems, provider, and patient etiology.[9] Overall, 34% of readmissions were deemed to be preventable compared to 24% in our study. Most readmissions (68%) were due to a worsening of a clinical condition, 4.5% were attributed to the admitting provider having too low a threshold to justify admission, and 2.7% were due to the patient not abstaining from drugs or alcohol. Though the study design and patient population differed from our own, the similarities in methods and results lend validity to the results and conclusions of our study.
Another limitation of our study is that readmissions to other hospitals were not included. In this respect, our estimate of the rate of readmission was an understatement of the true value. Nonetheless, the categorization of causes for readmission was not likely to be affected by the site of the second admission. Another limitation of this study was the small number of subjects reviewed relative to other studies that analyzed demographics and risk factors in large databases of readmissions.[12] However, the depth of the present review provides an understanding of the sequence of events leading to the readmission and permits development of strategies to prevent their occurrence.
We identified mechanisms of readmissions that can lay the groundwork for future interventions and safely reduce readmissions rates at little cost. To reduce admissions that may not be medically necessary, the narratives presented in the supplementary appendix suggest that improvement in communication between the admitting provider for the readmission and a provider familiar with the patient could have led to avoidance of the readmission. Similarly, enhanced communication to receiving nursing facilities would decrease the chances of the patient being immediately sent back as occurred multiple times in our cohort. Formal mandatory assessment of functional status for vulnerable patients would identify patients who may not be fully ready for discharge.
In conclusion, we found through detailed chart review of patients readmitted within 7 days to an urban teaching hospital that the majority of readmissions were not avoidable and were due to unpredictable complications of the primary diagnosis from the index hospitalization or a condition unrelated to the initial stay. This conclusion, in concurrence with those of other studies,[8, 10] questions the value of a readmission as a valid metric of quality though supports further improvements in hospital systems to reduce preventable readmissions.
Disclosure
Nothing to report.
- , , . Rehospitalizations among patients in the Medicare fee‐for‐service program. N Engl J Med. 2009;360(14):1418–1428.
- , . The rate and cost of hospital readmissions for preventable conditions. Med Care Res Rev. 2004;61(2):225–240.
- Centers for Medicare and Medicaid Services. 9th scope of work version #080108‐0. Available at: http://www.cms.gov/Medicare/Quality‐Initiatives‐Patient‐Assessment‐Instruments/QualityImprovementOrgs/downloads/9thSOWBaseContract_C_08‐01‐2008_2_.pdf. Accessed April 10, 2014.
- , . Hospital readmissions in the Medicare population. N Engl J Med. 1984;311(21):1349–1353.
- U.S. Department of Health 155(8):520–528.
- , , , et al. Incidence of potentially avoidable urgent readmissions and their relation to all‐cause urgent readmissions. CMAJ. 2011;183(14):E1067–E1072.
- , , , et al. Classifying general medicine readmissions. Are they preventable? Veterans Affairs Cooperative Studies in Health Services Group on Primary Care and Hospital Readmissions. J Gen Intern Med. 1996;11(10):597–607.
- , , , . Hospitalists assess the causes of early hospital readmissions. J Hosp Med. 2011;6(7):383–388.
- , , . Early readmissions to the department of medicine as a screening tool for monitoring quality of care problems. Medicine. 2008;87(5):294–300.
- , , , et al. Incidence and predictors of all and preventable adverse drug reactions in frail elderly persons after hospital stay. J Gerontol A Biol Sci Med Sci. 2006;61(5):511–515.
© 2015 Society of Hospital Medicine
