User login
TEE Impact on Managing Stroke Patients
Specific transesophageal echocardiography (TEE) findings associated with stroke include cardiac thrombi (particularly left atrial appendage [LAA]), left atrial spontaneous echo contrast, interatrial septal anomalies (particularly patent foramen ovale [PFO]), and atheromatous disease of the aorta. In younger patients (aged <50 years) with stroke of uncertain etiology, TEE is often recommended because of reported higher yield than transthoracic echocardiogram (TTE), particularly in detecting PFO or atrial septal aneurysm (ASA).[1]
Aside from oral anticoagulation in patients with an intracardiac thrombus, current guidelines and scientific evidence do not support specific therapeutic interventions for the other TEE findings. For example, the most effective therapy for stroke prevention with findings of aortic arch plaque remains uncertain. In addition, the very rare patient presenting with stroke from a cardiac tumor, which is generally visible on TTE, might benefit from surgical removal.[2]
We sought to examine the benefit of performing TEE after a normal TTE in patients over age 50 years admitted with a stroke of uncertain etiology. We hypothesized that there would be minimal change in management based on TEE findings after a normal TTE in older patients hospitalized with an unexplained stroke.
METHODS
Over a 4‐year period from 2009 to 2012, all patients over the age of 50 years admitted to our community‐based teaching hospital with a primary diagnosis of ischemic stroke were identified and retrospectively screened by review of our institutional echocardiography database during this time period. Stroke diagnosis had to be confirmed with acute or subacute ischemia on brain magnetic resonance imaging. Patients with an indication for anticoagulation or who had a known history of atrial fibrillation or flutter were excluded. Patients were monitored with continuous telemetry during hospital admission and were also excluded if they developed atrial fibrillation or flutter after admission. Additionally, patients were excluded if a neurologist‐directed evaluation revealed another etiology for the stroke.
A TTE acquired in all patients was performed according to Intersocietal Commission for the Accreditation of Echocardiography Laboratories standards and included 2‐dimensional, color Doppler, continuous wave, and pulse wave data. Images were obtained in the parasternal long and short axis, apical 4‐chamber, 2‐chamber, and long axis views. An abnormal TTE was defined as a study with a prosthetic valve, abnormal left ventricular (LV) systolic function, an intracardiac mass, intracardiac shunt, or severe valvular heart disease, as these significant findings may explain stroke.
Standardized TEE images were obtained with midesophageal 4‐chamber, mitral commissural, 2‐chamber, long axis, ascending aorta long axis, aortic valve short axis, right ventricular inflow‐outflow, and bicaval views. Detailed multiplanar evaluation of the LAA was performed. If no interatrial shunt was visualized with color flow Doppler in the bicaval view, agitated intravenous saline was administered for further evaluation. Additional standard images were obtained of the descending aorta and aortic arch in the short and long axis. Transgastric images were obtained when feasible or necessary.
The study was submitted to our institutional review board. As no patient identifiers were stored, and we used previously existing data from an institutional echocardiography database to conduct the study, it was determined to be exempt.
Statistical analysis was performed by recording the prevalence of each potential cardiac source of embolism.
RESULTS
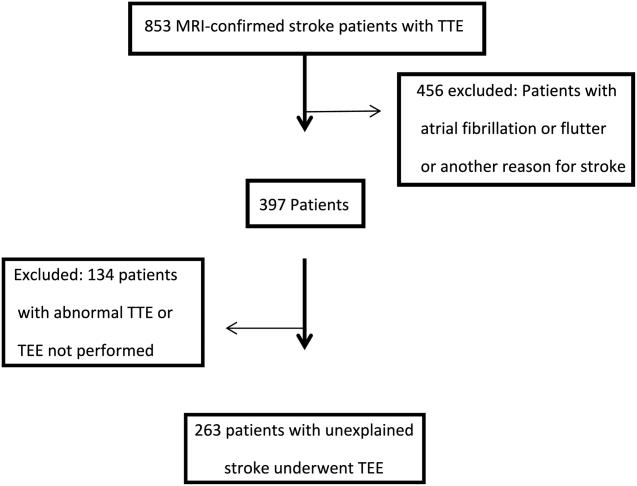
Of the 853 consecutive patients screened, 456 were excluded because of atrial fibrillation, atrial flutter, or another etiology of stroke. An additional 134 patients were excluded with an abnormal TTE or if a TEE was not performed. The remaining 263 patients were analyzed based on TEE findings (Figure 1).
The mean age was 66.7 years (range, 5091 years), and 42.5% were female. A possible etiology of stroke (Table 1) discovered included complex plaque of the ascending aorta or arch 44/263 (16.7%), PFO 18/263 (6.8%), atrial septal aneurysm 25/263 (9.5%), and both ASA and PFO in 11/263 (4.2%), and spontaneous contrast was seen in the left atrium or LAA in 13/263 (4.9%) patients. One patient had a thrombus in the LAA for which anticoagulation was prescribed. No other intracardiac masses were identified.
| Potential Source | No. (%) |
|---|---|
| |
| Atrial septal aneurysm | 25 (5.3%) |
| Patent foramen ovale | 18 (2.7%) |
| Atrial septal aneurysm and patent foramen ovale | 11 (4.2%) |
| Complex aortic plaque | 44 (16.7%) |
| Spontaneous contrast | 13 (4.9%) |
| Left atrial appendage thrombus* | 1 (0.4%) |
| Total | 112 (42.6%) |
Overall, 42.6% of patients had a TEE finding which could explain the etiology of stroke or transient ischemic attack (TIA), but only 1 patient (0.4%) had a finding that changed therapy. Follow‐up was available at 6 months for 85 patients, and 13 (15%) of these patients had been discovered to develop atrial fibrillation in the interim.
DISCUSSION
Our study retrospectively analyzed the utility of TEE in patients over age 50 years admitted with ischemic stroke without a clear etiology. We found that TEE provides significant incremental diagnostic benefit as compared to TTE in identifying a possible etiology of stroke in these patients. This is consistent with prior studies showing a high diagnostic yield of TEE in patient with ischemic stroke of uncertain etiology.[3] However, in our study, based on current guidelines, virtually none of these findings directly altered patient management.
The 2014 guidelines for secondary stroke prevention recommend antiplatelet and statin therapy (in addition to lifestyle modification, smoking cessation, and blood glucose and blood pressure control) as a standard medical regimen in patients with stroke or TIA of uncertain etiology. The finding of aortic arch atheroma does not warrant supplementary treatment in addition to an antiplatelet and statin according to current guidelines. Atherosclerosis of the aortic arch is an important source of cerebral embolism, particularly in cases where plaque is >4 mm in size.[4] A recent study by Amarenco et al., comparing efficacy of combined antiplatelet therapy (clopidogrel and aspirin) to warfarin in recurrent stroke prevention in patients with >4 mm aortic arch plaque, showed nonsignificant reduction in rate of recurrent stroke with dual antiplatelet therapy.[5] However, optimal therapy for these patients still remains uncertain beyond standard stroke‐prevention treatment. Although there are emerging data on therapeutic options in patients with complex atheroma, there is currently no specific guideline‐recommended therapy or consensus among stroke neurologists. Potentially, if an individual practitioner had a strong feeling on therapeutic modifications based on the presence of complex aortic arch atheroma, the TEE would have value to their patient. However, in our study, which had a prevalence of 16.8% of complex plaque of the ascending aorta or arch, there were no therapeutic changes based on this finding. This reinforces the limited value of this test that we observed in our study population.
Anticoagulation has not been shown to be superior to aspirin in patients with PFO (with or without ASA), and recent studies showed no benefit of procedural PFO closure compared to best medical management for stroke prevention (Randomized Evaluation of Recurrent Stroke Comparing PFO Closure to Established Current Standard of Care Treatment [RESPECT], Evaluation of the STARFlex Septal Closure System in Patients with a Stroke and/or Transient Ischemic Attack due to Presumed Paradoxical Embolism through a Patent Foramen Ovale [CLOSURE I]).[6, 7] However, a patient with a PFO and deep vein thrombosis would benefit from anticoagulation and consideration of PFO closure.[8] This rare entity could be excluded with a simple lower extremity duplex without the need for a TEE, which does come with a small risk of complications related to anesthesia and local oropharyngeal trauma as well as discomfort to the patient and increased cost. Spontaneous echo contrast is not an independent indication for anticoagulation. If spontaneous contrast were associated with mitral stenosis and an embolic event, then anticoagulation would be indicated.[9] Mitral stenosis is easily diagnosed with TTE.
LAA or left atrial thrombus is the predominant finding exclusive to TEE that would change management for secondary stroke prevention, specifically anticoagulation. Fifteen studies representing over 3000 patients in a 2014 meta‐analysis reported the prevalence of left atrial or LAA thrombus in patients aged 55 years with a cryptogenic stroke to be 4%, with a range in the studies of 0% to 21.2%.[3] The wide range of prevalence of this finding is likely related to the prevalence of known atrial arrhythmias or structural heart disease in the population of patients included in the analysis. Left atrial or LAA thrombus in the absence of systolic dysfunction, severe valve disease, or known atrial fibrillation is exceedingly uncommon (0.3%).[10] It is likely that the few patients with left atrial or LAA thrombus without 1 of these conditions probably has undiagnosed paroxysmal atrial fibrillation. In previous studies that showed a high prevalence of left atrial or LAA thrombus, there was no mention of the presence or absence of LV dysfunction or severe valve disease in patients with left atrial or LAA thrombus. Additionally, these studies only required a 12‐lead electrocardiogram or did not specify the presence or duration of continuous rhythm monitoring.[11, 12, 13, 14] Several of the studies with high incidence of left atrial or LAA thrombus specifically stated that some of these patients were known to have atrial fibrillation.[11, 13]
Approximately 8% of patients admitted with stroke are found to have atrial fibrillation only after admission with continuous electrocardiogram monitoring. The detection rate is nearly half if monitoring is limited to 24 hours instead of several days. Overall, detection rates of atrial fibrillation following stroke are relatively low during initial hospitalization.[15] More intense monitoring for atrial fibrillation in patients with a stroke of uncertain etiology with the use of a subcutaneous implantable cardiac monitor increases the detection rate to 12.4% at 1 year, and increases with longer monitoring time.[16] Therefore, identification of older stroke patients without significant stroke risk factors may be candidates for longer‐term cardiac monitoring to increase yield for detection of atrial fibrillation. Currently, continuous electrocardiographic monitoring of patients for the duration of their hospitalization and up to 30 days afterward is recommended.[8]
Our study differs from prior studies that showed a much higher prevalence of LAA or left atrial thrombus in 2 important ways. Patients with severe valve disease or LV dysfunction were excluded on the basis of TTE. Additionally, our patients underwent continuous electrocardiographic monitoring for the duration of their hospitalization and were excluded with a prior history or newly discovered atrial fibrillation or flutter. Our intention was to examine the value of adding TEE when no other etiology of stroke was identified. Value can be defined as healthcare outcomes achieved per dollar spent. Our study was not designed to look at long‐term outcomes; rather, we used immediate change in patient management as a surrogate.
There are several limitations to our study that must be noted. This was a single‐center study potentially creating a bias as less stringent selection of patients undergoing TEE may be the practice at other institutions. This analysis was retrospective; therefore, there may have been bias as to which patients were selected to undergo TEE. Additionally, stroke subtype was not specified, and the pretest probability of a cardioembolic source differs based on subtype. Last, we focused this study on immediate changes in clinical management prompted by TEE results, and did not assess patient perceptions of TEE value related to enhanced knowledge about the etiology of their stroke; this area represents an opportunity for further research.
CONCLUSIONS
TEE provides a substantial increase in possible explanation of stroke etiology in patients over age 50 years admitted with a stroke of uncertain cause and a normal TTE. However, there is minimal incremental value in regard to change in therapeutic management in these patients. In a time of increased focus on providing cost effective healthcare, our findings suggest that the need for TEE in this stroke population should be more closely examined.
Disclosure: Nothing to report.
- , , . Influence of transesophageal echocardiogram on therapy and prognosis in young patients with TIA or ischemic stroke. Neth Heart J. 2009;17:373–377.
- , , , et al. Diagnosis of Heart Tumors by Transesophageal Echocardiography: a multicentre study in 154 patients. Eur Heart J. 1993;14:1223–1228.
- , , , , , . Transesophageal echocardiography in patients with cryptogenic ischemic stroke: a systematic review. Am Heart J. 2014;168:706–712.
- , , . Protruding atheromas in the thoracic aorta and systemic embolization. Ann Intern Med. 1991;115:423–427.
- , , , et al.; The Aortic Arch Related Cerebral Hazard Trial Investigators. Clopidogrel plus aspirin versus warfarin in patients with stroke and aortic arch plaques. Stroke. 2014;45:1248–1257.
- , , , et al.; RESPECT Investigators. Closure of patent foramen ovale versus medical therapy after cryptogenic stroke. N Engl J Med. 2013;368:1092–1100.
- , , , et al.; CLOSURE I Investigators. Closure or medical therapy for cryptogenic stroke with patent foramen ovale. N Engl J Med. 2012;366:991–999.
- , , , et al. Guidelines for the prevention of stroke in patients with stroke and transient ischemic attack: a guideline for healthcare professionals from the American Heart Association/American Stroke Association. Stroke. 2014;45(7):2160–2236.
- , , , et al. 2014 AHA/ACA guideline for the management of patients with valvular heart disease. J Am Coll Cardiol. 2014; 63:e57–e185.
- , , , . Clinical and echocardiographic characteristics of patients with left atrial thrombus and sinus rhythm: experience in 20 643 consecutive transesophageal echocardiographic examinations. Circulation. 2002;105(1):27–31.
- , , , et al. Usefulness of transesophageal echocardiography in unexplained cerebral ischemia. Am J Cardiol. 1993;72:1448–1452.
- , , , , , . Transesophageal echocardiography in patients with recent stroke and normal carotid arteries. Am J Cardiol. 2001;88:820–823.
- , , , et al. Transesophageal echocardiography is superior to transthoracic echocardiography in management of patients of any age with transient ischemic attack or stroke. Stroke. 2006;37:2531–2534.
- , , , , , . Age‐dependent prevalence of cardioembolic sources detected by TEE: diagnostic and therapeutic implications. Echocardiography. 1997;14:597–606.
- , , , et al. Continuous stroke unit electrocardiographic monitoring versus 24‐hour Holter electrocardiography for detection of paroxysmal atrial fibrillation after stroke. Stroke. 2012;43:2689–2694.
- , , , et al.; CRYSTAL AF Investigators. Cryptogenic stroke and underlying atrial fibrillation. N Engl J Med. 2014;370(26):2478–2486.
Specific transesophageal echocardiography (TEE) findings associated with stroke include cardiac thrombi (particularly left atrial appendage [LAA]), left atrial spontaneous echo contrast, interatrial septal anomalies (particularly patent foramen ovale [PFO]), and atheromatous disease of the aorta. In younger patients (aged <50 years) with stroke of uncertain etiology, TEE is often recommended because of reported higher yield than transthoracic echocardiogram (TTE), particularly in detecting PFO or atrial septal aneurysm (ASA).[1]
Aside from oral anticoagulation in patients with an intracardiac thrombus, current guidelines and scientific evidence do not support specific therapeutic interventions for the other TEE findings. For example, the most effective therapy for stroke prevention with findings of aortic arch plaque remains uncertain. In addition, the very rare patient presenting with stroke from a cardiac tumor, which is generally visible on TTE, might benefit from surgical removal.[2]
We sought to examine the benefit of performing TEE after a normal TTE in patients over age 50 years admitted with a stroke of uncertain etiology. We hypothesized that there would be minimal change in management based on TEE findings after a normal TTE in older patients hospitalized with an unexplained stroke.
METHODS
Over a 4‐year period from 2009 to 2012, all patients over the age of 50 years admitted to our community‐based teaching hospital with a primary diagnosis of ischemic stroke were identified and retrospectively screened by review of our institutional echocardiography database during this time period. Stroke diagnosis had to be confirmed with acute or subacute ischemia on brain magnetic resonance imaging. Patients with an indication for anticoagulation or who had a known history of atrial fibrillation or flutter were excluded. Patients were monitored with continuous telemetry during hospital admission and were also excluded if they developed atrial fibrillation or flutter after admission. Additionally, patients were excluded if a neurologist‐directed evaluation revealed another etiology for the stroke.
A TTE acquired in all patients was performed according to Intersocietal Commission for the Accreditation of Echocardiography Laboratories standards and included 2‐dimensional, color Doppler, continuous wave, and pulse wave data. Images were obtained in the parasternal long and short axis, apical 4‐chamber, 2‐chamber, and long axis views. An abnormal TTE was defined as a study with a prosthetic valve, abnormal left ventricular (LV) systolic function, an intracardiac mass, intracardiac shunt, or severe valvular heart disease, as these significant findings may explain stroke.
Standardized TEE images were obtained with midesophageal 4‐chamber, mitral commissural, 2‐chamber, long axis, ascending aorta long axis, aortic valve short axis, right ventricular inflow‐outflow, and bicaval views. Detailed multiplanar evaluation of the LAA was performed. If no interatrial shunt was visualized with color flow Doppler in the bicaval view, agitated intravenous saline was administered for further evaluation. Additional standard images were obtained of the descending aorta and aortic arch in the short and long axis. Transgastric images were obtained when feasible or necessary.
The study was submitted to our institutional review board. As no patient identifiers were stored, and we used previously existing data from an institutional echocardiography database to conduct the study, it was determined to be exempt.
Statistical analysis was performed by recording the prevalence of each potential cardiac source of embolism.
RESULTS
Of the 853 consecutive patients screened, 456 were excluded because of atrial fibrillation, atrial flutter, or another etiology of stroke. An additional 134 patients were excluded with an abnormal TTE or if a TEE was not performed. The remaining 263 patients were analyzed based on TEE findings (Figure 1).
The mean age was 66.7 years (range, 5091 years), and 42.5% were female. A possible etiology of stroke (Table 1) discovered included complex plaque of the ascending aorta or arch 44/263 (16.7%), PFO 18/263 (6.8%), atrial septal aneurysm 25/263 (9.5%), and both ASA and PFO in 11/263 (4.2%), and spontaneous contrast was seen in the left atrium or LAA in 13/263 (4.9%) patients. One patient had a thrombus in the LAA for which anticoagulation was prescribed. No other intracardiac masses were identified.
| Potential Source | No. (%) |
|---|---|
| |
| Atrial septal aneurysm | 25 (5.3%) |
| Patent foramen ovale | 18 (2.7%) |
| Atrial septal aneurysm and patent foramen ovale | 11 (4.2%) |
| Complex aortic plaque | 44 (16.7%) |
| Spontaneous contrast | 13 (4.9%) |
| Left atrial appendage thrombus* | 1 (0.4%) |
| Total | 112 (42.6%) |
Overall, 42.6% of patients had a TEE finding which could explain the etiology of stroke or transient ischemic attack (TIA), but only 1 patient (0.4%) had a finding that changed therapy. Follow‐up was available at 6 months for 85 patients, and 13 (15%) of these patients had been discovered to develop atrial fibrillation in the interim.
DISCUSSION
Our study retrospectively analyzed the utility of TEE in patients over age 50 years admitted with ischemic stroke without a clear etiology. We found that TEE provides significant incremental diagnostic benefit as compared to TTE in identifying a possible etiology of stroke in these patients. This is consistent with prior studies showing a high diagnostic yield of TEE in patient with ischemic stroke of uncertain etiology.[3] However, in our study, based on current guidelines, virtually none of these findings directly altered patient management.
The 2014 guidelines for secondary stroke prevention recommend antiplatelet and statin therapy (in addition to lifestyle modification, smoking cessation, and blood glucose and blood pressure control) as a standard medical regimen in patients with stroke or TIA of uncertain etiology. The finding of aortic arch atheroma does not warrant supplementary treatment in addition to an antiplatelet and statin according to current guidelines. Atherosclerosis of the aortic arch is an important source of cerebral embolism, particularly in cases where plaque is >4 mm in size.[4] A recent study by Amarenco et al., comparing efficacy of combined antiplatelet therapy (clopidogrel and aspirin) to warfarin in recurrent stroke prevention in patients with >4 mm aortic arch plaque, showed nonsignificant reduction in rate of recurrent stroke with dual antiplatelet therapy.[5] However, optimal therapy for these patients still remains uncertain beyond standard stroke‐prevention treatment. Although there are emerging data on therapeutic options in patients with complex atheroma, there is currently no specific guideline‐recommended therapy or consensus among stroke neurologists. Potentially, if an individual practitioner had a strong feeling on therapeutic modifications based on the presence of complex aortic arch atheroma, the TEE would have value to their patient. However, in our study, which had a prevalence of 16.8% of complex plaque of the ascending aorta or arch, there were no therapeutic changes based on this finding. This reinforces the limited value of this test that we observed in our study population.
Anticoagulation has not been shown to be superior to aspirin in patients with PFO (with or without ASA), and recent studies showed no benefit of procedural PFO closure compared to best medical management for stroke prevention (Randomized Evaluation of Recurrent Stroke Comparing PFO Closure to Established Current Standard of Care Treatment [RESPECT], Evaluation of the STARFlex Septal Closure System in Patients with a Stroke and/or Transient Ischemic Attack due to Presumed Paradoxical Embolism through a Patent Foramen Ovale [CLOSURE I]).[6, 7] However, a patient with a PFO and deep vein thrombosis would benefit from anticoagulation and consideration of PFO closure.[8] This rare entity could be excluded with a simple lower extremity duplex without the need for a TEE, which does come with a small risk of complications related to anesthesia and local oropharyngeal trauma as well as discomfort to the patient and increased cost. Spontaneous echo contrast is not an independent indication for anticoagulation. If spontaneous contrast were associated with mitral stenosis and an embolic event, then anticoagulation would be indicated.[9] Mitral stenosis is easily diagnosed with TTE.
LAA or left atrial thrombus is the predominant finding exclusive to TEE that would change management for secondary stroke prevention, specifically anticoagulation. Fifteen studies representing over 3000 patients in a 2014 meta‐analysis reported the prevalence of left atrial or LAA thrombus in patients aged 55 years with a cryptogenic stroke to be 4%, with a range in the studies of 0% to 21.2%.[3] The wide range of prevalence of this finding is likely related to the prevalence of known atrial arrhythmias or structural heart disease in the population of patients included in the analysis. Left atrial or LAA thrombus in the absence of systolic dysfunction, severe valve disease, or known atrial fibrillation is exceedingly uncommon (0.3%).[10] It is likely that the few patients with left atrial or LAA thrombus without 1 of these conditions probably has undiagnosed paroxysmal atrial fibrillation. In previous studies that showed a high prevalence of left atrial or LAA thrombus, there was no mention of the presence or absence of LV dysfunction or severe valve disease in patients with left atrial or LAA thrombus. Additionally, these studies only required a 12‐lead electrocardiogram or did not specify the presence or duration of continuous rhythm monitoring.[11, 12, 13, 14] Several of the studies with high incidence of left atrial or LAA thrombus specifically stated that some of these patients were known to have atrial fibrillation.[11, 13]
Approximately 8% of patients admitted with stroke are found to have atrial fibrillation only after admission with continuous electrocardiogram monitoring. The detection rate is nearly half if monitoring is limited to 24 hours instead of several days. Overall, detection rates of atrial fibrillation following stroke are relatively low during initial hospitalization.[15] More intense monitoring for atrial fibrillation in patients with a stroke of uncertain etiology with the use of a subcutaneous implantable cardiac monitor increases the detection rate to 12.4% at 1 year, and increases with longer monitoring time.[16] Therefore, identification of older stroke patients without significant stroke risk factors may be candidates for longer‐term cardiac monitoring to increase yield for detection of atrial fibrillation. Currently, continuous electrocardiographic monitoring of patients for the duration of their hospitalization and up to 30 days afterward is recommended.[8]
Our study differs from prior studies that showed a much higher prevalence of LAA or left atrial thrombus in 2 important ways. Patients with severe valve disease or LV dysfunction were excluded on the basis of TTE. Additionally, our patients underwent continuous electrocardiographic monitoring for the duration of their hospitalization and were excluded with a prior history or newly discovered atrial fibrillation or flutter. Our intention was to examine the value of adding TEE when no other etiology of stroke was identified. Value can be defined as healthcare outcomes achieved per dollar spent. Our study was not designed to look at long‐term outcomes; rather, we used immediate change in patient management as a surrogate.
There are several limitations to our study that must be noted. This was a single‐center study potentially creating a bias as less stringent selection of patients undergoing TEE may be the practice at other institutions. This analysis was retrospective; therefore, there may have been bias as to which patients were selected to undergo TEE. Additionally, stroke subtype was not specified, and the pretest probability of a cardioembolic source differs based on subtype. Last, we focused this study on immediate changes in clinical management prompted by TEE results, and did not assess patient perceptions of TEE value related to enhanced knowledge about the etiology of their stroke; this area represents an opportunity for further research.
CONCLUSIONS
TEE provides a substantial increase in possible explanation of stroke etiology in patients over age 50 years admitted with a stroke of uncertain cause and a normal TTE. However, there is minimal incremental value in regard to change in therapeutic management in these patients. In a time of increased focus on providing cost effective healthcare, our findings suggest that the need for TEE in this stroke population should be more closely examined.
Disclosure: Nothing to report.
- , , . Influence of transesophageal echocardiogram on therapy and prognosis in young patients with TIA or ischemic stroke. Neth Heart J. 2009;17:373–377.
- , , , et al. Diagnosis of Heart Tumors by Transesophageal Echocardiography: a multicentre study in 154 patients. Eur Heart J. 1993;14:1223–1228.
- , , , , , . Transesophageal echocardiography in patients with cryptogenic ischemic stroke: a systematic review. Am Heart J. 2014;168:706–712.
- , , . Protruding atheromas in the thoracic aorta and systemic embolization. Ann Intern Med. 1991;115:423–427.
- , , , et al.; The Aortic Arch Related Cerebral Hazard Trial Investigators. Clopidogrel plus aspirin versus warfarin in patients with stroke and aortic arch plaques. Stroke. 2014;45:1248–1257.
- , , , et al.; RESPECT Investigators. Closure of patent foramen ovale versus medical therapy after cryptogenic stroke. N Engl J Med. 2013;368:1092–1100.
- , , , et al.; CLOSURE I Investigators. Closure or medical therapy for cryptogenic stroke with patent foramen ovale. N Engl J Med. 2012;366:991–999.
- , , , et al. Guidelines for the prevention of stroke in patients with stroke and transient ischemic attack: a guideline for healthcare professionals from the American Heart Association/American Stroke Association. Stroke. 2014;45(7):2160–2236.
- , , , et al. 2014 AHA/ACA guideline for the management of patients with valvular heart disease. J Am Coll Cardiol. 2014; 63:e57–e185.
- , , , . Clinical and echocardiographic characteristics of patients with left atrial thrombus and sinus rhythm: experience in 20 643 consecutive transesophageal echocardiographic examinations. Circulation. 2002;105(1):27–31.
- , , , et al. Usefulness of transesophageal echocardiography in unexplained cerebral ischemia. Am J Cardiol. 1993;72:1448–1452.
- , , , , , . Transesophageal echocardiography in patients with recent stroke and normal carotid arteries. Am J Cardiol. 2001;88:820–823.
- , , , et al. Transesophageal echocardiography is superior to transthoracic echocardiography in management of patients of any age with transient ischemic attack or stroke. Stroke. 2006;37:2531–2534.
- , , , , , . Age‐dependent prevalence of cardioembolic sources detected by TEE: diagnostic and therapeutic implications. Echocardiography. 1997;14:597–606.
- , , , et al. Continuous stroke unit electrocardiographic monitoring versus 24‐hour Holter electrocardiography for detection of paroxysmal atrial fibrillation after stroke. Stroke. 2012;43:2689–2694.
- , , , et al.; CRYSTAL AF Investigators. Cryptogenic stroke and underlying atrial fibrillation. N Engl J Med. 2014;370(26):2478–2486.
© 2015 Society of Hospital Medicine

Patients with
Staphylococcus aureus is one the most common pathogens isolated in nosocomial and community‐onset bloodstream infections (BSI) in the United States.[1, 2] S aureus bacteremia (SAB) has been reported in the literature to have substantial morbidity and mortality, with rates ranging between 15% and 60% worldwide.[3, 4, 5, 6] In the United States, patients with infections due to S aureus have on average 3 times the length of hospital stay than inpatients without these infections (14.3 days vs 4.5 days; P<0.01).[7] Healthcare costs are negatively impacted by these infections. In a recent meta‐analysis, Zimlichman et al.[8] reported that central‐line BSI (CLABSI) and surgical‐site infection (SSI) caused by methicillin‐resistant S aureus (MRSA) resulted in the highest estimated costs associated with hospital‐acquired infections in the United States ($58,614 [95% CI: $16,760‐$174,755] for CLABSI and $42,300 [95% CI: $4,005‐$82,670] for SSIs).
Appropriate management of SAB includes not only selecting the correct antimicrobial based on susceptibilities but also timely control of the source of infection, appropriate use of ancillary studies when indicated, and pharmacokinetic and pharmacodynamic therapeutic monitoring of antimicrobial therapy when vancomycin is used.[9] Consultation with an infectious diseases (ID) specialist has been associated with increased compliance with evidence‐based strategies in the management of SAB,[10, 11, 12, 13, 14] such as appropriate antibiotic choice, optimized duration of treatment, removal of the source of infection, and better use of cardiac echocardiography, resulting in improved outcomes.[13, 14]
Some, but not all, institutions have adopted bundles,[14] mandatory ID consultation[10] or daily prospective audit and feedback review[15] as part of antimicrobial stewardship program (ASP) interventions aiming to optimize the management of SABs. As part of our ASP quality improvement activities we performed the present study to determine our institutional rate of clinical failure in the treatment of SAB, to identify current practice patterns in the delivery of processes of care, and evaluate their association with clinical outcomes of hospitalized patients with SAB to identify future areas of improvement.
METHODS
A retrospective cohort study was performed at a 1558 licensed‐bed tertiary teaching hospital in Miami, Florida. All hospitalized patients 18 years of age or older with at least 1 positive blood culture with MRSA or methicillin‐susceptible S aureus (MSSA) between January 1, 2012 and April 30, 2013 were included. Patients were identified from the electronic microbiology laboratory database. For the purposes of this study, only the first episode of SAB was included in the analysis. Patients were excluded if aged younger than 18 years or if SAB was detected in an outpatient setting. The primary outcome was clinical failure, defined as a composite endpoint of in‐hospital mortality or persistent bacteremia; persistent bacteremia was defined as bacteremia for 7 or more days after the first positive blood culture. S aureus isolates were identified by standard methods.[16] Species identification was performed by latex agglutination. Antimicrobial susceptibility testing was performed using an automated system (Vitek 2; bioMerieux, Durham, NC) according to standard guidelines.
Data collected included baseline demographics, comorbidities, and treating healthcare provider's service; provider's service was categorized into 1 of 5 groups: internal medicine (academic), internal medicine (hospitalist), surgery, trauma, or neurosurgery. Duration of bacteremia was recorded and defined as the time between first positive and first negative blood culture. The time of first positive culture was defined as the date in which the culture was obtained. Patients who failed to have at least 1 follow‐up blood culture were not counted toward the main outcome. Additionally, presence of a foreign body (cardiac device, orthopedic prosthesis, tunneled catheter, nontunneled catheter) and presumed source of infection as documented in the electronic medical record by the treating service was also collected. Infections were considered community associated when onset of bacteremia occurred within the first 72 hours of admission, and hospital associated if onset of bacteremia occurred after 72 hours of admission.
Based on current practice guidelines,[9] the variables considered processes of care were the time to obtain the first follow‐up blood culture, time from first positive blood culture to initiation of appropriate antibiotic therapy (defined as a loading dose of vancomycin of 15 mg/kg, or a ‐lactam if the organism was susceptible), time to obtain the first vancomycin trough (when indicated), time from first positive blood culture to consultation with ID specialist, appropriate antibiotic de‐escalation (vancomycin to ‐lactam antibiotic if the organism was susceptible and the patient had no allergies or contraindications), and obtaining an echocardiographic study (transthoracic echocardiogram or transesophageal echocardiogram).
Statistical analyses were performed using SAS 9.2 (SAS Institute, Cary, NC). Differences in proportions were analyzed with 2 or Fisher exact test, accordingly. Differences in means among continuous variables were evaluated using independent samples of paired samples t tests as appropriate for the analysis. Continuous variables were dichotomized using a clinically established cutoff to determine relative risk (RR). A univariate analysis of risk factors associated with clinical failure was performed. Multivariable analyses were performed using logistic regression. Models were created using the backward stepwise approach and included all variables found to be statistically significant at less than 0.05 level in the univariate model and those of clinical significance. The study was reviewed and approved by the institutional review boards at the University of Miami and Jackson Memorial Hospital.
RESULTS
During the study period, 241 patients with a first episode of SAB were identified. MRSA and MSSA were isolated in 124 (51.4%) and 117 (48.5%) patients, respectively. Demographic and clinical characteristics of the study population based on isolate are summarized in Table 1. One hundred seventy‐nine (74.3%) patients were under the care of internal medicine services. There was no association between treating service (medical vs surgical) and clinical failure.
| Variable | MRSA, N= 124 (%) | MSSA, N= 117(%) | Overall, N=241 |
|---|---|---|---|
| |||
| Demographics | |||
| Age, y (mean) | 53.915.57 | 53.915.22 | 53.915.3 |
| Age greater than 60 years | 41 (33.1) | 39 (33.3) | 80 (33.2) |
| Male sex | 80 (64.5) | 80 (68.4) | 160 (66.4) |
| White race | 63 (50.8) | 69 (59) | 132 (54.8) |
| Comorbidities | |||
| Diabetes mellitus | 35 (28.2) | 40 (34.2) | 75 (30.7) |
| Hypertension | 56 (45.2) | 40 (34.2) | 96 (39.8) |
| CHF | 6 (4.8) | 9 (7.7) | 15 (6.2) |
| CVD | 8 (6.4) | 6 (5.1) | 14 (5.8) |
| Chronic pulmonary disease | 14 (11.3) | 14 (12) | 28 (11.6) |
| Malignancy | 9 (7.3) | 19 (16.2) | 28 (11.6) |
| Active chemotherapy | 5 (4) | 10 (8.5) | 15 (6.2) |
| HIV | 27 (21.8) | 17 (14.5) | 44 (18.2) |
| Cirrhosis | 6 (4.8) | 8 (6.8) | 14 (5.8) |
| Hepatitis C infection | 7 (5.6) | 11 (9.4) | 18 (7.5) |
| Acute kidney injury | 88 (71) | 80 (68.4) | 168 (69.7) |
| Chronic kidney disease | 29 (23.4) | 24 (20.5) | 53 (22) |
| End‐stage renal disease | 25 (20.2) | 22 (18.8) | 47 (19.5) |
| Connective tissue disease | 3 (2.4) | 3 (2.6) | 6 (2.5) |
| Alcohol abuse | 3 (2.4) | 1 (0.8) | 4 (1.7) |
| IVDU | 4 (3.2) | 5 (4.3) | 9 (3.7) |
| Hemiplegia | 4 (3.2) | 0 | 4 (1.7) |
| Chronic osteomyelitis | 4 (3.2) | 0 | 4 (1.7) |
| History of transplant | 7 (5.6) | 0 | 7 (2.9) |
| Surgery during current admission | 29 (23.4) | 46 (39.3) | 75 (31.1) |
| Surgery during the previous 30 days | 31 (25) | 36 (30.8) | 67 (25.3) |
| Treating service | |||
| Medical service | 89 (71.8) | 90 (76.9) | 179 (74.3) |
| Surgical service | 21 (16.9) | 16 (13.7) | 37 (15.3) |
| Other | 7 (5.6) | 11 (9.4) | 18 (7.5) |
| Presence of foreign body | |||
| PICC line | 24 (19.3) | 34 (29.1) | 58 (24.1) |
| Tunneled CVC | 24 (19.3) | 15 (12.8) | 39 (16.2) |
| Nontunneled CVC | 13 (10.5) | 28 (23.9) | 41 (17) |
| AV fistula | 3 (2.4) | 7 (6) | 10 (4.1) |
| Cardiac device | 8 (6.4) | 9 (7.7) | 17 (7) |
| Other | 4 (3.2) | 11 (9.4) | 15 (6.2) |
| Source of infection | |||
| CLABSI | 32 (25.8) | 21 (17.9) | 53 (22) |
| SSTI | 24 (19.3) | 20 (17.1) | 44 (18.2) |
| Endocarditis | 10 (8.1) | 7 (6) | 17 (7) |
| Thrombophlebitis | 2 (1.6) | 2 (1.7) | 4 (1.7) |
| Prostatic abscess | 3 (2.4) | 1 (0.8) | 4 (1.7) |
| Paravertebral abscess | 2 (1.6) | 2 (1.7) | 4 (1.7) |
| Mediastinal abscess | 2 (1.6) | 1 (0.8) | 3 (1.2) |
| CAP | 4 (3.2) | 4 (3.4) | 8 (3.3) |
| VAP | 3 (2.4) | 2 (1.7) | 5 (2.1) |
| Surgical site infection | 2 (1.6) | 1 (0.8) | 3 (1.2) |
| Ventriculostomy | 0 | 1 (0.8) | 1 (0.4) |
| Bone or joint infection | 2 (1.6) | 3 (2.6) | 5 (2.1) |
| Unknown | 38 (30.6) | 52 (44.4) | 90 (37.3) |
| Onset | |||
| Community onset* | 77 (62.1) | 77 (65.8) | 154 (63.9) |
| Hospital onset | 47 (37.9) | 40 (34.2) | 87 (36.1) |
The onset of infection occurred in the community in 77 (62.1%) patients with MRSA and in 77 (65.8%) patients with MSSA. The documented source of bacteremia was unknown in 30% of patients with MRSA and 44% of those with MSSA BSI. When ID specialists were consulted, patients were more likely to have a source of infection identified (RR: 1.5; 95% confidence interval [CI]: 1.2‐1.8; P<0.0001). The most commonly documented sources of infection were CLABSI, which occurred in 32 (25.8%) patients with MRSA and 21 (17.9%) patients with MSSA, followed by skin and soft tissue infections in 24 (19.3%) patients with MRSA BSI and 20 (17.1%) patients with MSSA BSI. All patients with CLABSI had documentation of catheter removal.
Clinical failure (defined as in‐hospital mortality or persistent bacteremia) occurred in 78 (32.4%) patients. Of these, 50 (20.7%) represented in‐hospital mortality, and 31 (12.9%) had persistent bacteremia. Table 2 summarizes the demographic and clinical characteristics associated with clinical failure. In the univariate analysis, the variables statistically significantly associated with clinical failure were: age greater than 60 years (RR: 1.4; 95% CI: 1.1‐1.8; P=0.001), bacteremia due to MRSA (RR: 1.7; 95% CI: 1.1‐2.5; P=0.008), white race (RR: 0.7; 95% CI: 0.6‐1; P=0.03), acute kidney injury during admission (RR: 2.2; 95% CI: 1.3‐3.7; P=0.004), presence of nontunneled central venous catheters at the onset of bacteremia (RR: 1.9; 95% CI: 1.3‐2.7; P=0.004), and endocarditis (RR: 2.9; 95% CI: 2.1‐3.9; P<0.0001). In the multivariable analysis, age greater than 60 years and endocarditis were found to be independent risk factors for the development of clinical failure.
| Variable | Clinical Failure, N=78 (%) | No Clinical Failure, N=163 (%) | Unadjusted RR (CI) | P Value* | Adjusted OR (CI) | P Value* |
|---|---|---|---|---|---|---|
| ||||||
| Demographics | ||||||
| Age >60 years | 37 (47.4) | 43 (26.4) | 1.4 (1.1‐1.8) | 0.001 | 2.4 (1.2‐4.5) | 0.008 |
| Male | 46 (60) | 114 (69.9) | 0.7 (0.5‐1.04) | 0.09 | ||
| White race | 35 (44.9) | 97 (59.5) | 0.7 (0.6‐1) | 0.03 | 0.5 (0.3‐1.02) | 0.058 |
| Isolate | ||||||
| MRSA | 50 (64.1) | 74 (45.4) | 1.7 (1.1‐2.5) | 0.008 | 1.8 (0.6‐5.2) | 0.3 |
| MSSA | 28 (35.9) | 89 (54.6) | 0.6 (0.4‐0.9) | 0.008 | ||
| Comorbidities | ||||||
| Diabetes mellitus | 21 (26.9) | 54 (33.1) | 0.8 (0.5‐1.2) | 0.34 | ||
| Cirrhosis | 6 (7.7) | 8 (4.9) | 1.3 (0.7‐2.5) | 0.35 | ||
| Acute kidney injury | 65 (83.3) | 103 (63.2) | 2.2 (1.3‐3.7) | 0.004 | 1.6 (0.5‐5.4) | 0.43 |
| Chronic kidney disease | 12 (15.4) | 41 (25.1) | 0.6 (0.4‐1.1) | 0.11 | ||
| End‐stage renal disease | 15 (19.2) | 32 (19.6) | 1 (0.6‐1.5) | 0.94 | ||
| IVDU | 3 (3.8) | 6 (3.7) | 1.03 (0.4‐2.6) | 1 | ||
| Treating service | ||||||
| Medical | 61 (78.2) | 118 (72.4) | 1.3 (0.7‐2.6) | 0.33 | ||
| Surgical | 11 (14.1) | 67 (41.1) | 1 (0.9‐1.1) | 0.71 | ||
| Presence of foreign body | ||||||
| Cardiac device | 6 (7.7) | 11 (6.7) | 1.1 (0.6‐2.1) | 0.78 | ||
| PICC line | 20 (25.6) | 38 (23.3) | 1.1 (0.7‐1.6) | 0.69 | ||
| Nontunneled CVC | 22 (28.2) | 19 (11.7) | 1.9 (1.3‐2.7) | 0.004 | 3.6 (0.7‐17.7) | 0.11 |
| Tunneled CVC | 15 (19.2) | 24 (14.7) | 1.2 (0.8‐1.9) | 0.36 | ||
| AV fistula | 0 | 10 (6.1) | 0.1 (0.09‐2) | 0.15 | ||
| Other | 4 (5.1) | 11 (6.7) | 0.8 (0.3‐1.9) | 0.64 | ||
| Onset | ||||||
| Community onset | 46 (59) | 108 (66.3) | 0.8 (0.6‐1.2) | 0.27 | ||
| Hospital onset | 32 (41) | 55 (33.7) | 1.2 (0.8‐1.8) | 0.27 | ||
| Source | ||||||
| CLABSI | 15 (19.2) | 38 (23.3) | 0.8 (0.5‐1.4) | 0.48 | ||
| SSTI | 12 (15.4) | 32 (19.6) | 0.8 (0.5‐1.4) | 0.44 | ||
| Endocarditis | 14 (17.9) | 3 (1.8) | 2.9 (2.1‐3.9) | <0.0001 | 9.4 (2.2‐1.1) | 0.003 |
| Thrombophlebitis | 0 | 4 (2.4) | 0.3 (0.02‐4.2) | 0.37 | ||
| Prostatic abscess | 1 (1.3) | 3 (1.8) | 0.8 (0.1‐4.2) | 0.76 | ||
| Paravertebral abscess | 0 | 4 (2.4) | 0.3 (0.02‐4.2) | 0.37 | ||
| Mediastinal abscess | 1 (1.3) | 2 (1.2) | 1.03 (0.2‐5.1) | 0.97 | ||
| CAP | 4 (5.1) | 4 (2.4) | 1.5 (0.8‐3.2) | 0.21 | ||
| VAP | 2 (2.6) | 3 (1.8) | 1.2 (0.4‐3.7) | 0.7 | ||
| Surgical site infection | 1 (1.3) | 2 (1.2) | 1.03 (0.2‐5.2) | 0.97 | ||
| Ventriculostomy | 0 | 1 (0.6) | 0.8 (0.1‐8.5) | 0.82 | ||
| Bone or joint infection | 1 (1.3) | 4 (2.4) | 0.6 (0.1‐3.6) | 0.59 | ||
| Unknown | 27 (34.6) | 63 (38.6) | 0.9 (0.6‐1.3) | 0.55 | ||
Performance of Process of Care and Association With Outcomes
The analysis of the performance of the processes of care and outcomes is shown in Table 3. After adjusting for relevant clinical and demographic characteristics, and those with a level of significance of <0.05, obtaining follow‐up blood cultures more than 4 days after the onset of bacteremia independently increased the risk of clinical failure (RR: 6.5; 95% CI: 2.1‐20.5; P=0.001). When consultation with an ID specialist was obtained within the first 6 days from onset of bacteremia, the risk of clinical failure was 0.3 (95% CI: 0.1‐0.9; P=0.03); however, consultation with an ID specialist overall was not associated with clinical failure (RR: 1; 95% CI: 0.7‐1.4; P=0.98).
| Variable | Clinical Failure, n=78 (%) | No Clinical Failure, n=163 (%) | Unadjusted RR (CI) | P Value* | Adjusted OR (CI) | P Value* |
|---|---|---|---|---|---|---|
| ||||||
| Timing of follow‐up blood culture, n=200 | ||||||
| Less than 2 days | 30 (19.2) | 87 (53.4) | 0.7 (0.5‐0.9) | 0.01 | 1.2 (0.5‐2.9) | 0.60 |
| 24 days (ref) | 16 (20.5) | 39 (23.9) | 0.9 (0.8‐1.1) | 0.53 | ||
| More than 4 days | 19 (24.3) | 9 (5.5) | 1.3 (1.1‐1.5) | <0.0001 | 6.6 (2.1‐20.5) | 0.001 |
| Early antibiotic therapy, n=232 | 66 (84.6) | 132 (81) | 1.2 (0.7‐2.3) | 0.45 | ||
| Monitoring of vancomycin levels, n=156 | 37 (20.8) | 97 (59.5) | 0.8 (0.6‐1.03) | 0.09 | ||
| Therapy with ‐lactam, n=103‖ | 7 (8.8) | 49 (30.1) | 0.4 (0.2‐0.8) | 0.01 | 0.1 (0.04‐0.5) | 0.002 |
| Consultation with ID specialist, n=241 | 31 (39.7) | 66 (40.5) | 1 (0.7‐1.4) | 0.98 | ||
| Early consultation with ID specialist, n=97# | 19 (24.3) | 56 (34.3) | 0.5 (0.3‐0.8) | 0.006 | 0.3 (0.1‐0.9) | 0.03 |
| Echocardiography, n=241 | 45 (57.7) | 96 (58.9) | 1 (0.7‐1.4) | 0.86 | ||
| Early echocardiography, n=141** | 35 (44.9) | 91 (55.8) | 0.7 (0.5‐1.07) | 0.11 | ||
A comparison of the average number of days to performance of processes of care is presented in Table 4. Patients with clinical failure had significantly greater elapsed time from the first positive blood culture to the first follow‐up blood culture as compared to those who did not have clinical failure (mean 2.321.3 days vs 3.883.37; P<0.0001). Forty‐one patients (17.1%) failed to have at least 1 follow‐up blood culture.
| Process of Care | Clinical Failure | No Clinical Failure | P Value* |
|---|---|---|---|
| |||
| First follow‐up blood culture, n=200 | 3.883.37 | 2.321.3 | <0.0001 |
| Consultation with infectious diseases, n=97 | 6.96.55 | 4.354.34 | 0.06 |
| First antibiotic dose, n=232 | 0.431.05 | 0.57 1.11 | 0.63 |
| First dose of ‐lactam, n=56 | 4.41.6 | 3.51.4 | 0.1 |
| First vancomycin trough, n=156 | 2.632.04 | 2.552.02 | 0.81 |
| Echocardiography, n=141 | 3.421.74 | 3.312.05 | 0.47 |
Among patients with clinical failure, an ID specialist was consulted at a mean time of 7 days from the onset of bacteremia, compared to patients with no clinical failure in whom a consult was obtained at a mean of 4 days (P=0.06) (Table 4). Overall, ID specialists were only consulted in 97/241 (40.2%) episodes.
Echocardiographic studies were performed in 141/241 (58.5)% of episodes, and they were more likely to be obtained when an ID specialist was consulted (RR: 1.7; 95% CI: 1.4‐2.1; P<0.0001). Lack of performance of these studies was not associated with clinical failure (Table 3).
Antibiotic Administration and De‐escalation of Therapy
There were no significant differences in the average time from the first positive blood culture to the administration of antibiotics between patients who had clinical failure and those who did not (0.571.11 vs 0.431.05; P=0.63) (Table 4).
Patients with MSSA BSI and no documented penicillin allergy were treated with ‐lactam or cephalosporin antibiotics in 56/103(54.3%) episodes. Patients were 2.5 times more likely to receive ‐lactam antibiotics when an ID specialist was consulted (95% CI: 1.8‐3.5; P<0.0001). Among patients with MSSA BSI, treatment with ‐lactams was an independent predictor of decreased risk of clinical failure (RR: 0.2; 95% CI: 0.07‐0.9; P=0.005) (Table 3).
DISCUSSION
Our study showed a significant rate of morbidity associated with S aureus bacteremia and identified processes of care in the management of SAB that impact patient outcomes.
Our results show that early consultation with an ID specialist was associated with a decreased risk of developing clinical failure, increased likelihood of identification of a source of infection, and positively impacted administration of appropriate antibiotic therapy, especially in cases of MSSA BSI, with overall improvement in patient outcomes. However, consultation with an ID specialist was only obtained in 40.2% of our cases, which is consistent with published data.[10, 11, 12, 13] Consultation with an ID specialist itself did not impact clinical failure, but rather timeliness in obtaining expert guidance was associated with better outcomes. As shown in previous studies,[10, 11, 12, 13, 14] compliance with the standards of care and patient prognosis are improved when ID specialists are involved in the management of SAB. Our study reiterates that early consultation with an ID specialist has a positive outcome in patient care, as opposed to delaying consultation once the patient has persistent bacteremia for more than 7 days. This association could be explained by considering that the majority of the standards of care are time sensitive, which include: obtaining surveillance blood cultures 48 to 96 hours after initial detection[10] or initiating therapy,[11, 14] removal of foci of infection,[10, 11, 12, 14] use of parenteral ‐lactams for the treatment of MSSA,[10, 11, 13, 14] performing echocardiography when clinically indicated,[10, 11, 13, 14] and appropriate duration of therapy.[10, 13, 14] Importantly, studies have shown that when ID specialists' recommendations are followed, patients are more likely to be cured,[10, 11, 13] and are less likely to relapse.[10, 11, 12] Given the complexities of treating patients with SAB and high rates of clinical failures, routine guidance could be beneficial to healthcare providers as part of a multidisciplinary structured strategy that is set in motion the moment a patient with SAB is identified by the microbiology laboratory. The processes of care outlined in this this study can serve as quality of care indicators and be integrated into a structured strategy to optimize the management of SAB.
Regarding optimal timing for follow‐up blood cultures, our results show that delays in obtaining follow‐up blood cultures (more than 4 days from onset of bacteremia) was independently associated with increased risk of clinical failure. Timely follow‐up blood cultures have been previously identified as quality of care indicators.[10, 11, 13, 14] Compliance with obtaining follow‐up blood cultures improves when this step is integrated into a bundle of care.[14]
Antimicrobial therapy was promptly initiated in the majority of the patients in our study. However, areas for improvement were identified. Vancomycin was the empirical therapy of choice in most of the cases, but an appropriate dose was only received by 65% of the patients, and vancomycin levels after the fourth dose were obtained in 85.9% of instances when indicated. Although in our cohort these results were not significantly associated with clinical failure, previous studies have described attainment of a target therapeutic vancomycin trough (1520 mg/dL) as a factor for treatment success.[17, 18] This problem could be addressed through physician education on therapeutic drug monitoring,[19] as well as through an ASP intervention, which have successfully led efforts to improve vancomycin utilization and dosing.[20] Among patients with MSSA BSI, therapy with ‐lactams was associated with improved outcomes, and was more likely to be administered when an ID specialist was consulted. This is in accordance with previous studies that have shown that higher rates of appropriate antimicrobial therapy are achieved when ID specialists are involved in management of SAB.[10, 11, 13, 14] The use of ‐lactams for treatment of MSSA BSI has been consistently associated with lower SAB‐related mortality and relapse.[21, 22, 23, 24, 25, 26]
Echocardiographic studies were obtained in only half of the patients in our cohort, and they were twice more likely to be obtained when an ID specialist was consulted. Although we did not evaluate the appropriateness of the echocardiographic study, the increased proportion of studies performed when ID specialists were consulted could indicate a more in‐depth evaluation of the case. Moreover, in our cohort, when ID specialists where involved in direct patient care, a source of infection was more likely to be identified. This is in accordance with previous studies proposing that because evaluation by ID specialists are more detailed, they lead to increased use in ancillary studies and recognition of complicated cases.[10, 12]
Limitations of this study include its retrospective design and the fact that it was performed in a single institution. The source of infection was defined as documented by treating providers and not by independent diagnostic criteria. Antibiotic use was collected throughout duration of admission, and was not followed after patients were discharged, as these data were not available on the electronic medical record for all patients. Deaths that may have occurred after hospital discharge were not included. We did not account for elevated vancomycin minimum inhibitory concentration as a risk factor for the main outcome, and adjustment of vancomycin based on serum levels was not factored in. Acute kidney injury was accounted for anytime during hospitalization, but not in relation to antimicrobial administration. Despite the limitations, our study has strengths that make our results generalizable. Although our institution is a single medical center, it serves a large and diverse population as reflected in our cases. Even though this is a retrospective cohort study, the use of a centralized electronic medical record allowed us to identify each aspect of the management of SAB, as implemented by different treating services (medical and surgical), as continuous variables (days) rather than only in a dichotomous fashion. Moreover, by being a community teaching hospital, we were able to explore aspects of the practice of physicians in training versus practicing clinicians. These results could be extrapolated to other healthcare facilities aiming to improve the management of SAB.
CONCLUSIONS
Our results suggest that obtaining timely follow‐up blood cultures, use of ‐lactams in patients with MSSA BSI, and early consultation with infectious diseases are the processes of care that could serve as quality and patient‐safety indicators for the management of SAB. These results contribute to a growing body of evidence supporting the implementation of structured processes of care to optimize the management and clinical outcomes of hospitalized patients with SAB.
Disclosure: Nothing to report.
- , , , , , . Nosocomial bloodstream infections in US hospitals: analysis of 24,179 cases from a prospective nationwide surveillance study. Clin Infect Dis. 2004;39(3):309–317.
- , , , . Laboratory‐based surveillance of current antimicrobial resistance patterns and trends among Staphylococcus aureus: 2005 status in the United States. Ann Clin Microbiol Antimicrob. 2006;5:2.
- , , , , , . The impact of methicillin resistance in Staphylococcus aureus bacteremia on patient outcomes: mortality, length of stay, and hospital charges. Infect Control Hosp Epidemiol. 2005;26(2):166–174.
- , , , . Staphylococcal bacteremia and altered host resistance. Ann Intern Medicine. 1968;69(5):859–873.
- , , , , , . Comparison of mortality associated with methicillin‐resistant and methicillin‐susceptible Staphylococcus aureus bacteremia: a meta‐analysis. Clin Infect Dis. 2003;36(1):53–59.
- . Unfavourable prognostic factors in Staphylococcus aureus septicemia and endocarditis. Scand J Infect Dis. 1985;17(2):179–187.
- , , , et al. The burden of Staphylococcus aureus infections on hospitals in the United States: an analysis of the 2000 and 2001 Nationwide Inpatient Sample Database. Arch Intern Med. 2005;165(15):1756–1761.
- , , , et al. Health care–associated infections: a meta‐analysis of costs and financial impact on the us health care system. JAMA Intern Med. 2013;173(22):2039–2046.
- , , , et al. Clinical practice guidelines by the Infectious Diseases Society of America for the treatment of methicillin‐resistant Staphylococcus aureus infections in adults and children. Clin Infect Dis. 2011;52(3):e18–e55.
- , , , , . Impact of routine infectious diseases service consultation on the evaluation, management, and outcomes of Staphylococcus aureus bacteremia. Clin Infect Dis. 2008;46(7):1000–1008.
- , , , et al. Outcome of Staphylococcus aureus bacteremia according to compliance with recommendations of infectious diseases specialists: experience with 244 patients. Clin Infect Dis. 1998;27(3):478–486.
- , , , . Infectious disease consultation for Staphylococcus aureus bacteremia improves patient management and outcomes. Infect Dis Clin Pract (Baltim Md). 2012;20(4):261–267.
- , , , , . The value of infectious diseases consultation in Staphylococcus aureus bacteremia. Am J Med. 2010;123(7):631–637.
- , , , et al. Impact of an evidence‐based bundle intervention in the quality‐of‐care management and outcome of Staphylococcus aureus bacteremia. Clin Infect Dis. 2013;57(9):1225–1233.
- , , , et al. Comparison of prior authorization and prospective audit with feedback for antimicrobial stewardship. Infect Control Hosp Epidemiol. 2014;35(9):1092–1099.
- Clinical Laboratory Standards Institute. Performance Standards for Antimicrobial Susceptibility Testing; Twenty‐First Informational Supplement. Wayne, PA: Clinical Laboratory Standards Institute; 2011.
- , , , . Impact of vancomycin exposure on outcomes in patients with methicillin‐resistant Staphylococcus aureus bacteremia: support for consensus guidelines suggested targets. Clin Infect Dis. 2011;52(8):975–981.
- , , , , . High‐dose vancomycin therapy for methicillin‐resistant Staphylococcus aureus infections: efficacy and toxicity. Arch Intern Med. 2006;166(19):2138–2144.
- , , , . Strategies for physician education in therapeutic drug monitoring. Clin Chem. 1998;44(2):401–407.
- , . Impact of antimicrobial stewardship program on vancomycin use in a pediatric teaching hospital. Pediatr Infect Dis J. 2010;29(8):707–711.
- , . Vancomycin for Staphylococcus aureus endocarditis in intravenous drug users. Antimicrob Agents Chemother. 1990;34(6):1227–1231.
- , , , et al. A prospective multicenter study of Staphylococcus aureus bacteremia: incidence of endocarditis, risk factors for mortality, and clinical impact of methicillin resistance. Medicine. 2003;82(5):322–332.
- , , , . Impact of empirical‐therapy selection on outcomes of intravenous drug users with infective endocarditis caused by methicillin‐susceptible Staphylococcus aureus. Antimicrob Agents Chemother. 2007;51(10):3731–3733.
- , , , et al. Use of vancomycin or first‐generation cephalosporins for the treatment of hemodialysis‐dependent patients with methicillin‐susceptible Staphylococcus aureus bacteremia. Clin Infect Dis. 2007;44(2):190–196.
- , , , et al. Outcome of vancomycin treatment in patients with methicillin‐susceptible Staphylococcus aureus bacteremia. Antimicrob Agents Chemother. 2008;52(1):192–197.
- , , , et al. Comparative effectiveness of nafcillin or cefazolin versus vancomycin in methicillin‐susceptible Staphylococcus aureus bacteremia. BMC Infect Dis. 2011;11:279.
Staphylococcus aureus is one the most common pathogens isolated in nosocomial and community‐onset bloodstream infections (BSI) in the United States.[1, 2] S aureus bacteremia (SAB) has been reported in the literature to have substantial morbidity and mortality, with rates ranging between 15% and 60% worldwide.[3, 4, 5, 6] In the United States, patients with infections due to S aureus have on average 3 times the length of hospital stay than inpatients without these infections (14.3 days vs 4.5 days; P<0.01).[7] Healthcare costs are negatively impacted by these infections. In a recent meta‐analysis, Zimlichman et al.[8] reported that central‐line BSI (CLABSI) and surgical‐site infection (SSI) caused by methicillin‐resistant S aureus (MRSA) resulted in the highest estimated costs associated with hospital‐acquired infections in the United States ($58,614 [95% CI: $16,760‐$174,755] for CLABSI and $42,300 [95% CI: $4,005‐$82,670] for SSIs).
Appropriate management of SAB includes not only selecting the correct antimicrobial based on susceptibilities but also timely control of the source of infection, appropriate use of ancillary studies when indicated, and pharmacokinetic and pharmacodynamic therapeutic monitoring of antimicrobial therapy when vancomycin is used.[9] Consultation with an infectious diseases (ID) specialist has been associated with increased compliance with evidence‐based strategies in the management of SAB,[10, 11, 12, 13, 14] such as appropriate antibiotic choice, optimized duration of treatment, removal of the source of infection, and better use of cardiac echocardiography, resulting in improved outcomes.[13, 14]
Some, but not all, institutions have adopted bundles,[14] mandatory ID consultation[10] or daily prospective audit and feedback review[15] as part of antimicrobial stewardship program (ASP) interventions aiming to optimize the management of SABs. As part of our ASP quality improvement activities we performed the present study to determine our institutional rate of clinical failure in the treatment of SAB, to identify current practice patterns in the delivery of processes of care, and evaluate their association with clinical outcomes of hospitalized patients with SAB to identify future areas of improvement.
METHODS
A retrospective cohort study was performed at a 1558 licensed‐bed tertiary teaching hospital in Miami, Florida. All hospitalized patients 18 years of age or older with at least 1 positive blood culture with MRSA or methicillin‐susceptible S aureus (MSSA) between January 1, 2012 and April 30, 2013 were included. Patients were identified from the electronic microbiology laboratory database. For the purposes of this study, only the first episode of SAB was included in the analysis. Patients were excluded if aged younger than 18 years or if SAB was detected in an outpatient setting. The primary outcome was clinical failure, defined as a composite endpoint of in‐hospital mortality or persistent bacteremia; persistent bacteremia was defined as bacteremia for 7 or more days after the first positive blood culture. S aureus isolates were identified by standard methods.[16] Species identification was performed by latex agglutination. Antimicrobial susceptibility testing was performed using an automated system (Vitek 2; bioMerieux, Durham, NC) according to standard guidelines.
Data collected included baseline demographics, comorbidities, and treating healthcare provider's service; provider's service was categorized into 1 of 5 groups: internal medicine (academic), internal medicine (hospitalist), surgery, trauma, or neurosurgery. Duration of bacteremia was recorded and defined as the time between first positive and first negative blood culture. The time of first positive culture was defined as the date in which the culture was obtained. Patients who failed to have at least 1 follow‐up blood culture were not counted toward the main outcome. Additionally, presence of a foreign body (cardiac device, orthopedic prosthesis, tunneled catheter, nontunneled catheter) and presumed source of infection as documented in the electronic medical record by the treating service was also collected. Infections were considered community associated when onset of bacteremia occurred within the first 72 hours of admission, and hospital associated if onset of bacteremia occurred after 72 hours of admission.
Based on current practice guidelines,[9] the variables considered processes of care were the time to obtain the first follow‐up blood culture, time from first positive blood culture to initiation of appropriate antibiotic therapy (defined as a loading dose of vancomycin of 15 mg/kg, or a ‐lactam if the organism was susceptible), time to obtain the first vancomycin trough (when indicated), time from first positive blood culture to consultation with ID specialist, appropriate antibiotic de‐escalation (vancomycin to ‐lactam antibiotic if the organism was susceptible and the patient had no allergies or contraindications), and obtaining an echocardiographic study (transthoracic echocardiogram or transesophageal echocardiogram).
Statistical analyses were performed using SAS 9.2 (SAS Institute, Cary, NC). Differences in proportions were analyzed with 2 or Fisher exact test, accordingly. Differences in means among continuous variables were evaluated using independent samples of paired samples t tests as appropriate for the analysis. Continuous variables were dichotomized using a clinically established cutoff to determine relative risk (RR). A univariate analysis of risk factors associated with clinical failure was performed. Multivariable analyses were performed using logistic regression. Models were created using the backward stepwise approach and included all variables found to be statistically significant at less than 0.05 level in the univariate model and those of clinical significance. The study was reviewed and approved by the institutional review boards at the University of Miami and Jackson Memorial Hospital.
RESULTS
During the study period, 241 patients with a first episode of SAB were identified. MRSA and MSSA were isolated in 124 (51.4%) and 117 (48.5%) patients, respectively. Demographic and clinical characteristics of the study population based on isolate are summarized in Table 1. One hundred seventy‐nine (74.3%) patients were under the care of internal medicine services. There was no association between treating service (medical vs surgical) and clinical failure.
| Variable | MRSA, N= 124 (%) | MSSA, N= 117(%) | Overall, N=241 |
|---|---|---|---|
| |||
| Demographics | |||
| Age, y (mean) | 53.915.57 | 53.915.22 | 53.915.3 |
| Age greater than 60 years | 41 (33.1) | 39 (33.3) | 80 (33.2) |
| Male sex | 80 (64.5) | 80 (68.4) | 160 (66.4) |
| White race | 63 (50.8) | 69 (59) | 132 (54.8) |
| Comorbidities | |||
| Diabetes mellitus | 35 (28.2) | 40 (34.2) | 75 (30.7) |
| Hypertension | 56 (45.2) | 40 (34.2) | 96 (39.8) |
| CHF | 6 (4.8) | 9 (7.7) | 15 (6.2) |
| CVD | 8 (6.4) | 6 (5.1) | 14 (5.8) |
| Chronic pulmonary disease | 14 (11.3) | 14 (12) | 28 (11.6) |
| Malignancy | 9 (7.3) | 19 (16.2) | 28 (11.6) |
| Active chemotherapy | 5 (4) | 10 (8.5) | 15 (6.2) |
| HIV | 27 (21.8) | 17 (14.5) | 44 (18.2) |
| Cirrhosis | 6 (4.8) | 8 (6.8) | 14 (5.8) |
| Hepatitis C infection | 7 (5.6) | 11 (9.4) | 18 (7.5) |
| Acute kidney injury | 88 (71) | 80 (68.4) | 168 (69.7) |
| Chronic kidney disease | 29 (23.4) | 24 (20.5) | 53 (22) |
| End‐stage renal disease | 25 (20.2) | 22 (18.8) | 47 (19.5) |
| Connective tissue disease | 3 (2.4) | 3 (2.6) | 6 (2.5) |
| Alcohol abuse | 3 (2.4) | 1 (0.8) | 4 (1.7) |
| IVDU | 4 (3.2) | 5 (4.3) | 9 (3.7) |
| Hemiplegia | 4 (3.2) | 0 | 4 (1.7) |
| Chronic osteomyelitis | 4 (3.2) | 0 | 4 (1.7) |
| History of transplant | 7 (5.6) | 0 | 7 (2.9) |
| Surgery during current admission | 29 (23.4) | 46 (39.3) | 75 (31.1) |
| Surgery during the previous 30 days | 31 (25) | 36 (30.8) | 67 (25.3) |
| Treating service | |||
| Medical service | 89 (71.8) | 90 (76.9) | 179 (74.3) |
| Surgical service | 21 (16.9) | 16 (13.7) | 37 (15.3) |
| Other | 7 (5.6) | 11 (9.4) | 18 (7.5) |
| Presence of foreign body | |||
| PICC line | 24 (19.3) | 34 (29.1) | 58 (24.1) |
| Tunneled CVC | 24 (19.3) | 15 (12.8) | 39 (16.2) |
| Nontunneled CVC | 13 (10.5) | 28 (23.9) | 41 (17) |
| AV fistula | 3 (2.4) | 7 (6) | 10 (4.1) |
| Cardiac device | 8 (6.4) | 9 (7.7) | 17 (7) |
| Other | 4 (3.2) | 11 (9.4) | 15 (6.2) |
| Source of infection | |||
| CLABSI | 32 (25.8) | 21 (17.9) | 53 (22) |
| SSTI | 24 (19.3) | 20 (17.1) | 44 (18.2) |
| Endocarditis | 10 (8.1) | 7 (6) | 17 (7) |
| Thrombophlebitis | 2 (1.6) | 2 (1.7) | 4 (1.7) |
| Prostatic abscess | 3 (2.4) | 1 (0.8) | 4 (1.7) |
| Paravertebral abscess | 2 (1.6) | 2 (1.7) | 4 (1.7) |
| Mediastinal abscess | 2 (1.6) | 1 (0.8) | 3 (1.2) |
| CAP | 4 (3.2) | 4 (3.4) | 8 (3.3) |
| VAP | 3 (2.4) | 2 (1.7) | 5 (2.1) |
| Surgical site infection | 2 (1.6) | 1 (0.8) | 3 (1.2) |
| Ventriculostomy | 0 | 1 (0.8) | 1 (0.4) |
| Bone or joint infection | 2 (1.6) | 3 (2.6) | 5 (2.1) |
| Unknown | 38 (30.6) | 52 (44.4) | 90 (37.3) |
| Onset | |||
| Community onset* | 77 (62.1) | 77 (65.8) | 154 (63.9) |
| Hospital onset | 47 (37.9) | 40 (34.2) | 87 (36.1) |
The onset of infection occurred in the community in 77 (62.1%) patients with MRSA and in 77 (65.8%) patients with MSSA. The documented source of bacteremia was unknown in 30% of patients with MRSA and 44% of those with MSSA BSI. When ID specialists were consulted, patients were more likely to have a source of infection identified (RR: 1.5; 95% confidence interval [CI]: 1.2‐1.8; P<0.0001). The most commonly documented sources of infection were CLABSI, which occurred in 32 (25.8%) patients with MRSA and 21 (17.9%) patients with MSSA, followed by skin and soft tissue infections in 24 (19.3%) patients with MRSA BSI and 20 (17.1%) patients with MSSA BSI. All patients with CLABSI had documentation of catheter removal.
Clinical failure (defined as in‐hospital mortality or persistent bacteremia) occurred in 78 (32.4%) patients. Of these, 50 (20.7%) represented in‐hospital mortality, and 31 (12.9%) had persistent bacteremia. Table 2 summarizes the demographic and clinical characteristics associated with clinical failure. In the univariate analysis, the variables statistically significantly associated with clinical failure were: age greater than 60 years (RR: 1.4; 95% CI: 1.1‐1.8; P=0.001), bacteremia due to MRSA (RR: 1.7; 95% CI: 1.1‐2.5; P=0.008), white race (RR: 0.7; 95% CI: 0.6‐1; P=0.03), acute kidney injury during admission (RR: 2.2; 95% CI: 1.3‐3.7; P=0.004), presence of nontunneled central venous catheters at the onset of bacteremia (RR: 1.9; 95% CI: 1.3‐2.7; P=0.004), and endocarditis (RR: 2.9; 95% CI: 2.1‐3.9; P<0.0001). In the multivariable analysis, age greater than 60 years and endocarditis were found to be independent risk factors for the development of clinical failure.
| Variable | Clinical Failure, N=78 (%) | No Clinical Failure, N=163 (%) | Unadjusted RR (CI) | P Value* | Adjusted OR (CI) | P Value* |
|---|---|---|---|---|---|---|
| ||||||
| Demographics | ||||||
| Age >60 years | 37 (47.4) | 43 (26.4) | 1.4 (1.1‐1.8) | 0.001 | 2.4 (1.2‐4.5) | 0.008 |
| Male | 46 (60) | 114 (69.9) | 0.7 (0.5‐1.04) | 0.09 | ||
| White race | 35 (44.9) | 97 (59.5) | 0.7 (0.6‐1) | 0.03 | 0.5 (0.3‐1.02) | 0.058 |
| Isolate | ||||||
| MRSA | 50 (64.1) | 74 (45.4) | 1.7 (1.1‐2.5) | 0.008 | 1.8 (0.6‐5.2) | 0.3 |
| MSSA | 28 (35.9) | 89 (54.6) | 0.6 (0.4‐0.9) | 0.008 | ||
| Comorbidities | ||||||
| Diabetes mellitus | 21 (26.9) | 54 (33.1) | 0.8 (0.5‐1.2) | 0.34 | ||
| Cirrhosis | 6 (7.7) | 8 (4.9) | 1.3 (0.7‐2.5) | 0.35 | ||
| Acute kidney injury | 65 (83.3) | 103 (63.2) | 2.2 (1.3‐3.7) | 0.004 | 1.6 (0.5‐5.4) | 0.43 |
| Chronic kidney disease | 12 (15.4) | 41 (25.1) | 0.6 (0.4‐1.1) | 0.11 | ||
| End‐stage renal disease | 15 (19.2) | 32 (19.6) | 1 (0.6‐1.5) | 0.94 | ||
| IVDU | 3 (3.8) | 6 (3.7) | 1.03 (0.4‐2.6) | 1 | ||
| Treating service | ||||||
| Medical | 61 (78.2) | 118 (72.4) | 1.3 (0.7‐2.6) | 0.33 | ||
| Surgical | 11 (14.1) | 67 (41.1) | 1 (0.9‐1.1) | 0.71 | ||
| Presence of foreign body | ||||||
| Cardiac device | 6 (7.7) | 11 (6.7) | 1.1 (0.6‐2.1) | 0.78 | ||
| PICC line | 20 (25.6) | 38 (23.3) | 1.1 (0.7‐1.6) | 0.69 | ||
| Nontunneled CVC | 22 (28.2) | 19 (11.7) | 1.9 (1.3‐2.7) | 0.004 | 3.6 (0.7‐17.7) | 0.11 |
| Tunneled CVC | 15 (19.2) | 24 (14.7) | 1.2 (0.8‐1.9) | 0.36 | ||
| AV fistula | 0 | 10 (6.1) | 0.1 (0.09‐2) | 0.15 | ||
| Other | 4 (5.1) | 11 (6.7) | 0.8 (0.3‐1.9) | 0.64 | ||
| Onset | ||||||
| Community onset | 46 (59) | 108 (66.3) | 0.8 (0.6‐1.2) | 0.27 | ||
| Hospital onset | 32 (41) | 55 (33.7) | 1.2 (0.8‐1.8) | 0.27 | ||
| Source | ||||||
| CLABSI | 15 (19.2) | 38 (23.3) | 0.8 (0.5‐1.4) | 0.48 | ||
| SSTI | 12 (15.4) | 32 (19.6) | 0.8 (0.5‐1.4) | 0.44 | ||
| Endocarditis | 14 (17.9) | 3 (1.8) | 2.9 (2.1‐3.9) | <0.0001 | 9.4 (2.2‐1.1) | 0.003 |
| Thrombophlebitis | 0 | 4 (2.4) | 0.3 (0.02‐4.2) | 0.37 | ||
| Prostatic abscess | 1 (1.3) | 3 (1.8) | 0.8 (0.1‐4.2) | 0.76 | ||
| Paravertebral abscess | 0 | 4 (2.4) | 0.3 (0.02‐4.2) | 0.37 | ||
| Mediastinal abscess | 1 (1.3) | 2 (1.2) | 1.03 (0.2‐5.1) | 0.97 | ||
| CAP | 4 (5.1) | 4 (2.4) | 1.5 (0.8‐3.2) | 0.21 | ||
| VAP | 2 (2.6) | 3 (1.8) | 1.2 (0.4‐3.7) | 0.7 | ||
| Surgical site infection | 1 (1.3) | 2 (1.2) | 1.03 (0.2‐5.2) | 0.97 | ||
| Ventriculostomy | 0 | 1 (0.6) | 0.8 (0.1‐8.5) | 0.82 | ||
| Bone or joint infection | 1 (1.3) | 4 (2.4) | 0.6 (0.1‐3.6) | 0.59 | ||
| Unknown | 27 (34.6) | 63 (38.6) | 0.9 (0.6‐1.3) | 0.55 | ||
Performance of Process of Care and Association With Outcomes
The analysis of the performance of the processes of care and outcomes is shown in Table 3. After adjusting for relevant clinical and demographic characteristics, and those with a level of significance of <0.05, obtaining follow‐up blood cultures more than 4 days after the onset of bacteremia independently increased the risk of clinical failure (RR: 6.5; 95% CI: 2.1‐20.5; P=0.001). When consultation with an ID specialist was obtained within the first 6 days from onset of bacteremia, the risk of clinical failure was 0.3 (95% CI: 0.1‐0.9; P=0.03); however, consultation with an ID specialist overall was not associated with clinical failure (RR: 1; 95% CI: 0.7‐1.4; P=0.98).
| Variable | Clinical Failure, n=78 (%) | No Clinical Failure, n=163 (%) | Unadjusted RR (CI) | P Value* | Adjusted OR (CI) | P Value* |
|---|---|---|---|---|---|---|
| ||||||
| Timing of follow‐up blood culture, n=200 | ||||||
| Less than 2 days | 30 (19.2) | 87 (53.4) | 0.7 (0.5‐0.9) | 0.01 | 1.2 (0.5‐2.9) | 0.60 |
| 24 days (ref) | 16 (20.5) | 39 (23.9) | 0.9 (0.8‐1.1) | 0.53 | ||
| More than 4 days | 19 (24.3) | 9 (5.5) | 1.3 (1.1‐1.5) | <0.0001 | 6.6 (2.1‐20.5) | 0.001 |
| Early antibiotic therapy, n=232 | 66 (84.6) | 132 (81) | 1.2 (0.7‐2.3) | 0.45 | ||
| Monitoring of vancomycin levels, n=156 | 37 (20.8) | 97 (59.5) | 0.8 (0.6‐1.03) | 0.09 | ||
| Therapy with ‐lactam, n=103‖ | 7 (8.8) | 49 (30.1) | 0.4 (0.2‐0.8) | 0.01 | 0.1 (0.04‐0.5) | 0.002 |
| Consultation with ID specialist, n=241 | 31 (39.7) | 66 (40.5) | 1 (0.7‐1.4) | 0.98 | ||
| Early consultation with ID specialist, n=97# | 19 (24.3) | 56 (34.3) | 0.5 (0.3‐0.8) | 0.006 | 0.3 (0.1‐0.9) | 0.03 |
| Echocardiography, n=241 | 45 (57.7) | 96 (58.9) | 1 (0.7‐1.4) | 0.86 | ||
| Early echocardiography, n=141** | 35 (44.9) | 91 (55.8) | 0.7 (0.5‐1.07) | 0.11 | ||
A comparison of the average number of days to performance of processes of care is presented in Table 4. Patients with clinical failure had significantly greater elapsed time from the first positive blood culture to the first follow‐up blood culture as compared to those who did not have clinical failure (mean 2.321.3 days vs 3.883.37; P<0.0001). Forty‐one patients (17.1%) failed to have at least 1 follow‐up blood culture.
| Process of Care | Clinical Failure | No Clinical Failure | P Value* |
|---|---|---|---|
| |||
| First follow‐up blood culture, n=200 | 3.883.37 | 2.321.3 | <0.0001 |
| Consultation with infectious diseases, n=97 | 6.96.55 | 4.354.34 | 0.06 |
| First antibiotic dose, n=232 | 0.431.05 | 0.57 1.11 | 0.63 |
| First dose of ‐lactam, n=56 | 4.41.6 | 3.51.4 | 0.1 |
| First vancomycin trough, n=156 | 2.632.04 | 2.552.02 | 0.81 |
| Echocardiography, n=141 | 3.421.74 | 3.312.05 | 0.47 |
Among patients with clinical failure, an ID specialist was consulted at a mean time of 7 days from the onset of bacteremia, compared to patients with no clinical failure in whom a consult was obtained at a mean of 4 days (P=0.06) (Table 4). Overall, ID specialists were only consulted in 97/241 (40.2%) episodes.
Echocardiographic studies were performed in 141/241 (58.5)% of episodes, and they were more likely to be obtained when an ID specialist was consulted (RR: 1.7; 95% CI: 1.4‐2.1; P<0.0001). Lack of performance of these studies was not associated with clinical failure (Table 3).
Antibiotic Administration and De‐escalation of Therapy
There were no significant differences in the average time from the first positive blood culture to the administration of antibiotics between patients who had clinical failure and those who did not (0.571.11 vs 0.431.05; P=0.63) (Table 4).
Patients with MSSA BSI and no documented penicillin allergy were treated with ‐lactam or cephalosporin antibiotics in 56/103(54.3%) episodes. Patients were 2.5 times more likely to receive ‐lactam antibiotics when an ID specialist was consulted (95% CI: 1.8‐3.5; P<0.0001). Among patients with MSSA BSI, treatment with ‐lactams was an independent predictor of decreased risk of clinical failure (RR: 0.2; 95% CI: 0.07‐0.9; P=0.005) (Table 3).
DISCUSSION
Our study showed a significant rate of morbidity associated with S aureus bacteremia and identified processes of care in the management of SAB that impact patient outcomes.
Our results show that early consultation with an ID specialist was associated with a decreased risk of developing clinical failure, increased likelihood of identification of a source of infection, and positively impacted administration of appropriate antibiotic therapy, especially in cases of MSSA BSI, with overall improvement in patient outcomes. However, consultation with an ID specialist was only obtained in 40.2% of our cases, which is consistent with published data.[10, 11, 12, 13] Consultation with an ID specialist itself did not impact clinical failure, but rather timeliness in obtaining expert guidance was associated with better outcomes. As shown in previous studies,[10, 11, 12, 13, 14] compliance with the standards of care and patient prognosis are improved when ID specialists are involved in the management of SAB. Our study reiterates that early consultation with an ID specialist has a positive outcome in patient care, as opposed to delaying consultation once the patient has persistent bacteremia for more than 7 days. This association could be explained by considering that the majority of the standards of care are time sensitive, which include: obtaining surveillance blood cultures 48 to 96 hours after initial detection[10] or initiating therapy,[11, 14] removal of foci of infection,[10, 11, 12, 14] use of parenteral ‐lactams for the treatment of MSSA,[10, 11, 13, 14] performing echocardiography when clinically indicated,[10, 11, 13, 14] and appropriate duration of therapy.[10, 13, 14] Importantly, studies have shown that when ID specialists' recommendations are followed, patients are more likely to be cured,[10, 11, 13] and are less likely to relapse.[10, 11, 12] Given the complexities of treating patients with SAB and high rates of clinical failures, routine guidance could be beneficial to healthcare providers as part of a multidisciplinary structured strategy that is set in motion the moment a patient with SAB is identified by the microbiology laboratory. The processes of care outlined in this this study can serve as quality of care indicators and be integrated into a structured strategy to optimize the management of SAB.
Regarding optimal timing for follow‐up blood cultures, our results show that delays in obtaining follow‐up blood cultures (more than 4 days from onset of bacteremia) was independently associated with increased risk of clinical failure. Timely follow‐up blood cultures have been previously identified as quality of care indicators.[10, 11, 13, 14] Compliance with obtaining follow‐up blood cultures improves when this step is integrated into a bundle of care.[14]
Antimicrobial therapy was promptly initiated in the majority of the patients in our study. However, areas for improvement were identified. Vancomycin was the empirical therapy of choice in most of the cases, but an appropriate dose was only received by 65% of the patients, and vancomycin levels after the fourth dose were obtained in 85.9% of instances when indicated. Although in our cohort these results were not significantly associated with clinical failure, previous studies have described attainment of a target therapeutic vancomycin trough (1520 mg/dL) as a factor for treatment success.[17, 18] This problem could be addressed through physician education on therapeutic drug monitoring,[19] as well as through an ASP intervention, which have successfully led efforts to improve vancomycin utilization and dosing.[20] Among patients with MSSA BSI, therapy with ‐lactams was associated with improved outcomes, and was more likely to be administered when an ID specialist was consulted. This is in accordance with previous studies that have shown that higher rates of appropriate antimicrobial therapy are achieved when ID specialists are involved in management of SAB.[10, 11, 13, 14] The use of ‐lactams for treatment of MSSA BSI has been consistently associated with lower SAB‐related mortality and relapse.[21, 22, 23, 24, 25, 26]
Echocardiographic studies were obtained in only half of the patients in our cohort, and they were twice more likely to be obtained when an ID specialist was consulted. Although we did not evaluate the appropriateness of the echocardiographic study, the increased proportion of studies performed when ID specialists were consulted could indicate a more in‐depth evaluation of the case. Moreover, in our cohort, when ID specialists where involved in direct patient care, a source of infection was more likely to be identified. This is in accordance with previous studies proposing that because evaluation by ID specialists are more detailed, they lead to increased use in ancillary studies and recognition of complicated cases.[10, 12]
Limitations of this study include its retrospective design and the fact that it was performed in a single institution. The source of infection was defined as documented by treating providers and not by independent diagnostic criteria. Antibiotic use was collected throughout duration of admission, and was not followed after patients were discharged, as these data were not available on the electronic medical record for all patients. Deaths that may have occurred after hospital discharge were not included. We did not account for elevated vancomycin minimum inhibitory concentration as a risk factor for the main outcome, and adjustment of vancomycin based on serum levels was not factored in. Acute kidney injury was accounted for anytime during hospitalization, but not in relation to antimicrobial administration. Despite the limitations, our study has strengths that make our results generalizable. Although our institution is a single medical center, it serves a large and diverse population as reflected in our cases. Even though this is a retrospective cohort study, the use of a centralized electronic medical record allowed us to identify each aspect of the management of SAB, as implemented by different treating services (medical and surgical), as continuous variables (days) rather than only in a dichotomous fashion. Moreover, by being a community teaching hospital, we were able to explore aspects of the practice of physicians in training versus practicing clinicians. These results could be extrapolated to other healthcare facilities aiming to improve the management of SAB.
CONCLUSIONS
Our results suggest that obtaining timely follow‐up blood cultures, use of ‐lactams in patients with MSSA BSI, and early consultation with infectious diseases are the processes of care that could serve as quality and patient‐safety indicators for the management of SAB. These results contribute to a growing body of evidence supporting the implementation of structured processes of care to optimize the management and clinical outcomes of hospitalized patients with SAB.
Disclosure: Nothing to report.
- , , , , , . Nosocomial bloodstream infections in US hospitals: analysis of 24,179 cases from a prospective nationwide surveillance study. Clin Infect Dis. 2004;39(3):309–317.
- , , , . Laboratory‐based surveillance of current antimicrobial resistance patterns and trends among Staphylococcus aureus: 2005 status in the United States. Ann Clin Microbiol Antimicrob. 2006;5:2.
- , , , , , . The impact of methicillin resistance in Staphylococcus aureus bacteremia on patient outcomes: mortality, length of stay, and hospital charges. Infect Control Hosp Epidemiol. 2005;26(2):166–174.
- , , , . Staphylococcal bacteremia and altered host resistance. Ann Intern Medicine. 1968;69(5):859–873.
- , , , , , . Comparison of mortality associated with methicillin‐resistant and methicillin‐susceptible Staphylococcus aureus bacteremia: a meta‐analysis. Clin Infect Dis. 2003;36(1):53–59.
- . Unfavourable prognostic factors in Staphylococcus aureus septicemia and endocarditis. Scand J Infect Dis. 1985;17(2):179–187.
- , , , et al. The burden of Staphylococcus aureus infections on hospitals in the United States: an analysis of the 2000 and 2001 Nationwide Inpatient Sample Database. Arch Intern Med. 2005;165(15):1756–1761.
- , , , et al. Health care–associated infections: a meta‐analysis of costs and financial impact on the us health care system. JAMA Intern Med. 2013;173(22):2039–2046.
- , , , et al. Clinical practice guidelines by the Infectious Diseases Society of America for the treatment of methicillin‐resistant Staphylococcus aureus infections in adults and children. Clin Infect Dis. 2011;52(3):e18–e55.
- , , , , . Impact of routine infectious diseases service consultation on the evaluation, management, and outcomes of Staphylococcus aureus bacteremia. Clin Infect Dis. 2008;46(7):1000–1008.
- , , , et al. Outcome of Staphylococcus aureus bacteremia according to compliance with recommendations of infectious diseases specialists: experience with 244 patients. Clin Infect Dis. 1998;27(3):478–486.
- , , , . Infectious disease consultation for Staphylococcus aureus bacteremia improves patient management and outcomes. Infect Dis Clin Pract (Baltim Md). 2012;20(4):261–267.
- , , , , . The value of infectious diseases consultation in Staphylococcus aureus bacteremia. Am J Med. 2010;123(7):631–637.
- , , , et al. Impact of an evidence‐based bundle intervention in the quality‐of‐care management and outcome of Staphylococcus aureus bacteremia. Clin Infect Dis. 2013;57(9):1225–1233.
- , , , et al. Comparison of prior authorization and prospective audit with feedback for antimicrobial stewardship. Infect Control Hosp Epidemiol. 2014;35(9):1092–1099.
- Clinical Laboratory Standards Institute. Performance Standards for Antimicrobial Susceptibility Testing; Twenty‐First Informational Supplement. Wayne, PA: Clinical Laboratory Standards Institute; 2011.
- , , , . Impact of vancomycin exposure on outcomes in patients with methicillin‐resistant Staphylococcus aureus bacteremia: support for consensus guidelines suggested targets. Clin Infect Dis. 2011;52(8):975–981.
- , , , , . High‐dose vancomycin therapy for methicillin‐resistant Staphylococcus aureus infections: efficacy and toxicity. Arch Intern Med. 2006;166(19):2138–2144.
- , , , . Strategies for physician education in therapeutic drug monitoring. Clin Chem. 1998;44(2):401–407.
- , . Impact of antimicrobial stewardship program on vancomycin use in a pediatric teaching hospital. Pediatr Infect Dis J. 2010;29(8):707–711.
- , . Vancomycin for Staphylococcus aureus endocarditis in intravenous drug users. Antimicrob Agents Chemother. 1990;34(6):1227–1231.
- , , , et al. A prospective multicenter study of Staphylococcus aureus bacteremia: incidence of endocarditis, risk factors for mortality, and clinical impact of methicillin resistance. Medicine. 2003;82(5):322–332.
- , , , . Impact of empirical‐therapy selection on outcomes of intravenous drug users with infective endocarditis caused by methicillin‐susceptible Staphylococcus aureus. Antimicrob Agents Chemother. 2007;51(10):3731–3733.
- , , , et al. Use of vancomycin or first‐generation cephalosporins for the treatment of hemodialysis‐dependent patients with methicillin‐susceptible Staphylococcus aureus bacteremia. Clin Infect Dis. 2007;44(2):190–196.
- , , , et al. Outcome of vancomycin treatment in patients with methicillin‐susceptible Staphylococcus aureus bacteremia. Antimicrob Agents Chemother. 2008;52(1):192–197.
- , , , et al. Comparative effectiveness of nafcillin or cefazolin versus vancomycin in methicillin‐susceptible Staphylococcus aureus bacteremia. BMC Infect Dis. 2011;11:279.
© 2015 Society of Hospital Medicine
Measuring Patient Experiences
The hospitalized patient experience has become an area of increased focus for hospitals given the recent coupling of patient satisfaction to reimbursement rates for Medicare patients.[1] Although patient experiences are multifactorial, 1 component is the relationship that hospitalized patients develop with their inpatient physicians. In recognition of the importance of this relationship, several organizations including the Society of Hospital Medicine, Society of General Internal Medicine, American College of Physicians, the American College of Emergency Physicians, and the Accreditation Council for Graduate Medical Education have recommended that patients know and understand who is guiding their care at all times during their hospitalization.[2, 3] Unfortunately, previous studies have shown that hospitalized patients often lack the ability to identify[4, 5] and understand their course of care.[6, 7] This may be due to numerous clinical factors including lack of a prior relationship, rapid pace of clinical care, and the frequent transitions of care found in both hospitalists and general medicine teaching services.[5, 8, 9] Regardless of the cause, one could hypothesize that patients who are unable to identify or understand the role of their physician may be less informed about their hospitalization, which may lead to further confusion, dissatisfaction, and ultimately a poor experience.
Given the proliferation of nonteaching hospitalist services in teaching hospitals, it is important to understand if patient experiences differ between general medicine teaching and hospitalist services. Several reasons could explain why patient experiences may vary on these services. For example, patients on a hospitalist service will likely interact with a single physician caretaker, which may give a feeling of more personalized care. In contrast, patients on general medicine teaching services are cared for by larger teams of residents under the supervision of an attending physician. Residents are also subjected to duty‐hour restrictions, clinic responsibilities, and other educational requirements that may impede the continuity of care for hospitalized patients.[10, 11, 12] Although 1 study has shown that hospitalist‐intensive hospitals perform better on patient satisfaction measures,[13] no study to date has compared patient‐reported experiences on general medicine teaching and nonteaching hospitalist services. This study aimed to evaluate the hospitalized patient experience on both teaching and nonteaching hospitalist services by assessing several patient‐reported measures of their experience, namely their confidence in their ability to identify their physician(s), understand their roles, and their rating of both the coordination and overall care.
METHODS
Study Design
We performed a retrospective cohort analysis at the University of Chicago Medical Center between July 2007 and June 2013. Data were acquired as part of the Hospitalist Project, an ongoing study that is used to evaluate the impact of hospitalists, and now serves as infrastructure to continue research related to hospital care at University of Chicago.[14] Patients were cared for by either the general medicine teaching service or the nonteaching hospitalist service. General medicine teaching services were composed of an attending physician who rotates for 2 weeks at a time, a second‐ or third‐year medicine resident, 1 to 2 medicine interns, and 1 to 2 medical students.[15] The attending physician assigned to the patient's hospitalization was the attending listed on the first day of hospitalization, regardless of the length of hospitalization. Nonteaching hospitalist services consisted of a single hospitalist who worked 7‐day shifts, and were assisted by a nurse practitioner/physician's assistant (NPA). The majority of attendings on the hospitalist service were less than 5 years out of residency. Both services admitted 7 days a week, with patients initially admitted to the general medicine teaching service until resident caps were met, after which all subsequent admissions were admitted to the hospitalist service. In addition, the hospitalist service is also responsible for specific patient subpopulations, such as lung and renal transplants, and oncologic patients who have previously established care with our institution.
Data Collection
During a 30‐day posthospitalization follow‐up questionnaire, patients were surveyed regarding their confidence in their ability to identify and understand the roles of their physician(s) and their perceptions of the overall coordination of care and their overall care, using a 5‐point Likert scale (1 = poor understanding to 5 = excellent understanding). Questions related to satisfaction with care and coordination were derived from the Picker‐Commonwealth Survey, a previously validated survey meant to evaluate patient‐centered care.[16] Patients were also asked to report their race, level of education, comorbid diseases, and whether they had any prior hospitalizations within 1 year. Chart review was performed to obtain patient age, gender, and hospital length of stay (LOS), and calculated Charlson Comorbidity Index (CCI).[17] Patients with missing data or responses to survey questions were excluded from final analysis. The University of Chicago Institutional Review Board approved the study protocol, and all patients provided written consented prior to participation.
Data Analysis
After initial analysis noted that outcomes were skewed, the decision was made to dichotomize the data and use logistic rather than linear regression models. Patient responses to the follow‐up phone questionnaire were dichotomized to reflect the top 2 categories (excellent and very good). Pearson 2 analysis was used to assess for any differences in demographic characteristics, disease severity, and measures of patient experience between the 2 services. To assess if service type was associated with differences in our 4 measures of patient experience, we created a 3‐level mixed‐effects logistic regression using a logit function while controlling for age, gender, race, CCI, LOS, previous hospitalizations within 1 year, level of education, and academic year. These models studied the longitudinal association between teaching service and the 4 outcome measures, while also controlling for the cluster effect of time nested within individual patients who were clustered within physicians. The model included random intercepts at both the patient and physician level and also included a random effect of service (teaching vs nonteaching) at the patient level. A Hausman test was used to determine if these random‐effects models improved fit over a fixed‐effects model, and the intraclass correlations were compared using likelihood ratio tests to determine the appropriateness of a 3‐level versus 2‐level model. Data management and 2 analyses were performed using Stata version 13.0 (StataCorp, College Station, TX), and mixed‐effects regression models were done in SuperMix (Scientific Software International, Skokie, IL).
RESULTS
In total, 14,855 patients were enrolled during their hospitalization with 57% and 61% completing the 30‐day follow‐up survey on the hospitalist and general medicine teaching service, respectively. In total, 4131 (69%) and 4322 (48%) of the hospitalist and general medicine services, respectively, either did not answer all survey questions, or were missing basic demographic data, and thus were excluded. Data from 4591 patients on the general medicine teaching (52% of those enrolled at hospitalization) and 1811 on the hospitalist service (31% of those enrolled at hospitalization) were used for final analysis (Figure 1). Respondents were predominantly female (61% and 56%), African American (75% and 63%), with a mean age of 56.2 (19.4) and 57.1 (16.1) years, for the general medicine teaching and hospitalist services, respectively. A majority of patients (71% and 66%) had a CCI of 0 to 3 on both services. There were differences in self‐reported comorbidities between the 2 groups, with hospitalist services having a higher prevalence of cancer (20% vs 7%), renal disease (25% vs 18%), and liver disease (23% vs 7%). Patients on the hospitalist service had a longer mean LOS (5.5 vs 4.8 days), a greater percentage of a hospitalization within 1 year (58% vs 52%), and a larger proportion who were admitted in 2011 to 2013 compared to 2007 to 2010 (75% vs 39%), when compared to the general medicine teaching services. Median LOS and interquartile ranges were similar between both groups. Although most baseline demographics were statistically different between the 2 groups (Table 1), these differences were likely clinically insignificant. Compared to those who responded to the follow‐up survey, nonresponders were more likely to be African American (73% and 64%, P < 0.001) and female (60% and 56%, P < 0.01). The nonresponders were more likely to be hospitalized in the past 1 year (62% and 53%, P < 0.001) and have a lower CCI (CCI 03 [75% and 80%, P < 0.001]) compared to responders. Demographics between responders and nonresponders were also statistically different from one another.
| Variable | General Medicine Teaching | Nonteaching Hospitalist | P Value |
|---|---|---|---|
| |||
| Total (n) | 4,591 | 1,811 | <0.001 |
| Attending classification, hospitalist, n (%) | 1,147 (25) | 1,811 (100) | |
| Response rate, % | 61 | 57 | <0.01 |
| Age, y, mean SD | 56.2 19.4 | 57.1 16.1 | <0.01 |
| Gender, n (%) | <0.01 | ||
| Male | 1,796 (39) | 805 (44) | |
| Female | 2,795 (61) | 1,004 (56) | |
| Race, n (%) | <0.01 | ||
| African American | 3,440 (75) | 1,092 (63) | |
| White | 900 (20) | 571 (32) | |
| Asian/Pacific | 38 (1) | 17 (1) | |
| Other | 20 (1) | 10 (1) | |
| Unknown | 134 (3) | 52 (3) | |
| Charlson Comorbidity Index, n (%) | <0.001 | ||
| 0 | 1,635 (36) | 532 (29) | |
| 12 | 1,590 (35) | 675 (37) | |
| 39 | 1,366 (30) | 602 (33) | |
| Self‐reported comorbidities | |||
| Anemia/sickle cell disease | 1,201 (26) | 408 (23) | 0.003 |
| Asthma/COPD | 1,251 (28) | 432 (24) | 0.006 |
| Cancer* | 300 (7) | 371 (20) | <0.001 |
| Depression | 1,035 (23) | 411 (23) | 0.887 |
| Diabetes | 1,381 (30) | 584 (32) | 0.087 |
| Gastrointestinal | 1,140 (25) | 485 (27) | 0.104 |
| Cardiac | 1,336 (29) | 520 (29) | 0.770 |
| Hypertension | 2,566 (56) | 1,042 (58) | 0.222 |
| HIV/AIDS | 151 (3) | 40 (2) | 0.022 |
| Kidney disease | 828 (18) | 459 (25) | <0.001 |
| Liver disease | 313 (7) | 417 (23) | <0.001 |
| Stroke | 543 (12) | 201 (11) | 0.417 |
| Education level | 0.066 | ||
| High school | 2,248 (49) | 832 (46) | |
| Junior college/college | 1,878 (41) | 781 (43) | |
| Postgraduate | 388 (8) | 173 (10) | |
| Don't know | 77 (2) | 23 (1) | |
| Academic year, n (%) | <0.001 | ||
| July 2007 June 2008 | 938 (20) | 90 (5) | |
| July 2008 June 2009 | 702 (15) | 148 (8) | |
| July 2009 June 2010 | 576(13) | 85 (5) | |
| July 2010 June 2011 | 602 (13) | 138 (8) | |
| July 2011 June 2012 | 769 (17) | 574 (32) | |
| July 2012 June 2013 | 1,004 (22) | 774 (43) | |
| Length of stay, d, mean SD | 4.8 7.3 | 5.5 6.4 | <0.01 |
| Prior hospitalization (within 1 year), yes, n (%) | 2,379 (52) | 1,039 (58) | <0.01 |

Unadjusted results revealed that patients on the hospitalist service were more confident in their abilities to identify their physician(s) (50% vs 45%, P < 0.001), perceived greater ability in understanding the role of their physician(s) (54% vs 50%, P < 0.001), and reported greater satisfaction with coordination and teamwork (68% vs 64%, P = 0.006) and with overall care (73% vs 67%, P < 0.001) (Figure 2).
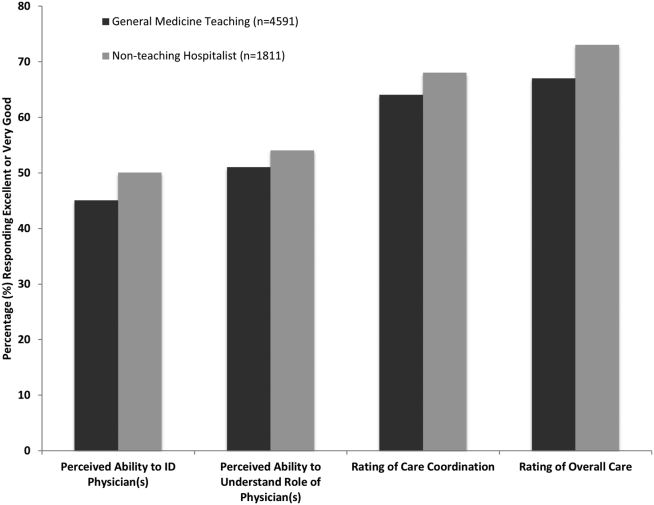
From the mixed‐effects regression models it was discovered that admission to the hospitalist service was associated with a higher odds ratio (OR) of reporting overall care as excellent or very good (OR: 1.33; 95% confidence interval [CI]: 1.15‐1.47). There was no difference between services in patients' ability to identify their physician(s) (OR: 0.89; 95% CI: 0.61‐1.11), in patients reporting a better understanding of the role of their physician(s) (OR: 1.09; 95% CI: 0.94‐1.23), or in their rating of overall coordination and teamwork (OR: 0.71; 95% CI: 0.42‐1.89).
A subgroup analysis was performed on the 25% of hospitalist attendings in the general medicine teaching service comparing this cohort to the hospitalist services, and it was found that patients perceived better overall care on the hospitalist service (OR: 1.17; 95% CI: 1.01‐ 1.31) than on the general medicine service (Table 2). All other domains in the subgroup analysis were not statistically significant. Finally, an ordinal logistic regression was performed for each of these outcomes, but it did not show any major differences compared to the logistic regression of dichotomous outcomes.
| Domains in Patient Experience* | Odds Ratio (95% CI) | P Value |
|---|---|---|
| ||
| How would you rate your ability to identify the physicians and trainees on your general medicine team during the hospitalization? | ||
| Model 1 | 0.89 (0.611.11) | 0.32 |
| Model 2 | 0.98 (0.671.22) | 0.86 |
| How would you rate your understanding of the roles of the physicians and trainees on your general medicine team? | ||
| Model 1 | 1.09 (0.941.23) | 0.25 |
| Model 2 | 1.19 (0.981.36) | 0.08 |
| How would you rate the overall coordination and teamwork among the doctors and nurses who care for you during your hospital stay? | ||
| Model 1 | 0.71 (0.421.89) | 0.18 |
| Model 2 | 0.82 (0.651.20) | 0.23 |
| Overall, how would you rate the care you received at the hospital? | ||
| Model 1 | 1.33 (1.151.47) | 0.001 |
| Model 2 | 1.17 (1.011.31) | 0.04 |
DISCUSSION
This study is the first to directly compare measures of patient experience on hospitalist and general medicine teaching services in a large, multiyear comparison across multiple domains. In adjusted analysis, we found that patients on nonteaching hospitalist services rated their overall care better than those on general medicine teaching services, whereas no differences in patients' ability to identify their physician(s), understand their role in their care, or rating of coordination of care were found. Although the magnitude of the differences in rating of overall care may appear small, it remains noteworthy because of the recent focus on patient experience at the reimbursement level, where small differences in performance can lead to large changes in payment. Because of the observational design of this study, it is important to consider mechanisms that could account for our findings.
The first are the structural differences between the 2 services. Our subgroup analysis comparing patients rating of overall care on a general medicine service with a hospitalist attending to a pure hospitalist cohort found a significant difference between the groups, indicating that the structural differences between the 2 groups may be a significant contributor to patient satisfaction ratings. Under the care of a hospitalist service, a patient would only interact with a single physician on a daily basis, possibly leading to a more meaningful relationship and improved communication between patient and provider. Alternatively, while on a general medicine teaching service, patients would likely interact with multiple physicians, as a result making their confidence in their ability to identify and perception at understanding physicians' roles more challenging.[18] This dilemma is further compounded by duty hour restrictions, which have subsequently led to increased fragmentation in housestaff scheduling. The patient experience on the general medicine teaching service may be further complicated by recent data that show residents spend a minority of time in direct patient care,[19, 20] which could additionally contribute to patients' inability to understand who their physicians are and to the decreased satisfaction with their care. This combination of structural complexity, duty hour reform, and reduced direct patient interaction would likely decrease the chance a patient will interact with the same resident on a consistent basis,[5, 21] thus making the ability to truly understand who their caretakers are, and the role they play, more difficult.
Another contributing factor could be the use of NPAs on our hospitalist service. Given that these providers often see the patient on a more continual basis, hospitalized patients' exposure to a single, continuous caretaker may be a factor in our findings.[22] Furthermore, with studies showing that hospitalists also spend a small fraction of their day in direct patient care,[23, 24, 25] the use of NPAs may allow our hospitalists to spend greater amounts of time with their patients, thus improving patients' rating of their overall care and influencing their perceived ability to understand their physician's role.
Although there was no difference between general medicine teaching and hospitalist services with respect to patient understanding of their roles, our data suggest that both groups would benefit from interventions to target this area. Focused attempts at improving patient's ability to identify and explain the roles of their inpatient physician(s) have been performed. For example, previous studies have attempted to improve a patient's ability to identify their physician through physician facecards[8, 9] or the use of other simple interventions (ie, bedside whiteboards).[4, 26] Results from such interventions are mixed, as they have demonstrated the capacity to improve patients' ability to identify who their physician is, whereas few have shown any appreciable improvement in patient satisfaction.[26]
Although our findings suggest that structural differences in team composition may be a possible explanation, it is also important to consider how the quality of care a patient receives affects their experience. For instance, hospitalists have been shown to produce moderate improvements in patient‐centered outcomes such as 30‐day readmission[27] and hospital length of stay[14, 28, 29, 30, 31] when compared to other care providers, which in turn could be reflected in the patient's perception of their overall care. In a large national study of acute care hospitals using the Hospital Consumer Assessment of Healthcare Providers and Systems survey, Chen and colleagues found that for most measures of patient satisfaction, hospitals with greater use of hospitalist care were associated with better patient‐centered care.[13] These outcomes were in part driven by patient‐centered domains such as discharge planning, pain control, and medication management. It is possible that patients are sensitive to the improved outcomes that are associated with hospitalist services, and reflect this in their measures of patient satisfaction.
Last, because this is an observational study and not a randomized trial, it is possible that the clinical differences in the patients cared for by these services could have led to our findings. Although the clinical significance of the differences in patient demographics were small, patients seen on the hospitalist service were more likely to be older white males, with a slightly longer LOS, greater comorbidities, and more hospitalizations in the previous year than those seen on the general medicine teaching service. Additionally, our hospitalist service frequently cares for highly specific subpopulations (ie, liver and renal transplant patients, and oncology patients), which could have influenced our results. For example, transplant patients who may be very grateful for their second chance, are preferentially admitted to the hospitalist service, which could have biased our results in favor of hospitalists.[32] Unfortunately, we were unable to control for all such factors.
Although we hope that multivariable analysis can adjust for many of these differences, we are not able to account for possible unmeasured confounders such as time of day of admission, health literacy, personality differences, physician turnover, or nursing and other ancillary care that could contribute to these findings. In addition to its observational study design, our study has several other limitations. First, our study was performed at a single institution, thus limiting its generalizability. Second, as a retrospective study based on observational data, no definitive conclusions regarding causality can be made. Third, although our response rate was low, it is comparable to other studies that have examined underserved populations.[33, 34] Fourth, because our survey was performed 30 days after hospitalization, this may impart imprecision on our outcomes measures. Finally, we were not able to mitigate selection bias through imputation for missing data .
All together, given the small absolute differences between the groups in patients' ratings of their overall care compared to large differences in possible confounders, these findings call for further exploration into the significance and possible mechanisms of these outcomes. Our study raises the potential possibility that the structural component of a care team may play a role in overall patient satisfaction. If this is the case, future studies of team structure could help inform how best to optimize this component for the patient experience. On the other hand, if process differences are to explain our findings, it is important to distill the types of processes hospitalists are using to improve the patient experience and potentially export this to resident services.
Finally, if similar results were found in other institutions, these findings could have implications on how hospitals respond to new payment models that are linked to patient‐experience measures. For example, the Hospital Value‐Based Purchasing Program currently links the Centers for Medicare and Medicaid Services payments to a set of quality measures that consist of (1) clinical processes of care (70%) and (2) the patient experience (30%).[1] Given this linkage, any small changes in the domain of patient satisfaction could have large payment implications on a national level.
CONCLUSION
In summary, in this large‐scale multiyear study, patients cared for by a nonteaching hospitalist service reported greater satisfaction with their overall care than patients cared for by a general medicine teaching service. This difference could be mediated by the structural differences between these 2 services. As hospitals seek to optimize patient experiences in an era where reimbursement models are now being linked to patient‐experience measures, future work should focus on further understanding the mechanisms for these findings.
Disclosures
Financial support for this work was provided by the Robert Wood Johnson Investigator Program (RWJF Grant ID 63910 PI Meltzer), a Midcareer Career Development Award from the National Institute of Aging (1 K24 AG031326‐01, PI Meltzer), and a Clinical and Translational Science Award (NIH/NCATS 2UL1TR000430‐08, PI Solway, Meltzer Core Leader). The authors report no conflicts of interest.
- Hospital Consumer Assessment of Healthcare Providers and Systems. HCAHPS fact sheet. CAHPS hospital survey August 2013. Available at: http://www.hcahpsonline.org/files/August_2013_HCAHPS_Fact_Sheet3.pdf. Accessed February 2, 2015.
- , , , et al. Transitions of Care Consensus policy statement: American College of Physicians, Society of General Internal Medicine, Society of Hospital Medicine, American Geriatrics Society, American College Of Emergency Physicians, and Society for Academic Emergency Medicine. J Hosp Med. 2009;4(6):364–370.
- Accreditation Council for Graduate Medical Education. Common program requirements. Available at: http://www.acgme.org/acgmeweb/Portals/0/PFAssets/ProgramRequirements/CPRs2013.pdf. Accessed January 15, 2015.
- , , . Increasing a patient's ability to identify his or her attending physician using a patient room display. Arch Intern Med. 2010;170(12):1084–1085.
- , , , , , . Ability of hospitalized patients to identify their in‐hospital physicians. Arch Intern Med. 2009;169(2):199–201.
- , , , et al. Hospitalized patients' understanding of their plan of care. Mayo Clin Proc. 2010;85(1):47–52.
- , , , et al. Patient‐physician communication at hospital discharge and patients' understanding of the postdischarge treatment plan. Arch Intern Med. 1997;157(9):1026–1030.
- , , , et al. Improving inpatients' identification of their doctors: use of FACE cards. Jt Comm J Qual Patient Saf. 2009;35(12):613–619.
- , , , , , . The impact of facecards on patients' knowledge, satisfaction, trust, and agreement with hospital physicians: a pilot study. J Hosp Med. 2014;9(3):137–141.
- , , . Restructuring an inpatient resident service to improve outcomes for residents, students, and patients. Acad Med. 2011;86(12):1500–1507.
- , , . Residency training in the modern era: the pipe dream of less time to learn more, care better, and be more professional. Arch Intern Med. 2005;165(22):2561–2562.
- , , , , . Managing discontinuity in academic medical centers: strategies for a safe and effective resident sign‐out. J Hosp Med. 2006;1(4):257–266.
- , , , . Hospitalist staffing and patient satisfaction in the national Medicare population. J Hosp Med. 2013;8(3):126–131.
- , , , et al. Effects of physician experience on costs and outcomes on an academic general medicine service: results of a trial of hospitalists. Ann Intern Med. 2002;137(11):866–874.
- , , , , , . The Effects of on‐duty napping on intern sleep time and fatigue. Ann Intern Med. 2006;144(11):792–798.
- , , , et al. Patients evaluate their hospital care: a national survey. Health Aff (Millwood). 1991;10(4):254–267.
- , , , . A new method of classifying prognostic comorbidity in longitudinal studies: development and validation. J Chronic Dis. 1987;40(5):373–383.
- Agency for Healthcare Research and Quality. Welcome to HCUPnet. Available at: http://hcupnet.ahrq.gov/HCUPnet.jsp?Id=F70FC59C286BADCB371(4):293–295.
- , , , et al. In the wake of the 2003 and 2011 duty hours regulations, how do internal medicine interns spend their time? J Gen Intern Med. 2013;28(8):1042–1047.
- , , , , , . The composition of intern work while on call. J Gen Intern Med. 2012;27(11):1432–1437.
- , , , et al. Effect of the 2011 vs 2003 duty hour regulation‐compliant models on sleep duration, trainee education, and continuity of patient care among internal medicine house staff: a randomized trial. JAMA Intern Med. 2013;173(8):649–655.
- , , , et al. The impact of hospitalist discontinuity on hospital cost, readmissions, and patient satisfaction. J Gen Intern Med. 2014;29(7):1004–1008.
- , , , , . Hospitalist time usage and cyclicality: opportunities to improve efficiency. J Hosp Med. 2010;5(6):329–334.
- , , , et al. Where did the day go?—a time‐motion study of hospitalists. J Hosp Med. 2010;5(6):323–328.
- , , . How hospitalists spend their time: insights on efficiency and safety. J Hosp Med. 2006;1(2):88–93.
- , , . Patient satisfaction associated with correct identification of physician's photographs. Mayo Clin Proc. 2001;76(6):604–608.
- , , , . Comparing patient outcomes of academician‐preceptors, hospitalist‐preceptors, and hospitalists on internal medicine services in an academic medical center. J Gen Intern Med. 2014;29(12):1672–1678.
- , , , . Comparison of processes and outcomes of pneumonia care between hospitalists and community‐based primary care physicians. Mayo Clin Proc. 2002;77(10):1053–1058.
- , , , , , . Outcomes of care by hospitalists, general internists, and family physicians. N Engl J Med. 2007;357(25):2589–2600.
- . A systematic review of outcomes and quality measures in adult patients cared for by hospitalists vs nonhospitalists. Mayo Clin Proc. 2009;84(3):248–254.
- , . Do hospitalist physicians improve the quality of inpatient care delivery? A systematic review of process, efficiency and outcome measures. BMC Med. 2011;9(1):58.
- , . Patients' experiences of everyday life after lung transplantation. J Clin Nurs. 2009;18(24):3472–3479.
- , , , et al. Optimal design features for surveying low‐income populations. J Health Care Poor Underserved. 2005;16(4):677–690.
The hospitalized patient experience has become an area of increased focus for hospitals given the recent coupling of patient satisfaction to reimbursement rates for Medicare patients.[1] Although patient experiences are multifactorial, 1 component is the relationship that hospitalized patients develop with their inpatient physicians. In recognition of the importance of this relationship, several organizations including the Society of Hospital Medicine, Society of General Internal Medicine, American College of Physicians, the American College of Emergency Physicians, and the Accreditation Council for Graduate Medical Education have recommended that patients know and understand who is guiding their care at all times during their hospitalization.[2, 3] Unfortunately, previous studies have shown that hospitalized patients often lack the ability to identify[4, 5] and understand their course of care.[6, 7] This may be due to numerous clinical factors including lack of a prior relationship, rapid pace of clinical care, and the frequent transitions of care found in both hospitalists and general medicine teaching services.[5, 8, 9] Regardless of the cause, one could hypothesize that patients who are unable to identify or understand the role of their physician may be less informed about their hospitalization, which may lead to further confusion, dissatisfaction, and ultimately a poor experience.
Given the proliferation of nonteaching hospitalist services in teaching hospitals, it is important to understand if patient experiences differ between general medicine teaching and hospitalist services. Several reasons could explain why patient experiences may vary on these services. For example, patients on a hospitalist service will likely interact with a single physician caretaker, which may give a feeling of more personalized care. In contrast, patients on general medicine teaching services are cared for by larger teams of residents under the supervision of an attending physician. Residents are also subjected to duty‐hour restrictions, clinic responsibilities, and other educational requirements that may impede the continuity of care for hospitalized patients.[10, 11, 12] Although 1 study has shown that hospitalist‐intensive hospitals perform better on patient satisfaction measures,[13] no study to date has compared patient‐reported experiences on general medicine teaching and nonteaching hospitalist services. This study aimed to evaluate the hospitalized patient experience on both teaching and nonteaching hospitalist services by assessing several patient‐reported measures of their experience, namely their confidence in their ability to identify their physician(s), understand their roles, and their rating of both the coordination and overall care.
METHODS
Study Design
We performed a retrospective cohort analysis at the University of Chicago Medical Center between July 2007 and June 2013. Data were acquired as part of the Hospitalist Project, an ongoing study that is used to evaluate the impact of hospitalists, and now serves as infrastructure to continue research related to hospital care at University of Chicago.[14] Patients were cared for by either the general medicine teaching service or the nonteaching hospitalist service. General medicine teaching services were composed of an attending physician who rotates for 2 weeks at a time, a second‐ or third‐year medicine resident, 1 to 2 medicine interns, and 1 to 2 medical students.[15] The attending physician assigned to the patient's hospitalization was the attending listed on the first day of hospitalization, regardless of the length of hospitalization. Nonteaching hospitalist services consisted of a single hospitalist who worked 7‐day shifts, and were assisted by a nurse practitioner/physician's assistant (NPA). The majority of attendings on the hospitalist service were less than 5 years out of residency. Both services admitted 7 days a week, with patients initially admitted to the general medicine teaching service until resident caps were met, after which all subsequent admissions were admitted to the hospitalist service. In addition, the hospitalist service is also responsible for specific patient subpopulations, such as lung and renal transplants, and oncologic patients who have previously established care with our institution.
Data Collection
During a 30‐day posthospitalization follow‐up questionnaire, patients were surveyed regarding their confidence in their ability to identify and understand the roles of their physician(s) and their perceptions of the overall coordination of care and their overall care, using a 5‐point Likert scale (1 = poor understanding to 5 = excellent understanding). Questions related to satisfaction with care and coordination were derived from the Picker‐Commonwealth Survey, a previously validated survey meant to evaluate patient‐centered care.[16] Patients were also asked to report their race, level of education, comorbid diseases, and whether they had any prior hospitalizations within 1 year. Chart review was performed to obtain patient age, gender, and hospital length of stay (LOS), and calculated Charlson Comorbidity Index (CCI).[17] Patients with missing data or responses to survey questions were excluded from final analysis. The University of Chicago Institutional Review Board approved the study protocol, and all patients provided written consented prior to participation.
Data Analysis
After initial analysis noted that outcomes were skewed, the decision was made to dichotomize the data and use logistic rather than linear regression models. Patient responses to the follow‐up phone questionnaire were dichotomized to reflect the top 2 categories (excellent and very good). Pearson 2 analysis was used to assess for any differences in demographic characteristics, disease severity, and measures of patient experience between the 2 services. To assess if service type was associated with differences in our 4 measures of patient experience, we created a 3‐level mixed‐effects logistic regression using a logit function while controlling for age, gender, race, CCI, LOS, previous hospitalizations within 1 year, level of education, and academic year. These models studied the longitudinal association between teaching service and the 4 outcome measures, while also controlling for the cluster effect of time nested within individual patients who were clustered within physicians. The model included random intercepts at both the patient and physician level and also included a random effect of service (teaching vs nonteaching) at the patient level. A Hausman test was used to determine if these random‐effects models improved fit over a fixed‐effects model, and the intraclass correlations were compared using likelihood ratio tests to determine the appropriateness of a 3‐level versus 2‐level model. Data management and 2 analyses were performed using Stata version 13.0 (StataCorp, College Station, TX), and mixed‐effects regression models were done in SuperMix (Scientific Software International, Skokie, IL).
RESULTS
In total, 14,855 patients were enrolled during their hospitalization with 57% and 61% completing the 30‐day follow‐up survey on the hospitalist and general medicine teaching service, respectively. In total, 4131 (69%) and 4322 (48%) of the hospitalist and general medicine services, respectively, either did not answer all survey questions, or were missing basic demographic data, and thus were excluded. Data from 4591 patients on the general medicine teaching (52% of those enrolled at hospitalization) and 1811 on the hospitalist service (31% of those enrolled at hospitalization) were used for final analysis (Figure 1). Respondents were predominantly female (61% and 56%), African American (75% and 63%), with a mean age of 56.2 (19.4) and 57.1 (16.1) years, for the general medicine teaching and hospitalist services, respectively. A majority of patients (71% and 66%) had a CCI of 0 to 3 on both services. There were differences in self‐reported comorbidities between the 2 groups, with hospitalist services having a higher prevalence of cancer (20% vs 7%), renal disease (25% vs 18%), and liver disease (23% vs 7%). Patients on the hospitalist service had a longer mean LOS (5.5 vs 4.8 days), a greater percentage of a hospitalization within 1 year (58% vs 52%), and a larger proportion who were admitted in 2011 to 2013 compared to 2007 to 2010 (75% vs 39%), when compared to the general medicine teaching services. Median LOS and interquartile ranges were similar between both groups. Although most baseline demographics were statistically different between the 2 groups (Table 1), these differences were likely clinically insignificant. Compared to those who responded to the follow‐up survey, nonresponders were more likely to be African American (73% and 64%, P < 0.001) and female (60% and 56%, P < 0.01). The nonresponders were more likely to be hospitalized in the past 1 year (62% and 53%, P < 0.001) and have a lower CCI (CCI 03 [75% and 80%, P < 0.001]) compared to responders. Demographics between responders and nonresponders were also statistically different from one another.
| Variable | General Medicine Teaching | Nonteaching Hospitalist | P Value |
|---|---|---|---|
| |||
| Total (n) | 4,591 | 1,811 | <0.001 |
| Attending classification, hospitalist, n (%) | 1,147 (25) | 1,811 (100) | |
| Response rate, % | 61 | 57 | <0.01 |
| Age, y, mean SD | 56.2 19.4 | 57.1 16.1 | <0.01 |
| Gender, n (%) | <0.01 | ||
| Male | 1,796 (39) | 805 (44) | |
| Female | 2,795 (61) | 1,004 (56) | |
| Race, n (%) | <0.01 | ||
| African American | 3,440 (75) | 1,092 (63) | |
| White | 900 (20) | 571 (32) | |
| Asian/Pacific | 38 (1) | 17 (1) | |
| Other | 20 (1) | 10 (1) | |
| Unknown | 134 (3) | 52 (3) | |
| Charlson Comorbidity Index, n (%) | <0.001 | ||
| 0 | 1,635 (36) | 532 (29) | |
| 12 | 1,590 (35) | 675 (37) | |
| 39 | 1,366 (30) | 602 (33) | |
| Self‐reported comorbidities | |||
| Anemia/sickle cell disease | 1,201 (26) | 408 (23) | 0.003 |
| Asthma/COPD | 1,251 (28) | 432 (24) | 0.006 |
| Cancer* | 300 (7) | 371 (20) | <0.001 |
| Depression | 1,035 (23) | 411 (23) | 0.887 |
| Diabetes | 1,381 (30) | 584 (32) | 0.087 |
| Gastrointestinal | 1,140 (25) | 485 (27) | 0.104 |
| Cardiac | 1,336 (29) | 520 (29) | 0.770 |
| Hypertension | 2,566 (56) | 1,042 (58) | 0.222 |
| HIV/AIDS | 151 (3) | 40 (2) | 0.022 |
| Kidney disease | 828 (18) | 459 (25) | <0.001 |
| Liver disease | 313 (7) | 417 (23) | <0.001 |
| Stroke | 543 (12) | 201 (11) | 0.417 |
| Education level | 0.066 | ||
| High school | 2,248 (49) | 832 (46) | |
| Junior college/college | 1,878 (41) | 781 (43) | |
| Postgraduate | 388 (8) | 173 (10) | |
| Don't know | 77 (2) | 23 (1) | |
| Academic year, n (%) | <0.001 | ||
| July 2007 June 2008 | 938 (20) | 90 (5) | |
| July 2008 June 2009 | 702 (15) | 148 (8) | |
| July 2009 June 2010 | 576(13) | 85 (5) | |
| July 2010 June 2011 | 602 (13) | 138 (8) | |
| July 2011 June 2012 | 769 (17) | 574 (32) | |
| July 2012 June 2013 | 1,004 (22) | 774 (43) | |
| Length of stay, d, mean SD | 4.8 7.3 | 5.5 6.4 | <0.01 |
| Prior hospitalization (within 1 year), yes, n (%) | 2,379 (52) | 1,039 (58) | <0.01 |
Unadjusted results revealed that patients on the hospitalist service were more confident in their abilities to identify their physician(s) (50% vs 45%, P < 0.001), perceived greater ability in understanding the role of their physician(s) (54% vs 50%, P < 0.001), and reported greater satisfaction with coordination and teamwork (68% vs 64%, P = 0.006) and with overall care (73% vs 67%, P < 0.001) (Figure 2).
From the mixed‐effects regression models it was discovered that admission to the hospitalist service was associated with a higher odds ratio (OR) of reporting overall care as excellent or very good (OR: 1.33; 95% confidence interval [CI]: 1.15‐1.47). There was no difference between services in patients' ability to identify their physician(s) (OR: 0.89; 95% CI: 0.61‐1.11), in patients reporting a better understanding of the role of their physician(s) (OR: 1.09; 95% CI: 0.94‐1.23), or in their rating of overall coordination and teamwork (OR: 0.71; 95% CI: 0.42‐1.89).
A subgroup analysis was performed on the 25% of hospitalist attendings in the general medicine teaching service comparing this cohort to the hospitalist services, and it was found that patients perceived better overall care on the hospitalist service (OR: 1.17; 95% CI: 1.01‐ 1.31) than on the general medicine service (Table 2). All other domains in the subgroup analysis were not statistically significant. Finally, an ordinal logistic regression was performed for each of these outcomes, but it did not show any major differences compared to the logistic regression of dichotomous outcomes.
| Domains in Patient Experience* | Odds Ratio (95% CI) | P Value |
|---|---|---|
| ||
| How would you rate your ability to identify the physicians and trainees on your general medicine team during the hospitalization? | ||
| Model 1 | 0.89 (0.611.11) | 0.32 |
| Model 2 | 0.98 (0.671.22) | 0.86 |
| How would you rate your understanding of the roles of the physicians and trainees on your general medicine team? | ||
| Model 1 | 1.09 (0.941.23) | 0.25 |
| Model 2 | 1.19 (0.981.36) | 0.08 |
| How would you rate the overall coordination and teamwork among the doctors and nurses who care for you during your hospital stay? | ||
| Model 1 | 0.71 (0.421.89) | 0.18 |
| Model 2 | 0.82 (0.651.20) | 0.23 |
| Overall, how would you rate the care you received at the hospital? | ||
| Model 1 | 1.33 (1.151.47) | 0.001 |
| Model 2 | 1.17 (1.011.31) | 0.04 |
DISCUSSION
This study is the first to directly compare measures of patient experience on hospitalist and general medicine teaching services in a large, multiyear comparison across multiple domains. In adjusted analysis, we found that patients on nonteaching hospitalist services rated their overall care better than those on general medicine teaching services, whereas no differences in patients' ability to identify their physician(s), understand their role in their care, or rating of coordination of care were found. Although the magnitude of the differences in rating of overall care may appear small, it remains noteworthy because of the recent focus on patient experience at the reimbursement level, where small differences in performance can lead to large changes in payment. Because of the observational design of this study, it is important to consider mechanisms that could account for our findings.
The first are the structural differences between the 2 services. Our subgroup analysis comparing patients rating of overall care on a general medicine service with a hospitalist attending to a pure hospitalist cohort found a significant difference between the groups, indicating that the structural differences between the 2 groups may be a significant contributor to patient satisfaction ratings. Under the care of a hospitalist service, a patient would only interact with a single physician on a daily basis, possibly leading to a more meaningful relationship and improved communication between patient and provider. Alternatively, while on a general medicine teaching service, patients would likely interact with multiple physicians, as a result making their confidence in their ability to identify and perception at understanding physicians' roles more challenging.[18] This dilemma is further compounded by duty hour restrictions, which have subsequently led to increased fragmentation in housestaff scheduling. The patient experience on the general medicine teaching service may be further complicated by recent data that show residents spend a minority of time in direct patient care,[19, 20] which could additionally contribute to patients' inability to understand who their physicians are and to the decreased satisfaction with their care. This combination of structural complexity, duty hour reform, and reduced direct patient interaction would likely decrease the chance a patient will interact with the same resident on a consistent basis,[5, 21] thus making the ability to truly understand who their caretakers are, and the role they play, more difficult.
Another contributing factor could be the use of NPAs on our hospitalist service. Given that these providers often see the patient on a more continual basis, hospitalized patients' exposure to a single, continuous caretaker may be a factor in our findings.[22] Furthermore, with studies showing that hospitalists also spend a small fraction of their day in direct patient care,[23, 24, 25] the use of NPAs may allow our hospitalists to spend greater amounts of time with their patients, thus improving patients' rating of their overall care and influencing their perceived ability to understand their physician's role.
Although there was no difference between general medicine teaching and hospitalist services with respect to patient understanding of their roles, our data suggest that both groups would benefit from interventions to target this area. Focused attempts at improving patient's ability to identify and explain the roles of their inpatient physician(s) have been performed. For example, previous studies have attempted to improve a patient's ability to identify their physician through physician facecards[8, 9] or the use of other simple interventions (ie, bedside whiteboards).[4, 26] Results from such interventions are mixed, as they have demonstrated the capacity to improve patients' ability to identify who their physician is, whereas few have shown any appreciable improvement in patient satisfaction.[26]
Although our findings suggest that structural differences in team composition may be a possible explanation, it is also important to consider how the quality of care a patient receives affects their experience. For instance, hospitalists have been shown to produce moderate improvements in patient‐centered outcomes such as 30‐day readmission[27] and hospital length of stay[14, 28, 29, 30, 31] when compared to other care providers, which in turn could be reflected in the patient's perception of their overall care. In a large national study of acute care hospitals using the Hospital Consumer Assessment of Healthcare Providers and Systems survey, Chen and colleagues found that for most measures of patient satisfaction, hospitals with greater use of hospitalist care were associated with better patient‐centered care.[13] These outcomes were in part driven by patient‐centered domains such as discharge planning, pain control, and medication management. It is possible that patients are sensitive to the improved outcomes that are associated with hospitalist services, and reflect this in their measures of patient satisfaction.
Last, because this is an observational study and not a randomized trial, it is possible that the clinical differences in the patients cared for by these services could have led to our findings. Although the clinical significance of the differences in patient demographics were small, patients seen on the hospitalist service were more likely to be older white males, with a slightly longer LOS, greater comorbidities, and more hospitalizations in the previous year than those seen on the general medicine teaching service. Additionally, our hospitalist service frequently cares for highly specific subpopulations (ie, liver and renal transplant patients, and oncology patients), which could have influenced our results. For example, transplant patients who may be very grateful for their second chance, are preferentially admitted to the hospitalist service, which could have biased our results in favor of hospitalists.[32] Unfortunately, we were unable to control for all such factors.
Although we hope that multivariable analysis can adjust for many of these differences, we are not able to account for possible unmeasured confounders such as time of day of admission, health literacy, personality differences, physician turnover, or nursing and other ancillary care that could contribute to these findings. In addition to its observational study design, our study has several other limitations. First, our study was performed at a single institution, thus limiting its generalizability. Second, as a retrospective study based on observational data, no definitive conclusions regarding causality can be made. Third, although our response rate was low, it is comparable to other studies that have examined underserved populations.[33, 34] Fourth, because our survey was performed 30 days after hospitalization, this may impart imprecision on our outcomes measures. Finally, we were not able to mitigate selection bias through imputation for missing data .
All together, given the small absolute differences between the groups in patients' ratings of their overall care compared to large differences in possible confounders, these findings call for further exploration into the significance and possible mechanisms of these outcomes. Our study raises the potential possibility that the structural component of a care team may play a role in overall patient satisfaction. If this is the case, future studies of team structure could help inform how best to optimize this component for the patient experience. On the other hand, if process differences are to explain our findings, it is important to distill the types of processes hospitalists are using to improve the patient experience and potentially export this to resident services.
Finally, if similar results were found in other institutions, these findings could have implications on how hospitals respond to new payment models that are linked to patient‐experience measures. For example, the Hospital Value‐Based Purchasing Program currently links the Centers for Medicare and Medicaid Services payments to a set of quality measures that consist of (1) clinical processes of care (70%) and (2) the patient experience (30%).[1] Given this linkage, any small changes in the domain of patient satisfaction could have large payment implications on a national level.
CONCLUSION
In summary, in this large‐scale multiyear study, patients cared for by a nonteaching hospitalist service reported greater satisfaction with their overall care than patients cared for by a general medicine teaching service. This difference could be mediated by the structural differences between these 2 services. As hospitals seek to optimize patient experiences in an era where reimbursement models are now being linked to patient‐experience measures, future work should focus on further understanding the mechanisms for these findings.
Disclosures
Financial support for this work was provided by the Robert Wood Johnson Investigator Program (RWJF Grant ID 63910 PI Meltzer), a Midcareer Career Development Award from the National Institute of Aging (1 K24 AG031326‐01, PI Meltzer), and a Clinical and Translational Science Award (NIH/NCATS 2UL1TR000430‐08, PI Solway, Meltzer Core Leader). The authors report no conflicts of interest.
- Hospital Consumer Assessment of Healthcare Providers and Systems. HCAHPS fact sheet. CAHPS hospital survey August 2013. Available at: http://www.hcahpsonline.org/files/August_2013_HCAHPS_Fact_Sheet3.pdf. Accessed February 2, 2015.
- , , , et al. Transitions of Care Consensus policy statement: American College of Physicians, Society of General Internal Medicine, Society of Hospital Medicine, American Geriatrics Society, American College Of Emergency Physicians, and Society for Academic Emergency Medicine. J Hosp Med. 2009;4(6):364–370.
- Accreditation Council for Graduate Medical Education. Common program requirements. Available at: http://www.acgme.org/acgmeweb/Portals/0/PFAssets/ProgramRequirements/CPRs2013.pdf. Accessed January 15, 2015.
- , , . Increasing a patient's ability to identify his or her attending physician using a patient room display. Arch Intern Med. 2010;170(12):1084–1085.
- , , , , , . Ability of hospitalized patients to identify their in‐hospital physicians. Arch Intern Med. 2009;169(2):199–201.
- , , , et al. Hospitalized patients' understanding of their plan of care. Mayo Clin Proc. 2010;85(1):47–52.
- , , , et al. Patient‐physician communication at hospital discharge and patients' understanding of the postdischarge treatment plan. Arch Intern Med. 1997;157(9):1026–1030.
- , , , et al. Improving inpatients' identification of their doctors: use of FACE cards. Jt Comm J Qual Patient Saf. 2009;35(12):613–619.
- , , , , , . The impact of facecards on patients' knowledge, satisfaction, trust, and agreement with hospital physicians: a pilot study. J Hosp Med. 2014;9(3):137–141.
- , , . Restructuring an inpatient resident service to improve outcomes for residents, students, and patients. Acad Med. 2011;86(12):1500–1507.
- , , . Residency training in the modern era: the pipe dream of less time to learn more, care better, and be more professional. Arch Intern Med. 2005;165(22):2561–2562.
- , , , , . Managing discontinuity in academic medical centers: strategies for a safe and effective resident sign‐out. J Hosp Med. 2006;1(4):257–266.
- , , , . Hospitalist staffing and patient satisfaction in the national Medicare population. J Hosp Med. 2013;8(3):126–131.
- , , , et al. Effects of physician experience on costs and outcomes on an academic general medicine service: results of a trial of hospitalists. Ann Intern Med. 2002;137(11):866–874.
- , , , , , . The Effects of on‐duty napping on intern sleep time and fatigue. Ann Intern Med. 2006;144(11):792–798.
- , , , et al. Patients evaluate their hospital care: a national survey. Health Aff (Millwood). 1991;10(4):254–267.
- , , , . A new method of classifying prognostic comorbidity in longitudinal studies: development and validation. J Chronic Dis. 1987;40(5):373–383.
- Agency for Healthcare Research and Quality. Welcome to HCUPnet. Available at: http://hcupnet.ahrq.gov/HCUPnet.jsp?Id=F70FC59C286BADCB371(4):293–295.
- , , , et al. In the wake of the 2003 and 2011 duty hours regulations, how do internal medicine interns spend their time? J Gen Intern Med. 2013;28(8):1042–1047.
- , , , , , . The composition of intern work while on call. J Gen Intern Med. 2012;27(11):1432–1437.
- , , , et al. Effect of the 2011 vs 2003 duty hour regulation‐compliant models on sleep duration, trainee education, and continuity of patient care among internal medicine house staff: a randomized trial. JAMA Intern Med. 2013;173(8):649–655.
- , , , et al. The impact of hospitalist discontinuity on hospital cost, readmissions, and patient satisfaction. J Gen Intern Med. 2014;29(7):1004–1008.
- , , , , . Hospitalist time usage and cyclicality: opportunities to improve efficiency. J Hosp Med. 2010;5(6):329–334.
- , , , et al. Where did the day go?—a time‐motion study of hospitalists. J Hosp Med. 2010;5(6):323–328.
- , , . How hospitalists spend their time: insights on efficiency and safety. J Hosp Med. 2006;1(2):88–93.
- , , . Patient satisfaction associated with correct identification of physician's photographs. Mayo Clin Proc. 2001;76(6):604–608.
- , , , . Comparing patient outcomes of academician‐preceptors, hospitalist‐preceptors, and hospitalists on internal medicine services in an academic medical center. J Gen Intern Med. 2014;29(12):1672–1678.
- , , , . Comparison of processes and outcomes of pneumonia care between hospitalists and community‐based primary care physicians. Mayo Clin Proc. 2002;77(10):1053–1058.
- , , , , , . Outcomes of care by hospitalists, general internists, and family physicians. N Engl J Med. 2007;357(25):2589–2600.
- . A systematic review of outcomes and quality measures in adult patients cared for by hospitalists vs nonhospitalists. Mayo Clin Proc. 2009;84(3):248–254.
- , . Do hospitalist physicians improve the quality of inpatient care delivery? A systematic review of process, efficiency and outcome measures. BMC Med. 2011;9(1):58.
- , . Patients' experiences of everyday life after lung transplantation. J Clin Nurs. 2009;18(24):3472–3479.
- , , , et al. Optimal design features for surveying low‐income populations. J Health Care Poor Underserved. 2005;16(4):677–690.
© 2015 Society of Hospital Medicine
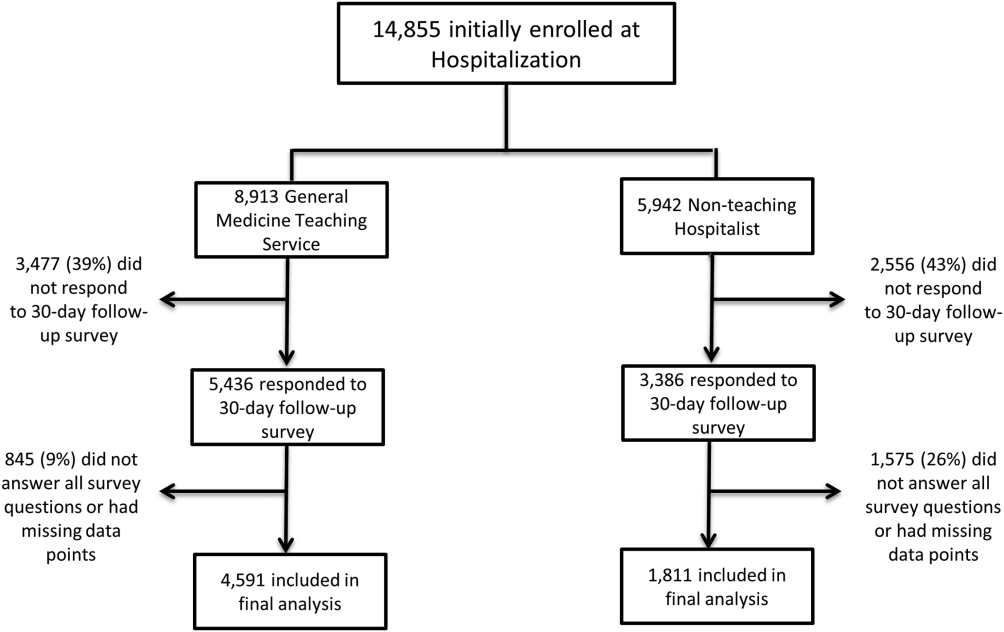
Ultrabrief Cognitive Screening Outcomes
Hospitalization is a critical time for older patients with cognitive impairment. Past research has found that hospitalized older adults with cognitive dysfunction have more rapid cognitive decline, increased morbidity and mortality, and higher costs of healthcare utilization.[1, 2, 3] Those with preexisting cognitive dysfunction, such as dementia, are most susceptible to the negative impacts of hospitalization.[4, 5, 6, 7, 8] Identification of cognitive deficits upon admission is important for risk stratification of patients and prevention of negative hospital health events.
Frontline healthcare providers are underequipped to detect acute cognitive dysfunction.[9, 10] Current practice and research for the detection of cognitive dysfunction in the acute care setting utilizes instruments that require training[11] and are relatively lengthy (>5 minutes).[12] Although these cognitive screening tests are accurate and reliable, the time requirement is not feasible in a fast‐paced clinical setting. A possible alternative is the use of ultra‐brief cognitive screening instruments (<1 minute) that have the potential to identify those individuals requiring additional evaluation and follow‐up. These brief instruments are composed of screening tools that emphasize core features of acute cognitive dysfunction such as level of arousal or attention.[13, 14, 15, 16] Arousal, the ability to respond to or interact with the environment,[15] is an important component of cognition because it is generally preserved in chronic cognitive disorders (eg, dementia). Thus, an alteration in arousal may be a harbinger of more acute impairment[17] in need of evaluation, and in these lowered states of arousal it may be difficult to test for attention.[18] Attention is a broadly defined cognitive domain indicating focus.[19] Older adults, regardless of preexisting cognitive dysfunction, warrant additional cognitive testing if levels of arousal or attention are altered[20, 21] due to the significant relationship to delirium, which is associated with adverse events in this population. Recent research has demonstrated that these brief cognitive screening instruments provide information about the risk for delirium and are a strong test for clinical characteristics of delirium.[16, 21]
The purpose of this analysis was to demonstrate the clinical outcomes of poor performance on ultrabrief assessments arousal and attention by frontline staff using a quality improvement database. Specific objectives include determining (1) the association of poor performance on brief cognitive assessments and hospital outcomes and (2) the inter‐relationship between alterations in the levels of arousal and attention on in‐hospital and discharge outcomes.
METHODS
Setting and Study Design
This is a secondary analysis of data collected from a quality improvement program for delirium risk modification.[22] This program collected data from October 2010 until September 2012 at a Veterans Affairs (VA) tertiary referral center for the New England region. Patients aged 60 years or older and admitted to medical wards were screened upon admission or transfer to VA Boston Healthcare System and provided appropriate interventions to modify delirium risk. Excluded were individuals admitted as observational status, or those readmitted within 30 days of initial screening, and those screened more than 72 hours after admission. Age and sex were abstracted from the medical record. Outcome data were collected from the medical record for the purpose of operating and sustaining the program. In a previous article, the length of stay (LOS) outcome was reported in a subset of this population.[23] The analysis presented here includes the full cohort, presents the interaction with month of the year backward (MOYB), and provides additional outcomes not included in the other article. The VA institutional review board (IRB) reviewed and approved the secondary data analysis of the quality improvement project.
Measures
Brief Cognitive Screening
The baseline assessments of levels of arousal and attention were collected within 72 hours of admission to identify delirium risk. Trained study staff, not involved in the clinical care of patients, administered these assessments as part of the quality improvement project. It is estimated that these assessments took less than 1 minute to complete per individual, but actual administration time was not measured. Assessments were documented within the electronic health record as part of a delirium risk stratification system.
Arousal
The arousal level assessment was the modified Richmond Agitation and Sedation Scale (mRASS). The mRASS is a brief, reliable, observational tool used to determine arousal level.[15, 17] It is a text modification of the RASS[17] for less acutely ill patients, capturing hyperactive and hypoactive altered levels of arousal. The mRASS asks an open‐ended question followed by observation for 10 seconds and completion of a 5 to+4 rating scale. Alert and calm (score=0) is considered normal, with positive numbers related to an increased level of arousal and attention, whereas negative numbers denote decreased levels. For the analyses, an mRASS of 0 is utilized as the reference. Categories were collapsed into 2 and 2 due to few patients on the extremes of the mRASS.
Attention
The MOYB is a brief measure of attention that is included in several instruments for delirium.[19, 24, 25] For this study, the patient was asked to recite the 12 months backward beginning with December. A correct score was given if the individual was able to recite all 12 months to January without any error. An incorrect score was given if any mistake was made. Scoring for the MOYB is not standardized by age, preexisting medical diagnosis, or any other rational.[26] Others have used July or June as a cutoff for a correct score on the MOYB,[21, 25] but a more conservative score of correct to January was used in this study, which has been previously used.[26, 27, 28, 29, 30] A score of not completed was given when the patient was unable to participate or declined to complete the assessment. For the analysis, a correct score on the MOYB is the referent group.
Outcomes
In‐hospital outcomes included (1) restraint use and (2) in‐hospital mortality. Physical restraint use was identified by focused medical record review and identification of required restraint documentation, which, by center policy requires daily review and documentation. Any restraint use during the hospitalization was included.
Discharge outcomes included (1) LOS, (2) discharge other than a location to home, and (3) variable direct costs. LOS was calculated from date of admission until date of discharge. Discharge disposition was identified in the electronic medical record discharge documentation and categorized into discharge to the prehospital residence (home) or not. Hospital variable direct costs were collected from the VA decision support system,[31] a centrally maintained administrative database. The VA decision support system is challenged with accounting for costs of a single‐day admission and patients who are hospitalized from VA long‐term care. To address the missing data from these cases, multiple imputations (n=20) of the missing data were performed.[32] Sensitivity analyses were performed to determine the impact of the imputation and the cost analysis strategy (see Supporting Information, Appendix 1, in the online version of this article).
Statistical Analyses
For this analysis, outcomes are reported at each level of performance on the mRASS (1 to1) and MOYB (correct, incorrect, not completed). For each analysis, the performance with a mean and standard deviation (SD) are reported for continuous outcomes and a percentage for dichotomous outcomes. For dichotomous outcomes, including restraint use, in‐hospital mortality, and discharge disposition, a risk ratio (RR) with 95% confidence interval (CI) is presented. The median is presented for the cost data because variable direct cost is highly skewed. For LOS and cost outcomes, unadjusted incident rate ratio (IRR) from a Poisson regression relative to the referent is presented to compare the categories. A Poisson regression was selected because LOS (a count of days) and variable direct costs (a count of dollars) are highly skewed. The output of Poisson regression produces an IRR and 95% CI relative to the referent group. The Poisson regression could not be adjusted because the quality improvement nature of these data limited the number of covariates collected. Sensitivity analyses did not identify significant interactions of age and sex (results not shown).
MOYB was also compared by level of arousal (mRASS=0 vs all others). Due to the relatively few patients with positive mRASS, it was compressed into a category of abnormal mRASS relative to alert and calm. Similar to the previous analyses, Poisson regression was performed to calculate the IRR (95% CI) relative to correct MOYB for the continuous variables. An RR was calculated for the dichotomous variables. All statistical analyses were performed using Stata version 11.0 (StataCorp, College Station, TX).
RESULTS
Population Description
Over the 2‐year project timeline, a total of 3232 unique individual records were analyzed (Table 1). Patients admitted and screened within the prior 30 days (n=501) and patients screened more than 3 days after admission (n=664) were not included in the analysis. Older adults were on average 74.7 years old (SD=9.8), and 98.2% were male, consistent with the veteran population. Altered level of arousal, as defined by an abnormal mRASS score, was found in 15.3% of the population. Average LOS was 5.2 days (SD=5.6), restraint use occurred in 5.5% during the hospital stay, patients were likely to be discharged home (71.7%), and a small portion died during hospitalization (1.3%). Mean variable direct costs were $11,084 with expected variability (SD=$15,682, median $6,614). Patients who died during the hospital stay had significantly longer LOS (mean 16.8 [SD=12.5] vs 5.1 [SD=5.4] days, P<0.001) and higher variable direct costs ($43,879 [SD=$37,334] vs $12,544 [SD=$16,802], P<0.001), justifying their removal from these analyses.
| Characteristic | Result, N=3,232, Mean (SD) or % (n) |
|---|---|
| |
| Age, y | 74.7 (9.8) |
| Male | 98.2 (3,174) |
| mRASS | |
| 2 | 2.0% (64) |
| 1 | 8.5% (273) |
| 0 | 84.7% (2,737) |
| 1 | 4.0% (131) |
| 2 | 0.8% (27) |
| MOYB | |
| Correct | 48.8% (1,578) |
| Incorrect | 45.1% (1,457) |
| Not completed | 6.1% (197) |
| Restraint use | 5.5% (177) |
| In‐hospital mortality | 1.3% (41) |
| Length of stay, da | 5.1 (5.4) |
| Discharge other than homea | 71.7% (2,292) |
| Variable direct hospital cost, $a | 11,084 (15,682) |
| Median cost, $ | 6,614 |
Impact of Altered Level of Arousal on Outcomes
There is an association between a deviation from a normal level of arousal (mRASS not equal to 0) and worsening outcomes (Table 2). Relative to a normal level of arousal (4.9SD 5.2 days), decreased level of arousal (negative mRASS), and increased arousal (positive mRASS) resulted in longer LOS (6.0SD 5.6 days, 5.7SD 6.8 days, respectively). Similarly, increased or decreased arousal was associated with heightened risk of restraints and less frequent discharge to home. In‐hospital mortality and hospital variable direct costs were significantly higher in those with decreased levels of arousal (IRR: 2.8, 95% CI: 1.36.0; IRR: 1.10, 95% CI: 0.951.26, respectively). The pattern does not hold for increased arousal with respect to in‐hospital mortality and variable direct hospital cost outcomes. The unadjusted analysis found that, relative to normal arousal, there is a significant change in outcomes with decreased levels of arousal. Increased arousal is associated with worsened IRR in LOS, restraint use, and discharge home, but not in‐hospital mortality and variable direct cost.
| mRASS Alert and Calm, n=2,737 | mRASS Negative, n=337 | mRASS Positive, n=158 | ||||
|---|---|---|---|---|---|---|
| Value | IRR/RR (95%CI) | Value | IRR/RR (95% CI) | Value | IRR/RR (95% CI) | |
| ||||||
| Restraint use % (n) | 4.2% (114) | Referent | 10.4% (35) | 2.49 (1.743.57) | 17.7% (28) | 4.25 (2.916.23) |
| In‐hospital mortality % (n) | 1.0% (26) | Referent | 2.7% (9) | 2.81 (1.335.95) | 1.3% (2) | 1.33 (0.325.56) |
| Length of stay, d (SD)a | 4.9 (5.2) | Referent | 6.0 (5.6) | 1.24 (1.181.30) | 5.7 (6.8) | 1.17 (1.091.25) |
| Discharge other than home, % (n)a | 24.9% (675) | Referent | 46.7% (153) | 1.87 (1.642.14) | 48.1% (75) | 1.93 (1.612.30) |
| Variable direct cost, $ (SD)a, b | 10,581 (14,928) | Referent | 11,604 (13,852) | 1.10 (0.951.26) | 10,640 (10,771) | 1.01 (0.851.19) |
| Median cost, $ | 6,318 | 7,738 | 7,858 | |||
Impact of Altered Attention on Outcomes
Patients who completed the MOYB incorrectly had increased restraint use (RR: 2.11, 95% CI 1.443.11) and LOS (IRR: 1.06, 95% CI: 1.021.10), but no difference in in‐hospital mortality, discharge home (RR: 0.78, 95% CI: 0.750.82), and variable direct costs, relative to those who completed the MOYB correctly (Table 3). Importantly, patients who did not complete the MOYB assessment had a 2‐fold increase in restraint use (RR: 2.05, 95% CI: 0.944.50), in‐hospital mortality was nearly 6‐fold higher (RR: 6.36, 95% CI: 2.1618.69), longer LOS (IRR: 1.12, 95% CI: 1.031.21), and returned home less frequently (RR: 1.77, 95% CI: 1.262.48).
| mRASS Normal | mRASS Abnormal | |||||||||||
|---|---|---|---|---|---|---|---|---|---|---|---|---|
| MOYB Correct (n=1,431) | MOYB Incorrect (n=1,181) | MOYB Incomplete (n=125) | MOYB Correct (n=147) | MOYB Incorrect (n=276) | MOYB Incomplete (n=72) | |||||||
| Value | IRR/RR (95% CI) | Value | IRR/RR (95% CI) | Value | IRR/RR (95% CI) | Value | IRR/RR (95% CI) | Value | IRR/RR (95% CI) | Value | IRR/RR (95% CI) | |
| ||||||||||||
| Restraint use, % (n) | 2.7% (39) | Referent | 5.8% (68) | 2.11 (1.44‐3.11) | 5.6% (7) | 2.05 (0.94‐4.50) | 2.7% (4) | 1.00 (0.36‐2.75) | 13.8% (38) | 5.05 (3.29‐7.75) | 29.2% (21) | 10.70 (6.66‐17.20) |
| In‐hospital mortality, % (n) | 0.6% (9) | Referent | 1.0% (12) | 1.62 (0.68‐ 3.82) | 4.0% (5) | 6.36 (2.16‐18.69) | 1.4% (2) | 2.16 (0.47‐9.92) | 2.2% (6) | 3.46 (1.24‐9.63) | 4.2% (3) | 6.63 (1.83‐23.95) |
| Length of stay, d (SD)a | 4.7 (5.4) | Referent | 5.0 (5.1) | 1.06 (1.02‐1.10) | 5.3 (5.0) | 1.12 (1.03‐1.21) | 5.4 (6.0) | 1.13 (1.05‐1.22) | 5.9 (4.4) | 1.23 (1.17‐1.30) | 7.5 (10.0) | 1.55 (1.44‐1.73) |
| Discharge other than home, % (n)a | 17.9% (255) | Referent | 32.7% (382) | 1.82 (1.56‐ 2.14) | 31.7% (38) | 1.77 (1.26‐2.48) | 29.7% (43) | 1.65 (1.20‐2.28) | 53.3% (144) | 2.97 (2.42‐3.64) | 59.4% (41) | 3.31 (2.38‐4.61) |
| Variable direct cost, $ (SD)a, b | 10,609 (16,154) | Referent | 10,482 (13,495) | 0.99 (0.89‐1.10) | 11,213 (12,994) | 1.06 (0.85‐1.32) | 12,010 (15,636) | 1.13 (0.90‐1.42) | 10,776 (10,680) | 1.02 (0.88‐1.17) | 11,815 (14,604) | 1.11 (0.82‐1.51) |
| Median cost, $ | 6,338 | 6,248 | 6,630 | 7,023 | 8,093 | 8,180 | ||||||
Inter‐relationship of Altered Level of Arousal and Attention on Outcomes
The inter‐relationship of altered level of arousal and attention is presented in Table 3. Of patients with a normal mRASS, 52% had correct MOYB. The percentage of correct MOYB declined with the level of arousal, such that 38% had normal MOYB and a mRASS of 1 and 9% had normal MOYB with mRASS of 2. In general, in‐hospital outcomes (restraints and mortality) are associated with MOYB performance, and discharge outcomes (LOS, discharge location, and variable direct costs) are associated with mRASS. Those patients who did not complete the MOYB demonstrated worse outcomes, regardless of mRASS performance, including a 6‐fold increase in mortality and significant increases in LOS and discharge location.
DISCUSSION
Impaired performance on a one‐time assessment of arousal or attention during hospitalization demonstrated a relationship with in‐hospital and discharge outcomes. Relative to normal levels of arousal and attention, alterations in attention, level of arousal, or both were associated with progressively negative consequences. Combined with the prognostic value, the administration of ultra‐brief cognitive screening measures may have value in the identification of patients who would benefit from additional screening, supporting prior work in this area.[23] The brevity of the assessments enhances clinical utility and implementation potential.
Cognitive function during hospitalization has been associated with many negative outcomes including delirium, falls, pressure ulcers, and functional decline.[3, 33, 34, 35, 36, 37] The findings of this analysis are consistent with previous studies and provide important clinical implications. First, prior work in cognitive screening has focused on more time‐consuming instruments.[12] By focusing on brief instruments, particularly those under 1 minute that do not require paper or props, a user‐friendly tool that is associated with health outcomes is provided.
In addition, this analysis demonstrates that each assessment, when used individually, has some prognostic significance associated with the identification of delirium or other types of cognitive impairment. When used alone, abnormal scores on the mRASS or MOYB may be indicative of individuals requiring further cognitive assessment, supporting previous research.[16, 23] Individuals with abnormal scores on both the mRASS and MOYB identify a high‐risk group in need of further clinical assessment for delirium (Figure 1). Neither of these assessments are meant to be used as the only means to diagnosis delirium, but together they identify key clinical characteristics of delirium (arousal and attention).[16, 18, 21] Considering the significant negative consequences associated with delirium, it is not surprising that tools identifying core features of delirium, such as those presented here, would also be associated with in‐hospital and discharge outcomes.
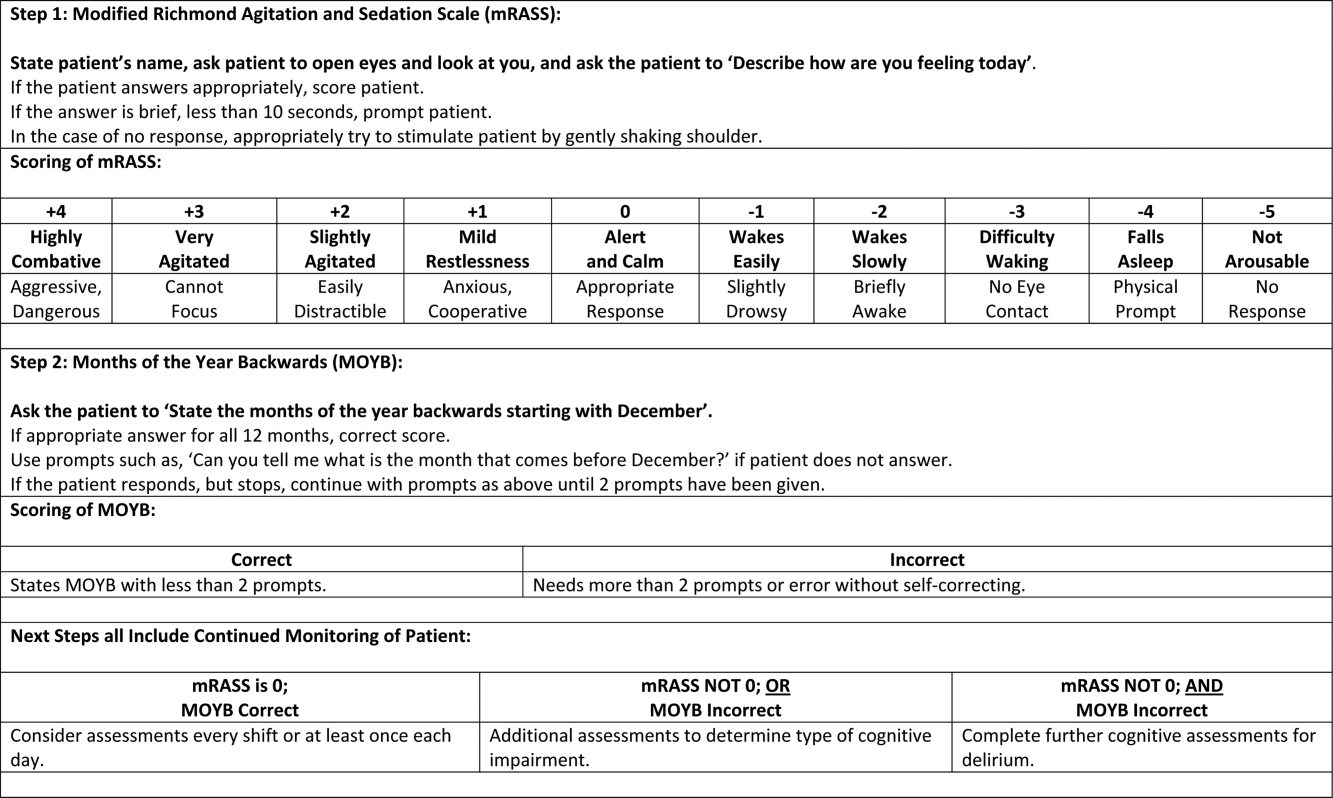
The quality improvement design of this project allowed the recording of outcomes in those who were unable or refused to complete the screening. This may be a potentially high‐risk group who would otherwise go unnoticed. A recent editorial from the American and European Delirium Societies highlights that individuals who are unable or refuse to complete testing due to impaired arousal are neglected in the most recent American Psychiatric Association Diagnostic and Statistical Manual of Mental Disorders, Fifth Edition definition of delirium.[18] Further work to identify and intervene on behalf of individuals who are unable to complete testing will aid in understanding arousal and its relationship to delirium and other disorders.
This analysis provides additional insight in the selection of measures of arousal and attention. Level of arousal is a complex concept that involves components of awareness and alertness, including external stimuli and self‐awareness.[38, 39, 40] As an ultra‐brief measure of arousal level, the mRASS incorporates both external stimuli (asking an open‐ended question) and self‐awareness (describing current state) to determine basic cognitive function. Attention can be defined as the selection of stimuli for further cognitive processing.[40] Attention is an umbrella term referring to many cognitive processes, ranging from sustained attention and working memory to executive function such as set shifting and multitasking. Ultra‐brief measures of attention, such as MOYB, are basic tasks of sustained attention with components of working memory.[19] An alteration in attention may be indicative of a more significant global change in cognition[41] beyond basic cognitive function assessed by administration of the mRASS, such as delirium.[42] The relationship between level of arousal and attention is complex, and arguments have been made that one has to have a certain level of arousal to attend to a stimuli, whereas others have found that one has to have a certain level of attention.[18, 39, 40] Administration of both the mRASS and MOYB is a useful bedside tool for clinicians to examine both basic cognitive function and more complex tasks of attention.
The quality improvement nature of this work has limitations and strengths that deserve mention. The significant strength of this work is the robust sample size. Also, trained staff not involved in the direct clinical care of patients administered the cognitive screens, suggesting that nonclinically trained personnel could be utilized for risk assessment. The major limitation is the restricted amount of covariate data that were collected. Data for this project were collected to operationalize and demonstrate the impact and business case of a delirium risk modification program,[17] limiting the ability to perform adjustment for other covariates such as comorbidity and reason for admission. Also, due to the nature of this project, a diagnosis of delirium was not determined. A limitation of excluding in‐hospital deaths from the cost analysis was that some individuals at high risk died early, thus costing less overall. Generalizability is limited by an over‐representation of males within a single setting. Further use and understanding of mRASS and MOYB in other population is warranted and welcomed. Use of MOYB is also a limitation considering that scores are not standardized across patients or settings.[26] Data regarding administration time of either of these tools were not collected; therefore, determining that these are ultra‐brief assessments (<1 minute) is based on estimates. As such, these measures should not be the sole source of information for clinical evaluation and diagnosis.
CONCLUSION
This work found that impaired performance on brief cognitive assessments of arousal and attention in hospitalized patients were associated with restraint use, in‐hospital mortality, longer LOS, less discharge home, and hospital costs. Routine screening of older patients with brief, user‐friendly cognitive assessments upon admission can identify those who would benefit from additional assessment and intervention to alleviate individual and economic burdens.
Acknowledgements
The authors are indebted to the veterans who participated in their delirium and fall reduction programs. The authors are thankful for the guidance of the VA Boston Healthcare System Delirium Task Force and Patient Safety Officers for continued collaboration to improve outcomes for the veterans they serve.
Disclosures: Dr. Yevchak and Ms. Doherty contributed equally to this article and agreed to share first authorship. This material is based upon work supported by the Department of Veterans Affairs Office of Patient Safety Delirium Patient Safety Center of Inquiry and a Geriatrics and Extended Care T21 Alternative to Non‐institutional Long Term Care award. Archambault, Doherty, Fonda, Kelly, and Rudolph are employees of the US government. Dr. Rudolph also received support from a VA Career Development Award. The views expressed in this article are those of the authors and do not necessarily reflect the position or policy of the Department of Veterans Affairs or the United States Government. The authors report no conflicts of interest.
- , , , , , . Delirium superimposed on dementia predicts 12‐month survival in elderly patients discharged from a postacute rehabilitation facility. J Gerontol A Biol Sci Med Sci. 2007;62(11):1306–1309.
- , , , . Delirium superimposed on dementia is associated with prolonged length of stay and poor outcomes in hospitalized older adults. J Hosp Med. 2013;8(9):500–505.
- , , , et al. Impact and recognition of cognitive impairment among hospitalized elders. J Hosp Med. 2010;5(2):69–75.
- , , , et al. Association between endothelial dysfunction and acute brain dysfunction during critical illness. Anesthesiology. 2013;118(3):631–639.
- , , , et al. Delirium accelerates cognitive decline in Alzheimer disease. Neurology. 2009;72(18):1570–1575.
- , , , et al. Adverse outcomes after hospitalization and delirium in persons with Alzheimer disease. Ann Intern Med. 2012;156(12):848–856.
- , , , et al. Delirium: an independent predictor of functional decline after cardiac surgery. J Am Geriatr Soc. 2010;58(4):643–649.
- , . The importance of delirium: economic and societal costs. J Am Geriatr Soc. 2011;59:S241–S243.
- , , , , , . Managing delirium in the acute care setting: a pilot focus group study. Int J Older People Nurs. 2012;7(2):152–162.
- , , , et al. Barriers and facilitators to implementing delirium rounds in a clinical trial across three diverse hospital settings. Clin Nurs Res. 2014;23(2):201–215.
- , , , , , . Validation of the confusion assessment method in the palliative care setting. Palliat Med. 2009;23(1):40–45.
- , , , . Does this patient have delirium? Value of bedside instruments. JAMA. 2010;304(7):779–786.
- , , , et al. Three core domains of delirium validated using exploratory and confirmatory factor analyses. Psychosomatics. 2013;54(3):227–238.
- , , . A neurologist's approach to delirium: diagnosis and management of toxic metabolic encephalopathies. Eur J Intern Med. 2014;25(2):112–116.
- , , ; the VADWG. Serial administration of a modified Richmond Agitation and Sedation Scale for delirium screening. J Hosp Med. 2012;7(5):450–453.
- . The diagnostic performance of the Richmond Agitation Sedation Scale for detecting delirium in older emergency department patients. Acad Emerg Med. 2015;22(7):878–882.
- , , , et al. The Richmond Agitation Sedation Scale: validity and reliability in adult intensive care unit patients. Am J Respir Crit Care Med. 2002;166(10):1338–1344.
- European Delirium Association, American Delirium Society. The DSM‐5 criteria, level of arousal and delirium diagnosis: inclusiveness is safer. BMC Med. 2014;12:141.
- , , , , , . Pay attention! The critical importance of assessing attention in older adults with dementia. J Gerontol Nurs. 2012;38(11):23–27.
- , , . Delirium: a disorder of consciousness? Med Hypotheses. 2013;80(4):399–404.
- , , , et al. Attention! A good bedside test for delirium? J Neurol Neurosurg Psychiatry. 2014;85(10):1122–1131.
- , , . A delirium risk modification program is associated with hospital outcomes. J Am Med Dir Assoc. 2014;15(12):11.
- , , , et al. Impaired arousal in older adults is associated with prolonged hospital stay and discharge to skilled nursing facility. J Am Med Dir Assoc. 2015;16(7):586–589.
- , , , et al. Validation of the 4AT, a new instrument for rapid delirium screening: a study in 234 hospitalised older people. Age Ageing. 2014;43(4):496–502.
- , , , , , . Reliability of a structured assessment for nonclinicians to detect delirium among new admissions to postacute care. J Am Med Dir Assoc. 2006;7(7):412–415.
- , , , . Reciting the months of the year backwards: what is a ‘normal’ score? Age Ageing. 2015;44(3):537–538.
- , , . A Delirium risk modification program is associated with hospital outcomes. J Am Med Dir Assoc. 2014;15(12):957.e957–957.e911.
- , , , et al. 3D‐CAM: derivation and validation of a 3‐minute diagnostic interview for CAM‐defined delirium: a cross‐sectional diagnostic test study. Ann Intern Med. 2014;161(8):554–561.
- , , , , , . Reliability of a structured assessment for non‐clinicians to detect delirium among new admissions to post‐acute care. J Am Med Dir Assoc. 2006;7:412–415.
- , , , et al. Derivation and validation of a preoperative prediction rule for delirium after cardiac surgery. Circulation. 2009;119(2):229–236.
- , . Use of the Decision Support System for VA cost‐effectiveness research. Med Care. 1999;37(4 suppl Va):AS63–AS70.
- , , , , . Cost analysis in the Department of Veterans Affairs: consensus and future directions. Med Care. 1999;37(4 Suppl Va):AS3‐AS8.
- , , . Delirium: a symptom of how hospital care is failing older persons and a window to improve quality of hospital care. Am J Med. 1999;106(5):565–573.
- , , , et al. A multicomponent intervention to prevent delirium in hospitalized older patients. N Engl J Med. 1999;340(9):669–676.
- , , , . Iatrogenic causes of falls in hospitalised elderly patients: a case‐control study. Postgrad Med J. 2002;78(922):487–489.
- , , , , . A controlled quality improvement trial to reduce the use of physical restraints in older hospitalized adults. J Am Geriatr Soc. 2014;62(3):541–545.
- , , , . Evaluation of the mobile acute care of the elderly (mace) service. JAMA Intern Med. 2013;173(11):990–996.
- , . Conscience and consciousness: a definition. J Med Life. 2014;7(1):104–108.
- , , , et al. Consciousness in humans and non‐human animals: recent advances and future directions. Front Psychol. 2013;4:625.
- . Interdependence of attention and consciousness. In: Rahul B, Bikas KC, eds. Progress in Brain Research. Vol. 168. New York, NY: Elsevier; 2007:65–75.
- , , . Relationship between cognitive and non‐cognitive symptoms of delirium. Asian J Psychiatr. 2013;6(2):106–112.
- , , , , , . Clarifying confusion: the confusion assessment method. A new method for detection of delirium. Ann Intern Med. 1990;113(12):941–948.
Hospitalization is a critical time for older patients with cognitive impairment. Past research has found that hospitalized older adults with cognitive dysfunction have more rapid cognitive decline, increased morbidity and mortality, and higher costs of healthcare utilization.[1, 2, 3] Those with preexisting cognitive dysfunction, such as dementia, are most susceptible to the negative impacts of hospitalization.[4, 5, 6, 7, 8] Identification of cognitive deficits upon admission is important for risk stratification of patients and prevention of negative hospital health events.
Frontline healthcare providers are underequipped to detect acute cognitive dysfunction.[9, 10] Current practice and research for the detection of cognitive dysfunction in the acute care setting utilizes instruments that require training[11] and are relatively lengthy (>5 minutes).[12] Although these cognitive screening tests are accurate and reliable, the time requirement is not feasible in a fast‐paced clinical setting. A possible alternative is the use of ultra‐brief cognitive screening instruments (<1 minute) that have the potential to identify those individuals requiring additional evaluation and follow‐up. These brief instruments are composed of screening tools that emphasize core features of acute cognitive dysfunction such as level of arousal or attention.[13, 14, 15, 16] Arousal, the ability to respond to or interact with the environment,[15] is an important component of cognition because it is generally preserved in chronic cognitive disorders (eg, dementia). Thus, an alteration in arousal may be a harbinger of more acute impairment[17] in need of evaluation, and in these lowered states of arousal it may be difficult to test for attention.[18] Attention is a broadly defined cognitive domain indicating focus.[19] Older adults, regardless of preexisting cognitive dysfunction, warrant additional cognitive testing if levels of arousal or attention are altered[20, 21] due to the significant relationship to delirium, which is associated with adverse events in this population. Recent research has demonstrated that these brief cognitive screening instruments provide information about the risk for delirium and are a strong test for clinical characteristics of delirium.[16, 21]
The purpose of this analysis was to demonstrate the clinical outcomes of poor performance on ultrabrief assessments arousal and attention by frontline staff using a quality improvement database. Specific objectives include determining (1) the association of poor performance on brief cognitive assessments and hospital outcomes and (2) the inter‐relationship between alterations in the levels of arousal and attention on in‐hospital and discharge outcomes.
METHODS
Setting and Study Design
This is a secondary analysis of data collected from a quality improvement program for delirium risk modification.[22] This program collected data from October 2010 until September 2012 at a Veterans Affairs (VA) tertiary referral center for the New England region. Patients aged 60 years or older and admitted to medical wards were screened upon admission or transfer to VA Boston Healthcare System and provided appropriate interventions to modify delirium risk. Excluded were individuals admitted as observational status, or those readmitted within 30 days of initial screening, and those screened more than 72 hours after admission. Age and sex were abstracted from the medical record. Outcome data were collected from the medical record for the purpose of operating and sustaining the program. In a previous article, the length of stay (LOS) outcome was reported in a subset of this population.[23] The analysis presented here includes the full cohort, presents the interaction with month of the year backward (MOYB), and provides additional outcomes not included in the other article. The VA institutional review board (IRB) reviewed and approved the secondary data analysis of the quality improvement project.
Measures
Brief Cognitive Screening
The baseline assessments of levels of arousal and attention were collected within 72 hours of admission to identify delirium risk. Trained study staff, not involved in the clinical care of patients, administered these assessments as part of the quality improvement project. It is estimated that these assessments took less than 1 minute to complete per individual, but actual administration time was not measured. Assessments were documented within the electronic health record as part of a delirium risk stratification system.
Arousal
The arousal level assessment was the modified Richmond Agitation and Sedation Scale (mRASS). The mRASS is a brief, reliable, observational tool used to determine arousal level.[15, 17] It is a text modification of the RASS[17] for less acutely ill patients, capturing hyperactive and hypoactive altered levels of arousal. The mRASS asks an open‐ended question followed by observation for 10 seconds and completion of a 5 to+4 rating scale. Alert and calm (score=0) is considered normal, with positive numbers related to an increased level of arousal and attention, whereas negative numbers denote decreased levels. For the analyses, an mRASS of 0 is utilized as the reference. Categories were collapsed into 2 and 2 due to few patients on the extremes of the mRASS.
Attention
The MOYB is a brief measure of attention that is included in several instruments for delirium.[19, 24, 25] For this study, the patient was asked to recite the 12 months backward beginning with December. A correct score was given if the individual was able to recite all 12 months to January without any error. An incorrect score was given if any mistake was made. Scoring for the MOYB is not standardized by age, preexisting medical diagnosis, or any other rational.[26] Others have used July or June as a cutoff for a correct score on the MOYB,[21, 25] but a more conservative score of correct to January was used in this study, which has been previously used.[26, 27, 28, 29, 30] A score of not completed was given when the patient was unable to participate or declined to complete the assessment. For the analysis, a correct score on the MOYB is the referent group.
Outcomes
In‐hospital outcomes included (1) restraint use and (2) in‐hospital mortality. Physical restraint use was identified by focused medical record review and identification of required restraint documentation, which, by center policy requires daily review and documentation. Any restraint use during the hospitalization was included.
Discharge outcomes included (1) LOS, (2) discharge other than a location to home, and (3) variable direct costs. LOS was calculated from date of admission until date of discharge. Discharge disposition was identified in the electronic medical record discharge documentation and categorized into discharge to the prehospital residence (home) or not. Hospital variable direct costs were collected from the VA decision support system,[31] a centrally maintained administrative database. The VA decision support system is challenged with accounting for costs of a single‐day admission and patients who are hospitalized from VA long‐term care. To address the missing data from these cases, multiple imputations (n=20) of the missing data were performed.[32] Sensitivity analyses were performed to determine the impact of the imputation and the cost analysis strategy (see Supporting Information, Appendix 1, in the online version of this article).
Statistical Analyses
For this analysis, outcomes are reported at each level of performance on the mRASS (1 to1) and MOYB (correct, incorrect, not completed). For each analysis, the performance with a mean and standard deviation (SD) are reported for continuous outcomes and a percentage for dichotomous outcomes. For dichotomous outcomes, including restraint use, in‐hospital mortality, and discharge disposition, a risk ratio (RR) with 95% confidence interval (CI) is presented. The median is presented for the cost data because variable direct cost is highly skewed. For LOS and cost outcomes, unadjusted incident rate ratio (IRR) from a Poisson regression relative to the referent is presented to compare the categories. A Poisson regression was selected because LOS (a count of days) and variable direct costs (a count of dollars) are highly skewed. The output of Poisson regression produces an IRR and 95% CI relative to the referent group. The Poisson regression could not be adjusted because the quality improvement nature of these data limited the number of covariates collected. Sensitivity analyses did not identify significant interactions of age and sex (results not shown).
MOYB was also compared by level of arousal (mRASS=0 vs all others). Due to the relatively few patients with positive mRASS, it was compressed into a category of abnormal mRASS relative to alert and calm. Similar to the previous analyses, Poisson regression was performed to calculate the IRR (95% CI) relative to correct MOYB for the continuous variables. An RR was calculated for the dichotomous variables. All statistical analyses were performed using Stata version 11.0 (StataCorp, College Station, TX).
RESULTS
Population Description
Over the 2‐year project timeline, a total of 3232 unique individual records were analyzed (Table 1). Patients admitted and screened within the prior 30 days (n=501) and patients screened more than 3 days after admission (n=664) were not included in the analysis. Older adults were on average 74.7 years old (SD=9.8), and 98.2% were male, consistent with the veteran population. Altered level of arousal, as defined by an abnormal mRASS score, was found in 15.3% of the population. Average LOS was 5.2 days (SD=5.6), restraint use occurred in 5.5% during the hospital stay, patients were likely to be discharged home (71.7%), and a small portion died during hospitalization (1.3%). Mean variable direct costs were $11,084 with expected variability (SD=$15,682, median $6,614). Patients who died during the hospital stay had significantly longer LOS (mean 16.8 [SD=12.5] vs 5.1 [SD=5.4] days, P<0.001) and higher variable direct costs ($43,879 [SD=$37,334] vs $12,544 [SD=$16,802], P<0.001), justifying their removal from these analyses.
| Characteristic | Result, N=3,232, Mean (SD) or % (n) |
|---|---|
| |
| Age, y | 74.7 (9.8) |
| Male | 98.2 (3,174) |
| mRASS | |
| 2 | 2.0% (64) |
| 1 | 8.5% (273) |
| 0 | 84.7% (2,737) |
| 1 | 4.0% (131) |
| 2 | 0.8% (27) |
| MOYB | |
| Correct | 48.8% (1,578) |
| Incorrect | 45.1% (1,457) |
| Not completed | 6.1% (197) |
| Restraint use | 5.5% (177) |
| In‐hospital mortality | 1.3% (41) |
| Length of stay, da | 5.1 (5.4) |
| Discharge other than homea | 71.7% (2,292) |
| Variable direct hospital cost, $a | 11,084 (15,682) |
| Median cost, $ | 6,614 |
Impact of Altered Level of Arousal on Outcomes
There is an association between a deviation from a normal level of arousal (mRASS not equal to 0) and worsening outcomes (Table 2). Relative to a normal level of arousal (4.9SD 5.2 days), decreased level of arousal (negative mRASS), and increased arousal (positive mRASS) resulted in longer LOS (6.0SD 5.6 days, 5.7SD 6.8 days, respectively). Similarly, increased or decreased arousal was associated with heightened risk of restraints and less frequent discharge to home. In‐hospital mortality and hospital variable direct costs were significantly higher in those with decreased levels of arousal (IRR: 2.8, 95% CI: 1.36.0; IRR: 1.10, 95% CI: 0.951.26, respectively). The pattern does not hold for increased arousal with respect to in‐hospital mortality and variable direct hospital cost outcomes. The unadjusted analysis found that, relative to normal arousal, there is a significant change in outcomes with decreased levels of arousal. Increased arousal is associated with worsened IRR in LOS, restraint use, and discharge home, but not in‐hospital mortality and variable direct cost.
| mRASS Alert and Calm, n=2,737 | mRASS Negative, n=337 | mRASS Positive, n=158 | ||||
|---|---|---|---|---|---|---|
| Value | IRR/RR (95%CI) | Value | IRR/RR (95% CI) | Value | IRR/RR (95% CI) | |
| ||||||
| Restraint use % (n) | 4.2% (114) | Referent | 10.4% (35) | 2.49 (1.743.57) | 17.7% (28) | 4.25 (2.916.23) |
| In‐hospital mortality % (n) | 1.0% (26) | Referent | 2.7% (9) | 2.81 (1.335.95) | 1.3% (2) | 1.33 (0.325.56) |
| Length of stay, d (SD)a | 4.9 (5.2) | Referent | 6.0 (5.6) | 1.24 (1.181.30) | 5.7 (6.8) | 1.17 (1.091.25) |
| Discharge other than home, % (n)a | 24.9% (675) | Referent | 46.7% (153) | 1.87 (1.642.14) | 48.1% (75) | 1.93 (1.612.30) |
| Variable direct cost, $ (SD)a, b | 10,581 (14,928) | Referent | 11,604 (13,852) | 1.10 (0.951.26) | 10,640 (10,771) | 1.01 (0.851.19) |
| Median cost, $ | 6,318 | 7,738 | 7,858 | |||
Impact of Altered Attention on Outcomes
Patients who completed the MOYB incorrectly had increased restraint use (RR: 2.11, 95% CI 1.443.11) and LOS (IRR: 1.06, 95% CI: 1.021.10), but no difference in in‐hospital mortality, discharge home (RR: 0.78, 95% CI: 0.750.82), and variable direct costs, relative to those who completed the MOYB correctly (Table 3). Importantly, patients who did not complete the MOYB assessment had a 2‐fold increase in restraint use (RR: 2.05, 95% CI: 0.944.50), in‐hospital mortality was nearly 6‐fold higher (RR: 6.36, 95% CI: 2.1618.69), longer LOS (IRR: 1.12, 95% CI: 1.031.21), and returned home less frequently (RR: 1.77, 95% CI: 1.262.48).
| mRASS Normal | mRASS Abnormal | |||||||||||
|---|---|---|---|---|---|---|---|---|---|---|---|---|
| MOYB Correct (n=1,431) | MOYB Incorrect (n=1,181) | MOYB Incomplete (n=125) | MOYB Correct (n=147) | MOYB Incorrect (n=276) | MOYB Incomplete (n=72) | |||||||
| Value | IRR/RR (95% CI) | Value | IRR/RR (95% CI) | Value | IRR/RR (95% CI) | Value | IRR/RR (95% CI) | Value | IRR/RR (95% CI) | Value | IRR/RR (95% CI) | |
| ||||||||||||
| Restraint use, % (n) | 2.7% (39) | Referent | 5.8% (68) | 2.11 (1.44‐3.11) | 5.6% (7) | 2.05 (0.94‐4.50) | 2.7% (4) | 1.00 (0.36‐2.75) | 13.8% (38) | 5.05 (3.29‐7.75) | 29.2% (21) | 10.70 (6.66‐17.20) |
| In‐hospital mortality, % (n) | 0.6% (9) | Referent | 1.0% (12) | 1.62 (0.68‐ 3.82) | 4.0% (5) | 6.36 (2.16‐18.69) | 1.4% (2) | 2.16 (0.47‐9.92) | 2.2% (6) | 3.46 (1.24‐9.63) | 4.2% (3) | 6.63 (1.83‐23.95) |
| Length of stay, d (SD)a | 4.7 (5.4) | Referent | 5.0 (5.1) | 1.06 (1.02‐1.10) | 5.3 (5.0) | 1.12 (1.03‐1.21) | 5.4 (6.0) | 1.13 (1.05‐1.22) | 5.9 (4.4) | 1.23 (1.17‐1.30) | 7.5 (10.0) | 1.55 (1.44‐1.73) |
| Discharge other than home, % (n)a | 17.9% (255) | Referent | 32.7% (382) | 1.82 (1.56‐ 2.14) | 31.7% (38) | 1.77 (1.26‐2.48) | 29.7% (43) | 1.65 (1.20‐2.28) | 53.3% (144) | 2.97 (2.42‐3.64) | 59.4% (41) | 3.31 (2.38‐4.61) |
| Variable direct cost, $ (SD)a, b | 10,609 (16,154) | Referent | 10,482 (13,495) | 0.99 (0.89‐1.10) | 11,213 (12,994) | 1.06 (0.85‐1.32) | 12,010 (15,636) | 1.13 (0.90‐1.42) | 10,776 (10,680) | 1.02 (0.88‐1.17) | 11,815 (14,604) | 1.11 (0.82‐1.51) |
| Median cost, $ | 6,338 | 6,248 | 6,630 | 7,023 | 8,093 | 8,180 | ||||||
Inter‐relationship of Altered Level of Arousal and Attention on Outcomes
The inter‐relationship of altered level of arousal and attention is presented in Table 3. Of patients with a normal mRASS, 52% had correct MOYB. The percentage of correct MOYB declined with the level of arousal, such that 38% had normal MOYB and a mRASS of 1 and 9% had normal MOYB with mRASS of 2. In general, in‐hospital outcomes (restraints and mortality) are associated with MOYB performance, and discharge outcomes (LOS, discharge location, and variable direct costs) are associated with mRASS. Those patients who did not complete the MOYB demonstrated worse outcomes, regardless of mRASS performance, including a 6‐fold increase in mortality and significant increases in LOS and discharge location.
DISCUSSION
Impaired performance on a one‐time assessment of arousal or attention during hospitalization demonstrated a relationship with in‐hospital and discharge outcomes. Relative to normal levels of arousal and attention, alterations in attention, level of arousal, or both were associated with progressively negative consequences. Combined with the prognostic value, the administration of ultra‐brief cognitive screening measures may have value in the identification of patients who would benefit from additional screening, supporting prior work in this area.[23] The brevity of the assessments enhances clinical utility and implementation potential.
Cognitive function during hospitalization has been associated with many negative outcomes including delirium, falls, pressure ulcers, and functional decline.[3, 33, 34, 35, 36, 37] The findings of this analysis are consistent with previous studies and provide important clinical implications. First, prior work in cognitive screening has focused on more time‐consuming instruments.[12] By focusing on brief instruments, particularly those under 1 minute that do not require paper or props, a user‐friendly tool that is associated with health outcomes is provided.
In addition, this analysis demonstrates that each assessment, when used individually, has some prognostic significance associated with the identification of delirium or other types of cognitive impairment. When used alone, abnormal scores on the mRASS or MOYB may be indicative of individuals requiring further cognitive assessment, supporting previous research.[16, 23] Individuals with abnormal scores on both the mRASS and MOYB identify a high‐risk group in need of further clinical assessment for delirium (Figure 1). Neither of these assessments are meant to be used as the only means to diagnosis delirium, but together they identify key clinical characteristics of delirium (arousal and attention).[16, 18, 21] Considering the significant negative consequences associated with delirium, it is not surprising that tools identifying core features of delirium, such as those presented here, would also be associated with in‐hospital and discharge outcomes.
The quality improvement design of this project allowed the recording of outcomes in those who were unable or refused to complete the screening. This may be a potentially high‐risk group who would otherwise go unnoticed. A recent editorial from the American and European Delirium Societies highlights that individuals who are unable or refuse to complete testing due to impaired arousal are neglected in the most recent American Psychiatric Association Diagnostic and Statistical Manual of Mental Disorders, Fifth Edition definition of delirium.[18] Further work to identify and intervene on behalf of individuals who are unable to complete testing will aid in understanding arousal and its relationship to delirium and other disorders.
This analysis provides additional insight in the selection of measures of arousal and attention. Level of arousal is a complex concept that involves components of awareness and alertness, including external stimuli and self‐awareness.[38, 39, 40] As an ultra‐brief measure of arousal level, the mRASS incorporates both external stimuli (asking an open‐ended question) and self‐awareness (describing current state) to determine basic cognitive function. Attention can be defined as the selection of stimuli for further cognitive processing.[40] Attention is an umbrella term referring to many cognitive processes, ranging from sustained attention and working memory to executive function such as set shifting and multitasking. Ultra‐brief measures of attention, such as MOYB, are basic tasks of sustained attention with components of working memory.[19] An alteration in attention may be indicative of a more significant global change in cognition[41] beyond basic cognitive function assessed by administration of the mRASS, such as delirium.[42] The relationship between level of arousal and attention is complex, and arguments have been made that one has to have a certain level of arousal to attend to a stimuli, whereas others have found that one has to have a certain level of attention.[18, 39, 40] Administration of both the mRASS and MOYB is a useful bedside tool for clinicians to examine both basic cognitive function and more complex tasks of attention.
The quality improvement nature of this work has limitations and strengths that deserve mention. The significant strength of this work is the robust sample size. Also, trained staff not involved in the direct clinical care of patients administered the cognitive screens, suggesting that nonclinically trained personnel could be utilized for risk assessment. The major limitation is the restricted amount of covariate data that were collected. Data for this project were collected to operationalize and demonstrate the impact and business case of a delirium risk modification program,[17] limiting the ability to perform adjustment for other covariates such as comorbidity and reason for admission. Also, due to the nature of this project, a diagnosis of delirium was not determined. A limitation of excluding in‐hospital deaths from the cost analysis was that some individuals at high risk died early, thus costing less overall. Generalizability is limited by an over‐representation of males within a single setting. Further use and understanding of mRASS and MOYB in other population is warranted and welcomed. Use of MOYB is also a limitation considering that scores are not standardized across patients or settings.[26] Data regarding administration time of either of these tools were not collected; therefore, determining that these are ultra‐brief assessments (<1 minute) is based on estimates. As such, these measures should not be the sole source of information for clinical evaluation and diagnosis.
CONCLUSION
This work found that impaired performance on brief cognitive assessments of arousal and attention in hospitalized patients were associated with restraint use, in‐hospital mortality, longer LOS, less discharge home, and hospital costs. Routine screening of older patients with brief, user‐friendly cognitive assessments upon admission can identify those who would benefit from additional assessment and intervention to alleviate individual and economic burdens.
Acknowledgements
The authors are indebted to the veterans who participated in their delirium and fall reduction programs. The authors are thankful for the guidance of the VA Boston Healthcare System Delirium Task Force and Patient Safety Officers for continued collaboration to improve outcomes for the veterans they serve.
Disclosures: Dr. Yevchak and Ms. Doherty contributed equally to this article and agreed to share first authorship. This material is based upon work supported by the Department of Veterans Affairs Office of Patient Safety Delirium Patient Safety Center of Inquiry and a Geriatrics and Extended Care T21 Alternative to Non‐institutional Long Term Care award. Archambault, Doherty, Fonda, Kelly, and Rudolph are employees of the US government. Dr. Rudolph also received support from a VA Career Development Award. The views expressed in this article are those of the authors and do not necessarily reflect the position or policy of the Department of Veterans Affairs or the United States Government. The authors report no conflicts of interest.
- , , , , , . Delirium superimposed on dementia predicts 12‐month survival in elderly patients discharged from a postacute rehabilitation facility. J Gerontol A Biol Sci Med Sci. 2007;62(11):1306–1309.
- , , , . Delirium superimposed on dementia is associated with prolonged length of stay and poor outcomes in hospitalized older adults. J Hosp Med. 2013;8(9):500–505.
- , , , et al. Impact and recognition of cognitive impairment among hospitalized elders. J Hosp Med. 2010;5(2):69–75.
- , , , et al. Association between endothelial dysfunction and acute brain dysfunction during critical illness. Anesthesiology. 2013;118(3):631–639.
- , , , et al. Delirium accelerates cognitive decline in Alzheimer disease. Neurology. 2009;72(18):1570–1575.
- , , , et al. Adverse outcomes after hospitalization and delirium in persons with Alzheimer disease. Ann Intern Med. 2012;156(12):848–856.
- , , , et al. Delirium: an independent predictor of functional decline after cardiac surgery. J Am Geriatr Soc. 2010;58(4):643–649.
- , . The importance of delirium: economic and societal costs. J Am Geriatr Soc. 2011;59:S241–S243.
- , , , , , . Managing delirium in the acute care setting: a pilot focus group study. Int J Older People Nurs. 2012;7(2):152–162.
- , , , et al. Barriers and facilitators to implementing delirium rounds in a clinical trial across three diverse hospital settings. Clin Nurs Res. 2014;23(2):201–215.
- , , , , , . Validation of the confusion assessment method in the palliative care setting. Palliat Med. 2009;23(1):40–45.
- , , , . Does this patient have delirium? Value of bedside instruments. JAMA. 2010;304(7):779–786.
- , , , et al. Three core domains of delirium validated using exploratory and confirmatory factor analyses. Psychosomatics. 2013;54(3):227–238.
- , , . A neurologist's approach to delirium: diagnosis and management of toxic metabolic encephalopathies. Eur J Intern Med. 2014;25(2):112–116.
- , , ; the VADWG. Serial administration of a modified Richmond Agitation and Sedation Scale for delirium screening. J Hosp Med. 2012;7(5):450–453.
- . The diagnostic performance of the Richmond Agitation Sedation Scale for detecting delirium in older emergency department patients. Acad Emerg Med. 2015;22(7):878–882.
- , , , et al. The Richmond Agitation Sedation Scale: validity and reliability in adult intensive care unit patients. Am J Respir Crit Care Med. 2002;166(10):1338–1344.
- European Delirium Association, American Delirium Society. The DSM‐5 criteria, level of arousal and delirium diagnosis: inclusiveness is safer. BMC Med. 2014;12:141.
- , , , , , . Pay attention! The critical importance of assessing attention in older adults with dementia. J Gerontol Nurs. 2012;38(11):23–27.
- , , . Delirium: a disorder of consciousness? Med Hypotheses. 2013;80(4):399–404.
- , , , et al. Attention! A good bedside test for delirium? J Neurol Neurosurg Psychiatry. 2014;85(10):1122–1131.
- , , . A delirium risk modification program is associated with hospital outcomes. J Am Med Dir Assoc. 2014;15(12):11.
- , , , et al. Impaired arousal in older adults is associated with prolonged hospital stay and discharge to skilled nursing facility. J Am Med Dir Assoc. 2015;16(7):586–589.
- , , , et al. Validation of the 4AT, a new instrument for rapid delirium screening: a study in 234 hospitalised older people. Age Ageing. 2014;43(4):496–502.
- , , , , , . Reliability of a structured assessment for nonclinicians to detect delirium among new admissions to postacute care. J Am Med Dir Assoc. 2006;7(7):412–415.
- , , , . Reciting the months of the year backwards: what is a ‘normal’ score? Age Ageing. 2015;44(3):537–538.
- , , . A Delirium risk modification program is associated with hospital outcomes. J Am Med Dir Assoc. 2014;15(12):957.e957–957.e911.
- , , , et al. 3D‐CAM: derivation and validation of a 3‐minute diagnostic interview for CAM‐defined delirium: a cross‐sectional diagnostic test study. Ann Intern Med. 2014;161(8):554–561.
- , , , , , . Reliability of a structured assessment for non‐clinicians to detect delirium among new admissions to post‐acute care. J Am Med Dir Assoc. 2006;7:412–415.
- , , , et al. Derivation and validation of a preoperative prediction rule for delirium after cardiac surgery. Circulation. 2009;119(2):229–236.
- , . Use of the Decision Support System for VA cost‐effectiveness research. Med Care. 1999;37(4 suppl Va):AS63–AS70.
- , , , , . Cost analysis in the Department of Veterans Affairs: consensus and future directions. Med Care. 1999;37(4 Suppl Va):AS3‐AS8.
- , , . Delirium: a symptom of how hospital care is failing older persons and a window to improve quality of hospital care. Am J Med. 1999;106(5):565–573.
- , , , et al. A multicomponent intervention to prevent delirium in hospitalized older patients. N Engl J Med. 1999;340(9):669–676.
- , , , . Iatrogenic causes of falls in hospitalised elderly patients: a case‐control study. Postgrad Med J. 2002;78(922):487–489.
- , , , , . A controlled quality improvement trial to reduce the use of physical restraints in older hospitalized adults. J Am Geriatr Soc. 2014;62(3):541–545.
- , , , . Evaluation of the mobile acute care of the elderly (mace) service. JAMA Intern Med. 2013;173(11):990–996.
- , . Conscience and consciousness: a definition. J Med Life. 2014;7(1):104–108.
- , , , et al. Consciousness in humans and non‐human animals: recent advances and future directions. Front Psychol. 2013;4:625.
- . Interdependence of attention and consciousness. In: Rahul B, Bikas KC, eds. Progress in Brain Research. Vol. 168. New York, NY: Elsevier; 2007:65–75.
- , , . Relationship between cognitive and non‐cognitive symptoms of delirium. Asian J Psychiatr. 2013;6(2):106–112.
- , , , , , . Clarifying confusion: the confusion assessment method. A new method for detection of delirium. Ann Intern Med. 1990;113(12):941–948.
© 2015 Society of Hospital Medicine

Mental Status to Predict Mortality
Altered mental status (AMS), characterized by abnormal changes in a patient's arousal and/or cognition, is a significant predictor of hospital mortality.[1, 2, 3] Yet despite its prevalence[3, 4, 5] and importance, up to three‐quarters of AMS events go unrecognized by caregivers.[6, 7, 8] Acute changes in mental status, often caused by delirium in the hospitalized patient,[3] can present nonspecifically, making it difficult to detect and distinguish from other diagnoses such as depression or dementia.[7, 9] Further complicating the recognition of AMS, numerous and imprecise qualitative descriptors such as confused and alert and oriented are used in clinical practice to describe the mental status of patients.[10] Thus, more objective measures may result in improved detection of altered mental status and in earlier diagnostic and therapeutic interventions.
In critically ill patients, several scales have been widely adopted for quantifying mental status. The Richmond Agitation and Sedation Scale (RASS) was created to optimize sedation.[11] The Glasgow Coma Scale (GCS) was developed for head‐trauma patients[12] and is now a standardized assessment tool in intensive care units,[13] the emergency department,[14] and the prehospital setting.[15] In addition, a simplified scale, AVPU (Alert, responsive to Verbal stimuli, responsive to Painful stimuli, and Unresponsive) was initially used in the primary survey of trauma patients[16] but is now a common component of early‐warning scores and rapid response activation criteria, such as the Modified Early Warning Score (MEWS).[17, 18] In fact, in a systematic review of 72 distinct early‐warning scores, 89% of the scores used AVPU as the measure of mentation.[17] However, the utility of these 3 scales is not well established in the general‐ward setting. Our aim was therefore to compare the accuracies of AVPU, GCS, and RASS for predicting mortality in hospitalized general‐ward patients to provide insight into the accuracy of these different scores for clinical deterioration.
METHODS
Study Setting and Protocol
We conducted an observational cohort study of consecutive adult general‐ward admissions from July 2011 through January 2013 at a 500‐bed, urban US teaching hospital. During the study period, no early‐warning scoring systems were in place on the hospital wards. Rapid response teams responding to altered mental status would do so without specific thresholds for activation. During this period, nurses on the general floors were expected to record each patient's GCS and RASS score in the electronic health record (EPIC Systems Corp., Verona, WI) as part of the routine patient assessment at least once every 12‐hour shift. AVPU assessments were extracted from the eye component of the GCS. The letter A was assigned to a GCS Eye score of 4 (opens eyes spontaneously), V to a score of 3 (opens eyes in response to voice), P to a score of 2 (opens eyes in response to painful stimuli), and U to a score of 1 (does not open eyes). To avoid comparison of mental‐status scores at different time points, only concurrent GCS and RASS scores, documented within 10 minutes of one another, were included in the analysis.
Location and time‐stamped GCS and RASS scores, demographics, and in‐hospital mortality data were obtained from the hospital's Clinical Research Data Warehouse, which is maintained by the Center for Research Informatics at The University of Chicago. The study protocol and data‐collection mechanisms were approved by The University of Chicago Institutional Review Board (#16995A).
Statistical Analysis
Baseline admission characteristics were described using proportions (%) and measures of central tendency (mean, standard deviations [SD]; median, interquartile ranges [IQR]). Patient severity of illness at first ward observation was calculated using the MEWS.[19] All mental‐status observations during a patient's ward stay were included in the analysis. Odds ratios for 24‐hour mortality following an abnormal mental‐status score were calculated using generalized estimating equations, with an exchangeable correlation structure to account for the correlation of scores within the same patient, as more than 1 abnormal mental‐status score may have been documented within the 24 hours preceding death. Spearman's rank correlation coefficients () were used to estimate the correlation among AVPU, GCS, and RASS scores.
The predictive accuracies of AVPU, GCS, RASS, and the subscales of GCS were compared using the area under the receiver operating characteristic curve (AUC), with mortality within 24 hours of a mental‐status observation as the primary outcome and the mental‐status score as the predictor variable. Although AUCs are typically used as a measure of discriminative ability, this study used AUCs to summarize both sensitivity and specificity across a range of cutoffs, providing an overall measure of predictive accuracies across mental‐status scales. To estimate AUCs, the AVPU, GCS, and GCS subscales were entered into a logistic regression model as ordinal variables, whereas RASS was entered as a nominal variable due to its positive and negative components, and predicted probabilities were calculated. In addition, a combined model was fit where GCS and RASS were classified as categorical independent variables. AUCs were then calculated by utilizing the predicted probabilities from each logistic regression model using the trapezoidal rule.[20] A sensitivity analysis was performed to estimate the internal validity of the RASS model using 10‐fold cross‐validation.
Predefined subgroup analyses were performed that compared the accuracies of AVPU, GCS, and RASS for predicting 24‐hour mortality in patients above and below the median age of the study population, and between patients who underwent surgery during their admission or not (surgical vs medical). All tests of significance used a 2‐sided P value <0.05. All data analysis was performed using Stata version 13.0 (StataCorp, College Station, TX).
RESULTS
During the study period, 313,577 complete GCS and 305,177 RASS scores were recorded in the electronic health record by nursing staff. A total of 26,806 (17,603 GCS and 9203 RASS) observations were excluded due to nonsimultaneous measurement of the other score, resulting in 295,974 paired mental‐status observations. These observations were obtained from 26,873 admissions in 17,660 unique patients, with a median MEWS at ward admission of 1 (IQR 11). The mean patient age was 57 years (SD 17), and 23% were surgical patients (Table 1). Patients spent a median 63.9 hours (IQR 26.7118.6) on the wards per admission and contributed a median of 3 paired observations (IQR 24) per day, with 91% of patients having at least 2 observations per day. A total of 417 (1.6%) general‐ward admissions resulted in death during the hospitalization, with 354 mental‐status observations occurring within 24 hours of a death. In addition, 26,618 (99.9%) admissions had at least 1 paired mental‐status observation within the last 24 hours of their ward stay.
| |
| Total no. of admissions | 26,873 |
| Total no. of unique patients | 17,660 |
| Age, y, mean (SD) | 57 (17) |
| Female sex, n (%) | 14,293 (53) |
| Race, n (%) | |
| White | 10,516 (39) |
| Black | 12,580 (47) |
| Other/unknown | 3,777 (14) |
| Admission MEWS, median (IQR) | 1 (11) |
| Days on ward, median (IQR) | 5 (310) |
| Observations per person, per day, median (IQR) | 3 (24) |
| Underwent surgery during hospitalization, n (%) | 6,141 (23) |
| Deaths, n (%) | 417 (1.6) |
AVPU was moderately correlated with GCS (Spearman's =0.56) (Figure 1a) and weakly correlated with RASS (Spearman's =0.28) (Figure 1b). GCS scores were also weakly correlated to RASS (Spearman's =0.13, P<0.001). Notably, AVPU mapped to distinct levels of GCS, with Alert associated with a median GCS total score of 15, Voice a score of 12, Pain a score of 8, and Unresponsive a score of 5. Abnormal mental‐status scores on any scale were associated with significantly higher odds of death within 24 hours than normal mental‐status scores (Table 2). This association was consistent within the 3 subscales of GCS and for scores in both the sedation (<0) and agitation (>0) ranges of RASS.
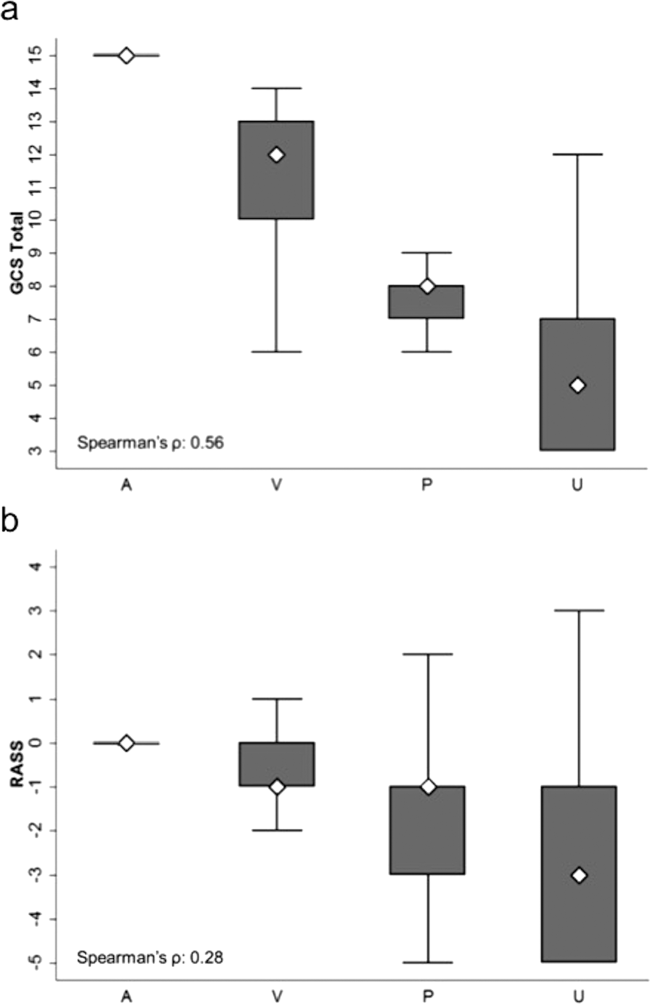
| Mental‐status Score | Observations, n (%) | Odds Ratio for Mortality (95% CI) |
|---|---|---|
| ||
| GCS Eye (AVPU) | ||
| 4 (alert) | 289,857 (98) | Reference |
| <4 (not alert) | 6,117 (2) | 33.8 (23.947.9) |
| GCS Verbal | ||
| 5 | 277,862 (94) | Reference |
| 4 | 11,258 (4) | 4.7 (2.87.9) |
| <4 | 6,854 (2) | 52.7 (38.073.2) |
| GCS Motor | ||
| 6 | 287,441 (97) | Reference |
| <6 | 8,533 (3) | 41.8 (30.756.9) |
| GCS total | ||
| 15 | 276,042 (93) | Reference |
| 13, 14 | 12,437 (4) | 5.2 (3.38.3) |
| <13 | 7,495 (3) | 55.5 (40.077.1) |
| RASS | ||
| >0 | 6,867 (2) | 8.5 (5.613.0) |
| 0 | 275,708 (93) | Reference |
| <0 | 13,339 (5) | 25.8 (19.234.6) |
AVPU was the least accurate predictor of mortality (AUC 0.73 [95% confidence interval {CI}: 0.710.76]), whereas simultaneous use of GCS and RASS was the most accurate predictor (AUC 0.85 [95% CI: 0.820.87] (Figure 2). The accuracies of GCS and RASS were not significantly different from one another in the total study population (AUC 0.80 [95% CI: 0.770.83] and 0.82 [0.790.84], respectively, P=0.13). Ten‐fold cross‐validation to estimate the internal validity of the RASS model resulted in a lower AUC (0.78 [95% CI: 0.750.81]) for RASS as a predictor of 24‐hour mortality. Subgroup analysis indicated that RASS was more accurate than GCS in younger patients (<57 years old) and in surgical patients (Figure 3).
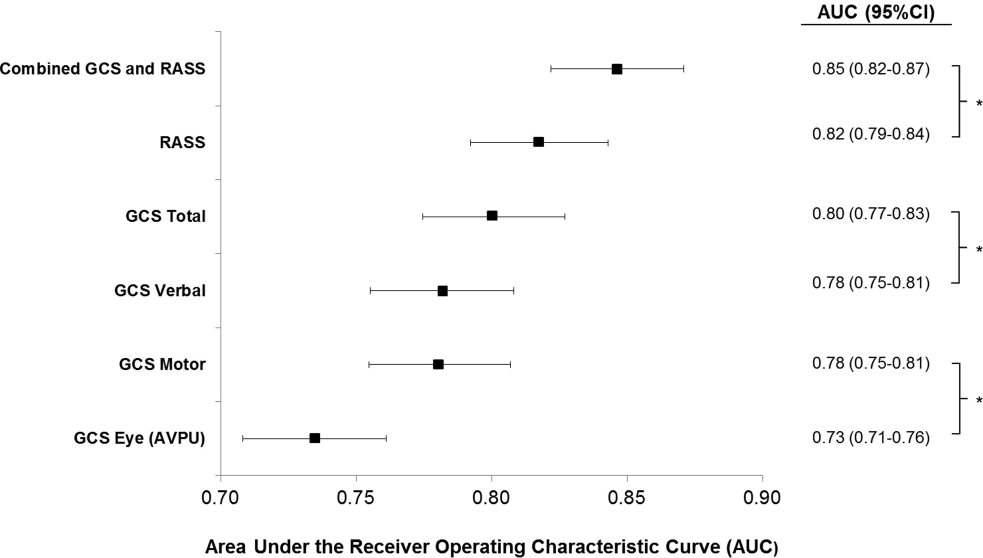
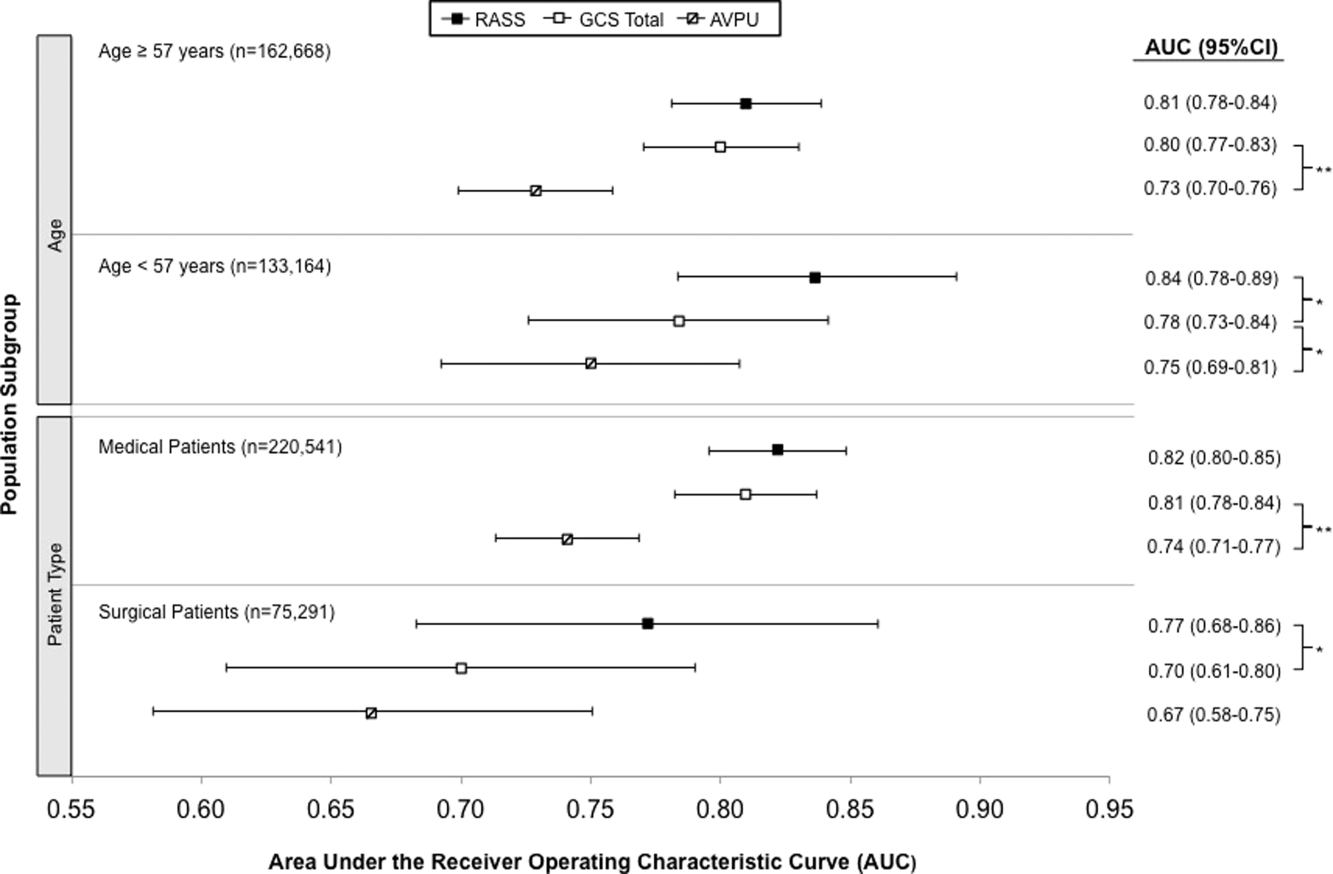
Removal of the 255 admissions missing a paired mental‐status observation within the last 24 hours of their ward stay resulted in no change in the AUC values. A sensitivity analysis for prediction of a combined secondary outcome of 24‐hour intensive care unit ICU transfer or cardiac arrest yielded lower AUCs for each mental‐status scale, with no change in the association among scales.
DISCUSSION
To our knowledge, this study is the first to compare the accuracies of AVPU, GCS, and RASS for predicting mortality in the general‐ward setting. Similar to McNarry and Goldhill, we demonstrated that AVPU scores mapped to distinct levels of GCS. Although our study reports the same median GCS scores of 15 and 8 for AVPU levels of Alert and Pain, respectively, we indicate slightly lower corresponding median GCS scores for AVPU scores of Voice (12 vs 13) and Unresponsive (5 vs 6) than their previous work.[21] We found that AVPU was the least accurate predictor of mortality within 24 hours of an observation, and the combination of GCS and RASS was the most accurate. RASS was at least as accurate a predictor for 24‐hour mortality in comparison to GCS total in the overall study population. However, the RASS score was the most accurate individual score in surgical and younger patients. These findings suggest that changing from the commonly used AVPU scale to the RASS and/or GCS would improve the prognostic ability of mental‐status assessments on the general wards.
Buist and colleagues have previously demonstrated altered mental status to be one of the strongest predictors of death on the wards. In that study, a GCS score of 3 and a decrease in GCS score by more than 2 points were independently associated with mortality (odds ratio 6.1 [95% CI: 3.111.8] and 5.5 [95% CI: 2.611.9], respectively).[22] We have also previously shown that after adjusting for vital signs, being unresponsive to pain was associated with a 4.5‐fold increase in the odds of death within 24 hours,[23]whereas Subbe and colleagues showed a relative risk ratio of 5.2 (95% CI: 1.518.1) for the combined endpoint of cardiac arrest, death at 60 days, or admission to the intensive care/high dependency unit.[19] In the current study, the magnitude of these associations was even stronger, with a GCS score <13 correlating with a 55‐fold increase in the odds of death, compared to a normal GCS, and not being alert being associated with a 33.8‐fold increase in the odds of death. This difference in magnitude is likely a product of the univariate nature of the current analysis, compared to both the Buist et al. and Churpek et al. studies, which adjusted for vital signs, thereby lessening the impact of any single predictor. Because this study was designed to compare mental‐status variables to one another for future model inclusion, and all the analyses were paired, confounding by additional predictors of death was not a concern.
One of the potential strengths of RASS over GCS and AVPU is its ability to measure agitation levels, in addition to depressed mentation, a feature that has been shown to be present in up to 60% of delirium episodes.[24] This may also explain why RASS was the most accurate predictor of mortality in our subset of younger patients and surgical patients, because hyperactive delirium is more common in younger and healthier patients, which surgical patients tend to be as compared to medical patients.[25, 26] In this study, we found negative RASS scores portending a worse prognosis than positive ones, which supports previous findings that hypoactive delirium had a higher association with mortality than hyperactive delirium at 6 months (hazard ratio 1.90 vs 1.37) and at 1 year (hazard ratio 1.60 vs 1.30) in elderly patients at postacute‐care facilities in 2 separate studies.[27, 28] However, a study of patients undergoing surgery for hip fracture found that patients with hyperactive delirium were more likely to die or be placed in a nursing home at 1 month follow‐up when compared to patients with purely hypoactive delirium (79% vs 32%, P=0.003).[29]
We found the assessment of RASS and GCS by ward nurses to be highly feasible. During the study period, nurses assessed mental status with the GCS and RASS scales at least once per 12‐hour shift in 91% of patients. GCS has been shown to be reliably and accurately recorded by experienced nurses (reliability coefficient=0.944 with 96.4% agreement with expert ratings).[30] RASS can take <30 seconds to administer, and in previous studies of the ICU setting has been shown to have over 94% nurse compliance for administration,[31] and good inter‐rater reliability (weighted kappa 0.66 and 0.89, respectively).[31, 32] Further, in a prior survey of 55 critical care nurses, 82% agreed that RASS was easy to score and clinically relevant.[31]
This study has several limitations. First, it was conducted in a single academic institution, which may limit generalizability to other hospitals. Second, baseline cognition and comorbidities were not available in the dataset, so we were unable to conduct additional subgroup analyses by these categories. However, we used age and hospital admission type as proxies. Third, the AVPU scores in this study were extracted from the Eye subset of the GCS scale, as AVPU was not directly assessed on our wards during the study period. Clinical assessment of mental status on the AVPU scale notes the presence of any active patient response (eg, eye opening, grunting, moaning, movement) to increasingly noxious stimuli. As such, our adaptation of AVPU using only eye‐opening criteria may underestimate the true number of patients correctly classified as alert, or responding to vocal/painful stimuli. However, a sensitivity analysis comparing directly assessed AVPU during a 3‐year period prior to the study implementation at our institution, and AVPU derived from the GCS Eye subscale for the study period, indicated no difference in predictive value for 24‐hour mortality. Fourth, we did not perform trend analyses for change from baseline mental status or evolution of AMS, which may more accurately predict 24‐hour mortality than discrete mental‐status observations. Finally, the 3 scales we compared differ in length, which may bias the AUC against AVPU, a 4‐point scale with a trapezoidal ROC curve compared to the smoother curve generated by the 15‐point GCS scale, for example. However, the lack of discrimination of the AVPU is the likely source of its lesser accuracy.
CONCLUSION
In the general‐ward setting, routine collection of GCS and RASS is feasible, and both are significantly more accurate for predicting mortality than the more commonly used AVPU scale. In addition, the combination of GCS and RASS has greater accuracy than any of the 3 individual scales. RASS may be particularly beneficial in the assessment of younger and/or surgical patients. Routine documentation and tracking of GCS and/or RASS by nurses may improve the detection of clinical deterioration in general‐ward patients. In addition, future early‐warning scores may benefit from the inclusion of GCS and/or RASS in lieu of AVPU.
Disclosures
Drs. Churpek and Edelson have a patent pending (ARCD. P0535US.P2) for risk stratification algorithms for hospitalized patients. Dr. Churpek is supported by a career development award from the National Heart, Lung, and Blood Institute (K08 HL121080). Dr. Edelson has received research support from the National Heart, Lung, and Blood Institute (K23 HL097157), Philips (Andover, MA), the American Heart Association (Dallas, TX), Laerdal Medical (Stavanger, Norway), and Early Sense (Tel Aviv, Israel). She has ownership interest in Quant HC (Chicago, IL), which is developing products for risk stratification of hospitalized patients. All other authors report no conflicts of interest.
- , , , et al. Delirium as a predictor of mortality in mechanically ventilated patients in the intensive care unit. JAMA. 2004;291(14):1753–1762.
- , , , , , Delirium in hospitalized older persons: outcomes and predictors. J Am Geriatr Soc. 1994;42(8):809–815.
- , , Occurrence and outcome of delirium in medical in‐patients: a systematic literature review. Age Ageing. 2006;35(4):350–364.
- , , , et al. Delirium. The occurrence and persistence of symptoms among elderly hospitalized patients. Arch Intern Med. 1992;152(2):334–340.
- , , Postoperative delirium. A review of 80 primary data‐collection studies. Arch Intern Med. 1995;155(5):461–465.
- , , , , Nurses' recognition of delirium and its symptoms: comparison of nurse and researcher ratings. Arch Intern Med. 2001;161(20):2467–2473.
- , , The misdiagnosis of delirium. Psychosomatics. 1997;38(5):433–439.
- , , , et al. Current opinions regarding the importance, diagnosis, and management of delirium in the intensive care unit: a survey of 912 healthcare professionals. Crit Care Med. 2004;32(1):106–112.
- , Misdiagnosing delirium as depression in medically ill elderly patients. Arch Intern Med. 1995;155(22):2459–2464.
- Doctors and nurses use of the word confused. Br J Psychiatry. 1984;145:441–443.
- , , , et al. The Richmond Agitation‐Sedation Scale: validity and reliability in adult intensive care unit patients. Am J Respir Crit Care Med. 2002;166(10):1338–1344.
- , Assessment and prognosis of coma after head injury. Acta Neurochir (Wien). 1976;34(1–4):45–55.
- , , , , Glasgow Coma Scale score in the evaluation of outcome in the intensive care unit: findings from the Acute Physiology and Chronic Health Evaluation III study. Crit Care Med. 1993;21(10):1459–1465.
- , , Variability in agreement between physicians and nurses when measuring the Glasgow Coma Scale in the emergency department limits its clinical usefulness. Emerg Med Australas. 2006;18(4):379–384.
- , , , Reliability of the Glasgow Coma Scale when used by emergency physicians and paramedics. J Trauma. 1993;34(1):46–48.
- , ; American College of Surgeons. Committee on Trauma. Advanced Trauma Life Support Program For Physicians: ATLS. 5th ed. Chicago, IL: American College of Surgeons; 1993.
- , , , Review and performance evaluation of aggregate weighted 'track and trigger' systems. Resuscitation. 2008;77(2):170–179.
- , , , , A review, and performance evaluation, of single‐parameter “track and trigger” systems. Resuscitation. 2008;79(1):11–21.
- , , , Validation of a modified Early Warning score in medical admissions. QJM. 2001;94(10):521–526.
- , , Comparing the areas under two or more correlated receiver operating characteristic curves: a nonparametric approach. Biometrics. 1988;44(3):837–845.
- , Simple bedside assessment of level of consciousness: comparison of two simple assessment scales with the Glascow Coma Scale. Anaesthesia. 2004;59(1):34–37.
- , , , , Association between clinically abnormal observations and subsequent in‐hospital mortality: a prospective study. Resuscitation. 2004;62(2):137–141.
- , , Predicting clinical deterioration in the hospital: the impact of outcome selection. Resuscitation. 2013;84(5):564–568.
- , , , et al. Delirium and its motoric subtypes: a study of 614 critically ill patients. J Am Geriatr Soc. 2006;54(3):479–484.
- , , , et al. Risk factors for delirium after major trauma. Am J Surg. 2008;196(6):864–869.
- , , , , Relationship between symptoms and motoric subtype of delirium. J Neuropsychiatry Clin Neurosci. 2000;12(1):51–56.
- , , , et al. Phenomenological subtypes of delirium in older persons: patterns, prevalence, and prognosis. Psychosomatics. 2009;50(3):248–254.
- , , , Association between psychomotor activity delirium subtypes and mortality among newly admitted post‐acute facility patients. J Gerontol A Biol Sci Med Sci. 2007;62(2):174–179.
- , , , Delirium severity and psychomotor types: their relationship with outcomes after hip fracture repair. J Am Geriatr Soc. 2002;50(5):850–857.
- , Reliability and accuracy of the Glasgow Coma Scale with experienced and inexperienced users. Lancet. 1991;337(8740):535–538.
- , , , et al. Large‐scale implementation of sedation and delirium monitoring in the intensive care unit: a report from two medical centers. Crit Care Med. 2005;33(6):1199–1205.
- , , , et al. Delirium and sedation recognition using validated instruments: reliability of bedside intensive care unit nursing assessments from 2007 to 2010. J Am Geriatr Soc. 2011;59(suppl 2):S249–S255.
Altered mental status (AMS), characterized by abnormal changes in a patient's arousal and/or cognition, is a significant predictor of hospital mortality.[1, 2, 3] Yet despite its prevalence[3, 4, 5] and importance, up to three‐quarters of AMS events go unrecognized by caregivers.[6, 7, 8] Acute changes in mental status, often caused by delirium in the hospitalized patient,[3] can present nonspecifically, making it difficult to detect and distinguish from other diagnoses such as depression or dementia.[7, 9] Further complicating the recognition of AMS, numerous and imprecise qualitative descriptors such as confused and alert and oriented are used in clinical practice to describe the mental status of patients.[10] Thus, more objective measures may result in improved detection of altered mental status and in earlier diagnostic and therapeutic interventions.
In critically ill patients, several scales have been widely adopted for quantifying mental status. The Richmond Agitation and Sedation Scale (RASS) was created to optimize sedation.[11] The Glasgow Coma Scale (GCS) was developed for head‐trauma patients[12] and is now a standardized assessment tool in intensive care units,[13] the emergency department,[14] and the prehospital setting.[15] In addition, a simplified scale, AVPU (Alert, responsive to Verbal stimuli, responsive to Painful stimuli, and Unresponsive) was initially used in the primary survey of trauma patients[16] but is now a common component of early‐warning scores and rapid response activation criteria, such as the Modified Early Warning Score (MEWS).[17, 18] In fact, in a systematic review of 72 distinct early‐warning scores, 89% of the scores used AVPU as the measure of mentation.[17] However, the utility of these 3 scales is not well established in the general‐ward setting. Our aim was therefore to compare the accuracies of AVPU, GCS, and RASS for predicting mortality in hospitalized general‐ward patients to provide insight into the accuracy of these different scores for clinical deterioration.
METHODS
Study Setting and Protocol
We conducted an observational cohort study of consecutive adult general‐ward admissions from July 2011 through January 2013 at a 500‐bed, urban US teaching hospital. During the study period, no early‐warning scoring systems were in place on the hospital wards. Rapid response teams responding to altered mental status would do so without specific thresholds for activation. During this period, nurses on the general floors were expected to record each patient's GCS and RASS score in the electronic health record (EPIC Systems Corp., Verona, WI) as part of the routine patient assessment at least once every 12‐hour shift. AVPU assessments were extracted from the eye component of the GCS. The letter A was assigned to a GCS Eye score of 4 (opens eyes spontaneously), V to a score of 3 (opens eyes in response to voice), P to a score of 2 (opens eyes in response to painful stimuli), and U to a score of 1 (does not open eyes). To avoid comparison of mental‐status scores at different time points, only concurrent GCS and RASS scores, documented within 10 minutes of one another, were included in the analysis.
Location and time‐stamped GCS and RASS scores, demographics, and in‐hospital mortality data were obtained from the hospital's Clinical Research Data Warehouse, which is maintained by the Center for Research Informatics at The University of Chicago. The study protocol and data‐collection mechanisms were approved by The University of Chicago Institutional Review Board (#16995A).
Statistical Analysis
Baseline admission characteristics were described using proportions (%) and measures of central tendency (mean, standard deviations [SD]; median, interquartile ranges [IQR]). Patient severity of illness at first ward observation was calculated using the MEWS.[19] All mental‐status observations during a patient's ward stay were included in the analysis. Odds ratios for 24‐hour mortality following an abnormal mental‐status score were calculated using generalized estimating equations, with an exchangeable correlation structure to account for the correlation of scores within the same patient, as more than 1 abnormal mental‐status score may have been documented within the 24 hours preceding death. Spearman's rank correlation coefficients () were used to estimate the correlation among AVPU, GCS, and RASS scores.
The predictive accuracies of AVPU, GCS, RASS, and the subscales of GCS were compared using the area under the receiver operating characteristic curve (AUC), with mortality within 24 hours of a mental‐status observation as the primary outcome and the mental‐status score as the predictor variable. Although AUCs are typically used as a measure of discriminative ability, this study used AUCs to summarize both sensitivity and specificity across a range of cutoffs, providing an overall measure of predictive accuracies across mental‐status scales. To estimate AUCs, the AVPU, GCS, and GCS subscales were entered into a logistic regression model as ordinal variables, whereas RASS was entered as a nominal variable due to its positive and negative components, and predicted probabilities were calculated. In addition, a combined model was fit where GCS and RASS were classified as categorical independent variables. AUCs were then calculated by utilizing the predicted probabilities from each logistic regression model using the trapezoidal rule.[20] A sensitivity analysis was performed to estimate the internal validity of the RASS model using 10‐fold cross‐validation.
Predefined subgroup analyses were performed that compared the accuracies of AVPU, GCS, and RASS for predicting 24‐hour mortality in patients above and below the median age of the study population, and between patients who underwent surgery during their admission or not (surgical vs medical). All tests of significance used a 2‐sided P value <0.05. All data analysis was performed using Stata version 13.0 (StataCorp, College Station, TX).
RESULTS
During the study period, 313,577 complete GCS and 305,177 RASS scores were recorded in the electronic health record by nursing staff. A total of 26,806 (17,603 GCS and 9203 RASS) observations were excluded due to nonsimultaneous measurement of the other score, resulting in 295,974 paired mental‐status observations. These observations were obtained from 26,873 admissions in 17,660 unique patients, with a median MEWS at ward admission of 1 (IQR 11). The mean patient age was 57 years (SD 17), and 23% were surgical patients (Table 1). Patients spent a median 63.9 hours (IQR 26.7118.6) on the wards per admission and contributed a median of 3 paired observations (IQR 24) per day, with 91% of patients having at least 2 observations per day. A total of 417 (1.6%) general‐ward admissions resulted in death during the hospitalization, with 354 mental‐status observations occurring within 24 hours of a death. In addition, 26,618 (99.9%) admissions had at least 1 paired mental‐status observation within the last 24 hours of their ward stay.
| |
| Total no. of admissions | 26,873 |
| Total no. of unique patients | 17,660 |
| Age, y, mean (SD) | 57 (17) |
| Female sex, n (%) | 14,293 (53) |
| Race, n (%) | |
| White | 10,516 (39) |
| Black | 12,580 (47) |
| Other/unknown | 3,777 (14) |
| Admission MEWS, median (IQR) | 1 (11) |
| Days on ward, median (IQR) | 5 (310) |
| Observations per person, per day, median (IQR) | 3 (24) |
| Underwent surgery during hospitalization, n (%) | 6,141 (23) |
| Deaths, n (%) | 417 (1.6) |
AVPU was moderately correlated with GCS (Spearman's =0.56) (Figure 1a) and weakly correlated with RASS (Spearman's =0.28) (Figure 1b). GCS scores were also weakly correlated to RASS (Spearman's =0.13, P<0.001). Notably, AVPU mapped to distinct levels of GCS, with Alert associated with a median GCS total score of 15, Voice a score of 12, Pain a score of 8, and Unresponsive a score of 5. Abnormal mental‐status scores on any scale were associated with significantly higher odds of death within 24 hours than normal mental‐status scores (Table 2). This association was consistent within the 3 subscales of GCS and for scores in both the sedation (<0) and agitation (>0) ranges of RASS.
| Mental‐status Score | Observations, n (%) | Odds Ratio for Mortality (95% CI) |
|---|---|---|
| ||
| GCS Eye (AVPU) | ||
| 4 (alert) | 289,857 (98) | Reference |
| <4 (not alert) | 6,117 (2) | 33.8 (23.947.9) |
| GCS Verbal | ||
| 5 | 277,862 (94) | Reference |
| 4 | 11,258 (4) | 4.7 (2.87.9) |
| <4 | 6,854 (2) | 52.7 (38.073.2) |
| GCS Motor | ||
| 6 | 287,441 (97) | Reference |
| <6 | 8,533 (3) | 41.8 (30.756.9) |
| GCS total | ||
| 15 | 276,042 (93) | Reference |
| 13, 14 | 12,437 (4) | 5.2 (3.38.3) |
| <13 | 7,495 (3) | 55.5 (40.077.1) |
| RASS | ||
| >0 | 6,867 (2) | 8.5 (5.613.0) |
| 0 | 275,708 (93) | Reference |
| <0 | 13,339 (5) | 25.8 (19.234.6) |
AVPU was the least accurate predictor of mortality (AUC 0.73 [95% confidence interval {CI}: 0.710.76]), whereas simultaneous use of GCS and RASS was the most accurate predictor (AUC 0.85 [95% CI: 0.820.87] (Figure 2). The accuracies of GCS and RASS were not significantly different from one another in the total study population (AUC 0.80 [95% CI: 0.770.83] and 0.82 [0.790.84], respectively, P=0.13). Ten‐fold cross‐validation to estimate the internal validity of the RASS model resulted in a lower AUC (0.78 [95% CI: 0.750.81]) for RASS as a predictor of 24‐hour mortality. Subgroup analysis indicated that RASS was more accurate than GCS in younger patients (<57 years old) and in surgical patients (Figure 3).
Removal of the 255 admissions missing a paired mental‐status observation within the last 24 hours of their ward stay resulted in no change in the AUC values. A sensitivity analysis for prediction of a combined secondary outcome of 24‐hour intensive care unit ICU transfer or cardiac arrest yielded lower AUCs for each mental‐status scale, with no change in the association among scales.
DISCUSSION
To our knowledge, this study is the first to compare the accuracies of AVPU, GCS, and RASS for predicting mortality in the general‐ward setting. Similar to McNarry and Goldhill, we demonstrated that AVPU scores mapped to distinct levels of GCS. Although our study reports the same median GCS scores of 15 and 8 for AVPU levels of Alert and Pain, respectively, we indicate slightly lower corresponding median GCS scores for AVPU scores of Voice (12 vs 13) and Unresponsive (5 vs 6) than their previous work.[21] We found that AVPU was the least accurate predictor of mortality within 24 hours of an observation, and the combination of GCS and RASS was the most accurate. RASS was at least as accurate a predictor for 24‐hour mortality in comparison to GCS total in the overall study population. However, the RASS score was the most accurate individual score in surgical and younger patients. These findings suggest that changing from the commonly used AVPU scale to the RASS and/or GCS would improve the prognostic ability of mental‐status assessments on the general wards.
Buist and colleagues have previously demonstrated altered mental status to be one of the strongest predictors of death on the wards. In that study, a GCS score of 3 and a decrease in GCS score by more than 2 points were independently associated with mortality (odds ratio 6.1 [95% CI: 3.111.8] and 5.5 [95% CI: 2.611.9], respectively).[22] We have also previously shown that after adjusting for vital signs, being unresponsive to pain was associated with a 4.5‐fold increase in the odds of death within 24 hours,[23]whereas Subbe and colleagues showed a relative risk ratio of 5.2 (95% CI: 1.518.1) for the combined endpoint of cardiac arrest, death at 60 days, or admission to the intensive care/high dependency unit.[19] In the current study, the magnitude of these associations was even stronger, with a GCS score <13 correlating with a 55‐fold increase in the odds of death, compared to a normal GCS, and not being alert being associated with a 33.8‐fold increase in the odds of death. This difference in magnitude is likely a product of the univariate nature of the current analysis, compared to both the Buist et al. and Churpek et al. studies, which adjusted for vital signs, thereby lessening the impact of any single predictor. Because this study was designed to compare mental‐status variables to one another for future model inclusion, and all the analyses were paired, confounding by additional predictors of death was not a concern.
One of the potential strengths of RASS over GCS and AVPU is its ability to measure agitation levels, in addition to depressed mentation, a feature that has been shown to be present in up to 60% of delirium episodes.[24] This may also explain why RASS was the most accurate predictor of mortality in our subset of younger patients and surgical patients, because hyperactive delirium is more common in younger and healthier patients, which surgical patients tend to be as compared to medical patients.[25, 26] In this study, we found negative RASS scores portending a worse prognosis than positive ones, which supports previous findings that hypoactive delirium had a higher association with mortality than hyperactive delirium at 6 months (hazard ratio 1.90 vs 1.37) and at 1 year (hazard ratio 1.60 vs 1.30) in elderly patients at postacute‐care facilities in 2 separate studies.[27, 28] However, a study of patients undergoing surgery for hip fracture found that patients with hyperactive delirium were more likely to die or be placed in a nursing home at 1 month follow‐up when compared to patients with purely hypoactive delirium (79% vs 32%, P=0.003).[29]
We found the assessment of RASS and GCS by ward nurses to be highly feasible. During the study period, nurses assessed mental status with the GCS and RASS scales at least once per 12‐hour shift in 91% of patients. GCS has been shown to be reliably and accurately recorded by experienced nurses (reliability coefficient=0.944 with 96.4% agreement with expert ratings).[30] RASS can take <30 seconds to administer, and in previous studies of the ICU setting has been shown to have over 94% nurse compliance for administration,[31] and good inter‐rater reliability (weighted kappa 0.66 and 0.89, respectively).[31, 32] Further, in a prior survey of 55 critical care nurses, 82% agreed that RASS was easy to score and clinically relevant.[31]
This study has several limitations. First, it was conducted in a single academic institution, which may limit generalizability to other hospitals. Second, baseline cognition and comorbidities were not available in the dataset, so we were unable to conduct additional subgroup analyses by these categories. However, we used age and hospital admission type as proxies. Third, the AVPU scores in this study were extracted from the Eye subset of the GCS scale, as AVPU was not directly assessed on our wards during the study period. Clinical assessment of mental status on the AVPU scale notes the presence of any active patient response (eg, eye opening, grunting, moaning, movement) to increasingly noxious stimuli. As such, our adaptation of AVPU using only eye‐opening criteria may underestimate the true number of patients correctly classified as alert, or responding to vocal/painful stimuli. However, a sensitivity analysis comparing directly assessed AVPU during a 3‐year period prior to the study implementation at our institution, and AVPU derived from the GCS Eye subscale for the study period, indicated no difference in predictive value for 24‐hour mortality. Fourth, we did not perform trend analyses for change from baseline mental status or evolution of AMS, which may more accurately predict 24‐hour mortality than discrete mental‐status observations. Finally, the 3 scales we compared differ in length, which may bias the AUC against AVPU, a 4‐point scale with a trapezoidal ROC curve compared to the smoother curve generated by the 15‐point GCS scale, for example. However, the lack of discrimination of the AVPU is the likely source of its lesser accuracy.
CONCLUSION
In the general‐ward setting, routine collection of GCS and RASS is feasible, and both are significantly more accurate for predicting mortality than the more commonly used AVPU scale. In addition, the combination of GCS and RASS has greater accuracy than any of the 3 individual scales. RASS may be particularly beneficial in the assessment of younger and/or surgical patients. Routine documentation and tracking of GCS and/or RASS by nurses may improve the detection of clinical deterioration in general‐ward patients. In addition, future early‐warning scores may benefit from the inclusion of GCS and/or RASS in lieu of AVPU.
Disclosures
Drs. Churpek and Edelson have a patent pending (ARCD. P0535US.P2) for risk stratification algorithms for hospitalized patients. Dr. Churpek is supported by a career development award from the National Heart, Lung, and Blood Institute (K08 HL121080). Dr. Edelson has received research support from the National Heart, Lung, and Blood Institute (K23 HL097157), Philips (Andover, MA), the American Heart Association (Dallas, TX), Laerdal Medical (Stavanger, Norway), and Early Sense (Tel Aviv, Israel). She has ownership interest in Quant HC (Chicago, IL), which is developing products for risk stratification of hospitalized patients. All other authors report no conflicts of interest.
- , , , et al. Delirium as a predictor of mortality in mechanically ventilated patients in the intensive care unit. JAMA. 2004;291(14):1753–1762.
- , , , , , Delirium in hospitalized older persons: outcomes and predictors. J Am Geriatr Soc. 1994;42(8):809–815.
- , , Occurrence and outcome of delirium in medical in‐patients: a systematic literature review. Age Ageing. 2006;35(4):350–364.
- , , , et al. Delirium. The occurrence and persistence of symptoms among elderly hospitalized patients. Arch Intern Med. 1992;152(2):334–340.
- , , Postoperative delirium. A review of 80 primary data‐collection studies. Arch Intern Med. 1995;155(5):461–465.
- , , , , Nurses' recognition of delirium and its symptoms: comparison of nurse and researcher ratings. Arch Intern Med. 2001;161(20):2467–2473.
- , , The misdiagnosis of delirium. Psychosomatics. 1997;38(5):433–439.
- , , , et al. Current opinions regarding the importance, diagnosis, and management of delirium in the intensive care unit: a survey of 912 healthcare professionals. Crit Care Med. 2004;32(1):106–112.
- , Misdiagnosing delirium as depression in medically ill elderly patients. Arch Intern Med. 1995;155(22):2459–2464.
- Doctors and nurses use of the word confused. Br J Psychiatry. 1984;145:441–443.
- , , , et al. The Richmond Agitation‐Sedation Scale: validity and reliability in adult intensive care unit patients. Am J Respir Crit Care Med. 2002;166(10):1338–1344.
- , Assessment and prognosis of coma after head injury. Acta Neurochir (Wien). 1976;34(1–4):45–55.
- , , , , Glasgow Coma Scale score in the evaluation of outcome in the intensive care unit: findings from the Acute Physiology and Chronic Health Evaluation III study. Crit Care Med. 1993;21(10):1459–1465.
- , , Variability in agreement between physicians and nurses when measuring the Glasgow Coma Scale in the emergency department limits its clinical usefulness. Emerg Med Australas. 2006;18(4):379–384.
- , , , Reliability of the Glasgow Coma Scale when used by emergency physicians and paramedics. J Trauma. 1993;34(1):46–48.
- , ; American College of Surgeons. Committee on Trauma. Advanced Trauma Life Support Program For Physicians: ATLS. 5th ed. Chicago, IL: American College of Surgeons; 1993.
- , , , Review and performance evaluation of aggregate weighted 'track and trigger' systems. Resuscitation. 2008;77(2):170–179.
- , , , , A review, and performance evaluation, of single‐parameter “track and trigger” systems. Resuscitation. 2008;79(1):11–21.
- , , , Validation of a modified Early Warning score in medical admissions. QJM. 2001;94(10):521–526.
- , , Comparing the areas under two or more correlated receiver operating characteristic curves: a nonparametric approach. Biometrics. 1988;44(3):837–845.
- , Simple bedside assessment of level of consciousness: comparison of two simple assessment scales with the Glascow Coma Scale. Anaesthesia. 2004;59(1):34–37.
- , , , , Association between clinically abnormal observations and subsequent in‐hospital mortality: a prospective study. Resuscitation. 2004;62(2):137–141.
- , , Predicting clinical deterioration in the hospital: the impact of outcome selection. Resuscitation. 2013;84(5):564–568.
- , , , et al. Delirium and its motoric subtypes: a study of 614 critically ill patients. J Am Geriatr Soc. 2006;54(3):479–484.
- , , , et al. Risk factors for delirium after major trauma. Am J Surg. 2008;196(6):864–869.
- , , , , Relationship between symptoms and motoric subtype of delirium. J Neuropsychiatry Clin Neurosci. 2000;12(1):51–56.
- , , , et al. Phenomenological subtypes of delirium in older persons: patterns, prevalence, and prognosis. Psychosomatics. 2009;50(3):248–254.
- , , , Association between psychomotor activity delirium subtypes and mortality among newly admitted post‐acute facility patients. J Gerontol A Biol Sci Med Sci. 2007;62(2):174–179.
- , , , Delirium severity and psychomotor types: their relationship with outcomes after hip fracture repair. J Am Geriatr Soc. 2002;50(5):850–857.
- , Reliability and accuracy of the Glasgow Coma Scale with experienced and inexperienced users. Lancet. 1991;337(8740):535–538.
- , , , et al. Large‐scale implementation of sedation and delirium monitoring in the intensive care unit: a report from two medical centers. Crit Care Med. 2005;33(6):1199–1205.
- , , , et al. Delirium and sedation recognition using validated instruments: reliability of bedside intensive care unit nursing assessments from 2007 to 2010. J Am Geriatr Soc. 2011;59(suppl 2):S249–S255.
© 2015 Society of Hospital Medicine

The Importance of an Antimicrobial Stewardship Program
An antimicrobial stewardship program (ASP) is designed to provide guidance for the safe andcost-effective use of antimicrobial agents. This evidence-based approach addresses the correct selection of antimicrobial agents, dosages, routes of administration, and duration of therapy. In other words, the ASP necessitates the right drug, the right time, the right amount, and the right duration.1 The ASP reduces the development of multidrug-resistant organisms (MDROs), adverse drug events (such as antibiotic-associated diarrhea and renal toxicity), hospital length of stay, collateral damage (development of Clostridium difficile colitis), and health care costs. Review of the literature has shown the ASP reduces hospital stays among patients with acute bacterial-skin and skin-structure infections along with other costly infections.2
The ASP is not a new concept, but it is a hot topic. A successful ASP cannot be achieved without the support of the hospital leadership to determine and provide the needed resources. Its success stems from being a joint collaborative effort between pharmacy, medicine, infection control (IC), microbiology, and information technology. The purpose of the ASP is to ensure proper use of antimicrobials within the health care system through the development of a formal, interdisciplinary team. The primary goal of the ASP is to optimize clinical outcomes while minimizing unintended consequences related to antimicrobial usage, such as toxicities or the emergence of resistance.
In today’s world, health care clinicians are dealing with a global challenge of MDROs such as Enterococcus faecium, Staphylococcus aureus (S aureus), Klebsiella pneumonia, Acinetobacter baumanii, Pseudomonas aeruginosa, and Enterobacter species (ESKAPE), better known as “bugs without borders.”3 According to the CDC, antibiotic-resistant infections affect at least 2 million people in the U.S. annually and result in > 23,000 deaths.2 According to Thomas Frieden, director of the CDC, the pipeline of new antibiotics is nearly empty for the short term, and new drugs could be a decade away from discovery and approval by the FDA.2
Literature Review
Pasquale and colleagues conducted a retrospective, observational chart review on 62 patients who were admitted for bacterial-skin and skin-structure infections (S aureus, MRSA, MSSA, and Pseudomonas aeruginosa).4 The data examined patient demographic characteristics, comorbidities, specific type of skin infection (the most common being cellulitis, major or deep abscesses, and surgical site infections), microbiology, surgical interventions, and recommendations obtained from the ASP committee.
The ASP recommendations were divided into 5 categories, including dosage changes, de-escalation, antibiotic regimen changes, infectious disease (ID) consults, and other (not described). The ASP offered 85 recommendations, and acceptance of the ASP recommendations by physicians was 95%. The intervention group had a significantly lower length of stay (4.4 days vs 6.2 days, P < .001); and the 30-day all-cause readmission rate was also significantly lower (6.5% vs 16.71%, P = .05). However, the skin and skin-related structures readmission rate did not differ significantly (3.33% vs 6.27%). It was impossible for the investigators to determine exact differences in the amount of antimicrobials used in the intervention group vs the historical controls, because the historical data were based on ICD-9 codes, which may explain the nonsignificant finding.4
D’Agata reviewed the antimicrobial usage and ASP programs in dialysis centers.5 Chronic hemodialysis patients with central lines were noted to have the greatest rate of infections and antibiotic usage (6.4 per 100 patient months). The next highest group was dialysis patients with grafts (2.4 per 100 patient months), followed by patients with fistulas (1.8 per 100 patient months). Vancomycin was most commonly chosen for all antibiotic starts (73%). Interestingly, vancomycin was followed by cefazolin and third- and/or fourth-generation cephalosporin, which are risk factors for the emergence of multidrug-resistant, Gram-negative bacteria that are highly linked to increased morbidity and mortality rates. The U.S. Renal Data System stated in its 2009 report that the use of antibiotic therapy has increased from 31% in 1994 to 41% in 2007.5
In reviewing inappropriate choices of antimicrobial prescribing, D’Agata compared prescriptions given to the Healthcare Infection Control Practices Advisory Committee to determine whether the correct antibiotic was chosen. In 164 vancomycin prescriptions, 20% were categorized as inappropriate.5 In another study done by Zvonar and colleagues, 163 prescriptions of vancomycin were reviewed, and 12% were considered inappropriate.6
Snyder and colleagues examined 278 patients on hemodialysis, and over a 1-year period, 32% of these patients received ≥ 1 antimicrobial with 29.8% of the doses classified as inappropriate.7 The most common category for inappropriate prescribing of antimicrobials was not meeting the criteria for diagnosing infections (52.9% of cases). The second leading cause of inappropriate prescription for infections was not meeting criteria for diagnosing specific skin and skin-structure infections (51.6% of cases). Another common category was failure to choose a narrower spectrum antimicrobial prescription (26.8%).7 Attention to the indications and duration of antimicrobial treatment accounted for 20.3% of all inappropriate doses. Correction of these problems with use of an ASP could reduce the patient’s exposure to unneeded or inappropriate antibiotics by 22% to 36% and decrease hospital costs between $200,000 to $900,000.5
Rosa and colleagues discussed adherence to an ASP and the effects on mortality in hospitalized cancer patients with febrile neutropenia (FN).8 A prospective cohort study was performed in a single facility over a 2-year period. Patients admitted with cancer and FN were followed for 28 days. The mortality rates of those treated with ASP protocol antibiotics were compared with those treated with other antibiotic regimens. One hundred sixty-nine patients with 307 episodes of FN were included. The rate of adherence to ASP recommendations was 53% with the mortality of this cohort 9.4% (29 patients).8
Older patients were more likely to be treated according to ASP recommendations, whereas patients with comorbidities were not treated with ASP guidelines, Rosa and colleagues noted.8 No explanation was given, but statistical testing did uphold these findings, ensuring that the results were correctly interpreted. The 28-day mortality during FN was related to several factors, including nonadherence with ASP recommendations (P = .001) relapsing diseases stages (P = .001), and time to antibiotic start therapy > 1 hour (P = .001). Adherence to the ASP was independently associated with a higher survival rate (P = .03), whereas mortality was attributable to infection in all 29 patients who died.
Nowak and colleagues reviewed the clinical and economic benefits of an ASP using a pre- and postanalysis of potential patients who might benefit from recommendations of the ASP.9 Subjects included adult inpatients with pneumonia or abdominal sepsis. Recommendations from ASP that were followed decreased expenditures by 9.75% during the first year and remained stable in the following years. The cumulative cost savings was about $1.7 million. Rates of nosocomial infections decreased, and pre- and postcomparison of survival and lengths of stay for patients with pneumonia (n = 2,186) or abdominal sepsis (n = 225) revealed no significant differences. Investigators argued that this finding may have been due to the hospital’s initiation of other concurrent IC programs.
Doron and colleagues conducted a survey identifying characteristics of ASP practices and factors associated with the presence of an ASP.10 Surveys were received from 48 states (North and South Dakota were not included) and Puerto Rico. Surveys were received from 406 providers, and 96.4% identified some form of ASP. Barriers to implementation included staffing constraints (69.4%) and insufficient funding (0.6%).10
About 38% of the responses stated ASP was being used for adults and pediatric patients, whereas 58.8% were used for adults only.10 The ASP teams were composed of a variety of providers, including infectious disease (ID) physicians (70.7%), IC professionals (51.1%), and clinical microbiologists (38.6%). Additional barriers to implementing an ASP were found as insufficient medical staff buy-in (32.8%), not high on the priority list (22.2%), and too many other things to consider or deal with at the time (42.8%). Interestingly, 41.1% of the subjects in facilities without an ASP responded that providers agree with limiting the use of antimicrobials compared with 66.9% of subjects in hospitals with an ASP. Factors linked to having an ASP included having an ID consultation service, an ID fellowship program, an ID pharmacist, larger hospitals, annual admissions > 10,000, having a published antibiogram, and being a teaching hospital.
Establishment of an ASP
The Infectious Diseases Society of America (IDSA) and the Society for Healthcare Epidemiology of America (SHEA) issued guidelines in 2007 for developing an institutional ASP to enhance antimicrobial stewardship and help prevent antimicrobial resistance in hospitals.11 The ASP may vary among facilities based on available resources.
When developing an ASP, 2 core strategies are necessary. The core measures are proactive and are usually conducted by an ID clinical pharmacist assigned to the ASP in collaboration with the ID physician. These strategies are not mutually exclusive and include a prospective audit with interventions provided to the clinicians, resulting in decreased inappropriate use of antimicrobials or a formulary restriction and preauthorization to help reduce antimicrobial usage and related cost.
Supplemental elements may be considered and prioritized as to the core antimicrobial stewardship strategies based on local practice pattern and resources.11 Factors to consider include education, which is considered to be an essential element of the ASP. Although education is important, it alone is only somewhat effective in changing clinicians’ prescribing practices. Guidelines and clinical pathways are elements set forth in institutional management protocols for common and potentially serious infections such as intravascular catheter-related infections, hospital- and community-acquired pneumonia, bloodstream infections, and complicated urinary tract infections among other types.
Another consideration is antimicrobial cycling. This process refers to the specific schedule of alternating specific antimicrobials or antimicrobial classes to prevent or reverse the development of antimicrobial resistance. Insufficient data on antimicrobial cycling currently exist to affect major changes in practice. This element, however, could be implemented in certain institutions if needed based on the reported bacterial resistance pattern.
Antimicrobial order forms can be used to help monitor the implementation of formulated institutional clinical practice pathways. However, the authors feel that documenting this indication in the clinician notes may be adequate and save time for everyone involved; additionally, reviewing combination therapy, which if avoided, may prevent the emergence of resistance. Although combination therapy is needed in certain clinical diagnostic situations, careful consideration of its use is essential.
Streamlining or de-escalation of therapy by using a narrower spectrum agent, based on culture and sensitivity results, prevents duplicative therapy with a patient when double coverage is not indicated or intended. Another goal is the discontinuation of therapy based on negative culture results and lack of supporting clinical signs and symptoms of infection. Dose optimization and adjustment should also be reviewed. Using the appropriate antimicrobial dose based on the specific pathogen, patient characteristic, source of infection, along with the pharmacokinetic and pharmacodynamics should be reviewed to prevent antimicrobial overuse and subsequent potentially avoidable adverse effects.
Parenteral to oral conversion from IV to oral administration (IV to oral) antimicrobials must be considered when the patient is clinically and hemodynamically stable, thus limiting the length of hospital stays and health care costs. However, it is important to keep in mind pharmacokinetic studies examining the bioavailability of antibiotics are usually conducted with healthy volunteers. Therefore, when treating patients who are elderly, on multiple medications, or severely ill, proper usage of these antibiotics is required. Also, having antibiotics with excellent bioavailability does not necessarily mean switching from IV to oral routes when treating serious infections such as bacteremia. Special consideration should be given when changing the route of administration. In addition, approval—or at least notification by the treating physician or ID specialist—should be included in the absence of an institutional policy, allowing for automatic IV to oral conversion.
The ASP Team
The participation of specific clinicians has been suggested as key to having a successful ASP team.12 Members should include an ID physician (director) who serves as the lead physician and supervises the overall function of the ASP, makes recommendations to the ASP team, and contributes to the educational activities. A clinical ID pharmacist (codirector) provides suggestions to clinicians on preferred first-line antimicrobials and reviews medication orders for antimicrobials and resistance patterns, microbiological data, patient data, and clinical information. The codirector also tracks any ASP-related data and submits monitoring reports on a regular basis.
If accessible, an IC professional should participate, implementing and monitoring prevention strategies that decrease health care-associated infections. These infections play a significant role in reducing MDROs and decreasing the use of antibiotics. Additionally, the IC professional can assist in the early identification of patients with MDROs, aid patient placement on transmission-based precautions, and flag a patient in the medical record for hightened awareness. Also, IC professionals promote hand hygiene, standard precautions, and contribute to infection prevention strategies, such as hospital bundle practices, to prevent catheter-associated bloodstream infections and ventilator-associated pneumonias, among others.
If possible, a microbiologist who can prepare culture and susceptibility data to optimize antimicrobial management and conduct timely documentation of microbial pathogens should be a member of the team. Microbiologists can report organism susceptibility, assist in the surveillance of specific organisms, and provide early identification of patients with MDROs that require transmission-based precautions. The microbiologist can perform a semiannual update of a local antibiogram while reporting antimicrobial susceptibility profiles. Based on the information gathered, microbiologists can provide new drug panels to the members of the ASP, who will decide which antibiotic panel will be used. Another possible member of the ASP team is a program analyst who provides data retrieval, performs data analysis, and delivers necessary reports to the team.
It is the responsibility of medical staff to review and implement suggestions made by the ASP when appropriate. However, these suggestions are not considered a substitute for clinical decisions, and discretion is required when treating individual patients. The VHA, in response to the IDSA/SHEA published guidelines, chartered an antimicrobial stewardship task force in May 2011 with the sole purpose “To optimize the care of Veterans by developing, deploying and monitoring a national-level strategic plan for improvements in antimicrobial therapy management.”1 In 2011, the Office of Inspector General in a combined assessment program summary report for management of MDROs in VHA facilities recommended that “the Under Secretary for Health, in conjunction with VISN and facility senior managers, ensures that facilities develop policies and programs that control and reduce antimicrobial agent use.”13
In 2012, the VHA conducted a survey to obtain baseline data regarding ASP activities, presence of dedicated personnel, current related practice policies, available resources, and outcomes. There were 140 voluntary participating VA facilities, of which 130 had inpatient services. The survey found that 26 facilities (20%) did not have an attending ID physician, 49 facilities (38%) reported having an ASP, 19 facilities (15%) had developed policy in place addressing de-escalation of antimicrobials, 87 facilities (67%) had not developed a business plan for an ASP, and 61 facilities (47%) had completed a medication usage evaluation.14 Feedback following the analysis of the survey data recommended integrating more ID personnel as needed, along with the development of ASP teams for all facilities with inpatient services, who would have the authority to change the antimicrobial therapy selection and have policies in place related to ASP principles.
Conclusions
Increased MDROs and decreased anti-infective development requires stricter management of antibiotics. An ASP is essential in any hospital or health care facility to decrease the incidence of resistance and improve patient care. The ASP is a collaborative effort that involves multiple specialties and departments. A successful ASP is one that changes based on local prescribing trends and resistance patterns while focusing on a patient as an individual.
Author disclosures
The authors report no actual or potential conflicts of interest with regard to this article.
Disclaimer
The opinions expressed herein are those of the authors and do not necessarily reflect those of Federal Practitioner, Frontline Medical Communications Inc., the U.S. Government, or any of its agencies. This article may discuss unlabeled or investigational use of certain drugs. Please review complete prescribing information for specific drugs or drug combinations—including indications, contraindications, warnings, and adverse effects—before administering pharmacologic therapy to patients.
1. U.S. Department of Veterans Affairs, Veterans Health Administration. Antimicrobial Stewardship Programs (ASP). VHA Directive 1031. U.S. Department of Veterans Affairs Website. http://www.va.gov/vhapublications/ViewPublication.asp?pub_ID=2964. Updated January 22, 2014. Accessed August 4, 2015.
2. Centers for Disease Control and Prevention. Antibiotic Resistance Threats in the United States, 2013. Centers for Disease Control and Prevention Website. http://www.cdc.gov/drugresistance/threat-report-2013/pdf/ar-threats-2013-508.pdf. Published April 23, 2013. Accessed August 4, 2015.
3. Pyrek K. Bugs without borders: the global challenge of MDROs. Infect Control Today. 2013;17(2):1-8.
4. Pasquale T, Trienski TL, Olexia DE, et al. Impact of an antimicrobial stewardship program on patients with acute bacterial skin and skin structure infections. Am J Health Syst Pharm. 2014;71(13):1136-1139.
5. D’Agata EM. Antimicrobial use and stewardship programs among dialysis centers. Semin Dial. 2013;26(4):457-464.
6. Zvonar R, Natarajan S, Edwards C, Roth V. Assessment of vancomycin use in chronic hemodialysis patients: room for improvement. Nephrol Dial Transplant. 2008;23(11):3690-3695.
7. Snyder, GM, Patel PR, Kallen AJ, Strom JA, Tucker JK, D’Agata EM. Antimicrobial use in outpatient hemodialysis units. Infect Control Hosp Epidemiol. 2013;34(4):349-357.
8. Rosa RG, Goldani LZ, dos Santos RP. Association between adherence to an antimicrobial stewardship program and mortality among hospitalised cancer patients with febril neutropaenia: a prospective cohort study. BMC Infect Dis. 2014;14:286.
9. Nowak MA, Nelson RE, Breidenbach JL, Thompson PA, Carson PJ. Clinical and economic outcomes of a prospective antimicrobial stewardship program. Am J Health Syst Pharm. 2012;69(17):1500-1508.
10. Doron S, Nadkarni L, Lyn Price L, et al. A nationwide survey of antimicrobial stewardship practices. Clin Ther. 2013;35(6):758-765.
11. Dellit TH, Owens RC, McGowan JE Jr, et al; Infectious Diseases Society of America; Society for Healthcare Epidemiology of America. Infectious Diseases Society of America and the Society for Healthcare Epidemiology of America guidelines for developing an institutional program to enhance antimicrobial stewardship. Clin Infect Dis. 2007;44(2):159-177.
12. Griffith M, Postelnick M, Scheetz M. Antimicrobial stewardship programs: methods of operation and suggested outcomes. Expert Rev Anti Infect Ther. 2012;10(1):63-73.
13. U.S. Department of Veterans Affairs Office of Inspector General. Combined Assessment Program Summary Report: Management of Multidrug-Resistant Organisms in Veterans Health Administration Facilities. Report No. 11-02870-04. U.S. Department of Veterans Affairs Website. http://www.va.gov/oig/pubs/VAOIG-11-02870-04.pdf. Updated October 14, 2011. Accessed August 4, 2015.
14. Roselle GA, Neuhauser M, Kelly A, Vandenberg P. 2012 Survey of antimicrobial stewardship in VA. Washington, DC: Department of Veterans Affairs; 2013.
An antimicrobial stewardship program (ASP) is designed to provide guidance for the safe andcost-effective use of antimicrobial agents. This evidence-based approach addresses the correct selection of antimicrobial agents, dosages, routes of administration, and duration of therapy. In other words, the ASP necessitates the right drug, the right time, the right amount, and the right duration.1 The ASP reduces the development of multidrug-resistant organisms (MDROs), adverse drug events (such as antibiotic-associated diarrhea and renal toxicity), hospital length of stay, collateral damage (development of Clostridium difficile colitis), and health care costs. Review of the literature has shown the ASP reduces hospital stays among patients with acute bacterial-skin and skin-structure infections along with other costly infections.2
The ASP is not a new concept, but it is a hot topic. A successful ASP cannot be achieved without the support of the hospital leadership to determine and provide the needed resources. Its success stems from being a joint collaborative effort between pharmacy, medicine, infection control (IC), microbiology, and information technology. The purpose of the ASP is to ensure proper use of antimicrobials within the health care system through the development of a formal, interdisciplinary team. The primary goal of the ASP is to optimize clinical outcomes while minimizing unintended consequences related to antimicrobial usage, such as toxicities or the emergence of resistance.
In today’s world, health care clinicians are dealing with a global challenge of MDROs such as Enterococcus faecium, Staphylococcus aureus (S aureus), Klebsiella pneumonia, Acinetobacter baumanii, Pseudomonas aeruginosa, and Enterobacter species (ESKAPE), better known as “bugs without borders.”3 According to the CDC, antibiotic-resistant infections affect at least 2 million people in the U.S. annually and result in > 23,000 deaths.2 According to Thomas Frieden, director of the CDC, the pipeline of new antibiotics is nearly empty for the short term, and new drugs could be a decade away from discovery and approval by the FDA.2
Literature Review
Pasquale and colleagues conducted a retrospective, observational chart review on 62 patients who were admitted for bacterial-skin and skin-structure infections (S aureus, MRSA, MSSA, and Pseudomonas aeruginosa).4 The data examined patient demographic characteristics, comorbidities, specific type of skin infection (the most common being cellulitis, major or deep abscesses, and surgical site infections), microbiology, surgical interventions, and recommendations obtained from the ASP committee.
The ASP recommendations were divided into 5 categories, including dosage changes, de-escalation, antibiotic regimen changes, infectious disease (ID) consults, and other (not described). The ASP offered 85 recommendations, and acceptance of the ASP recommendations by physicians was 95%. The intervention group had a significantly lower length of stay (4.4 days vs 6.2 days, P < .001); and the 30-day all-cause readmission rate was also significantly lower (6.5% vs 16.71%, P = .05). However, the skin and skin-related structures readmission rate did not differ significantly (3.33% vs 6.27%). It was impossible for the investigators to determine exact differences in the amount of antimicrobials used in the intervention group vs the historical controls, because the historical data were based on ICD-9 codes, which may explain the nonsignificant finding.4
D’Agata reviewed the antimicrobial usage and ASP programs in dialysis centers.5 Chronic hemodialysis patients with central lines were noted to have the greatest rate of infections and antibiotic usage (6.4 per 100 patient months). The next highest group was dialysis patients with grafts (2.4 per 100 patient months), followed by patients with fistulas (1.8 per 100 patient months). Vancomycin was most commonly chosen for all antibiotic starts (73%). Interestingly, vancomycin was followed by cefazolin and third- and/or fourth-generation cephalosporin, which are risk factors for the emergence of multidrug-resistant, Gram-negative bacteria that are highly linked to increased morbidity and mortality rates. The U.S. Renal Data System stated in its 2009 report that the use of antibiotic therapy has increased from 31% in 1994 to 41% in 2007.5
In reviewing inappropriate choices of antimicrobial prescribing, D’Agata compared prescriptions given to the Healthcare Infection Control Practices Advisory Committee to determine whether the correct antibiotic was chosen. In 164 vancomycin prescriptions, 20% were categorized as inappropriate.5 In another study done by Zvonar and colleagues, 163 prescriptions of vancomycin were reviewed, and 12% were considered inappropriate.6
Snyder and colleagues examined 278 patients on hemodialysis, and over a 1-year period, 32% of these patients received ≥ 1 antimicrobial with 29.8% of the doses classified as inappropriate.7 The most common category for inappropriate prescribing of antimicrobials was not meeting the criteria for diagnosing infections (52.9% of cases). The second leading cause of inappropriate prescription for infections was not meeting criteria for diagnosing specific skin and skin-structure infections (51.6% of cases). Another common category was failure to choose a narrower spectrum antimicrobial prescription (26.8%).7 Attention to the indications and duration of antimicrobial treatment accounted for 20.3% of all inappropriate doses. Correction of these problems with use of an ASP could reduce the patient’s exposure to unneeded or inappropriate antibiotics by 22% to 36% and decrease hospital costs between $200,000 to $900,000.5
Rosa and colleagues discussed adherence to an ASP and the effects on mortality in hospitalized cancer patients with febrile neutropenia (FN).8 A prospective cohort study was performed in a single facility over a 2-year period. Patients admitted with cancer and FN were followed for 28 days. The mortality rates of those treated with ASP protocol antibiotics were compared with those treated with other antibiotic regimens. One hundred sixty-nine patients with 307 episodes of FN were included. The rate of adherence to ASP recommendations was 53% with the mortality of this cohort 9.4% (29 patients).8
Older patients were more likely to be treated according to ASP recommendations, whereas patients with comorbidities were not treated with ASP guidelines, Rosa and colleagues noted.8 No explanation was given, but statistical testing did uphold these findings, ensuring that the results were correctly interpreted. The 28-day mortality during FN was related to several factors, including nonadherence with ASP recommendations (P = .001) relapsing diseases stages (P = .001), and time to antibiotic start therapy > 1 hour (P = .001). Adherence to the ASP was independently associated with a higher survival rate (P = .03), whereas mortality was attributable to infection in all 29 patients who died.
Nowak and colleagues reviewed the clinical and economic benefits of an ASP using a pre- and postanalysis of potential patients who might benefit from recommendations of the ASP.9 Subjects included adult inpatients with pneumonia or abdominal sepsis. Recommendations from ASP that were followed decreased expenditures by 9.75% during the first year and remained stable in the following years. The cumulative cost savings was about $1.7 million. Rates of nosocomial infections decreased, and pre- and postcomparison of survival and lengths of stay for patients with pneumonia (n = 2,186) or abdominal sepsis (n = 225) revealed no significant differences. Investigators argued that this finding may have been due to the hospital’s initiation of other concurrent IC programs.
Doron and colleagues conducted a survey identifying characteristics of ASP practices and factors associated with the presence of an ASP.10 Surveys were received from 48 states (North and South Dakota were not included) and Puerto Rico. Surveys were received from 406 providers, and 96.4% identified some form of ASP. Barriers to implementation included staffing constraints (69.4%) and insufficient funding (0.6%).10
About 38% of the responses stated ASP was being used for adults and pediatric patients, whereas 58.8% were used for adults only.10 The ASP teams were composed of a variety of providers, including infectious disease (ID) physicians (70.7%), IC professionals (51.1%), and clinical microbiologists (38.6%). Additional barriers to implementing an ASP were found as insufficient medical staff buy-in (32.8%), not high on the priority list (22.2%), and too many other things to consider or deal with at the time (42.8%). Interestingly, 41.1% of the subjects in facilities without an ASP responded that providers agree with limiting the use of antimicrobials compared with 66.9% of subjects in hospitals with an ASP. Factors linked to having an ASP included having an ID consultation service, an ID fellowship program, an ID pharmacist, larger hospitals, annual admissions > 10,000, having a published antibiogram, and being a teaching hospital.
Establishment of an ASP
The Infectious Diseases Society of America (IDSA) and the Society for Healthcare Epidemiology of America (SHEA) issued guidelines in 2007 for developing an institutional ASP to enhance antimicrobial stewardship and help prevent antimicrobial resistance in hospitals.11 The ASP may vary among facilities based on available resources.
When developing an ASP, 2 core strategies are necessary. The core measures are proactive and are usually conducted by an ID clinical pharmacist assigned to the ASP in collaboration with the ID physician. These strategies are not mutually exclusive and include a prospective audit with interventions provided to the clinicians, resulting in decreased inappropriate use of antimicrobials or a formulary restriction and preauthorization to help reduce antimicrobial usage and related cost.
Supplemental elements may be considered and prioritized as to the core antimicrobial stewardship strategies based on local practice pattern and resources.11 Factors to consider include education, which is considered to be an essential element of the ASP. Although education is important, it alone is only somewhat effective in changing clinicians’ prescribing practices. Guidelines and clinical pathways are elements set forth in institutional management protocols for common and potentially serious infections such as intravascular catheter-related infections, hospital- and community-acquired pneumonia, bloodstream infections, and complicated urinary tract infections among other types.
Another consideration is antimicrobial cycling. This process refers to the specific schedule of alternating specific antimicrobials or antimicrobial classes to prevent or reverse the development of antimicrobial resistance. Insufficient data on antimicrobial cycling currently exist to affect major changes in practice. This element, however, could be implemented in certain institutions if needed based on the reported bacterial resistance pattern.
Antimicrobial order forms can be used to help monitor the implementation of formulated institutional clinical practice pathways. However, the authors feel that documenting this indication in the clinician notes may be adequate and save time for everyone involved; additionally, reviewing combination therapy, which if avoided, may prevent the emergence of resistance. Although combination therapy is needed in certain clinical diagnostic situations, careful consideration of its use is essential.
Streamlining or de-escalation of therapy by using a narrower spectrum agent, based on culture and sensitivity results, prevents duplicative therapy with a patient when double coverage is not indicated or intended. Another goal is the discontinuation of therapy based on negative culture results and lack of supporting clinical signs and symptoms of infection. Dose optimization and adjustment should also be reviewed. Using the appropriate antimicrobial dose based on the specific pathogen, patient characteristic, source of infection, along with the pharmacokinetic and pharmacodynamics should be reviewed to prevent antimicrobial overuse and subsequent potentially avoidable adverse effects.
Parenteral to oral conversion from IV to oral administration (IV to oral) antimicrobials must be considered when the patient is clinically and hemodynamically stable, thus limiting the length of hospital stays and health care costs. However, it is important to keep in mind pharmacokinetic studies examining the bioavailability of antibiotics are usually conducted with healthy volunteers. Therefore, when treating patients who are elderly, on multiple medications, or severely ill, proper usage of these antibiotics is required. Also, having antibiotics with excellent bioavailability does not necessarily mean switching from IV to oral routes when treating serious infections such as bacteremia. Special consideration should be given when changing the route of administration. In addition, approval—or at least notification by the treating physician or ID specialist—should be included in the absence of an institutional policy, allowing for automatic IV to oral conversion.
The ASP Team
The participation of specific clinicians has been suggested as key to having a successful ASP team.12 Members should include an ID physician (director) who serves as the lead physician and supervises the overall function of the ASP, makes recommendations to the ASP team, and contributes to the educational activities. A clinical ID pharmacist (codirector) provides suggestions to clinicians on preferred first-line antimicrobials and reviews medication orders for antimicrobials and resistance patterns, microbiological data, patient data, and clinical information. The codirector also tracks any ASP-related data and submits monitoring reports on a regular basis.
If accessible, an IC professional should participate, implementing and monitoring prevention strategies that decrease health care-associated infections. These infections play a significant role in reducing MDROs and decreasing the use of antibiotics. Additionally, the IC professional can assist in the early identification of patients with MDROs, aid patient placement on transmission-based precautions, and flag a patient in the medical record for hightened awareness. Also, IC professionals promote hand hygiene, standard precautions, and contribute to infection prevention strategies, such as hospital bundle practices, to prevent catheter-associated bloodstream infections and ventilator-associated pneumonias, among others.
If possible, a microbiologist who can prepare culture and susceptibility data to optimize antimicrobial management and conduct timely documentation of microbial pathogens should be a member of the team. Microbiologists can report organism susceptibility, assist in the surveillance of specific organisms, and provide early identification of patients with MDROs that require transmission-based precautions. The microbiologist can perform a semiannual update of a local antibiogram while reporting antimicrobial susceptibility profiles. Based on the information gathered, microbiologists can provide new drug panels to the members of the ASP, who will decide which antibiotic panel will be used. Another possible member of the ASP team is a program analyst who provides data retrieval, performs data analysis, and delivers necessary reports to the team.
It is the responsibility of medical staff to review and implement suggestions made by the ASP when appropriate. However, these suggestions are not considered a substitute for clinical decisions, and discretion is required when treating individual patients. The VHA, in response to the IDSA/SHEA published guidelines, chartered an antimicrobial stewardship task force in May 2011 with the sole purpose “To optimize the care of Veterans by developing, deploying and monitoring a national-level strategic plan for improvements in antimicrobial therapy management.”1 In 2011, the Office of Inspector General in a combined assessment program summary report for management of MDROs in VHA facilities recommended that “the Under Secretary for Health, in conjunction with VISN and facility senior managers, ensures that facilities develop policies and programs that control and reduce antimicrobial agent use.”13
In 2012, the VHA conducted a survey to obtain baseline data regarding ASP activities, presence of dedicated personnel, current related practice policies, available resources, and outcomes. There were 140 voluntary participating VA facilities, of which 130 had inpatient services. The survey found that 26 facilities (20%) did not have an attending ID physician, 49 facilities (38%) reported having an ASP, 19 facilities (15%) had developed policy in place addressing de-escalation of antimicrobials, 87 facilities (67%) had not developed a business plan for an ASP, and 61 facilities (47%) had completed a medication usage evaluation.14 Feedback following the analysis of the survey data recommended integrating more ID personnel as needed, along with the development of ASP teams for all facilities with inpatient services, who would have the authority to change the antimicrobial therapy selection and have policies in place related to ASP principles.
Conclusions
Increased MDROs and decreased anti-infective development requires stricter management of antibiotics. An ASP is essential in any hospital or health care facility to decrease the incidence of resistance and improve patient care. The ASP is a collaborative effort that involves multiple specialties and departments. A successful ASP is one that changes based on local prescribing trends and resistance patterns while focusing on a patient as an individual.
Author disclosures
The authors report no actual or potential conflicts of interest with regard to this article.
Disclaimer
The opinions expressed herein are those of the authors and do not necessarily reflect those of Federal Practitioner, Frontline Medical Communications Inc., the U.S. Government, or any of its agencies. This article may discuss unlabeled or investigational use of certain drugs. Please review complete prescribing information for specific drugs or drug combinations—including indications, contraindications, warnings, and adverse effects—before administering pharmacologic therapy to patients.
1. U.S. Department of Veterans Affairs, Veterans Health Administration. Antimicrobial Stewardship Programs (ASP). VHA Directive 1031. U.S. Department of Veterans Affairs Website. http://www.va.gov/vhapublications/ViewPublication.asp?pub_ID=2964. Updated January 22, 2014. Accessed August 4, 2015.
2. Centers for Disease Control and Prevention. Antibiotic Resistance Threats in the United States, 2013. Centers for Disease Control and Prevention Website. http://www.cdc.gov/drugresistance/threat-report-2013/pdf/ar-threats-2013-508.pdf. Published April 23, 2013. Accessed August 4, 2015.
3. Pyrek K. Bugs without borders: the global challenge of MDROs. Infect Control Today. 2013;17(2):1-8.
4. Pasquale T, Trienski TL, Olexia DE, et al. Impact of an antimicrobial stewardship program on patients with acute bacterial skin and skin structure infections. Am J Health Syst Pharm. 2014;71(13):1136-1139.
5. D’Agata EM. Antimicrobial use and stewardship programs among dialysis centers. Semin Dial. 2013;26(4):457-464.
6. Zvonar R, Natarajan S, Edwards C, Roth V. Assessment of vancomycin use in chronic hemodialysis patients: room for improvement. Nephrol Dial Transplant. 2008;23(11):3690-3695.
7. Snyder, GM, Patel PR, Kallen AJ, Strom JA, Tucker JK, D’Agata EM. Antimicrobial use in outpatient hemodialysis units. Infect Control Hosp Epidemiol. 2013;34(4):349-357.
8. Rosa RG, Goldani LZ, dos Santos RP. Association between adherence to an antimicrobial stewardship program and mortality among hospitalised cancer patients with febril neutropaenia: a prospective cohort study. BMC Infect Dis. 2014;14:286.
9. Nowak MA, Nelson RE, Breidenbach JL, Thompson PA, Carson PJ. Clinical and economic outcomes of a prospective antimicrobial stewardship program. Am J Health Syst Pharm. 2012;69(17):1500-1508.
10. Doron S, Nadkarni L, Lyn Price L, et al. A nationwide survey of antimicrobial stewardship practices. Clin Ther. 2013;35(6):758-765.
11. Dellit TH, Owens RC, McGowan JE Jr, et al; Infectious Diseases Society of America; Society for Healthcare Epidemiology of America. Infectious Diseases Society of America and the Society for Healthcare Epidemiology of America guidelines for developing an institutional program to enhance antimicrobial stewardship. Clin Infect Dis. 2007;44(2):159-177.
12. Griffith M, Postelnick M, Scheetz M. Antimicrobial stewardship programs: methods of operation and suggested outcomes. Expert Rev Anti Infect Ther. 2012;10(1):63-73.
13. U.S. Department of Veterans Affairs Office of Inspector General. Combined Assessment Program Summary Report: Management of Multidrug-Resistant Organisms in Veterans Health Administration Facilities. Report No. 11-02870-04. U.S. Department of Veterans Affairs Website. http://www.va.gov/oig/pubs/VAOIG-11-02870-04.pdf. Updated October 14, 2011. Accessed August 4, 2015.
14. Roselle GA, Neuhauser M, Kelly A, Vandenberg P. 2012 Survey of antimicrobial stewardship in VA. Washington, DC: Department of Veterans Affairs; 2013.
Assessment of a Mental Health Residential Rehabilitation Treatment Program As Needed Medication List
The Mental Health Residential Rehabilitation Treatment Program (MHRRTP) is an essential part of the mental health services offered at the Clement J. Zablocki VAMC (ZVAMC) in Milwaukee, Wisconsin. Across the nation, there are about 250 MHRRTPs, which are designed to provide rehabilitation and treatment services to veterans ranging in age from 18 to 80 years, with medical conditions, mental illness, addiction, or psychosocial deficits.1 About 900 patients were admitted to the ZVAMC MHRRTP in 2013.
Background
Prior to 2010, pharmacy administrators recognized that many MHRRTP patients were inappropriately using emergency care services (ECS) to obtain treatments for simple ailments that often required only the use of over-the-counter medications. This was likely associated with the Safe Medication Management (SMM) Policy as defined in Professional Services Memorandum VII-29.2,3 This policy states that MHRRTP patients are not allowed to bring in any home medications—all medications are reconciled and readministered on admission in an effort to reduce diversion.
A lack of 24-hour-per-day provider availability forced patients to find treatment elsewhere. A 6-month review was completed in 2010, which identified all of the MHRRTP patients who used ECS, their chief medical condition, and the medication(s) that were administered to each patient. This review identified a total of 254 ECS visits made by MHRRTP patients during this period. Twenty percent of these visits resulted in prescriptions for over-the-counter medications. As a result, an as needed (PRN) medication list was created for patients to have medications readily available for simple ailments with nursing oversight (Box). The goal of the PRN medication list is to reduce the amount of unnecessary ECS visits, decrease unnecessary cost, and improve treatment efficiency and overall patient care.
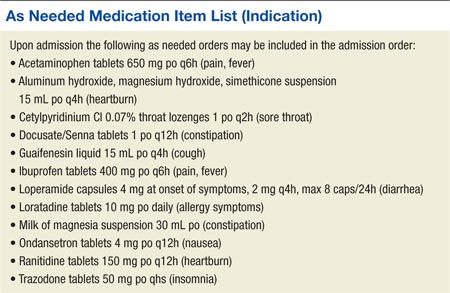
Treatment Programs
The ZVAMC MHRRTP has 189 beds divided among 7 different 6-week treatment programs, including General Men’s Program (GEN), Substance Abuse Rehabilitation (SAR), Posttraumatic Stress Disorder (PTSD), Women’s Program (WOM), Operation Enduring Freedom/Operation Iraqi Freedom/Operation New Dawn (OEF/OIF/OND), Domiciliary Care for Homeless Veterans (DCHV), and Individualized Addiction Consultation Team (I-ACT).4
The treatment programs within the MHRRTP at the ZVAMC address goals of rehabilitation, recovery, health maintenance, improved quality of life, and community integration in addition to specific treatment of medical conditions, mental illnesses, addictive disorders, and homelessness. Various levels of care are available through the program, based on the needs of each veteran. This care generally provides methods to enhance patients’ functional status and psychosocial rehabilitation.
A SMM program is used to ensure safe and effective medication use for all patients in the MHRRTP.2 As a result, the patients are admitted to the MHRRTP with inpatient status, and the medication delivery procedure varies based on the veteran’s ability to take medication independently. Veterans are assisted in developing self-care skills, which include comprehensive medication education. The goal of the SMM program is to give patients the assistance to eventually manage their medications independently.
MHRRTP Staffing
The MHRRTP must have adequate staffing in order to provide safe and effective patient care. Program staffing patterns are based on workload indicators and a bed-to-staff ratio.4 The MHRRTP is a multidisciplinary program; however, the only providers who can address medication issues are the 1.2 full-time employee equivalent MHRRTP psychiatrists. Unfortunately, the psychiatrists are not available for triage on nights, weekends, or holidays.
The role of the psychiatrist is to focus on the mental health needs of the MHRRTP patients, not the primary care medical concerns, which are the main reason for ECS visits. With the current model, providers are sometimes unavailable to meet the emergent needs of patients in the MHRRTP, and patients may be forced to choose between using ECS or leaving the concern unaddressed. Patients’ needs vary from mild to serious emergent needs but may not necessarily require full emergency assessments. For example, if a patient has a headache and a physician is not available to write an order for acetaminophen, the patient may need to visit the ECS to obtain a medication that otherwise would have been readily available at home. The restrictions are designed to promote medication safety, prevent medication diversion and misuse, and be in compliance with regulatory agencies (eg, The Joint Commission and the Commission on Accreditation of Rehabilitation Facilities).
ECS Use
During fiscal year 2010, pharmacy administrators discovered that many patients were using ECS to obtain medications for nonemergent conditions. Inappropriate and unnecessary use of ECS by MHRRTP patients delayed treatment, increased wait times for veterans in need of emergent care, and increased the cost of caring for simple ailments. To put this into perspective, the average cost of all conditions at the ZVAMC during the 2013 fiscal year was $657 per ECS visit, while the total cost of ECS was about $14 million.
In response to the inappropriate ECS use, the ZVAMC created a PRN medication list in 2010, which is offered to all MHRRTP patients, with the goal of reducing the number of patients inappropriately using ECS for minor ailments and providing more efficient and cost-effective patient care.2 The MHRRTP PRN medication list is initially evaluated by the admitting psychiatrist or nurse practitioner and mental health clinical pharmacy specialist completing the admission orders for appropriateness based on each patient’s comorbidities, medication regimen, and past medical history. For example, if a new patient with liver dysfunction is admitted to the MHRRTP, acetaminophen would not be made available due to an increased risk of hepatotoxicity. The other PRN medications would still be available for the patient if clinically appropriate.
Once the PRN medications are ordered, the MHRRTP nurse can assess a patient’s condition and administer the medication(s) to the patient as indicated. For instance, if a patient requests ibuprofen for pain, the nurse will document an initial pain score and administer the ibuprofendose. As a result, the patient obtains more efficient and convenient care and does not need to wait for a provider to become available or use ECS. Per ZVAMC policy, the nurse has 96 hours to reassess the PRN medication effectiveness; however, this is typically done within the same shift. Since the implementation of the PRN medication list, no formal assessment has been completed.
To the authors’ knowledge, the ZVAMC is the only MHRRTP in the VHA system that incorporates a PRN medication list in the admission orders to reduce unnecessary ECS visits. After completing a thorough literature review and contacting the national VA mental health pharmacist listserve, no studies discussing the use of PRN medication lists in this setting were identified, and no sites offered information as to a similar practice in place.
Methods
A randomized, retrospective case-controlled study involving a chart review was completed for patients admitted to the MHRRTP at the ZVAMC pre- and postimplementation of the MHRRTP PRN medication list between April 2010 and August 2010 and between April 2013 and August 2013, respectively. The ZVAMC is a teaching institution. This study was approved by the ZVAMC institutional review board.
Patients were eligible for the study if they were male, aged > 18 years, and admitted during the study period for treatment in the GEN or SAR programs at the ZVAMC for at least 4 weeks. Patients were excluded if they were female, admitted to the hospital after being seen by ECS, or if they were receiving treatment in the following programs: PTSD, WOM, OEF/OIF/OND, DCHV, and I-ACT. Patients studied in 2010 served as the control group, and patients studied in 2013 were the treatment group.
Objectives
The primary objective of this study was to evaluate the use of the current PRN medication list. Secondary objectives included the evaluation of the use of ECS by patients admitted to the MHRRTP pre- and postimplementation of the PRN medication list, the potential cost reduction due to avoided ECS use, and nurse and patient satisfaction with the PRN medication list.
Data
A list of all patients admitted to the MHRRTP at the ZVAMC between April and August of 2010 and 2013 was generated using the Veterans Health Information Systems and Technology Architecture (VISTA)system. The Computerized Patient Record System (CPRS) was used to evaluate the patient for inclusion and collect pertinent data. The PRN medication list was implemented on September 15, 2010. Data collection terminated as of September 14, 2010, regardless of discharge status. All data collected for this study were entered and stored in a database created by the authors. A table with set criteria to review was created for the 2010 and 2013 group to ensure standardization. The pharmacy resident reviewed all of the patient charts. The following data were collected for each patient in the 2010 group:
- Demographic data: Patient name, last 4 digits of their social security number, age
- Program information: Admitted to GEN or SAR program, admission and discharge date, duration of stay, reason for discharge
- ECS data: Date, type of visit, chief condition, medications administered during the visit, whether the visit resulted in a hospital admission, and whether the visit was avoidable
- Avoidable visit: visit in which the patient received or could have received medication(s) that are on the PRN medication list at the ECS visit to treat their illness
The same information was collected for each patient in the 2013 group in addition to the following: PRN medication data (medications administered from the PRN medication list and the number of times each medication was administered if applicable); and ECS data (along with the aforementioned data, it was noted if PRN medications were taken prior to the ECS visit).
In addition, nurse and patient satisfaction with the PRN medication list were assessed via a simple satisfaction survey. The survey was given to 120 patients admitted to the MHRRTP as well as to 32 nurses at the time of distribution. A cover letter on each survey explained the study and informed the patient that the survey was voluntary and anonymous. Satisfaction was based on 10-point scale, with 1 (lowest) and 10 (highest) in satisfaction. Additional questions were asked to identify areas of improvement (see eAppendixes A and B for patient and nurse surveys, respectively).
Statistical Analysis
Descriptive statistics were used to analyze collected data. The primary outcome was assessed for the group admitted postintervention by calculating the average number of times each medication on the PRN medication list was used per patient during their length of stay (LOS) as applicable. The administration totals for each medication on the PRN medication list during the postintervention study period were also recorded.
Secondary outcomes were assessed by comparing the recorded total number of ECS visits pre- and postimplementation. Additionally, the average number of ECS visits per admission and the number of avoidable ECS visits were recorded for each study group. The cost reduction from avoided ECS use was estimated by calculating the total cost of ECS used pre- and postimplementation. The difference between the number of avoidable ECS visits in the pre- and postintervention groups was assessed for statistical significance by using a chi-square test. The 2013 cost saving estimation was based on the average ECS visit cost in the 2013 fiscal year ($657). Of note, power for this study could not be calculated as this has not been studied prior; therefore, no precedence has been set.
Results
On completion of the data collection, 583 patients were assessed for inclusion into the study, 325 in the 2010 preimplementation group and 258 in the 2013 postimplementation group. A total of 200 patients were randomized in each group (n = 400); however, 69 (35%) and 63 (32%) were excluded from the 2010 group and 2013 group, respectively. Sample demographics are described in the Table.
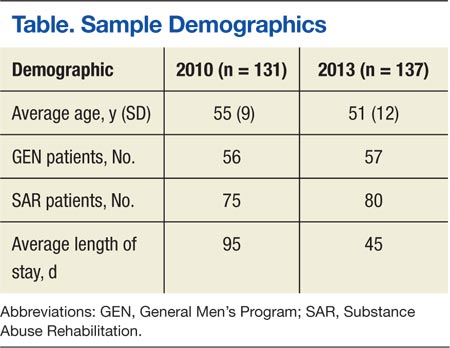
PRN Medication and ECS Use
Between April 1, 2013, and September 14, 2013, 3,959 doses of PRN medications were administered to MHRRTP patients who were included in the study (Figure). Prior to accessing ECS for their problem, 22 (36%) of the 61 patients who used ECS had trialed the PRN medication(s).
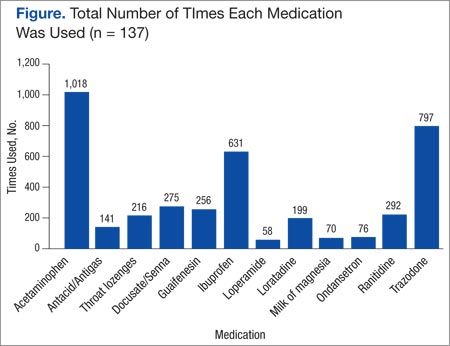
When comparing the total number of ECS visits, the 2010 group had 145 visits and the 2013 group had 96 visits. The preimplementation group averaged 1.1 ECS visits per MHRRTP admission, whereas the postimplementation group averaged 0.7 ECS visits per admission. The difference in the number of avoidable ECS visits was statistically significant, with the 2010 group totaling 15 avoidable visits, while the 2013 group totaled 1 ECS visit (P = .0045).
It was estimated that 9 (9.3%) ECS visits were avoided due to the PRN medication list in 2013. Using 137 patients, who were included in the postimplementation group, it can be calculated that $5,867 was saved due to the PRN medication list, or $42.83 per patient in 2013. Using the 2013 MHRRTP census of 898 patients, the financial impact of the PRN medication list can be extrapolated to produce an estimated annual cost savings of $38,461.
Patient and Nurse Satisfaction
Of the 120 patients given the patient satisfaction questionnaire, 28 (23%) patients responded. Of the respondents, 25 (89%) stated they were aware of the PRN medication list. The median rank of satisfaction reported was 8 on a 10-point scale. Twenty-two (79%) patients felt that the PRN medication list had or may have reduced the need to go to ECS or urgent care. Twenty-three (82%) patients recommended not removing any drugs listed on the PRN medication list.
Of the 32 registered nurses and licensed practical nurses working in the MHRRTP, 7 (22%) responded to the nurse satisfaction questionnaire. Of the respondents, 6 (86%) stated they discuss the PRN medication list during admission assessments every time or most of the time. The median rank of satisfaction was 9 on a 10-point scale. Four (57%) nurses felt patients had a clear understanding of the PRN medication list, and 100% of nurses stated they had enough guidance on situations to administer the medications. Seven (100%) stated that the PRN medication list had not caused adverse events; however, 5 (71%) stated that the list had been used inappropriately.
Discussion
This retrospective case-controlled study of 400 patients revealed high use of the PRN medication list and a cost avoidance of nearly $40,000. Although this represents a small reduction of the annual ECS budget, the PRN medication list also improved patient care by providing more efficient and convenient access to medications. The most commonly used medications were acetaminophen, trazodone, and ibuprofen. In addition, the nursing and patient surveys demonstrated an overall satisfaction with the current PRN medication list. It is important to note that the number of avoidable ECS visits decreased significantly after the implementation of the PRN medication list in 2010.
Roughly 35% of patients in each group were excluded from the study. The main exclusion criteria included a < 4-week LOS, being admitted to the hospital, being female, and being admitted prior to the study period. Women veterans were treated through different programs prior to the implementation of the PRN medication list; therefore, they were excluded to decrease variability. Only patients in the GEN and SAR programs were included, because they were well established prior to and after the intervention. The other programs, which included PTSD, WOM, OEF/OIF/OND, DCHV, and I-ACT, accounted for about one-third of MHRRTP admissions. However, they were not all available or structured similarly in 2010. Including the other programs would have increased variability.
Survey Results
Although the response rates were low, the patient and nurse satisfaction surveys revealed useful information that may assist in identifying the strengths and weaknesses of the current program. More rigorous surveying needs to be conducted to make the results more generalizable. Fifty percent of patients reported using a PRN medication on a daily basis or 3 times per week. However, 28.6% stated they never used the PRN medication list, which was thought to be an overestimation due to an incomplete understanding of what medications are on the PRN medication list. This finding does not correlate with the high use demonstrated with the actual number of PRN medications used.
Two patients marked “other,” one reported using the list when they “need the medication,” and another did not mark an answer. Similarly, 57.1% of the nursing staff reported offering a PRN medication on a daily basis and discussing the list on admission every time. However, 28.6% of nursing staff stated they do not complete admission assessments or work in the medication room, most likely because they are licensed practical nurses and do not have those responsibilities. Interestingly, when asked about medications that should be removed from the PRN medication list, 1 nurse suggested removing trazodone, which was the second most used drug. Some of the medications patients suggested adding to the PRN medication list included creams for dry skin or fungal infections, calcium carbonate, and pain medications such as tramadol, aspirin, and naproxen. Nurses suggested adding aspirin, diphenhydramine, and nicotine gum. These responses will aid in enhancing the current PRN medication list by potentially increasing the types of medications offered.
Limitations
This study has several limitations that may affect its interpretation. The study was retrospective in nature and had a short study period. The data were collected from a single specialty program, which decreases the study’s generalizability, as not all VAMCs have a MHRRTP. Also, the average LOS in 2010 was longer than in 2013. This was related to the restructuring of the MHRRTP in the spring of 2013 to allow for more condensed programming. As a result, it may be reasonable to infer that there were more ECS visits prior to implementation of the PRN medication list due to the longer LOS in 2010. This confounding variable was minimized by normalizing the calculation for the number and percent of ECS visits avoided.
The patient population was limited to male veterans and the satisfaction questionnaires had low response rates. The low patient response rate may have been due to a lack of incentive, decreased health literacy, or possibly lack of time. The low nurse response rate may have been due to limited time and also lack of incentive. A larger response rate may have increased the PRN medication list use and satisfaction reported. This study looked at the change in the number of ECS visits; but, it did not investigate any changes in the number of primary care visits. Patients were able to go to their primary care appointments during their stay in the MHRRTP and may have received medications listed on the PRN medication list at these appointments, which could have been avoided. Last, the accuracy of the documentation in CPRS may be unclear and may have subjected the study to bias. Unfortunately, ECS does not use bar code medication administration, so the administration of medications has to be manually written into the ECS visit note. This method may be vulnerable to human error.
Future Directions
Future directions from this study include discussing the results with the MHRRTP staff and identifying areas of improvement to enhance the medication list. Some discussion points include the reasoning to remove trazodone and examples of inappropriate use. Furthermore, the questions asked by patients and general
suggestions made by the nursing staff identified that increased patient education of the PRN medication list should be implemented during the admission assessment process. This would improve patient understanding and awareness of the PRN medication list, because some patients did not know about the list or what medications it included. Moving forward, the results of this project may provide incentive for future implementation of PRN medication lists at other VA MHRRTPs.
Conclusion
This study confirms that the MHRRTP PRN medication list has been highly used since its implementation in 2010. The study also suggests that the nursing staff and patients are satisfied with the current process. Furthermore, these findings illustrate the PRN medication list’s success at decreasing unnecessary use of ECS and its association with avoiding cost. Further studies are needed to support the results seen in this analysis. Although these discoveries are preliminary, they may provide incentive for future implementation of PRN medication lists at other VA MHRRTPs.
Acknowledgements
Michelle Bury had full access to all of the data in the study and takes responsibility for the integrity of the data and the accuracy of the data analysis.
Author disclosures
The authors report no actual or potential conflicts of interest with regard to this article.
Disclaimer
The opinions expressed herein are those of the authors and do not necessarily reflect those of Federal Practitioner, Frontline Medical Communications Inc., the U.S. Government, or any of its agencies. This article may discuss unlabeled or investigational use of certain drugs. Please review the complete prescribing information for specific drugs or drug combinations—including indications, contraindications, warnings, and adverse effects—before administering pharmacologic therapy to patients.
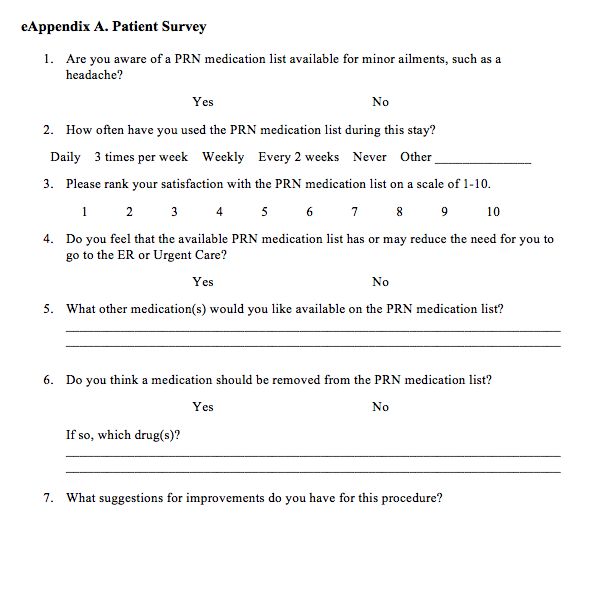
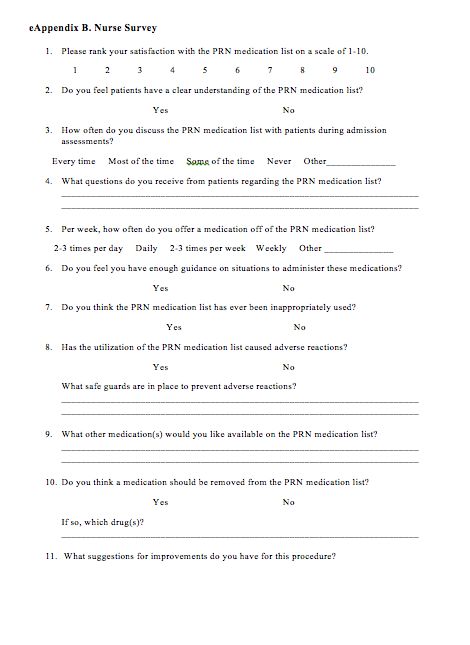
1. Department of Veterans Affairs. Mental Health Residential Rehabilitation Treatment Program. Washington, DC: Department of Veterans Affairs Website. https://vaww.portal.va.gov/sites/OMHS/mhrrtp/default.aspx. Accessed October 7, 2013.
2. Pharmacy Procedures for Safe Medication Management (SMM) in DOMs 123 and 43. Milwaukee, WI: Clement J. Zablocki VA Medical Center; September 2010.
3. Professional Services Memorandum VII-29. Milwaukee, WI: Clement J. Zablocki VA Medical Center; November 2010.
4. Petzel RA. Mental Health Residential Rehabilitation Treatment Program (MHRRTP): VHA Handbook 1162.02. Washington, DC: Veterans Health Administration; December 2010.
The Mental Health Residential Rehabilitation Treatment Program (MHRRTP) is an essential part of the mental health services offered at the Clement J. Zablocki VAMC (ZVAMC) in Milwaukee, Wisconsin. Across the nation, there are about 250 MHRRTPs, which are designed to provide rehabilitation and treatment services to veterans ranging in age from 18 to 80 years, with medical conditions, mental illness, addiction, or psychosocial deficits.1 About 900 patients were admitted to the ZVAMC MHRRTP in 2013.
Background
Prior to 2010, pharmacy administrators recognized that many MHRRTP patients were inappropriately using emergency care services (ECS) to obtain treatments for simple ailments that often required only the use of over-the-counter medications. This was likely associated with the Safe Medication Management (SMM) Policy as defined in Professional Services Memorandum VII-29.2,3 This policy states that MHRRTP patients are not allowed to bring in any home medications—all medications are reconciled and readministered on admission in an effort to reduce diversion.
A lack of 24-hour-per-day provider availability forced patients to find treatment elsewhere. A 6-month review was completed in 2010, which identified all of the MHRRTP patients who used ECS, their chief medical condition, and the medication(s) that were administered to each patient. This review identified a total of 254 ECS visits made by MHRRTP patients during this period. Twenty percent of these visits resulted in prescriptions for over-the-counter medications. As a result, an as needed (PRN) medication list was created for patients to have medications readily available for simple ailments with nursing oversight (Box). The goal of the PRN medication list is to reduce the amount of unnecessary ECS visits, decrease unnecessary cost, and improve treatment efficiency and overall patient care.
Treatment Programs
The ZVAMC MHRRTP has 189 beds divided among 7 different 6-week treatment programs, including General Men’s Program (GEN), Substance Abuse Rehabilitation (SAR), Posttraumatic Stress Disorder (PTSD), Women’s Program (WOM), Operation Enduring Freedom/Operation Iraqi Freedom/Operation New Dawn (OEF/OIF/OND), Domiciliary Care for Homeless Veterans (DCHV), and Individualized Addiction Consultation Team (I-ACT).4
The treatment programs within the MHRRTP at the ZVAMC address goals of rehabilitation, recovery, health maintenance, improved quality of life, and community integration in addition to specific treatment of medical conditions, mental illnesses, addictive disorders, and homelessness. Various levels of care are available through the program, based on the needs of each veteran. This care generally provides methods to enhance patients’ functional status and psychosocial rehabilitation.
A SMM program is used to ensure safe and effective medication use for all patients in the MHRRTP.2 As a result, the patients are admitted to the MHRRTP with inpatient status, and the medication delivery procedure varies based on the veteran’s ability to take medication independently. Veterans are assisted in developing self-care skills, which include comprehensive medication education. The goal of the SMM program is to give patients the assistance to eventually manage their medications independently.
MHRRTP Staffing
The MHRRTP must have adequate staffing in order to provide safe and effective patient care. Program staffing patterns are based on workload indicators and a bed-to-staff ratio.4 The MHRRTP is a multidisciplinary program; however, the only providers who can address medication issues are the 1.2 full-time employee equivalent MHRRTP psychiatrists. Unfortunately, the psychiatrists are not available for triage on nights, weekends, or holidays.
The role of the psychiatrist is to focus on the mental health needs of the MHRRTP patients, not the primary care medical concerns, which are the main reason for ECS visits. With the current model, providers are sometimes unavailable to meet the emergent needs of patients in the MHRRTP, and patients may be forced to choose between using ECS or leaving the concern unaddressed. Patients’ needs vary from mild to serious emergent needs but may not necessarily require full emergency assessments. For example, if a patient has a headache and a physician is not available to write an order for acetaminophen, the patient may need to visit the ECS to obtain a medication that otherwise would have been readily available at home. The restrictions are designed to promote medication safety, prevent medication diversion and misuse, and be in compliance with regulatory agencies (eg, The Joint Commission and the Commission on Accreditation of Rehabilitation Facilities).
ECS Use
During fiscal year 2010, pharmacy administrators discovered that many patients were using ECS to obtain medications for nonemergent conditions. Inappropriate and unnecessary use of ECS by MHRRTP patients delayed treatment, increased wait times for veterans in need of emergent care, and increased the cost of caring for simple ailments. To put this into perspective, the average cost of all conditions at the ZVAMC during the 2013 fiscal year was $657 per ECS visit, while the total cost of ECS was about $14 million.
In response to the inappropriate ECS use, the ZVAMC created a PRN medication list in 2010, which is offered to all MHRRTP patients, with the goal of reducing the number of patients inappropriately using ECS for minor ailments and providing more efficient and cost-effective patient care.2 The MHRRTP PRN medication list is initially evaluated by the admitting psychiatrist or nurse practitioner and mental health clinical pharmacy specialist completing the admission orders for appropriateness based on each patient’s comorbidities, medication regimen, and past medical history. For example, if a new patient with liver dysfunction is admitted to the MHRRTP, acetaminophen would not be made available due to an increased risk of hepatotoxicity. The other PRN medications would still be available for the patient if clinically appropriate.
Once the PRN medications are ordered, the MHRRTP nurse can assess a patient’s condition and administer the medication(s) to the patient as indicated. For instance, if a patient requests ibuprofen for pain, the nurse will document an initial pain score and administer the ibuprofendose. As a result, the patient obtains more efficient and convenient care and does not need to wait for a provider to become available or use ECS. Per ZVAMC policy, the nurse has 96 hours to reassess the PRN medication effectiveness; however, this is typically done within the same shift. Since the implementation of the PRN medication list, no formal assessment has been completed.
To the authors’ knowledge, the ZVAMC is the only MHRRTP in the VHA system that incorporates a PRN medication list in the admission orders to reduce unnecessary ECS visits. After completing a thorough literature review and contacting the national VA mental health pharmacist listserve, no studies discussing the use of PRN medication lists in this setting were identified, and no sites offered information as to a similar practice in place.
Methods
A randomized, retrospective case-controlled study involving a chart review was completed for patients admitted to the MHRRTP at the ZVAMC pre- and postimplementation of the MHRRTP PRN medication list between April 2010 and August 2010 and between April 2013 and August 2013, respectively. The ZVAMC is a teaching institution. This study was approved by the ZVAMC institutional review board.
Patients were eligible for the study if they were male, aged > 18 years, and admitted during the study period for treatment in the GEN or SAR programs at the ZVAMC for at least 4 weeks. Patients were excluded if they were female, admitted to the hospital after being seen by ECS, or if they were receiving treatment in the following programs: PTSD, WOM, OEF/OIF/OND, DCHV, and I-ACT. Patients studied in 2010 served as the control group, and patients studied in 2013 were the treatment group.
Objectives
The primary objective of this study was to evaluate the use of the current PRN medication list. Secondary objectives included the evaluation of the use of ECS by patients admitted to the MHRRTP pre- and postimplementation of the PRN medication list, the potential cost reduction due to avoided ECS use, and nurse and patient satisfaction with the PRN medication list.
Data
A list of all patients admitted to the MHRRTP at the ZVAMC between April and August of 2010 and 2013 was generated using the Veterans Health Information Systems and Technology Architecture (VISTA)system. The Computerized Patient Record System (CPRS) was used to evaluate the patient for inclusion and collect pertinent data. The PRN medication list was implemented on September 15, 2010. Data collection terminated as of September 14, 2010, regardless of discharge status. All data collected for this study were entered and stored in a database created by the authors. A table with set criteria to review was created for the 2010 and 2013 group to ensure standardization. The pharmacy resident reviewed all of the patient charts. The following data were collected for each patient in the 2010 group:
- Demographic data: Patient name, last 4 digits of their social security number, age
- Program information: Admitted to GEN or SAR program, admission and discharge date, duration of stay, reason for discharge
- ECS data: Date, type of visit, chief condition, medications administered during the visit, whether the visit resulted in a hospital admission, and whether the visit was avoidable
- Avoidable visit: visit in which the patient received or could have received medication(s) that are on the PRN medication list at the ECS visit to treat their illness
The same information was collected for each patient in the 2013 group in addition to the following: PRN medication data (medications administered from the PRN medication list and the number of times each medication was administered if applicable); and ECS data (along with the aforementioned data, it was noted if PRN medications were taken prior to the ECS visit).
In addition, nurse and patient satisfaction with the PRN medication list were assessed via a simple satisfaction survey. The survey was given to 120 patients admitted to the MHRRTP as well as to 32 nurses at the time of distribution. A cover letter on each survey explained the study and informed the patient that the survey was voluntary and anonymous. Satisfaction was based on 10-point scale, with 1 (lowest) and 10 (highest) in satisfaction. Additional questions were asked to identify areas of improvement (see eAppendixes A and B for patient and nurse surveys, respectively).
Statistical Analysis
Descriptive statistics were used to analyze collected data. The primary outcome was assessed for the group admitted postintervention by calculating the average number of times each medication on the PRN medication list was used per patient during their length of stay (LOS) as applicable. The administration totals for each medication on the PRN medication list during the postintervention study period were also recorded.
Secondary outcomes were assessed by comparing the recorded total number of ECS visits pre- and postimplementation. Additionally, the average number of ECS visits per admission and the number of avoidable ECS visits were recorded for each study group. The cost reduction from avoided ECS use was estimated by calculating the total cost of ECS used pre- and postimplementation. The difference between the number of avoidable ECS visits in the pre- and postintervention groups was assessed for statistical significance by using a chi-square test. The 2013 cost saving estimation was based on the average ECS visit cost in the 2013 fiscal year ($657). Of note, power for this study could not be calculated as this has not been studied prior; therefore, no precedence has been set.
Results
On completion of the data collection, 583 patients were assessed for inclusion into the study, 325 in the 2010 preimplementation group and 258 in the 2013 postimplementation group. A total of 200 patients were randomized in each group (n = 400); however, 69 (35%) and 63 (32%) were excluded from the 2010 group and 2013 group, respectively. Sample demographics are described in the Table.
PRN Medication and ECS Use
Between April 1, 2013, and September 14, 2013, 3,959 doses of PRN medications were administered to MHRRTP patients who were included in the study (Figure). Prior to accessing ECS for their problem, 22 (36%) of the 61 patients who used ECS had trialed the PRN medication(s).
When comparing the total number of ECS visits, the 2010 group had 145 visits and the 2013 group had 96 visits. The preimplementation group averaged 1.1 ECS visits per MHRRTP admission, whereas the postimplementation group averaged 0.7 ECS visits per admission. The difference in the number of avoidable ECS visits was statistically significant, with the 2010 group totaling 15 avoidable visits, while the 2013 group totaled 1 ECS visit (P = .0045).
It was estimated that 9 (9.3%) ECS visits were avoided due to the PRN medication list in 2013. Using 137 patients, who were included in the postimplementation group, it can be calculated that $5,867 was saved due to the PRN medication list, or $42.83 per patient in 2013. Using the 2013 MHRRTP census of 898 patients, the financial impact of the PRN medication list can be extrapolated to produce an estimated annual cost savings of $38,461.
Patient and Nurse Satisfaction
Of the 120 patients given the patient satisfaction questionnaire, 28 (23%) patients responded. Of the respondents, 25 (89%) stated they were aware of the PRN medication list. The median rank of satisfaction reported was 8 on a 10-point scale. Twenty-two (79%) patients felt that the PRN medication list had or may have reduced the need to go to ECS or urgent care. Twenty-three (82%) patients recommended not removing any drugs listed on the PRN medication list.
Of the 32 registered nurses and licensed practical nurses working in the MHRRTP, 7 (22%) responded to the nurse satisfaction questionnaire. Of the respondents, 6 (86%) stated they discuss the PRN medication list during admission assessments every time or most of the time. The median rank of satisfaction was 9 on a 10-point scale. Four (57%) nurses felt patients had a clear understanding of the PRN medication list, and 100% of nurses stated they had enough guidance on situations to administer the medications. Seven (100%) stated that the PRN medication list had not caused adverse events; however, 5 (71%) stated that the list had been used inappropriately.
Discussion
This retrospective case-controlled study of 400 patients revealed high use of the PRN medication list and a cost avoidance of nearly $40,000. Although this represents a small reduction of the annual ECS budget, the PRN medication list also improved patient care by providing more efficient and convenient access to medications. The most commonly used medications were acetaminophen, trazodone, and ibuprofen. In addition, the nursing and patient surveys demonstrated an overall satisfaction with the current PRN medication list. It is important to note that the number of avoidable ECS visits decreased significantly after the implementation of the PRN medication list in 2010.
Roughly 35% of patients in each group were excluded from the study. The main exclusion criteria included a < 4-week LOS, being admitted to the hospital, being female, and being admitted prior to the study period. Women veterans were treated through different programs prior to the implementation of the PRN medication list; therefore, they were excluded to decrease variability. Only patients in the GEN and SAR programs were included, because they were well established prior to and after the intervention. The other programs, which included PTSD, WOM, OEF/OIF/OND, DCHV, and I-ACT, accounted for about one-third of MHRRTP admissions. However, they were not all available or structured similarly in 2010. Including the other programs would have increased variability.
Survey Results
Although the response rates were low, the patient and nurse satisfaction surveys revealed useful information that may assist in identifying the strengths and weaknesses of the current program. More rigorous surveying needs to be conducted to make the results more generalizable. Fifty percent of patients reported using a PRN medication on a daily basis or 3 times per week. However, 28.6% stated they never used the PRN medication list, which was thought to be an overestimation due to an incomplete understanding of what medications are on the PRN medication list. This finding does not correlate with the high use demonstrated with the actual number of PRN medications used.
Two patients marked “other,” one reported using the list when they “need the medication,” and another did not mark an answer. Similarly, 57.1% of the nursing staff reported offering a PRN medication on a daily basis and discussing the list on admission every time. However, 28.6% of nursing staff stated they do not complete admission assessments or work in the medication room, most likely because they are licensed practical nurses and do not have those responsibilities. Interestingly, when asked about medications that should be removed from the PRN medication list, 1 nurse suggested removing trazodone, which was the second most used drug. Some of the medications patients suggested adding to the PRN medication list included creams for dry skin or fungal infections, calcium carbonate, and pain medications such as tramadol, aspirin, and naproxen. Nurses suggested adding aspirin, diphenhydramine, and nicotine gum. These responses will aid in enhancing the current PRN medication list by potentially increasing the types of medications offered.
Limitations
This study has several limitations that may affect its interpretation. The study was retrospective in nature and had a short study period. The data were collected from a single specialty program, which decreases the study’s generalizability, as not all VAMCs have a MHRRTP. Also, the average LOS in 2010 was longer than in 2013. This was related to the restructuring of the MHRRTP in the spring of 2013 to allow for more condensed programming. As a result, it may be reasonable to infer that there were more ECS visits prior to implementation of the PRN medication list due to the longer LOS in 2010. This confounding variable was minimized by normalizing the calculation for the number and percent of ECS visits avoided.
The patient population was limited to male veterans and the satisfaction questionnaires had low response rates. The low patient response rate may have been due to a lack of incentive, decreased health literacy, or possibly lack of time. The low nurse response rate may have been due to limited time and also lack of incentive. A larger response rate may have increased the PRN medication list use and satisfaction reported. This study looked at the change in the number of ECS visits; but, it did not investigate any changes in the number of primary care visits. Patients were able to go to their primary care appointments during their stay in the MHRRTP and may have received medications listed on the PRN medication list at these appointments, which could have been avoided. Last, the accuracy of the documentation in CPRS may be unclear and may have subjected the study to bias. Unfortunately, ECS does not use bar code medication administration, so the administration of medications has to be manually written into the ECS visit note. This method may be vulnerable to human error.
Future Directions
Future directions from this study include discussing the results with the MHRRTP staff and identifying areas of improvement to enhance the medication list. Some discussion points include the reasoning to remove trazodone and examples of inappropriate use. Furthermore, the questions asked by patients and general
suggestions made by the nursing staff identified that increased patient education of the PRN medication list should be implemented during the admission assessment process. This would improve patient understanding and awareness of the PRN medication list, because some patients did not know about the list or what medications it included. Moving forward, the results of this project may provide incentive for future implementation of PRN medication lists at other VA MHRRTPs.
Conclusion
This study confirms that the MHRRTP PRN medication list has been highly used since its implementation in 2010. The study also suggests that the nursing staff and patients are satisfied with the current process. Furthermore, these findings illustrate the PRN medication list’s success at decreasing unnecessary use of ECS and its association with avoiding cost. Further studies are needed to support the results seen in this analysis. Although these discoveries are preliminary, they may provide incentive for future implementation of PRN medication lists at other VA MHRRTPs.
Acknowledgements
Michelle Bury had full access to all of the data in the study and takes responsibility for the integrity of the data and the accuracy of the data analysis.
Author disclosures
The authors report no actual or potential conflicts of interest with regard to this article.
Disclaimer
The opinions expressed herein are those of the authors and do not necessarily reflect those of Federal Practitioner, Frontline Medical Communications Inc., the U.S. Government, or any of its agencies. This article may discuss unlabeled or investigational use of certain drugs. Please review the complete prescribing information for specific drugs or drug combinations—including indications, contraindications, warnings, and adverse effects—before administering pharmacologic therapy to patients.
1. Department of Veterans Affairs. Mental Health Residential Rehabilitation Treatment Program. Washington, DC: Department of Veterans Affairs Website. https://vaww.portal.va.gov/sites/OMHS/mhrrtp/default.aspx. Accessed October 7, 2013.
2. Pharmacy Procedures for Safe Medication Management (SMM) in DOMs 123 and 43. Milwaukee, WI: Clement J. Zablocki VA Medical Center; September 2010.
3. Professional Services Memorandum VII-29. Milwaukee, WI: Clement J. Zablocki VA Medical Center; November 2010.
4. Petzel RA. Mental Health Residential Rehabilitation Treatment Program (MHRRTP): VHA Handbook 1162.02. Washington, DC: Veterans Health Administration; December 2010.
Assessing the Quality of VA Animal Care and Use Programs
Institutions conducting research involving animals have established operational frameworks, referred to as animal care and use programs (ACUPs), to ensure research animal welfare and high-quality research data and to meet ethical and regulatory requirements.1-4 The Institutional Animal Care and Use Committee (IACUC) is a critical component of the ACUP and is responsible for the oversight and evaluation of all aspects of the ACUP.5 However, investigators, IACUCs, institutions, the research sponsor, and the federal government share responsibilities for ensuring research animal welfare.
Effective policies, procedures, practices, and systems in the ACUP are critical to an institution’s ability to ensure that animal research is conducted humanely and complies with applicable regulations, policies, and guidelines. To this end, considerable effort and resources have been devoted to improve the effectiveness of ACUPs, including external accreditation of ACUPs by the Association for Assessment and Accreditation of Laboratory Animal Care International (AAALAC International) and implementation of science-based performance standards, postapproval monitoring, and risk assessments and mitigation of identified vulnerability.6-9 However, the impact of these quality improvement measures remains unclear. There have been no valid, reliable, and quantifiable measures to assess the effectiveness and quality of ACUPs.
Compliance with federal regulations is not only required, but also essential in protecting laboratory animals. However, the goal is not to ensure compliance but to prevent unnecessary harm, injury, and suffering to those research animals. Overemphasis on compliance and documentation may negatively impact the system by diverting resources away from ensuring research animal welfare. The authors propose that although research animal welfare cannot be directly measured, it is possible to assess the quality of ACUPs. High-quality ACUPs are expected to minimize risk to research animals to the extent possible while maintaining the integrity of the research.
The authors previously developed a set of quality indicators (QIs) for human research protection programs (HRPPs) at the VA, emphasizing performance outcomes built on a foundation of compliance.10 Implementation of these QIs allowed the research team to collect data to assess the quality of VA HRPPs.11 It also allowed the team to answer important questions, such as whether there were significant differences in the quality of HRPPs among facilities using their own institutional review boards (IRBs) and those using affiliated university IRBs as their IRBs of record.12
Background
The VA health care system (VAHCS) is the largest integrated health care system in the U.S. Currently, there are 77 VA facilities conducting research involving laboratory animals. In addition to federal regulations governing research with animals, researchers in the VAHCS must comply with requirements established by VA.1-4 For example, in the VAHCS, the IACUC is a subcommittee of the Research and Development Committee (R&DC). Research involving animals may not be initiated until it has been approved by both the IACUC and the R&DC.13,14 All investigators, including animal research investigators, are required to have approved scopes of practice.14 Furthermore, all VA facilities that conduct animal research are required to have their ACUPs accredited by the AAALAC International.13
Based on the experience gained from the VA HRPP QIs, the authors developed a set of QIs that emphasize assessing the outcome of ACUPs rather than solely on IACUC review or compliance with animal research regulations and policies. This report describes the proposed QIs for assessing the quality of VA ACUPs and presents preliminary data using some of these QIs.
Methods
The VA ACUP QIs were developed through a process that included (1) identification of a set of potential indicators by the authors; (2) review and comments on the potential indicators by individuals within and outside VA who have expertise in protecting research animal welfare, including veterinarians with board certification in laboratory animal medicine, IACUC chairs, and individuals involved in the accreditation and oversight of ACUPs; and (3) review and revision by the authors of the proposed QIs in light of the suggestions and comments received. After 6 months of deliberation, a set of 13 QIs was finalized for consideration for implementation.
Data Collection
As part of the VA ACUP quality assurance program, each VA research facility is required to conduct regulatory audits of all animal research protocols once every 3 years by qualified research compliance officers (RCOs).15 Audit tools were developed for the triennial animal protocol regulatory audits (available at http://www.va.gov/oro/rcep.asp).11,12 Facility RCOs were then trained to use these tools to conduct audits throughout the year.
Results of the protocol regulatory audits, conducted between June 1, 2011, and May 31, 2012, were collected through a Web-based system from all 74 VA facilities conducting animal research during that period. Information collected included IACUC and R&DC initial approval of human research protocols; for-cause suspension or termination of animal research protocols; compliance with continuing review requirements; research personnel scopes of practice; and investigator animal research protection training requirements.
Because this study did not involve the use of laboratory animals, no ACUC review and approval was required.
Data Analysis
All data collected were entered into a database for analysis. When necessary, facilities were contacted to verify the accuracy and uniformity of data reported. Only descriptive statistics were obtained and presented.
Quality Indicators
As shown in the Box, a total of 13 QIs covering a broad range of areas that may have significant impact on research animal welfare were selected.
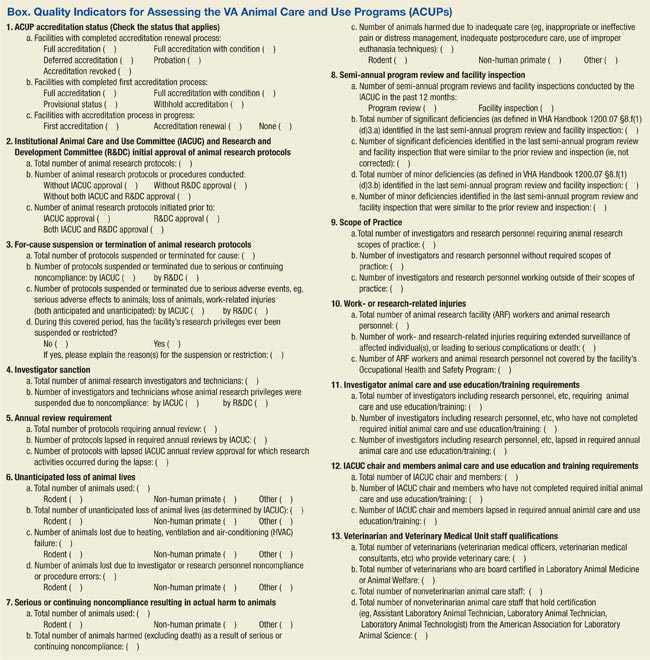
QI 1. ACUP accreditation status was chosen, because accreditation of an institutional ACUP by AAALAC International, the sole widely accepted ACUP accrediting organization, suggests that the institution establish acceptable operational frameworks to ensure research animal welfare. Because VA policy requires that all facilities conducting animal research be accredited, failure to achieve full accreditation may indicate that research animals are at an elevated risk due to a less than optimal system to protect research animals.13
QI 2. IACUC and R&DC initial approval of animal research protocols was chosen because of the importance of IACUC and R&DC review and approval in ensuring the scientific merit of the research and the adequacy of research animal protection. The number and the percentage of protocols conducted without or initiated prior to IACUC and/or R&DC approval, which may put animals at risk, is a good measure of the adequacy of the institution’s ACUP.
QI 3. For-cause suspension or termination of animal research protocols was chosen, because this is a serious event. Protocols can be suspended or prematurely terminated by IACUCs due to investigators’ serious or continuing noncompliance or due to serious adverse events/injuries to the animals or research personnel. The number and percentage of protocols suspended reflect the adequacy of the IACUC oversight of the institution’s animal research program.
QI 4. Investigator sanction was chosen, because investigators and research personnel play an important role in protecting research animals. The number and percentage of investigators or technicians whose research privileges were suspended due to noncompliance reflect the adequacy of the institution’s education and training program as well as oversight of the ACUP.
QI 5. Annual review requirement was chosen because of the importance of ongoing oversight of approved animal research by the IACUC. The number and percentage of protocols lapsed in annual reviews, particularly when research activities continued during the lapse reflects the adequacy of IACUC oversight.
QI 6. Unanticipated loss of animal lives was chosen, because loss of animal lives is the most serious harm to animals that the ACUP is intended to prevent. The number and percentage of animals whose lives are unnecessarily lost due to heating, ventilation, or air-conditioning failure reflect the adequacy of the institution’s animal care infrastructure and effectiveness of the emergency response plan.
QI 7. Serious or continuing noncompliance resulting in actual harm to animals was chosen, because actual harm to animals is an important outcome measure of the adequacy of ACUP. The number and percentage of animals harmed due to investigator noncompliance or inadequate care reflect the adequacy of the institution’s veterinarian and IACUC oversight.
QI 8. Semi-annual program review and facility inspection was chosen because of the importance of semi-annual program review and facility inspection in IACUC’s oversight of the institution’s ACUP. This QI emphasizes the timely correction and remediation of both major and minor deficiencies identified during semi-annual program reviews and facility inspections. Failure to promptly address identified deficiencies in a timely manner may place research animals at significant risk.
QI 9. Scope of practice was chosen because of the importance of the investigator’s qualification in ensuring not only high-quality research data, but also adequate protection of research animals. Certain animal procedures can be safely performed only by investigators with adequate training and experience. Allowing investigators who are unqualified to perform these procedures places animals at significant risk of being harmed.
QI 10. Work- or research-related injuries was chosen because of the importance of the safety of investigators and animal caretakers in the institution’s ACUP. The importance of the institution’s occupational health and safety program in protecting investigators and animal care workers cannot be overemphasized. The number and percentage of investigators and animal care workers covered by the occupational health and safety program and work- or research-related injuries reflect the adequacy of the ACUP.
QI 11. Investigator animal care and use education/training requirements was chosen because of the important role of investigators in protecting animal welfare. The number and percentage of investigators who fail to maintain required animal care and use education/training reflect the adequacy of the institution’s IACUC oversight.
QI 12. IACUC chair and members’ animal care and use education and training requirements was chosen because of the important role of the IACUC chair and members in the institution’s ACUP. To appropriately evaluate and approve/disapprove animal research protocols, the chair and members of IACUC must maintain sufficient knowledge of federal regulations and VA policies regarding animal protections.
QI 13. Veterinarian and veterinary medical unit staff qualification was chosen because of the important role of veterinarian and veterinary medical unit staff in the day-to-day care of research animals and the specialized knowledge and qualification they need to maintain the animal research facilities. The number of veterinarians and nonveterinary animal care staff with appropriate board certifications reflects the strength of an institution’s ACUP.
Results
Recognizing the importance of assessing the quality of VA ACUPs, the authors started to collect some QI data of VA ACUPs parallel to those of VA HRPPs before the aforementioned proposed QIs for VA ACUPs were fully developed. These preliminary data are included here to demonstrate the feasibility of implementing these proposed VA ACUP QIs.
IACUC and R&DC Approvals (QI 2)
VA policies require that all animal research protocols be reviewed and approved first by the IACUC and then by the R&DC.13,14 The IACUC is a subcommittee of the R&DC. No animal research activities in VA may be initiated before receiving both IACUC and R&DC approval.13,14
Between June 1, 2011, and May 31, 2012, regulatory audits were conducted on 1,286 animal research protocols. Among them, 1 (0.08%) protocol was conducted and completed without the required IACUC approval, 1 (0.08%) was conducted and completed without the required R&DC approval, 1 (0.08%) was initiated prior to IACUC approval, and 2 (0.16%) were initiated prior to R&DC approval.
For-Cause Suspension or Termination (QI 3)
Among the 1,286 animal research protocols audited, 14 (1.09%) protocols were suspended or terminated for cause; 10 (0.78%) protocols were suspended or terminated due to animal safety concerns; and 4 (0.31%) protocols were suspended or terminated due to investigator-related concerns.
Lapse in Continuing Reviews (QI 5)
Federal regulations and VA policies require that IACUC conduct continuing review of all animal research protocols annually.2,13 Of the 1,286 animal research protocols audited, 1,159 protocols required IACUC continuing reviews during the auditing period. Fifty-three protocols (4.57%) lapsed in IACUC annual reviews, and in 25 of these 53 protocols, investigators continued research activities during the lapse.
Scope of Practice (QI 9)
VA policies require all research personnel to have an approved research scope of practice or functional statement that defines the duties that the individual is qualified and allowed to perform for research purposes.14
A total of 4,604 research personnel records were reviewed from the 1,286 animal research protocols audited. Of these, 276 (5.99%) did not have an approved research scope of practice; 1 (0.02%) had an approved research scope of practice but was working outside the approved research scope of practice.
Training Requirements (QI 11)
VA policies require that all research personnel who participate in animal research complete initial and annual training to ensure that they can competently and humanely perform their duties related to animal research.14
Among the 4,604 animal research personnel records reviewed, 186 (4.04%) did not maintain their training requirements, including 26 (0.56%) without required initial training and 160 (3.48%) with lapses in required continuing training.
Discussion
Collectively, these proposed QIs should provide useful information about the overall quality of an ACUP. This allows semiquantitative assessment of the quality and performance of VA facilities’ ACUPs over time and comparison of the performance of ACUPs across research facilities in the VAHCS. The information obtained may also help administrators identify program vulnerabilities and make management decisions regarding where improvements are most needed. Specifically, QI data will be collected from all VA research facilities’ ACUPs annually. National averages for all QIs will be calculated. Each facility will then be provided with the results of its own ACUP QI data as well as the national averages, allowing the facility to compare its QI data with the national averages and determine how its ACUP performs compared with the overall VA ACUP performance.
These QIs were designed for use in assessing the quality of ACUPs at VA research facilities annually or at least once every other year. With the recent requirement that a full-time RCO at each VA research facility conduct regulatory audits of all animal research protocols once every 3 years, it is feasible that an assessment of the VA ACUPs using these QIs could be conducted annually as demonstrated by the preliminary data for QIs 2, 3, 5, 9, and 11 reported here.15,16 These preliminary data also showed high rates of lapses in IACUC continuing review (4.57%), lack of research personnel scopes of practice (5.99%), and noncompliance with training requirements (4.04%). These are areas that need improvements.
The size and complexity of animal research programs are different among different facilities, which can make it difficult to compare different facilities’ ACUPs using the same quality measures. In addition, VA facilities may use their own IACUCs or the affiliate university IACUCs as the IACUCs of record. However, based on the authors’ experience using HRPP QIs to assess the quality of VA HRPPs, the collected data using ACUP QIs will help determine whether such variables as the size and complexity of a program or the kind of IACUCs used (either VA, own IACUC, or affiliate IACUC) affect the quality of VA ACUPs.10-12
Limitations
There is no evidence proving that these QIs are the most optimal measures for evaluating the quality of a VA facility’s ACUP. It is also unknown whether these QIs correlate directly with the protection of research animals. Furthermore, a quantitative, numerical value cannot be put on each indicator to allow evaluators to rank facilities’ ACUPs.
Some QIs, such as QIs 3, 4, 7, and 8, may depend on how stringent an IACUC is. For example, it is possible that a conscientious IACUC may report more noncompliance or suspend more protocols, giving the appearance of a poor quality ACUP, whereas in fact it might be an excellent program. However, the authors want to emphasize that no single QI by itself is sufficient to assess the quality of a program. It is the combination of various QIs that provides information about the overall quality of a program. It is also through the data collected that the usefulness of any particular indicators may be determined.
Conclusion
These proposed QIs provide a useful first step toward developing a robust and valid assessment of VA ACUPs. As these QIs are used at VA facilities, they will likely be redefined and modified. The authors hope that other institutions will find these indicators useful as they develop instruments to assess their own ACUPs.
Acknowledgement
The authors thank Dr. Kathryn Bayne, Global Director, Association for Assessment and Accreditation of Laboratory Animal Care International, for her suggestions and comments during the development of these quality indicators and critical review of the manuscript, and Dr. J. Thomas Puglisi, Chief Officer, VA Office of Research Oversight, for his support and critical review of the manuscript.
Author disclosures
The authors report no actual or potential conflicts of interest with regard to this article.
Disclaimer
The opinions expressed herein are those of the authors and do not necessarily reflect those of Federal Practitioner, Frontline Medical Communications Inc., the U.S. Government, or any of its agencies. This article may discuss unlabeled or investigational use of certain drugs. Please review complete prescribing information for specific drugs or drug combinations—including indications, contraindications, warnings, and adverse effects—before administering pharmacologic therapy to patients.
1. Animal Welfare Act, 7 USC §2131-2156 (2008).
2. Animal Welfare Regulations, 9 CFR §1-4 (2008).
3. National Research Council of the National Academies. Guide for the Care and Use of Laboratory Animals. 8th ed. Washington, DC: National Academies Press; 2011.
4. Office of Laboratory Animal Welfare. Public Health Service Policy On Humane Care And Use Of Laboratory Animals. Bethesda, MD: National Institutes of Health, U.S. Department of Health and Human Services; 2015. NIH publication 15-8013. http://grants.nih.gov/grants/olaw//PHSPolicyLabAnimals.pdf. Revised 2015. Accessed August 3, 2015.
5. Sandgren EP. Defining the animal care and use program. Lab Anim (NY). 2005;34(10):41-44.
6. Association for Assessment and Accreditation of Laboratory Animal Care International. The AAALAC International accreditation program. The Association for Assessment and Accreditation of Laboratory Animal Care International Website. http://www.aaalac.org/accreditation/index.cfm. Updated 2015. Accessed August 3, 2015.
7. Klein HJ, Bayne KA. Establishing a culture of care, conscience, and responsibility: addressing the improvement of scientific discovery and animal welfare through science-based performance standards. ILAR J. 2007;48(1):3-11.
8. Banks RE, Norton JN. A sample postapproval monitoring program in academia. ILAR J. 2008;49(4):402-418.
9. Van Sluyters RC. A guide to risk assessment in animal care and use programs: the metaphor of the 3-legged stool. ILAR J. 2008;49(4):372-378.
10. Tsan MF, Smith K, Gao B. Assessing the quality of human research protection programs: the experience at the Department of Veterans Affairs. IRB. 2010;32(4):16-19.
11. Tsan MF, Nguyen Y, Brooks R. Using quality indicators to assess human research protection programs at the Department of Veterans Affairs. IRB. 2013;35(1):10-14.
12. Tsan MF, Nguyen Y, Brooks B. Assessing the quality of VA Human Research Protection Programs: VA vs. affiliated University Institutional Review Board. J Emp Res Hum Res Ethics. 2013;8(2):153-160.
13. VA Research and Development Service. Use of Animals in Research. VHA Handbook 1200.07. Washington, DC: Department of Veterans Affairs, Veterans Health Administration; 2011.
14. VA Research and Development Service. Research and Development (R&D) Committee. VHA Handbook 1200.01. Washington, DC: Veterans Health Administration; 2009.
15. Research Compliance Officers and the Auditing of VHA Human Subjects Research to Determine Compliance with Applicable Laws, Regulations, and Policies. VHA Directive 2008-064. Washington, DC: Veterans Health Administration; 2008.
16. VA Office of Research Oversight. Research Compliance Reporting Requirements. VHA Handbook 1058.01. Washington, DC: Veterans Health Administration; 2015.
Institutions conducting research involving animals have established operational frameworks, referred to as animal care and use programs (ACUPs), to ensure research animal welfare and high-quality research data and to meet ethical and regulatory requirements.1-4 The Institutional Animal Care and Use Committee (IACUC) is a critical component of the ACUP and is responsible for the oversight and evaluation of all aspects of the ACUP.5 However, investigators, IACUCs, institutions, the research sponsor, and the federal government share responsibilities for ensuring research animal welfare.
Effective policies, procedures, practices, and systems in the ACUP are critical to an institution’s ability to ensure that animal research is conducted humanely and complies with applicable regulations, policies, and guidelines. To this end, considerable effort and resources have been devoted to improve the effectiveness of ACUPs, including external accreditation of ACUPs by the Association for Assessment and Accreditation of Laboratory Animal Care International (AAALAC International) and implementation of science-based performance standards, postapproval monitoring, and risk assessments and mitigation of identified vulnerability.6-9 However, the impact of these quality improvement measures remains unclear. There have been no valid, reliable, and quantifiable measures to assess the effectiveness and quality of ACUPs.
Compliance with federal regulations is not only required, but also essential in protecting laboratory animals. However, the goal is not to ensure compliance but to prevent unnecessary harm, injury, and suffering to those research animals. Overemphasis on compliance and documentation may negatively impact the system by diverting resources away from ensuring research animal welfare. The authors propose that although research animal welfare cannot be directly measured, it is possible to assess the quality of ACUPs. High-quality ACUPs are expected to minimize risk to research animals to the extent possible while maintaining the integrity of the research.
The authors previously developed a set of quality indicators (QIs) for human research protection programs (HRPPs) at the VA, emphasizing performance outcomes built on a foundation of compliance.10 Implementation of these QIs allowed the research team to collect data to assess the quality of VA HRPPs.11 It also allowed the team to answer important questions, such as whether there were significant differences in the quality of HRPPs among facilities using their own institutional review boards (IRBs) and those using affiliated university IRBs as their IRBs of record.12
Background
The VA health care system (VAHCS) is the largest integrated health care system in the U.S. Currently, there are 77 VA facilities conducting research involving laboratory animals. In addition to federal regulations governing research with animals, researchers in the VAHCS must comply with requirements established by VA.1-4 For example, in the VAHCS, the IACUC is a subcommittee of the Research and Development Committee (R&DC). Research involving animals may not be initiated until it has been approved by both the IACUC and the R&DC.13,14 All investigators, including animal research investigators, are required to have approved scopes of practice.14 Furthermore, all VA facilities that conduct animal research are required to have their ACUPs accredited by the AAALAC International.13
Based on the experience gained from the VA HRPP QIs, the authors developed a set of QIs that emphasize assessing the outcome of ACUPs rather than solely on IACUC review or compliance with animal research regulations and policies. This report describes the proposed QIs for assessing the quality of VA ACUPs and presents preliminary data using some of these QIs.
Methods
The VA ACUP QIs were developed through a process that included (1) identification of a set of potential indicators by the authors; (2) review and comments on the potential indicators by individuals within and outside VA who have expertise in protecting research animal welfare, including veterinarians with board certification in laboratory animal medicine, IACUC chairs, and individuals involved in the accreditation and oversight of ACUPs; and (3) review and revision by the authors of the proposed QIs in light of the suggestions and comments received. After 6 months of deliberation, a set of 13 QIs was finalized for consideration for implementation.
Data Collection
As part of the VA ACUP quality assurance program, each VA research facility is required to conduct regulatory audits of all animal research protocols once every 3 years by qualified research compliance officers (RCOs).15 Audit tools were developed for the triennial animal protocol regulatory audits (available at http://www.va.gov/oro/rcep.asp).11,12 Facility RCOs were then trained to use these tools to conduct audits throughout the year.
Results of the protocol regulatory audits, conducted between June 1, 2011, and May 31, 2012, were collected through a Web-based system from all 74 VA facilities conducting animal research during that period. Information collected included IACUC and R&DC initial approval of human research protocols; for-cause suspension or termination of animal research protocols; compliance with continuing review requirements; research personnel scopes of practice; and investigator animal research protection training requirements.
Because this study did not involve the use of laboratory animals, no ACUC review and approval was required.
Data Analysis
All data collected were entered into a database for analysis. When necessary, facilities were contacted to verify the accuracy and uniformity of data reported. Only descriptive statistics were obtained and presented.
Quality Indicators
As shown in the Box, a total of 13 QIs covering a broad range of areas that may have significant impact on research animal welfare were selected.
QI 1. ACUP accreditation status was chosen, because accreditation of an institutional ACUP by AAALAC International, the sole widely accepted ACUP accrediting organization, suggests that the institution establish acceptable operational frameworks to ensure research animal welfare. Because VA policy requires that all facilities conducting animal research be accredited, failure to achieve full accreditation may indicate that research animals are at an elevated risk due to a less than optimal system to protect research animals.13
QI 2. IACUC and R&DC initial approval of animal research protocols was chosen because of the importance of IACUC and R&DC review and approval in ensuring the scientific merit of the research and the adequacy of research animal protection. The number and the percentage of protocols conducted without or initiated prior to IACUC and/or R&DC approval, which may put animals at risk, is a good measure of the adequacy of the institution’s ACUP.
QI 3. For-cause suspension or termination of animal research protocols was chosen, because this is a serious event. Protocols can be suspended or prematurely terminated by IACUCs due to investigators’ serious or continuing noncompliance or due to serious adverse events/injuries to the animals or research personnel. The number and percentage of protocols suspended reflect the adequacy of the IACUC oversight of the institution’s animal research program.
QI 4. Investigator sanction was chosen, because investigators and research personnel play an important role in protecting research animals. The number and percentage of investigators or technicians whose research privileges were suspended due to noncompliance reflect the adequacy of the institution’s education and training program as well as oversight of the ACUP.
QI 5. Annual review requirement was chosen because of the importance of ongoing oversight of approved animal research by the IACUC. The number and percentage of protocols lapsed in annual reviews, particularly when research activities continued during the lapse reflects the adequacy of IACUC oversight.
QI 6. Unanticipated loss of animal lives was chosen, because loss of animal lives is the most serious harm to animals that the ACUP is intended to prevent. The number and percentage of animals whose lives are unnecessarily lost due to heating, ventilation, or air-conditioning failure reflect the adequacy of the institution’s animal care infrastructure and effectiveness of the emergency response plan.
QI 7. Serious or continuing noncompliance resulting in actual harm to animals was chosen, because actual harm to animals is an important outcome measure of the adequacy of ACUP. The number and percentage of animals harmed due to investigator noncompliance or inadequate care reflect the adequacy of the institution’s veterinarian and IACUC oversight.
QI 8. Semi-annual program review and facility inspection was chosen because of the importance of semi-annual program review and facility inspection in IACUC’s oversight of the institution’s ACUP. This QI emphasizes the timely correction and remediation of both major and minor deficiencies identified during semi-annual program reviews and facility inspections. Failure to promptly address identified deficiencies in a timely manner may place research animals at significant risk.
QI 9. Scope of practice was chosen because of the importance of the investigator’s qualification in ensuring not only high-quality research data, but also adequate protection of research animals. Certain animal procedures can be safely performed only by investigators with adequate training and experience. Allowing investigators who are unqualified to perform these procedures places animals at significant risk of being harmed.
QI 10. Work- or research-related injuries was chosen because of the importance of the safety of investigators and animal caretakers in the institution’s ACUP. The importance of the institution’s occupational health and safety program in protecting investigators and animal care workers cannot be overemphasized. The number and percentage of investigators and animal care workers covered by the occupational health and safety program and work- or research-related injuries reflect the adequacy of the ACUP.
QI 11. Investigator animal care and use education/training requirements was chosen because of the important role of investigators in protecting animal welfare. The number and percentage of investigators who fail to maintain required animal care and use education/training reflect the adequacy of the institution’s IACUC oversight.
QI 12. IACUC chair and members’ animal care and use education and training requirements was chosen because of the important role of the IACUC chair and members in the institution’s ACUP. To appropriately evaluate and approve/disapprove animal research protocols, the chair and members of IACUC must maintain sufficient knowledge of federal regulations and VA policies regarding animal protections.
QI 13. Veterinarian and veterinary medical unit staff qualification was chosen because of the important role of veterinarian and veterinary medical unit staff in the day-to-day care of research animals and the specialized knowledge and qualification they need to maintain the animal research facilities. The number of veterinarians and nonveterinary animal care staff with appropriate board certifications reflects the strength of an institution’s ACUP.
Results
Recognizing the importance of assessing the quality of VA ACUPs, the authors started to collect some QI data of VA ACUPs parallel to those of VA HRPPs before the aforementioned proposed QIs for VA ACUPs were fully developed. These preliminary data are included here to demonstrate the feasibility of implementing these proposed VA ACUP QIs.
IACUC and R&DC Approvals (QI 2)
VA policies require that all animal research protocols be reviewed and approved first by the IACUC and then by the R&DC.13,14 The IACUC is a subcommittee of the R&DC. No animal research activities in VA may be initiated before receiving both IACUC and R&DC approval.13,14
Between June 1, 2011, and May 31, 2012, regulatory audits were conducted on 1,286 animal research protocols. Among them, 1 (0.08%) protocol was conducted and completed without the required IACUC approval, 1 (0.08%) was conducted and completed without the required R&DC approval, 1 (0.08%) was initiated prior to IACUC approval, and 2 (0.16%) were initiated prior to R&DC approval.
For-Cause Suspension or Termination (QI 3)
Among the 1,286 animal research protocols audited, 14 (1.09%) protocols were suspended or terminated for cause; 10 (0.78%) protocols were suspended or terminated due to animal safety concerns; and 4 (0.31%) protocols were suspended or terminated due to investigator-related concerns.
Lapse in Continuing Reviews (QI 5)
Federal regulations and VA policies require that IACUC conduct continuing review of all animal research protocols annually.2,13 Of the 1,286 animal research protocols audited, 1,159 protocols required IACUC continuing reviews during the auditing period. Fifty-three protocols (4.57%) lapsed in IACUC annual reviews, and in 25 of these 53 protocols, investigators continued research activities during the lapse.
Scope of Practice (QI 9)
VA policies require all research personnel to have an approved research scope of practice or functional statement that defines the duties that the individual is qualified and allowed to perform for research purposes.14
A total of 4,604 research personnel records were reviewed from the 1,286 animal research protocols audited. Of these, 276 (5.99%) did not have an approved research scope of practice; 1 (0.02%) had an approved research scope of practice but was working outside the approved research scope of practice.
Training Requirements (QI 11)
VA policies require that all research personnel who participate in animal research complete initial and annual training to ensure that they can competently and humanely perform their duties related to animal research.14
Among the 4,604 animal research personnel records reviewed, 186 (4.04%) did not maintain their training requirements, including 26 (0.56%) without required initial training and 160 (3.48%) with lapses in required continuing training.
Discussion
Collectively, these proposed QIs should provide useful information about the overall quality of an ACUP. This allows semiquantitative assessment of the quality and performance of VA facilities’ ACUPs over time and comparison of the performance of ACUPs across research facilities in the VAHCS. The information obtained may also help administrators identify program vulnerabilities and make management decisions regarding where improvements are most needed. Specifically, QI data will be collected from all VA research facilities’ ACUPs annually. National averages for all QIs will be calculated. Each facility will then be provided with the results of its own ACUP QI data as well as the national averages, allowing the facility to compare its QI data with the national averages and determine how its ACUP performs compared with the overall VA ACUP performance.
These QIs were designed for use in assessing the quality of ACUPs at VA research facilities annually or at least once every other year. With the recent requirement that a full-time RCO at each VA research facility conduct regulatory audits of all animal research protocols once every 3 years, it is feasible that an assessment of the VA ACUPs using these QIs could be conducted annually as demonstrated by the preliminary data for QIs 2, 3, 5, 9, and 11 reported here.15,16 These preliminary data also showed high rates of lapses in IACUC continuing review (4.57%), lack of research personnel scopes of practice (5.99%), and noncompliance with training requirements (4.04%). These are areas that need improvements.
The size and complexity of animal research programs are different among different facilities, which can make it difficult to compare different facilities’ ACUPs using the same quality measures. In addition, VA facilities may use their own IACUCs or the affiliate university IACUCs as the IACUCs of record. However, based on the authors’ experience using HRPP QIs to assess the quality of VA HRPPs, the collected data using ACUP QIs will help determine whether such variables as the size and complexity of a program or the kind of IACUCs used (either VA, own IACUC, or affiliate IACUC) affect the quality of VA ACUPs.10-12
Limitations
There is no evidence proving that these QIs are the most optimal measures for evaluating the quality of a VA facility’s ACUP. It is also unknown whether these QIs correlate directly with the protection of research animals. Furthermore, a quantitative, numerical value cannot be put on each indicator to allow evaluators to rank facilities’ ACUPs.
Some QIs, such as QIs 3, 4, 7, and 8, may depend on how stringent an IACUC is. For example, it is possible that a conscientious IACUC may report more noncompliance or suspend more protocols, giving the appearance of a poor quality ACUP, whereas in fact it might be an excellent program. However, the authors want to emphasize that no single QI by itself is sufficient to assess the quality of a program. It is the combination of various QIs that provides information about the overall quality of a program. It is also through the data collected that the usefulness of any particular indicators may be determined.
Conclusion
These proposed QIs provide a useful first step toward developing a robust and valid assessment of VA ACUPs. As these QIs are used at VA facilities, they will likely be redefined and modified. The authors hope that other institutions will find these indicators useful as they develop instruments to assess their own ACUPs.
Acknowledgement
The authors thank Dr. Kathryn Bayne, Global Director, Association for Assessment and Accreditation of Laboratory Animal Care International, for her suggestions and comments during the development of these quality indicators and critical review of the manuscript, and Dr. J. Thomas Puglisi, Chief Officer, VA Office of Research Oversight, for his support and critical review of the manuscript.
Author disclosures
The authors report no actual or potential conflicts of interest with regard to this article.
Disclaimer
The opinions expressed herein are those of the authors and do not necessarily reflect those of Federal Practitioner, Frontline Medical Communications Inc., the U.S. Government, or any of its agencies. This article may discuss unlabeled or investigational use of certain drugs. Please review complete prescribing information for specific drugs or drug combinations—including indications, contraindications, warnings, and adverse effects—before administering pharmacologic therapy to patients.
1. Animal Welfare Act, 7 USC §2131-2156 (2008).
2. Animal Welfare Regulations, 9 CFR §1-4 (2008).
3. National Research Council of the National Academies. Guide for the Care and Use of Laboratory Animals. 8th ed. Washington, DC: National Academies Press; 2011.
4. Office of Laboratory Animal Welfare. Public Health Service Policy On Humane Care And Use Of Laboratory Animals. Bethesda, MD: National Institutes of Health, U.S. Department of Health and Human Services; 2015. NIH publication 15-8013. http://grants.nih.gov/grants/olaw//PHSPolicyLabAnimals.pdf. Revised 2015. Accessed August 3, 2015.
5. Sandgren EP. Defining the animal care and use program. Lab Anim (NY). 2005;34(10):41-44.
6. Association for Assessment and Accreditation of Laboratory Animal Care International. The AAALAC International accreditation program. The Association for Assessment and Accreditation of Laboratory Animal Care International Website. http://www.aaalac.org/accreditation/index.cfm. Updated 2015. Accessed August 3, 2015.
7. Klein HJ, Bayne KA. Establishing a culture of care, conscience, and responsibility: addressing the improvement of scientific discovery and animal welfare through science-based performance standards. ILAR J. 2007;48(1):3-11.
8. Banks RE, Norton JN. A sample postapproval monitoring program in academia. ILAR J. 2008;49(4):402-418.
9. Van Sluyters RC. A guide to risk assessment in animal care and use programs: the metaphor of the 3-legged stool. ILAR J. 2008;49(4):372-378.
10. Tsan MF, Smith K, Gao B. Assessing the quality of human research protection programs: the experience at the Department of Veterans Affairs. IRB. 2010;32(4):16-19.
11. Tsan MF, Nguyen Y, Brooks R. Using quality indicators to assess human research protection programs at the Department of Veterans Affairs. IRB. 2013;35(1):10-14.
12. Tsan MF, Nguyen Y, Brooks B. Assessing the quality of VA Human Research Protection Programs: VA vs. affiliated University Institutional Review Board. J Emp Res Hum Res Ethics. 2013;8(2):153-160.
13. VA Research and Development Service. Use of Animals in Research. VHA Handbook 1200.07. Washington, DC: Department of Veterans Affairs, Veterans Health Administration; 2011.
14. VA Research and Development Service. Research and Development (R&D) Committee. VHA Handbook 1200.01. Washington, DC: Veterans Health Administration; 2009.
15. Research Compliance Officers and the Auditing of VHA Human Subjects Research to Determine Compliance with Applicable Laws, Regulations, and Policies. VHA Directive 2008-064. Washington, DC: Veterans Health Administration; 2008.
16. VA Office of Research Oversight. Research Compliance Reporting Requirements. VHA Handbook 1058.01. Washington, DC: Veterans Health Administration; 2015.
A Treatment Protocol for Patients With Diabetic Peripheral Neuropathy
The progressive symptoms of diabetic peripheral neuropathy (DPN) are some of the most frequent presentations of patients seeking care at the VHA. Patients with DPN often experience unmanageable pain in the lower extremities, loss of sensation in the feet, loss of balance, and an inability to perform daily functional activities.1 In addition, these patients are at significant risk for lower extremity ulceration and amputation.2 The symptoms and consequences of DPN are strongly linked to chronic use of pain medications as well as increased fall risk and injury.3 The high health care usage of veterans with these complex issues makes DPN a significant burden for the patient, the VHA, and society as a whole.
At the William Jennings Bryan Dorn VA Medical Center (WJBDVAMC) in Columbia, South Carolina, 10,763 veterans were identified to be at risk for limb loss in 2014 due to loss of protective sensation and 5,667 veterans diagnosed with DPN were treated in 2014.4 Although WJBDVAMC offers multiple clinics and programs to address the complex issues of diabetes and DPN, veterans oftentimes continue to experience uncontrolled pain, loss of protective sensation, and a decline in function even after diagnosis.
One area of improvement the authors identified in the WJBDVAMC Physical Medicine and Rehabilitation Services Department was the need for an effective, nonpharmacologic treatment for patients who experience DPN. As a result, the authors designed a pilot research study to determine whether or not a combined physical therapy intervention of monochromatic near-infrared energy (MIRE) treatments and a standardized balance exercise program would help improve the protective sensation, reduce fall risk, and decrease the adverse impact of pain on daily function. The study was approved by the institutional review board (IRB) and had no outside source of funding.
Background
Current treatments for DPN are primarily pharmacologic and are viewed as only moderately effective, limited by significant adverse effects (AEs) and drug interactions.5 Patients in the VHA at risk for amputation in low-, moderate-, and high-risk groups total 541,475 and 363,468 have a history of neuropathy. They are considered at risk due to multiple, documented factors, including weakness, callus, foot deformity, loss of protective sensation, and/or history of amputation.4 Neuropathy can affect tissues throughout the body, including organs, sensory neurons, cardiovascular status, the autonomic system, and the gastrointestinal tract as it progresses.
Individuals who develop DPN often experience severe, uncontrolled pain in the lower extremities, insensate feet, and decreased proprioceptive skills. The functional status of individuals with DPN often declines insidiously while mortality rate increases.6 Increased levels of neuropathic pain often lead to decreased activity levels, which, in turn, contribute to decreased endurance, poorly managed glycemic indexes, decreased strength, and decreased independence.
Additional DPN complications, such as decreased sensation and muscle atrophy in the lower extremities, often lead to foot deformity and increased areas of pressure during weight bearing postures. These areas of increased pressure may develop unknowingly into ulceration. If a patient’s wound becomes chronic and nonhealing, it can also lead to amputation. In such cases, early mortality may result.6,7 The cascading effects of neuropathic pain and decreased sensation place a patient with diabetes at risk for falls. Injuries from falls are widely known to be a leading cause of hospitalization and mortality in the elderly.8
Physical therapy may be prescribed for DPN and its resulting sequelae. Several studies present conflicting results regarding the benefits of therapeutic exercise in the treatment of DPN. Akbari and colleagues showed that balance exercises can increase stability in patients with DPN; whereas, a study by Kruse and colleagues noted a training program consisting of lower-extremity exercises, balance training, and walking resulted in minimal improvement of participants’ balance and leg strength over a 12-month period.9,10 Recent studies have shown that weight bearing does not increase ulceration in patients with diabetes and DPN. This is contrary to previous assumptions that patients with diabetes and DPN need to avoid weight-bearing activities.11,12
Transcutaneous electrical nerve stimulation (TENS), a modality often used in physical therapy, has been studied in the treatment of DPN with conflicting results. Gossrau and colleagues found that pain reduction with micro-TENS applied peripherally is not superior to a placebo.13 However, a case study by Somers and Somers indicated that TENS applied to the lumbar area seemed to reduce pain and insomnia associated with diabetic neuropathy.14
Several recent research studies suggest that MIRE, another available modality, may be effective in treating symptoms of DPN. Monochromatic infrared energy therapy is a noninvasive, drug-free, FDA-approved medical device that emits monochromatic near-infrared light to improve local circulation and decrease pain. A large study of 2,239 patients with DPN reported an increase in foot sensation and decreased neuropathic pain levels when treated with MIRE.15
Leonard and colleagues found that the MIRE treatments resulted in a significant increase in sensation in individuals with baseline sensation of 6.65 Semmes-Weinstein Monofilament (SWM) after 6 and 12 active treatments as well as a decrease in neuropathic symptoms as measured by the Michigan Neuropathy Screening Instrument.16 Prendergast and colleagues noted improved electrophysical changes in both large and small myelinated nerve fibers of patients with DPN following 10 MIRE treatments.17 When studying 49 patients with DPN, Kochman and colleagues found 100% of participants had improved sensation after 12 MIRE treatments when tested with monofilaments.18
An additional benefit of MIRE treatment is that it can be safely performed at home once the patient is educated on proper use and application. Home DPN treatment has the potential to decrease the burden this population places on health care systems by reducing provider visits, medication, hospitalization secondary to pain, ulceration, fall injuries, and amputations.
Methods
This was a prospective, case series pilot study designed to measure changes in patient pain levels using the visual analog scale (VAS) and Pain Outcomes Questionnaire-VA (POQ-VA), degree of protective sensation loss as measured by SWM, and fall risk as denoted by Tinetti scores from entry to 6 months. Informed consent was obtained prior to treatment, and 33 patients referred by primary care providers and specialty clinics met the criteria and enrolled in the study. Twenty-one patients completed the entire 6-month study. The nonparametric Friedman test with a Dunn’s multiple comparison (DMC) post hoc test was used to analyze the data from the initial, 4-week, 3-month, and 6-month follow-up visits.
Setting and Participants
The study was performed in the Outpatient Physical Therapy Department at WJBDVAMC. Veterans with DPN who met the inclusion/exclusion criteria were enrolled. Inclusion criteria specified that the participant must be referred by a qualified health care provider for the treatment of DPN, be able to read and write in English, have consistent transportation to and from the study location, and be able to apply MIRE therapy as directed at home.
Exclusion criteria were subjects for whom MIRE or exercise were contraindicated. Subjects were excluded if they had medical conditions that suggested a possible decline in health status in the next 6 months. Such conditions included a current regimen of chemotherapy, radiation therapy, or dialysis; recent lower extremity amputation without prosthesis; documented active alcohol and/or drug misuse; advanced chronic obstructive pulmonary disease as defined as dyspnea at rest at least once per day; unstable angina; hemiplegia or other lower extremity paralysis; and a history of central nervous system or peripheral nervous system demyelinating disorders. Additional exclusion criteria included hospitalization in the past 60 days, use of any apparatus for continuous or patient-controlled analgesia; history of chronic low back pain with documented radiculopathy; and any change in pertinent medications in the past 60 days, including pain medications, insulin, metformin, and anti-inflammatories.
Interventions
Subjects participated in a combined physical therapy approach using MIRE and a standardized balance program. Patients received treatment in the outpatient clinic 3 times each week for 4 weeks. The treatment then continued at the same frequency at home until the scheduled 6-month follow-up visit. Clinic and home treatments included application of MIRE to bilateral lower extremities and feet for 30 minutes each as well as performance of a therapeutic exercise program for balance.
In the clinic, 2 pads from the MIRE device (Anodyne Therapy, LLC, Tampa, FL) were placed along the medial and lateral aspect of each lower leg, and an additional 2 pads were placed in a T formation on the plantar surface of each foot, per the manufacturer’s recommendations. The T formation consisted of the first pad placed horizontally across the metatarsal heads and the second placed vertically down the length of the foot. Each pad was protected by plastic wrap to ensure proper hygiene and secured. The intensity of clinic treatments was set at 7 bars, which minimized the risk of burns. Home treatments were similar to those in the clinic, except that each leg had to be treated individually instead of simultaneously and home MIRE units are preset and only function at an intensity that is equivalent to around 7 bars on the clinical unit.
The standardized balance program consisted of a progression of the following exercises: ankle alphabet/ankle range of motion, standing lateral weight shifts, bilateral heel raises, bilateral toe raises, unilateral heel raises, unilateral toe raises, partial wall squats, and single leg stance. Each participant performed these exercises 3 times per week in the clinic and then 3 times per week at home following the 12th visit.
Outcomes and Follow-up
The POQ-VA, a subjective quality of life (QOL) measure for veterans, as well as VAS, SWM testing, and the Tinetti Gait and Balance Assessment scores were used to measure outcomes. Data were collected for each of these measures during the initial and 12th clinic visits and at the 3-month and 6-month follow-up visits. The POQ-VA and VAS scores were self-reported and filled out by each participant at the initial, 12th, 3-month, and 6-month visits. The POQ-VA score has proven to be reliable and valid for the assessment of noncancer, chronic pain in veterans.19 The VAS scores were measured using a scale of 0 to 10 cm.
The SWM was standardized, and 7 sites were tested on each foot during the initial, 12th, 3-month, and 6-month visits: plantar surface of the distal great toe, the distal 3rd toe, the distal 5th toe, the 1st metatarsal head, the 3rd metatarsal head, the 5th metatarsal head, and the mid-plantar arch. At each site, the SWM was applied with just enough force to initiate a bending force and held for 1.5 seconds. Each site was tested 3 times. Participants had to detect the monofilament at least twice for the monofilament value to be recorded. Monofilament testing began with 6.65 SWM and decreased to 5.07, 4.56, 4.32, and lower until the patient was no longer able to detect sensation.
The Tinetti Gait and Balance Assessments was performed on each participant at the initial, 12th, 3-month, and 6-month visits. Tinetti balance, gait, and total scores were recorded at each interval.
Results
Thirty-three patients, referred by primary care providers and specialty clinics, met the inclusion criteria and enrolled in the study. Twenty-one patients (20 men and 1 woman) completed the entire 6-month study. Causes for withdrawal included travel difficulties (5), did not show up for follow-up visits (4), lumbar radiculopathy (1), perceived minimal/no benefit (1), and unrelated death (1). No AEs were reported.
The Friedman test with DMC post hoc test was performed on the POQ-VA total score and subscale scores. The POQ-VA subscale scores were divided into the following domains: pain, activities of daily living (ADL), fear, negative affect, mobility, and vitality. The POQ-VA domains were analyzed to compare data from the initial, 12th, 3-month, and 6-month visits. The POQ-VA total score significantly decreased from the initial to the 12th visit (P < .01), from the initial to the 3-month (P < .01), and from the initial to the 6-month visit (P < .05). However, there was no significant change from the 12th visit to the 3-month follow-up, 12th visit to the 6-month follow-up, or the 3-month to 6-month follow-up.
The POQ-VA pain score decreased significantly from the initial to the 12th visit (P < .05) and from the initial to the 6-month visit (P < .05). However, there was no significant interval change from the initial to the 3-month, the 12th to 3-month, 12th to 6-month, or 3-month to 6-month visit (Figure 1). The POQ-VA vitality scores and POQ-VA fear scores did not yield significant changes. The POQ-VA negative affect scores showed significant improvement only between the initial and the 3-month visit (P < .05) (Figure 2). The POQ-VA ADL scores showed significant improvement in the initial vs 3-month score (P < .05). The POQ-VA mobility scores were significantly improved for the initial vs 12th visit (P < .01), initial vs 3-month visit (P < .01), and the initial vs 6-month visit (P < .001) (Figure 1).

Analysis of VAS scores revealed a significant decrease at the 6-month time frame compared with the initial score for the left foot (P < .05). Further VAS analysis revealed no significant difference between the initial and 6-month right foot VAS score. When both feet were compared together, there was no significant difference in VAS ratings between any 2 points in time.
Analysis of Tinetti Total Score, Tinetti Balance Score, and Tinetti Gait Score revealed a significant difference between the initial vs 3-month visit for all 3 scores (P < .001, P < .001, and P < .05, respectively). In addition, Tinetti Total (P < .001) and Tinetti Balance (P < .01) scores were significantly improved from initial to the final 6-month visit. There were no significant findings between interim scores of the initial and 12th visits, the 12th and 3-month visits, or the 3-month and 6-month scores (Figure 2).
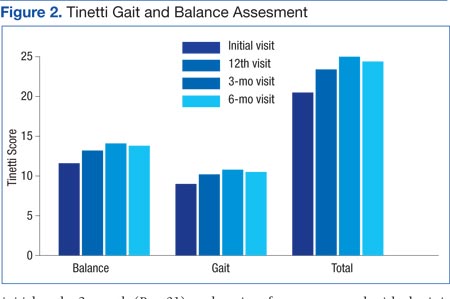
Analysis of SWM testing indicated a significant decrease in the total number of insensate sites (> 5.07) when both feet were grouped together between the initial and 3-month visits (P < .05) as well as the initial and 6-month (P < .01) visits. When the left and right feet were compared independently of each other, there was a significant decrease in the number of insensate sites between the initial and 6-month visits (P < .01 for both) (Figure 3).
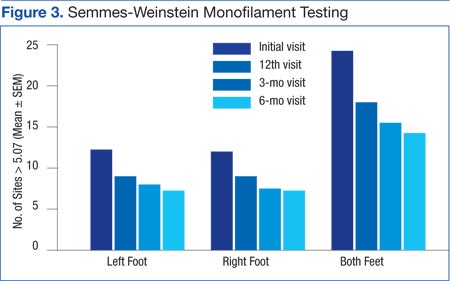
Discussion
This study investigated whether or not a multimodal physical therapy approach would reduce several of the debilitating symptoms of DPN experienced by many veterans at WJBDVAMC. The results support the idea that a combined treatment protocol of MIRE and a standardized exercise program can lead to decreased POQ-VA pain levels, improved balance, and improved protective sensation in veterans with DPN. Alleviation of these DPN complications may ultimately decrease an individual’s risk of injury and improve overall QOL.
Because the POQ-VA is a reliable, valid self-reported measure for veterans, it was chosen to quantify the impact of pain. Overall, veterans who participated in this study perceived decreased pain interference in multiple areas of their lives. The most significant findings were in overall QOL, household and community mobility, and pain ratings. This suggests that the combined treatment protocol will help veterans maintain an active lifestyle despite poorly controlled diabetes and neuropathic pain.
Along with decreased pain interference with QOL, participants demonstrated a decrease in fall risk as quantified by the Tinetti Gait and Balance Assessment. The SWM testing showed improved protective sensation as early as 3 months and continued through the 6-month visit. As protective sensation improves and fall risk decreases, the risk of injury is lessened, fear of falling is decreased, and individuals are less likely to self-impose limitations on daily activity levels, which improves QOL. In addition, decreased fall risk and improved protective sensation can reduce the financial burden on both the patient and the health care system. Many individuals are hospitalized secondary to fall injury, nonhealing wounds, resulting infections, and/or secondary complications from prolonged immobility. This treatment protocol demonstrates how a standardized physical therapy protocol, including MIRE and balance exercises, can be used preventively to reduce both the personal and financial impact of DPN.
It is interesting to note that some POQ-VA and Tinetti subscores were significantly improved at 3 months but not at 6 months. The significance achieved at 3 months may be due to the time required (ie, > 12 visits) to make significant physiological changes. The lack of significance at 6 months may be due to the natural tendency of participants to less consistently perform the home exercise program and MIRE protocol when unsupervised in the home. Differences in the VAS and POQ-VA pain score ratings were noted in the data. The POQ-VA pain rating scale indicated significant improvement in pain levels over the course of the study. However, when asked about pain using the 10-cm VAS, patients reported no significant improvements. This may be because veterans are more familiar with the numerical pain rating scale and are rarely asked to use the 10-cm VAS. It may also be because the POQ-VA pain rating asks for an average pain level over the previous week, whereas the 10-cm VAS asks for pain level at a discrete point in time.
Historically, physical therapy has had little to offer individuals with DPN. As a result of this study, however, a standardized treatment program for DPN has been implemented at the WJBDVAMC Physical Therapy Clinic. Referred patients are seen in the clinic on a trial basis. If positive results are documented during the clinic treatments, a home MIRE unit and exercise program are provided. The patients are expected to continue performing home treatments of MIRE and exercise 3 times a week after discharge.
Strengths and Limitations
Strengths of the study include a stringent IRB review, control of medication changes during the study through alerts to all VA providers, and a standardized MIRE and exercise protocol. An additional strength is the long duration of the study, which included supervised and unsupervised interventions that simulate real-life scenarios.
Limitations of the study include a small sample size, case-controlled design rather than a randomized, double-blinded study, which can contribute to selection bias, inability to differentiate between the benefits of physical therapy alone vs physical therapy and MIRE treatments, and retention of participants due to travel difficulties across a wide catchment area.
This pilot study should be expanded to a multicenter, randomized, double-blinded study to clarify the most beneficial treatments for individuals with diabetic neuropathy. Examining the number of documented falls pre- and postintervention may also be helpful to determine actual effects on an individual’s fall risk.
Conclusion
The use of a multimodal physical therapy approach seems to be effective in reducing the impact of neuropathic pain, the risk of amputation, and the risk of falls in individuals who have pursued all standard medical options but still experience the long-term effects of DPN. By adhering to a standardized treatment protocol of MIRE and therapeutic exercise, it seems that the benefits of this intervention can be maintained over time. This offers new, nonconventional treatment options in the field of physical therapy for veterans whose QOL is negatively impacted by the devastating effects of diabetic neuropathy.
Acknowledgements
Clinical support was provided by David Metzelfeld, DPT, and Cam Lendrim, PTA of William Jennings Bryan Dorn VA Medical Center. Paul Bartels, PhD, of Warren Wilson College provided data analysis support. Anodyne Therapy, LLC, provided the MIRE unit used in the clinic.
Author disclosures
The authors report no actual or potential conflicts of interest with regard to this article.
Disclaimer
The opinions expressed herein are those of the authors and do not necessarily reflect those of Federal Practitioner, Frontline Medical Communications Inc., the U.S. Government, or any of its agencies. This article may discuss unlabeled or investigational use of certain drugs. Please review complete prescribing information for specific drugs or drug combinations—including indications, contraindications, warnings, and adverse effects—before administering pharmacologic therapy to patients.
1. National Institute of Neurological Disorders and Stroke. Peripheral neuropathy fact sheet. National Institute of Neurological Disorders and Stroke Website. http://www.ninds.nih.gov/disorders/peripheralneuropath/detail_peripheralneuropathy.htm#183583208. Updated April 17, 2015. Accesssed August 8, 2015.
2. Armstrong DG, Lavery LA, and Wunderlich RP. Risk factors for diabetic foot ulceration: a logical approach to treatment. J Wound Ostomy Continence Nurs. 1998;25(3):123-128.
3. Pesa J, Meyer R, Quock T, Rattana SK, Mody SH. MBA Opioid utilization patterns among medicare patients with diabetic peripheral neuropathy. Am Health Drug Benefits. 2013;6(4):188-196.
4. VHA Support Service Center. The amputation risk by facility in the ProClarity amputation risk (PAVE) cube. Department of Veterans Affairs Nonpublic Intranet. http://vssc.med.va.gov.
5. Gore M, Brandenburg NA, Hoffman DL, Tai KS, Stacey B. Burden of illness in painful diabetic peripheral neuropathy: the patients’ perspectives. J Pain. 2006;7(12):892-900
6. Tentolouris N, Al-Sabbagh S, Walker MG, Boulton AJ, Jude EB. Mortality in diabetic and nondiabetic patients after amputations performed from 1990 to 1995: a 5-year follow-up study. Diabetes Care. 2004;27(7):1598-1604.
7. Boyko EJ, Ahroni JH, Stensel V, Forsberg RC, Davignon DR, Smith DG. A prospective study of risk factors for diabetic foot ulcer. The Seattle Diabetic Foot Study. Diabetes Care. 1999;22(7):1036-1042.
8. Centers for Disease Control and Prevention. Older adults falls: get the facts. Centers for Disease Control and Prevention Website. http://www.cdc.gov/HomeandRecreationalSafety/Falls/adultfalls.html. Updated July 1, 2015. Accessed August 8, 2015.
9. Akbari M, Jafari H, Moshashaee A, Forugh B. Do diabetic neuropathy patients benefit from balance training? J Rehabil Res Dev. 2012;49(2):333-338.
10. Kruse RL, Lemaster JW, Madsen RW. Fall and balance outcomes after an intervention to promote leg strength, balance, and walking in people with diabetic peripheral neuropathy: “feet first” randomized controlled trial. Phys Ther. 2010;90(11):1568-1579.
11. Lemaster JW, Mueller MJ, Reiber GE, Mehr DR, Madsen RW, Conn VS. Effect of weight-bearing activity on foot ulcer incidence in people with diabetic peripheral neuropathy: feet first randomized controlled trial. Phys Ther. 2008;88(11):1385-1398.
12. Tuttle LG, Hastings MK, and Mueller MJ. A moderate-intensity weight-bearing exercise program for a person with type 2 diabetes and peripheral neuropathy. Phys Ther. 2012;92(1):133-141.
13. Gossrau G, Wähner M, Kuschke M, et al. Microcurrent transcutaneous electric nerve stimulation in painful diabetic neuropathy: a randomized placebo-controlled study. Pain Med. 2011;12(6):953-960.
14. Somers DL, Somers MF. Treatment of neuropathic pain in a patient with diabetic neuropathy using transcutaneous electrical nerve stimulation applied to the skin of the lumbar region. Phys Ther. 1999;79(8):767-775.
15. Harkless LB, DeLellis S, Carnegie DH, Burke TJ. Improved foot sensitivity and pain reduction in patients with peripheral neuropathy after treatment with monochromatic infrared photo energy—MIRE. J Diabetes Complications. 2006;20(2):81-87.
16. Leonard DR, Farooqi MH, Myers S. Restoration of sensation, reduced pain, and improved balance in subjects with diabetic peripheral neuropathy: a double-blind, randomized, placebo-controlled study with monochromatic near-infrared treatment. Diabetes Care. 2004;27(1):168-172.
17. Prendergast JJ, Miranda G, Sanchez M. Improvement of sensory impairment in patients with peripheral neuropathy. Endocr Pract. 2004;10(1):24-30.
18. Kochman AB, Carnegie DH, Burke TJ. Symptomatic reversal of peripheral neuropathy in patients with diabetes. J Am Podiatr Med Assoc. 2002;92(3):125-130.
19. Clark ME, Gironda RJ, Young RW. Development and validation of the Pain Outcomes Questionnaire-VA. J Rehabil Res Dev. 2003;40(5):381-395.
The progressive symptoms of diabetic peripheral neuropathy (DPN) are some of the most frequent presentations of patients seeking care at the VHA. Patients with DPN often experience unmanageable pain in the lower extremities, loss of sensation in the feet, loss of balance, and an inability to perform daily functional activities.1 In addition, these patients are at significant risk for lower extremity ulceration and amputation.2 The symptoms and consequences of DPN are strongly linked to chronic use of pain medications as well as increased fall risk and injury.3 The high health care usage of veterans with these complex issues makes DPN a significant burden for the patient, the VHA, and society as a whole.
At the William Jennings Bryan Dorn VA Medical Center (WJBDVAMC) in Columbia, South Carolina, 10,763 veterans were identified to be at risk for limb loss in 2014 due to loss of protective sensation and 5,667 veterans diagnosed with DPN were treated in 2014.4 Although WJBDVAMC offers multiple clinics and programs to address the complex issues of diabetes and DPN, veterans oftentimes continue to experience uncontrolled pain, loss of protective sensation, and a decline in function even after diagnosis.
One area of improvement the authors identified in the WJBDVAMC Physical Medicine and Rehabilitation Services Department was the need for an effective, nonpharmacologic treatment for patients who experience DPN. As a result, the authors designed a pilot research study to determine whether or not a combined physical therapy intervention of monochromatic near-infrared energy (MIRE) treatments and a standardized balance exercise program would help improve the protective sensation, reduce fall risk, and decrease the adverse impact of pain on daily function. The study was approved by the institutional review board (IRB) and had no outside source of funding.
Background
Current treatments for DPN are primarily pharmacologic and are viewed as only moderately effective, limited by significant adverse effects (AEs) and drug interactions.5 Patients in the VHA at risk for amputation in low-, moderate-, and high-risk groups total 541,475 and 363,468 have a history of neuropathy. They are considered at risk due to multiple, documented factors, including weakness, callus, foot deformity, loss of protective sensation, and/or history of amputation.4 Neuropathy can affect tissues throughout the body, including organs, sensory neurons, cardiovascular status, the autonomic system, and the gastrointestinal tract as it progresses.
Individuals who develop DPN often experience severe, uncontrolled pain in the lower extremities, insensate feet, and decreased proprioceptive skills. The functional status of individuals with DPN often declines insidiously while mortality rate increases.6 Increased levels of neuropathic pain often lead to decreased activity levels, which, in turn, contribute to decreased endurance, poorly managed glycemic indexes, decreased strength, and decreased independence.
Additional DPN complications, such as decreased sensation and muscle atrophy in the lower extremities, often lead to foot deformity and increased areas of pressure during weight bearing postures. These areas of increased pressure may develop unknowingly into ulceration. If a patient’s wound becomes chronic and nonhealing, it can also lead to amputation. In such cases, early mortality may result.6,7 The cascading effects of neuropathic pain and decreased sensation place a patient with diabetes at risk for falls. Injuries from falls are widely known to be a leading cause of hospitalization and mortality in the elderly.8
Physical therapy may be prescribed for DPN and its resulting sequelae. Several studies present conflicting results regarding the benefits of therapeutic exercise in the treatment of DPN. Akbari and colleagues showed that balance exercises can increase stability in patients with DPN; whereas, a study by Kruse and colleagues noted a training program consisting of lower-extremity exercises, balance training, and walking resulted in minimal improvement of participants’ balance and leg strength over a 12-month period.9,10 Recent studies have shown that weight bearing does not increase ulceration in patients with diabetes and DPN. This is contrary to previous assumptions that patients with diabetes and DPN need to avoid weight-bearing activities.11,12
Transcutaneous electrical nerve stimulation (TENS), a modality often used in physical therapy, has been studied in the treatment of DPN with conflicting results. Gossrau and colleagues found that pain reduction with micro-TENS applied peripherally is not superior to a placebo.13 However, a case study by Somers and Somers indicated that TENS applied to the lumbar area seemed to reduce pain and insomnia associated with diabetic neuropathy.14
Several recent research studies suggest that MIRE, another available modality, may be effective in treating symptoms of DPN. Monochromatic infrared energy therapy is a noninvasive, drug-free, FDA-approved medical device that emits monochromatic near-infrared light to improve local circulation and decrease pain. A large study of 2,239 patients with DPN reported an increase in foot sensation and decreased neuropathic pain levels when treated with MIRE.15
Leonard and colleagues found that the MIRE treatments resulted in a significant increase in sensation in individuals with baseline sensation of 6.65 Semmes-Weinstein Monofilament (SWM) after 6 and 12 active treatments as well as a decrease in neuropathic symptoms as measured by the Michigan Neuropathy Screening Instrument.16 Prendergast and colleagues noted improved electrophysical changes in both large and small myelinated nerve fibers of patients with DPN following 10 MIRE treatments.17 When studying 49 patients with DPN, Kochman and colleagues found 100% of participants had improved sensation after 12 MIRE treatments when tested with monofilaments.18
An additional benefit of MIRE treatment is that it can be safely performed at home once the patient is educated on proper use and application. Home DPN treatment has the potential to decrease the burden this population places on health care systems by reducing provider visits, medication, hospitalization secondary to pain, ulceration, fall injuries, and amputations.
Methods
This was a prospective, case series pilot study designed to measure changes in patient pain levels using the visual analog scale (VAS) and Pain Outcomes Questionnaire-VA (POQ-VA), degree of protective sensation loss as measured by SWM, and fall risk as denoted by Tinetti scores from entry to 6 months. Informed consent was obtained prior to treatment, and 33 patients referred by primary care providers and specialty clinics met the criteria and enrolled in the study. Twenty-one patients completed the entire 6-month study. The nonparametric Friedman test with a Dunn’s multiple comparison (DMC) post hoc test was used to analyze the data from the initial, 4-week, 3-month, and 6-month follow-up visits.
Setting and Participants
The study was performed in the Outpatient Physical Therapy Department at WJBDVAMC. Veterans with DPN who met the inclusion/exclusion criteria were enrolled. Inclusion criteria specified that the participant must be referred by a qualified health care provider for the treatment of DPN, be able to read and write in English, have consistent transportation to and from the study location, and be able to apply MIRE therapy as directed at home.
Exclusion criteria were subjects for whom MIRE or exercise were contraindicated. Subjects were excluded if they had medical conditions that suggested a possible decline in health status in the next 6 months. Such conditions included a current regimen of chemotherapy, radiation therapy, or dialysis; recent lower extremity amputation without prosthesis; documented active alcohol and/or drug misuse; advanced chronic obstructive pulmonary disease as defined as dyspnea at rest at least once per day; unstable angina; hemiplegia or other lower extremity paralysis; and a history of central nervous system or peripheral nervous system demyelinating disorders. Additional exclusion criteria included hospitalization in the past 60 days, use of any apparatus for continuous or patient-controlled analgesia; history of chronic low back pain with documented radiculopathy; and any change in pertinent medications in the past 60 days, including pain medications, insulin, metformin, and anti-inflammatories.
Interventions
Subjects participated in a combined physical therapy approach using MIRE and a standardized balance program. Patients received treatment in the outpatient clinic 3 times each week for 4 weeks. The treatment then continued at the same frequency at home until the scheduled 6-month follow-up visit. Clinic and home treatments included application of MIRE to bilateral lower extremities and feet for 30 minutes each as well as performance of a therapeutic exercise program for balance.
In the clinic, 2 pads from the MIRE device (Anodyne Therapy, LLC, Tampa, FL) were placed along the medial and lateral aspect of each lower leg, and an additional 2 pads were placed in a T formation on the plantar surface of each foot, per the manufacturer’s recommendations. The T formation consisted of the first pad placed horizontally across the metatarsal heads and the second placed vertically down the length of the foot. Each pad was protected by plastic wrap to ensure proper hygiene and secured. The intensity of clinic treatments was set at 7 bars, which minimized the risk of burns. Home treatments were similar to those in the clinic, except that each leg had to be treated individually instead of simultaneously and home MIRE units are preset and only function at an intensity that is equivalent to around 7 bars on the clinical unit.
The standardized balance program consisted of a progression of the following exercises: ankle alphabet/ankle range of motion, standing lateral weight shifts, bilateral heel raises, bilateral toe raises, unilateral heel raises, unilateral toe raises, partial wall squats, and single leg stance. Each participant performed these exercises 3 times per week in the clinic and then 3 times per week at home following the 12th visit.
Outcomes and Follow-up
The POQ-VA, a subjective quality of life (QOL) measure for veterans, as well as VAS, SWM testing, and the Tinetti Gait and Balance Assessment scores were used to measure outcomes. Data were collected for each of these measures during the initial and 12th clinic visits and at the 3-month and 6-month follow-up visits. The POQ-VA and VAS scores were self-reported and filled out by each participant at the initial, 12th, 3-month, and 6-month visits. The POQ-VA score has proven to be reliable and valid for the assessment of noncancer, chronic pain in veterans.19 The VAS scores were measured using a scale of 0 to 10 cm.
The SWM was standardized, and 7 sites were tested on each foot during the initial, 12th, 3-month, and 6-month visits: plantar surface of the distal great toe, the distal 3rd toe, the distal 5th toe, the 1st metatarsal head, the 3rd metatarsal head, the 5th metatarsal head, and the mid-plantar arch. At each site, the SWM was applied with just enough force to initiate a bending force and held for 1.5 seconds. Each site was tested 3 times. Participants had to detect the monofilament at least twice for the monofilament value to be recorded. Monofilament testing began with 6.65 SWM and decreased to 5.07, 4.56, 4.32, and lower until the patient was no longer able to detect sensation.
The Tinetti Gait and Balance Assessments was performed on each participant at the initial, 12th, 3-month, and 6-month visits. Tinetti balance, gait, and total scores were recorded at each interval.
Results
Thirty-three patients, referred by primary care providers and specialty clinics, met the inclusion criteria and enrolled in the study. Twenty-one patients (20 men and 1 woman) completed the entire 6-month study. Causes for withdrawal included travel difficulties (5), did not show up for follow-up visits (4), lumbar radiculopathy (1), perceived minimal/no benefit (1), and unrelated death (1). No AEs were reported.
The Friedman test with DMC post hoc test was performed on the POQ-VA total score and subscale scores. The POQ-VA subscale scores were divided into the following domains: pain, activities of daily living (ADL), fear, negative affect, mobility, and vitality. The POQ-VA domains were analyzed to compare data from the initial, 12th, 3-month, and 6-month visits. The POQ-VA total score significantly decreased from the initial to the 12th visit (P < .01), from the initial to the 3-month (P < .01), and from the initial to the 6-month visit (P < .05). However, there was no significant change from the 12th visit to the 3-month follow-up, 12th visit to the 6-month follow-up, or the 3-month to 6-month follow-up.
The POQ-VA pain score decreased significantly from the initial to the 12th visit (P < .05) and from the initial to the 6-month visit (P < .05). However, there was no significant interval change from the initial to the 3-month, the 12th to 3-month, 12th to 6-month, or 3-month to 6-month visit (Figure 1). The POQ-VA vitality scores and POQ-VA fear scores did not yield significant changes. The POQ-VA negative affect scores showed significant improvement only between the initial and the 3-month visit (P < .05) (Figure 2). The POQ-VA ADL scores showed significant improvement in the initial vs 3-month score (P < .05). The POQ-VA mobility scores were significantly improved for the initial vs 12th visit (P < .01), initial vs 3-month visit (P < .01), and the initial vs 6-month visit (P < .001) (Figure 1).
Analysis of VAS scores revealed a significant decrease at the 6-month time frame compared with the initial score for the left foot (P < .05). Further VAS analysis revealed no significant difference between the initial and 6-month right foot VAS score. When both feet were compared together, there was no significant difference in VAS ratings between any 2 points in time.
Analysis of Tinetti Total Score, Tinetti Balance Score, and Tinetti Gait Score revealed a significant difference between the initial vs 3-month visit for all 3 scores (P < .001, P < .001, and P < .05, respectively). In addition, Tinetti Total (P < .001) and Tinetti Balance (P < .01) scores were significantly improved from initial to the final 6-month visit. There were no significant findings between interim scores of the initial and 12th visits, the 12th and 3-month visits, or the 3-month and 6-month scores (Figure 2).
Analysis of SWM testing indicated a significant decrease in the total number of insensate sites (> 5.07) when both feet were grouped together between the initial and 3-month visits (P < .05) as well as the initial and 6-month (P < .01) visits. When the left and right feet were compared independently of each other, there was a significant decrease in the number of insensate sites between the initial and 6-month visits (P < .01 for both) (Figure 3).
Discussion
This study investigated whether or not a multimodal physical therapy approach would reduce several of the debilitating symptoms of DPN experienced by many veterans at WJBDVAMC. The results support the idea that a combined treatment protocol of MIRE and a standardized exercise program can lead to decreased POQ-VA pain levels, improved balance, and improved protective sensation in veterans with DPN. Alleviation of these DPN complications may ultimately decrease an individual’s risk of injury and improve overall QOL.
Because the POQ-VA is a reliable, valid self-reported measure for veterans, it was chosen to quantify the impact of pain. Overall, veterans who participated in this study perceived decreased pain interference in multiple areas of their lives. The most significant findings were in overall QOL, household and community mobility, and pain ratings. This suggests that the combined treatment protocol will help veterans maintain an active lifestyle despite poorly controlled diabetes and neuropathic pain.
Along with decreased pain interference with QOL, participants demonstrated a decrease in fall risk as quantified by the Tinetti Gait and Balance Assessment. The SWM testing showed improved protective sensation as early as 3 months and continued through the 6-month visit. As protective sensation improves and fall risk decreases, the risk of injury is lessened, fear of falling is decreased, and individuals are less likely to self-impose limitations on daily activity levels, which improves QOL. In addition, decreased fall risk and improved protective sensation can reduce the financial burden on both the patient and the health care system. Many individuals are hospitalized secondary to fall injury, nonhealing wounds, resulting infections, and/or secondary complications from prolonged immobility. This treatment protocol demonstrates how a standardized physical therapy protocol, including MIRE and balance exercises, can be used preventively to reduce both the personal and financial impact of DPN.
It is interesting to note that some POQ-VA and Tinetti subscores were significantly improved at 3 months but not at 6 months. The significance achieved at 3 months may be due to the time required (ie, > 12 visits) to make significant physiological changes. The lack of significance at 6 months may be due to the natural tendency of participants to less consistently perform the home exercise program and MIRE protocol when unsupervised in the home. Differences in the VAS and POQ-VA pain score ratings were noted in the data. The POQ-VA pain rating scale indicated significant improvement in pain levels over the course of the study. However, when asked about pain using the 10-cm VAS, patients reported no significant improvements. This may be because veterans are more familiar with the numerical pain rating scale and are rarely asked to use the 10-cm VAS. It may also be because the POQ-VA pain rating asks for an average pain level over the previous week, whereas the 10-cm VAS asks for pain level at a discrete point in time.
Historically, physical therapy has had little to offer individuals with DPN. As a result of this study, however, a standardized treatment program for DPN has been implemented at the WJBDVAMC Physical Therapy Clinic. Referred patients are seen in the clinic on a trial basis. If positive results are documented during the clinic treatments, a home MIRE unit and exercise program are provided. The patients are expected to continue performing home treatments of MIRE and exercise 3 times a week after discharge.
Strengths and Limitations
Strengths of the study include a stringent IRB review, control of medication changes during the study through alerts to all VA providers, and a standardized MIRE and exercise protocol. An additional strength is the long duration of the study, which included supervised and unsupervised interventions that simulate real-life scenarios.
Limitations of the study include a small sample size, case-controlled design rather than a randomized, double-blinded study, which can contribute to selection bias, inability to differentiate between the benefits of physical therapy alone vs physical therapy and MIRE treatments, and retention of participants due to travel difficulties across a wide catchment area.
This pilot study should be expanded to a multicenter, randomized, double-blinded study to clarify the most beneficial treatments for individuals with diabetic neuropathy. Examining the number of documented falls pre- and postintervention may also be helpful to determine actual effects on an individual’s fall risk.
Conclusion
The use of a multimodal physical therapy approach seems to be effective in reducing the impact of neuropathic pain, the risk of amputation, and the risk of falls in individuals who have pursued all standard medical options but still experience the long-term effects of DPN. By adhering to a standardized treatment protocol of MIRE and therapeutic exercise, it seems that the benefits of this intervention can be maintained over time. This offers new, nonconventional treatment options in the field of physical therapy for veterans whose QOL is negatively impacted by the devastating effects of diabetic neuropathy.
Acknowledgements
Clinical support was provided by David Metzelfeld, DPT, and Cam Lendrim, PTA of William Jennings Bryan Dorn VA Medical Center. Paul Bartels, PhD, of Warren Wilson College provided data analysis support. Anodyne Therapy, LLC, provided the MIRE unit used in the clinic.
Author disclosures
The authors report no actual or potential conflicts of interest with regard to this article.
Disclaimer
The opinions expressed herein are those of the authors and do not necessarily reflect those of Federal Practitioner, Frontline Medical Communications Inc., the U.S. Government, or any of its agencies. This article may discuss unlabeled or investigational use of certain drugs. Please review complete prescribing information for specific drugs or drug combinations—including indications, contraindications, warnings, and adverse effects—before administering pharmacologic therapy to patients.
1. National Institute of Neurological Disorders and Stroke. Peripheral neuropathy fact sheet. National Institute of Neurological Disorders and Stroke Website. http://www.ninds.nih.gov/disorders/peripheralneuropath/detail_peripheralneuropathy.htm#183583208. Updated April 17, 2015. Accesssed August 8, 2015.
2. Armstrong DG, Lavery LA, and Wunderlich RP. Risk factors for diabetic foot ulceration: a logical approach to treatment. J Wound Ostomy Continence Nurs. 1998;25(3):123-128.
3. Pesa J, Meyer R, Quock T, Rattana SK, Mody SH. MBA Opioid utilization patterns among medicare patients with diabetic peripheral neuropathy. Am Health Drug Benefits. 2013;6(4):188-196.
4. VHA Support Service Center. The amputation risk by facility in the ProClarity amputation risk (PAVE) cube. Department of Veterans Affairs Nonpublic Intranet. http://vssc.med.va.gov.
5. Gore M, Brandenburg NA, Hoffman DL, Tai KS, Stacey B. Burden of illness in painful diabetic peripheral neuropathy: the patients’ perspectives. J Pain. 2006;7(12):892-900
6. Tentolouris N, Al-Sabbagh S, Walker MG, Boulton AJ, Jude EB. Mortality in diabetic and nondiabetic patients after amputations performed from 1990 to 1995: a 5-year follow-up study. Diabetes Care. 2004;27(7):1598-1604.
7. Boyko EJ, Ahroni JH, Stensel V, Forsberg RC, Davignon DR, Smith DG. A prospective study of risk factors for diabetic foot ulcer. The Seattle Diabetic Foot Study. Diabetes Care. 1999;22(7):1036-1042.
8. Centers for Disease Control and Prevention. Older adults falls: get the facts. Centers for Disease Control and Prevention Website. http://www.cdc.gov/HomeandRecreationalSafety/Falls/adultfalls.html. Updated July 1, 2015. Accessed August 8, 2015.
9. Akbari M, Jafari H, Moshashaee A, Forugh B. Do diabetic neuropathy patients benefit from balance training? J Rehabil Res Dev. 2012;49(2):333-338.
10. Kruse RL, Lemaster JW, Madsen RW. Fall and balance outcomes after an intervention to promote leg strength, balance, and walking in people with diabetic peripheral neuropathy: “feet first” randomized controlled trial. Phys Ther. 2010;90(11):1568-1579.
11. Lemaster JW, Mueller MJ, Reiber GE, Mehr DR, Madsen RW, Conn VS. Effect of weight-bearing activity on foot ulcer incidence in people with diabetic peripheral neuropathy: feet first randomized controlled trial. Phys Ther. 2008;88(11):1385-1398.
12. Tuttle LG, Hastings MK, and Mueller MJ. A moderate-intensity weight-bearing exercise program for a person with type 2 diabetes and peripheral neuropathy. Phys Ther. 2012;92(1):133-141.
13. Gossrau G, Wähner M, Kuschke M, et al. Microcurrent transcutaneous electric nerve stimulation in painful diabetic neuropathy: a randomized placebo-controlled study. Pain Med. 2011;12(6):953-960.
14. Somers DL, Somers MF. Treatment of neuropathic pain in a patient with diabetic neuropathy using transcutaneous electrical nerve stimulation applied to the skin of the lumbar region. Phys Ther. 1999;79(8):767-775.
15. Harkless LB, DeLellis S, Carnegie DH, Burke TJ. Improved foot sensitivity and pain reduction in patients with peripheral neuropathy after treatment with monochromatic infrared photo energy—MIRE. J Diabetes Complications. 2006;20(2):81-87.
16. Leonard DR, Farooqi MH, Myers S. Restoration of sensation, reduced pain, and improved balance in subjects with diabetic peripheral neuropathy: a double-blind, randomized, placebo-controlled study with monochromatic near-infrared treatment. Diabetes Care. 2004;27(1):168-172.
17. Prendergast JJ, Miranda G, Sanchez M. Improvement of sensory impairment in patients with peripheral neuropathy. Endocr Pract. 2004;10(1):24-30.
18. Kochman AB, Carnegie DH, Burke TJ. Symptomatic reversal of peripheral neuropathy in patients with diabetes. J Am Podiatr Med Assoc. 2002;92(3):125-130.
19. Clark ME, Gironda RJ, Young RW. Development and validation of the Pain Outcomes Questionnaire-VA. J Rehabil Res Dev. 2003;40(5):381-395.
Two‐Item Bedside Test for Delirium
Delirium (acute confusion) is common in older adults and leads to poor outcomes, such as death, clinician and caregiver burden, and prolonged cognitive and functional decline.[1, 2, 3, 4] Delirium is extremely costly, with estimates ranging from $143 to $152 billion annually (2005 US$).[5, 6] Early detection and management may improve the poor outcomes and reduce costs attributable to delirium,[3, 7] yet delirium identification in clinical practice has been challenging, particularly when translating research tools to the bedside.[8, 9, 10]As a result, only 12% to 35% of delirium cases are detected in routine care, with hypoactive delirium and delirium superimposed on dementia most likely to be missed.[11, 12, 13, 14, 15]
To address these issues, we recently developed and published the three‐dimensional Confusion Assessment Method (3D‐CAM), the 3‐minute diagnostic assessment for CAM‐defined delirium.[16] The 3D‐CAM is a structured assessment tool that includes mental status testing, patient symptom probes, and guided interviewer observations for signs of delirium. 3D‐CAM items were selected through a rigorous process to determine the most informative items for the 4 CAM diagnostic features.[17] The 3D‐CAM can be completed in 3 minutes, and has 95% sensitivity and 94% specificity relative to a reference standard.[16]
Despite the capabilities of the 3D‐CAM, there are situations when even 3 minutes is too long to devote to delirium identification. Moreover, a 2‐step approach in which a sensitive ultrabrief screen is administered, followed by the 3D‐CAM in positives, may be the most efficient approach for large‐scale delirium case identification. The aim of the current study was to use the 3D‐CAM database to identify the most sensitive single item and pair of items in the diagnosis of delirium, using the reference standard in the diagnostic accuracy analysis. We hypothesized that we could identify a single item with greater than 80% sensitivity and a pair of items with greater than 90% sensitivity for detection of delirium.
METHODS
Study Sample and Design
We analyzed data from the 3D‐CAM validation study,[16] which prospectively enrolled participants from a large urban teaching hospital in Boston, Massachusetts, using a consecutive enrollment sampling strategy. Inclusion criteria were: (1) 75 years old, (2) admitted to general or geriatric medicine services, (3) able to communicate in English, (4) without terminal conditions, (5) expected hospital stay of 2 days, (6) not a previous study participant. Experienced clinicians screened patients for eligibility. If the patient lacked capacity to provide consent, the designated surrogate decision maker was contacted. The study was approved by the institutional review board.
Reference Standard Delirium Diagnosis
The reference standard delirium diagnosis was based on an extensive (45 minutes) face‐to‐face patient interview by experienced clinician assessors (neuropsychologists or advanced practice nurses), medical record review, and input from the nurse and family members. This comprehensive assessment included: (1) reason for hospital admission, hospital course, and presence of cognitive concerns, (2) family, social, and functional history, (3) Montreal Cognitive Assessment,[18] (4) Geriatric Depression Scale,[19] (5) medical record review including scoring of comorbidities using the Charlson index,[20] determination of functional status using the basic and Instrumental Activities of Daily Living,[21, 22] psychoactive medications administered, and (6) a family member interview to assess the patient's baseline cognitive status that included the Eight‐Item Interview to Differentiate Aging and Dementia,[23] to assess the presence of dementia. Using all of these data, an expert panel, including the clinical assessor, the study principal investigator (E.R.M.), a geriatrician, and an experienced neuropsychologist, adjudicated the final delirium diagnoses using Diagnostic and Statistical Manual of Mental Disorders, 4th Edition (DSM‐IV) criteria. The panel also adjudicated for the presence or absence of dementia and mild cognitive impairment based on National Institute on Aging‐Alzheimer's Association (NIA‐AA) criteria.[24] This approach has been used in other delirium studies.[25]
3D‐CAM Assessments
After the reference standard assessment, the 3D‐CAM was administered by trained research assistants (RAs) who were blinded to the results of the reference standard. To reduce the likelihood of fluctuations or temporal changes, all assessments were completed between 11:00 am and 2:00 pm and for each participant, within a 2‐hour time period (for example, 11:23 am to 1:23 pm).
Statistical Analyses to Determine the Best Single‐ and Two‐Item Screeners
To determine the best single 3D‐CAM item to identify delirium, the responses of the 20 individual items in the 3D‐CAM (see Supporting Table 1 in the online version of this article) were compared to the reference standard to determine their sensitivity and specificity. Similarly, an algorithm was used to generate all unique 2‐item combinations of the 20 items (190 unique pairs), which were compared to the reference. An error, no response, or an answer of I do not know by the patient was considered a positive screen for delirium. The 2‐item screeners were considered positive if 1 or both of the items were positive. Sensitivity and specificity were calculated along with 95% confidence intervals (CIs).
Subset analyses were performed to determine sensitivity and specificity of individual items and pairs of items stratified by the patient's baseline cognitive status. Two strata were createdpatients with dementia (N=56), and patients with normal baseline cognitive status or mild cognitive impairment (MCI) (N=145). We chose to group MCI with normal for 2 reasons: (1) dementia is a well‐established and strong risk factor for delirium, whereas the evidence for MCI being a risk factor for delirium is less established and (2) to achieve adequate allocation of delirious cases in both strata. Last, we report the sensitivity of altered level of consciousness (LOC), which included lethargy, stupor, coma, and hypervigilance as a single screening item for delirium in the overall sample and by cognitive status. Analyses were conducted using commercially available software (SAS version 9.3; SAS Institute, Inc., Cary, NC).
RESULTS
Characteristics of the patients are shown in Table 1. Subjects had a mean age of 84 years, 62% were female, and 28% had a baseline dementia. Forty‐two (21%) had delirium based on the clinical reference standard. Twenty (10%) had less than a high school education and 100 (49%) had at least a college education.
| Characteristic | N (%) |
|---|---|
| |
| Age, y, mean (SD) | 84 (5.4) |
| Sex, n (%) female | 125 (62) |
| White, n (%) | 177 (88) |
| Education, n (%) | |
| Less than high school | 20 (10) |
| High school graduate | 75 (38) |
| College plus | 100 (49) |
| Vision interfered with interview, n (%) | 5 (2) |
| Hearing interfered with interview, n (%) | 18 (9) |
| English second language n (%) | 10 (5) |
| Charlson, mean (SD) | 3 (2.3) |
| ADL, n (% impaired) | 110 (55) |
| IADL, n (% impaired) | 163 (81) |
| MCI, n (%) | 50 (25) |
| Dementia, n (%) | 56 (28) |
| Delirium, n (%) | 42 (21) |
| MoCA, mean (SD) | 19 (6.6) |
| MoCA, median (range) | 20 (030) |
Single Item Screens
Table 2 reports the results of single‐item screens for delirium with sensitivity, the ability to correctly identify delirium when it is present by the reference standard, and specificity, the ability to correctly identify patients without delirium when it is not present by reference standard and 95% CIs. Items are listed in descending order of sensitivity; in the case of ties, the item with the higher specificity is listed first. The screening items with the highest sensitivity for delirium are Months of the year backwards, and Four digits backwards, both with a sensitivity of 83% (95% CI: 69%‐93%). Of these 2 items, Months of the year backwards had a much better specificity of 69% (95% CI: 61%‐76%), whereas Four digits backwards had a specificity of 52% (95% CI: 44%‐60%). The item What is the day of the week? had lower sensitivity at 71% (95% CI: 55%‐84%), but excellent specificity at 92% (95% CI: 87%‐96%).
| Screen Item | Screen Positive (%)c | Sensitivity (95% CI) | Specificity (95% CI) | LR | LR |
|---|---|---|---|---|---|
| |||||
| Months of the year backwards | 42 | 0.83 (0.69‐0.93) | 0.69 (0.61‐0.76) | 2.7 | 0.24 |
| Four digits backwards | 56 | 0.83 (0.69‐0.93) | 0.52 (0.44‐0.60) | 1.72 | 0.32 |
| What is the day of the week? | 21 | 0.71 (0.55‐0.84) | 0.92 (0.87‐0.96) | 9.46 | 0.31 |
| What is the year? | 16 | 0.55 (0.39‐0.70) | 0.94 (0.9‐0.97) | 9.67 | 0.48 |
| Have you felt confused during the past day? | 14 | 0.50 (0.34‐0.66) | 0.95 (0.9‐0.98) | 9.94 | 0.53 |
| Days of the week backwards | 15 | 0.50 (0.34‐0.66) | 0.94 (0.89‐0.97) | 7.95 | 0.53 |
| During the past day, did you see things that were not really there? | 11 | 0.45 (0.3‐0.61) | 0.97 (0.94‐0.99) | 17.98 | 0.56 |
| Three digits backwards | 15 | 0.45 (0.3‐0.61) | 0.92 (0.87‐0.96) | 5.99 | 0.59 |
| What type of place is this? | 9 | 0.38 (0.24‐0.54) | 0.99 (0.96‐1) | 30.29 | 0.63 |
| During the past day, did you think you were not in the hospital? | 10 | 0.38 (0.24‐0.54) | 0.97 (0.94‐0.99) | 15.14 | 0.64 |
We then examined performance of single‐item screeners in patients with and without dementia (Table 3). In persons with dementia, the best single item was also Months of the year backwards, with a sensitivity of 89% (95% CI: 72%‐98%) and a specificity of 61% (95% CI: 41%‐78%). In persons with normal baseline cognition or MCI, the best performing single item was Four digits backwards, with sensitivity of 79% (95% CI: 49%‐95%) and specificity of 51% (95% CI: 42%‐60%). Months of the year backwards also performed well, with sensitivity of 71% (95% CI: 42%‐92%) and specificity of 71% (95% CI: 62%‐79%).
| Test Item | Normal/MCI Patients (n=145) | Dementia Patients (n=56) | ||||||||
|---|---|---|---|---|---|---|---|---|---|---|
| Screen Positive (%)b | Sensitivity (95% CI) | Specificity (95% CI) | LR | LR | Screen Positive (%)b | Sensitivity (95% CI) | Specificity (95% CI) | LR | LR | |
| ||||||||||
| Months backwards | 33 | 0.71 (0.42‐0.92) | 0.71 (0.62‐0.79) | 2.46 | 0.4 | 64 | 0.89 (0.72‐0.98) | 0.61 (0.41‐0.78) | 2.27 | 0.18 |
| Four digits backwards | 52 | 0.79 (0.49‐0.95) | 0.51 (0.42‐0.60) | 1.61 | 0.42 | 66 | 0.86 (0.67‐0.96) | 0.54 (0.34‐0.72) | 1.85 | 0.27 |
| What is the day of the week? | 10 | 0.64 (0.35‐0.87) | 0.96 (0.91‐0.99) | 16.84 | 0.37 | 50 | 0.75 (0.55‐0.89) | 0.75 (0.55‐0.89) | 3 | 0.33 |
Two‐Item Screens
Table 4 reports the results of 2‐item screens for delirium with sensitivity, specificity, and 95% CIs. Item pairs are listed in descending order of sensitivity following the same convention as in Table 2. The 2‐item screen with the highest sensitivity for delirium is the combination of What is the day of the week? and Months of the year backwards, with a sensitivity of 93% (95% CI: 81%‐99%) and specificity of 64% (95% CI: 56%‐70%). This screen had a positive and negative likelihood ratio (LR) of 2.59 and 0.11, respectively. The combination of What is the day of the week? and Four digits backwards had the same sensitivity 93% (95% CI: 81%‐99%), but lower specificity of 48% (95% CI: 40%‐56%). The combination of What type of place is this? (hospital) and Four digits backwards had a sensitivity of 90% (95% CI: 77%‐97%) and specificity of 51% (95% CI: 43%‐50%).
| Screen Item 1 | Screen Item 2 | Screen Positive (%)c | Sensitivity (95% CI) | Specificity (95% CI) | LR | LR |
|---|---|---|---|---|---|---|
| ||||||
| What is the day of the week? | Months backwards | 48 | 0.93 (0.81‐0.99) | 0.64 (0.56‐0.70) | 2.59 | 0.11 |
| What is the day of the week? | Four digits backwards | 60 | 0.93 (0.81‐0.99) | 0.48 (0.4‐0.56) | 1.8 | 0.15 |
| Four digits backwards | Months backwards | 65 | 0.93 (0.81‐0.99) | 0.42 (0.34‐0.50) | 1.6 | 0.17 |
| What type of place is this? | Four digits backwards | 58 | 0.90 (0.77‐0.97) | 0.51 (0.43‐0.50) | 1.84 | 0.19 |
| What is the year? | Four digits backwards | 59 | 0.9 (0.77‐0.97) | 0.5 (0.42‐0.5) | 1.80 | 0.19 |
| What is the day of the week? | Three digits backwards | 30 | 0.88 (0.74‐0.96) | 0.86 (0.79‐0.90) | 6.09 | 0.14 |
| What is the year? | Months backwards | 44 | 0.88 (0.74‐0.96) | 0.68 (0.6‐0.75) | 2.75 | 0.18 |
| What type of place is this? | Months backwards | 43 | 0.86 (0.71‐0.95) | 0.69 (0.61‐0.70) | 2.73 | 0.21 |
| During the past day, did you think you were not in the hospital? | Months backwards | 43 | 0.86 (0.71‐0.95) | 0.69 (0.61‐0.70) | 2.73 | 0.21 |
| Days of the week backwards | Months backwards | 43 | 0.86 (0.71‐0.95) | 0.68 (0.6‐0.75) | 2.67 | 0.21 |
When subjects were stratified by baseline cognition, the best 2‐item screens for normal and MCI patients was What is the day of the week? and Four digits backwards, with 93% sensitivity (95% CI: 66%‐100%) and 50% specificity (95% CI: 42%‐59%). The best pair of items for patients with dementia (Table 5) was the same as the overall sample, What is the day of the week? and Months of the year backwards, but its performance differed with a higher sensitivity of 96% (95% CI: 82%‐100%) and lower specificity of 43% (95% CI: 24%‐63%). This same pair of items had 86% sensitivity (95% CI: 57%‐98%) and 69% (95% CI: 60%‐77%) specificity for persons with either normal cognition or MCI.
| Test Item 1 | Test Item 2 | Normal/MCI Patients (n=145) | Dementia Patients (n=56) | ||||||||
|---|---|---|---|---|---|---|---|---|---|---|---|
| Item Positive (%)b | Sensitivity (95% CI) | Specificity (95% CI) | LR | LR | Item Positive (%)b | Sensitivity (95% CI) | Specificity (95% CI) | LR | LR | ||
| |||||||||||
| What is the day of the week? | Months backwards | 36 | 0.86 (0.57‐0.98) | 0.69 (0.60‐0.77) | 2.74 | 0.21 | 77 | 0.96 (0.82‐1) | 0.43 (0.24‐0.63) | 1.69 | 0.08 |
| What is the day of the week? | Four digits backwards | 54 | 0.93 (0.66‐1) | 0.5 (0.42‐0.59) | 1.87 | 0.14 | 77 | 0.93 (0.76‐0.99) | 0.39 (0.22‐0.59) | 1.53 | 0.18 |
| Four digits backwards | Months backwards | 61 | 0.93 (0.66‐1) | 0.43 (0.34‐0.52) | 1.62 | 0.17 | 77 | 0.93 (0.76‐0.99) | 0.39 (0.22‐0.59) | 1.53 | 0.18 |
Altered Level of Consciousness as a Screener for Delirium
Altered level of consciousness (ALOC) was uncommon in our sample, with an overall prevalence of 10/201 (4.9%). When examined as a screening item for delirium, ALOC had very poor sensitivity of 19% (95% CI: 9%‐34%) but had excellent specificity 99% (95% CI: 96%‐100%). Altered LOC also demonstrated poor screening performance when stratified by cognitive status, with a sensitivity of 14% in the normal and MCI group (95% CI: 2%‐43%) and sensitivity of 21% (95% CI: 8%‐41%) in persons with dementia.
Positive and Negative Predictive Values
Although we focused on sensitivity and specificity in evaluating 1‐ and 2‐item screeners, we also examined positive and negative predictive values. These values will vary depending on the overall prevalence of delirium, which was 21% in this dataset. The best 1‐item screener, Months of the year backwards, had a positive predictive value of 31% and negative predictive value of 94%. The best 2‐item screener, Months of the year backwards with What is the day of the week?, had a positive predictive value of 41% and negative predictive value of 97% (see Supporting Tables 2 and 3 in the online version of this article) LRs for the items are in Tables 2 through 5.
DISCUSSION
Identifying simple, efficient, bedside case‐identification methods for delirium is an essential step toward improving recognition of this highly morbid syndrome in hospitalized older adults. In this study, we identified a single cognitive item, Months of the year backwards, that identified 83% of delirium cases when compared with a reference standard diagnosis. Furthermore, we identified 2 items, Months of the year backwards and What is the day of the week? which when used in combination identified 93% of delirium cases. The same 1 and 2 items also worked well in patients with dementia, in whom delirium is often missed. Although these items require further clinical validation, the development of an ultrabrief 2‐item test that identifies over 90% of delirium cases and can be completed in less than 1 minute (recently, we administered the best 2‐item screener to 20 consecutive general medicine patients over age 70 years, and it was completed in a median of 36.5 seconds), holds great potential for simplifying bedside delirium screening and improving the care of hospitalized older adults.
Our current findings both confirm and extend the emerging literature on best screening items for delirium. Sands and colleagues (2010)[26] tested a single test for delirium, Do you think (name of patient) has been more confused lately? in 21 subjects and achieved a sensitivity of 80%. Han and colleagues developed a screening tool in emergency‐department patients using the LOC question from the Richmond Agitation‐Sedation Scale and spelling the word lunch backwards, and achieved 98% sensitivity, but in a younger emergency department population with a low prevalence of dementia.[27] O'Regan et al. recently also found Months of the year backwards to be the best single‐screening item for delirium in a large sample, but only tested a 1‐item screen.[28] Our study extends these studies in several important ways by: (1) employing a rigorous clinical reference standard diagnosis of delirium, (2) having a large sample with a high prevalence of patients with dementia, (3) use of a general medical population, and (4) examining the best 2‐item screens in addition to the best single item.
Systematic intervention programs[29, 30, 31] that focus on improved delirium evaluation and management have the potential to improve patient outcomes and reduce costs. However, targeting these programs to patients with delirium has proven difficult, as only 12% to 35% of delirium cases are recognized in routine clinical practice.[11, 12, 13, 14, 15] The 1‐ and 2‐item screeners we identified could play an important role in future delirium identification. The 3D‐CAM combines high sensitivity (95%) with high specificity (94%)[16] and therefore would be an excellent choice as the second step after a positive screen. The feasibility, effectiveness, and cost of administering these screeners, followed by a brief diagnostic tool such as the 3D‐CAM, should be evaluated in future work.
Our study has noteworthy strengths, including the use of a large purposefully challenging clinical sample with advanced age that included a substantial proportion with dementia, a detailed assessment, and the testing of very brief and practical tools for bedside delirium screening.[25] This study also has several important limitations. Most importantly, we presented secondary analysis of individual items and pairs of items drawn from the 3D CAM assessment; therefore, the 2‐item bedside screen requires prospective clinical validation. The reference standard was based on the DSM‐IV, because this study was conducted prior to the release of DSM‐V. In addition, the ordering of the reference standard and 3D‐CAM assessments was not randomized due to feasibility constraints. In addition, this study was cross‐sectional, involved only a single hospital, and enrolled only older medical patients during the day shift. Our sample was older (aged 75 years and older), and a younger sample may have had a different prevalence of delirium, which could affect the positive predictive value of our ultrabrief screen. We plan to test this in a sample of patients aged 70 years and older in future studies. Finally, it should be noted that these best 1‐item and 2‐item screeners miss 17% and 7% of delirium cases, respectively. In cases where this is unacceptably high, alternative approaches might be necessary.
It is important to remember that these 1‐ and 2‐item screeners are not diagnostic tools and therefore should not be used in isolation. Optimally, they will be followed by a more specific evaluation, such as the 3D‐CAM, as part of a systematic delirium identification process. For instance, in our sample (with a delirium rate of 21%), the best 2‐item screener had a positive predictive value of 41%, meaning that positive screens are more likely to be false positives than true positives (see Supporting Tables 2 and 3 in the online version of this article).[32] Nevertheless, by reducing the total number of patients who require diagnostic instrument administration, use of these ultrabrief screeners can improve efficiency and result in a net benefit to delirium case‐identification efforts.[32]
Time has been demonstrated to be a barrier to delirium identification in previous studies, but there are likely others. These may include, for instance, staff nihilism about screening making a difference, ambiguous responsibility for delirium screening and management, unsupportive system leadership, and absent payment for these activities.[31] Moreover, it is possible that the 2‐step process we propose may create an incentive for staff to avoid positive screens as they see it creating more work for themselves. We plan to identify and address such barriers in our future work.
In conclusion, we identified a single screening item for delirium, Months of the year backwards, with 83% sensitivity, and a pair of items, Months of the year backwards and What is the day of the week?, with 93% sensitivity relative to a rigorous reference standard diagnosis. These ultrabrief screening items work well in patients with and without dementia, and should require very little training of staff. Future studies should further validate these tools, and determine their translatability and scalability into programs for systematic, widespread delirium detection. Developing efficient and accurate case identification strategies is a necessary prerequisite to appropriately target delirium management protocols, enabling healthcare systems to effectively address this costly and deadly condition.
Disclosures
Author contributionsD.M.F. conceived the study idea, participated in its design and coordination, and drafted the initial manuscript. S.K.I. contributed to the study design and conceptualization, supervision, funding, preliminary analysis, and interpretation of the data, and critical revision of the manuscript. J.G. conducted the analysis for the study and critically revised the manuscript. L.N. supervised the analysis for the study and critically revised the manuscript. R.J. contributed to the study design and critical revision of the manuscript. J.S.S. critically revised the manuscript. E.R.M. obtained funding for the study, supervised all data collection, assisted in drafting and critically revising the manuscript, and contributed to the conceptualization, design, and supervision of the study. All authors have seen and agree with the contents of the manuscript.
This work was supported by the National Institute of Aging grant number R01AG030618 and K24AG035075 to Dr. Marcantonio. Dr. Inouye's time was supported in part by grants P01AG031720, R01AG044518, and K07AG041835 from the National Institute on Aging. Dr. Inouye holds the Milton and Shirley F. Levy Family Chair (Hebrew Senior Life/Harvard Medical School). Dr. Fick is partially supported from National Institute of Nursing Research grant number R01 NR011042. Dr. Saczynski was supported in part by funding from the National Institute on Aging (K01AG33643) and from the National Heart Lung and Blood Institute (U01HL105268). The funding agencies had no role and the authors retained full autonomy in the preparation of this article. All authors and coauthors have no financial or nonfinancial conflicts of interest to disclose regarding this article.
This article was presented at the Presidential Poster Session at the American Geriatrics Society 2014 Annual Meeting in Orlando, Florida, May 14, 2014.
- , , , , , Delirium in elderly patients and the risk of postdischarge mortality, institutionalization, and dementia: a meta‐analysis. JAMA. 2010;304(4):443–451.
- , , , et al. Cognitive trajectories after postoperative delirium. N Engl J Med. 2012;367(1):30–39.
- , , Delirium in elderly people. Lancet. 2014;383:911–922.
- , , , Delirium superimposed on dementia is associated with prolonged length of stay and poor outcomes in hospitalized older adults. J Hosp Med. 2013;8(9):500–505.
- , , , , One‐year health care costs associated with delirium in the elderly population. Arch Intern Med. 2008;168(1):27–32.
- , The importance of delirium: Economic and societal costs. J Am Geriatr Soc. 2011;59(suppl 2):S241–S243.
- Delirium. Ann Intern Med. 2011;154(11):ITC6.
- , , , , , Fostering implementation of health services research findings into practice: a consolidated framework for advancing implementation science. Implement Sci. 2009;4:50.
- , , , Mixed‐methods approach to understanding nurses' clinical reasoning in recognizing delirium in hospitalized older adults. J Contin Educ Nurs. 2014;45:1–13.
- , , Educational interventions to improve recognition of delirium: a systematic review. J Am Geriatr Soc. 2013;61(11):1983–1993.
- , Delirium superimposed on dementia: accuracy of nurse documentation. J Gerontol Nurs. 2012;38(1):32–42.
- , , , et al. Detection of delirium by bedside nurses using the confusion assessment method. J Am Geriatr Soc. 2006;54:685–689.
- , , , et al. Documentation of delirium in elderly patients with hip fracture. J Gerontol Nurs. 2002;28(11):23–29.
- , , , Recorded delirium in a national sample of elderly inpatients: potential implications for recognition. J Geriatr Psychiatry Neurol. 2003;16(1):32–38.
- , , , et al. A tale of two methods: chart and interview methods for identifying delirium. J Am Geriatr Soc. 2014;62(3):518–524.
- , , , et al. 3D‐CAM: Derivation and validation of a 3‐minute diagnostic interview for CAM‐defined delirium: a cross‐sectional diagnostic test study. Ann Intern Med. 2014;161(8):554–561.
- , , , et al. Selecting optimal screening items for delirium: an application of item response theory. BMC Med Res Methodol. 2013;13:8.
- , , , et al. The Montreal Cognitive Assessment, MoCA: a brief screening tool for mild cognitive impairment. J Am Geriatr Soc. 2005;53(4):695–699.
- Geriatric Depression Scale. Psychopharmacol Bull. 1988;24(4):709–711.
- , , , A new method of classifying prognostic comorbidity in longitudinal studies: development and validation. J Chronic Dis. 1987;40(5):373–383.
- , , , , Studies of illness in the aged: the index of ADL: a standardized measure of biological and psychosocial function. JAMA. 1963;185:914–919.
- , Assessment of older people: self‐maintaining and instrumental activities of daily living. Gerontologist. 1969;9(3):179–186.
- , , , et al. The AD8: a brief informant interview to detect dementia. Neurology. 2005;65(4):559–564.
- , , , et al. The diagnosis of dementia due to Alzheimer's disease: recommendations from the National Institute on Aging‐Alzheimer's Association workgroups on diagnostic guidelines for Alzheimer's disease. Alzheimers Dement. 2011;7(3):263–269.
- , , , et al. Delirium diagnosis methodology used in research: a survey‐based study. Am J Geriatr Psychiatry. 2014;22(12):1513–1521.
- , , , , Single Question in Delirium (SQiD): testing its efficacy against psychiatrist interview, the Confusion Assessment Method and the Memorial Delirium Assessment Scale. Palliat Med. 2010;24(6):561–565.
- , , , et al. Diagnosing delirium in older emergency department patients: validity and reliability of the delirium triage screen and the brief confusion assessment method. Ann Emerg Med. 2013;62(5):457–465.
- , , , et al. Attention! A good bedside test for delirium? J Neurol Neurosurg Psychiatry. 2014;85(10):1122–1131.
- , , , , A model for management of delirious postacute care patients. J Am Geriatr Soc. 2005;53(10):1817–1825.
- , , , Computerized decision support for delirium superimposed on dementia in older adults: a pilot study. J Gerontol Nurs. 2011;37(4):39–47.
- , , , et al. Barriers and facilitators to implementing delirium rounds in a clinical trial across three diverse hospital settings. Clin Nurs Res. 2014;23(2):201–215.
- , Antecedent probability and the efficiency of psychometric signs, patterns, or cutting scores. Psychol Bull. 1955;52(3):194.
Delirium (acute confusion) is common in older adults and leads to poor outcomes, such as death, clinician and caregiver burden, and prolonged cognitive and functional decline.[1, 2, 3, 4] Delirium is extremely costly, with estimates ranging from $143 to $152 billion annually (2005 US$).[5, 6] Early detection and management may improve the poor outcomes and reduce costs attributable to delirium,[3, 7] yet delirium identification in clinical practice has been challenging, particularly when translating research tools to the bedside.[8, 9, 10]As a result, only 12% to 35% of delirium cases are detected in routine care, with hypoactive delirium and delirium superimposed on dementia most likely to be missed.[11, 12, 13, 14, 15]
To address these issues, we recently developed and published the three‐dimensional Confusion Assessment Method (3D‐CAM), the 3‐minute diagnostic assessment for CAM‐defined delirium.[16] The 3D‐CAM is a structured assessment tool that includes mental status testing, patient symptom probes, and guided interviewer observations for signs of delirium. 3D‐CAM items were selected through a rigorous process to determine the most informative items for the 4 CAM diagnostic features.[17] The 3D‐CAM can be completed in 3 minutes, and has 95% sensitivity and 94% specificity relative to a reference standard.[16]
Despite the capabilities of the 3D‐CAM, there are situations when even 3 minutes is too long to devote to delirium identification. Moreover, a 2‐step approach in which a sensitive ultrabrief screen is administered, followed by the 3D‐CAM in positives, may be the most efficient approach for large‐scale delirium case identification. The aim of the current study was to use the 3D‐CAM database to identify the most sensitive single item and pair of items in the diagnosis of delirium, using the reference standard in the diagnostic accuracy analysis. We hypothesized that we could identify a single item with greater than 80% sensitivity and a pair of items with greater than 90% sensitivity for detection of delirium.
METHODS
Study Sample and Design
We analyzed data from the 3D‐CAM validation study,[16] which prospectively enrolled participants from a large urban teaching hospital in Boston, Massachusetts, using a consecutive enrollment sampling strategy. Inclusion criteria were: (1) 75 years old, (2) admitted to general or geriatric medicine services, (3) able to communicate in English, (4) without terminal conditions, (5) expected hospital stay of 2 days, (6) not a previous study participant. Experienced clinicians screened patients for eligibility. If the patient lacked capacity to provide consent, the designated surrogate decision maker was contacted. The study was approved by the institutional review board.
Reference Standard Delirium Diagnosis
The reference standard delirium diagnosis was based on an extensive (45 minutes) face‐to‐face patient interview by experienced clinician assessors (neuropsychologists or advanced practice nurses), medical record review, and input from the nurse and family members. This comprehensive assessment included: (1) reason for hospital admission, hospital course, and presence of cognitive concerns, (2) family, social, and functional history, (3) Montreal Cognitive Assessment,[18] (4) Geriatric Depression Scale,[19] (5) medical record review including scoring of comorbidities using the Charlson index,[20] determination of functional status using the basic and Instrumental Activities of Daily Living,[21, 22] psychoactive medications administered, and (6) a family member interview to assess the patient's baseline cognitive status that included the Eight‐Item Interview to Differentiate Aging and Dementia,[23] to assess the presence of dementia. Using all of these data, an expert panel, including the clinical assessor, the study principal investigator (E.R.M.), a geriatrician, and an experienced neuropsychologist, adjudicated the final delirium diagnoses using Diagnostic and Statistical Manual of Mental Disorders, 4th Edition (DSM‐IV) criteria. The panel also adjudicated for the presence or absence of dementia and mild cognitive impairment based on National Institute on Aging‐Alzheimer's Association (NIA‐AA) criteria.[24] This approach has been used in other delirium studies.[25]
3D‐CAM Assessments
After the reference standard assessment, the 3D‐CAM was administered by trained research assistants (RAs) who were blinded to the results of the reference standard. To reduce the likelihood of fluctuations or temporal changes, all assessments were completed between 11:00 am and 2:00 pm and for each participant, within a 2‐hour time period (for example, 11:23 am to 1:23 pm).
Statistical Analyses to Determine the Best Single‐ and Two‐Item Screeners
To determine the best single 3D‐CAM item to identify delirium, the responses of the 20 individual items in the 3D‐CAM (see Supporting Table 1 in the online version of this article) were compared to the reference standard to determine their sensitivity and specificity. Similarly, an algorithm was used to generate all unique 2‐item combinations of the 20 items (190 unique pairs), which were compared to the reference. An error, no response, or an answer of I do not know by the patient was considered a positive screen for delirium. The 2‐item screeners were considered positive if 1 or both of the items were positive. Sensitivity and specificity were calculated along with 95% confidence intervals (CIs).
Subset analyses were performed to determine sensitivity and specificity of individual items and pairs of items stratified by the patient's baseline cognitive status. Two strata were createdpatients with dementia (N=56), and patients with normal baseline cognitive status or mild cognitive impairment (MCI) (N=145). We chose to group MCI with normal for 2 reasons: (1) dementia is a well‐established and strong risk factor for delirium, whereas the evidence for MCI being a risk factor for delirium is less established and (2) to achieve adequate allocation of delirious cases in both strata. Last, we report the sensitivity of altered level of consciousness (LOC), which included lethargy, stupor, coma, and hypervigilance as a single screening item for delirium in the overall sample and by cognitive status. Analyses were conducted using commercially available software (SAS version 9.3; SAS Institute, Inc., Cary, NC).
RESULTS
Characteristics of the patients are shown in Table 1. Subjects had a mean age of 84 years, 62% were female, and 28% had a baseline dementia. Forty‐two (21%) had delirium based on the clinical reference standard. Twenty (10%) had less than a high school education and 100 (49%) had at least a college education.
| Characteristic | N (%) |
|---|---|
| |
| Age, y, mean (SD) | 84 (5.4) |
| Sex, n (%) female | 125 (62) |
| White, n (%) | 177 (88) |
| Education, n (%) | |
| Less than high school | 20 (10) |
| High school graduate | 75 (38) |
| College plus | 100 (49) |
| Vision interfered with interview, n (%) | 5 (2) |
| Hearing interfered with interview, n (%) | 18 (9) |
| English second language n (%) | 10 (5) |
| Charlson, mean (SD) | 3 (2.3) |
| ADL, n (% impaired) | 110 (55) |
| IADL, n (% impaired) | 163 (81) |
| MCI, n (%) | 50 (25) |
| Dementia, n (%) | 56 (28) |
| Delirium, n (%) | 42 (21) |
| MoCA, mean (SD) | 19 (6.6) |
| MoCA, median (range) | 20 (030) |
Single Item Screens
Table 2 reports the results of single‐item screens for delirium with sensitivity, the ability to correctly identify delirium when it is present by the reference standard, and specificity, the ability to correctly identify patients without delirium when it is not present by reference standard and 95% CIs. Items are listed in descending order of sensitivity; in the case of ties, the item with the higher specificity is listed first. The screening items with the highest sensitivity for delirium are Months of the year backwards, and Four digits backwards, both with a sensitivity of 83% (95% CI: 69%‐93%). Of these 2 items, Months of the year backwards had a much better specificity of 69% (95% CI: 61%‐76%), whereas Four digits backwards had a specificity of 52% (95% CI: 44%‐60%). The item What is the day of the week? had lower sensitivity at 71% (95% CI: 55%‐84%), but excellent specificity at 92% (95% CI: 87%‐96%).
| Screen Item | Screen Positive (%)c | Sensitivity (95% CI) | Specificity (95% CI) | LR | LR |
|---|---|---|---|---|---|
| |||||
| Months of the year backwards | 42 | 0.83 (0.69‐0.93) | 0.69 (0.61‐0.76) | 2.7 | 0.24 |
| Four digits backwards | 56 | 0.83 (0.69‐0.93) | 0.52 (0.44‐0.60) | 1.72 | 0.32 |
| What is the day of the week? | 21 | 0.71 (0.55‐0.84) | 0.92 (0.87‐0.96) | 9.46 | 0.31 |
| What is the year? | 16 | 0.55 (0.39‐0.70) | 0.94 (0.9‐0.97) | 9.67 | 0.48 |
| Have you felt confused during the past day? | 14 | 0.50 (0.34‐0.66) | 0.95 (0.9‐0.98) | 9.94 | 0.53 |
| Days of the week backwards | 15 | 0.50 (0.34‐0.66) | 0.94 (0.89‐0.97) | 7.95 | 0.53 |
| During the past day, did you see things that were not really there? | 11 | 0.45 (0.3‐0.61) | 0.97 (0.94‐0.99) | 17.98 | 0.56 |
| Three digits backwards | 15 | 0.45 (0.3‐0.61) | 0.92 (0.87‐0.96) | 5.99 | 0.59 |
| What type of place is this? | 9 | 0.38 (0.24‐0.54) | 0.99 (0.96‐1) | 30.29 | 0.63 |
| During the past day, did you think you were not in the hospital? | 10 | 0.38 (0.24‐0.54) | 0.97 (0.94‐0.99) | 15.14 | 0.64 |
We then examined performance of single‐item screeners in patients with and without dementia (Table 3). In persons with dementia, the best single item was also Months of the year backwards, with a sensitivity of 89% (95% CI: 72%‐98%) and a specificity of 61% (95% CI: 41%‐78%). In persons with normal baseline cognition or MCI, the best performing single item was Four digits backwards, with sensitivity of 79% (95% CI: 49%‐95%) and specificity of 51% (95% CI: 42%‐60%). Months of the year backwards also performed well, with sensitivity of 71% (95% CI: 42%‐92%) and specificity of 71% (95% CI: 62%‐79%).
| Test Item | Normal/MCI Patients (n=145) | Dementia Patients (n=56) | ||||||||
|---|---|---|---|---|---|---|---|---|---|---|
| Screen Positive (%)b | Sensitivity (95% CI) | Specificity (95% CI) | LR | LR | Screen Positive (%)b | Sensitivity (95% CI) | Specificity (95% CI) | LR | LR | |
| ||||||||||
| Months backwards | 33 | 0.71 (0.42‐0.92) | 0.71 (0.62‐0.79) | 2.46 | 0.4 | 64 | 0.89 (0.72‐0.98) | 0.61 (0.41‐0.78) | 2.27 | 0.18 |
| Four digits backwards | 52 | 0.79 (0.49‐0.95) | 0.51 (0.42‐0.60) | 1.61 | 0.42 | 66 | 0.86 (0.67‐0.96) | 0.54 (0.34‐0.72) | 1.85 | 0.27 |
| What is the day of the week? | 10 | 0.64 (0.35‐0.87) | 0.96 (0.91‐0.99) | 16.84 | 0.37 | 50 | 0.75 (0.55‐0.89) | 0.75 (0.55‐0.89) | 3 | 0.33 |
Two‐Item Screens
Table 4 reports the results of 2‐item screens for delirium with sensitivity, specificity, and 95% CIs. Item pairs are listed in descending order of sensitivity following the same convention as in Table 2. The 2‐item screen with the highest sensitivity for delirium is the combination of What is the day of the week? and Months of the year backwards, with a sensitivity of 93% (95% CI: 81%‐99%) and specificity of 64% (95% CI: 56%‐70%). This screen had a positive and negative likelihood ratio (LR) of 2.59 and 0.11, respectively. The combination of What is the day of the week? and Four digits backwards had the same sensitivity 93% (95% CI: 81%‐99%), but lower specificity of 48% (95% CI: 40%‐56%). The combination of What type of place is this? (hospital) and Four digits backwards had a sensitivity of 90% (95% CI: 77%‐97%) and specificity of 51% (95% CI: 43%‐50%).
| Screen Item 1 | Screen Item 2 | Screen Positive (%)c | Sensitivity (95% CI) | Specificity (95% CI) | LR | LR |
|---|---|---|---|---|---|---|
| ||||||
| What is the day of the week? | Months backwards | 48 | 0.93 (0.81‐0.99) | 0.64 (0.56‐0.70) | 2.59 | 0.11 |
| What is the day of the week? | Four digits backwards | 60 | 0.93 (0.81‐0.99) | 0.48 (0.4‐0.56) | 1.8 | 0.15 |
| Four digits backwards | Months backwards | 65 | 0.93 (0.81‐0.99) | 0.42 (0.34‐0.50) | 1.6 | 0.17 |
| What type of place is this? | Four digits backwards | 58 | 0.90 (0.77‐0.97) | 0.51 (0.43‐0.50) | 1.84 | 0.19 |
| What is the year? | Four digits backwards | 59 | 0.9 (0.77‐0.97) | 0.5 (0.42‐0.5) | 1.80 | 0.19 |
| What is the day of the week? | Three digits backwards | 30 | 0.88 (0.74‐0.96) | 0.86 (0.79‐0.90) | 6.09 | 0.14 |
| What is the year? | Months backwards | 44 | 0.88 (0.74‐0.96) | 0.68 (0.6‐0.75) | 2.75 | 0.18 |
| What type of place is this? | Months backwards | 43 | 0.86 (0.71‐0.95) | 0.69 (0.61‐0.70) | 2.73 | 0.21 |
| During the past day, did you think you were not in the hospital? | Months backwards | 43 | 0.86 (0.71‐0.95) | 0.69 (0.61‐0.70) | 2.73 | 0.21 |
| Days of the week backwards | Months backwards | 43 | 0.86 (0.71‐0.95) | 0.68 (0.6‐0.75) | 2.67 | 0.21 |
When subjects were stratified by baseline cognition, the best 2‐item screens for normal and MCI patients was What is the day of the week? and Four digits backwards, with 93% sensitivity (95% CI: 66%‐100%) and 50% specificity (95% CI: 42%‐59%). The best pair of items for patients with dementia (Table 5) was the same as the overall sample, What is the day of the week? and Months of the year backwards, but its performance differed with a higher sensitivity of 96% (95% CI: 82%‐100%) and lower specificity of 43% (95% CI: 24%‐63%). This same pair of items had 86% sensitivity (95% CI: 57%‐98%) and 69% (95% CI: 60%‐77%) specificity for persons with either normal cognition or MCI.
| Test Item 1 | Test Item 2 | Normal/MCI Patients (n=145) | Dementia Patients (n=56) | ||||||||
|---|---|---|---|---|---|---|---|---|---|---|---|
| Item Positive (%)b | Sensitivity (95% CI) | Specificity (95% CI) | LR | LR | Item Positive (%)b | Sensitivity (95% CI) | Specificity (95% CI) | LR | LR | ||
| |||||||||||
| What is the day of the week? | Months backwards | 36 | 0.86 (0.57‐0.98) | 0.69 (0.60‐0.77) | 2.74 | 0.21 | 77 | 0.96 (0.82‐1) | 0.43 (0.24‐0.63) | 1.69 | 0.08 |
| What is the day of the week? | Four digits backwards | 54 | 0.93 (0.66‐1) | 0.5 (0.42‐0.59) | 1.87 | 0.14 | 77 | 0.93 (0.76‐0.99) | 0.39 (0.22‐0.59) | 1.53 | 0.18 |
| Four digits backwards | Months backwards | 61 | 0.93 (0.66‐1) | 0.43 (0.34‐0.52) | 1.62 | 0.17 | 77 | 0.93 (0.76‐0.99) | 0.39 (0.22‐0.59) | 1.53 | 0.18 |
Altered Level of Consciousness as a Screener for Delirium
Altered level of consciousness (ALOC) was uncommon in our sample, with an overall prevalence of 10/201 (4.9%). When examined as a screening item for delirium, ALOC had very poor sensitivity of 19% (95% CI: 9%‐34%) but had excellent specificity 99% (95% CI: 96%‐100%). Altered LOC also demonstrated poor screening performance when stratified by cognitive status, with a sensitivity of 14% in the normal and MCI group (95% CI: 2%‐43%) and sensitivity of 21% (95% CI: 8%‐41%) in persons with dementia.
Positive and Negative Predictive Values
Although we focused on sensitivity and specificity in evaluating 1‐ and 2‐item screeners, we also examined positive and negative predictive values. These values will vary depending on the overall prevalence of delirium, which was 21% in this dataset. The best 1‐item screener, Months of the year backwards, had a positive predictive value of 31% and negative predictive value of 94%. The best 2‐item screener, Months of the year backwards with What is the day of the week?, had a positive predictive value of 41% and negative predictive value of 97% (see Supporting Tables 2 and 3 in the online version of this article) LRs for the items are in Tables 2 through 5.
DISCUSSION
Identifying simple, efficient, bedside case‐identification methods for delirium is an essential step toward improving recognition of this highly morbid syndrome in hospitalized older adults. In this study, we identified a single cognitive item, Months of the year backwards, that identified 83% of delirium cases when compared with a reference standard diagnosis. Furthermore, we identified 2 items, Months of the year backwards and What is the day of the week? which when used in combination identified 93% of delirium cases. The same 1 and 2 items also worked well in patients with dementia, in whom delirium is often missed. Although these items require further clinical validation, the development of an ultrabrief 2‐item test that identifies over 90% of delirium cases and can be completed in less than 1 minute (recently, we administered the best 2‐item screener to 20 consecutive general medicine patients over age 70 years, and it was completed in a median of 36.5 seconds), holds great potential for simplifying bedside delirium screening and improving the care of hospitalized older adults.
Our current findings both confirm and extend the emerging literature on best screening items for delirium. Sands and colleagues (2010)[26] tested a single test for delirium, Do you think (name of patient) has been more confused lately? in 21 subjects and achieved a sensitivity of 80%. Han and colleagues developed a screening tool in emergency‐department patients using the LOC question from the Richmond Agitation‐Sedation Scale and spelling the word lunch backwards, and achieved 98% sensitivity, but in a younger emergency department population with a low prevalence of dementia.[27] O'Regan et al. recently also found Months of the year backwards to be the best single‐screening item for delirium in a large sample, but only tested a 1‐item screen.[28] Our study extends these studies in several important ways by: (1) employing a rigorous clinical reference standard diagnosis of delirium, (2) having a large sample with a high prevalence of patients with dementia, (3) use of a general medical population, and (4) examining the best 2‐item screens in addition to the best single item.
Systematic intervention programs[29, 30, 31] that focus on improved delirium evaluation and management have the potential to improve patient outcomes and reduce costs. However, targeting these programs to patients with delirium has proven difficult, as only 12% to 35% of delirium cases are recognized in routine clinical practice.[11, 12, 13, 14, 15] The 1‐ and 2‐item screeners we identified could play an important role in future delirium identification. The 3D‐CAM combines high sensitivity (95%) with high specificity (94%)[16] and therefore would be an excellent choice as the second step after a positive screen. The feasibility, effectiveness, and cost of administering these screeners, followed by a brief diagnostic tool such as the 3D‐CAM, should be evaluated in future work.
Our study has noteworthy strengths, including the use of a large purposefully challenging clinical sample with advanced age that included a substantial proportion with dementia, a detailed assessment, and the testing of very brief and practical tools for bedside delirium screening.[25] This study also has several important limitations. Most importantly, we presented secondary analysis of individual items and pairs of items drawn from the 3D CAM assessment; therefore, the 2‐item bedside screen requires prospective clinical validation. The reference standard was based on the DSM‐IV, because this study was conducted prior to the release of DSM‐V. In addition, the ordering of the reference standard and 3D‐CAM assessments was not randomized due to feasibility constraints. In addition, this study was cross‐sectional, involved only a single hospital, and enrolled only older medical patients during the day shift. Our sample was older (aged 75 years and older), and a younger sample may have had a different prevalence of delirium, which could affect the positive predictive value of our ultrabrief screen. We plan to test this in a sample of patients aged 70 years and older in future studies. Finally, it should be noted that these best 1‐item and 2‐item screeners miss 17% and 7% of delirium cases, respectively. In cases where this is unacceptably high, alternative approaches might be necessary.
It is important to remember that these 1‐ and 2‐item screeners are not diagnostic tools and therefore should not be used in isolation. Optimally, they will be followed by a more specific evaluation, such as the 3D‐CAM, as part of a systematic delirium identification process. For instance, in our sample (with a delirium rate of 21%), the best 2‐item screener had a positive predictive value of 41%, meaning that positive screens are more likely to be false positives than true positives (see Supporting Tables 2 and 3 in the online version of this article).[32] Nevertheless, by reducing the total number of patients who require diagnostic instrument administration, use of these ultrabrief screeners can improve efficiency and result in a net benefit to delirium case‐identification efforts.[32]
Time has been demonstrated to be a barrier to delirium identification in previous studies, but there are likely others. These may include, for instance, staff nihilism about screening making a difference, ambiguous responsibility for delirium screening and management, unsupportive system leadership, and absent payment for these activities.[31] Moreover, it is possible that the 2‐step process we propose may create an incentive for staff to avoid positive screens as they see it creating more work for themselves. We plan to identify and address such barriers in our future work.
In conclusion, we identified a single screening item for delirium, Months of the year backwards, with 83% sensitivity, and a pair of items, Months of the year backwards and What is the day of the week?, with 93% sensitivity relative to a rigorous reference standard diagnosis. These ultrabrief screening items work well in patients with and without dementia, and should require very little training of staff. Future studies should further validate these tools, and determine their translatability and scalability into programs for systematic, widespread delirium detection. Developing efficient and accurate case identification strategies is a necessary prerequisite to appropriately target delirium management protocols, enabling healthcare systems to effectively address this costly and deadly condition.
Disclosures
Author contributionsD.M.F. conceived the study idea, participated in its design and coordination, and drafted the initial manuscript. S.K.I. contributed to the study design and conceptualization, supervision, funding, preliminary analysis, and interpretation of the data, and critical revision of the manuscript. J.G. conducted the analysis for the study and critically revised the manuscript. L.N. supervised the analysis for the study and critically revised the manuscript. R.J. contributed to the study design and critical revision of the manuscript. J.S.S. critically revised the manuscript. E.R.M. obtained funding for the study, supervised all data collection, assisted in drafting and critically revising the manuscript, and contributed to the conceptualization, design, and supervision of the study. All authors have seen and agree with the contents of the manuscript.
This work was supported by the National Institute of Aging grant number R01AG030618 and K24AG035075 to Dr. Marcantonio. Dr. Inouye's time was supported in part by grants P01AG031720, R01AG044518, and K07AG041835 from the National Institute on Aging. Dr. Inouye holds the Milton and Shirley F. Levy Family Chair (Hebrew Senior Life/Harvard Medical School). Dr. Fick is partially supported from National Institute of Nursing Research grant number R01 NR011042. Dr. Saczynski was supported in part by funding from the National Institute on Aging (K01AG33643) and from the National Heart Lung and Blood Institute (U01HL105268). The funding agencies had no role and the authors retained full autonomy in the preparation of this article. All authors and coauthors have no financial or nonfinancial conflicts of interest to disclose regarding this article.
This article was presented at the Presidential Poster Session at the American Geriatrics Society 2014 Annual Meeting in Orlando, Florida, May 14, 2014.
- , , , , , Delirium in elderly patients and the risk of postdischarge mortality, institutionalization, and dementia: a meta‐analysis. JAMA. 2010;304(4):443–451.
- , , , et al. Cognitive trajectories after postoperative delirium. N Engl J Med. 2012;367(1):30–39.
- , , Delirium in elderly people. Lancet. 2014;383:911–922.
- , , , Delirium superimposed on dementia is associated with prolonged length of stay and poor outcomes in hospitalized older adults. J Hosp Med. 2013;8(9):500–505.
- , , , , One‐year health care costs associated with delirium in the elderly population. Arch Intern Med. 2008;168(1):27–32.
- , The importance of delirium: Economic and societal costs. J Am Geriatr Soc. 2011;59(suppl 2):S241–S243.
- Delirium. Ann Intern Med. 2011;154(11):ITC6.
- , , , , , Fostering implementation of health services research findings into practice: a consolidated framework for advancing implementation science. Implement Sci. 2009;4:50.
- , , , Mixed‐methods approach to understanding nurses' clinical reasoning in recognizing delirium in hospitalized older adults. J Contin Educ Nurs. 2014;45:1–13.
- , , Educational interventions to improve recognition of delirium: a systematic review. J Am Geriatr Soc. 2013;61(11):1983–1993.
- , Delirium superimposed on dementia: accuracy of nurse documentation. J Gerontol Nurs. 2012;38(1):32–42.
- , , , et al. Detection of delirium by bedside nurses using the confusion assessment method. J Am Geriatr Soc. 2006;54:685–689.
- , , , et al. Documentation of delirium in elderly patients with hip fracture. J Gerontol Nurs. 2002;28(11):23–29.
- , , , Recorded delirium in a national sample of elderly inpatients: potential implications for recognition. J Geriatr Psychiatry Neurol. 2003;16(1):32–38.
- , , , et al. A tale of two methods: chart and interview methods for identifying delirium. J Am Geriatr Soc. 2014;62(3):518–524.
- , , , et al. 3D‐CAM: Derivation and validation of a 3‐minute diagnostic interview for CAM‐defined delirium: a cross‐sectional diagnostic test study. Ann Intern Med. 2014;161(8):554–561.
- , , , et al. Selecting optimal screening items for delirium: an application of item response theory. BMC Med Res Methodol. 2013;13:8.
- , , , et al. The Montreal Cognitive Assessment, MoCA: a brief screening tool for mild cognitive impairment. J Am Geriatr Soc. 2005;53(4):695–699.
- Geriatric Depression Scale. Psychopharmacol Bull. 1988;24(4):709–711.
- , , , A new method of classifying prognostic comorbidity in longitudinal studies: development and validation. J Chronic Dis. 1987;40(5):373–383.
- , , , , Studies of illness in the aged: the index of ADL: a standardized measure of biological and psychosocial function. JAMA. 1963;185:914–919.
- , Assessment of older people: self‐maintaining and instrumental activities of daily living. Gerontologist. 1969;9(3):179–186.
- , , , et al. The AD8: a brief informant interview to detect dementia. Neurology. 2005;65(4):559–564.
- , , , et al. The diagnosis of dementia due to Alzheimer's disease: recommendations from the National Institute on Aging‐Alzheimer's Association workgroups on diagnostic guidelines for Alzheimer's disease. Alzheimers Dement. 2011;7(3):263–269.
- , , , et al. Delirium diagnosis methodology used in research: a survey‐based study. Am J Geriatr Psychiatry. 2014;22(12):1513–1521.
- , , , , Single Question in Delirium (SQiD): testing its efficacy against psychiatrist interview, the Confusion Assessment Method and the Memorial Delirium Assessment Scale. Palliat Med. 2010;24(6):561–565.
- , , , et al. Diagnosing delirium in older emergency department patients: validity and reliability of the delirium triage screen and the brief confusion assessment method. Ann Emerg Med. 2013;62(5):457–465.
- , , , et al. Attention! A good bedside test for delirium? J Neurol Neurosurg Psychiatry. 2014;85(10):1122–1131.
- , , , , A model for management of delirious postacute care patients. J Am Geriatr Soc. 2005;53(10):1817–1825.
- , , , Computerized decision support for delirium superimposed on dementia in older adults: a pilot study. J Gerontol Nurs. 2011;37(4):39–47.
- , , , et al. Barriers and facilitators to implementing delirium rounds in a clinical trial across three diverse hospital settings. Clin Nurs Res. 2014;23(2):201–215.
- , Antecedent probability and the efficiency of psychometric signs, patterns, or cutting scores. Psychol Bull. 1955;52(3):194.
© 2015 Society of Hospital Medicine