User login
Safety of Tourniquet Use in Total Knee Arthroplasty in Patients With Radiographic Evidence of Vascular Calcifications
Tourniquets are often used in total knee arthroplasty (TKA) to improve visualization of structures, shorten operative time, reduce intraoperative bleeding, and improve cementing technique. Despite these advantages, controversy remains regarding the safety of tourniquet use. Tourniquets have been associated with nerve palsies, vascular injury, and muscle damage.1-5 Some have hypothesized they may cause venous stasis or direct endothelial damage that may develop into deep vein thrombosis (DVT). Abdel-Salam and Eyres6 found an increased incidence of postoperative wound complications and DVTs associated with tourniquet use.
Moreover, investigators have analyzed the role of tourniquets in populations at high risk for wound complications. DeLaurentis and colleagues7 performed a prospective and retrospective analysis of 1182 TKA patients, 24 (2%) of whom had preexisting peripheral vascular disease (PVD), defined as a history of arterial insufficiency, absent dorsalis pedis and/or absent posterior tibial pulsations, and arterial calcifications. A tourniquet was used in each case. Arterial complications occurred in 6 of the 24 patients with PVD. As expected, the authors found that a history of intermittent claudication, pain at rest, and arterial ulcers resulted in a high risk for vascular complications. Further studies have supported this finding and expanded the list of predisposing factors to include previous vascular surgery and absent and asymmetric pedal pulsations.7-11 Of particular concern to total joint arthroplasty surgeons was the finding by DeLaurentis and colleagues7 that patients with radiographic evidence of calcification of the distal superficial femoral artery and/or popliteal artery were at risk for arterial complications. This finding is also supported by other studies.8,11 In TKA, damage to arterial structures proximal to the surgical field could manifest as impaired postoperative wound healing or an ischemic limb. Wound healing depends on adequate blood flow to the healing tissue, and any damage to arterial or venous structures can theoretically compromise this process.
Added to vascular/wound complications as concerning complications in orthopedic surgery is venous thromboembolism (VTE). The role of tourniquets in the formation of VTEs is controversial. A tourniquet has the potential to increase the risk for DVT because of the stasis of venous blood in the lower limb or possible damage to calcified blood vessels. Callam and colleagues12 studied the connection between artery disease and chronic leg ulcers and found that half the patients diagnosed with peripheral artery disease also had stigmata of chronic venous insufficiency. Therefore, the entities can occur in tandem, and surgeons should keep this in mind.
Here we report on a study we conducted to determine whether tourniquet use in TKA in patients with preexisting radiographic evidence of vascular disease increases the risk for wound complications or VTE.
Patients and Methods
We retrospectively reviewed 461 consecutive primary TKAs (373 patients) performed between January 2007 and June 2012 by 2 attending orthopedic surgeons specializing in adult reconstruction. Medical records and operative reports of 583 patients were examined after receiving institutional review board approval. Of these patients, 373 (64%) had a minimum of 12-month follow-up data available. Twelve months was deemed long enough to discover wound complications or DVTs secondary to the index procedure. Most of these outcomes manifest within the first 3 months after surgery and certainly by 12 months. Follow-up longer than 12 months may become a confounder, as wound complications outside the acute to subacute postoperative window could be related to patients’ underlying PVD and not directly to tourniquet use during surgery. Patient demographics and comorbidities were recorded. Comorbidities were obtained from preoperative medical evaluations and surgeons’ preoperative evaluations. All patients had preoperative palpable dorsalis pedis and posterior tibialis arterial pulses. No patient required preoperative vascular studies based on preoperative examination or comorbidities. No patient had prior vascular bypass surgery or stenting.
TKA was performed in a nonlaminar flow, positive-pressure, high-efficiency particulate air-filtered room with sterile toga/surgical helmet systems. For all patients, a pneumatic thigh tourniquet was applied, and the patient was prepared and draped. After limb exsanguination using a rubber bandage, the limb was elevated and the tourniquet inflated to a pressure of 250 to 300 mm Hg. The tourniquet was released either just before closure or immediately after closure in all cases; it was always let down before placement of final bandages.
Prophylactic chemical anticoagulation consisting of warfarin, aspirin, or enoxaparin was used in all patients and continued for 4 to 6 weeks after surgery. All patients received mechanical DVT prophylaxis with sequential compression devices, and all were mobilized out of bed beginning either the day of surgery or the next day. All patients received perioperative intravenous antibiotics, with the preoperative dose given before tourniquet inflation and the last postoperative dose stopped within 24 hours of surgery.
All patients who had primary TKA underwent preoperative medical evaluation and optimization. The patient’s hospital course was monitored closely, and complications noted by the orthopedic team were documented. Follow-up documentation was retrospectively reviewed for evidence of wound complications or VTE. Wound complications were defined as cellulitis, delayed wound healing, wound dehiscence, and/or periprosthetic joint infection. In the case of VTE, physical examination findings were not sufficient for inclusion. Venous duplex ultrasonography demonstrating the clot was reviewed before inclusion.
Preoperative radiographs were examined for arterial calcification (Figure). We refer to calcification seen above the knee joint as proximal calcification and to calcification observed below the joint as distal calcification. Patients exhibited calcification proximally only, distally only, or both proximally and distally. The 373 patients were placed into 2 groups based on whether they had preoperative arterial calcification on plain radiography of the knee. One group (285 patients with no radiographic evidence of preoperative knee arterial calcification) underwent 365 TKAs, and the other group (88 patients with radiographic evidence of preoperative knee arterial calcification) underwent 96 TKAs.

A sample size calculation was performed to determine how many patients were needed in each group with 80% power and an α of 0.05. With an estimated difference in VTE/wound complication rate between the calcification and no-calcification groups of 12%, we needed to review 316 TKAs total. This 12% difference was based on study findings of a 25% complication rate in PVD patients who underwent tourniquet-assisted TKA, and the rate of VTE/wound complication after TKA in patients overall, which can be up to 12%.7,13,14 We exceeded minimal enrollment and had 461 TKAs. Descriptive statistics were reported, with means and ranges provided where appropriate. Independent t test was used to evaluate the differences in continuous data (age) between the groups. Univariate analysis (using Pearson χ2 and Fisher exact tests) and multivariate logistic regression analysis were used to evaluate the effects of categorical variables (sex, comorbidity, calcification [presence, absence], and location of calcification [proximal only, distal only, both]) on wound complication and VTE rates. All tests were 2-tailed and performed with a type I error rate of 0.05. Data analysis was performed with SPSS Version 19.0 (SPSS).
Results
Patient characteristics are summarized in Table 1. Of the 373 patients, 285 lacked calcification, and 88 had calcification. Mean age was 67.73 years (range, 24-92 years) for all patients, 65.99 years (range, 24-89 years) for the no-calcification group, and 74.32 years (range, 54-92 years) for the calcification group; the calcification group demonstrated a trend toward older age, but the difference was not significantly different (P = .07). Of the 373 patients, 156 (41.82%) were male: 110 in the no-calcification group (38.60%) and 46 in the calcification group (52.27%); sex was significantly (P = .002) different between groups, with more males in the calcification group.
![]()
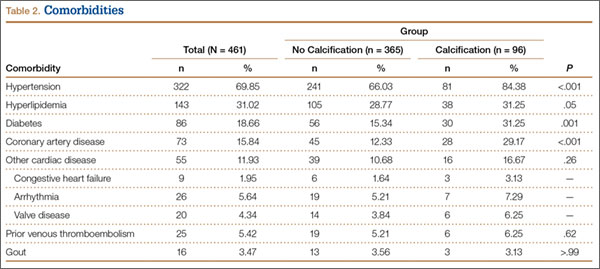
Data on total preoperative comorbidities are summarized in Table 2. Hypertension, hyperlipidemia, diabetes, and coronary artery disease (CAD) were the most common comorbidities, and they were all significantly (P ≤ .05) increased in the calcification group.
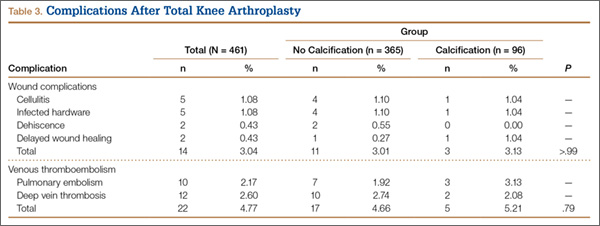
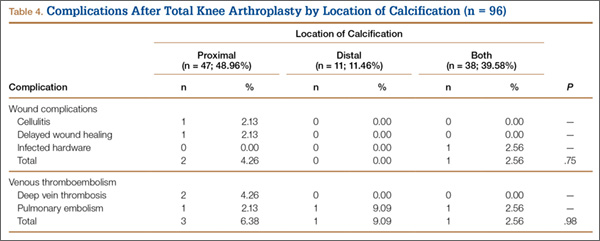
No patients had reported arterial complications, such as arterial bleeding, aneurysm, intimal tears, or loss of distal pulses. Wound complication after TKA was detected in 3.04% of all cases (Table 3). Rate of DVT after TKA was 2.60% of all cases, and rate of pulmonary embolism after TKA was 2.17% of all cases. Of the 96 TKAs with preoperative radiographic evidence of calcification, 47 (48.96%) had proximal calcification only, 11 (11.46%) had distal calcification only, and 38 (39.58%) had both proximal and distal calcification (Table 4). There was no significant difference between the rate of wound complication or VTE based on location of vascular calcification.
Univariate analysis demonstrated that presence of arterial knee calcification did not increase the risk for postoperative wound complication (odds ratio [OR], 1.04; 95% confidence interval [CI], 0.28-3.80; P > .05) (Table 5). Location of arterial knee calcification also did not increase the risk for postoperative wound complication. In addition, univariate analysis demonstrated that presence of arterial knee calcification did not increase the risk for postoperative VTE (OR, 1.20; 95% CI, 0.43-3.36; P > .05 (Table 6).


Of the 14 wound complications, the most common infections were cellulitis (5/14 cases; 35.71%) and infected hardware that required component revision (5/14 cases; 35.71%). Mean time from TKA to infection was 137.93 days (range, 5-783 days). The most common organism grown in culture from the wound was Staphylococcus (5/14 cases; 35.71%).
Additional univariate statistical analysis revealed that presence of diabetes, hypertension, prior VTE, CAD, and male sex was linked to higher incidence of wound complication (P < .05) (Table 5). When multivariate analysis was performed, hypertension, prior VTE, and male sex remained significant (P < .05) (Table 5).
Discussion
TKA is a safe and effective procedure used to treat osteoarthritis of the knee and improve patients’ quality of life.15 About 700,000 TKAs are performed annually in the United States.16 Because of improvements in preventive medicine and medical technology, life expectancy is increasing, and TKAs are now being performed in higher numbers and in an older patient population. Over the next few decades, these developments will lead to more postoperative complications. It is projected that, by 2030, the need for TKAs in the United States will increase by 673% to 3.48 million.17 Postoperative complications are rare but unfortunately often lead to poor outcomes or even mortality.18 To help minimize the number of postoperative complications, we must understand the safety of tourniquet use in TKA. Other investigators have concluded that tourniquet use is unsafe in patients with preoperative vascular calcifications on plain radiographs.7,8,11 The present study, designed to elucidate whether preoperative evidence of knee arterial calcification may predispose TKA patients to postoperative wound complication or VTE, had some important findings.
In our study, wound complication and VTE occurred in a considerable number of patients after TKA. Despite exceeding the number of patients calculated by the power analysis, our population may have been inadequate to fully detect statistical significance. Thus, our conclusion of failing to reject the null hypothesis may have been because of sample size, a type II error. We found that, after primary TKA, 3.04% of patients developed wound complications and 4.77% VTE. According to the literature, the incidence of infection after primary TKA is between 0.5% and 12%, and that of VTE reported within 3 months after TKA is 1.3% to 10%.13,14 Although we had 100% VTE prophylaxis, meeting the standard of care, VTE after TKA remains a postoperative complication.19 This study also found that a considerable percentage of primary TKA patients (23.59%) had preoperative calcification of the knee arteries. To our knowledge, this study was the first to quantify the incidence of knee arterial calcification in patients who underwent TKA.
Preoperative calcification of the knee arteries in patients who underwent TKA did not increase the risk for wound complication, VTE, or arterial damage. These calcifications, however, do pose an increased systemic vascular risk.20 Calcification of the vascular wall predicts increased cardiovascular risk, independent of classical cardiovascular risk factors.3,18,21-24 Clinically, patients who have both diabetes and calcifications are at significant excess risk for total mortality, stroke mortality, and cardiovascular mortality, compared with patients with diabetes but without such calcifications. They also had a significantly higher incidence of coronary heart disease events, stroke events, and lower extremity amputations.25,26
All our patients underwent tourniquet-assisted TKA. Although previous studies have indicated that tourniquet use may increase arterial complications and wound complications or even limb loss in patients with calcified arteries, we did not find this link.7,27 Our population had no reported arterial complications related to tourniquet use. Other, smaller studies have had similar findings. Vandenbussche and colleagues28 prospectively studied 80 TKA cases randomized to tourniquet use or no tourniquet use and found no postoperative nerve palsies, wound infections, wound healing problems, or hematomas. Our study is also in accord with studies that have reported tourniquet use did not increase risk for DVT.29 Therefore, unlike earlier data, our data demonstrated that tourniquet use in patients with knee arterial calcification was safe.7,27,30,31
Patients with calcification were more likely to have the medical comorbidities of hypertension, diabetes, hyperlipidemia, and CAD. All these comorbidities are linked to the development of arterial calcification, or atherosclerotic occlusive disease.32,33 As life expectancy and the need for TKA increase, it is likely that a larger percentage of TKA patients will have preoperative radiographic evidence of knee arterial calcification. Although current dogma is that tourniquet-assisted TKA is contraindicated for patients with preoperative radiographic evidence of femoral-popliteal calcification, our study results showed that this calcification should not affect preoperative TKA planning for these patients.
We divided our patients into 3 categories: those with proximal calcification (above the joint line), those with distal calcification (below the joint line), and those with both proximal and distal calcification. Location of arterial calcification did not have an effect on their rates of postoperative wound complication or VTE. We hypothesized that patients with proximal calcification would be at increased risk for direct arterial injury and subsequent wound complication because the tourniquet is placed proximally. Previous research has indicated that arterial occlusion and subsequent wound complication can occur because of low blood flow stemming from tourniquet use.7 Further, intraoperative manipulation (flexing) of a knee with calcified vessels causes arterial complications after TKA because these vessels are less elastic than nonatheromatous vessels.31 However, we found no such effect. At the same time, having arterial calcification might also be an indication of venous disease in this location,12 which may be especially important for proximal calcifications. Proximal DVT more likely is a precursor to pulmonary embolic events than distal DVT is.31,34 However, we found no difference in VTE rates among the 3 arterial location groups, which is supported by studies that have found that tourniquet use does not increase DVT incidence.29,35-40
Risk for wound complications was higher in male patients and in patients with diabetes, prior VTE, hypertension, or CAD. This finding is important because, with the increasing age of patients who undergo TKA, those with serious medical comorbidities will continue to need and have this surgery.17 Diabetes may increase the rate of wound complication because patients with diabetes have poor microcirculation, poor collagen synthesis, and reduced wound strength.41 Malinzak and colleagues42 demonstrated that, compared with patients without diabetes, those with diabetes had a significantly higher risk for infection after TKA. Prior VTE, specifically DVT, may increase the rate of wound complication because after DVT the deep veins may be damaged and exhibit valvular dysfunction. Labropoulos and colleagues43 showed that DVT history was strongly associated with ulcer nonhealing. Perhaps hypertension has been overlooked as a risk factor for wound complication in TKA. No previous studies have assessed the link between hypertension and wound complications after TKA. However, a study of wound healing after total hip arthroplasty found that, compared with normotensive patients, hypertensive patients had delayed wound healing, putting them at higher risk for infection.44 In addition, we found that patients with CAD were at increased risk for wound complications—an unexpected finding, as CAD traditionally is not a risk factor for infection or poor wound healing. Recently, however, CAD was identified as an independent risk factor for surgical site infections in posterior lumbar–instrumented arthrodesis.45 The etiology of this association is unknown. Also, male patients were at increased risk for wound complication. Male sex has been implicated as an independent risk factor for development of surgical site infections and has been established as an important predisposing factor for periprosthetic joint infections.46
It is possible that patients who present with diabetes, VTE, hypertension, or CAD before TKA should have a consultation with a vascular surgeon or should have TKA performed without a tourniquet, but this conclusion cannot be considered definitive without a large prospective randomized trial or possibly registry data. Our data indicate that patients with these comorbidities have higher rates of wound complications irrespective of preoperative radiographic calcifications. On the basis of our study results, however, we certainly recommend that patients with these risk factors have preoperative medical optimization. Orthopedic surgeons should take a thorough history and perform a meticulous physical examination on these patients to look for evidence of PVD. We recommend that, if vascular claudication is elicited in the history, or if there is evidence of peripheral arterial disease—such as hair loss, skin discoloration, dystrophic nail changes, or absent or unequal peripheral pulses—the ankle-brachial index test should be performed. If the index value is less than 0.9, then a preoperative vascular surgery consultation should be obtained.
This study had some weaknesses. First, it was retrospective, so it is possible that some wound or VTE complications were not reported and thus not found in the paper charts or electronic medical records. Some patients may have had VTE diagnostic scans at other hospitals, and their results may not have been recorded across databases. Moreover, some patients may have seen wound specialists for wound infections or wound healing problems, and these may not have been reported to the orthopedic surgeons. Second, though our patient population was not small, it may not have been of adequate size to fully detect statistical significance. We met our enrollment numbers based on our sample size calculations from an a priori power analysis; however, we still draw conclusions with the possibility of committing a type II error in mind by failing to reject the null hypothesis when in reality a statistically significant difference does exist. Third, none of our consecutive patients carried the preoperative diagnosis of PVD, and none had preoperative vascular surgery. Therefore, though calcifications were noted on radiographs, clinically our patients were asymptomatic with respect to vascular health. Last, the 2 groups were not randomized. All patients underwent tourniquet-assisted TKA.
Conclusion
To our knowledge, this is the largest study to examine the effect of preoperative knee arterial calcification on wound complication and VTE after tourniquet-assisted TKA. Contrary to previously published recommendations, we conclude that TKA can be safely performed with a tourniquet in the presence of preoperative radiographic evidence of such calcification. However, we recommend that patients with diabetes, hypertension, CAD, or prior VTE undergo an appropriate physical examination to elicit any signs or symptoms of vascular disease. If before surgery there is any question of vascular competence, a vascular surgeon should be consulted.
1. Guanche CA. Tourniquet-induced tibial nerve palsy complicating anterior cruciate ligament reconstruction. Arthroscopy. 1995;11(5):620-622.
2. Irvine GB, Chan RN. Arterial calcification and tourniquets. Lancet. 1986;2(8517):1217.
3. Patterson S, Klenerman L. The effect of pneumatic tourniquets on the ultrastructure of skeletal muscle. J Bone Joint Surg Br. 1979;61(2):178-183.
4. Rorabeck CH, Kennedy JC. Tourniquet-induced nerve ischemia complicating knee ligament surgery. Am J Sports Med. 1980;8(2):98-102.
5. Shenton DW, Spitzer SA, Mulrennan BM. Tourniquet-induced rhabdomyolysis. A case report. J Bone Joint Surg Am. 1990;72(9):1405-1406.
6. Abdel-Salam A, Eyres KS. Effects of tourniquet during total knee arthroplasty. A prospective randomised study. J Bone Joint Surg Br. 1995;77(2):250-253.
7. DeLaurentis DA, Levitsky KA, Booth RE, et al. Arterial and ischemic aspects of total knee arthroplasty. Am J Surg. 1992;164(3):237-240.
8. Holmberg A, Milbrink J, Bergqvist D. Arterial complications and knee arthroplasty. Acta Orthop Scand. 1996;67(1):75-8.
9. Hozack WJ, Cole PA, Gardner R, Corces A. Popliteal aneurysm after total knee arthroplasty. Case reports and review of the literature. J Arthroplasty. 1990;5(4):301-305.
10. Kumar SN, Chapman JA, Rawlins I. Vascular injuries after total knee arthroplasty: a review of the problem with special reference to the possible effects of the tourniquet. J Arthroplasty. 1998;13(2):211-216.
11. Rush JH, Vidovich JD, Johanson MA. Arterial complications and total knee arthroplasty. The Australian experience. J Bone Joint Surg Br. 1987;69(3):400-402.
12. Callam MJ, Harper DR, Dale JJ, Ruckley CV. Arterial disease in chronic leg ulceration: an underestimated hazard? Lothian and Forth Valley Leg Ulcer Study. Br Med J (Clin Res Ed). 1987;294(6577):929-931.
13. Blom AW, Brown J, Taylor AH, Pattison G, Whitehouse S, Bannister GC. Infection after total knee arthroplasty. J Bone Joint Surg Br. 2004;86(5):688-691.
14. Geerts WH, Bergqvist D, Pinco G, et al. Prevention of venous thromboembolism. Chest. 2008;133(6 suppl):381S-453S.
15. Pulido L, Parvizi J, Macgibeny M, et al. In hospital complications after total joint arthroplasty. J Arthroplasty. 2008;23(6 Suppl 1):139-145.
16. Arthritis: data and statistics. Centers for Disease Control and Prevention website. http://www.cdc.gov/arthritis/data_statistics.htm. Updated March 11, 2015. Accessed July 27, 2015.
17. Kurtz S, Ong K, Lau E, Mowat F, Halpern M. Projections of primary and revision hip and knee arthroplasty in the United States from 2005 to 2030. J Bone Joint Surg Am. 2007;89(4):780-785.
18. Pulido L, Ghanem E, Joshi A, Purtill JJ, Parvizi J. Periprosthetic joint infection: the incidence, timing, and predisposing factors. Clin Orthop Relat Res. 2008;466(7):1710-1715.
19. Warwick D. Prevention of venous thromboembolism in total knee and hip replacement. Circulation. 2012;125(17):2151-2155.
20. Rennenberg RJ, Kessels AG, Schurgers LJ, van Engelshoven JM, de Leeuw PW, Kroon AA. Vascular calcifications as a marker of increased cardiovascular risk: a meta-analysis. Vasc Health Risk Manag. 2009;5(1):185-197.
21. Arad Y, Goodman KJ, Roth M, Newstein D, Guerci AD. Coronary calcification, coronary disease risk factors, C-reactive protein, and atherosclerotic cardiovascular disease events: the St. Francis Heart Study. J Am Coll Cardiol. 2005;46(1):158-165.
22. Iribarren C, Sidney S, Sternfeld B, Browner WS. Calcification of the aortic arch: risk factors and association with coronary heart disease, stroke, and peripheral vascular disease. JAMA. 2000;283(21):2810-2815.
23. Shaw LJ, Raggi P, Schisterman E, Berman DS, Callister TQ. Prognostic value of cardiac risk factors and coronary artery calcium screening for all-cause mortality. Radiology. 2003;228(3):826-833.
24. Taylor AJ, Bindeman J, Feuerstein I, Cao F, Brazaitis M, O’Malley PG. Coronary calcium independently predicts incident premature coronary heart disease over measured cardiovascular risk factors: mean three-year outcomes in the Prospective Army Coronary Calcium (PACC) project. J Am Coll Cardiol. 2005;46(5):807-814.
25. Lehto S, Niskanen L, Suhonen M, Rönnemaa T, Laakso M. Medial artery calcification. A neglected harbinger of cardiovascular complications in non-insulin-dependent diabetes mellitus. Arterioscler Thromb Vasc Biol. 1996;16(8):978-983.
26. Niskanen L, Siitonen O, Suhonen M, Uusitupa MI. Medial artery calcification predicts cardiovascular mortality in patients with NIDDM. Diabetes Care. 1994;17(11):1252-1256.
27. Smith DE, McGraw RW, Taylor DC, et al. Arterial complications and total knee arthroplasty. J Am Acad Orthop Surg. 2001;9(4):253-257.
28. Vandenbussche E, Duranthon L, Couturier M, Pidhorz L, Augereau B. The effect of tourniquet use in total knee arthroplasty. Int Orthop. 2002;26(5):306-309.
29. Fukunda A, Hasegawa M, Kato K, Shi D, Sudo A, Uchida A. Effect of tourniquet application on deep vein thrombosis after total knee thrombosis. Arch Orthop Trauma Surg. 2007;127(8):671-675.
30. Butt U, Samuel R, Sahu A, Butt IS, Johnson DS, Turner PG. Arterial injury in total knee arthroplasty. J Arthroplasty. 2010;25(8):1311-1318.
31. Langkamer VG. Local vascular complications after knee replacement: a review with illustrative case reports. Knee. 2001;8(4):259-264.
32. Hussein A, Uno K, Wolski K, et al. Peripheral arterial disease and progression of coronary atherosclerosis. J Am Coll Cardiol. 2011;57(10):1220-1225.
33. Ouriel K. Peripheral arterial disease. Lancet. 2001;358(9289):1257-1264.
34. Monreal M, Rufz J, Olazabal A, Arias A, Roca J. Deep venous thrombosis and the risk of pulmonary embolism. Chest. 1992;102(3):677-681.
35. Angus PD, Nakielny R, Goodrum DT. The pneumatic tourniquet and deep venous thrombosis. J Bone Joint Surg Br. 1983;65(3):336-339.
36. Fahmy NR, Patel DG. Hemostatic changes and postoperative deep-vein thrombosis associated with use of a pneumatic tourniquet. J Bone Joint Surg Am. 1981;63(3):461-465.
37. Harvey EJ, Leclerc J, Brooks CE, Burke DL. Effect of tourniquet use on blood loss and incidence of deep vein thrombosis in total knee arthroplasty. J Arthroplasty. 1997;12(3):291-296.
38. Simon MA, Mass DP, Zarins CK, Bidani N, Gudas CJ, Metz CE. The effect of a thigh tourniquet on the incidence of deep venous thrombosis after operations on the fore part of the foot. J Bone Joint Surg Am. 1982;64(2):188-191.
39. Stulberg BN, Insall JN, Williams GW, Ghelman B. Deep-vein thrombosis following total knee replacement. An analysis of six hundred and thirty-eight arthroplasties. J Bone Joint Surg Am. 1984;66(2):194-201.
40. Wakankar HM, Nicholl JE, Koka R, D’Arcy JC. The tourniquet in total knee arthroplasty. A prospective, randomized study. J Bone Joint Surg Br. 1999;81(1):30-33.
41. Vince K, Chivas D, Droll K. Wound complications after total knee arthroplasty. J Arthroplasty. 2007;22(4 Suppl 1):39-44.
42. Malinzak RA, Ritter MA, Berend ME, Meding JB, Olberding EM, Davis KE. Morbidly obese, diabetic, younger, and unilateral joint arthroplasty patients have elevated total joint arthroplasty infection rates. J Arthroplasty. 2009;24(6 Suppl):84-88.
43. Labropoulos N, Wang E, Lanier S, Khan SU. Factors associated with poor healing and recurrence of venous ulceration. Plast Reconstr Surg. 2011;129(1):179-186.
44. Ahmed AA, Mooar PA, Kleiner M, Torg JS, Miyamoto CT. Hypertensive patients show delayed wound healing following total hip arthroplasty. PLoS One. 2011;6(8):e23224.
45. Koutsoumbelis S, Hughes AP, Girardi FP, et al. Risk factors for postoperative infection following posterior lumbar instrumented arthrodesis. J Bone Joint Surg Am. 2001;93(17):1627-1633.
46. Poultsides LA, Ma Y, Della Valle AG, Chiu YL, Sculco TP, Memtsoudis SG. In-hospital surgical site infections after primary hip and knee arthroplasty—incidence and risk factors. J Arthroplasty. 2013;28(3):385-389.
Tourniquets are often used in total knee arthroplasty (TKA) to improve visualization of structures, shorten operative time, reduce intraoperative bleeding, and improve cementing technique. Despite these advantages, controversy remains regarding the safety of tourniquet use. Tourniquets have been associated with nerve palsies, vascular injury, and muscle damage.1-5 Some have hypothesized they may cause venous stasis or direct endothelial damage that may develop into deep vein thrombosis (DVT). Abdel-Salam and Eyres6 found an increased incidence of postoperative wound complications and DVTs associated with tourniquet use.
Moreover, investigators have analyzed the role of tourniquets in populations at high risk for wound complications. DeLaurentis and colleagues7 performed a prospective and retrospective analysis of 1182 TKA patients, 24 (2%) of whom had preexisting peripheral vascular disease (PVD), defined as a history of arterial insufficiency, absent dorsalis pedis and/or absent posterior tibial pulsations, and arterial calcifications. A tourniquet was used in each case. Arterial complications occurred in 6 of the 24 patients with PVD. As expected, the authors found that a history of intermittent claudication, pain at rest, and arterial ulcers resulted in a high risk for vascular complications. Further studies have supported this finding and expanded the list of predisposing factors to include previous vascular surgery and absent and asymmetric pedal pulsations.7-11 Of particular concern to total joint arthroplasty surgeons was the finding by DeLaurentis and colleagues7 that patients with radiographic evidence of calcification of the distal superficial femoral artery and/or popliteal artery were at risk for arterial complications. This finding is also supported by other studies.8,11 In TKA, damage to arterial structures proximal to the surgical field could manifest as impaired postoperative wound healing or an ischemic limb. Wound healing depends on adequate blood flow to the healing tissue, and any damage to arterial or venous structures can theoretically compromise this process.
Added to vascular/wound complications as concerning complications in orthopedic surgery is venous thromboembolism (VTE). The role of tourniquets in the formation of VTEs is controversial. A tourniquet has the potential to increase the risk for DVT because of the stasis of venous blood in the lower limb or possible damage to calcified blood vessels. Callam and colleagues12 studied the connection between artery disease and chronic leg ulcers and found that half the patients diagnosed with peripheral artery disease also had stigmata of chronic venous insufficiency. Therefore, the entities can occur in tandem, and surgeons should keep this in mind.
Here we report on a study we conducted to determine whether tourniquet use in TKA in patients with preexisting radiographic evidence of vascular disease increases the risk for wound complications or VTE.
Patients and Methods
We retrospectively reviewed 461 consecutive primary TKAs (373 patients) performed between January 2007 and June 2012 by 2 attending orthopedic surgeons specializing in adult reconstruction. Medical records and operative reports of 583 patients were examined after receiving institutional review board approval. Of these patients, 373 (64%) had a minimum of 12-month follow-up data available. Twelve months was deemed long enough to discover wound complications or DVTs secondary to the index procedure. Most of these outcomes manifest within the first 3 months after surgery and certainly by 12 months. Follow-up longer than 12 months may become a confounder, as wound complications outside the acute to subacute postoperative window could be related to patients’ underlying PVD and not directly to tourniquet use during surgery. Patient demographics and comorbidities were recorded. Comorbidities were obtained from preoperative medical evaluations and surgeons’ preoperative evaluations. All patients had preoperative palpable dorsalis pedis and posterior tibialis arterial pulses. No patient required preoperative vascular studies based on preoperative examination or comorbidities. No patient had prior vascular bypass surgery or stenting.
TKA was performed in a nonlaminar flow, positive-pressure, high-efficiency particulate air-filtered room with sterile toga/surgical helmet systems. For all patients, a pneumatic thigh tourniquet was applied, and the patient was prepared and draped. After limb exsanguination using a rubber bandage, the limb was elevated and the tourniquet inflated to a pressure of 250 to 300 mm Hg. The tourniquet was released either just before closure or immediately after closure in all cases; it was always let down before placement of final bandages.
Prophylactic chemical anticoagulation consisting of warfarin, aspirin, or enoxaparin was used in all patients and continued for 4 to 6 weeks after surgery. All patients received mechanical DVT prophylaxis with sequential compression devices, and all were mobilized out of bed beginning either the day of surgery or the next day. All patients received perioperative intravenous antibiotics, with the preoperative dose given before tourniquet inflation and the last postoperative dose stopped within 24 hours of surgery.
All patients who had primary TKA underwent preoperative medical evaluation and optimization. The patient’s hospital course was monitored closely, and complications noted by the orthopedic team were documented. Follow-up documentation was retrospectively reviewed for evidence of wound complications or VTE. Wound complications were defined as cellulitis, delayed wound healing, wound dehiscence, and/or periprosthetic joint infection. In the case of VTE, physical examination findings were not sufficient for inclusion. Venous duplex ultrasonography demonstrating the clot was reviewed before inclusion.
Preoperative radiographs were examined for arterial calcification (Figure). We refer to calcification seen above the knee joint as proximal calcification and to calcification observed below the joint as distal calcification. Patients exhibited calcification proximally only, distally only, or both proximally and distally. The 373 patients were placed into 2 groups based on whether they had preoperative arterial calcification on plain radiography of the knee. One group (285 patients with no radiographic evidence of preoperative knee arterial calcification) underwent 365 TKAs, and the other group (88 patients with radiographic evidence of preoperative knee arterial calcification) underwent 96 TKAs.
A sample size calculation was performed to determine how many patients were needed in each group with 80% power and an α of 0.05. With an estimated difference in VTE/wound complication rate between the calcification and no-calcification groups of 12%, we needed to review 316 TKAs total. This 12% difference was based on study findings of a 25% complication rate in PVD patients who underwent tourniquet-assisted TKA, and the rate of VTE/wound complication after TKA in patients overall, which can be up to 12%.7,13,14 We exceeded minimal enrollment and had 461 TKAs. Descriptive statistics were reported, with means and ranges provided where appropriate. Independent t test was used to evaluate the differences in continuous data (age) between the groups. Univariate analysis (using Pearson χ2 and Fisher exact tests) and multivariate logistic regression analysis were used to evaluate the effects of categorical variables (sex, comorbidity, calcification [presence, absence], and location of calcification [proximal only, distal only, both]) on wound complication and VTE rates. All tests were 2-tailed and performed with a type I error rate of 0.05. Data analysis was performed with SPSS Version 19.0 (SPSS).
Results
Patient characteristics are summarized in Table 1. Of the 373 patients, 285 lacked calcification, and 88 had calcification. Mean age was 67.73 years (range, 24-92 years) for all patients, 65.99 years (range, 24-89 years) for the no-calcification group, and 74.32 years (range, 54-92 years) for the calcification group; the calcification group demonstrated a trend toward older age, but the difference was not significantly different (P = .07). Of the 373 patients, 156 (41.82%) were male: 110 in the no-calcification group (38.60%) and 46 in the calcification group (52.27%); sex was significantly (P = .002) different between groups, with more males in the calcification group.
![]()
Data on total preoperative comorbidities are summarized in Table 2. Hypertension, hyperlipidemia, diabetes, and coronary artery disease (CAD) were the most common comorbidities, and they were all significantly (P ≤ .05) increased in the calcification group.
No patients had reported arterial complications, such as arterial bleeding, aneurysm, intimal tears, or loss of distal pulses. Wound complication after TKA was detected in 3.04% of all cases (Table 3). Rate of DVT after TKA was 2.60% of all cases, and rate of pulmonary embolism after TKA was 2.17% of all cases. Of the 96 TKAs with preoperative radiographic evidence of calcification, 47 (48.96%) had proximal calcification only, 11 (11.46%) had distal calcification only, and 38 (39.58%) had both proximal and distal calcification (Table 4). There was no significant difference between the rate of wound complication or VTE based on location of vascular calcification.
Univariate analysis demonstrated that presence of arterial knee calcification did not increase the risk for postoperative wound complication (odds ratio [OR], 1.04; 95% confidence interval [CI], 0.28-3.80; P > .05) (Table 5). Location of arterial knee calcification also did not increase the risk for postoperative wound complication. In addition, univariate analysis demonstrated that presence of arterial knee calcification did not increase the risk for postoperative VTE (OR, 1.20; 95% CI, 0.43-3.36; P > .05 (Table 6).
Of the 14 wound complications, the most common infections were cellulitis (5/14 cases; 35.71%) and infected hardware that required component revision (5/14 cases; 35.71%). Mean time from TKA to infection was 137.93 days (range, 5-783 days). The most common organism grown in culture from the wound was Staphylococcus (5/14 cases; 35.71%).
Additional univariate statistical analysis revealed that presence of diabetes, hypertension, prior VTE, CAD, and male sex was linked to higher incidence of wound complication (P < .05) (Table 5). When multivariate analysis was performed, hypertension, prior VTE, and male sex remained significant (P < .05) (Table 5).
Discussion
TKA is a safe and effective procedure used to treat osteoarthritis of the knee and improve patients’ quality of life.15 About 700,000 TKAs are performed annually in the United States.16 Because of improvements in preventive medicine and medical technology, life expectancy is increasing, and TKAs are now being performed in higher numbers and in an older patient population. Over the next few decades, these developments will lead to more postoperative complications. It is projected that, by 2030, the need for TKAs in the United States will increase by 673% to 3.48 million.17 Postoperative complications are rare but unfortunately often lead to poor outcomes or even mortality.18 To help minimize the number of postoperative complications, we must understand the safety of tourniquet use in TKA. Other investigators have concluded that tourniquet use is unsafe in patients with preoperative vascular calcifications on plain radiographs.7,8,11 The present study, designed to elucidate whether preoperative evidence of knee arterial calcification may predispose TKA patients to postoperative wound complication or VTE, had some important findings.
In our study, wound complication and VTE occurred in a considerable number of patients after TKA. Despite exceeding the number of patients calculated by the power analysis, our population may have been inadequate to fully detect statistical significance. Thus, our conclusion of failing to reject the null hypothesis may have been because of sample size, a type II error. We found that, after primary TKA, 3.04% of patients developed wound complications and 4.77% VTE. According to the literature, the incidence of infection after primary TKA is between 0.5% and 12%, and that of VTE reported within 3 months after TKA is 1.3% to 10%.13,14 Although we had 100% VTE prophylaxis, meeting the standard of care, VTE after TKA remains a postoperative complication.19 This study also found that a considerable percentage of primary TKA patients (23.59%) had preoperative calcification of the knee arteries. To our knowledge, this study was the first to quantify the incidence of knee arterial calcification in patients who underwent TKA.
Preoperative calcification of the knee arteries in patients who underwent TKA did not increase the risk for wound complication, VTE, or arterial damage. These calcifications, however, do pose an increased systemic vascular risk.20 Calcification of the vascular wall predicts increased cardiovascular risk, independent of classical cardiovascular risk factors.3,18,21-24 Clinically, patients who have both diabetes and calcifications are at significant excess risk for total mortality, stroke mortality, and cardiovascular mortality, compared with patients with diabetes but without such calcifications. They also had a significantly higher incidence of coronary heart disease events, stroke events, and lower extremity amputations.25,26
All our patients underwent tourniquet-assisted TKA. Although previous studies have indicated that tourniquet use may increase arterial complications and wound complications or even limb loss in patients with calcified arteries, we did not find this link.7,27 Our population had no reported arterial complications related to tourniquet use. Other, smaller studies have had similar findings. Vandenbussche and colleagues28 prospectively studied 80 TKA cases randomized to tourniquet use or no tourniquet use and found no postoperative nerve palsies, wound infections, wound healing problems, or hematomas. Our study is also in accord with studies that have reported tourniquet use did not increase risk for DVT.29 Therefore, unlike earlier data, our data demonstrated that tourniquet use in patients with knee arterial calcification was safe.7,27,30,31
Patients with calcification were more likely to have the medical comorbidities of hypertension, diabetes, hyperlipidemia, and CAD. All these comorbidities are linked to the development of arterial calcification, or atherosclerotic occlusive disease.32,33 As life expectancy and the need for TKA increase, it is likely that a larger percentage of TKA patients will have preoperative radiographic evidence of knee arterial calcification. Although current dogma is that tourniquet-assisted TKA is contraindicated for patients with preoperative radiographic evidence of femoral-popliteal calcification, our study results showed that this calcification should not affect preoperative TKA planning for these patients.
We divided our patients into 3 categories: those with proximal calcification (above the joint line), those with distal calcification (below the joint line), and those with both proximal and distal calcification. Location of arterial calcification did not have an effect on their rates of postoperative wound complication or VTE. We hypothesized that patients with proximal calcification would be at increased risk for direct arterial injury and subsequent wound complication because the tourniquet is placed proximally. Previous research has indicated that arterial occlusion and subsequent wound complication can occur because of low blood flow stemming from tourniquet use.7 Further, intraoperative manipulation (flexing) of a knee with calcified vessels causes arterial complications after TKA because these vessels are less elastic than nonatheromatous vessels.31 However, we found no such effect. At the same time, having arterial calcification might also be an indication of venous disease in this location,12 which may be especially important for proximal calcifications. Proximal DVT more likely is a precursor to pulmonary embolic events than distal DVT is.31,34 However, we found no difference in VTE rates among the 3 arterial location groups, which is supported by studies that have found that tourniquet use does not increase DVT incidence.29,35-40
Risk for wound complications was higher in male patients and in patients with diabetes, prior VTE, hypertension, or CAD. This finding is important because, with the increasing age of patients who undergo TKA, those with serious medical comorbidities will continue to need and have this surgery.17 Diabetes may increase the rate of wound complication because patients with diabetes have poor microcirculation, poor collagen synthesis, and reduced wound strength.41 Malinzak and colleagues42 demonstrated that, compared with patients without diabetes, those with diabetes had a significantly higher risk for infection after TKA. Prior VTE, specifically DVT, may increase the rate of wound complication because after DVT the deep veins may be damaged and exhibit valvular dysfunction. Labropoulos and colleagues43 showed that DVT history was strongly associated with ulcer nonhealing. Perhaps hypertension has been overlooked as a risk factor for wound complication in TKA. No previous studies have assessed the link between hypertension and wound complications after TKA. However, a study of wound healing after total hip arthroplasty found that, compared with normotensive patients, hypertensive patients had delayed wound healing, putting them at higher risk for infection.44 In addition, we found that patients with CAD were at increased risk for wound complications—an unexpected finding, as CAD traditionally is not a risk factor for infection or poor wound healing. Recently, however, CAD was identified as an independent risk factor for surgical site infections in posterior lumbar–instrumented arthrodesis.45 The etiology of this association is unknown. Also, male patients were at increased risk for wound complication. Male sex has been implicated as an independent risk factor for development of surgical site infections and has been established as an important predisposing factor for periprosthetic joint infections.46
It is possible that patients who present with diabetes, VTE, hypertension, or CAD before TKA should have a consultation with a vascular surgeon or should have TKA performed without a tourniquet, but this conclusion cannot be considered definitive without a large prospective randomized trial or possibly registry data. Our data indicate that patients with these comorbidities have higher rates of wound complications irrespective of preoperative radiographic calcifications. On the basis of our study results, however, we certainly recommend that patients with these risk factors have preoperative medical optimization. Orthopedic surgeons should take a thorough history and perform a meticulous physical examination on these patients to look for evidence of PVD. We recommend that, if vascular claudication is elicited in the history, or if there is evidence of peripheral arterial disease—such as hair loss, skin discoloration, dystrophic nail changes, or absent or unequal peripheral pulses—the ankle-brachial index test should be performed. If the index value is less than 0.9, then a preoperative vascular surgery consultation should be obtained.
This study had some weaknesses. First, it was retrospective, so it is possible that some wound or VTE complications were not reported and thus not found in the paper charts or electronic medical records. Some patients may have had VTE diagnostic scans at other hospitals, and their results may not have been recorded across databases. Moreover, some patients may have seen wound specialists for wound infections or wound healing problems, and these may not have been reported to the orthopedic surgeons. Second, though our patient population was not small, it may not have been of adequate size to fully detect statistical significance. We met our enrollment numbers based on our sample size calculations from an a priori power analysis; however, we still draw conclusions with the possibility of committing a type II error in mind by failing to reject the null hypothesis when in reality a statistically significant difference does exist. Third, none of our consecutive patients carried the preoperative diagnosis of PVD, and none had preoperative vascular surgery. Therefore, though calcifications were noted on radiographs, clinically our patients were asymptomatic with respect to vascular health. Last, the 2 groups were not randomized. All patients underwent tourniquet-assisted TKA.
Conclusion
To our knowledge, this is the largest study to examine the effect of preoperative knee arterial calcification on wound complication and VTE after tourniquet-assisted TKA. Contrary to previously published recommendations, we conclude that TKA can be safely performed with a tourniquet in the presence of preoperative radiographic evidence of such calcification. However, we recommend that patients with diabetes, hypertension, CAD, or prior VTE undergo an appropriate physical examination to elicit any signs or symptoms of vascular disease. If before surgery there is any question of vascular competence, a vascular surgeon should be consulted.
1. Guanche CA. Tourniquet-induced tibial nerve palsy complicating anterior cruciate ligament reconstruction. Arthroscopy. 1995;11(5):620-622.
2. Irvine GB, Chan RN. Arterial calcification and tourniquets. Lancet. 1986;2(8517):1217.
3. Patterson S, Klenerman L. The effect of pneumatic tourniquets on the ultrastructure of skeletal muscle. J Bone Joint Surg Br. 1979;61(2):178-183.
4. Rorabeck CH, Kennedy JC. Tourniquet-induced nerve ischemia complicating knee ligament surgery. Am J Sports Med. 1980;8(2):98-102.
5. Shenton DW, Spitzer SA, Mulrennan BM. Tourniquet-induced rhabdomyolysis. A case report. J Bone Joint Surg Am. 1990;72(9):1405-1406.
6. Abdel-Salam A, Eyres KS. Effects of tourniquet during total knee arthroplasty. A prospective randomised study. J Bone Joint Surg Br. 1995;77(2):250-253.
7. DeLaurentis DA, Levitsky KA, Booth RE, et al. Arterial and ischemic aspects of total knee arthroplasty. Am J Surg. 1992;164(3):237-240.
8. Holmberg A, Milbrink J, Bergqvist D. Arterial complications and knee arthroplasty. Acta Orthop Scand. 1996;67(1):75-8.
9. Hozack WJ, Cole PA, Gardner R, Corces A. Popliteal aneurysm after total knee arthroplasty. Case reports and review of the literature. J Arthroplasty. 1990;5(4):301-305.
10. Kumar SN, Chapman JA, Rawlins I. Vascular injuries after total knee arthroplasty: a review of the problem with special reference to the possible effects of the tourniquet. J Arthroplasty. 1998;13(2):211-216.
11. Rush JH, Vidovich JD, Johanson MA. Arterial complications and total knee arthroplasty. The Australian experience. J Bone Joint Surg Br. 1987;69(3):400-402.
12. Callam MJ, Harper DR, Dale JJ, Ruckley CV. Arterial disease in chronic leg ulceration: an underestimated hazard? Lothian and Forth Valley Leg Ulcer Study. Br Med J (Clin Res Ed). 1987;294(6577):929-931.
13. Blom AW, Brown J, Taylor AH, Pattison G, Whitehouse S, Bannister GC. Infection after total knee arthroplasty. J Bone Joint Surg Br. 2004;86(5):688-691.
14. Geerts WH, Bergqvist D, Pinco G, et al. Prevention of venous thromboembolism. Chest. 2008;133(6 suppl):381S-453S.
15. Pulido L, Parvizi J, Macgibeny M, et al. In hospital complications after total joint arthroplasty. J Arthroplasty. 2008;23(6 Suppl 1):139-145.
16. Arthritis: data and statistics. Centers for Disease Control and Prevention website. http://www.cdc.gov/arthritis/data_statistics.htm. Updated March 11, 2015. Accessed July 27, 2015.
17. Kurtz S, Ong K, Lau E, Mowat F, Halpern M. Projections of primary and revision hip and knee arthroplasty in the United States from 2005 to 2030. J Bone Joint Surg Am. 2007;89(4):780-785.
18. Pulido L, Ghanem E, Joshi A, Purtill JJ, Parvizi J. Periprosthetic joint infection: the incidence, timing, and predisposing factors. Clin Orthop Relat Res. 2008;466(7):1710-1715.
19. Warwick D. Prevention of venous thromboembolism in total knee and hip replacement. Circulation. 2012;125(17):2151-2155.
20. Rennenberg RJ, Kessels AG, Schurgers LJ, van Engelshoven JM, de Leeuw PW, Kroon AA. Vascular calcifications as a marker of increased cardiovascular risk: a meta-analysis. Vasc Health Risk Manag. 2009;5(1):185-197.
21. Arad Y, Goodman KJ, Roth M, Newstein D, Guerci AD. Coronary calcification, coronary disease risk factors, C-reactive protein, and atherosclerotic cardiovascular disease events: the St. Francis Heart Study. J Am Coll Cardiol. 2005;46(1):158-165.
22. Iribarren C, Sidney S, Sternfeld B, Browner WS. Calcification of the aortic arch: risk factors and association with coronary heart disease, stroke, and peripheral vascular disease. JAMA. 2000;283(21):2810-2815.
23. Shaw LJ, Raggi P, Schisterman E, Berman DS, Callister TQ. Prognostic value of cardiac risk factors and coronary artery calcium screening for all-cause mortality. Radiology. 2003;228(3):826-833.
24. Taylor AJ, Bindeman J, Feuerstein I, Cao F, Brazaitis M, O’Malley PG. Coronary calcium independently predicts incident premature coronary heart disease over measured cardiovascular risk factors: mean three-year outcomes in the Prospective Army Coronary Calcium (PACC) project. J Am Coll Cardiol. 2005;46(5):807-814.
25. Lehto S, Niskanen L, Suhonen M, Rönnemaa T, Laakso M. Medial artery calcification. A neglected harbinger of cardiovascular complications in non-insulin-dependent diabetes mellitus. Arterioscler Thromb Vasc Biol. 1996;16(8):978-983.
26. Niskanen L, Siitonen O, Suhonen M, Uusitupa MI. Medial artery calcification predicts cardiovascular mortality in patients with NIDDM. Diabetes Care. 1994;17(11):1252-1256.
27. Smith DE, McGraw RW, Taylor DC, et al. Arterial complications and total knee arthroplasty. J Am Acad Orthop Surg. 2001;9(4):253-257.
28. Vandenbussche E, Duranthon L, Couturier M, Pidhorz L, Augereau B. The effect of tourniquet use in total knee arthroplasty. Int Orthop. 2002;26(5):306-309.
29. Fukunda A, Hasegawa M, Kato K, Shi D, Sudo A, Uchida A. Effect of tourniquet application on deep vein thrombosis after total knee thrombosis. Arch Orthop Trauma Surg. 2007;127(8):671-675.
30. Butt U, Samuel R, Sahu A, Butt IS, Johnson DS, Turner PG. Arterial injury in total knee arthroplasty. J Arthroplasty. 2010;25(8):1311-1318.
31. Langkamer VG. Local vascular complications after knee replacement: a review with illustrative case reports. Knee. 2001;8(4):259-264.
32. Hussein A, Uno K, Wolski K, et al. Peripheral arterial disease and progression of coronary atherosclerosis. J Am Coll Cardiol. 2011;57(10):1220-1225.
33. Ouriel K. Peripheral arterial disease. Lancet. 2001;358(9289):1257-1264.
34. Monreal M, Rufz J, Olazabal A, Arias A, Roca J. Deep venous thrombosis and the risk of pulmonary embolism. Chest. 1992;102(3):677-681.
35. Angus PD, Nakielny R, Goodrum DT. The pneumatic tourniquet and deep venous thrombosis. J Bone Joint Surg Br. 1983;65(3):336-339.
36. Fahmy NR, Patel DG. Hemostatic changes and postoperative deep-vein thrombosis associated with use of a pneumatic tourniquet. J Bone Joint Surg Am. 1981;63(3):461-465.
37. Harvey EJ, Leclerc J, Brooks CE, Burke DL. Effect of tourniquet use on blood loss and incidence of deep vein thrombosis in total knee arthroplasty. J Arthroplasty. 1997;12(3):291-296.
38. Simon MA, Mass DP, Zarins CK, Bidani N, Gudas CJ, Metz CE. The effect of a thigh tourniquet on the incidence of deep venous thrombosis after operations on the fore part of the foot. J Bone Joint Surg Am. 1982;64(2):188-191.
39. Stulberg BN, Insall JN, Williams GW, Ghelman B. Deep-vein thrombosis following total knee replacement. An analysis of six hundred and thirty-eight arthroplasties. J Bone Joint Surg Am. 1984;66(2):194-201.
40. Wakankar HM, Nicholl JE, Koka R, D’Arcy JC. The tourniquet in total knee arthroplasty. A prospective, randomized study. J Bone Joint Surg Br. 1999;81(1):30-33.
41. Vince K, Chivas D, Droll K. Wound complications after total knee arthroplasty. J Arthroplasty. 2007;22(4 Suppl 1):39-44.
42. Malinzak RA, Ritter MA, Berend ME, Meding JB, Olberding EM, Davis KE. Morbidly obese, diabetic, younger, and unilateral joint arthroplasty patients have elevated total joint arthroplasty infection rates. J Arthroplasty. 2009;24(6 Suppl):84-88.
43. Labropoulos N, Wang E, Lanier S, Khan SU. Factors associated with poor healing and recurrence of venous ulceration. Plast Reconstr Surg. 2011;129(1):179-186.
44. Ahmed AA, Mooar PA, Kleiner M, Torg JS, Miyamoto CT. Hypertensive patients show delayed wound healing following total hip arthroplasty. PLoS One. 2011;6(8):e23224.
45. Koutsoumbelis S, Hughes AP, Girardi FP, et al. Risk factors for postoperative infection following posterior lumbar instrumented arthrodesis. J Bone Joint Surg Am. 2001;93(17):1627-1633.
46. Poultsides LA, Ma Y, Della Valle AG, Chiu YL, Sculco TP, Memtsoudis SG. In-hospital surgical site infections after primary hip and knee arthroplasty—incidence and risk factors. J Arthroplasty. 2013;28(3):385-389.
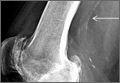
Role of Surgical Dressings in Total Joint Arthroplasty: A Randomized Controlled Trial
Wound complications (eg, delayed wound healing, blisters, prolonged drainage) have been reported in up to 30% of patients who undergo elective total joint arthroplasty (TJA).1-6 Wound complications increase resource utilization, lengthen hospital stays, and increase costs.7-9 Prolonged wound healing and persistent wound drainage are also harbingers of both superficial and deep surgical site infections.5-11
In several studies, wound complications after TJA were the primary reason for hospital readmissions.12-15 As part of the Patient Protection and Affordable Care Act, hospitals will be penalized by the Centers for Medicaid & Medicare Services for unplanned hospital readmissions within 30 days after TJA. It is imperative, then, to reduce the risk factors and complications associated with surgical site infections to decrease unplanned readmissions.
Historically, little attention has been given to the role of surgical dressings and the effect of dressings on wound healing. Although many subspecialties (eg, cardiothoracic surgery, general surgery) have reported benefits in using occlusive dressings, adoption in TJA has been slow.16-18 At our institution about 5 years ago, we began using an occlusive silver-impregnated barrier dressing based on preliminary data from studies showing benefits of occlusive dressings in TJA.19,20
We conducted a study to determine if use of occlusive antimicrobial barrier dressings decreases rates of wound complications in TJA. We had 3 research questions: Compared with standard surgical dressings, are occlusive dressings associated with decreased rates of wound complications after TJA? Is there a difference in number of dressing changes required between the 2 dressing types? Is satisfaction higher for patients with occlusive dressings than for patients with standard dressings?
Patients and Methods
This randomized controlled trial (RCT) was reviewed and approved by the Institutional Review Board at Carolinas Healthcare. Patients were randomized by the research staff using a parallel, 1:1 allocation method. The randomization table was generated using a random number generator.
An a priori sample size estimate was made using a 2-tailed Fisher exact test with a .05 level of significance. Based on a study by Clarke and colleagues,21 we estimated the incidence of wound problems at 3% in the occlusive dressing (study) group and 13% in the standard dressing (control) group. We determined that 260 participants (130 per group) would be needed to achieve 80% power. We considered a 15% attrition rate for a total enrollment goal of 300 study participants (150 per group).
Between December 2010 and January 2013, patients presenting for either primary total hip arthroplasty (THA) or primary total knee arthroplasty (TKA) were recruited to participate in the study. Eligibility criteria (Table 1) were reviewed, and patients were enrolled by the senior surgeons, Dr. Springer, Dr. Beaver, Dr. Griffin, and Dr. Mason. All eligible participants who provided informed consent were randomized to receive either an occlusive antimicrobial barrier dressing (Aquacel Ag, ConvaTec) or standard surgical dressing (Primapore, Smith & Nephew). The occlusive dressing (Figure 1) consists of an outer barrier layer of hydrocolloid and a central island of hydrofiber, which absorbs and locks in any wound exudate within the fibers and prevents the creation of an overly moist wound environment that can lead to skin maceration and wound breakdown. In addition, the hydrofibers are embedded with ionic silver, which is released only at the site of wound exudate, or drainage; thus, there is no continuous exposure of the entire wound to silver. The standard dressing (Figure 2) consists of a central island of gauze enclosed in low-allergy acrylic adhesive tape.
All surgical dressings were placed over a closed incision in a sterile environment in the operating room after the procedure. The groups’ wound closures were identical.
A posterior approach was used for all THAs. The deep fascia was closed with a running barbed suture (Quill, Angiotech), the deep subcutaneous tissue with No. 1 Vicryl suture (Ethicon), and the superficial subcutaneous layer with 2-0 Vicryl suture. A running 3-0 Monocryl stitch (Ethicon) was placed in the subcuticular layer and was followed with a skin adhesive (Dermabond, Ethicon). A closed suction drain, removed on postoperative day (POD) 1, was used for all THAs.
A standard medial parapatellar arthrotomy was used for all TKAs. The arthrotomy was closed with a running barbed suture, the deep subcutaneous tissue with No. 1 Vicryl suture, and the superficial subcutaneous layer with 2-0 Vicryl suture. A running 3-0 Monocryl stitch was placed in the subcuticular layer and was followed with a skin adhesive. A closed suction drain was also used. In addition, a compressive wrap was placed over the dressing in the operating room and was removed the next morning. During the hospital stay, the surgical site was evaluated daily with a standard wound evaluation form.
In the standard dressing group, the bandage was removed for wound evaluation on POD 2, and the dressing was changed every other day during the hospital stay. The dressing was also changed as needed for wound drainage (Figure 3) or other minor wound-healing concerns.
In the occlusive dressing group, the dressing design allowed the dressing to remain in place for about 7 days. It was removed by a home health nurse during a visit closest to but not before the 7-day mark. In addition, it was changed at surgeon discretion if there were concerns about wound drainage or wound healing. For the occlusive barrier, wound drainage was evaluated by strike-through of drainage on the back side of the dressing (Figure 4). If more than 50% of the dressing was saturated, the bandage was changed and the wound evaluated. If there were no immediate concerns about wound complications (eg, infection, blistering), a new occlusive dressing was placed. Because the occlusive dressing was waterproof, patients in the study group were able to shower immediately after surgery. In the control group, patients were allowed to shower if the surgical dressing was kept dry, as the bandage was not waterproof.
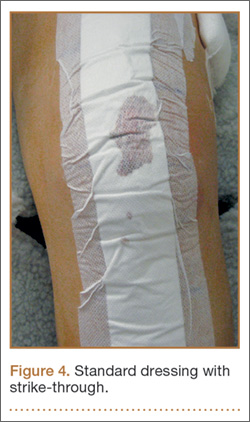
Per the study protocol, all patients were discharged home and followed by a single home health agency. Mean hospital stay was 3 days (range, 0-8 days), which did not differ significantly between groups (P = .133). All home health nurses were trained in evaluation of postsurgical wounds and were aware of the study requirements. The nurses visited all patients 3 days a week until the scheduled 4-week postoperative follow-up with the treating physician or physician assistant. At each visit, the nurse evaluated the wound and surrounding skin using a standard wound document. Dressings were changed based on the criteria we have described. Concerns about wound status (eg, drainage, blistering, erythema) prompted removal of the dressing for further evaluation. The physician was notified of concerns about wound healing, which prompted an office visit for evaluation. The dressing remained in place for a minimum of 7 days but in all cases was removed as close to 7 days as possible, depending on the scheduled nursing visits. Once uneventful wound healing was complete, no further dressing was required. A final wound evaluation was conducted by the surgeon at the 4-week postoperative evaluation.
The primary outcome measure was wound complication (dichotomous variable). Wounds were assessed by describing the amount, type, and color of exudate (Figure 5). The appearance of the wound margins and the surrounding skin was also assessed. Because wounds could not be directly visualized in the occlusive dressing group, drainage (indicated by strike-through) was used as a measure of possible wound complications, prompting removal and full evaluation.

Secondary endpoints included additional wound treatment or surgical procedures for wound complications, number of dressing changes, and patient satisfaction. Patients completed a satisfaction questionnaire at each wound assessment (Figure 6). Using a visual analog scale (VAS), they rated their satisfaction with their ability to perform activities of daily living (personal hygiene, change clothes, sit comfortably, sleep comfortably), drawing a line on the VAS at a point between 0 (totally unsatisfied) and 100 (totally satisfied) for each satisfaction measure. This line was measured and recorded by the study coordinator. The 4 satisfaction measures were averaged for a composite satisfaction measure.

All statistical analyses were conducted using SAS Version 9.2 (SAS Institute). Standard univariate descriptive statistics (means, standard deviations, frequencies, proportions) were calculated and reported. Differences in mean values for continuous data were assessed with independent t test or Wilcoxon rank sum test. Chi-square test and Fisher exact test were used to determine differences between groups for categorical or dichotomous variables. A significance level of .05 was used for all statistical tests.
Results
The 300 patients who consented to participate in the study were randomized to receive either occlusive dressing or standard dressing. After randomization, 38 patients (15 occlusive, 23 standard) were withdrawn from the study (Table 2), leaving a final dataset of 262 patients, 141 in the occlusive group (67 THAs, 74 TKAs) and 121 in the standard group (49 THAs, 72 TKAs). There were no differences in proportion of THAs or TKAs, age, sex, or body mass index between the occlusive and standard groups (Table 3).
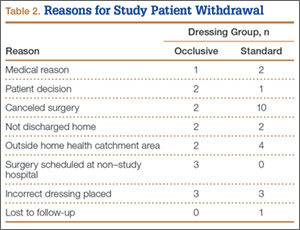
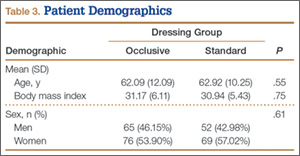
There were statistically significantly (P = .015) fewer wound complications in the occlusive dressing group (10%) than in the standard dressing group (22%). Blisters at or around the wound site were reported in significantly (P = .026) fewer patients with occlusive dressing (1/141, 0.7%) than standard dressing (7/121, 6%). Additional wound care was required in 9 patients (7%) in the standard group and 6 patients (4%) in the occlusive group (P = .27). Two patients (1.7%) in the standard group were readmitted for treatment of wound dehiscence; no one in the occlusive group was readmitted to the hospital or had to return to the operating room for treatment of a wound complication. The difference was not statistically significant (P = .13). There were also no significant (P = .81) differences in rate of wound complications between THA and TKA patients.
There were statistically significantly (P < .0001) fewer dressing changes in the occlusive dressing group. Mean number of dressing changes was 0.14 (median, 0; interquartile range, 0-0) in the occlusive group and 2.8 (median, 2; interquartile range, 1-3) in the standard group.
Compared with patients in the standard dressing group, patients in the occlusive dressing group reported significantly higher satisfaction scores. Mean overall patient satisfaction score was 92 in the occlusive group and 81 in the standard group (P < .0001). Patients in the occlusive group were more satisfied with their ability to take care of their personal hygiene, to change clothes, and to sit and sleep comfortably (Table 4).
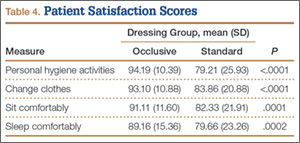
Discussion
Wound complications after TJA are common, occurring in up to 30% of patients,1-6 and are associated with development of superficial and deep surgical site infections, increased resource utilization, and longer hospital stays.5-11 Although the role of surgical dressings has received little attention in TJA practice, other subspecialties have found that occlusive barrier dressings can reduce wound complications and promote wound healing.16,17 Mitotic cell division and leukocyte activity, which are critical in wound healing, increase under occlusive dressings. This cellular activity is disrupted with every dressing change, delaying wound healing (biological activity takes 3-4 hours to resume).22 In addition, occlusive dressings increase hypoxia, which promotes angiogenesis and accelerates wound healing.23
Despite being a prospective RCT, this study had several limitations. Because of the need to evaluate wounds and obvious differences between the 2 dressings (eg, color, ability to shower), it was not possible to blind the patient or surgeon to the dressing used. When rating satisfaction, patients were not able to directly compare the 2 dressings. The primary endpoint of the study was the complication rate; however, the deep periprosthetic infection rate may be a superior endpoint and would require a much larger study. Although we assumed that wound complications may be harbingers for periprosthetic infections, no patient in either group developed periprosthetic infection. Therefore, we cannot conclude that surgical dressings play a role in reducing infections. In addition, as the standard dressing was changed on POD 2 (per standard protocol) and the occlusive dressing could remain in place for up to 7 days, there was a selection bias in the evaluation of the number of dressing changes. However, given the characteristics of the standard dressing (eg, tape, gauze, nonocclusive), leaving it in place after POD 2 is not optimal. Therefore, we would expect to see a difference in the number of dressing changes. We think this comparison remains valid, as occlusive dressings were changed when there were indications of wound problems (eg, excessive drainage [strike-through], surrounding erythema, blistering). With an average of less than 1 dressing change in the occlusive group, we think this is a surrogate for uneventful wound healing and decreased wound complication, and our data support this. It is also important to test both dressing durability and patient tolerance for wearing a single dressing for 7 days.
Our RCT results showed that, compared with a standard dressing, an occlusive antimicrobial dressing was associated with a significant decrease in overall wound complications and blisters. These findings are similar to those of other studies of occlusive dressings in a number of surgical subspecialties.16,18 In an RCT of 200 patients who underwent elective and nonelective hip and knee surgery and were randomized to either absorbent perforated dressing with adhesive border (Cutiplast, Smith & Nephew) or Aquacel (ConvaTec) covered with vapor-permeable dressing (Tegaderm, 3M), Ravenscroft and colleagues20 found that Aquacel-plus-Tegaderm was 5.8 times more likely than Cutiplast to produce an uncompromised wound. Similarly, in an RCT of hydrofiber (Aquacel) and central pad (Mepore, Mölnlycke) dressings after primary THA and TKA, Abuzakuk and colleagues19 found significantly fewer dressing changes (43% vs 77%) and blisters (13% vs 26%) in the hydrofiber group than in the pad group.
Hopper and colleagues24 compared 50 consecutive patients treated with modern dressings (Aquacel) with 50 historical control patients treated with traditional surgical dressings (Mepore). Blisters developed in 20% of the patients in the traditional group and 4% of patients in the modern group (P = .028). The authors concluded that adverse outcomes of wound healing can be minimized with modern dressings.
A recent retrospective study by Cai and colleagues25 evaluated the incidence of acute periprosthetic infection (≤3 months after surgery) with use of occlusive (Aquacel) and standard dressings. Incidence of acute periprosthetic infection was 0.44% in the occlusive group and 1.7% in the standard group (P = .005). Incidence of wound-healing problems was not evaluated.
Our second aim in the present study was to evaluate the number of dressing changes required. There were significantly fewer dressing changes in the occlusive dressing group than in the standard dressing group. Therefore, wear time (amount of time a single dressing remains in place) was substantially longer for the occlusive group. In the study by Hopper and colleagues,24 wear time was significantly shorter for the traditional dressing than for the modern dressing (2 vs 7 days; P < .001), and the traditional dressing required more changes (3 vs 0; P < .001).
These findings are important for several reasons. Standard surgical dressings often require frequent changes. If left in place, they create an excessively moist wound environment that promotes blistering and delays wound healing. However, frequent dressing changes expose the wound and increase the risk for surgical site infection.26 A barrier dressing left in place from time of surgery prevents bacteria from entering and contaminating a healing wound. A study by Clarke and colleagues21 demonstrated higher skin colonization rates for patients who had dressings changed on POD 1 than for patients who had their first dressing change on POD 6.
Our third study aim was to evaluate patient satisfaction with surgical dressings. The orthopedic literature has little on this topic.23 Blisters and other wound complications can negatively affect satisfaction.2,3 Our data showed significant improvement in satisfaction, particularly regarding sterility and hygiene.
Other surgical subspecialties have found similar improvement in patient satisfaction with occlusive barrier dressings. In an RCT of 88 pediatric patients, Rasmussen and colleagues27 found that patients reported significantly less pain during changes of an occlusive adhesive dressing (Duoderm, ConvaTec) than during changes of a conventional Steristrip (3M) plus Cutiplast. According to the authors, the occlusive wound dressing seemed to minimize the physical and psychological trauma to the infant or child and lessen disruption of the child’s and the parents’ daily routines, because the children could be bathed immediately after surgery.
Our study did not specifically address cost. Cai and colleagues25 estimated that, if the Aquacel dressing were routinely used in every hip and knee arthroplasty, it would add about $27 million in cost. However, this must be balanced by the cost of managing infection after TJA. In the United States, at an estimated $50,000 to $100,000 per case and an annual incidence of 1% to 2%, the low-end cost for the treatment of periprosthetic infection would be $500 million.28 Cai and colleagues25 found a 4-fold reduction in periprosthetic infection when use of occlusive dressings was implemented. In addition, wound complications remain the number one reason for hospital readmission after TJA.12,13 Cost of hospital readmission, as well as financial penalties to institutions for unplanned readmission for wound complications, must be considered.
Conclusion
Our RCT results demonstrated that use of occlusive antimicrobial barrier dressings (vs standard surgical dressings) significantly reduced wound complications and dressing changes and improved overall patient satisfaction. These findings are similar to those in the literature on TJA and other surgical subspecialties. We conclude that occlusive surgical dressings reduce wound complications after TJA.
1. Cosker T, Elsayed S, Gupta S, Mendonca AD, Tayton KJ. Choice of dressing has a major impact on blistering and healing outcomes in orthopaedic patients. J Wound Care. 2005;14(1):27-29.
2. Koval KJ, Egol KA, Hiebert R, Spratt KF. Tape blisters after hip surgery: can they be eliminated completely? Am J Orthop. 2007;36(5):261-265.
3. Lawrentschuk N, Falkenberg MP, Pirpiris M. Wound blisters post hip surgery: a prospective trial comparing dressings. ANZ J Surg. 2002;72(10):716-719.
4. Mihalko WM, Manaswi A, Brown TE, Parvizi J, Schmalzried TP, Saleh KJ. Infection in primary total knee arthroplasty: contributing factors. Instr Course Lect. 2008;57:317-325.
5. Patel VP, Walsh M, Sehgal B, Preston C, DeWal H, Di Cesare PE. Factors associated with prolonged wound drainage after primary total hip and knee arthroplasty. J Bone Joint Surg Am. 2007;89(1):33-38.
6. Vince KG, Abdeen A. Wound problems in total knee arthroplasty. Clin Orthop Relat Res. 2006;(452):88-90.
7. Galat DD, McGovern SC, Larson DR, Harrington JR, Hanssen AD, Clarke HD. Surgical treatment of early wound complications following primary total knee arthroplasty. J Bone Joint Surg Am. 2009;91(1):48-54.
8. Gordon SM, Culver DH, Simmons BP, Jarvis WR. Risk factors for wound infections after total knee arthroplasty. Am J Epidemiol. 1990;131(5):905-916.
9. Jaberi FM, Parvizi J, Haytmanek CT, Joshi A, Purtill J. Procrastination of wound drainage and malnutrition affect the outcome of joint arthroplasty. Clin Orthop Relat Res. 2008;466(6):1368-1371.
10. Schmalzried TP. The infected hip: telltale signs and treatment options. J Arthroplasty. 2006;21(4 suppl 1):97-100.
11. Weiss AP, Krackow KA. Persistent wound drainage after primary total knee arthroplasty. J Arthroplasty. 1993;8(3):285-289.
12. Avram V, Petruccelli D, Winemaker M, de Beer J. Total joint arthroplasty readmission rates and reasons for 30-day hospital readmission. J Arthroplasty. 2014;29(3):465-468.
13. Dailey EA, Cizik A, Kasten J, Chapman JR, Lee MJ. Risk factors for readmission of orthopaedic surgical patients. J Bone Joint Surg Am. 2013;95(11):1012-1019.
14. Jordan CJ, Goldstein RY, Michels RF, Hutzler L, Slover JD, Bosco JA 3rd. Comprehensive program reduces hospital readmission rates after total joint arthroplasty. Am J Orthop. 2012;41(11):E147-E151.
15. Schairer WW, Sing DC, Vail TP, Bozic KJ. Causes and frequency of unplanned hospital readmission after total hip arthroplasty. Clin Orthop Relat Res. 2014;472(2):464-470.
16. Shinohara T, Yamashita Y, Satoh K, et al. Prospective evaluation of occlusive hydrocolloid dressing versus conventional gauze dressing regarding the healing effect after abdominal operations: randomized controlled trial. Asian J Surg. 2008;31(1):1-5.
17. Siah CJ, Yatim J. Efficacy of a total occlusive ionic silver-containing dressing combination in decreasing risk of surgical site infection: an RCT. J Wound Care. 2011;20(12):561-568.
18. Teshima H, Kawano H, Kashikie H, et al. A new hydrocolloid dressing prevents surgical site infection of median sternotomy wounds. Surg Today. 2009;39(10):848-854.
19. Abuzakuk TM, Coward P, Shenava Y, Kumar VS, Skinner JA. The management of wounds following primary lower limb arthroplasty: a prospective, randomised study comparing hydrofibre and central pad dressings. Int Wound J. 2006;3(2):133-137.
20. Ravenscroft MJ, Harker J, Buch KA. A prospective, randomised, controlled trial comparing wound dressings used in hip and knee surgery: Aquacel and Tegaderm versus Cutiplast. Ann R Coll Surg Engl. 2006;88(1):18-22.
21. Clarke JV, Deakin AH, Dillon JM, Emmerson S, Kinninmonth AW. A prospective clinical audit of a new dressing design for lower limb arthroplasty wounds. J Wound Care. 2009;18(1):5-8, 10-11.
22. Kloeters O. The use of a semi-occlusive dressing reduces epidermal inflammatory cytokine expression and mitigates dermal proliferation and inflammation in a rat incisional model. Wound Repair Regen. 2008;16(4):568-575.
23. Michie DD, Hugill JV. Influence of occlusive and impregnated gauze dressings on incisional healing: a prospective, randomized, controlled study. Ann Plast Surg. 1994;32(1):57-64.
24. Hopper GP, Deakin AH, Crane EO, Clarke JV. Enhancing patient recovery following lower limb arthroplasty with a modern wound dressing: a prospective, comparative audit. J Wound Care. 2012;21(4):200-203.
25. Cai J, Karam JA, Parvizi J, Smith EB, Sharkey PF. Aquacel surgical dressing reduces the rate of acute PJI following total joint arthroplasty: a case–control study. J Arthroplasty. 2014;29(6):1098-1100.
26. Berg A, Fleischer S, Kuss O, Unverzagt S, Langer G. Timing of dressing removal in the healing of surgical wounds by primary intention: quantitative systematic review protocol. J Adv Nurs. 2012;68(2):264-270.
27. Rasmussen H, Larsen MJ, Skeie E. Surgical wound dressing in outpatient paediatric surgery. A randomised study. Dan Med Bull. 1993;40(2):252-254.
28. Kurtz SM, Lau E, Schmier J, Ong KL, Zhao K, Parvizi J. Infection burden for hip and knee arthroplasty in the United States. J Arthroplasty. 2008;23(7):984-991.
Wound complications (eg, delayed wound healing, blisters, prolonged drainage) have been reported in up to 30% of patients who undergo elective total joint arthroplasty (TJA).1-6 Wound complications increase resource utilization, lengthen hospital stays, and increase costs.7-9 Prolonged wound healing and persistent wound drainage are also harbingers of both superficial and deep surgical site infections.5-11
In several studies, wound complications after TJA were the primary reason for hospital readmissions.12-15 As part of the Patient Protection and Affordable Care Act, hospitals will be penalized by the Centers for Medicaid & Medicare Services for unplanned hospital readmissions within 30 days after TJA. It is imperative, then, to reduce the risk factors and complications associated with surgical site infections to decrease unplanned readmissions.
Historically, little attention has been given to the role of surgical dressings and the effect of dressings on wound healing. Although many subspecialties (eg, cardiothoracic surgery, general surgery) have reported benefits in using occlusive dressings, adoption in TJA has been slow.16-18 At our institution about 5 years ago, we began using an occlusive silver-impregnated barrier dressing based on preliminary data from studies showing benefits of occlusive dressings in TJA.19,20
We conducted a study to determine if use of occlusive antimicrobial barrier dressings decreases rates of wound complications in TJA. We had 3 research questions: Compared with standard surgical dressings, are occlusive dressings associated with decreased rates of wound complications after TJA? Is there a difference in number of dressing changes required between the 2 dressing types? Is satisfaction higher for patients with occlusive dressings than for patients with standard dressings?
Patients and Methods
This randomized controlled trial (RCT) was reviewed and approved by the Institutional Review Board at Carolinas Healthcare. Patients were randomized by the research staff using a parallel, 1:1 allocation method. The randomization table was generated using a random number generator.
An a priori sample size estimate was made using a 2-tailed Fisher exact test with a .05 level of significance. Based on a study by Clarke and colleagues,21 we estimated the incidence of wound problems at 3% in the occlusive dressing (study) group and 13% in the standard dressing (control) group. We determined that 260 participants (130 per group) would be needed to achieve 80% power. We considered a 15% attrition rate for a total enrollment goal of 300 study participants (150 per group).
Between December 2010 and January 2013, patients presenting for either primary total hip arthroplasty (THA) or primary total knee arthroplasty (TKA) were recruited to participate in the study. Eligibility criteria (Table 1) were reviewed, and patients were enrolled by the senior surgeons, Dr. Springer, Dr. Beaver, Dr. Griffin, and Dr. Mason. All eligible participants who provided informed consent were randomized to receive either an occlusive antimicrobial barrier dressing (Aquacel Ag, ConvaTec) or standard surgical dressing (Primapore, Smith & Nephew). The occlusive dressing (Figure 1) consists of an outer barrier layer of hydrocolloid and a central island of hydrofiber, which absorbs and locks in any wound exudate within the fibers and prevents the creation of an overly moist wound environment that can lead to skin maceration and wound breakdown. In addition, the hydrofibers are embedded with ionic silver, which is released only at the site of wound exudate, or drainage; thus, there is no continuous exposure of the entire wound to silver. The standard dressing (Figure 2) consists of a central island of gauze enclosed in low-allergy acrylic adhesive tape.
All surgical dressings were placed over a closed incision in a sterile environment in the operating room after the procedure. The groups’ wound closures were identical.
A posterior approach was used for all THAs. The deep fascia was closed with a running barbed suture (Quill, Angiotech), the deep subcutaneous tissue with No. 1 Vicryl suture (Ethicon), and the superficial subcutaneous layer with 2-0 Vicryl suture. A running 3-0 Monocryl stitch (Ethicon) was placed in the subcuticular layer and was followed with a skin adhesive (Dermabond, Ethicon). A closed suction drain, removed on postoperative day (POD) 1, was used for all THAs.
A standard medial parapatellar arthrotomy was used for all TKAs. The arthrotomy was closed with a running barbed suture, the deep subcutaneous tissue with No. 1 Vicryl suture, and the superficial subcutaneous layer with 2-0 Vicryl suture. A running 3-0 Monocryl stitch was placed in the subcuticular layer and was followed with a skin adhesive. A closed suction drain was also used. In addition, a compressive wrap was placed over the dressing in the operating room and was removed the next morning. During the hospital stay, the surgical site was evaluated daily with a standard wound evaluation form.
In the standard dressing group, the bandage was removed for wound evaluation on POD 2, and the dressing was changed every other day during the hospital stay. The dressing was also changed as needed for wound drainage (Figure 3) or other minor wound-healing concerns.
In the occlusive dressing group, the dressing design allowed the dressing to remain in place for about 7 days. It was removed by a home health nurse during a visit closest to but not before the 7-day mark. In addition, it was changed at surgeon discretion if there were concerns about wound drainage or wound healing. For the occlusive barrier, wound drainage was evaluated by strike-through of drainage on the back side of the dressing (Figure 4). If more than 50% of the dressing was saturated, the bandage was changed and the wound evaluated. If there were no immediate concerns about wound complications (eg, infection, blistering), a new occlusive dressing was placed. Because the occlusive dressing was waterproof, patients in the study group were able to shower immediately after surgery. In the control group, patients were allowed to shower if the surgical dressing was kept dry, as the bandage was not waterproof.
Per the study protocol, all patients were discharged home and followed by a single home health agency. Mean hospital stay was 3 days (range, 0-8 days), which did not differ significantly between groups (P = .133). All home health nurses were trained in evaluation of postsurgical wounds and were aware of the study requirements. The nurses visited all patients 3 days a week until the scheduled 4-week postoperative follow-up with the treating physician or physician assistant. At each visit, the nurse evaluated the wound and surrounding skin using a standard wound document. Dressings were changed based on the criteria we have described. Concerns about wound status (eg, drainage, blistering, erythema) prompted removal of the dressing for further evaluation. The physician was notified of concerns about wound healing, which prompted an office visit for evaluation. The dressing remained in place for a minimum of 7 days but in all cases was removed as close to 7 days as possible, depending on the scheduled nursing visits. Once uneventful wound healing was complete, no further dressing was required. A final wound evaluation was conducted by the surgeon at the 4-week postoperative evaluation.
The primary outcome measure was wound complication (dichotomous variable). Wounds were assessed by describing the amount, type, and color of exudate (Figure 5). The appearance of the wound margins and the surrounding skin was also assessed. Because wounds could not be directly visualized in the occlusive dressing group, drainage (indicated by strike-through) was used as a measure of possible wound complications, prompting removal and full evaluation.
Secondary endpoints included additional wound treatment or surgical procedures for wound complications, number of dressing changes, and patient satisfaction. Patients completed a satisfaction questionnaire at each wound assessment (Figure 6). Using a visual analog scale (VAS), they rated their satisfaction with their ability to perform activities of daily living (personal hygiene, change clothes, sit comfortably, sleep comfortably), drawing a line on the VAS at a point between 0 (totally unsatisfied) and 100 (totally satisfied) for each satisfaction measure. This line was measured and recorded by the study coordinator. The 4 satisfaction measures were averaged for a composite satisfaction measure.
All statistical analyses were conducted using SAS Version 9.2 (SAS Institute). Standard univariate descriptive statistics (means, standard deviations, frequencies, proportions) were calculated and reported. Differences in mean values for continuous data were assessed with independent t test or Wilcoxon rank sum test. Chi-square test and Fisher exact test were used to determine differences between groups for categorical or dichotomous variables. A significance level of .05 was used for all statistical tests.
Results
The 300 patients who consented to participate in the study were randomized to receive either occlusive dressing or standard dressing. After randomization, 38 patients (15 occlusive, 23 standard) were withdrawn from the study (Table 2), leaving a final dataset of 262 patients, 141 in the occlusive group (67 THAs, 74 TKAs) and 121 in the standard group (49 THAs, 72 TKAs). There were no differences in proportion of THAs or TKAs, age, sex, or body mass index between the occlusive and standard groups (Table 3).
There were statistically significantly (P = .015) fewer wound complications in the occlusive dressing group (10%) than in the standard dressing group (22%). Blisters at or around the wound site were reported in significantly (P = .026) fewer patients with occlusive dressing (1/141, 0.7%) than standard dressing (7/121, 6%). Additional wound care was required in 9 patients (7%) in the standard group and 6 patients (4%) in the occlusive group (P = .27). Two patients (1.7%) in the standard group were readmitted for treatment of wound dehiscence; no one in the occlusive group was readmitted to the hospital or had to return to the operating room for treatment of a wound complication. The difference was not statistically significant (P = .13). There were also no significant (P = .81) differences in rate of wound complications between THA and TKA patients.
There were statistically significantly (P < .0001) fewer dressing changes in the occlusive dressing group. Mean number of dressing changes was 0.14 (median, 0; interquartile range, 0-0) in the occlusive group and 2.8 (median, 2; interquartile range, 1-3) in the standard group.
Compared with patients in the standard dressing group, patients in the occlusive dressing group reported significantly higher satisfaction scores. Mean overall patient satisfaction score was 92 in the occlusive group and 81 in the standard group (P < .0001). Patients in the occlusive group were more satisfied with their ability to take care of their personal hygiene, to change clothes, and to sit and sleep comfortably (Table 4).
Discussion
Wound complications after TJA are common, occurring in up to 30% of patients,1-6 and are associated with development of superficial and deep surgical site infections, increased resource utilization, and longer hospital stays.5-11 Although the role of surgical dressings has received little attention in TJA practice, other subspecialties have found that occlusive barrier dressings can reduce wound complications and promote wound healing.16,17 Mitotic cell division and leukocyte activity, which are critical in wound healing, increase under occlusive dressings. This cellular activity is disrupted with every dressing change, delaying wound healing (biological activity takes 3-4 hours to resume).22 In addition, occlusive dressings increase hypoxia, which promotes angiogenesis and accelerates wound healing.23
Despite being a prospective RCT, this study had several limitations. Because of the need to evaluate wounds and obvious differences between the 2 dressings (eg, color, ability to shower), it was not possible to blind the patient or surgeon to the dressing used. When rating satisfaction, patients were not able to directly compare the 2 dressings. The primary endpoint of the study was the complication rate; however, the deep periprosthetic infection rate may be a superior endpoint and would require a much larger study. Although we assumed that wound complications may be harbingers for periprosthetic infections, no patient in either group developed periprosthetic infection. Therefore, we cannot conclude that surgical dressings play a role in reducing infections. In addition, as the standard dressing was changed on POD 2 (per standard protocol) and the occlusive dressing could remain in place for up to 7 days, there was a selection bias in the evaluation of the number of dressing changes. However, given the characteristics of the standard dressing (eg, tape, gauze, nonocclusive), leaving it in place after POD 2 is not optimal. Therefore, we would expect to see a difference in the number of dressing changes. We think this comparison remains valid, as occlusive dressings were changed when there were indications of wound problems (eg, excessive drainage [strike-through], surrounding erythema, blistering). With an average of less than 1 dressing change in the occlusive group, we think this is a surrogate for uneventful wound healing and decreased wound complication, and our data support this. It is also important to test both dressing durability and patient tolerance for wearing a single dressing for 7 days.
Our RCT results showed that, compared with a standard dressing, an occlusive antimicrobial dressing was associated with a significant decrease in overall wound complications and blisters. These findings are similar to those of other studies of occlusive dressings in a number of surgical subspecialties.16,18 In an RCT of 200 patients who underwent elective and nonelective hip and knee surgery and were randomized to either absorbent perforated dressing with adhesive border (Cutiplast, Smith & Nephew) or Aquacel (ConvaTec) covered with vapor-permeable dressing (Tegaderm, 3M), Ravenscroft and colleagues20 found that Aquacel-plus-Tegaderm was 5.8 times more likely than Cutiplast to produce an uncompromised wound. Similarly, in an RCT of hydrofiber (Aquacel) and central pad (Mepore, Mölnlycke) dressings after primary THA and TKA, Abuzakuk and colleagues19 found significantly fewer dressing changes (43% vs 77%) and blisters (13% vs 26%) in the hydrofiber group than in the pad group.
Hopper and colleagues24 compared 50 consecutive patients treated with modern dressings (Aquacel) with 50 historical control patients treated with traditional surgical dressings (Mepore). Blisters developed in 20% of the patients in the traditional group and 4% of patients in the modern group (P = .028). The authors concluded that adverse outcomes of wound healing can be minimized with modern dressings.
A recent retrospective study by Cai and colleagues25 evaluated the incidence of acute periprosthetic infection (≤3 months after surgery) with use of occlusive (Aquacel) and standard dressings. Incidence of acute periprosthetic infection was 0.44% in the occlusive group and 1.7% in the standard group (P = .005). Incidence of wound-healing problems was not evaluated.
Our second aim in the present study was to evaluate the number of dressing changes required. There were significantly fewer dressing changes in the occlusive dressing group than in the standard dressing group. Therefore, wear time (amount of time a single dressing remains in place) was substantially longer for the occlusive group. In the study by Hopper and colleagues,24 wear time was significantly shorter for the traditional dressing than for the modern dressing (2 vs 7 days; P < .001), and the traditional dressing required more changes (3 vs 0; P < .001).
These findings are important for several reasons. Standard surgical dressings often require frequent changes. If left in place, they create an excessively moist wound environment that promotes blistering and delays wound healing. However, frequent dressing changes expose the wound and increase the risk for surgical site infection.26 A barrier dressing left in place from time of surgery prevents bacteria from entering and contaminating a healing wound. A study by Clarke and colleagues21 demonstrated higher skin colonization rates for patients who had dressings changed on POD 1 than for patients who had their first dressing change on POD 6.
Our third study aim was to evaluate patient satisfaction with surgical dressings. The orthopedic literature has little on this topic.23 Blisters and other wound complications can negatively affect satisfaction.2,3 Our data showed significant improvement in satisfaction, particularly regarding sterility and hygiene.
Other surgical subspecialties have found similar improvement in patient satisfaction with occlusive barrier dressings. In an RCT of 88 pediatric patients, Rasmussen and colleagues27 found that patients reported significantly less pain during changes of an occlusive adhesive dressing (Duoderm, ConvaTec) than during changes of a conventional Steristrip (3M) plus Cutiplast. According to the authors, the occlusive wound dressing seemed to minimize the physical and psychological trauma to the infant or child and lessen disruption of the child’s and the parents’ daily routines, because the children could be bathed immediately after surgery.
Our study did not specifically address cost. Cai and colleagues25 estimated that, if the Aquacel dressing were routinely used in every hip and knee arthroplasty, it would add about $27 million in cost. However, this must be balanced by the cost of managing infection after TJA. In the United States, at an estimated $50,000 to $100,000 per case and an annual incidence of 1% to 2%, the low-end cost for the treatment of periprosthetic infection would be $500 million.28 Cai and colleagues25 found a 4-fold reduction in periprosthetic infection when use of occlusive dressings was implemented. In addition, wound complications remain the number one reason for hospital readmission after TJA.12,13 Cost of hospital readmission, as well as financial penalties to institutions for unplanned readmission for wound complications, must be considered.
Conclusion
Our RCT results demonstrated that use of occlusive antimicrobial barrier dressings (vs standard surgical dressings) significantly reduced wound complications and dressing changes and improved overall patient satisfaction. These findings are similar to those in the literature on TJA and other surgical subspecialties. We conclude that occlusive surgical dressings reduce wound complications after TJA.
1. Cosker T, Elsayed S, Gupta S, Mendonca AD, Tayton KJ. Choice of dressing has a major impact on blistering and healing outcomes in orthopaedic patients. J Wound Care. 2005;14(1):27-29.
2. Koval KJ, Egol KA, Hiebert R, Spratt KF. Tape blisters after hip surgery: can they be eliminated completely? Am J Orthop. 2007;36(5):261-265.
3. Lawrentschuk N, Falkenberg MP, Pirpiris M. Wound blisters post hip surgery: a prospective trial comparing dressings. ANZ J Surg. 2002;72(10):716-719.
4. Mihalko WM, Manaswi A, Brown TE, Parvizi J, Schmalzried TP, Saleh KJ. Infection in primary total knee arthroplasty: contributing factors. Instr Course Lect. 2008;57:317-325.
5. Patel VP, Walsh M, Sehgal B, Preston C, DeWal H, Di Cesare PE. Factors associated with prolonged wound drainage after primary total hip and knee arthroplasty. J Bone Joint Surg Am. 2007;89(1):33-38.
6. Vince KG, Abdeen A. Wound problems in total knee arthroplasty. Clin Orthop Relat Res. 2006;(452):88-90.
7. Galat DD, McGovern SC, Larson DR, Harrington JR, Hanssen AD, Clarke HD. Surgical treatment of early wound complications following primary total knee arthroplasty. J Bone Joint Surg Am. 2009;91(1):48-54.
8. Gordon SM, Culver DH, Simmons BP, Jarvis WR. Risk factors for wound infections after total knee arthroplasty. Am J Epidemiol. 1990;131(5):905-916.
9. Jaberi FM, Parvizi J, Haytmanek CT, Joshi A, Purtill J. Procrastination of wound drainage and malnutrition affect the outcome of joint arthroplasty. Clin Orthop Relat Res. 2008;466(6):1368-1371.
10. Schmalzried TP. The infected hip: telltale signs and treatment options. J Arthroplasty. 2006;21(4 suppl 1):97-100.
11. Weiss AP, Krackow KA. Persistent wound drainage after primary total knee arthroplasty. J Arthroplasty. 1993;8(3):285-289.
12. Avram V, Petruccelli D, Winemaker M, de Beer J. Total joint arthroplasty readmission rates and reasons for 30-day hospital readmission. J Arthroplasty. 2014;29(3):465-468.
13. Dailey EA, Cizik A, Kasten J, Chapman JR, Lee MJ. Risk factors for readmission of orthopaedic surgical patients. J Bone Joint Surg Am. 2013;95(11):1012-1019.
14. Jordan CJ, Goldstein RY, Michels RF, Hutzler L, Slover JD, Bosco JA 3rd. Comprehensive program reduces hospital readmission rates after total joint arthroplasty. Am J Orthop. 2012;41(11):E147-E151.
15. Schairer WW, Sing DC, Vail TP, Bozic KJ. Causes and frequency of unplanned hospital readmission after total hip arthroplasty. Clin Orthop Relat Res. 2014;472(2):464-470.
16. Shinohara T, Yamashita Y, Satoh K, et al. Prospective evaluation of occlusive hydrocolloid dressing versus conventional gauze dressing regarding the healing effect after abdominal operations: randomized controlled trial. Asian J Surg. 2008;31(1):1-5.
17. Siah CJ, Yatim J. Efficacy of a total occlusive ionic silver-containing dressing combination in decreasing risk of surgical site infection: an RCT. J Wound Care. 2011;20(12):561-568.
18. Teshima H, Kawano H, Kashikie H, et al. A new hydrocolloid dressing prevents surgical site infection of median sternotomy wounds. Surg Today. 2009;39(10):848-854.
19. Abuzakuk TM, Coward P, Shenava Y, Kumar VS, Skinner JA. The management of wounds following primary lower limb arthroplasty: a prospective, randomised study comparing hydrofibre and central pad dressings. Int Wound J. 2006;3(2):133-137.
20. Ravenscroft MJ, Harker J, Buch KA. A prospective, randomised, controlled trial comparing wound dressings used in hip and knee surgery: Aquacel and Tegaderm versus Cutiplast. Ann R Coll Surg Engl. 2006;88(1):18-22.
21. Clarke JV, Deakin AH, Dillon JM, Emmerson S, Kinninmonth AW. A prospective clinical audit of a new dressing design for lower limb arthroplasty wounds. J Wound Care. 2009;18(1):5-8, 10-11.
22. Kloeters O. The use of a semi-occlusive dressing reduces epidermal inflammatory cytokine expression and mitigates dermal proliferation and inflammation in a rat incisional model. Wound Repair Regen. 2008;16(4):568-575.
23. Michie DD, Hugill JV. Influence of occlusive and impregnated gauze dressings on incisional healing: a prospective, randomized, controlled study. Ann Plast Surg. 1994;32(1):57-64.
24. Hopper GP, Deakin AH, Crane EO, Clarke JV. Enhancing patient recovery following lower limb arthroplasty with a modern wound dressing: a prospective, comparative audit. J Wound Care. 2012;21(4):200-203.
25. Cai J, Karam JA, Parvizi J, Smith EB, Sharkey PF. Aquacel surgical dressing reduces the rate of acute PJI following total joint arthroplasty: a case–control study. J Arthroplasty. 2014;29(6):1098-1100.
26. Berg A, Fleischer S, Kuss O, Unverzagt S, Langer G. Timing of dressing removal in the healing of surgical wounds by primary intention: quantitative systematic review protocol. J Adv Nurs. 2012;68(2):264-270.
27. Rasmussen H, Larsen MJ, Skeie E. Surgical wound dressing in outpatient paediatric surgery. A randomised study. Dan Med Bull. 1993;40(2):252-254.
28. Kurtz SM, Lau E, Schmier J, Ong KL, Zhao K, Parvizi J. Infection burden for hip and knee arthroplasty in the United States. J Arthroplasty. 2008;23(7):984-991.
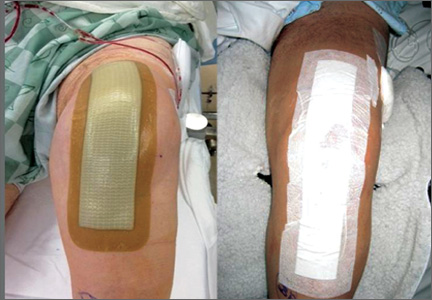
Modular Versus Nonmodular Femoral Necks for Primary Total Hip Arthroplasty
Femoral stem modularity in total hip arthroplasty (THA) has a checkered past. Developments such as the modular head–trunnion interface, which allows for placement of femoral heads of different sizes and offsets, and the modular midstem, which allows for version adjustments independent of patient anatomy (S-ROM, Depuy) and for bypassing proximal bone defects in the revision setting (Restoration Modular, Stryker; ZMR-XL, Zimmer), have proved very successful.1-10 However, even these successful advances have been associated with failures at the modular junction.11-13 Proximal femoral neck–stem modularity (PFNSM) has had mixed results, with notable failures and recalls associated with the neck–stem junction.14,15 Failures at this junction have occurred secondary to corrosion and breakage of the modular neck.16-18 Nevertheless, proximal modular stems remain available for implantation. One such system, the M/L Taper stem with Kinectiv technology (Zimmer), is an all-titanium construct that allows for adjustment of several variables (length, offset, version), providing numerous combinations beyond those of the original M/L Taper offerings. Advantages of these offerings include closer reconstruction of patient anatomy, stability improvements, and easing of the process of revision in polyethylene/femoral head exchanges or in infections in which single-staged irrigation and débridement and polyethylene/head exchange are chosen.
These theoretic advantages must be judged in the context of the possible disadvantages of the modular neck junction. The mechanical environment of the junction places it at risk for failure as well as for metallosis from fretting, crevice corrosion, and recurrent repassivation.19 Although the titanium necks are at less risk for degradation than their cobalt-chromium counterparts, they are at higher risk for breakage.13,19 For one of the surgeons in our practice, the M/L Taper stem with Kinectiv technology is the stem of choice for primary THA.
We conducted a study to determine, in the setting of primary THA, how often a neck–stem combination choice resulted in a reconstructive geometry that would not have been possible had the surgeon opted for the traditional M/L Taper stem. Every Kinectiv stem has numerous neck options with a head center position that would not be possible with the nonmodular M/L Taper. However, in a high-volume community practice, how often is a modular neck that results in an otherwise unavailable head center being used for the reconstruction?
Materials and Methods
This study was approved by our local institutional review board. The Kinectiv stem is used by 1 of the 4 high-volume joint replacement surgeons in our practice (not one of the authors). From our community practice joint registry, we identified every stem–neck combination used since the Kinectiv stem became available in 2006.20 Each case was performed using a posterior approach. A trabecular metal acetabular component (Zimmer) secured with 2 screws was used, and an M/L Taper stem with Kinectiv technology was implanted in each case.
Once the neck–stem combination was determined, its position on the head centers map was compared with that of the standard M/L Taper head centers (Figures 1, 2) for each stem size as the relationship of the Kinectiv head center varies with each stem size compared with the head center of the M/L Taper stems. If the head centers were in contact on the map, the geometry was considered identical. If the head centers were not in contact, we noted where the nearest standard M/L Taper head center lay in terms of length and offset. As the head centers are laid out in regular, 4-mm increments, this estimation was relatively easy. Any anteverted or retroverted neck was considered to have no adequate substitution in the standard M/L Taper stem offerings. This initial evaluation was performed by Dr. Carothers.
We then reviewed the head center comparisons independently. For every Kinectiv head center that did not contact an M/L Taper counterpart, the difference between those head centers was reviewed. Each of us noted whether the difference between the head centers was clinically relevant, as many of the head center positions are extremely close. The head centers that were so close as to be deemed clinically irrelevant were recorded.
Results
Between January 2008 and October 2013, 463 primary THAs were performed using the M/L Taper femoral stem with Kinectiv technology. Of the neck options used, 205 (44%) had a head center identical to that of a nonmodular M/L Taper stem. In another 56 cases (12%), all 3 reviewing surgeons agreed that the M/L Taper head center was so close to the Kinectiv head center as to be clinically indistinguishable. Of these 56 cases, 54 had a head center difference of less than 1 mm in length or offset; the other 2 had a 2-mm difference in offset.
Thus, a total of 261 stems (56%) had a standard M/L Taper option that offered an identical head center or one so close as to be clinically indistinguishable. Interestingly, in the group of 202 stems that did not have an identical head center and were not clinically indistinguishable, 132 (65%) of these modular stems were within 4 mm in length and 2 mm of offset of the closest Kinectiv head center. A verted neck was used in 12 cases (11 anteverted, 1 retroverted).
Nine of the 463 cases required revision surgery, 3 for recurrent instability. In 1 of these 3 cases, the acetabulum was revised for malposition, and the neck was converted from standard offset, +0 mm length (head center identical to nonmodular stem), to extended offset, +4 mm length (2 mm shorter with 1 mm less offset than closest nonmodular head center). The second case had complete deficiency of the abductor tendons and was converted to a constrained liner, though at the time of the THA a head center identical to that of the nonmodular stem was used. The third case was revised to convert a standard offset, +0 mm length, straight neck (head center identical to nonmodular stem), to extended offset, +4 mm length, anteverted neck (anteversion making this a unique head center position). Of the other 6 cases, 1 was treated for corrosion at the head–neck junction by changing the head from cobalt-chromium to ceramic (the junction was noted to be pristine), 1 underwent revision of the acetabular component for loosening, 2 femoral stems were revised for periprosthetic femur fracture, and 2 cases underwent 2-stage revision for late infection. There were no failures secondary to metallosis at the neck–stem junction and no modular breakages. The 3 cases of recurrent instability had no dislocation episodes after revision.
Discussion
PFNSM was developed to help more closely reconstruct patient anatomy. PFNSM allows for individualization of offset, length, and version—and thus for optimization of component interaction to avoid impingement and dislocation while promoting range of motion and normal gait.21 These benefits must be judged in light of the disadvantages of proximal stem modularity, including corrosion and breakage of the modular neck.14-18
In the present study, conducted in a high-volume private practice setting, 44% of necks used in a proximally modular construct had a head center identical to that of a nonmodular alternative. In the opinion of the 3 authors (high-volume hip surgeons), an additional 12% of the modular stems had a head center so close to that of the nonmodular stem as to be clinically indistinguishable. In addition, 132 of the modular necks had a femoral head center within 4 mm in length and 2 mm of offset of the nonmodular stem. These findings call into question the theoretical benefits of regular use of this modular femoral stem for primary THA. Certainly there are extreme femoral neck–shaft angle cases in which the standard nonmodular stem may be inadequate and this proximal modularity would be helpful, but our study showed such cases are relatively less frequent. We caution against routine use of this proximal modularity in primary THA and suggest restricting it to cases in which the standard stem offerings are unacceptable. These findings are not surprising given that the standard M/L Taper stem is based on a historically successful model with neck angle and length options designed to meet the goals of restoring length, offset, range of motion, and stability. We would expect that a well-designed stem will meet these goals in the majority of cases.
Of our 463 cases with the modular neck, 9 required revision surgery. Of these 9 revisions, 2 were for recurrent dislocation in which the modular neck was revised to one that enhanced stability, and there were no further dislocations. The ability to change the geometry of the proximal femur resulted in a stability solution that avoided revision of the entire femoral component, as might otherwise be required. One case of acetabular loosening and 1 case that required placement of a constrained liner were potentially benefited by the modular neck in that the surgeries may have been expedited by being able to remove the neck to ease exposure for placement of the acetabular components. The other 5 revisions—2 for periprosthetic femur fracture, 2 two-stage revisions for infection, and 1 femoral head exchange for metallosis at the head–neck junction—saw no benefit from the modularity in the revision setting.
This study had several limitations. First, as it was primarily an evaluation of use of a modular femoral system, there was no attempt to account for the fact that acetabular component orientation can affect stability and, thus, the perceived need for additional offset or changes in version. The habit of all 3 of the reviewing surgeons is to consider the position of the acetabular component and to reposition the component, if necessary, to achieve appropriate stability. Therefore, the need for the modularity may be even less than suggested by this study. In addition, the idea that (in 12 cases) no standard stem option would be acceptable because of the use of a verted neck ignores the possibility that cup repositioning could have obviated the need for additional version. Furthermore, use of a 36-mm head results in an additional 3.5 mm of offset in the polyethylene liner, and this study did not account for the option of increasing head size—and for the potential increase in stability from a larger head and the increased offset gained from the liner.
A second limitation is that a significant number of Kinectiv stems (132) had a head center within 4 mm in length and 2 mm of offset of the nearest M/L Taper stem. We carefully template every primary THA to determine the plan that will optimize component size and position and restore length and offset. More options for achieving these goals are available when templating with the intention of using the Kinectiv modular neck. The neck cut and position of the stem proximally or distally in the proximal femur may not need to be so exact, as the additional options may be able to accommodate minor inaccuracies. Thus, the reported percentage of clinically indistinguishable head centers (12%) may underestimate the actual number of modular stems that could have been replaced with a nonmodular stem.
Third, this study did not evaluate the effect of the modular junction on ease of irrigation and débridement with head/neck and polyethylene exchange in cases of infection, or on ease of head/neck and polyethylene exchange for revision. In addition, the study did not evaluate other cases of instability involving a nonmodular stem that otherwise could have been solved with simple revision of the head/neck combination, avoiding revision of the entire stem and/or the acetabular component. We reported revisions for infection and for instability, but comprehensive assessment and comparison were beyond the scope of this study. Certainly ease of revision of the head and neck is a factor that could favor use of the modularity.
Fourth, this was not a clinical outcome study comparing 2 different femoral stems. We sought only to determine how often a modular neck was chosen that resulted in a head center that would have been unavailable to the non-modular stem suggesting that the patient was receiving a reconstructive benefit in exchange for the modularity. However, 2 recent reports have noted no clinical benefit at 2-year follow-up with use of the modular neck compared with the nonmodular stem.22,23
Though the M/L Taper with Kinectiv technology has, thus far, performed well, PFNSM should be used with caution in light of recently reported failures at the neck–stem junction.14,16-18 Our study results suggest that most (≥56%) of the modular stems used could have been reconstructed as acceptably with a nonmodular stem, and therefore a reconstructive benefit was not realized in trade for the potential risks of proximal modularity. Only 2 of the 9 revision cases saw a clear advantage in being able to change the modular neck geometry in the revision setting. Given the recently reported failures and the high-profile recall of a modular stem,14 we recommend restricting the modular stem to cases that cannot be adequately reconstructed with the nonmodular option.
1. Barrack RL. Modularity of prosthetic implants. J Am Acad Orthop Surg. 1994;2(1):16-25.
2. Cameron HU. Modularity in primary total hip arthroplasty. J Arthroplasty. 1996;11(3):332-334.
3. Hozack WJ, Mesa JJ, Rothman RF. Head–neck modularity for total hip arthroplasty. Is it necessary? J Arthroplasty. 1996;11(4):397-399.
4. Holt GE, Christie MJ, Schwartz HS. Trabecular metal endoprosthetic limb salvage reconstruction of the lower limb. J Arthroplasty. 2009;24(7):1079-1089.
5. Sporer SM, Obar RJ, Bernini PM. Primary total hip arthroplasty using a modular proximally coated prosthesis in patients older than 70: two to eight year results. J Arthroplasty. 2004;19(2):197-203.
6. Spitzer AI. The S-ROM cementless femoral stem: history and literature review. Orthopedics. 2005;28(9 suppl):s1117-s1124.
7. Mumme T, Müller-Rath R, Andereya S, Wirtz DC. Uncemented femoral revision arthroplasty using the modular revision prosthesis MRP-TITAN revision stem. Oper Orthop Traumatol. 2007;19(1):56-77.
8. Wirtz DC, Heller KD, Holzwarth U, et al. A modular femoral implant for uncemented stem revision in THR. Int Orthop. 2000;24(3):134-138.
9. Lakstein D, Backstein D, Safir O, Kosashvili Y, Gross AE. Revision total hip arthroplasty with a porous-coated modular stem: 5 to 10 years follow-up. Clin Orthop Relat Res. 2010;468(5):1310-1315.
10. Bolognesi MP, Pietrobon R, Clifford PE, Vail TP. Comparison of a hydroxyapatite-coated sleeve and a porous-coated sleeve with a modular revision hip stem. A prospective, randomized study. J Bone Joint Surg Am. 2004;86(12):2720-2725.
11. Huot Carlson JC, Van Citters DW, Currier JH, Bryant AM, Mayor MB, Collier JP. Femoral stem fracture and in vivo corrosion of retrieved modular femoral hips. J Arthroplasty. 2012;27(7):1389-1396.e1.
12. Gilbert JL, Mehta M, Pinder B. Fretting crevice corrosion of stainless steel stem–CoCr femoral head connections: comparisons of materials, initial moisture, and offset length. J Biomed Mater Res B Appl Biomater. 2009;88(1):162-173.
13. Kop AM, Keogh C, Swarts E. Proximal component modularity in THA—at what cost? An implant retrieval study. Clin Orthop Relat Res. 2012;470(7):1885-1894.
14. Cooper HJ, Urban RM, Wixson RL, Meneghini RM, Jacobs JJ. Adverse local tissue reaction arising from corrosion at the femoral neck–body junction in a dual-taper stem with a cobalt-chromium modular neck. J Bone Joint Surg Am. 2013;95(10):865-872.
15. Vundelinckx BJ, Verhelst LA, De Schepper J. Taper corrosion in modular hip prostheses: analysis of serum metal ions in 19 patients. J Arthroplasty. 2013;28(7):1218-1223.
16. Kouzelis A, Georgiou CS, Megas P. Dissociation of modular total hip arthroplasty at the neck–stem interface without dislocation. J Orthop Traumatol. 2012;13(4):221-224.
17. Sotereanos NG, Sauber TJ, Tupis TT. Modular femoral neck fracture after primary total hip arthroplasty. J Arthroplasty. 2013;28(1):196.e7-e9.
18. Wodecki P, Sabbah D, Kermarrec G, Semaan I. New type of hip arthroplasty failure related to modular femoral components: breakage at the neck–stem junction. Orthop Traumatol Surg Res. 2013;99(6):741-744.
19. Dorn U, Neumann D, Frank M. Corrosion behavior of tantalum-coated cobalt-chromium modular necks compared to titanium modular necks in a simulator test. J Arthroplasty. 2014;29(4):831-835.
20. Carothers JT, White RE, Tripuraneni KR, Hattab MW, Archibeck MJ. Lessons learned from managing a prospective, private practice joint replacement registry: a 25-year experience. Clin Orthop Relat Res. 2013;471(2):537-543.
21. Archibeck MJ, Cummins T, Carothers J, Junick DW, White RE Jr. A comparison of two implant systems in restoration of hip geometry in arthroplasty. Clin Orthop Rel Res. 2011;469(2):443-446.
22. Duwelius PJ, Hartzband MA, Burkhart R, et al. Clinical results of a modular neck hip system: hitting the “bull’s-eye” more accurately. Am J Orthop. 2010;39(10 suppl):2-6.
23. Duwelius PJ, Burkhart B, Carnahan C, et al. Modular versus nonmodular neck femoral implants in primary total hip arthroplasty: which is better? Clin Orthop Relat Res. 2014;472(4):1240-1245.
Femoral stem modularity in total hip arthroplasty (THA) has a checkered past. Developments such as the modular head–trunnion interface, which allows for placement of femoral heads of different sizes and offsets, and the modular midstem, which allows for version adjustments independent of patient anatomy (S-ROM, Depuy) and for bypassing proximal bone defects in the revision setting (Restoration Modular, Stryker; ZMR-XL, Zimmer), have proved very successful.1-10 However, even these successful advances have been associated with failures at the modular junction.11-13 Proximal femoral neck–stem modularity (PFNSM) has had mixed results, with notable failures and recalls associated with the neck–stem junction.14,15 Failures at this junction have occurred secondary to corrosion and breakage of the modular neck.16-18 Nevertheless, proximal modular stems remain available for implantation. One such system, the M/L Taper stem with Kinectiv technology (Zimmer), is an all-titanium construct that allows for adjustment of several variables (length, offset, version), providing numerous combinations beyond those of the original M/L Taper offerings. Advantages of these offerings include closer reconstruction of patient anatomy, stability improvements, and easing of the process of revision in polyethylene/femoral head exchanges or in infections in which single-staged irrigation and débridement and polyethylene/head exchange are chosen.
These theoretic advantages must be judged in the context of the possible disadvantages of the modular neck junction. The mechanical environment of the junction places it at risk for failure as well as for metallosis from fretting, crevice corrosion, and recurrent repassivation.19 Although the titanium necks are at less risk for degradation than their cobalt-chromium counterparts, they are at higher risk for breakage.13,19 For one of the surgeons in our practice, the M/L Taper stem with Kinectiv technology is the stem of choice for primary THA.
We conducted a study to determine, in the setting of primary THA, how often a neck–stem combination choice resulted in a reconstructive geometry that would not have been possible had the surgeon opted for the traditional M/L Taper stem. Every Kinectiv stem has numerous neck options with a head center position that would not be possible with the nonmodular M/L Taper. However, in a high-volume community practice, how often is a modular neck that results in an otherwise unavailable head center being used for the reconstruction?
Materials and Methods
This study was approved by our local institutional review board. The Kinectiv stem is used by 1 of the 4 high-volume joint replacement surgeons in our practice (not one of the authors). From our community practice joint registry, we identified every stem–neck combination used since the Kinectiv stem became available in 2006.20 Each case was performed using a posterior approach. A trabecular metal acetabular component (Zimmer) secured with 2 screws was used, and an M/L Taper stem with Kinectiv technology was implanted in each case.
Once the neck–stem combination was determined, its position on the head centers map was compared with that of the standard M/L Taper head centers (Figures 1, 2) for each stem size as the relationship of the Kinectiv head center varies with each stem size compared with the head center of the M/L Taper stems. If the head centers were in contact on the map, the geometry was considered identical. If the head centers were not in contact, we noted where the nearest standard M/L Taper head center lay in terms of length and offset. As the head centers are laid out in regular, 4-mm increments, this estimation was relatively easy. Any anteverted or retroverted neck was considered to have no adequate substitution in the standard M/L Taper stem offerings. This initial evaluation was performed by Dr. Carothers.
We then reviewed the head center comparisons independently. For every Kinectiv head center that did not contact an M/L Taper counterpart, the difference between those head centers was reviewed. Each of us noted whether the difference between the head centers was clinically relevant, as many of the head center positions are extremely close. The head centers that were so close as to be deemed clinically irrelevant were recorded.
Results
Between January 2008 and October 2013, 463 primary THAs were performed using the M/L Taper femoral stem with Kinectiv technology. Of the neck options used, 205 (44%) had a head center identical to that of a nonmodular M/L Taper stem. In another 56 cases (12%), all 3 reviewing surgeons agreed that the M/L Taper head center was so close to the Kinectiv head center as to be clinically indistinguishable. Of these 56 cases, 54 had a head center difference of less than 1 mm in length or offset; the other 2 had a 2-mm difference in offset.
Thus, a total of 261 stems (56%) had a standard M/L Taper option that offered an identical head center or one so close as to be clinically indistinguishable. Interestingly, in the group of 202 stems that did not have an identical head center and were not clinically indistinguishable, 132 (65%) of these modular stems were within 4 mm in length and 2 mm of offset of the closest Kinectiv head center. A verted neck was used in 12 cases (11 anteverted, 1 retroverted).
Nine of the 463 cases required revision surgery, 3 for recurrent instability. In 1 of these 3 cases, the acetabulum was revised for malposition, and the neck was converted from standard offset, +0 mm length (head center identical to nonmodular stem), to extended offset, +4 mm length (2 mm shorter with 1 mm less offset than closest nonmodular head center). The second case had complete deficiency of the abductor tendons and was converted to a constrained liner, though at the time of the THA a head center identical to that of the nonmodular stem was used. The third case was revised to convert a standard offset, +0 mm length, straight neck (head center identical to nonmodular stem), to extended offset, +4 mm length, anteverted neck (anteversion making this a unique head center position). Of the other 6 cases, 1 was treated for corrosion at the head–neck junction by changing the head from cobalt-chromium to ceramic (the junction was noted to be pristine), 1 underwent revision of the acetabular component for loosening, 2 femoral stems were revised for periprosthetic femur fracture, and 2 cases underwent 2-stage revision for late infection. There were no failures secondary to metallosis at the neck–stem junction and no modular breakages. The 3 cases of recurrent instability had no dislocation episodes after revision.
Discussion
PFNSM was developed to help more closely reconstruct patient anatomy. PFNSM allows for individualization of offset, length, and version—and thus for optimization of component interaction to avoid impingement and dislocation while promoting range of motion and normal gait.21 These benefits must be judged in light of the disadvantages of proximal stem modularity, including corrosion and breakage of the modular neck.14-18
In the present study, conducted in a high-volume private practice setting, 44% of necks used in a proximally modular construct had a head center identical to that of a nonmodular alternative. In the opinion of the 3 authors (high-volume hip surgeons), an additional 12% of the modular stems had a head center so close to that of the nonmodular stem as to be clinically indistinguishable. In addition, 132 of the modular necks had a femoral head center within 4 mm in length and 2 mm of offset of the nonmodular stem. These findings call into question the theoretical benefits of regular use of this modular femoral stem for primary THA. Certainly there are extreme femoral neck–shaft angle cases in which the standard nonmodular stem may be inadequate and this proximal modularity would be helpful, but our study showed such cases are relatively less frequent. We caution against routine use of this proximal modularity in primary THA and suggest restricting it to cases in which the standard stem offerings are unacceptable. These findings are not surprising given that the standard M/L Taper stem is based on a historically successful model with neck angle and length options designed to meet the goals of restoring length, offset, range of motion, and stability. We would expect that a well-designed stem will meet these goals in the majority of cases.
Of our 463 cases with the modular neck, 9 required revision surgery. Of these 9 revisions, 2 were for recurrent dislocation in which the modular neck was revised to one that enhanced stability, and there were no further dislocations. The ability to change the geometry of the proximal femur resulted in a stability solution that avoided revision of the entire femoral component, as might otherwise be required. One case of acetabular loosening and 1 case that required placement of a constrained liner were potentially benefited by the modular neck in that the surgeries may have been expedited by being able to remove the neck to ease exposure for placement of the acetabular components. The other 5 revisions—2 for periprosthetic femur fracture, 2 two-stage revisions for infection, and 1 femoral head exchange for metallosis at the head–neck junction—saw no benefit from the modularity in the revision setting.
This study had several limitations. First, as it was primarily an evaluation of use of a modular femoral system, there was no attempt to account for the fact that acetabular component orientation can affect stability and, thus, the perceived need for additional offset or changes in version. The habit of all 3 of the reviewing surgeons is to consider the position of the acetabular component and to reposition the component, if necessary, to achieve appropriate stability. Therefore, the need for the modularity may be even less than suggested by this study. In addition, the idea that (in 12 cases) no standard stem option would be acceptable because of the use of a verted neck ignores the possibility that cup repositioning could have obviated the need for additional version. Furthermore, use of a 36-mm head results in an additional 3.5 mm of offset in the polyethylene liner, and this study did not account for the option of increasing head size—and for the potential increase in stability from a larger head and the increased offset gained from the liner.
A second limitation is that a significant number of Kinectiv stems (132) had a head center within 4 mm in length and 2 mm of offset of the nearest M/L Taper stem. We carefully template every primary THA to determine the plan that will optimize component size and position and restore length and offset. More options for achieving these goals are available when templating with the intention of using the Kinectiv modular neck. The neck cut and position of the stem proximally or distally in the proximal femur may not need to be so exact, as the additional options may be able to accommodate minor inaccuracies. Thus, the reported percentage of clinically indistinguishable head centers (12%) may underestimate the actual number of modular stems that could have been replaced with a nonmodular stem.
Third, this study did not evaluate the effect of the modular junction on ease of irrigation and débridement with head/neck and polyethylene exchange in cases of infection, or on ease of head/neck and polyethylene exchange for revision. In addition, the study did not evaluate other cases of instability involving a nonmodular stem that otherwise could have been solved with simple revision of the head/neck combination, avoiding revision of the entire stem and/or the acetabular component. We reported revisions for infection and for instability, but comprehensive assessment and comparison were beyond the scope of this study. Certainly ease of revision of the head and neck is a factor that could favor use of the modularity.
Fourth, this was not a clinical outcome study comparing 2 different femoral stems. We sought only to determine how often a modular neck was chosen that resulted in a head center that would have been unavailable to the non-modular stem suggesting that the patient was receiving a reconstructive benefit in exchange for the modularity. However, 2 recent reports have noted no clinical benefit at 2-year follow-up with use of the modular neck compared with the nonmodular stem.22,23
Though the M/L Taper with Kinectiv technology has, thus far, performed well, PFNSM should be used with caution in light of recently reported failures at the neck–stem junction.14,16-18 Our study results suggest that most (≥56%) of the modular stems used could have been reconstructed as acceptably with a nonmodular stem, and therefore a reconstructive benefit was not realized in trade for the potential risks of proximal modularity. Only 2 of the 9 revision cases saw a clear advantage in being able to change the modular neck geometry in the revision setting. Given the recently reported failures and the high-profile recall of a modular stem,14 we recommend restricting the modular stem to cases that cannot be adequately reconstructed with the nonmodular option.
1. Barrack RL. Modularity of prosthetic implants. J Am Acad Orthop Surg. 1994;2(1):16-25.
2. Cameron HU. Modularity in primary total hip arthroplasty. J Arthroplasty. 1996;11(3):332-334.
3. Hozack WJ, Mesa JJ, Rothman RF. Head–neck modularity for total hip arthroplasty. Is it necessary? J Arthroplasty. 1996;11(4):397-399.
4. Holt GE, Christie MJ, Schwartz HS. Trabecular metal endoprosthetic limb salvage reconstruction of the lower limb. J Arthroplasty. 2009;24(7):1079-1089.
5. Sporer SM, Obar RJ, Bernini PM. Primary total hip arthroplasty using a modular proximally coated prosthesis in patients older than 70: two to eight year results. J Arthroplasty. 2004;19(2):197-203.
6. Spitzer AI. The S-ROM cementless femoral stem: history and literature review. Orthopedics. 2005;28(9 suppl):s1117-s1124.
7. Mumme T, Müller-Rath R, Andereya S, Wirtz DC. Uncemented femoral revision arthroplasty using the modular revision prosthesis MRP-TITAN revision stem. Oper Orthop Traumatol. 2007;19(1):56-77.
8. Wirtz DC, Heller KD, Holzwarth U, et al. A modular femoral implant for uncemented stem revision in THR. Int Orthop. 2000;24(3):134-138.
9. Lakstein D, Backstein D, Safir O, Kosashvili Y, Gross AE. Revision total hip arthroplasty with a porous-coated modular stem: 5 to 10 years follow-up. Clin Orthop Relat Res. 2010;468(5):1310-1315.
10. Bolognesi MP, Pietrobon R, Clifford PE, Vail TP. Comparison of a hydroxyapatite-coated sleeve and a porous-coated sleeve with a modular revision hip stem. A prospective, randomized study. J Bone Joint Surg Am. 2004;86(12):2720-2725.
11. Huot Carlson JC, Van Citters DW, Currier JH, Bryant AM, Mayor MB, Collier JP. Femoral stem fracture and in vivo corrosion of retrieved modular femoral hips. J Arthroplasty. 2012;27(7):1389-1396.e1.
12. Gilbert JL, Mehta M, Pinder B. Fretting crevice corrosion of stainless steel stem–CoCr femoral head connections: comparisons of materials, initial moisture, and offset length. J Biomed Mater Res B Appl Biomater. 2009;88(1):162-173.
13. Kop AM, Keogh C, Swarts E. Proximal component modularity in THA—at what cost? An implant retrieval study. Clin Orthop Relat Res. 2012;470(7):1885-1894.
14. Cooper HJ, Urban RM, Wixson RL, Meneghini RM, Jacobs JJ. Adverse local tissue reaction arising from corrosion at the femoral neck–body junction in a dual-taper stem with a cobalt-chromium modular neck. J Bone Joint Surg Am. 2013;95(10):865-872.
15. Vundelinckx BJ, Verhelst LA, De Schepper J. Taper corrosion in modular hip prostheses: analysis of serum metal ions in 19 patients. J Arthroplasty. 2013;28(7):1218-1223.
16. Kouzelis A, Georgiou CS, Megas P. Dissociation of modular total hip arthroplasty at the neck–stem interface without dislocation. J Orthop Traumatol. 2012;13(4):221-224.
17. Sotereanos NG, Sauber TJ, Tupis TT. Modular femoral neck fracture after primary total hip arthroplasty. J Arthroplasty. 2013;28(1):196.e7-e9.
18. Wodecki P, Sabbah D, Kermarrec G, Semaan I. New type of hip arthroplasty failure related to modular femoral components: breakage at the neck–stem junction. Orthop Traumatol Surg Res. 2013;99(6):741-744.
19. Dorn U, Neumann D, Frank M. Corrosion behavior of tantalum-coated cobalt-chromium modular necks compared to titanium modular necks in a simulator test. J Arthroplasty. 2014;29(4):831-835.
20. Carothers JT, White RE, Tripuraneni KR, Hattab MW, Archibeck MJ. Lessons learned from managing a prospective, private practice joint replacement registry: a 25-year experience. Clin Orthop Relat Res. 2013;471(2):537-543.
21. Archibeck MJ, Cummins T, Carothers J, Junick DW, White RE Jr. A comparison of two implant systems in restoration of hip geometry in arthroplasty. Clin Orthop Rel Res. 2011;469(2):443-446.
22. Duwelius PJ, Hartzband MA, Burkhart R, et al. Clinical results of a modular neck hip system: hitting the “bull’s-eye” more accurately. Am J Orthop. 2010;39(10 suppl):2-6.
23. Duwelius PJ, Burkhart B, Carnahan C, et al. Modular versus nonmodular neck femoral implants in primary total hip arthroplasty: which is better? Clin Orthop Relat Res. 2014;472(4):1240-1245.
Radiographically Silent Loosening of the Acetabular Component in Hip Arthroplasty
Total hip arthroplasty (THA) is an excellent option for the treatment of osteoarthritis of the hip. In numerous studies, modern implants have shown survivorship of more than 90% at 10 years.1,2 Polyethylene wear and subsequent osteolysis are major obstacles to the long-term success of THA.3-5 Polyethylene wear particles are phagocytized by macrophages, inducing an inflammatory response that can ultimately lead to osteolysis of the bony architecture surrounding the bone–implant interface.6,7 As modern implants often rely on direct implant-to-bone ingrowth to maintain fixation, wear at this junction can lead to aseptic component loosening and ultimately require revision surgery.8-10 Osteolysis can be diagnosed with plain radiography or computed tomography (CT).11 CT is more sensitive than plain radiography for the diagnosis of osteolysis and is better able to determine the size and location of osteolytic lesions.12,13
Although diagnosis of osteolysis is well defined in the literature, what is more challenging is radiographic diagnosis of a loose acetabular component.11 The most commonly described criteria for loosening are presence of a complete radiolucent line of more than 2 mm in width at the bone–implant interface and any progressive tilting or migration of the component.14,15 CT-based criteria for component loosening remain largely undefined, though Egawa and colleagues16 showed that acetabular osteolysis involving less than 40% of the total cup surface is not associated with component loosening. Although a patient may show signs of osteolysis on postoperative imaging, this finding does not necessitate immediate revision surgery.17 Osteolysis may be monitored clinically and followed radiographically to determine when intervention is necessary.13
The goals of revision surgery are to eliminate the wear generator and bone-graft lytic lesions where needed to help maintain the bone–implant interface.17 The timing of such surgery is important, as the surgeon must balance the risk for gross component migration against the morbidity and mortality associated with acetabular component revision.18 This is in contrast to the settings of infection, periprosthetic fracture, recurrent instability, and component fracture/loosening, in which revision is urgently indicated and the case cannot be managed conservatively.
We conducted a study to determine the incidence of loose acetabular components without radiographic or clinical findings that would necessitate urgent revision THA. Radiographically silent loosening (RSL) was defined as an acetabular component that was loose at time of revision surgery but that did not show frank signs of loosening on either plain radiography or CT. Although these patients make up a small minority of the revision population, knowing the incidence of RSL can help raise surgeon awareness of this potentially dangerous situation. We further sought to determine whether patients with RSL present with different demographic characteristics or clinical symptoms than patients with stable acetabular components.
Materials and Methods
In this retrospective, case–control, institutional review board–approved study, we evaluated patients who had undergone revision THA and had preoperative plain radiographs and CT images. We identified patients by International Classification of Diseases, Ninth Revision (ICD‑9) codes (00.70, 00.71, 00.72, 00.73, 80.05, 81.53, 84.56, 84.57) and searched for those cases treated between 2000 and 2012.
Inclusion criteria were confirmed revision THA and confirmed plain radiography and CT of the THA performed before revision. When osteolysis was diagnosed by plain radiography, CT was ordered to determine the extent of bony lesions or to evaluate for eccentric head position or component malposition. Last, all patients included in the study had a detailed operative report clearly indicating acetabular component stability at time of revision. Acetabular component stability at time of surgery was determined according to the criteria defined by Berger and colleagues.19 Cups were evaluated for gross motion during both hip dislocation and during edge loading of the component after thorough scar and capsular débridement.
Patients who did not have CT performed before revision surgery were excluded from the study. These patients had been diagnosed by clinical history and/or plain radiography. Cases revised for periprosthetic infection or periprosthetic fracture were also excluded. Patients with metal-on-metal bearings were excluded, as were any cases revised from hemiarthroplasty to THA, as well as cases revised for recurrent dislocations or component malposition.
All plain radiographs and CT images were evaluated by the orthopedic surgeon who performed the revision and by a radiologist. Images were inspected for signs of gross component migration, tilting, and concentric lucency of the bone–implant interface. Patients with imaging that showed signs of component movement or migration (as seen by the attending surgeon or the radiologist) were excluded. Patients with radiographic evidence of femoral stem loosening were also excluded, as they had an indication to undergo revision arthroplasty. The remaining patients were then stratified into 2 groups: those with stable acetabular components at time of revision and those with loose acetabular components. Stable acetabular shells showed no gross motion of the implant with dislocation, edge loading with an impactor, or pulling with a Kocher clamp after débridement and screw removal.15,19 The 2 groups were then compared with respect to age, sex, and most common presenting symptoms and diagnoses. Fischer exact test and Student t test were used to statistically compare the groups.
Results
Overall, 393 patients underwent revision arthroplasty for the diagnoses (ICD-9 codes) indicated (Figure). One hundred eighty-nine patients (48.1%) had CT performed before revision. Of these 189 patients, 85 were excluded for diagnoses that were evident on either plain radiography or CT, that necessitated urgent revision, or for procedures beyond the scope of the study (Table 1). CT showed a loose cup in 28 patients; 6 of these cups were also seen on CT. Thirteen patients were diagnosed with a loose femoral stem, 10 with a periprosthetic infection, and 8 with a periprosthetic fracture.
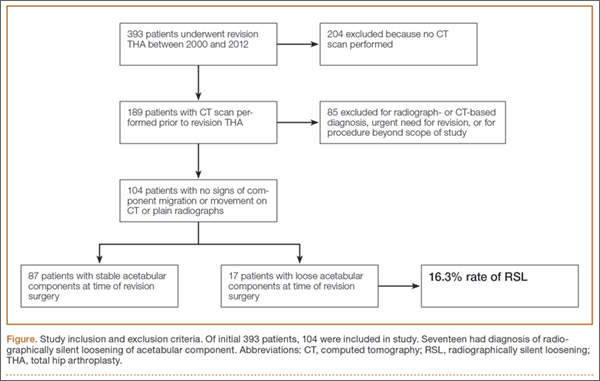
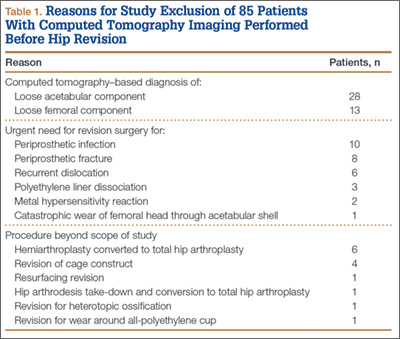
One hundred four patients (54 men, 50 women) met the study inclusion criteria. Mean age was 65.1 years. Of these 104 patients, 87 (83.7%) had a stable acetabular shell at time of revision surgery; the other 17 (16.3%) were diagnosed with RSL of the acetabular shell. Osteolysis was the most common diagnosis (89.4%) in the overall population, and pain was the most common complaint at time of presentation (66.6%). Lack of symptoms was the second most common presentation at time of revision (19.2%) (Table 2). Patients without symptoms underwent revision surgery because of concern about impending compromise of the bone–implant interface and progressive osteolysis.
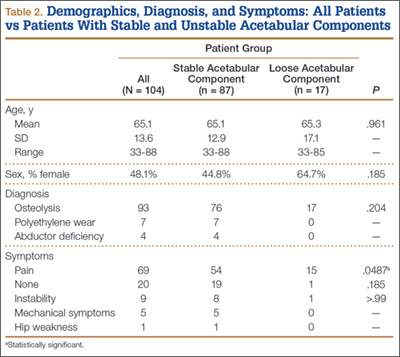
The 2 groups (stable vs unstable acetabular shells) were not significantly different with respect to age (P = .961) or sex distribution (P = .185). All patients in the RSL group were diagnosed with osteolysis radiographically, and 15 (88%) of 17 patients presented with pain as the primary complaint, compared with only 54 (62%) of 87 patients in the group with stable shells. Patients with RSL were significantly more likely to present with pain as the primary complaint (P = .0487). Nineteen patients in the stable implant group and only 1 patient in the RSL group were asymptomatic, but this was not statistically significant (P = .185) when compared against all other diagnoses.
Discussion
We defined RSL as an acetabular component that was loose at time of revision surgery but that did not show frank signs of loosening on either plain radiography or CT. Patients with RSL and the surgeons who treat them are in a difficult position. In the setting of osteolysis, patients can be treated with serial radiographic imaging and clinical monitoring to determine if and when revision arthroplasty should be performed.17 However, given the complexity and risks associated with revision THA, surgeons should be aware that the acetabular shell may necessitate revision even if it does not appear to be frankly unstable on radiographic imaging.18
Of the 393 patients who underwent revision THA at our institution, 48.1% were evaluated with CT. Eighty-five of the 189 patients who underwent CT were diagnosed with radiographic loosening, or were diagnosed as needing urgent revision THA in the setting of loose components, periprosthetic infection, periprosthetic fracture, or catastrophic implant failure. Of the remaining 104 patients, 17 (16.3%) met the diagnosis of RSL of the acetabular component. The most common complaint was pain, and the most common diagnoses were osteolysis and polyethylene wear. Age and sex were not associated with increased likelihood of RSL.
Our study has several limitations. We defined the radiographic diagnosis of loose acetabular components as components showing frank migration, tilting, or a 2-mm concentric lucency on plain radiography or CT. Although these are common definitions of loose acetabular components, more sensitive radiographic measures have been described.16 We also excluded patients with recurrent dislocations and metal-on-metal prostheses, as these cases increase the metal artifact on CT and limit the ability to evaluate the bone–implant interface. Metal artifact remains an ongoing challenge to use of CT for post-THA imaging. However, tailored imaging protocols are helping to eliminate metal artifact. Bone scan was not used to evaluate for possible component loosening. Although sensitivity and specificity are about 67% and 76%, respectively,20 Temmerman and colleagues21 also found poor intraobserver reliability (0.53) for bone scans in the setting of uncemented acetabular components. Last, our study did not evaluate the bony ingrowth patterns that corresponded to stable or unstable fixation and did not evaluate the volumetric size or anatomical location of the osteolytic lesions on CT. Careful assessment of these variables is clinically relevant when trying to determine if revision arthroplasty is warranted.
Although we used relatively simple radiographic criteria to define loose components, more sensitive and specific techniques have been described for both plain radiography and CT. Moore and colleagues22 described 5 radiographic signs of bony ingrowth; when 3 or more were present, sensitivity was 89.6% and specificity 76.9%. Mehin and colleagues23 suggested that osteolysis involving more than 50% of the circumference of the shell on a standard pelvic radiograph might require revision arthroplasty. However, more recent studies have found that anteroposterior and lateral radiographs are less able to evaluate the anterior and posterior rims of the bone–implant interface, and it is this ingrowth area that may be the most crucial for stable osseointegration.12,16
CT has expanded our ability to evaluate the bone–implant interface in 3 dimensions. Egawa and colleagues16 described using CT to evaluate the surface area involved with osteolysis and found that less than 40% involvement of the surface area generally corresponded to well-fixed components. Furthermore, they found that osteolysis generally creates lesions inferior and superior to the acetabular component and less often involves the anterior and posterior rims, which may be more important for stable fixation. The authors noted that volumetric analysis and CT were not as cost-effective as plain radiography and were more time- and skill-intensive.
Osteolysis itself remains a common indication for revision THA. However, the most appropriate procedure remains controversial. Mallory and colleagues24 recommended explanting all acetabular shells in the setting of revision arthroplasty. They indicated that full assessment of the bony pelvis and any lytic defects was possible only with the wide exposure gained by acetabular component removal. More recent studies have begun to justify isolated component revision in the setting of well-fixed acetabular shells. Studies by Maloney and colleagues,10 Park and colleagues,15 and Beaulé and colleagues25 have shown excellent outcomes with retention of well-fixed acetabular shells and removal of the wear generator in the setting of osteolysis. Haidukewych17 wrote that the goals in addressing osteolysis in revision THA are to eliminate the wear generator, débride osteolytic lesions, and restore bone stock. Surgeons should weigh the benefits of component retention and isolated liner exchange against the morbidity associated with explantation and preparation for implanting a new component. Good outcomes have been achieved with isolated component exchange, but surgeons should be aware that instability remains the most common complication after isolated liner exchange.8
The majority of our patients with RSL presented with complaints of pain and the diagnosis of osteolysis. One patient who had the diagnosis but was clinically asymptomatic was found to have a loose acetabular shell at time of revision surgery. Given the increased morbidity associated with acetabular component revision, this patient’s condition represents a dangerous combination of RSL and clinically asymptomatic component loosening. By raising awareness about RSL and its incidence, we should be able to increase our ability to detect RSL. A surgeon who detects RSL before gross migration or movement of the acetabular component may be better able to plan for revision arthroplasty before a catastrophic event that may necessitate a larger, more complex procedure. With the number of patients who require revision THA continuing to rise, surgeons should be aware of the incidence of RSL and the potential of RSL to affect patient care and potential surgical options.
1. Milošev I, Kovač S, Trebše R, Levašič V, Pišot V. Comparison of ten-year survivorship of hip prostheses with use of conventional polyethylene, metal-on-metal, or ceramic-on-ceramic bearings. J Bone Joint Surg Am. 2012;94(19):1756-1763.
2. D’Antonio JA, Capello WN, Naughton M. Ceramic bearings for total hip arthroplasty have high survivorship at 10 years. Clin Orthop Relat Res. 2012;470(2):373-381.
3. Dowd JE, Sychterz CJ, Young AM, Engh CA. Characterization of long-term femoral-head-penetration rates. Association with and prediction of osteolysis. J Bone Joint Surg Am. 2000;82(8):1102-1107.
4. Orishimo KF, Claus AM, Sychterz CJ, Engh CA. Relationship between polyethylene wear and osteolysis in hips with a second-generation porous-coated cementless cup after seven years of follow-up. J Bone Joint Surg Am. 2003;85(6):1095-1099.
5. Harris WH. Wear and periprosthetic osteolysis: the problem. Clin Orthop Relat Res. 2001;(393):66-70.
6. Holt G, Murnaghan C, Reilly J, Meek RM. The biology of aseptic osteolysis. Clin Orthop Relat Res. 2007;(460):240-252.
7. Catelas I, Jacobs JJ. Biologic activity of wear particles. Instr Course Lect. 2010;59:3-16.
8. Paprosky WG, Nourbash P, Gill P. Treatment of progressive periacetabular osteolysis: cup revision versus liner exchange and bone grafting. Paper presented at: Annual Meeting of the American Academy of Orthopaedic Surgeons; February 4-8, 1999; Anaheim, CA.
9. Engh CA Jr, Claus AM, Hopper RH Jr, Engh CA. Long-term results using the anatomic medullary locking hip prosthesis. Clin Orthop Relat Res. 2001;(393):137-146.
10. Maloney WJ, Peters P, Engh CA, Chandler H. Severe osteolysis of the pelvic in association with acetabular replacement without cement. J Bone Joint Surg Am. 1993;75(11):1627-1635.
11. Claus AM, Engh CA Jr, Sychterz CJ, Xenos JS, Orishimo KF, Engh CA Sr. Radiographic definition of pelvic osteolysis following total hip arthroplasty. J Bone Joint Surg Am. 2003;85(8):1519-1526.
12. Puri L, Wixson RL, Stern SH, Kohli J, Hendrix RW, Stulberg SD. Use of helical computed tomography for the assessment of acetabular osteolysis after total hip arthroplasty. J Bone Joint Surg Am. 2002;84(4):609-614.
13. Stulberg SD, Wixson RL, Adams AD, Hendrix RW, Bernfield JB. Monitoring pelvic osteolysis following total hip replacement surgery: an algorithm for surveillance. J Bone Joint Surg Am. 2002;84(suppl 2):116-122.
14. Massin P, Schmidt L, Engh CA. Evaluation of cementless acetabular component migration. An experimental study. J Arthroplasty. 1989;4(3):245-251.
15. Park KS, Yoon TR, Song EK, Lee KB. Results of isolated femoral component revision with well-fixed acetabular implant retention. J Arthroplasty. 2010;25(8):1188-1195.
16. Egawa H, Ho H, Hopper RH Jr, Engh CA Jr, Engh CA. Computed tomography assessment of pelvic osteolysis and cup–lesion interface involvement with a press-fit porous-coated acetabular cup. J Arthroplasty. 2009;24(2):233-239.
17. Haidukewych GJ. Osteolysis in the well-fixed socket: cup retention or revision? J Bone Joint Surg Br. 2012;94(12):65-69.
18. Stulberg BN, Della Valle AG. What are the guidelines for the surgical and nonsurgical treatment of periprosthetic osteolysis? J Am Acad Orthop Surg. 2008;16(suppl 1):S20-S25.
19. Berger RA, Quigley LR, Jacobs JJ, Sheinkop MB, Rosenberg AG, Galante JO. The fate of stable cemented acetabular components retained during revision of a femoral component of a total hip arthroplasty. J Bone Joint Surg Am. 1999;81(12):1682-1691.
20. Temmerman OP, Raijmakers PG, Deville WL, Berkhof J, Hooft L, Heyligers IC. The use of plain radiography, subtraction arthrography, nuclear arthrography, and bone scintigraphy in the diagnosis of a loose acetabular component of a total hip prosthesis: a systematic review. J Arthroplasty. 2007;22(6):818-827.
21. Temmerman OP, Raijmakers PG, David EF, et al. A comparison of radiographic and scintigraphic techniques to assess aseptic loosening of the acetabular component in a total hip replacement. J Bone Joint Surg Am. 2004;86(11):2456-2463.
22. Moore MS, McAuley JP, Young AM, Engh CA Sr. Radiographic signs of osseointegration in porous-coated acetabular components. Clin Orthop Relat Res. 2006;(444):176-183.
23. Mehin R, Yuan X, Haydon C, et al. Retroacetabular osteolysis: when to operate? Clin Orthop Relat Res. 2004;(428):247-255.
24. Mallory TH, Lombardi AV Jr, Fada RA, Adams JB, Kefauver CA, Eberle RW. Noncemented acetabular component removal in the presence of osteolysis: the affirmative. Clin Orthop Relat Res. 2000;(381):120-128.
25. Beaulé PE, Le Duff MJ, Dorey FJ, Amstutz HC. Fate of cementless acetabular components retained during revision total hip arthroplasty. J Bone Joint Surg Am. 2003;85(12):2288-2293.
Total hip arthroplasty (THA) is an excellent option for the treatment of osteoarthritis of the hip. In numerous studies, modern implants have shown survivorship of more than 90% at 10 years.1,2 Polyethylene wear and subsequent osteolysis are major obstacles to the long-term success of THA.3-5 Polyethylene wear particles are phagocytized by macrophages, inducing an inflammatory response that can ultimately lead to osteolysis of the bony architecture surrounding the bone–implant interface.6,7 As modern implants often rely on direct implant-to-bone ingrowth to maintain fixation, wear at this junction can lead to aseptic component loosening and ultimately require revision surgery.8-10 Osteolysis can be diagnosed with plain radiography or computed tomography (CT).11 CT is more sensitive than plain radiography for the diagnosis of osteolysis and is better able to determine the size and location of osteolytic lesions.12,13
Although diagnosis of osteolysis is well defined in the literature, what is more challenging is radiographic diagnosis of a loose acetabular component.11 The most commonly described criteria for loosening are presence of a complete radiolucent line of more than 2 mm in width at the bone–implant interface and any progressive tilting or migration of the component.14,15 CT-based criteria for component loosening remain largely undefined, though Egawa and colleagues16 showed that acetabular osteolysis involving less than 40% of the total cup surface is not associated with component loosening. Although a patient may show signs of osteolysis on postoperative imaging, this finding does not necessitate immediate revision surgery.17 Osteolysis may be monitored clinically and followed radiographically to determine when intervention is necessary.13
The goals of revision surgery are to eliminate the wear generator and bone-graft lytic lesions where needed to help maintain the bone–implant interface.17 The timing of such surgery is important, as the surgeon must balance the risk for gross component migration against the morbidity and mortality associated with acetabular component revision.18 This is in contrast to the settings of infection, periprosthetic fracture, recurrent instability, and component fracture/loosening, in which revision is urgently indicated and the case cannot be managed conservatively.
We conducted a study to determine the incidence of loose acetabular components without radiographic or clinical findings that would necessitate urgent revision THA. Radiographically silent loosening (RSL) was defined as an acetabular component that was loose at time of revision surgery but that did not show frank signs of loosening on either plain radiography or CT. Although these patients make up a small minority of the revision population, knowing the incidence of RSL can help raise surgeon awareness of this potentially dangerous situation. We further sought to determine whether patients with RSL present with different demographic characteristics or clinical symptoms than patients with stable acetabular components.
Materials and Methods
In this retrospective, case–control, institutional review board–approved study, we evaluated patients who had undergone revision THA and had preoperative plain radiographs and CT images. We identified patients by International Classification of Diseases, Ninth Revision (ICD‑9) codes (00.70, 00.71, 00.72, 00.73, 80.05, 81.53, 84.56, 84.57) and searched for those cases treated between 2000 and 2012.
Inclusion criteria were confirmed revision THA and confirmed plain radiography and CT of the THA performed before revision. When osteolysis was diagnosed by plain radiography, CT was ordered to determine the extent of bony lesions or to evaluate for eccentric head position or component malposition. Last, all patients included in the study had a detailed operative report clearly indicating acetabular component stability at time of revision. Acetabular component stability at time of surgery was determined according to the criteria defined by Berger and colleagues.19 Cups were evaluated for gross motion during both hip dislocation and during edge loading of the component after thorough scar and capsular débridement.
Patients who did not have CT performed before revision surgery were excluded from the study. These patients had been diagnosed by clinical history and/or plain radiography. Cases revised for periprosthetic infection or periprosthetic fracture were also excluded. Patients with metal-on-metal bearings were excluded, as were any cases revised from hemiarthroplasty to THA, as well as cases revised for recurrent dislocations or component malposition.
All plain radiographs and CT images were evaluated by the orthopedic surgeon who performed the revision and by a radiologist. Images were inspected for signs of gross component migration, tilting, and concentric lucency of the bone–implant interface. Patients with imaging that showed signs of component movement or migration (as seen by the attending surgeon or the radiologist) were excluded. Patients with radiographic evidence of femoral stem loosening were also excluded, as they had an indication to undergo revision arthroplasty. The remaining patients were then stratified into 2 groups: those with stable acetabular components at time of revision and those with loose acetabular components. Stable acetabular shells showed no gross motion of the implant with dislocation, edge loading with an impactor, or pulling with a Kocher clamp after débridement and screw removal.15,19 The 2 groups were then compared with respect to age, sex, and most common presenting symptoms and diagnoses. Fischer exact test and Student t test were used to statistically compare the groups.
Results
Overall, 393 patients underwent revision arthroplasty for the diagnoses (ICD-9 codes) indicated (Figure). One hundred eighty-nine patients (48.1%) had CT performed before revision. Of these 189 patients, 85 were excluded for diagnoses that were evident on either plain radiography or CT, that necessitated urgent revision, or for procedures beyond the scope of the study (Table 1). CT showed a loose cup in 28 patients; 6 of these cups were also seen on CT. Thirteen patients were diagnosed with a loose femoral stem, 10 with a periprosthetic infection, and 8 with a periprosthetic fracture.
One hundred four patients (54 men, 50 women) met the study inclusion criteria. Mean age was 65.1 years. Of these 104 patients, 87 (83.7%) had a stable acetabular shell at time of revision surgery; the other 17 (16.3%) were diagnosed with RSL of the acetabular shell. Osteolysis was the most common diagnosis (89.4%) in the overall population, and pain was the most common complaint at time of presentation (66.6%). Lack of symptoms was the second most common presentation at time of revision (19.2%) (Table 2). Patients without symptoms underwent revision surgery because of concern about impending compromise of the bone–implant interface and progressive osteolysis.
The 2 groups (stable vs unstable acetabular shells) were not significantly different with respect to age (P = .961) or sex distribution (P = .185). All patients in the RSL group were diagnosed with osteolysis radiographically, and 15 (88%) of 17 patients presented with pain as the primary complaint, compared with only 54 (62%) of 87 patients in the group with stable shells. Patients with RSL were significantly more likely to present with pain as the primary complaint (P = .0487). Nineteen patients in the stable implant group and only 1 patient in the RSL group were asymptomatic, but this was not statistically significant (P = .185) when compared against all other diagnoses.
Discussion
We defined RSL as an acetabular component that was loose at time of revision surgery but that did not show frank signs of loosening on either plain radiography or CT. Patients with RSL and the surgeons who treat them are in a difficult position. In the setting of osteolysis, patients can be treated with serial radiographic imaging and clinical monitoring to determine if and when revision arthroplasty should be performed.17 However, given the complexity and risks associated with revision THA, surgeons should be aware that the acetabular shell may necessitate revision even if it does not appear to be frankly unstable on radiographic imaging.18
Of the 393 patients who underwent revision THA at our institution, 48.1% were evaluated with CT. Eighty-five of the 189 patients who underwent CT were diagnosed with radiographic loosening, or were diagnosed as needing urgent revision THA in the setting of loose components, periprosthetic infection, periprosthetic fracture, or catastrophic implant failure. Of the remaining 104 patients, 17 (16.3%) met the diagnosis of RSL of the acetabular component. The most common complaint was pain, and the most common diagnoses were osteolysis and polyethylene wear. Age and sex were not associated with increased likelihood of RSL.
Our study has several limitations. We defined the radiographic diagnosis of loose acetabular components as components showing frank migration, tilting, or a 2-mm concentric lucency on plain radiography or CT. Although these are common definitions of loose acetabular components, more sensitive radiographic measures have been described.16 We also excluded patients with recurrent dislocations and metal-on-metal prostheses, as these cases increase the metal artifact on CT and limit the ability to evaluate the bone–implant interface. Metal artifact remains an ongoing challenge to use of CT for post-THA imaging. However, tailored imaging protocols are helping to eliminate metal artifact. Bone scan was not used to evaluate for possible component loosening. Although sensitivity and specificity are about 67% and 76%, respectively,20 Temmerman and colleagues21 also found poor intraobserver reliability (0.53) for bone scans in the setting of uncemented acetabular components. Last, our study did not evaluate the bony ingrowth patterns that corresponded to stable or unstable fixation and did not evaluate the volumetric size or anatomical location of the osteolytic lesions on CT. Careful assessment of these variables is clinically relevant when trying to determine if revision arthroplasty is warranted.
Although we used relatively simple radiographic criteria to define loose components, more sensitive and specific techniques have been described for both plain radiography and CT. Moore and colleagues22 described 5 radiographic signs of bony ingrowth; when 3 or more were present, sensitivity was 89.6% and specificity 76.9%. Mehin and colleagues23 suggested that osteolysis involving more than 50% of the circumference of the shell on a standard pelvic radiograph might require revision arthroplasty. However, more recent studies have found that anteroposterior and lateral radiographs are less able to evaluate the anterior and posterior rims of the bone–implant interface, and it is this ingrowth area that may be the most crucial for stable osseointegration.12,16
CT has expanded our ability to evaluate the bone–implant interface in 3 dimensions. Egawa and colleagues16 described using CT to evaluate the surface area involved with osteolysis and found that less than 40% involvement of the surface area generally corresponded to well-fixed components. Furthermore, they found that osteolysis generally creates lesions inferior and superior to the acetabular component and less often involves the anterior and posterior rims, which may be more important for stable fixation. The authors noted that volumetric analysis and CT were not as cost-effective as plain radiography and were more time- and skill-intensive.
Osteolysis itself remains a common indication for revision THA. However, the most appropriate procedure remains controversial. Mallory and colleagues24 recommended explanting all acetabular shells in the setting of revision arthroplasty. They indicated that full assessment of the bony pelvis and any lytic defects was possible only with the wide exposure gained by acetabular component removal. More recent studies have begun to justify isolated component revision in the setting of well-fixed acetabular shells. Studies by Maloney and colleagues,10 Park and colleagues,15 and Beaulé and colleagues25 have shown excellent outcomes with retention of well-fixed acetabular shells and removal of the wear generator in the setting of osteolysis. Haidukewych17 wrote that the goals in addressing osteolysis in revision THA are to eliminate the wear generator, débride osteolytic lesions, and restore bone stock. Surgeons should weigh the benefits of component retention and isolated liner exchange against the morbidity associated with explantation and preparation for implanting a new component. Good outcomes have been achieved with isolated component exchange, but surgeons should be aware that instability remains the most common complication after isolated liner exchange.8
The majority of our patients with RSL presented with complaints of pain and the diagnosis of osteolysis. One patient who had the diagnosis but was clinically asymptomatic was found to have a loose acetabular shell at time of revision surgery. Given the increased morbidity associated with acetabular component revision, this patient’s condition represents a dangerous combination of RSL and clinically asymptomatic component loosening. By raising awareness about RSL and its incidence, we should be able to increase our ability to detect RSL. A surgeon who detects RSL before gross migration or movement of the acetabular component may be better able to plan for revision arthroplasty before a catastrophic event that may necessitate a larger, more complex procedure. With the number of patients who require revision THA continuing to rise, surgeons should be aware of the incidence of RSL and the potential of RSL to affect patient care and potential surgical options.
1. Milošev I, Kovač S, Trebše R, Levašič V, Pišot V. Comparison of ten-year survivorship of hip prostheses with use of conventional polyethylene, metal-on-metal, or ceramic-on-ceramic bearings. J Bone Joint Surg Am. 2012;94(19):1756-1763.
2. D’Antonio JA, Capello WN, Naughton M. Ceramic bearings for total hip arthroplasty have high survivorship at 10 years. Clin Orthop Relat Res. 2012;470(2):373-381.
3. Dowd JE, Sychterz CJ, Young AM, Engh CA. Characterization of long-term femoral-head-penetration rates. Association with and prediction of osteolysis. J Bone Joint Surg Am. 2000;82(8):1102-1107.
4. Orishimo KF, Claus AM, Sychterz CJ, Engh CA. Relationship between polyethylene wear and osteolysis in hips with a second-generation porous-coated cementless cup after seven years of follow-up. J Bone Joint Surg Am. 2003;85(6):1095-1099.
5. Harris WH. Wear and periprosthetic osteolysis: the problem. Clin Orthop Relat Res. 2001;(393):66-70.
6. Holt G, Murnaghan C, Reilly J, Meek RM. The biology of aseptic osteolysis. Clin Orthop Relat Res. 2007;(460):240-252.
7. Catelas I, Jacobs JJ. Biologic activity of wear particles. Instr Course Lect. 2010;59:3-16.
8. Paprosky WG, Nourbash P, Gill P. Treatment of progressive periacetabular osteolysis: cup revision versus liner exchange and bone grafting. Paper presented at: Annual Meeting of the American Academy of Orthopaedic Surgeons; February 4-8, 1999; Anaheim, CA.
9. Engh CA Jr, Claus AM, Hopper RH Jr, Engh CA. Long-term results using the anatomic medullary locking hip prosthesis. Clin Orthop Relat Res. 2001;(393):137-146.
10. Maloney WJ, Peters P, Engh CA, Chandler H. Severe osteolysis of the pelvic in association with acetabular replacement without cement. J Bone Joint Surg Am. 1993;75(11):1627-1635.
11. Claus AM, Engh CA Jr, Sychterz CJ, Xenos JS, Orishimo KF, Engh CA Sr. Radiographic definition of pelvic osteolysis following total hip arthroplasty. J Bone Joint Surg Am. 2003;85(8):1519-1526.
12. Puri L, Wixson RL, Stern SH, Kohli J, Hendrix RW, Stulberg SD. Use of helical computed tomography for the assessment of acetabular osteolysis after total hip arthroplasty. J Bone Joint Surg Am. 2002;84(4):609-614.
13. Stulberg SD, Wixson RL, Adams AD, Hendrix RW, Bernfield JB. Monitoring pelvic osteolysis following total hip replacement surgery: an algorithm for surveillance. J Bone Joint Surg Am. 2002;84(suppl 2):116-122.
14. Massin P, Schmidt L, Engh CA. Evaluation of cementless acetabular component migration. An experimental study. J Arthroplasty. 1989;4(3):245-251.
15. Park KS, Yoon TR, Song EK, Lee KB. Results of isolated femoral component revision with well-fixed acetabular implant retention. J Arthroplasty. 2010;25(8):1188-1195.
16. Egawa H, Ho H, Hopper RH Jr, Engh CA Jr, Engh CA. Computed tomography assessment of pelvic osteolysis and cup–lesion interface involvement with a press-fit porous-coated acetabular cup. J Arthroplasty. 2009;24(2):233-239.
17. Haidukewych GJ. Osteolysis in the well-fixed socket: cup retention or revision? J Bone Joint Surg Br. 2012;94(12):65-69.
18. Stulberg BN, Della Valle AG. What are the guidelines for the surgical and nonsurgical treatment of periprosthetic osteolysis? J Am Acad Orthop Surg. 2008;16(suppl 1):S20-S25.
19. Berger RA, Quigley LR, Jacobs JJ, Sheinkop MB, Rosenberg AG, Galante JO. The fate of stable cemented acetabular components retained during revision of a femoral component of a total hip arthroplasty. J Bone Joint Surg Am. 1999;81(12):1682-1691.
20. Temmerman OP, Raijmakers PG, Deville WL, Berkhof J, Hooft L, Heyligers IC. The use of plain radiography, subtraction arthrography, nuclear arthrography, and bone scintigraphy in the diagnosis of a loose acetabular component of a total hip prosthesis: a systematic review. J Arthroplasty. 2007;22(6):818-827.
21. Temmerman OP, Raijmakers PG, David EF, et al. A comparison of radiographic and scintigraphic techniques to assess aseptic loosening of the acetabular component in a total hip replacement. J Bone Joint Surg Am. 2004;86(11):2456-2463.
22. Moore MS, McAuley JP, Young AM, Engh CA Sr. Radiographic signs of osseointegration in porous-coated acetabular components. Clin Orthop Relat Res. 2006;(444):176-183.
23. Mehin R, Yuan X, Haydon C, et al. Retroacetabular osteolysis: when to operate? Clin Orthop Relat Res. 2004;(428):247-255.
24. Mallory TH, Lombardi AV Jr, Fada RA, Adams JB, Kefauver CA, Eberle RW. Noncemented acetabular component removal in the presence of osteolysis: the affirmative. Clin Orthop Relat Res. 2000;(381):120-128.
25. Beaulé PE, Le Duff MJ, Dorey FJ, Amstutz HC. Fate of cementless acetabular components retained during revision total hip arthroplasty. J Bone Joint Surg Am. 2003;85(12):2288-2293.
Patient Costs for Observation Care/
When Medicare beneficiaries seek healthcare, they are increasingly likely to have that care delivered under observation status. From 2006 to 2010, the annual number of observation hours for Medicare beneficiaries rose by nearly 70%.[1] In 2012, the number of observation stays for Medicare beneficiaries reached 1.5 million.[2] One consequence of this trend is a potential change in patient financial liabilitythe amount patients are expected to pay out of pocket for care. Although observation care is usually delivered in a hospital, Medicare classifies it as an outpatient service, covered through Part B rather than inpatient Part A. In two‐thirds of US hospitals, observation care is largely an administrative classification, delivered in the same units and beds as admitted patients rather than in a protocol‐driven observation care unit.[3] Therefore, patients are often unaware of their outpatient observation status and its financial implications until they receive their hospital bill.
Observation has the potential to impact patient financial liability through 4 mechanisms.[4] First, instead of a fixed cost for an inpatient admission (eg, a fixed deductible for a hospital admission), patients pay a percentage of the cost of each service provided. Therefore, patients who have long observation stays or receive expensive services could have higher than expected liability. A recent study using all‐payer data demonstrated that patients with longer observation stays (greater than 24 hours) paid 21% more than for those with shorter stays.[5]
A second consideration is that Medicare does not cover the same hospital services for observation care as it does for inpatient care. For example, self‐administered medications are generally not covered for beneficiaries receiving observation care. However, the Office of the Inspector General (OIG)[2] recently found that the average patient cost per observation stay in 2012even including the cost of self‐administered medicationswas $528. This was significantly lower than the inpatient deductible ($1156 in 2012) that patients would have paid had they been admitted. Although on average patients paid less for observation care, the OIG report found that 6% of observation stays were more costly to patients than inpatient admissions.
Third, there are certain benefits that Medicare beneficiaries are not eligible for unless they are admitted to the hospital. For a beneficiary to receive skilled nursing facility (SNF) benefits, they must be admitted to the hospital for 3 or more days. This was the basis for Bagnall v Sebelius, a class action lawsuit against the Centers for Medicare & Medicaid Services (CMS) filed in 2009 by the Center for Medicare Advocacy.[6] The OIG estimated that in 2012, Medicare beneficiaries had 600,000 observation stays longer than 3 days that failed to qualify them for SNF services. Since then, CMS created the 2‐midnight rule,[7] stating that CMS will assign inpatient status to all medically necessary stays of 2 midnights or longer. This rule was intended, in part, to curb the use of observation stays greater than 48 hours and was a key factor in Judge Michael Shea's decision to dismiss Bagnall v Sebelius.[6]
Finally, Medicare beneficiaries who must revisit the hospital may have greater cumulative costs under observation care versus inpatient care. Medicare beneficiaries are partially protected from accumulating high costs over multiple inpatient admissions by a benefit design known as the benefit period. A benefit period begins the day a beneficiary is admitted to a hospital or SNF, and ends when he or she has not received any inpatient hospital or SNF care for 60 days in a row. Beneficiaries pay the inpatient deductible only once per benefit period, even if they have multiple readmissions during this time. So, for example, if a beneficiary was readmitted to the hospital 59 days after discharge, he or she would not have to pay the inpatient deductible again. In addition, the benefit period would be extended for an additional 60 days. In contrast, beneficiaries who receive observation care are subject to coinsurance at every subsequent visit; therefore, these beneficiaries could accrue high cumulative costs over multiple observation stays.
To our knowledge, there have been no published studies focusing on the potentially vulnerable population of Medicare beneficiaries who frequently use observation care. Our objectives were to determine the financial liability for patients who have multiple observation stays within a 60‐day period, and then compare this to the inpatient deductible they would have paid as inpatients.
METHODS
Data Sources
We used a 20% sample of the Medicare Outpatient Standard Analytic File (SAF) to identify hospital observation stays among beneficiaries over the 3‐year period 2010 to 2012. The Outpatient SAF contains all institutional outpatient claims filed on the UB‐04 form. We also used publicly available data (American Association of Medical Colleges Council of Teaching Hospitals status,[8] US Department of Agriculture rural/urban continuum codes,[9] CMS Hospital Cost Reports,[10] and census bureau region) to link hospital Medicare provider number to hospital characteristics.
Measures
Our primary measure was beneficiary financial responsibility for facilities fees. For observation care patients, this amount is the sum of the Part B coinsurance liability amount, the Part B deductible amount, and the blood deductible liability amount.[11]
Observation care claims also include information on claim date, hospital Medicare provider number, principal diagnosis (International Classification of Diseases, Ninth Revision codes), services provided, and total hours for which observation services were provided (service units). Finally, claims include unique individual identifiers, which allowed us to construct our study population and obtain beneficiary characteristics including beneficiary age, race, gender, dual eligibility for Medicare/Medicaid, and severity of illness as measured by the CMS Hierarchical Condition Category (CMS‐HCC).[12] We obtained publicly available data on hospital characteristics, including academic hospital status,[8] urban versus rural,[9] nonprofit versus for profit,[10] and census bureau region, and linked these to the hospital Medicare provider number.
Study Sample and Statistical Analysis
We first created a denominator file that included all fee‐for‐service Medicare beneficiaries who had Part A and Part B coverage for a full calendar year (or until death) during the study period 2010 to 2012. We included dually eligible individuals, provided they had fee‐for‐service Medicare rather than a Medicare Advantage Plan.
We then constructed our study sample of unique beneficiaries who had an observation stay (lasting 8 hours, which is the criteria for Medicare payment) during the study period. We identified observation stays using revenue center codes and the Healthcare Common Procedure Coding System classification, and according to coding instructions found in the Medicare Claims Processing Manual.[13] Beneficiaries were excluded if their stay was converted from observation to inpatient status, because these claims may not be reliably tracked. After creating this study sample, we calculated the mean financial liability for the first observation stay for each beneficiary.
Next, within our study sample, we divided beneficiaries receiving observation care into 2 groups: those with multiple visits (defined as 2 observation stays in any 60‐day interval over the study period) and those without multiple visits. For each beneficiary with multiple visits, we calculated the mean cumulative financial liability for all stays within the 60‐day interval. We then compared this mean cumulative financial liability to the 2010 inpatient deductible of $1100.
We compared baseline characteristics of Medicare beneficiaries not receiving observation care, those with multiple observation visits, and those without multiple visits. We did this by using 2 tests for categorical variables, 2‐tailed unpaired t tests for 2‐way comparisons of means, and analysis of variance for 3‐way comparisons of means. We compared our primary outcome, mean beneficiary financial liability with the inpatient deductible of $1100 using a 1‐sample z test. As an exploratory analysis, we compared characteristics of beneficiaries with multiple observation visits with high cumulative liability (>$1100) versus low liability using bivariate analyses. We then created a multivariable logistic regression model for high liability. All analyses were performed using SAS version 9.1 (SAS Institute, Inc., Cary, NC). This study was reviewed by the institutional review board of the University of Pennsylvania.
RESULTS
Of the 7,470,676 unique Medicare beneficiaries in the 20% denominator file, 691,760 (9.3%) had at least 1 observation visit during the 3‐year study period (Table 1). The proportion of beneficiaries using observation care rose in each year of the study; 4.1% of beneficiaries used observation care in 2010, 4.4% in 2011, and 5.0% in 2012.
| Medicare FFS Beneficiaries Not Receiving Observation Care | Observation Care (n = 691,760) | P Value | ||
|---|---|---|---|---|
| No Multiple Observation Stays in 60 Days | Multiple (2) Observation Stays in 60 Days | |||
| ||||
| No. | 6,778,916 | 650,375 | 41,385 | N/A |
| Age, y, mean (SD) | 70.5 (12.9) | 72.2 (13.1) | 70.3 (14.9) | <0.01 |
| Gender, no. (%) | <0.01 | |||
| Male | 3,720,428 (54.9) | 387,333 (59.6) | 24,462 (59.1) | |
| Female | 3,058,488 (45.1) | 263,042 (40.4) | 16,923 (40.9) | |
| Race, no. (%) | <0.01 | |||
| White | 5,673,580 (83.7) | 545,165 (83.8) | 33,586 (81.2) | |
| Black | 674,420 (10.0) | 74,367 (11.4) | 5,913 (14.3) | |
| Other | 430,916 (6.4) | 30,843 (4.7) | 1,886 (4.6) | |
| Average no. of chronic conditions, mean (SD) | 1.7 (1.7) | 2.8 (2.0) | 3.6 (2.1) | <0.01 |
| Length of stay, h, mean (SD) | N/A | 29.9 (53.7) | 32.1 (16.9) | <0.01 |
| Most common hospital diagnoses, no. (%)* | N/A | |||
| Other chest pain (786.59) | N/A | 82,550 (12.7) | 9,995 (11.5) | |
| Chest pain, unspecified (786.50) | N/A | 56,416 (8.7) | 7,578 (8.7) | |
| Syncope and collapse (780.2) | N/A | 34,183 (5.3) | 3,291 (3.8) | |
| Coronary atherosclerosis (414.01) | N/A | 16,348 (2.5) | 2,763 (3.1) | |
Of the beneficiaries receiving observation care over the entire study period, 41,385 (6.0%) had multiple visits (2 observation visits in any 60‐day interval). The number of beneficiaries with multiple visits grew by 21.9% from 2010 to 2012. There were racial differences in the use of observation care; patients with multiple visits were more likely to be black than those without multiple visits or those not receiving observation care (14.3% vs 11.4% vs 10.0, P < 0.01). Multiple observation visits were also associated with a higher number of chronic conditions (3.6 vs 2.8 vs 1.7, P < 0.01) (Table 1).
The mean financial liability for the first observation stay for each beneficiary in our study sample was $469.42 (442.43) (Table 2). This is significantly lower than the standard inpatient deductible of $1100 (p<0.01). For 9.2% of beneficiaries, the financial liability was greater than the inpatient deductible.
| Mean (SD) | 25th Percentile | 50th Percentile | 75th Percentile | 90th Percentile | 99th Percentile | |
|---|---|---|---|---|---|---|
| ||||||
| First observation stay, n = 691,760 | $469.43 (442.43) | $216.20 | $333.77 | $529.87 | $1,045.85 | $2,088.66 |
| Cumulative 60 days for beneficiaries with multiple visits, n = 41,385 | $947.40 (803.62) | $471.01 | $681.40 | $1,152.66 | $1,904.54 | $3,902.50 |
The cumulative mean financial liability for beneficiaries with 2 stays in a 60‐day interval was $947.40 (803.62) (Table 2). This is significantly lower than the standard inpatient deductible of $1100 (P < 0.01). However, for 26.6% of beneficiaries, cumulative financial liability was greater than the $1100 inpatient deductible, which is what they would have paid had these hospital visits been inpatient admissions (Figure 1).
There were several factors associated with having this excess cumulative liability (Table 3). Higher frequency of observation visits within a 60‐day period was associated with high liability (odds ratio [OR]: 2.0, 95% confidence interval [CI]: 1.9‐2.1). In addition, having an index hospitalization in the Northeast region of the country was associated with lower odds of being in the high‐liability group (OR: 0.51, 95% CI: 0.47‐0.55). High liability was weakly associated with lower CMS‐HCC risk scores, nondual eligibility, nonblack race, and index hospital stay at an academic, urban, or nonprofit hospital.
| Unadjusted | Adjusted | |||
|---|---|---|---|---|
| Low, n = 30,416 | High, n = 10,969 | P Value | OR (95% CI) | |
| ||||
| No. of observation visits in a 60‐day period, mean (SD) | 2.08 (0.30) | 2.18 (0.52) | <0.001 | 2.0 (1.92.1) |
| HCC risk score, mean (SD) | 2.40 (2.50) | 2.10 (2.50) | <0.001 | 0.97 (0.960.98) |
| Most common hospital diagnoses, no. (%) | Chest pain (other or unspecified); 13,381 (21.1%) | Chest pain (other or unspecified); 4,165 (17.4%) | N/A | |
| Syncope and collapse; 2,602 (4.1%) | Coronary atherosclerosis; 2,228 (9.3%) | N/A | ||
| Dehydration; 1,264 (2.0%) | Syncope and collapse; 686 (2.9%) | N/A | ||
| Altered mental status; 1,140 (1.8%) | Atrial fibrillation; 390 (1.6%) | N/A | ||
| Obstructive bronchitis with exacerbation; 1,032 (1.6%) | CHF; 350 (1.5%) | N/A | ||
| Dual eligibility, no. (%) | 10,895 (35.8%) | 3,162 (28.8%) | <0.001 | 0.76 (0.730.80) |
| Race, no. (%) | <0.001 | |||
| White | 24,283 (79.8%) | 9,303 (84.8%) | 1 | |
| Black | 4,704 (15.5%) | 1,209 (11.0%) | 0.79 (0.730.85) | |
| Other | 1,429 (4.7%) | 457 (4.2%) | 0.95 (0.851.1) | |
| Hospital census bureau region, no. (%) | <0.001 | |||
| South | 14,076 (46.3%) | 5,059 (46.1%) | 1 | |
| Midwest | 8,431 (27.7%) | 3,365 (30.7%) | 1.08 (1.021.14) | |
| West | 3,426 (11.3%) | 1,709 (15.6%) | 1.34 (1.251.44) | |
| Northeast | 4,483 (14.7%) | 832 (7.6%) | 0.51 (0.470.55) | |
| Academic hospital | 5,038 (16.9%) | 1,362 (12.9%) | <0.001 | 0.90 (0.840.96) |
| Urban hospital | 13,260 (44.4%) | 3,926 (37.1%) | <0.001 | 0.79 (0.760.83) |
| Nonprofit hospital | 20,665 (69.2%) | 7,143 (67.4%) | 0.001 | 0.89 (0.830.94) |
DISCUSSION
Our findings suggest that for 91% of Medicare beneficiaries, a single observation stay was less costly than an inpatient admission. However, when beneficiaries had to return to observation care within 60 days of a prior stay, on average, their cumulative costs went up to $947. For more than a quarter of beneficiaries with multiple observation visits, the cumulative costs of these observation visits exceeded the inpatient deductible.
The results of this study are consistent with prior studies of observation care. We found that in 2010, 4.1% of Medicare beneficiaries used observation care, consistent with the estimated 4.0% in 2009 reported by the AARP Public Policy Institute.[14] Also, consistent with the growth rate from the AARP report, we found growth in use of observation care from 4.1% in 2010 to 5.0% in 2012. We found that the mean length of stay for observation care was 30 hours, consistent with recent studies estimating mean length of stay in 2009 as 25.9 hours.[15] We found that beneficiaries paid an average of $468.50 per observation care stay, very close to the $401 estimated by the 2013 OIG report (when self‐administered drugs were excluded).[2] The difference may be explained by the fact that OIG included observation stays of <8 hours in their sample; we excluded these stays because they did not meet criteria for Medicare payment. Like the OIG report, we also found that the vast majority (91%) of beneficiaries pay less for any given observation stay than for an inpatient stay.
However, our findings raise the concern that for a significant proportion of beneficiaries who are likely to return to the hospital, cumulative costs of multiple observation stays may be greater than the inpatient deductible. Therefore, although observation care is, on average, less expensive for beneficiaries than inpatient admission, beneficiaries lack the protection from escalating financial liability over multiple visits.
This finding is worrisome for 3 reasons. First, compared with the general beneficiary population, Medicare beneficiaries who return to the hospital frequently are also typically of lower socioeconomic status[16, 17, 18] and may be disproportionately affected by any increased financial liability. Interestingly, our analysis showed that patients with high financial liability incurred from multiple observation stays actually had a lower comorbidity burden than patients in the multiple observation stay group with lower liability, and were less likely to be black or dual eligible. This finding perhaps reflects the fact that very high‐risk patients who returned to the hospital were readmitted rather than being placed under observation status again, potentially depleting the high‐liability group of patients with these high‐risk characteristics. Second, patients have little control over their classification as observation versus inpatients. In many hospitals, observation is simply an administrative classification for care thatfrom the patients' perspectiveis identical to inpatient care.[4] It is problematic to expose patients to varying financial liability based on differences in administrative classification. Finally, we found that the number of patients with multiple observation visits within a 60‐day period rose by 22% between 2010 and 2012. This means that the problem of excess cumulative financial liability is likely to be increasingly common over the coming years. The increased incidence of multiple observation visits may be simply related to overall increases in use of observation care. Alternatively, some authors worry that this trend may be driven by hospital use of observation care for patients who are likely to be readmitted.[14, 19] A recent analysis by Gerhardt et al.[20] did not find evidence of direct substitution of observation care in the 30‐day window after an index admission. This suggests that physicians are not explicitly shifting patients to observation care in order to avert a readmission and the readmissions penalty.[21] However, it does not exclude the possibility of general shifts toward observation care for patients likely to return.
Experts have suggested capping the total out‐of‐pocket expense for observation care at the inpatient‐deductible amount.[4] This deductible cap would prevent the relatively rare case in which a single observation stay costs more than an inpatient admission. Our findings suggest that a benefit period (as in Part A) during which such a deductible would serve as a cap would also protect a small but significantly impacted population from higher than expected cumulative costs for multiple observation care visits.
This study has several limitations. First, we are only able to measure beneficiary financial responsibility and not the amount actually paid. This can differ from financial responsibility when patients do not pay their bill, when patients accrue additional charges (such as self‐administered medications) that are not reflected on outpatient claims, or when patients have additional third‐party payers who cover part or all of the financial responsibility (as with dually eligible patients). For such beneficiaries with supplemental coverage, out‐of‐pocket cost in both scenarios (inpatient or observation care) may be low or zero. However, the use of financial responsibility as an approximation of actual payment amounts is recommended by the Research Data Assistance Center and is consistent with other studies of cost in observation care.[2] Second, our data source only allowed us to assess facilities fees and not professional expenses. Our comparator of the inpatient deductible also only reflects facilities fees, making this a valid comparison. Third, we selected 60 days as the time interval for defining multiple visits. This interval is intended to approximate a Medicare benefit period, which is the time interval following a discharge from a hospital or an SNF until the time when the deductible resets. However, Medicare actually extends the benefit period another 60 days if a patient is readmitted during that 60‐day period. Thus, 60 days is actually the shortest possible benefit period. By conservatively defining the interval for recurrent observation stays in this way, we are likely underestimating the number and cost of observation stays in a true benefit period, and biasing our results toward the null.
In conclusion, our findings suggest that a significant proportion of Medicare beneficiaries who revisit observation care pay more than they would have had they been readmitted. As CMS policies on observation care continue to evolve, it may be helpful to consider measures to cap total out‐of‐pocket expenses within a benefit period to protect beneficiaries from higher than expected costs.
Disclosure
Disclosure: Nothing to report.
- June 2012 Data Book: Health Care Spending and the Medicare Program. Washington, DC: Medicare Payment Advisory Commission; 2012.
- . Hospitals' use of observation stays and short inpatient stays for Medicare beneficiaries, OEI‐02‐12‐00040. Washington, DC: Department of Health and Human Services, Office of the Inspector General; 2013.
- , , . National study of emergency department observation services. Acad Emerg Med. 2011;18(9):959–965.
- , . Observation care—high‐value care or a cost‐shifting loophole? N Engl J Med. 2013;369(4):302–305.
- , , , , . Factors associated with prolonged observation services stays and the impact of long stays on patient cost. Health Serv Res. 2014;49(3):893–909.
- Bagnall v Sebelius. No. 3:11cv1703 (MPS). September 23, 2013.
- Centers for Medicare 2 Midnight Benchmark for Inpatient Hospital Admissions. CMS‐1599‐F2013.2013. Available at: http://www.cms.gov/Outreach‐and‐Education/Outreach/OpenDoorForums/Downloads/02042014SODF.pdf. Accessed June 16, 2015
- Council of Teaching Hospitals and Health Systems (COTH). Association of American Medical Colleges website. Available at: https://www.aamc.org/members/coth/. Accessed May 5, 2006.
- United States Department of Agriculture Economic Research Service. Rural‐urban continuity codes. Available at: http://www.ers.usda.gov/data‐products/rural‐urban‐continuum‐codes.aspx. Accessed June 16, 2015.
- Centers for Medicare
When Medicare beneficiaries seek healthcare, they are increasingly likely to have that care delivered under observation status. From 2006 to 2010, the annual number of observation hours for Medicare beneficiaries rose by nearly 70%.[1] In 2012, the number of observation stays for Medicare beneficiaries reached 1.5 million.[2] One consequence of this trend is a potential change in patient financial liabilitythe amount patients are expected to pay out of pocket for care. Although observation care is usually delivered in a hospital, Medicare classifies it as an outpatient service, covered through Part B rather than inpatient Part A. In two‐thirds of US hospitals, observation care is largely an administrative classification, delivered in the same units and beds as admitted patients rather than in a protocol‐driven observation care unit.[3] Therefore, patients are often unaware of their outpatient observation status and its financial implications until they receive their hospital bill.
Observation has the potential to impact patient financial liability through 4 mechanisms.[4] First, instead of a fixed cost for an inpatient admission (eg, a fixed deductible for a hospital admission), patients pay a percentage of the cost of each service provided. Therefore, patients who have long observation stays or receive expensive services could have higher than expected liability. A recent study using all‐payer data demonstrated that patients with longer observation stays (greater than 24 hours) paid 21% more than for those with shorter stays.[5]
A second consideration is that Medicare does not cover the same hospital services for observation care as it does for inpatient care. For example, self‐administered medications are generally not covered for beneficiaries receiving observation care. However, the Office of the Inspector General (OIG)[2] recently found that the average patient cost per observation stay in 2012even including the cost of self‐administered medicationswas $528. This was significantly lower than the inpatient deductible ($1156 in 2012) that patients would have paid had they been admitted. Although on average patients paid less for observation care, the OIG report found that 6% of observation stays were more costly to patients than inpatient admissions.
Third, there are certain benefits that Medicare beneficiaries are not eligible for unless they are admitted to the hospital. For a beneficiary to receive skilled nursing facility (SNF) benefits, they must be admitted to the hospital for 3 or more days. This was the basis for Bagnall v Sebelius, a class action lawsuit against the Centers for Medicare & Medicaid Services (CMS) filed in 2009 by the Center for Medicare Advocacy.[6] The OIG estimated that in 2012, Medicare beneficiaries had 600,000 observation stays longer than 3 days that failed to qualify them for SNF services. Since then, CMS created the 2‐midnight rule,[7] stating that CMS will assign inpatient status to all medically necessary stays of 2 midnights or longer. This rule was intended, in part, to curb the use of observation stays greater than 48 hours and was a key factor in Judge Michael Shea's decision to dismiss Bagnall v Sebelius.[6]
Finally, Medicare beneficiaries who must revisit the hospital may have greater cumulative costs under observation care versus inpatient care. Medicare beneficiaries are partially protected from accumulating high costs over multiple inpatient admissions by a benefit design known as the benefit period. A benefit period begins the day a beneficiary is admitted to a hospital or SNF, and ends when he or she has not received any inpatient hospital or SNF care for 60 days in a row. Beneficiaries pay the inpatient deductible only once per benefit period, even if they have multiple readmissions during this time. So, for example, if a beneficiary was readmitted to the hospital 59 days after discharge, he or she would not have to pay the inpatient deductible again. In addition, the benefit period would be extended for an additional 60 days. In contrast, beneficiaries who receive observation care are subject to coinsurance at every subsequent visit; therefore, these beneficiaries could accrue high cumulative costs over multiple observation stays.
To our knowledge, there have been no published studies focusing on the potentially vulnerable population of Medicare beneficiaries who frequently use observation care. Our objectives were to determine the financial liability for patients who have multiple observation stays within a 60‐day period, and then compare this to the inpatient deductible they would have paid as inpatients.
METHODS
Data Sources
We used a 20% sample of the Medicare Outpatient Standard Analytic File (SAF) to identify hospital observation stays among beneficiaries over the 3‐year period 2010 to 2012. The Outpatient SAF contains all institutional outpatient claims filed on the UB‐04 form. We also used publicly available data (American Association of Medical Colleges Council of Teaching Hospitals status,[8] US Department of Agriculture rural/urban continuum codes,[9] CMS Hospital Cost Reports,[10] and census bureau region) to link hospital Medicare provider number to hospital characteristics.
Measures
Our primary measure was beneficiary financial responsibility for facilities fees. For observation care patients, this amount is the sum of the Part B coinsurance liability amount, the Part B deductible amount, and the blood deductible liability amount.[11]
Observation care claims also include information on claim date, hospital Medicare provider number, principal diagnosis (International Classification of Diseases, Ninth Revision codes), services provided, and total hours for which observation services were provided (service units). Finally, claims include unique individual identifiers, which allowed us to construct our study population and obtain beneficiary characteristics including beneficiary age, race, gender, dual eligibility for Medicare/Medicaid, and severity of illness as measured by the CMS Hierarchical Condition Category (CMS‐HCC).[12] We obtained publicly available data on hospital characteristics, including academic hospital status,[8] urban versus rural,[9] nonprofit versus for profit,[10] and census bureau region, and linked these to the hospital Medicare provider number.
Study Sample and Statistical Analysis
We first created a denominator file that included all fee‐for‐service Medicare beneficiaries who had Part A and Part B coverage for a full calendar year (or until death) during the study period 2010 to 2012. We included dually eligible individuals, provided they had fee‐for‐service Medicare rather than a Medicare Advantage Plan.
We then constructed our study sample of unique beneficiaries who had an observation stay (lasting 8 hours, which is the criteria for Medicare payment) during the study period. We identified observation stays using revenue center codes and the Healthcare Common Procedure Coding System classification, and according to coding instructions found in the Medicare Claims Processing Manual.[13] Beneficiaries were excluded if their stay was converted from observation to inpatient status, because these claims may not be reliably tracked. After creating this study sample, we calculated the mean financial liability for the first observation stay for each beneficiary.
Next, within our study sample, we divided beneficiaries receiving observation care into 2 groups: those with multiple visits (defined as 2 observation stays in any 60‐day interval over the study period) and those without multiple visits. For each beneficiary with multiple visits, we calculated the mean cumulative financial liability for all stays within the 60‐day interval. We then compared this mean cumulative financial liability to the 2010 inpatient deductible of $1100.
We compared baseline characteristics of Medicare beneficiaries not receiving observation care, those with multiple observation visits, and those without multiple visits. We did this by using 2 tests for categorical variables, 2‐tailed unpaired t tests for 2‐way comparisons of means, and analysis of variance for 3‐way comparisons of means. We compared our primary outcome, mean beneficiary financial liability with the inpatient deductible of $1100 using a 1‐sample z test. As an exploratory analysis, we compared characteristics of beneficiaries with multiple observation visits with high cumulative liability (>$1100) versus low liability using bivariate analyses. We then created a multivariable logistic regression model for high liability. All analyses were performed using SAS version 9.1 (SAS Institute, Inc., Cary, NC). This study was reviewed by the institutional review board of the University of Pennsylvania.
RESULTS
Of the 7,470,676 unique Medicare beneficiaries in the 20% denominator file, 691,760 (9.3%) had at least 1 observation visit during the 3‐year study period (Table 1). The proportion of beneficiaries using observation care rose in each year of the study; 4.1% of beneficiaries used observation care in 2010, 4.4% in 2011, and 5.0% in 2012.
| Medicare FFS Beneficiaries Not Receiving Observation Care | Observation Care (n = 691,760) | P Value | ||
|---|---|---|---|---|
| No Multiple Observation Stays in 60 Days | Multiple (2) Observation Stays in 60 Days | |||
| ||||
| No. | 6,778,916 | 650,375 | 41,385 | N/A |
| Age, y, mean (SD) | 70.5 (12.9) | 72.2 (13.1) | 70.3 (14.9) | <0.01 |
| Gender, no. (%) | <0.01 | |||
| Male | 3,720,428 (54.9) | 387,333 (59.6) | 24,462 (59.1) | |
| Female | 3,058,488 (45.1) | 263,042 (40.4) | 16,923 (40.9) | |
| Race, no. (%) | <0.01 | |||
| White | 5,673,580 (83.7) | 545,165 (83.8) | 33,586 (81.2) | |
| Black | 674,420 (10.0) | 74,367 (11.4) | 5,913 (14.3) | |
| Other | 430,916 (6.4) | 30,843 (4.7) | 1,886 (4.6) | |
| Average no. of chronic conditions, mean (SD) | 1.7 (1.7) | 2.8 (2.0) | 3.6 (2.1) | <0.01 |
| Length of stay, h, mean (SD) | N/A | 29.9 (53.7) | 32.1 (16.9) | <0.01 |
| Most common hospital diagnoses, no. (%)* | N/A | |||
| Other chest pain (786.59) | N/A | 82,550 (12.7) | 9,995 (11.5) | |
| Chest pain, unspecified (786.50) | N/A | 56,416 (8.7) | 7,578 (8.7) | |
| Syncope and collapse (780.2) | N/A | 34,183 (5.3) | 3,291 (3.8) | |
| Coronary atherosclerosis (414.01) | N/A | 16,348 (2.5) | 2,763 (3.1) | |
Of the beneficiaries receiving observation care over the entire study period, 41,385 (6.0%) had multiple visits (2 observation visits in any 60‐day interval). The number of beneficiaries with multiple visits grew by 21.9% from 2010 to 2012. There were racial differences in the use of observation care; patients with multiple visits were more likely to be black than those without multiple visits or those not receiving observation care (14.3% vs 11.4% vs 10.0, P < 0.01). Multiple observation visits were also associated with a higher number of chronic conditions (3.6 vs 2.8 vs 1.7, P < 0.01) (Table 1).
The mean financial liability for the first observation stay for each beneficiary in our study sample was $469.42 (442.43) (Table 2). This is significantly lower than the standard inpatient deductible of $1100 (p<0.01). For 9.2% of beneficiaries, the financial liability was greater than the inpatient deductible.
| Mean (SD) | 25th Percentile | 50th Percentile | 75th Percentile | 90th Percentile | 99th Percentile | |
|---|---|---|---|---|---|---|
| ||||||
| First observation stay, n = 691,760 | $469.43 (442.43) | $216.20 | $333.77 | $529.87 | $1,045.85 | $2,088.66 |
| Cumulative 60 days for beneficiaries with multiple visits, n = 41,385 | $947.40 (803.62) | $471.01 | $681.40 | $1,152.66 | $1,904.54 | $3,902.50 |
The cumulative mean financial liability for beneficiaries with 2 stays in a 60‐day interval was $947.40 (803.62) (Table 2). This is significantly lower than the standard inpatient deductible of $1100 (P < 0.01). However, for 26.6% of beneficiaries, cumulative financial liability was greater than the $1100 inpatient deductible, which is what they would have paid had these hospital visits been inpatient admissions (Figure 1).
There were several factors associated with having this excess cumulative liability (Table 3). Higher frequency of observation visits within a 60‐day period was associated with high liability (odds ratio [OR]: 2.0, 95% confidence interval [CI]: 1.9‐2.1). In addition, having an index hospitalization in the Northeast region of the country was associated with lower odds of being in the high‐liability group (OR: 0.51, 95% CI: 0.47‐0.55). High liability was weakly associated with lower CMS‐HCC risk scores, nondual eligibility, nonblack race, and index hospital stay at an academic, urban, or nonprofit hospital.
| Unadjusted | Adjusted | |||
|---|---|---|---|---|
| Low, n = 30,416 | High, n = 10,969 | P Value | OR (95% CI) | |
| ||||
| No. of observation visits in a 60‐day period, mean (SD) | 2.08 (0.30) | 2.18 (0.52) | <0.001 | 2.0 (1.92.1) |
| HCC risk score, mean (SD) | 2.40 (2.50) | 2.10 (2.50) | <0.001 | 0.97 (0.960.98) |
| Most common hospital diagnoses, no. (%) | Chest pain (other or unspecified); 13,381 (21.1%) | Chest pain (other or unspecified); 4,165 (17.4%) | N/A | |
| Syncope and collapse; 2,602 (4.1%) | Coronary atherosclerosis; 2,228 (9.3%) | N/A | ||
| Dehydration; 1,264 (2.0%) | Syncope and collapse; 686 (2.9%) | N/A | ||
| Altered mental status; 1,140 (1.8%) | Atrial fibrillation; 390 (1.6%) | N/A | ||
| Obstructive bronchitis with exacerbation; 1,032 (1.6%) | CHF; 350 (1.5%) | N/A | ||
| Dual eligibility, no. (%) | 10,895 (35.8%) | 3,162 (28.8%) | <0.001 | 0.76 (0.730.80) |
| Race, no. (%) | <0.001 | |||
| White | 24,283 (79.8%) | 9,303 (84.8%) | 1 | |
| Black | 4,704 (15.5%) | 1,209 (11.0%) | 0.79 (0.730.85) | |
| Other | 1,429 (4.7%) | 457 (4.2%) | 0.95 (0.851.1) | |
| Hospital census bureau region, no. (%) | <0.001 | |||
| South | 14,076 (46.3%) | 5,059 (46.1%) | 1 | |
| Midwest | 8,431 (27.7%) | 3,365 (30.7%) | 1.08 (1.021.14) | |
| West | 3,426 (11.3%) | 1,709 (15.6%) | 1.34 (1.251.44) | |
| Northeast | 4,483 (14.7%) | 832 (7.6%) | 0.51 (0.470.55) | |
| Academic hospital | 5,038 (16.9%) | 1,362 (12.9%) | <0.001 | 0.90 (0.840.96) |
| Urban hospital | 13,260 (44.4%) | 3,926 (37.1%) | <0.001 | 0.79 (0.760.83) |
| Nonprofit hospital | 20,665 (69.2%) | 7,143 (67.4%) | 0.001 | 0.89 (0.830.94) |
DISCUSSION
Our findings suggest that for 91% of Medicare beneficiaries, a single observation stay was less costly than an inpatient admission. However, when beneficiaries had to return to observation care within 60 days of a prior stay, on average, their cumulative costs went up to $947. For more than a quarter of beneficiaries with multiple observation visits, the cumulative costs of these observation visits exceeded the inpatient deductible.
The results of this study are consistent with prior studies of observation care. We found that in 2010, 4.1% of Medicare beneficiaries used observation care, consistent with the estimated 4.0% in 2009 reported by the AARP Public Policy Institute.[14] Also, consistent with the growth rate from the AARP report, we found growth in use of observation care from 4.1% in 2010 to 5.0% in 2012. We found that the mean length of stay for observation care was 30 hours, consistent with recent studies estimating mean length of stay in 2009 as 25.9 hours.[15] We found that beneficiaries paid an average of $468.50 per observation care stay, very close to the $401 estimated by the 2013 OIG report (when self‐administered drugs were excluded).[2] The difference may be explained by the fact that OIG included observation stays of <8 hours in their sample; we excluded these stays because they did not meet criteria for Medicare payment. Like the OIG report, we also found that the vast majority (91%) of beneficiaries pay less for any given observation stay than for an inpatient stay.
However, our findings raise the concern that for a significant proportion of beneficiaries who are likely to return to the hospital, cumulative costs of multiple observation stays may be greater than the inpatient deductible. Therefore, although observation care is, on average, less expensive for beneficiaries than inpatient admission, beneficiaries lack the protection from escalating financial liability over multiple visits.
This finding is worrisome for 3 reasons. First, compared with the general beneficiary population, Medicare beneficiaries who return to the hospital frequently are also typically of lower socioeconomic status[16, 17, 18] and may be disproportionately affected by any increased financial liability. Interestingly, our analysis showed that patients with high financial liability incurred from multiple observation stays actually had a lower comorbidity burden than patients in the multiple observation stay group with lower liability, and were less likely to be black or dual eligible. This finding perhaps reflects the fact that very high‐risk patients who returned to the hospital were readmitted rather than being placed under observation status again, potentially depleting the high‐liability group of patients with these high‐risk characteristics. Second, patients have little control over their classification as observation versus inpatients. In many hospitals, observation is simply an administrative classification for care thatfrom the patients' perspectiveis identical to inpatient care.[4] It is problematic to expose patients to varying financial liability based on differences in administrative classification. Finally, we found that the number of patients with multiple observation visits within a 60‐day period rose by 22% between 2010 and 2012. This means that the problem of excess cumulative financial liability is likely to be increasingly common over the coming years. The increased incidence of multiple observation visits may be simply related to overall increases in use of observation care. Alternatively, some authors worry that this trend may be driven by hospital use of observation care for patients who are likely to be readmitted.[14, 19] A recent analysis by Gerhardt et al.[20] did not find evidence of direct substitution of observation care in the 30‐day window after an index admission. This suggests that physicians are not explicitly shifting patients to observation care in order to avert a readmission and the readmissions penalty.[21] However, it does not exclude the possibility of general shifts toward observation care for patients likely to return.
Experts have suggested capping the total out‐of‐pocket expense for observation care at the inpatient‐deductible amount.[4] This deductible cap would prevent the relatively rare case in which a single observation stay costs more than an inpatient admission. Our findings suggest that a benefit period (as in Part A) during which such a deductible would serve as a cap would also protect a small but significantly impacted population from higher than expected cumulative costs for multiple observation care visits.
This study has several limitations. First, we are only able to measure beneficiary financial responsibility and not the amount actually paid. This can differ from financial responsibility when patients do not pay their bill, when patients accrue additional charges (such as self‐administered medications) that are not reflected on outpatient claims, or when patients have additional third‐party payers who cover part or all of the financial responsibility (as with dually eligible patients). For such beneficiaries with supplemental coverage, out‐of‐pocket cost in both scenarios (inpatient or observation care) may be low or zero. However, the use of financial responsibility as an approximation of actual payment amounts is recommended by the Research Data Assistance Center and is consistent with other studies of cost in observation care.[2] Second, our data source only allowed us to assess facilities fees and not professional expenses. Our comparator of the inpatient deductible also only reflects facilities fees, making this a valid comparison. Third, we selected 60 days as the time interval for defining multiple visits. This interval is intended to approximate a Medicare benefit period, which is the time interval following a discharge from a hospital or an SNF until the time when the deductible resets. However, Medicare actually extends the benefit period another 60 days if a patient is readmitted during that 60‐day period. Thus, 60 days is actually the shortest possible benefit period. By conservatively defining the interval for recurrent observation stays in this way, we are likely underestimating the number and cost of observation stays in a true benefit period, and biasing our results toward the null.
In conclusion, our findings suggest that a significant proportion of Medicare beneficiaries who revisit observation care pay more than they would have had they been readmitted. As CMS policies on observation care continue to evolve, it may be helpful to consider measures to cap total out‐of‐pocket expenses within a benefit period to protect beneficiaries from higher than expected costs.
Disclosure
Disclosure: Nothing to report.
- June 2012 Data Book: Health Care Spending and the Medicare Program. Washington, DC: Medicare Payment Advisory Commission; 2012.
- . Hospitals' use of observation stays and short inpatient stays for Medicare beneficiaries, OEI‐02‐12‐00040. Washington, DC: Department of Health and Human Services, Office of the Inspector General; 2013.
- , , . National study of emergency department observation services. Acad Emerg Med. 2011;18(9):959–965.
- , . Observation care—high‐value care or a cost‐shifting loophole? N Engl J Med. 2013;369(4):302–305.
- , , , , . Factors associated with prolonged observation services stays and the impact of long stays on patient cost. Health Serv Res. 2014;49(3):893–909.
- Bagnall v Sebelius. No. 3:11cv1703 (MPS). September 23, 2013.
- Centers for Medicare 2 Midnight Benchmark for Inpatient Hospital Admissions. CMS‐1599‐F2013.2013. Available at: http://www.cms.gov/Outreach‐and‐Education/Outreach/OpenDoorForums/Downloads/02042014SODF.pdf. Accessed June 16, 2015
- Council of Teaching Hospitals and Health Systems (COTH). Association of American Medical Colleges website. Available at: https://www.aamc.org/members/coth/. Accessed May 5, 2006.
- United States Department of Agriculture Economic Research Service. Rural‐urban continuity codes. Available at: http://www.ers.usda.gov/data‐products/rural‐urban‐continuum‐codes.aspx. Accessed June 16, 2015.
- Centers for Medicare
© 2015 Society of Hospital Medicine

Redesigning Inpatient Care
Despite an estimated annual $2.6 trillion expenditure on healthcare, the United States performs poorly on indicators of health and harm during care.[1, 2, 3] Hospitals around the nation are working to improve the care they deliver. We describe a model developed at our institution and report the evaluation of the outcomes associated with its implementation on the general medical and surgical units. The Indiana University Institutional Review Board approved this work.
SETTING AND DEFINITIONS
Indiana University Health Methodist Hospital (MH) is an academic center in Indianapolis, Indiana, serving over 30,000 patients annually.[4] In 2012, responding to the coexisting needs to improve quality and contain costs, the MH leadership team redesigned care in the hospital. The new model centers around accountable care teams (ACTs). Each ACT is a geographically defined set of providers accepting ownership for the clinical, service, and financial outcomes of their respective inpatient unit. The units studied are described in Table 1.
| Unit | No. of Beds | Predominant Diagnosis (Maximum Domain Score)* | |
|---|---|---|---|
| |||
| Medical units with progressive‐care beds | 1 | 33 | Pulmonary (3.4, 3.5, 5) |
| 2 | 28 | Cardiology (4.8, 3.5, 4) | |
| 3 | 24 | General medical (4.8, 3.5, 4) | |
| Medical units without progressive‐care beds | 4 | 36 | Renal/diabetic (4, 3.5, 5) |
| 5 | 24 | General medical (3.75, 4, 5) | |
| Surgical units with progressive‐care beds | 6 | 51 | Cardiothoracic surgery/cardiology (4, 4, 5) |
| 7 | 29 | Trauma/general surgery (3.75, 3.5, 5) | |
| 8 | 23 | Neurosurgical/neurological (4.8, 5, 5) | |
| 9 | 24 | Neurosurgical/neurological (4.4, 4.5, 5) | |
| Surgical units without progressive‐care beds | 10 | 29 | General/urologic/gynecologic/plastic surgery (3.4, 3, 2) |
| 11 | 26 | Orthopedic surgery (4.6, 4, 5) | |
THE ACT MODEL
The model comprises 8 interventions rooted in 3 foundational domains: (1) enhancing interprofessional collaboration (IPC), (2) enabling data‐driven decisions, and (3) providing leadership. Each intervention is briefly described under its main focus (see Supporting Information, Appendix A, in the online version of this article for further details).
Enhancing IPC
Geographical Cohorting of Patients and Providers
Hospitalist providers are localized for 4 consecutive months to 1 unit. An interdisciplinary team including a case manager, clinical nurse specialist, pharmacist, nutritionist, and social worker also serve each unit. Learners (residents, pharmacy, and medical students) are embedded in the team when rotating on the hospital medicine service. The presence of unit‐based nurse managers and charge nurses predates the model and is retained.
Bedside Collaborative Rounding
Geographically cohorted providers round on their patients with the bedside nurse guided by a customizable script.
Daily Huddle
The hospitalist, learners, and the interdisciplinary team for the unit meet each weekday to discuss patients' needs for a safe transition out of the hospital. Each unit determined the timing, location, and script for the huddle while retaining the focus on discharge planning (see Supporting Information, Appendix A2, in the online version of this article for a sample script).
Hospitalist and Specialty Comanagement Agreements
Guidelines delineating responsibilities for providers of each specialty were developed. Examples include orders pertaining to the management of a dialysis catheter in a patient with end‐stage renal disease, the removal of drains in postsurgical patients, and wound care.
Unit White Board
Each unit has a white board at the nursing station. Similar to the huddle, it is focused on discharge planning.
Enabling Data‐Driven Decisions
Monthly Review of Unit‐Level Data
Data analytics at our institution developed a data dashboard. Key metrics including length of stay (LOS), patient satisfaction scores, readmission rates, and costs are tracked and attributed to the discharging unit. The data are collated monthly by the ACT program director and distributed to each unit's leadership. Monthly interdisciplinary meetings are held to review trends. Learners are encouraged but not required to attend.
Weekly Patient Satisfaction Rounding
The unit's nurse manager and physician leader conduct weekly satisfaction rounds on patients. The conversation is open‐ended and focused on eliciting positive and negative experiences.
Providing Leadership
Designated hospitalist and, where relevant, specialty leaders are committed to serve each unit for at least 1 year as a resource for both medical and operational problem solving. The leader stays closely connected with the unit's nurse manager. In addition to day‐to‐day troubleshooting, the leader is responsible for monitoring outcome trends. There is currently no stipend, training, or other incentive offered for the role.
Implementation Timelines and ACT Scores
The development of the ACTs started in the spring of 2012. Physician, nursing, and pharmacy support was sought, and a pilot unit was formed in August 2012. The model was cascaded hospital wide by December 2013, with support from the ACT program director (A.N.). The program director observed and scored the uptake of each intervention by each unit monthly. A score of 1 denoted no implementation, whereas 5 denoted complete implementation. The criteria for scoring are presented in Table 2. The monthly scores for all 8 interventions in each of the 11 units were averaged as an overall ACT score, which reflects the implementation dose of the ACT model. Monthly domain scores for enhancing IPC and enabling data‐driven decisions were also calculated as the average score within each domain. This yielded 3 domain scores. Figure 1A plots by month the overall ACT score for the medical and surgical units, and Figure 1B plots the implementation score for the 3 domains between August 2012 and December 2013 for all units. The uptake of the interventions varied between units. This allowed our analysis to explore the dose relationships between the model and outcomes independent of underlying time trends that may be affected by concomitant initiatives.
| 1 | 2 | 3 | 4 | 5 | |
|---|---|---|---|---|---|
| |||||
| Geographical cohorting of patients and the ACT* | None | At least 1 discipline comprising the ACT is unit based | All disciplines comprising the ACT except the hospitalist unit based | All disciplines including the hospitalist unit based | 4 + 80% of hospitalist provider's patients on the unit |
| Bedside collaborative rounding | None | Occurring 1 day a week on at least 25% of the patients on the unit | Occurring 2 to 3 days a week on at least 50% of the patients on the unit | Occurring 3 to 4 days a week on at least 75% of the patients on the unit | Occurring MondayFriday on all patients on the unit |
| Daily huddle | None | Occurring daily, 1 out of 4 ACT disciplines represented, at least 25% of patients on the unit discussed | Occurring daily, 2 out of 4 ACT disciplines represented, at least 50% of patients on the unit discussed | Occurring daily, 3 out of 4 ACT disciplines represented, at least 75% of patients on the unit discussed | Occurring daily, all disciplines of the ACT represented, all patients on the unit discussed |
| Hospitalist and specialty comanagement agreements | None | One out of 3 specialists represented on the unit collaborating with the hospitalists on at least 25% of relevant patients | One out of 3 specialists represented on the unit collaborating with the hospitalists on at least 50% of relevant patients | Two out of 3 specialists on the unit collaborating with the hospitalists on at least 75% of relevant patients | All specialists on the unit collaborating with the hospitalists on all relevant patients on the unit |
| Unit white board | None | Present but only used by nursing | Present and used by all ACT disciplines except physician providers | Present and used by entire ACT; use inconsistent | Present and used MondayFriday by all disciplines of ACT |
| Monthly review of unit level data | None | Nurse manager reviewing data with ACT program director | Nurse manager and unit leader reviewing data with ACT program director | Meeting either not consistently occurring monthly or not consistently attended by entire ACT | Monthly meeting with entire ACT |
| Weekly patient satisfaction rounding | None | Nurse manager performing up to 1 week a month | Nurse manager performing weekly | Nurse and physician leader performing up to 3 times a month | Nurse and physician leader performing weekly |
| Leadership | None | For units with specialties, either hospitalist or specialist leader identified | Both hospitalist and specialist leader Identified | Both hospitalist and specialist leaders (where applicable) identified and partially engaged in leadership role | Both hospitalist and specialist leaders (where applicable) identified and engaged in leadership role |
Outcomes
Monthly data between August 2012 and December 2013 were analyzed.
Measures of Value
MH is a member of the University Health Consortium, which measures outcomes of participants relative to their peers. MH measures LOS index as a ratio of observed LOS to expected LOS that is adjusted for severity of illness.[5]
Variable direct costs (VDCs) are costs that a hospital can save if a service is not provided.[6] A hospital's case‐mix index (CMI) represents the average diagnosis‐related group relative weight for that hospital. We track VDCs adjusted for CMI (CMI‐adjusted VDC).[7]
Thirty‐day readmission rate is the percentage of cases that are readmitted to MH within 30 days of discharge from the index admission.[8]
Measures of Patient Satisfaction
The Hospital Consumer Assessment of Healthcare Providers and Systems (HCAHPS) survey covers topics relevant to a patient's experience in the hospital.[9] Patient satisfaction scores are tracked by responses to the HCAHPS survey.
Measures of Provider Satisfaction
Hospitalist and specialty providers, leadership, and case management teams were surveyed via email through SurveyMonkey in July 2014. The survey included Likert responses that elicited opinions and comments about the ACT model.
Statistical Methods
The primary predictor of interest was the monthly overall ACT score. We also explored the domain scores as well as the individual scores for each intervention. Generalized linear mixed models were fit to investigate the association between each predictor (overall ACT score, ACT domain scores, and individual implementation scores) and each outcome (LOS index, CMI‐adjusted VDC, 30‐day readmission rate, and overall patient satisfaction). The model for testing each ACT score also included covariates of inpatient units as a random effect, as well as date and type of unit as fixed effects. We set the statistical significance level at 0.01 and reported 99% confidence intervals.
Descriptive statistics were used to report the provider satisfaction survey results.
RESULTS
The overall ACT score was associated with LOS index and CMI‐adjusted VDC (both P < 0.001). For every 1‐unit increase in the overall ACT score, LOS index decreased by 0.078 and CMI‐adjusted VDC decreased by $273.99 (Table 3).
| Length of Stay Index | CMI Adjusted VDC | |||
|---|---|---|---|---|
| Estimate (99% CI)* | P Value | Estimate (99% CI)* | P Value | |
| ||||
| Overall ACT Score | 0.078 (0.123 to 0.032) | <0.001 | 274.0 (477.31 to 70.68) | <0.001 |
| Enhancing IPC | 0.071 (0.117 to 0.026) | <0.001 | 284.7 (488.08 to 81.23) | <0.001 |
| Enabling data‐driven decisions | 0.044 (0.080 to 0.009) | 0.002 | 145.4 (304.57 to 13.81) | 0.02 |
| Providing leadership | 0.027 (0.049 to 0.005) | 0.001 | 69.9 (169.00 to 29.26) | 0.07 |
Looking at domains, enhancing IPC resulted in statistically significant decreases in both LOS index and CMI‐adjusted VDC, but providing leadership and enabling data‐driven decisions decreased only the LOS index. Most of the 8 individual interventions were associated with at least 1 of these 2 outcomes. (Even where the associations were not significant, they were all in the direction of decreasing LOS and cost). In these models, the covariate of type of units (medical vs surgical) was not associated with LOS or cost. There was no significant time trend in LOS or cost, except in models where an intervention had no association with either outcome. Inclusion of all individual effective interventions in the same statistical model to assess their relative contributions was not possible because they were highly correlated (correlations 0.450.89).
Thirty‐day readmissions and patient satisfaction were not significantly associated with the overall ACT score, but exploratory analyses showed that patient satisfaction increased with the implementation of geographical cohorting (P = 0.007).
Survey Results
The response rate was 87% (96/110). Between 85% and 96% of respondents either agreed or strongly agreed that the ACT model had improved the quality and safety of the care delivered, improved communication between providers and patients, and improved their own engagement and job satisfaction. Overall, 78% of the respondents either agreed or strongly agreed that the model improved efficiency (Table 4). Suggestions for improvements revolved around increasing the emphasis on patient centeredness and bedside nursing engagement.
| The ACT Model | Strongly Agree, n (%) | Agree, n (%) | Disagree, n (%) | Strongly Disagree, n (%) |
|---|---|---|---|---|
| ||||
| Has improved the quality and safety of patient care | 46 (47.9) | 46 (47.9) | 2 (2.1) | 2 (2.1) |
| Has improved communication with patients and families | 42 (43.7) | 47 (49.0) | 5 (5.2) | 2 (2.1) |
| Has improved your efficiency/productivity | 31 (32.6) | 43 (45.3) | 17 (17.9) | 4 (4.2) |
| Has improved your engagement and job satisfaction | 33 (34.4) | 49 (51.0) | 10 (10.4) | 4 (4.2) |
| Is a better model of delivering patient care | 45 (47.4) | 44 (46.3) | 2 (2.1) | 4 (4.2) |
DISCUSSION
The serious problems in US healthcare constitute an urgent imperative to innovate and reform.[10] Inpatient care reflects 31% of the expenditure on healthcare, and in 2010, 35.1 million patients were discharged from the hospital after spending an average of 4.8 days as an inpatient.[11] These figures represent an immense opportunity to intervene. Measuring the impact of quality improvement efforts is often complicated by concomitant changes that affect outcomes over the interval studied. Our approach allowed us to detect statistically significant changes in LOS index and CMI‐adjusted VDC associated with the ACT implementation dose that could be separated from the underlying time trends.
The ACT model we describe is rooted in improving 3 foundational domains; quantifying each intervention's compartmentalized contribution, however, proved difficult. Each intervention intertwines with the others to create changes in attitudes, knowledge, and culture that are difficult to measure yet may synergistically affect outcomes. For example, although geographical cohorting appears to have the strongest statistical association with outcomes, this may be mediated by how it enables other processes to take place more effectively. Based on this analysis, therefore, the ACT model may best be considered a bundled intervention.
The team caring for a patient during hospitalization is so complex that fewer than a quarter of patients know their physician's or nurse's name.[12] This complexity impairs communication between patients and providers and between the providers themselves. Communication failures are consistently identified as root causes in sentinel events reported to the Joint Commission.[13] IPC is the process by which different professional groups work together to positively impact health care. IPC overlaps with communication, coordination, and teamwork, and improvements in IPC may improve care.[14] Some elements of the model we describe have been tested previously.[15, 16, 17] Localization of teams may increase productivity and the frequency with which physicians and nurses communicate. Localization also decreases the number of pages received and steps walked by providers during a workday.[15, 16, 17] However, these studies reported a trend toward an increase in the LOS and neutral effects on cost and readmission rates. We found statistically significant decreases in both LOS and cost associated with the geographic cohorting of patients and providers. Notably, our model localized not only the physician providers but also the interdisciplinary team of pharmacists, clinical nurse specialists, case managers, and social workers. This proximity may facilitate IPC between all members that culminates in improved efficiency. The possibility of delays in discharges to avoid new admissions in a geographically structured team has previously been raised to explain the associated increases in LOS.[16, 17] The accountability of each unit for its metrics, the communication between nursing and physicians, and the timely availability of the unit's performance data aligns everyone toward a shared goal and provides some protection from an unintended consequence.
Structured interdisciplinary rounds decrease adverse events and improve teamwork ratings.[18, 19] The huddle in our model is a forum to collaborate between disciplines that proved to be effective in decreasing LOS and costs. Our huddle aims to discuss all the patients on the unit. This allows the team to assist each other in problem solving for the entire unit and not just the patients on the geographically cohorted team. This approach, in addition to the improved IPC fostered by the ACT model, may help explain how benefits in LOS and costs permeated across all 11 diverse units despite the presence of patients who are not directly served by the geographically cohorted team.
High‐performing clinical systems maintain an awareness of their overarching mission and unit‐based leaders can influence the frontline by reiterating the organizational mission and aligning efforts with outcomes.[20] Our leadership model is similar to those described by other institutions in the strong partnerships between physicians and nursing.[21] As outlined by Kim et al., investing in the professional development of the unit leaders may help them fulfill their roles and serve the organization better.[21]
The fragmentation and lack of ownership over the continuum of patient care causes duplication and waste. The proposal in the Accountable Care Act to create accountable care organizations is rooted in the understanding that providers and organizations will seek out new ways of improving quality when held accountable for their outcomes.[22] To foster ownership and accountability, reporting of metrics at the unit level is needed. Furthermore, an informational infrastructure is critical, as improvements cannot occur without the availability of data to both monitor performance and measure the effect of interventions.[10, 23] Even without any other interventions, providing feedback alone is an effective way of changing practices.[24] According to Berwick et al., this phenomenon reflects practitioners' intrinsic motivation to simply want to be better.[25] Our monthly review of each unit's data is an effective way to provide timely feedback to the frontline that sparks pride, ownership, and innovative thinking.
Based on our mean ACT score and CMI‐adjusted VDC reductions alone, we estimate savings of $649.36 per hospitalization (mean increase in ACT implementation of 2.37 times reduction in cost index of $273.99 per unit increase in overall ACT score). This figure does not include savings realized through reductions in LOS. This is a small decrease relative to the mean cost of hospitalization, yet when compounded over the annual MH census, it would result in substantial savings. The model relied on the restructuring of the existing workforce and the only direct additional cost was the early salary support for the ACT program director.
Limitations
We recognize several limitations. It is a single center's experience and may not be generalizable. The diffusion of knowledge and culture carried between units and the relatively rapid implementation timeline did not allow for a control unit. A single observer assigned our implementation scores, and therefore we cannot report measures of inter‐rater reliability. However, defined criteria and direct observations were used wherever possible. Although administratively available data have their limitations, where available, we used measurements that are adjusted for severity of illness and CMI. We therefore feel that this dataset is an accurate representation of currently reported national quality indicators.
FURTHER DIRECTIONS
Although there is a need to improve our healthcare system, interventions should be deliberate and evidence based wherever possible.[26] Geographic cohorting may decrease the frequency of paging interruptions for physicians and practitioners while increasing face‐to‐face interruptions.[27] The net effect on safety with this trade‐off should be investigated.
The presence of an intervention does not guarantee its success. Despite geographic cohorting and interdisciplinary meetings, communication that influences physician decision making may not improve.[28] Although instruments to measure ratings of team work and collaboration are available, focusing on clinically relevant outcomes of teamwork, such as prevention of harm, may be more empowering feedback for the frontline. Formal cost‐benefit analyses and outcomes related to physician and nursing retention will be equally important for assessing the sustainability of the model. Involving patients and their caregivers and inviting their perspectives as care is redesigned will also be critical in maintaining patient centeredness. Research addressing interventions to mediate preventable readmission risk and understanding the drivers of patient satisfaction is also needed.
The true value of the model may be in its potential to monitor and drive change within itself. Continuously aligning aims, incentives, performance measures, and feedback will help support this innovation and drive. This affects not only patient care but creates microcosms within which research and education can thrive. We hope that our experience will help guide other institutions as we all strive in our journey to improve the care we deliver.
Acknowledgements
The authors thank the Indiana University Health Physicians hospitalists at MH, Sandy Janitz and Decision Support, the Indiana University Health executive leadership team, Robert Clark, Malaz Boustani, Dennis Watson, Nadia Adams, Todd Biggerstaff, Deanne Kashiwagi, and the tireless providers at MH for their support.
Disclosure: This work was supported by a grant from the Indiana University Health Values Fund. The authors have no conflicts of interest to disclose.
- Committee on Quality of Health Care in America; Institute of Medicine. Crossing the Quality Chasm: A New Health System for the 21st Century. Washington, DC: The National Academies Press; 2001.
- . Is US health really the best in the world? JAMA. 2000;284(4):483–485.
- , , , , , . Temporal trends in rates of patient harm resulting from medical care. N Engl J Med. 2010;363(22):2124–2134.
- Indiana University Health. Available at: http://iuhealth.org/methodist/aboIut/. Accessed October 20, 2014.
- University Health Consortium. Available at: https://www.uhc.edu/docs/45014769_QSS_dashboard_FAQs.pdf. Accessed October 23, 2014.
- , , , et al. Distribution of variable vs fixed costs of hospital care. JAMA. 1999;281(7):644–649.
- Centers for Medicare and Medicaid Services. Case mix index. Available at: http://www.cms.gov/Medicare/Medicare‐Fee‐for‐Service‐Payment/AcuteInpatientPPS/Acute‐Inpatient‐Files‐for‐Download‐Items/CMS022630.html. Accessed May 4, 2015.
- University Health Consortium. Available at: https://www.uhc.edu. Accessed October 23, 2014.
- Centers for Medicare and Medicaid Services. Hospital Consumer Assessment of Healthcare Providers and Systems. HCAHPS survey content and administration. Centers for Medicare 280(11):1000–1005.
- Centers for Disease Control and Prevention. FastStats. Available at: http://www.cdc.gov/nchs/fastats/default.htm. Accessed October 27, 2014.
- , . Does your patient know your name? An approach to enhancing patients' awareness of their caretaker's name. J Healthc Qual. 2005;27(4):53–56.
- The Joint Commission. Sentinel event data: root causes by event type 2004‐third quarter. Available at: http://www.jointcommissionorg. Available at: http://www.jointcommission.org/assets/1/18/Root_Causes_by_Event_Type_2004-2Q2013.pdf. Accessed March 26, 2014.
- , , . Interprofessional collaboration: effects of practice‐based interventions on professional practice and healthcare outcomes. Cochrane Database Syst Rev. 2009;(3):CD000072.
- , , , et al. Impact of localizing physicians to hospital units on nurse–physician communication and agreement on the plan of care. J Gen Intern Med. 2009;24(11):1223–1227.
- , , , et al. Impact of localizing general medical teams to a single nursing unit. J Hosp Med. 2012;7(7):551–556.
- , , , et al. Implementation of a physician assistant/hospitalist service in an academic medical center: impact on efficiency and patient outcomes. J Hosp Med. 2008;3(5):361–368.
- , , , , , . Improving teamwork: impact of structured interdisciplinary rounds on a medical teaching unit. J Gen Intern Med. 2010;25(8):826–832.
- , , , ; High Performance Teams and the Hospital of the Future Project Team. Interdisciplinary teamwork in hospitals: a review and practical recommendations for improvement. J Hosp Med. 2011;7(1):48–54.
- , , , , , . Microsystems in health care: part 8. Developing people and improving work life: what front‐line staff told us. Jt Comm J Qual Saf. 2003;29(10):512–522.
- , , , , , . Unit‐based interprofessional leadership models in six US hospitals. J Hosp Med. 2014;9(8):545–550.
- , , , . Creating accountable care organizations: the extended hospital medical staff. Health Aff (Millwood). 2007;26(1):w44–w57.
- , . Using performance measurement to drive improvement: a road map for change. Med Care. 2003;41(1 suppl):I48–I60.
- , . Changing physicians' practices. N Engl J Med. 1993;329(17):1271–1273.
- , , . Connections between quality measurement and improvement. Med Care. 2003;41(1 suppl):I30–I38.
- , , . The tension between needing to improve care and knowing how to do it. N Engl J Med. 2007;357(6):608–613.
- , . A qualitative evaluation of geographical localization of hospitalists: how unintended consequences may impact quality. J Gen Intern Med. 2014;29(7):1009–1016.
- , , , , . Disengaged: a qualitative study of communication and collaboration between physicians and other professions on general internal medicine wards. BMC Health Serv Res. 2013;13:494.
Despite an estimated annual $2.6 trillion expenditure on healthcare, the United States performs poorly on indicators of health and harm during care.[1, 2, 3] Hospitals around the nation are working to improve the care they deliver. We describe a model developed at our institution and report the evaluation of the outcomes associated with its implementation on the general medical and surgical units. The Indiana University Institutional Review Board approved this work.
SETTING AND DEFINITIONS
Indiana University Health Methodist Hospital (MH) is an academic center in Indianapolis, Indiana, serving over 30,000 patients annually.[4] In 2012, responding to the coexisting needs to improve quality and contain costs, the MH leadership team redesigned care in the hospital. The new model centers around accountable care teams (ACTs). Each ACT is a geographically defined set of providers accepting ownership for the clinical, service, and financial outcomes of their respective inpatient unit. The units studied are described in Table 1.
| Unit | No. of Beds | Predominant Diagnosis (Maximum Domain Score)* | |
|---|---|---|---|
| |||
| Medical units with progressive‐care beds | 1 | 33 | Pulmonary (3.4, 3.5, 5) |
| 2 | 28 | Cardiology (4.8, 3.5, 4) | |
| 3 | 24 | General medical (4.8, 3.5, 4) | |
| Medical units without progressive‐care beds | 4 | 36 | Renal/diabetic (4, 3.5, 5) |
| 5 | 24 | General medical (3.75, 4, 5) | |
| Surgical units with progressive‐care beds | 6 | 51 | Cardiothoracic surgery/cardiology (4, 4, 5) |
| 7 | 29 | Trauma/general surgery (3.75, 3.5, 5) | |
| 8 | 23 | Neurosurgical/neurological (4.8, 5, 5) | |
| 9 | 24 | Neurosurgical/neurological (4.4, 4.5, 5) | |
| Surgical units without progressive‐care beds | 10 | 29 | General/urologic/gynecologic/plastic surgery (3.4, 3, 2) |
| 11 | 26 | Orthopedic surgery (4.6, 4, 5) | |
THE ACT MODEL
The model comprises 8 interventions rooted in 3 foundational domains: (1) enhancing interprofessional collaboration (IPC), (2) enabling data‐driven decisions, and (3) providing leadership. Each intervention is briefly described under its main focus (see Supporting Information, Appendix A, in the online version of this article for further details).
Enhancing IPC
Geographical Cohorting of Patients and Providers
Hospitalist providers are localized for 4 consecutive months to 1 unit. An interdisciplinary team including a case manager, clinical nurse specialist, pharmacist, nutritionist, and social worker also serve each unit. Learners (residents, pharmacy, and medical students) are embedded in the team when rotating on the hospital medicine service. The presence of unit‐based nurse managers and charge nurses predates the model and is retained.
Bedside Collaborative Rounding
Geographically cohorted providers round on their patients with the bedside nurse guided by a customizable script.
Daily Huddle
The hospitalist, learners, and the interdisciplinary team for the unit meet each weekday to discuss patients' needs for a safe transition out of the hospital. Each unit determined the timing, location, and script for the huddle while retaining the focus on discharge planning (see Supporting Information, Appendix A2, in the online version of this article for a sample script).
Hospitalist and Specialty Comanagement Agreements
Guidelines delineating responsibilities for providers of each specialty were developed. Examples include orders pertaining to the management of a dialysis catheter in a patient with end‐stage renal disease, the removal of drains in postsurgical patients, and wound care.
Unit White Board
Each unit has a white board at the nursing station. Similar to the huddle, it is focused on discharge planning.
Enabling Data‐Driven Decisions
Monthly Review of Unit‐Level Data
Data analytics at our institution developed a data dashboard. Key metrics including length of stay (LOS), patient satisfaction scores, readmission rates, and costs are tracked and attributed to the discharging unit. The data are collated monthly by the ACT program director and distributed to each unit's leadership. Monthly interdisciplinary meetings are held to review trends. Learners are encouraged but not required to attend.
Weekly Patient Satisfaction Rounding
The unit's nurse manager and physician leader conduct weekly satisfaction rounds on patients. The conversation is open‐ended and focused on eliciting positive and negative experiences.
Providing Leadership
Designated hospitalist and, where relevant, specialty leaders are committed to serve each unit for at least 1 year as a resource for both medical and operational problem solving. The leader stays closely connected with the unit's nurse manager. In addition to day‐to‐day troubleshooting, the leader is responsible for monitoring outcome trends. There is currently no stipend, training, or other incentive offered for the role.
Implementation Timelines and ACT Scores
The development of the ACTs started in the spring of 2012. Physician, nursing, and pharmacy support was sought, and a pilot unit was formed in August 2012. The model was cascaded hospital wide by December 2013, with support from the ACT program director (A.N.). The program director observed and scored the uptake of each intervention by each unit monthly. A score of 1 denoted no implementation, whereas 5 denoted complete implementation. The criteria for scoring are presented in Table 2. The monthly scores for all 8 interventions in each of the 11 units were averaged as an overall ACT score, which reflects the implementation dose of the ACT model. Monthly domain scores for enhancing IPC and enabling data‐driven decisions were also calculated as the average score within each domain. This yielded 3 domain scores. Figure 1A plots by month the overall ACT score for the medical and surgical units, and Figure 1B plots the implementation score for the 3 domains between August 2012 and December 2013 for all units. The uptake of the interventions varied between units. This allowed our analysis to explore the dose relationships between the model and outcomes independent of underlying time trends that may be affected by concomitant initiatives.
| 1 | 2 | 3 | 4 | 5 | |
|---|---|---|---|---|---|
| |||||
| Geographical cohorting of patients and the ACT* | None | At least 1 discipline comprising the ACT is unit based | All disciplines comprising the ACT except the hospitalist unit based | All disciplines including the hospitalist unit based | 4 + 80% of hospitalist provider's patients on the unit |
| Bedside collaborative rounding | None | Occurring 1 day a week on at least 25% of the patients on the unit | Occurring 2 to 3 days a week on at least 50% of the patients on the unit | Occurring 3 to 4 days a week on at least 75% of the patients on the unit | Occurring MondayFriday on all patients on the unit |
| Daily huddle | None | Occurring daily, 1 out of 4 ACT disciplines represented, at least 25% of patients on the unit discussed | Occurring daily, 2 out of 4 ACT disciplines represented, at least 50% of patients on the unit discussed | Occurring daily, 3 out of 4 ACT disciplines represented, at least 75% of patients on the unit discussed | Occurring daily, all disciplines of the ACT represented, all patients on the unit discussed |
| Hospitalist and specialty comanagement agreements | None | One out of 3 specialists represented on the unit collaborating with the hospitalists on at least 25% of relevant patients | One out of 3 specialists represented on the unit collaborating with the hospitalists on at least 50% of relevant patients | Two out of 3 specialists on the unit collaborating with the hospitalists on at least 75% of relevant patients | All specialists on the unit collaborating with the hospitalists on all relevant patients on the unit |
| Unit white board | None | Present but only used by nursing | Present and used by all ACT disciplines except physician providers | Present and used by entire ACT; use inconsistent | Present and used MondayFriday by all disciplines of ACT |
| Monthly review of unit level data | None | Nurse manager reviewing data with ACT program director | Nurse manager and unit leader reviewing data with ACT program director | Meeting either not consistently occurring monthly or not consistently attended by entire ACT | Monthly meeting with entire ACT |
| Weekly patient satisfaction rounding | None | Nurse manager performing up to 1 week a month | Nurse manager performing weekly | Nurse and physician leader performing up to 3 times a month | Nurse and physician leader performing weekly |
| Leadership | None | For units with specialties, either hospitalist or specialist leader identified | Both hospitalist and specialist leader Identified | Both hospitalist and specialist leaders (where applicable) identified and partially engaged in leadership role | Both hospitalist and specialist leaders (where applicable) identified and engaged in leadership role |
Outcomes
Monthly data between August 2012 and December 2013 were analyzed.
Measures of Value
MH is a member of the University Health Consortium, which measures outcomes of participants relative to their peers. MH measures LOS index as a ratio of observed LOS to expected LOS that is adjusted for severity of illness.[5]
Variable direct costs (VDCs) are costs that a hospital can save if a service is not provided.[6] A hospital's case‐mix index (CMI) represents the average diagnosis‐related group relative weight for that hospital. We track VDCs adjusted for CMI (CMI‐adjusted VDC).[7]
Thirty‐day readmission rate is the percentage of cases that are readmitted to MH within 30 days of discharge from the index admission.[8]
Measures of Patient Satisfaction
The Hospital Consumer Assessment of Healthcare Providers and Systems (HCAHPS) survey covers topics relevant to a patient's experience in the hospital.[9] Patient satisfaction scores are tracked by responses to the HCAHPS survey.
Measures of Provider Satisfaction
Hospitalist and specialty providers, leadership, and case management teams were surveyed via email through SurveyMonkey in July 2014. The survey included Likert responses that elicited opinions and comments about the ACT model.
Statistical Methods
The primary predictor of interest was the monthly overall ACT score. We also explored the domain scores as well as the individual scores for each intervention. Generalized linear mixed models were fit to investigate the association between each predictor (overall ACT score, ACT domain scores, and individual implementation scores) and each outcome (LOS index, CMI‐adjusted VDC, 30‐day readmission rate, and overall patient satisfaction). The model for testing each ACT score also included covariates of inpatient units as a random effect, as well as date and type of unit as fixed effects. We set the statistical significance level at 0.01 and reported 99% confidence intervals.
Descriptive statistics were used to report the provider satisfaction survey results.
RESULTS
The overall ACT score was associated with LOS index and CMI‐adjusted VDC (both P < 0.001). For every 1‐unit increase in the overall ACT score, LOS index decreased by 0.078 and CMI‐adjusted VDC decreased by $273.99 (Table 3).
| Length of Stay Index | CMI Adjusted VDC | |||
|---|---|---|---|---|
| Estimate (99% CI)* | P Value | Estimate (99% CI)* | P Value | |
| ||||
| Overall ACT Score | 0.078 (0.123 to 0.032) | <0.001 | 274.0 (477.31 to 70.68) | <0.001 |
| Enhancing IPC | 0.071 (0.117 to 0.026) | <0.001 | 284.7 (488.08 to 81.23) | <0.001 |
| Enabling data‐driven decisions | 0.044 (0.080 to 0.009) | 0.002 | 145.4 (304.57 to 13.81) | 0.02 |
| Providing leadership | 0.027 (0.049 to 0.005) | 0.001 | 69.9 (169.00 to 29.26) | 0.07 |
Looking at domains, enhancing IPC resulted in statistically significant decreases in both LOS index and CMI‐adjusted VDC, but providing leadership and enabling data‐driven decisions decreased only the LOS index. Most of the 8 individual interventions were associated with at least 1 of these 2 outcomes. (Even where the associations were not significant, they were all in the direction of decreasing LOS and cost). In these models, the covariate of type of units (medical vs surgical) was not associated with LOS or cost. There was no significant time trend in LOS or cost, except in models where an intervention had no association with either outcome. Inclusion of all individual effective interventions in the same statistical model to assess their relative contributions was not possible because they were highly correlated (correlations 0.450.89).
Thirty‐day readmissions and patient satisfaction were not significantly associated with the overall ACT score, but exploratory analyses showed that patient satisfaction increased with the implementation of geographical cohorting (P = 0.007).
Survey Results
The response rate was 87% (96/110). Between 85% and 96% of respondents either agreed or strongly agreed that the ACT model had improved the quality and safety of the care delivered, improved communication between providers and patients, and improved their own engagement and job satisfaction. Overall, 78% of the respondents either agreed or strongly agreed that the model improved efficiency (Table 4). Suggestions for improvements revolved around increasing the emphasis on patient centeredness and bedside nursing engagement.
| The ACT Model | Strongly Agree, n (%) | Agree, n (%) | Disagree, n (%) | Strongly Disagree, n (%) |
|---|---|---|---|---|
| ||||
| Has improved the quality and safety of patient care | 46 (47.9) | 46 (47.9) | 2 (2.1) | 2 (2.1) |
| Has improved communication with patients and families | 42 (43.7) | 47 (49.0) | 5 (5.2) | 2 (2.1) |
| Has improved your efficiency/productivity | 31 (32.6) | 43 (45.3) | 17 (17.9) | 4 (4.2) |
| Has improved your engagement and job satisfaction | 33 (34.4) | 49 (51.0) | 10 (10.4) | 4 (4.2) |
| Is a better model of delivering patient care | 45 (47.4) | 44 (46.3) | 2 (2.1) | 4 (4.2) |
DISCUSSION
The serious problems in US healthcare constitute an urgent imperative to innovate and reform.[10] Inpatient care reflects 31% of the expenditure on healthcare, and in 2010, 35.1 million patients were discharged from the hospital after spending an average of 4.8 days as an inpatient.[11] These figures represent an immense opportunity to intervene. Measuring the impact of quality improvement efforts is often complicated by concomitant changes that affect outcomes over the interval studied. Our approach allowed us to detect statistically significant changes in LOS index and CMI‐adjusted VDC associated with the ACT implementation dose that could be separated from the underlying time trends.
The ACT model we describe is rooted in improving 3 foundational domains; quantifying each intervention's compartmentalized contribution, however, proved difficult. Each intervention intertwines with the others to create changes in attitudes, knowledge, and culture that are difficult to measure yet may synergistically affect outcomes. For example, although geographical cohorting appears to have the strongest statistical association with outcomes, this may be mediated by how it enables other processes to take place more effectively. Based on this analysis, therefore, the ACT model may best be considered a bundled intervention.
The team caring for a patient during hospitalization is so complex that fewer than a quarter of patients know their physician's or nurse's name.[12] This complexity impairs communication between patients and providers and between the providers themselves. Communication failures are consistently identified as root causes in sentinel events reported to the Joint Commission.[13] IPC is the process by which different professional groups work together to positively impact health care. IPC overlaps with communication, coordination, and teamwork, and improvements in IPC may improve care.[14] Some elements of the model we describe have been tested previously.[15, 16, 17] Localization of teams may increase productivity and the frequency with which physicians and nurses communicate. Localization also decreases the number of pages received and steps walked by providers during a workday.[15, 16, 17] However, these studies reported a trend toward an increase in the LOS and neutral effects on cost and readmission rates. We found statistically significant decreases in both LOS and cost associated with the geographic cohorting of patients and providers. Notably, our model localized not only the physician providers but also the interdisciplinary team of pharmacists, clinical nurse specialists, case managers, and social workers. This proximity may facilitate IPC between all members that culminates in improved efficiency. The possibility of delays in discharges to avoid new admissions in a geographically structured team has previously been raised to explain the associated increases in LOS.[16, 17] The accountability of each unit for its metrics, the communication between nursing and physicians, and the timely availability of the unit's performance data aligns everyone toward a shared goal and provides some protection from an unintended consequence.
Structured interdisciplinary rounds decrease adverse events and improve teamwork ratings.[18, 19] The huddle in our model is a forum to collaborate between disciplines that proved to be effective in decreasing LOS and costs. Our huddle aims to discuss all the patients on the unit. This allows the team to assist each other in problem solving for the entire unit and not just the patients on the geographically cohorted team. This approach, in addition to the improved IPC fostered by the ACT model, may help explain how benefits in LOS and costs permeated across all 11 diverse units despite the presence of patients who are not directly served by the geographically cohorted team.
High‐performing clinical systems maintain an awareness of their overarching mission and unit‐based leaders can influence the frontline by reiterating the organizational mission and aligning efforts with outcomes.[20] Our leadership model is similar to those described by other institutions in the strong partnerships between physicians and nursing.[21] As outlined by Kim et al., investing in the professional development of the unit leaders may help them fulfill their roles and serve the organization better.[21]
The fragmentation and lack of ownership over the continuum of patient care causes duplication and waste. The proposal in the Accountable Care Act to create accountable care organizations is rooted in the understanding that providers and organizations will seek out new ways of improving quality when held accountable for their outcomes.[22] To foster ownership and accountability, reporting of metrics at the unit level is needed. Furthermore, an informational infrastructure is critical, as improvements cannot occur without the availability of data to both monitor performance and measure the effect of interventions.[10, 23] Even without any other interventions, providing feedback alone is an effective way of changing practices.[24] According to Berwick et al., this phenomenon reflects practitioners' intrinsic motivation to simply want to be better.[25] Our monthly review of each unit's data is an effective way to provide timely feedback to the frontline that sparks pride, ownership, and innovative thinking.
Based on our mean ACT score and CMI‐adjusted VDC reductions alone, we estimate savings of $649.36 per hospitalization (mean increase in ACT implementation of 2.37 times reduction in cost index of $273.99 per unit increase in overall ACT score). This figure does not include savings realized through reductions in LOS. This is a small decrease relative to the mean cost of hospitalization, yet when compounded over the annual MH census, it would result in substantial savings. The model relied on the restructuring of the existing workforce and the only direct additional cost was the early salary support for the ACT program director.
Limitations
We recognize several limitations. It is a single center's experience and may not be generalizable. The diffusion of knowledge and culture carried between units and the relatively rapid implementation timeline did not allow for a control unit. A single observer assigned our implementation scores, and therefore we cannot report measures of inter‐rater reliability. However, defined criteria and direct observations were used wherever possible. Although administratively available data have their limitations, where available, we used measurements that are adjusted for severity of illness and CMI. We therefore feel that this dataset is an accurate representation of currently reported national quality indicators.
FURTHER DIRECTIONS
Although there is a need to improve our healthcare system, interventions should be deliberate and evidence based wherever possible.[26] Geographic cohorting may decrease the frequency of paging interruptions for physicians and practitioners while increasing face‐to‐face interruptions.[27] The net effect on safety with this trade‐off should be investigated.
The presence of an intervention does not guarantee its success. Despite geographic cohorting and interdisciplinary meetings, communication that influences physician decision making may not improve.[28] Although instruments to measure ratings of team work and collaboration are available, focusing on clinically relevant outcomes of teamwork, such as prevention of harm, may be more empowering feedback for the frontline. Formal cost‐benefit analyses and outcomes related to physician and nursing retention will be equally important for assessing the sustainability of the model. Involving patients and their caregivers and inviting their perspectives as care is redesigned will also be critical in maintaining patient centeredness. Research addressing interventions to mediate preventable readmission risk and understanding the drivers of patient satisfaction is also needed.
The true value of the model may be in its potential to monitor and drive change within itself. Continuously aligning aims, incentives, performance measures, and feedback will help support this innovation and drive. This affects not only patient care but creates microcosms within which research and education can thrive. We hope that our experience will help guide other institutions as we all strive in our journey to improve the care we deliver.
Acknowledgements
The authors thank the Indiana University Health Physicians hospitalists at MH, Sandy Janitz and Decision Support, the Indiana University Health executive leadership team, Robert Clark, Malaz Boustani, Dennis Watson, Nadia Adams, Todd Biggerstaff, Deanne Kashiwagi, and the tireless providers at MH for their support.
Disclosure: This work was supported by a grant from the Indiana University Health Values Fund. The authors have no conflicts of interest to disclose.
- Committee on Quality of Health Care in America; Institute of Medicine. Crossing the Quality Chasm: A New Health System for the 21st Century. Washington, DC: The National Academies Press; 2001.
- . Is US health really the best in the world? JAMA. 2000;284(4):483–485.
- , , , , , . Temporal trends in rates of patient harm resulting from medical care. N Engl J Med. 2010;363(22):2124–2134.
- Indiana University Health. Available at: http://iuhealth.org/methodist/aboIut/. Accessed October 20, 2014.
- University Health Consortium. Available at: https://www.uhc.edu/docs/45014769_QSS_dashboard_FAQs.pdf. Accessed October 23, 2014.
- , , , et al. Distribution of variable vs fixed costs of hospital care. JAMA. 1999;281(7):644–649.
- Centers for Medicare and Medicaid Services. Case mix index. Available at: http://www.cms.gov/Medicare/Medicare‐Fee‐for‐Service‐Payment/AcuteInpatientPPS/Acute‐Inpatient‐Files‐for‐Download‐Items/CMS022630.html. Accessed May 4, 2015.
- University Health Consortium. Available at: https://www.uhc.edu. Accessed October 23, 2014.
- Centers for Medicare and Medicaid Services. Hospital Consumer Assessment of Healthcare Providers and Systems. HCAHPS survey content and administration. Centers for Medicare 280(11):1000–1005.
- Centers for Disease Control and Prevention. FastStats. Available at: http://www.cdc.gov/nchs/fastats/default.htm. Accessed October 27, 2014.
- , . Does your patient know your name? An approach to enhancing patients' awareness of their caretaker's name. J Healthc Qual. 2005;27(4):53–56.
- The Joint Commission. Sentinel event data: root causes by event type 2004‐third quarter. Available at: http://www.jointcommissionorg. Available at: http://www.jointcommission.org/assets/1/18/Root_Causes_by_Event_Type_2004-2Q2013.pdf. Accessed March 26, 2014.
- , , . Interprofessional collaboration: effects of practice‐based interventions on professional practice and healthcare outcomes. Cochrane Database Syst Rev. 2009;(3):CD000072.
- , , , et al. Impact of localizing physicians to hospital units on nurse–physician communication and agreement on the plan of care. J Gen Intern Med. 2009;24(11):1223–1227.
- , , , et al. Impact of localizing general medical teams to a single nursing unit. J Hosp Med. 2012;7(7):551–556.
- , , , et al. Implementation of a physician assistant/hospitalist service in an academic medical center: impact on efficiency and patient outcomes. J Hosp Med. 2008;3(5):361–368.
- , , , , , . Improving teamwork: impact of structured interdisciplinary rounds on a medical teaching unit. J Gen Intern Med. 2010;25(8):826–832.
- , , , ; High Performance Teams and the Hospital of the Future Project Team. Interdisciplinary teamwork in hospitals: a review and practical recommendations for improvement. J Hosp Med. 2011;7(1):48–54.
- , , , , , . Microsystems in health care: part 8. Developing people and improving work life: what front‐line staff told us. Jt Comm J Qual Saf. 2003;29(10):512–522.
- , , , , , . Unit‐based interprofessional leadership models in six US hospitals. J Hosp Med. 2014;9(8):545–550.
- , , , . Creating accountable care organizations: the extended hospital medical staff. Health Aff (Millwood). 2007;26(1):w44–w57.
- , . Using performance measurement to drive improvement: a road map for change. Med Care. 2003;41(1 suppl):I48–I60.
- , . Changing physicians' practices. N Engl J Med. 1993;329(17):1271–1273.
- , , . Connections between quality measurement and improvement. Med Care. 2003;41(1 suppl):I30–I38.
- , , . The tension between needing to improve care and knowing how to do it. N Engl J Med. 2007;357(6):608–613.
- , . A qualitative evaluation of geographical localization of hospitalists: how unintended consequences may impact quality. J Gen Intern Med. 2014;29(7):1009–1016.
- , , , , . Disengaged: a qualitative study of communication and collaboration between physicians and other professions on general internal medicine wards. BMC Health Serv Res. 2013;13:494.
© 2015 Society of Hospital Medicine

Baseline QTc and Azithromycin Evaluation
Azithromycin, a macrolide antibiotic, received US Food and Drug Administration (FDA) approval in 1991 and is 1 of the most prescribed antibiotics used for a variety of infections, including community‐acquired pneumonia, bacterial sinusitis, urethritis, and cervicitis. In 2011, it was estimated that 40.3 million outpatients received a prescription for azithromycin.[1] In addition to treating acute bacterial infections, recent literature has pointed to using azithromycin for its unlabeled immunomodulatory and anti‐inflammatory effects, particularly in cystic fibrosis, chronic obstructive pulmonary disease (COPD), and lung transplant recipients.[2, 3, 4] Azithromycin decreases bacterial load and virulence, thus reducing airway secretion, as well as decreasing airway neutrophil accumulation through a reduction in proinflammatory cytokine expression.[4]
Cardiac toxicity can occur with macrolide antibiotics, and prolongation of the QT interval with subsequent Torsades de pointes has been documented with azithromycin.[1, 5, 6] In 2012, Ray et al. published data on a cohort of outpatients receiving azithromycin compared to amoxicillin, ciprofloxacin, or no antibiotics, and showed a small but absolute increase in cardiovascular deaths.[7, 8] Subsequent data, however, have not illustrated increased risk of death from cardiovascular causes. Mortensen et al. showed a lower risk of 90‐day mortality in older patients treated for community acquired pneumonia with azithromycin and ceftriaxone, although there was a nonstatistically significant increased risk of myocardial infarction in this group.[8, 9, 10] In March 2013, the FDA released an official statement regarding increased cardiovascular risk with azithromycin, stating that healthcare professionals should consider the risk of fatal heart rhythms with azithromycin when considering treatment options for patients who are at risk for cardiovascular events.[11]
In recent years, the potential for corrected QT (QTc) prolongation and Torsades de pointes has received increased attention due to its catastrophic nature, and it is thought that hospitalized patients are at a greater risk of drug‐induced Torsades de pointes due to the likelihood of having more risk factors.[12, 13] The American Heart Association released a statement in 2010 to raise awareness among healthcare professionals about risk, electrocardiogram (ECG) monitoring, and management of drug‐induced QT interval prolongation in hospitalized patients, although little data exist regarding quantification of risk in this patient population.[13, 14]
Prescribers currently have no standardized practice guidelines related to cardiovascular safety when prescribing QTc prolonging medications. Given the dramatic increase in azithromycin prescriptions and ongoing concern for cardiovascular risk and QTc prolongation, we investigated the prescribing practices with azithromycin within our institution. Our primary aims were 3‐fold. First, we aimed to describe the frequency azithromycin was prescribed with additional QTc prolonging medications. Second, we assessed the relationship between the number of arrhythmogenic drugs prescribed in addition to azithromycin with ordering telemetry. Finally, we assessed the relationship between baseline ECG abnormalities and telemetry monitoring in patients prescribed azithromycin. The purpose of these objectives was to better understand physician prescribing practices and to determine if patients have a potential risk of developing fatal cardiac arrhythmias
METHODS
Data
For this retrospective review, we utilized data from the University of Alabama at Birmingham Health Care system, a 1157licensed bed hospital. The institutional review board approved this study with a waiver of informed consent. Patients were eligible to be included in this study if they were 19 years of age with an inpatient hospital length of stay 3 days. Patients were considered to be receiving azithromycin and were included only when they were dispensed 1 dose of azithromycin by the pharmacy. Between October 1, 2012 and April 30, 2013, 1610 encounters were identified, of which 100 patient encounters were randomly selected for evaluation via a Microsoft Excel (Microsoft Corp., Redmond, WA) function. One patient was randomly included twice in this study, but had 2 separate admissions in which he received azithromycin.
QTc prolonging medications in our hospital formulary were identified via Micromedex and package inserts (see Supporting Information, Appendix, in the online version of this article for the full list).
Measures
The primary study measures were number of medications associated with QTc prolongation, baseline ECG findings, and telemetry monitoring. Secondary study measures include indication, dose, duration of use, formulation, length of stay, and admitting service (Table 1). Indications, dosage, and duration were defined by the FDA package insert for azithromycin (see Supporting Information, Appendix, in the online version of this article). Indication for use was defined as (1) empiric for a specific infection; (2) anti‐inflammatory for patients with COPD, lung transplant recipients, or cystic fibrosis patients; and (3) culture proven if evidence of a particular pathogen grown on culture. Indications were defined by prescriber notes. Dosage is defined as appropriate if FDA guidelines were followed for the defined indication. If patients were given azithromycin for anti‐inflammatory purposes, dosing was considered appropriate if it followed previous literature dosing of 250mg daily.
| |
| Age, y | |
| Average | 5519.5 |
| Range | 2197 |
| Gender | |
| Female | 61% |
| Male | 39% |
| Length of stay, d | |
| Average | 9.713.1 |
| Range | 3115 |
| Admitting service | |
| Hospitalist | 37% |
| Pulmonary | 23% |
| Obstetrics | 9% |
| General medicine | 8% |
| Hematology/oncology | 6% |
| Othera | 17% |
| Days of therapy | |
| Average | 4.53.9 |
| Range | 128 |
| Median | 4 |
| Indication for use | |
| Empiric | 79% |
| Anti‐inflammatory | 20% |
| Culture proven | 1% |
| Dosage | |
| Appropriate | 67% |
| Inappropriate | 14% |
| Unknown | 19% |
| Duration | |
| Appropriate | 63% |
| Inappropriate | 19% |
| Unknown | 18% |
| Formulation | |
| Intravenous only | 21% |
| Intravenous followed by tablet | 13% |
| Suspension | 2% |
| Tablet | 64% |
| Diagnosis‐related group | |
| Simple pneumonia with pleurisy | 14% |
| Septicemia with sepsis | 8% |
| Respiratory infection with inflammation | 8% |
| Chronic obstructive pulmonary disease | 8% |
| Pulmonary edema with respiratory failure | 6% |
| Vaginal delivery with complications | 6% |
| Respiratory diagnosis with ventilator support | 4% |
| Otherb | 46% |
Patients were divided into drug interaction risk levels based on the number of medications prescribed with the potential for QT prolongation (Table 2). Patients were considered low risk if they received azithromycin alone, medium risk if they received 2 to 3 QT‐prolonging medications including azithromycin, and high risk if they received 4 or more QT‐prolonging medications including azithromycin.
| Medication | % of Patients Receiving Interacting Medication With Azithromycin |
|---|---|
| |
| Ondansetron | 48 |
| Trazodone | 23 |
| Moxifloxacin | 17 |
| Promethazine, haloperidol | 10 |
| Ciprofloxacin, citalopram, fluconazole | 7 |
| Amiodarone, amitriptyline | 5 |
| Quetiapine, methadone | 4 |
| Clarithromycin, octreotide, voriconazole | 2 |
| Erythromycin, granisetron, salmeterol, sotalol, ziprasidone | 1 |
The QT interval was measured from the beginning of the QRS complex to the end of the T wave as it returns to baseline. QTc has been defined by the most universally adopted method known as Bazett's formula ( , where QT is the measured QT interval and RR is the interval in seconds).[15]
Baseline QTc was evaluated through the use of most recent ECG within the past 6 months of admission. Borderline QTc was defined as 431 to 450 ms in males and 451 to 470 ms in females. Abnormal QTc was defined as >450 ms in males and >470 ms in females.[16]
Following admission, inpatient charges for telemetry during hospitalization were included. Telemetry was documented based on telemetry charges at any point in the hospital.
Statistical Analysis
Patient data were initially collected via Excel and analyzed with SAS version 9.4 software (SAS Institute, Cary, NC). Univariate analysis including central tendency and dispersion were utilized for aim 1. P values were calculated using 2 analysis and Fisher exact test for probability if cells with numerical values were <5 for aims 2 and 3.
RESULTS
Azithromycin use within our hospital system has increased from 15 days of therapy per 1000 patient days in 2002 to 40 days of therapy per 1000 patient days in 2013 (Figure 1). At the same time, azithromycin susceptibility in Streptococcus pneumoniae isolates has decreased over the past decade from 65% to 35% in our hospital.
The baseline characteristics of patients included in this study are noted in Table 1. The mean age of patients was 55 years, with a range of 21 to 97 years, and 61% were female. Forty‐five percent of patients were admitted to either the general medicine teaching service or hospitalist service, and 23% were admitted to the pulmonary service, which includes intensive care unit admission. The average length of patient stay was 9.7 days (range, 3115 days; median 6 days).
Seventy‐nine percent of azithromycin use was empiric for the treatment of suspected infection. The second most common use was for anti‐inflammatory effects (20%), as documented by prescribers in the medical record for patients with cystic fibrosis, lung transplant, and chronic obstructive pulmonary disease. Azithromycin was dosed appropriately according to the documented indication in 67% of patients, with the most discrepancy in dosing noted for anti‐inflammatory use. The average duration of azithromycin therapy was 4.5 days (range, 128 days). Duration was appropriate in 63% of patients. Twenty‐one percent of patients received intravenous formulation of azithromycin, 13% received intravenous followed by oral formulation, and 64% of patient received tablet formulation alone.
Thirty‐five medications have been identified in our formulary as having a potential major drug‐drug interaction when prescribed with azithromycin (see Supporting Information, Appendix, in the online version of this article), and of these medications, 20 were prescribed with azithromycin, with an average overlap of therapy of 4.5 days (Table 2). Seventy‐six percent of patients were concomitantly prescribed a QT‐prolonging drug in addition to azithromycin. The most commonly prescribed agents were ondansetron (48%), trazodone (22%), and moxifloxacin (17%).
Telemetry monitoring was assessed for each patient based on inpatient charges during their hospitalization (Table 3). Forty‐three percent of patients were placed on telemetry. Twenty‐four (24%) of the patients were prescribed azithromycin alone, of whom 45.8% were placed on telemetry. Fifty‐seven percent of patients were prescribed azithromycin with 1 to 2 additional QT‐prolonging medications (medium‐risk arm); 38.5% of patients in this group were placed on telemetry. In the high‐risk arm, 19% of patients were prescribed at least 3 QT‐prolonging medications in addition to azithromycin, of which only 52.6% of patients were monitored with telemetry. No statistically significant association was observed between risk level and telemetry placement (P=0.07).
| Telemetry (%) | No Telemetry (%) | Total | P Valueb | |
|---|---|---|---|---|
| ||||
| Drug interaction risk levela | ||||
| Low | 11 (45.8) | 13 (54.2) | 24 | |
| Medium | 22 (38.5) | 35 (61.4) | 57 | |
| High | 10 (52.6) | 9 (47.4) | 19 | |
| Total | 43 | 57 | 100 | 0.07 |
| QTc | ||||
| Normal | 14 (50) | 14 (50) | 28 | |
| Borderline | 6 (66.7) | 3 (33.3) | 9 | |
| Abnormal | 15 (51.7) | 14 (48.3) | 29 | |
| Total | 35 | 31 | 66 | 0.22 |
Telemetry charges were further examined by analyzing baseline ECG evaluation within the past 6 months of their hospitalization (Table 3). Sixty‐six patients received baseline ECGs prior to initiation of azithromycin. Telemetry placement was not statistically correlated to abnormal QTc at baseline (P=0.22). Of those who underwent baseline ECG evaluation, 8.3% were noted to have borderline QTc, and 12.5% had abnormal QTc on admission prior to receiving azithromycin in the low‐risk level (Table 4). Within the medium‐risk level, 63.2% had baseline ECG evaluation, with 5.3% with borderline QTc and 35.7% with abnormal QTc. In the high‐risk level, 73.6% received a baseline ECG, with 21% with borderline QTc and 31.6% with abnormal QTc. No statistically significant association was observed between risk level and obtainment of baseline ECG (P=0.7). In 17 out of 66 patients, average repeat ECGs were obtained on day 3 (range, 27 days). Ten of the 17 ECGs showed increase in QTc (range, 397ms; average 27 ms), whereas the other 7 had a decrease in their QTc interval (range, 618 ms; average 13 ms; P=0.17).
| QTcb | Low, n=24 (%) | Medium, n=57 (%) | High, n=19 (%) | Total |
|---|---|---|---|---|
| ||||
| Normal | 11 (45.8%) | 13 (22.8%) | 4 (21.0%) | 28 |
| Borderline | 2 (8.3%) | 3 (5.3%) | 4 (21.0%) | 9 |
| Abnormal | 3 (12.5%) | 20 (35.7%) | 6 (31.6%) | 29 |
| Total | 16 (66.7%) | 36 (63.2%) | 14 (73.6%) | 66 |
| P valuec | 0.03 | 0.11 | ||
As risk level increased, having an abnormal QTc at baseline was statistically different between low‐ and medium‐risk levels (P=0.03), but this association was lost when comparing the low‐risk arm to the high‐risk arm (P=0.11). When the medium‐ and high‐risk categories were combined, there was a noted statistical significance of having an abnormal ECG at baseline (P=0.03).
Of the 9 patients prescribed azithromycin chronically, 3 patients were in the low‐risk category, 4 in the medium‐risk category, and 2 in the high‐risk category. Only 2 had baseline ECGs obtained, 1 of which was noted to have abnormal QTc and was in the high‐risk category. Only 1 patient was placed on telemetry, but was considered low risk based on medications prescribed.
DISCUSSION
In this study, 76% of patients were prescribed azithromycin with 1 or more medications known to affect QT prolongation; 19% received 3 or more QT‐prolonging medications in addition to azithromycin. Of patients who received a baseline ECG, 43% were documented to have borderline or prolonged QTc on admission. Telemetry monitoring was ordered 43% of the time, but there was no significant association between telemetry placement and risk level (P=0.07), suggesting that telemetry was ordered based on symptoms more than risk. Despite more drug‐druginteracting medications prescribed, there was no association to either telemetry orders or baseline ECG evaluation. Furthermore, if an abnormal QTc was documented on admission, there was no relationship to ordering telemetry as an inpatient (P=0.215), suggesting that healthcare providers are not considering risk of QTc medication accumulation. Given increased warnings issued by the FDA for azithromycin, further prospective studies are indicated to fully assess risk of QTc prolongation and arrhythmias in the setting of multiple drug interactions. This study elucidates the potential for drug‐drug interactions and need for increased vigilance and education of providers in the healthcare setting for QTc prolongation and subsequent arrhythmias.
Forty‐eight percent of patients receiving other QTc prolonging medications were prescribed ondansetron, followed by 23% of patients prescribed trazodone. Both of these medications are included on the admission order set in our institution and can be easily ordered for patients. Despite ordering multiple medications that have potential for QTc prolongation, there are no current alerts set up in our electronic medical record. When patients are separated into drug interaction risk levels, there is a trend of having an abnormal QTc on admission, but this is driven by the large number of patients in the medium‐risk category, and the rate does not increase (and is not significant) when comparing high risk to low risk. However, patients who receive any QTc‐prolonging medication are more likely to have an abnormal QTc when compared to azithromycin prescription alone (P=0.03). The small sample size limits the power and generalizability of this study, and further larger studies are indicated to assess if risk of QTc prolongation is additive.
In the 9 patients prescribed azithromycin chronically, dosing was not consistent, and a vast majority of patients were not placed on telemetry nor had baseline ECGs on admission. This further correlates with the idea that risk of arrhythmia is not fully considered in this patient population, as patients prescribed more than 1 QTc‐prolonging medication were not included in prior studies that examined azithromycin for its anti‐inflammatory effects.[2]
Azithromycin was added to our hospital formulary in 1998, and prescription of this agent remained relatively low until 2006, when azithromycin use increased dramatically from 15 days of therapy (DOT) per 1000 patient days to 40 DOT per 1000 patient days. Although numerous factors may have led to this increase, literature was published in 2006 and 2011 citing benefit from the anti‐inflammatory effects of azithromycin.[2, 17] At the same time, azithromycin susceptibility among Streptococcus pneumoniae in patients within our hospital has decreased over the past decade; studies have found a correlation between increasing use of macrolides and the development of resistance in Streptococcus species.[18, 19, 20] In this study, 79% of patients were prescribed azithromycin empirically for treatment of bacterial infections, whereas 20% were given azithromycin for its anti‐inflammatory effects; both dose and frequency varied among patients, raising the concern for development of resistance. Published studies have shown improvement in quality of life and decreased frequency of exacerbation and infection when azithromycin is used as an anti‐inflammatory agent; however, no QTc monitoring was noted.[2] Drug‐induced QTc prolongation>10 ms above baseline suggests the potential for clinical significance, whereas a QTc prolongation >20 milliseconds above baseline has a substantially increased likelihood of being proarrhythmic.[1] Unfortunately, drug‐induced QT prolongation is unpredictable, and additional risk factors play a role in facilitating Torsades de pointes, including female sex, advanced age, electrolyte disturbances, intravenous formulation, and concurrent use of more than 1 drug that can prolong the QT interval.[15] Azithromycin has recently been added to the growing list of medications that can prolong the QT interval, with 12 cases of Torsades de pointes reported in the literature. In March 2013, the FDA released a warning regarding prescribing azithromycin, but there is a lack of guidance for clinicians in identifying risk of cardiovascular events in susceptible patients.
There are some limitations to this study. Given data were acquired retrospectively and telemetry sheets were unable to be reviewed. Some patients were noted to have arrhythmias, but these data were obtained through physician notes and not examined directly from telemetry sheets. Seventeen patients had repeat ECGs, but most were performed serially for chest pain and not QTc monitoring. Four patients died in this study, but cause of death could not be determined through electronic medical records provided for all 4 patients; families pursued withdrawal of care.
Despite the published FDA warning, there are no national guidelines for clinicians in prescribing QTc‐prolonging medications. The American Heart Association published recommendations in 2010 for prescribing these drugs in the inpatient setting, but because hospitals differ in cardiac monitoring, there is no one‐size‐fits‐all strategy in reducing risk of cardiac events.[14] If the benefit of azithromycin outweighs the risk, QTc prolongation should not limit therapy; however, institutional awareness is necessary, whether it be through automatic stop dates on azithromycin, electronic alerts regarding drug‐drug interaction, enhanced prescriber education, or a combination of all of the above.
Disclosure: Nothing to report.
- , , . Azithromycin and the risk of cardiovascular complications. J Pharm Pract. 2014;27(5):496–500.
- , , , et al., Azithromycin for prevention of exacerbations of COPD. N Engl J Med. 2011;365(8):689–698.
- , , , . Macrolide antibiotics for cystic fibrosis. Cochrane Database Syst Rev. 2012;11:CD002203.
- , , . Long‐term macrolide treatment for chronic respiratory disease. Eur Respir J. 2013;42(1):239–251.
- , . Antimicrobial‐associated QT interval prolongation: pointes of interest. Clin Infect Dis. 2006;43(12):1603–1611.
- . Azithromycin‐induced proarrhythmia and cardiovascular death. Ann Pharmacother. 2013;47(11):1547–1551.
- , , , , . Azithromycin and the risk of cardiovascular death. N Engl J Med. 2012;366(20):1881–1890.
- , , , et al. Azithromycin and levofloxacin use and increased risk of cardiac arrhythmia and death. Ann Fam Med. 2014;12(2):121–127.
- , , , et al. Association of azithromycin with mortality and cardiovascular events among older patients hospitalized with pneumonia. JAMA. 2014;311(21):2199–2208.
- , , . Use of azithromycin and death from cardiovascular causes. N Engl J Med. 2013;368(18):1704–1712.
- U.S. Food and Drug Administration Drug Information. FDA drug safety communication: azithromycin (zithromax or zmax) and the risk of potentially fatal heart rhythms. Available at: http://www.fda.gov/Drugs/DrugSafety/ucm341822.htm. Accessed December 1, 2014.
- , , , , . QT interval prolongation and the risk of torsades de pointes: essentials for clinicians. Curr Med Res Opin. 2013;29(12):1719–1726.
- , , , et al., Development and validation of a risk score to predict QT interval prolongation in hospitalized patients. Circ Cardiovasc Qual Outcomes. 2013;6(4):479–487.
- , , , et al.; American Heart Association Acute Cardiac Care Committee of the Council on Clinical Cardiology; Council on Cardiovascular Nursing; American College of Cardiology Foundation. Prevention of torsade de pointes in hospital settings: a scientific statement from the American Heart Association and the American College of Cardiology Foundation. J Am Coll Cardiol. 2010;55(9):934–947.
- , , . Drug‐induced QT interval prolongation: mechanisms and clinical management. Ther Adv Drug Saf. 2012;3(5):241–253.
- , , . QT interval: how to measure it and what is “normal”. J Cardiovasc Electrophysiol. 2006;17(3):333–336.
- , , , , . Anti‐inflammatory effects of azithromycin in cystic fibrosis airway epithelial cells. Biochem Biophys Res Commun. 2006;350(4):977–982.
- , , , , , ; Finnish Study Group for Antimicrobial Resistance (FiRe‐Network). Macrolide‐resistant Streptococcus pneumoniae and use of antimicrobial agents. Clin Infect Dis. 2001;33(4):483–488.
- , , , , , . Community prescribing and resistant Streptococcus pneumoniae. Emerg Infect Dis. 2005;11(6):829–837.
- , , , , ; Finnish Study Group for Antimicrobial Resistance (FiRe Network). Macrolide and azithromycin use are linked to increased macrolide resistance in Streptococcus pneumoniae. Antimicrob Agents Chemother. 2006;50(11):3646–3650.
Azithromycin, a macrolide antibiotic, received US Food and Drug Administration (FDA) approval in 1991 and is 1 of the most prescribed antibiotics used for a variety of infections, including community‐acquired pneumonia, bacterial sinusitis, urethritis, and cervicitis. In 2011, it was estimated that 40.3 million outpatients received a prescription for azithromycin.[1] In addition to treating acute bacterial infections, recent literature has pointed to using azithromycin for its unlabeled immunomodulatory and anti‐inflammatory effects, particularly in cystic fibrosis, chronic obstructive pulmonary disease (COPD), and lung transplant recipients.[2, 3, 4] Azithromycin decreases bacterial load and virulence, thus reducing airway secretion, as well as decreasing airway neutrophil accumulation through a reduction in proinflammatory cytokine expression.[4]
Cardiac toxicity can occur with macrolide antibiotics, and prolongation of the QT interval with subsequent Torsades de pointes has been documented with azithromycin.[1, 5, 6] In 2012, Ray et al. published data on a cohort of outpatients receiving azithromycin compared to amoxicillin, ciprofloxacin, or no antibiotics, and showed a small but absolute increase in cardiovascular deaths.[7, 8] Subsequent data, however, have not illustrated increased risk of death from cardiovascular causes. Mortensen et al. showed a lower risk of 90‐day mortality in older patients treated for community acquired pneumonia with azithromycin and ceftriaxone, although there was a nonstatistically significant increased risk of myocardial infarction in this group.[8, 9, 10] In March 2013, the FDA released an official statement regarding increased cardiovascular risk with azithromycin, stating that healthcare professionals should consider the risk of fatal heart rhythms with azithromycin when considering treatment options for patients who are at risk for cardiovascular events.[11]
In recent years, the potential for corrected QT (QTc) prolongation and Torsades de pointes has received increased attention due to its catastrophic nature, and it is thought that hospitalized patients are at a greater risk of drug‐induced Torsades de pointes due to the likelihood of having more risk factors.[12, 13] The American Heart Association released a statement in 2010 to raise awareness among healthcare professionals about risk, electrocardiogram (ECG) monitoring, and management of drug‐induced QT interval prolongation in hospitalized patients, although little data exist regarding quantification of risk in this patient population.[13, 14]
Prescribers currently have no standardized practice guidelines related to cardiovascular safety when prescribing QTc prolonging medications. Given the dramatic increase in azithromycin prescriptions and ongoing concern for cardiovascular risk and QTc prolongation, we investigated the prescribing practices with azithromycin within our institution. Our primary aims were 3‐fold. First, we aimed to describe the frequency azithromycin was prescribed with additional QTc prolonging medications. Second, we assessed the relationship between the number of arrhythmogenic drugs prescribed in addition to azithromycin with ordering telemetry. Finally, we assessed the relationship between baseline ECG abnormalities and telemetry monitoring in patients prescribed azithromycin. The purpose of these objectives was to better understand physician prescribing practices and to determine if patients have a potential risk of developing fatal cardiac arrhythmias
METHODS
Data
For this retrospective review, we utilized data from the University of Alabama at Birmingham Health Care system, a 1157licensed bed hospital. The institutional review board approved this study with a waiver of informed consent. Patients were eligible to be included in this study if they were 19 years of age with an inpatient hospital length of stay 3 days. Patients were considered to be receiving azithromycin and were included only when they were dispensed 1 dose of azithromycin by the pharmacy. Between October 1, 2012 and April 30, 2013, 1610 encounters were identified, of which 100 patient encounters were randomly selected for evaluation via a Microsoft Excel (Microsoft Corp., Redmond, WA) function. One patient was randomly included twice in this study, but had 2 separate admissions in which he received azithromycin.
QTc prolonging medications in our hospital formulary were identified via Micromedex and package inserts (see Supporting Information, Appendix, in the online version of this article for the full list).
Measures
The primary study measures were number of medications associated with QTc prolongation, baseline ECG findings, and telemetry monitoring. Secondary study measures include indication, dose, duration of use, formulation, length of stay, and admitting service (Table 1). Indications, dosage, and duration were defined by the FDA package insert for azithromycin (see Supporting Information, Appendix, in the online version of this article). Indication for use was defined as (1) empiric for a specific infection; (2) anti‐inflammatory for patients with COPD, lung transplant recipients, or cystic fibrosis patients; and (3) culture proven if evidence of a particular pathogen grown on culture. Indications were defined by prescriber notes. Dosage is defined as appropriate if FDA guidelines were followed for the defined indication. If patients were given azithromycin for anti‐inflammatory purposes, dosing was considered appropriate if it followed previous literature dosing of 250mg daily.
| |
| Age, y | |
| Average | 5519.5 |
| Range | 2197 |
| Gender | |
| Female | 61% |
| Male | 39% |
| Length of stay, d | |
| Average | 9.713.1 |
| Range | 3115 |
| Admitting service | |
| Hospitalist | 37% |
| Pulmonary | 23% |
| Obstetrics | 9% |
| General medicine | 8% |
| Hematology/oncology | 6% |
| Othera | 17% |
| Days of therapy | |
| Average | 4.53.9 |
| Range | 128 |
| Median | 4 |
| Indication for use | |
| Empiric | 79% |
| Anti‐inflammatory | 20% |
| Culture proven | 1% |
| Dosage | |
| Appropriate | 67% |
| Inappropriate | 14% |
| Unknown | 19% |
| Duration | |
| Appropriate | 63% |
| Inappropriate | 19% |
| Unknown | 18% |
| Formulation | |
| Intravenous only | 21% |
| Intravenous followed by tablet | 13% |
| Suspension | 2% |
| Tablet | 64% |
| Diagnosis‐related group | |
| Simple pneumonia with pleurisy | 14% |
| Septicemia with sepsis | 8% |
| Respiratory infection with inflammation | 8% |
| Chronic obstructive pulmonary disease | 8% |
| Pulmonary edema with respiratory failure | 6% |
| Vaginal delivery with complications | 6% |
| Respiratory diagnosis with ventilator support | 4% |
| Otherb | 46% |
Patients were divided into drug interaction risk levels based on the number of medications prescribed with the potential for QT prolongation (Table 2). Patients were considered low risk if they received azithromycin alone, medium risk if they received 2 to 3 QT‐prolonging medications including azithromycin, and high risk if they received 4 or more QT‐prolonging medications including azithromycin.
| Medication | % of Patients Receiving Interacting Medication With Azithromycin |
|---|---|
| |
| Ondansetron | 48 |
| Trazodone | 23 |
| Moxifloxacin | 17 |
| Promethazine, haloperidol | 10 |
| Ciprofloxacin, citalopram, fluconazole | 7 |
| Amiodarone, amitriptyline | 5 |
| Quetiapine, methadone | 4 |
| Clarithromycin, octreotide, voriconazole | 2 |
| Erythromycin, granisetron, salmeterol, sotalol, ziprasidone | 1 |
The QT interval was measured from the beginning of the QRS complex to the end of the T wave as it returns to baseline. QTc has been defined by the most universally adopted method known as Bazett's formula ( , where QT is the measured QT interval and RR is the interval in seconds).[15]
Baseline QTc was evaluated through the use of most recent ECG within the past 6 months of admission. Borderline QTc was defined as 431 to 450 ms in males and 451 to 470 ms in females. Abnormal QTc was defined as >450 ms in males and >470 ms in females.[16]
Following admission, inpatient charges for telemetry during hospitalization were included. Telemetry was documented based on telemetry charges at any point in the hospital.
Statistical Analysis
Patient data were initially collected via Excel and analyzed with SAS version 9.4 software (SAS Institute, Cary, NC). Univariate analysis including central tendency and dispersion were utilized for aim 1. P values were calculated using 2 analysis and Fisher exact test for probability if cells with numerical values were <5 for aims 2 and 3.
RESULTS
Azithromycin use within our hospital system has increased from 15 days of therapy per 1000 patient days in 2002 to 40 days of therapy per 1000 patient days in 2013 (Figure 1). At the same time, azithromycin susceptibility in Streptococcus pneumoniae isolates has decreased over the past decade from 65% to 35% in our hospital.
The baseline characteristics of patients included in this study are noted in Table 1. The mean age of patients was 55 years, with a range of 21 to 97 years, and 61% were female. Forty‐five percent of patients were admitted to either the general medicine teaching service or hospitalist service, and 23% were admitted to the pulmonary service, which includes intensive care unit admission. The average length of patient stay was 9.7 days (range, 3115 days; median 6 days).
Seventy‐nine percent of azithromycin use was empiric for the treatment of suspected infection. The second most common use was for anti‐inflammatory effects (20%), as documented by prescribers in the medical record for patients with cystic fibrosis, lung transplant, and chronic obstructive pulmonary disease. Azithromycin was dosed appropriately according to the documented indication in 67% of patients, with the most discrepancy in dosing noted for anti‐inflammatory use. The average duration of azithromycin therapy was 4.5 days (range, 128 days). Duration was appropriate in 63% of patients. Twenty‐one percent of patients received intravenous formulation of azithromycin, 13% received intravenous followed by oral formulation, and 64% of patient received tablet formulation alone.
Thirty‐five medications have been identified in our formulary as having a potential major drug‐drug interaction when prescribed with azithromycin (see Supporting Information, Appendix, in the online version of this article), and of these medications, 20 were prescribed with azithromycin, with an average overlap of therapy of 4.5 days (Table 2). Seventy‐six percent of patients were concomitantly prescribed a QT‐prolonging drug in addition to azithromycin. The most commonly prescribed agents were ondansetron (48%), trazodone (22%), and moxifloxacin (17%).
Telemetry monitoring was assessed for each patient based on inpatient charges during their hospitalization (Table 3). Forty‐three percent of patients were placed on telemetry. Twenty‐four (24%) of the patients were prescribed azithromycin alone, of whom 45.8% were placed on telemetry. Fifty‐seven percent of patients were prescribed azithromycin with 1 to 2 additional QT‐prolonging medications (medium‐risk arm); 38.5% of patients in this group were placed on telemetry. In the high‐risk arm, 19% of patients were prescribed at least 3 QT‐prolonging medications in addition to azithromycin, of which only 52.6% of patients were monitored with telemetry. No statistically significant association was observed between risk level and telemetry placement (P=0.07).
| Telemetry (%) | No Telemetry (%) | Total | P Valueb | |
|---|---|---|---|---|
| ||||
| Drug interaction risk levela | ||||
| Low | 11 (45.8) | 13 (54.2) | 24 | |
| Medium | 22 (38.5) | 35 (61.4) | 57 | |
| High | 10 (52.6) | 9 (47.4) | 19 | |
| Total | 43 | 57 | 100 | 0.07 |
| QTc | ||||
| Normal | 14 (50) | 14 (50) | 28 | |
| Borderline | 6 (66.7) | 3 (33.3) | 9 | |
| Abnormal | 15 (51.7) | 14 (48.3) | 29 | |
| Total | 35 | 31 | 66 | 0.22 |
Telemetry charges were further examined by analyzing baseline ECG evaluation within the past 6 months of their hospitalization (Table 3). Sixty‐six patients received baseline ECGs prior to initiation of azithromycin. Telemetry placement was not statistically correlated to abnormal QTc at baseline (P=0.22). Of those who underwent baseline ECG evaluation, 8.3% were noted to have borderline QTc, and 12.5% had abnormal QTc on admission prior to receiving azithromycin in the low‐risk level (Table 4). Within the medium‐risk level, 63.2% had baseline ECG evaluation, with 5.3% with borderline QTc and 35.7% with abnormal QTc. In the high‐risk level, 73.6% received a baseline ECG, with 21% with borderline QTc and 31.6% with abnormal QTc. No statistically significant association was observed between risk level and obtainment of baseline ECG (P=0.7). In 17 out of 66 patients, average repeat ECGs were obtained on day 3 (range, 27 days). Ten of the 17 ECGs showed increase in QTc (range, 397ms; average 27 ms), whereas the other 7 had a decrease in their QTc interval (range, 618 ms; average 13 ms; P=0.17).
| QTcb | Low, n=24 (%) | Medium, n=57 (%) | High, n=19 (%) | Total |
|---|---|---|---|---|
| ||||
| Normal | 11 (45.8%) | 13 (22.8%) | 4 (21.0%) | 28 |
| Borderline | 2 (8.3%) | 3 (5.3%) | 4 (21.0%) | 9 |
| Abnormal | 3 (12.5%) | 20 (35.7%) | 6 (31.6%) | 29 |
| Total | 16 (66.7%) | 36 (63.2%) | 14 (73.6%) | 66 |
| P valuec | 0.03 | 0.11 | ||
As risk level increased, having an abnormal QTc at baseline was statistically different between low‐ and medium‐risk levels (P=0.03), but this association was lost when comparing the low‐risk arm to the high‐risk arm (P=0.11). When the medium‐ and high‐risk categories were combined, there was a noted statistical significance of having an abnormal ECG at baseline (P=0.03).
Of the 9 patients prescribed azithromycin chronically, 3 patients were in the low‐risk category, 4 in the medium‐risk category, and 2 in the high‐risk category. Only 2 had baseline ECGs obtained, 1 of which was noted to have abnormal QTc and was in the high‐risk category. Only 1 patient was placed on telemetry, but was considered low risk based on medications prescribed.
DISCUSSION
In this study, 76% of patients were prescribed azithromycin with 1 or more medications known to affect QT prolongation; 19% received 3 or more QT‐prolonging medications in addition to azithromycin. Of patients who received a baseline ECG, 43% were documented to have borderline or prolonged QTc on admission. Telemetry monitoring was ordered 43% of the time, but there was no significant association between telemetry placement and risk level (P=0.07), suggesting that telemetry was ordered based on symptoms more than risk. Despite more drug‐druginteracting medications prescribed, there was no association to either telemetry orders or baseline ECG evaluation. Furthermore, if an abnormal QTc was documented on admission, there was no relationship to ordering telemetry as an inpatient (P=0.215), suggesting that healthcare providers are not considering risk of QTc medication accumulation. Given increased warnings issued by the FDA for azithromycin, further prospective studies are indicated to fully assess risk of QTc prolongation and arrhythmias in the setting of multiple drug interactions. This study elucidates the potential for drug‐drug interactions and need for increased vigilance and education of providers in the healthcare setting for QTc prolongation and subsequent arrhythmias.
Forty‐eight percent of patients receiving other QTc prolonging medications were prescribed ondansetron, followed by 23% of patients prescribed trazodone. Both of these medications are included on the admission order set in our institution and can be easily ordered for patients. Despite ordering multiple medications that have potential for QTc prolongation, there are no current alerts set up in our electronic medical record. When patients are separated into drug interaction risk levels, there is a trend of having an abnormal QTc on admission, but this is driven by the large number of patients in the medium‐risk category, and the rate does not increase (and is not significant) when comparing high risk to low risk. However, patients who receive any QTc‐prolonging medication are more likely to have an abnormal QTc when compared to azithromycin prescription alone (P=0.03). The small sample size limits the power and generalizability of this study, and further larger studies are indicated to assess if risk of QTc prolongation is additive.
In the 9 patients prescribed azithromycin chronically, dosing was not consistent, and a vast majority of patients were not placed on telemetry nor had baseline ECGs on admission. This further correlates with the idea that risk of arrhythmia is not fully considered in this patient population, as patients prescribed more than 1 QTc‐prolonging medication were not included in prior studies that examined azithromycin for its anti‐inflammatory effects.[2]
Azithromycin was added to our hospital formulary in 1998, and prescription of this agent remained relatively low until 2006, when azithromycin use increased dramatically from 15 days of therapy (DOT) per 1000 patient days to 40 DOT per 1000 patient days. Although numerous factors may have led to this increase, literature was published in 2006 and 2011 citing benefit from the anti‐inflammatory effects of azithromycin.[2, 17] At the same time, azithromycin susceptibility among Streptococcus pneumoniae in patients within our hospital has decreased over the past decade; studies have found a correlation between increasing use of macrolides and the development of resistance in Streptococcus species.[18, 19, 20] In this study, 79% of patients were prescribed azithromycin empirically for treatment of bacterial infections, whereas 20% were given azithromycin for its anti‐inflammatory effects; both dose and frequency varied among patients, raising the concern for development of resistance. Published studies have shown improvement in quality of life and decreased frequency of exacerbation and infection when azithromycin is used as an anti‐inflammatory agent; however, no QTc monitoring was noted.[2] Drug‐induced QTc prolongation>10 ms above baseline suggests the potential for clinical significance, whereas a QTc prolongation >20 milliseconds above baseline has a substantially increased likelihood of being proarrhythmic.[1] Unfortunately, drug‐induced QT prolongation is unpredictable, and additional risk factors play a role in facilitating Torsades de pointes, including female sex, advanced age, electrolyte disturbances, intravenous formulation, and concurrent use of more than 1 drug that can prolong the QT interval.[15] Azithromycin has recently been added to the growing list of medications that can prolong the QT interval, with 12 cases of Torsades de pointes reported in the literature. In March 2013, the FDA released a warning regarding prescribing azithromycin, but there is a lack of guidance for clinicians in identifying risk of cardiovascular events in susceptible patients.
There are some limitations to this study. Given data were acquired retrospectively and telemetry sheets were unable to be reviewed. Some patients were noted to have arrhythmias, but these data were obtained through physician notes and not examined directly from telemetry sheets. Seventeen patients had repeat ECGs, but most were performed serially for chest pain and not QTc monitoring. Four patients died in this study, but cause of death could not be determined through electronic medical records provided for all 4 patients; families pursued withdrawal of care.
Despite the published FDA warning, there are no national guidelines for clinicians in prescribing QTc‐prolonging medications. The American Heart Association published recommendations in 2010 for prescribing these drugs in the inpatient setting, but because hospitals differ in cardiac monitoring, there is no one‐size‐fits‐all strategy in reducing risk of cardiac events.[14] If the benefit of azithromycin outweighs the risk, QTc prolongation should not limit therapy; however, institutional awareness is necessary, whether it be through automatic stop dates on azithromycin, electronic alerts regarding drug‐drug interaction, enhanced prescriber education, or a combination of all of the above.
Disclosure: Nothing to report.
- , , . Azithromycin and the risk of cardiovascular complications. J Pharm Pract. 2014;27(5):496–500.
- , , , et al., Azithromycin for prevention of exacerbations of COPD. N Engl J Med. 2011;365(8):689–698.
- , , , . Macrolide antibiotics for cystic fibrosis. Cochrane Database Syst Rev. 2012;11:CD002203.
- , , . Long‐term macrolide treatment for chronic respiratory disease. Eur Respir J. 2013;42(1):239–251.
- , . Antimicrobial‐associated QT interval prolongation: pointes of interest. Clin Infect Dis. 2006;43(12):1603–1611.
- . Azithromycin‐induced proarrhythmia and cardiovascular death. Ann Pharmacother. 2013;47(11):1547–1551.
- , , , , . Azithromycin and the risk of cardiovascular death. N Engl J Med. 2012;366(20):1881–1890.
- , , , et al. Azithromycin and levofloxacin use and increased risk of cardiac arrhythmia and death. Ann Fam Med. 2014;12(2):121–127.
- , , , et al. Association of azithromycin with mortality and cardiovascular events among older patients hospitalized with pneumonia. JAMA. 2014;311(21):2199–2208.
- , , . Use of azithromycin and death from cardiovascular causes. N Engl J Med. 2013;368(18):1704–1712.
- U.S. Food and Drug Administration Drug Information. FDA drug safety communication: azithromycin (zithromax or zmax) and the risk of potentially fatal heart rhythms. Available at: http://www.fda.gov/Drugs/DrugSafety/ucm341822.htm. Accessed December 1, 2014.
- , , , , . QT interval prolongation and the risk of torsades de pointes: essentials for clinicians. Curr Med Res Opin. 2013;29(12):1719–1726.
- , , , et al., Development and validation of a risk score to predict QT interval prolongation in hospitalized patients. Circ Cardiovasc Qual Outcomes. 2013;6(4):479–487.
- , , , et al.; American Heart Association Acute Cardiac Care Committee of the Council on Clinical Cardiology; Council on Cardiovascular Nursing; American College of Cardiology Foundation. Prevention of torsade de pointes in hospital settings: a scientific statement from the American Heart Association and the American College of Cardiology Foundation. J Am Coll Cardiol. 2010;55(9):934–947.
- , , . Drug‐induced QT interval prolongation: mechanisms and clinical management. Ther Adv Drug Saf. 2012;3(5):241–253.
- , , . QT interval: how to measure it and what is “normal”. J Cardiovasc Electrophysiol. 2006;17(3):333–336.
- , , , , . Anti‐inflammatory effects of azithromycin in cystic fibrosis airway epithelial cells. Biochem Biophys Res Commun. 2006;350(4):977–982.
- , , , , , ; Finnish Study Group for Antimicrobial Resistance (FiRe‐Network). Macrolide‐resistant Streptococcus pneumoniae and use of antimicrobial agents. Clin Infect Dis. 2001;33(4):483–488.
- , , , , , . Community prescribing and resistant Streptococcus pneumoniae. Emerg Infect Dis. 2005;11(6):829–837.
- , , , , ; Finnish Study Group for Antimicrobial Resistance (FiRe Network). Macrolide and azithromycin use are linked to increased macrolide resistance in Streptococcus pneumoniae. Antimicrob Agents Chemother. 2006;50(11):3646–3650.
© 2015 Society of Hospital Medicine

Perceived Attitudes and Staff Roles of Disaster Management at CBOCs
Recently, the U.S. Department of Homeland Security redefined disasters into 4 types: natural hazards, societal hazards, technologic hazards, and terrorism. The incidence of manmade and natural disasters is on the rise in intensity and frequency globally. Recent events such as tornadoes and hurricanes in the southeastern U.S., tsunamis in Japan, earthquakes in Haiti, wild fires, heat waves, and terrorist attacks like that of September 11, 2001, underscore the urgency of developing and maintaining solid local public health disaster response plans to minimize mortality and morbidity.
The 2010 BP oil spill in the Gulf of Mexico, the largest in history, hurricane Katrina, and the lingering impact of hurricane Sandy on the East Coast further raise concerns about our communities’ ability to handle disasters, especially in the early hours after events, when federally coordinated help is being organized and not yet fully available locally or from other nations.1 The recent fertilizer plant explosion in West Texas, the 2013 Boston marathon bombing, and the Newtown, Connecticut, massacre remind us of the unpredictable nature of both manmade and natural disasters.

Coordinated Response
Regardless of its origin, residents expect a coordinated local response during an emergency, and it is important that government agencies meet this expectation. Fulfilling these expectations, however, takes many partners, and it is important to have a clear idea of who is involved in emergency preparedness (EP) and the response of each partner’s role.
Role of Government
Federal, state, and local governments have a critical role in emergency management (EM). When state government, local government, or an individual entity is overwhelmed with a disaster, the role of the Federal Emergency Management Agency is to provide assistance and resources to cope with the emergency.2 Private industry and traditional disaster relief agencies, such as the American Red Cross and the Adventist Development and Relief Agency, are also involved in response efforts. Recent examples have shown that these partnerships are often overwhelmed with the needs of large regions experiencing limited resources. Therefore, hospitals and local public health departments frequently must carry much of the immediate burden of stabilizing communities and coordinating response with government agencies and local partners.3
Role of Public Health and the CDC
Federal agencies and local public health departments have been given critical roles in planning and responding to disasters. In particular, the PHS focuses on population care and shapes how public health entities should respond to mass casualty events and pandemics, including local response coordination. The CDC is primarily responsible for assisting state and local governments with disaster response and recovery after a large-scale public health emergency.3 The CDC works closely with local public health departments in decision making; tracking the source, spread, and severity of health threats; assessing impacts; educating the public on how to safeguard their health; and implementing measures to protect the public. During a large-scale health emergency, the CDC also maintains and provides resources through the maintenance and distribution of the nation’s Strategic National Stockpile of medications and supplies that may be needed during events such as the recent 2009 H1N1 influenza outbreak or other public health emergencies.3
Role of Local Businesses and Professional Institutions
Nationally, businesses and professional institutions are coming together and organizing in such a way that places them as part of the solution. More specifically, the National Voluntary Organizations Active in Disaster and Community Organizations Active in Disaster have grown exponentially since September 11, 2001.4 These efforts include but are not limited to development of EP plans and the subsequent sharing of those plans, sharing of key assets critical to response activities, development of a community key asset database, and training/exercise participation.

Role of Hospitals
The Hospital Preparedness Program was developed to prepare the nation’s health care system to respond appropriately to mass casualty incidents, whether due to bioterrorism, natural disaster, or other public health emergencies. Health care systems must be able to develop a disaster medical capability that is rapid, flexible, sustainable, integrated, coordinated, and capable of providing appropriate care in the most ethical manner with the resources and capabilities it has at its disposal.3 Although involved as first responders, traditionally, medical care systems, hospitals, physicians, and pharmacists are faced with the dual task of individual patient care and are thus more limited as partners in an overall local response system.
Also vital to this discussion is the reality that hospital emergency departments (EDs) already routinely operate at or above capacity, limiting their ability to prepare for mass casualties due to a public health disaster. Hospitals continue to divert more than half a million ambulances per year due to ED overcrowding.3 How they could step up in a true emergency situation is questionable at best.
Role of First Responders
Individuals who respond immediately are referred to as first responders. First responders come in 2 archetypes: those who are there purely based on unexpected circumstances and take action and those who are trained first responders, such as firefighters, police officers, and emergency medical technicians (EMTs). These first responders are trained to partner with one another. Firefighters primarily handle fire rescue as well as assessing the extent of potential damage to the area. Law enforcement’s responsibility is to restore order after an emergency, whether it is a natural disaster, community disturbance, or outbreak of hazardous chemicals. An EMT’s role is to attend to the immediate medical care of patients who have been injured or become ill during the emergency.5
Related: Disaster Preparedness for Veterans With Dementia and Their Caregivers
There are occasions where other potential incident responders, such as health care professionals, can play a key role and yet are not integrated into the emergency response. The VHA needs to focus on this facet in order to more effectively respond to events that threaten lives, property, and current infrastructure of the veterans it serves.
Role of CBOCs and Private Physician Practices
Community-based outpatient clinics (CBOCs), including outpatient community health centers and private physician practices (PPPs), maintain and improve routine community health but are rarely involved in routine planning for disasters. They are, therefore, typically not open for business or may have limited hours as they recover from the event. This results in patients who do not have access to their primary care providers (PCPs) turning to EDs, which are already at capacity. As a result, in a disaster the costly and overburdened ED functions as the PCP site for even larger populations affected by a disaster, including those who are uninsured.6,7
Kahan and colleagues reported that two-thirds of patients preferred their family doctor or health care authorities as their first choice for care instead of receiving care in the ED.8 Researchers found that 89% of physicians in private practice felt it was their responsibility to treat, for example, patients infected with anthrax.8 Some argue that if PCPs are included in planning and appropriately trained in disaster preparedness, their attitudes and willingness to participate in emergency services would follow.9
Given the many challenges to disaster preparedness, CBOCs could be a critical partner in EM, and interest continues to grow to explore that role. Health professionals in CBOCs who are trained in disaster management (DM) could become active participants in early intervention to initiate the treatment of patients in rescue efforts during a disaster.10 For instance, a CBOC could triage patients in a postdisaster situation, thus limiting the burden on hospital EDs by evaluating populations at risk and providing them with important information when communication is difficult.
This already existing network of community-based triage stations would offer natural locations to assess the health needs of the population and determine their level of appropriate medical care. Additionally, these clinics can ensure continuation of basic services after initial medical care has been completed in the hospital setting.10 Because clinics have not been included in coordinated DM, there is scant literature that addresses their potential role in disaster response. Community-based outpatient clinics and PPPs are untapped resources; however, it is unknown whether medical staff in these medical clinics have the interest, training, knowledge, skills, and resources in DM or whether barriers to providing safe care can be overcome.10
Case Study
The VHA is the largest integrated health care system in the U.S. It is mandated to serve as a backup to the DoD during disasters, and VHA CBOCs can play an important role.11,12 The CBOCs are staffed with a medical director, nurse manager, and other clinical and support staff. As a study population, CBOCs are well suited to examine and explore staff attitudes and roles in DM. To date, no research reports have been found studying EP in CBOCs.
The purpose of this study was to learn how to best integrate the CBOCs into disaster response. This qualitative study aimed to answer 3 questions: (1) How do VA clinic personnel perceive their personal and their clinic’s risk, level of preparedness, role, and knowledge for an active response in a disaster; (2) What do VA clinic personnel perceive they need in order to function in a disaster; and (3) What resources are necessary for clinic staff to function competently in a disaster?
Methods
In this qualitative study, in-depth semistructured key informant (KI) interviews (N = 3) and focus group discussions (N = 20) guided by risk perception theory and the Andersen Behavioral Model of Health Services Use were conducted and analyzed using grounded theory methods to contextualize the potential of local clinics in disaster response.13-15 To optimize breadth of viewpoints on this issue, participants were selected by theoretical sampling methods to explore perceptions of leadership and line staff.

Study Location
Health care providers and support staff from 3 southern California CBOCs that are contracted by the local VA to provide primary care services (ie, internal medicine, geriatrics, women’s health, mental health, and some specialty care services) to veterans were recruited for this study. The CBOCs are generally connected with a VHA local hospital in their region, offer services 5 days a week, and are closed on weekends and federal holidays. Some VA CBOCs participate in telehealth remote services connected to their regional hospital to help manage their patient populations. The CBOCs are managed by a medical director and a clinic manager and report to their respective VISN, and each VISN reports to the VHA Central Office in Washington, DC.13,15 The CBOC staff includes physicians, nurse practitioners, physician assistants, registered nurses (RNs), licensed vocational nurses (LVNs), medical assistants, front office staff, social workers, case managers, counselors, pharmacists, and nonclinical staff.
In this case, the CBOCs are contracted by Loma Linda University Health to manage care of the veterans and agree to care for nonveterans in a disaster. The CBOCs contracted or not all fall under the criteria as set forth in VHA Handbook 1006.1. This handbook criteria indicate that CBOCs must maintain appropriate emergency response capability. Additionally, VHA Handbook 0320.1 states that the CBOC is responsible for developing, implementing, evaluating, and improving a CBOC Comprehensive Emergency Management Program (CEMP) and for participating in the VAMC Emergency Management Committee. The scope of the VISN-wide CEMP integrates VAMC and VISN EM programs to coordinate and enhance operations during planned and unplanned events.
Study Design and Sample
After receiving institutional review board approval, 3 in-depth semi-structured clinic leadership KI interviews and 3 clinic staff (RNs, LVNs, health technicians, and nursing assistants) focus group discussions (N = 20, 1 per CBOC) to follow up on information gleaned from the analyses of the initial KIs were conducted. To provide continuity, all were conducted by the same trained facilitator who used a semistructured KI outline with questions and probes based on the guiding study framework.
Data Collection and Content Analysis
Interviews and focus group discussions were audio recorded and transcribed verbatim and then analyzed using grounded theory methods. Line-by-line coding was done to develop an initial inductive codebook, which was then organized into final codes. Once the codebook was developed, it was applied to all transcripts.
Related: Pre-Storm Dialysis Saves Lives
Transcripts and resulting codes were reviewed 3 times by independent reviewers to validate data, ensure accuracy, and delete any information that might identify participants. Pseudonyms were used to represent the participants by perspective (eg, nurse, MD) to avoid confusion in data analysis. A 4-stage data analysis approach was used: (1) immersion in the raw data by listening to tapes and reading manuscripts and notes in order to list key ideas and recurrent themes using a constant comparison method; (2) indexing by applying the thematic framework systematically to the data using and seeking new, unanticipated emerging codes; (3) arranging the data in codes and concepts/themes that represent the thematic framework of EP in clinics; (4) identifying a thematic framework for EP using codes that identified key issues, concepts, and themes that can be referenced and derived from the text.
Results
The Table describes the 4 primary emerging themes and corresponding quotes: (1) EP barriers, including lack of direction, training, and tools, which would result in negative outcomes; (2) perceived personal and clinic risk for a disaster, including negative outcomes and personal family safety; (3) perceptions of roles and responsibilities in EP, including intent to participate in DM at various staffing levels as well as patient expectations for care; and (4) existing resources that influence EP and the ability to survive a disaster collectively.
Emergency preparedness barriers. Although most respondents realized their potentially critical role in an emergency, they expressed recurrent barrier themes centered on their perceived lack of training, lack of tools to function, and lack of direction to be effective in a disaster response. Lack of knowledge of EP was identified as a great need by multiple participants. One participant stated, “Lack of information is so destructive. If you don’t know how to keep yourself from those things you don’t know…such as in a situation that’s going to be tragic, it is because of a lack of information or a lack of training. And I see that so many times…Mandate that we do our classes, so we know what we’re doing.” Another stated in reference to lack of skills, “I haven’t experienced any drills or anything like that. So I know what is going to happen here.”
Lack of abilities to communicate with key DM players also were identified. For example, “Downed power lines may result in no telephone connection to communicate next steps for critical issues, such as if evacuation of the clinic is required.” Another respondent indicated, “We need backup communication...devices, wind-up radios, or whatever.”
Lack of a clear disaster plan was also identified. Questions arose centered on details—how to actually implement a clinic response plan, including concerns that there were none, as the respondents “had not seen the plan in a couple of years” and were not sure who really was in charge of giving directions. Lack of community/organizational support voiced included aspects such as interdepartmental, facility, and community resource connectedness. There was acknowledgement that department assets should be clearly identified so that resource sharing might be used as part of the plan.
Last, regarding lack of resources, one participant said, “We don’t have the resources. We don’t have gurneys. We don’t have enough wheel chairs….We don’t have a crash cart. We don’t have the triage tarps or whatever for the triage of people; we don’t have any supplies to supply the energy room for diabetics, like what they have in the ER.”
Perceived personal and clinic risk for a disaster. Participants stated they felt at risk for natural disasters, including fire, floods, and earthquakes, but expressed concerns and even more fears about how they would handle a response to bombings, spills of hazardous materials, airplane accidents, and gunfire, which also qualify as disasters but are much harder to prepare for, because they could be so varied. One participated stated, “They are so unpredictable whether it is an earthquake or a fire…they are unpredictable….We see planes that fly close to our window and we wonder about the possibility of a crash—you never know.”
Many staff members expressed fear of what these disasters would mean to them in the clinic and to their patients. Another comment shared was, “I don’t think anybody really thinks about this kind of stuff until it happens and then it is too late…If we had just done this or that or knew how to do this or that then…” The biggest fear expressed was that of a massive earthquake in which there would be power outages and resulting fires, blocked building exits, and no way to get to evacuation areas. Fears expressed included working with people who are dying and trying to get the patients down the stairs and out of the disaster area.
Personal safety in a disaster was also a concern; a nurse stated, “Your personal safety is a priority. Yourself, that is first, if you are not safe, you can’t do any good to anyone else.” Another shared concern was the safety of family members during a disaster and conflicting obligations between duties at work and protecting family members. Participants felt they would want to be at home with their families.
Perceptions of roles and responsibilities in EP. Supervisors of the clinics shared that their primary responsibility is to the staff and their current patients; ensuring their safety was a top priority. Their knowledge, skills, and available resources were crucial to their duties, including establishing methods of communication outside the clinic for advice and direction, such as notifying the power company and other outside agencies of the condition of the clinic. They felt that their duties included making sure generators were working, ensuring telephones and lighting were available, and advising staff when to leave the building. One manager stated that more EP discussions need to happen in order to determine how to react: “...in event of a disaster it is important to control patient flow, staffing the clinic appropriately and managing the employees.” They felt a need to help empower their staff by making sure staff were trained in EP tasks and that they could complete the tasks they were required to perform.
Staff consistently reported that the doctors were in charge of providing direction concerning activities and care of the patients. However, most were able to identify their own role in helping preserve lives and keeping the patients and other staff safe. One nurse stated, “My job would be to evacuate the physicians’ offices, to make sure they are aware of the disaster, get them out safely, put an X on their door, keep the patients calm and guide them out to the designated area, then look out for medics or other help so that they would be directed to the correct locations.” Another staff nurse stated, “My role is to check the bathrooms and then under the direction of the physician assist in the care of patient injuries.”
When asked about the expectations of patients for care during a disaster, staff consistently stated that patients and their families would want to get care and direction from clinic staff who knew them instead of going to the hospital for care. Staff anticipated that patients would be calling the clinic first to discuss their medical problems. One stated, “The veterans would head to us…. We can’t turn them away.” Some staff indicated that some patients might have to go to the ED for care instead of coming to the clinic, because the clinic may not be equipped to respond, noting that “we have to remind [the patients] that in our clinic we have minimal abilities.”
Existing resources. Consistently, the respondents verbalized the importance of acquiring knowledge and skills and using available resources in their disaster plan. They felt that training was critical and that it needed to be simple and uncomplicated. Many felt that they did not have sufficient drills to maintain their knowledge and skills for all types of events. One nursing assistant stated he had extensive training in the military in DM, but clinics did not have sufficient training and were not prepared to handle multiple casualties. Others stated that it would be important for training to be “second nature” so they would not have to think much about it, with everyone pulling together and performing tasks seamlessly. However, some stated that they did not know what to do in an emergency.
Critical resources noted were access to emergency power sources, transistor radios, telephone and communication, 911 services, backup phone services, computers, and text pagers and cell phones so that connections could be made outside the clinic setting. Other critical resources needed included medical supplies and access to food for 1 week.
Finally, teamwork was identified as a critical factor for success. One example involved the clinic responding to a severe snowstorm; the medical director, lead nurse, and support staff agreed to remain on site to assist with any patients who needed help. “We shared our 4-wheel drive trucks to get around, and others called patients, advising them of storm conditions and what to do to maintain care at home and canceled appointments scheduled for that day.” They were very proud of the way they had pooled their resources to support each other and their patients.
Based on these emerging themes and the inquiry guiding theories, a theoretical framework was proposed on how contributing factors influenced the process by which CBOC staff viewed their roles and the likelihood that they would participate in a disaster plan (Figure). The framework suggests that personal risks and perceived personal and clinic readiness to respond to an emergency were critical barriers to staff willingness to get involved in preparedness, whereas they saw the provision of training and resources as necessary to increase their resilience and ability to function in a disaster.
Clearly addressing barriers through training, planning, ensuring that resources functioned effectively in a disaster, and clarifying roles and responsibilities, combined with promoting personal and clinic readiness facilitated staff EP participation.
Discussion
This qualitative study explored issues surrounding the role of CBOCs in EP and how risk perception and enabling factors contributed to staff intent to participate in DM. As in many qualitative studies, findings were somewhat limited by an overall small sample size (N = 23) across 3 CBOCs in southern California. However, given the lack of available literature, the authors believe that this study helped provide critical insight into CBOC clinic staff’s willingness and readiness to be active in disaster response. The study clearly points to clinic staff’s openness to actively take part in regional disaster response and calls for better and more standardized approaches to EP and DM planning that include local CBOCs. The authors identified factors that contribute to staff intent to participate in DM and the need to reduce barriers that hinder participation.
In general, clinic staff who reported feeling inadequately prepared for disasters (ie, felt more vulnerable) and staff with firsthand disaster experience were more inclined to prepare than were those without experience. Without clearly spelled-out expectations, staff tend to depend and wait on others to lead in a disaster. They noted a desire for better preparation and thus, clarity of roles, need for a reliable method of communication with the outside world during a disaster, and the required equipment and supplies for self-care or care of the patients for ≥ 3 days post disaster. Some indicated that they did not have the resources to provide medical care on the scale that may be required.
Many did not have a clear understanding of an all-hazard approach plan and had not been involved in hazard assessments. Already tightly staffed for personal health care delivery, staff spent minimal time and energy thinking about the risk of a disaster or preparing for one. However, there seemed to be a direct relationship between the attitude of the supervisor and the attitudes of clinic staff to EP. Although these qualitative results are encouraging and point to these clinics as an important undertapped resource for EP, further quantitative studies should expand this inquiry.
Lessons learned from this study include the need to expand qualitative data collection to include a larger sample size to retrieve information that would contribute to a better understanding of how staff view their roles in DM. There are 152 VAMCs and hundreds of associated CBOCs that should be queried as to their EM readiness. Also, replicating this study in non-VHA clinics, such as private CBOCs and PPPs, might bring greater insight into what is needed to involve them in DM plans. Finally, future studies should determine clearer criteria when care can be provided at a clinic and when it would be appropriate for the patient to report at their local ED.
Conclusions and Recommendations
Given the VHA EP mandate, the authors recommend the following steps to address barriers identified in this study: (1) Develop a more structured approach to DM in a CBOC setting to provide staff with a clear understanding of their roles and responsibilities; (2) Conduct a comprehensive assessment of each clinic to determine staff knowledge, skills, and resources required to provide EP and institute a DM training curriculum; (3) Provide clinic leadership with direction on developing a disaster plan as well as how to partner with their primary and local VA health care system, especially onsite physicians, to provide effective DM leadership; (4) Recruit staff into routine drills for natural disasters and expand to an all-hazard approach to manmade disasters to identify gaps in delivering DM in a disaster; (5) Facilitate partnerships and a standardized approach to DM between CBOCs within the VISN by scheduling routine video and teleconferencing, live meetings, and webinars so that procedures and language are clearly understood and communicated between facilities; and (6) Identify key barriers to clinic preparedness by assessing EP elements through mock disaster drills and offer solutions to fill DM gaps.
The authors also recommend that CBOCs should be included in community DM and EP plans in order to understand how to integrate resources in a disaster. Networking, planning, and interdisciplinary staff training between agencies to include CBOCs will bring a wealth of information of what CBOCs require to participate effectively in DM. Lessons learned from these partnerships can provide valuable information to facilitate resource allocation for acute care hospitals, which may be burdened with treating patients with minor medical issues when they should be focusing on providing care to those with catastrophic medical conditions.
Acknowledgments
This study and this material is the result of work supported with resources and the use of facilities at the VA Loma Linda Health Care System. Research in this publication was in part supported by the National Institute on Minority Health and Health Disparities of the National Institutes of Health under award number P20MD006988.
Author disclosures
The authors report no actual or potential conflicts of interest with regard to this article.
Disclaimer
The opinions expressed herein are those of the authors and do not necessarily reflect those of Federal Practitioner, Frontline Medical Communications Inc., the U.S. Government, or any of its agencies. This article may discuss unlabeled or investigational use of certain drugs. Please review complete prescribing information for specific drugs or drug combinations—including indications, contraindications, warnings, and adverse effects—before administering pharmacologic therapy to patients.
1. McNeill JB, Carafano JJ, Mayer MA, Weitz R. Accepting disaster relief from nations: lessons from Katrina and Gulf oil spill. The Heritage Foundation Website. http://www.heritage.org/research/reports/2011/02/accepting-disaster-relief-from-other-nations-lessons-from-katrina-and-the-gulf-oil-spill. Published February 17, 2011. Accessed July 16, 2015.
2. Haddow GD, Bullock JA. Introduction to Emergency Management. 2nd ed. Burlington, MA: Butterworth-Heinemann; 2006.
3. Institute of Medicine. Medical Surge Capacity: Workshop Summary. Washington, DC: The National Academies Press; 2010.
4. National Voluntary Organizations Active in Disasters. Federal Emergency Management Agency Website. http://www.ready.gov/voluntary-organizations-active-disaster. Updated June 19, 2014. Accessed July 10, 2015.
5. What is the role of police, fire and EMS after a natural disaster strikes? Galls Website. http://gallsblog.com/2011/08/29/what-is-the-role-of-police-fire-and-ems-after-a-natural-disaster-strikes. Published August 29, 2011. Accessed July 14, 2015.
6. Hogan DE, Waeckerle JF, Dire DJ, Lillibridge SR. Emergency department impact of the Oklahoma City terrorist bombing. Ann Emerg Med. 1999;34(2):160-167.
7. Carlson JN, Menegazzi JJ, Callaway CW. Magnitude of national ED visits and resource utilization by the uninsured. Am J Emerg Med. 2013;31(4):722-726.
8. Kahan E, Fogelman Y, Kitai E, Vinker S. Patient and family physician p for care and communication in the eventuality of anthrax terrorism. Fam Pract. 2003;20(4):441-442.
9. Chen FM, Hickner J, Fink KS, Galliher JM, Burstin H. On the front lines: family physicians’ preparedness for bioterrorism. J Fam Pract. 2002;51(9):745-750.
10. Wood K. Community health centers: the untapped resource for public health and medical preparedness. Homeland Secur Aff. 2009;5(8):113.
11. Koenig KL. Homeland security and public health: role of the Department of Veterans Affairs, the US Department of Homeland Security, and implications for the public health community. Prehosp Disaster Med. 2003;18(4):327-333.
12. Panangala SV, Mendez BHP. Veterans Health Administration: Community-Based Outpatient Clinics. Washington, DC: Library of Congress, Congressional Research Service; 2010.
13. Tashakkori A, Teddlie C, eds. Handbook of Mixed Methods in Social & Behavioral Research. Thousand Oaks, CA: Sage Publications, Inc.; 2003.
14. Barnett DJ, Balicer RD, Blodgett DW, et al. Applying risk perception theory to public health workforce preparedness training. J Public Health Manag Pract. 2005;Suppl:33-37.
15. Andersen RM. Revisiting the behavioral model and access to medical care: does it matter? J Health Soc Behav. 1995;36(1):1-10.
Recently, the U.S. Department of Homeland Security redefined disasters into 4 types: natural hazards, societal hazards, technologic hazards, and terrorism. The incidence of manmade and natural disasters is on the rise in intensity and frequency globally. Recent events such as tornadoes and hurricanes in the southeastern U.S., tsunamis in Japan, earthquakes in Haiti, wild fires, heat waves, and terrorist attacks like that of September 11, 2001, underscore the urgency of developing and maintaining solid local public health disaster response plans to minimize mortality and morbidity.
The 2010 BP oil spill in the Gulf of Mexico, the largest in history, hurricane Katrina, and the lingering impact of hurricane Sandy on the East Coast further raise concerns about our communities’ ability to handle disasters, especially in the early hours after events, when federally coordinated help is being organized and not yet fully available locally or from other nations.1 The recent fertilizer plant explosion in West Texas, the 2013 Boston marathon bombing, and the Newtown, Connecticut, massacre remind us of the unpredictable nature of both manmade and natural disasters.
Coordinated Response
Regardless of its origin, residents expect a coordinated local response during an emergency, and it is important that government agencies meet this expectation. Fulfilling these expectations, however, takes many partners, and it is important to have a clear idea of who is involved in emergency preparedness (EP) and the response of each partner’s role.
Role of Government
Federal, state, and local governments have a critical role in emergency management (EM). When state government, local government, or an individual entity is overwhelmed with a disaster, the role of the Federal Emergency Management Agency is to provide assistance and resources to cope with the emergency.2 Private industry and traditional disaster relief agencies, such as the American Red Cross and the Adventist Development and Relief Agency, are also involved in response efforts. Recent examples have shown that these partnerships are often overwhelmed with the needs of large regions experiencing limited resources. Therefore, hospitals and local public health departments frequently must carry much of the immediate burden of stabilizing communities and coordinating response with government agencies and local partners.3
Role of Public Health and the CDC
Federal agencies and local public health departments have been given critical roles in planning and responding to disasters. In particular, the PHS focuses on population care and shapes how public health entities should respond to mass casualty events and pandemics, including local response coordination. The CDC is primarily responsible for assisting state and local governments with disaster response and recovery after a large-scale public health emergency.3 The CDC works closely with local public health departments in decision making; tracking the source, spread, and severity of health threats; assessing impacts; educating the public on how to safeguard their health; and implementing measures to protect the public. During a large-scale health emergency, the CDC also maintains and provides resources through the maintenance and distribution of the nation’s Strategic National Stockpile of medications and supplies that may be needed during events such as the recent 2009 H1N1 influenza outbreak or other public health emergencies.3
Role of Local Businesses and Professional Institutions
Nationally, businesses and professional institutions are coming together and organizing in such a way that places them as part of the solution. More specifically, the National Voluntary Organizations Active in Disaster and Community Organizations Active in Disaster have grown exponentially since September 11, 2001.4 These efforts include but are not limited to development of EP plans and the subsequent sharing of those plans, sharing of key assets critical to response activities, development of a community key asset database, and training/exercise participation.
Role of Hospitals
The Hospital Preparedness Program was developed to prepare the nation’s health care system to respond appropriately to mass casualty incidents, whether due to bioterrorism, natural disaster, or other public health emergencies. Health care systems must be able to develop a disaster medical capability that is rapid, flexible, sustainable, integrated, coordinated, and capable of providing appropriate care in the most ethical manner with the resources and capabilities it has at its disposal.3 Although involved as first responders, traditionally, medical care systems, hospitals, physicians, and pharmacists are faced with the dual task of individual patient care and are thus more limited as partners in an overall local response system.
Also vital to this discussion is the reality that hospital emergency departments (EDs) already routinely operate at or above capacity, limiting their ability to prepare for mass casualties due to a public health disaster. Hospitals continue to divert more than half a million ambulances per year due to ED overcrowding.3 How they could step up in a true emergency situation is questionable at best.
Role of First Responders
Individuals who respond immediately are referred to as first responders. First responders come in 2 archetypes: those who are there purely based on unexpected circumstances and take action and those who are trained first responders, such as firefighters, police officers, and emergency medical technicians (EMTs). These first responders are trained to partner with one another. Firefighters primarily handle fire rescue as well as assessing the extent of potential damage to the area. Law enforcement’s responsibility is to restore order after an emergency, whether it is a natural disaster, community disturbance, or outbreak of hazardous chemicals. An EMT’s role is to attend to the immediate medical care of patients who have been injured or become ill during the emergency.5
Related: Disaster Preparedness for Veterans With Dementia and Their Caregivers
There are occasions where other potential incident responders, such as health care professionals, can play a key role and yet are not integrated into the emergency response. The VHA needs to focus on this facet in order to more effectively respond to events that threaten lives, property, and current infrastructure of the veterans it serves.
Role of CBOCs and Private Physician Practices
Community-based outpatient clinics (CBOCs), including outpatient community health centers and private physician practices (PPPs), maintain and improve routine community health but are rarely involved in routine planning for disasters. They are, therefore, typically not open for business or may have limited hours as they recover from the event. This results in patients who do not have access to their primary care providers (PCPs) turning to EDs, which are already at capacity. As a result, in a disaster the costly and overburdened ED functions as the PCP site for even larger populations affected by a disaster, including those who are uninsured.6,7
Kahan and colleagues reported that two-thirds of patients preferred their family doctor or health care authorities as their first choice for care instead of receiving care in the ED.8 Researchers found that 89% of physicians in private practice felt it was their responsibility to treat, for example, patients infected with anthrax.8 Some argue that if PCPs are included in planning and appropriately trained in disaster preparedness, their attitudes and willingness to participate in emergency services would follow.9
Given the many challenges to disaster preparedness, CBOCs could be a critical partner in EM, and interest continues to grow to explore that role. Health professionals in CBOCs who are trained in disaster management (DM) could become active participants in early intervention to initiate the treatment of patients in rescue efforts during a disaster.10 For instance, a CBOC could triage patients in a postdisaster situation, thus limiting the burden on hospital EDs by evaluating populations at risk and providing them with important information when communication is difficult.
This already existing network of community-based triage stations would offer natural locations to assess the health needs of the population and determine their level of appropriate medical care. Additionally, these clinics can ensure continuation of basic services after initial medical care has been completed in the hospital setting.10 Because clinics have not been included in coordinated DM, there is scant literature that addresses their potential role in disaster response. Community-based outpatient clinics and PPPs are untapped resources; however, it is unknown whether medical staff in these medical clinics have the interest, training, knowledge, skills, and resources in DM or whether barriers to providing safe care can be overcome.10
Case Study
The VHA is the largest integrated health care system in the U.S. It is mandated to serve as a backup to the DoD during disasters, and VHA CBOCs can play an important role.11,12 The CBOCs are staffed with a medical director, nurse manager, and other clinical and support staff. As a study population, CBOCs are well suited to examine and explore staff attitudes and roles in DM. To date, no research reports have been found studying EP in CBOCs.
The purpose of this study was to learn how to best integrate the CBOCs into disaster response. This qualitative study aimed to answer 3 questions: (1) How do VA clinic personnel perceive their personal and their clinic’s risk, level of preparedness, role, and knowledge for an active response in a disaster; (2) What do VA clinic personnel perceive they need in order to function in a disaster; and (3) What resources are necessary for clinic staff to function competently in a disaster?
Methods
In this qualitative study, in-depth semistructured key informant (KI) interviews (N = 3) and focus group discussions (N = 20) guided by risk perception theory and the Andersen Behavioral Model of Health Services Use were conducted and analyzed using grounded theory methods to contextualize the potential of local clinics in disaster response.13-15 To optimize breadth of viewpoints on this issue, participants were selected by theoretical sampling methods to explore perceptions of leadership and line staff.
Study Location
Health care providers and support staff from 3 southern California CBOCs that are contracted by the local VA to provide primary care services (ie, internal medicine, geriatrics, women’s health, mental health, and some specialty care services) to veterans were recruited for this study. The CBOCs are generally connected with a VHA local hospital in their region, offer services 5 days a week, and are closed on weekends and federal holidays. Some VA CBOCs participate in telehealth remote services connected to their regional hospital to help manage their patient populations. The CBOCs are managed by a medical director and a clinic manager and report to their respective VISN, and each VISN reports to the VHA Central Office in Washington, DC.13,15 The CBOC staff includes physicians, nurse practitioners, physician assistants, registered nurses (RNs), licensed vocational nurses (LVNs), medical assistants, front office staff, social workers, case managers, counselors, pharmacists, and nonclinical staff.
In this case, the CBOCs are contracted by Loma Linda University Health to manage care of the veterans and agree to care for nonveterans in a disaster. The CBOCs contracted or not all fall under the criteria as set forth in VHA Handbook 1006.1. This handbook criteria indicate that CBOCs must maintain appropriate emergency response capability. Additionally, VHA Handbook 0320.1 states that the CBOC is responsible for developing, implementing, evaluating, and improving a CBOC Comprehensive Emergency Management Program (CEMP) and for participating in the VAMC Emergency Management Committee. The scope of the VISN-wide CEMP integrates VAMC and VISN EM programs to coordinate and enhance operations during planned and unplanned events.
Study Design and Sample
After receiving institutional review board approval, 3 in-depth semi-structured clinic leadership KI interviews and 3 clinic staff (RNs, LVNs, health technicians, and nursing assistants) focus group discussions (N = 20, 1 per CBOC) to follow up on information gleaned from the analyses of the initial KIs were conducted. To provide continuity, all were conducted by the same trained facilitator who used a semistructured KI outline with questions and probes based on the guiding study framework.
Data Collection and Content Analysis
Interviews and focus group discussions were audio recorded and transcribed verbatim and then analyzed using grounded theory methods. Line-by-line coding was done to develop an initial inductive codebook, which was then organized into final codes. Once the codebook was developed, it was applied to all transcripts.
Related: Pre-Storm Dialysis Saves Lives
Transcripts and resulting codes were reviewed 3 times by independent reviewers to validate data, ensure accuracy, and delete any information that might identify participants. Pseudonyms were used to represent the participants by perspective (eg, nurse, MD) to avoid confusion in data analysis. A 4-stage data analysis approach was used: (1) immersion in the raw data by listening to tapes and reading manuscripts and notes in order to list key ideas and recurrent themes using a constant comparison method; (2) indexing by applying the thematic framework systematically to the data using and seeking new, unanticipated emerging codes; (3) arranging the data in codes and concepts/themes that represent the thematic framework of EP in clinics; (4) identifying a thematic framework for EP using codes that identified key issues, concepts, and themes that can be referenced and derived from the text.
Results
The Table describes the 4 primary emerging themes and corresponding quotes: (1) EP barriers, including lack of direction, training, and tools, which would result in negative outcomes; (2) perceived personal and clinic risk for a disaster, including negative outcomes and personal family safety; (3) perceptions of roles and responsibilities in EP, including intent to participate in DM at various staffing levels as well as patient expectations for care; and (4) existing resources that influence EP and the ability to survive a disaster collectively.
Emergency preparedness barriers. Although most respondents realized their potentially critical role in an emergency, they expressed recurrent barrier themes centered on their perceived lack of training, lack of tools to function, and lack of direction to be effective in a disaster response. Lack of knowledge of EP was identified as a great need by multiple participants. One participant stated, “Lack of information is so destructive. If you don’t know how to keep yourself from those things you don’t know…such as in a situation that’s going to be tragic, it is because of a lack of information or a lack of training. And I see that so many times…Mandate that we do our classes, so we know what we’re doing.” Another stated in reference to lack of skills, “I haven’t experienced any drills or anything like that. So I know what is going to happen here.”
Lack of abilities to communicate with key DM players also were identified. For example, “Downed power lines may result in no telephone connection to communicate next steps for critical issues, such as if evacuation of the clinic is required.” Another respondent indicated, “We need backup communication...devices, wind-up radios, or whatever.”
Lack of a clear disaster plan was also identified. Questions arose centered on details—how to actually implement a clinic response plan, including concerns that there were none, as the respondents “had not seen the plan in a couple of years” and were not sure who really was in charge of giving directions. Lack of community/organizational support voiced included aspects such as interdepartmental, facility, and community resource connectedness. There was acknowledgement that department assets should be clearly identified so that resource sharing might be used as part of the plan.
Last, regarding lack of resources, one participant said, “We don’t have the resources. We don’t have gurneys. We don’t have enough wheel chairs….We don’t have a crash cart. We don’t have the triage tarps or whatever for the triage of people; we don’t have any supplies to supply the energy room for diabetics, like what they have in the ER.”
Perceived personal and clinic risk for a disaster. Participants stated they felt at risk for natural disasters, including fire, floods, and earthquakes, but expressed concerns and even more fears about how they would handle a response to bombings, spills of hazardous materials, airplane accidents, and gunfire, which also qualify as disasters but are much harder to prepare for, because they could be so varied. One participated stated, “They are so unpredictable whether it is an earthquake or a fire…they are unpredictable….We see planes that fly close to our window and we wonder about the possibility of a crash—you never know.”
Many staff members expressed fear of what these disasters would mean to them in the clinic and to their patients. Another comment shared was, “I don’t think anybody really thinks about this kind of stuff until it happens and then it is too late…If we had just done this or that or knew how to do this or that then…” The biggest fear expressed was that of a massive earthquake in which there would be power outages and resulting fires, blocked building exits, and no way to get to evacuation areas. Fears expressed included working with people who are dying and trying to get the patients down the stairs and out of the disaster area.
Personal safety in a disaster was also a concern; a nurse stated, “Your personal safety is a priority. Yourself, that is first, if you are not safe, you can’t do any good to anyone else.” Another shared concern was the safety of family members during a disaster and conflicting obligations between duties at work and protecting family members. Participants felt they would want to be at home with their families.
Perceptions of roles and responsibilities in EP. Supervisors of the clinics shared that their primary responsibility is to the staff and their current patients; ensuring their safety was a top priority. Their knowledge, skills, and available resources were crucial to their duties, including establishing methods of communication outside the clinic for advice and direction, such as notifying the power company and other outside agencies of the condition of the clinic. They felt that their duties included making sure generators were working, ensuring telephones and lighting were available, and advising staff when to leave the building. One manager stated that more EP discussions need to happen in order to determine how to react: “...in event of a disaster it is important to control patient flow, staffing the clinic appropriately and managing the employees.” They felt a need to help empower their staff by making sure staff were trained in EP tasks and that they could complete the tasks they were required to perform.
Staff consistently reported that the doctors were in charge of providing direction concerning activities and care of the patients. However, most were able to identify their own role in helping preserve lives and keeping the patients and other staff safe. One nurse stated, “My job would be to evacuate the physicians’ offices, to make sure they are aware of the disaster, get them out safely, put an X on their door, keep the patients calm and guide them out to the designated area, then look out for medics or other help so that they would be directed to the correct locations.” Another staff nurse stated, “My role is to check the bathrooms and then under the direction of the physician assist in the care of patient injuries.”
When asked about the expectations of patients for care during a disaster, staff consistently stated that patients and their families would want to get care and direction from clinic staff who knew them instead of going to the hospital for care. Staff anticipated that patients would be calling the clinic first to discuss their medical problems. One stated, “The veterans would head to us…. We can’t turn them away.” Some staff indicated that some patients might have to go to the ED for care instead of coming to the clinic, because the clinic may not be equipped to respond, noting that “we have to remind [the patients] that in our clinic we have minimal abilities.”
Existing resources. Consistently, the respondents verbalized the importance of acquiring knowledge and skills and using available resources in their disaster plan. They felt that training was critical and that it needed to be simple and uncomplicated. Many felt that they did not have sufficient drills to maintain their knowledge and skills for all types of events. One nursing assistant stated he had extensive training in the military in DM, but clinics did not have sufficient training and were not prepared to handle multiple casualties. Others stated that it would be important for training to be “second nature” so they would not have to think much about it, with everyone pulling together and performing tasks seamlessly. However, some stated that they did not know what to do in an emergency.
Critical resources noted were access to emergency power sources, transistor radios, telephone and communication, 911 services, backup phone services, computers, and text pagers and cell phones so that connections could be made outside the clinic setting. Other critical resources needed included medical supplies and access to food for 1 week.
Finally, teamwork was identified as a critical factor for success. One example involved the clinic responding to a severe snowstorm; the medical director, lead nurse, and support staff agreed to remain on site to assist with any patients who needed help. “We shared our 4-wheel drive trucks to get around, and others called patients, advising them of storm conditions and what to do to maintain care at home and canceled appointments scheduled for that day.” They were very proud of the way they had pooled their resources to support each other and their patients.
Based on these emerging themes and the inquiry guiding theories, a theoretical framework was proposed on how contributing factors influenced the process by which CBOC staff viewed their roles and the likelihood that they would participate in a disaster plan (Figure). The framework suggests that personal risks and perceived personal and clinic readiness to respond to an emergency were critical barriers to staff willingness to get involved in preparedness, whereas they saw the provision of training and resources as necessary to increase their resilience and ability to function in a disaster.
Clearly addressing barriers through training, planning, ensuring that resources functioned effectively in a disaster, and clarifying roles and responsibilities, combined with promoting personal and clinic readiness facilitated staff EP participation.
Discussion
This qualitative study explored issues surrounding the role of CBOCs in EP and how risk perception and enabling factors contributed to staff intent to participate in DM. As in many qualitative studies, findings were somewhat limited by an overall small sample size (N = 23) across 3 CBOCs in southern California. However, given the lack of available literature, the authors believe that this study helped provide critical insight into CBOC clinic staff’s willingness and readiness to be active in disaster response. The study clearly points to clinic staff’s openness to actively take part in regional disaster response and calls for better and more standardized approaches to EP and DM planning that include local CBOCs. The authors identified factors that contribute to staff intent to participate in DM and the need to reduce barriers that hinder participation.
In general, clinic staff who reported feeling inadequately prepared for disasters (ie, felt more vulnerable) and staff with firsthand disaster experience were more inclined to prepare than were those without experience. Without clearly spelled-out expectations, staff tend to depend and wait on others to lead in a disaster. They noted a desire for better preparation and thus, clarity of roles, need for a reliable method of communication with the outside world during a disaster, and the required equipment and supplies for self-care or care of the patients for ≥ 3 days post disaster. Some indicated that they did not have the resources to provide medical care on the scale that may be required.
Many did not have a clear understanding of an all-hazard approach plan and had not been involved in hazard assessments. Already tightly staffed for personal health care delivery, staff spent minimal time and energy thinking about the risk of a disaster or preparing for one. However, there seemed to be a direct relationship between the attitude of the supervisor and the attitudes of clinic staff to EP. Although these qualitative results are encouraging and point to these clinics as an important undertapped resource for EP, further quantitative studies should expand this inquiry.
Lessons learned from this study include the need to expand qualitative data collection to include a larger sample size to retrieve information that would contribute to a better understanding of how staff view their roles in DM. There are 152 VAMCs and hundreds of associated CBOCs that should be queried as to their EM readiness. Also, replicating this study in non-VHA clinics, such as private CBOCs and PPPs, might bring greater insight into what is needed to involve them in DM plans. Finally, future studies should determine clearer criteria when care can be provided at a clinic and when it would be appropriate for the patient to report at their local ED.
Conclusions and Recommendations
Given the VHA EP mandate, the authors recommend the following steps to address barriers identified in this study: (1) Develop a more structured approach to DM in a CBOC setting to provide staff with a clear understanding of their roles and responsibilities; (2) Conduct a comprehensive assessment of each clinic to determine staff knowledge, skills, and resources required to provide EP and institute a DM training curriculum; (3) Provide clinic leadership with direction on developing a disaster plan as well as how to partner with their primary and local VA health care system, especially onsite physicians, to provide effective DM leadership; (4) Recruit staff into routine drills for natural disasters and expand to an all-hazard approach to manmade disasters to identify gaps in delivering DM in a disaster; (5) Facilitate partnerships and a standardized approach to DM between CBOCs within the VISN by scheduling routine video and teleconferencing, live meetings, and webinars so that procedures and language are clearly understood and communicated between facilities; and (6) Identify key barriers to clinic preparedness by assessing EP elements through mock disaster drills and offer solutions to fill DM gaps.
The authors also recommend that CBOCs should be included in community DM and EP plans in order to understand how to integrate resources in a disaster. Networking, planning, and interdisciplinary staff training between agencies to include CBOCs will bring a wealth of information of what CBOCs require to participate effectively in DM. Lessons learned from these partnerships can provide valuable information to facilitate resource allocation for acute care hospitals, which may be burdened with treating patients with minor medical issues when they should be focusing on providing care to those with catastrophic medical conditions.
Acknowledgments
This study and this material is the result of work supported with resources and the use of facilities at the VA Loma Linda Health Care System. Research in this publication was in part supported by the National Institute on Minority Health and Health Disparities of the National Institutes of Health under award number P20MD006988.
Author disclosures
The authors report no actual or potential conflicts of interest with regard to this article.
Disclaimer
The opinions expressed herein are those of the authors and do not necessarily reflect those of Federal Practitioner, Frontline Medical Communications Inc., the U.S. Government, or any of its agencies. This article may discuss unlabeled or investigational use of certain drugs. Please review complete prescribing information for specific drugs or drug combinations—including indications, contraindications, warnings, and adverse effects—before administering pharmacologic therapy to patients.
1. McNeill JB, Carafano JJ, Mayer MA, Weitz R. Accepting disaster relief from nations: lessons from Katrina and Gulf oil spill. The Heritage Foundation Website. http://www.heritage.org/research/reports/2011/02/accepting-disaster-relief-from-other-nations-lessons-from-katrina-and-the-gulf-oil-spill. Published February 17, 2011. Accessed July 16, 2015.
2. Haddow GD, Bullock JA. Introduction to Emergency Management. 2nd ed. Burlington, MA: Butterworth-Heinemann; 2006.
3. Institute of Medicine. Medical Surge Capacity: Workshop Summary. Washington, DC: The National Academies Press; 2010.
4. National Voluntary Organizations Active in Disasters. Federal Emergency Management Agency Website. http://www.ready.gov/voluntary-organizations-active-disaster. Updated June 19, 2014. Accessed July 10, 2015.
5. What is the role of police, fire and EMS after a natural disaster strikes? Galls Website. http://gallsblog.com/2011/08/29/what-is-the-role-of-police-fire-and-ems-after-a-natural-disaster-strikes. Published August 29, 2011. Accessed July 14, 2015.
6. Hogan DE, Waeckerle JF, Dire DJ, Lillibridge SR. Emergency department impact of the Oklahoma City terrorist bombing. Ann Emerg Med. 1999;34(2):160-167.
7. Carlson JN, Menegazzi JJ, Callaway CW. Magnitude of national ED visits and resource utilization by the uninsured. Am J Emerg Med. 2013;31(4):722-726.
8. Kahan E, Fogelman Y, Kitai E, Vinker S. Patient and family physician p for care and communication in the eventuality of anthrax terrorism. Fam Pract. 2003;20(4):441-442.
9. Chen FM, Hickner J, Fink KS, Galliher JM, Burstin H. On the front lines: family physicians’ preparedness for bioterrorism. J Fam Pract. 2002;51(9):745-750.
10. Wood K. Community health centers: the untapped resource for public health and medical preparedness. Homeland Secur Aff. 2009;5(8):113.
11. Koenig KL. Homeland security and public health: role of the Department of Veterans Affairs, the US Department of Homeland Security, and implications for the public health community. Prehosp Disaster Med. 2003;18(4):327-333.
12. Panangala SV, Mendez BHP. Veterans Health Administration: Community-Based Outpatient Clinics. Washington, DC: Library of Congress, Congressional Research Service; 2010.
13. Tashakkori A, Teddlie C, eds. Handbook of Mixed Methods in Social & Behavioral Research. Thousand Oaks, CA: Sage Publications, Inc.; 2003.
14. Barnett DJ, Balicer RD, Blodgett DW, et al. Applying risk perception theory to public health workforce preparedness training. J Public Health Manag Pract. 2005;Suppl:33-37.
15. Andersen RM. Revisiting the behavioral model and access to medical care: does it matter? J Health Soc Behav. 1995;36(1):1-10.

Colonic Dyspnea and the Morgagni Hernia: A Rare Adult Diagnosis
Congenital diaphragmatic hernias (CDHs) occur from a disruption in the muscular formation of the diaphragm, resulting in herniation of abdominal contents into the thoracic cavity. A rare diagnosis, most cases are identified in the pediatric and neonatal populations with an overall historical 50% mortality related to the diagnosis.1 More recent data published in the U.S. and Japan cite an overall survival rate of 67% to 80% secondary to improved understanding of the pathophysiology and subsequent enhancement of neonatal cardiopulmonary support adjuncts.2,3
Bochladek hernias (posterolateral space) are the most common presentation of CDH, accounting for > 90% of cases. First described by the Giovanni Batista Morgagni in On the Seats and Causes of Disease Investigated by Anatomy, the anteromedial sternocostal location is far less common and accounts for only 2% to 3% of cases.4,5 More commonly found on the right side of the diaphragm, despite protection from the liver, the right-sided space has been traditionally referred to as the Morgagni space. A left-sided defect is occasionally called the Larrey gap or space, after Napoleon’s surgeon who described the space as a potential location for pericardial drainage of tamponade.6,7
Related: Colonoscopy Bowel Preparation Instructions
There are a few congenital conditions, such as trisomy 21, Turner syndrome, Prader Willi syndrome, dextrocardia, and Tetralogy of Fallot, that have been associated with Morgagni hernias.7 Pulmonary hypertension and respiratory distress are the most common symptoms for neonatal patients; chest pain, sensations of tightness/fullness, reflux, and transient obstructive symptoms constitute the typical symptoms of adult patients with CDH. In this case study, the authors present a case of adult-onset Morgagni hernia as well as a review of the relevant literature.
Case Report
The patient was a 48-year-old man on active-duty who presented to the Naval Medical Center Portsmouth General Surgery clinic in Virginia with a 4-year history of gastroesophageal reflux-related symptoms. Specifically, he reported epigastric fullness, pyrosis, and discomfort that radiated toward his bilateral lower ribs for the previous 4 years. This discomfort was typically associated with the intake of solid food and was followed a few hours later by a loose bowel movement.
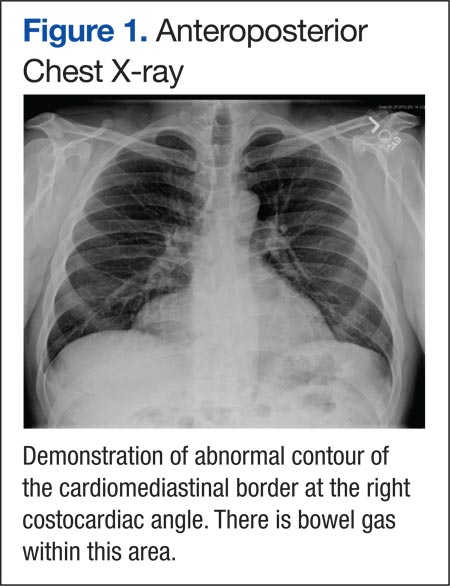
The patient was initially treated with antacids and proton pump inhibitors by his primary care physician, with only minimal relief. He also reported several months of chronic cough as well as intermittent episodes of “gasping air hunger” for about 6 years, which had been incidentally brought up during his separation physical examination. A chest X-ray performed during the workup revealed findings suggesting a right diaphragmatic hernia vs a bronchogenic cyst (Figure 1). A computed tomography (CT) of the thorax demonstrated a 3 x 8-cm hernia through the foramen of Morgagni containing a portion of the transverse colon along with intraperitoneal fat (Figures 2 and 3). 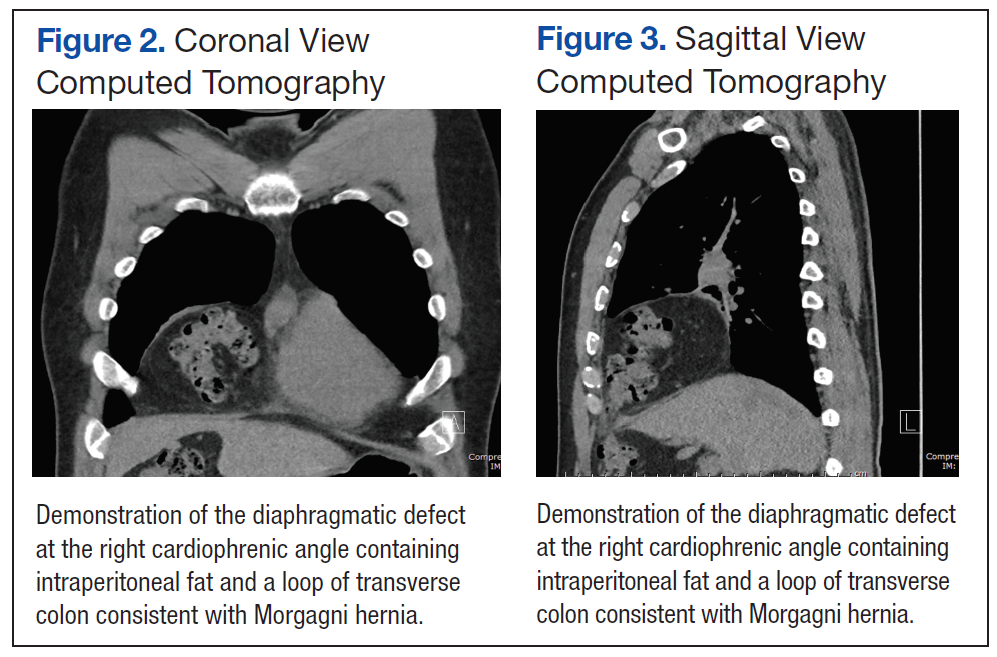
The patient underwent repair of this right Morgagni hernia via a laparoscopic approach. Intraoperative findings confirmed preoperative radiologic studies demonstrating colonic and omental contents within an easily reducible hernia sac (Figures 4 and 5). The hernia sac was left in vivo, and a combined direct hernia repair with mesh reinforcement was performed using Surgimesh XB (BG Medical, Barrington, IL) (Figure 6). The patient remained in the hospital for overnight observation and was discharged on postoperative day 1. The patient has since been seen in follow-up and is doing quite well with complete resolution of his reflux and pulmonary symptoms.

Discussion
A recent review of surgical literature revealed that over a 57-year period, 298 cases of Morgagni hernias have been described in adults.7 Although previous studies have postulated that a majority of adult patients are asymptomatic, more recent retrospective studies have found about a 70% symptomatic rate of patients with Morgagni hernias.7 The natural history of adult presentations lends itself to pulmonary (most common) or chronic upper gastrointestinal symptoms, although an acute presentation with potential volvulus and strangulation of the herniated contents has been described.7
Diagnosis is typically confirmed with a chest X-ray, although the CT scan has become more popular in the era of multimodal imaging.4,7 Multiple methods of repair have been described; however, thoracotomy has been the most widely used approach, and laparoscopy has gained popularity since the early 1990s.7 Mesh has been described in more than 60% of cases, and a laparoscopic repair has proven to have a low (< 5%) complication rate and short hospital stay.8,9 In particular, it has been suggested that a hernia defect larger than 20 to 30 cm2 should be repaired with a prosthetic adjunct, such as polypropylene, polytetrafluoroethylene, and bovine pericardium with a 1.5- to 2.5-cm mesh overlap.7,8
Related: Unusual Congenital Pulmonary Anomaly in an Adult Patient With Dyspnea
There is some controversy about the management of the hernia sac, with about 69% of surgeons choosing not to excise the sac due to concerns of intrathoracic or pericardial injury.7 In a separate study, 36 patients were evaluated retrospectively, and the hernia sac was not resected in any of the patients, with long-term follow-up revealing no evidence of recurrence.6
Conclusion
To allow for early intervention and avoidance of potentially life-threatening volvulus/strangulation, the medical practitioner has to be aware of this rare diagnosis when performing a workup for vague pulmonary and abdominal symptoms as described here. Disagreement exists over the method of repair and management of the hernia sac as well as the need for mesh buttressing of the defect. A well-planned surgical approach individualized to the patient’s anatomy, surgeon’s expertise, and hernia defect size will provide the best possible outcome with a low operative morbidity.
Author disclosures
The authors report no actual or potential conflicts of interest with regard to this article.
Disclaimer
The opinions expressed herein are those of the authors and do not necessarily reflect those of Federal Practitioner, Frontline Medical Communications Inc., the U.S. Government, or any of its agencies. This article may discuss unlabeled or investigational use of certain drugs. Please review the complete prescribing information for specific drugs or drug combinations—including indications, contraindications, warnings, and adverse effects—before administering pharmacologic therapy to patients.
1. Holcomb GW, Murphy JP. Ashcraft’s Pediatric Surgery. 5th ed. Kansas City: Saunders Elsevier; 2010: 319-320.
2. Haroon, J, Chamberlain RS. An evidence-based review of the current treatment of congenital diaphragmatic hernia. Clin Pediatr (Phila). 2013;52(2):115-124.
3. Nagata K, Usui N, Kanamori Y, et al. The current profile and outcome of congenital diaphragmatic hernia: a nationwide survey in Japan. J Pediatr Surg. 2013;48(4):738-744.
4. Abraham V, Myla Y, Verghese S, Chandran BS. Morgagni-larrey hernia—a review of 20 cases. Indian J Surg. 2012;74(5):391-395.
5. Arora S, Haji A, Ng P. Adult Morgagni hernia: the need for clinical awareness, early diagnosis, and prompt surgical intervention. Ann R Coll Surg Engl. 2008;90(8):694-695.
6. Aghajanzadeh M, Khadem S, Khajeh Jahromi S, Gorabi HE, Ebrahimi H, Maafi AA. Clinical presentation and operative repair of Morgagni hernia. Interact Cardiovasc Thorac Surg. 2012;15(4):608-611.
7. Horton JD, Hofmann LJ, Hetz SP. Presentation and management of Morgagni hernias in adults: a review of 298 cases. Surg Endosc. 2008;22(6):1413-1420.
8. Terrosu G, Brizzolari M, Intini S, Cattin F, Bresadola V, De Anna D. Morgagni hernia: technical variation in the laparoscopic treatment. Ann Ital Chir. 2012;83(5):415-420.
9. Durak E, Gur S, Cokmez A, Atahan K, Zahtz E, Tarcan E. Laparoscopic repair of Morgagni hernia. Hernia. 2007;11(3):265-270.
Congenital diaphragmatic hernias (CDHs) occur from a disruption in the muscular formation of the diaphragm, resulting in herniation of abdominal contents into the thoracic cavity. A rare diagnosis, most cases are identified in the pediatric and neonatal populations with an overall historical 50% mortality related to the diagnosis.1 More recent data published in the U.S. and Japan cite an overall survival rate of 67% to 80% secondary to improved understanding of the pathophysiology and subsequent enhancement of neonatal cardiopulmonary support adjuncts.2,3
Bochladek hernias (posterolateral space) are the most common presentation of CDH, accounting for > 90% of cases. First described by the Giovanni Batista Morgagni in On the Seats and Causes of Disease Investigated by Anatomy, the anteromedial sternocostal location is far less common and accounts for only 2% to 3% of cases.4,5 More commonly found on the right side of the diaphragm, despite protection from the liver, the right-sided space has been traditionally referred to as the Morgagni space. A left-sided defect is occasionally called the Larrey gap or space, after Napoleon’s surgeon who described the space as a potential location for pericardial drainage of tamponade.6,7
Related: Colonoscopy Bowel Preparation Instructions
There are a few congenital conditions, such as trisomy 21, Turner syndrome, Prader Willi syndrome, dextrocardia, and Tetralogy of Fallot, that have been associated with Morgagni hernias.7 Pulmonary hypertension and respiratory distress are the most common symptoms for neonatal patients; chest pain, sensations of tightness/fullness, reflux, and transient obstructive symptoms constitute the typical symptoms of adult patients with CDH. In this case study, the authors present a case of adult-onset Morgagni hernia as well as a review of the relevant literature.
Case Report
The patient was a 48-year-old man on active-duty who presented to the Naval Medical Center Portsmouth General Surgery clinic in Virginia with a 4-year history of gastroesophageal reflux-related symptoms. Specifically, he reported epigastric fullness, pyrosis, and discomfort that radiated toward his bilateral lower ribs for the previous 4 years. This discomfort was typically associated with the intake of solid food and was followed a few hours later by a loose bowel movement.
The patient was initially treated with antacids and proton pump inhibitors by his primary care physician, with only minimal relief. He also reported several months of chronic cough as well as intermittent episodes of “gasping air hunger” for about 6 years, which had been incidentally brought up during his separation physical examination. A chest X-ray performed during the workup revealed findings suggesting a right diaphragmatic hernia vs a bronchogenic cyst (Figure 1). A computed tomography (CT) of the thorax demonstrated a 3 x 8-cm hernia through the foramen of Morgagni containing a portion of the transverse colon along with intraperitoneal fat (Figures 2 and 3).
The patient underwent repair of this right Morgagni hernia via a laparoscopic approach. Intraoperative findings confirmed preoperative radiologic studies demonstrating colonic and omental contents within an easily reducible hernia sac (Figures 4 and 5). The hernia sac was left in vivo, and a combined direct hernia repair with mesh reinforcement was performed using Surgimesh XB (BG Medical, Barrington, IL) (Figure 6). The patient remained in the hospital for overnight observation and was discharged on postoperative day 1. The patient has since been seen in follow-up and is doing quite well with complete resolution of his reflux and pulmonary symptoms.
Discussion
A recent review of surgical literature revealed that over a 57-year period, 298 cases of Morgagni hernias have been described in adults.7 Although previous studies have postulated that a majority of adult patients are asymptomatic, more recent retrospective studies have found about a 70% symptomatic rate of patients with Morgagni hernias.7 The natural history of adult presentations lends itself to pulmonary (most common) or chronic upper gastrointestinal symptoms, although an acute presentation with potential volvulus and strangulation of the herniated contents has been described.7
Diagnosis is typically confirmed with a chest X-ray, although the CT scan has become more popular in the era of multimodal imaging.4,7 Multiple methods of repair have been described; however, thoracotomy has been the most widely used approach, and laparoscopy has gained popularity since the early 1990s.7 Mesh has been described in more than 60% of cases, and a laparoscopic repair has proven to have a low (< 5%) complication rate and short hospital stay.8,9 In particular, it has been suggested that a hernia defect larger than 20 to 30 cm2 should be repaired with a prosthetic adjunct, such as polypropylene, polytetrafluoroethylene, and bovine pericardium with a 1.5- to 2.5-cm mesh overlap.7,8
Related: Unusual Congenital Pulmonary Anomaly in an Adult Patient With Dyspnea
There is some controversy about the management of the hernia sac, with about 69% of surgeons choosing not to excise the sac due to concerns of intrathoracic or pericardial injury.7 In a separate study, 36 patients were evaluated retrospectively, and the hernia sac was not resected in any of the patients, with long-term follow-up revealing no evidence of recurrence.6
Conclusion
To allow for early intervention and avoidance of potentially life-threatening volvulus/strangulation, the medical practitioner has to be aware of this rare diagnosis when performing a workup for vague pulmonary and abdominal symptoms as described here. Disagreement exists over the method of repair and management of the hernia sac as well as the need for mesh buttressing of the defect. A well-planned surgical approach individualized to the patient’s anatomy, surgeon’s expertise, and hernia defect size will provide the best possible outcome with a low operative morbidity.
Author disclosures
The authors report no actual or potential conflicts of interest with regard to this article.
Disclaimer
The opinions expressed herein are those of the authors and do not necessarily reflect those of Federal Practitioner, Frontline Medical Communications Inc., the U.S. Government, or any of its agencies. This article may discuss unlabeled or investigational use of certain drugs. Please review the complete prescribing information for specific drugs or drug combinations—including indications, contraindications, warnings, and adverse effects—before administering pharmacologic therapy to patients.
1. Holcomb GW, Murphy JP. Ashcraft’s Pediatric Surgery. 5th ed. Kansas City: Saunders Elsevier; 2010: 319-320.
2. Haroon, J, Chamberlain RS. An evidence-based review of the current treatment of congenital diaphragmatic hernia. Clin Pediatr (Phila). 2013;52(2):115-124.
3. Nagata K, Usui N, Kanamori Y, et al. The current profile and outcome of congenital diaphragmatic hernia: a nationwide survey in Japan. J Pediatr Surg. 2013;48(4):738-744.
4. Abraham V, Myla Y, Verghese S, Chandran BS. Morgagni-larrey hernia—a review of 20 cases. Indian J Surg. 2012;74(5):391-395.
5. Arora S, Haji A, Ng P. Adult Morgagni hernia: the need for clinical awareness, early diagnosis, and prompt surgical intervention. Ann R Coll Surg Engl. 2008;90(8):694-695.
6. Aghajanzadeh M, Khadem S, Khajeh Jahromi S, Gorabi HE, Ebrahimi H, Maafi AA. Clinical presentation and operative repair of Morgagni hernia. Interact Cardiovasc Thorac Surg. 2012;15(4):608-611.
7. Horton JD, Hofmann LJ, Hetz SP. Presentation and management of Morgagni hernias in adults: a review of 298 cases. Surg Endosc. 2008;22(6):1413-1420.
8. Terrosu G, Brizzolari M, Intini S, Cattin F, Bresadola V, De Anna D. Morgagni hernia: technical variation in the laparoscopic treatment. Ann Ital Chir. 2012;83(5):415-420.
9. Durak E, Gur S, Cokmez A, Atahan K, Zahtz E, Tarcan E. Laparoscopic repair of Morgagni hernia. Hernia. 2007;11(3):265-270.
A Multidisciplinary Chronic Pain Management Clinic in an Indian Health Service Facility
The epidemic of opioid abuse, addiction, and overdose deaths across the U.S. has not forgone the reservations of American Indian/Alaska Native (AI/AN) tribes. Indeed, AI/ANs may be at increased risk for abuse of prescription opioids due to higher rates of reported illicit drug use and misuse of opioids. According to the 2012 National Survey on Drug Use and Mental Health, AI/ANs aged ≥ 12 years had the highest rates of illicit drug use (12.7%) with the national average being only 9.5%.1 In 2009, AI/ANs aged 12 to 17 years were found to have the highest rates of marijuana use (13.8%) and nonmedical prescription drug abuse (6.1%) compared with the overall U.S. averages of 6.9% and 3.3%, respectively, putting them at an increased risk for an opioid overdose.1,2
In 2010, the American Pain Society conducted a survey establishing that about 41% of American adults reported having chronic, recurrent, or long-lasting pain.3 People of AI/AN heritage may experience chronic pain at higher rates, as they were identified as having the greatest incidence rates of low back pain (35%), arthritis (25%), and obesity (40%), which are often significant contributing factors to chronic pain.4-6
These conditions suggest a need for intensified management of chronic pain among IHS patients. The authors’ IHS facility is a closed health-system network where pharmacists are integral components of the health care team throughout the ambulatory care, emergency, and inpatient departments.
Related: Pharmacist Pain E-Consults That Result in a Therapy Change
Given that medications play a central role in the treatment of chronic pain, pharmacists are appropriate leaders for chronic pain management teams. Pharmacists can improve patient outcomes by conducting pain assessments, managing adverse events (AEs), identifying optimal medication choices, determining equianalgesic dosing, and managing care through care protocols.7
The primary objective of the multidisciplinary chronic pain management clinic (MCPMC) is to manage complicated and postsurgical patients, using a multimodal approach. Primary care providers (PCPs), which include physicians, nurse practitioners (NPs), physician assistants (PAs), and pharmacist providers collaborate to meet this goal by minimizing disease progression, preserving activities of daily living (ADL), maintaing employment, preventing an increase in pain, using treatment plans that include pharmacologic, interventional, and complementary components, decreasing emergency department (ED) visits for chronic pain issues, improving pain agreement adherence, managing AEs, performing drug abuse and diversion surveillance, and using sustained-release (SR) opioids when appropriate. Sustained release opioids not only ease dosing schedules and increase adherence, but also improve sleep, functionality, and quality of life (QOL) for chronic pain patients.8
Methods
The MCPMC began enrolling patients in January 2011 and has continued to date. Inclusion criterion is the presence of pain lasting 3 months or more. Exclusionary criteria are the presence of malignant pain, aged < 18 years, pregnancy, unmanaged psychiatric disorders, and a referral not approved by a PCP. Referrals are accepted from providers throughout the facility, including the ED, which then require approval by the PCP before enrollment. The PCP continues to manage these patients through consultations with the MCPMC pharmacists following MCPMC appointments and at separate ambulatory care clinic appointments.
Currently, there are 2 pharmacists practicing in the MCPMC clinic in conjunction with other health care providers, including 5 physical therapists, 1 psychiatrist, 2 clinical social workers, and 15 PCPs, including NPs and PAs. Additionally in 2014, the clinic became a yearlong rotation in the PGY-1 pharmacy practice residency.
Related: Evaluation of Methadone-Induced QTc Prolongation in a Veteran Population
After enrollment, a pharmacist reviews patients’ health records for past pain medications, interventional and complementary treatments, adherence to these treatments, recent ED visits and medications received, urine toxicology results, adherence to pain agreements, and the Arizona Controlled Substances Prescription Monitoring Program Database (ACSPMPD).
During the initial MCPMC appointment, a pain assessment questionnaire (PAQ) is completed with a MCPMC pharmacist. The questionnaire, designed specifically for the MCPMC, consists of a comprehensive pain assessment, including functional status and common comorbidities, such as anxiety, depression, obesity, and insomnia. Patients provide feedback on efficacy of past or current medications, and interventional and complementary treatments if applicable. Patients also rate their satisfaction with health care received and develop goals for their treatment and overall health.
A collaborative treatment plan is then developed with the patient’s PCP. Treatment plans often consist of increasing or starting interventional and complementary treatments, SR opioids, and adjuvant medications. Common adjuvant medications include nonsteroidal anti-inflammatory drugs (NSAIDs), antidepressants, antiepileptics, immunosuppressants, disease-modifying antirheumatic drugs (DMARDs), and topical agents. To maximize benefits of the medications, antidepressants are often prescribed for dual purposes among patients with comorbid conditions, such as anxiety, depression, and insomnia. Among obese patients, weight loss is encouraged, and patients may be referred to dietary counseling and exercise programs. Other intentions of the treatment plans are to decrease breakthrough pain and ED visits while attempting to decrease the use of immediate-release (IR) opioids. Treatment plans are executed in a stepwise approach over multiple MCPMC visits and may be modified throughout the course of the program.
To ensure that medication changes and other issues can be addressed when a prescriber is available, all subsequent visits are scheduled when patients are due for a pain medication refill. The MCPMC pharmacists chose not to pursue prescriptive authority but have privileges to order urine toxicology tests, make nonformulary requests, and refer patients for complementary treatments. Subsequent appointments are commonly scheduled 1 to 4 weeks apart or alternate with PCP appointments.
Related: Multidisciplinary Approach to Back Pain
During each appointment, data are collected to record changes in therapy and pain levels. Questions regarding general health and adherence to pharmacologic, interventional, and complementary treatments, exercise regimens, and specialty referrals are asked of all patients. Additionally, follow-up PAQs are completed every 6 months to track progress in therapy, pain control, treatment plan adherence, and patient satisfaction. To determine pain agreement adherence, the ACSPMPD is reviewed monthly, and urine toxicology tests and pill counts are performed randomly at MCPMC visits.
In October 2013, all PCPs who had patients in the clinic completed a survey to assess their perception of the MCPMC. Questions were related to their satisfaction with the clinic as well as their opinion of patients’ satisfaction. Other questions were related to their view of patient care and outcomes compared with those of the general chronic pain patients at the facility.
Results
As of January 2013, 106 patients had been referred to the MCPMC by 17 PCPs. Thirty-six of these patients were still actively participating in the clinic, while 25 were pending review. Of the remaining 45 patients, 30 were denied initial enrollment, and 15 were disenrolled from the clinic over the previous 2 years. Patients were determined to be inappropriate candidates and not enrolled in the clinic for the following reasons: referral not approved by the PCP, patient refused care, patient had not established care with a PCP, mental health issues, pediatric patient, oncology patient, and death prior to the initial review. Patients were disenrolled from the MCPMC clinic before 2013 for the following reasons: not participating in their treatment plan, illicit drug use, seeking care from other PCPs, suspected diversion, death due to a nonpain-related issue, and remained stable on the medication regimen and were released back to the care of their PCP.
In 2013, there were 47 new referrals to the MCPMC, resulting in a total of 153 referrals since the clinic’s 2011 inception. Over the course of 2013, 31 new patients were enrolled, 32 referrals were denied (15 of which remained from 2012), and 36 patients were disenrolled (Figure 1). At the end of 2013, 31 patients remained active, while 9 referrals remained pending review. A total of 67 patients participated in the MCPMC at some point during 2013 and were included in the data collection. Patients by diagnoses are displayed in Figure 2.
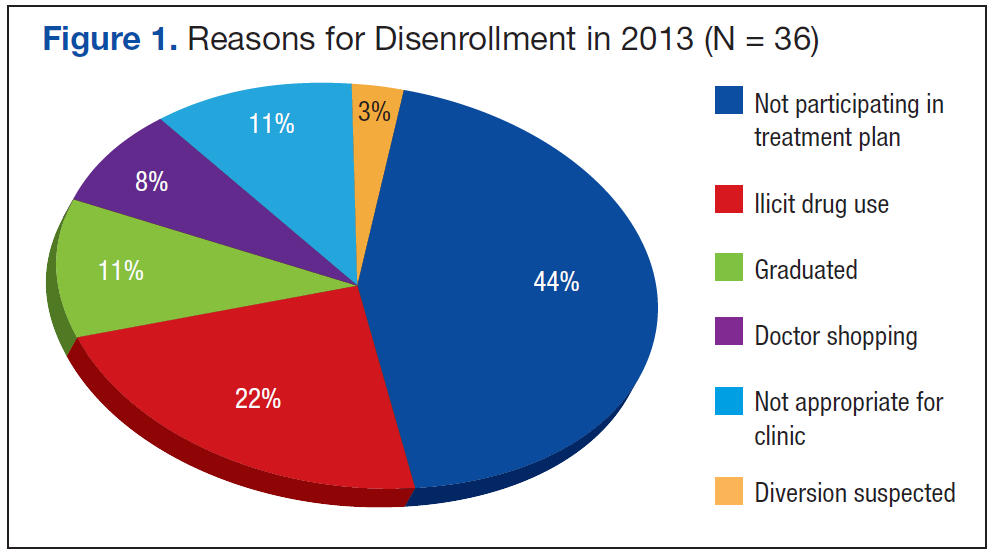
In 2013, patients were scheduled for a total of 337 MCPMC appointments, and 298 (88%) were completed by patients, a 17% increase above 2012. The mean show rate of PCP ambulatory care clinic appointments was about 70%. The completed MCPMC visits for 2013 correlates to about 6.8 MCPMC visits annually per patient. Of the 67 patients included in data collection, the mean total number of months active in the clinic was 12.5. The mean number of months active in the clinic in 2013 was 6.9.
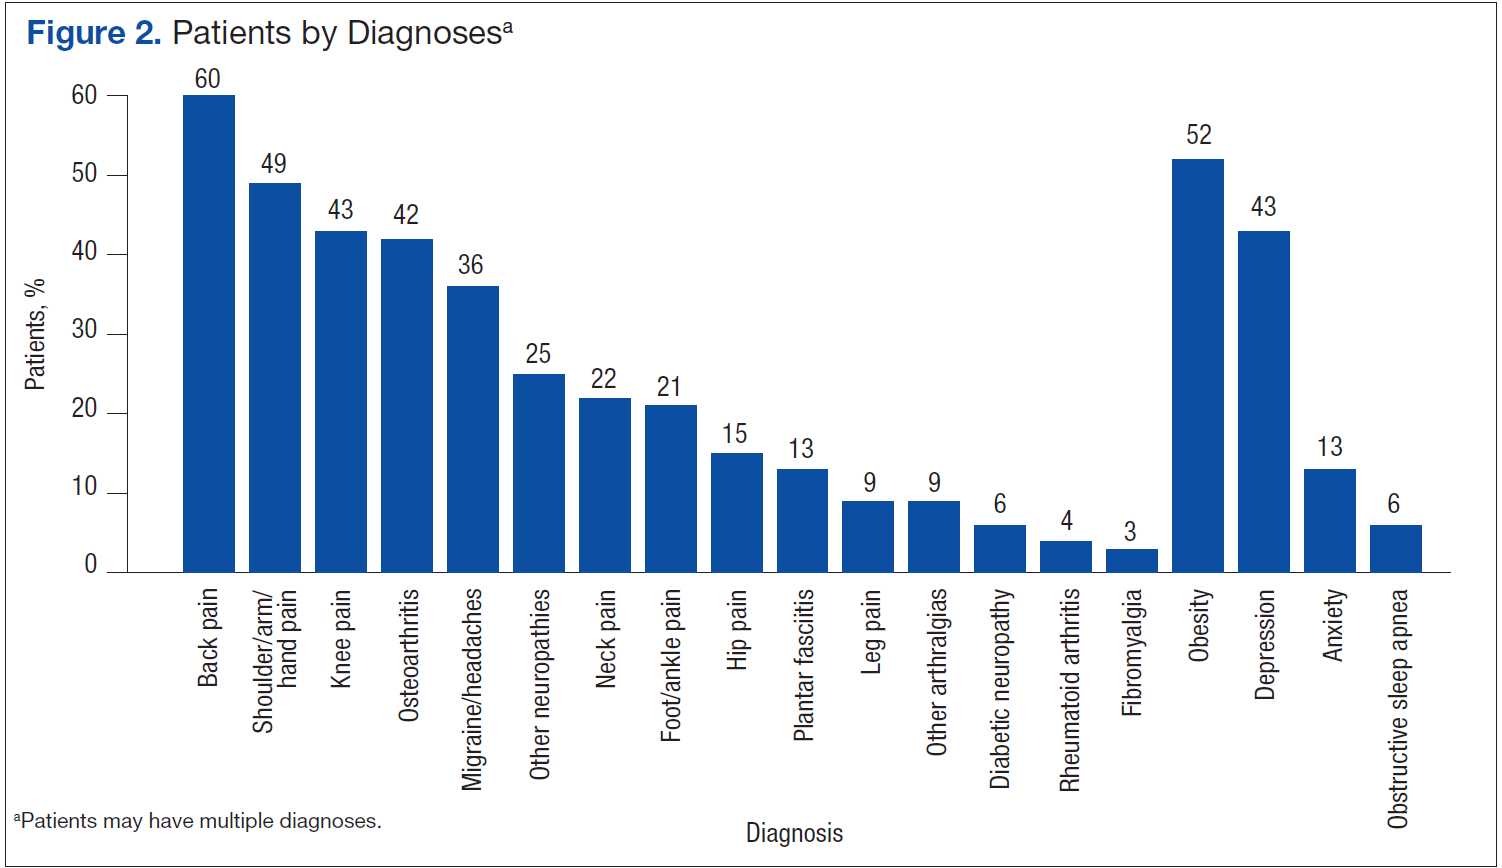
Pain Assessment Questionnaire
In 2013, 27 patients (40%) were enrolled in the clinic for 6 months or more and completed a follow-up PAQ. Throughout 2013, MCPMC patients presented to the ED for care 76 times, which correlates to about 1.8 ED visits annually per patient. MCPMC patients also attended an appointment with their PCP on average 3.7 times per year and provided urine toxicology tests on average 4.3 times per year between MCPMC and PCP visits.
Data collected from follow-up PAQs in January 2014 provided information on the 27 MCPMC patients enrolled in the clinic for 6 months or more. This review indicated alterations in patients’ reported pain levels, functional status, patient satisfaction, and adherence to pain agreements from before and after enrollment in the clinic. Additional information was collected using the electronic health record to reveal the adjustments in treatment plans, including pharmacologic, complementary, and interventional treatments, along with adherence to these treatments.
Patients’ self-reported pain levels at the time of appointment and average pain levels since the previous appointment were documented at each visit for the 27 MCPMC patients. These 2 pain levels were then compared with the levels of the initial assessment and the most recent appointment. Results were inconsistent; however, slight trends were observed with the analysis. The mean change in pain reported at the time of assessment decreased 5.1%. The mean change in average reported pain since the previous appointment also decreased 6.9%. Statistical analysis was performed using the Wilcoxon signed rank test. Both decreases in reported pain were not clinically or statistically significant (P = .21 and P = .17, respectively). Eleven (41%) patients had improvement in average pain, whereas 10 (37%) had no change, and 6 (22%) reported increased average pain levels.
Data on alterations in functional status and ADL were also collected from the 27 MCPMC patients. These patients reported the perceived degree of difficulty, on a scale of 1 to 5, required to complete tasks and get through their day. A rating of 1 represented the ability to complete activities with no difficulty, whereas 5 represented an inability to complete the tasks. For each of the 19 tasks, the differences in scores from the initial to the most recent PAQs were recorded as either a positive or negative alteration for each patient, and the sum of these differences was recorded as an overall positive or negative change in function. A positive change in function indicated an improvement in function, whereas an overall negative change indicated a decrease in ability to complete daily activities.
Twenty-six percent of the 27 pa-tients had a cumulative positive change of up to 5 points, and 19% had a positive change of 6 or more points. Alternatively, 22% of patients had a cumulative negative change of up to 5 points, and 33% of patients had a negative change of 6 points or more. The greatest positive change was 15 points, the greatest negative change was 28 points, and the median change from the initial to the most recent assessments was a negative change of 2 points.
Adjuvant Medications
The pharmacologic component of the treatment plans consisted primarily of optimizing the use of adjuvant medications and SR opioids when appropriate, while minimizing the use of IR opioids and other controlled medications. Of the 67 MCPMC patients in 2013, 55% were on IR opioids alone, a slight increase from 46% in 2012 (Table 1). Eighty-one percent of patients in this group were on ≤ 15 mg of morphine equivalent daily dose (MEDD), which would have required at least a doubling of their dose to initiate the preferred formulary SR opioid, morphine SR tablets. Six percent of patients were on SR opioids alone, also a slight increase from 3% in 2012. Twenty-seven percent of patients were prescribed a combination of IR and SR opioids. Nine percent of patients had been recently transitioned to SR opioids while in the MCPMC, of which 1 patient was prescribed the medication as monotherapy. Twelve percent of patients were not on any opioid therapy throughout 2013.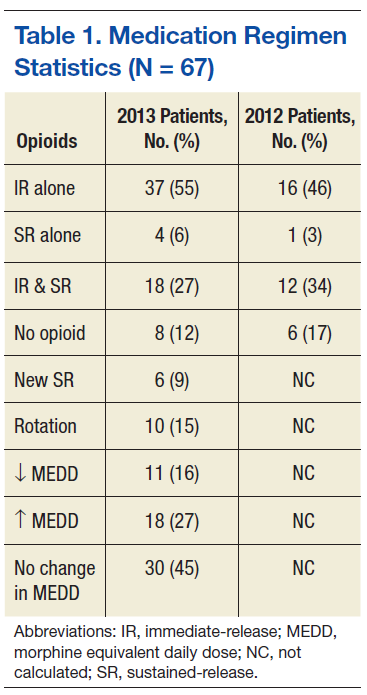
Opioids were switched to an alternative opioid at some point during the year to minimize tolerance in 15% of patients, of which 9% were IR and 6% were SR opioids. Changes in opioid therapy from the beginning to the end of the year were recorded as a decrease, increase, or no change in MEDD. Doses were decreased for 16%, increased for 27%, and not changed for the remaining 45% of patients. The sum of these changes for the 59 patients on opioids was a decrease of 172 mg MEDD or, on average, a decrease of about 3 mg MEDD per patient. Throughout the year, 36 patients were disenrolled from the clinic, and a total of 941 mg MEDD were discontinued by patients’ PCPs. This resulted in a mean of about 26 mg MEDD discontinued per patient. These statistics demonstrate small trends in decreasing overall MEDD in MCPMC patients.
Adjunctive therapies were often used in 67 MCPMC patients in addition to their opioid medications. If possible, therapies for pain management were chosen to maximize the ability to benefit comorbidities, such as depression, anxiety, and insomnia, while also treating chronic pain. The most frequently prescribed class of medications was antidepressants with 63% of patients prescribed one or more: bupropion, serotonin-norepinephrine reuptake inhibitor, selective-serotonin reuptake inhibitor, and tricyclic antidepressants. The next top 3 medication classes after antidepressants were topical medications (54%), antiepileptics (48%), and muscle relaxers (42%). The single most frequently prescribed adjunctive medication was gabapentin (37%), an antiepileptic.
Complementary Treatments
Complementary treatment referrals were followed throughout 2013 and compared with referrals from 2012 (Table 2). Physical therapy (PT) and exercise programs continued to be the most frequently referred treatment programs within the facility. Fifty-two percent of 67 MCPMC patients did not attend any PT appointments as recommended, of which the majority were required to attend as a component of their pain agreement. Of the remaining patients referred to PT, 48% went to their initial visit, 40% attended a second, and 32% attended 3 or more appointments. Of the group that attended 3 or more appointments, patients completed about 70% of the overall scheduled appointments, which was below the facility averages of 75% in 2012 and 80% in 2013. 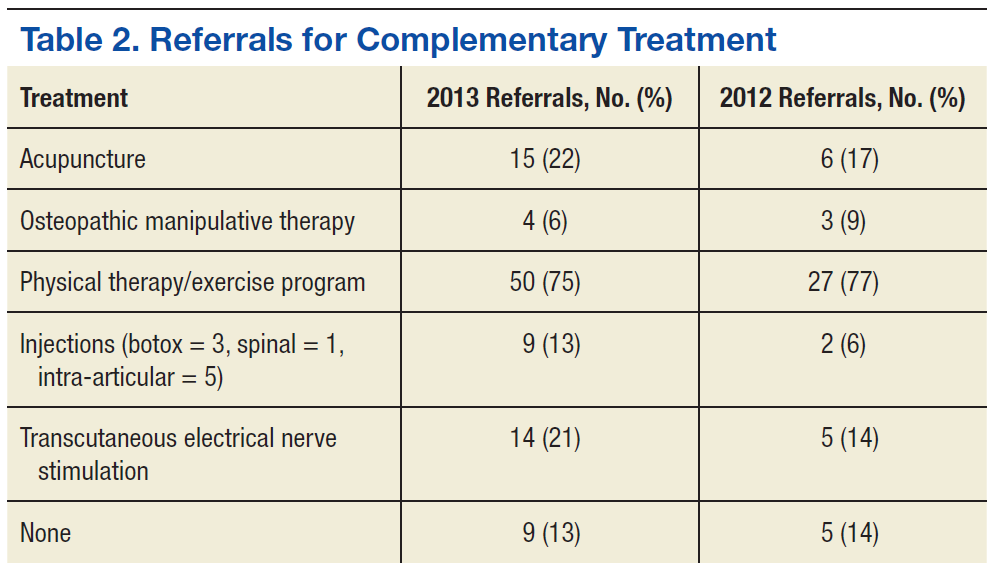
Acupuncture, transcutaneous electrical nerve stimulation, and osteopathic manipulative therapy (OMT) were much less frequently suggested treatments, with percentages of patient referrals of 22%, 21%, and 6%, respectively. Sixty percent of patients referred to acupuncture attended the initial visit, 47% attended a second, and 40% attended 3 or more appointments. Of this group that attended at least 3 appointments, patients completed 75% of scheduled appointments, which was also below the facility averages of 86% in 2012 and 81% in 2013. Only 50% of patients referred to OMT attended the initial visit, of which these patients completed 100% of their scheduled appointments. This rate of attendance was above the facility averages of 60% in 2012 and 68% in 2013. Thirteen percent of patients were referred for interventional pain management and completed 1 of 3 types of injections (onabotulinumtoxinA, spinal, or intra-articular). There was a slight decrease in patients without complementary treatment referrals from 14% in 2012 to 13% in 2013.
Adherence
Pain agreement adherence was determined by assessing ED visits, urine toxicology results, and ACSPMPD search results. Sixty-one percent of the 67 MCPMC patients did not seek care in the ED, whereas 12% had 1 visit in 2013. This decrease in frequency of ED visits was significant compared with these same MCPMC patients from prior to participation in the clinic. The mean ED patient visits per year decreased from 5.1 to 1.8.
Urine toxicology tests were completed on 54 of the 67 MCPMC patients in 2013. Overall, urine toxicology reports were determined to be appropriate at the initial review 51% of the time, with 30% of patients having all of their reports completely appropriate. Of the 54 patients, 35% were disenrolled for inappropriate urine toxicology reports for the following reasons: negative for opioids, positive for opioids without a prescription, positive for amphetamines with additional confirmation testing, and positive for barbiturates without a prescription. Six percent of patients were discovered to have trace amphetamine results that were sent out for confirmation, but these reports were found to be negative, thus confirming an initial false-positive result.
Forty-eight percent of MCPMC patients tested negative for opioids at some point during the year when they were expected to have positive results. Of this group, 31% were prescribed morphine; the remaining patients were prescribed synthetic or semisynthetic opioids that are known to cause false-negative results: fentanyl (4%), hydrocodone (50%), and oxycodone (15%).9 Twenty-two percent of patients were disenrolled from the clinic for testing negative for opioids. The reason for disenrollment was often in conjunction with other behaviors that resulted in violations of their pain agreement. The remaining 78% reported running out of pain medications early and remained in the clinic. Two percent of patients were discovered to have a positive opioid result when it was expected to be negative. This group reported finding previously prescribed medications and subsequent results were appropriate, thus they remained in the clinic. Lastly, 2% of patients tested negative for barbiturates when it was expected to be positive. These patients reported running out of pain medication early as well.
The ACSPMPD was also used to assess pain agreement adherencee for all MCPMC patients. Six percent of patients were identified as seeking care from providers outside the IHS facility and receiving prescriptions for opioid medications, thus violating their pain agreements. Seventy-five percent of these patients were disenrolled from the MCPMC for this reason. PCPs referred the other 25% of patients, and the outside prescribers had performed procedures on them. These patients were reminded of their pain agreements, and no further violations were discovered according to the database. Each patient’s status in the MCPMC was evaluated on a case-by-case basis, and often decisions to disenroll or continue treating patients were based on the PCP’s clinical judgment.
Patient satisfaction was measured in the follow-up PAQ by asking 27 patients how they felt about their care, using a typical 5-point Likert scale. The 2 statements were, “I am pleased with the care that I have received for my pain,” and “I believe that I am receiving the best health care available.” Seventy percent of patients answered “strongly agree” or “agree” to the first statement, and 67% of patients answered the same for the second statement. Nineteen percent of patients answered “not sure” to the first statement, and 22% of patients answered the same for the other statement. Eleven percent of patients responded, “disagree” or “strongly disagree” to both statements.
In October 2013, 12 PCPs who had patients in the MCPMC completed an online survey regarding their perception of patient outcomes, time spent providing care to chronic pain patients, comparisons with general chronic pain patients, and satisfaction with the clinic. Most of the PCPs reported they spent 15 to 30 minutes on MCPMC patients compared with 30 to 60 minutes on general chronic pain patients each month. Most of the PCPs stated that they required ambulatory care clinic visits with chronic pain patients every other month, whereas MCPMC patients needed to be seen only quarterly. PCPs agreed that having their patients participate in the MCPMC resulted in better pain control, improved adherence to treatments, increased diversion and abuse surveillance, and better access to pain medications. Eleven of 12 PCPs stated that they were very satisfied with the MCPMC.
Discussion
The ultimate goal for patients of the MCPMC is to minimize disease progression, prevent an increase in pain, and improve adherence to treatment plans, including pharmacologic, interventional, and complementary components. According to the change in reported pain levels from the initial to the most recent assessment, most patients met the goal of preventing an increase in pain. There was a trend toward a decrease in reported pain, though it was not clinically or statistically significant. The follow-up PAQ measured varying changes in functional status and often demonstrated disease stabilization or progression, not improvement among patients. Forty-five percent of patients showed improvements, and 55% reported more difficulty performing daily activities. The median change between all 27 MCPMC patients was an overall decline in function of 2 points. This worsening in function over time would be expected for most of the chronic pain conditions.
In 2013, 9% of patients were initiated on SR opioids, making a clinic total of 33% of patients on SR medications. More than half the patients were on IR opioids as monotherapy, which is not an ideal treatment for chronic pain management. However, 81% of this group was on 15 mg MEDD or less. The use of SR opioids may or may not reduce abuse potential but can improve patient outcomes. Overall, there was an emphasis on using SR opioids when appropriate while continuing to improve patient outcomes. Over 61% of patients remained on the same opioid doses or were decreased over the course of 2013. There was also a significant use of adjuvant medications, primarily antidepressants, antiepileptics, and topical pain relievers. The most frequently prescribed non-opioid medication, excluding NSAIDs, was gabapentin. This medication has abuse potential and was treated as a controlled medication by the MCPMC during this period.
After enrollment in the MCPMC, patients used complementary and interventional treatments more consistently than prior to enrollment in the clinic. Treatments such as injections, acupuncture, OMT, and PT may reduce opioid medication consumption in the long term or slow the progression of disease for most patients. The improvement in QOL and lack of disease progression in these patients is not objectively measurable; however, the summative progress may be subjectively evaluated through reported pain levels and patient satisfaction.
For MCPMC patients who remained in the clinic, PT and acupuncture attendance was 70% and 75%, respectively. Although these were improvements in adherence for many MCPMC patients, the rates were still below the facility average completion rates of 80% and 81%, respectively. It could be argued that patients with acute pain are typically seen in PT for shorter periods and with fewer possibilities of missing appointments. Conversely, the single active MCPMC patient who attended OMT had a 100% completion rate compared with the average facility OMT attendance of 68%.
Other goals of the MCPMC consist of managing AEs, minimizing ED visits, monitoring for drug abuse and diversion, and improving adherence to pain agreements. The substantial 65% decrease in ED visits can be attributed to the patients’ participation in the MCPMC. Before enrollment, many patients would frequent the ED, because their PCP was not available. The cost savings from minimizing ED visits, provider and staff time, and resources is difficult to measure due to low rates of collections from insurance supplemental to IHS insurance yet is a significant benefit to the IHS facility.
Conclusions
Since the implementation of the MCPMC, patient outcomes have improved due to more consistent drug abuse and diversion surveillance of chronic pain patients rather than performing surveillance because of a suspicion of inappropriate medication use. Frequently using the pain agreement and monitoring parameters constructed a more trusting relationship between the PCP and the patient, and identified patients inappropriate for long-term opioid therapy. Identifying these patients was an unintentional, yet positive outcome.
Additionally, PCPs reported spending half the time with MCPMC patients vs general chronic pain patients. Patients who were not compliant with their pain agreements were discontinued from opioid therapy and were disenrolled from the clinic. Patients who have remained active have become more compliant with their pain agreements and treatment plans than they had been before enrollment. The MCPMC has ultimately relieved a significant burden from primary care and ED providers while improving outcomes and satisfaction of chronic pain patients.
Author disclosures
The authors report no actual or potential conflicts of interest with regard to this article.
Disclaimer
The opinions expressed herein are those of the authors and do not necessarily reflect those of Federal Practitioner, Frontline Medical Communications Inc., the U.S. Government, or any of its agencies. This article may discuss unlabeled or investigational use of certain drugs. Please review the complete prescribing information for specific drugs or drug combinations—including indications, contraindications, warnings, and adverse effects—before administering pharmacologic therapy to patients.
1. Substance Abuse and Mental Health Services Administration. Results from the 2012 National Survey on Drug Use and Health: Summary of National Findings, NSDUH Series H-46, HHS Publication No. (SMA) 13-4795. Rockville, MD: Substance Abuse and Mental Health Services Administration; 2013.
2. Substance Abuse and Mental Health Services Administration. Results from the 2009 National Survey on Drug Use and Health: Summary of National Findings, NSDUH Series H-38, HHS Publication No. (SMA) 10-4586. Rockville, MD: Substance Abuse and Mental Health Services Administration; 2010.
3. Johannes CB, Le TK, Zhou X, Johnston JA, Dworkin RH. The prevalence of chronic pain in United States adults: results of an Internet-based survey.
J Pain. 2010;11(11):1230-1239.
4. Deyo RA, Mirza SK, Martin BI. Back pain prevalence and visit rates: estimates from U.S. national surveys, 2002. Spine (Phila PA 1976). 2006;31(23):
2724-2727.
5. Bolen J, Schieb L, Hootman JM, et al. Differences in the prevalence and impact of arthritis among racial/ethnic groups in the United States, National Health Interview Survey, 2002, 2003, and 2006. Prev Chronic Dis. 2010;7(3):A64.
6. Schiller JS, Lucas JW, Ward BW, Perogoy JA. Summary health statistics U.S. adults: National Health Interview Survey, 2010. National Center for Health Statistics. Vital Health Stat. 2012;10(252). Centers for Disease Control and Prevention Website. http://www.cdc.gov/nchs/data/series/sr_10/sr10_252.pdf. Accessed June 26, 2015.
7. Strickland JM, Huskey A, Brushwood DB. Pharmacist-physician collaboration in pain management practice. J Opioid Manag. 2007;3(6):295-301.
8. Rauck RL. What is the case for prescribing long-acting opioids over short-acting opioids for patients with chronic pain? A critical review. Pain Pract. 2009;9(6):468-479.
9. Pesce A, West C, Egan City K, Strickland J. Interpretation of urine drug testing in pain patients. Pain Med. 2012;13(7):868-885.
The epidemic of opioid abuse, addiction, and overdose deaths across the U.S. has not forgone the reservations of American Indian/Alaska Native (AI/AN) tribes. Indeed, AI/ANs may be at increased risk for abuse of prescription opioids due to higher rates of reported illicit drug use and misuse of opioids. According to the 2012 National Survey on Drug Use and Mental Health, AI/ANs aged ≥ 12 years had the highest rates of illicit drug use (12.7%) with the national average being only 9.5%.1 In 2009, AI/ANs aged 12 to 17 years were found to have the highest rates of marijuana use (13.8%) and nonmedical prescription drug abuse (6.1%) compared with the overall U.S. averages of 6.9% and 3.3%, respectively, putting them at an increased risk for an opioid overdose.1,2
In 2010, the American Pain Society conducted a survey establishing that about 41% of American adults reported having chronic, recurrent, or long-lasting pain.3 People of AI/AN heritage may experience chronic pain at higher rates, as they were identified as having the greatest incidence rates of low back pain (35%), arthritis (25%), and obesity (40%), which are often significant contributing factors to chronic pain.4-6
These conditions suggest a need for intensified management of chronic pain among IHS patients. The authors’ IHS facility is a closed health-system network where pharmacists are integral components of the health care team throughout the ambulatory care, emergency, and inpatient departments.
Related: Pharmacist Pain E-Consults That Result in a Therapy Change
Given that medications play a central role in the treatment of chronic pain, pharmacists are appropriate leaders for chronic pain management teams. Pharmacists can improve patient outcomes by conducting pain assessments, managing adverse events (AEs), identifying optimal medication choices, determining equianalgesic dosing, and managing care through care protocols.7
The primary objective of the multidisciplinary chronic pain management clinic (MCPMC) is to manage complicated and postsurgical patients, using a multimodal approach. Primary care providers (PCPs), which include physicians, nurse practitioners (NPs), physician assistants (PAs), and pharmacist providers collaborate to meet this goal by minimizing disease progression, preserving activities of daily living (ADL), maintaing employment, preventing an increase in pain, using treatment plans that include pharmacologic, interventional, and complementary components, decreasing emergency department (ED) visits for chronic pain issues, improving pain agreement adherence, managing AEs, performing drug abuse and diversion surveillance, and using sustained-release (SR) opioids when appropriate. Sustained release opioids not only ease dosing schedules and increase adherence, but also improve sleep, functionality, and quality of life (QOL) for chronic pain patients.8
Methods
The MCPMC began enrolling patients in January 2011 and has continued to date. Inclusion criterion is the presence of pain lasting 3 months or more. Exclusionary criteria are the presence of malignant pain, aged < 18 years, pregnancy, unmanaged psychiatric disorders, and a referral not approved by a PCP. Referrals are accepted from providers throughout the facility, including the ED, which then require approval by the PCP before enrollment. The PCP continues to manage these patients through consultations with the MCPMC pharmacists following MCPMC appointments and at separate ambulatory care clinic appointments.
Currently, there are 2 pharmacists practicing in the MCPMC clinic in conjunction with other health care providers, including 5 physical therapists, 1 psychiatrist, 2 clinical social workers, and 15 PCPs, including NPs and PAs. Additionally in 2014, the clinic became a yearlong rotation in the PGY-1 pharmacy practice residency.
Related: Evaluation of Methadone-Induced QTc Prolongation in a Veteran Population
After enrollment, a pharmacist reviews patients’ health records for past pain medications, interventional and complementary treatments, adherence to these treatments, recent ED visits and medications received, urine toxicology results, adherence to pain agreements, and the Arizona Controlled Substances Prescription Monitoring Program Database (ACSPMPD).
During the initial MCPMC appointment, a pain assessment questionnaire (PAQ) is completed with a MCPMC pharmacist. The questionnaire, designed specifically for the MCPMC, consists of a comprehensive pain assessment, including functional status and common comorbidities, such as anxiety, depression, obesity, and insomnia. Patients provide feedback on efficacy of past or current medications, and interventional and complementary treatments if applicable. Patients also rate their satisfaction with health care received and develop goals for their treatment and overall health.
A collaborative treatment plan is then developed with the patient’s PCP. Treatment plans often consist of increasing or starting interventional and complementary treatments, SR opioids, and adjuvant medications. Common adjuvant medications include nonsteroidal anti-inflammatory drugs (NSAIDs), antidepressants, antiepileptics, immunosuppressants, disease-modifying antirheumatic drugs (DMARDs), and topical agents. To maximize benefits of the medications, antidepressants are often prescribed for dual purposes among patients with comorbid conditions, such as anxiety, depression, and insomnia. Among obese patients, weight loss is encouraged, and patients may be referred to dietary counseling and exercise programs. Other intentions of the treatment plans are to decrease breakthrough pain and ED visits while attempting to decrease the use of immediate-release (IR) opioids. Treatment plans are executed in a stepwise approach over multiple MCPMC visits and may be modified throughout the course of the program.
To ensure that medication changes and other issues can be addressed when a prescriber is available, all subsequent visits are scheduled when patients are due for a pain medication refill. The MCPMC pharmacists chose not to pursue prescriptive authority but have privileges to order urine toxicology tests, make nonformulary requests, and refer patients for complementary treatments. Subsequent appointments are commonly scheduled 1 to 4 weeks apart or alternate with PCP appointments.
Related: Multidisciplinary Approach to Back Pain
During each appointment, data are collected to record changes in therapy and pain levels. Questions regarding general health and adherence to pharmacologic, interventional, and complementary treatments, exercise regimens, and specialty referrals are asked of all patients. Additionally, follow-up PAQs are completed every 6 months to track progress in therapy, pain control, treatment plan adherence, and patient satisfaction. To determine pain agreement adherence, the ACSPMPD is reviewed monthly, and urine toxicology tests and pill counts are performed randomly at MCPMC visits.
In October 2013, all PCPs who had patients in the clinic completed a survey to assess their perception of the MCPMC. Questions were related to their satisfaction with the clinic as well as their opinion of patients’ satisfaction. Other questions were related to their view of patient care and outcomes compared with those of the general chronic pain patients at the facility.
Results
As of January 2013, 106 patients had been referred to the MCPMC by 17 PCPs. Thirty-six of these patients were still actively participating in the clinic, while 25 were pending review. Of the remaining 45 patients, 30 were denied initial enrollment, and 15 were disenrolled from the clinic over the previous 2 years. Patients were determined to be inappropriate candidates and not enrolled in the clinic for the following reasons: referral not approved by the PCP, patient refused care, patient had not established care with a PCP, mental health issues, pediatric patient, oncology patient, and death prior to the initial review. Patients were disenrolled from the MCPMC clinic before 2013 for the following reasons: not participating in their treatment plan, illicit drug use, seeking care from other PCPs, suspected diversion, death due to a nonpain-related issue, and remained stable on the medication regimen and were released back to the care of their PCP.
In 2013, there were 47 new referrals to the MCPMC, resulting in a total of 153 referrals since the clinic’s 2011 inception. Over the course of 2013, 31 new patients were enrolled, 32 referrals were denied (15 of which remained from 2012), and 36 patients were disenrolled (Figure 1). At the end of 2013, 31 patients remained active, while 9 referrals remained pending review. A total of 67 patients participated in the MCPMC at some point during 2013 and were included in the data collection. Patients by diagnoses are displayed in Figure 2.
In 2013, patients were scheduled for a total of 337 MCPMC appointments, and 298 (88%) were completed by patients, a 17% increase above 2012. The mean show rate of PCP ambulatory care clinic appointments was about 70%. The completed MCPMC visits for 2013 correlates to about 6.8 MCPMC visits annually per patient. Of the 67 patients included in data collection, the mean total number of months active in the clinic was 12.5. The mean number of months active in the clinic in 2013 was 6.9.
Pain Assessment Questionnaire
In 2013, 27 patients (40%) were enrolled in the clinic for 6 months or more and completed a follow-up PAQ. Throughout 2013, MCPMC patients presented to the ED for care 76 times, which correlates to about 1.8 ED visits annually per patient. MCPMC patients also attended an appointment with their PCP on average 3.7 times per year and provided urine toxicology tests on average 4.3 times per year between MCPMC and PCP visits.
Data collected from follow-up PAQs in January 2014 provided information on the 27 MCPMC patients enrolled in the clinic for 6 months or more. This review indicated alterations in patients’ reported pain levels, functional status, patient satisfaction, and adherence to pain agreements from before and after enrollment in the clinic. Additional information was collected using the electronic health record to reveal the adjustments in treatment plans, including pharmacologic, complementary, and interventional treatments, along with adherence to these treatments.
Patients’ self-reported pain levels at the time of appointment and average pain levels since the previous appointment were documented at each visit for the 27 MCPMC patients. These 2 pain levels were then compared with the levels of the initial assessment and the most recent appointment. Results were inconsistent; however, slight trends were observed with the analysis. The mean change in pain reported at the time of assessment decreased 5.1%. The mean change in average reported pain since the previous appointment also decreased 6.9%. Statistical analysis was performed using the Wilcoxon signed rank test. Both decreases in reported pain were not clinically or statistically significant (P = .21 and P = .17, respectively). Eleven (41%) patients had improvement in average pain, whereas 10 (37%) had no change, and 6 (22%) reported increased average pain levels.
Data on alterations in functional status and ADL were also collected from the 27 MCPMC patients. These patients reported the perceived degree of difficulty, on a scale of 1 to 5, required to complete tasks and get through their day. A rating of 1 represented the ability to complete activities with no difficulty, whereas 5 represented an inability to complete the tasks. For each of the 19 tasks, the differences in scores from the initial to the most recent PAQs were recorded as either a positive or negative alteration for each patient, and the sum of these differences was recorded as an overall positive or negative change in function. A positive change in function indicated an improvement in function, whereas an overall negative change indicated a decrease in ability to complete daily activities.
Twenty-six percent of the 27 pa-tients had a cumulative positive change of up to 5 points, and 19% had a positive change of 6 or more points. Alternatively, 22% of patients had a cumulative negative change of up to 5 points, and 33% of patients had a negative change of 6 points or more. The greatest positive change was 15 points, the greatest negative change was 28 points, and the median change from the initial to the most recent assessments was a negative change of 2 points.
Adjuvant Medications
The pharmacologic component of the treatment plans consisted primarily of optimizing the use of adjuvant medications and SR opioids when appropriate, while minimizing the use of IR opioids and other controlled medications. Of the 67 MCPMC patients in 2013, 55% were on IR opioids alone, a slight increase from 46% in 2012 (Table 1). Eighty-one percent of patients in this group were on ≤ 15 mg of morphine equivalent daily dose (MEDD), which would have required at least a doubling of their dose to initiate the preferred formulary SR opioid, morphine SR tablets. Six percent of patients were on SR opioids alone, also a slight increase from 3% in 2012. Twenty-seven percent of patients were prescribed a combination of IR and SR opioids. Nine percent of patients had been recently transitioned to SR opioids while in the MCPMC, of which 1 patient was prescribed the medication as monotherapy. Twelve percent of patients were not on any opioid therapy throughout 2013.
Opioids were switched to an alternative opioid at some point during the year to minimize tolerance in 15% of patients, of which 9% were IR and 6% were SR opioids. Changes in opioid therapy from the beginning to the end of the year were recorded as a decrease, increase, or no change in MEDD. Doses were decreased for 16%, increased for 27%, and not changed for the remaining 45% of patients. The sum of these changes for the 59 patients on opioids was a decrease of 172 mg MEDD or, on average, a decrease of about 3 mg MEDD per patient. Throughout the year, 36 patients were disenrolled from the clinic, and a total of 941 mg MEDD were discontinued by patients’ PCPs. This resulted in a mean of about 26 mg MEDD discontinued per patient. These statistics demonstrate small trends in decreasing overall MEDD in MCPMC patients.
Adjunctive therapies were often used in 67 MCPMC patients in addition to their opioid medications. If possible, therapies for pain management were chosen to maximize the ability to benefit comorbidities, such as depression, anxiety, and insomnia, while also treating chronic pain. The most frequently prescribed class of medications was antidepressants with 63% of patients prescribed one or more: bupropion, serotonin-norepinephrine reuptake inhibitor, selective-serotonin reuptake inhibitor, and tricyclic antidepressants. The next top 3 medication classes after antidepressants were topical medications (54%), antiepileptics (48%), and muscle relaxers (42%). The single most frequently prescribed adjunctive medication was gabapentin (37%), an antiepileptic.
Complementary Treatments
Complementary treatment referrals were followed throughout 2013 and compared with referrals from 2012 (Table 2). Physical therapy (PT) and exercise programs continued to be the most frequently referred treatment programs within the facility. Fifty-two percent of 67 MCPMC patients did not attend any PT appointments as recommended, of which the majority were required to attend as a component of their pain agreement. Of the remaining patients referred to PT, 48% went to their initial visit, 40% attended a second, and 32% attended 3 or more appointments. Of the group that attended 3 or more appointments, patients completed about 70% of the overall scheduled appointments, which was below the facility averages of 75% in 2012 and 80% in 2013.
Acupuncture, transcutaneous electrical nerve stimulation, and osteopathic manipulative therapy (OMT) were much less frequently suggested treatments, with percentages of patient referrals of 22%, 21%, and 6%, respectively. Sixty percent of patients referred to acupuncture attended the initial visit, 47% attended a second, and 40% attended 3 or more appointments. Of this group that attended at least 3 appointments, patients completed 75% of scheduled appointments, which was also below the facility averages of 86% in 2012 and 81% in 2013. Only 50% of patients referred to OMT attended the initial visit, of which these patients completed 100% of their scheduled appointments. This rate of attendance was above the facility averages of 60% in 2012 and 68% in 2013. Thirteen percent of patients were referred for interventional pain management and completed 1 of 3 types of injections (onabotulinumtoxinA, spinal, or intra-articular). There was a slight decrease in patients without complementary treatment referrals from 14% in 2012 to 13% in 2013.
Adherence
Pain agreement adherence was determined by assessing ED visits, urine toxicology results, and ACSPMPD search results. Sixty-one percent of the 67 MCPMC patients did not seek care in the ED, whereas 12% had 1 visit in 2013. This decrease in frequency of ED visits was significant compared with these same MCPMC patients from prior to participation in the clinic. The mean ED patient visits per year decreased from 5.1 to 1.8.
Urine toxicology tests were completed on 54 of the 67 MCPMC patients in 2013. Overall, urine toxicology reports were determined to be appropriate at the initial review 51% of the time, with 30% of patients having all of their reports completely appropriate. Of the 54 patients, 35% were disenrolled for inappropriate urine toxicology reports for the following reasons: negative for opioids, positive for opioids without a prescription, positive for amphetamines with additional confirmation testing, and positive for barbiturates without a prescription. Six percent of patients were discovered to have trace amphetamine results that were sent out for confirmation, but these reports were found to be negative, thus confirming an initial false-positive result.
Forty-eight percent of MCPMC patients tested negative for opioids at some point during the year when they were expected to have positive results. Of this group, 31% were prescribed morphine; the remaining patients were prescribed synthetic or semisynthetic opioids that are known to cause false-negative results: fentanyl (4%), hydrocodone (50%), and oxycodone (15%).9 Twenty-two percent of patients were disenrolled from the clinic for testing negative for opioids. The reason for disenrollment was often in conjunction with other behaviors that resulted in violations of their pain agreement. The remaining 78% reported running out of pain medications early and remained in the clinic. Two percent of patients were discovered to have a positive opioid result when it was expected to be negative. This group reported finding previously prescribed medications and subsequent results were appropriate, thus they remained in the clinic. Lastly, 2% of patients tested negative for barbiturates when it was expected to be positive. These patients reported running out of pain medication early as well.
The ACSPMPD was also used to assess pain agreement adherencee for all MCPMC patients. Six percent of patients were identified as seeking care from providers outside the IHS facility and receiving prescriptions for opioid medications, thus violating their pain agreements. Seventy-five percent of these patients were disenrolled from the MCPMC for this reason. PCPs referred the other 25% of patients, and the outside prescribers had performed procedures on them. These patients were reminded of their pain agreements, and no further violations were discovered according to the database. Each patient’s status in the MCPMC was evaluated on a case-by-case basis, and often decisions to disenroll or continue treating patients were based on the PCP’s clinical judgment.
Patient satisfaction was measured in the follow-up PAQ by asking 27 patients how they felt about their care, using a typical 5-point Likert scale. The 2 statements were, “I am pleased with the care that I have received for my pain,” and “I believe that I am receiving the best health care available.” Seventy percent of patients answered “strongly agree” or “agree” to the first statement, and 67% of patients answered the same for the second statement. Nineteen percent of patients answered “not sure” to the first statement, and 22% of patients answered the same for the other statement. Eleven percent of patients responded, “disagree” or “strongly disagree” to both statements.
In October 2013, 12 PCPs who had patients in the MCPMC completed an online survey regarding their perception of patient outcomes, time spent providing care to chronic pain patients, comparisons with general chronic pain patients, and satisfaction with the clinic. Most of the PCPs reported they spent 15 to 30 minutes on MCPMC patients compared with 30 to 60 minutes on general chronic pain patients each month. Most of the PCPs stated that they required ambulatory care clinic visits with chronic pain patients every other month, whereas MCPMC patients needed to be seen only quarterly. PCPs agreed that having their patients participate in the MCPMC resulted in better pain control, improved adherence to treatments, increased diversion and abuse surveillance, and better access to pain medications. Eleven of 12 PCPs stated that they were very satisfied with the MCPMC.
Discussion
The ultimate goal for patients of the MCPMC is to minimize disease progression, prevent an increase in pain, and improve adherence to treatment plans, including pharmacologic, interventional, and complementary components. According to the change in reported pain levels from the initial to the most recent assessment, most patients met the goal of preventing an increase in pain. There was a trend toward a decrease in reported pain, though it was not clinically or statistically significant. The follow-up PAQ measured varying changes in functional status and often demonstrated disease stabilization or progression, not improvement among patients. Forty-five percent of patients showed improvements, and 55% reported more difficulty performing daily activities. The median change between all 27 MCPMC patients was an overall decline in function of 2 points. This worsening in function over time would be expected for most of the chronic pain conditions.
In 2013, 9% of patients were initiated on SR opioids, making a clinic total of 33% of patients on SR medications. More than half the patients were on IR opioids as monotherapy, which is not an ideal treatment for chronic pain management. However, 81% of this group was on 15 mg MEDD or less. The use of SR opioids may or may not reduce abuse potential but can improve patient outcomes. Overall, there was an emphasis on using SR opioids when appropriate while continuing to improve patient outcomes. Over 61% of patients remained on the same opioid doses or were decreased over the course of 2013. There was also a significant use of adjuvant medications, primarily antidepressants, antiepileptics, and topical pain relievers. The most frequently prescribed non-opioid medication, excluding NSAIDs, was gabapentin. This medication has abuse potential and was treated as a controlled medication by the MCPMC during this period.
After enrollment in the MCPMC, patients used complementary and interventional treatments more consistently than prior to enrollment in the clinic. Treatments such as injections, acupuncture, OMT, and PT may reduce opioid medication consumption in the long term or slow the progression of disease for most patients. The improvement in QOL and lack of disease progression in these patients is not objectively measurable; however, the summative progress may be subjectively evaluated through reported pain levels and patient satisfaction.
For MCPMC patients who remained in the clinic, PT and acupuncture attendance was 70% and 75%, respectively. Although these were improvements in adherence for many MCPMC patients, the rates were still below the facility average completion rates of 80% and 81%, respectively. It could be argued that patients with acute pain are typically seen in PT for shorter periods and with fewer possibilities of missing appointments. Conversely, the single active MCPMC patient who attended OMT had a 100% completion rate compared with the average facility OMT attendance of 68%.
Other goals of the MCPMC consist of managing AEs, minimizing ED visits, monitoring for drug abuse and diversion, and improving adherence to pain agreements. The substantial 65% decrease in ED visits can be attributed to the patients’ participation in the MCPMC. Before enrollment, many patients would frequent the ED, because their PCP was not available. The cost savings from minimizing ED visits, provider and staff time, and resources is difficult to measure due to low rates of collections from insurance supplemental to IHS insurance yet is a significant benefit to the IHS facility.
Conclusions
Since the implementation of the MCPMC, patient outcomes have improved due to more consistent drug abuse and diversion surveillance of chronic pain patients rather than performing surveillance because of a suspicion of inappropriate medication use. Frequently using the pain agreement and monitoring parameters constructed a more trusting relationship between the PCP and the patient, and identified patients inappropriate for long-term opioid therapy. Identifying these patients was an unintentional, yet positive outcome.
Additionally, PCPs reported spending half the time with MCPMC patients vs general chronic pain patients. Patients who were not compliant with their pain agreements were discontinued from opioid therapy and were disenrolled from the clinic. Patients who have remained active have become more compliant with their pain agreements and treatment plans than they had been before enrollment. The MCPMC has ultimately relieved a significant burden from primary care and ED providers while improving outcomes and satisfaction of chronic pain patients.
Author disclosures
The authors report no actual or potential conflicts of interest with regard to this article.
Disclaimer
The opinions expressed herein are those of the authors and do not necessarily reflect those of Federal Practitioner, Frontline Medical Communications Inc., the U.S. Government, or any of its agencies. This article may discuss unlabeled or investigational use of certain drugs. Please review the complete prescribing information for specific drugs or drug combinations—including indications, contraindications, warnings, and adverse effects—before administering pharmacologic therapy to patients.
1. Substance Abuse and Mental Health Services Administration. Results from the 2012 National Survey on Drug Use and Health: Summary of National Findings, NSDUH Series H-46, HHS Publication No. (SMA) 13-4795. Rockville, MD: Substance Abuse and Mental Health Services Administration; 2013.
2. Substance Abuse and Mental Health Services Administration. Results from the 2009 National Survey on Drug Use and Health: Summary of National Findings, NSDUH Series H-38, HHS Publication No. (SMA) 10-4586. Rockville, MD: Substance Abuse and Mental Health Services Administration; 2010.
3. Johannes CB, Le TK, Zhou X, Johnston JA, Dworkin RH. The prevalence of chronic pain in United States adults: results of an Internet-based survey.
J Pain. 2010;11(11):1230-1239.
4. Deyo RA, Mirza SK, Martin BI. Back pain prevalence and visit rates: estimates from U.S. national surveys, 2002. Spine (Phila PA 1976). 2006;31(23):
2724-2727.
5. Bolen J, Schieb L, Hootman JM, et al. Differences in the prevalence and impact of arthritis among racial/ethnic groups in the United States, National Health Interview Survey, 2002, 2003, and 2006. Prev Chronic Dis. 2010;7(3):A64.
6. Schiller JS, Lucas JW, Ward BW, Perogoy JA. Summary health statistics U.S. adults: National Health Interview Survey, 2010. National Center for Health Statistics. Vital Health Stat. 2012;10(252). Centers for Disease Control and Prevention Website. http://www.cdc.gov/nchs/data/series/sr_10/sr10_252.pdf. Accessed June 26, 2015.
7. Strickland JM, Huskey A, Brushwood DB. Pharmacist-physician collaboration in pain management practice. J Opioid Manag. 2007;3(6):295-301.
8. Rauck RL. What is the case for prescribing long-acting opioids over short-acting opioids for patients with chronic pain? A critical review. Pain Pract. 2009;9(6):468-479.
9. Pesce A, West C, Egan City K, Strickland J. Interpretation of urine drug testing in pain patients. Pain Med. 2012;13(7):868-885.