User login
A Qualitative Study of Treating Dual-Use Patients Across Health Care Systems
The VHA assigns all enrolled veterans to a primary care provider (PCP). However, almost 80% of veterans enrolled in VHA have another form of health care coverage, including Medicare, Medicaid, private insurance, and TRICARE for Life program.1 Consequently, veterans may choose to use more than 1 health care system to manage their health care needs.
Studies based on merged VHA and Medicare claims data have demonstrated substantial dual use by VHA enrollees with Medicare. Petersen and colleagues reported that about 80% of VHA enrollees with Medicare chose to use services in both systems and that greater distance to VHA facilities and lower priority level for VHA care predicted lower VHA reliance.2 Among those aged < 65 years who had Medicare due to disability, 58% weredual users. These dual users relied more on private sector care for many health conditions, with the notable exception of substance abuse and mental health disorders, for which reliance on VHA care was greater.2 Another study found that over half of VHA enrollees assigned to a PCP at a community-based outpatient clinic (CBOC) received some or all of their care outside VHA and that reliance on VHA outpatient care declined over the 4-year study period.3
Related: Mutual Alignment Trumps Merger for Joint VA/DoD Health Care Programs
This use of multiple health care providers (HCPs), facilities, and modalities is often described as dual use or comanagement. Dual use in the case of veterans refers to use of both VHA and non-VHA health care, whereas comanagement implies an expectation of shared decision making and open communication between VHA and non-VHA providers. In addition to VHA PCPs, rural veterans frequently receive care from local, non-VHA HCPs in the community where they live. As health care in the U.S. evolves and patients have increasing choices through the Affordable Care Act (ACA), the challenge of comanagement for patients receiving care in multiple systems is likely to increase both within and outside VHA.
This study was part of a qualitative rural health needs assessment designed to ascertain the issues facing rural veterans and their providers in the upper Midwest.4 The objective was to examine VHA primary care clinic staff perspectives on dual users, perceived barriers that inhibit comanagement, and factors that contribute to the need for dual use in rural areas.
Methods
A qualitative study design with in-person interviews was used to elicit the perspective of VHA clinic staff on the current and ideal states of comanagement. Clinics were selected using a stratified purposeful sample of 15 urban and rural primary care clinics at VHA CBOCs and VAMCs in 8 Midwestern states (Illinois, Iowa, Minnesota, Nebraska, North Dakota, South Dakota, Wisconsin, and Wyoming). The stratification criteria included (1) urban and rural; (2) geographic coverage of VISN 23; and (3) VHA-managed and contract clinics, resulting in a purposeful sample of 2 urban VAMC clinics, 3 urban CBOCs, 7 rural VHA-managed CBOCs, and 3 rural contract CBOCs. The distance from the CBOC to the closest VAMC ranged from 32 to 242 miles.
Related: VA Relaxes Rules for Choice Program
Interview guides were developed and tested by the research team for comprehension, length, and timing prior to data collection and iteratively revised as analysis evolved and new topics emerged. Clinic staff were asked about their perceptions of rural veteran use of VHA care; barriers and facilitators to accessing care; and their personal experience working within VHA. Several questions focused on dual use and why rural veterans use multiple health care systems, their perspectives of dual use, their expectations of patients’ role(s) in health care coordination, and the perceived barriers that inhibit comanagement. Interviewers used comanagement and dual use interchangeably to discuss patients with multiple care providers, allowing interviewees to use their preferred terminology; assigned meanings were probed for clarification but not corrected by interviewers.
Between June and October 2009, teams of 2 to 3 researchers visited 15 clinics for 1 to 2 business days each. Researchers conducted interviews with a convenience sample of clinical staff. Consent forms and an explanation of the study were distributed, and those electing to participate voluntarily came to a designated room to complete an interview. All interviews were audio recorded for accuracy.
Interview recordings were transcribed verbatim and reviewed for accuracy. Prior to coding, transcripts were imported into a qualitative data management software program. A codebook, including a priori research hypotheses and de novo themes, was developed based on a systematic review of a randomly selected subset of interview transcripts.5 Four coders were responsible for coding all transcripts and validating coding through tests of agreement at predetermined intervals.
Regular meetings were conducted with coders and the lead qualitative investigator to discuss disagreements, clarify code definitions, or add new codes as needed. As codes were added, previous transcripts were coded/recoded for content related to the new codes. An audit trail was maintained, and iterative mediation of codes continued throughout the process. The final codebook contained 42 thematic codes, which reached saturation or data redundancy.6 Detailed analysis of the codes dual use, distance, and care coordination were used to inform this study.
Results
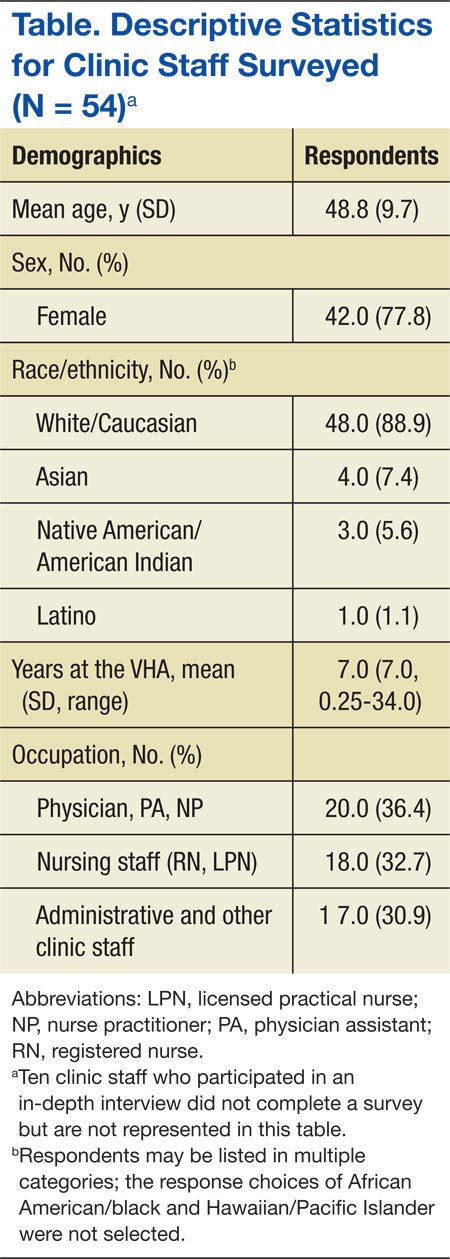
Among the 15 sites, 64 in-depth individual interviews were conducted, ranging from 5 to 53 minutes (average 26 minutes). Clinic staff demographic characteristics are depicted in the Table. Analysis of data captured in the codes dual use, distance, and care coordination resulted in notable concentration in 4 thematic areas: (1) clinic staff perceptions of the influence of access, convenience, and distance on dual use for rural patients; (2) communication and patient’s role in comanagement; (3) rules and regulations related to comanagement from the VHA perspective; and (4) barriers to comanagement and recommendations for education.
Influence of Access, Convenience, and Distance
Access to health care was central to the discussion of dual use and comanagement by clinic staff. Convenience was identified as the primary reason for rural patients’ use of non-VHA services, as many rural patients must travel outside their local community to access VHA care. Thus, dual use was most often noted for services typically available in patients’ local communities, especially management of chronic conditions.
The CBOCs provide important services for primary care and management of chronic conditions but are not available in all communities and may have limited hours/days that do not fit with patients’ schedules. The CBOCs are often unable to provide needed services, including but not limited to emergency care, diagnostic tests, physical and occupational therapy, and other specialty care services. As one VHA provider put it, “The biggest factor for [dual use] is availability, access, convenience.… It’s a lot more convenient to go to the hospital down the street than it is to go 120 miles to [the VAMC], or for some guys who live 30, 40 minutes the other side of here it becomes 150, 160-mile one-way trip.”
Related to access, distance and transportation barriers were identified by clinic staff as obstacles to care for rural patients. Despite efforts to offset the expense of travel through reimbursement to qualified veterans and coordinated van transport with Veterans Service Organizations, travel costs—both time and money—were seen as significant barriers to accessing VHA care, as was an inability to travel for those who are ill or frail and elderly. “We send people … in the van and for the most part that works, but eventually it gets expensive, or you’ve got somebody with chronic pain that can’t tolerate the van ride for 2 hours,” one interviewee
reported.
According to clinic staff, dual-use patients also rely on non-VHA providers in particular for urgent or emergency care, while relying on VHA primary care for reduced-cost medications, diagnostic testing, chronic disease management, or annual exams. When asked why rural patients may choose to see more than 1 provider, VHA providers responded. “[It’s] more convenient to have a local doctor just in case something went wrong and they need to see a doctor right away. So distance to this clinic would be the number one reason.” Another reported, “If it’s once or twice a year routine appointments they’ll come here, but… they’d rather go to a walk-in clinic nearby than spend so much [money] on gas.”
Communication and Patients’ Role
Communication between VHA and non-VHA providers is a necessary element of comanagement. Although phone calls or faxing patient medical records are available options, clinic staff reported it was more common to encounter patients hand carrying their records between providers. For dual-use patients, clinic staff indicated it was often unclear who was responsible for relaying information between providers. There is often ambiguity about who will (and should) fulfill this role and not enough time to adequately address or clarify how this is done. Some clinic staff believed that acting as the main conduits of information placed an undue burden on the patients, particularly asking them to be able to accurately relay medical information about tests or prescriptions that they may not fully understand. Others said that it was primarily the patients’ responsibility to give relevant information about their care to all their providers, because of VHA regulations and patient privacy laws. “[The] patient should tell the primary doctor to send them [medical records] because we can’t get the medical records without the patient’s permission,” said one provider.
Another provider utilized the nursing staff to call patients after their appointments to remind them to give their medical records to their non-VHA provider. The data suggest that responsibility for maintaining communication between providers ultimately falls on the patient. From the perspective of a nurse practitioner, “We just keep trying to educate the community…. I’ve been told that if the patient wants that privilege of using the VA for a pharmacy for an outside provider that we’re glad to do that. But it is their responsibility to communicate with their [non-VHA] physician. I think we just need to keep educating the patients.”
Rules and Regulations
VHA policies governing prescriptions, hospitalizations at outside facilities, and release of patient information regulate, and in some cases hinder, information flow between VHA and non-VHA providers. Many patients use VHA to obtain medications for lower out-of-pocket costs. This contributes to the number of dual-use patients in VHA and results in several challenges for VHA providers trying to manage patients’ prescriptions. For example, patients will ask to fill a prescription at a VHA pharmacy from their non-VHA providers; however, VHA pharmacies can only fill prescriptions from VHA providers.
Many VHA providers are willing to rewrite these prescriptions, but they may need to see the patient before adding or changing the prescription and require documentation to address contraindications, adverse reactions and/or therapeutic failure, and associated risks before making the authorization. VHA providers noted that because the VHA formulary does not contain all medications, non-VHA providers are often unfamiliar with the VHA National Formulary specifics and will write prescriptions for nonformulary medications, which require a nonformulary request from a VHA provider.
Clinic staff also mentioned difficulty in obtaining records from non-VHA providers. This can be particularly problematic if the patient lives a distance away from a VHA facility and does not have the necessary authorization to share records on file.
Barriers and Education Recommendations
Clinic staff identified coordination of care for dual-use patients as a barrier to providing care. Specifically, providers identified coordination as complicated by communication difficulties, inefficient medical record exchange, short staffing in VHA clinics, duplication of diagnostic services, and non-VHA providers’ lack of understanding regarding the services that VHA provides. Specific to rural clinics, comanagement was reportedly hindered by limitations in technology (eg, consistent Internet access), access to routine diagnostic services, and lack of relationships with non-VHA providers. Providers most frequently reported that the critical piece missing in comanagement is a relationship—and implied communication—between VHA clinics and non-VHA community clinics. The concept of a relationship between providers is evoked as a critical element to comanaging dual-use patients; however, clinic staff had a difficult time articulating what that relationship would actually look like if put into practice.
Related: Patients Benefit From ICU Telemedicine
In spite of the numerous barriers identified by clinic staff, the recommendation for education to improve comanagement was consistent across study sites and clinic staff roles. Education was proposed for patients and non-VHA providers as the best intervention. In response to a question about ideas and recommendations to improve comanagement, clinic staff drew on varied experiences. To illustrate this theme, a provider gave this example of dual-use patients seeking prescription medication from VHA and its impact on comanagement: “I would [recommend] an outreach program to community resources and [non-VHA] providers. To let them know more about how the VA works and the resources that are available, and how specifically to coordinate care through the VA, would be a significant benefit.… If the [non-VHA] providers knew how to—who to—talk to, what information the VA needs, for example, for medication changes, it would help the patients make it work…without having to overburden the patients with having to physically hand carry their blood test results, or their notes, discharge summaries, procedure notes.”
Along with providing outreach and education on working with the VHA, clinic staff addressed the need to educate patients more effectively, because they are seen as central to the information exchange. There is motivation on the part of patients to learn the system. “Just making sure that the patients realize that they need to tell their local providers to send us the records and make sure that there is an exchange going on consistently,” explained a case manager. “If the patient wants to get those medications that are costly, then they figure out pretty quick what they have to have, what they need to send to us.” The need for education is an ongoing process; who is responsible for this continues to be a point of debate.
Discussion
In order to better understand comanagement of dual-use patients, this study focused on the experiences and perceptions of staff at VHA primary care clinics in the upper Midwest. The data indicated that:
- VHA clinical staff perceive the primary reason patients choose to seek non-VHA care is because of access, convenience, and
distance - In order for comanagement to occur, communication and information exchange—currently facilitated largely by patients—needs to improve
- Education of patients and their non-VHA providers is recommended, to increase understanding of rules and regulations tied to exchange of patient information across health care systems
- Education may facilitate communication, develop relationships, and overcome barriers to information exchange
Distance to health care and perceived convenience were clearly seen by clinic staff as the driving factors behind their patients’ dual use. In the authors’ prior work, interviews with veterans and their VA providers supported this assertion as well; however, it was also found that distance must not be understood in isolation of other contingencies, such as urgency of need.4
Clinic staff identified institutional and individual barriers that lead to miscommunication and confusion on the part of patients and reported misunderstandings with non-VHA providers, including 3 potential barriers to comanagement. These included (1) inconsistent communication and flow of information between VHA and non-VHA providers; (2) uncertainty about who will (and should) be responsible for information flow between providers; and (3) VHA and federal regulations over patient privacy. Throughout the interviews, access to less expensive prescription medications in VHA was considered an additional driver of dual use. According to clinic staff interviewed, education of patients and non-VHA providers could facilitate efficient and safe comanagement for dual-use patients.7
This study suggests both advantages and disadvantages for patients choosing to use multiple health care systems from the perspective of the clinic staff. The primary advantage is better overall health care access, especially for rural patients and those with longer travel times to VHA facilities. The primary disadvantage of dual use is discontinuity of care between multiple care sites. Specifically, this study identified concerns regarding poor communication between providers and transfer of patient medical records. An underlying theme was a concern for quality of care and patient safety, which are recognized by others in the literature as potential consequences of inadequate comanagement.8-12
If there is one aspect of co-management for dual-use patients to target, this study’s findings point to developing strategies to improve communication between providers caring for dual-use patients and, more specifically, cultivating relationships that are currently underdeveloped. This will necessitate a clearer articulation of what constitutes a relationship between comanaging providers and is a direction for further research that would have applicability beyond VHA to any comanagement of patients using multiple health care systems.
There are 3 simultaneous, yet unrelated, factors that may contribute to increasing dual use. First is the rise in VHA eligible veterans from Operation Enduring Freedom, Operation Iraqi Freedom, and Operation New Dawn.13,14 All returning veterans who meet minimal requirements are eligible for 5 years of VHA health care. A large proportion of these individuals are in the Reserve and National Guard, most of whom have nonmilitary jobs that may provide employer-based health insurance. Thus, these veterans have a greater opportunity for dual use. Second, with the aging cohort of Vietnam-era veterans, a greater proportion is becoming Medicare eligible. Third, with the recent passing of the ACA, more patients, including veterans, may choose to purchase insurance through ACA health exchanges. Taken individually or collectively, these factors will likely have effects reaching beyond VHA, especially when veterans receiving care in non-VHA health care systems engage in dual use.3,13,15,16
Limitations
This study has a number of limitations. First, it was limited to VHA facilities located in the upper Midwest, which may limit generalizability to other parts of the country. The convenience sample of clinic staff at VHA clinics may not represent the full range of perspectives among HCPs generally. This study did not interview clinic staff in non-VHA clinics, although this has been the focus of other studies.17,18 Although dual use also applies to specialty care and related access issues in rural areas, this was not a focus of this study. Last, the data were collected in 2009, prior to the implementation of the patient-aligned care team (PACT) model and prior to the recently revealed issues regarding patient wait times for VHA care. Thus, perceptions may have changed, and additional study is needed.
Conclusions
The results of this study support prior assumptions of barriers to care, but also introduce previously unreported challenges. Dual use is perceived to have both positive and negative impacts, but for the positives to outweigh the negatives, thoughtful comanagement is critical. This may be particularly so in rural areas where dual use is encouraged as a way to overcome distance and increase convenience in accessing care.
As demonstrated by recent events, there are still VHA health care access issues for veterans. Recently, VA leadership and the U.S. Congress proposed that veterans have greater access to community providers as well as VHA in order to overcome delays in care.19 As this option is explored and put into practice, it is more important than ever to consider the need for care coordination and management of dual-use patients, to ensure good communication and care that is timely, safe, and high quality.
Few models exist in which 2 PCPs coordinate across health care systems, and greater understanding of this dual use is needed. This information is important in designing interventions to improve care coordination across systems to ensure continuity of care, patient safety, and patient satisfaction. Although some work has been done to examine the perspectives of non-VA PCPs, little is known about VHA provider perspectives on rural veteran dual use.17,18 This study explores VHA provider perspectives and identifies areas where interventions to improve care coordination across systems might be targeted.
Next steps for intervention studies would be to improve communication and develop educational tools to aid in the coordination of care between VHA and non-VHA providers. A recent example of this is the Co-Management Toolkit developed by the Veterans Rural Health Resource Center-Central Region, which provides information on VHA policies and targets non-VHA providers.20 Although VHA perceptions of comanageing dual-use patients were the target, a similar study of non-VHA providers is important to understand this complex and multifaceted dynamic. Additional work is needed to measure the impact of dual use on clinical outcomes, patient safety and quality, and efficient use of resources, as these are understudied. As dual use continues and potentially increases with the ACA and changing health care in the U.S., it is important to understand the management of patients using multiple health care systems. This is salient as primary care adopts the PACT model and to inform interventions to improve quality and safety while eliminating duplicative health care and costs.
Acknowledgements
The research reported here was supported by the Department of Veterans Affairs, Veterans Health Administration, Office of Rural Health, Veterans Rural Health Resource Center-Central Region (VRHRC-CR) and the VA Health Services Research and Development (HSR&D) Service, the Comprehensive Access and Delivery Research and Evaluation (CADRE) Center at the Iowa City VA Health Care System, and Center to Improve Veteran Involvement in Care (CIVIC) at VA Portland Health Care System. Dr. Reisinger was supported by a Research Career Development Award from the Health Services Research and Development Service, Department of Veterans Affairs (CD1 08-013-1).
We would like to thank all health care providers who graciously agreed to participate in this study and VRHRC-CR staff, in particular Monica Paez for assistance on this manuscript.
Author disclosures
The authors report no actual or potential conflicts of interest with regard to this article.
Disclaimer
The opinions expressed herein are those of the authors and do not necessarily reflect those of Federal Practitioner, Frontline Medical Communications Inc., the U.S. Government, or any of its agencies. This article may discuss unlabeled or investigational use of certain drugs. Please review complete prescribing information for specific drugs or drug combinations—including indications, contraindications, warnings, and adverse effects—before administering pharmacologic therapy to patients.
1. Department of Veterans Affairs Office of Rural Health, VHA. Veterans Rural Health: Perspectives and Opportunities. Rockville, MD: Booz Allen Hamilton; 2008. http://www.ruralhealth.va.gov/docs/PAO-final-report-0208.pdf. Accessed July 6, 2015.
2. Petersen LA, Byrne MM, Daw CN, Hasche J, Reis B, Pietz K. Relationship between clinical conditions and use of Veterans Affairs health care among Medicare‐enrolled veterans. Health Serv Res. 2010;45(3):762-791.
3. Liu CF, Chapko M, Bryson CL, et al. Use of outpatient care in Veterans Health Administration and Medicare among veterans receiving primary care in community-based and hospital outpatient clinics. Health Serv Res. 2010;45(5 pt 1):1268-1286.
4. Buzza C, Ono SS, Turvey C, et al. Distance is relative: unpacking a principal barrier in rural healthcare. J Gen Intern Med. 2011;26(suppl 2):648-654.
5. Bernard HR, Ryan GW. Analyzing Qualitative Data: Systematic Approaches. Los Angeles, CA: SAGE; 2010.
6. Guest G, Bunce A, Johnson L. How many interviews are enough? An experiment with data saturation and variability. Field Methods. 2006;18(1):59-82.
7. Kramer BJ, Vivrette RL, Satter DE, Jouldjian S, McDonald LR. Dual use of Veterans Health Administration and Indian Health Service: healthcare provider and patient perspectives. J Gen Intern Med. 2009;24(6):758-764.
8. Ajmera M, Wilkins TL, Sambamoorthi U. Dual Medicare and Veteran Health Administration use and ambulatory care sensitive hospitalizations. J Gen Intern Med. 2011;26(suppl 2):669-675.
9. Jia H, Zheng Y, Reker DM, et al. Multiple system utilization and mortality for veterans with stroke. Stroke. 2007;38(2):355-360.
10. Trivedi AN, Grebla RC, Jiang L, Yoon J, Mor V, Kizer KW. Duplicate federal payments for dual enrollees in Medicare Advantage plans and the Veterans Affairs health care system. JAMA. 2012;308(1):67-72.
11. Kaboli PJ, Shivapour DM, Henderson MS, Ishani A, Charlton ME. The impact of primary care dual-management on quality of care. J Prim Care Community Health. 2012;3(1):11-16.
12. Wolinsky FD, Miller TR, An H, Brezinski PR, Vaughn TE, Rosenthal GE. Dual use of Medicare and the Veterans Health Administration: are there adverse health outcomes? BMC Health Serv Res. 2006;6:131.
13. Liu CF, Bryson CL, Burgess JF Jr, Sharp N, Perkins M, Maciejewski ML. Use of outpatient care in VA and Medicare among disability-eligible and age-eligible veteran patients. BMC Health Serv Res. 2012;12:51.
14. Miller EA, Intrator O. Veterans use of non-VHA services: implications for policy and planning. Soc Work Public Health. 2012;27(4):379-391.
15. Bachman SS, Gonyea JG. Improving health care delivery to aging adults with disabilities: social work with dual eligibles in a climate of health care reform. J Gerontol Soc Work. 2012;55(2):191-207.
16. Kizer KW. Veterans and the Affordable Care Act. JAMA. 2012;307(8):789-790.
17. Lampman MA, Mueller KJ. Experiences of rural non-VA providers in treating dual care veterans and the development of electronic health information exchange networks between the two systems. J Rural Soc Sci. 2011;26(3):201-219.
18. Gaglioti A, Cozad A, Wittrock S, et al. Non-VA primary care providers’ perspectives on comanagement for rural veterans. Mil Med. 2014;179(11):1236-1243.
19. U.S. Department of Veterans Affairs. Acting Secretary Gibson outlines problems, actions taken, and budget resources needed to ensure access to care. U.S. Department of Veterans Affairs Website. http://www.va.gov/opa/pressrel/pressrelease.cfm?id=2586. Published July 16, 2014. Accessed July 6, 2015.
20. Office of Rural Health Central Region. Co-managed care toolkit. U.S. Department of Veterans Affairs Website. http://www.ruralhealth.va.gov/resource-centers/central/comanagement-toolkit.asp. Updated June 3, 2015. Accessed July 6, 2015.
The VHA assigns all enrolled veterans to a primary care provider (PCP). However, almost 80% of veterans enrolled in VHA have another form of health care coverage, including Medicare, Medicaid, private insurance, and TRICARE for Life program.1 Consequently, veterans may choose to use more than 1 health care system to manage their health care needs.
Studies based on merged VHA and Medicare claims data have demonstrated substantial dual use by VHA enrollees with Medicare. Petersen and colleagues reported that about 80% of VHA enrollees with Medicare chose to use services in both systems and that greater distance to VHA facilities and lower priority level for VHA care predicted lower VHA reliance.2 Among those aged < 65 years who had Medicare due to disability, 58% weredual users. These dual users relied more on private sector care for many health conditions, with the notable exception of substance abuse and mental health disorders, for which reliance on VHA care was greater.2 Another study found that over half of VHA enrollees assigned to a PCP at a community-based outpatient clinic (CBOC) received some or all of their care outside VHA and that reliance on VHA outpatient care declined over the 4-year study period.3
Related: Mutual Alignment Trumps Merger for Joint VA/DoD Health Care Programs
This use of multiple health care providers (HCPs), facilities, and modalities is often described as dual use or comanagement. Dual use in the case of veterans refers to use of both VHA and non-VHA health care, whereas comanagement implies an expectation of shared decision making and open communication between VHA and non-VHA providers. In addition to VHA PCPs, rural veterans frequently receive care from local, non-VHA HCPs in the community where they live. As health care in the U.S. evolves and patients have increasing choices through the Affordable Care Act (ACA), the challenge of comanagement for patients receiving care in multiple systems is likely to increase both within and outside VHA.
This study was part of a qualitative rural health needs assessment designed to ascertain the issues facing rural veterans and their providers in the upper Midwest.4 The objective was to examine VHA primary care clinic staff perspectives on dual users, perceived barriers that inhibit comanagement, and factors that contribute to the need for dual use in rural areas.
Methods
A qualitative study design with in-person interviews was used to elicit the perspective of VHA clinic staff on the current and ideal states of comanagement. Clinics were selected using a stratified purposeful sample of 15 urban and rural primary care clinics at VHA CBOCs and VAMCs in 8 Midwestern states (Illinois, Iowa, Minnesota, Nebraska, North Dakota, South Dakota, Wisconsin, and Wyoming). The stratification criteria included (1) urban and rural; (2) geographic coverage of VISN 23; and (3) VHA-managed and contract clinics, resulting in a purposeful sample of 2 urban VAMC clinics, 3 urban CBOCs, 7 rural VHA-managed CBOCs, and 3 rural contract CBOCs. The distance from the CBOC to the closest VAMC ranged from 32 to 242 miles.
Related: VA Relaxes Rules for Choice Program
Interview guides were developed and tested by the research team for comprehension, length, and timing prior to data collection and iteratively revised as analysis evolved and new topics emerged. Clinic staff were asked about their perceptions of rural veteran use of VHA care; barriers and facilitators to accessing care; and their personal experience working within VHA. Several questions focused on dual use and why rural veterans use multiple health care systems, their perspectives of dual use, their expectations of patients’ role(s) in health care coordination, and the perceived barriers that inhibit comanagement. Interviewers used comanagement and dual use interchangeably to discuss patients with multiple care providers, allowing interviewees to use their preferred terminology; assigned meanings were probed for clarification but not corrected by interviewers.
Between June and October 2009, teams of 2 to 3 researchers visited 15 clinics for 1 to 2 business days each. Researchers conducted interviews with a convenience sample of clinical staff. Consent forms and an explanation of the study were distributed, and those electing to participate voluntarily came to a designated room to complete an interview. All interviews were audio recorded for accuracy.
Interview recordings were transcribed verbatim and reviewed for accuracy. Prior to coding, transcripts were imported into a qualitative data management software program. A codebook, including a priori research hypotheses and de novo themes, was developed based on a systematic review of a randomly selected subset of interview transcripts.5 Four coders were responsible for coding all transcripts and validating coding through tests of agreement at predetermined intervals.
Regular meetings were conducted with coders and the lead qualitative investigator to discuss disagreements, clarify code definitions, or add new codes as needed. As codes were added, previous transcripts were coded/recoded for content related to the new codes. An audit trail was maintained, and iterative mediation of codes continued throughout the process. The final codebook contained 42 thematic codes, which reached saturation or data redundancy.6 Detailed analysis of the codes dual use, distance, and care coordination were used to inform this study.
Results
Among the 15 sites, 64 in-depth individual interviews were conducted, ranging from 5 to 53 minutes (average 26 minutes). Clinic staff demographic characteristics are depicted in the Table. Analysis of data captured in the codes dual use, distance, and care coordination resulted in notable concentration in 4 thematic areas: (1) clinic staff perceptions of the influence of access, convenience, and distance on dual use for rural patients; (2) communication and patient’s role in comanagement; (3) rules and regulations related to comanagement from the VHA perspective; and (4) barriers to comanagement and recommendations for education.
Influence of Access, Convenience, and Distance
Access to health care was central to the discussion of dual use and comanagement by clinic staff. Convenience was identified as the primary reason for rural patients’ use of non-VHA services, as many rural patients must travel outside their local community to access VHA care. Thus, dual use was most often noted for services typically available in patients’ local communities, especially management of chronic conditions.
The CBOCs provide important services for primary care and management of chronic conditions but are not available in all communities and may have limited hours/days that do not fit with patients’ schedules. The CBOCs are often unable to provide needed services, including but not limited to emergency care, diagnostic tests, physical and occupational therapy, and other specialty care services. As one VHA provider put it, “The biggest factor for [dual use] is availability, access, convenience.… It’s a lot more convenient to go to the hospital down the street than it is to go 120 miles to [the VAMC], or for some guys who live 30, 40 minutes the other side of here it becomes 150, 160-mile one-way trip.”
Related to access, distance and transportation barriers were identified by clinic staff as obstacles to care for rural patients. Despite efforts to offset the expense of travel through reimbursement to qualified veterans and coordinated van transport with Veterans Service Organizations, travel costs—both time and money—were seen as significant barriers to accessing VHA care, as was an inability to travel for those who are ill or frail and elderly. “We send people … in the van and for the most part that works, but eventually it gets expensive, or you’ve got somebody with chronic pain that can’t tolerate the van ride for 2 hours,” one interviewee
reported.
According to clinic staff, dual-use patients also rely on non-VHA providers in particular for urgent or emergency care, while relying on VHA primary care for reduced-cost medications, diagnostic testing, chronic disease management, or annual exams. When asked why rural patients may choose to see more than 1 provider, VHA providers responded. “[It’s] more convenient to have a local doctor just in case something went wrong and they need to see a doctor right away. So distance to this clinic would be the number one reason.” Another reported, “If it’s once or twice a year routine appointments they’ll come here, but… they’d rather go to a walk-in clinic nearby than spend so much [money] on gas.”
Communication and Patients’ Role
Communication between VHA and non-VHA providers is a necessary element of comanagement. Although phone calls or faxing patient medical records are available options, clinic staff reported it was more common to encounter patients hand carrying their records between providers. For dual-use patients, clinic staff indicated it was often unclear who was responsible for relaying information between providers. There is often ambiguity about who will (and should) fulfill this role and not enough time to adequately address or clarify how this is done. Some clinic staff believed that acting as the main conduits of information placed an undue burden on the patients, particularly asking them to be able to accurately relay medical information about tests or prescriptions that they may not fully understand. Others said that it was primarily the patients’ responsibility to give relevant information about their care to all their providers, because of VHA regulations and patient privacy laws. “[The] patient should tell the primary doctor to send them [medical records] because we can’t get the medical records without the patient’s permission,” said one provider.
Another provider utilized the nursing staff to call patients after their appointments to remind them to give their medical records to their non-VHA provider. The data suggest that responsibility for maintaining communication between providers ultimately falls on the patient. From the perspective of a nurse practitioner, “We just keep trying to educate the community…. I’ve been told that if the patient wants that privilege of using the VA for a pharmacy for an outside provider that we’re glad to do that. But it is their responsibility to communicate with their [non-VHA] physician. I think we just need to keep educating the patients.”
Rules and Regulations
VHA policies governing prescriptions, hospitalizations at outside facilities, and release of patient information regulate, and in some cases hinder, information flow between VHA and non-VHA providers. Many patients use VHA to obtain medications for lower out-of-pocket costs. This contributes to the number of dual-use patients in VHA and results in several challenges for VHA providers trying to manage patients’ prescriptions. For example, patients will ask to fill a prescription at a VHA pharmacy from their non-VHA providers; however, VHA pharmacies can only fill prescriptions from VHA providers.
Many VHA providers are willing to rewrite these prescriptions, but they may need to see the patient before adding or changing the prescription and require documentation to address contraindications, adverse reactions and/or therapeutic failure, and associated risks before making the authorization. VHA providers noted that because the VHA formulary does not contain all medications, non-VHA providers are often unfamiliar with the VHA National Formulary specifics and will write prescriptions for nonformulary medications, which require a nonformulary request from a VHA provider.
Clinic staff also mentioned difficulty in obtaining records from non-VHA providers. This can be particularly problematic if the patient lives a distance away from a VHA facility and does not have the necessary authorization to share records on file.
Barriers and Education Recommendations
Clinic staff identified coordination of care for dual-use patients as a barrier to providing care. Specifically, providers identified coordination as complicated by communication difficulties, inefficient medical record exchange, short staffing in VHA clinics, duplication of diagnostic services, and non-VHA providers’ lack of understanding regarding the services that VHA provides. Specific to rural clinics, comanagement was reportedly hindered by limitations in technology (eg, consistent Internet access), access to routine diagnostic services, and lack of relationships with non-VHA providers. Providers most frequently reported that the critical piece missing in comanagement is a relationship—and implied communication—between VHA clinics and non-VHA community clinics. The concept of a relationship between providers is evoked as a critical element to comanaging dual-use patients; however, clinic staff had a difficult time articulating what that relationship would actually look like if put into practice.
Related: Patients Benefit From ICU Telemedicine
In spite of the numerous barriers identified by clinic staff, the recommendation for education to improve comanagement was consistent across study sites and clinic staff roles. Education was proposed for patients and non-VHA providers as the best intervention. In response to a question about ideas and recommendations to improve comanagement, clinic staff drew on varied experiences. To illustrate this theme, a provider gave this example of dual-use patients seeking prescription medication from VHA and its impact on comanagement: “I would [recommend] an outreach program to community resources and [non-VHA] providers. To let them know more about how the VA works and the resources that are available, and how specifically to coordinate care through the VA, would be a significant benefit.… If the [non-VHA] providers knew how to—who to—talk to, what information the VA needs, for example, for medication changes, it would help the patients make it work…without having to overburden the patients with having to physically hand carry their blood test results, or their notes, discharge summaries, procedure notes.”
Along with providing outreach and education on working with the VHA, clinic staff addressed the need to educate patients more effectively, because they are seen as central to the information exchange. There is motivation on the part of patients to learn the system. “Just making sure that the patients realize that they need to tell their local providers to send us the records and make sure that there is an exchange going on consistently,” explained a case manager. “If the patient wants to get those medications that are costly, then they figure out pretty quick what they have to have, what they need to send to us.” The need for education is an ongoing process; who is responsible for this continues to be a point of debate.
Discussion
In order to better understand comanagement of dual-use patients, this study focused on the experiences and perceptions of staff at VHA primary care clinics in the upper Midwest. The data indicated that:
- VHA clinical staff perceive the primary reason patients choose to seek non-VHA care is because of access, convenience, and
distance - In order for comanagement to occur, communication and information exchange—currently facilitated largely by patients—needs to improve
- Education of patients and their non-VHA providers is recommended, to increase understanding of rules and regulations tied to exchange of patient information across health care systems
- Education may facilitate communication, develop relationships, and overcome barriers to information exchange
Distance to health care and perceived convenience were clearly seen by clinic staff as the driving factors behind their patients’ dual use. In the authors’ prior work, interviews with veterans and their VA providers supported this assertion as well; however, it was also found that distance must not be understood in isolation of other contingencies, such as urgency of need.4
Clinic staff identified institutional and individual barriers that lead to miscommunication and confusion on the part of patients and reported misunderstandings with non-VHA providers, including 3 potential barriers to comanagement. These included (1) inconsistent communication and flow of information between VHA and non-VHA providers; (2) uncertainty about who will (and should) be responsible for information flow between providers; and (3) VHA and federal regulations over patient privacy. Throughout the interviews, access to less expensive prescription medications in VHA was considered an additional driver of dual use. According to clinic staff interviewed, education of patients and non-VHA providers could facilitate efficient and safe comanagement for dual-use patients.7
This study suggests both advantages and disadvantages for patients choosing to use multiple health care systems from the perspective of the clinic staff. The primary advantage is better overall health care access, especially for rural patients and those with longer travel times to VHA facilities. The primary disadvantage of dual use is discontinuity of care between multiple care sites. Specifically, this study identified concerns regarding poor communication between providers and transfer of patient medical records. An underlying theme was a concern for quality of care and patient safety, which are recognized by others in the literature as potential consequences of inadequate comanagement.8-12
If there is one aspect of co-management for dual-use patients to target, this study’s findings point to developing strategies to improve communication between providers caring for dual-use patients and, more specifically, cultivating relationships that are currently underdeveloped. This will necessitate a clearer articulation of what constitutes a relationship between comanaging providers and is a direction for further research that would have applicability beyond VHA to any comanagement of patients using multiple health care systems.
There are 3 simultaneous, yet unrelated, factors that may contribute to increasing dual use. First is the rise in VHA eligible veterans from Operation Enduring Freedom, Operation Iraqi Freedom, and Operation New Dawn.13,14 All returning veterans who meet minimal requirements are eligible for 5 years of VHA health care. A large proportion of these individuals are in the Reserve and National Guard, most of whom have nonmilitary jobs that may provide employer-based health insurance. Thus, these veterans have a greater opportunity for dual use. Second, with the aging cohort of Vietnam-era veterans, a greater proportion is becoming Medicare eligible. Third, with the recent passing of the ACA, more patients, including veterans, may choose to purchase insurance through ACA health exchanges. Taken individually or collectively, these factors will likely have effects reaching beyond VHA, especially when veterans receiving care in non-VHA health care systems engage in dual use.3,13,15,16
Limitations
This study has a number of limitations. First, it was limited to VHA facilities located in the upper Midwest, which may limit generalizability to other parts of the country. The convenience sample of clinic staff at VHA clinics may not represent the full range of perspectives among HCPs generally. This study did not interview clinic staff in non-VHA clinics, although this has been the focus of other studies.17,18 Although dual use also applies to specialty care and related access issues in rural areas, this was not a focus of this study. Last, the data were collected in 2009, prior to the implementation of the patient-aligned care team (PACT) model and prior to the recently revealed issues regarding patient wait times for VHA care. Thus, perceptions may have changed, and additional study is needed.
Conclusions
The results of this study support prior assumptions of barriers to care, but also introduce previously unreported challenges. Dual use is perceived to have both positive and negative impacts, but for the positives to outweigh the negatives, thoughtful comanagement is critical. This may be particularly so in rural areas where dual use is encouraged as a way to overcome distance and increase convenience in accessing care.
As demonstrated by recent events, there are still VHA health care access issues for veterans. Recently, VA leadership and the U.S. Congress proposed that veterans have greater access to community providers as well as VHA in order to overcome delays in care.19 As this option is explored and put into practice, it is more important than ever to consider the need for care coordination and management of dual-use patients, to ensure good communication and care that is timely, safe, and high quality.
Few models exist in which 2 PCPs coordinate across health care systems, and greater understanding of this dual use is needed. This information is important in designing interventions to improve care coordination across systems to ensure continuity of care, patient safety, and patient satisfaction. Although some work has been done to examine the perspectives of non-VA PCPs, little is known about VHA provider perspectives on rural veteran dual use.17,18 This study explores VHA provider perspectives and identifies areas where interventions to improve care coordination across systems might be targeted.
Next steps for intervention studies would be to improve communication and develop educational tools to aid in the coordination of care between VHA and non-VHA providers. A recent example of this is the Co-Management Toolkit developed by the Veterans Rural Health Resource Center-Central Region, which provides information on VHA policies and targets non-VHA providers.20 Although VHA perceptions of comanageing dual-use patients were the target, a similar study of non-VHA providers is important to understand this complex and multifaceted dynamic. Additional work is needed to measure the impact of dual use on clinical outcomes, patient safety and quality, and efficient use of resources, as these are understudied. As dual use continues and potentially increases with the ACA and changing health care in the U.S., it is important to understand the management of patients using multiple health care systems. This is salient as primary care adopts the PACT model and to inform interventions to improve quality and safety while eliminating duplicative health care and costs.
Acknowledgements
The research reported here was supported by the Department of Veterans Affairs, Veterans Health Administration, Office of Rural Health, Veterans Rural Health Resource Center-Central Region (VRHRC-CR) and the VA Health Services Research and Development (HSR&D) Service, the Comprehensive Access and Delivery Research and Evaluation (CADRE) Center at the Iowa City VA Health Care System, and Center to Improve Veteran Involvement in Care (CIVIC) at VA Portland Health Care System. Dr. Reisinger was supported by a Research Career Development Award from the Health Services Research and Development Service, Department of Veterans Affairs (CD1 08-013-1).
We would like to thank all health care providers who graciously agreed to participate in this study and VRHRC-CR staff, in particular Monica Paez for assistance on this manuscript.
Author disclosures
The authors report no actual or potential conflicts of interest with regard to this article.
Disclaimer
The opinions expressed herein are those of the authors and do not necessarily reflect those of Federal Practitioner, Frontline Medical Communications Inc., the U.S. Government, or any of its agencies. This article may discuss unlabeled or investigational use of certain drugs. Please review complete prescribing information for specific drugs or drug combinations—including indications, contraindications, warnings, and adverse effects—before administering pharmacologic therapy to patients.
1. Department of Veterans Affairs Office of Rural Health, VHA. Veterans Rural Health: Perspectives and Opportunities. Rockville, MD: Booz Allen Hamilton; 2008. http://www.ruralhealth.va.gov/docs/PAO-final-report-0208.pdf. Accessed July 6, 2015.
2. Petersen LA, Byrne MM, Daw CN, Hasche J, Reis B, Pietz K. Relationship between clinical conditions and use of Veterans Affairs health care among Medicare‐enrolled veterans. Health Serv Res. 2010;45(3):762-791.
3. Liu CF, Chapko M, Bryson CL, et al. Use of outpatient care in Veterans Health Administration and Medicare among veterans receiving primary care in community-based and hospital outpatient clinics. Health Serv Res. 2010;45(5 pt 1):1268-1286.
4. Buzza C, Ono SS, Turvey C, et al. Distance is relative: unpacking a principal barrier in rural healthcare. J Gen Intern Med. 2011;26(suppl 2):648-654.
5. Bernard HR, Ryan GW. Analyzing Qualitative Data: Systematic Approaches. Los Angeles, CA: SAGE; 2010.
6. Guest G, Bunce A, Johnson L. How many interviews are enough? An experiment with data saturation and variability. Field Methods. 2006;18(1):59-82.
7. Kramer BJ, Vivrette RL, Satter DE, Jouldjian S, McDonald LR. Dual use of Veterans Health Administration and Indian Health Service: healthcare provider and patient perspectives. J Gen Intern Med. 2009;24(6):758-764.
8. Ajmera M, Wilkins TL, Sambamoorthi U. Dual Medicare and Veteran Health Administration use and ambulatory care sensitive hospitalizations. J Gen Intern Med. 2011;26(suppl 2):669-675.
9. Jia H, Zheng Y, Reker DM, et al. Multiple system utilization and mortality for veterans with stroke. Stroke. 2007;38(2):355-360.
10. Trivedi AN, Grebla RC, Jiang L, Yoon J, Mor V, Kizer KW. Duplicate federal payments for dual enrollees in Medicare Advantage plans and the Veterans Affairs health care system. JAMA. 2012;308(1):67-72.
11. Kaboli PJ, Shivapour DM, Henderson MS, Ishani A, Charlton ME. The impact of primary care dual-management on quality of care. J Prim Care Community Health. 2012;3(1):11-16.
12. Wolinsky FD, Miller TR, An H, Brezinski PR, Vaughn TE, Rosenthal GE. Dual use of Medicare and the Veterans Health Administration: are there adverse health outcomes? BMC Health Serv Res. 2006;6:131.
13. Liu CF, Bryson CL, Burgess JF Jr, Sharp N, Perkins M, Maciejewski ML. Use of outpatient care in VA and Medicare among disability-eligible and age-eligible veteran patients. BMC Health Serv Res. 2012;12:51.
14. Miller EA, Intrator O. Veterans use of non-VHA services: implications for policy and planning. Soc Work Public Health. 2012;27(4):379-391.
15. Bachman SS, Gonyea JG. Improving health care delivery to aging adults with disabilities: social work with dual eligibles in a climate of health care reform. J Gerontol Soc Work. 2012;55(2):191-207.
16. Kizer KW. Veterans and the Affordable Care Act. JAMA. 2012;307(8):789-790.
17. Lampman MA, Mueller KJ. Experiences of rural non-VA providers in treating dual care veterans and the development of electronic health information exchange networks between the two systems. J Rural Soc Sci. 2011;26(3):201-219.
18. Gaglioti A, Cozad A, Wittrock S, et al. Non-VA primary care providers’ perspectives on comanagement for rural veterans. Mil Med. 2014;179(11):1236-1243.
19. U.S. Department of Veterans Affairs. Acting Secretary Gibson outlines problems, actions taken, and budget resources needed to ensure access to care. U.S. Department of Veterans Affairs Website. http://www.va.gov/opa/pressrel/pressrelease.cfm?id=2586. Published July 16, 2014. Accessed July 6, 2015.
20. Office of Rural Health Central Region. Co-managed care toolkit. U.S. Department of Veterans Affairs Website. http://www.ruralhealth.va.gov/resource-centers/central/comanagement-toolkit.asp. Updated June 3, 2015. Accessed July 6, 2015.
Accelerated Hepatitis A and B Immunization in a Substance Abuse Treatment Program
Homeless individuals and IV drug users are susceptible to hepatitis A, B, and C infections, and co-infection with these diseases may complicate treatment and result in poor medical outcomes.1 Vaccination offers the best protection against hepatitis A and B, particularly among high-risk populations.2,3 Immunization against hepatitis A and B is of even greater importance for patients with hepatitis C, because there is no specific hepatitis C vaccine, and concomitant infections of B with C are damaging to the liver.4
Veterans have a rate of hepatitis C infection that is 3 times that of the general population.5 Some evidence exists that veterans with serious mental illness (SMI) have a higher rate of hepatitis C infection relative to patients without SMI. Co-occurring substance abuse may add another layer of vulnerability to hepatitis C infection, particularly for homeless veterans.5-7
Mental Health and Primary Care Integration
Substance abuse and dual-diagnosis treatment programs (ie, those programs that treat both substance abuse and co-occurring serious mental health problems, such as bipolar disorder, severe major depressive disorder, psychotic disorders, and posttraumatic stress disorder [PTSD]) that have integrated mental health and primary care into their treatment programs may offer a window of opportunity for risk-reducing interventions. These interventions include testing and education of patients regarding infectious diseases, such as viral hepatitis and HIV, and completion of the hepatitis A/B immunization series.
The James A. Haley Veterans’ Hospital (JAHVH) in Tampa, Florida, has demonstrated some limited success in the past with integrating a standard dosing schedule for hepatitis A/B vaccination into its substance abuse treatment program (SATP), though recent evidence points to more promising results using an accelerated regimen as indicated by a high completion rate for hepatitis B vaccination in a methadone clinic.8,9 A relatively low proportion of SATPs in the U.S. provide testing, education, or vaccination for hepatitis A and B, especially considering the public health importance of controlling these diseases in the substance abusing populations.10,11
Related: Combination Pill Approved for HCV
In 1999, a primary care team was added to the alcohol and drug abuse treatment program at JAHVH.In 2005, the nurses in the program began scheduling vaccinations and screening patients for medical and psychiatric issues, pain, hypertension, diabetes, hepatitis C, alcohol use, depression, PTSD, prostate and colorectal cancers.12 Such a multidisciplinary approach provides many treatment advantages for patients and may save lives.13
Even with a multidisciplinary approach, the nurses found it difficult to provide adequate hepatitis A/B immunization within the 3- to 6-week intensive SATP, because standard immunization dosing regimens are spread over 6 months.14 As with all types of immunizations, long dosing schedules may reduce patient adherence and result in inadequate seroprotection.15 Thus, there is a need to provide a completed immunization series in a more expeditious fashion, and an accelerated dosing regimen makes that possible.15,16
Hepatitis A/B Vaccination
Twinrix (GlaxoSmithKline, Brentford, United Kingdom) is a vaccine that provides dual immunization for hepatitis A and B. Whereas the standard vaccination schedule takes 6 months to complete, the accelerated dosing schedule can be used to complete the first 3 doses in less than a month. The accelerated dosing schedule was incorporated into the JAHVH clinic to capture as many patients as possible in the 3- to 6-week time frame: The first dose is administered and followed by a second dose 7 days later. The third dose is administered 21 to 30 days after the first dose. Twelve months after the first dose, a booster dose is given.
After the first 3 accelerated doses, > 98% of patients show a sustained immune response to hepatitis A, and > 63% demonstrate immunity to hepatitis B. If a 12-month booster injection is given, 100% of patients may receive immunity to hepatitis A and > 96% may have immunity to hepatitis B.16 Another study of the combined vaccine showed even greater seroprotection for hepatitis A and B after only 1 month, 100% and 82%, respectively.17
Related: Viral Hepatitis Awareness
This JAHVH retrospective feasibility study describes a risk-reduction program for hepatitis A/B prevention that was implemented within a 3- to 4-week intensive outpatient SATP and a 6-week dual-diagnosis treatment program. The study includes the development and implementation of the program, designed to vaccinate patients using the accelerated Twinrix schedule. To ascertain the feasibility of this vaccination approach, historical medical records were used to describe and examine the vaccination initiation and follow-up rates of the treatment program participants who received the hepatitis A/B immunization series during their intensive SATP.
Study Design
A retrospective review of medical records was conducted for all participants who were admitted to the intensive JAHVH SATP between October 1, 2008, and September 30, 2009. This study was reviewed and approved by the JAHVH research and development committee and its associated University of South Florida institutional review board. Informed consent to participate was not obtained, because the study was retrospective.
Patient Identification and Education
All program participants were offered testing for HIV and hepatitis A, B, and C. Program participants were educated about hepatitis and HIV transmission, as well as about the long-term effects of continued substance abuse on the progression of hepatitis C. Education about hepatitis, HIV, and substance abuse was provided in a group setting by a member of the program’s nursing staff. One-on-one risk education counseling was also provided when requested or otherwise indicated.
Laboratory testing was performed following each participant’s initial physical examination (within 3 to 5 days of program admission), and the nursing staff reviewed the results before vaccination. Explanation of laboratory results and an individualized immunization regimen were provided to each participant. On review of participants’ laboratory results, those with seroconversion of both hepatitis A and B were not given the combined immunization. Participants who had seroconversion of hepatitis A were offered the hepatitis B vaccination series, and vice versa.
Immunization Process
Participants who lacked prior immunization for hepatitis A and B and had no seroconversion of either hepatitis A or B were offered vaccination. Some patients declined vaccination, even though they were eligible. Their reasons were not formally assessed.
Related: Nivolumab Approved for Expanded Indication
Patients who accepted the vaccination were given the accelerated regimen.16 Participants were educated on the importance of compliance with the vaccination series and provided with follow-up immunization dates and a reminder for the 1-year booster vaccine. The immunizations were ordered by the program’s primary care NP and administered by a licensed practical nurse. The nurse who administered the injections took responsibility for scheduling the patients for all their subsequent injections, including the 1-year booster.
Follow-up Care
If the third injection was not completed before discharge, patients were given a follow-up appointment with the nurse if they remained in the JAHVH service area. If they were leaving the area, they were given instructions on how to follow-up at another VA facility to continue their immunization schedule. A note was written in the electronic medical record documenting their abbreviated hepatitis A/B immunization schedule, which could be accessed by other providers at other VA facilities. Patients who did not show up for any follow-up appointments (third injection or the 1-year booster injection) were contacted and reminded about the importance of completing the immunization series and to schedule an appointment.
Statistical Analysis
All data were analyzed using IBM Statistical Package for the Social Sciences (IBM SPSS, Armonk, New York) with a focus on identifying differences between vaccination-eligible patients (n = 269) who did (n = 128) and did not (n = 141) initiate the immunization schedule during the treatment program. Chi-square and Fisher exact tests were used to assess statistical differences in initiation of the immunization schedule related to categoric variables (ie, marital status, race, history of IV drug abuse, cigarette smoking status, housing status, legal status, history of combat, having a psychiatric or medical diagnosis, and program track). Independent sample t tests were used to test for differences between these 2 groups on the continuous variables, including age, number of previous treatment programs, Global Assessment of Functioning score, severity of smoking dependence as measured by the Fagerström Test for Nicotine Dependence, and the Addiction Severity Index scales.18-20
Results
The sample consisted of 284 successive admissions to an intensive outpatient program for veterans with substance use disorders. About one-third of the patients were homeless at the time of admission to the treatment, and 87% required contracted housing while completing treatment for reasons related to lack of housing, transportation, clinical necessity, or a combination of those factors (Table 1). The most common substance problems were alcohol and cocaine dependence, and 21% (n = 59) of the patients acknowledged a history of IV drug use during their initial psychiatric evaluation. Seventy percent were dually diagnosed with some other Axis I disorder, and 40% had a history of serious mental illness. More than one-fourth (n = 77) of the patients admitted to the intensive outpatient SATP were seropositive for hepatitis A, B and/or C, and the most common hepatitis diagnosis was hepatitis C (n = 71).
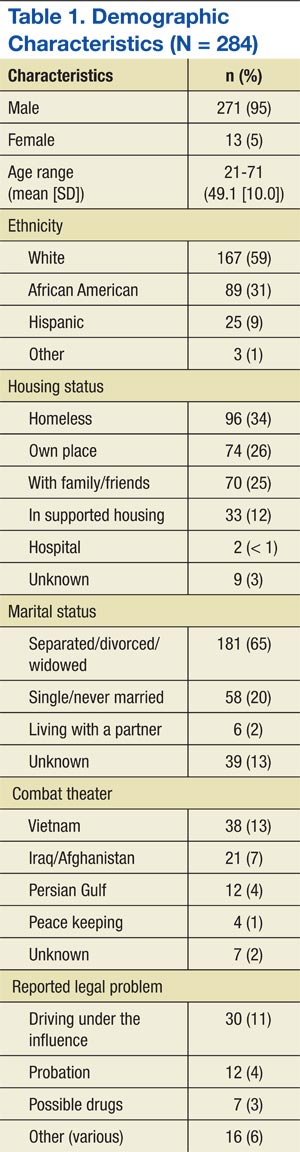
Accelerated Immunization Regimen
Patients were eligible to receive the accelerated vaccination schedule only if they had no prior immunization for hepatitis A or B and if they had no seroconversion for either hepatitis A or B. Six people had hepatitis B alone, 7 had hepatitis B and C, 1 had hepatitis A and C, and 1 had all 3 (Table 2). Thus, 15 participants were ineligible to receive the accelerated hepatitis A/B immunization. Chi-square, Fisher exact, and independent sample t tests showed that among those who were vaccination-eligible (269), there were no significant differences in any of the demographic or clinical characteristics between those who initiated the vaccination schedule and those who did not. Among those who completed the first 3 vaccine injections, those who received the 1-year booster injection (54) did not differ (on any demographic or clinical variables) from those who did not (58).
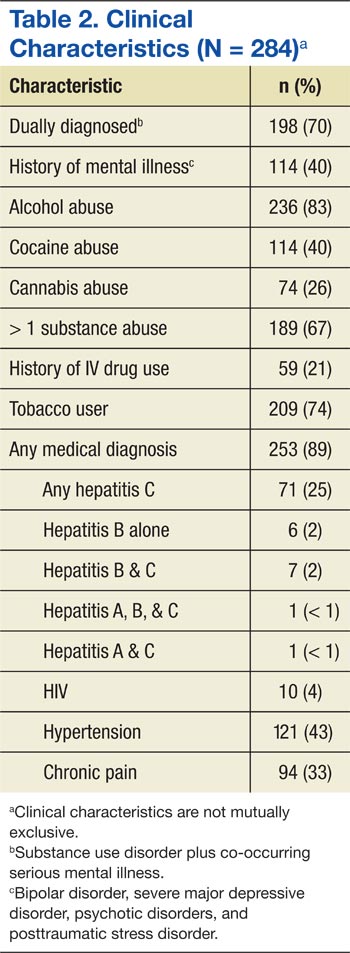
Nearly half (48%) of all the eligible patients admitted to the program began the accelerated immunization schedule for hepatitis A and B. Of those, 88% completed the first 3 injections in the series. Among the patients who received the first 3 injections, 48% received the 1-year booster injection—a 20% completion rate for the vaccination-eligible sample overall (Table 3).
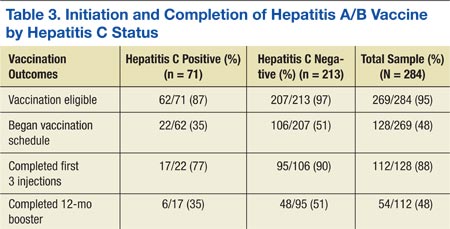
Of the 74 patients who did not complete their vaccinations once initiating the accelerated schedule, the most common reason identified was that the patient moved away (37), or no reason could be identified (33). It was uncommon for a patient not to complete the vaccination schedule because of terminating treatment prematurely (4).
Compared with the vaccine-eligible patients without hepatitis C (207), patients with hepatitis C were less likely to receive any vaccination injections (Table 3). Specifically, 51% of the vaccination-eligible patients who did not have hepatitis C began the vaccination regimen. However, only 22 patients with hepatitis C, or
35% of all vaccination-eligible patients with hepatitis C, began the vaccination regimen. Patients with hepatitis C were also less likely than those without hepatitis C to complete the first 3 injections of the vaccination series once they had initiated it (77%, vs 90%, respectively). This difference continued to be apparent at the time of the 12-month booster injection. Only 35% of vaccine-eligible individuals with hepatitis C received the 12-month booster injection, whereas 51% of vaccination-eligible individuals without hepatitis C received the 12-month booster injection. As with the sample overall, the most common reason patients with hepatitis C did not complete the vaccination regimen was because they moved away (9), followed by no identified reason (5), and premature termination of treatment (2).
Discussion
Individuals abusing alcohol and drugs have an increased vulnerability for infectious diseases, and homeless veterans with substance use disorders may be at a particularly heightened risk.21,22 This study describes a sample of veterans, many were homeless and most were dually diagnosed, in an intensive outpatient SATP that offered an accelerated dosing regimen for hepatitis A and B vaccination. Almost half (48%) of the vaccination-eligible patients began the accelerated regimen for hepatitis A/B vaccination. Moreover, 88% of those who started the vaccination regimen received the first 3 injections of the series, thus possibly conferring substantial immunity to hepatitis A and B and demonstrating the feasibility of an accelerated vaccination schedule in an intensive outpatient SATP.
It is especially important to demonstrate the successful integration of a hepatitis screening and immunization program within a SATP, given that many such programs do not offer screening or immunization for hepatitis, even though substance abusers are disproportionately affected by the disease and contribute greatly to the ongoing hepatitis epidemic.10,11 This study’s results were in line with another study of rapid vaccination for hepatitis B in IV drug users being treated in a methadone clinic, where 83% of the vaccination initiators completed the first 3 injections of the series.9
Unvaccinated Patients
The treatment team in the current study seemed to be less effective at reaching the subset of vaccination-eligible veterans with hepatitis C (almost one-quarter of the sample) in order to administer the accelerated vaccination schedule, as indicated by the lower rate of vaccination initiation as well as a lower rate of completion of the vaccination series among those patients. This replicates a finding from another study that also indicated a low rate of hepatitis A and B vaccination among patients with hepatitis C.23 Only 35% of the vaccination-eligible patients with hepatitis C in the current study initiated the vaccination series, compared with 51% of the patients without hepatitis C. However, the rate of completion of the first 3 injections of the series in the hepatitis C group was respectably high (77%), especially given the high relapse rate and psychosocial instability of individuals with addictive disorders. Initiation seems to be a bigger obstacle than completion of at least the first 3 injections of the vaccination series in both patients with and without hepatitis C.
The study investigators did not formally assess the reasons that more than half the patients in the study did not begin the vaccination series, but anecdotal evidence from the nurses indicated that many patients were afraid of needles. In addition, other patients felt that they simply did not need the vaccination. Some also insisted that they had already had the vaccination despite a blood test showing no evidence for either hepatitis A or B immunization.
Although the nursing team provided group and individual risk-based education as well as information about the effects of continued substance abuse on hepatitis C, it is possible that patients still underestimated their own risk of hepatitis infection and its consequences, or perhaps the information was simply not retained.24
Patient Education
A recent study showed that there is a positive relationship between the amount of hepatitis counseling received and knowledge of hepatitis.25 Possibly, increased intensity of education efforts may make an impact on initiation rates. Encouragingly, there is also evidence that prompting people to predict their future vaccination behavior may increase vaccination initiation rates despite a high-degree of short-term barriers, such as perceived pain or inconvenience.26 A brief intervention to induce people to formulate their future intentions would be relatively easy to incorporate into a vaccination program, and the study team is considering options for this to improve vaccination initiation rates.
Patients can expect to achieve substantial immunity from hepatitis A and, to a lesser degree, hepatitis B after completing the first 3 injections of the series, although the best seroprotection from both is obtained by completing the 12-month booster injection as well.17 Overall, about half of all patients who completed the first 3 injections returned for the booster shot, but only 35% of the patients with hepatitis C did so. The most common known cause of any patient not receiving the booster was movement out of the geographic area. However, much of the time the investigators were unable to determine the reasons patients did not return for the booster shot.
Medication adherence is a difficult problem with vaccination in high-risk samples, although Stitzer and colleagues found a significant improvement in follow-up for a 6-month vaccination protocol by using monetary incentives.27 In addition to ensuring medication adherence, it would also be of value for future immunization efforts to include testing to assess whether seroconversion has occurred once the vaccinations are complete, which is the ultimate measure of the success of a vaccination program. Most patients in the current study did not receive such testing at the completion of their vaccination schedules, and thus, seroconversion rates could not be determined. However, existing studies suggest high rates of seroprotection after the first 3 doses of the combined vaccine.10,17
Limitations
The retrospective nature of the study is its most significant limitation. Any conclusions about the results must be made with caution. However, this design allowed for a naturalistic and potentially generalizable investigation into the application of a vaccination program in a real-world treatment setting. As such, the investigators were able to demonstrate the feasibility of conducting a rapid vaccination program within a 3- to 6-week SATP.
The retrospective nature of the study also limited a full investigation into the reasons behind the lack of vaccination initiation and vaccination noncompletion among the study’s treatment population, especially with regard to the follow-up booster injection. Initial statistical comparisons of initiators and noninitiators and completers and noncompleters showed no significant statistical differences between the groups. Future prospective designs should take into account the need to successfully initiate and complete vaccinations for all eligible patients and include assessment measures to determine the specific reasons that patients did not initiate or complete their vaccinations.
Conclusions
Many patients began and completed the accelerated vaccination schedule for hepatitis A and B in the context of a 3- to 6-week SATP at JAHVH. The overall vaccination rate, including the 12-month booster injection, was one-fifth of the entire vaccination-eligible sample. Additionally, 88% of the vaccination-eligible patients who began the vaccination schedule (or 42% of the whole sample) completed at least the first 3 doses, which may confer substantial immunity from hepatitis A and B. For reasons not entirely clear, a little less than half the vaccination-eligible patients began the vaccination schedule, and only about 50% of those returned to receive their 12-month booster injection. Future prospective studies may be able to determine barriers to both the initiation of and adherence to the vaccination protocol.
The results of this study are also a testament to having primary care nursing staff available and actively involved in the care of patients in a SATP. It seems likely that additional interventions might be needed for outreach to and retention of patients in need of vaccination for hepatitis A and B, and particularly those patients with hepatitis C. It is important to find ways to increase the rates of 12-month booster vaccinations, both for veterans who continue to receive services at JAHVH and for those who transfer care to other VA facilities. Finally, testing to confirm serologic immunity to hepatitis A and hepatitis B would be the next step in the effort to eliminate the risk of hepatitis A and hepatitis B and minimize additional harm for those with hepatitis C in the population receiving treatment for addictive disorders.
Author disclosures
The authors report no actual or potential conflicts of interest with regard to this article.
Disclaimer
The opinions expressed herein are those of the authors and do not necessarily reflect those of Federal Practitioner, Frontline Medical Communications Inc., the U.S. Government, or any of its agencies. This article may discuss unlabeled or investigational use of certain drugs. Please review the complete prescribing information for specific drugs or drug combinations—including indications, contraindications, warnings, and adverse effects—before administering pharmacologic therapy to patients.
1. Nyamathi A, Liu Y, Marfisee M, et al. Effects of a nurse-managed program on hepatitis A and B vaccine completion among homeless adults. Nurs Res. 2009;58(1):13-22.
2. Center for Disease Control and Prevention (CDC). A comprehensive immunization strategy to eliminate transmission of hepatitis B virus infection in the United States. MMWR Morb Mortal Wkly Rep. 2006;55(RR16):1-25.
3. Advisory Committee on Immunization Practices (ACIP), Fiore AE, Wasley A, Bell BP. Prevention of hepatitis A through active or passive immunization: recommendations of the Advisory Committee on Immunization Practices (ACIP). MMWR Morb Mortal Wkly Rep. 2006;55(RR07):1-23.
4. Weltman MD, Brotodihardjo A, Crewe EB, et al. Coinfection with hepatitis B and C or B, C and delta viruses results in severe chronic liver disease and responds poorly to interferon-alpha treatment. J Viral Hepat. 1995;2(1):39-45.
5. Groessl EJ, Weingart KR, Kaplan RM, et al. Living with hepatitis C: qualitative interviews with hepatitis C-infected veterans. J Gen Intern Med. 2008;23(12):1959-1965.
6. Dominitz JA, Boyko EJ, Koepsell TD, et al. Elevated prevalence of hepatitis C infection in users of United States veterans medical centers. Hepatology. 2005;41(1):88-96.
7. Himeloch S, McCarthy JF, Ganoczy D, et al. Understanding associations between serious mental illness and hepatitis C virus among veterans: a national multivariate analysis. Psychosomatics. 2009;50(1):30-37.
8. Hagedorn H, Dieperink E, Dingmann D, et al. Integrating hepatitis prevention services into a substance use disorder clinic. J Subst Abuse Treat. 2007;32(4):391-398.
9. Ramasamy P, Lintzeris N, Sutton Y, Taylor H, Day CA, Haber PS. The outcome of a rapid hepatitis B vaccination programme in a methadone treatment clinic. Addiction. 2010;105(2):329-334.
10. Bini EJ, Kritz S, Brown LS Jr, et al. Hepatitis B virus and hepatitis C virus services offered by substance abuse treatment programs in the United States. J Subst Abuse Treat. 2012;42(4):438-445.
11. Recommendations for prevention and control of hepatitis C virus (HCV) infection and HCV-related chronic disease. Centers for Disease Control and Prevention. MMWR Morb Mortal Wkly Rep. 1998;47(RR-19):1-39.
12. Francis E, Gonzales-Nolas CL, Markowitz J, Phillips S. Integration of preventive health screening into mental health clinics. Fed Pract. 2008;25(2):39-50.
13. Vreeland B. Bridging the gap between mental and physical health: a multidisciplinary approach. J Clin Psychiatry. 2007;68(suppl 4):26-33.
14. Brim N, Zaller N, Taylor LE, Feller E. Twinrix vaccination schedules among injecting drug users. Expert Opin Biol Ther. 2007;7(3):379-389.
15. Zuckerman J. The place of accelerated schedules for hepatitis A and B vaccinations. Drugs. 2003;63(17):1779-1784.
16. Connor BA, Blatter MM, Beran J, Zou B, Trofa AF. Rapid and sustained immune response against hepatitis A and B achieved with combined vaccine using an accelerated administration schedule. J Travel Med. 2007;14(1):9-15.
17. Nothdurft HD, Dietrich M, Zuckerman JN, et al. A new accelerated vaccination schedule for rapid protection against hepatitis A and B. Vaccine. 2002;20(7-8):1157-1162.
18. American Psychiatric Association. Diagnostic and Statistical Manual of Mental Disorders, 4th Edition, Text Revision (DSM-IV-TR). Washington, DC: American Psychiatric Association; 2000.
19. Heatherton TF, Kozlowski LT, Frecker RC, Fagerström KO. The Fagerström Test for Nicotine Dependence: a revision of the Fagerström Tolerance Questionnaire. Br J Addict. 1991;86(9):1119-1127.
20. McLellan AT, Kushner H, Metzger D, et al. The Fifth Edition of the Addiction Severity Index. J Subst Abuse Treat. 1992;9(3):199-213.
21. Batki SL, Nathan KI. HIV/AIDS and Hepatitis C. In: Galanter M, Kleber HD, Brady KT, eds. The American Psychiatric Publishing Textbook of Substance Abuse Treatment. 5th ed. Arlington, VA: American Psychiatric Publishing; 2015.
22. Gelberg L, Robertson MJ, Leake B, et al. Hepatitis B among homeless and other impoverished US military veterans in residential care in Los Angeles. Public Health. 2001;115(4):286-291.
23. Felsen UR, Fishbein DA, Litwin AH. Low rates of hepatitis A and B vaccination in patients with chronic hepatitis C at an urban methadone maintenance program. J Addict Dis. 2010;29(4):461-465.
24. Brewer NT, Chapman GB, Gibbons FX, Gerrard M, McCaul KD, Weinstein ND. Meta-analysis of the relationship between risk perception and health behavior: the example of vaccination. Health Psychol. 2007;26(2):136-145.
25. Soto-Salgado M, Suárez E, Ortiz AP, et al. Knowledge of viral hepatitis among Puerto Rican adults: implications for prevention. J Community Health. 2011;36(4):565-573.
26. Cox AD, Cox D, Cyrier R, Graham-Dotson Y, Zimet GD. Can self-prediction overcome barriers to hepatitis B vaccination? A randomized controlled trial. Health Psychol. 2012;31(1):97-105.
27. Stitzer ML, Polk T, Bowles S, Kosten T. Drug users’ adherence to a 6-month vaccination protocol: effects of motivational incentives. Drug Alcohol Depend. 2010;107(1):76-79.
Homeless individuals and IV drug users are susceptible to hepatitis A, B, and C infections, and co-infection with these diseases may complicate treatment and result in poor medical outcomes.1 Vaccination offers the best protection against hepatitis A and B, particularly among high-risk populations.2,3 Immunization against hepatitis A and B is of even greater importance for patients with hepatitis C, because there is no specific hepatitis C vaccine, and concomitant infections of B with C are damaging to the liver.4
Veterans have a rate of hepatitis C infection that is 3 times that of the general population.5 Some evidence exists that veterans with serious mental illness (SMI) have a higher rate of hepatitis C infection relative to patients without SMI. Co-occurring substance abuse may add another layer of vulnerability to hepatitis C infection, particularly for homeless veterans.5-7
Mental Health and Primary Care Integration
Substance abuse and dual-diagnosis treatment programs (ie, those programs that treat both substance abuse and co-occurring serious mental health problems, such as bipolar disorder, severe major depressive disorder, psychotic disorders, and posttraumatic stress disorder [PTSD]) that have integrated mental health and primary care into their treatment programs may offer a window of opportunity for risk-reducing interventions. These interventions include testing and education of patients regarding infectious diseases, such as viral hepatitis and HIV, and completion of the hepatitis A/B immunization series.
The James A. Haley Veterans’ Hospital (JAHVH) in Tampa, Florida, has demonstrated some limited success in the past with integrating a standard dosing schedule for hepatitis A/B vaccination into its substance abuse treatment program (SATP), though recent evidence points to more promising results using an accelerated regimen as indicated by a high completion rate for hepatitis B vaccination in a methadone clinic.8,9 A relatively low proportion of SATPs in the U.S. provide testing, education, or vaccination for hepatitis A and B, especially considering the public health importance of controlling these diseases in the substance abusing populations.10,11
Related: Combination Pill Approved for HCV
In 1999, a primary care team was added to the alcohol and drug abuse treatment program at JAHVH.In 2005, the nurses in the program began scheduling vaccinations and screening patients for medical and psychiatric issues, pain, hypertension, diabetes, hepatitis C, alcohol use, depression, PTSD, prostate and colorectal cancers.12 Such a multidisciplinary approach provides many treatment advantages for patients and may save lives.13
Even with a multidisciplinary approach, the nurses found it difficult to provide adequate hepatitis A/B immunization within the 3- to 6-week intensive SATP, because standard immunization dosing regimens are spread over 6 months.14 As with all types of immunizations, long dosing schedules may reduce patient adherence and result in inadequate seroprotection.15 Thus, there is a need to provide a completed immunization series in a more expeditious fashion, and an accelerated dosing regimen makes that possible.15,16
Hepatitis A/B Vaccination
Twinrix (GlaxoSmithKline, Brentford, United Kingdom) is a vaccine that provides dual immunization for hepatitis A and B. Whereas the standard vaccination schedule takes 6 months to complete, the accelerated dosing schedule can be used to complete the first 3 doses in less than a month. The accelerated dosing schedule was incorporated into the JAHVH clinic to capture as many patients as possible in the 3- to 6-week time frame: The first dose is administered and followed by a second dose 7 days later. The third dose is administered 21 to 30 days after the first dose. Twelve months after the first dose, a booster dose is given.
After the first 3 accelerated doses, > 98% of patients show a sustained immune response to hepatitis A, and > 63% demonstrate immunity to hepatitis B. If a 12-month booster injection is given, 100% of patients may receive immunity to hepatitis A and > 96% may have immunity to hepatitis B.16 Another study of the combined vaccine showed even greater seroprotection for hepatitis A and B after only 1 month, 100% and 82%, respectively.17
Related: Viral Hepatitis Awareness
This JAHVH retrospective feasibility study describes a risk-reduction program for hepatitis A/B prevention that was implemented within a 3- to 4-week intensive outpatient SATP and a 6-week dual-diagnosis treatment program. The study includes the development and implementation of the program, designed to vaccinate patients using the accelerated Twinrix schedule. To ascertain the feasibility of this vaccination approach, historical medical records were used to describe and examine the vaccination initiation and follow-up rates of the treatment program participants who received the hepatitis A/B immunization series during their intensive SATP.
Study Design
A retrospective review of medical records was conducted for all participants who were admitted to the intensive JAHVH SATP between October 1, 2008, and September 30, 2009. This study was reviewed and approved by the JAHVH research and development committee and its associated University of South Florida institutional review board. Informed consent to participate was not obtained, because the study was retrospective.
Patient Identification and Education
All program participants were offered testing for HIV and hepatitis A, B, and C. Program participants were educated about hepatitis and HIV transmission, as well as about the long-term effects of continued substance abuse on the progression of hepatitis C. Education about hepatitis, HIV, and substance abuse was provided in a group setting by a member of the program’s nursing staff. One-on-one risk education counseling was also provided when requested or otherwise indicated.
Laboratory testing was performed following each participant’s initial physical examination (within 3 to 5 days of program admission), and the nursing staff reviewed the results before vaccination. Explanation of laboratory results and an individualized immunization regimen were provided to each participant. On review of participants’ laboratory results, those with seroconversion of both hepatitis A and B were not given the combined immunization. Participants who had seroconversion of hepatitis A were offered the hepatitis B vaccination series, and vice versa.
Immunization Process
Participants who lacked prior immunization for hepatitis A and B and had no seroconversion of either hepatitis A or B were offered vaccination. Some patients declined vaccination, even though they were eligible. Their reasons were not formally assessed.
Related: Nivolumab Approved for Expanded Indication
Patients who accepted the vaccination were given the accelerated regimen.16 Participants were educated on the importance of compliance with the vaccination series and provided with follow-up immunization dates and a reminder for the 1-year booster vaccine. The immunizations were ordered by the program’s primary care NP and administered by a licensed practical nurse. The nurse who administered the injections took responsibility for scheduling the patients for all their subsequent injections, including the 1-year booster.
Follow-up Care
If the third injection was not completed before discharge, patients were given a follow-up appointment with the nurse if they remained in the JAHVH service area. If they were leaving the area, they were given instructions on how to follow-up at another VA facility to continue their immunization schedule. A note was written in the electronic medical record documenting their abbreviated hepatitis A/B immunization schedule, which could be accessed by other providers at other VA facilities. Patients who did not show up for any follow-up appointments (third injection or the 1-year booster injection) were contacted and reminded about the importance of completing the immunization series and to schedule an appointment.
Statistical Analysis
All data were analyzed using IBM Statistical Package for the Social Sciences (IBM SPSS, Armonk, New York) with a focus on identifying differences between vaccination-eligible patients (n = 269) who did (n = 128) and did not (n = 141) initiate the immunization schedule during the treatment program. Chi-square and Fisher exact tests were used to assess statistical differences in initiation of the immunization schedule related to categoric variables (ie, marital status, race, history of IV drug abuse, cigarette smoking status, housing status, legal status, history of combat, having a psychiatric or medical diagnosis, and program track). Independent sample t tests were used to test for differences between these 2 groups on the continuous variables, including age, number of previous treatment programs, Global Assessment of Functioning score, severity of smoking dependence as measured by the Fagerström Test for Nicotine Dependence, and the Addiction Severity Index scales.18-20
Results
The sample consisted of 284 successive admissions to an intensive outpatient program for veterans with substance use disorders. About one-third of the patients were homeless at the time of admission to the treatment, and 87% required contracted housing while completing treatment for reasons related to lack of housing, transportation, clinical necessity, or a combination of those factors (Table 1). The most common substance problems were alcohol and cocaine dependence, and 21% (n = 59) of the patients acknowledged a history of IV drug use during their initial psychiatric evaluation. Seventy percent were dually diagnosed with some other Axis I disorder, and 40% had a history of serious mental illness. More than one-fourth (n = 77) of the patients admitted to the intensive outpatient SATP were seropositive for hepatitis A, B and/or C, and the most common hepatitis diagnosis was hepatitis C (n = 71).
Accelerated Immunization Regimen
Patients were eligible to receive the accelerated vaccination schedule only if they had no prior immunization for hepatitis A or B and if they had no seroconversion for either hepatitis A or B. Six people had hepatitis B alone, 7 had hepatitis B and C, 1 had hepatitis A and C, and 1 had all 3 (Table 2). Thus, 15 participants were ineligible to receive the accelerated hepatitis A/B immunization. Chi-square, Fisher exact, and independent sample t tests showed that among those who were vaccination-eligible (269), there were no significant differences in any of the demographic or clinical characteristics between those who initiated the vaccination schedule and those who did not. Among those who completed the first 3 vaccine injections, those who received the 1-year booster injection (54) did not differ (on any demographic or clinical variables) from those who did not (58).
Nearly half (48%) of all the eligible patients admitted to the program began the accelerated immunization schedule for hepatitis A and B. Of those, 88% completed the first 3 injections in the series. Among the patients who received the first 3 injections, 48% received the 1-year booster injection—a 20% completion rate for the vaccination-eligible sample overall (Table 3).
Of the 74 patients who did not complete their vaccinations once initiating the accelerated schedule, the most common reason identified was that the patient moved away (37), or no reason could be identified (33). It was uncommon for a patient not to complete the vaccination schedule because of terminating treatment prematurely (4).
Compared with the vaccine-eligible patients without hepatitis C (207), patients with hepatitis C were less likely to receive any vaccination injections (Table 3). Specifically, 51% of the vaccination-eligible patients who did not have hepatitis C began the vaccination regimen. However, only 22 patients with hepatitis C, or
35% of all vaccination-eligible patients with hepatitis C, began the vaccination regimen. Patients with hepatitis C were also less likely than those without hepatitis C to complete the first 3 injections of the vaccination series once they had initiated it (77%, vs 90%, respectively). This difference continued to be apparent at the time of the 12-month booster injection. Only 35% of vaccine-eligible individuals with hepatitis C received the 12-month booster injection, whereas 51% of vaccination-eligible individuals without hepatitis C received the 12-month booster injection. As with the sample overall, the most common reason patients with hepatitis C did not complete the vaccination regimen was because they moved away (9), followed by no identified reason (5), and premature termination of treatment (2).
Discussion
Individuals abusing alcohol and drugs have an increased vulnerability for infectious diseases, and homeless veterans with substance use disorders may be at a particularly heightened risk.21,22 This study describes a sample of veterans, many were homeless and most were dually diagnosed, in an intensive outpatient SATP that offered an accelerated dosing regimen for hepatitis A and B vaccination. Almost half (48%) of the vaccination-eligible patients began the accelerated regimen for hepatitis A/B vaccination. Moreover, 88% of those who started the vaccination regimen received the first 3 injections of the series, thus possibly conferring substantial immunity to hepatitis A and B and demonstrating the feasibility of an accelerated vaccination schedule in an intensive outpatient SATP.
It is especially important to demonstrate the successful integration of a hepatitis screening and immunization program within a SATP, given that many such programs do not offer screening or immunization for hepatitis, even though substance abusers are disproportionately affected by the disease and contribute greatly to the ongoing hepatitis epidemic.10,11 This study’s results were in line with another study of rapid vaccination for hepatitis B in IV drug users being treated in a methadone clinic, where 83% of the vaccination initiators completed the first 3 injections of the series.9
Unvaccinated Patients
The treatment team in the current study seemed to be less effective at reaching the subset of vaccination-eligible veterans with hepatitis C (almost one-quarter of the sample) in order to administer the accelerated vaccination schedule, as indicated by the lower rate of vaccination initiation as well as a lower rate of completion of the vaccination series among those patients. This replicates a finding from another study that also indicated a low rate of hepatitis A and B vaccination among patients with hepatitis C.23 Only 35% of the vaccination-eligible patients with hepatitis C in the current study initiated the vaccination series, compared with 51% of the patients without hepatitis C. However, the rate of completion of the first 3 injections of the series in the hepatitis C group was respectably high (77%), especially given the high relapse rate and psychosocial instability of individuals with addictive disorders. Initiation seems to be a bigger obstacle than completion of at least the first 3 injections of the vaccination series in both patients with and without hepatitis C.
The study investigators did not formally assess the reasons that more than half the patients in the study did not begin the vaccination series, but anecdotal evidence from the nurses indicated that many patients were afraid of needles. In addition, other patients felt that they simply did not need the vaccination. Some also insisted that they had already had the vaccination despite a blood test showing no evidence for either hepatitis A or B immunization.
Although the nursing team provided group and individual risk-based education as well as information about the effects of continued substance abuse on hepatitis C, it is possible that patients still underestimated their own risk of hepatitis infection and its consequences, or perhaps the information was simply not retained.24
Patient Education
A recent study showed that there is a positive relationship between the amount of hepatitis counseling received and knowledge of hepatitis.25 Possibly, increased intensity of education efforts may make an impact on initiation rates. Encouragingly, there is also evidence that prompting people to predict their future vaccination behavior may increase vaccination initiation rates despite a high-degree of short-term barriers, such as perceived pain or inconvenience.26 A brief intervention to induce people to formulate their future intentions would be relatively easy to incorporate into a vaccination program, and the study team is considering options for this to improve vaccination initiation rates.
Patients can expect to achieve substantial immunity from hepatitis A and, to a lesser degree, hepatitis B after completing the first 3 injections of the series, although the best seroprotection from both is obtained by completing the 12-month booster injection as well.17 Overall, about half of all patients who completed the first 3 injections returned for the booster shot, but only 35% of the patients with hepatitis C did so. The most common known cause of any patient not receiving the booster was movement out of the geographic area. However, much of the time the investigators were unable to determine the reasons patients did not return for the booster shot.
Medication adherence is a difficult problem with vaccination in high-risk samples, although Stitzer and colleagues found a significant improvement in follow-up for a 6-month vaccination protocol by using monetary incentives.27 In addition to ensuring medication adherence, it would also be of value for future immunization efforts to include testing to assess whether seroconversion has occurred once the vaccinations are complete, which is the ultimate measure of the success of a vaccination program. Most patients in the current study did not receive such testing at the completion of their vaccination schedules, and thus, seroconversion rates could not be determined. However, existing studies suggest high rates of seroprotection after the first 3 doses of the combined vaccine.10,17
Limitations
The retrospective nature of the study is its most significant limitation. Any conclusions about the results must be made with caution. However, this design allowed for a naturalistic and potentially generalizable investigation into the application of a vaccination program in a real-world treatment setting. As such, the investigators were able to demonstrate the feasibility of conducting a rapid vaccination program within a 3- to 6-week SATP.
The retrospective nature of the study also limited a full investigation into the reasons behind the lack of vaccination initiation and vaccination noncompletion among the study’s treatment population, especially with regard to the follow-up booster injection. Initial statistical comparisons of initiators and noninitiators and completers and noncompleters showed no significant statistical differences between the groups. Future prospective designs should take into account the need to successfully initiate and complete vaccinations for all eligible patients and include assessment measures to determine the specific reasons that patients did not initiate or complete their vaccinations.
Conclusions
Many patients began and completed the accelerated vaccination schedule for hepatitis A and B in the context of a 3- to 6-week SATP at JAHVH. The overall vaccination rate, including the 12-month booster injection, was one-fifth of the entire vaccination-eligible sample. Additionally, 88% of the vaccination-eligible patients who began the vaccination schedule (or 42% of the whole sample) completed at least the first 3 doses, which may confer substantial immunity from hepatitis A and B. For reasons not entirely clear, a little less than half the vaccination-eligible patients began the vaccination schedule, and only about 50% of those returned to receive their 12-month booster injection. Future prospective studies may be able to determine barriers to both the initiation of and adherence to the vaccination protocol.
The results of this study are also a testament to having primary care nursing staff available and actively involved in the care of patients in a SATP. It seems likely that additional interventions might be needed for outreach to and retention of patients in need of vaccination for hepatitis A and B, and particularly those patients with hepatitis C. It is important to find ways to increase the rates of 12-month booster vaccinations, both for veterans who continue to receive services at JAHVH and for those who transfer care to other VA facilities. Finally, testing to confirm serologic immunity to hepatitis A and hepatitis B would be the next step in the effort to eliminate the risk of hepatitis A and hepatitis B and minimize additional harm for those with hepatitis C in the population receiving treatment for addictive disorders.
Author disclosures
The authors report no actual or potential conflicts of interest with regard to this article.
Disclaimer
The opinions expressed herein are those of the authors and do not necessarily reflect those of Federal Practitioner, Frontline Medical Communications Inc., the U.S. Government, or any of its agencies. This article may discuss unlabeled or investigational use of certain drugs. Please review the complete prescribing information for specific drugs or drug combinations—including indications, contraindications, warnings, and adverse effects—before administering pharmacologic therapy to patients.
1. Nyamathi A, Liu Y, Marfisee M, et al. Effects of a nurse-managed program on hepatitis A and B vaccine completion among homeless adults. Nurs Res. 2009;58(1):13-22.
2. Center for Disease Control and Prevention (CDC). A comprehensive immunization strategy to eliminate transmission of hepatitis B virus infection in the United States. MMWR Morb Mortal Wkly Rep. 2006;55(RR16):1-25.
3. Advisory Committee on Immunization Practices (ACIP), Fiore AE, Wasley A, Bell BP. Prevention of hepatitis A through active or passive immunization: recommendations of the Advisory Committee on Immunization Practices (ACIP). MMWR Morb Mortal Wkly Rep. 2006;55(RR07):1-23.
4. Weltman MD, Brotodihardjo A, Crewe EB, et al. Coinfection with hepatitis B and C or B, C and delta viruses results in severe chronic liver disease and responds poorly to interferon-alpha treatment. J Viral Hepat. 1995;2(1):39-45.
5. Groessl EJ, Weingart KR, Kaplan RM, et al. Living with hepatitis C: qualitative interviews with hepatitis C-infected veterans. J Gen Intern Med. 2008;23(12):1959-1965.
6. Dominitz JA, Boyko EJ, Koepsell TD, et al. Elevated prevalence of hepatitis C infection in users of United States veterans medical centers. Hepatology. 2005;41(1):88-96.
7. Himeloch S, McCarthy JF, Ganoczy D, et al. Understanding associations between serious mental illness and hepatitis C virus among veterans: a national multivariate analysis. Psychosomatics. 2009;50(1):30-37.
8. Hagedorn H, Dieperink E, Dingmann D, et al. Integrating hepatitis prevention services into a substance use disorder clinic. J Subst Abuse Treat. 2007;32(4):391-398.
9. Ramasamy P, Lintzeris N, Sutton Y, Taylor H, Day CA, Haber PS. The outcome of a rapid hepatitis B vaccination programme in a methadone treatment clinic. Addiction. 2010;105(2):329-334.
10. Bini EJ, Kritz S, Brown LS Jr, et al. Hepatitis B virus and hepatitis C virus services offered by substance abuse treatment programs in the United States. J Subst Abuse Treat. 2012;42(4):438-445.
11. Recommendations for prevention and control of hepatitis C virus (HCV) infection and HCV-related chronic disease. Centers for Disease Control and Prevention. MMWR Morb Mortal Wkly Rep. 1998;47(RR-19):1-39.
12. Francis E, Gonzales-Nolas CL, Markowitz J, Phillips S. Integration of preventive health screening into mental health clinics. Fed Pract. 2008;25(2):39-50.
13. Vreeland B. Bridging the gap between mental and physical health: a multidisciplinary approach. J Clin Psychiatry. 2007;68(suppl 4):26-33.
14. Brim N, Zaller N, Taylor LE, Feller E. Twinrix vaccination schedules among injecting drug users. Expert Opin Biol Ther. 2007;7(3):379-389.
15. Zuckerman J. The place of accelerated schedules for hepatitis A and B vaccinations. Drugs. 2003;63(17):1779-1784.
16. Connor BA, Blatter MM, Beran J, Zou B, Trofa AF. Rapid and sustained immune response against hepatitis A and B achieved with combined vaccine using an accelerated administration schedule. J Travel Med. 2007;14(1):9-15.
17. Nothdurft HD, Dietrich M, Zuckerman JN, et al. A new accelerated vaccination schedule for rapid protection against hepatitis A and B. Vaccine. 2002;20(7-8):1157-1162.
18. American Psychiatric Association. Diagnostic and Statistical Manual of Mental Disorders, 4th Edition, Text Revision (DSM-IV-TR). Washington, DC: American Psychiatric Association; 2000.
19. Heatherton TF, Kozlowski LT, Frecker RC, Fagerström KO. The Fagerström Test for Nicotine Dependence: a revision of the Fagerström Tolerance Questionnaire. Br J Addict. 1991;86(9):1119-1127.
20. McLellan AT, Kushner H, Metzger D, et al. The Fifth Edition of the Addiction Severity Index. J Subst Abuse Treat. 1992;9(3):199-213.
21. Batki SL, Nathan KI. HIV/AIDS and Hepatitis C. In: Galanter M, Kleber HD, Brady KT, eds. The American Psychiatric Publishing Textbook of Substance Abuse Treatment. 5th ed. Arlington, VA: American Psychiatric Publishing; 2015.
22. Gelberg L, Robertson MJ, Leake B, et al. Hepatitis B among homeless and other impoverished US military veterans in residential care in Los Angeles. Public Health. 2001;115(4):286-291.
23. Felsen UR, Fishbein DA, Litwin AH. Low rates of hepatitis A and B vaccination in patients with chronic hepatitis C at an urban methadone maintenance program. J Addict Dis. 2010;29(4):461-465.
24. Brewer NT, Chapman GB, Gibbons FX, Gerrard M, McCaul KD, Weinstein ND. Meta-analysis of the relationship between risk perception and health behavior: the example of vaccination. Health Psychol. 2007;26(2):136-145.
25. Soto-Salgado M, Suárez E, Ortiz AP, et al. Knowledge of viral hepatitis among Puerto Rican adults: implications for prevention. J Community Health. 2011;36(4):565-573.
26. Cox AD, Cox D, Cyrier R, Graham-Dotson Y, Zimet GD. Can self-prediction overcome barriers to hepatitis B vaccination? A randomized controlled trial. Health Psychol. 2012;31(1):97-105.
27. Stitzer ML, Polk T, Bowles S, Kosten T. Drug users’ adherence to a 6-month vaccination protocol: effects of motivational incentives. Drug Alcohol Depend. 2010;107(1):76-79.
The VA/DoD Chronic Effects of Neurotrauma Consortium: An Overview at Year 1
The Chronic Effects of Neuro-trauma Consortium (CENC) is a federally funded research project devised to address the long-term effects of mild traumatic brain injury (mTBI) in military service members (SMs) and veterans. Announced by President Barack Obama on August 20, 2013, the CENC is one of 2 major initiatives developed in response to injuries incurred by U.S. service personnel during Operation Enduring Freedom (OEF) and Operation Iraqi Freedom (OIF) as part of the National Research Action Plan. The CENC is jointly funded by the DoD and the VA, with a budget of $62.175 million over 5 years.
The consortium funds basic science, clinical, and translational research efforts with a closely integrated supportive infrastructure, including administrative services, regulatory guidance, study design, biostatistical consultation, data management, common data element application, and interdisciplinary communication. In addition, the consortium facilitates and integrates the activities of a diverse group of skilled specialty research teams, allowing them to fully focus their efforts on understanding and clarifying the relationship between combat-related mTBI and chronic neurotrauma effects, including neurodegeneration.
Background
Nearly 20% of the more than 2.6 million U.S. SMs deployed since 2003 to OEF and OIF have sustained at least 1 TBI, predominantly mTBI. Almost 8% of all OEF/OIF veterans demonstrate persistent post-TBI symptoms more than 6 months postinjury. Acute mTBI effects are typically transient, with headache, cognitive, behavioral, balance, and sleep symptoms most often seen, but symptoms may persist and even lead to lifelong disability. In these individuals, additional chronic effects, such as neuroendocrinologic abnormalities, seizures and seizurelike disorders, fatigue, vision and hearing abnormalities, and numerous other somatic symptoms are more common over time. The long-term effects from single or repeated mTBIs on the persistence of these symptoms, on combat and trauma-related comorbidities, and on long-term brain functioning are unknown.
Increasing evidence supports the link between both concussions and combat-related trauma with chronic traumatic encephalopathy (CTE), which results in progressive cognitive and behavioral decline in subpopulations 5 to 50 years out from repeated or cumulative mTBI exposures. The possibility of a link between mTBI, persistent symptoms, and early dementia has widespread implications for SMs and veterans; however, these chronic and late-life effects of mTBI are poorly understood.
Traumatic brain injuries of mixed severity have been linked to a higher incidence of Alzheimer disease (AD) and other dementias and an earlier onset of AD, although negative findings have also been reported. Chronic traumatic encephalopathy has been reported to occur in retired boxers at higher rates and at younger ages compared with dementia in the general population. More recently, brain autopsies of athletes from a variety of sports with confirmed CTE have demonstrated elevated tau proteins, tau-immunoreactive neurofibrillary tangles, and neuropil threads, suggesting that pathologic processes similar to those occurring in AD may be involved. Longitudinal research bridging SMs, veterans, and athletes with neurotrauma has been fragmented and incompletely focused on the strategic needs (eg, troop readiness) and vision of the DoD and VA.
Critical gaps exist in the literature with few prospective, well-controlled, longitudinal studies on late-life outcomes and neurodegeneration after mTBI, as well as in related basic science research. These research gaps are particularly prominent in the potentially unique injuries and difficulties seen in combat-exposed populations. The existing research, although suggestive, is not rigorous or robust enough to allow for a clear understanding of the relationships, risks, and potential effective interventions for mTBI, chronic symptoms, and neurodegeneration.
The CENC was developed to create a road map of existing knowledge gaps, to recruit the top relevant subject matter experts in the country, to develop and establish a cohesive set of rigorously designed studies to address these knowledge voids, and to leverage core consortium resources both efficiently and effectively.
Related: The Right Care at the Right Time and in the Right Place: The Role of Technology in the VHA
Given these gaps in scientific research and knowledge, the DoD and VA jointly issued a request for proposals to fund a project to address these concerns. After a competitive application process, an integrated proposal, led by researchers at Virginia Commonwealth University (VCU) was announced as the recipient of the Presidential award.
Consortium Structure
The CENC, serving as the comprehensive research network for DoD and VA, focuses on (1) identifying and characterizing the anatomic, molecular, and physiologic mechanisms of chronic injury from mTBI and potential neurodegeneration; (2) investigating the relationship of comorbidities (psychological, neurologic, sensory, motor, pain, cognitive, and neuroendocrine) of trauma and combat exposure to TBI with neurodegeneration; and (3) assessing the efficacy of existing and novel treatment and rehabilitation strategies for chronic effects and neurodegeneration following TBI.
The consortium is a collaboration among more than 30 universities, nonprofit research organizations, VAMCs, and military medical centers made up of a leadership core, 5 research infrastructure cores, 8 active studies, a data safety monitoring committee, a consumer advisory board, a scientific advisory board, and an independent granting mechanism to foster additional research in chronic effects after mTBI.
Leadership Core
The principal investigator for CENC is David X. Cifu, MD, chairman and professor of the VCU Department of Physical Medicine and Rehabilitation in Richmond, Virginia. The consortium co-principal investigators are Ramon Diaz-Arrastia, MD, PhD, professor of neurology, Uniformed Services University of the Health Sciences (USUHS) and director of the clinical research at the Center for Neuroscience and Regenerative Medicine in Bethesda, Maryland, and Rick L. Williams, PhD, co-principal investigator for CENC and senior statistician at RTI International in Raleigh, North Carolina.
Research Cores
The CENC operates 5 research infrastructure cores. The Biorepository Core, led by Dr. Diaz-Arrastia at USUHS, manages the storage and processing of biologic (blood and saliva) samples collected through all CENC protocols. The Biostatistics Core, led by Dr. Williams; Nancy Temkin, PhD; and Heather Belanger, PhD at RTI, provides study design guidance and biostatistical analysis to facilitate knowledge translation and dissemination.
The Data and Study Management Core is led by Dr. Williams at RTI. It centrally and securely maintains all collected data; oversees the clinical monitoring of research sites; provides a consortium research manager for each study who interacts with the study leadership, study site leaders, and staff; expedites and guides clinical protocols through regulatory approval processes; coordinates patient accrual and study activities across sites; develops and monitors data acquisition compliance; and facilitates exportation of all data collection to the Federal Interagency Traumatic Brain Injury Research informatics system.
The Neuroimaging Core is led by Elisabeth Wilde, PhD, at Baylor College of Medicine and the Michael E. DeBakey VAMC in Houston, Texas. This core facilitates sequence development and pulse programming; provides training and supervision of technologists and support personnel; ensures acquisition, transfer, and storage of imaging data; oversees quality assurance; performs conventional and advanced imaging analysis; and interprets neuroimaging data.
The Neuropathology Core is led by Dr. Dan Perl and colocated at USUHS and Edith Norse Rogers Memorial Veterans Hospital/VA Boston Healthcare System. Dr. Perl manages the collection of brain specimens from the participants, using an existing national network of dieners and neuropathologists, catalogs and stores tissues, and administers requests for use of these tissues.
Active Research Studies
The Longitudinal Cohort Study addresses a critical research gap by identifying and characterizing the late effects of mTBI and assessing the influence and interaction of the many potential risk factors for early dementia. The study uses a wide array of self-report, laboratory, biophysical, neuropsychologic, and imaging assessment tools to evaluate a cohort (n = 880) of U.S. OEF/OIF combatants who have had at least 1 mTBI and a control group of participants (n = 220) who have experienced combat but have not had a mTBI, and then re-assesses them annually (in person or via telephone), with the goal of following the cohort for as long as resources are available.
Collaborating sites for this study include Hunter Holmes McGuire VAMC in Richmond, Virginia; James A. Haley Veterans’ Hospital in Tampa, Florida; Michael E. DeBakey VAMC in Houston, Texas; Audie L. Murphy Memorial Veterans Hospital in San Antonio, Texas; VA Boston Healthcare System; Minneapolis VA Health Care System in Minnesota; and Fort Belvoir in Virginia. Dr. Cifu and Dr. William Walker lead this study.
Epidemiology of mTBI and Neurosensory Outcomes
This project integrates and analyzes several VA, DoD, and Centers for Medicare and Medicaid Services health care system data sets to study the chronic effects of mTBI on neurodegenerative disease and other comorbidities. The primary aims of the project include evaluating the association between mTBI and short-term clinical outcomes, including factors associated with resilience and effects of treatment; investigating long-term clinical outcomes, including neurosensory disorders and mortality; and identifying factors associated with low- and high-distress trajectories of comorbid burden after mTBI. Dr. Kristine Yaffe, Dr. Mary Jo Pugh, and Dr. Michael McCrea, are the leads of this study.
Tau Modification and Aggregation in TBI
This study aims to develop an animal model of repetitive-mTBI, which will allow the tracking of progressive intraneuronal tau alterations that can be correlated with behavioral dysfunction, neuronal protein, and gene expression signatures that can be used to assess the effects of interventions. The observations made in the animal model will be compared with findings generated from tissue obtained at autopsy from deceased SMs and veterans who sustained repetitive-mTBI. Dr. Fiona Crawford and Dr. Elliott Mufson lead this study.
Otolith Dysfunction
This study is examining the effect of inner ear dysfunction on balance, gait, and quality of life (QOL). Recent evidence suggests that otolith organ dysfunction can occur in patients with mTBI or blast exposure. If the dizziness and imbalance symptoms that occur following head injury or blast exposure are related to injury to the otolith organs rather than to the horizontal semicircular canal, then new treatment approaches may be necessary to focus on otolith organ pathway recovery. Performance on balance tasks while standing and walking and questionnaires on the impact on QOL will be compared in 4 groups of individuals (n = 120) with and without head injury/blast exposure (otolith organ dysfunction, horizontal canal dysfunction, both otolith and horizontal canal dysfunction, and healthy individuals). Dr. Faith Akin leads this study.
ADAPT
The ADAPT study (Assessment and Long-term Outcome and Disability in Active Duty Military Prospectively Examined following Concussive TBI) is investigating the association of early clinical and imaging measures with late (5 year) clinical outcome after blast-related mTBI from combat. The study (n = 100) will use 5-year follow-up advanced magnetic resonance imaging (MRI) and clinical outcome measures of combat mTBI, as a continuation of previous longitudinal research efforts (n = 575). Two groups of subjects will be studied: subjects who sustained a mTBI from blast during deployment and subjects without history of blast exposure and no diagnosis of deployment mTBI. Dr. Christine MacDonald leads this study.
Diffusion Tensor Imaging Phantom Study
This study involves the development and testing of a novel phantom that would be used to enhance accuracy, consistency, and reliability in both isotropic and anisotropic measurements derived from diffusion imaging, as well as other MRI-based measurements, using universal fluid disk chambers in a single phantom. Currently, the acquisition of diffusion data in large studies and clinical trials lacks standardization, and important differences exist in how data are acquired on scanners of different manufacturers, using different hardware or software, or when different acquisition parameters are used. As a result, development of large pools of data and the creation of normative data are hampered by inhomogeneity in the data set, which is difficult to analyze. The study team will perform detailed testing of the phantom materials and phantoms themselves, as well as examine diffusion imaging on 1 to 2 human volunteers at each of the 4 sites. Intra- and interscanner differences will be measured, and based on these findings, a more standardized imaging protocol that will provide optimal uniformity of diffusion imaging will be designed. Dr. Elisabeth Wilde leads this study.
Novel White Matter Imaging to Improve mTBI Diagnosis
This study will use myelin-sensitive novel imaging techniques (McDespot [multi-component driven equilibrium single pulse observation of T1/T2]) to improve correspondence with diagnostic groups after trauma exposure and correlation with cognitive deficits in mTBI. The study will recruit individuals (n = 82) from 4 groups, comorbid mTBI and posttraumatic stress disorder (PTSD), only mTBI, only PTSD, and controls who will be prospectively comprehensively assessed clinically (clinical interview, physical exam, neuropsychological assessment) and with advanced imaging (including McDespot, diffusion tensor imaging, and other forms of imaging). Dr. Amy Jak leads this study.
Peer Review Program
The CENC has an integrated grant program to identify scientifically valid and strategically important research projects. To date, 2 rounds of proposal requests and project support have been completed. Scientific review is conducted under the CENC Peer Review Program. Scientifically meritorious studies are identified by independent peer review and then undergo a Programmatic Review by CENC leadership before being recommended for funding to the Government Steering Committee (GSC). Studies that are recommended must address road map gaps, develop innovative approaches, or provide an avenue for new researchers and novel research approaches to contribute to the consortium mission to advance the science of brain injury treatment and prevention. The CENC grant program is administered by Dr. Steven L. West.
Consumer Advisory Board
The Consumer Advisory Board (CAB) advises and makes nonbinding recommendations to CENC. The responsibilities of the committee members include (1) providing information that helps CENC leadership better appreciate and understand the issues and needs of TBI survivors and their support networks so appropriate research can be designed and implemented; (2) evaluating existing research and making recommendations for additions and/or modifications to project procedures; (3) providing input for the road map for future research based on members’ personal experiences and knowledge; and (4) providing linkages to targeted communities for direct feedback and to assist in forming collaborative partnerships.
The CAB is composed of survivors of TBI, family members of survivors of TBI, providers of TBI services, service organizations with specific ties to SMs and veterans, and clinical and corporate representatives of transportation services for the disabled, the independent living movement, and assistive technology. Persons who are heavily engaged in political activity or who actively endorse a specific device or product are not eligible for membership on the CAB. Membership is composed of persons nominated by CENC leadership and approved by the GSC. The CAB is co-chaired by Charles Gatlin, MS, and General (Ret.) Peter Chiarelli.
Scientific Advisory Board
The members of the Scientific Advisory Board (SAB) advise and make nonbinding recommendations to CENC. Responsibilities of the committee members include (1) providing information that may help the consortium leadership better understand the issues related to TBI; (2) evaluating existing research; (3) recommending additions and/or modifications to project procedures; and (4) assisting CENC by helping leverage relationships with other researchers. The SAB is composed of members of the research community on TBI who are not part of CENC. Persons who may be considered to have positions of authority, such as active or retired flag officers or chief executive officers, may be eligible for general SAB membership but are not be eligible for chair positions. Membership is composed of persons nominated by CENC leadership and approved by the GSC. Col. Jamie Grimes, MD, and Henry Lew, MD, PhD, co-chair the SAB.
Federal Oversight
The GSC oversees CENC. Members of the GSC are DoD and VA appointed and represent both government agencies and nongovernment subject matter experts. The GSC approves all studies to be conducted, recommends new studies, and identifies existing and new requirements. The GSC is the overall main governing and management committee for the project and the committee through which the DoD and VA interact and collaborate with the CENC. The GSC determines all major scientific decisions, and clinical studies proposed by the CENC committee proceed to the implementation stage only with the approval of the GSC.
Acknowledgements
This research is supported by grants 1-I01-RX-001135-01-A2 (PI: F. Aiken), 1-I01-RX-001774-01 (PI: F. Crawford), 1-I01-RX-001880-01 (PI: E. Wilde), 1-I01-CX-001135-01 (PI: S. Cifu), and 1-I01-CX-001246-01 (PI: K. Yaffe) from the U.S. Department of Veterans Affairs and by grant W81XWH-13-2-0095 (PI: D. Cifu) from the U.S. Department of Defense, Congressionally Directed Medical Research Programs. The ideas and opinions expressed in this paper do not necessarily represent the views of the Department of Veterans Affairs, the Department of Defense, or the U.S. Government.
Author disclosures
The authors report no actual or potential conflicts of interest with regard to this article.
Disclaimer
The opinions expressed herein are those of the authors and do not necessarily reflect those of Federal Practitioner, Frontline Medical Communications Inc., the U.S. Government, or any of its agencies.
National Acute Medicine Programme
In 2009, Irish hospitals were experiencing ongoing and increasing overcrowding of emergency departments (EDs). This overcrowding and subsequent assessment delays are both associated with increased morbidity and mortality rates.[1, 2, 3, 4] The prevailing culture in many larger hospitals was to prioritize subspecialty care at the expense of the assessment and management of patients with undifferentiated acute medical presentations with nonspecific symptoms. The National Acute Medicine Programme (NAMP) was set up in 2010 by the Royal College of Physicians in Ireland (RCPI) and the Health Service Executive (HSE) to address this unsatisfactory management of acutely ill medical patients.
The objectives of the NAMP are categorized under 3 quality improvement principles: (1) Quality: to improve quality of care and patient safety by ensuring patients are seen by a nurse within 20 minutes and a senior doctor within 1 hour of arrival. (2) Access: to improve access by ensuring that the patient journey from presentation to decision to admit or discharge does not exceed 6 hours and to eliminate extended waiting periods on gurneys for medical patients. (3) Cost: to reduce cost and increase value by achieving bed savings through reduced overnight admissions and shortened lengths of stay.
The program was implemented by a small national team, which included hospital and public health physicians, nurses, a health and social care professional (HSCP), a general practitioner (GP), and a program manager. RCPI also set up a National Advisory Group of Consultant Physicians, comprised of representative medical consultants from all over the country, and key links were established with each acute hospital. The team aimed to develop a standardized model of care for all acutely ill medical patients and ensure its full implementation nationally.
METHODS
A literature review was undertaken to develop the standardized model of care in agreement with stakeholders and in consultation with patient groups.[5] The model of care required the establishment of acute medical assessment units (AMAUs), whose main function was to assess to discharge rather than admit to assess patients.[6, 7] At that time, only 8 of the 33 acute Irish hospitals that admitted medical patients had an AMAU. However, their function and operation varied greatly. In the remaining hospitals, all medical patients went to the ED, and from there were either admitted or discharged. Delays in access to senior clinicians, diagnostics, and allied health professionals such as, Occupational Therapists, Physiotherapists and Speech and Language Therapists often resulted in delays in assessment and treatment that could lead to overnight admissions.
In the new model, all acute medical patients, except those requiring invasive monitoring, critical care, or special services such as oncology and dialysis, are referred to the AMAU by another doctor (ie. a GP, outpatient department, or ED physician), as shown in Figure 1. A senior physician in the AMAU then reviews the patient and decides to admit or discharge. This doctor can either be a dedicated physician with an interest in acute general medicine, or a specialist consultant rostered to work in the unit on a regular basis. Some patients are discharged the same day thanks to prompt review and treatment. Of those requiring overnight admission, some are streamed directly to specialist pathways (eg. coronary care unit). The remaining patients are admitted to the medical short‐stay unit (MSSU) under the care of an acute physician. Patients in the MSSU are then either discharged within 48 hours or go on to be transferred to a specialist ward.
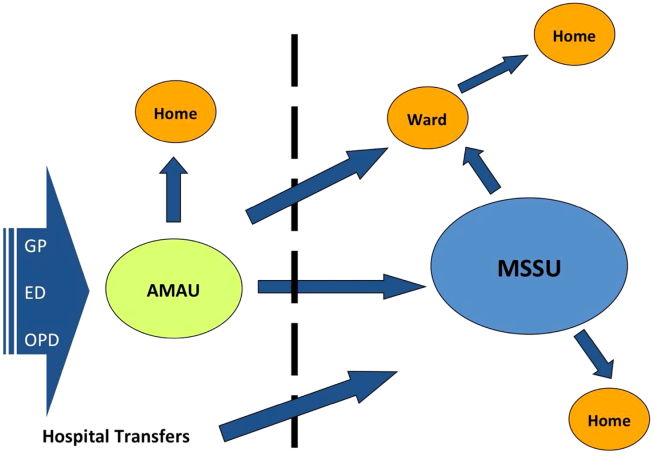
The model of care was therefore divided into 4 care pathways. National Health Service (NHS) admission data for 2008 to 2009 were used to calculate the proportion of patients who flowed through each pathway. The NHS has a wealth of experience in the development and use of AMAUs, having started implementing these units in the early 2000s. Therefore, the NHS estimates calculated above were used to set the national benchmarks for the NAMP. The four pathways are:
1. Ambulatory Care Pathway
Patients receive safe and effective treatment and are discharged on the same day. The NAMP benchmark was that at least 25% of AMAU admissions should follow this pathway of care.
2. Medical Short‐Stay Care Pathway
This pathway was developed for those patients who require inpatient care but are not expected to stay longer than 1 or 2 nights. The program benchmark was that 31% of patients should be discharged within 48 hours.
3. Routine Specialist Inpatient Care Pathway
Approximately 33% of medical admissions are expected to stay more than 2 days and less than 14 days in the hospital and have a straightforward discharge after their acute episode of care. These patients are admitted either directly to specialist medical wards from AMAU or via the MSSU within 2 days of arrival. Care is formally handed over from the AMAU team to the appropriate consultant physician upon transfer.
4. Appropriate Care and Discharge of Complex Patients Care Pathway
Frail older patients have complex care needs that continue following discharge, and their discharge requirements must be identified early during the acute care episode. The NAMP benchmark was that no more than 11% of medical admissions would fall into this pathway and require a length of stay (LoS) exceeding 14 days.
The flow model was used to build system capacity by modeling and predicting the expected demand on each AMAU to assist in forward planning The number of assessment spaces and ward beds required for each hospital were calculated by analyzing respective admission data for 2009 and applying target lengths of stay for medical patients to the flow model. The program team carried out this analysis for each of the 32 hospitals. The model of care also identified a number of practice changes under each pathway that would be required to achieve process changes and the resulting efficiency gains. Table 1 summarizes these.
|
| Ambulatory care pathway |
| Establishment of adequate assessment area |
| National early warning score within 20 minutes |
| Access to senior decision maker within 1 hour |
| Access to rapid diagnostics and HSCP assessment |
| Development of clinical criteria for transfer between ED and AMAU |
| Liaison with discharge planner |
| Clear pathways to specialist wards and community support |
| Close liaison with GP to ensure integrated care |
| Patient experience time in AMAU to be 6 hours or less |
| Medical short‐stay care pathway |
| Establishment of adequate short‐stay unit |
| Access to senior decision maker within 12 hours of transfer from AMAU |
| Twice daily consultant ward rounds |
| Access to prioritized diagnostics and HSCP assessment |
| Integrated discharge planning |
| Routine specialist inpatient care pathway |
| Daily consultant ward rounds |
| Weekend nurse/HSCP‐facilitated discharges |
| Active discharge planning with planned dates of discharge for every patient |
| Liaison with caregivers and community supports |
| Development of clinical criteria to support bidirectional flow to community hospitals within hospital groups |
| Appropriate care and discharge of complex patients care pathway |
| Early assessment and identification of complex patients |
| Streaming to care of the elderly services where appropriate |
| Proactive multidisciplinary discharge planning and liaison with funding agencies for referral to community placements and supports |
Hospitals were also categorized into 4 divisions or models as determined by the complexity of patients they admit. Model 1 hospitals are community units with subacute inpatient beds that can care for patients with rehabilitation, respite, or palliative care needs. Model 2 hospitals are small hospitals that provide inpatient and outpatient care for low‐risk, differentiated medical patients or refer on to associated higher complexity facilities. The majority of hospitals in the country are model 3 general hospitals, admitting 50% of all medical patients. Last, model 4 hospitals are the 8 regional tertiary referral centers in Ireland. A considerable volume of their patient workload remains inpatient admissions for routine specialist inpatient care.
Measuring success in the program's quality and access objectives required the development of a bespoke information technology (IT) system that is not yet operational, and therefore these objectives could not be audited.
A number of outcome measures or key performance indicators (KPIs) were developed to assess performance under each care pathway relative to the cost objectives of the NAMP as shown in Table 2. The available hospital inpatient enquiry (HIPE) data were analyzed by the program team to establish baseline performance metrics for each hospital. Initially, these data were only available to the NAMP 1 year in arrears. However, the NAMP worked with the hospitals and the HIPE system to improve the completeness and timeliness of the HIPE reporting, so that by the third quarter of 2011 monthly data were available. Audit cycles occurred on a continuous monthly basis, with feedback provided to each hospital and follow‐up of results conducted at a local level. This allowed for analysis of performance at a national, hospital group, and individual hospital level. Of note, it was only possible to analyze readmission rates to the same facility in the absence of a national unique patient identifier, and therefore readmission rates observed were of limited use as a quality measure.
| Care Pathway | Metric | National Target | 2010 | 2011 | 2012 | 2013* |
|---|---|---|---|---|---|---|
| ||||||
| Ambulatory care pathway | % of patients with LoS=0 | 25% | 11.5% | 12.9% | 18.8% | 23.2% |
| Medical short‐stay pathway | % of patients with LoS 12 days | 31% | 25.4% | 25.9% | 25.6% | 23.8% |
| Routine specialist inpatient pathway | % of patients with LoS>2 days | 44% | 63.1% | 61.2% | 55.6% | 53.1% |
| Complex care pathway | % of patients with LoS>14 days | 11% | 13.1% | 12.4% | 11.0% | 10.8% |
| % BDU of patients with LoS>30 days | 33% | 36.9% | 36.0% | 35.1% | 34.4% | |
| Routine and complex care pathway | Average LoS for those staying >2 days | 610 days | 12.9 | 12.7 | 12.4 | 12.4 |
| Summary metric | Overall average LoS | 5.8 days | 8.5 | 8.1 | 7.2 | 6.9 |
| No. of medical discharges | 202,567 | 206,250 | 235,167 | 253,083 | ||
RESULTS
The NAMP model of care was officially launched in December 2010.[6] Thirty‐two out of the 33 Irish hospitals that admit acute medical patients had adopted the model of care by the end of 2013. The program team performed an initial diagnostic meeting at each hospital to explain the program, discuss their individual baseline metrics, and collaboratively develop a hospital‐specific implementation plan. A local implementation and unscheduled care governance team, composed of senior management members and local GPs, was established in each hospital to identify ward spaces to be developed as AMAUs, reassign nursing staff to the AMAU from the wards, and organize the recruitment of new consultants with an interest in acute general medicine. The program team performed 2 to 3 visits per year to each hospital to obtain feedback on performance and support local improvement plans using appreciative enquiry. They also organized workshops and training for physicians, nurses, managers, and data managers to improve understanding of and engagement with the program. An acute medicine nurse interest group was convened to support nurses in the transition to clinical practice with a greater focus on ambulatory care. Annual conferences were held to present and discuss annual and cumulative audit results.
Table 2 presents the national KPI results for the cost and value objectives over the 3 years of implementation. The number of medical discharges increased from 202,567 in 2010 to 253,083 in 2013. The proportion of discharges that passed through the AMAU was 29% in 2013, considerably reducing the amount of patients seen through the ED and alleviating some of the overcrowding experienced there.
The proportion of medical patients who avoided admission increased from 11.5% to 23.2% in 2013. When examining the proportion of patients discharged within 48 hours, we combined results for the ambulatory care pathway (LoS=0) and the medical short‐stay pathway (LoS=12) and found a 10% increase nationally from 36.9% to 47% in 2013. In addition, the proportion of total medical bed‐days used (BDU) for patients with LoS over 30 days also improved by 2.5%. The program achieved an overall reduction of 0.5 days in those staying over 2 days nationally, and an overall reduction in average LoS (AvLoS) for all medical inpatients of 1.6 days (from 8.5 days 6.9 days) across the 3 years.
Table 3 shows the average change in KPIs from 2010 to 2013 by hospital model group. Looking at data by hospital group allowed results to be interpreted in a national context and identify any bottlenecks in the health system.
| Care pathway | Metric | National | Model 2 | Model 3 | Model 4 |
|---|---|---|---|---|---|
| |||||
| Ambulatory care pathway | % of patients with LoS=0 | 11.7% | 11.5% | 12% | 11.5% |
| Medical short‐stay pathway | % of patients with LoS 12 days | 1.6% | 5% | 2.3% | 0.3% |
| Routine specialist inpatient pathway | % of patients with LoS>2 days | 10% | 6.4% | 9.8% | 11.2% |
| Complex care pathway | % of patients with LoS>14 days | 2.3% | 0.4% | 1.7% | 4.1% |
| % BDU of patients with LoS>30 days | 2.5% | 1.9% | 0.2% | 4.9% | |
| Routine and complex care pathway | Average LoS for those staying >2 days | 0.5 | 0.7 | 0 | 1.4 |
| Summary metric | Overall average LoS | 1.6 | 0.4 | 1.0 | 2.6 |
During the 3‐year period, the role of model 2 hospitals changed from admitting all medical patients to only admitting differentiated medical patients referred from GPs. This is reflected in their KPI results, with an increasing proportion of patients with LoS greater than 14 days and the proportion of BDU occupied by those with LoS greater than 30 days. Data from the model 2 and 3 hospitals showed a considerable increase in same‐day discharges, with a concurrent decrease in percentage of patients staying in the hospital longer than 2 days. This translated to a national reduction in AvLoS of 1 day in this hospital group. Model 2 hospitals experienced small increases in both the AvLoS for those patients staying over 2 days (0.7%) and the proportion of BDU occupied by patients staying longer than 30 days (1.9%), whereas model 3 had experienced no real change in either of these metrics (0% and 0.2%, respectively). This reflected the limited availability of long‐term care facilities and protracted funding approval process nationally during the implementation period.
Model 4 hospitals experienced improvement across all KPIs. There was an 11.2% increase in the proportion of patients discharged within 48 hours and a 1.4‐day reduction in AvLoS for patients with LoS>2 days. A notable success within this hospital category was the 4.9% reduction in percentage of BDU by patients with LoS>30 days. The AvLoS for all medical admissions in this group remained above the national target at 8.6 days but did decrease considerably by 2.6 days from its baseline.
Data on 28‐day readmission to the same facility were used as a balancing measure but were only available for the latter 2 years. We found rates of 11% and 10% for 2012 and 2013, respectively. Patient experience of these new units should be assessed, but it was not possible to measure this during the implementation period.
DISCUSSION
The implementation of the NAMP has demonstrably streamlined the care of acute medical patients in Ireland. We report the results of this national transformational change brought about by the implementation of an evidence‐based model of care. The development of a flow model for each hospital improved the patient flow from assessment to discharge. Process improvement lies at the core of all the successes achieved by the program. The practice changes highlighted in Table 1 were pivotal in streamlining and improving the care of acutely ill medical patients. The focus on early access to senior decision making, early diagnostics, and a continuous, coordinated, multidisciplinary approach to care and discharge were central to the effective functioning of the AMAU and the resulting increase in avoided admissions.
Shortened lengths of stay are associated with better clinical outcomes and reduced exposure of patients to risk, and result in significant cost efficiencies accrued to the Irish health services.[2, 8] The adoption of ambulatory care and medical short‐stay pathways facilitated the 11.7% increase in avoided admissions and the reduction of 1.6 days in overall AvLoS nationally. This translates to significant cost savings for the Irish health system and likely improves clinical outcomes and reduced morbidity. We estimated these cost savings to be approximately 88.2 million by multiplying the number of bed days saved by the marginal cost of a bed day, which was quoted at 246 in 2012 by our Healthcare Pricing Office.
Thirty‐two of the 33 Irish hospitals that admit acute medical patients are now operating the program and achieving improvements in performance, as evidenced by ongoing audits. The priority given to the program by the RCPI and HSE has enabled the assignment of local implementation teams sustaining the focus on quality improvement at a local level. It also allowed for modest seed funding to be allocated for the appointment of 36 new consultants with an interest in acute general medicine. The cost of these additional consultants is offset by the considerable savings achieved through efficiency gains. An important challenge to implementation was the change in mindset required from local healthcare staff to divert patients away from the ED to the AMAU, and reassign staff and resources from other inpatient wards to the new unit. Visible clinical leadership from clinical directors, acute medicine hospital leads, senior nursing, and HSCP, together with management and local GPs, was essential in effecting this change. The program team also offered considerable support in this regard through advocacy and promotion of the program nationally. The implementation of the 4 care pathways represents a generational change in how medicine is practiced in Ireland. The development of acute medicine as a new specialty was strongly fostered by the program.
A number of disease‐specific clinical programs began operation during the implementation period and achieved reductions in AvLoS for some conditions such as chronic obstructive pulmonary disease and heart failure, contributing to varying degrees (2%6%) to the bed‐days savings achieved by the NAMP. During the 3‐year period, there was a 25% increase in medical discharges. This is partly due to the changing demographics and epidemiology of chronic diseases in the Irish population. This increased demand was absorbed by the system with no increase in acute bed usage. We estimated that approximately 1000 additional acute beds would have been required if the NAMP efficiencies had not been achieved. Concurrent financial constraints compounded the stress on the public health system by limiting the available staff and resources for the new AMAUs and by reducing the number of community and nursing home beds available. This obstructed the flow of older and frailer patients out of the acute setting and impacted negatively on the performance of some hospitals.
An important limitation in auditing success in the quality and access aims of the program was the absence of IT systems within the AMAUs. These have since been specified by the NAMP but have not yet been delivered to the service areas. In addition, a bespoke user interface, which allows hospitals to manipulate and benchmark their own performance, is being developed. This will facilitate more in‐depth auditing within hospitals at the ward and consultant team level. The lack of a unique patient identifier hindered our ability to measure true 28‐day readmission rates, which is a useful quality indicator.
Despite these contextual, cultural, and structural challenges, the NAMP successfully implemented an evidence‐based model of care across the country. Through its implementation, tangible improvements to the Irish health system were observed with expected benefits to the patient. The program successfully instituted an ongoing audit cycle to promote continuous improvement and identified areas for future work to build on the successes achieved.
Disclosure
Nothing to report.
- ,. The effect of emergency department crowding on patient outcomes: a literature review. Adv Emerg Nurs J. 2011;33(1):39–54.
- , , , et al. Effect of emergency department crowding on outcomes of admitted patients. Ann Emerg Med. 2013;61(6):605–611.e6.
- , , . The relationship between emergency department crowding and patient outcomes: a systematic review. J Nurs Scholarsh. 2014;46(2):106–115.
- , , , et al. The effect of emergency department crowding on clinically oriented outcomes. Acad Emerg Med. 2009;16(1):1–10.
- Acute medical assessment units: a literature review. 2012. [Unpublished Manuscript]
- National Acute Medicine Programme Working Group. Report of the National Acute Medicine Programme 2010. Retrieved on Sep 24, 2014 from, http://www.hse.ie/eng/about/Who/clinical/natclinprog/acutemedicineprogramme/report.pdf. [Retrieved]
- Royal College of Physicians. Acute medical care. The right person, in the right setting—first time. October 2007. Retrieved on Sep 24, 2014, from, https://www.rcplondon.ac.uk/sites/default/files/documents/acute_medical_care_final_for_web.pdf.
- . Increase in patient mortality at 10 days associated with emergency department overcrowding. Med J Aust. 2006;184(5):213–216.
In 2009, Irish hospitals were experiencing ongoing and increasing overcrowding of emergency departments (EDs). This overcrowding and subsequent assessment delays are both associated with increased morbidity and mortality rates.[1, 2, 3, 4] The prevailing culture in many larger hospitals was to prioritize subspecialty care at the expense of the assessment and management of patients with undifferentiated acute medical presentations with nonspecific symptoms. The National Acute Medicine Programme (NAMP) was set up in 2010 by the Royal College of Physicians in Ireland (RCPI) and the Health Service Executive (HSE) to address this unsatisfactory management of acutely ill medical patients.
The objectives of the NAMP are categorized under 3 quality improvement principles: (1) Quality: to improve quality of care and patient safety by ensuring patients are seen by a nurse within 20 minutes and a senior doctor within 1 hour of arrival. (2) Access: to improve access by ensuring that the patient journey from presentation to decision to admit or discharge does not exceed 6 hours and to eliminate extended waiting periods on gurneys for medical patients. (3) Cost: to reduce cost and increase value by achieving bed savings through reduced overnight admissions and shortened lengths of stay.
The program was implemented by a small national team, which included hospital and public health physicians, nurses, a health and social care professional (HSCP), a general practitioner (GP), and a program manager. RCPI also set up a National Advisory Group of Consultant Physicians, comprised of representative medical consultants from all over the country, and key links were established with each acute hospital. The team aimed to develop a standardized model of care for all acutely ill medical patients and ensure its full implementation nationally.
METHODS
A literature review was undertaken to develop the standardized model of care in agreement with stakeholders and in consultation with patient groups.[5] The model of care required the establishment of acute medical assessment units (AMAUs), whose main function was to assess to discharge rather than admit to assess patients.[6, 7] At that time, only 8 of the 33 acute Irish hospitals that admitted medical patients had an AMAU. However, their function and operation varied greatly. In the remaining hospitals, all medical patients went to the ED, and from there were either admitted or discharged. Delays in access to senior clinicians, diagnostics, and allied health professionals such as, Occupational Therapists, Physiotherapists and Speech and Language Therapists often resulted in delays in assessment and treatment that could lead to overnight admissions.
In the new model, all acute medical patients, except those requiring invasive monitoring, critical care, or special services such as oncology and dialysis, are referred to the AMAU by another doctor (ie. a GP, outpatient department, or ED physician), as shown in Figure 1. A senior physician in the AMAU then reviews the patient and decides to admit or discharge. This doctor can either be a dedicated physician with an interest in acute general medicine, or a specialist consultant rostered to work in the unit on a regular basis. Some patients are discharged the same day thanks to prompt review and treatment. Of those requiring overnight admission, some are streamed directly to specialist pathways (eg. coronary care unit). The remaining patients are admitted to the medical short‐stay unit (MSSU) under the care of an acute physician. Patients in the MSSU are then either discharged within 48 hours or go on to be transferred to a specialist ward.
The model of care was therefore divided into 4 care pathways. National Health Service (NHS) admission data for 2008 to 2009 were used to calculate the proportion of patients who flowed through each pathway. The NHS has a wealth of experience in the development and use of AMAUs, having started implementing these units in the early 2000s. Therefore, the NHS estimates calculated above were used to set the national benchmarks for the NAMP. The four pathways are:
1. Ambulatory Care Pathway
Patients receive safe and effective treatment and are discharged on the same day. The NAMP benchmark was that at least 25% of AMAU admissions should follow this pathway of care.
2. Medical Short‐Stay Care Pathway
This pathway was developed for those patients who require inpatient care but are not expected to stay longer than 1 or 2 nights. The program benchmark was that 31% of patients should be discharged within 48 hours.
3. Routine Specialist Inpatient Care Pathway
Approximately 33% of medical admissions are expected to stay more than 2 days and less than 14 days in the hospital and have a straightforward discharge after their acute episode of care. These patients are admitted either directly to specialist medical wards from AMAU or via the MSSU within 2 days of arrival. Care is formally handed over from the AMAU team to the appropriate consultant physician upon transfer.
4. Appropriate Care and Discharge of Complex Patients Care Pathway
Frail older patients have complex care needs that continue following discharge, and their discharge requirements must be identified early during the acute care episode. The NAMP benchmark was that no more than 11% of medical admissions would fall into this pathway and require a length of stay (LoS) exceeding 14 days.
The flow model was used to build system capacity by modeling and predicting the expected demand on each AMAU to assist in forward planning The number of assessment spaces and ward beds required for each hospital were calculated by analyzing respective admission data for 2009 and applying target lengths of stay for medical patients to the flow model. The program team carried out this analysis for each of the 32 hospitals. The model of care also identified a number of practice changes under each pathway that would be required to achieve process changes and the resulting efficiency gains. Table 1 summarizes these.
|
| Ambulatory care pathway |
| Establishment of adequate assessment area |
| National early warning score within 20 minutes |
| Access to senior decision maker within 1 hour |
| Access to rapid diagnostics and HSCP assessment |
| Development of clinical criteria for transfer between ED and AMAU |
| Liaison with discharge planner |
| Clear pathways to specialist wards and community support |
| Close liaison with GP to ensure integrated care |
| Patient experience time in AMAU to be 6 hours or less |
| Medical short‐stay care pathway |
| Establishment of adequate short‐stay unit |
| Access to senior decision maker within 12 hours of transfer from AMAU |
| Twice daily consultant ward rounds |
| Access to prioritized diagnostics and HSCP assessment |
| Integrated discharge planning |
| Routine specialist inpatient care pathway |
| Daily consultant ward rounds |
| Weekend nurse/HSCP‐facilitated discharges |
| Active discharge planning with planned dates of discharge for every patient |
| Liaison with caregivers and community supports |
| Development of clinical criteria to support bidirectional flow to community hospitals within hospital groups |
| Appropriate care and discharge of complex patients care pathway |
| Early assessment and identification of complex patients |
| Streaming to care of the elderly services where appropriate |
| Proactive multidisciplinary discharge planning and liaison with funding agencies for referral to community placements and supports |
Hospitals were also categorized into 4 divisions or models as determined by the complexity of patients they admit. Model 1 hospitals are community units with subacute inpatient beds that can care for patients with rehabilitation, respite, or palliative care needs. Model 2 hospitals are small hospitals that provide inpatient and outpatient care for low‐risk, differentiated medical patients or refer on to associated higher complexity facilities. The majority of hospitals in the country are model 3 general hospitals, admitting 50% of all medical patients. Last, model 4 hospitals are the 8 regional tertiary referral centers in Ireland. A considerable volume of their patient workload remains inpatient admissions for routine specialist inpatient care.
Measuring success in the program's quality and access objectives required the development of a bespoke information technology (IT) system that is not yet operational, and therefore these objectives could not be audited.
A number of outcome measures or key performance indicators (KPIs) were developed to assess performance under each care pathway relative to the cost objectives of the NAMP as shown in Table 2. The available hospital inpatient enquiry (HIPE) data were analyzed by the program team to establish baseline performance metrics for each hospital. Initially, these data were only available to the NAMP 1 year in arrears. However, the NAMP worked with the hospitals and the HIPE system to improve the completeness and timeliness of the HIPE reporting, so that by the third quarter of 2011 monthly data were available. Audit cycles occurred on a continuous monthly basis, with feedback provided to each hospital and follow‐up of results conducted at a local level. This allowed for analysis of performance at a national, hospital group, and individual hospital level. Of note, it was only possible to analyze readmission rates to the same facility in the absence of a national unique patient identifier, and therefore readmission rates observed were of limited use as a quality measure.
| Care Pathway | Metric | National Target | 2010 | 2011 | 2012 | 2013* |
|---|---|---|---|---|---|---|
| ||||||
| Ambulatory care pathway | % of patients with LoS=0 | 25% | 11.5% | 12.9% | 18.8% | 23.2% |
| Medical short‐stay pathway | % of patients with LoS 12 days | 31% | 25.4% | 25.9% | 25.6% | 23.8% |
| Routine specialist inpatient pathway | % of patients with LoS>2 days | 44% | 63.1% | 61.2% | 55.6% | 53.1% |
| Complex care pathway | % of patients with LoS>14 days | 11% | 13.1% | 12.4% | 11.0% | 10.8% |
| % BDU of patients with LoS>30 days | 33% | 36.9% | 36.0% | 35.1% | 34.4% | |
| Routine and complex care pathway | Average LoS for those staying >2 days | 610 days | 12.9 | 12.7 | 12.4 | 12.4 |
| Summary metric | Overall average LoS | 5.8 days | 8.5 | 8.1 | 7.2 | 6.9 |
| No. of medical discharges | 202,567 | 206,250 | 235,167 | 253,083 | ||
RESULTS
The NAMP model of care was officially launched in December 2010.[6] Thirty‐two out of the 33 Irish hospitals that admit acute medical patients had adopted the model of care by the end of 2013. The program team performed an initial diagnostic meeting at each hospital to explain the program, discuss their individual baseline metrics, and collaboratively develop a hospital‐specific implementation plan. A local implementation and unscheduled care governance team, composed of senior management members and local GPs, was established in each hospital to identify ward spaces to be developed as AMAUs, reassign nursing staff to the AMAU from the wards, and organize the recruitment of new consultants with an interest in acute general medicine. The program team performed 2 to 3 visits per year to each hospital to obtain feedback on performance and support local improvement plans using appreciative enquiry. They also organized workshops and training for physicians, nurses, managers, and data managers to improve understanding of and engagement with the program. An acute medicine nurse interest group was convened to support nurses in the transition to clinical practice with a greater focus on ambulatory care. Annual conferences were held to present and discuss annual and cumulative audit results.
Table 2 presents the national KPI results for the cost and value objectives over the 3 years of implementation. The number of medical discharges increased from 202,567 in 2010 to 253,083 in 2013. The proportion of discharges that passed through the AMAU was 29% in 2013, considerably reducing the amount of patients seen through the ED and alleviating some of the overcrowding experienced there.
The proportion of medical patients who avoided admission increased from 11.5% to 23.2% in 2013. When examining the proportion of patients discharged within 48 hours, we combined results for the ambulatory care pathway (LoS=0) and the medical short‐stay pathway (LoS=12) and found a 10% increase nationally from 36.9% to 47% in 2013. In addition, the proportion of total medical bed‐days used (BDU) for patients with LoS over 30 days also improved by 2.5%. The program achieved an overall reduction of 0.5 days in those staying over 2 days nationally, and an overall reduction in average LoS (AvLoS) for all medical inpatients of 1.6 days (from 8.5 days 6.9 days) across the 3 years.
Table 3 shows the average change in KPIs from 2010 to 2013 by hospital model group. Looking at data by hospital group allowed results to be interpreted in a national context and identify any bottlenecks in the health system.
| Care pathway | Metric | National | Model 2 | Model 3 | Model 4 |
|---|---|---|---|---|---|
| |||||
| Ambulatory care pathway | % of patients with LoS=0 | 11.7% | 11.5% | 12% | 11.5% |
| Medical short‐stay pathway | % of patients with LoS 12 days | 1.6% | 5% | 2.3% | 0.3% |
| Routine specialist inpatient pathway | % of patients with LoS>2 days | 10% | 6.4% | 9.8% | 11.2% |
| Complex care pathway | % of patients with LoS>14 days | 2.3% | 0.4% | 1.7% | 4.1% |
| % BDU of patients with LoS>30 days | 2.5% | 1.9% | 0.2% | 4.9% | |
| Routine and complex care pathway | Average LoS for those staying >2 days | 0.5 | 0.7 | 0 | 1.4 |
| Summary metric | Overall average LoS | 1.6 | 0.4 | 1.0 | 2.6 |
During the 3‐year period, the role of model 2 hospitals changed from admitting all medical patients to only admitting differentiated medical patients referred from GPs. This is reflected in their KPI results, with an increasing proportion of patients with LoS greater than 14 days and the proportion of BDU occupied by those with LoS greater than 30 days. Data from the model 2 and 3 hospitals showed a considerable increase in same‐day discharges, with a concurrent decrease in percentage of patients staying in the hospital longer than 2 days. This translated to a national reduction in AvLoS of 1 day in this hospital group. Model 2 hospitals experienced small increases in both the AvLoS for those patients staying over 2 days (0.7%) and the proportion of BDU occupied by patients staying longer than 30 days (1.9%), whereas model 3 had experienced no real change in either of these metrics (0% and 0.2%, respectively). This reflected the limited availability of long‐term care facilities and protracted funding approval process nationally during the implementation period.
Model 4 hospitals experienced improvement across all KPIs. There was an 11.2% increase in the proportion of patients discharged within 48 hours and a 1.4‐day reduction in AvLoS for patients with LoS>2 days. A notable success within this hospital category was the 4.9% reduction in percentage of BDU by patients with LoS>30 days. The AvLoS for all medical admissions in this group remained above the national target at 8.6 days but did decrease considerably by 2.6 days from its baseline.
Data on 28‐day readmission to the same facility were used as a balancing measure but were only available for the latter 2 years. We found rates of 11% and 10% for 2012 and 2013, respectively. Patient experience of these new units should be assessed, but it was not possible to measure this during the implementation period.
DISCUSSION
The implementation of the NAMP has demonstrably streamlined the care of acute medical patients in Ireland. We report the results of this national transformational change brought about by the implementation of an evidence‐based model of care. The development of a flow model for each hospital improved the patient flow from assessment to discharge. Process improvement lies at the core of all the successes achieved by the program. The practice changes highlighted in Table 1 were pivotal in streamlining and improving the care of acutely ill medical patients. The focus on early access to senior decision making, early diagnostics, and a continuous, coordinated, multidisciplinary approach to care and discharge were central to the effective functioning of the AMAU and the resulting increase in avoided admissions.
Shortened lengths of stay are associated with better clinical outcomes and reduced exposure of patients to risk, and result in significant cost efficiencies accrued to the Irish health services.[2, 8] The adoption of ambulatory care and medical short‐stay pathways facilitated the 11.7% increase in avoided admissions and the reduction of 1.6 days in overall AvLoS nationally. This translates to significant cost savings for the Irish health system and likely improves clinical outcomes and reduced morbidity. We estimated these cost savings to be approximately 88.2 million by multiplying the number of bed days saved by the marginal cost of a bed day, which was quoted at 246 in 2012 by our Healthcare Pricing Office.
Thirty‐two of the 33 Irish hospitals that admit acute medical patients are now operating the program and achieving improvements in performance, as evidenced by ongoing audits. The priority given to the program by the RCPI and HSE has enabled the assignment of local implementation teams sustaining the focus on quality improvement at a local level. It also allowed for modest seed funding to be allocated for the appointment of 36 new consultants with an interest in acute general medicine. The cost of these additional consultants is offset by the considerable savings achieved through efficiency gains. An important challenge to implementation was the change in mindset required from local healthcare staff to divert patients away from the ED to the AMAU, and reassign staff and resources from other inpatient wards to the new unit. Visible clinical leadership from clinical directors, acute medicine hospital leads, senior nursing, and HSCP, together with management and local GPs, was essential in effecting this change. The program team also offered considerable support in this regard through advocacy and promotion of the program nationally. The implementation of the 4 care pathways represents a generational change in how medicine is practiced in Ireland. The development of acute medicine as a new specialty was strongly fostered by the program.
A number of disease‐specific clinical programs began operation during the implementation period and achieved reductions in AvLoS for some conditions such as chronic obstructive pulmonary disease and heart failure, contributing to varying degrees (2%6%) to the bed‐days savings achieved by the NAMP. During the 3‐year period, there was a 25% increase in medical discharges. This is partly due to the changing demographics and epidemiology of chronic diseases in the Irish population. This increased demand was absorbed by the system with no increase in acute bed usage. We estimated that approximately 1000 additional acute beds would have been required if the NAMP efficiencies had not been achieved. Concurrent financial constraints compounded the stress on the public health system by limiting the available staff and resources for the new AMAUs and by reducing the number of community and nursing home beds available. This obstructed the flow of older and frailer patients out of the acute setting and impacted negatively on the performance of some hospitals.
An important limitation in auditing success in the quality and access aims of the program was the absence of IT systems within the AMAUs. These have since been specified by the NAMP but have not yet been delivered to the service areas. In addition, a bespoke user interface, which allows hospitals to manipulate and benchmark their own performance, is being developed. This will facilitate more in‐depth auditing within hospitals at the ward and consultant team level. The lack of a unique patient identifier hindered our ability to measure true 28‐day readmission rates, which is a useful quality indicator.
Despite these contextual, cultural, and structural challenges, the NAMP successfully implemented an evidence‐based model of care across the country. Through its implementation, tangible improvements to the Irish health system were observed with expected benefits to the patient. The program successfully instituted an ongoing audit cycle to promote continuous improvement and identified areas for future work to build on the successes achieved.
Disclosure
Nothing to report.
- ,. The effect of emergency department crowding on patient outcomes: a literature review. Adv Emerg Nurs J. 2011;33(1):39–54.
- , , , et al. Effect of emergency department crowding on outcomes of admitted patients. Ann Emerg Med. 2013;61(6):605–611.e6.
- , , . The relationship between emergency department crowding and patient outcomes: a systematic review. J Nurs Scholarsh. 2014;46(2):106–115.
- , , , et al. The effect of emergency department crowding on clinically oriented outcomes. Acad Emerg Med. 2009;16(1):1–10.
- Acute medical assessment units: a literature review. 2012. [Unpublished Manuscript]
- National Acute Medicine Programme Working Group. Report of the National Acute Medicine Programme 2010. Retrieved on Sep 24, 2014 from, http://www.hse.ie/eng/about/Who/clinical/natclinprog/acutemedicineprogramme/report.pdf. [Retrieved]
- Royal College of Physicians. Acute medical care. The right person, in the right setting—first time. October 2007. Retrieved on Sep 24, 2014, from, https://www.rcplondon.ac.uk/sites/default/files/documents/acute_medical_care_final_for_web.pdf.
- . Increase in patient mortality at 10 days associated with emergency department overcrowding. Med J Aust. 2006;184(5):213–216.
© 2015 Society of Hospital Medicine

Stratum Corneum Absorption Kinetics of 2 Potent Topical Corticosteroid Formulations: A Pilot Study
The active ingredient of any pharmaceutical product is responsible for the agent’s efficacy and safety profile. This ingredient is extensively studied in clinical trials and evaluated by the US Food and Drug Administration before the product is commercially available. In dermatologic products, especially those for treating dermatoses, the vehicle in which the active ingredient is formulated also plays a role in drug delivery and indirectly impacts therapeutic outcomes, unlike excipients in oral medications. Topical vehicles must be stable, provide a suitable environment that will not degrade the active ingredient or affect its efficacy, and be cosmetically acceptable.1
Topical vehicles are formulated to maintain the stability of the active ingredient and allow it to readily penetrate the skin and reach its target area with minimal absorption into the bloodstream, thus avoiding systemic adverse events. A variety of vehicles can exist for a single active ingredient to accommodate different phases of disease and different anatomical sites where the disease may occur.2 For example, alcohol-based vehicles, sprays, and foams are preferred for the scalp where evaporation of the vehicle is beneficial to prevent greasiness of the hair, while ointments may be preferred due to their occlusive nature for areas with xerotic or thick skin from dermatoses.
Cosmetic acceptability of the vehicle may influence patient adherence to therapy. Housman et al3 assessed a variety of products formulated in different vehicles (ie, solutions, foams, emollients, gels, creams, ointments) for the treatment of psoriasis. Patients with psoriasis applied each test product to a quarter-sized area of normal skin on the forearm using a cotton swab and completed a preference questionnaire. By far, respondents significantly preferred solutions and foams over creams, gels, and ointments (P<.01). Side effects were rated to be the most important characteristics of topical therapy, followed by time needed for application, ease of application, and messiness.3 Presumably, if patients are frustrated with the topical product that they are using, adherence to the prescribed dosage and application instructions will diminish over time, leading to suboptimal steady-state levels of the product. If appropriate levels of the drug are not present at the target site, treatment will not be successful.
Steady-state levels of a topical drug at the site of action also are maintained via appropriate application frequency, most commonly once to 4 times daily for dermatologic products. Fluocinonide and halcinonide are class II (potent) corticosteroids indicated for the relief of inflammatory and pruritic manifestations of corticosteroid-responsive dermatoses and usually are administered at least twice daily. In double-blind clinical studies comparing both products in the treatment of psoriasis, halcinonide resulted in more improved outcomes than fluocinonide.4-6 Sudilovsky and Clewe4 studied 140 patients with moderate to severe psoriasis. After 3 weeks of treatment, 44% showed superior results with halcinonide, 27% showed superior results with fluocinonide, 26% showed equal results with both products, and 3% showed no relief.4 Similarly, Close5 reported that 61% of patients showed superior results with halcinonide, 25% showed superior results with fluocinonide, 10% showed equal results with both products, and 4% showed no relief (N=50). Lynfield and Watsky6 reported that 56% of patients with severe psoriasis who were treated with halcinonide for 2 weeks showed improvement to normal or slight inflammation compared to 44% of patients treated with fluocinonide (N=59). All 3 studies used cream formulations of halcinonide and fluocinonide.
Recently, halcinonide cream was shown to have an immediate release into the stratum corneum that peaked within 1 hour of application and remained elevated for 6 hours before beginning to decline.7 These results support a biphasic release of halcinonide, which is in agreement with its formulation—that halcinonide exists in both a solution phase for immediate release into the skin and in a suspension phase that allows a sustained release after equilibrium is reached between the solution and suspension phases.8 Fluocinonide is not known to be formulated in a similar way. Its vehicle composition and penetration into the skin could explain the superior efficacy of halcinonide versus fluocinonide.
The current pilot study was conducted to compare the release pattern of fluocinonide cream versus halcinonide cream into the stratum corneum using an in vivo, noninvasive method. Results for halcin-onide have been previously published.7
Methods
Participants were sequestered in a controlled environment for the entire day to allow the skin to equilibrate prior to product application. The methodology for the application and quantification of halcinonide cream 0.1% into the stratum corneum of 5 participants using a tape-stripping protocol has been described elsewhere.7 Concordia Clinical Research institutional review board (Cedar Knolls, New Jersey) approved this study, which was conducted at Dermatology Consulting Services (High Point, North Carolina).
A 0.1-g dose of generic fluocinonide cream 0.05% was applied to four 2.5-cm circular sites on the forearm in 5 participants with normal skin until completely absorbed. Circular tape strips were subsequently placed on the application site at 1, 3, 6, and 9 hours posttreatment and were held for 10 seconds with a controlled pressure plunger to ensure adequate and consistent contact between the tape strip and the skin. The tape strip was removed with forceps, rolled with the skin scale inside, and placed in a glass vial. This procedure was repeated 6 times at 1 of 4 sites with a new tape strip at each time point to obtain samples from deeper skin layers. A total of 24 tape strips were collected from each participant.
All vials were frozen at -20°C and were shipped overnight to Robert Kellar, PhD, at the Center for Bioengineering Innovation at Northern Arizona University (Flagstaff, Arizona) for mass spectroscopy evaluation. Once received at the outside facility, the vials were stored at -20°C until analysis. Each sample was spiked with a known quantity of an appropriate reference standard and extracted with 1 mL acetonitrile at room temperature for 1 minute with agitation. New unused tape strips were spiked with a small amount of fluocinonide reference standard for extraction efficiency.
Extracts were evaporated to dryness under nitrogen gas, resuspended in 200 µL chromatography solvent, and quantified using liquid chromatography–mass spectrometry. To remove the skin scale from the tape strips, 10 mL of a solvent solution of 0.1 mg/mL fludrocortisone acetate in acetonitrile was dispensed into a 4 dram vial containing the tape strip. The vials were ultrasonicated and shaken for 10 to 15 minutes, and the samples were further diluted to 100-fold and were inverted several times to ensure complete dissolution of fluocinonide before liquid chromatography–mass spectrometry.
A standard curve ranging from the lower limit of quantification to the upper limit of quantification for the fluocinonide reference was used to determine the quantity of fluocinonide in each of the tape strips. Once the lower limit of quantification was reached in a given set of tape strip samples (1-, 3-, 6-, and 9-hour samples), the next 2 sequential tape strips in that set were analyzed to confirm fluocinonide was not detectable in deeper layers. Standard quality controls were analyzed to ensure run-to-run and sample-to-sample accuracy.
Each sample was analyzed in duplicate; 10 mg fluocinonide was used as a reference standard. The minimum detectable concentration of fluocinonide was 1 ng/mL.
Results
As expected, tape strip 1 from each participant contained the highest concentration of fluocinonide. This strip corresponded to the most superficial layer of skin. Concentrations decreased in deeper skin layers, as detected in strips 2 to 6.
In general, the average concentration of fluocin-onide in strip 1 for all 5 participants was highest at hour 1, with a subsequent decline at hours 3, 6, and 9; however, participant 1 showed a second peak in fluocinonide concentration at hour 6 (Figure 1). When the fluocinonide concentration in strips 1 to 6 was averaged for each participant at each time point, similar results were obtained: a general decline after hour 1, but a second prominent peak at hour 6 in participant 1 only. In participant 1, the average fluocinonide concentration for strips 1 to 6 was 393 ng/mL at hour 1 and declined to 208 ng/mL at hour 3; it increased to 451 ng/mL at hour 6 before declining again to 202 ng/mL at hour 9.
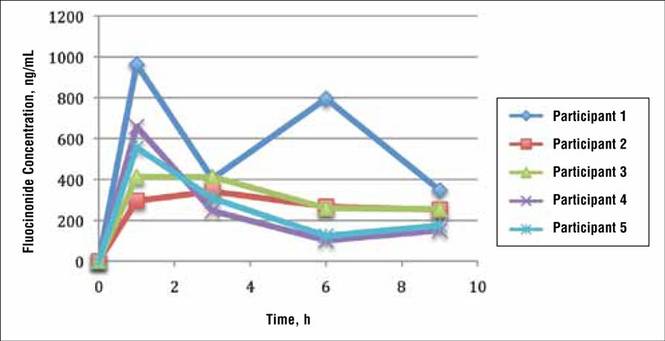
Because participant 1 was the only one to exhibit a second peak of fluocinonide concentration, it appears that measurements obtained from this participant may be outliers. When removing partici-pant 1 from the analysis of fluocinonide concentration in strip 1 at each time point, a clear decline is evident from hour 1 to hour 9 (Figure 2A, red line [partici-pants 2–5] vs blue line [participants 1–5]).
When the average concentration of fluocinonide was calculated in strips 1 to 6 from all participants, there was a general steady decline after hour 1 with a slight increase of 25 ng/mL at hour 6 (Figure 2B, blue line). This increase is due to the measurements obtained from participant 1; however, if partici-pant 1 is removed from the analysis, a constant decline is observed from hour 1 to hour 9 (Figure 2B, red line).
|
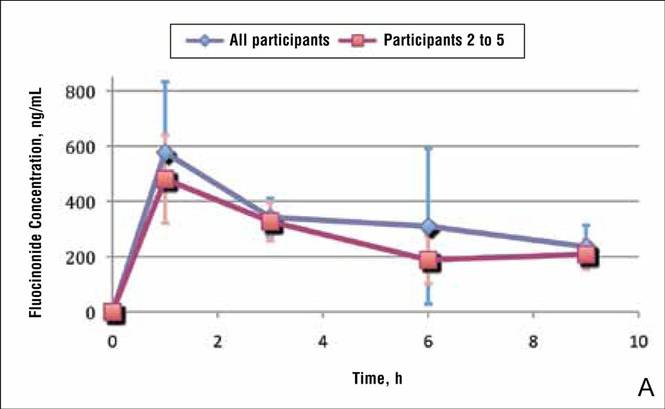
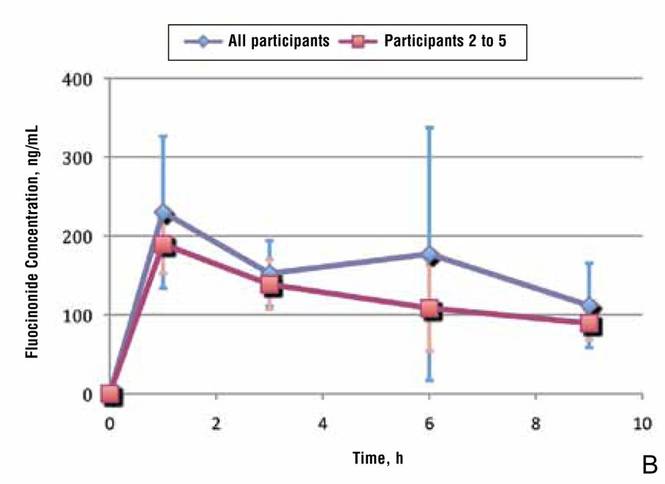
A prior study evaluated the penetration and absorption of halcinonide in the stratum corneum.7 In summary, halcinonide concentration peaked at hour 1 following application and remained elevated to hour 6, before beginning a slow decline. The average concentration of halcinonide from all participants in strips 1 to 6 reached 1350 ng/mL at hour 1, remained within 93% to 97% of this level (1253–1303 ng/mL) for the next 5 hours, and declined only 29% from the peak at hour 1 to hour 9 (958 ng/mL)(Figure 3, blue line).7 In contrast, the fluocinonide concentration in participants 2 to 5 from the current study reached 190 ng/mL at hour 1 and steadily declined 53% to 89 ng/mL by hour 9 (Figure 3, red line).
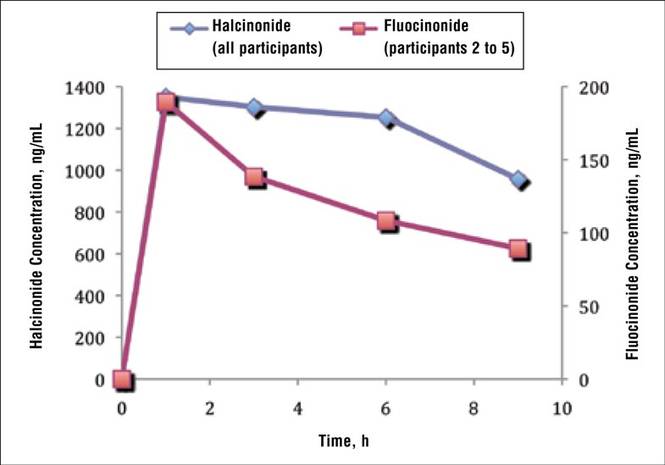
Two participants from the prior halcinonide study also were enrolled in the current fluocinonide study (referred to as participant A and B). In general, halcinonide levels in both participants remained elevated for 6 hours after application and declined 27.5% and 35.5%, respectively, by hour 9 (Figure 4). Participant A experienced a 20.5% dip in halcinonide concentration at hour 3 followed by an increase at hour 6; however, the halcinonide concentration at hour 9 was similar to hour 3.7 In contrast, fluocin-onide concentrations for these participants peaked at 1 hour and clearly declined approximately 60% over the next 8 hours.
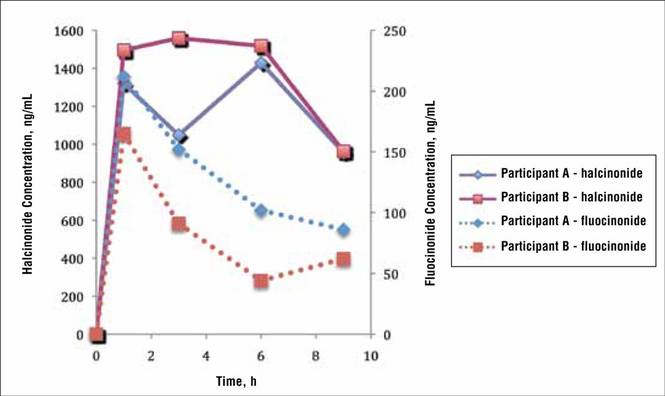
Comment
The release of both fluocinonide and halcinonide into the skin was evaluated using dermal tape stripping on 4 sites on the forearms of healthy individuals. Cream formulations of each corticosteroid were evaluated in 5 participants, with 2 participants receiving both formulations during different study periods. In the prior study with halcinonide, the stratum corneum exhibited the highest concentration of the corticosteroid, with substantial declines beyond strip 6 (ie, strips 7–20).7 For this reason, only strips 1 to 6 were evaluated for corticosteroid penetration and absorption.
Results from strip 1 indicated immediate absorption of corticosteroid (fluocinonide and halcinonide) into the skin. Unlike the release of halcinonide, which demonstrated a clear sustained release over 6 hours before decreasing,7 fluocinonide concentrations began declining immediately after peaking at hour 1 and continued to decline up to hour 9. Only participant 1 exhibited a second peak of fluocinonide concentration at hour 6; the rest of the participants did not. This second peak is most likely an anomaly due to the small number of participants rather than a true elevation.
Given the rapid decline of fluocinonide concentration over the 9 hours compared with the more gradual decline of halcinonide concentration, there appears to be no evidence of a biphasic sustained release of fluocinonide from its vehicle. This difference in release pattern from each corticosteroid’s respective vehicle may explain in part the different clinical outcomes in comparative studies.4-6
It is known that vehicle composition affects corticosteroid diffusion from the vehicle to the skin surface and subsequent penetration into the skin.9 Either process can determine the overall effectiveness of the product. Ayres and Hooper10 evaluated the penetration of 4 topical preparations of cortisol. Product 1 delivered 16 times more cortisol to the skin than product 2, 8 times more than product 3, and 3 times more than product 4. Because all the preparations contained cortisol-free alcohol, these differences were attributed to the vehicle in which the cortisol was formulated. Products 1 and 4 both contained 10% urea, but the urea in product 1 was a powder in a cream base and the urea in product 4 was in a stabilizing emulsified base. Product 2 contained a propylene glycol/water base and product 3 was a water-miscible cream.10
Generic corticosteroid products have been observed in clinical practice and have been shown in vasoconstriction assays to be less and more potent than their brand-name equivalents.2,11 Vasoconstriction assays are the standard for assessing the potency of topical corticosteroids and predicting their clinical efficacy.2 One study reported significant differences in therapeutic effectiveness between generic formulations and their brand-name equivalents.12 Kenalog cream 0.1% (multiple manufacturers) was significantly more potent than any of the generic triamcinolone creams tested (P<.05); in fact, Kenalog cream 0.025% (multiple manufacturers) was statistically superior to all the generic triamcinolone creams 0.1%. Moreover, Artistocort A ointment 0.1% (Lederele Laboratories) and Valisone cream 0.1% (Schering Corporation) also were more potent than their generics at the same concentration in the same vehicle type.12 A second study also observed that 2 of 6 generic formulations had significantly less vasoconstriction than their respective brand-name formulations.11 A brand-name betamethasone valerate cream produced significantly greater vasoconstriction than its generic equivalent, and a brand-name betamethasone dipropionate cream produced greater vasoconstriction than one generic and equal vasoconstriction to another generic. Additionally, the vasoconstriction measured with Diprosone was greater than that measured with Diprolene, another brand-name product of betamethasone dipropionate.11 Diprosone and Diprolene differ in their vehicle content. The latter, a class I corticosteroid, contains a modified vehicle high in propylene glycol, whereas the former contains less propylene glycol and thus is classified as a class III corticosteroid. Propylene glycol allows hydrophobic molecules such as corticosteroids to dissolve more fully in the vehicle.12
Ostrenga et al1 studied the solubility of corticosteroids in different vehicles and, as expected, corticosteroids that fully solubilized in the vehicle exhibited better penetration into the skin on assessment with vasoconstriction assays. Corticosteroids in a suspension, on the other hand, showed slower penetration into the skin.1,13 A balance between the solution and suspension phase would allow a drug to rapidly penetrate the skin upon application, and when this pool of solubilized drug was depleted, additional drug could penetrate into the skin from the suspension phase. Based on the tape strip results from the current study it appears that halcinonide, which is manufactured in a biphasic formulation, follows this pattern of penetration and absorption into the stratum corneum. In contrast, fluocinonide appears to exist in a soluble state without much, if any, amount in a suspension phase because it had no sustained release during the 9 hours after application.
Common belief among dermatologists is that long-term use of corticosteroids leads to tachyphylaxis,14 which can be attributed to poor patient adherence. If patients skip doses, then the steady state of the product at the target site is not maintained. It is interesting to speculate that using agents with more sustained release beyond the time of application (such as halcinonide) may preserve steady-state levels even when patients are neglectful of the next medication application. Corticosteroids that work in 2 phases such as halcinonide may minimize tachyphylaxis experienced with prolonged use of corticosteroids.
Fluocinonide and halcinonide are both class II high-potency corticosteroids as shown on outcomes from vasoconstrictor assays, which assess the extent to which a corticosteroid causes cutaneous vasoconstriction or blanching in normal healthy individuals.15 The assay depends on the molecule diffusing from the vehicle, penetrating the skin, and causing a reaction (blanching) that is then evaluated. The assay cannot effectively evaluate the rate of continued diffusion and skin penetration beyond the appearance of blanching. In contrast, the tape-stripping method provides an inside look at the extent of penetration of the corticosteroid beyond the skin surface and the rate of its clearance from different skin layers. In the current study, the levels of fluocinonide declined after peaking at 1 hour after application, but the levels of halcinonide clearly remained elevated after peaking at the same time point. Most likely, vasoconstrictor studies would not be able to differentiate between the concentrations of the 2 products in the stratum corneum beyond the first hour after application.
Tape stripping, or dermatopharmacokinetics, has advantages over vasoconstriction assays in studying corticosteroid penetration and clearance from the stratum corneum. At one point, the US Food and Drug Administration had included tape stripping in its preliminary guidelines for generic topical bioequivalence studies until data from the same formulation generated from 2 different laboratories produced different results.16 Since that time, much work has been done with tape stripping to ensure its consistency. Weigmann et al17 demonstrated equivalent results with clobetasol using vasoconstriction and tape stripping, and Wiedersberg et al18 demonstrated the same with betamethasone. For the current study, the fluocinonide and halcinonide formulations were weighed prior to application so that the same dose was tested in all participants. A plunger was used to produce consistent pressure at all application sites to control for the amount of skin that was stripped off with the tape. Results for both corticosteroids were consistent between the participants. Variability in the data was detected; however, this observation is most likely due to the small number of participants in the studies.
Conclusion
In summary, this pilot study demonstrated that fluocinonide concentration in the stratum corneum peaks within the first hour of application before beginning a steady general decline. There was no evidence of sustained release. In contrast, halcin-onide demonstrated a sustained release for 6 hours after application. Halcinonide is formulated in a cream base in which the corticosteroid is present in a solution and suspension phase that allows for sustained delivery in skin over time. Fluocinonide does not appear to be formulated in the same way, and its concentrations in the stratum corneum begin to decline 1 hour after application.
Acknowledgement
Thank you to Robert Kellar, PhD, at the Center for Bioengineering Innovation at Northern Arizona University, Flagstaff, for conducting the liquid chromatography–mass spectrometry.
1. Ostrenga J, Haleblian J, Poulsen B, et al. Vehicle design for a new topical steroid, fluocinonide. J Invest Dermatol. 1971;56:392-399.
2. Rathi SK, D’Souza P. Rational and ethical use of topical corticosteroids based on safety and efficacy. Indian J Dermatol. 2012;57:251-259.
3. Housman TS, Mellen BG, Rapp SR, et al. Patients with psoriasis prefer solution and foam vehicles: a quantitative assessment of vehicle preference. Cutis. 2002;70:327-332.
4. Sudilovsky A, Clewe TH. Comparative efficacy of halcin-onide and fluocinonide creams in psoriasis and eczematous dermatoses. J Clin Pharmacol. 1975;15:779-784.
5. Close JE. Double-blind comparison of topical halcinonide and fluocinonide in the treatment of psoriasis. Int J Dermatol. 1976;15:534-537.
6. Lynfield Y, Watsky M. Psoriasis: topical corticosteroid therapy. Cutis. 1976;18:133, 136-137.
7. Draelos ZD. Demonstration of the biphasic release of 0.1% halcinonide cream. J Drugs Dermatol. 2015;14:89-90.
8. Bagatell FK. Halcinonide: a new potent topical anti-inflammatory drug. Cutis. 1974;14:459-462.
9. Ostrenga J, Steinmetz C, Poulsen B. Significance of vehicle composition. I. relationship between topical vehicle composition, skin penetrability, and clinical efficacy. J Pharm Sci. 1971;60:1175-1179.
10. Ayres PJ, Hooper G. Assessment of the skin penetration properties of different carrier vehicles for topically applied cortisol. Br J Dermatol. 1978;99:307-317.
11. Olsen EA. Double-blind controlled comparison of generic and trade-name topical steroids using the vasoconstriction assay. Arch Dermatol. 1991;127:197-201.
12. Stoughton RB. Are generic formulations equivalent to trade name topical glucocorticoids? Arch Dermatol. 1987;123:1312-1314.
13. Poulsen BJ, Young E, Coquilla V, et al. Effect of topical vehicle composition on the in vitro release of fluocinolone acetonide and its acetate ester. J Pharm Sci. 1968;57:928-933.
14. Taheri A, Cantrell J, Feldman SR. Tachyphylaxis to topical glucocorticoids: what is the evidence? Dermatol Online J. 2013;19:18954.
15. Ference JD, Last AR. Choosing topical corticosteroids. Am Fam Physician. 2009;79:135-140.
16. Pershing LK, Nelson JL, Corlett JL, et al. Assessment of dermatopharmacokinetic approach in the bioequivalence determination of topical tretinoin gel products. J Am Acad Dermatol. 2003;48:740-751.
17. Weigmann H, Lademann J, v Pelchrzim R, et al. Bioavailability of clobetasol propionate-quantification of drug concentrations in the stratum corneum by dermatopharmacokinetics using tape stripping. Skin Pharmacol Appl Skin Physiol. 1999;12:46-53.
18. Wiedersberg S, Naik A, Leopold CS, et al. Pharmacodynamics and dermatopharmacokinetics of betamethasone 17-valerate: assessment of topical bioavailability. Br J Dermatol. 2009;160:676-686.
The active ingredient of any pharmaceutical product is responsible for the agent’s efficacy and safety profile. This ingredient is extensively studied in clinical trials and evaluated by the US Food and Drug Administration before the product is commercially available. In dermatologic products, especially those for treating dermatoses, the vehicle in which the active ingredient is formulated also plays a role in drug delivery and indirectly impacts therapeutic outcomes, unlike excipients in oral medications. Topical vehicles must be stable, provide a suitable environment that will not degrade the active ingredient or affect its efficacy, and be cosmetically acceptable.1
Topical vehicles are formulated to maintain the stability of the active ingredient and allow it to readily penetrate the skin and reach its target area with minimal absorption into the bloodstream, thus avoiding systemic adverse events. A variety of vehicles can exist for a single active ingredient to accommodate different phases of disease and different anatomical sites where the disease may occur.2 For example, alcohol-based vehicles, sprays, and foams are preferred for the scalp where evaporation of the vehicle is beneficial to prevent greasiness of the hair, while ointments may be preferred due to their occlusive nature for areas with xerotic or thick skin from dermatoses.
Cosmetic acceptability of the vehicle may influence patient adherence to therapy. Housman et al3 assessed a variety of products formulated in different vehicles (ie, solutions, foams, emollients, gels, creams, ointments) for the treatment of psoriasis. Patients with psoriasis applied each test product to a quarter-sized area of normal skin on the forearm using a cotton swab and completed a preference questionnaire. By far, respondents significantly preferred solutions and foams over creams, gels, and ointments (P<.01). Side effects were rated to be the most important characteristics of topical therapy, followed by time needed for application, ease of application, and messiness.3 Presumably, if patients are frustrated with the topical product that they are using, adherence to the prescribed dosage and application instructions will diminish over time, leading to suboptimal steady-state levels of the product. If appropriate levels of the drug are not present at the target site, treatment will not be successful.
Steady-state levels of a topical drug at the site of action also are maintained via appropriate application frequency, most commonly once to 4 times daily for dermatologic products. Fluocinonide and halcinonide are class II (potent) corticosteroids indicated for the relief of inflammatory and pruritic manifestations of corticosteroid-responsive dermatoses and usually are administered at least twice daily. In double-blind clinical studies comparing both products in the treatment of psoriasis, halcinonide resulted in more improved outcomes than fluocinonide.4-6 Sudilovsky and Clewe4 studied 140 patients with moderate to severe psoriasis. After 3 weeks of treatment, 44% showed superior results with halcinonide, 27% showed superior results with fluocinonide, 26% showed equal results with both products, and 3% showed no relief.4 Similarly, Close5 reported that 61% of patients showed superior results with halcinonide, 25% showed superior results with fluocinonide, 10% showed equal results with both products, and 4% showed no relief (N=50). Lynfield and Watsky6 reported that 56% of patients with severe psoriasis who were treated with halcinonide for 2 weeks showed improvement to normal or slight inflammation compared to 44% of patients treated with fluocinonide (N=59). All 3 studies used cream formulations of halcinonide and fluocinonide.
Recently, halcinonide cream was shown to have an immediate release into the stratum corneum that peaked within 1 hour of application and remained elevated for 6 hours before beginning to decline.7 These results support a biphasic release of halcinonide, which is in agreement with its formulation—that halcinonide exists in both a solution phase for immediate release into the skin and in a suspension phase that allows a sustained release after equilibrium is reached between the solution and suspension phases.8 Fluocinonide is not known to be formulated in a similar way. Its vehicle composition and penetration into the skin could explain the superior efficacy of halcinonide versus fluocinonide.
The current pilot study was conducted to compare the release pattern of fluocinonide cream versus halcinonide cream into the stratum corneum using an in vivo, noninvasive method. Results for halcin-onide have been previously published.7
Methods
Participants were sequestered in a controlled environment for the entire day to allow the skin to equilibrate prior to product application. The methodology for the application and quantification of halcinonide cream 0.1% into the stratum corneum of 5 participants using a tape-stripping protocol has been described elsewhere.7 Concordia Clinical Research institutional review board (Cedar Knolls, New Jersey) approved this study, which was conducted at Dermatology Consulting Services (High Point, North Carolina).
A 0.1-g dose of generic fluocinonide cream 0.05% was applied to four 2.5-cm circular sites on the forearm in 5 participants with normal skin until completely absorbed. Circular tape strips were subsequently placed on the application site at 1, 3, 6, and 9 hours posttreatment and were held for 10 seconds with a controlled pressure plunger to ensure adequate and consistent contact between the tape strip and the skin. The tape strip was removed with forceps, rolled with the skin scale inside, and placed in a glass vial. This procedure was repeated 6 times at 1 of 4 sites with a new tape strip at each time point to obtain samples from deeper skin layers. A total of 24 tape strips were collected from each participant.
All vials were frozen at -20°C and were shipped overnight to Robert Kellar, PhD, at the Center for Bioengineering Innovation at Northern Arizona University (Flagstaff, Arizona) for mass spectroscopy evaluation. Once received at the outside facility, the vials were stored at -20°C until analysis. Each sample was spiked with a known quantity of an appropriate reference standard and extracted with 1 mL acetonitrile at room temperature for 1 minute with agitation. New unused tape strips were spiked with a small amount of fluocinonide reference standard for extraction efficiency.
Extracts were evaporated to dryness under nitrogen gas, resuspended in 200 µL chromatography solvent, and quantified using liquid chromatography–mass spectrometry. To remove the skin scale from the tape strips, 10 mL of a solvent solution of 0.1 mg/mL fludrocortisone acetate in acetonitrile was dispensed into a 4 dram vial containing the tape strip. The vials were ultrasonicated and shaken for 10 to 15 minutes, and the samples were further diluted to 100-fold and were inverted several times to ensure complete dissolution of fluocinonide before liquid chromatography–mass spectrometry.
A standard curve ranging from the lower limit of quantification to the upper limit of quantification for the fluocinonide reference was used to determine the quantity of fluocinonide in each of the tape strips. Once the lower limit of quantification was reached in a given set of tape strip samples (1-, 3-, 6-, and 9-hour samples), the next 2 sequential tape strips in that set were analyzed to confirm fluocinonide was not detectable in deeper layers. Standard quality controls were analyzed to ensure run-to-run and sample-to-sample accuracy.
Each sample was analyzed in duplicate; 10 mg fluocinonide was used as a reference standard. The minimum detectable concentration of fluocinonide was 1 ng/mL.
Results
As expected, tape strip 1 from each participant contained the highest concentration of fluocinonide. This strip corresponded to the most superficial layer of skin. Concentrations decreased in deeper skin layers, as detected in strips 2 to 6.
In general, the average concentration of fluocin-onide in strip 1 for all 5 participants was highest at hour 1, with a subsequent decline at hours 3, 6, and 9; however, participant 1 showed a second peak in fluocinonide concentration at hour 6 (Figure 1). When the fluocinonide concentration in strips 1 to 6 was averaged for each participant at each time point, similar results were obtained: a general decline after hour 1, but a second prominent peak at hour 6 in participant 1 only. In participant 1, the average fluocinonide concentration for strips 1 to 6 was 393 ng/mL at hour 1 and declined to 208 ng/mL at hour 3; it increased to 451 ng/mL at hour 6 before declining again to 202 ng/mL at hour 9.
Because participant 1 was the only one to exhibit a second peak of fluocinonide concentration, it appears that measurements obtained from this participant may be outliers. When removing partici-pant 1 from the analysis of fluocinonide concentration in strip 1 at each time point, a clear decline is evident from hour 1 to hour 9 (Figure 2A, red line [partici-pants 2–5] vs blue line [participants 1–5]).
When the average concentration of fluocinonide was calculated in strips 1 to 6 from all participants, there was a general steady decline after hour 1 with a slight increase of 25 ng/mL at hour 6 (Figure 2B, blue line). This increase is due to the measurements obtained from participant 1; however, if partici-pant 1 is removed from the analysis, a constant decline is observed from hour 1 to hour 9 (Figure 2B, red line).
|
A prior study evaluated the penetration and absorption of halcinonide in the stratum corneum.7 In summary, halcinonide concentration peaked at hour 1 following application and remained elevated to hour 6, before beginning a slow decline. The average concentration of halcinonide from all participants in strips 1 to 6 reached 1350 ng/mL at hour 1, remained within 93% to 97% of this level (1253–1303 ng/mL) for the next 5 hours, and declined only 29% from the peak at hour 1 to hour 9 (958 ng/mL)(Figure 3, blue line).7 In contrast, the fluocinonide concentration in participants 2 to 5 from the current study reached 190 ng/mL at hour 1 and steadily declined 53% to 89 ng/mL by hour 9 (Figure 3, red line).
Two participants from the prior halcinonide study also were enrolled in the current fluocinonide study (referred to as participant A and B). In general, halcinonide levels in both participants remained elevated for 6 hours after application and declined 27.5% and 35.5%, respectively, by hour 9 (Figure 4). Participant A experienced a 20.5% dip in halcinonide concentration at hour 3 followed by an increase at hour 6; however, the halcinonide concentration at hour 9 was similar to hour 3.7 In contrast, fluocin-onide concentrations for these participants peaked at 1 hour and clearly declined approximately 60% over the next 8 hours.
Comment
The release of both fluocinonide and halcinonide into the skin was evaluated using dermal tape stripping on 4 sites on the forearms of healthy individuals. Cream formulations of each corticosteroid were evaluated in 5 participants, with 2 participants receiving both formulations during different study periods. In the prior study with halcinonide, the stratum corneum exhibited the highest concentration of the corticosteroid, with substantial declines beyond strip 6 (ie, strips 7–20).7 For this reason, only strips 1 to 6 were evaluated for corticosteroid penetration and absorption.
Results from strip 1 indicated immediate absorption of corticosteroid (fluocinonide and halcinonide) into the skin. Unlike the release of halcinonide, which demonstrated a clear sustained release over 6 hours before decreasing,7 fluocinonide concentrations began declining immediately after peaking at hour 1 and continued to decline up to hour 9. Only participant 1 exhibited a second peak of fluocinonide concentration at hour 6; the rest of the participants did not. This second peak is most likely an anomaly due to the small number of participants rather than a true elevation.
Given the rapid decline of fluocinonide concentration over the 9 hours compared with the more gradual decline of halcinonide concentration, there appears to be no evidence of a biphasic sustained release of fluocinonide from its vehicle. This difference in release pattern from each corticosteroid’s respective vehicle may explain in part the different clinical outcomes in comparative studies.4-6
It is known that vehicle composition affects corticosteroid diffusion from the vehicle to the skin surface and subsequent penetration into the skin.9 Either process can determine the overall effectiveness of the product. Ayres and Hooper10 evaluated the penetration of 4 topical preparations of cortisol. Product 1 delivered 16 times more cortisol to the skin than product 2, 8 times more than product 3, and 3 times more than product 4. Because all the preparations contained cortisol-free alcohol, these differences were attributed to the vehicle in which the cortisol was formulated. Products 1 and 4 both contained 10% urea, but the urea in product 1 was a powder in a cream base and the urea in product 4 was in a stabilizing emulsified base. Product 2 contained a propylene glycol/water base and product 3 was a water-miscible cream.10
Generic corticosteroid products have been observed in clinical practice and have been shown in vasoconstriction assays to be less and more potent than their brand-name equivalents.2,11 Vasoconstriction assays are the standard for assessing the potency of topical corticosteroids and predicting their clinical efficacy.2 One study reported significant differences in therapeutic effectiveness between generic formulations and their brand-name equivalents.12 Kenalog cream 0.1% (multiple manufacturers) was significantly more potent than any of the generic triamcinolone creams tested (P<.05); in fact, Kenalog cream 0.025% (multiple manufacturers) was statistically superior to all the generic triamcinolone creams 0.1%. Moreover, Artistocort A ointment 0.1% (Lederele Laboratories) and Valisone cream 0.1% (Schering Corporation) also were more potent than their generics at the same concentration in the same vehicle type.12 A second study also observed that 2 of 6 generic formulations had significantly less vasoconstriction than their respective brand-name formulations.11 A brand-name betamethasone valerate cream produced significantly greater vasoconstriction than its generic equivalent, and a brand-name betamethasone dipropionate cream produced greater vasoconstriction than one generic and equal vasoconstriction to another generic. Additionally, the vasoconstriction measured with Diprosone was greater than that measured with Diprolene, another brand-name product of betamethasone dipropionate.11 Diprosone and Diprolene differ in their vehicle content. The latter, a class I corticosteroid, contains a modified vehicle high in propylene glycol, whereas the former contains less propylene glycol and thus is classified as a class III corticosteroid. Propylene glycol allows hydrophobic molecules such as corticosteroids to dissolve more fully in the vehicle.12
Ostrenga et al1 studied the solubility of corticosteroids in different vehicles and, as expected, corticosteroids that fully solubilized in the vehicle exhibited better penetration into the skin on assessment with vasoconstriction assays. Corticosteroids in a suspension, on the other hand, showed slower penetration into the skin.1,13 A balance between the solution and suspension phase would allow a drug to rapidly penetrate the skin upon application, and when this pool of solubilized drug was depleted, additional drug could penetrate into the skin from the suspension phase. Based on the tape strip results from the current study it appears that halcinonide, which is manufactured in a biphasic formulation, follows this pattern of penetration and absorption into the stratum corneum. In contrast, fluocinonide appears to exist in a soluble state without much, if any, amount in a suspension phase because it had no sustained release during the 9 hours after application.
Common belief among dermatologists is that long-term use of corticosteroids leads to tachyphylaxis,14 which can be attributed to poor patient adherence. If patients skip doses, then the steady state of the product at the target site is not maintained. It is interesting to speculate that using agents with more sustained release beyond the time of application (such as halcinonide) may preserve steady-state levels even when patients are neglectful of the next medication application. Corticosteroids that work in 2 phases such as halcinonide may minimize tachyphylaxis experienced with prolonged use of corticosteroids.
Fluocinonide and halcinonide are both class II high-potency corticosteroids as shown on outcomes from vasoconstrictor assays, which assess the extent to which a corticosteroid causes cutaneous vasoconstriction or blanching in normal healthy individuals.15 The assay depends on the molecule diffusing from the vehicle, penetrating the skin, and causing a reaction (blanching) that is then evaluated. The assay cannot effectively evaluate the rate of continued diffusion and skin penetration beyond the appearance of blanching. In contrast, the tape-stripping method provides an inside look at the extent of penetration of the corticosteroid beyond the skin surface and the rate of its clearance from different skin layers. In the current study, the levels of fluocinonide declined after peaking at 1 hour after application, but the levels of halcinonide clearly remained elevated after peaking at the same time point. Most likely, vasoconstrictor studies would not be able to differentiate between the concentrations of the 2 products in the stratum corneum beyond the first hour after application.
Tape stripping, or dermatopharmacokinetics, has advantages over vasoconstriction assays in studying corticosteroid penetration and clearance from the stratum corneum. At one point, the US Food and Drug Administration had included tape stripping in its preliminary guidelines for generic topical bioequivalence studies until data from the same formulation generated from 2 different laboratories produced different results.16 Since that time, much work has been done with tape stripping to ensure its consistency. Weigmann et al17 demonstrated equivalent results with clobetasol using vasoconstriction and tape stripping, and Wiedersberg et al18 demonstrated the same with betamethasone. For the current study, the fluocinonide and halcinonide formulations were weighed prior to application so that the same dose was tested in all participants. A plunger was used to produce consistent pressure at all application sites to control for the amount of skin that was stripped off with the tape. Results for both corticosteroids were consistent between the participants. Variability in the data was detected; however, this observation is most likely due to the small number of participants in the studies.
Conclusion
In summary, this pilot study demonstrated that fluocinonide concentration in the stratum corneum peaks within the first hour of application before beginning a steady general decline. There was no evidence of sustained release. In contrast, halcin-onide demonstrated a sustained release for 6 hours after application. Halcinonide is formulated in a cream base in which the corticosteroid is present in a solution and suspension phase that allows for sustained delivery in skin over time. Fluocinonide does not appear to be formulated in the same way, and its concentrations in the stratum corneum begin to decline 1 hour after application.
Acknowledgement
Thank you to Robert Kellar, PhD, at the Center for Bioengineering Innovation at Northern Arizona University, Flagstaff, for conducting the liquid chromatography–mass spectrometry.
1. Ostrenga J, Haleblian J, Poulsen B, et al. Vehicle design for a new topical steroid, fluocinonide. J Invest Dermatol. 1971;56:392-399.
2. Rathi SK, D’Souza P. Rational and ethical use of topical corticosteroids based on safety and efficacy. Indian J Dermatol. 2012;57:251-259.
3. Housman TS, Mellen BG, Rapp SR, et al. Patients with psoriasis prefer solution and foam vehicles: a quantitative assessment of vehicle preference. Cutis. 2002;70:327-332.
4. Sudilovsky A, Clewe TH. Comparative efficacy of halcin-onide and fluocinonide creams in psoriasis and eczematous dermatoses. J Clin Pharmacol. 1975;15:779-784.
5. Close JE. Double-blind comparison of topical halcinonide and fluocinonide in the treatment of psoriasis. Int J Dermatol. 1976;15:534-537.
6. Lynfield Y, Watsky M. Psoriasis: topical corticosteroid therapy. Cutis. 1976;18:133, 136-137.
7. Draelos ZD. Demonstration of the biphasic release of 0.1% halcinonide cream. J Drugs Dermatol. 2015;14:89-90.
8. Bagatell FK. Halcinonide: a new potent topical anti-inflammatory drug. Cutis. 1974;14:459-462.
9. Ostrenga J, Steinmetz C, Poulsen B. Significance of vehicle composition. I. relationship between topical vehicle composition, skin penetrability, and clinical efficacy. J Pharm Sci. 1971;60:1175-1179.
10. Ayres PJ, Hooper G. Assessment of the skin penetration properties of different carrier vehicles for topically applied cortisol. Br J Dermatol. 1978;99:307-317.
11. Olsen EA. Double-blind controlled comparison of generic and trade-name topical steroids using the vasoconstriction assay. Arch Dermatol. 1991;127:197-201.
12. Stoughton RB. Are generic formulations equivalent to trade name topical glucocorticoids? Arch Dermatol. 1987;123:1312-1314.
13. Poulsen BJ, Young E, Coquilla V, et al. Effect of topical vehicle composition on the in vitro release of fluocinolone acetonide and its acetate ester. J Pharm Sci. 1968;57:928-933.
14. Taheri A, Cantrell J, Feldman SR. Tachyphylaxis to topical glucocorticoids: what is the evidence? Dermatol Online J. 2013;19:18954.
15. Ference JD, Last AR. Choosing topical corticosteroids. Am Fam Physician. 2009;79:135-140.
16. Pershing LK, Nelson JL, Corlett JL, et al. Assessment of dermatopharmacokinetic approach in the bioequivalence determination of topical tretinoin gel products. J Am Acad Dermatol. 2003;48:740-751.
17. Weigmann H, Lademann J, v Pelchrzim R, et al. Bioavailability of clobetasol propionate-quantification of drug concentrations in the stratum corneum by dermatopharmacokinetics using tape stripping. Skin Pharmacol Appl Skin Physiol. 1999;12:46-53.
18. Wiedersberg S, Naik A, Leopold CS, et al. Pharmacodynamics and dermatopharmacokinetics of betamethasone 17-valerate: assessment of topical bioavailability. Br J Dermatol. 2009;160:676-686.
Practice Points
- Fluocinonide concentration in the stratum corneum peaks within the first hour of application and then begins a steady decline.
- Halcinonide concentration also peaks within the first hour of application and remains elevated for 6 hours after application.
- Halcinonide, rather than fluocinonide, may provide clinical benefits in between doses because of its sustained release hours after application.

Impact of an Inpatient PN Program
Inpatient medicine is becoming increasingly complex. A growing number of patients with multiple chronic conditions coupled with mounting care fragmentation leave patients vulnerable to adverse events and readmission to the hospital.[1, 2, 3] Moreover, efforts to minimize hospital length of stay (LOS) have resulted in patients being discharged quicker and sicker than ever before.[4]
A cornerstone of safe and high‐quality healthcare is effective communication.[5] Ineffective communication between and among healthcare providers and patients is a leading cause of medical errors and patient harm. An analysis of sentinel events reported to The Joint Commission revealed that communication failure was the root cause in 59% of these events.[6]
The current climate of increasing healthcare complexity has prompted the need for adaptive innovation.[7] However, there are limited data describing interventions targeting improvements in both communication and transitional care planning. We created a new position, the patient navigator (PN), a dedicated patient‐care facilitator not responsible for clinical care. PNs were integrated into the inpatient multidisciplinary clinical team to facilitate patient and provider navigation through the complexity of a hospital admission by enhancing communication between and among patients and providers. The objective of this study was to determine whether this intervention would reduce hospital LOS and 30‐day unplanned readmissions.
METHODS
Setting
Mount Sinai Hospital is a 446‐bed acute care urban academic health center in Toronto, Ontario, Canada. The general internal medicine service operates as a 90‐bed clinical teaching unit physically distributed over 4 inpatient wards. The service is structurally divided into 4 nongeographically based multidisciplinary care teams (teams A, B, C, and D) comprised of the medical team (attending physician, senior resident physician, 23 junior resident physicians, and 23 medical students), pharmacist, social worker, physiotherapist, occupational therapist, speech and language pathologist, dietician, respiratory therapist, and nursing staff allocated by ward. Each team is on call approximately 1 night in 4 with no night float system. At our institution, attending physicians rotate on a 2‐ or 4‐week schedule, resident physicians rotate on a 1‐ or 2‐month schedule, and medical students rotate on a 2‐month schedule. Preintervention, communication occurred in person and by telephone between members of the medical team. Other members of the multidisciplinary care team communicated with the medical team in person at daily multidisciplinary rounds focused on discharge planning, by pager, or using a Web‐based communication tool.
Intervention
PNs were dedicated patient‐care facilitators not responsible for clinical care. They acted as liaisons between and among providers and patients. Each PN was a fully integrated member of their multidisciplinary care team. With ongoing medical team rotations, the PN was notably the only consistent member on the clinical team. Each patient saw the same PN throughout his or her hospital stay, as both the patient and the PN were team based. The average number of patients for whom each PN was responsible daily was dictated by the patient census for their team. On average, each team had a census between 20 and 30 patients daily. PNs worked during the daytime from Monday to Friday, and did not have any overnight or weekend responsibilities.
A PN's typical day began by reviewing and rounding on overnight admissions as a formal member of the clinical team. This was followed by participating in daily multidisciplinary rounds, then documenting and circulating the resultant action items. Thereafter, they expedited consultations and tests by liaising with departmental staff, and proactively established contact with the patient and their family. They answered simple factual questions related to test scheduling, consultations, diagnosis, medications, and treatments as discussed and outlined by the clinical team, and promptly relayed care questions beyond the scope of their knowledge to the clinical team. They were available to patients, family members, and providers via a dedicated mobile number using phone calls and text messages. If indicated, they assisted in discharge coordination by arranging follow‐up appointments and placing postdischarge phone calls. In addition, they served as primary contact for every patient admitted to their clinical team following discharge to ensure appropriate follow through on discharge plans. There were no set criteria for PNs to disengage from a patient's care. They could always be reached using their dedicated mobile number during business hours, with a voicemail system in place for after‐hours calls.
The role was filled by individuals skilled in communication and/or healthcare, such as registered nurses, a masters degreetrained educator, internationally trained physicians, and professionals from the hospitality and human resources industries. There were no prespecified training or degree requirements. Each PN underwent on‐the‐job training and participated in twice monthly PN meetings for ongoing feedback and education.
Program Implementation
We implemented the PN program on the inpatient general internal medicine service in June 2010 on 2 of 4 multidisciplinary clinical teams. Because a PN became an integrated member of 1 of 4 clinical teams, patient assignment to a PN was determined by the team to which the patient was admitted. On average, each of the 4 teams admitted equally on a daily basis. Initially, there were only sufficient resources to fund 2 PNs. Thus, from June 2010 to May 2011, only teams A and C were assigned PNs. To create fairness between the 4 teams, these 2 PNs moved to teams B and D from June 2011 to November 2011, and then back to teams A and C from December 2011 to April 2012. Following this initial pilot period, the program was allocated further resources, and so expanded to all 4 teams in May 2012. PN salaries were the only program costs. These costs were funded by matching donations from physicians within the Mount Sinai Hospital Department of Medicine and donations to the hospital from community members directed to support the implementation and evaluation of novel care delivery systems.
Study Design
We evaluated the PN program using a retrospective cohort study that included all general medical admissions between July 2010 and March 2014 matched by case mix group, age category, and resource intensity weight (a relative value measuring total patient resource use compared with average typical acute inpatients).[8]
Our primary outcomes were LOS and 30‐day readmission rate. These outcomes were stratified by exposure status to a PN. There were no exclusion criteria for the LOS analysis. Patients who died, were transferred to or from an acute care facility, or signed out against medical advice were excluded from the 30‐day readmission analysis. A secondary analysis restricted the timeframe from July 2010 to April 2011, when only 2 of 4 teams were exposed to PNs.
Average LOS has been observed to be higher in Canadian hospitals as compared to their US counterparts across different admission diagnoses, such as coronary artery bypass graft surgery and heart failure.[9, 10] We hypothesize that these differences are party due to systems‐level differences, including posthospital care. Specifically, the Canadian system does not utilize posthospital acute care, such as skilled nursing facilities, which may in part account for these differences. To help contextualize our data, we standardized LOS using an LOS index called the LOS/expected LOS (ELOS) ratio. It takes the LOS and divides it by the ELOS, a validated estimate of the expected LOS for a given patient generated using a national administrative database for acute hospital care in Canada that takes into account case mix group, age, comorbidity level, and intervention factors.[8]
Additionally, We performed an interrupted time‐series analysis, whereby a log‐linear model was fit on LOS and adjusted for weekly and monthly trends, age category, resource intensity weight, major clinical category (a surrogate for case mix group), admission location, and discharge location. The cohort was divided into 3 groups: before program implementation (July 2009June 2010), after program implementation with PN (July 2010March 2014), and after program implementation without PN (July 2010March 2014).
This study was approved by the research ethics board at Mount Sinai Hospital. No patient consent was deemed necessary. Data were obtained from institutional databases monitored by the hospital's performance measurement office.
Statistical Analysis
In Tables 1, 2, mean values were compared using a 2‐tailed t test, and the relationship between categorical groups was determined using a 2 test. For the interrupted time‐series analysis, 2‐tailed t tests were used to test null hypotheses of no association between the parameter value and the outcome, and 2 tests were used to test for the equivalence of 2 given parameters. P0.05 indicated statistical significance for all comparisons and analyses. All data were analyzed using Stata version 13 (StataCorp, College Station, TX) or R 3.0.2 (R Foundation for Statistical Computing, Vienna, Austria).
| With PN, n = 5,628 | Without PN, n = 2,213 | |
|---|---|---|
| ||
| Age, y, mean (SD)* | 69 (20) | 68 (20) |
| Female sex, n (%) | 3,018 (53.6) | 1,196 (54.0) |
| Most responsible diagnosis, n (%) | ||
| Pneumonia | 374 (6.6) | 135 (6.1) |
| Chronic obstructive pulmonary disease | 271 (4.8) | 88 (4.0) |
| Congestive heart failure | 217 (3.9) | 87 (3.9) |
| Admission location, n (%) | ||
| Home | 4,665 (82.9) | 1,943 (87.8) |
| Long‐term care* | 524 (9.3) | 158 (7.1) |
| Other* | 439 (7.8) | 112 (5.1) |
| Discharge location, n (%) | ||
| Home | 3,824 (67.9) | 1,578 (71.3) |
| Long‐term care | 779 (13.8) | 267 (12.1) |
| Other | 1,025 (18.3) | 368 (16.6) |
RESULTS
Our matched cohort included 7841 admissions (6141 patients), with 5628 admissions (4592 patients) exposed and 2213 admissions (1920 patients) not exposed to PNs. The discrepancy between the total number of patients and the sum of exposed and nonexposed patients is resultant from patients admitted more than once over the study period, as patients admitted to at least 1 team staffed with a PN and another team not staffed with a PN over the study period were counted in both groups. The 2 groups were similar with respect to several characteristics (Table 1). However, the 2 groups were significantly different for age (P = 0.046) and admissions from long‐term care (P < 0.01) and other facilities (P < 0.01).
Admissions with PNs were 1.3 days (21%) shorter than admission without PNs (6.2 vs 7.5 days, P < 0.001). Moreover, admissions with PNs had a smaller mean LOS/ELOS ratio compared to admissions without PNs (0.93 vs 1.05, P < 0.001). The restricted analysis found a 1.2‐day (18%) lower LOS (6.4 vs 7.6 days, P < 0.05) and a smaller mean LOS/ELOS ratio (0.91 vs 1.06, P < 0.001). Thirty‐day readmission rate was not different between the 2 groups (13.1 vs 13.8%, P = 0.48) or in the restricted analysis (12.0 vs 13.5%, P = 0.40) (Table 2).
| With PN | Without PN | P Value | |
|---|---|---|---|
| |||
| July 2010‐March 2014 | |||
| LOS, d (95% confidence interval) [n] | 6.2 (6.06.4) [5,628] | 7.5 (7.17.9) [2,213] | <0.001 |
| LOS/ELOS ratio (95% confidence interval) [n] | 0.93 (0.910.95) [5,628] | 1.05 (1.001.09) [2,213] | <0.001 |
| 30‐day readmission rate, % [n] | 13.1 [5,055] | 13.8 [2,012] | 0.48 |
| July 2010 to April 2011 | |||
| LOS, d (95% confidence interval) [n] | 6.4 (5.87.0) [713] | 7.6 (6.88.3) [753) | <0.05 |
| LOS/ELOS ratio (95% confidence interval) [n] | 0.91 (0.850.96) [713] | 1.06 (1.001.11) [753] | <0.001 |
| 30‐day readmission rate, % [n] | 12.0 [627] | 13.5 [681] | 0.40 |
In the interrupted time‐series analysis, prior to the implementation of the PN program, there was a positive relationship between LOS and time. After the implementation of the program, this relationship became inverse, meaning the curve plotting LOS against time had a negative slope. Furthermore, there was a statistically significant drop in LOS at the time of program implementation (P < 0.05). However, there was no difference in slope between the groups with and without PN after program implementation.
DISCUSSION
We describe an innovative inpatient intervention featuring an integrated patient‐care facilitator not responsible for clinical care charged with enhancing communication between and among patients and providers. Data from the almost 4‐year period demonstrated that implementation was associated with a 21% reduction in hospital LOS, with no difference in 30‐day readmission rates.
The patient navigator was first conceptualized in 1990 to help African American women in Harlem with breast cancer negotiate the complex world of oncology.[11] It was later implemented by the National Cancer Institute as an outpatient intervention spanning the continuum of cancer care. This concept has since expanded to other domains of complex single disease outpatient care, including asthma and fertility.[12, 13] To our knowledge, there has been limited evidence in the literature describing implementation of such programs in the inpatient general medical setting.
This study contributes to the growing literature on interventions targeting improvements in transitional care, such as transition coaches and discharge advocates.[14, 15] Balaban et al. recently described a PN intervention in the safety‐net population.[16] A common theme to these interventions was the prioritization of safe care transitions. However, this goal was achieved using related, yet different approaches: transition coaches focused on encouraging the patient and caregiver to assert a more active role,[14] discharge advocates focused on providing a comprehensive discharge plan for patients,[15] PNs from Balaban's study focused on coaching and assistance in navigating patients through the transition from hospital to home, and our study's PNs focused on enhancing communication between and among patients and providers. Additionally, unlike transition coaches and discharge advocates, who were nurses by training, and PNs from Balaban's study, who were community health workers, our PNs did not have any prespecified training or degree requirements.
Patients are at risk of being inadequately informed about important issues related to their care, such as hospital medications, diagnoses, and treatment plans during their hospital stay.[17, 18] Furthermore, we know that ineffective communication is a common cause of poor patient outcomes in hospital‐based care.[6] This phenomenon can be amplified from external pressures to maximize productivity. For example, Elliott and colleagues found that increasing hospitalist workload is associated with higher hospital LOS and cost.[19] PNs may offload care demands by enhancing communication for providers and patients.
Our study has several strengths. By matching admissions by case mix group, age category, and resource intensity weight, we aimed to reduce potential bias contributed by these covariates. Moreover, a staged rollout of the intervention, whereby over a 10‐month period, 2 of the multidisciplinary care teams were assigned PNs, while the remaining 2 were not, enabled contemporaneous comparison. Our study had few exclusion criteria, thus making it potentially generalizable to other inpatient general medicine settings of a similar nature. The relative simplicity of this intervention makes it amenable to scalability. Of note, the intervention has been deemed to show great promise at our institution, and has currently expanded to the cardiology, gastroenterology, and surgical oncology units.
Our study's limitations include a single‐center design. Moreover, although we demonstrate similarity in the majority of measurable covariates between the groups, we cannot exclude the existence of unmeasured confounders. Of the covariates that were found to be different between the groups, we suspect the difference in admissions from long‐term care and other facilities did not largely influence our study's main findings. Furthermore, though age was found to be statistically different between the groups, we postulate that the 1‐year difference between the groups is not particularly relevant clinically. Additionally, 30‐day readmission rates were only captured for our institution. However, the vast majority of readmissions in our region are to the index facility, and are unlikely to differ between the 2 groups.[20]
There may have been secular trends at play. In the interrupted time‐series analysis, there was a statistically significant drop in LOS at the time of program implementation. There was however, no difference in slope between the groups with and without PNs after program implementation. There are some plausible explanations for this lack of difference in slope. The study may not have been powered to detect such a difference, as this analysis was not prespecified. Furthermore, there may have been a spillover effect of the program, such that PNs may have improved efficiency for the teams to which they were assigned, thereby improving the efficiency of the other members of the multidisciplinary team, many of whom cared for patients assigned and not assigned a PN. Additionally, we measured the LOS in a preintervention control group between July 2009 and June 2010 using the same inclusion criteria as the matched cohort. It was found to be 8.5 days, which suggests a secular trend toward improvement in LOS over time at our institution. We are, however, reassured that our restricted analysis enabling contemporaneous comparison between patients exposed and not exposed to PNs was still found to be significant.
The implementation of this intervention could have implications for policymakers‐at‐large. Establishment of criteria for qualifications and a clear educational curriculum to train future PNs is needed, especially in the context of ongoing program expansion. These initiatives are currently underway at our institution. Furthermore, evaluation of the program's operating cost and calculation of its return on investment should include balanced metrics incorporating patient‐, provider‐, organizational‐, and system‐level measures. The current cost to the hospital per PN is approximately $73,800 CAD ($58,700 USD), which covers 1 PN's annual salary and benefits. Thus, the implementation of 4 PNs for each of the 4 multidisciplinary teams costs the hospital approximately $295,000 CAD ($234,700 USD) per year. Although the details of our preliminary calculations are outside the scope of this report, it suggests that the savings incurred from shorter LOS outweigh program costs.
We found that implementation of this innovative inpatient intervention targeting improvements in communication was associated with a reduction in LOS without an increase in 30‐day readmission. Our experience shows promise and may inform others considering similar interventions. Patient and provider experience and generalizability should be evaluated in future work.
Acknowledgements
The authors thank Dr. Allan Detsky and David Wells for their review of the manuscript. They are also grateful to Chin‐Chin Chua, Ningmei Wang, and Joann Bon in the Office of Quality and Performance Measurement for their help with data collection, and John Matelski for his help with data analysis.
Disclosure: This program was funded by matched donations from physicians in the Mount Sinai Hospital Department of Medicine and donations to Mount Sinai Hospital from community members directed to support the implementation and evaluation of novel care delivery systems. The authors report no conflicts of interest. Preliminary abstracts of this study were presented in the online forum, Leading Health Care Innovation, November 12, 2013 (
- , , , et al. Multiple chronic conditions: prevalence, health consequences, and implications for quality, care management, and costs. J Gen Intern Med. 2007;22(S3):391–395.
- , , , , . The incidence and severity of adverse events affecting patients after discharge from the hospital. Ann Intern Med. 2003;138(3):161–167.
- , , . Rehospitalizations among patients in the Medicare fee‐for‐service program. N Engl J Med. 2009;360(14):1418–1428.
- , , , et al. Prospective payment system and impairment at discharge. The “quicker‐and‐sicker” story revisited. JAMA. 1990;264(15):1980–1983.
- . The human factor: the critical importance of effective teamwork and communication in providing safe care. Qual Saf Health Care. 2004;13(suppl 1):i85–i90.
- The Joint Commission. Sentinel event data root: causes by event type (2004–June 2014). Available at: http://www.jointcommission.org/assets/1/18/Root_Causes_by_Event_Type_2004‐2014.pdf. Accessed March 12, 2014.
- , . Complexity science: the challenge of complexity in health care. BMJ. 2001;323(7313):625–628.
- Canadian Institute for Health Information. Case mix. Available at: http://www.cihi.ca/CIHI‐ext‐portal/internet/EN/TabbedContent/standards+and+data+submission/standards/case+mix/cihi010690. Accessed April 12, 2015.
- , , , , , . Outcomes and cost of coronary artery bypass graft surgery in the United States and Canada. Arch Intern Med. 2005;165(13):1506–1513.
- , , , et al. Differences in treatment, outcomes, and quality of life among patients with heart failure in Canada and the United States. JACC Heart Fail. 2013;1(6):523–530.
- , , . Expanding access to cancer screening and clinical follow‐up among the medically underserved. Cancer Pract. 1995;3(1):19–30.
- , , , et al. Clearing clinical barriers: enhancing social support using a patient navigator for asthma care. J Asthma. 2010;47(8):913–919.
- . The role of a patient navigator in fertility preservation. In: Cancer Treatment and Research. Vol 156. Boston, MA: Springer US; 2010:469–470.
- , , , . The care transitions intervention: results of a randomized controlled trial. Arch Intern Med. 2006;166(17):1822–1828.
- , , , et al. A reengineered hospital discharge program to decrease rehospitalization: a randomized trial. Ann Intern Med. 2009;150(3):178–187.
- , , , , , . A patient navigator intervention to reduce hospital readmissions among high‐risk safety‐net patients: a randomized controlled trial. J Gen Intern Med. 2015;30(7):907–915.
- , , . Lack of patient knowledge regarding hospital medications. J Hosp Med. 2010;5(2):83–86.
- , . Patients' understanding of their treatment plans and diagnosis at discharge. Mayo Clin Proc. 2005;80(8):991–994.
- , , , , . Effect of Hospitalist Workload on the Quality and Efficiency of Care. JAMA Intern Med. 2014;174(5):786.
- , , , et al. Unplanned readmissions after hospital discharge among patients identified as being at high risk for readmission using a validated predictive algorithm. Open Med. 2011;5(2):e104–e111.
Inpatient medicine is becoming increasingly complex. A growing number of patients with multiple chronic conditions coupled with mounting care fragmentation leave patients vulnerable to adverse events and readmission to the hospital.[1, 2, 3] Moreover, efforts to minimize hospital length of stay (LOS) have resulted in patients being discharged quicker and sicker than ever before.[4]
A cornerstone of safe and high‐quality healthcare is effective communication.[5] Ineffective communication between and among healthcare providers and patients is a leading cause of medical errors and patient harm. An analysis of sentinel events reported to The Joint Commission revealed that communication failure was the root cause in 59% of these events.[6]
The current climate of increasing healthcare complexity has prompted the need for adaptive innovation.[7] However, there are limited data describing interventions targeting improvements in both communication and transitional care planning. We created a new position, the patient navigator (PN), a dedicated patient‐care facilitator not responsible for clinical care. PNs were integrated into the inpatient multidisciplinary clinical team to facilitate patient and provider navigation through the complexity of a hospital admission by enhancing communication between and among patients and providers. The objective of this study was to determine whether this intervention would reduce hospital LOS and 30‐day unplanned readmissions.
METHODS
Setting
Mount Sinai Hospital is a 446‐bed acute care urban academic health center in Toronto, Ontario, Canada. The general internal medicine service operates as a 90‐bed clinical teaching unit physically distributed over 4 inpatient wards. The service is structurally divided into 4 nongeographically based multidisciplinary care teams (teams A, B, C, and D) comprised of the medical team (attending physician, senior resident physician, 23 junior resident physicians, and 23 medical students), pharmacist, social worker, physiotherapist, occupational therapist, speech and language pathologist, dietician, respiratory therapist, and nursing staff allocated by ward. Each team is on call approximately 1 night in 4 with no night float system. At our institution, attending physicians rotate on a 2‐ or 4‐week schedule, resident physicians rotate on a 1‐ or 2‐month schedule, and medical students rotate on a 2‐month schedule. Preintervention, communication occurred in person and by telephone between members of the medical team. Other members of the multidisciplinary care team communicated with the medical team in person at daily multidisciplinary rounds focused on discharge planning, by pager, or using a Web‐based communication tool.
Intervention
PNs were dedicated patient‐care facilitators not responsible for clinical care. They acted as liaisons between and among providers and patients. Each PN was a fully integrated member of their multidisciplinary care team. With ongoing medical team rotations, the PN was notably the only consistent member on the clinical team. Each patient saw the same PN throughout his or her hospital stay, as both the patient and the PN were team based. The average number of patients for whom each PN was responsible daily was dictated by the patient census for their team. On average, each team had a census between 20 and 30 patients daily. PNs worked during the daytime from Monday to Friday, and did not have any overnight or weekend responsibilities.
A PN's typical day began by reviewing and rounding on overnight admissions as a formal member of the clinical team. This was followed by participating in daily multidisciplinary rounds, then documenting and circulating the resultant action items. Thereafter, they expedited consultations and tests by liaising with departmental staff, and proactively established contact with the patient and their family. They answered simple factual questions related to test scheduling, consultations, diagnosis, medications, and treatments as discussed and outlined by the clinical team, and promptly relayed care questions beyond the scope of their knowledge to the clinical team. They were available to patients, family members, and providers via a dedicated mobile number using phone calls and text messages. If indicated, they assisted in discharge coordination by arranging follow‐up appointments and placing postdischarge phone calls. In addition, they served as primary contact for every patient admitted to their clinical team following discharge to ensure appropriate follow through on discharge plans. There were no set criteria for PNs to disengage from a patient's care. They could always be reached using their dedicated mobile number during business hours, with a voicemail system in place for after‐hours calls.
The role was filled by individuals skilled in communication and/or healthcare, such as registered nurses, a masters degreetrained educator, internationally trained physicians, and professionals from the hospitality and human resources industries. There were no prespecified training or degree requirements. Each PN underwent on‐the‐job training and participated in twice monthly PN meetings for ongoing feedback and education.
Program Implementation
We implemented the PN program on the inpatient general internal medicine service in June 2010 on 2 of 4 multidisciplinary clinical teams. Because a PN became an integrated member of 1 of 4 clinical teams, patient assignment to a PN was determined by the team to which the patient was admitted. On average, each of the 4 teams admitted equally on a daily basis. Initially, there were only sufficient resources to fund 2 PNs. Thus, from June 2010 to May 2011, only teams A and C were assigned PNs. To create fairness between the 4 teams, these 2 PNs moved to teams B and D from June 2011 to November 2011, and then back to teams A and C from December 2011 to April 2012. Following this initial pilot period, the program was allocated further resources, and so expanded to all 4 teams in May 2012. PN salaries were the only program costs. These costs were funded by matching donations from physicians within the Mount Sinai Hospital Department of Medicine and donations to the hospital from community members directed to support the implementation and evaluation of novel care delivery systems.
Study Design
We evaluated the PN program using a retrospective cohort study that included all general medical admissions between July 2010 and March 2014 matched by case mix group, age category, and resource intensity weight (a relative value measuring total patient resource use compared with average typical acute inpatients).[8]
Our primary outcomes were LOS and 30‐day readmission rate. These outcomes were stratified by exposure status to a PN. There were no exclusion criteria for the LOS analysis. Patients who died, were transferred to or from an acute care facility, or signed out against medical advice were excluded from the 30‐day readmission analysis. A secondary analysis restricted the timeframe from July 2010 to April 2011, when only 2 of 4 teams were exposed to PNs.
Average LOS has been observed to be higher in Canadian hospitals as compared to their US counterparts across different admission diagnoses, such as coronary artery bypass graft surgery and heart failure.[9, 10] We hypothesize that these differences are party due to systems‐level differences, including posthospital care. Specifically, the Canadian system does not utilize posthospital acute care, such as skilled nursing facilities, which may in part account for these differences. To help contextualize our data, we standardized LOS using an LOS index called the LOS/expected LOS (ELOS) ratio. It takes the LOS and divides it by the ELOS, a validated estimate of the expected LOS for a given patient generated using a national administrative database for acute hospital care in Canada that takes into account case mix group, age, comorbidity level, and intervention factors.[8]
Additionally, We performed an interrupted time‐series analysis, whereby a log‐linear model was fit on LOS and adjusted for weekly and monthly trends, age category, resource intensity weight, major clinical category (a surrogate for case mix group), admission location, and discharge location. The cohort was divided into 3 groups: before program implementation (July 2009June 2010), after program implementation with PN (July 2010March 2014), and after program implementation without PN (July 2010March 2014).
This study was approved by the research ethics board at Mount Sinai Hospital. No patient consent was deemed necessary. Data were obtained from institutional databases monitored by the hospital's performance measurement office.
Statistical Analysis
In Tables 1, 2, mean values were compared using a 2‐tailed t test, and the relationship between categorical groups was determined using a 2 test. For the interrupted time‐series analysis, 2‐tailed t tests were used to test null hypotheses of no association between the parameter value and the outcome, and 2 tests were used to test for the equivalence of 2 given parameters. P0.05 indicated statistical significance for all comparisons and analyses. All data were analyzed using Stata version 13 (StataCorp, College Station, TX) or R 3.0.2 (R Foundation for Statistical Computing, Vienna, Austria).
| With PN, n = 5,628 | Without PN, n = 2,213 | |
|---|---|---|
| ||
| Age, y, mean (SD)* | 69 (20) | 68 (20) |
| Female sex, n (%) | 3,018 (53.6) | 1,196 (54.0) |
| Most responsible diagnosis, n (%) | ||
| Pneumonia | 374 (6.6) | 135 (6.1) |
| Chronic obstructive pulmonary disease | 271 (4.8) | 88 (4.0) |
| Congestive heart failure | 217 (3.9) | 87 (3.9) |
| Admission location, n (%) | ||
| Home | 4,665 (82.9) | 1,943 (87.8) |
| Long‐term care* | 524 (9.3) | 158 (7.1) |
| Other* | 439 (7.8) | 112 (5.1) |
| Discharge location, n (%) | ||
| Home | 3,824 (67.9) | 1,578 (71.3) |
| Long‐term care | 779 (13.8) | 267 (12.1) |
| Other | 1,025 (18.3) | 368 (16.6) |
RESULTS
Our matched cohort included 7841 admissions (6141 patients), with 5628 admissions (4592 patients) exposed and 2213 admissions (1920 patients) not exposed to PNs. The discrepancy between the total number of patients and the sum of exposed and nonexposed patients is resultant from patients admitted more than once over the study period, as patients admitted to at least 1 team staffed with a PN and another team not staffed with a PN over the study period were counted in both groups. The 2 groups were similar with respect to several characteristics (Table 1). However, the 2 groups were significantly different for age (P = 0.046) and admissions from long‐term care (P < 0.01) and other facilities (P < 0.01).
Admissions with PNs were 1.3 days (21%) shorter than admission without PNs (6.2 vs 7.5 days, P < 0.001). Moreover, admissions with PNs had a smaller mean LOS/ELOS ratio compared to admissions without PNs (0.93 vs 1.05, P < 0.001). The restricted analysis found a 1.2‐day (18%) lower LOS (6.4 vs 7.6 days, P < 0.05) and a smaller mean LOS/ELOS ratio (0.91 vs 1.06, P < 0.001). Thirty‐day readmission rate was not different between the 2 groups (13.1 vs 13.8%, P = 0.48) or in the restricted analysis (12.0 vs 13.5%, P = 0.40) (Table 2).
| With PN | Without PN | P Value | |
|---|---|---|---|
| |||
| July 2010‐March 2014 | |||
| LOS, d (95% confidence interval) [n] | 6.2 (6.06.4) [5,628] | 7.5 (7.17.9) [2,213] | <0.001 |
| LOS/ELOS ratio (95% confidence interval) [n] | 0.93 (0.910.95) [5,628] | 1.05 (1.001.09) [2,213] | <0.001 |
| 30‐day readmission rate, % [n] | 13.1 [5,055] | 13.8 [2,012] | 0.48 |
| July 2010 to April 2011 | |||
| LOS, d (95% confidence interval) [n] | 6.4 (5.87.0) [713] | 7.6 (6.88.3) [753) | <0.05 |
| LOS/ELOS ratio (95% confidence interval) [n] | 0.91 (0.850.96) [713] | 1.06 (1.001.11) [753] | <0.001 |
| 30‐day readmission rate, % [n] | 12.0 [627] | 13.5 [681] | 0.40 |
In the interrupted time‐series analysis, prior to the implementation of the PN program, there was a positive relationship between LOS and time. After the implementation of the program, this relationship became inverse, meaning the curve plotting LOS against time had a negative slope. Furthermore, there was a statistically significant drop in LOS at the time of program implementation (P < 0.05). However, there was no difference in slope between the groups with and without PN after program implementation.
DISCUSSION
We describe an innovative inpatient intervention featuring an integrated patient‐care facilitator not responsible for clinical care charged with enhancing communication between and among patients and providers. Data from the almost 4‐year period demonstrated that implementation was associated with a 21% reduction in hospital LOS, with no difference in 30‐day readmission rates.
The patient navigator was first conceptualized in 1990 to help African American women in Harlem with breast cancer negotiate the complex world of oncology.[11] It was later implemented by the National Cancer Institute as an outpatient intervention spanning the continuum of cancer care. This concept has since expanded to other domains of complex single disease outpatient care, including asthma and fertility.[12, 13] To our knowledge, there has been limited evidence in the literature describing implementation of such programs in the inpatient general medical setting.
This study contributes to the growing literature on interventions targeting improvements in transitional care, such as transition coaches and discharge advocates.[14, 15] Balaban et al. recently described a PN intervention in the safety‐net population.[16] A common theme to these interventions was the prioritization of safe care transitions. However, this goal was achieved using related, yet different approaches: transition coaches focused on encouraging the patient and caregiver to assert a more active role,[14] discharge advocates focused on providing a comprehensive discharge plan for patients,[15] PNs from Balaban's study focused on coaching and assistance in navigating patients through the transition from hospital to home, and our study's PNs focused on enhancing communication between and among patients and providers. Additionally, unlike transition coaches and discharge advocates, who were nurses by training, and PNs from Balaban's study, who were community health workers, our PNs did not have any prespecified training or degree requirements.
Patients are at risk of being inadequately informed about important issues related to their care, such as hospital medications, diagnoses, and treatment plans during their hospital stay.[17, 18] Furthermore, we know that ineffective communication is a common cause of poor patient outcomes in hospital‐based care.[6] This phenomenon can be amplified from external pressures to maximize productivity. For example, Elliott and colleagues found that increasing hospitalist workload is associated with higher hospital LOS and cost.[19] PNs may offload care demands by enhancing communication for providers and patients.
Our study has several strengths. By matching admissions by case mix group, age category, and resource intensity weight, we aimed to reduce potential bias contributed by these covariates. Moreover, a staged rollout of the intervention, whereby over a 10‐month period, 2 of the multidisciplinary care teams were assigned PNs, while the remaining 2 were not, enabled contemporaneous comparison. Our study had few exclusion criteria, thus making it potentially generalizable to other inpatient general medicine settings of a similar nature. The relative simplicity of this intervention makes it amenable to scalability. Of note, the intervention has been deemed to show great promise at our institution, and has currently expanded to the cardiology, gastroenterology, and surgical oncology units.
Our study's limitations include a single‐center design. Moreover, although we demonstrate similarity in the majority of measurable covariates between the groups, we cannot exclude the existence of unmeasured confounders. Of the covariates that were found to be different between the groups, we suspect the difference in admissions from long‐term care and other facilities did not largely influence our study's main findings. Furthermore, though age was found to be statistically different between the groups, we postulate that the 1‐year difference between the groups is not particularly relevant clinically. Additionally, 30‐day readmission rates were only captured for our institution. However, the vast majority of readmissions in our region are to the index facility, and are unlikely to differ between the 2 groups.[20]
There may have been secular trends at play. In the interrupted time‐series analysis, there was a statistically significant drop in LOS at the time of program implementation. There was however, no difference in slope between the groups with and without PNs after program implementation. There are some plausible explanations for this lack of difference in slope. The study may not have been powered to detect such a difference, as this analysis was not prespecified. Furthermore, there may have been a spillover effect of the program, such that PNs may have improved efficiency for the teams to which they were assigned, thereby improving the efficiency of the other members of the multidisciplinary team, many of whom cared for patients assigned and not assigned a PN. Additionally, we measured the LOS in a preintervention control group between July 2009 and June 2010 using the same inclusion criteria as the matched cohort. It was found to be 8.5 days, which suggests a secular trend toward improvement in LOS over time at our institution. We are, however, reassured that our restricted analysis enabling contemporaneous comparison between patients exposed and not exposed to PNs was still found to be significant.
The implementation of this intervention could have implications for policymakers‐at‐large. Establishment of criteria for qualifications and a clear educational curriculum to train future PNs is needed, especially in the context of ongoing program expansion. These initiatives are currently underway at our institution. Furthermore, evaluation of the program's operating cost and calculation of its return on investment should include balanced metrics incorporating patient‐, provider‐, organizational‐, and system‐level measures. The current cost to the hospital per PN is approximately $73,800 CAD ($58,700 USD), which covers 1 PN's annual salary and benefits. Thus, the implementation of 4 PNs for each of the 4 multidisciplinary teams costs the hospital approximately $295,000 CAD ($234,700 USD) per year. Although the details of our preliminary calculations are outside the scope of this report, it suggests that the savings incurred from shorter LOS outweigh program costs.
We found that implementation of this innovative inpatient intervention targeting improvements in communication was associated with a reduction in LOS without an increase in 30‐day readmission. Our experience shows promise and may inform others considering similar interventions. Patient and provider experience and generalizability should be evaluated in future work.
Acknowledgements
The authors thank Dr. Allan Detsky and David Wells for their review of the manuscript. They are also grateful to Chin‐Chin Chua, Ningmei Wang, and Joann Bon in the Office of Quality and Performance Measurement for their help with data collection, and John Matelski for his help with data analysis.
Disclosure: This program was funded by matched donations from physicians in the Mount Sinai Hospital Department of Medicine and donations to Mount Sinai Hospital from community members directed to support the implementation and evaluation of novel care delivery systems. The authors report no conflicts of interest. Preliminary abstracts of this study were presented in the online forum, Leading Health Care Innovation, November 12, 2013 (
- , , , et al. Multiple chronic conditions: prevalence, health consequences, and implications for quality, care management, and costs. J Gen Intern Med. 2007;22(S3):391–395.
- , , , , . The incidence and severity of adverse events affecting patients after discharge from the hospital. Ann Intern Med. 2003;138(3):161–167.
- , , . Rehospitalizations among patients in the Medicare fee‐for‐service program. N Engl J Med. 2009;360(14):1418–1428.
- , , , et al. Prospective payment system and impairment at discharge. The “quicker‐and‐sicker” story revisited. JAMA. 1990;264(15):1980–1983.
- . The human factor: the critical importance of effective teamwork and communication in providing safe care. Qual Saf Health Care. 2004;13(suppl 1):i85–i90.
- The Joint Commission. Sentinel event data root: causes by event type (2004–June 2014). Available at: http://www.jointcommission.org/assets/1/18/Root_Causes_by_Event_Type_2004‐2014.pdf. Accessed March 12, 2014.
- , . Complexity science: the challenge of complexity in health care. BMJ. 2001;323(7313):625–628.
- Canadian Institute for Health Information. Case mix. Available at: http://www.cihi.ca/CIHI‐ext‐portal/internet/EN/TabbedContent/standards+and+data+submission/standards/case+mix/cihi010690. Accessed April 12, 2015.
- , , , , , . Outcomes and cost of coronary artery bypass graft surgery in the United States and Canada. Arch Intern Med. 2005;165(13):1506–1513.
- , , , et al. Differences in treatment, outcomes, and quality of life among patients with heart failure in Canada and the United States. JACC Heart Fail. 2013;1(6):523–530.
- , , . Expanding access to cancer screening and clinical follow‐up among the medically underserved. Cancer Pract. 1995;3(1):19–30.
- , , , et al. Clearing clinical barriers: enhancing social support using a patient navigator for asthma care. J Asthma. 2010;47(8):913–919.
- . The role of a patient navigator in fertility preservation. In: Cancer Treatment and Research. Vol 156. Boston, MA: Springer US; 2010:469–470.
- , , , . The care transitions intervention: results of a randomized controlled trial. Arch Intern Med. 2006;166(17):1822–1828.
- , , , et al. A reengineered hospital discharge program to decrease rehospitalization: a randomized trial. Ann Intern Med. 2009;150(3):178–187.
- , , , , , . A patient navigator intervention to reduce hospital readmissions among high‐risk safety‐net patients: a randomized controlled trial. J Gen Intern Med. 2015;30(7):907–915.
- , , . Lack of patient knowledge regarding hospital medications. J Hosp Med. 2010;5(2):83–86.
- , . Patients' understanding of their treatment plans and diagnosis at discharge. Mayo Clin Proc. 2005;80(8):991–994.
- , , , , . Effect of Hospitalist Workload on the Quality and Efficiency of Care. JAMA Intern Med. 2014;174(5):786.
- , , , et al. Unplanned readmissions after hospital discharge among patients identified as being at high risk for readmission using a validated predictive algorithm. Open Med. 2011;5(2):e104–e111.
© 2015 Society of Hospital Medicine
Febrile Infant Diagnosis Code Accuracy
Fever is one of the most common reasons for emergency department (ED) evaluation of infants under 90 days of age.[1] Up to 10% to 20% of febrile young infants will have a serious bacterial infection (SBI),[2, 3, 4] but infants with SBI are difficult to distinguish from those without SBI based upon symptoms and physical examination findings alone.[5] Previously developed clinical prediction algorithms can help to identify febrile infants at low risk for SBI, but differ in age range as well as recommendations for testing and empiric treatment.[6, 7, 8] Consequently, there is widespread variation in management of febrile young infants at US children's hospitals,[9, 10, 11] and defining optimal management strategies remains an important issue in pediatric healthcare.[12] Administrative datasets are convenient and inexpensive, and can be used to evaluate practice variation, trends, and outcomes of a large, diverse group of patients within and across institutions.[9, 10] Accurately identifying febrile infants evaluated for suspected SBI in administrative databases would facilitate comparative effectiveness research, quality improvement initiatives, and institutional benchmarking.
Prior studies have validated the accuracy of administrative billing codes for identification of other common childhood illnesses, including urinary tract infection (UTI)[13] and pneumonia.[14] The accuracy of International Classification of Diseases, Ninth Revision (ICD‐9) diagnosis codes in identifying febrile young infants evaluated for SBI is not known. Reliance on administrative ICD‐9 diagnosis codes for patient identification can lead to misclassification of patients due to variable database quality, the validity of the diagnosis codes being utilized, and hospital coding practices.[15] Additionally, fever is a symptom and not a specific diagnosis. If a particular bacterial or viral diagnosis is established (eg, enterovirus meningitis), a discharge diagnosis of fever may not be attributed to the patient encounter. Thus, evaluating the performance characteristics and capture of clinical outcomes of different combinations of ICD‐9 diagnosis codes for identifying febrile infants is necessary for both the conduct and interpretation of studies that utilize administrative databases. The primary objective of this investigation was to identify the most accurate ICD‐9 coding strategies for the identification of febrile infants aged <90 days using administrative data. We also sought to evaluate capture of clinically important outcomes across identification strategies.
METHODS
Study Design and Setting
For this multicenter retrospective study, we used the Pediatric Health Information System (PHIS) database to identify infants <90 days of age[16] who presented between July 1, 2012 and June 30, 2013 to 1 of 8 EDs. We assessed performance characteristics of ICD‐9 diagnosis code case‐identification algorithms by comparing ICD‐9 code combinations to a fever reference standard determined by medical record review. The institutional review board at each participating site approved the study protocol.
Data Source
Data were obtained from 2 sources: the PHIS database and medical record review. We used the PHIS database to identify eligible patients by ICD‐9 diagnosis codes; patient encounters were randomly selected using a random number generator. The PHIS database contains demographic, diagnosis, and billing data from 44 hospitals affiliated with the Children's Hospital Association (Overland Park, Kansas) and represents 85% of freestanding children's hospitals in the United States.[17] Data are deidentified; encrypted unique patient identifiers permit tracking of patients across visits within a site.[18] The Children's Hospital Association and participating hospitals jointly assure the quality and integrity of the data.[19]
For each patient encounter identified in the PHIS database, detailed medical record review was performed by trained investigators at each of the 8 study sites (see Supporting Information, Appendix, in the online version of this article). A standardized data collection instrument was pilot tested by all investigators prior to use. Data were collected and managed using the Research Electronic Data Capture (REDCap) tool hosted at Boston Children's Hospital.[20]
Exclusions
Using PHIS data, prior to medical record review we excluded infants with a complex chronic condition as defined previously[21] and those transferred from another institution, as these infants may warrant a nonstandard evaluation and/or may have incomplete data.
ICD‐9 Diagnosis Code Groups
In the PHIS database, all patients discharged from the hospital (including hospitalized patients as well as patients discharged from the ED) receive 1 or more ICD‐9 discharge diagnosis codes. These diagnosis codes are ascribed after discharge from the hospital, or for ED patients, after ED discharge. Additionally, patients may receive an admission diagnosis, which reflects the diagnosis ascribed at the time of ED discharge or transfer to the inpatient unit.
We reviewed medical records of infants selected from the following ICD‐9 diagnosis code groups (Figure 1): (1) discharge diagnosis code of fever (780.6 [fever and other physiologic disturbances of temperature regulation], 778.4 [other disturbances of temperature regulation of newborn], 780.60 [fever, unspecified], or 780.61 [fever presenting with conditions classified elsewhere])[9, 10] regardless of the presence of admission diagnosis of fever or diagnosis of serious infection, (2) admission diagnosis code of fever without associated discharge diagnosis code of fever,[10] (3) discharge diagnosis code of serious infection determined a priori (see Supporting Information, Appendix, in the online version of this article) without discharge or admission diagnosis code of fever, and (4) infants without any diagnosis code of fever or serious infection.

Medical records reviewed in each of the 4 ICD‐9 diagnosis code groups were randomly selected from the overall set of ED encounters in the population of infants <90 days of age evaluated during the study period. Twenty‐five percent population sampling was used for 3 of the ICD‐9 diagnosis code groups, whereas 5% sampling was used for the no fever/no serious infection code group. The number of medical records reviewed in each ICD‐9 diagnosis code group was proportional to the distribution of ICD‐9 codes across the entire population of infants <90 days of age. These records were distributed equally across sites (228 records per site), except for 1 site that does not assign admission diagnoses (201 records).
Investigators were blinded to ICD‐9 diagnosis code groups during medical record review. Infants with multiple visits during the study period were eligible to be included more than once if the visits occurred more than 3 days apart. For infants with more than 1 ED visit on a particular calendar day, investigators were instructed to review the initial visit.
For each encounter, we also abstracted demographic characteristics (gender, race/ethnicity), insurance status, hospital region (using US Census categories[22]), and season from the PHIS database.
Reference Standard
The presence of fever was determined by medical record review. We defined fever as any documented temperature 100.4F (38.0C) at home or in the ED.[16]
ICD‐9 Code Case‐Identification Algorithms
Using the aforementioned ICD‐9 diagnosis code groups individually and in combination, the following 4 case‐identification algorithms, determined from prior study or group consensus, were compared to the reference standard: (1) ICD‐9 discharge diagnosis code of fever,[9] (2) ICD‐9 admission or discharge diagnosis code of fever,[10, 11] (3) ICD‐9 discharge diagnosis code of fever or serious infection, and (4) ICD‐9 discharge or admission diagnosis code of fever or serious infection. Algorithms were compared overall, separately for discharged and hospitalized infants, and across 3 distinct age groups (28 days, 2956 days, and 5789 days).
Patient‐Level Outcomes
To compare differences in outcomes by case‐identification algorithm, from the PHIS database we abstracted hospitalization rates, rates of UTI/pyelonephritis,[13] bacteremia/sepsis, and bacterial meningitis.[19] Severe outcomes were defined as intensive care unit admission, mechanical ventilation, central line placement, receipt of extracorporeal membrane oxygenation, or death. We assessed hospital length of stay for admitted infants and 3‐day revisits,[23, 24] and revisits resulting in hospitalization for infants discharged from the ED at the index visit. Patients billed for observation care were classified as being hospitalized.[25, 26]
Data Analysis
Accuracy of the 4 case‐identification algorithms (compared with the reference standard) was calculated using sensitivity, specificity, negative predictive value (NPV), and positive predictive value (PPV), along with 95% confidence interval (CI). Prior to analysis, a 5‐fold weighting factor was applied to the no fever/no serious infection group to account for the differential sampling used for this group (5% vs 25% for the other 3 ICD‐9 diagnosis code groups). This weighting was done to approximate the true prevalence of each ICD‐9 code group within the larger population, so that an accurate rate of false negatives (infants with fever who had neither a diagnosis of fever nor serious infection) could be calculated.
We described continuous variables using median and interquartile range or range values and categorical variables using frequencies with 95% CIs. We compared categorical variables using a 2 test. We determined statistical significance as a 2‐tailed P value <0.05. Statistical analyses were performed using SAS version 9.3 (SAS Institute, Cary, NC).
RESULTS
Study Patients
During the 1‐year study period, 23,753 ED encounters for infants <90 days of age were identified in the PHIS database at the 8 participating sites. Of these infant encounters, 2166 (9.2%) were excluded (1658 infants who had a complex chronic condition and 508 transferred into the ED), leaving 21,587 infants available for selection. After applying our sampling strategy, we identified 1797 encounters for medical record review. Seven encounters from 3 hospitals with missing medical records were excluded, resulting in a final cohort of 1790 encounters (Figure 1). Among included infants, 552 (30.8%) were 28 days, 743 (41.5%) were 29 to 56 days, and 495 (27.8%) were 57 to 89 days of age; 737 (41.2%) infants were hospitalized. Patients differed in age, race, payer, and season across ICD‐9 diagnosis code groups (see Supporting Information, Table 1, in the online version of this article).
| ICD‐9 Diagnosis Code Algorithm | Overall | |||
|---|---|---|---|---|
| Sensitivity, % (95% CI) | Specificity, % (95% CI) | Negative Predictive Value, % (95% CI) | Positive Predictive Value, % (95% CI) | |
| ||||
| Discharge diagnosis of fever | 53.2 (50.056.4) | 98.2 (97.898.6) | 90.8 (90.091.6) | 86.1 (83.388.9) |
| Hospitalized | 47.3 (43.151.5) | 97.7 (96.998.5) | 80.6 (78.682.6) | 90.2 (86.893.6) |
| Discharged from ED | 61.4 (56.666.2) | 98.4 (98.098.8) | 95.4 (94.796.1) | 82.1 (77.786.5) |
| Discharge or admission diagnosis of Fever | 71.1 (68.274.0) | 97.7 (97.398.1) | 94.1 (93.494.8) | 86.9 (84.589.3) |
| Hospitalized | 72.5 (68.876.2) | 97.1 (96.298.0) | 88.8 (87.190.5) | 91.7 (89.194.3) |
| Discharged from ED | 69.2 (64.773.7) | 98.0 (97.598.5) | 96.3 (95.796.9) | 80.8 (76.685.0) |
| Discharge diagnosis of fever or serious infection | 63.7 (60.666.8) | 96.5 (96.097.0) | 92.6 (91.893.4) | 79.6 (76.782.5) |
| Hospitalized | 63.9 (59.967.9) | 92.5 (91.094.0) | 85.1 (83.287.0) | 79.1 (75.382.9) |
| Discharged from ED | 63.4 (58.768.1) | 98.1 (97.698.6) | 95.6 (94.996.3) | 80.2 (75.884.6) |
| Discharge or admission diagnosis of fever or serious infection | 76.6 (73.979.3) | 96.2 (95.696.8) | 95.1 (94.595.7) | 81.0 (78.483.6) |
| Hospitalized | 80.8 (77.584.1) | 92.1 (90.693.6) | 91.5 (89.993.1) | 82.1 (78.985.3) |
| Discharged from ED | 71.0 (66.575.5) | 97.7 (97.298.2) | 96.5 (95.997.1) | 79.4 (75.283.6) |
Among the 1790 patient encounters reviewed, a total of 766 infants (42.8%) met the reference standard definition for fever in the cohort. An additional 47 infants had abnormal temperature reported (documentation of tactile fever, history of fever without a specific temperature described, or hypothermia) but were classified as having no fever by the reference standard.
ICD‐9 Code Case‐Identification Algorithm Performance
Compared with the reference standard, the 4 case‐identification algorithms demonstrated specificity of 96.2% to 98.2% but lower sensitivity overall (Figure 2). Discharge diagnosis of fever alone demonstrated the lowest sensitivity. The algorithm of discharge or admission diagnosis of fever resulted in increased sensitivity and the highest PPV of all 4 algorithms (86.9%, 95% CI: 84.5‐89.3). Addition of serious infection codes to this algorithm resulted in a marginal increase in sensitivity and a similar decrease in PPV (Table 1). When limited to hospitalized infants, specificity was highest for the case‐identification algorithm of discharge diagnosis of fever and similarly high for discharge or admission diagnosis of fever; sensitivity was highest for the algorithm of discharge or admission diagnosis of fever or diagnosis of serious infection. For infants discharged from the ED, algorithm specificity was 97.7% to 98.4%, with lower sensitivity for all 4 algorithms (Table 1). Inclusion of the 47 infants with abnormal temperature as fever did not materially change algorithm performance (data not shown).
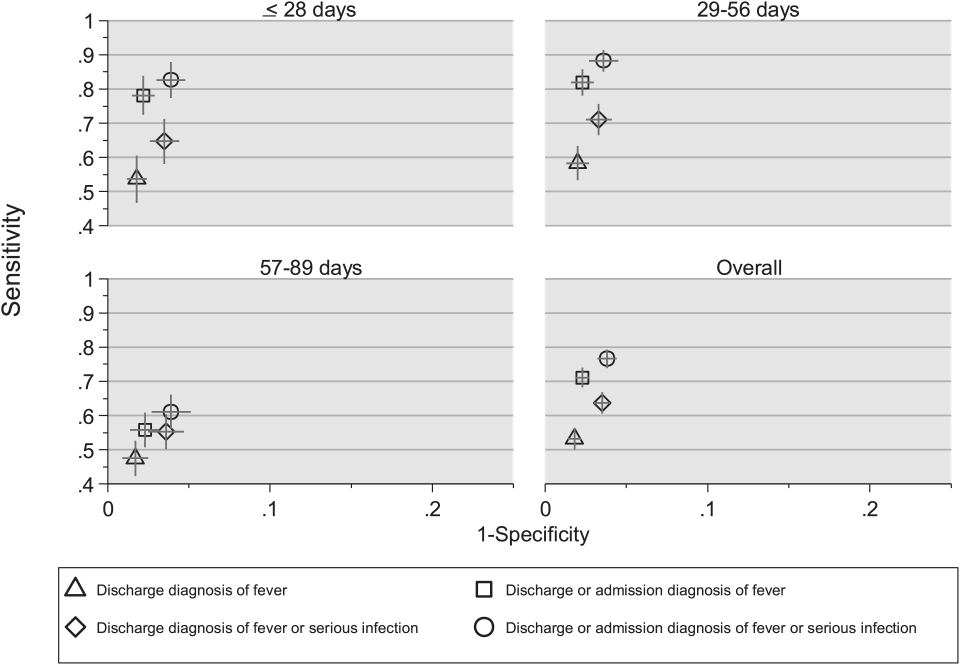
Across all 3 age groups (28 days, 2956 days, and 5789 days), the 4 case‐identification algorithms demonstrated specificity >96%, whereas algorithm sensitivity was highest in the 29‐ to 56‐days‐old age group and lowest among infants 57 to 89 days old across all 4 algorithms (Figure 2). Similar to the overall cohort, an algorithm of discharge or admission diagnosis of fever demonstrated specificity of nearly 98% in all age groups; addition of serious infection codes to this algorithm increased sensitivity, highest in the 29‐ to 56‐days‐old age group (Figure 2; see also Supporting Information, Table 2, in the online version of this article).
| ICD‐9 Diagnosis Code Algorithm | Sensitivity, Median % (Range) | Specificity, Median % (Range) | Negative Predictive Value, Median % (Range) | Positive Predictive Value, Median % (Range) |
|---|---|---|---|---|
| ||||
| Discharge diagnosis of fever | 56.2 (34.681.0) | 98.3 (96.499.1) | 92.1 (83.297.4) | 87.7 (74.093.2) |
| Discharge or Admission diagnosis of Fever | 76.7 (51.385.0) | 97.8 (96.298.7) | 95.6 (86.997.4) | 87.4 (80.092.9) |
| Discharge diagnosis of fever or serious infection | 68.3 (44.287.3) | 96.5 (95.498.0) | 93.6 (85.298.2) | 78.3 (74.289.0) |
| Discharge or admission diagnosis of fever or serious infection | 83.1 (58.390.7) | 95.8 (95.498.0) | 96.5 (88.598.2) | 79.1 (77.490.4) |
Across the 8 study sites, median specificity was 95.8% to 98.3% for the 4 algorithms, with little interhospital variability; however, algorithm sensitivity varied widely by site. Median PPV was highest for discharge diagnosis of fever alone at 87.7% but ranged from 74.0% to 93.2% across sites. Median PPV for an algorithm of discharge or admission diagnosis of fever was similar (87.4%) but with less variation by site (range 80.0%92.9%) (Table 2).
Outcomes by ICD‐9 Diagnosis Code Group and Case‐Identification Algorithm
When compared with discharge diagnosis of fever, adding admission diagnosis of fever captured a higher proportion of hospitalized infants with SBIs (UTI/pyelonephritis, bacteremia/sepsis, or bacterial meningitis). However, median hospital length of stay, severe outcomes, and 3‐day revisits and revisits with hospitalization did not materially differ when including infants with admission diagnosis of fever in addition to discharge diagnosis of fever. Addition of infants with a diagnosis code for serious infection substantially increased the number of infants with SBIs and severe outcomes but did not capture additional 3‐day revisits (Table 3). There were no additional cases of SBI in the no fever/no serious illness diagnosis code group.
| ICD‐9 Diagnosis Code Algorithm | Outcome | 3‐Day Revisit, % (95% CI) | 3‐Day Revisit With Hospitalization, % (95% CI) | |||
|---|---|---|---|---|---|---|
| Hospitalized, % (95% CI) | UTI/Pyelonephritis, Bacteremia/Sepsis, or Bacterial Meningitis, % (95% CI) | Severe Outcome, % (95% CI)* | Length of Stay in Days, Median (IQR) | |||
| ||||||
| Discharge diagnosis of fever | 44.3 (40.348.4) | 3.3 (1.84.7) | 1.4 (0.42.3) | 3 (23) | 11.7 (8.215.2) | 5.9 (3.38.4) |
| Discharge or admission diagnosis of fever | 52.4 (48.955.9) | 6.1 (4.47.8) | 1.9 (1.02.9) | 3 (23) | 10.9 (7.714.1) | 5.4 (3.17.8) |
| Discharge diagnosis of fever or serious infection | 54.0 (50.457.5) | 15.3 (12.717.8) | 3.8 (2.55.2) | 3 (24) | 11.0 (7.714.2) | 5.5 (3.17.9) |
| Discharge or admission diagnosis of fever or serious infection | 56.5 (53.259.7) | 12.9 (10.715.1) | 3.6 (2.44.8) | 3 (24) | 10.3 (7.313.3) | 5.2 (3.07.4) |
Among infants who met the reference standard for fever but did not have a discharge or admission diagnosis of fever (false negatives), 11.8% had a diagnosis of SBI. Overall, 43.2% of febrile infants (and 84.4% of hospitalized infants) with SBI did not have an ICD‐9 discharge or admission diagnosis of fever. Addition of ICD‐9 diagnosis codes of serious infection to the algorithm of discharge or admission diagnosis of fever captured all additional SBIs, and no false negativeinfants missed with this algorithm had an SBI.
DISCUSSION
We described the performance of 4 ICD‐9 diagnosis code case‐identification algorithms for the identification of febrile young infants <90 days of age at US children's hospitals. Although the specificity was high across algorithms and institutions, the sensitivity was relatively low, particularly for discharge diagnosis of fever, and varied by institution. Given the high specificity, ICD‐9 diagnosis code case‐identification algorithms for fever reliably identify febrile infants using administrative data with low rates of inclusion of infants without fever. However, underidentification of patients, particularly those more prone to SBIs and severe outcomes depending on the algorithm utilized, can impact interpretation of comparative effectiveness studies or the quality of care delivered by an institution.
ICD‐9 discharge diagnosis codes are frequently used to identify pediatric patients across a variety of administrative databases, diseases, and symptoms.[19, 27, 28, 29, 30, 31] Although discharge diagnosis of fever is highly specific, sensitivity is substantially lower than other case‐identification algorithms we studied, particularly for hospitalized infants. This may be due to a fever code sometimes being omitted in favor of a more specific diagnosis (eg, bacteremia) prior to hospital discharge. Therefore, case identification relying only on ICD‐9 discharge diagnosis codes for fever may under‐report clinically important SBI or severe outcomes as demonstrated in our study. This is in contrast to ICD‐9 diagnosis code identification strategies for childhood UTI and pneumonia, which largely have higher sensitivity but lower specificity than fever codes.[13, 14]
Admission diagnosis of fever is important for febrile infants as they may not have an explicit diagnosis at the time of disposition from the ED. Addition of admission diagnosis of fever to an algorithm relying on discharge diagnosis code alone increased sensitivity without a demonstrable reduction in specificity and PPV, likely due to capture of infants with a fever diagnosis at presentation before a specific infection was identified. Although using an algorithm of discharge or admission diagnosis of fever captured a higher percentage of hospitalized febrile infants with SBIs, sensitivity was only 71% overall with this algorithm, and 43% of febrile infants with SBI would still have been missed. Importantly, though, addition of various ICD‐9 codes for serious infection to this algorithm resulted in capture of all febrile infants with SBI and should be used as a sensitivity analysis.
The test characteristics of diagnosis codes were highest in the 29‐ to 56‐days‐old age group. Given the differing low‐risk criteria[6, 7, 8] and lack of best practice guidelines[16] in this age group, the use of administrative data may allow for the comparison of testing and treatment strategies across a large cohort of febrile infants aged 29 to 56 days. However, individual hospital coding practices may affect algorithm performance, in particular sensitivity, which varied substantially by hospital. This variation in algorithm sensitivity may impact comparisons of outcomes across institutions. Therefore, when conducting studies of febrile infants using administrative data, sensitivity analyses or use of chart review should be considered to augment the use of ICD‐9 code‐based identification strategies, particularly for comparative benchmarking and outcomes studies. These additional analyses are particularly important for studies of febrile infants >56 days of age, in whom the sensitivity of diagnosis codes is particularly low. We speculate that the lower sensitivity in older febrile infants may relate to a lack of consensus on the clinical significance of fever in this age group and the varying management strategies employed.[10]
Strengths of this study include the assessment of ICD‐9 code algorithms across multiple institutions for identification of fever in young infants, and the patterns of our findings remained robust when comparing median performance characteristics of the algorithms across hospitals to our overall findings. We were also able to accurately estimate PPV and NPV using a case‐identification strategy weighted to the actual population sizes. Although sensitivity and specificity are the primary measures of test performance, predictive values are highly informative for investigators using administrative data. Additionally, our findings may inform public health efforts including disease surveillance, assessment of seasonal variation, and identification and monitoring of healthcare‐associated infections among febrile infants.
Our study has limitations. We did not review all identified records, which raises the possibility that our evaluated cohort may not be representative of the entire febrile infant population. We attempted to mitigate this possibility by using a random sampling strategy for our population selection that was weighted to the actual population sizes. Second, we identified serious infections using ICD‐9 diagnosis codes determined by group consensus, which may not capture all serious infection codes that identify febrile infants whose fever code was omitted. Third, 47 infants had abnormal temperature that did not meet our reference standard criteria for fever and were included in the no fever group. Although there may be disagreement regarding what constitutes a fever, we used a widely accepted reference standard to define fever.[16] Further, inclusion of these 47 infants as fever did not materially change algorithm performance. Last, our study was conducted at 8 large tertiary‐care children's hospitals, and our results may not be generalizable to other children's hospitals and community‐based hospitals.
CONCLUSIONS
Studies of febrile young infants that rely on ICD‐9 discharge diagnosis code of fever for case ascertainment have high specificity but low sensitivity for the identification of febrile infants, particularly among hospitalized patients. A case‐identification strategy that includes discharge or admission diagnosis of fever demonstrated higher sensitivity, and should be considered for studies of febrile infants using administrative data. However, additional strategies such as incorporation of ICD‐9 codes for serious infection should be used when comparing outcomes across institutions.
Acknowledgements
The Febrile Young Infant Research Collaborative includes the following additional collaborators who are acknowledged for their work on this study: Erica DiLeo, MA, Department of Medical Education and Research, Danbury Hospital, Danbury, Connecticut; Janet Flores, BS, Division of Emergency Medicine, Ann and Robert H. Lurie Children's Hospital of Chicago, Chicago, Illinois.
Disclosures: This project funded in part by The Gerber Foundation Novice Researcher Award, (Ref No. 1827‐3835). Dr. Fran Balamuth received career development support from the National Institutes of Health (NHLBI K12‐HL109009). Funders were not involved in the design or conduct of the study; collection, management, analysis, or interpretation of the data; or preparation, review, or approval of the manuscript. The authors have no conflicts of interest relevant to this article to disclose.
- . The prevalence of serious bacterial infections by age in febrile infants during the first 3 months of life. Pediatr Ann. 1993;22:462–466.
- , , . Performance of low‐risk criteria in the evaluation of young infants with fever: review of the literature. Pediatrics. 2010;125:228–233.
- , , , , , . A week‐by‐week analysis of the low‐risk criteria for serious bacterial infection in febrile neonates. Arch Dis Child. 2009;94:287–292.
- , , , et al. Is 15 days an appropriate cut‐off age for considering serious bacterial infection in the management of febrile infants? Pediatr Infect Dis J. 2012;31:455–458.
- , , . Failure of infant observation scales in detecting serious illness in febrile, 4‐ to 8‐week‐old infants. Pediatrics. 1990;85:1040–1043.
- , , . Outpatient management without antibiotics of fever in selected infants. N Engl J Med. 1993;329:1437–1441.
- , , . Identifying febrile infants at risk for a serious bacterial infection. J Pediatr. 1993;123:489–490.
- , , , et al. Febrile infants at low risk for serious bacterial infection—an appraisal of the Rochester criteria and implications for management. Febrile Infant Collaborative Study Group. Pediatrics. 1994;94:390–396.
- , , , et al. Management of febrile neonates in US pediatric emergency departments. Pediatrics. 2014;133:187–195.
- , , , et al. Variation in care of the febrile young infant <90 days in US pediatric emergency departments. Pediatrics. 2014;134:667–677.
- , , , et al. Association of clinical practice guidelines with emergency department management of febrile infants ≤56 days of age. J Hosp Med. 2015;10:358–365.
- , , , et al. Diagnosis and management of febrile infants (0‐3 months). Evid Rep Technol Assess (Full Rep). 2012;(205):1–297.
- , , , et al. Accuracy of administrative billing codes to detect urinary tract infection hospitalizations. Pediatrics. 2011;128:323–330.
- , , , et al. Identifying pediatric community‐acquired pneumonia hospitalizations: accuracy of administrative billing codes. JAMA Pediatr. 2013;167:851–858.
- , , , , , . Development and use of reporting guidelines for assessing the quality of validation studies of health administrative data. J Clin Epidemiol. 2011;64:821–829.
- American College of Emergency Physicians Clinical Policies Committee; American College of Emergency Physicians Clinical Policies Subcommittee on Pediatric Fever. Clinical policy for children younger than three years presenting to the emergency department with fever. Ann Emerg Med. 2003;42:530–545.
- , , , , , . Variation in occult injury screening for children with suspected abuse in selected US children's hospitals. Pediatrics. 2012;130:853–860.
- . Achieving data quality. How data from a pediatric health information system earns the trust of its users. J AHIMA. 2004;75:22–26.
- , , , . Corticosteroids and mortality in children with bacterial meningitis. JAMA. 2008;299:2048–2055.
- , , , , , . Research electronic data capture (REDCap)—a metadata‐driven methodology and workflow process for providing translational research informatics support. J Biomed Inform. 2009;42:377–381.
- , , , , , . Deaths attributed to pediatric complex chronic conditions: national trends and implications for supportive care services. Pediatrics. 2001;107:E99.
- US Census Bureau. Geographic terms and concepts—census divisions and census regions. Available at: https://www.census.gov/geo/reference/gtc/gtc_census_divreg.html. Accessed October 20, 2014.
- , , , . Initial emergency department diagnosis and return visits: risk versus perception. Ann Emerg Med. 1998;32:569–573.
- , , , , . A national depiction of children with return visits to the emergency department within 72 hours, 2001–2007. Pediatr Emerg Care. 2012;28:606–610.
- , , , et al. Pediatric observation status: are we overlooking a growing population in children's hospitals? J Hosp Med. 2012;7:530–536.
- , , , et al. Differences in designations of observation care in US freestanding children's hospitals: are they virtual or real? J Hosp Med. 2012;7:287–293.
- , , , , . Trends in the management of viral meningitis at United States children's hospitals. Pediatrics. 2013;131:670–676.
- , , , et al. Impact of increasing ondansetron use on clinical outcomes in children with gastroenteritis. JAMA Pediatr. 2014;168:321–329.
- , , , , . Race, otitis media, and antibiotic selection. Pediatrics. 2014;134:1059–1066.
- , , , et al. Establishing benchmarks for the hospitalized care of children with asthma, bronchiolitis, and pneumonia. Pediatrics. 2014;134:555–562.
- , , , , . Diagnostic testing and treatment of pediatric headache in the emergency department. J Pediatr. 2013;163:1634–1637.
Fever is one of the most common reasons for emergency department (ED) evaluation of infants under 90 days of age.[1] Up to 10% to 20% of febrile young infants will have a serious bacterial infection (SBI),[2, 3, 4] but infants with SBI are difficult to distinguish from those without SBI based upon symptoms and physical examination findings alone.[5] Previously developed clinical prediction algorithms can help to identify febrile infants at low risk for SBI, but differ in age range as well as recommendations for testing and empiric treatment.[6, 7, 8] Consequently, there is widespread variation in management of febrile young infants at US children's hospitals,[9, 10, 11] and defining optimal management strategies remains an important issue in pediatric healthcare.[12] Administrative datasets are convenient and inexpensive, and can be used to evaluate practice variation, trends, and outcomes of a large, diverse group of patients within and across institutions.[9, 10] Accurately identifying febrile infants evaluated for suspected SBI in administrative databases would facilitate comparative effectiveness research, quality improvement initiatives, and institutional benchmarking.
Prior studies have validated the accuracy of administrative billing codes for identification of other common childhood illnesses, including urinary tract infection (UTI)[13] and pneumonia.[14] The accuracy of International Classification of Diseases, Ninth Revision (ICD‐9) diagnosis codes in identifying febrile young infants evaluated for SBI is not known. Reliance on administrative ICD‐9 diagnosis codes for patient identification can lead to misclassification of patients due to variable database quality, the validity of the diagnosis codes being utilized, and hospital coding practices.[15] Additionally, fever is a symptom and not a specific diagnosis. If a particular bacterial or viral diagnosis is established (eg, enterovirus meningitis), a discharge diagnosis of fever may not be attributed to the patient encounter. Thus, evaluating the performance characteristics and capture of clinical outcomes of different combinations of ICD‐9 diagnosis codes for identifying febrile infants is necessary for both the conduct and interpretation of studies that utilize administrative databases. The primary objective of this investigation was to identify the most accurate ICD‐9 coding strategies for the identification of febrile infants aged <90 days using administrative data. We also sought to evaluate capture of clinically important outcomes across identification strategies.
METHODS
Study Design and Setting
For this multicenter retrospective study, we used the Pediatric Health Information System (PHIS) database to identify infants <90 days of age[16] who presented between July 1, 2012 and June 30, 2013 to 1 of 8 EDs. We assessed performance characteristics of ICD‐9 diagnosis code case‐identification algorithms by comparing ICD‐9 code combinations to a fever reference standard determined by medical record review. The institutional review board at each participating site approved the study protocol.
Data Source
Data were obtained from 2 sources: the PHIS database and medical record review. We used the PHIS database to identify eligible patients by ICD‐9 diagnosis codes; patient encounters were randomly selected using a random number generator. The PHIS database contains demographic, diagnosis, and billing data from 44 hospitals affiliated with the Children's Hospital Association (Overland Park, Kansas) and represents 85% of freestanding children's hospitals in the United States.[17] Data are deidentified; encrypted unique patient identifiers permit tracking of patients across visits within a site.[18] The Children's Hospital Association and participating hospitals jointly assure the quality and integrity of the data.[19]
For each patient encounter identified in the PHIS database, detailed medical record review was performed by trained investigators at each of the 8 study sites (see Supporting Information, Appendix, in the online version of this article). A standardized data collection instrument was pilot tested by all investigators prior to use. Data were collected and managed using the Research Electronic Data Capture (REDCap) tool hosted at Boston Children's Hospital.[20]
Exclusions
Using PHIS data, prior to medical record review we excluded infants with a complex chronic condition as defined previously[21] and those transferred from another institution, as these infants may warrant a nonstandard evaluation and/or may have incomplete data.
ICD‐9 Diagnosis Code Groups
In the PHIS database, all patients discharged from the hospital (including hospitalized patients as well as patients discharged from the ED) receive 1 or more ICD‐9 discharge diagnosis codes. These diagnosis codes are ascribed after discharge from the hospital, or for ED patients, after ED discharge. Additionally, patients may receive an admission diagnosis, which reflects the diagnosis ascribed at the time of ED discharge or transfer to the inpatient unit.
We reviewed medical records of infants selected from the following ICD‐9 diagnosis code groups (Figure 1): (1) discharge diagnosis code of fever (780.6 [fever and other physiologic disturbances of temperature regulation], 778.4 [other disturbances of temperature regulation of newborn], 780.60 [fever, unspecified], or 780.61 [fever presenting with conditions classified elsewhere])[9, 10] regardless of the presence of admission diagnosis of fever or diagnosis of serious infection, (2) admission diagnosis code of fever without associated discharge diagnosis code of fever,[10] (3) discharge diagnosis code of serious infection determined a priori (see Supporting Information, Appendix, in the online version of this article) without discharge or admission diagnosis code of fever, and (4) infants without any diagnosis code of fever or serious infection.
Medical records reviewed in each of the 4 ICD‐9 diagnosis code groups were randomly selected from the overall set of ED encounters in the population of infants <90 days of age evaluated during the study period. Twenty‐five percent population sampling was used for 3 of the ICD‐9 diagnosis code groups, whereas 5% sampling was used for the no fever/no serious infection code group. The number of medical records reviewed in each ICD‐9 diagnosis code group was proportional to the distribution of ICD‐9 codes across the entire population of infants <90 days of age. These records were distributed equally across sites (228 records per site), except for 1 site that does not assign admission diagnoses (201 records).
Investigators were blinded to ICD‐9 diagnosis code groups during medical record review. Infants with multiple visits during the study period were eligible to be included more than once if the visits occurred more than 3 days apart. For infants with more than 1 ED visit on a particular calendar day, investigators were instructed to review the initial visit.
For each encounter, we also abstracted demographic characteristics (gender, race/ethnicity), insurance status, hospital region (using US Census categories[22]), and season from the PHIS database.
Reference Standard
The presence of fever was determined by medical record review. We defined fever as any documented temperature 100.4F (38.0C) at home or in the ED.[16]
ICD‐9 Code Case‐Identification Algorithms
Using the aforementioned ICD‐9 diagnosis code groups individually and in combination, the following 4 case‐identification algorithms, determined from prior study or group consensus, were compared to the reference standard: (1) ICD‐9 discharge diagnosis code of fever,[9] (2) ICD‐9 admission or discharge diagnosis code of fever,[10, 11] (3) ICD‐9 discharge diagnosis code of fever or serious infection, and (4) ICD‐9 discharge or admission diagnosis code of fever or serious infection. Algorithms were compared overall, separately for discharged and hospitalized infants, and across 3 distinct age groups (28 days, 2956 days, and 5789 days).
Patient‐Level Outcomes
To compare differences in outcomes by case‐identification algorithm, from the PHIS database we abstracted hospitalization rates, rates of UTI/pyelonephritis,[13] bacteremia/sepsis, and bacterial meningitis.[19] Severe outcomes were defined as intensive care unit admission, mechanical ventilation, central line placement, receipt of extracorporeal membrane oxygenation, or death. We assessed hospital length of stay for admitted infants and 3‐day revisits,[23, 24] and revisits resulting in hospitalization for infants discharged from the ED at the index visit. Patients billed for observation care were classified as being hospitalized.[25, 26]
Data Analysis
Accuracy of the 4 case‐identification algorithms (compared with the reference standard) was calculated using sensitivity, specificity, negative predictive value (NPV), and positive predictive value (PPV), along with 95% confidence interval (CI). Prior to analysis, a 5‐fold weighting factor was applied to the no fever/no serious infection group to account for the differential sampling used for this group (5% vs 25% for the other 3 ICD‐9 diagnosis code groups). This weighting was done to approximate the true prevalence of each ICD‐9 code group within the larger population, so that an accurate rate of false negatives (infants with fever who had neither a diagnosis of fever nor serious infection) could be calculated.
We described continuous variables using median and interquartile range or range values and categorical variables using frequencies with 95% CIs. We compared categorical variables using a 2 test. We determined statistical significance as a 2‐tailed P value <0.05. Statistical analyses were performed using SAS version 9.3 (SAS Institute, Cary, NC).
RESULTS
Study Patients
During the 1‐year study period, 23,753 ED encounters for infants <90 days of age were identified in the PHIS database at the 8 participating sites. Of these infant encounters, 2166 (9.2%) were excluded (1658 infants who had a complex chronic condition and 508 transferred into the ED), leaving 21,587 infants available for selection. After applying our sampling strategy, we identified 1797 encounters for medical record review. Seven encounters from 3 hospitals with missing medical records were excluded, resulting in a final cohort of 1790 encounters (Figure 1). Among included infants, 552 (30.8%) were 28 days, 743 (41.5%) were 29 to 56 days, and 495 (27.8%) were 57 to 89 days of age; 737 (41.2%) infants were hospitalized. Patients differed in age, race, payer, and season across ICD‐9 diagnosis code groups (see Supporting Information, Table 1, in the online version of this article).
| ICD‐9 Diagnosis Code Algorithm | Overall | |||
|---|---|---|---|---|
| Sensitivity, % (95% CI) | Specificity, % (95% CI) | Negative Predictive Value, % (95% CI) | Positive Predictive Value, % (95% CI) | |
| ||||
| Discharge diagnosis of fever | 53.2 (50.056.4) | 98.2 (97.898.6) | 90.8 (90.091.6) | 86.1 (83.388.9) |
| Hospitalized | 47.3 (43.151.5) | 97.7 (96.998.5) | 80.6 (78.682.6) | 90.2 (86.893.6) |
| Discharged from ED | 61.4 (56.666.2) | 98.4 (98.098.8) | 95.4 (94.796.1) | 82.1 (77.786.5) |
| Discharge or admission diagnosis of Fever | 71.1 (68.274.0) | 97.7 (97.398.1) | 94.1 (93.494.8) | 86.9 (84.589.3) |
| Hospitalized | 72.5 (68.876.2) | 97.1 (96.298.0) | 88.8 (87.190.5) | 91.7 (89.194.3) |
| Discharged from ED | 69.2 (64.773.7) | 98.0 (97.598.5) | 96.3 (95.796.9) | 80.8 (76.685.0) |
| Discharge diagnosis of fever or serious infection | 63.7 (60.666.8) | 96.5 (96.097.0) | 92.6 (91.893.4) | 79.6 (76.782.5) |
| Hospitalized | 63.9 (59.967.9) | 92.5 (91.094.0) | 85.1 (83.287.0) | 79.1 (75.382.9) |
| Discharged from ED | 63.4 (58.768.1) | 98.1 (97.698.6) | 95.6 (94.996.3) | 80.2 (75.884.6) |
| Discharge or admission diagnosis of fever or serious infection | 76.6 (73.979.3) | 96.2 (95.696.8) | 95.1 (94.595.7) | 81.0 (78.483.6) |
| Hospitalized | 80.8 (77.584.1) | 92.1 (90.693.6) | 91.5 (89.993.1) | 82.1 (78.985.3) |
| Discharged from ED | 71.0 (66.575.5) | 97.7 (97.298.2) | 96.5 (95.997.1) | 79.4 (75.283.6) |
Among the 1790 patient encounters reviewed, a total of 766 infants (42.8%) met the reference standard definition for fever in the cohort. An additional 47 infants had abnormal temperature reported (documentation of tactile fever, history of fever without a specific temperature described, or hypothermia) but were classified as having no fever by the reference standard.
ICD‐9 Code Case‐Identification Algorithm Performance
Compared with the reference standard, the 4 case‐identification algorithms demonstrated specificity of 96.2% to 98.2% but lower sensitivity overall (Figure 2). Discharge diagnosis of fever alone demonstrated the lowest sensitivity. The algorithm of discharge or admission diagnosis of fever resulted in increased sensitivity and the highest PPV of all 4 algorithms (86.9%, 95% CI: 84.5‐89.3). Addition of serious infection codes to this algorithm resulted in a marginal increase in sensitivity and a similar decrease in PPV (Table 1). When limited to hospitalized infants, specificity was highest for the case‐identification algorithm of discharge diagnosis of fever and similarly high for discharge or admission diagnosis of fever; sensitivity was highest for the algorithm of discharge or admission diagnosis of fever or diagnosis of serious infection. For infants discharged from the ED, algorithm specificity was 97.7% to 98.4%, with lower sensitivity for all 4 algorithms (Table 1). Inclusion of the 47 infants with abnormal temperature as fever did not materially change algorithm performance (data not shown).
Across all 3 age groups (28 days, 2956 days, and 5789 days), the 4 case‐identification algorithms demonstrated specificity >96%, whereas algorithm sensitivity was highest in the 29‐ to 56‐days‐old age group and lowest among infants 57 to 89 days old across all 4 algorithms (Figure 2). Similar to the overall cohort, an algorithm of discharge or admission diagnosis of fever demonstrated specificity of nearly 98% in all age groups; addition of serious infection codes to this algorithm increased sensitivity, highest in the 29‐ to 56‐days‐old age group (Figure 2; see also Supporting Information, Table 2, in the online version of this article).
| ICD‐9 Diagnosis Code Algorithm | Sensitivity, Median % (Range) | Specificity, Median % (Range) | Negative Predictive Value, Median % (Range) | Positive Predictive Value, Median % (Range) |
|---|---|---|---|---|
| ||||
| Discharge diagnosis of fever | 56.2 (34.681.0) | 98.3 (96.499.1) | 92.1 (83.297.4) | 87.7 (74.093.2) |
| Discharge or Admission diagnosis of Fever | 76.7 (51.385.0) | 97.8 (96.298.7) | 95.6 (86.997.4) | 87.4 (80.092.9) |
| Discharge diagnosis of fever or serious infection | 68.3 (44.287.3) | 96.5 (95.498.0) | 93.6 (85.298.2) | 78.3 (74.289.0) |
| Discharge or admission diagnosis of fever or serious infection | 83.1 (58.390.7) | 95.8 (95.498.0) | 96.5 (88.598.2) | 79.1 (77.490.4) |
Across the 8 study sites, median specificity was 95.8% to 98.3% for the 4 algorithms, with little interhospital variability; however, algorithm sensitivity varied widely by site. Median PPV was highest for discharge diagnosis of fever alone at 87.7% but ranged from 74.0% to 93.2% across sites. Median PPV for an algorithm of discharge or admission diagnosis of fever was similar (87.4%) but with less variation by site (range 80.0%92.9%) (Table 2).
Outcomes by ICD‐9 Diagnosis Code Group and Case‐Identification Algorithm
When compared with discharge diagnosis of fever, adding admission diagnosis of fever captured a higher proportion of hospitalized infants with SBIs (UTI/pyelonephritis, bacteremia/sepsis, or bacterial meningitis). However, median hospital length of stay, severe outcomes, and 3‐day revisits and revisits with hospitalization did not materially differ when including infants with admission diagnosis of fever in addition to discharge diagnosis of fever. Addition of infants with a diagnosis code for serious infection substantially increased the number of infants with SBIs and severe outcomes but did not capture additional 3‐day revisits (Table 3). There were no additional cases of SBI in the no fever/no serious illness diagnosis code group.
| ICD‐9 Diagnosis Code Algorithm | Outcome | 3‐Day Revisit, % (95% CI) | 3‐Day Revisit With Hospitalization, % (95% CI) | |||
|---|---|---|---|---|---|---|
| Hospitalized, % (95% CI) | UTI/Pyelonephritis, Bacteremia/Sepsis, or Bacterial Meningitis, % (95% CI) | Severe Outcome, % (95% CI)* | Length of Stay in Days, Median (IQR) | |||
| ||||||
| Discharge diagnosis of fever | 44.3 (40.348.4) | 3.3 (1.84.7) | 1.4 (0.42.3) | 3 (23) | 11.7 (8.215.2) | 5.9 (3.38.4) |
| Discharge or admission diagnosis of fever | 52.4 (48.955.9) | 6.1 (4.47.8) | 1.9 (1.02.9) | 3 (23) | 10.9 (7.714.1) | 5.4 (3.17.8) |
| Discharge diagnosis of fever or serious infection | 54.0 (50.457.5) | 15.3 (12.717.8) | 3.8 (2.55.2) | 3 (24) | 11.0 (7.714.2) | 5.5 (3.17.9) |
| Discharge or admission diagnosis of fever or serious infection | 56.5 (53.259.7) | 12.9 (10.715.1) | 3.6 (2.44.8) | 3 (24) | 10.3 (7.313.3) | 5.2 (3.07.4) |
Among infants who met the reference standard for fever but did not have a discharge or admission diagnosis of fever (false negatives), 11.8% had a diagnosis of SBI. Overall, 43.2% of febrile infants (and 84.4% of hospitalized infants) with SBI did not have an ICD‐9 discharge or admission diagnosis of fever. Addition of ICD‐9 diagnosis codes of serious infection to the algorithm of discharge or admission diagnosis of fever captured all additional SBIs, and no false negativeinfants missed with this algorithm had an SBI.
DISCUSSION
We described the performance of 4 ICD‐9 diagnosis code case‐identification algorithms for the identification of febrile young infants <90 days of age at US children's hospitals. Although the specificity was high across algorithms and institutions, the sensitivity was relatively low, particularly for discharge diagnosis of fever, and varied by institution. Given the high specificity, ICD‐9 diagnosis code case‐identification algorithms for fever reliably identify febrile infants using administrative data with low rates of inclusion of infants without fever. However, underidentification of patients, particularly those more prone to SBIs and severe outcomes depending on the algorithm utilized, can impact interpretation of comparative effectiveness studies or the quality of care delivered by an institution.
ICD‐9 discharge diagnosis codes are frequently used to identify pediatric patients across a variety of administrative databases, diseases, and symptoms.[19, 27, 28, 29, 30, 31] Although discharge diagnosis of fever is highly specific, sensitivity is substantially lower than other case‐identification algorithms we studied, particularly for hospitalized infants. This may be due to a fever code sometimes being omitted in favor of a more specific diagnosis (eg, bacteremia) prior to hospital discharge. Therefore, case identification relying only on ICD‐9 discharge diagnosis codes for fever may under‐report clinically important SBI or severe outcomes as demonstrated in our study. This is in contrast to ICD‐9 diagnosis code identification strategies for childhood UTI and pneumonia, which largely have higher sensitivity but lower specificity than fever codes.[13, 14]
Admission diagnosis of fever is important for febrile infants as they may not have an explicit diagnosis at the time of disposition from the ED. Addition of admission diagnosis of fever to an algorithm relying on discharge diagnosis code alone increased sensitivity without a demonstrable reduction in specificity and PPV, likely due to capture of infants with a fever diagnosis at presentation before a specific infection was identified. Although using an algorithm of discharge or admission diagnosis of fever captured a higher percentage of hospitalized febrile infants with SBIs, sensitivity was only 71% overall with this algorithm, and 43% of febrile infants with SBI would still have been missed. Importantly, though, addition of various ICD‐9 codes for serious infection to this algorithm resulted in capture of all febrile infants with SBI and should be used as a sensitivity analysis.
The test characteristics of diagnosis codes were highest in the 29‐ to 56‐days‐old age group. Given the differing low‐risk criteria[6, 7, 8] and lack of best practice guidelines[16] in this age group, the use of administrative data may allow for the comparison of testing and treatment strategies across a large cohort of febrile infants aged 29 to 56 days. However, individual hospital coding practices may affect algorithm performance, in particular sensitivity, which varied substantially by hospital. This variation in algorithm sensitivity may impact comparisons of outcomes across institutions. Therefore, when conducting studies of febrile infants using administrative data, sensitivity analyses or use of chart review should be considered to augment the use of ICD‐9 code‐based identification strategies, particularly for comparative benchmarking and outcomes studies. These additional analyses are particularly important for studies of febrile infants >56 days of age, in whom the sensitivity of diagnosis codes is particularly low. We speculate that the lower sensitivity in older febrile infants may relate to a lack of consensus on the clinical significance of fever in this age group and the varying management strategies employed.[10]
Strengths of this study include the assessment of ICD‐9 code algorithms across multiple institutions for identification of fever in young infants, and the patterns of our findings remained robust when comparing median performance characteristics of the algorithms across hospitals to our overall findings. We were also able to accurately estimate PPV and NPV using a case‐identification strategy weighted to the actual population sizes. Although sensitivity and specificity are the primary measures of test performance, predictive values are highly informative for investigators using administrative data. Additionally, our findings may inform public health efforts including disease surveillance, assessment of seasonal variation, and identification and monitoring of healthcare‐associated infections among febrile infants.
Our study has limitations. We did not review all identified records, which raises the possibility that our evaluated cohort may not be representative of the entire febrile infant population. We attempted to mitigate this possibility by using a random sampling strategy for our population selection that was weighted to the actual population sizes. Second, we identified serious infections using ICD‐9 diagnosis codes determined by group consensus, which may not capture all serious infection codes that identify febrile infants whose fever code was omitted. Third, 47 infants had abnormal temperature that did not meet our reference standard criteria for fever and were included in the no fever group. Although there may be disagreement regarding what constitutes a fever, we used a widely accepted reference standard to define fever.[16] Further, inclusion of these 47 infants as fever did not materially change algorithm performance. Last, our study was conducted at 8 large tertiary‐care children's hospitals, and our results may not be generalizable to other children's hospitals and community‐based hospitals.
CONCLUSIONS
Studies of febrile young infants that rely on ICD‐9 discharge diagnosis code of fever for case ascertainment have high specificity but low sensitivity for the identification of febrile infants, particularly among hospitalized patients. A case‐identification strategy that includes discharge or admission diagnosis of fever demonstrated higher sensitivity, and should be considered for studies of febrile infants using administrative data. However, additional strategies such as incorporation of ICD‐9 codes for serious infection should be used when comparing outcomes across institutions.
Acknowledgements
The Febrile Young Infant Research Collaborative includes the following additional collaborators who are acknowledged for their work on this study: Erica DiLeo, MA, Department of Medical Education and Research, Danbury Hospital, Danbury, Connecticut; Janet Flores, BS, Division of Emergency Medicine, Ann and Robert H. Lurie Children's Hospital of Chicago, Chicago, Illinois.
Disclosures: This project funded in part by The Gerber Foundation Novice Researcher Award, (Ref No. 1827‐3835). Dr. Fran Balamuth received career development support from the National Institutes of Health (NHLBI K12‐HL109009). Funders were not involved in the design or conduct of the study; collection, management, analysis, or interpretation of the data; or preparation, review, or approval of the manuscript. The authors have no conflicts of interest relevant to this article to disclose.
- . The prevalence of serious bacterial infections by age in febrile infants during the first 3 months of life. Pediatr Ann. 1993;22:462–466.
- , , . Performance of low‐risk criteria in the evaluation of young infants with fever: review of the literature. Pediatrics. 2010;125:228–233.
- , , , , , . A week‐by‐week analysis of the low‐risk criteria for serious bacterial infection in febrile neonates. Arch Dis Child. 2009;94:287–292.
- , , , et al. Is 15 days an appropriate cut‐off age for considering serious bacterial infection in the management of febrile infants? Pediatr Infect Dis J. 2012;31:455–458.
- , , . Failure of infant observation scales in detecting serious illness in febrile, 4‐ to 8‐week‐old infants. Pediatrics. 1990;85:1040–1043.
- , , . Outpatient management without antibiotics of fever in selected infants. N Engl J Med. 1993;329:1437–1441.
- , , . Identifying febrile infants at risk for a serious bacterial infection. J Pediatr. 1993;123:489–490.
- , , , et al. Febrile infants at low risk for serious bacterial infection—an appraisal of the Rochester criteria and implications for management. Febrile Infant Collaborative Study Group. Pediatrics. 1994;94:390–396.
- , , , et al. Management of febrile neonates in US pediatric emergency departments. Pediatrics. 2014;133:187–195.
- , , , et al. Variation in care of the febrile young infant <90 days in US pediatric emergency departments. Pediatrics. 2014;134:667–677.
- , , , et al. Association of clinical practice guidelines with emergency department management of febrile infants ≤56 days of age. J Hosp Med. 2015;10:358–365.
- , , , et al. Diagnosis and management of febrile infants (0‐3 months). Evid Rep Technol Assess (Full Rep). 2012;(205):1–297.
- , , , et al. Accuracy of administrative billing codes to detect urinary tract infection hospitalizations. Pediatrics. 2011;128:323–330.
- , , , et al. Identifying pediatric community‐acquired pneumonia hospitalizations: accuracy of administrative billing codes. JAMA Pediatr. 2013;167:851–858.
- , , , , , . Development and use of reporting guidelines for assessing the quality of validation studies of health administrative data. J Clin Epidemiol. 2011;64:821–829.
- American College of Emergency Physicians Clinical Policies Committee; American College of Emergency Physicians Clinical Policies Subcommittee on Pediatric Fever. Clinical policy for children younger than three years presenting to the emergency department with fever. Ann Emerg Med. 2003;42:530–545.
- , , , , , . Variation in occult injury screening for children with suspected abuse in selected US children's hospitals. Pediatrics. 2012;130:853–860.
- . Achieving data quality. How data from a pediatric health information system earns the trust of its users. J AHIMA. 2004;75:22–26.
- , , , . Corticosteroids and mortality in children with bacterial meningitis. JAMA. 2008;299:2048–2055.
- , , , , , . Research electronic data capture (REDCap)—a metadata‐driven methodology and workflow process for providing translational research informatics support. J Biomed Inform. 2009;42:377–381.
- , , , , , . Deaths attributed to pediatric complex chronic conditions: national trends and implications for supportive care services. Pediatrics. 2001;107:E99.
- US Census Bureau. Geographic terms and concepts—census divisions and census regions. Available at: https://www.census.gov/geo/reference/gtc/gtc_census_divreg.html. Accessed October 20, 2014.
- , , , . Initial emergency department diagnosis and return visits: risk versus perception. Ann Emerg Med. 1998;32:569–573.
- , , , , . A national depiction of children with return visits to the emergency department within 72 hours, 2001–2007. Pediatr Emerg Care. 2012;28:606–610.
- , , , et al. Pediatric observation status: are we overlooking a growing population in children's hospitals? J Hosp Med. 2012;7:530–536.
- , , , et al. Differences in designations of observation care in US freestanding children's hospitals: are they virtual or real? J Hosp Med. 2012;7:287–293.
- , , , , . Trends in the management of viral meningitis at United States children's hospitals. Pediatrics. 2013;131:670–676.
- , , , et al. Impact of increasing ondansetron use on clinical outcomes in children with gastroenteritis. JAMA Pediatr. 2014;168:321–329.
- , , , , . Race, otitis media, and antibiotic selection. Pediatrics. 2014;134:1059–1066.
- , , , et al. Establishing benchmarks for the hospitalized care of children with asthma, bronchiolitis, and pneumonia. Pediatrics. 2014;134:555–562.
- , , , , . Diagnostic testing and treatment of pediatric headache in the emergency department. J Pediatr. 2013;163:1634–1637.
© 2015 Society of Hospital Medicine
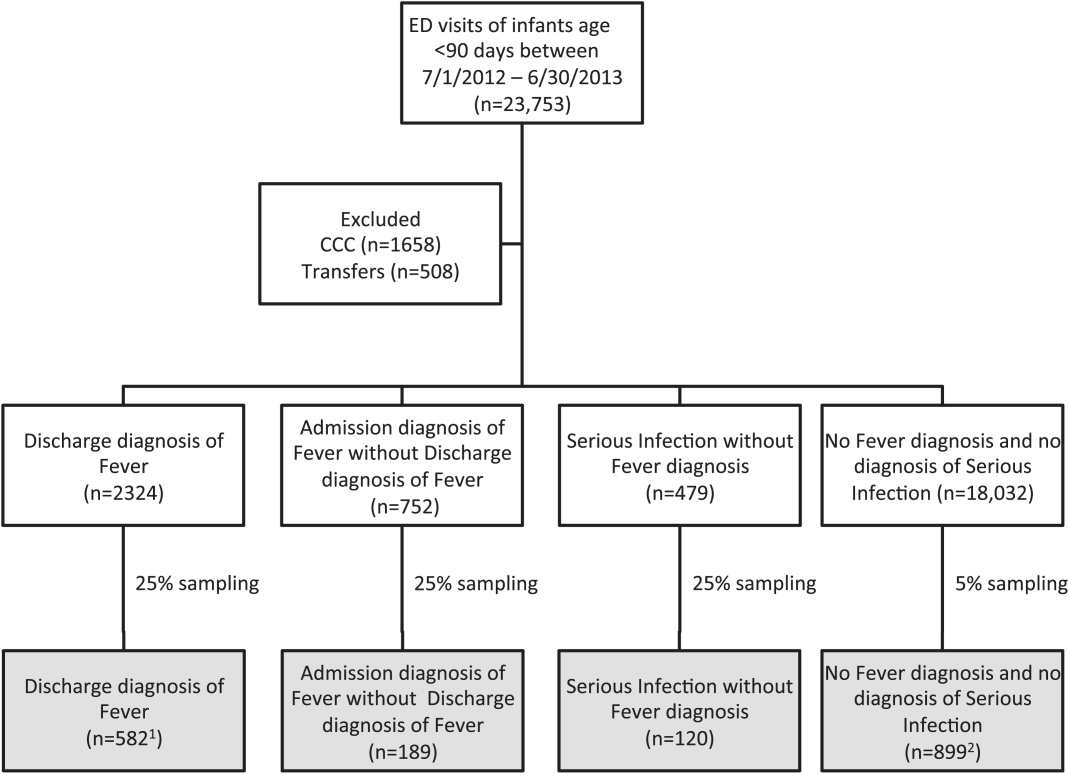
Length of Stay and Readmission After Total Shoulder Arthroplasty: An Analysis of 1505 Cases
Use of total shoulder arthroplasty (TSA) and reverse TSA for shoulder conditions has increased dramatically in recent years.1 Approximately 27,000 standard TSAs were performed in the United States in 2008, and this number is expected to double by 2015.2 TSA provides excellent pain relief, restoration of function, and patient satisfaction.3 The evolution of implant design over the past 25 years has contributed to excellent long-term implant survival, with rates comparable to those of total knee and hip arthroplasty.4 Similarly, compared with previous designs, contemporary designs and techniques have resulted in fewer complications.5
Several studies have investigated the long-term complications of TSA. These complications include prosthetic loosening, instability, periprosthetic fracture, rotator cuff tears, nerve injury, and deltoid dysfunction.6-11 In addition, Waterman and colleagues11 very recently assessed the influence of risk factors on short-term postoperative complications of TSA. However, none of these studies has assessed the influence of multiple risk factors on postoperative length of stay (LOS) after TSA. Only 1 study, using data from 2005 and earlier, has analyzed the potential effect of multiple patient characteristics on readmission after TSA12; other studies have been only descriptive.13-16
We conducted a retrospective cohort study to characterize the risk factors for extended LOS and readmission after TSA in a large sample of patients drawn from a national database. We hypothesized that patient factors, including age, sex, and obesity, would be significantly associated with postoperative LOS and readmission after TSA. National databases have been increasingly used in orthopedic research, as they offer particular advantages. Large sample sizes allow for powerful analyses of associations—analyses previously not possible in single-surgeon and single-institution studies. In addition, use of a large, national patient sample allows us to draw generalizable conclusions to better define patients’ and physicians’ postoperative expectations.
Methods
We conducted a retrospective cohort study using the American College of Surgeons National Surgical Quality Improvement Program (ACS-NSQIP) database. ACS-NSQIP collects 150 patient variables from 374 participating US hospitals.17 Patients are prospectively identified, and information is collected from operative reports, medical records, and patient interviews by trained clinical reviewers.17,18 Routine auditing by the program ensures high-quality data, with reported interrater disagreement below 2% for all variables. Data are collected through the 30th postoperative day, including after discharge.
This study was granted an exemption from our institutional review board, as we used a deidentified and publicly available database. Patients who were 60 years or older and underwent TSA between 2011 and 2012 were identified in the ACS-NSQIP database. TSA patients were identified using Current Procedural Terminology (CPT) code 23472, which includes TSA and reverse TSA procedures.
Patients were divided into groups based on surgical indications, which were available as International Classification of Diseases, Ninth Revision (ICD-9) diagnosis codes. Patients with postoperative ICD-9 codes 714.0 (rheumatoid arthritis), 715.0-9 (osteoarthritis), 716.61/716.81/716.91 (unspecified arthropathy), 718.01 (articular cartilage disorder), 718.31 (recurrent dislocation of shoulder), 718.81 (other joint derangement of shoulder), 719.41/719.91 (unspecified shoulder pain/disorder), 726.0-2 (disorder of shoulder tendons and bursa), 727.61 (rotator cuff rupture), and 840.3-9 (rotator cuff sprain) were classified as having a nonfracture indication. Patients with postoperative ICD-9 codes 716.11 (traumatic arthropathy), 833.80-89 (malunion/nonunion of fracture), and 812.00-20 (fracture of proximal humerus) were classified as having a fracture-associated indication. Patients with incomplete perioperative data were excluded from the study, leaving 1505 patients for the study (out of an initial 1726).
Patient characteristics, including sex, age, height, weight, and history of smoking, were collected from the ACS-NSQIP database. Body mass index (BMI) was calculated from each patient’s height and weight. Information about medical comorbidities was also collected from the ACS-NSQIP database. History of pulmonary disease was defined as a history of dyspnea, severe chronic obstructive pulmonary disease, ventilator-assisted respiration within 48 hours before surgery, or current pneumonia. History of heart disease was defined as a history of congestive heart failure or angina within 1 month before admission, myocardial infarction within 6 months before admission, cardiac surgery, or percutaneous coronary intervention. American Society of Anesthesiologists (ASA) class 3 or higher indicates severe systemic disease. Steroid use was defined as regular administration of corticosteroid medications within 30 days before surgery. Functional status was defined as the ability to perform activities of daily living (ADLs) within 30 days before surgery, with the patient’s best functional status during this period recorded. Similar to how other variables were collected from the database, this information was obtained through medical record abstraction and patient interviews by trained personnel. ADLs are defined in the ACS-NSQIP as “activities usually performed in the course of a normal day in a person’s life” and include bathing, feeding, dressing, toileting, and mobility. An independent patient does not require assistance for any ADLs, a partially dependent patient requires assistance for some ADLs, and a totally dependent patient requires assistance in completing all ADLs. Partially and totally dependent patients were grouped for analysis. Information about a patient’s discharge destination (to home or a facility) was also available in the database.17
Extended Length of Stay
Extended LOS was defined as a binary variable that was positive when the postoperative LOS exceeded the 90th percentile LOS. The 90th percentile LOS was chosen as a cutoff to account for normal variations in LOS and differing practices of surgeons while still capturing patients with abnormally extended LOS.
Readmission
Readmission was defined as a binary variable that was positive when a patient had an unplanned readmission 1 or more times after the initial postoperative discharge.
Patient Demographics
Table 1 summarizes the demographics and comorbidities of the 1505 TSA patients who met our study inclusion criteria. Mean age was 72.8 years (range, 60-90 years). Mean BMI was 30.3 kg/m2 (range, 15.7-63.9 kg/m2); 46.7% of patients were classified as obese (BMI, ≥30 kg/m2). The cohort was 58.9% female. Four percent of patients underwent TSA for a fracture-associated indication.
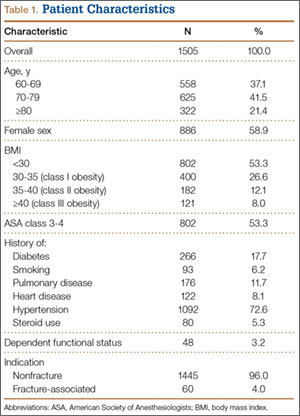
Statistical Analyses
Statistical analyses were performed with Stata 11.2 (StataCorp). Bivariate and multivariate analyses were used to test patient characteristics for association with extended LOS and readmission. Discharge destination and LOS were included in the readmission analysis because this information would be available at time of discharge and would be useful to include in a model that predicts odds of readmission.
Final multivariate models were constructed using a backward stepwise process that initially included all potential variables and sequentially excluded variables with the highest P value until only those with P < .20 remained. Variables with .05 < P < .20 were left in the model to control for potential confounding but were not considered significantly associated with the outcome. All tests were 2-tailed, and the statistical difference was established at a 2-sided α level of 0.05 (P < .05).
Results
Median LOS after TSA was 2 days (interquartile range, 1-3 days), and extended LOS was defined as LOS of more than 3 days (90th percentile LOS). The distribution of LOS is depicted in the Figure. Results of the bivariate and multivariate analyses are reported in Table 2 and Table 3, respectively. Bivariate analysis revealed an association between extended LOS and increased age, ASA class 3 or higher, and history of diabetes, pulmonary disease, and heart disease. On multivariate analysis, extended LOS was associated with age 70 to 79 years (odds ratio [OR], 1.71; 95% confidence interval [CI], 1.01-2.95; P = .049), age 80 years or older (OR, 3.38; 95% CI, 1.94-5.91; P < .001), and history of diabetes (OR, 2.37; 95% CI, 1.53-3.66; P < .001).
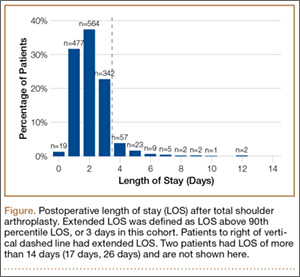
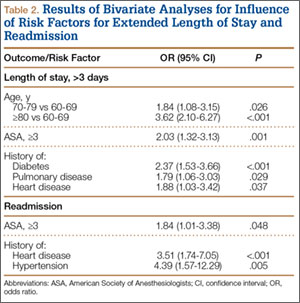
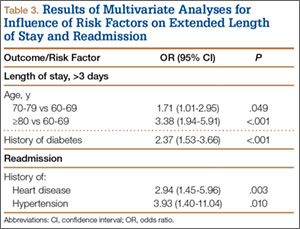
Forty-nine patients (3.3%) were readmitted within the first 30 postoperative days. Bivariate analysis revealed an association between readmission and ASA class 3 or higher, history of heart disease, and history of hypertension. On multivariate analysis, readmission was associated only with history of heart disease (OR, 2.94; 95% CI, 1.45-5.96; P = .003) and history of hypertension (OR, 3.93; 95% CI, 1.40-11.04; P = .010).
Discussion
In the United States, TSA has become increasingly popular because of its favorable outcomes and continued implant development.1-5 However, there is a shortage of information about risk factors for short-term outcomes after TSA. In this study, we used multivariate analyses to identify patient-related factors associated with extended LOS and readmission after discharge. By identifying these factors, we can improve the preoperative discussion and postoperative planning for this procedure.
In the present study, extended LOS (>3 days) was found to be associated with older age and history of diabetes. The TSA literature has little information that can be used to compare these results, though age over 80 years was previously described as a risk factor for extended LOS after TSA.19 Uncontrolled diabetes has been identified as a risk factor for extended LOS in hip and knee arthroplasty,20 and management of diabetes may similarly complicate postoperative care, leading to extended LOS and increased costs in TSA patients. Patients with the identified risk factors for extended LOS should be counseled before surgery. In addition, this is important information for health care organizations and providers.
Readmission within 30 days after TSA was found to be independently associated with history of heart disease and history of hypertension. Similar to factors affecting LOS, patient-related risk factors for readmission are also poorly defined in the TSA literature. In total hip arthroplasty patients, heart disease has been found to be associated with readmission.21,22 Hypertension has also been associated with readmission for other orthopedic procedures.23 Results of the present study indicate these comorbidities may increase the risk for complications after discharge. It is important to note, however, that LOS did not correlate with readmission rates, indicating patients are likely being discharged at the most clinically appropriate time.
Waterman and colleagues11 very recently identified (in the ACS-NSQIP database) a patient population that underwent TSA between 2006 and 2011 to describe risk factors for postoperative complications within 30 days. They found that comorbid cardiac disease and older age were independently associated with mortality. Interestingly, the present study identified older age as associated with extended LOS, and cardiac disease as associated with readmission. Together with the results from the previous study, age and cardiac disease seem to be important patient factors to consider when planning TSA, as they are associated with a significantly worse postoperative course.
This study had several limitations. First, given the nature of the ACS-NSQIP database, readmissions are recorded only up to 30 days after surgery, including after discharge. Second, though the ACS-NSQIP tries to collect as many patient variables as possible, some information is not captured. Additional variables that could potentially affect LOS and readmission (eg, insurance status, hospital volume) were not available for analysis. However, we think the high-quality data collection process used by the ACS-NSQIP outweighs the lack of certain variables. Third, original operative notes are not available in the ACS-NSQIP database, and the only way to identify operative procedures is to check CPT codes. Unfortunately, CPT code 23472 is used for both TSA and reverse TSA, so these procedures could not be separated for analysis, and the results of this study can be used to comment only on the risks of both procedures. Another limitation is that there were not enough patients to further analyze the data by each indication.
Conclusion
With the increasing popularity of TSA for an expanding set of indications, it is important to understand the factors that can affect the postoperative course. In this study, we found several patient-related risk factors for extended LOS and readmission. Although the identified factors are generally not modifiable, this information can be used to better define the expectations of patients, providers, and organizations for this increasingly common procedure.
1. Kim SH, Wise BL, Zhang Y, Szabo RM. Increasing incidence of shoulder arthroplasty in the United States. J Bone Joint Surg Am. 2011;93(24):2249-2254.
2. Day JS, Lau E, Ong KL, Williams GR, Ramsey ML, Kurtz SM. Prevalence and projections of total shoulder and elbow arthroplasty in the United States to 2015. J Shoulder Elbow Surg. 2010;19(8):1115-1120.
3. Adams JE, Sperling JW, Hoskin TL, Melton LJ 3rd, Cofield RH. Shoulder arthroplasty in Olmsted County, Minnesota, 1976–2000: a population-based study. J Shoulder Elbow Surg. 2006;15(1):50-55.
4. Farmer KW, Hammond JW, Queale WS, Keyurapan E, McFarland EG. Shoulder arthroplasty versus hip and knee arthroplasties: a comparison of outcomes. Clin Orthop Relat Res. 2007;(455):183-189.
5. Chin PY, Sperling JW, Cofield RH, Schleck C. Complications of total shoulder arthroplasty: are they fewer or different? J Shoulder Elbow Surg. 2006;15(1):19-22.
6. Bohsali KI, Wirth MA, Rockwood CA Jr. Complications of total shoulder arthroplasty. J Bone Joint Surg Am. 2006;88(10):2279-2292.
7. Torchia ME, Cofield RH, Settergren CR. Total shoulder arthroplasty with the Neer prosthesis: long-term results. J Shoulder Elbow Surg. 1997;6(6):495-505.
8. Sneppen O, Fruensgaard S, Johannsen HV, Olsen BS, Søjbjerg JO, Andersen NH. Total shoulder replacement in rheumatoid arthritis: proximal migration and loosening. J Shoulder Elbow Surg. 1996;5(1):47-52.
9. Søjbjerg JO, Frich LH, Johannsen HV, Sneppen O. Late results of total shoulder replacement in patients with rheumatoid arthritis. Clin Orthop Relat Res. 1999;(366):39-45.
10. Raiss P, Bruckner T, Rickert M, Walch G. Longitudinal observational study of total shoulder replacements with cement: fifteen to twenty-year follow-up. J Bone Joint Surg Am. 2014;96(3):198-205.
11. Waterman BR, Dunn JC, Bader J, Urrea L, Schoenfeld AJ, Belmont PJ Jr. Thirty-day morbidity and mortality after elective total shoulder arthroplasty: patient-based and surgical risk factors. J Shoulder Elbow Surg. 2015;24(1):24-30.
12. Farng E, Zingmond D, Krenek L, Soohoo NF. Factors predicting complication rates after primary shoulder arthroplasty. J Shoulder Elbow Surg. 2011;20(4):557-563.
13. Streubel PN, Simone JP, Sperling JW, Cofield R. Thirty and ninety-day reoperation rates after shoulder arthroplasty. J Bone Joint Surg Am. 2014;96(3):e17.
14. Mahoney A, Bosco JA 3rd, Zuckerman JD. Readmission after shoulder arthroplasty. J Shoulder Elbow Surg. 2014;23(3):377-381.
15. Gay DM, Lyman S, Do H, Hotchkiss RN, Marx RG, Daluiski A. Indications and reoperation rates for total elbow arthroplasty: an analysis of trends in New York state. J Bone Joint Surg Am. 2012;94(2):110-117.
16. Zumstein MA, Pinedo M, Old J, Boileau P. Problems, complications, reoperations, and revisions in reverse total shoulder arthroplasty: a systematic review. J Shoulder Elbow Surg. 2011;20(1):146-157.
17. American College of Surgeons. User Guide for the 2012 ACS NSQIP Participant Use Data File. https://www.facs.org/~/media/files/quality%20programs/nsqip/ug12.ashx. Published October 2013. Accessed June 21, 2015.
18. Khuri SF, Henderson WG, Daley J, et al; Principal Investigators of Patient Safety in Surgery Study. Successful implementation of the Department of Veterans Affairs’ National Surgical Quality Improvement Program in the private sector: the Patient Safety in Surgery study. Ann Surg. 2008;248(2):329-336.
19. Ricchetti ET, Abboud JA, Kuntz AF, Ramsey ML, Glaser DL, Williams GR Jr. Total shoulder arthroplasty in older patients: increased perioperative morbidity? Clin Orthop Relat Res. 2011;469(4):1042-1049.
20. Marchant MH Jr, Viens NA, Cook C, Vail TP, Bolognesi MP. The impact of glycemic control and diabetes mellitus on perioperative outcomes after total joint arthroplasty. J Bone Joint Surg Am. 2009;91(7):1621-1629.
21. Schairer WW, Sing DC, Vail TP, Bozic KJ. Causes and frequency of unplanned hospital readmission after total hip arthroplasty. Clin Orthop Relat Res. 2014;472(2):464-470.
22. Vorhies JS, Wang Y, Herndon J, Maloney WJ, Huddleston JI. Readmission and length of stay after total hip arthroplasty in a national Medicare sample. J Arthroplasty. 2011;26(6 suppl):119-123.
23. Lovecchio F, Hsu WK, Smith TR, Cybulski G, Kim B, Kim JY. Predictors of thirty-day readmission after anterior cervical fusion. Spine. 2014;39(2):127-133.
Use of total shoulder arthroplasty (TSA) and reverse TSA for shoulder conditions has increased dramatically in recent years.1 Approximately 27,000 standard TSAs were performed in the United States in 2008, and this number is expected to double by 2015.2 TSA provides excellent pain relief, restoration of function, and patient satisfaction.3 The evolution of implant design over the past 25 years has contributed to excellent long-term implant survival, with rates comparable to those of total knee and hip arthroplasty.4 Similarly, compared with previous designs, contemporary designs and techniques have resulted in fewer complications.5
Several studies have investigated the long-term complications of TSA. These complications include prosthetic loosening, instability, periprosthetic fracture, rotator cuff tears, nerve injury, and deltoid dysfunction.6-11 In addition, Waterman and colleagues11 very recently assessed the influence of risk factors on short-term postoperative complications of TSA. However, none of these studies has assessed the influence of multiple risk factors on postoperative length of stay (LOS) after TSA. Only 1 study, using data from 2005 and earlier, has analyzed the potential effect of multiple patient characteristics on readmission after TSA12; other studies have been only descriptive.13-16
We conducted a retrospective cohort study to characterize the risk factors for extended LOS and readmission after TSA in a large sample of patients drawn from a national database. We hypothesized that patient factors, including age, sex, and obesity, would be significantly associated with postoperative LOS and readmission after TSA. National databases have been increasingly used in orthopedic research, as they offer particular advantages. Large sample sizes allow for powerful analyses of associations—analyses previously not possible in single-surgeon and single-institution studies. In addition, use of a large, national patient sample allows us to draw generalizable conclusions to better define patients’ and physicians’ postoperative expectations.
Methods
We conducted a retrospective cohort study using the American College of Surgeons National Surgical Quality Improvement Program (ACS-NSQIP) database. ACS-NSQIP collects 150 patient variables from 374 participating US hospitals.17 Patients are prospectively identified, and information is collected from operative reports, medical records, and patient interviews by trained clinical reviewers.17,18 Routine auditing by the program ensures high-quality data, with reported interrater disagreement below 2% for all variables. Data are collected through the 30th postoperative day, including after discharge.
This study was granted an exemption from our institutional review board, as we used a deidentified and publicly available database. Patients who were 60 years or older and underwent TSA between 2011 and 2012 were identified in the ACS-NSQIP database. TSA patients were identified using Current Procedural Terminology (CPT) code 23472, which includes TSA and reverse TSA procedures.
Patients were divided into groups based on surgical indications, which were available as International Classification of Diseases, Ninth Revision (ICD-9) diagnosis codes. Patients with postoperative ICD-9 codes 714.0 (rheumatoid arthritis), 715.0-9 (osteoarthritis), 716.61/716.81/716.91 (unspecified arthropathy), 718.01 (articular cartilage disorder), 718.31 (recurrent dislocation of shoulder), 718.81 (other joint derangement of shoulder), 719.41/719.91 (unspecified shoulder pain/disorder), 726.0-2 (disorder of shoulder tendons and bursa), 727.61 (rotator cuff rupture), and 840.3-9 (rotator cuff sprain) were classified as having a nonfracture indication. Patients with postoperative ICD-9 codes 716.11 (traumatic arthropathy), 833.80-89 (malunion/nonunion of fracture), and 812.00-20 (fracture of proximal humerus) were classified as having a fracture-associated indication. Patients with incomplete perioperative data were excluded from the study, leaving 1505 patients for the study (out of an initial 1726).
Patient characteristics, including sex, age, height, weight, and history of smoking, were collected from the ACS-NSQIP database. Body mass index (BMI) was calculated from each patient’s height and weight. Information about medical comorbidities was also collected from the ACS-NSQIP database. History of pulmonary disease was defined as a history of dyspnea, severe chronic obstructive pulmonary disease, ventilator-assisted respiration within 48 hours before surgery, or current pneumonia. History of heart disease was defined as a history of congestive heart failure or angina within 1 month before admission, myocardial infarction within 6 months before admission, cardiac surgery, or percutaneous coronary intervention. American Society of Anesthesiologists (ASA) class 3 or higher indicates severe systemic disease. Steroid use was defined as regular administration of corticosteroid medications within 30 days before surgery. Functional status was defined as the ability to perform activities of daily living (ADLs) within 30 days before surgery, with the patient’s best functional status during this period recorded. Similar to how other variables were collected from the database, this information was obtained through medical record abstraction and patient interviews by trained personnel. ADLs are defined in the ACS-NSQIP as “activities usually performed in the course of a normal day in a person’s life” and include bathing, feeding, dressing, toileting, and mobility. An independent patient does not require assistance for any ADLs, a partially dependent patient requires assistance for some ADLs, and a totally dependent patient requires assistance in completing all ADLs. Partially and totally dependent patients were grouped for analysis. Information about a patient’s discharge destination (to home or a facility) was also available in the database.17
Extended Length of Stay
Extended LOS was defined as a binary variable that was positive when the postoperative LOS exceeded the 90th percentile LOS. The 90th percentile LOS was chosen as a cutoff to account for normal variations in LOS and differing practices of surgeons while still capturing patients with abnormally extended LOS.
Readmission
Readmission was defined as a binary variable that was positive when a patient had an unplanned readmission 1 or more times after the initial postoperative discharge.
Patient Demographics
Table 1 summarizes the demographics and comorbidities of the 1505 TSA patients who met our study inclusion criteria. Mean age was 72.8 years (range, 60-90 years). Mean BMI was 30.3 kg/m2 (range, 15.7-63.9 kg/m2); 46.7% of patients were classified as obese (BMI, ≥30 kg/m2). The cohort was 58.9% female. Four percent of patients underwent TSA for a fracture-associated indication.
Statistical Analyses
Statistical analyses were performed with Stata 11.2 (StataCorp). Bivariate and multivariate analyses were used to test patient characteristics for association with extended LOS and readmission. Discharge destination and LOS were included in the readmission analysis because this information would be available at time of discharge and would be useful to include in a model that predicts odds of readmission.
Final multivariate models were constructed using a backward stepwise process that initially included all potential variables and sequentially excluded variables with the highest P value until only those with P < .20 remained. Variables with .05 < P < .20 were left in the model to control for potential confounding but were not considered significantly associated with the outcome. All tests were 2-tailed, and the statistical difference was established at a 2-sided α level of 0.05 (P < .05).
Results
Median LOS after TSA was 2 days (interquartile range, 1-3 days), and extended LOS was defined as LOS of more than 3 days (90th percentile LOS). The distribution of LOS is depicted in the Figure. Results of the bivariate and multivariate analyses are reported in Table 2 and Table 3, respectively. Bivariate analysis revealed an association between extended LOS and increased age, ASA class 3 or higher, and history of diabetes, pulmonary disease, and heart disease. On multivariate analysis, extended LOS was associated with age 70 to 79 years (odds ratio [OR], 1.71; 95% confidence interval [CI], 1.01-2.95; P = .049), age 80 years or older (OR, 3.38; 95% CI, 1.94-5.91; P < .001), and history of diabetes (OR, 2.37; 95% CI, 1.53-3.66; P < .001).
Forty-nine patients (3.3%) were readmitted within the first 30 postoperative days. Bivariate analysis revealed an association between readmission and ASA class 3 or higher, history of heart disease, and history of hypertension. On multivariate analysis, readmission was associated only with history of heart disease (OR, 2.94; 95% CI, 1.45-5.96; P = .003) and history of hypertension (OR, 3.93; 95% CI, 1.40-11.04; P = .010).
Discussion
In the United States, TSA has become increasingly popular because of its favorable outcomes and continued implant development.1-5 However, there is a shortage of information about risk factors for short-term outcomes after TSA. In this study, we used multivariate analyses to identify patient-related factors associated with extended LOS and readmission after discharge. By identifying these factors, we can improve the preoperative discussion and postoperative planning for this procedure.
In the present study, extended LOS (>3 days) was found to be associated with older age and history of diabetes. The TSA literature has little information that can be used to compare these results, though age over 80 years was previously described as a risk factor for extended LOS after TSA.19 Uncontrolled diabetes has been identified as a risk factor for extended LOS in hip and knee arthroplasty,20 and management of diabetes may similarly complicate postoperative care, leading to extended LOS and increased costs in TSA patients. Patients with the identified risk factors for extended LOS should be counseled before surgery. In addition, this is important information for health care organizations and providers.
Readmission within 30 days after TSA was found to be independently associated with history of heart disease and history of hypertension. Similar to factors affecting LOS, patient-related risk factors for readmission are also poorly defined in the TSA literature. In total hip arthroplasty patients, heart disease has been found to be associated with readmission.21,22 Hypertension has also been associated with readmission for other orthopedic procedures.23 Results of the present study indicate these comorbidities may increase the risk for complications after discharge. It is important to note, however, that LOS did not correlate with readmission rates, indicating patients are likely being discharged at the most clinically appropriate time.
Waterman and colleagues11 very recently identified (in the ACS-NSQIP database) a patient population that underwent TSA between 2006 and 2011 to describe risk factors for postoperative complications within 30 days. They found that comorbid cardiac disease and older age were independently associated with mortality. Interestingly, the present study identified older age as associated with extended LOS, and cardiac disease as associated with readmission. Together with the results from the previous study, age and cardiac disease seem to be important patient factors to consider when planning TSA, as they are associated with a significantly worse postoperative course.
This study had several limitations. First, given the nature of the ACS-NSQIP database, readmissions are recorded only up to 30 days after surgery, including after discharge. Second, though the ACS-NSQIP tries to collect as many patient variables as possible, some information is not captured. Additional variables that could potentially affect LOS and readmission (eg, insurance status, hospital volume) were not available for analysis. However, we think the high-quality data collection process used by the ACS-NSQIP outweighs the lack of certain variables. Third, original operative notes are not available in the ACS-NSQIP database, and the only way to identify operative procedures is to check CPT codes. Unfortunately, CPT code 23472 is used for both TSA and reverse TSA, so these procedures could not be separated for analysis, and the results of this study can be used to comment only on the risks of both procedures. Another limitation is that there were not enough patients to further analyze the data by each indication.
Conclusion
With the increasing popularity of TSA for an expanding set of indications, it is important to understand the factors that can affect the postoperative course. In this study, we found several patient-related risk factors for extended LOS and readmission. Although the identified factors are generally not modifiable, this information can be used to better define the expectations of patients, providers, and organizations for this increasingly common procedure.
1. Kim SH, Wise BL, Zhang Y, Szabo RM. Increasing incidence of shoulder arthroplasty in the United States. J Bone Joint Surg Am. 2011;93(24):2249-2254.
2. Day JS, Lau E, Ong KL, Williams GR, Ramsey ML, Kurtz SM. Prevalence and projections of total shoulder and elbow arthroplasty in the United States to 2015. J Shoulder Elbow Surg. 2010;19(8):1115-1120.
3. Adams JE, Sperling JW, Hoskin TL, Melton LJ 3rd, Cofield RH. Shoulder arthroplasty in Olmsted County, Minnesota, 1976–2000: a population-based study. J Shoulder Elbow Surg. 2006;15(1):50-55.
4. Farmer KW, Hammond JW, Queale WS, Keyurapan E, McFarland EG. Shoulder arthroplasty versus hip and knee arthroplasties: a comparison of outcomes. Clin Orthop Relat Res. 2007;(455):183-189.
5. Chin PY, Sperling JW, Cofield RH, Schleck C. Complications of total shoulder arthroplasty: are they fewer or different? J Shoulder Elbow Surg. 2006;15(1):19-22.
6. Bohsali KI, Wirth MA, Rockwood CA Jr. Complications of total shoulder arthroplasty. J Bone Joint Surg Am. 2006;88(10):2279-2292.
7. Torchia ME, Cofield RH, Settergren CR. Total shoulder arthroplasty with the Neer prosthesis: long-term results. J Shoulder Elbow Surg. 1997;6(6):495-505.
8. Sneppen O, Fruensgaard S, Johannsen HV, Olsen BS, Søjbjerg JO, Andersen NH. Total shoulder replacement in rheumatoid arthritis: proximal migration and loosening. J Shoulder Elbow Surg. 1996;5(1):47-52.
9. Søjbjerg JO, Frich LH, Johannsen HV, Sneppen O. Late results of total shoulder replacement in patients with rheumatoid arthritis. Clin Orthop Relat Res. 1999;(366):39-45.
10. Raiss P, Bruckner T, Rickert M, Walch G. Longitudinal observational study of total shoulder replacements with cement: fifteen to twenty-year follow-up. J Bone Joint Surg Am. 2014;96(3):198-205.
11. Waterman BR, Dunn JC, Bader J, Urrea L, Schoenfeld AJ, Belmont PJ Jr. Thirty-day morbidity and mortality after elective total shoulder arthroplasty: patient-based and surgical risk factors. J Shoulder Elbow Surg. 2015;24(1):24-30.
12. Farng E, Zingmond D, Krenek L, Soohoo NF. Factors predicting complication rates after primary shoulder arthroplasty. J Shoulder Elbow Surg. 2011;20(4):557-563.
13. Streubel PN, Simone JP, Sperling JW, Cofield R. Thirty and ninety-day reoperation rates after shoulder arthroplasty. J Bone Joint Surg Am. 2014;96(3):e17.
14. Mahoney A, Bosco JA 3rd, Zuckerman JD. Readmission after shoulder arthroplasty. J Shoulder Elbow Surg. 2014;23(3):377-381.
15. Gay DM, Lyman S, Do H, Hotchkiss RN, Marx RG, Daluiski A. Indications and reoperation rates for total elbow arthroplasty: an analysis of trends in New York state. J Bone Joint Surg Am. 2012;94(2):110-117.
16. Zumstein MA, Pinedo M, Old J, Boileau P. Problems, complications, reoperations, and revisions in reverse total shoulder arthroplasty: a systematic review. J Shoulder Elbow Surg. 2011;20(1):146-157.
17. American College of Surgeons. User Guide for the 2012 ACS NSQIP Participant Use Data File. https://www.facs.org/~/media/files/quality%20programs/nsqip/ug12.ashx. Published October 2013. Accessed June 21, 2015.
18. Khuri SF, Henderson WG, Daley J, et al; Principal Investigators of Patient Safety in Surgery Study. Successful implementation of the Department of Veterans Affairs’ National Surgical Quality Improvement Program in the private sector: the Patient Safety in Surgery study. Ann Surg. 2008;248(2):329-336.
19. Ricchetti ET, Abboud JA, Kuntz AF, Ramsey ML, Glaser DL, Williams GR Jr. Total shoulder arthroplasty in older patients: increased perioperative morbidity? Clin Orthop Relat Res. 2011;469(4):1042-1049.
20. Marchant MH Jr, Viens NA, Cook C, Vail TP, Bolognesi MP. The impact of glycemic control and diabetes mellitus on perioperative outcomes after total joint arthroplasty. J Bone Joint Surg Am. 2009;91(7):1621-1629.
21. Schairer WW, Sing DC, Vail TP, Bozic KJ. Causes and frequency of unplanned hospital readmission after total hip arthroplasty. Clin Orthop Relat Res. 2014;472(2):464-470.
22. Vorhies JS, Wang Y, Herndon J, Maloney WJ, Huddleston JI. Readmission and length of stay after total hip arthroplasty in a national Medicare sample. J Arthroplasty. 2011;26(6 suppl):119-123.
23. Lovecchio F, Hsu WK, Smith TR, Cybulski G, Kim B, Kim JY. Predictors of thirty-day readmission after anterior cervical fusion. Spine. 2014;39(2):127-133.
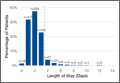
Use of a Topical Thrombin-Based Hemostatic Agent in Shoulder Arthroplasty
Shoulder arthroplasty can be associated with significant perioperative blood loss, with the overall rate of postoperative allogeneic blood transfusion ranging from 7.4% to 43%.1-6 Blood transfusions are associated with a range of health risks.7 Soft-tissue dissection and cutting and reaming of bone surfaces can be sources of significant blood loss. Directly visualized sources of bleeding can be addressed using standard surgical hemostasis, including electrocautery, suture ligation, compression, and careful avoidance of vascular structures. However, difficult-to-visualize areas and bony sources of bleeding are more difficult to manage.
Numerous products for mitigating perioperative blood loss are commercially available. Topical hemostatic agents have been used in many surgical specialties, including orthopedic surgery, cardiothoracic surgery, neurosurgery, vascular surgery, and general surgery.8-10 In orthopedic surgery, use of topical thrombin- and fibrin-based products as hemostatic agents has been studied in knee and hip arthroplasty, with varying results.11-14 Early studies have shown reduced blood loss and postoperative transfusion rates with use of a fibrin sealant or fibrin tissue adhesive,11,12,15 whereas others have shown no significant benefit of using these hemostatic agents. Massin and colleagues14 found no difference in blood loss in the setting of total knee arthroplasty (TKA) with use of a fibrin sealant. In a 2012 prospective study, Kim and colleagues13 also showed no significant reduction in blood loss in patients treated with a topical thrombin-based hemostatic agent in TKA.
Surgiflo (Ethicon) is a hemostatic matrix that is combined with a topical human thrombin solution before sterile application. The matrix consists of an absorbable porcine gelatin powder that provides a structure for platelet adhesion and aggregation.16 When used in combination with thrombin, it aids in fibrin clot formation, leading to hemostasis of oozing blood and minor bleeding from small capillaries and venules. According to the manufacturer’s data, it can halt bleeding in less than 2 minutes and retains its efficacy for up to 8 hours.
To our knowledge, there are no reports of studies on use of topical fibrin- or thrombin-based hemostatic agents in shoulder arthroplasty. We conducted a study to investigate perioperative blood loss, transfusion rates, and complications during the hospital stays of patients who underwent shoulder arthroplasty and were treated with or without the Surgiflo topical hemostatic agent. Our hypothesis was that patients intraoperatively treated with this agent would have significantly less perioperative blood loss and lower transfusion rates without increased rates of in-hospital complications.
Patients and Methods
We retrospectively reviewed data from 211 consecutive shoulder arthroplasties performed by Dr. J. Michael Wiater between December 2012 and August 2013. All primary and revision anatomical and reverse total shoulder arthroplasty (TSA) procedures were included. Patients with a preoperative diagnosis of acute fracture, and patients with a diagnosis of any type of blood diathesis, including anemia and platelet disorders that lead to excessive clotting or bleeding, were excluded. Patients treated between May 2013 and August 2013 had the hemostatic matrix applied to the soft tissues before final wound closure. Chart review for any exclusion criteria left 102 patients in the experimental (hemostatic agent) group and 98 patients in the control group.
For all patients, any anticoagulation or anti-inflammatory medication was discontinued 1 week before the elective arthroplasty. An interscalene regional block combined with general anesthesia was used in all cases. All procedures were performed through a standard anterior deltopectoral approach. Patients in the experimental group had 10 mL of the hemostatic agent topically applied to the soft tissues of the wound before closure. Half the mixture (5 mL) was applied to the deep tissues of the axillary recess, subacromial, and joint spaces, and the other half was applied superficially after closure of the deltopectoral interval. A medium Hemovac (Zimmer) drain was used in all cases, with 1 tubing placed in the deep space and another between the deltoid and the skin, both draining to a single drain evacuator.
After surgery, all patients received deep venous thrombosis (DVT) prophylaxis consisting of 5000 units of subcutaneous unfractionated heparin every 8 hours until discharge, and then aspirin 325 mg twice daily for 2 weeks after discharge unless contraindicated. Any long-term anticoagulation therapy discontinued before surgery was resumed on postoperative day 2 (POD 2). All drains were removed on POD 2 unless they had more than 50 mL of output over an 8-hour period. Complete blood cell counts were collected for all patients before surgery and on PODs 1 and 2. Whether to transfuse blood was based on clinical judgment of severe or symptomatic acute blood loss anemia; however, no strict predetermined criteria were followed.
Patient electronic medical records were reviewed for demographic information, including age, sex, height, weight, comorbidities, American Society of Anesthesiologists (ASA) physical status, and preoperative anticoagulation use. Anesthesia records were reviewed for intraoperative estimated blood loss (EBL) and intraoperative autologous blood return (Cell Saver, Haemonetics). Patient laboratory results were reviewed for preoperative and postoperative hemoglobin (Hb) and hematocrit levels. Electronic medical records were also reviewed for incidence of transfusion and any major or minor complications occurring within 90 days of the procedure. All data were collected and reviewed under the approval of the human investigations committee at our institution.
Hemoglobin loss and hidden blood loss (HBL) were calculated as described by Good and colleagues.17 Total Hb loss was estimated using the total blood volume formula described by Nadler and colleagues.18 Difference between preoperative Hb level and final Hb level recorded during hospital stay was corrected for units of blood transfused (estimate, 52 g of Hb per unit). Hemoglobin loss was then used to calculate total blood loss, and total drain output was added to total blood loss to determine HBL. These formulas were used:
Hbloss = Blood Volume (L) × [Hbinitial (g/L) – Hbfinal (g/L)] + Hbtransfused
Total Blood Loss (mL) = 1000 × Hbloss/Hbinitial
HBL (mL) = Total Blood Loss (mL) + Total Drain Output (mL)
All statistical analyses were performed using SPSS Statistics Version 20 (IBM). A Shapiro-Wilk test was used to test for normality. All variables collected were compared between the experimental and control cohorts. For continuous variables, independent t test was used to compare normal data, and the Mann-Whitney rank sum test was used for non-normal data. Categorical variables were compared with the Fisher exact test for 2×2 tables and with the χ2 test for larger tables. In all tests, P < .05 was considered statistically significant.
Results
The experimental and control cohorts were demographically similar with respect to age, sex, body mass index (BMI), ASA status, and home anticoagulation treatment (Table 1). Patients who received preoperative anticoagulation therapy were evenly distributed between the 2 patient groups (P = .745). Thirty-five patients in the experimental group and 39 in the control group were taking aspirin. In addition, in the experimental group, 5 patients were taking warfarin, 4 clopidogrel, 1 dabigatran, and 1 prasugrel. In the control group, 6 patients were taking warfarin, 3 clopidogrel, 2 dabigatran, and 1 rivaroxaban. Type of arthroplasty (primary anatomical, primary reverse, revision shoulder arthroplasty) was also evenly distributed (P = .256), and operative time did not vary significantly between cohorts (P = .518).
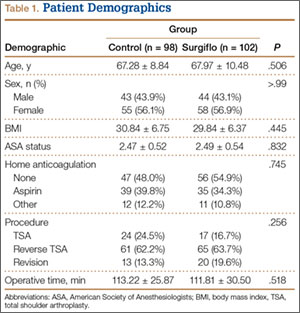
Markers of operative blood loss were also compared between patient groups (Table 2). There was no significant difference in intraoperative EBL or cell saver volume between cohorts (Ps = .301 and .800). Drain output on PODs 1 and 2 did not differ between cohorts (Ps = .789 and .777); the same was true for total postoperative drain output (P = .906). Hemoglobin levels did vary significantly between groups before surgery (P = .002) and on PODs 1 and 2 (Ps = .027 and .005), with the experimental group having a lower mean Hb level at each time point. Mean Hb loss, however, did not vary significantly (P = .253). There was also no difference in HBL between cohorts (P = .601), the calculation of which accounts for patient height and weight, Hb loss, and transfusions. The incidence of transfusion was 25% in the experimental group and 20% in the control group—not a statistically significant difference (P = .407). Mean (SD) number of transfused units of packed red blood cells was 0.54 (1.05) in the experimental group and 0.40 (0.91) in the control group—again, not a statistically significant difference (P = .377).
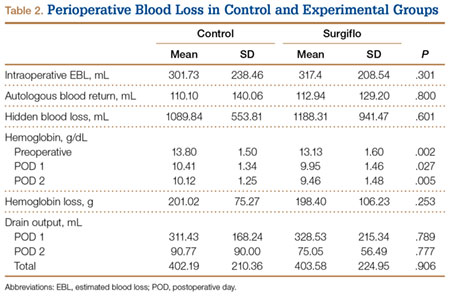
Preoperative Hb level under 13 g/dL has been reported as a risk factor for transfusion after surgery.19 To account for the significantly lower Hb level in the experimental group, we examined the incidence of transfusion in patients with preoperative Hb levels above and below this cutoff. Among patients with preoperative Hb levels under 13 g/dL, transfusion incidence was 45.8% (experimental group) and 42.9% (control group) (P > .99); among those with preoperative Hb levels above 13 g/dL, transfusion incidence was 7.7% (experimental) and 11.1% (control) (P = .760).
To account for reportedly higher blood loss and transfusion rates in revision cases,1,2,20 we stratified our data by primary and revision cases, comparing them within the entire patient cohort and comparing the experimental and control groups within these subsets. Tables 3 and 4 list the results. Revision cases had more EBL (P < .001), autologous blood return (P < .001), drain output on POD 1 (P = .025), and total drain output (P = .002). There was no significant difference in transfusion rate between primary (22.2%) and revision (27.3%) cases (P = .505) or when the experimental and control groups were compared within primary and revision subsets. Among primary cases, transfusion rates were 23% (experimental) and 21.2% (control) (P = .853); among revision cases, rates were 35% (experimental) and 15% (control) (P = .263). Revisions showed a significant (P = .043) difference in HBL between the experimental and control groups, with more blood loss in the experimental group. EBL and autologous blood return were equivocal. Hb levels and drain outputs were statistically different only for POD 2, but there was no difference between overall Hb loss or total drain outputs. Among primary cases, no parameters of blood loss were statistically significantly different. The significantly lower preoperative and postoperative Hb levels were again seen in the experimental group.
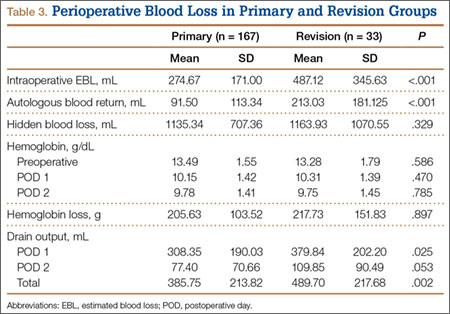
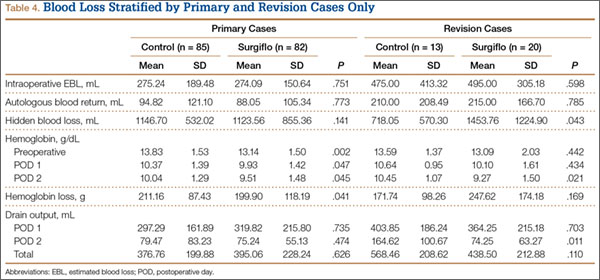
The groups’ complication rates were comparable, and there was no significant risk associated with use of the hemostatic agent (P = .764). In each group, there were no complications that would be of particular concern with use of this agent. These complications included wound complications, deep prosthesis infection, and systemic thromboembolic disease (eg, myocardial infarction, stroke, DVT, pulmonary embolus). Nine patients (5 control, 4 experimental) had minor medical complications, and 2 (1 control, 1 experimental) had major medical complications. The control group’s 5 minor medical complications were acute kidney infection treated with antibiotics (1 patient), persistent urinary retention requiring Foley catheter for short period after discharge (1), minor upper gastrointestinal bleed treated medically (1), recalcitrant tachycardia in setting of chronic atrial fibrillation (1), and vasovagal syncope with no identified cardiovascular cause or periprosthetic complication (1); the control patient with the major medical complication died 2 weeks after surgery, after discharge to the inpatient rehabilitation unit. This death was secondary to pneumonia, sepsis, and eventual multisystem organ failure. The experimental group’s 4 minor medical complications were urinary retention requiring catheterization for short period (1 patient), urinary tract infections diagnosed 2 weeks after surgery and treated with antibiotics (2), and new-onset atrial fibrillation treated medically (1); the experimental patient with the major medical complication developed Takotsubo cardiomyopathy, a nonischemic stress-induced weakening of the myocardium requiring medical management. An experimental patient also had reverse TSA shoulder dislocation 12 days after surgery—thought to be caused by inadequate soft-tissue tension and unrelated to hemostatic agent use. The patient was returned to the operating room for polyethylene liner exchange and metallic spacer implantation.
Discussion
Reported rates of transfusion after shoulder arthroplasty have ranged from 7.4% to 43%, when including revision and reverse TSAs.2,3 In the present study, the overall transfusion rate was 23% (includes patients who underwent primary or revision shoulder arthroplasties with anatomical or reverse prostheses). Although the risk for complications is low, serious issues may arise with blood transfusions. Allogeneic blood transfusions can cause fluid overload, allergic reactions, fever, acute immune hemolytic reaction, transfusion-related acute lung injury (TRALI), bloodborne infections, and formation of antibodies complicating any future need for transfusions.7 According to the National Heart, Lung, and Blood Institute, the chances of becoming infected from transfusion are 1 in 2 million for the hepatitis C and human immunodeficiency viruses and 1 in 205,000 for the hepatitis B virus.7 Some studies have also found higher rates of infection after hip or knee arthroplasty in patients who received allogeneic blood transfusions.21,22 In addition, for hospitals, transfusion costs are significant. One study showed that direct and indirect overhead costs amounted to $522 to $1183 per red blood cell unit.23 Given the risks and costs associated with blood transfusions, use of an effective intraoperative blood loss management agent could be beneficial in the setting of shoulder arthroplasty.
The use and efficacy of intraoperative blood management agents remain controversial. Numerous agents for managing perioperative blood loss are commercially available. Previous clinical studies have shown variable results with use of topical hemostatic agents, but not in the setting of shoulder arthroplasty.24 In 1999, Levy and colleagues11 showed that use of fibrin tissue adhesive reduced blood loss and postoperative transfusion rates in patients who underwent TKA. In 2001, Wang and colleagues15 showed that using a fibrin sealant in TKA reduced bloody drainage and maintained higher Hb levels. In 2003, the same group showed that use of fibrin sealant also reduced perioperative blood loss in total hip arthroplasty.12 More recent studies have had contradicting results,13,14 similar to ours. A 2012 prospective study failed to show any significant difference in blood loss after TKA in patients treated with a topical thrombin-based hemostatic agent.13 The authors did find significantly higher Hb values in the treated group on PODs 1 and 2, though the drain outputs and transfusion rates did not differ.
To our knowledge, the present study is the first to evaluate use of a topical hemostatic agent during shoulder arthroplasty. We did not find a significant difference in perioperative blood loss with application of Surgiflo, a topical thrombin-based hemostatic agent. Interestingly, we found that Hb levels both before surgery and on PODs 1 and 2 were significantly lower in the experimental group. However, the difference was about 0.7 g/dL, which would not be clinically significant. The lower Hb levels on PODs 1 and 2 likely resulted from lower preoperative levels.
Other studies have found higher transfusion rates for revision versus primary shoulder arthroplasty.1,2,20 In our series, EBL, autologous blood return, and drain output were higher overall for revision versus primary cases. When we stratified by primary and revision cases, we could not detect a difference in transfusion rates between the experimental and control groups. The lack of significant difference in the revision group could be caused by low statistical power, as the control group had only 13 revision cases. Having more patients in the study may have revealed a larger difference in blood loss with use of the hemostatic agent in revision cases.
We also found no significant increase in adverse events related to use of the hemostatic agent. Complications of particular concern would include wound complications, deep prosthesis infection, and systemic thromboembolic disease (eg, myocardial infarction, stroke, DVT, pulmonary embolus). There were no statistical differences in major and minor complications between the groups and no identifiable complications related to the hemostatic agent used.
Our results should be viewed in light of study limitations. First, with this retrospective study, we relied heavily on the accuracy of computer-based patient documentation. In addition, blood loss estimates are imperfect regardless of measurement technique. Intraoperative EBL is often determined by the surgeon and is highly variable, and autologous blood collection does not account for blood lost in operative sponges, instruments, and irrigation. To minimize this issue, we tried to assess perioperative blood loss through multiple data points, including intraoperative EBL, autologous blood returned during surgery, drain output, transfusion rates, and HBL calculations. Also, blood transfusion criteria depend on the physician’s clinical assessment and decision making, as well as patient condition, which could certainly add variability to the transfusion rate between groups. Another limitation is that the procedures studied were not homogeneous, and including primary and revision anatomical and reverse shoulder arthroplasties may have added variability to the results. In this single-surgeon study, however, we were able to ensure that the same standard techniques and hemostasis were applied in all procedures. Last, given the relatively small sample used, more patients may be needed to reveal a significant and clinically relevant difference in blood loss.
Conclusion
Perioperative blood loss poses serious risks to patient health. In light of the varying findings in the literature and the cost of transfusions and blood loss management products, use of these hemostatic agents remains controversial. In the present study, we found no significant difference in perioperative blood loss or transfusion rates with use of a hemostatic agent during shoulder arthroplasty. Therefore, we cannot conclude that this agent is effective for blood loss management in shoulder arthroplasty. Highly powered prospective studies are needed to confirm our findings.
1. Millett PJ, Porramatikul M, Chen N, Zurakowski D, Warner JJ. Analysis of transfusion predictors in shoulder arthroplasty. J Bone Joint Surg Am. 2006;88(6):1223-1230.
2. Hardy JC, Hung M, Snow BJ, et al. Blood transfusion associated with shoulder arthroplasty. J Shoulder Elbow Surg. 2013;22(2):233-239.
3. Gruson KI, Accousti KJ, Parsons BO, Pillai G, Flatow EL. Transfusion after shoulder arthroplasty: an analysis of rates and risk factors. J Shoulder Elbow Surg. 2009;18(2):225-230.
4. Schumer RA, Chae JS, Markert RJ, Sprott D, Crosby LA. Predicting transfusion in shoulder arthroplasty. J Shoulder Elbow Surg. 2010;19(1):91-96.
5. Sperling JW, Duncan SF, Cofield RH, Schleck CD, Harmsen WS. Incidence and risk factors for blood transfusion in shoulder arthroplasty. J Shoulder Elbow Surg. 2005;14(6):599-601.
6. Ahmadi S, Lawrence TM, Sahota S, et al. The incidence and risk factors for blood transfusion in revision shoulder arthroplasty: our institution’s experience and review of the literature. J Shoulder Elbow Surg. 2014;23(1):43-48.
7. National Heart, Lung, and Blood Institute. What are the risks of a blood transfusion? http://www.nhlbi.nih.gov/health/health-topics/topics/bt/risks.html. Published January 30, 2012. Accessed June 24, 2015.
8. Bracale U, Rovani M, Picardo A, et al. Beneficial effects of fibrin glue (Quixil) versus Lichtenstein conventional technique in inguinal hernia repair: a randomized clinical trial. Hernia. 2014;18(2):185-192.
9. Gazzeri R, Galarza M, Alfier A. Safety biocompatibility of gelatin hemostatic matrix (Floseal and Surgiflo) in neurosurgical procedures. Surg Technol Int. 2012;22:49-54.
10. Krishnan S, Conner TM, Leslie R, Stemkowski S, Shander A. Choice of hemostatic agent and hospital length of stay in cardiovascular surgery. Semin Cardiothorac Vasc Anesth. 2009;13(4):225-230.
11. Levy O, Martinowitz U, Oran A, Tauber C, Horoszowski H. The use of fibrin tissue adhesive to reduce blood loss and the need for blood transfusion after total knee arthroplasty. A prospective, randomized, multicenter study. J Bone Joint Surg Am. 1999;81(11):1580-1588.
12. Wang GJ, Goldthwaite CA Jr, Burks S, Crawford R, Spotnitz WD; Orthopaedic Investigators Group. Fibrin sealant reduces perioperative blood loss in total hip replacement. J Long Term Eff Med Implants. 2003;13(5):399-411.
13. Kim HJ, Fraser MR, Kahn B, Lyman S, Figgie MP. The efficacy of a thrombin-based hemostatic agent in unilateral total knee arthroplasty: a randomized controlled trial. J Bone Joint Surg Am. 2012;94(13):1160-1165.
14. Massin P, Scemama C, Jeanrot C, Boyer P. Does fibrin sealant use in total knee replacement reduce transfusion rates? A non-randomised comparative study. Orthop Traumatol Surg Res. 2012;98(2):180-185.
15. Wang GJ, Hungerford DS, Savory CG, et al. Use of fibrin sealant to reduce bloody drainage and hemoglobin loss after total knee arthroplasty: a brief note on a randomized prospective trial. J Bone Joint Surg Am. 2001;83(10):1503-1505.
16. Surgiflo Hemostatic Matrix Kit [package insert]. Somerville, NJ: Ethicon; 2012.
17. Good L, Peterson E, Lisander B. Tranexamic acid decreases external blood loss but not hidden blood loss in total knee replacement. Br J Anaesth. 2003;90(5):596-599.
18. Nadler SB, Hidalgo JH, Bloch T. Prediction of blood volume in normal human adults. Surgery. 1962;51(2):224-232.
19. Faris PM, Spence RK, Larholt KM, Sampson AR, Frei D. The predictive power of baseline hemoglobin for transfusion risk in surgery patients. Orthopedics. 1999;22(1 suppl):s135-s140.
20. Saltzman BM, Chalmers PN, Gupta AK, Romeo AA, Nicholson GP. Complication rates comparing primary with revision reverse total shoulder arthroplasty. J Shoulder Elbow Surg. 2014;23(11):1647-1654.
21. Murphy P, Heal JM, Blumberg N. Infection or suspected infection after hip replacement surgery with autologous or homologous blood transfusions. Transfusion. 1991;31(3):212-217.
22. Thomas D, Wareham K, Cohen D, Hutchings H. Autologous blood transfusion in total knee replacement surgery. Br J Anaesth. 2001;86(5):669-673.
23. Shander A, Hofmann A, Ozawa S, Theusinger OM, Gombotz H, Spahn DR. Activity-based costs of blood transfusions in surgical patients at four hospitals. Transfusion. 2010;50(4):753-765.
24. Thoms RJ, Marwin SE. The role of fibrin sealants in orthopaedic surgery. J Am Acad Orthop Surg. 2009;17(12):727-736.
Shoulder arthroplasty can be associated with significant perioperative blood loss, with the overall rate of postoperative allogeneic blood transfusion ranging from 7.4% to 43%.1-6 Blood transfusions are associated with a range of health risks.7 Soft-tissue dissection and cutting and reaming of bone surfaces can be sources of significant blood loss. Directly visualized sources of bleeding can be addressed using standard surgical hemostasis, including electrocautery, suture ligation, compression, and careful avoidance of vascular structures. However, difficult-to-visualize areas and bony sources of bleeding are more difficult to manage.
Numerous products for mitigating perioperative blood loss are commercially available. Topical hemostatic agents have been used in many surgical specialties, including orthopedic surgery, cardiothoracic surgery, neurosurgery, vascular surgery, and general surgery.8-10 In orthopedic surgery, use of topical thrombin- and fibrin-based products as hemostatic agents has been studied in knee and hip arthroplasty, with varying results.11-14 Early studies have shown reduced blood loss and postoperative transfusion rates with use of a fibrin sealant or fibrin tissue adhesive,11,12,15 whereas others have shown no significant benefit of using these hemostatic agents. Massin and colleagues14 found no difference in blood loss in the setting of total knee arthroplasty (TKA) with use of a fibrin sealant. In a 2012 prospective study, Kim and colleagues13 also showed no significant reduction in blood loss in patients treated with a topical thrombin-based hemostatic agent in TKA.
Surgiflo (Ethicon) is a hemostatic matrix that is combined with a topical human thrombin solution before sterile application. The matrix consists of an absorbable porcine gelatin powder that provides a structure for platelet adhesion and aggregation.16 When used in combination with thrombin, it aids in fibrin clot formation, leading to hemostasis of oozing blood and minor bleeding from small capillaries and venules. According to the manufacturer’s data, it can halt bleeding in less than 2 minutes and retains its efficacy for up to 8 hours.
To our knowledge, there are no reports of studies on use of topical fibrin- or thrombin-based hemostatic agents in shoulder arthroplasty. We conducted a study to investigate perioperative blood loss, transfusion rates, and complications during the hospital stays of patients who underwent shoulder arthroplasty and were treated with or without the Surgiflo topical hemostatic agent. Our hypothesis was that patients intraoperatively treated with this agent would have significantly less perioperative blood loss and lower transfusion rates without increased rates of in-hospital complications.
Patients and Methods
We retrospectively reviewed data from 211 consecutive shoulder arthroplasties performed by Dr. J. Michael Wiater between December 2012 and August 2013. All primary and revision anatomical and reverse total shoulder arthroplasty (TSA) procedures were included. Patients with a preoperative diagnosis of acute fracture, and patients with a diagnosis of any type of blood diathesis, including anemia and platelet disorders that lead to excessive clotting or bleeding, were excluded. Patients treated between May 2013 and August 2013 had the hemostatic matrix applied to the soft tissues before final wound closure. Chart review for any exclusion criteria left 102 patients in the experimental (hemostatic agent) group and 98 patients in the control group.
For all patients, any anticoagulation or anti-inflammatory medication was discontinued 1 week before the elective arthroplasty. An interscalene regional block combined with general anesthesia was used in all cases. All procedures were performed through a standard anterior deltopectoral approach. Patients in the experimental group had 10 mL of the hemostatic agent topically applied to the soft tissues of the wound before closure. Half the mixture (5 mL) was applied to the deep tissues of the axillary recess, subacromial, and joint spaces, and the other half was applied superficially after closure of the deltopectoral interval. A medium Hemovac (Zimmer) drain was used in all cases, with 1 tubing placed in the deep space and another between the deltoid and the skin, both draining to a single drain evacuator.
After surgery, all patients received deep venous thrombosis (DVT) prophylaxis consisting of 5000 units of subcutaneous unfractionated heparin every 8 hours until discharge, and then aspirin 325 mg twice daily for 2 weeks after discharge unless contraindicated. Any long-term anticoagulation therapy discontinued before surgery was resumed on postoperative day 2 (POD 2). All drains were removed on POD 2 unless they had more than 50 mL of output over an 8-hour period. Complete blood cell counts were collected for all patients before surgery and on PODs 1 and 2. Whether to transfuse blood was based on clinical judgment of severe or symptomatic acute blood loss anemia; however, no strict predetermined criteria were followed.
Patient electronic medical records were reviewed for demographic information, including age, sex, height, weight, comorbidities, American Society of Anesthesiologists (ASA) physical status, and preoperative anticoagulation use. Anesthesia records were reviewed for intraoperative estimated blood loss (EBL) and intraoperative autologous blood return (Cell Saver, Haemonetics). Patient laboratory results were reviewed for preoperative and postoperative hemoglobin (Hb) and hematocrit levels. Electronic medical records were also reviewed for incidence of transfusion and any major or minor complications occurring within 90 days of the procedure. All data were collected and reviewed under the approval of the human investigations committee at our institution.
Hemoglobin loss and hidden blood loss (HBL) were calculated as described by Good and colleagues.17 Total Hb loss was estimated using the total blood volume formula described by Nadler and colleagues.18 Difference between preoperative Hb level and final Hb level recorded during hospital stay was corrected for units of blood transfused (estimate, 52 g of Hb per unit). Hemoglobin loss was then used to calculate total blood loss, and total drain output was added to total blood loss to determine HBL. These formulas were used:
Hbloss = Blood Volume (L) × [Hbinitial (g/L) – Hbfinal (g/L)] + Hbtransfused
Total Blood Loss (mL) = 1000 × Hbloss/Hbinitial
HBL (mL) = Total Blood Loss (mL) + Total Drain Output (mL)
All statistical analyses were performed using SPSS Statistics Version 20 (IBM). A Shapiro-Wilk test was used to test for normality. All variables collected were compared between the experimental and control cohorts. For continuous variables, independent t test was used to compare normal data, and the Mann-Whitney rank sum test was used for non-normal data. Categorical variables were compared with the Fisher exact test for 2×2 tables and with the χ2 test for larger tables. In all tests, P < .05 was considered statistically significant.
Results
The experimental and control cohorts were demographically similar with respect to age, sex, body mass index (BMI), ASA status, and home anticoagulation treatment (Table 1). Patients who received preoperative anticoagulation therapy were evenly distributed between the 2 patient groups (P = .745). Thirty-five patients in the experimental group and 39 in the control group were taking aspirin. In addition, in the experimental group, 5 patients were taking warfarin, 4 clopidogrel, 1 dabigatran, and 1 prasugrel. In the control group, 6 patients were taking warfarin, 3 clopidogrel, 2 dabigatran, and 1 rivaroxaban. Type of arthroplasty (primary anatomical, primary reverse, revision shoulder arthroplasty) was also evenly distributed (P = .256), and operative time did not vary significantly between cohorts (P = .518).
Markers of operative blood loss were also compared between patient groups (Table 2). There was no significant difference in intraoperative EBL or cell saver volume between cohorts (Ps = .301 and .800). Drain output on PODs 1 and 2 did not differ between cohorts (Ps = .789 and .777); the same was true for total postoperative drain output (P = .906). Hemoglobin levels did vary significantly between groups before surgery (P = .002) and on PODs 1 and 2 (Ps = .027 and .005), with the experimental group having a lower mean Hb level at each time point. Mean Hb loss, however, did not vary significantly (P = .253). There was also no difference in HBL between cohorts (P = .601), the calculation of which accounts for patient height and weight, Hb loss, and transfusions. The incidence of transfusion was 25% in the experimental group and 20% in the control group—not a statistically significant difference (P = .407). Mean (SD) number of transfused units of packed red blood cells was 0.54 (1.05) in the experimental group and 0.40 (0.91) in the control group—again, not a statistically significant difference (P = .377).
Preoperative Hb level under 13 g/dL has been reported as a risk factor for transfusion after surgery.19 To account for the significantly lower Hb level in the experimental group, we examined the incidence of transfusion in patients with preoperative Hb levels above and below this cutoff. Among patients with preoperative Hb levels under 13 g/dL, transfusion incidence was 45.8% (experimental group) and 42.9% (control group) (P > .99); among those with preoperative Hb levels above 13 g/dL, transfusion incidence was 7.7% (experimental) and 11.1% (control) (P = .760).
To account for reportedly higher blood loss and transfusion rates in revision cases,1,2,20 we stratified our data by primary and revision cases, comparing them within the entire patient cohort and comparing the experimental and control groups within these subsets. Tables 3 and 4 list the results. Revision cases had more EBL (P < .001), autologous blood return (P < .001), drain output on POD 1 (P = .025), and total drain output (P = .002). There was no significant difference in transfusion rate between primary (22.2%) and revision (27.3%) cases (P = .505) or when the experimental and control groups were compared within primary and revision subsets. Among primary cases, transfusion rates were 23% (experimental) and 21.2% (control) (P = .853); among revision cases, rates were 35% (experimental) and 15% (control) (P = .263). Revisions showed a significant (P = .043) difference in HBL between the experimental and control groups, with more blood loss in the experimental group. EBL and autologous blood return were equivocal. Hb levels and drain outputs were statistically different only for POD 2, but there was no difference between overall Hb loss or total drain outputs. Among primary cases, no parameters of blood loss were statistically significantly different. The significantly lower preoperative and postoperative Hb levels were again seen in the experimental group.
The groups’ complication rates were comparable, and there was no significant risk associated with use of the hemostatic agent (P = .764). In each group, there were no complications that would be of particular concern with use of this agent. These complications included wound complications, deep prosthesis infection, and systemic thromboembolic disease (eg, myocardial infarction, stroke, DVT, pulmonary embolus). Nine patients (5 control, 4 experimental) had minor medical complications, and 2 (1 control, 1 experimental) had major medical complications. The control group’s 5 minor medical complications were acute kidney infection treated with antibiotics (1 patient), persistent urinary retention requiring Foley catheter for short period after discharge (1), minor upper gastrointestinal bleed treated medically (1), recalcitrant tachycardia in setting of chronic atrial fibrillation (1), and vasovagal syncope with no identified cardiovascular cause or periprosthetic complication (1); the control patient with the major medical complication died 2 weeks after surgery, after discharge to the inpatient rehabilitation unit. This death was secondary to pneumonia, sepsis, and eventual multisystem organ failure. The experimental group’s 4 minor medical complications were urinary retention requiring catheterization for short period (1 patient), urinary tract infections diagnosed 2 weeks after surgery and treated with antibiotics (2), and new-onset atrial fibrillation treated medically (1); the experimental patient with the major medical complication developed Takotsubo cardiomyopathy, a nonischemic stress-induced weakening of the myocardium requiring medical management. An experimental patient also had reverse TSA shoulder dislocation 12 days after surgery—thought to be caused by inadequate soft-tissue tension and unrelated to hemostatic agent use. The patient was returned to the operating room for polyethylene liner exchange and metallic spacer implantation.
Discussion
Reported rates of transfusion after shoulder arthroplasty have ranged from 7.4% to 43%, when including revision and reverse TSAs.2,3 In the present study, the overall transfusion rate was 23% (includes patients who underwent primary or revision shoulder arthroplasties with anatomical or reverse prostheses). Although the risk for complications is low, serious issues may arise with blood transfusions. Allogeneic blood transfusions can cause fluid overload, allergic reactions, fever, acute immune hemolytic reaction, transfusion-related acute lung injury (TRALI), bloodborne infections, and formation of antibodies complicating any future need for transfusions.7 According to the National Heart, Lung, and Blood Institute, the chances of becoming infected from transfusion are 1 in 2 million for the hepatitis C and human immunodeficiency viruses and 1 in 205,000 for the hepatitis B virus.7 Some studies have also found higher rates of infection after hip or knee arthroplasty in patients who received allogeneic blood transfusions.21,22 In addition, for hospitals, transfusion costs are significant. One study showed that direct and indirect overhead costs amounted to $522 to $1183 per red blood cell unit.23 Given the risks and costs associated with blood transfusions, use of an effective intraoperative blood loss management agent could be beneficial in the setting of shoulder arthroplasty.
The use and efficacy of intraoperative blood management agents remain controversial. Numerous agents for managing perioperative blood loss are commercially available. Previous clinical studies have shown variable results with use of topical hemostatic agents, but not in the setting of shoulder arthroplasty.24 In 1999, Levy and colleagues11 showed that use of fibrin tissue adhesive reduced blood loss and postoperative transfusion rates in patients who underwent TKA. In 2001, Wang and colleagues15 showed that using a fibrin sealant in TKA reduced bloody drainage and maintained higher Hb levels. In 2003, the same group showed that use of fibrin sealant also reduced perioperative blood loss in total hip arthroplasty.12 More recent studies have had contradicting results,13,14 similar to ours. A 2012 prospective study failed to show any significant difference in blood loss after TKA in patients treated with a topical thrombin-based hemostatic agent.13 The authors did find significantly higher Hb values in the treated group on PODs 1 and 2, though the drain outputs and transfusion rates did not differ.
To our knowledge, the present study is the first to evaluate use of a topical hemostatic agent during shoulder arthroplasty. We did not find a significant difference in perioperative blood loss with application of Surgiflo, a topical thrombin-based hemostatic agent. Interestingly, we found that Hb levels both before surgery and on PODs 1 and 2 were significantly lower in the experimental group. However, the difference was about 0.7 g/dL, which would not be clinically significant. The lower Hb levels on PODs 1 and 2 likely resulted from lower preoperative levels.
Other studies have found higher transfusion rates for revision versus primary shoulder arthroplasty.1,2,20 In our series, EBL, autologous blood return, and drain output were higher overall for revision versus primary cases. When we stratified by primary and revision cases, we could not detect a difference in transfusion rates between the experimental and control groups. The lack of significant difference in the revision group could be caused by low statistical power, as the control group had only 13 revision cases. Having more patients in the study may have revealed a larger difference in blood loss with use of the hemostatic agent in revision cases.
We also found no significant increase in adverse events related to use of the hemostatic agent. Complications of particular concern would include wound complications, deep prosthesis infection, and systemic thromboembolic disease (eg, myocardial infarction, stroke, DVT, pulmonary embolus). There were no statistical differences in major and minor complications between the groups and no identifiable complications related to the hemostatic agent used.
Our results should be viewed in light of study limitations. First, with this retrospective study, we relied heavily on the accuracy of computer-based patient documentation. In addition, blood loss estimates are imperfect regardless of measurement technique. Intraoperative EBL is often determined by the surgeon and is highly variable, and autologous blood collection does not account for blood lost in operative sponges, instruments, and irrigation. To minimize this issue, we tried to assess perioperative blood loss through multiple data points, including intraoperative EBL, autologous blood returned during surgery, drain output, transfusion rates, and HBL calculations. Also, blood transfusion criteria depend on the physician’s clinical assessment and decision making, as well as patient condition, which could certainly add variability to the transfusion rate between groups. Another limitation is that the procedures studied were not homogeneous, and including primary and revision anatomical and reverse shoulder arthroplasties may have added variability to the results. In this single-surgeon study, however, we were able to ensure that the same standard techniques and hemostasis were applied in all procedures. Last, given the relatively small sample used, more patients may be needed to reveal a significant and clinically relevant difference in blood loss.
Conclusion
Perioperative blood loss poses serious risks to patient health. In light of the varying findings in the literature and the cost of transfusions and blood loss management products, use of these hemostatic agents remains controversial. In the present study, we found no significant difference in perioperative blood loss or transfusion rates with use of a hemostatic agent during shoulder arthroplasty. Therefore, we cannot conclude that this agent is effective for blood loss management in shoulder arthroplasty. Highly powered prospective studies are needed to confirm our findings.
1. Millett PJ, Porramatikul M, Chen N, Zurakowski D, Warner JJ. Analysis of transfusion predictors in shoulder arthroplasty. J Bone Joint Surg Am. 2006;88(6):1223-1230.
2. Hardy JC, Hung M, Snow BJ, et al. Blood transfusion associated with shoulder arthroplasty. J Shoulder Elbow Surg. 2013;22(2):233-239.
3. Gruson KI, Accousti KJ, Parsons BO, Pillai G, Flatow EL. Transfusion after shoulder arthroplasty: an analysis of rates and risk factors. J Shoulder Elbow Surg. 2009;18(2):225-230.
4. Schumer RA, Chae JS, Markert RJ, Sprott D, Crosby LA. Predicting transfusion in shoulder arthroplasty. J Shoulder Elbow Surg. 2010;19(1):91-96.
5. Sperling JW, Duncan SF, Cofield RH, Schleck CD, Harmsen WS. Incidence and risk factors for blood transfusion in shoulder arthroplasty. J Shoulder Elbow Surg. 2005;14(6):599-601.
6. Ahmadi S, Lawrence TM, Sahota S, et al. The incidence and risk factors for blood transfusion in revision shoulder arthroplasty: our institution’s experience and review of the literature. J Shoulder Elbow Surg. 2014;23(1):43-48.
7. National Heart, Lung, and Blood Institute. What are the risks of a blood transfusion? http://www.nhlbi.nih.gov/health/health-topics/topics/bt/risks.html. Published January 30, 2012. Accessed June 24, 2015.
8. Bracale U, Rovani M, Picardo A, et al. Beneficial effects of fibrin glue (Quixil) versus Lichtenstein conventional technique in inguinal hernia repair: a randomized clinical trial. Hernia. 2014;18(2):185-192.
9. Gazzeri R, Galarza M, Alfier A. Safety biocompatibility of gelatin hemostatic matrix (Floseal and Surgiflo) in neurosurgical procedures. Surg Technol Int. 2012;22:49-54.
10. Krishnan S, Conner TM, Leslie R, Stemkowski S, Shander A. Choice of hemostatic agent and hospital length of stay in cardiovascular surgery. Semin Cardiothorac Vasc Anesth. 2009;13(4):225-230.
11. Levy O, Martinowitz U, Oran A, Tauber C, Horoszowski H. The use of fibrin tissue adhesive to reduce blood loss and the need for blood transfusion after total knee arthroplasty. A prospective, randomized, multicenter study. J Bone Joint Surg Am. 1999;81(11):1580-1588.
12. Wang GJ, Goldthwaite CA Jr, Burks S, Crawford R, Spotnitz WD; Orthopaedic Investigators Group. Fibrin sealant reduces perioperative blood loss in total hip replacement. J Long Term Eff Med Implants. 2003;13(5):399-411.
13. Kim HJ, Fraser MR, Kahn B, Lyman S, Figgie MP. The efficacy of a thrombin-based hemostatic agent in unilateral total knee arthroplasty: a randomized controlled trial. J Bone Joint Surg Am. 2012;94(13):1160-1165.
14. Massin P, Scemama C, Jeanrot C, Boyer P. Does fibrin sealant use in total knee replacement reduce transfusion rates? A non-randomised comparative study. Orthop Traumatol Surg Res. 2012;98(2):180-185.
15. Wang GJ, Hungerford DS, Savory CG, et al. Use of fibrin sealant to reduce bloody drainage and hemoglobin loss after total knee arthroplasty: a brief note on a randomized prospective trial. J Bone Joint Surg Am. 2001;83(10):1503-1505.
16. Surgiflo Hemostatic Matrix Kit [package insert]. Somerville, NJ: Ethicon; 2012.
17. Good L, Peterson E, Lisander B. Tranexamic acid decreases external blood loss but not hidden blood loss in total knee replacement. Br J Anaesth. 2003;90(5):596-599.
18. Nadler SB, Hidalgo JH, Bloch T. Prediction of blood volume in normal human adults. Surgery. 1962;51(2):224-232.
19. Faris PM, Spence RK, Larholt KM, Sampson AR, Frei D. The predictive power of baseline hemoglobin for transfusion risk in surgery patients. Orthopedics. 1999;22(1 suppl):s135-s140.
20. Saltzman BM, Chalmers PN, Gupta AK, Romeo AA, Nicholson GP. Complication rates comparing primary with revision reverse total shoulder arthroplasty. J Shoulder Elbow Surg. 2014;23(11):1647-1654.
21. Murphy P, Heal JM, Blumberg N. Infection or suspected infection after hip replacement surgery with autologous or homologous blood transfusions. Transfusion. 1991;31(3):212-217.
22. Thomas D, Wareham K, Cohen D, Hutchings H. Autologous blood transfusion in total knee replacement surgery. Br J Anaesth. 2001;86(5):669-673.
23. Shander A, Hofmann A, Ozawa S, Theusinger OM, Gombotz H, Spahn DR. Activity-based costs of blood transfusions in surgical patients at four hospitals. Transfusion. 2010;50(4):753-765.
24. Thoms RJ, Marwin SE. The role of fibrin sealants in orthopaedic surgery. J Am Acad Orthop Surg. 2009;17(12):727-736.
Evidence‐Based Care for Cellulitis
Cellulitis is a common infection causing inflammation of the skin and subcutaneous tissues. Cellulitis has been attributed to gram‐positive organisms through historical evaluations including fine‐needle aspirates and punch biopsies of the infected tissue.[1] Neither of these diagnostic tests is currently used due to their invasiveness, poor diagnostic yield, and availability. Similarly, readily available tests such as blood cultures provide an etiology <5% of the time[1] and are not cost‐effective for most patients for diagnosing cellulitis.[2] In addition, the prevalence of methicillin‐resistant Staphylococcus aureus (MRSA) has steadily increased, complicating decisions about antibiotic selection.[3] The result of this uncertainty is a large variation in practice with respect to antibiotic and imaging selection for patients with a diagnosis of cellulitis.
University of Utah Health Care (UUHC) performed benchmarking for the management of cellulitis using the University HealthSystem Consortium (UHC) database and associated CareFx analytics tool. Benchmarking demonstrated that UUHC had a greater percentage of broad‐spectrum antibiotic use (defined as vancomycin, piperacillin/tazobactam, or carbapenems) than the top 5 performing UHC facilities for International Classification of Diseases, Ninth Revision, Clinical Modification (ICD‐9‐CM) diagnoses of cellulitis (vancomycin 83% vs 58% and carbapenem or piperacillin/tazobactam 44% vs 16%). Advanced imaging (computed tomography [CT] or magnetic resonance imaging [MRI]) for the diagnosis of cellulitis was also found to be an opportunity for improvement (CT 27% vs 20% and MRI 8% vs 5%). The hospitalist group (most patients admitted with cellulitis were on this service) believed these data reflected current practice, as there was no standard of treatment for cellulitis despite an active order set. Therefore, cellulitis was considered an opportunity to improve value to our patients. A standardized clinical care pathway was created, as such pathways have demonstrated a reduction in variation in practice and improved efficiency and effectiveness of care for multiple disease states including cellulitis.[4, 5] We hypothesized that implementation of an evidence‐based care pathway would decrease broad‐spectrum antibiotic use, cost, and use of advanced imaging without having any adverse effects on clinical outcomes such as length of stay (LOS) or readmission.
METHODS
Study Setting and Population
UUHC is a 500‐bed academic medical center in Salt Lake City, Utah. All patients admitted to the emergency department observation unit (EDOU) or the hospital with a primary ICD‐9‐CM diagnosis of cellulitis between July 1, 2011 and December 31, 2013 were evaluated.
Intervention
Initial steps involved the formation of a multidisciplinary team including key stakeholders from the hospitalist group, infectious diseases, the emergency department (ED), and nursing. This multidisciplinary team was charged with developing a clinical care pathway appropriate for local implementation. National guidance for the care pathway was mainly obtained from the Infectious Disease Society of America (IDSA) guidelines on skin and soft tissue infections (SSTIs)[6] and MRSA.[7] Specific attention was paid to recommendations on blood cultures (only when systemically ill), imaging (rarely needed), antibiotic selection (rarely gram‐negative coverage and consideration of MRSA coverage), and patient‐care principles that are often overlooked (elevation of the affected extremity). A distinction of purulent versus nonpurulent cellulitis was adopted based on the guidelines and a prospective evaluation of the care of patients with nonpurulent cellulitis.[8] The 2014 IDSA update on SSTIs incorporates this distinction more clearly in hopes of determining staphylococcal versus streptococcal infections.[9] After multiple iterations, an agreed‐upon care pathway was created that excluded patients with neutropenia, osteomyelitis, diabetic foot ulcerations; hand, perineal, periorbital, or surgical site infections; and human or animal bites (Figure 1). After the care pathway was determined, interventions were performed to implement this change.
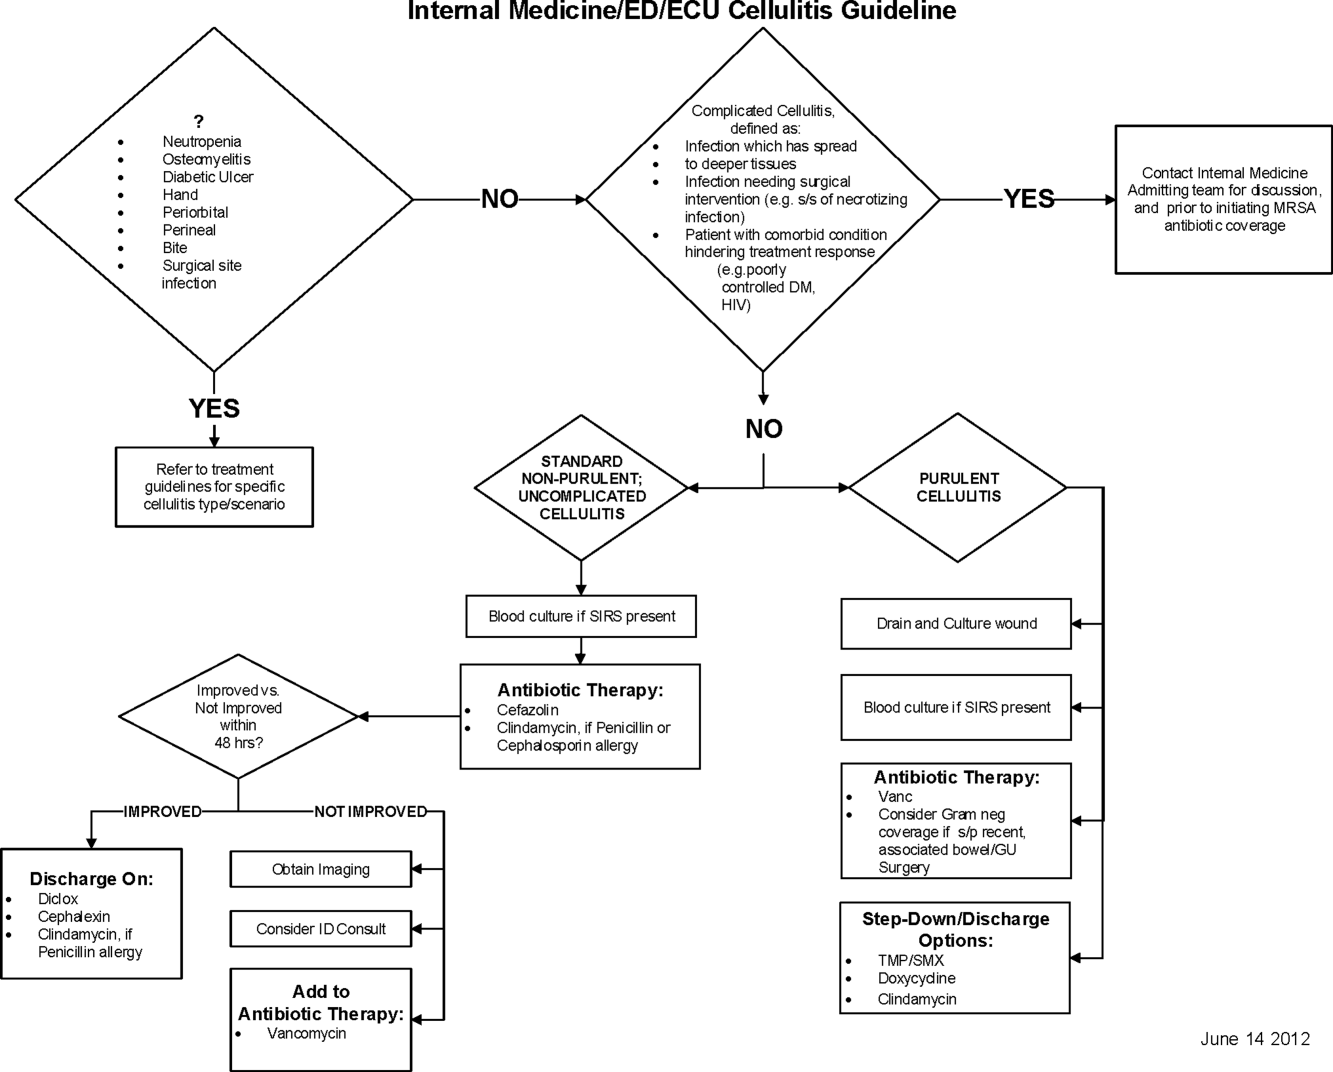
Education of all providers involved included discussion of cellulitis as a disease process, presentation of benchmarking data, dissemination of the care pathway to hospitalist and ED physicians, teaching conferences for internal medicine residents and ED residents, and reinforcement of these concepts at the beginning of resident rotations.
Incorporation of the care pathway into the existing electronic order sets for cellulitis care in the inpatient and ED settings, with links to the care pathway, links to excluded disease processes (eg, hand cellulitis), preselection of commonly needed items (eg, elevate leg), and recommendations for antibiotic selection based on categories of purulent or nonpurulent cellulitis. The electronic health record (EHR) did not allow for forced order set usage, so the order set required selection by the admitting physician if indicated. Additionally, an embedded 48‐hour order set could be accessed at any time by the ordering physician and included vancomycin dosing. Specific changes to the preexisting order set included the development of sections for purulent and nonpurulent cellulitis as well as recommended antibiotics. Piperacillin/tazobactam and nafcillin were both removed and vancomycin was limited to the purulent subheading. Additionally, elevation of the extremity was preselected, and orderables for imaging (chest x‐ray and duplex ultrasound), antiulcer prophylaxis, telemetry, and electrocardiograph were all removed.
Audit and feedback of cases of cellulitis and broad‐spectrum antibiotic usage was performed by a senior hospitalist.
Study Design
A retrospective before/after study was performed to assess overall impact of the intervention on the patient population. Additionally, a retrospective controlled pre‐/postintervention study was performed to compare changes in cellulitis management for visits where order sets were used with visits where order sets were not used. The intervention initiation date was July 9, 2012. The institutional review board classified this project as quality improvement and did not require review and oversight.
Study Population
We analyzed 2278 ED and inpatient visits for cellulitis, of which 677 met inclusion criteria. We partitioned visits into 2 groups: (1) those for which order sets were used (n = 370) and (2) control visits for which order sets were not used (n = 307). We analyzed outcomes for 2 subpopulations: hospitalized patients for whom the EDOU or admission order sets were used (n = 149) and patients not admitted and only seen in the EDOU for whom the EDOU order set was used (n = 262).
Inclusion Criteria
Inclusion criteria included hospital admission or admission to the EDOU between July 1, 2011 and December 31, 2013, age greater or equal to 18 years, and primary diagnosis of cellulitis as determined by ICD‐9‐CM billing codes 035, 457.2, 681, 681.0, 681.00, 681.01, 681.02, 681.1, 681.10, 681.11, 681.9, 680, 680.0‐9, 682.0‐9, 684, 685.0, 685.1, 686.00, 686.01, 686.09, 686.1, 686.8, 686.9, 910.1, 910.5, 910.7, 910.9, 911.1, 911.3, 911.5, 911.7, 911.9, 912.1, 912.3, 912.5, 912.7, 912.9, 913.1, 913.3, 913.5, 913.7, 913.9, 914.1, 914.3, 914.5, 914.7, 914.9, 915.1, 915.3, 915.5, 915.7, 915.9, 916.1, 916.3, 916.5, 916.7, 916.9, 917.1, 917.3, 917.5, 917.7, 917.9, 919.1, 919.3, 919.5, 919.7, or 919.9.
Data Collection and Preparation
Clinical data were collected in the inpatient EHR (Cerner Corp., Kansas City, MO) and later imported into the enterprise data warehouse (EDW) as part of the normal data flow. Billing data were imported into the EDW from the billing system. Cost data were estimated using the value‐driven outcomes (VDO) tool developed by the University of Utah to identify clinical costs to the UUHC system.[10] All data were extracted from the EDW on September 10, 2014.
Process Metrics, Clinical, and Cost Outcomes
We defined 1 primary outcome (use of broad‐spectrum antibiotics) and 8 secondary outcomes, including process metrics (MRI and CT orders), clinical outcomes (LOS and 30‐day readmissions), and cost outcomes (pharmacy, lab, imaging cost from radiology department, and total facility cost). Broad‐spectrum antibiotics were defined as any use of meropenem (UUHC's carbapenem), piperacillin/tazobactam, or vancomycin and were determined by orders. Thirty‐day readmissions included only inpatient encounters with the primary diagnosis of cellulitis.
Covariates
To control for patient demographics we included age at admission in years and gender into the statistical model. To control for background health state as well as cellulitis severity, we included Charlson Comorbidity Index (CCI) and hospitalization status. CCI was calculated according to the algorithm specified by Quan et al.[11]
Study Hypotheses
First, for all patients, we hypothesized that process metrics as well as clinical and cost outcomes would improve following the implementation of the care pathway. To evaluate this hypothesis, we estimated impact of the time interval (pre‐/postintervention) on all outcomes. Second, we hypothesized that among patients for whom order sets were used (which we deemed to be a proxy for following the agreed‐upon care pathway), there would be a greater improvement than in patients for whom order sets were not used. To evaluate this hypothesis, we estimated interactions between order set use and time period (pre‐/postintervention) for all outcomes.
Statistical Analysis
The variable time period was created to represent the time period before and after the intervention.
We provided unadjusted descriptive statistics for study outcomes and visit characteristics for all patients before and after intervention. Descriptive statistics were expressed as n (%) and mean standard deviation. Simple comparisons were performed based on 2 test of homogeneity for categorical variables and t test or Wilcoxon test for continuous variables.
For before/after analysis, we fitted generalized linear regression models to estimate the change in outcomes of interest before and after intervention for all patients simultaneously. Generalized linear model defined by a binomial distributional assumption and logit link function was used to estimate the effect of the intervention on antibiotic use, imaging orders, and readmission adjusting for effects of age, gender, CCI, and hospitalization status. A generalized linear model defined by a gamma distributional assumption and log link function was used to estimate effect of the intervention on clinical LOS and cost outcomes adjusting for the effects of the same covariates. Generalized linear models with gamma distributional assumptions were used because they are known to perform well even for zero‐inflated semicontinuous cost variables and are easier to interpret than 2‐part models.
For the controlled before/after analysis, the variable order set used was created to represent groups where order sets were used or not used. Similarly, generalized linear models were used to estimate differential effect of the intervention at 2 different order set use levels using an interaction term between order set use and the time period.
P values <0.05 were considered significant. We used SAS version 9.3 statistical software (SAS Institute Inc., Cary, NC) for data analysis.
RESULTS
Descriptive Characteristics
Patient characteristics before and after intervention for 677 EDOU and inpatient visits for cellulitis by 618 patients are summarized in the first 4 columns of Table 1. Patient age at admission ranged from 18 to 98 years. Thirty‐eight percent of visits were by female patients. There were 274 visits before the intervention and 403 visits after. Four hundred thirty‐two (64%) were admitted, and 295 (44%) were seen in the EDOU. The admission order set alone was used for 104 visits, the EDOU order set alone was used for 242 visits, and both order sets were used for 24 visits.
| Characteristic | Overall | Order Sets Not Used | Order Sets Used | ||||||
|---|---|---|---|---|---|---|---|---|---|
| Baseline, N = 274 | Intervention, N = 403 | P* | Baseline, N = 127 | Intervention, N = 180 | P* | Baseline, N = 147 | Intervention, N = 223 | P* | |
| |||||||||
| Patient Characteristics | |||||||||
| Age, y | 46.8 16.0 | 48.9 17.1 | 0.097 | 49.8 16.0 | 5.1 16.3 | 0.88 | 44.2 15.5 | 48.0 17.6 | 0.032 |
| Female gender | 105 (38%) | 155 (39%) | 0.93 | 50 (39%) | 74 (41%) | 0.73 | 55 (37%) | 81 (36%) | 0.86 |
| CCI | 2.6 3.2 | 2.6 3.0 | 0.69 | 3.2 3.5 | 3.2 3.2 | 0.82 | 2.0 2.8 | 2.1 2.7 | 0.68 |
| Clinical process characteristics | |||||||||
| EDOU admission | 122 (45%) | 173 (43%) | 0.68 | 12 (9%) | 19 (11%) | 0.75 | 110 (75%) | 154 (69%) | 0.23 |
| Hospital admission | 173 (63%) | 259 (64%) | 0.76 | 117 (92%) | 166 (92%) | 0.98 | 56 (38%) | 93 (42%) | 0.49 |
| EDOU order set used | 111 (41%) | 155 (38%) | 0.59 | NA | NA | NA | 111 (76%) | 155 (70%) | 0.21 |
| ADM order set used | 47 (17%) | 81 (20%) | 0.34 | NA | NA | NA | 47 (32%) | 81 (36%) | 0.39 |
| Process outcomes | |||||||||
| Broad‐spectrum antibiotics used | 205 (75%) | 230 (57%) | <0.001 | 90 (71%) | 121 (67%) | 0.50 | 115 (78%) | 109 (49%) | <0.001 |
| MRI done | 27 (10%) | 32 (8%) | 0.39 | 13 (10%) | 20 (11%) | 0.81 | 14 (10%) | 12 (5%) | 0.13 |
| CT done | 56 (20%) | 76 (19%) | 0.61 | 32 (25%) | 43 (24%) | 0.79 | 24 (16%) | 33 (15%) | 0.69 |
| Clinical outcomes | |||||||||
| Length of stay, d | 2.7 2.6 | 2.6 2.8 | 0.35 | 3.6 2.8 | 3.8 3.4 | 0.62 | 2.0 2.1 | 1.7 1.6 | 0.48 |
| 30‐day readmission | 14 (5%) | 17 (4%) | 0.59 | 7 (6%) | 9 (5%) | 0.84 | 7 (5%) | 8 (4%) | 0.58 |
| Cost outcomes | |||||||||
| Pharmacy cost ($) | 1 | 0.76 | 0.002 | 1 | 0.89 | 0.13 | 1 | 0.56 | 0.004 |
| Lab cost ($) | 1 | 0.52 | <0.001 | 1 | 0.53 | 0.001 | 1 | 0.51 | 0.055 |
| Imaging cost ($) | 1 | 0.82 | 0.11 | 1 | 0.95 | 0.52 | 1 | 0.67 | 0.13 |
| Total facility cost ($) | 1 | 0.85 | 0.027 | 1 | 0.91 | 0.042 | 1 | 0.77 | 0.26 |
Before/After Analysis
Among all patients, use of broad‐spectrum antibiotics decreased from 75% to 57% (Table 1). Analysis adjusted for gender, age at admission, CCI, and hospital admission status is provided in Table 2. Overall, there was a 59% decrease in the odds of ordering broad‐spectrum antibiotics (P < 0.001), a 23% decrease in pharmacy cost (P = 0.002), a 44% decrease in laboratory cost (P < 0.001), and a 13% decrease in total facility cost (P = 0.006).
| Logistic Regression | ||||
|---|---|---|---|---|
| Outcome Variables | Selected Predictor Variables | Odds* | Percent Change | P |
| Gamma Regression | ||||
| Outcome Variables | Selected Predictor Variables | Fold Change* | Percent Change | P |
| ||||
| Antibiotics used | Time period | 0.41 (0.29, 0.59) | 59% (71% to 41%) | <0.001 |
| MRI done | Time period | 0.74 (0.43, 1.30) | 26% (57% to 30%) | 0.29 |
| CT done | Time period | 0.92 (0.62, 1.36) | 8% (38% to 36%) | 0.67 |
| 30‐day readmission | Time period | 0.86 (0.41, 1.80) | 14% (59% to 80%) | 0.69 |
| Length of stay, d | Time period | 0.97 (0.91, 1.03) | 3% (9% to 3%) | 0.34 |
| Pharmacy cost ($) | Time period | 0.77 (0.65, 0.91) | 23% (35% to 9%) | 0.002 |
| Lab cost ($) | Time period | 0.56 (0.48, 0.65) | 44% (52% to 35%) | <0.001 |
| Imaging cost($) | Time period | 0.90 (0.71, 1.14) | 10% (29% to 14%) | 0.38 |
| Total facility cost ($) | Time Period | 0.87 (0.79, 0.96) | 13% (21% to 4%) | 0.006 |
Order Set Use Groups Analysis
Descriptive statistics and simple comparison before/after the intervention for the 2 study groups are shown in the last 6 columns of Table 1. Among patients for whom order sets were used, broad‐spectrum antibiotic usage significantly decreased from 78% before the intervention to 49% after the intervention (P < 0.001). In contrast, among patients for whom order sets were not used, broad‐spectrum antibiotic usage remained relatively constant71% before the intervention versus 67% after the intervention (P = 0.50). Figure 2 shows semiannual changes in the prescription of broad‐spectrum antibiotics. There is a noticeable drop after the intervention among patients for whom order sets were used.
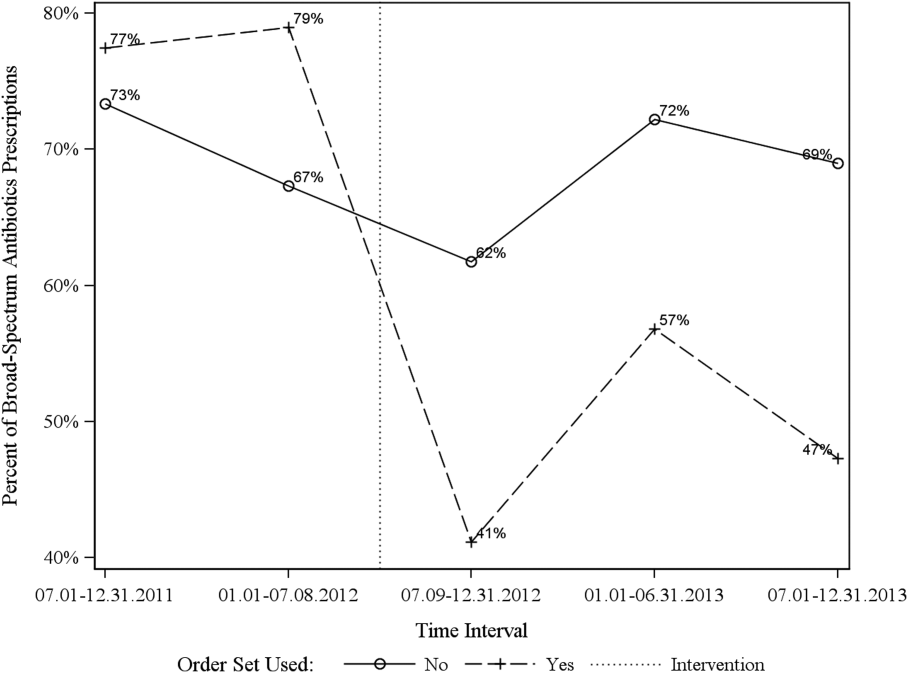
Analysis of the interaction between time period and order set usage is provided in Table 3. After the intervention, patients for whom the order sets were used had greater improvement in broad‐spectrum antibiotic selection (75% decrease, P < 0.001) and LOS (25% decrease, P = 0.041) than patients for whom order sets were not used. Pharmacy costs also decreased by 13% more among patients for whom the order sets were used, although the interaction was not statistically significant (P = 0.074). Laboratory costs decreased in both groups, but order set use did not demonstrate an interaction (P = 0.5). Similar results were found for the subgroups of admitted patients and patients seen in the EDOU.
| Logistic Regression | ||||
|---|---|---|---|---|
| Outcome Variables | Selected Predictor Variables | Odds* | Percent Change | P |
| Gamma Regression | ||||
| Outcome Variables | Selected Predictor Variables | Fold Change* | Percent Change | P |
| ||||
| Broad spectrum antibiotics | Time period | 0.84 (0.50, 1.40) | 16% (50% to 40%) | 0.50 |
| Time periodorder set | 0.25 (0.12, 0.52) | 75% (88% to 48%) | <0.001 | |
| MRI done | Time period | 1.04 (0.49, 2.20) | 4% (51% to 120%) | 0.92 |
| Time periodorder set | 0.44 (0.14, 1.38) | 56% (86% to 38%) | 0.16 | |
| CT done | Time period | 0.94 (0.55, 1.60) | 6% (45% to 60%) | 0.81 |
| Time periodorder set | 0.96 (0.44, 2.12) | 4% (56% to 112%) | 0.93 | |
| 30‐day readmission | Time period | 0.91 (0.33, 2.53) | 9% (67% to 153%) | 0.86 |
| Time periodorder set | 0.88 (0.20, 3.93) | 12% (80% to 293%) | 0.87 | |
| Clinical length of stay | Time period | 1.04 (0.95, 1.14) | 4% (5% to 14%) | 0.41 |
| Time periodorder set | 0.87 (0.77, 0.99) | 13% (23% to 1%) | 0.041 | |
| Pharmacy cost ($) | Time period | 0.88 (0.70, 1.12) | 12% (30% to 12%) | 0.31 |
| Time periodorder set | 0.75 (0.54, 1.03) | 25% (46% to 3%) | 0.074 | |
| Lab cost ($) | Time period | 0.53 (0.42, 0.66) | 47% (58% to 34%) | <0.001 |
| Time periodorder set | 1.11 (0.82, 1.50) | 11% (18% to 50%) | 0.50 | |
| Imaging cost ($) | Time period | 1.00 (0.71, 1.40) | 0% (29% to 40%) | 0.98 |
| Time periodorder set | 0.82 (0.51, 1.30) | 18% (49% to 30%) | 0.39 | |
| Facility cost ($) | Time period | 0.92 (0.80, 1.05) | 8% (20% to 5%) | 0.22 |
| Time periodorder set | 0.90 (0.75, 1.09) | 10% (25% to 9%) | 0.29 | |
Audit and feedback was initially performed for cases of cellulitis using broad‐spectrum antibiotics. However, given the complexity of cellulitis as a disease process and the frequency of broad‐spectrum antibiotic usage, in all cases of review, it was deemed reasonable to use broad‐spectrum antibiotics. Therefore, the audit was not continued.
DISCUSSION
Care pathways have demonstrated improvement across multiple different disease states including cellulitis.[4, 5] They have been noted to reduce variation in practice and improve physician agreement about treatment options.[4] The best method for implementation is not clearly understood,[12] and there remains concern about maintaining flexibility for patient care.[13] Additionally, although implementation of pathways is often well described, evaluations of the processes are noted to frequently be weak.[12] UUHC felt that the literature supported implementing a care pathway for the diagnosis of cellulitis, but that a thorough evaluation was also needed to understand any resulting benefits or harms. Through this study, we found that the implementation of this pathway resulted in a significant decrease in broad‐spectrum antibiotic use, pharmacy costs, and total facility costs. There was also a trend to decrease in imaging cost, and there were no adverse effects on LOS or 30‐day readmissions. Our findings demonstrate that care‐pathway implementation accompanied by education, pathway‐compliant electronic order sets, and audit and feedback can help drive improvements in quality while reducing costs. This finding furthers the evidence supporting standard work through the creation of clinical care pathways for cellulitis as an effective intervention.[4] Additionally, although not measured in this study, reduction of antibiotic use is supported as a measure to help reduce Clostridium difficile infections, a further potential benefit.[14]
This study has several important strengths. First, we included accurate cost analyses using the VDO tool. Given the increasing importance of improving care value, we feel the inclusion of such cost analysis is an increasingly important aspect of health service intervention evaluations. Second, we used a formal benchmarking approach to identify a priority care improvement area and to monitor changes in practice following the rollout of the intervention. We feel this approach provides a useful example on how to systematically improve care quality and value in a broader health system context. Third, we evaluated not order set implementation per se, but rather changing an existing order set. Because studies in this area generally focus on initial order set implementation, our study contributes insights on what can be expected through modifications of existing order sets based on care pathways. Fourth, the analysis accounted for a variety of variables including the CCI. Of interest, our study found that the intervention group (patients for whom order sets were used) had a lower CCI, confirming Allen et al.'s findings that diseases with predictable trajectories are the most likely to benefit from care pathways.[4] As a final strength, the narrative‐based order set intervention was relatively simple, and the inclusion criteria were broad, making the process generalizable.
Limitations of this study include that it was a single center pre‐/postintervention study and not a randomized controlled trial. Related to this limitation, the control group for which order sets were not used reflected a different patient population compared to the intervention group for which order sets were used. Specifically, it was more common for order sets to be used in the EDOU than upon admission, resulting in the order set group consisting of patients with less comorbidities than patients in the nonorder set group. Additionally, patients in the order set intervention group were older than in the baseline group (48.0 vs 44.2 years). However, these differences in population remained relatively stable before and after the intervention, and relevant variables including demographic factors and CCI were accounted for in the regression models. Nevertheless, it remains possible that secular trends existed that we did not capture that affected the 2 populations differently. For example, there was a separate project that overlapped with the intervention period to reduce unnecessary laboratory usage at UUHC. This intervention could have influenced the trend to decreased laboratory utilization in the postintervention period. However, there were no concurrent initiatives to reduce antibiotic use during the study period. As a final limitation, the statistical analyses have not corrected for multiple testing for the secondary outcomes.
CONCLUSION
Using benchmark data from UHC, an academic medical center was able to identify an opportunity for improving the care of patients with cellulitis and subsequently develop an evidence‐based care pathway. The implementation of this pathway correlated with a significant reduction of broad‐spectrum antibiotic use, pharmacy costs, and total facility costs without adverse clinical affects. An important factor in the success of the intervention was the use of electronic order sets for cellulitis, which provided support for the implementation of the care pathway. This study demonstrates that the intervention was not only effective overall, but that it was more effective for those patients for whom the order set was used. This study adds to the growing body of literature suggesting that a well‐defined care pathway can improve outcomes and reduce costs for patients and institutions.
Acknowledgements
The authors thank Ms. Pam Proctor for her assistance in implementation of the care pathway and Ms. Selma Lopez for her editorial assistance.
Disclosures: K.K. is or has been a consultant on clinical decision support (CDS) or electronic clinical quality measurement to the US Office of the National Coordinator for Health Information Technology, ARUP Laboratories, McKesson InterQual, ESAC, Inc., JBS International, Inc., Inflexxion, Inc., Intelligent Automation, Inc., Partners HealthCare, Mayo Clinic, and the RAND Corporation. K.K. receives royalties for a Duke Universityowned CDS technology for infectious disease management known as CustomID that he helped develop. K.K. was formerly a consultant for Religent, Inc. and a co‐owner and consultant for Clinica Software, Inc., both of which provide commercial CDS services, including through use of a CDS technology known as SEBASTIAN that K.K. developed. K.K. no longer has a financial relationship with either Religent or Clinica Software. K.K. has no competing interest with any specific product or intervention evaluated in this manuscript. All other authors declare no competing interests.
- . Cellulitis. N Engl J Med. 2004;350(9):904–912.
- , , , , , . Cost‐effectiveness of blood cultures for adult patients with cellulitis. Clin Infect Dis. 1999;29(6):1483–1488.
- , , , et al. Methicillin‐resistant s. aureus infectious among patients in the emergency department. N Engl J Med. 2006;355:666–674.
- , , . Systematic review of the effectiveness of integrated care pathways: what works, for whom, in which circumstances? Int J Evid Based Healthc. 2009;7:61–74.
- . Decreased antibiotic utilization after implementation of a guideline for inpatient cellulitis and cutaneous abscess. Arch Intern Med. 2011;171(12):1072–1079.
- , , , et al. Practice guidelines for the diagnosis and management of skin and soft‐tissue infections. Clin Infect Dis. 2005;41:1373–1406.
- , , , et al. Clinical practice guidelines by the Infectious Disease Society of American for the treatment of methicillin‐resistant Staphylococcus aureus infectious in adults and children. Clin Infect Dis. 2011;42:1–38.
- , , , . The role of b‐hemolytic streptococci in causing diffuse, nonculturable cellulitis. Medicine. 2010;89:217–226.
- , , , et al. Practice guidelines for the diagnosis and management of skin and soft tissue infections: 2014 update by the Infectious Disease Society of America. Clin Infect Dis. 2014;59(2):147–159.
- , , , et al. Value driven outcomes (VDO): a pragmatic, modular, and extensible software framework for understanding and improving health care costs and outcomes. J Am Med Inform Assoc. 2015;22(1):223–235.
- , , , et al. Coding algorithms for defining comorbidities in ICD‐9‐CM and ICD‐10 administrative data. Med Care. 2005;43:113–1139.
- , . Computerization of workflows, guidelines, and care pathways: a review of implementation challenges for process‐oriented health information systems. J Am Med Inform Assoc. 2011;18:738–748.
- , , , et al. Standardized clinical assessment and management plans (SCAMPs) provide a better alternative to clinical practice guidelines. Health Aff (Millwood) 2013;32(5):911–920.
- , , , et al. Clinical practice guidelines for clostridium difficile infection in adults: 2010 update by the Society for Healthcare Epidemiology of America (SHEA) and Infectious Diseases Society of America (IDSA). Infect Control Hosp Epidemiol. 2010;31:431–455.
Cellulitis is a common infection causing inflammation of the skin and subcutaneous tissues. Cellulitis has been attributed to gram‐positive organisms through historical evaluations including fine‐needle aspirates and punch biopsies of the infected tissue.[1] Neither of these diagnostic tests is currently used due to their invasiveness, poor diagnostic yield, and availability. Similarly, readily available tests such as blood cultures provide an etiology <5% of the time[1] and are not cost‐effective for most patients for diagnosing cellulitis.[2] In addition, the prevalence of methicillin‐resistant Staphylococcus aureus (MRSA) has steadily increased, complicating decisions about antibiotic selection.[3] The result of this uncertainty is a large variation in practice with respect to antibiotic and imaging selection for patients with a diagnosis of cellulitis.
University of Utah Health Care (UUHC) performed benchmarking for the management of cellulitis using the University HealthSystem Consortium (UHC) database and associated CareFx analytics tool. Benchmarking demonstrated that UUHC had a greater percentage of broad‐spectrum antibiotic use (defined as vancomycin, piperacillin/tazobactam, or carbapenems) than the top 5 performing UHC facilities for International Classification of Diseases, Ninth Revision, Clinical Modification (ICD‐9‐CM) diagnoses of cellulitis (vancomycin 83% vs 58% and carbapenem or piperacillin/tazobactam 44% vs 16%). Advanced imaging (computed tomography [CT] or magnetic resonance imaging [MRI]) for the diagnosis of cellulitis was also found to be an opportunity for improvement (CT 27% vs 20% and MRI 8% vs 5%). The hospitalist group (most patients admitted with cellulitis were on this service) believed these data reflected current practice, as there was no standard of treatment for cellulitis despite an active order set. Therefore, cellulitis was considered an opportunity to improve value to our patients. A standardized clinical care pathway was created, as such pathways have demonstrated a reduction in variation in practice and improved efficiency and effectiveness of care for multiple disease states including cellulitis.[4, 5] We hypothesized that implementation of an evidence‐based care pathway would decrease broad‐spectrum antibiotic use, cost, and use of advanced imaging without having any adverse effects on clinical outcomes such as length of stay (LOS) or readmission.
METHODS
Study Setting and Population
UUHC is a 500‐bed academic medical center in Salt Lake City, Utah. All patients admitted to the emergency department observation unit (EDOU) or the hospital with a primary ICD‐9‐CM diagnosis of cellulitis between July 1, 2011 and December 31, 2013 were evaluated.
Intervention
Initial steps involved the formation of a multidisciplinary team including key stakeholders from the hospitalist group, infectious diseases, the emergency department (ED), and nursing. This multidisciplinary team was charged with developing a clinical care pathway appropriate for local implementation. National guidance for the care pathway was mainly obtained from the Infectious Disease Society of America (IDSA) guidelines on skin and soft tissue infections (SSTIs)[6] and MRSA.[7] Specific attention was paid to recommendations on blood cultures (only when systemically ill), imaging (rarely needed), antibiotic selection (rarely gram‐negative coverage and consideration of MRSA coverage), and patient‐care principles that are often overlooked (elevation of the affected extremity). A distinction of purulent versus nonpurulent cellulitis was adopted based on the guidelines and a prospective evaluation of the care of patients with nonpurulent cellulitis.[8] The 2014 IDSA update on SSTIs incorporates this distinction more clearly in hopes of determining staphylococcal versus streptococcal infections.[9] After multiple iterations, an agreed‐upon care pathway was created that excluded patients with neutropenia, osteomyelitis, diabetic foot ulcerations; hand, perineal, periorbital, or surgical site infections; and human or animal bites (Figure 1). After the care pathway was determined, interventions were performed to implement this change.
Education of all providers involved included discussion of cellulitis as a disease process, presentation of benchmarking data, dissemination of the care pathway to hospitalist and ED physicians, teaching conferences for internal medicine residents and ED residents, and reinforcement of these concepts at the beginning of resident rotations.
Incorporation of the care pathway into the existing electronic order sets for cellulitis care in the inpatient and ED settings, with links to the care pathway, links to excluded disease processes (eg, hand cellulitis), preselection of commonly needed items (eg, elevate leg), and recommendations for antibiotic selection based on categories of purulent or nonpurulent cellulitis. The electronic health record (EHR) did not allow for forced order set usage, so the order set required selection by the admitting physician if indicated. Additionally, an embedded 48‐hour order set could be accessed at any time by the ordering physician and included vancomycin dosing. Specific changes to the preexisting order set included the development of sections for purulent and nonpurulent cellulitis as well as recommended antibiotics. Piperacillin/tazobactam and nafcillin were both removed and vancomycin was limited to the purulent subheading. Additionally, elevation of the extremity was preselected, and orderables for imaging (chest x‐ray and duplex ultrasound), antiulcer prophylaxis, telemetry, and electrocardiograph were all removed.
Audit and feedback of cases of cellulitis and broad‐spectrum antibiotic usage was performed by a senior hospitalist.
Study Design
A retrospective before/after study was performed to assess overall impact of the intervention on the patient population. Additionally, a retrospective controlled pre‐/postintervention study was performed to compare changes in cellulitis management for visits where order sets were used with visits where order sets were not used. The intervention initiation date was July 9, 2012. The institutional review board classified this project as quality improvement and did not require review and oversight.
Study Population
We analyzed 2278 ED and inpatient visits for cellulitis, of which 677 met inclusion criteria. We partitioned visits into 2 groups: (1) those for which order sets were used (n = 370) and (2) control visits for which order sets were not used (n = 307). We analyzed outcomes for 2 subpopulations: hospitalized patients for whom the EDOU or admission order sets were used (n = 149) and patients not admitted and only seen in the EDOU for whom the EDOU order set was used (n = 262).
Inclusion Criteria
Inclusion criteria included hospital admission or admission to the EDOU between July 1, 2011 and December 31, 2013, age greater or equal to 18 years, and primary diagnosis of cellulitis as determined by ICD‐9‐CM billing codes 035, 457.2, 681, 681.0, 681.00, 681.01, 681.02, 681.1, 681.10, 681.11, 681.9, 680, 680.0‐9, 682.0‐9, 684, 685.0, 685.1, 686.00, 686.01, 686.09, 686.1, 686.8, 686.9, 910.1, 910.5, 910.7, 910.9, 911.1, 911.3, 911.5, 911.7, 911.9, 912.1, 912.3, 912.5, 912.7, 912.9, 913.1, 913.3, 913.5, 913.7, 913.9, 914.1, 914.3, 914.5, 914.7, 914.9, 915.1, 915.3, 915.5, 915.7, 915.9, 916.1, 916.3, 916.5, 916.7, 916.9, 917.1, 917.3, 917.5, 917.7, 917.9, 919.1, 919.3, 919.5, 919.7, or 919.9.
Data Collection and Preparation
Clinical data were collected in the inpatient EHR (Cerner Corp., Kansas City, MO) and later imported into the enterprise data warehouse (EDW) as part of the normal data flow. Billing data were imported into the EDW from the billing system. Cost data were estimated using the value‐driven outcomes (VDO) tool developed by the University of Utah to identify clinical costs to the UUHC system.[10] All data were extracted from the EDW on September 10, 2014.
Process Metrics, Clinical, and Cost Outcomes
We defined 1 primary outcome (use of broad‐spectrum antibiotics) and 8 secondary outcomes, including process metrics (MRI and CT orders), clinical outcomes (LOS and 30‐day readmissions), and cost outcomes (pharmacy, lab, imaging cost from radiology department, and total facility cost). Broad‐spectrum antibiotics were defined as any use of meropenem (UUHC's carbapenem), piperacillin/tazobactam, or vancomycin and were determined by orders. Thirty‐day readmissions included only inpatient encounters with the primary diagnosis of cellulitis.
Covariates
To control for patient demographics we included age at admission in years and gender into the statistical model. To control for background health state as well as cellulitis severity, we included Charlson Comorbidity Index (CCI) and hospitalization status. CCI was calculated according to the algorithm specified by Quan et al.[11]
Study Hypotheses
First, for all patients, we hypothesized that process metrics as well as clinical and cost outcomes would improve following the implementation of the care pathway. To evaluate this hypothesis, we estimated impact of the time interval (pre‐/postintervention) on all outcomes. Second, we hypothesized that among patients for whom order sets were used (which we deemed to be a proxy for following the agreed‐upon care pathway), there would be a greater improvement than in patients for whom order sets were not used. To evaluate this hypothesis, we estimated interactions between order set use and time period (pre‐/postintervention) for all outcomes.
Statistical Analysis
The variable time period was created to represent the time period before and after the intervention.
We provided unadjusted descriptive statistics for study outcomes and visit characteristics for all patients before and after intervention. Descriptive statistics were expressed as n (%) and mean standard deviation. Simple comparisons were performed based on 2 test of homogeneity for categorical variables and t test or Wilcoxon test for continuous variables.
For before/after analysis, we fitted generalized linear regression models to estimate the change in outcomes of interest before and after intervention for all patients simultaneously. Generalized linear model defined by a binomial distributional assumption and logit link function was used to estimate the effect of the intervention on antibiotic use, imaging orders, and readmission adjusting for effects of age, gender, CCI, and hospitalization status. A generalized linear model defined by a gamma distributional assumption and log link function was used to estimate effect of the intervention on clinical LOS and cost outcomes adjusting for the effects of the same covariates. Generalized linear models with gamma distributional assumptions were used because they are known to perform well even for zero‐inflated semicontinuous cost variables and are easier to interpret than 2‐part models.
For the controlled before/after analysis, the variable order set used was created to represent groups where order sets were used or not used. Similarly, generalized linear models were used to estimate differential effect of the intervention at 2 different order set use levels using an interaction term between order set use and the time period.
P values <0.05 were considered significant. We used SAS version 9.3 statistical software (SAS Institute Inc., Cary, NC) for data analysis.
RESULTS
Descriptive Characteristics
Patient characteristics before and after intervention for 677 EDOU and inpatient visits for cellulitis by 618 patients are summarized in the first 4 columns of Table 1. Patient age at admission ranged from 18 to 98 years. Thirty‐eight percent of visits were by female patients. There were 274 visits before the intervention and 403 visits after. Four hundred thirty‐two (64%) were admitted, and 295 (44%) were seen in the EDOU. The admission order set alone was used for 104 visits, the EDOU order set alone was used for 242 visits, and both order sets were used for 24 visits.
| Characteristic | Overall | Order Sets Not Used | Order Sets Used | ||||||
|---|---|---|---|---|---|---|---|---|---|
| Baseline, N = 274 | Intervention, N = 403 | P* | Baseline, N = 127 | Intervention, N = 180 | P* | Baseline, N = 147 | Intervention, N = 223 | P* | |
| |||||||||
| Patient Characteristics | |||||||||
| Age, y | 46.8 16.0 | 48.9 17.1 | 0.097 | 49.8 16.0 | 5.1 16.3 | 0.88 | 44.2 15.5 | 48.0 17.6 | 0.032 |
| Female gender | 105 (38%) | 155 (39%) | 0.93 | 50 (39%) | 74 (41%) | 0.73 | 55 (37%) | 81 (36%) | 0.86 |
| CCI | 2.6 3.2 | 2.6 3.0 | 0.69 | 3.2 3.5 | 3.2 3.2 | 0.82 | 2.0 2.8 | 2.1 2.7 | 0.68 |
| Clinical process characteristics | |||||||||
| EDOU admission | 122 (45%) | 173 (43%) | 0.68 | 12 (9%) | 19 (11%) | 0.75 | 110 (75%) | 154 (69%) | 0.23 |
| Hospital admission | 173 (63%) | 259 (64%) | 0.76 | 117 (92%) | 166 (92%) | 0.98 | 56 (38%) | 93 (42%) | 0.49 |
| EDOU order set used | 111 (41%) | 155 (38%) | 0.59 | NA | NA | NA | 111 (76%) | 155 (70%) | 0.21 |
| ADM order set used | 47 (17%) | 81 (20%) | 0.34 | NA | NA | NA | 47 (32%) | 81 (36%) | 0.39 |
| Process outcomes | |||||||||
| Broad‐spectrum antibiotics used | 205 (75%) | 230 (57%) | <0.001 | 90 (71%) | 121 (67%) | 0.50 | 115 (78%) | 109 (49%) | <0.001 |
| MRI done | 27 (10%) | 32 (8%) | 0.39 | 13 (10%) | 20 (11%) | 0.81 | 14 (10%) | 12 (5%) | 0.13 |
| CT done | 56 (20%) | 76 (19%) | 0.61 | 32 (25%) | 43 (24%) | 0.79 | 24 (16%) | 33 (15%) | 0.69 |
| Clinical outcomes | |||||||||
| Length of stay, d | 2.7 2.6 | 2.6 2.8 | 0.35 | 3.6 2.8 | 3.8 3.4 | 0.62 | 2.0 2.1 | 1.7 1.6 | 0.48 |
| 30‐day readmission | 14 (5%) | 17 (4%) | 0.59 | 7 (6%) | 9 (5%) | 0.84 | 7 (5%) | 8 (4%) | 0.58 |
| Cost outcomes | |||||||||
| Pharmacy cost ($) | 1 | 0.76 | 0.002 | 1 | 0.89 | 0.13 | 1 | 0.56 | 0.004 |
| Lab cost ($) | 1 | 0.52 | <0.001 | 1 | 0.53 | 0.001 | 1 | 0.51 | 0.055 |
| Imaging cost ($) | 1 | 0.82 | 0.11 | 1 | 0.95 | 0.52 | 1 | 0.67 | 0.13 |
| Total facility cost ($) | 1 | 0.85 | 0.027 | 1 | 0.91 | 0.042 | 1 | 0.77 | 0.26 |
Before/After Analysis
Among all patients, use of broad‐spectrum antibiotics decreased from 75% to 57% (Table 1). Analysis adjusted for gender, age at admission, CCI, and hospital admission status is provided in Table 2. Overall, there was a 59% decrease in the odds of ordering broad‐spectrum antibiotics (P < 0.001), a 23% decrease in pharmacy cost (P = 0.002), a 44% decrease in laboratory cost (P < 0.001), and a 13% decrease in total facility cost (P = 0.006).
| Logistic Regression | ||||
|---|---|---|---|---|
| Outcome Variables | Selected Predictor Variables | Odds* | Percent Change | P |
| Gamma Regression | ||||
| Outcome Variables | Selected Predictor Variables | Fold Change* | Percent Change | P |
| ||||
| Antibiotics used | Time period | 0.41 (0.29, 0.59) | 59% (71% to 41%) | <0.001 |
| MRI done | Time period | 0.74 (0.43, 1.30) | 26% (57% to 30%) | 0.29 |
| CT done | Time period | 0.92 (0.62, 1.36) | 8% (38% to 36%) | 0.67 |
| 30‐day readmission | Time period | 0.86 (0.41, 1.80) | 14% (59% to 80%) | 0.69 |
| Length of stay, d | Time period | 0.97 (0.91, 1.03) | 3% (9% to 3%) | 0.34 |
| Pharmacy cost ($) | Time period | 0.77 (0.65, 0.91) | 23% (35% to 9%) | 0.002 |
| Lab cost ($) | Time period | 0.56 (0.48, 0.65) | 44% (52% to 35%) | <0.001 |
| Imaging cost($) | Time period | 0.90 (0.71, 1.14) | 10% (29% to 14%) | 0.38 |
| Total facility cost ($) | Time Period | 0.87 (0.79, 0.96) | 13% (21% to 4%) | 0.006 |
Order Set Use Groups Analysis
Descriptive statistics and simple comparison before/after the intervention for the 2 study groups are shown in the last 6 columns of Table 1. Among patients for whom order sets were used, broad‐spectrum antibiotic usage significantly decreased from 78% before the intervention to 49% after the intervention (P < 0.001). In contrast, among patients for whom order sets were not used, broad‐spectrum antibiotic usage remained relatively constant71% before the intervention versus 67% after the intervention (P = 0.50). Figure 2 shows semiannual changes in the prescription of broad‐spectrum antibiotics. There is a noticeable drop after the intervention among patients for whom order sets were used.
Analysis of the interaction between time period and order set usage is provided in Table 3. After the intervention, patients for whom the order sets were used had greater improvement in broad‐spectrum antibiotic selection (75% decrease, P < 0.001) and LOS (25% decrease, P = 0.041) than patients for whom order sets were not used. Pharmacy costs also decreased by 13% more among patients for whom the order sets were used, although the interaction was not statistically significant (P = 0.074). Laboratory costs decreased in both groups, but order set use did not demonstrate an interaction (P = 0.5). Similar results were found for the subgroups of admitted patients and patients seen in the EDOU.
| Logistic Regression | ||||
|---|---|---|---|---|
| Outcome Variables | Selected Predictor Variables | Odds* | Percent Change | P |
| Gamma Regression | ||||
| Outcome Variables | Selected Predictor Variables | Fold Change* | Percent Change | P |
| ||||
| Broad spectrum antibiotics | Time period | 0.84 (0.50, 1.40) | 16% (50% to 40%) | 0.50 |
| Time periodorder set | 0.25 (0.12, 0.52) | 75% (88% to 48%) | <0.001 | |
| MRI done | Time period | 1.04 (0.49, 2.20) | 4% (51% to 120%) | 0.92 |
| Time periodorder set | 0.44 (0.14, 1.38) | 56% (86% to 38%) | 0.16 | |
| CT done | Time period | 0.94 (0.55, 1.60) | 6% (45% to 60%) | 0.81 |
| Time periodorder set | 0.96 (0.44, 2.12) | 4% (56% to 112%) | 0.93 | |
| 30‐day readmission | Time period | 0.91 (0.33, 2.53) | 9% (67% to 153%) | 0.86 |
| Time periodorder set | 0.88 (0.20, 3.93) | 12% (80% to 293%) | 0.87 | |
| Clinical length of stay | Time period | 1.04 (0.95, 1.14) | 4% (5% to 14%) | 0.41 |
| Time periodorder set | 0.87 (0.77, 0.99) | 13% (23% to 1%) | 0.041 | |
| Pharmacy cost ($) | Time period | 0.88 (0.70, 1.12) | 12% (30% to 12%) | 0.31 |
| Time periodorder set | 0.75 (0.54, 1.03) | 25% (46% to 3%) | 0.074 | |
| Lab cost ($) | Time period | 0.53 (0.42, 0.66) | 47% (58% to 34%) | <0.001 |
| Time periodorder set | 1.11 (0.82, 1.50) | 11% (18% to 50%) | 0.50 | |
| Imaging cost ($) | Time period | 1.00 (0.71, 1.40) | 0% (29% to 40%) | 0.98 |
| Time periodorder set | 0.82 (0.51, 1.30) | 18% (49% to 30%) | 0.39 | |
| Facility cost ($) | Time period | 0.92 (0.80, 1.05) | 8% (20% to 5%) | 0.22 |
| Time periodorder set | 0.90 (0.75, 1.09) | 10% (25% to 9%) | 0.29 | |
Audit and feedback was initially performed for cases of cellulitis using broad‐spectrum antibiotics. However, given the complexity of cellulitis as a disease process and the frequency of broad‐spectrum antibiotic usage, in all cases of review, it was deemed reasonable to use broad‐spectrum antibiotics. Therefore, the audit was not continued.
DISCUSSION
Care pathways have demonstrated improvement across multiple different disease states including cellulitis.[4, 5] They have been noted to reduce variation in practice and improve physician agreement about treatment options.[4] The best method for implementation is not clearly understood,[12] and there remains concern about maintaining flexibility for patient care.[13] Additionally, although implementation of pathways is often well described, evaluations of the processes are noted to frequently be weak.[12] UUHC felt that the literature supported implementing a care pathway for the diagnosis of cellulitis, but that a thorough evaluation was also needed to understand any resulting benefits or harms. Through this study, we found that the implementation of this pathway resulted in a significant decrease in broad‐spectrum antibiotic use, pharmacy costs, and total facility costs. There was also a trend to decrease in imaging cost, and there were no adverse effects on LOS or 30‐day readmissions. Our findings demonstrate that care‐pathway implementation accompanied by education, pathway‐compliant electronic order sets, and audit and feedback can help drive improvements in quality while reducing costs. This finding furthers the evidence supporting standard work through the creation of clinical care pathways for cellulitis as an effective intervention.[4] Additionally, although not measured in this study, reduction of antibiotic use is supported as a measure to help reduce Clostridium difficile infections, a further potential benefit.[14]
This study has several important strengths. First, we included accurate cost analyses using the VDO tool. Given the increasing importance of improving care value, we feel the inclusion of such cost analysis is an increasingly important aspect of health service intervention evaluations. Second, we used a formal benchmarking approach to identify a priority care improvement area and to monitor changes in practice following the rollout of the intervention. We feel this approach provides a useful example on how to systematically improve care quality and value in a broader health system context. Third, we evaluated not order set implementation per se, but rather changing an existing order set. Because studies in this area generally focus on initial order set implementation, our study contributes insights on what can be expected through modifications of existing order sets based on care pathways. Fourth, the analysis accounted for a variety of variables including the CCI. Of interest, our study found that the intervention group (patients for whom order sets were used) had a lower CCI, confirming Allen et al.'s findings that diseases with predictable trajectories are the most likely to benefit from care pathways.[4] As a final strength, the narrative‐based order set intervention was relatively simple, and the inclusion criteria were broad, making the process generalizable.
Limitations of this study include that it was a single center pre‐/postintervention study and not a randomized controlled trial. Related to this limitation, the control group for which order sets were not used reflected a different patient population compared to the intervention group for which order sets were used. Specifically, it was more common for order sets to be used in the EDOU than upon admission, resulting in the order set group consisting of patients with less comorbidities than patients in the nonorder set group. Additionally, patients in the order set intervention group were older than in the baseline group (48.0 vs 44.2 years). However, these differences in population remained relatively stable before and after the intervention, and relevant variables including demographic factors and CCI were accounted for in the regression models. Nevertheless, it remains possible that secular trends existed that we did not capture that affected the 2 populations differently. For example, there was a separate project that overlapped with the intervention period to reduce unnecessary laboratory usage at UUHC. This intervention could have influenced the trend to decreased laboratory utilization in the postintervention period. However, there were no concurrent initiatives to reduce antibiotic use during the study period. As a final limitation, the statistical analyses have not corrected for multiple testing for the secondary outcomes.
CONCLUSION
Using benchmark data from UHC, an academic medical center was able to identify an opportunity for improving the care of patients with cellulitis and subsequently develop an evidence‐based care pathway. The implementation of this pathway correlated with a significant reduction of broad‐spectrum antibiotic use, pharmacy costs, and total facility costs without adverse clinical affects. An important factor in the success of the intervention was the use of electronic order sets for cellulitis, which provided support for the implementation of the care pathway. This study demonstrates that the intervention was not only effective overall, but that it was more effective for those patients for whom the order set was used. This study adds to the growing body of literature suggesting that a well‐defined care pathway can improve outcomes and reduce costs for patients and institutions.
Acknowledgements
The authors thank Ms. Pam Proctor for her assistance in implementation of the care pathway and Ms. Selma Lopez for her editorial assistance.
Disclosures: K.K. is or has been a consultant on clinical decision support (CDS) or electronic clinical quality measurement to the US Office of the National Coordinator for Health Information Technology, ARUP Laboratories, McKesson InterQual, ESAC, Inc., JBS International, Inc., Inflexxion, Inc., Intelligent Automation, Inc., Partners HealthCare, Mayo Clinic, and the RAND Corporation. K.K. receives royalties for a Duke Universityowned CDS technology for infectious disease management known as CustomID that he helped develop. K.K. was formerly a consultant for Religent, Inc. and a co‐owner and consultant for Clinica Software, Inc., both of which provide commercial CDS services, including through use of a CDS technology known as SEBASTIAN that K.K. developed. K.K. no longer has a financial relationship with either Religent or Clinica Software. K.K. has no competing interest with any specific product or intervention evaluated in this manuscript. All other authors declare no competing interests.
- . Cellulitis. N Engl J Med. 2004;350(9):904–912.
- , , , , , . Cost‐effectiveness of blood cultures for adult patients with cellulitis. Clin Infect Dis. 1999;29(6):1483–1488.
- , , , et al. Methicillin‐resistant s. aureus infectious among patients in the emergency department. N Engl J Med. 2006;355:666–674.
- , , . Systematic review of the effectiveness of integrated care pathways: what works, for whom, in which circumstances? Int J Evid Based Healthc. 2009;7:61–74.
- . Decreased antibiotic utilization after implementation of a guideline for inpatient cellulitis and cutaneous abscess. Arch Intern Med. 2011;171(12):1072–1079.
- , , , et al. Practice guidelines for the diagnosis and management of skin and soft‐tissue infections. Clin Infect Dis. 2005;41:1373–1406.
- , , , et al. Clinical practice guidelines by the Infectious Disease Society of American for the treatment of methicillin‐resistant Staphylococcus aureus infectious in adults and children. Clin Infect Dis. 2011;42:1–38.
- , , , . The role of b‐hemolytic streptococci in causing diffuse, nonculturable cellulitis. Medicine. 2010;89:217–226.
- , , , et al. Practice guidelines for the diagnosis and management of skin and soft tissue infections: 2014 update by the Infectious Disease Society of America. Clin Infect Dis. 2014;59(2):147–159.
- , , , et al. Value driven outcomes (VDO): a pragmatic, modular, and extensible software framework for understanding and improving health care costs and outcomes. J Am Med Inform Assoc. 2015;22(1):223–235.
- , , , et al. Coding algorithms for defining comorbidities in ICD‐9‐CM and ICD‐10 administrative data. Med Care. 2005;43:113–1139.
- , . Computerization of workflows, guidelines, and care pathways: a review of implementation challenges for process‐oriented health information systems. J Am Med Inform Assoc. 2011;18:738–748.
- , , , et al. Standardized clinical assessment and management plans (SCAMPs) provide a better alternative to clinical practice guidelines. Health Aff (Millwood) 2013;32(5):911–920.
- , , , et al. Clinical practice guidelines for clostridium difficile infection in adults: 2010 update by the Society for Healthcare Epidemiology of America (SHEA) and Infectious Diseases Society of America (IDSA). Infect Control Hosp Epidemiol. 2010;31:431–455.
© 2015 Society of Hospital Medicine
