User login
Cadaveric Study of Appropriate Screw Length for Distal Radius Stabilization Using Volar Plate Fixation
Distal radius fractures constitute 15% of all extremity fractures and are the most common upper extremity fractures.1-3 The incidence of distal radius fractures is continuing to escalate because of the expanding elderly population and concurrent increase in osteoporosis.3,4 In addition, open reduction and internal fixation with a volar locking plate for distal radius fractures are more commonly being performed by general orthopedists, who may not perform these surgeries frequently. Surgically treated patients experience less time immobilized and have a higher chance of regaining previous functional status.2 In a commonly used technique, volar fixed-angle plating is used to stabilize the distal radius. With the rising popularity of this method, more patients are having postoperative complications.1,3,5,6 Extensor tendon irritation and attritional rupture constitute up to 50% of all complications stemming from volar plating of the distal radius.1
Volar plate fixation of the distal radius was originally designed to decrease postoperative tendon complications by preventing the flexor and extensor tendons from coming into direct contact with the surgically placed plates and/or screws.1 This technique places the volar plate under the belly of the pronator quadratus muscle. Shielding the flexor tendons, the pronator quadratus can prevent the volar plate from causing flexor tendon attrition. This shielding does not occur on the dorsal side of the wrist because the extensor tendons are in full contact with the dorsal radius. As such, volar fixation gained in popularity on the premise of preventing extensor tendon complications by directly avoiding the dorsal compartment.1,7
The most common complication of volar plating ironically involves the dorsal compartment.1,7 The typical distal radius fracture occurs when a fall on an outstretched hand results in significant dorsal comminution. In these cases, it can be difficult to judge the appropriate screw length, as the depth gauge does not have an intact cortex to hook. There is the temptation to use intraoperative fluoroscopy and the depth gauge to estimate screw lengths at the distal radius, especially in cases in which a surgeon may not perform this type of surgery often. More specifically, use of a lateral image to gauge the appropriate length for screws may be tempting, but a false estimate is possible.
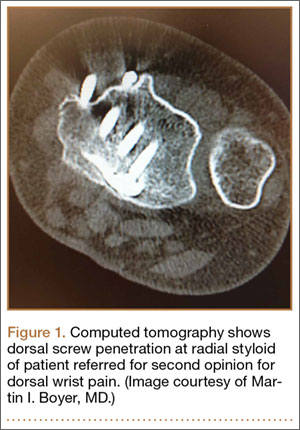
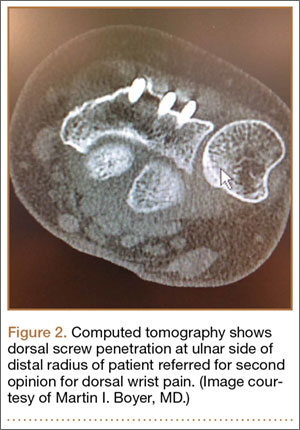
Screw prominence on the dorsal cortex may be caused by the complex geometry of the distal radius. This geometry is produced by the Lister tubercle and its adjacent groove for the extensor pollicis longus.7 The dorsal shape of the distal radius is a dome or dihedral with the thickest part at the Lister tubercle. The dihedral shape may hide possible dorsal screw prominence on a lateral radiograph, but screw prominence can be appreciated with computed tomography (CT) (Figures 1, 2).
We conducted a study to determine if and where screw prominence occurs, and in what amount, to establish general guidelines for screw depth based on lateral radiographs. We also wanted to be able to highlight the potential source of postoperative complications.
Materials and Methods
Twelve preserved cadaveric forearms were used for this study. Two sets of arms were paired, and the other arms came from different cadavers. In total, 5 male arms (3 left, 2 right) and 7 female arms (5 left, 2 right) were used.
The arms were harvested using a bone saw to cut through the humerus just proximal to the epicondyles, keeping the ulna and radius completely intact. Each arm was examined by the naked eye and by fluoroscopy to determine if any significant anatomical or traumatic variations in the distal radius were present. None showed any abnormal variation.
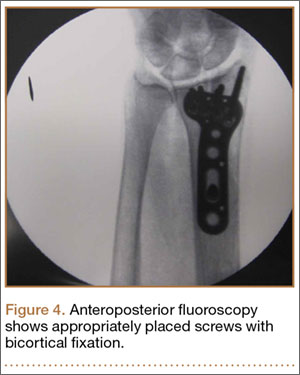
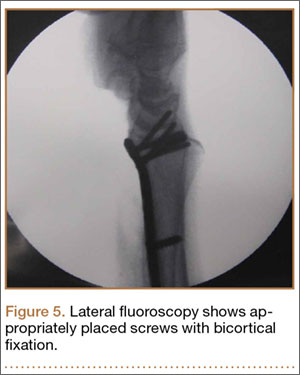
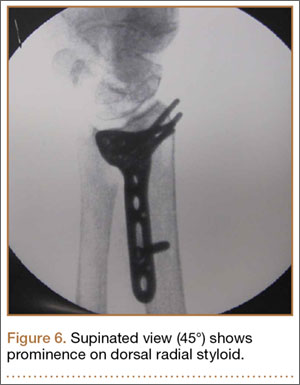
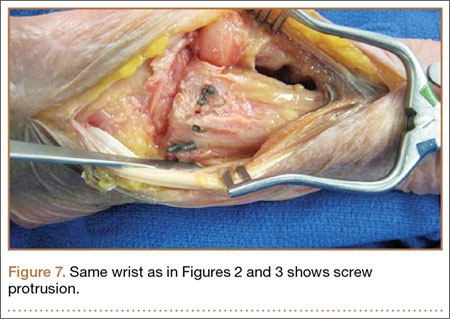
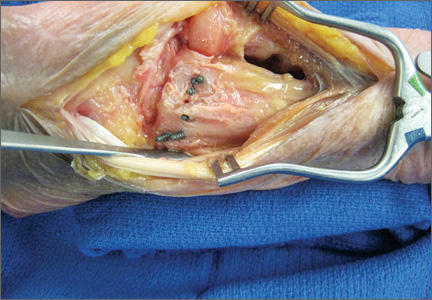
The flexor tendons and volar structures were removed to allow easy visualization and access to the distal radius. The volar locking plates (Precise SD; Small Bone Innovations) were positioned to the best anatomical and radiographic fit and secured with a proximal and distal Kirschner wire (Figure 3). A single cortical screw was placed through the shaft for compression. All 7 distal holes were drilled bicortically using an appropriately sized 2.0-mm drill and the standard block drill guide. A depth gauge was used in concordance with fluoroscopy to estimate the distance between cortices and appropriate screw lengths for each hole. A standard lateral view was used to determine the depth based on aligning the depth gauge at the dorsal cortex. The hook was not used to hook the dorsal cortex, as typically the dorsal cortex is severely comminuted and unavailable for measurement. Next, all 7 locking screws of premeasured length were secured into their respective holes. Anteroposterior, lateral, and oblique (forearm supinated and pronated 45°) radiographs were obtained to visualize screw placement and possible dorsal screw prominence (Figures 4-6).8 The extensor tendons and dorsal structures were then dissected away to expose any violation of the dorsal compartments, and calipers were used to measure absolute dorsal screw prominence and the depth of the Lister tubercle (Figure 7).
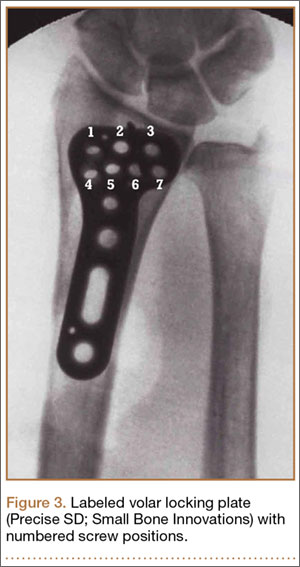
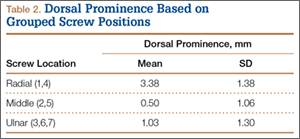
Mean (SD) dorsal prominence at each screw position was calculated. The screws were also categorized into radial (1,4), central (2,5), and ulnar (3,6,7) groups based on location within the plate (Figure 3). Equality of means testing was performed using a 1-way analysis of variance followed by a Bonferroni test.
Results
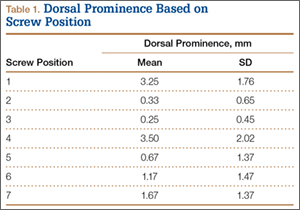
Mean (SD) dorsal prominence in millimeters is listed in Table 1. Positions 1 and 4 had significantly more dorsal prominence than the other 5 screw positions (P < .01 for all comparisons). Mean (SD) dorsal prominence based on grouped screw positions is listed in Table 2. There was significantly more dorsal prominence in the radial group that in the central group (P < .001) and ulnar group (P < .001). Mean depth of the Lister tubercle was 3.25 mm.
All prominent screws in the radial aspect of the radius were detected using a supinated 45° view. A 45° pronated view was not successful in demonstrating screw prominence on the ulnar side of the wrist because of overlap of the ulnar head.
Discussion
Extensor tendon irritation and extensor tendon rupture are frequent yet preventable complications of using volar plating systems to stabilize distal radius fractures. Many recent studies have investigated the intraoperative methodologies in order to identify real-time adjustments the surgeon can make to prevent negative outcomes. The first report of extensor tendon injury caused by volar plate fixation (published in 1989) was attributed to dorsal screw prominence.9,10 Even today, extensor tendon complications remain a challenge, as screw prominence is difficult to ascertain even with multiple intraoperative radiologic views.1,8
This study simulated real-time radiographic views to estimate if screws had extended into the dorsal compartment. These radiographic predictions were then correlated with the absolute dorsal screw prominence seen after dorsal compartment dissection. We determined that the supinated oblique view was the best imaging view for identifying radial styloid screw prominence.
Mean depth of the Lister tubercle was 3.25 mm (similar to previously reported 2 mm11). However, there was no correlation identified between depth of the Lister tubercle and amount of dorsal screw prominence.
We wanted to identify high-risk areas and estimate expected dorsal screw prominence in order to make appropriate intraoperative screw length adjustments. The radius is divided into radial, central, and ulnar columns. The central screw positions had the least dorsal screw prominence (mean, 0.50 mm). This central position was considered low-risk. Both the radial and the ulnar screw positions had more dorsal screw prominence (means, 3.38 mm and 1.03 mm, respectively). Only the radial screws had significantly more prominence. However, this study was not powered to detect a difference as small as that between the central and ulnar screw positions. Despite the lack of statistical significance, it is clear from the data that the ulnar screws trend toward more dorsal prominence, and, therefore, screw measurements at both the radial and ulnar screw locations (using the depth gauge) require adjustments.
Extensor tendon contact was difficult to determine based on any specific screw length, as the extensor tendon had to be dissected to determine prominence. Based on observations, a prominence of 2 mm seemed to present a risk for tendon irritation. The periosteum and the rounded end of the screw may obviate the risk with 1 mm of prominence. However, this observation may not hold true in an in vivo situation.
This study had several limitations. First, only a single brand of plate was used, making these findings specific to this system. However, concepts and conclusions can be extrapolated to all systems. The radial side had the highest risk for prominence, and this factor should be accounted for when selecting screw lengths. In addition, the ulnar column also poses some risk, but not to the degree of the radial column. Another limitation is that fractures were not created in these radii; therefore, dorsal comminution was not recreated. In some cases, the dorsal cortex may be displaced dorsally and be somewhat protective. This study is not meant to be an exhaustive study on all volar plates or provide absolute recommendations. It is meant to suggest caution to surgeons who may not be familiar with the complex anatomy of the dorsal radius and to identify areas where the risk for screw penetration is highest.
Shortening screw lengths at the positions described may trigger surgeons’ concerns about stabilizing distal radius fractures. In a 2012 biomechanical study, Wall and colleagues12 found no difference between unicortical screws (placed at 75% of the distance to the dorsal cortex) and bicortical screws in effectiveness in stabilizing distal radius fractures.12 The proposed reduction will result in the desired bicortical screw lengths but limit prominence. In addition, in the setting of dorsal comminution, the increased stability gained by bicortical fixation is minimal.
In fractures with an intact dorsal cortex, standard depth gauges will likely produce appropriate screw length measurements. However, even in this situation, and based on the results reported by Wall and colleagues,12 subtraction of 1 to 2 mm may prove prudent. In cases in which the dorsal cortex is comminuted and screw estimates based on fluoroscopy are used, the lateral image may provide estimates that lead to screw prominence. A 45° supinated view should be used to check screw length for the radial side, the column most at risk. However, comminution may also obscure this view. We cannot comment on that, as the present study did not create comminuted fractures of the distal radius. In addition, the ulnar column posed a lesser but real risk of screw prominence, which must also be accounted for, and typically is not appreciated with alternate views.
Last, use of live fluoroscopy instead of standard anteroposterior and lateral views may prove valuable in assessing hardware placement and screw length in the setting of a comminuted distal radius fracture. Through use of live fluoroscopy, prominent screws, especially those on the radial side, may be identified, and potential tendon injury may be avoided. Keeping in mind the shape of the dorsal aspect of the distal radius should assist surgeons in preventing screw prominence dorsally and limit complications.
1. Maschke SD, Evans PJ, Schub D, Drake R, Lawton JN. Radiographic evaluation of dorsal screw penetration after volar fixed-angle plating of the distal radius: a cadaveric study. Hand. 2007;2(3):144-150.
2. Nana AD, Joshi A, Lichtman DM. Plating of the distal radius. J Am Acad Orthop Surg. 2005;13(3):159-171.
3. Orbay JL, Fernandez DL. Volar fixed-angle plate fixation for unstable distal radius fractures in the elderly patient. J Hand Surg. 2004;29(1):96-102.
4. Protopsaltis TS, Ruch DS. Volar approach to distal radius fractures. J Hand Surg. 2008;33(6):958-965.
5. Koval KJ, Harrast JJ, Anglen JO, Weinstein JN. Fractures of the distal part of the radius. The evolution of practice over time. Where’s the evidence? J Bone Joint Surg Am. 2008;90(9):1855-1861.
6. Gruber G, Zacherl M, Giessauf C, et al. Quality of life after volar plate fixation of articular fractures of the distal part of the radius. J Bone Joint Surg Am. 2010;92(5):1170-1178.
7. Clement H, Pichler W, Nelson D, Hausleitner L, Tesch NP, Grechenig W. Morphometric analysis of Lister’s tubercle and its consequences on volar plate fixation of distal radius fractures. J Hand Surg. 2008;33(10):1716-1719.
8. Ozer K, Wolf JM, Watkins B, Hak DJ. Comparison of 4 fluoroscopic views for dorsal cortex screw penetration after volar plating of the distal radius. J Hand Surg. 2012;37(5):963-967.
9. Perry DC, Machin DM, Casaletto JA, Brown DJ. Minimising the risk of extensor pollicis longus rupture following volar plate fixation of distal radius fractures: a cadaveric study. Ann R Coll Surg Engl. 2011;93(1):57-60.
10. Wong-Chung J, Quinlan W. Rupture of extensor pollicis longus following fixation of a distal radius fracture. Injury. 1989;20(6):375-376.
11. Park DH, Goldie BS. Volar plating for distal radius fractures—do not trust the image intensifier when judging distal subchondral screw length. Tech Hand Up Extrem Surg. 2012;16(3):169-172.
12. Wall LB, Brodt MD, Silva MJ, Boyer MI, Calfee RP. The effects of screw length on stability of simulated osteoporotic distal radius fractures fixed with volar locking plates. J Hand Surg. 2012;37(3):446-453.
Distal radius fractures constitute 15% of all extremity fractures and are the most common upper extremity fractures.1-3 The incidence of distal radius fractures is continuing to escalate because of the expanding elderly population and concurrent increase in osteoporosis.3,4 In addition, open reduction and internal fixation with a volar locking plate for distal radius fractures are more commonly being performed by general orthopedists, who may not perform these surgeries frequently. Surgically treated patients experience less time immobilized and have a higher chance of regaining previous functional status.2 In a commonly used technique, volar fixed-angle plating is used to stabilize the distal radius. With the rising popularity of this method, more patients are having postoperative complications.1,3,5,6 Extensor tendon irritation and attritional rupture constitute up to 50% of all complications stemming from volar plating of the distal radius.1
Volar plate fixation of the distal radius was originally designed to decrease postoperative tendon complications by preventing the flexor and extensor tendons from coming into direct contact with the surgically placed plates and/or screws.1 This technique places the volar plate under the belly of the pronator quadratus muscle. Shielding the flexor tendons, the pronator quadratus can prevent the volar plate from causing flexor tendon attrition. This shielding does not occur on the dorsal side of the wrist because the extensor tendons are in full contact with the dorsal radius. As such, volar fixation gained in popularity on the premise of preventing extensor tendon complications by directly avoiding the dorsal compartment.1,7
The most common complication of volar plating ironically involves the dorsal compartment.1,7 The typical distal radius fracture occurs when a fall on an outstretched hand results in significant dorsal comminution. In these cases, it can be difficult to judge the appropriate screw length, as the depth gauge does not have an intact cortex to hook. There is the temptation to use intraoperative fluoroscopy and the depth gauge to estimate screw lengths at the distal radius, especially in cases in which a surgeon may not perform this type of surgery often. More specifically, use of a lateral image to gauge the appropriate length for screws may be tempting, but a false estimate is possible.
Screw prominence on the dorsal cortex may be caused by the complex geometry of the distal radius. This geometry is produced by the Lister tubercle and its adjacent groove for the extensor pollicis longus.7 The dorsal shape of the distal radius is a dome or dihedral with the thickest part at the Lister tubercle. The dihedral shape may hide possible dorsal screw prominence on a lateral radiograph, but screw prominence can be appreciated with computed tomography (CT) (Figures 1, 2).
We conducted a study to determine if and where screw prominence occurs, and in what amount, to establish general guidelines for screw depth based on lateral radiographs. We also wanted to be able to highlight the potential source of postoperative complications.
Materials and Methods
Twelve preserved cadaveric forearms were used for this study. Two sets of arms were paired, and the other arms came from different cadavers. In total, 5 male arms (3 left, 2 right) and 7 female arms (5 left, 2 right) were used.
The arms were harvested using a bone saw to cut through the humerus just proximal to the epicondyles, keeping the ulna and radius completely intact. Each arm was examined by the naked eye and by fluoroscopy to determine if any significant anatomical or traumatic variations in the distal radius were present. None showed any abnormal variation.
The flexor tendons and volar structures were removed to allow easy visualization and access to the distal radius. The volar locking plates (Precise SD; Small Bone Innovations) were positioned to the best anatomical and radiographic fit and secured with a proximal and distal Kirschner wire (Figure 3). A single cortical screw was placed through the shaft for compression. All 7 distal holes were drilled bicortically using an appropriately sized 2.0-mm drill and the standard block drill guide. A depth gauge was used in concordance with fluoroscopy to estimate the distance between cortices and appropriate screw lengths for each hole. A standard lateral view was used to determine the depth based on aligning the depth gauge at the dorsal cortex. The hook was not used to hook the dorsal cortex, as typically the dorsal cortex is severely comminuted and unavailable for measurement. Next, all 7 locking screws of premeasured length were secured into their respective holes. Anteroposterior, lateral, and oblique (forearm supinated and pronated 45°) radiographs were obtained to visualize screw placement and possible dorsal screw prominence (Figures 4-6).8 The extensor tendons and dorsal structures were then dissected away to expose any violation of the dorsal compartments, and calipers were used to measure absolute dorsal screw prominence and the depth of the Lister tubercle (Figure 7).
Mean (SD) dorsal prominence at each screw position was calculated. The screws were also categorized into radial (1,4), central (2,5), and ulnar (3,6,7) groups based on location within the plate (Figure 3). Equality of means testing was performed using a 1-way analysis of variance followed by a Bonferroni test.
Results
Mean (SD) dorsal prominence in millimeters is listed in Table 1. Positions 1 and 4 had significantly more dorsal prominence than the other 5 screw positions (P < .01 for all comparisons). Mean (SD) dorsal prominence based on grouped screw positions is listed in Table 2. There was significantly more dorsal prominence in the radial group that in the central group (P < .001) and ulnar group (P < .001). Mean depth of the Lister tubercle was 3.25 mm.
All prominent screws in the radial aspect of the radius were detected using a supinated 45° view. A 45° pronated view was not successful in demonstrating screw prominence on the ulnar side of the wrist because of overlap of the ulnar head.
Discussion
Extensor tendon irritation and extensor tendon rupture are frequent yet preventable complications of using volar plating systems to stabilize distal radius fractures. Many recent studies have investigated the intraoperative methodologies in order to identify real-time adjustments the surgeon can make to prevent negative outcomes. The first report of extensor tendon injury caused by volar plate fixation (published in 1989) was attributed to dorsal screw prominence.9,10 Even today, extensor tendon complications remain a challenge, as screw prominence is difficult to ascertain even with multiple intraoperative radiologic views.1,8
This study simulated real-time radiographic views to estimate if screws had extended into the dorsal compartment. These radiographic predictions were then correlated with the absolute dorsal screw prominence seen after dorsal compartment dissection. We determined that the supinated oblique view was the best imaging view for identifying radial styloid screw prominence.
Mean depth of the Lister tubercle was 3.25 mm (similar to previously reported 2 mm11). However, there was no correlation identified between depth of the Lister tubercle and amount of dorsal screw prominence.
We wanted to identify high-risk areas and estimate expected dorsal screw prominence in order to make appropriate intraoperative screw length adjustments. The radius is divided into radial, central, and ulnar columns. The central screw positions had the least dorsal screw prominence (mean, 0.50 mm). This central position was considered low-risk. Both the radial and the ulnar screw positions had more dorsal screw prominence (means, 3.38 mm and 1.03 mm, respectively). Only the radial screws had significantly more prominence. However, this study was not powered to detect a difference as small as that between the central and ulnar screw positions. Despite the lack of statistical significance, it is clear from the data that the ulnar screws trend toward more dorsal prominence, and, therefore, screw measurements at both the radial and ulnar screw locations (using the depth gauge) require adjustments.
Extensor tendon contact was difficult to determine based on any specific screw length, as the extensor tendon had to be dissected to determine prominence. Based on observations, a prominence of 2 mm seemed to present a risk for tendon irritation. The periosteum and the rounded end of the screw may obviate the risk with 1 mm of prominence. However, this observation may not hold true in an in vivo situation.
This study had several limitations. First, only a single brand of plate was used, making these findings specific to this system. However, concepts and conclusions can be extrapolated to all systems. The radial side had the highest risk for prominence, and this factor should be accounted for when selecting screw lengths. In addition, the ulnar column also poses some risk, but not to the degree of the radial column. Another limitation is that fractures were not created in these radii; therefore, dorsal comminution was not recreated. In some cases, the dorsal cortex may be displaced dorsally and be somewhat protective. This study is not meant to be an exhaustive study on all volar plates or provide absolute recommendations. It is meant to suggest caution to surgeons who may not be familiar with the complex anatomy of the dorsal radius and to identify areas where the risk for screw penetration is highest.
Shortening screw lengths at the positions described may trigger surgeons’ concerns about stabilizing distal radius fractures. In a 2012 biomechanical study, Wall and colleagues12 found no difference between unicortical screws (placed at 75% of the distance to the dorsal cortex) and bicortical screws in effectiveness in stabilizing distal radius fractures.12 The proposed reduction will result in the desired bicortical screw lengths but limit prominence. In addition, in the setting of dorsal comminution, the increased stability gained by bicortical fixation is minimal.
In fractures with an intact dorsal cortex, standard depth gauges will likely produce appropriate screw length measurements. However, even in this situation, and based on the results reported by Wall and colleagues,12 subtraction of 1 to 2 mm may prove prudent. In cases in which the dorsal cortex is comminuted and screw estimates based on fluoroscopy are used, the lateral image may provide estimates that lead to screw prominence. A 45° supinated view should be used to check screw length for the radial side, the column most at risk. However, comminution may also obscure this view. We cannot comment on that, as the present study did not create comminuted fractures of the distal radius. In addition, the ulnar column posed a lesser but real risk of screw prominence, which must also be accounted for, and typically is not appreciated with alternate views.
Last, use of live fluoroscopy instead of standard anteroposterior and lateral views may prove valuable in assessing hardware placement and screw length in the setting of a comminuted distal radius fracture. Through use of live fluoroscopy, prominent screws, especially those on the radial side, may be identified, and potential tendon injury may be avoided. Keeping in mind the shape of the dorsal aspect of the distal radius should assist surgeons in preventing screw prominence dorsally and limit complications.
1. Maschke SD, Evans PJ, Schub D, Drake R, Lawton JN. Radiographic evaluation of dorsal screw penetration after volar fixed-angle plating of the distal radius: a cadaveric study. Hand. 2007;2(3):144-150.
2. Nana AD, Joshi A, Lichtman DM. Plating of the distal radius. J Am Acad Orthop Surg. 2005;13(3):159-171.
3. Orbay JL, Fernandez DL. Volar fixed-angle plate fixation for unstable distal radius fractures in the elderly patient. J Hand Surg. 2004;29(1):96-102.
4. Protopsaltis TS, Ruch DS. Volar approach to distal radius fractures. J Hand Surg. 2008;33(6):958-965.
5. Koval KJ, Harrast JJ, Anglen JO, Weinstein JN. Fractures of the distal part of the radius. The evolution of practice over time. Where’s the evidence? J Bone Joint Surg Am. 2008;90(9):1855-1861.
6. Gruber G, Zacherl M, Giessauf C, et al. Quality of life after volar plate fixation of articular fractures of the distal part of the radius. J Bone Joint Surg Am. 2010;92(5):1170-1178.
7. Clement H, Pichler W, Nelson D, Hausleitner L, Tesch NP, Grechenig W. Morphometric analysis of Lister’s tubercle and its consequences on volar plate fixation of distal radius fractures. J Hand Surg. 2008;33(10):1716-1719.
8. Ozer K, Wolf JM, Watkins B, Hak DJ. Comparison of 4 fluoroscopic views for dorsal cortex screw penetration after volar plating of the distal radius. J Hand Surg. 2012;37(5):963-967.
9. Perry DC, Machin DM, Casaletto JA, Brown DJ. Minimising the risk of extensor pollicis longus rupture following volar plate fixation of distal radius fractures: a cadaveric study. Ann R Coll Surg Engl. 2011;93(1):57-60.
10. Wong-Chung J, Quinlan W. Rupture of extensor pollicis longus following fixation of a distal radius fracture. Injury. 1989;20(6):375-376.
11. Park DH, Goldie BS. Volar plating for distal radius fractures—do not trust the image intensifier when judging distal subchondral screw length. Tech Hand Up Extrem Surg. 2012;16(3):169-172.
12. Wall LB, Brodt MD, Silva MJ, Boyer MI, Calfee RP. The effects of screw length on stability of simulated osteoporotic distal radius fractures fixed with volar locking plates. J Hand Surg. 2012;37(3):446-453.
Trends in Thumb Carpometacarpal Interposition Arthroplasty in the United States, 2005–2011
A common entity, osteoarthritis (OA) at the base of the thumb is largely caused by the unique anatomy and biomechanics of the thumb carpometacarpal (CMC) joint.1 Radiographically evident CMC degeneration occurs in 40% of women and 25% of men over age 75 years, making the thumb CMC joint the most common site of surgical reconstruction for upper extremity OA.2,3
Over the past 40 years, numerous surgical techniques for managing thumb CMC-OA have been described. These include volar ligament reconstruction, first metacarpal osteotomy, CMC arthrodesis, CMC joint replacement, and trapeziectomy. Trapeziectomy can be performed in isolation or in combination with tendon interposition, ligament reconstruction, or ligament reconstruction and tendon interposition (LRTI).4-20 The authors of a recent systematic review concluded there is no evidence that any one surgical procedure for CMC-OA is superior to another in terms of pain, function, satisfaction, range of motion, or strength.4 Nevertheless, a recent survey found that 719 (62%) of 1156 US hand surgeons used LRTI as the treatment of choice for advanced CMC-OA.21
Our detailed literature search yielded no other database studies characterizing current trends in the practice patterns of US orthopedic surgeons who perform interposition arthroplasty for CMC arthritis. Analysis of these trends is important not only to patients but also to the broader orthopedic and health care community.22
We conducted a study to investigate current trends in CMC interposition arthroplasty across time, sex, age, and region of the United States; per-patient charges and reimbursements; and the association between this procedure and concomitantly performed carpal tunnel syndrome (CTS) and carpal tunnel release (CTR). In addition, we compared incidence of CMC interposition arthroplasty with that of CMC arthrodesis.
Patients and Methods
All data were derived from the PearlDiver Patient Records Database (PearlDiver Technologies), a publicly available database of patients. The database stores procedure volumes, demographics, and average charge information for patients with International Classification of Diseases, Ninth Revision (ICD-9) diagnoses and procedures or Current Procedural Terminology (CPT) codes. Data for the present study were drawn from the Medicare database within the PearlDiver records, which has a total of 179,094,296 patient records covering the period 2005–2011. This study did not require institutional review board approval, as it used existing, publicly available data without identifiers linked to subjects.
PearlDiver Technologies granted us database access for academic research. The database was stored on a password-protected server maintained by PearlDiver. ICD-9 and CPT codes can be searched in isolation or in combination. Search results yield number of patients with a searched code (or combination of codes) in each year, age group, or region of the United States, as well as mean charge and mean reimbursement for the code or combination of codes.
We used CPT code 25447 (arthroplasty, interposition, intercarpal, or CMC joints) to search the database for patients who underwent thumb CMC interposition arthroplasty. Although this code does not specify thumb, we are unaware of any procedure (other than thumb CMC interposition arthroplasty) typically given this code. Our search yielded procedure volumes, sex distribution, age distribution, region volumes, and mean per-patient charges and reimbursements for each CPT code. We then searched the resulting cohort for CTS (ICD-9 code 354.0), endoscopic CTR (CPT code 29848), and open CTR (CPT code 64721) to find CTR performed concomitantly with CMC interposition arthroplasty. Last, patients were tracked in the database past their surgery date to evaluate for postoperative physical or occupational therapy evaluations within 6 months (using CPT codes appearing in at least 1% of the cohort: 97001, 97003, 97004, 97110, 97112, 97124, 97140, 97150, 97350, 97535) and postoperative thumb, hand, or wrist radiographs within 6 months (using CPT codes appearing in at least 1% of the cohort: 73140, 73130, 73110). To ensure adequacy of 6-month postoperative data, we included in this portion of the study only those patients with surgery dates between 2005 and 2010.
For comparative purposes, we also searched the database for patients who underwent thumb CMC arthrodesis within the same period—using CPT codes 26841 and 26842 (arthrodesis CMC joint thumb, with or without internal fixation; with or without autograft) and CPT code 26820 (fusion in opposition, thumb, with autogenous graft).
Overall procedure volume data are reported as number of patients with the given CPT code in the database output in a given year. Age-group and sex analyses are reported as number of patients reported in the database output and as percentage of patients who underwent the CPT code of interest that year. Mean charges and reimbursements are reported as results by the database for the code of interest (CPT 25447). Data for the region analysis are presented as an incidence, as there is an uneven distribution of patient volumes among regions. This incidence is calculated as number of patients in a particular region and year normalized to total number of patients in the database for that particular region or year. Regions are defined as Midwest (IA, IL, IN, KS, MI, MN, MO, ND, NE, OH, SD, WI), Northeast (CT, MA, ME, NH, NJ, NY, PA, RI, VT), South (AL, AR, DC, DE, FL, GA, KY, LA, MD, MS, NC, OK, SC, TN, TX, VA, WV), and West (AK, AZ, CA, CO, HI, ID, MT, NM, NV, OR, UT, WA, WY).
Chi-squared linear-by-linear association analysis was used to determine statistical significance with regard to trends over time in procedure volumes, sex, age group, and region. For all statistical comparisons, P < .05 was considered significant.
Results
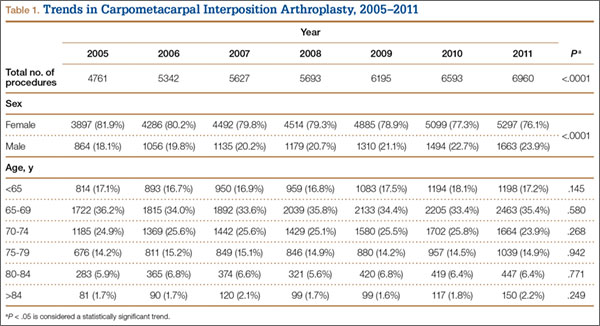
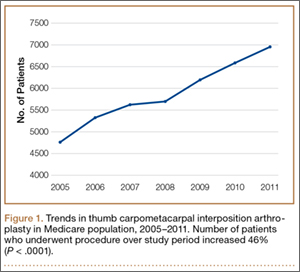
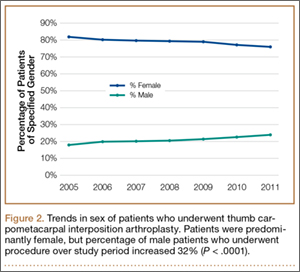
In the database, we identified 41,171 unique patients who underwent CMC interposition arthroplasty between 2005 and 2011. Over the 7-year study period, number of patients who had CMC interposition arthroplasty increased 46.2%, from 4761 in 2005 to 6960 in 2011 (P < .0001) (Table 1, Figure 1). Throughout this period, females underwent CMC interposition arthroplasty more frequently than males at all time points (P < .0001). Overall ratio of female to male patients, however, changed significantly. In 2005, 18.1% of all CMC interposition arthroplasties were performed on male patients; this increased to 23.9% of all procedures by 2011 (P < .0001) (Figure 2). Table 1 presents an age-group analysis. There were no significant differences in relative percentage of patients in any given age group who underwent CMC interposition arthroplasty over the study period.
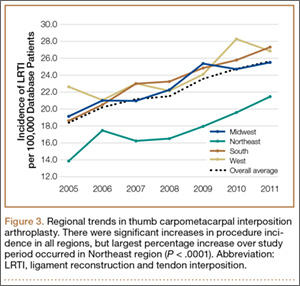
Analysis of overall procedure incidence by region revealed significant increases in all regions (P < .0001), ranging from 18.5% (West) to 54.5% (Northeast) (Figure 3). At all time points, the incidence of CMC interposition arthroplasty was significantly lower in the Northeast than in any other region and compared with the overall average.
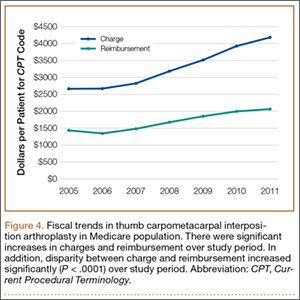
Between 2005 and 2011, there were significant increases in both per-patient charges and reimbursements for CMC interposition arthroplasty (Figure 4). Mean per-patient charge increased from $2676 in 2005 to $4181 in 2011 (P < .0001), and mean per-patient reimbursement increased from $1445 in 2005 to $2061 in 2011 (P < .0001). The discrepancy between charge and reimbursement increased throughout the study period: Reimbursement in 2005 was 54.0% of the charge; this decreased to 49.3% by 2011 but was not statistically significant (P = .08).
Overall, 40.9% of patients who underwent CMC interposition arthroplasty also had a CTS diagnosis. Between 15.5% and 17.3% of these patients had concomitant open or endoscopic CTR at time of CMC interposition arthroplasty (Table 2). Percentage of patients who underwent concomitant CTR did not change significantly from 2005 to 2011 (P = .139). Use of postoperative occupational and/or physical therapy increased significantly over the study period, from 33.5% of patients in 2005 to 50.7% of patients in 2010 (P < .0001). Use of postoperative thumb, hand, and/or wrist radiography also increased throughout the study period, from 7.4% of patients in 2005 to 18.7% of patients in 2010 (P < .0001).
![]()
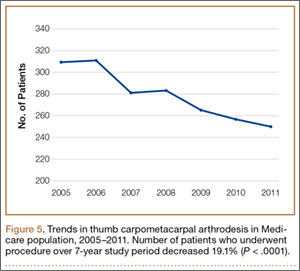
We identified 1916 unique patients who underwent thumb CMC arthrodesis between 2005 and 2011. Over the 7-year study period, there was a 19.1% decrease in number of patients who underwent CMC arthrodesis, from 309 in 2005 to 250 in 2011 (P < .0001) (Figure 5). Significantly fewer patients had CMC arthrodesis compared with CMC interposition arthroplasty at all time points, ranging from 6.5% (thumb CMC arthrodesis:CMC interposition arthroplasty) in 2005 to 3.6% in 2011 (P < .0001).
Discussion
Our results demonstrated a significant increase in use of thumb CMC interposition arthroplasty in a US Medicare population, with an increase of more than 46% from 2005 to 2011. This finding supports the findings of a recent cross-sectional survey-based study in which 719 (62%) of 1156 surveyed US hand surgeons reported performing trapeziectomy with LRTI for advanced thumb CMC-OA.21 A prior study had similar findings, with 692 (68%) of 1024 American Society for Surgery of the Hand (ASSH) members performing LRTI and 766 (75%) of 1024 performing some type of CMC interposition with trapeziectomy for advanced CMC-OA.23 This preference for CMC interposition arthroplasty prevails despite the fact that numerous studies have shown no superiority of any surgical procedure to another for CMC-OA in terms of pain, function, satisfaction, range of motion, and strength.7,15,18,19,24-34 Our data demonstrated that, not only does CMC interposition arthroplasty remain the most frequently used procedure for thumb CMC-OA, the incidence of CMC interposition arthroplasty continues to increase yearly.
The incidence of thumb CMC-OA is higher in women than in men, with more joint laxity a known contributor and subtle sex differences in trapezium geometry and congruence postulated as additional factors.3,35,36 This trend was confirmed in the present study, as females underwent significantly more CMC interposition arthroplasties at all time points. It is interesting that the overall ratio of female to male patients changed significantly over the study period, with the percentage of patients who were male increasing from 18.1% in 2005 to 23.9% in 2011. No previous studies have captured such a large cross section of the population to establish this trend. Although this trend is not necessarily intuitive, potential theories include increased acceptance of CMC interposition arthroplasty as a surgical option for male patients, and potentially a larger number of male patients seeking medical care for thumb CMC-OA in recent years.
Increases in procedure incidence were noted in all regions of the United States, but the largest percentage increase occurred in the Northeast. Despite this increase, the Northeast also had significantly lower CMC interposition arthroplasty incidence compared with all other regions and with the average procedure incidence throughout the study period—demonstrating some regional bias as to treatment of thumb CMC-OA. Unfortunately, because of database limitations and lack of specific CPT codes for other treatment options for thumb CMC-OA, we cannot ascertain if other types of surgery are more frequently used in the Northeast.
CTS and thumb CMC-OA often coexist.37 The estimated incidence of concomitant CTS in patients with CMC-OA is between 4% and 43%, but the rate of concomitant CTR and CMC interposition arthroplasty was not previously characterized in the literature.38,39 Results of the present study supported these findings; 41% of patients who underwent CMC interposition arthroplasty in our study also had a CTS diagnosis, compared with 43% in the 246-patient study by Florack and colleagues.38 We also found that 16% to 17% of patients who underwent CMC interposition arthroplasty underwent concomitant CTR; this rate remained consistent throughout the study period.
Our study demonstrated that, compared with CMC interposition arthroplasties, significantly fewer thumb CMC arthrodesis procedures were performed in the same Medicare population during the same period. Furthermore, the number of thumb CMC arthrodesis procedures declined yearly, with an overall decrease of 19% from 2005 to 2011. In a recent single-blinded, randomized trial, Vermeulen and colleagues40 compared thumb CMC arthrodesis and trapeziectomy with LRTI. They found superior patient satisfaction and significantly lower complication rates in women who underwent LRTI versus arthrodesis. The study was terminated prematurely because of these complications and thus was underpowered to determine differences in specific outcome measures. Previous studies comparing arthrodesis and interposition arthroplasties reported inconsistent outcomes. Hart and colleagues41 found no significant differences in pain or function between CMC arthrodesis and LRTI at a mean 7-year follow-up in a level II randomized controlled trial. Hartigan and colleagues15 reached similar conclusions in their retrospective comparison of the procedures. Without clear evidence supporting arthrodesis over interposition arthroplasty, the majority of surgeons favor interposition arthroplasty for thumb CMC-OA. Among Medicare patients, use of thumb CMC arthrodesis continues to fall.
This national database study had several limitations, which are common to all studies using the PearlDiver database22,42-47:
1. The power of the analysis depended on the quality of available data. Potential sources of error included accuracy of billing codes, and miscoding or noncoding by physicians.46
2. Although we used this database to try to accurately represent a large population of interest, we cannot guarantee the database represented a true cross section of the United States.
3. For the Medicare population, the PearlDiver database indexes data only in 7-year increments. Although the study period was long enough to detect significant trends, some data may not be accurately captured over a 7-year period.
4. Patients were not randomized to a treatment group.
5. The PearlDiver database does not include any clinical outcome data. Therefore, we cannot comment on the efficacy of the reported evaluations and interventions.
6. There is no specific CPT code for thumb CMC interposition arthroplasty. However, we are unaware of a CMC interposition arthroplasty performed for any area besides the thumb. Theoretically, the study population can include a negligible percentage of patients who had interposition arthroplasty of a CMC joint other than the thumb.
7. The database cannot be searched for use of thumb CMC-OA surgical techniques other than CMC interposition arthroplasty or arthrodesis, as isolated trapeziectomy, volar ligament reconstruction, implant arthroplasty, and metacarpal osteotomy lack specific CPT codes.
Conclusion
Thumb CMC-OA is a common entity among Medicare patients. There are numerous surgical options for cases that have failed conservative treatment. Despite the lack of evidence that thumb CMC interposition arthroplasty is superior to other surgical options, the number of patients who had this procedure increased 46% during the 2005–2011 study period. Although the majority of patients who undergo CMC interposition arthroplasty are female, the percentage of male patients has increased significantly. More than 40% of patients who have CMC interposition arthroplasty are also diagnosed with CTS, and 16% to 17% of patients who have CMC interposition arthroplasty will have a concomitant CTR. CMC arthrodesis is used in significantly fewer patients of Medicare age, and its use has been declining.
1. Hentz VR. Surgical treatment of trapeziometacarpal joint arthritis: a historical perspective. Clin Orthop Relat Res. 2014;472(4):1184-1189.
2. Armstrong AL, Hunter JB, Davis TR. The prevalence of degenerative arthritis of the base of the thumb in post-menopausal women. J Hand Surg Br. 1994;19(3):340-341.
3. Van Heest AE, Kallemeier P. Thumb carpal metacarpal arthritis. J Am Acad Orthop Surg. 2008;16(3):140-151.
4. Vermeulen GM, Slijper H, Feitz R, Hovius SE, Moojen TM, Selles RW. Surgical management of primary thumb carpometacarpal osteoarthritis: a systematic review. J Hand Surg Am. 2011;36(1):157-169.
5. Bodin ND, Spangler R, Thoder JJ. Interposition arthroplasty options for carpometacarpal arthritis of the thumb. Hand Clin. 2010;26(3):339-350, v-vi.
6. Cooney WP, Linscheid RL, Askew LJ. Total arthroplasty of the thumb trapeziometacarpal joint. Clin Orthop Relat Res. 1987;(220):35-45.
7. De Smet L, Vandenberghe L, Degreef I. Long-term outcome of trapeziectomy with ligament reconstruction and tendon interposition (LRTI) versus prosthesis arthroplasty for basal joint osteoarthritis of the thumb. Acta Orthop Belg. 2013;79(2):146-149.
8. Dell PC, Muniz RB. Interposition arthroplasty of the trapeziometacarpal joint for osteoarthritis. Clin Orthop Relat Res. 1987;(220):27-34.
9. Dhar S, Gray IC, Jones WA, Beddow FH. Simple excision of the trapezium for osteoarthritis of the carpometacarpal joint of the thumb. J Hand Surg Br. 1994;19(4):485-488.
10. Eaton RG, Littler JW. Ligament reconstruction for the painful thumb carpometacarpal joint. J Bone Joint Surg Am. 1973;55(8):1655-1666.
11. Eaton RG, Lane LB, Littler JW, Keyser JJ. Ligament reconstruction for the painful thumb carpometacarpal joint: a long-term assessment. J Hand Surg Am. 1984;9(5):692-699.
12. Eaton RG, Glickel SZ, Littler JW. Tendon interposition arthroplasty for degenerative arthritis of the trapeziometacarpal joint of the thumb. J Hand Surg Am. 1985;10(5):645-654.
13. Elfar JC, Burton RI. Ligament reconstruction and tendon interposition for thumb basal arthritis. Hand Clin. 2013;29(1):15-25.
14. Froimson AI. Tendon arthroplasty of the trapeziometacarpal joint. Clin Orthop Relat Res. 1970;70:191-199.
15. Hartigan BJ, Stern PJ, Kiefhaber TR. Thumb carpometacarpal osteoarthritis: arthrodesis compared with ligament reconstruction and tendon interposition. J Bone Joint Surg Am. 2001;83(10):1470-1478.
16. Kenniston JA, Bozentka DJ. Treatment of advanced carpometacarpal joint disease: arthrodesis. Hand Clin. 2008;24(3):285-294, vi-vii.
17. Kokkalis ZT, Zanaros G, Weiser RW, Sotereanos DG. Trapezium resection with suspension and interposition arthroplasty using acellular dermal allograft for thumb carpometacarpal arthritis. J Hand Surg Am. 2009;34(6):1029-1036.
18. Kriegs-Au G, Petje G, Fojtl E, Ganger R, Zachs I. Ligament reconstruction with or without tendon interposition to treat primary thumb carpometacarpal osteoarthritis. Surgical technique. J Bone Joint Surg Am. 2005;87 suppl 1(Pt 1):78-85.
19. Park MJ, Lichtman G, Christian JB, et al. Surgical treatment of thumb carpometacarpal joint arthritis: a single institution experience from 1995–2005. Hand. 2008;3(4):304-310.
20. Park MJ, Lee AT, Yao J. Treatment of thumb carpometacarpal arthritis with arthroscopic hemitrapeziectomy and interposition arthroplasty. Orthopedics. 2012;35(12):e1759-e1764.
21. Wolf JM, Delaronde S. Current trends in nonoperative and operative treatment of trapeziometacarpal osteoarthritis: a survey of US hand surgeons. J Hand Surg Am. 2012;37(1):77-82.
22. Zhang AL, Kreulen C, Ngo SS, Hame SL, Wang JC, Gamradt SC. Demographic trends in arthroscopic SLAP repair in the United States. Am J Sports Med. 2012;40(5):1144-1147.
23. Brunton LM, Wilgis EF. A survey to determine current practice patterns in the surgical treatment of advanced thumb carpometacarpal osteoarthrosis. Hand. 2010;5(4):415-422.
24. Belcher HJ, Nicholl JE. A comparison of trapeziectomy with and without ligament reconstruction and tendon interposition. J Hand Surg Br. 2000;25(4):350-356.
25. Davis TR, Pace A. Trapeziectomy for trapeziometacarpal joint osteoarthritis: is ligament reconstruction and temporary stabilisation of the pseudarthrosis with a Kirschner wire important? J Hand Surg Eur Vol. 2009;34(3):312-321.
26. Davis TR, Brady O, Dias JJ. Excision of the trapezium for osteoarthritis of the trapeziometacarpal joint: a study of the benefit of ligament reconstruction or tendon interposition. J Hand Surg Am. 2004;29(6):1069-1077.
27. De Smet L, Sioen W, Spaepen D, van Ransbeeck H. Treatment of basal joint arthritis of the thumb: trapeziectomy with or without tendon interposition/ligament reconstruction. Hand Surg. 2004;9(1):5-9.
28. Field J, Buchanan D. To suspend or not to suspend: a randomised single blind trial of simple trapeziectomy versus trapeziectomy and flexor carpi radialis suspension. J Hand Surg Eur Vol. 2007;32(4):462-466.
29. Gerwin M, Griffith A, Weiland AJ, Hotchkiss RN, McCormack RR. Ligament reconstruction basal joint arthroplasty without tendon interposition. Clin Orthop Relat Res. 1997;(342):42-45.
30. Jorheim M, Isaxon I, Flondell M, Kalen P, Atroshi I. Short-term outcomes of trapeziometacarpal Artelon implant compared with tendon suspension interposition arthroplasty for osteoarthritis: a matched cohort study. J Hand Surg Am. 2009;34(8):1381-1387.
31. Lehmann O, Herren DB, Simmen BR. Comparison of tendon suspension-interposition and silicon spacers in the treatment of degenerative osteoarthritis of the base of the thumb. Ann Chir Main Memb Super. 1998;17(1):25-30.
32. Nilsson A, Liljensten E, Bergstrom C, Sollerman C. Results from a degradable TMC joint spacer (Artelon) compared with tendon arthroplasty. J Hand Surg Am. 2005;30(2):380-389.
33. Schroder J, Kerkhoffs GM, Voerman HJ, Marti RK. Surgical treatment of basal joint disease of the thumb: comparison between resection-interposition arthroplasty and trapezio-metacarpal arthrodesis. Arch Orthop Trauma Surg. 2002;122(1):35-38.
34. Tagil M, Kopylov P. Swanson versus APL arthroplasty in the treatment of osteoarthritis of the trapeziometacarpal joint: a prospective and randomized study in 26 patients. J Hand Surg Br. 2002;27(5):452-456.
35. North ER, Rutledge WM. The trapezium-thumb metacarpal joint: the relationship of joint shape and degenerative joint disease. Hand. 1983;15(2):201-206.
36. Ateshian GA, Rosenwasser MP, Mow VC. Curvature characteristics and congruence of the thumb carpometacarpal joint: differences between female and male joints. J Biomech. 1992;25(6):591-607.
37. Sless Y, Sampson SP. Experience with transtrapezium approach for transverse carpal ligament release in patients with coexisted trapeziometacarpal joint osteoarthritis and carpal tunnel syndrome. Hand. 2007;2(3):151-154.
38. Florack TM, Miller RJ, Pellegrini VD, Burton RI, Dunn MG. The prevalence of carpal tunnel syndrome in patients with basal joint arthritis of the thumb. J Hand Surg Am. 1992;17(4):624-630.
39. Tsai TM, Laurentin-Perez LA, Wong MS, Tamai M. Ideas and innovations: radial approach to carpal tunnel release in conjunction with thumb carpometacarpal arthroplasty. Hand Surg. 2005;10(1):61-66.
40. Vermeulen GM, Brink SM, Slijper H, et al. Trapeziometacarpal arthrodesis or trapeziectomy with ligament reconstruction in primary trapeziometacarpal osteoarthritis: a randomized controlled trial. J Bone Joint Surg Am. 2014;96(9):726-733.
41. Hart R, Janecek M, Siska V, Kucera B, Stipcak V. Interposition suspension arthroplasty according to Epping versus arthrodesis for trapeziometacarpal osteoarthritis. Eur Surg. 2006;38(6):433-438.
42. Abrams GD, Frank RM, Gupta AK, Harris JD, McCormick FM, Cole BJ. Trends in meniscus repair and meniscectomy in the United States, 2005–2011. Am J Sports Med. 2013;41(10):2333-2339.
43. Montgomery SR, Ngo SS, Hobson T, et al. Trends and demographics in hip arthroscopy in the United States. Arthroscopy. 2013;29(4):661-665.
44. Zhang AL, Montgomery SR, Ngo SS, Hame SL, Wang JC, Gamradt SC. Arthroscopic versus open shoulder stabilization: current practice patterns in the United States. Arthroscopy. 2014;30(4):436-443.
45. Yeranosian MG, Arshi A, Terrell RD, Wang JC, McAllister DR, Petrigliano FA. Incidence of acute postoperative infections requiring reoperation after arthroscopic shoulder surgery. Am J Sports Med. 2014;42(2):437-441.
46. Yeranosian MG, Terrell RD, Wang JC, McAllister DR, Petrigliano FA. The costs associated with the evaluation of rotator cuff tears before surgical repair. J Shoulder Elbow Surg. 2013;22(12):1662-1666.
47. Daffner SD, Hymanson HJ, Wang JC. Cost and use of conservative management of lumbar disc herniation before surgical discectomy. Spine J. 2010;10(6):463-468.
A common entity, osteoarthritis (OA) at the base of the thumb is largely caused by the unique anatomy and biomechanics of the thumb carpometacarpal (CMC) joint.1 Radiographically evident CMC degeneration occurs in 40% of women and 25% of men over age 75 years, making the thumb CMC joint the most common site of surgical reconstruction for upper extremity OA.2,3
Over the past 40 years, numerous surgical techniques for managing thumb CMC-OA have been described. These include volar ligament reconstruction, first metacarpal osteotomy, CMC arthrodesis, CMC joint replacement, and trapeziectomy. Trapeziectomy can be performed in isolation or in combination with tendon interposition, ligament reconstruction, or ligament reconstruction and tendon interposition (LRTI).4-20 The authors of a recent systematic review concluded there is no evidence that any one surgical procedure for CMC-OA is superior to another in terms of pain, function, satisfaction, range of motion, or strength.4 Nevertheless, a recent survey found that 719 (62%) of 1156 US hand surgeons used LRTI as the treatment of choice for advanced CMC-OA.21
Our detailed literature search yielded no other database studies characterizing current trends in the practice patterns of US orthopedic surgeons who perform interposition arthroplasty for CMC arthritis. Analysis of these trends is important not only to patients but also to the broader orthopedic and health care community.22
We conducted a study to investigate current trends in CMC interposition arthroplasty across time, sex, age, and region of the United States; per-patient charges and reimbursements; and the association between this procedure and concomitantly performed carpal tunnel syndrome (CTS) and carpal tunnel release (CTR). In addition, we compared incidence of CMC interposition arthroplasty with that of CMC arthrodesis.
Patients and Methods
All data were derived from the PearlDiver Patient Records Database (PearlDiver Technologies), a publicly available database of patients. The database stores procedure volumes, demographics, and average charge information for patients with International Classification of Diseases, Ninth Revision (ICD-9) diagnoses and procedures or Current Procedural Terminology (CPT) codes. Data for the present study were drawn from the Medicare database within the PearlDiver records, which has a total of 179,094,296 patient records covering the period 2005–2011. This study did not require institutional review board approval, as it used existing, publicly available data without identifiers linked to subjects.
PearlDiver Technologies granted us database access for academic research. The database was stored on a password-protected server maintained by PearlDiver. ICD-9 and CPT codes can be searched in isolation or in combination. Search results yield number of patients with a searched code (or combination of codes) in each year, age group, or region of the United States, as well as mean charge and mean reimbursement for the code or combination of codes.
We used CPT code 25447 (arthroplasty, interposition, intercarpal, or CMC joints) to search the database for patients who underwent thumb CMC interposition arthroplasty. Although this code does not specify thumb, we are unaware of any procedure (other than thumb CMC interposition arthroplasty) typically given this code. Our search yielded procedure volumes, sex distribution, age distribution, region volumes, and mean per-patient charges and reimbursements for each CPT code. We then searched the resulting cohort for CTS (ICD-9 code 354.0), endoscopic CTR (CPT code 29848), and open CTR (CPT code 64721) to find CTR performed concomitantly with CMC interposition arthroplasty. Last, patients were tracked in the database past their surgery date to evaluate for postoperative physical or occupational therapy evaluations within 6 months (using CPT codes appearing in at least 1% of the cohort: 97001, 97003, 97004, 97110, 97112, 97124, 97140, 97150, 97350, 97535) and postoperative thumb, hand, or wrist radiographs within 6 months (using CPT codes appearing in at least 1% of the cohort: 73140, 73130, 73110). To ensure adequacy of 6-month postoperative data, we included in this portion of the study only those patients with surgery dates between 2005 and 2010.
For comparative purposes, we also searched the database for patients who underwent thumb CMC arthrodesis within the same period—using CPT codes 26841 and 26842 (arthrodesis CMC joint thumb, with or without internal fixation; with or without autograft) and CPT code 26820 (fusion in opposition, thumb, with autogenous graft).
Overall procedure volume data are reported as number of patients with the given CPT code in the database output in a given year. Age-group and sex analyses are reported as number of patients reported in the database output and as percentage of patients who underwent the CPT code of interest that year. Mean charges and reimbursements are reported as results by the database for the code of interest (CPT 25447). Data for the region analysis are presented as an incidence, as there is an uneven distribution of patient volumes among regions. This incidence is calculated as number of patients in a particular region and year normalized to total number of patients in the database for that particular region or year. Regions are defined as Midwest (IA, IL, IN, KS, MI, MN, MO, ND, NE, OH, SD, WI), Northeast (CT, MA, ME, NH, NJ, NY, PA, RI, VT), South (AL, AR, DC, DE, FL, GA, KY, LA, MD, MS, NC, OK, SC, TN, TX, VA, WV), and West (AK, AZ, CA, CO, HI, ID, MT, NM, NV, OR, UT, WA, WY).
Chi-squared linear-by-linear association analysis was used to determine statistical significance with regard to trends over time in procedure volumes, sex, age group, and region. For all statistical comparisons, P < .05 was considered significant.
Results
In the database, we identified 41,171 unique patients who underwent CMC interposition arthroplasty between 2005 and 2011. Over the 7-year study period, number of patients who had CMC interposition arthroplasty increased 46.2%, from 4761 in 2005 to 6960 in 2011 (P < .0001) (Table 1, Figure 1). Throughout this period, females underwent CMC interposition arthroplasty more frequently than males at all time points (P < .0001). Overall ratio of female to male patients, however, changed significantly. In 2005, 18.1% of all CMC interposition arthroplasties were performed on male patients; this increased to 23.9% of all procedures by 2011 (P < .0001) (Figure 2). Table 1 presents an age-group analysis. There were no significant differences in relative percentage of patients in any given age group who underwent CMC interposition arthroplasty over the study period.
Analysis of overall procedure incidence by region revealed significant increases in all regions (P < .0001), ranging from 18.5% (West) to 54.5% (Northeast) (Figure 3). At all time points, the incidence of CMC interposition arthroplasty was significantly lower in the Northeast than in any other region and compared with the overall average.
Between 2005 and 2011, there were significant increases in both per-patient charges and reimbursements for CMC interposition arthroplasty (Figure 4). Mean per-patient charge increased from $2676 in 2005 to $4181 in 2011 (P < .0001), and mean per-patient reimbursement increased from $1445 in 2005 to $2061 in 2011 (P < .0001). The discrepancy between charge and reimbursement increased throughout the study period: Reimbursement in 2005 was 54.0% of the charge; this decreased to 49.3% by 2011 but was not statistically significant (P = .08).
Overall, 40.9% of patients who underwent CMC interposition arthroplasty also had a CTS diagnosis. Between 15.5% and 17.3% of these patients had concomitant open or endoscopic CTR at time of CMC interposition arthroplasty (Table 2). Percentage of patients who underwent concomitant CTR did not change significantly from 2005 to 2011 (P = .139). Use of postoperative occupational and/or physical therapy increased significantly over the study period, from 33.5% of patients in 2005 to 50.7% of patients in 2010 (P < .0001). Use of postoperative thumb, hand, and/or wrist radiography also increased throughout the study period, from 7.4% of patients in 2005 to 18.7% of patients in 2010 (P < .0001).
![]()
We identified 1916 unique patients who underwent thumb CMC arthrodesis between 2005 and 2011. Over the 7-year study period, there was a 19.1% decrease in number of patients who underwent CMC arthrodesis, from 309 in 2005 to 250 in 2011 (P < .0001) (Figure 5). Significantly fewer patients had CMC arthrodesis compared with CMC interposition arthroplasty at all time points, ranging from 6.5% (thumb CMC arthrodesis:CMC interposition arthroplasty) in 2005 to 3.6% in 2011 (P < .0001).
Discussion
Our results demonstrated a significant increase in use of thumb CMC interposition arthroplasty in a US Medicare population, with an increase of more than 46% from 2005 to 2011. This finding supports the findings of a recent cross-sectional survey-based study in which 719 (62%) of 1156 surveyed US hand surgeons reported performing trapeziectomy with LRTI for advanced thumb CMC-OA.21 A prior study had similar findings, with 692 (68%) of 1024 American Society for Surgery of the Hand (ASSH) members performing LRTI and 766 (75%) of 1024 performing some type of CMC interposition with trapeziectomy for advanced CMC-OA.23 This preference for CMC interposition arthroplasty prevails despite the fact that numerous studies have shown no superiority of any surgical procedure to another for CMC-OA in terms of pain, function, satisfaction, range of motion, and strength.7,15,18,19,24-34 Our data demonstrated that, not only does CMC interposition arthroplasty remain the most frequently used procedure for thumb CMC-OA, the incidence of CMC interposition arthroplasty continues to increase yearly.
The incidence of thumb CMC-OA is higher in women than in men, with more joint laxity a known contributor and subtle sex differences in trapezium geometry and congruence postulated as additional factors.3,35,36 This trend was confirmed in the present study, as females underwent significantly more CMC interposition arthroplasties at all time points. It is interesting that the overall ratio of female to male patients changed significantly over the study period, with the percentage of patients who were male increasing from 18.1% in 2005 to 23.9% in 2011. No previous studies have captured such a large cross section of the population to establish this trend. Although this trend is not necessarily intuitive, potential theories include increased acceptance of CMC interposition arthroplasty as a surgical option for male patients, and potentially a larger number of male patients seeking medical care for thumb CMC-OA in recent years.
Increases in procedure incidence were noted in all regions of the United States, but the largest percentage increase occurred in the Northeast. Despite this increase, the Northeast also had significantly lower CMC interposition arthroplasty incidence compared with all other regions and with the average procedure incidence throughout the study period—demonstrating some regional bias as to treatment of thumb CMC-OA. Unfortunately, because of database limitations and lack of specific CPT codes for other treatment options for thumb CMC-OA, we cannot ascertain if other types of surgery are more frequently used in the Northeast.
CTS and thumb CMC-OA often coexist.37 The estimated incidence of concomitant CTS in patients with CMC-OA is between 4% and 43%, but the rate of concomitant CTR and CMC interposition arthroplasty was not previously characterized in the literature.38,39 Results of the present study supported these findings; 41% of patients who underwent CMC interposition arthroplasty in our study also had a CTS diagnosis, compared with 43% in the 246-patient study by Florack and colleagues.38 We also found that 16% to 17% of patients who underwent CMC interposition arthroplasty underwent concomitant CTR; this rate remained consistent throughout the study period.
Our study demonstrated that, compared with CMC interposition arthroplasties, significantly fewer thumb CMC arthrodesis procedures were performed in the same Medicare population during the same period. Furthermore, the number of thumb CMC arthrodesis procedures declined yearly, with an overall decrease of 19% from 2005 to 2011. In a recent single-blinded, randomized trial, Vermeulen and colleagues40 compared thumb CMC arthrodesis and trapeziectomy with LRTI. They found superior patient satisfaction and significantly lower complication rates in women who underwent LRTI versus arthrodesis. The study was terminated prematurely because of these complications and thus was underpowered to determine differences in specific outcome measures. Previous studies comparing arthrodesis and interposition arthroplasties reported inconsistent outcomes. Hart and colleagues41 found no significant differences in pain or function between CMC arthrodesis and LRTI at a mean 7-year follow-up in a level II randomized controlled trial. Hartigan and colleagues15 reached similar conclusions in their retrospective comparison of the procedures. Without clear evidence supporting arthrodesis over interposition arthroplasty, the majority of surgeons favor interposition arthroplasty for thumb CMC-OA. Among Medicare patients, use of thumb CMC arthrodesis continues to fall.
This national database study had several limitations, which are common to all studies using the PearlDiver database22,42-47:
1. The power of the analysis depended on the quality of available data. Potential sources of error included accuracy of billing codes, and miscoding or noncoding by physicians.46
2. Although we used this database to try to accurately represent a large population of interest, we cannot guarantee the database represented a true cross section of the United States.
3. For the Medicare population, the PearlDiver database indexes data only in 7-year increments. Although the study period was long enough to detect significant trends, some data may not be accurately captured over a 7-year period.
4. Patients were not randomized to a treatment group.
5. The PearlDiver database does not include any clinical outcome data. Therefore, we cannot comment on the efficacy of the reported evaluations and interventions.
6. There is no specific CPT code for thumb CMC interposition arthroplasty. However, we are unaware of a CMC interposition arthroplasty performed for any area besides the thumb. Theoretically, the study population can include a negligible percentage of patients who had interposition arthroplasty of a CMC joint other than the thumb.
7. The database cannot be searched for use of thumb CMC-OA surgical techniques other than CMC interposition arthroplasty or arthrodesis, as isolated trapeziectomy, volar ligament reconstruction, implant arthroplasty, and metacarpal osteotomy lack specific CPT codes.
Conclusion
Thumb CMC-OA is a common entity among Medicare patients. There are numerous surgical options for cases that have failed conservative treatment. Despite the lack of evidence that thumb CMC interposition arthroplasty is superior to other surgical options, the number of patients who had this procedure increased 46% during the 2005–2011 study period. Although the majority of patients who undergo CMC interposition arthroplasty are female, the percentage of male patients has increased significantly. More than 40% of patients who have CMC interposition arthroplasty are also diagnosed with CTS, and 16% to 17% of patients who have CMC interposition arthroplasty will have a concomitant CTR. CMC arthrodesis is used in significantly fewer patients of Medicare age, and its use has been declining.
1. Hentz VR. Surgical treatment of trapeziometacarpal joint arthritis: a historical perspective. Clin Orthop Relat Res. 2014;472(4):1184-1189.
2. Armstrong AL, Hunter JB, Davis TR. The prevalence of degenerative arthritis of the base of the thumb in post-menopausal women. J Hand Surg Br. 1994;19(3):340-341.
3. Van Heest AE, Kallemeier P. Thumb carpal metacarpal arthritis. J Am Acad Orthop Surg. 2008;16(3):140-151.
4. Vermeulen GM, Slijper H, Feitz R, Hovius SE, Moojen TM, Selles RW. Surgical management of primary thumb carpometacarpal osteoarthritis: a systematic review. J Hand Surg Am. 2011;36(1):157-169.
5. Bodin ND, Spangler R, Thoder JJ. Interposition arthroplasty options for carpometacarpal arthritis of the thumb. Hand Clin. 2010;26(3):339-350, v-vi.
6. Cooney WP, Linscheid RL, Askew LJ. Total arthroplasty of the thumb trapeziometacarpal joint. Clin Orthop Relat Res. 1987;(220):35-45.
7. De Smet L, Vandenberghe L, Degreef I. Long-term outcome of trapeziectomy with ligament reconstruction and tendon interposition (LRTI) versus prosthesis arthroplasty for basal joint osteoarthritis of the thumb. Acta Orthop Belg. 2013;79(2):146-149.
8. Dell PC, Muniz RB. Interposition arthroplasty of the trapeziometacarpal joint for osteoarthritis. Clin Orthop Relat Res. 1987;(220):27-34.
9. Dhar S, Gray IC, Jones WA, Beddow FH. Simple excision of the trapezium for osteoarthritis of the carpometacarpal joint of the thumb. J Hand Surg Br. 1994;19(4):485-488.
10. Eaton RG, Littler JW. Ligament reconstruction for the painful thumb carpometacarpal joint. J Bone Joint Surg Am. 1973;55(8):1655-1666.
11. Eaton RG, Lane LB, Littler JW, Keyser JJ. Ligament reconstruction for the painful thumb carpometacarpal joint: a long-term assessment. J Hand Surg Am. 1984;9(5):692-699.
12. Eaton RG, Glickel SZ, Littler JW. Tendon interposition arthroplasty for degenerative arthritis of the trapeziometacarpal joint of the thumb. J Hand Surg Am. 1985;10(5):645-654.
13. Elfar JC, Burton RI. Ligament reconstruction and tendon interposition for thumb basal arthritis. Hand Clin. 2013;29(1):15-25.
14. Froimson AI. Tendon arthroplasty of the trapeziometacarpal joint. Clin Orthop Relat Res. 1970;70:191-199.
15. Hartigan BJ, Stern PJ, Kiefhaber TR. Thumb carpometacarpal osteoarthritis: arthrodesis compared with ligament reconstruction and tendon interposition. J Bone Joint Surg Am. 2001;83(10):1470-1478.
16. Kenniston JA, Bozentka DJ. Treatment of advanced carpometacarpal joint disease: arthrodesis. Hand Clin. 2008;24(3):285-294, vi-vii.
17. Kokkalis ZT, Zanaros G, Weiser RW, Sotereanos DG. Trapezium resection with suspension and interposition arthroplasty using acellular dermal allograft for thumb carpometacarpal arthritis. J Hand Surg Am. 2009;34(6):1029-1036.
18. Kriegs-Au G, Petje G, Fojtl E, Ganger R, Zachs I. Ligament reconstruction with or without tendon interposition to treat primary thumb carpometacarpal osteoarthritis. Surgical technique. J Bone Joint Surg Am. 2005;87 suppl 1(Pt 1):78-85.
19. Park MJ, Lichtman G, Christian JB, et al. Surgical treatment of thumb carpometacarpal joint arthritis: a single institution experience from 1995–2005. Hand. 2008;3(4):304-310.
20. Park MJ, Lee AT, Yao J. Treatment of thumb carpometacarpal arthritis with arthroscopic hemitrapeziectomy and interposition arthroplasty. Orthopedics. 2012;35(12):e1759-e1764.
21. Wolf JM, Delaronde S. Current trends in nonoperative and operative treatment of trapeziometacarpal osteoarthritis: a survey of US hand surgeons. J Hand Surg Am. 2012;37(1):77-82.
22. Zhang AL, Kreulen C, Ngo SS, Hame SL, Wang JC, Gamradt SC. Demographic trends in arthroscopic SLAP repair in the United States. Am J Sports Med. 2012;40(5):1144-1147.
23. Brunton LM, Wilgis EF. A survey to determine current practice patterns in the surgical treatment of advanced thumb carpometacarpal osteoarthrosis. Hand. 2010;5(4):415-422.
24. Belcher HJ, Nicholl JE. A comparison of trapeziectomy with and without ligament reconstruction and tendon interposition. J Hand Surg Br. 2000;25(4):350-356.
25. Davis TR, Pace A. Trapeziectomy for trapeziometacarpal joint osteoarthritis: is ligament reconstruction and temporary stabilisation of the pseudarthrosis with a Kirschner wire important? J Hand Surg Eur Vol. 2009;34(3):312-321.
26. Davis TR, Brady O, Dias JJ. Excision of the trapezium for osteoarthritis of the trapeziometacarpal joint: a study of the benefit of ligament reconstruction or tendon interposition. J Hand Surg Am. 2004;29(6):1069-1077.
27. De Smet L, Sioen W, Spaepen D, van Ransbeeck H. Treatment of basal joint arthritis of the thumb: trapeziectomy with or without tendon interposition/ligament reconstruction. Hand Surg. 2004;9(1):5-9.
28. Field J, Buchanan D. To suspend or not to suspend: a randomised single blind trial of simple trapeziectomy versus trapeziectomy and flexor carpi radialis suspension. J Hand Surg Eur Vol. 2007;32(4):462-466.
29. Gerwin M, Griffith A, Weiland AJ, Hotchkiss RN, McCormack RR. Ligament reconstruction basal joint arthroplasty without tendon interposition. Clin Orthop Relat Res. 1997;(342):42-45.
30. Jorheim M, Isaxon I, Flondell M, Kalen P, Atroshi I. Short-term outcomes of trapeziometacarpal Artelon implant compared with tendon suspension interposition arthroplasty for osteoarthritis: a matched cohort study. J Hand Surg Am. 2009;34(8):1381-1387.
31. Lehmann O, Herren DB, Simmen BR. Comparison of tendon suspension-interposition and silicon spacers in the treatment of degenerative osteoarthritis of the base of the thumb. Ann Chir Main Memb Super. 1998;17(1):25-30.
32. Nilsson A, Liljensten E, Bergstrom C, Sollerman C. Results from a degradable TMC joint spacer (Artelon) compared with tendon arthroplasty. J Hand Surg Am. 2005;30(2):380-389.
33. Schroder J, Kerkhoffs GM, Voerman HJ, Marti RK. Surgical treatment of basal joint disease of the thumb: comparison between resection-interposition arthroplasty and trapezio-metacarpal arthrodesis. Arch Orthop Trauma Surg. 2002;122(1):35-38.
34. Tagil M, Kopylov P. Swanson versus APL arthroplasty in the treatment of osteoarthritis of the trapeziometacarpal joint: a prospective and randomized study in 26 patients. J Hand Surg Br. 2002;27(5):452-456.
35. North ER, Rutledge WM. The trapezium-thumb metacarpal joint: the relationship of joint shape and degenerative joint disease. Hand. 1983;15(2):201-206.
36. Ateshian GA, Rosenwasser MP, Mow VC. Curvature characteristics and congruence of the thumb carpometacarpal joint: differences between female and male joints. J Biomech. 1992;25(6):591-607.
37. Sless Y, Sampson SP. Experience with transtrapezium approach for transverse carpal ligament release in patients with coexisted trapeziometacarpal joint osteoarthritis and carpal tunnel syndrome. Hand. 2007;2(3):151-154.
38. Florack TM, Miller RJ, Pellegrini VD, Burton RI, Dunn MG. The prevalence of carpal tunnel syndrome in patients with basal joint arthritis of the thumb. J Hand Surg Am. 1992;17(4):624-630.
39. Tsai TM, Laurentin-Perez LA, Wong MS, Tamai M. Ideas and innovations: radial approach to carpal tunnel release in conjunction with thumb carpometacarpal arthroplasty. Hand Surg. 2005;10(1):61-66.
40. Vermeulen GM, Brink SM, Slijper H, et al. Trapeziometacarpal arthrodesis or trapeziectomy with ligament reconstruction in primary trapeziometacarpal osteoarthritis: a randomized controlled trial. J Bone Joint Surg Am. 2014;96(9):726-733.
41. Hart R, Janecek M, Siska V, Kucera B, Stipcak V. Interposition suspension arthroplasty according to Epping versus arthrodesis for trapeziometacarpal osteoarthritis. Eur Surg. 2006;38(6):433-438.
42. Abrams GD, Frank RM, Gupta AK, Harris JD, McCormick FM, Cole BJ. Trends in meniscus repair and meniscectomy in the United States, 2005–2011. Am J Sports Med. 2013;41(10):2333-2339.
43. Montgomery SR, Ngo SS, Hobson T, et al. Trends and demographics in hip arthroscopy in the United States. Arthroscopy. 2013;29(4):661-665.
44. Zhang AL, Montgomery SR, Ngo SS, Hame SL, Wang JC, Gamradt SC. Arthroscopic versus open shoulder stabilization: current practice patterns in the United States. Arthroscopy. 2014;30(4):436-443.
45. Yeranosian MG, Arshi A, Terrell RD, Wang JC, McAllister DR, Petrigliano FA. Incidence of acute postoperative infections requiring reoperation after arthroscopic shoulder surgery. Am J Sports Med. 2014;42(2):437-441.
46. Yeranosian MG, Terrell RD, Wang JC, McAllister DR, Petrigliano FA. The costs associated with the evaluation of rotator cuff tears before surgical repair. J Shoulder Elbow Surg. 2013;22(12):1662-1666.
47. Daffner SD, Hymanson HJ, Wang JC. Cost and use of conservative management of lumbar disc herniation before surgical discectomy. Spine J. 2010;10(6):463-468.

Handoffs From ED to Inpatient Care
Handoffs are the exchange of information between health professionals that accompany the transfer of patient‐care responsibility.[1] Poor handoff practices are associated with unsafe and inefficient care.[2, 3, 4] Teaching hospitals are especially at risk, as resident work‐hour restrictions have increased the number of handoffs.[5] Accreditation agencies now require that hospitals and residency programs have structured handoff processes[6, 7] and that medical students[8] and residents[9, 10, 11, 12] demonstrate competency in handoffs.
Physician handoff research has primarily focused on handoffs within a service or discipline. These within‐unit handoffs should be differentiated from interunit handoffs.[13, 14] Interunit handoffs, such as the transition from the emergency department (ED) to inpatient setting, are subject to unique challenges. The ED admission process involves changes in personnel, provider specialty, and location.[15] The transition occurs when the patient's clinical trajectory is uncertain, treatments are being initiated, and test results are pending. Other barriers include interdisciplinary cultural differences, interphysician conflict, unstructured communication, environmental factors, and complex care coordination.[13, 14, 15, 16, 17, 18] Despite these challenges, there is relatively little research specifically examining ED to inpatient handoffs, and most of what is available has focused on individual services within an institution.[13, 14, 15, 18, 19, 20, 21, 22, 23, 24, 25]
As part of an institutional effort to improve our ED admission handoff practices, we conducted a cross‐sectional, survey‐based needs‐assessment involving emergency medicine (EM) and 5 inpatient medical services. The objective of this study was to determine physicians' perceptions of the ED admission handoff process and to identify potential barriers to safe patient care.
METHODS
Survey Design
A study group comprised of resident and faculty physicians in internal medicine (IM) and EM, as well as a healthcare communication expert, designed analogous cross‐sectional surveys to determine the perceptions of admitting (see Supporting Information, Appendix 1, in the online version of this article) and EM (see Supporting Information, Appendix 2, in the online version of this article) physicians toward the admission handoff process. Using an iterative process to ensure content validity, we created questions in 6 domains based on the expert opinion of the authors and emergent themes identified in the literature.[15, 19, 22, 24] These themes were general communication quality, clinical information, interpersonal perceptions, responsibilities, organizational factors, and patient safety. We asked respondents to report their answers using 5‐point Likert and Likert‐like scales. Questions regarding frequency were assigned semiquantitative values: rarely=0% to 24%, sometimes=25% to 49%, often=50% to 74%, very often 75% to 99%, and always=100%. We also asked an open‐ended question, asking respondents to describe any handoff‐related adverse events (defined as patient harm or near miss) they encountered in the past 3 months. We pilot tested the survey for clarity and relevance prior to distribution on a group of 5 physicians from the participating services. The institutional internal review board approved the protocol (#046‐13‐EX).
Setting, Participants, and Recruitment
We conducted the study at a 627‐bed tertiary care academic medical center. Eligible participants included all resident, fellow, and faculty physicians directly involved in admission handoffs from EM and 5 medical inpatient services (university‐based IM, university‐based family medicine [FM], community‐based FM, cardiology, and critical care medicine). The admitting services accounted for two‐thirds of the institution's 10,000 annual adult, nonobstetric ED admissions. Physicians who had not participated in admission handoffs in the past 3 months were excluded.
At the time of the study, there was no standardized institutional process for admission handoff communication, nor was there policy delineating when patient‐care responsibility transferred from the EM to admitting physician. The admission handoff process generally relied on verbal handoff via telephone between EM and admitting physicians. All services used the same electronic health record, but there was no written handoff note, and EM physician documentation generally was not available at the time of handoff. To determine patient assignment schemes following admission handoff, we questioned leadership from the participating admitting services.
We distributed and collected anonymous hard‐copy surveys at educational conferences in March 2013. We emailed a link to an online survey to eligible participants who could not be reached in person. Subjects voluntarily participated and provided consent via cover letter.
Data Analysis
We compiled survey data and performed descriptive analysis. We assessed the internal consistency of the survey domains that were made up of at least 3 questions using Cronbach's . To compare the distribution of aggregate admitting service responses to EM responses, we used the Mann‐Whitney test. We used the Fisher exact test to examine the associations of dichotomized responses (<50% vs 50%) to the level of training (intern vs resident vs fellow/faculty) and to the admitting service affiliation (university‐based IM vs university‐based FM vs aggregate of other services). When indicated, we made pairwise comparisons using the Bonferroni method to compute adjusted P values. We analyzed data independently using both SPSS version 20 (IBM Corp., Armonk, NY) and SAS version 9.3 (SAS Inc., Cary, NC) software and considered a P value <0.05 to be significant. Three researchers independently categorized descriptions of adverse events based on a previously published qualitative analysis,[15] with disagreements settled by consensus.
RESULTS
After applying exclusion criteria, the survey response rate was 63% for admitting physicians (94/150) and 86% for EM physicians (32/37). Participants' service affiliation and level of training are shown in the Table 1. Table 2 provides the distribution of survey responses for EM and admitting physicians.
| Service Affiliation | Level of Training | Total | |||||||||
|---|---|---|---|---|---|---|---|---|---|---|---|
| PGY1 | PGY2 | PGY3 | Fellow | Staff | |||||||
| No. | % | No. | % | No. | % | No. | % | No. | % | No. | |
| |||||||||||
| Admitting services | |||||||||||
| University‐based IM | 12 | 32.4 | 7 | 18.9 | 5 | 13.5 | 1 | 2.7 | 12 | 32.4 | 37 |
| University‐based FM | 15 | 44.1 | 13 | 38.2 | 5 | 14.7 | 1 | 2.9 | 0 | 0 | 34 |
| Community‐based FM | 5 | 50.0 | 1 | 10.0 | 3 | 30.0 | 0 | 0 | 1 | 10.0 | 10 |
| Critical care medicine | 0 | 0 | 0 | 0 | 0 | 0 | 6 | 100.0 | 0 | 0 | 6 |
| Cardiology | 0 | 0 | 0 | 0 | 0 | 0 | 7 | 100.0 | 0 | 0 | 7 |
| Admitting services total | 32 | 34.0 | 21 | 22.3 | 13 | 13.8 | 15 | 16.0 | 13 | 13.8 | 94 |
| Emergency medicine | 6 | 18.8 | 8 | 25.0 | 5 | 15.6 | 0 | 0 | 13 | 40.6 | 32 |
| Question | Service | Very Poor | Poor | Fair | Good | Very Good | |||||
|---|---|---|---|---|---|---|---|---|---|---|---|
| No. | % | No. | % | No. | % | No. | % | No. | % | ||
| Rarely (0%24%) | Sometimes (25%49%) | Often (50%74%) | Very Often (75%99%) | Always (100%) | |||||||
| |||||||||||
| Generally, the quality of communication between EM and admitting physicians is: | Admitting | 0 | 0 | 8 | 8.6% | 37 | 39.7% | 46 | 49.4% | 2 | 2.1% |
| EM | 0 | 0 | 2 | 6.2% | 4 | 12.5% | 20 | 62.5% | 6 | 18.7% | |
| The current handoff system's ability to ensure patient safety is generally: | Admitting | 1 | 1.0% | 10 | 10.7% | 43 | 46.2% | 37 | 39.7% | 2 | 2.1% |
| EM | 1 | 3.1% | 1 | 3.1% | 11 | 34.3% | 15 | 46.8% | 4 | 12.5% | |
| The current handoff system's ability to ensure efficient patient care is generally: | Admitting | 3 | 3.2% | 20 | 21.7% | 31 | 33.6% | 36 | 39.1% | 2 | 2.1% |
| EM | 2 | 6.2% | 5 | 15.6% | 15 | 46.8% | 10 | 31.2% | 0 | ||
| During handoff, how often does the EM physician provide the following information to the admitting service? | |||||||||||
| The working diagnosis of the EM physician | Admitting | 5 | 5.4% | 19 | 20.6% | 30 | 32.6% | 30 | 32.6% | 8 | 8.6% |
| EM | 0 | 4 | 12.5% | 0 | 12 | 37.5% | 16 | 50.0% | |||
| Relevant past medical/surgical history | Admitting | 5 | 5.4% | 25 | 27.1% | 40 | 43.4% | 18 | 19.5% | 4 | 4.3% |
| EM | 1 | 3.1% | 2 | 6.2% | 5 | 15.6% | 17 | 53.1% | 7 | 21.8% | |
| Relevant physical exam findings (including abnormal vital signs) | Admitting | 3 | 3.2% | 25 | 27.1% | 41 | 44.5% | 21 | 22.8% | 2 | 2.1% |
| EM | 0 | 5 | 15.6% | 2 | 6.2% | 15 | 46.8% | 10 | 31.2% | ||
| Results of relevant diagnostic studies (labs, imaging) | Admitting | 2 | 2.1% | 10 | 10.8% | 39 | 42.3% | 37 | 40.2% | 4 | 4.3% |
| EM | 1 | 3.1% | 0 | 3 | 9.3% | 14 | 43.7% | 14 | 43.7% | ||
| Procedures and therapeutic interventions initiated while in the ED | Admitting | 3 | 3.2% | 20 | 21.7% | 34 | 36.9% | 29 | 31.5% | 6 | 6.5% |
| EM | 1 | 3.1% | 0 | 3 | 9.3% | 18 | 56.2% | 10 | 31.2% | ||
| Trend in the patient's clinical condition while in the ED | Admitting | 12 | 13.1% | 27 | 29.6% | 33 | 36.2% | 17 | 18.6% | 2 | 2.1% |
| EM | 4 | 12.5% | 1 | 3.1% | 5 | 15.6% | 13 | 40.6% | 9 | 28.1% | |
| Current clinical condition of the patient (at time of handoff) | Admitting | 3 | 3.2% | 24 | 26.0% | 41 | 44.5% | 18 | 19.5% | 6 | 6.5% |
| EM | 1 | 3.1% | 1 | 3.1% | 3 | 9.3% | 13 | 40.6% | 14 | 43.7% | |
| Pending diagnostic studies (labs, imaging), if ordered | Admitting | 12 | 13.0% | 32 | 34.7% | 29 | 31.5% | 17 | 18.4% | 2 | 2.1% |
| EM | 0 | 5 | 15.6% | 6 | 18.7% | 14 | 43.7% | 7 | 21.8% | ||
| During handoff, how often are clinical questions asked about the patient being admitted? | Admitting | 2 | 2.1% | 1 | 1.0% | 13 | 14.1% | 29 | 31.5% | 47 | 51.0% |
| EM | 0 | 0 | 5 | 15.6% | 8 | 25.0% | 13 | 40.6% | 6 | 18.7% | |
| In general, how often do you agree with the clinical decisions made by the EM physician? | Admitting | 1 | 1.0% | 26 | 27.9% | 56 | 60.2% | 10 | 10.7% | 0 | 0 |
| Generally, how often do you feel you have to defend your clinical decisions to the admitting service? | EM | 2 | 6.2% | 15 | 46.8% | 5 | 15.6% | 10 | 31.2% | 0 | 0 |
| How often do you have clinically meaningful face‐to‐face communication with the EM/admitting physician about the patient being admitted? | Admitting | 24 | 25.8% | 38 | 40.8% | 22 | 23.6% | 8 | 8.6% | 1 | 1.0% |
| EM | 14 | 43.7% | 13 | 40.6% | 4 | 12.5% | 1 | 3.1% | 0 | ||
| On average, how often do competing clinical responsibilities distract you during handoff? | Admitting | 6 | 6.5% | 34 | 36.9% | 29 | 31.5% | 20 | 21.7% | 3 | 3.2% |
| EM | 7 | 21.8% | 8 | 25.0% | 9 | 28.1% | 8 | 25.0% | 0 | 0 | |
| On average, how often do environmental factors distract you during handoff? | Admitting | 44 | 48.3% | 31 | 34.0% | 10 | 10.9% | 6 | 6.5% | 0 | 0 |
| EM | 7 | 21.8% | 11 | 34.3% | 8 | 25.0% | 4 | 12.5% | 2 | 6.2% | |
The processes for assigning responsibilities following the initial handoff differed between admitting services, and within a service the process was often dynamic. For example, within the university‐based IM and community‐based FM services, the assignment process varied depending on timing (day vs night, weekday vs weekend). For the critical care medicine and cardiology services, fellows accepted admission handoff calls, and depending on competing clinical responsibilities and the patient's stability, either evaluated the patient independently or sent a resident to perform a preliminary evaluation. We reviewed and classified these varied admission assignment strategies into 4 general schemes (Figure 1). All 5 admitting services relied partly or entirely on housestaff for receiving admission handoffs, as did the EM service.
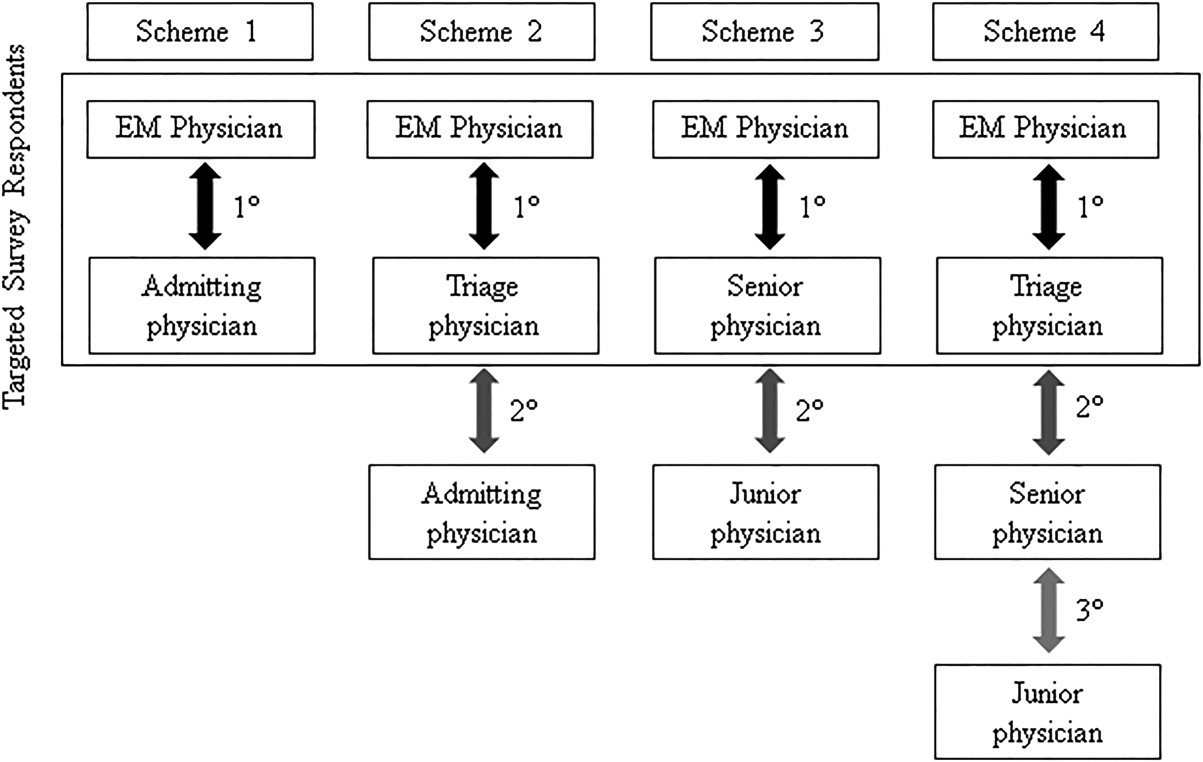
Communication Quality and Content
Cronbach's was 0.72 for general handoff questions and 0.89 for clinical information questions. Compared with EM respondents, admitting physicians reported worse quality of communication (P < 0.001) and less confidence in the handoff system's ability to ensure patient safety (P=0.04). Admitting physicians reported communication of clinical information occurred less frequently than EM physicians for all 8 content areas (P < 0.001 for all). There were no significant differences in responses between various levels of training and service affiliations.
Interpersonal Perceptions
EM respondents reported admitting physicians asked clinical questions less frequently than did admitting respondents (P < 0.001). Ninety‐four percent of EM physicians (n=30) felt they had to defend their clinical decisions at least sometimes. EM interns (P=0.009) and faculty (P=0.01) were more likely than residents to report feeling defensive. Most admitting physicians (60%, n=56) often agreed with decisions made by the EM provider, but 29% (n=27) agreed less than half the time. One‐third of admitting (n=31) and 16% of EM physicians (n=5) reported routine (ie, >50% of admissions) meaningful face‐to‐face communication with one another at the time of admission.
Responsibilities
When asked who was primarily responsible for patients boarding in the ED, defined as nonemergent patient care that occurs after handoff, but before a patient is physically transferred from the ED, 37.6% (n=47) of respondents answered the admitting physician, 21.6% (n=27) answered the EM physician, 34.4% (n=43) answered both, and 6.4% (n=8) answered don't know. Responses were similar for EM and admitting physicians.
Organizational Factors
Fifty‐six percent of all respondents (n=69) reported they were distracted during handoffs by competing clinical duties 50% of the time. Environmental factors, such as noise, more commonly distracted EM physicians (P=0.001). Approximately 60% (n=56) of admitting physicians reported using a triage system to distribute admissions, with a resultant 57% (n=32) reporting sequential handoffs (ie, handoffs of handoffs) occurred at least sometimes. About 80% of EM physicians (n=23) reported that shift change led to sequential handoffs at least sometimes. Seventy‐eight percent (n=67) of physicians felt sequential handoffs had a negative impact on patient care.
Patient Safety
Thirty‐four percent of admitting (n=30) and 19% of EM physicians (n=6) reported a patient was harmed or suffered a near miss in the past 3 months because of an ineffective handoff, with 58% (n=21) reporting 2 examples. Twenty‐four respondents described 29 adverse events. Respondents described perceived mistakes in diagnosis (n=11), treatment (n=16), and disposition (n=12), with some examples falling into more than 1 category. Absent or ineffective communication contributed to 27 of 29 examples. Other commonly cited areas of vulnerability included uncertain assignment of responsibility, sequential handoffs, and patient boarding.
DISCUSSION
Based upon physician self‐reporting, we identified perceived barriers to safe ED admission handoff across several domains. This study adds to the literature, as it provides a cross‐section of multiple inpatient services with varying admission schemes to underscore the complexities facing hospitals in safely transitioning patients between units. As noted in previous studies, one‐third of physicians reported a handoff‐related adverse event,[15] and there was significant disagreement between handoff participants about communication of critical information.[21, 26] These differences in perceptions suggest a failure of physicians to accurately transfer information to create a shared understanding of patient care,[21] which is the central function of handoffs.
EM physicians frequently felt that admitting physicians did not trust their clinical decisions, a perception supported by the fact that over 25% of admitting respondents' usually disagreed with decisions in the ED. Interdisciplinary trust is central in negotiating a shared plan of care[13] and mitigating conflict to ensure a safe transition of patient care.[16] Handoffs are complex social interactions, and feelings of defensiveness and mistrust are likely exacerbated by in‐group/out‐group biases,[15] conflicting information expectations,[19] and discordant ways of interpreting and framing handoff interactions.[13] Interestingly, EM residents were less likely than interns or faculty to report feeling defensive. This may be in part because residents from EM and admitting services develop relationships during interdisciplinary rotations, which may help facilitate future handoff interactions.[27] The fact that EM respondents felt defensive, despite reporting less‐frequent questioning than admitting physicians, suggests that tone and content of questions played an important role. These findings support the importance of interdisciplinary education and standardization of handoff communication between ED and admitting physicians.[23] Beach and colleagues have recommended a conceptual framework for interunit handoffs between EM and hospital physicians, but further research is needed to measure its impact in real‐world settings.[14]
We also found great variability in admitting services' processes for assigning patient‐care responsibility following the initial handoff. Even within an individual service, these processes were often dynamic and relied on physicians at different levels of training. This has several potential consequences. First, it may be difficult for physicians engaged in a handoff to know the level of experience and expertise of one another. These contextual variables play an important role in how handoff information is conveyed, as less experienced clinicians may require explicit information that a more experienced provider may infer.[1, 21] Second, the variability in admission assignment processes may further exacerbate uncertainty regarding responsibility for patients boarding in the ED, making it increasingly difficult for nurses and ancillary staff to know which physician is ultimately responsible for patient care. Finally, the diversity of admission schemes may complicate the development of standardized interunit handoff protocols, policy, and education.
A related finding was that sequential handoffs were common within both EM and admitting services. EM shift handoffs have their own set of barriers,[28] which can lead to ineffective communication.[29] Likewise, about two‐thirds of admitting respondents reported using an admission triage system. The goal of such systems is to simplify complex call schedules and diverse patient assignment schemes within admitting services, thus streamlining the admission process. These systems may also allow for more consistency in the quality of handoff communication through the creation of triage specialists. These potential advantages need to be weighed against the increased risk of communication breakdown. The introduction of sequential handoffs creates a game of telephone, in which there is no direct communication between the first and final caregivers (Figure 1), allowing misinformation to be propagated forward.[30] Sequential handoffs contributed to several reported adverse events, and the majority of surveyed physicians felt they negatively impacted patient care. Further research is necessary to determine the impact of centralized triage systems and to explore strategies to mitigate information decay that results from sequential handoffs, as quality‐improvement interventions may be of limited benefit if downstream communication remains ineffective. Potential strategies may include standardizing sequential handoff communication, leveraging centralized handoff notes within electronic health records, or developing handoff systems that ensure direct communication between the EM physician and the ultimate admitting provider.
Limitations
This was a single‐institution study, so results may not be generalizable, as handoff processes vary among hospitals.[24] Our study relied on a novel survey instrument, for which validity and reliability are uncertain, although internal consistency was good for domains that could be tested (Cronbach's 0.720.89). As with other survey‐based studies, participant selection, hindsight, recall, and response biases may have influenced the results. We attempted to minimize these risks by pilot testing the survey, targeting a relatively large number of respondents across multiple services, and by making efforts to maximize the response rate by contacting eligible participants both in person and via email. Because results reflect self‐reported perceptions, we cannot prove that the factors studied are actually associated with adverse outcomes, nor can we quantify their relative importance. Nevertheless, the reported perceptions raise concerns that warrant further study.
FUTURE DIRECTIONS
Further research is needed to examine interventions that may improve clinically relevant outcomes. Development of structured admission handoff protocols should be collaborative[31] and focus on clinical judgment, rather than rote recitation of data.[14] Based on our study findings, we are pilot testing a standardized approach for ED‐to‐hospital handoffs, and portions of this survey will be repeated in the postintervention assessment.
At our institution, housestaff at all levels of training regularly participated in the handoff process. The Accreditation Council for Graduate Medical Education requires that residents demonstrate competence in performing handoffs,[7] yet handoff training and assessment are inconsistent,[23, 32, 33] and published interventions have focused primarily on within‐unit handoffs.[34, 35, 36] Additional training should focus on the unique aspects of interunit handoffs. Approaches could include interprofessional communication training, simulation training, and enhanced assessment methods. Additionally, increasing face‐to‐face communication, perhaps as part of bedside handoffs, could improve relationships and the development of a shared mental model of patient care. More direct involvement by attending physicians will also be important, as there is evidence that such oversight may improve training[36] and safety,[37] as more experienced physicians better integrate handoff information.[21]
CONCLUSION
We identified several perceived barriers to safe interunit handoff from the ED to the inpatient setting. Handoff‐related adverse events, a pattern of conflicting physician perceptions, and frequent sequential handoffs were of particular concern. Our findings support the need for collaborative efforts to improve interdisciplinary communication.
Disclosure
Nothing to report.
- , . Handoffs in hospitals: a review of the literature on information exchange while transferring patient responsibility or control. Available at: http://deepblue.lib.umich.edu/handle/2027.42/61498. Updated 2009. Accessed May 15, 2014.
- . Handoffs causing patient harm: a survey of medical and surgical house staff. Jt Comm J Qual Patient Saf. 2008;34(10):563–570.
- . Consequences of inadequate sign‐out for patient care. Arch Intern Med. 2008;168(16):1755–1760.
- , . A systematic review of failures in handoff communication during intrahospital transfers. Jt Comm J Qual Patient Saf. 2011;37(6):274–284.
- , , , , . Managing discontinuity in academic medical centers: strategies for a safe and effective resident sign‐out. J Hosp Med. 2006;1(4):257–266.
- , . A model for building a standardized hand‐off protocol. Jt Comm J Qual Patient Saf. 2006;32(11):646–655.
- Accreditation Council for Graduate Medical Education. ACGME common program requirements. Available at: https://www.acgme.org/acgmeweb/Portals/0/PFAssets/ProgramRequirements/CPRs2013.pdf. Updated 2013. Accessed May 7, 2014.
- Association of American Medical Colleges. Core entrustable professional activities for entering residency. Available at: https://members.aamc.org/eweb/upload/Core%20EPA%20Faculty%20and%20Learner%20Guide.pdf. Updated 2014. Accessed July 7, 2014.
- Accreditation Council for Graduate Medical Education and American Board of Internal Medicine. The internal medicine milestones. Available at: http://www.acgme.org/acgmeweb/portals/0/pdfs/milestones/internalmedicinemilestones.pdf. Updated 2012. Accessed December 23, 2013.
- Accreditation Council for Graduate Medical Education and American Board of Emergency Medicine. The emergency medicine milestones. Available at: https://www.abem.org/public/docs/default‐source/migrated‐documents‐and‐files/em‐milestones.pdf?sfvrsn=4. Updated 2012. Accessed December 23, 2013.
- Accreditation Council for Graduate Medical Education and American Board of Family Medicine. The family medicine milestone project. Available at: http://www.acgme.org/acgmeweb/Portals/0/PDFs/Milestones/FamilyMedicineMilestones.pdf. Updated 2013. Accessed October 31, 2014.
- Accreditation Council for Graduate Medical Education and American Board of Pediatrics. The pediatrics milestone project. Available at: http://acgme.org/acgmeweb/Portals/0/PDFs/Milestones/PediatricsMilestones.pdf. Updated 2013. Accessed October, 31, 2014.
- , . The unappreciated challenges of between‐unit handoffs: negotiating and coordinating across boundaries. Ann Emerg Med. 2013;61(2):155–160.
- , , , et al. Improving interunit transitions of care between emergency physicians and hospital medicine physicians: a conceptual approach. Acad Emerg Med. 2012;19(10):1188–1195.
- , , , , , . Dropping the baton: a qualitative analysis of failures during the transition from emergency department to inpatient care. Ann Emerg Med. 2009;53(6):701–710.e4.
- , , , . Conflict prevention, conflict mitigation, and manifestations of conflict during emergency department consultations. Acad Emerg Med. 2014;21(3):308–313.
- , , , . I'm clear, you're clear, we're all clear: improving consultation communication skills in undergraduate medical education. Acad Med. 2013;88(6):753–758.
- , , , . Emergency physician to admitting physician handovers: an exploratory study. Proc Hum Factors Ergon Soc Annu Meet. 2002;46(16):1511–1515.
- , , . Communicating in the “gray zone”: perceptions about emergency physician hospitalist handoffs and patient safety. Acad Emerg Med. 2007;14(10):884–894.
- , . Chart biopsy: an emerging medical practice enabled by electronic health records and its impacts on emergency department‐inpatient admission handoffs. J Am Med Inform Assoc. 2013;20(2):260–267.
- , , , , . Admission handoff communications: clinician's shared understanding of patient severity of illness and problems. J Patient Saf. 2009;5(4):237–242.
- , , , et al. Exploring emergency physician‐hospitalist handoff interactions: development of the handoff communication assessment. Ann Emerg Med. 2010;55(2):161–170.
- , , , , , . Interunit handoffs of patients and transfers of information: a survey of current practices. Ann Emerg Med. 2014;64(4):343–349.e5.
- , , , et al. A conceptual framework for studying the safety of transitions in emergency care. In: Henriksen K, Battles JB, Marks ES, Lewin DI, eds. Advances in Patient Safety: From Research to Implementation. Vol. 2: Concepts and Methodology. Rockville, MD: Agency for Healthcare Research and Quality; 2005:309–321.
- , , , , , . Patient care transitions from the emergency department to the medicine ward: evaluation of a standardized electronic signout tool. Int J Qual Health Care. 2014;26(4):337–347.
- , , , , . Interns overestimate the effectiveness of their hand‐off communication. Pediatrics. 2010;125(3):491–496.
- , , , . Understanding the impact of residents' interpersonal relationships during emergency department referrals and consultations. J Grad Med Educ. 2013;5(4):576–581.
- , , , et al. Improving handoffs in the emergency department. Ann Emerg Med. 2010;55(2):171–180.
- , , . ED handoffs: observed practices and communication errors. Am J Emerg Med. 2011;29(5):502–511.
- , , , , . Characterizing information decay in patient handoffs. J Surg Educ. 2014;71(4):480–485.
- , , . Emergency medicine and hospital medicine: a call for collaboration. J Emerg Med. 2012;43(2):328–334.
- , , , et al. A survey of handoff practices in emergency medicine. Am J Med Qual. 2014;29(5):408–414.
- . Transfers of patient care between house staff on internal medicine wards: a national survey. Arch Intern Med. 2006;166(11):1173–1177.
- , , , , , . Effect of a systems intervention on the quality and safety of patient handoffs in an internal medicine residency program. J Gen Intern Med. 2013;28(8):986–993.
- , , , et al. Rates of medical errors and preventable adverse events among hospitalized children following implementation of a resident handoff bundle. JAMA. 2013;310(21):2262–2270.
- , , , et al. A structured handoff program for interns. Acad Med. 2009;84(3):347–352.
- , , , et al. Experience with faculty supervision of an electronic resident sign‐out system. Am J Med. 2010;123(4):376–381.
Handoffs are the exchange of information between health professionals that accompany the transfer of patient‐care responsibility.[1] Poor handoff practices are associated with unsafe and inefficient care.[2, 3, 4] Teaching hospitals are especially at risk, as resident work‐hour restrictions have increased the number of handoffs.[5] Accreditation agencies now require that hospitals and residency programs have structured handoff processes[6, 7] and that medical students[8] and residents[9, 10, 11, 12] demonstrate competency in handoffs.
Physician handoff research has primarily focused on handoffs within a service or discipline. These within‐unit handoffs should be differentiated from interunit handoffs.[13, 14] Interunit handoffs, such as the transition from the emergency department (ED) to inpatient setting, are subject to unique challenges. The ED admission process involves changes in personnel, provider specialty, and location.[15] The transition occurs when the patient's clinical trajectory is uncertain, treatments are being initiated, and test results are pending. Other barriers include interdisciplinary cultural differences, interphysician conflict, unstructured communication, environmental factors, and complex care coordination.[13, 14, 15, 16, 17, 18] Despite these challenges, there is relatively little research specifically examining ED to inpatient handoffs, and most of what is available has focused on individual services within an institution.[13, 14, 15, 18, 19, 20, 21, 22, 23, 24, 25]
As part of an institutional effort to improve our ED admission handoff practices, we conducted a cross‐sectional, survey‐based needs‐assessment involving emergency medicine (EM) and 5 inpatient medical services. The objective of this study was to determine physicians' perceptions of the ED admission handoff process and to identify potential barriers to safe patient care.
METHODS
Survey Design
A study group comprised of resident and faculty physicians in internal medicine (IM) and EM, as well as a healthcare communication expert, designed analogous cross‐sectional surveys to determine the perceptions of admitting (see Supporting Information, Appendix 1, in the online version of this article) and EM (see Supporting Information, Appendix 2, in the online version of this article) physicians toward the admission handoff process. Using an iterative process to ensure content validity, we created questions in 6 domains based on the expert opinion of the authors and emergent themes identified in the literature.[15, 19, 22, 24] These themes were general communication quality, clinical information, interpersonal perceptions, responsibilities, organizational factors, and patient safety. We asked respondents to report their answers using 5‐point Likert and Likert‐like scales. Questions regarding frequency were assigned semiquantitative values: rarely=0% to 24%, sometimes=25% to 49%, often=50% to 74%, very often 75% to 99%, and always=100%. We also asked an open‐ended question, asking respondents to describe any handoff‐related adverse events (defined as patient harm or near miss) they encountered in the past 3 months. We pilot tested the survey for clarity and relevance prior to distribution on a group of 5 physicians from the participating services. The institutional internal review board approved the protocol (#046‐13‐EX).
Setting, Participants, and Recruitment
We conducted the study at a 627‐bed tertiary care academic medical center. Eligible participants included all resident, fellow, and faculty physicians directly involved in admission handoffs from EM and 5 medical inpatient services (university‐based IM, university‐based family medicine [FM], community‐based FM, cardiology, and critical care medicine). The admitting services accounted for two‐thirds of the institution's 10,000 annual adult, nonobstetric ED admissions. Physicians who had not participated in admission handoffs in the past 3 months were excluded.
At the time of the study, there was no standardized institutional process for admission handoff communication, nor was there policy delineating when patient‐care responsibility transferred from the EM to admitting physician. The admission handoff process generally relied on verbal handoff via telephone between EM and admitting physicians. All services used the same electronic health record, but there was no written handoff note, and EM physician documentation generally was not available at the time of handoff. To determine patient assignment schemes following admission handoff, we questioned leadership from the participating admitting services.
We distributed and collected anonymous hard‐copy surveys at educational conferences in March 2013. We emailed a link to an online survey to eligible participants who could not be reached in person. Subjects voluntarily participated and provided consent via cover letter.
Data Analysis
We compiled survey data and performed descriptive analysis. We assessed the internal consistency of the survey domains that were made up of at least 3 questions using Cronbach's . To compare the distribution of aggregate admitting service responses to EM responses, we used the Mann‐Whitney test. We used the Fisher exact test to examine the associations of dichotomized responses (<50% vs 50%) to the level of training (intern vs resident vs fellow/faculty) and to the admitting service affiliation (university‐based IM vs university‐based FM vs aggregate of other services). When indicated, we made pairwise comparisons using the Bonferroni method to compute adjusted P values. We analyzed data independently using both SPSS version 20 (IBM Corp., Armonk, NY) and SAS version 9.3 (SAS Inc., Cary, NC) software and considered a P value <0.05 to be significant. Three researchers independently categorized descriptions of adverse events based on a previously published qualitative analysis,[15] with disagreements settled by consensus.
RESULTS
After applying exclusion criteria, the survey response rate was 63% for admitting physicians (94/150) and 86% for EM physicians (32/37). Participants' service affiliation and level of training are shown in the Table 1. Table 2 provides the distribution of survey responses for EM and admitting physicians.
| Service Affiliation | Level of Training | Total | |||||||||
|---|---|---|---|---|---|---|---|---|---|---|---|
| PGY1 | PGY2 | PGY3 | Fellow | Staff | |||||||
| No. | % | No. | % | No. | % | No. | % | No. | % | No. | |
| |||||||||||
| Admitting services | |||||||||||
| University‐based IM | 12 | 32.4 | 7 | 18.9 | 5 | 13.5 | 1 | 2.7 | 12 | 32.4 | 37 |
| University‐based FM | 15 | 44.1 | 13 | 38.2 | 5 | 14.7 | 1 | 2.9 | 0 | 0 | 34 |
| Community‐based FM | 5 | 50.0 | 1 | 10.0 | 3 | 30.0 | 0 | 0 | 1 | 10.0 | 10 |
| Critical care medicine | 0 | 0 | 0 | 0 | 0 | 0 | 6 | 100.0 | 0 | 0 | 6 |
| Cardiology | 0 | 0 | 0 | 0 | 0 | 0 | 7 | 100.0 | 0 | 0 | 7 |
| Admitting services total | 32 | 34.0 | 21 | 22.3 | 13 | 13.8 | 15 | 16.0 | 13 | 13.8 | 94 |
| Emergency medicine | 6 | 18.8 | 8 | 25.0 | 5 | 15.6 | 0 | 0 | 13 | 40.6 | 32 |
| Question | Service | Very Poor | Poor | Fair | Good | Very Good | |||||
|---|---|---|---|---|---|---|---|---|---|---|---|
| No. | % | No. | % | No. | % | No. | % | No. | % | ||
| Rarely (0%24%) | Sometimes (25%49%) | Often (50%74%) | Very Often (75%99%) | Always (100%) | |||||||
| |||||||||||
| Generally, the quality of communication between EM and admitting physicians is: | Admitting | 0 | 0 | 8 | 8.6% | 37 | 39.7% | 46 | 49.4% | 2 | 2.1% |
| EM | 0 | 0 | 2 | 6.2% | 4 | 12.5% | 20 | 62.5% | 6 | 18.7% | |
| The current handoff system's ability to ensure patient safety is generally: | Admitting | 1 | 1.0% | 10 | 10.7% | 43 | 46.2% | 37 | 39.7% | 2 | 2.1% |
| EM | 1 | 3.1% | 1 | 3.1% | 11 | 34.3% | 15 | 46.8% | 4 | 12.5% | |
| The current handoff system's ability to ensure efficient patient care is generally: | Admitting | 3 | 3.2% | 20 | 21.7% | 31 | 33.6% | 36 | 39.1% | 2 | 2.1% |
| EM | 2 | 6.2% | 5 | 15.6% | 15 | 46.8% | 10 | 31.2% | 0 | ||
| During handoff, how often does the EM physician provide the following information to the admitting service? | |||||||||||
| The working diagnosis of the EM physician | Admitting | 5 | 5.4% | 19 | 20.6% | 30 | 32.6% | 30 | 32.6% | 8 | 8.6% |
| EM | 0 | 4 | 12.5% | 0 | 12 | 37.5% | 16 | 50.0% | |||
| Relevant past medical/surgical history | Admitting | 5 | 5.4% | 25 | 27.1% | 40 | 43.4% | 18 | 19.5% | 4 | 4.3% |
| EM | 1 | 3.1% | 2 | 6.2% | 5 | 15.6% | 17 | 53.1% | 7 | 21.8% | |
| Relevant physical exam findings (including abnormal vital signs) | Admitting | 3 | 3.2% | 25 | 27.1% | 41 | 44.5% | 21 | 22.8% | 2 | 2.1% |
| EM | 0 | 5 | 15.6% | 2 | 6.2% | 15 | 46.8% | 10 | 31.2% | ||
| Results of relevant diagnostic studies (labs, imaging) | Admitting | 2 | 2.1% | 10 | 10.8% | 39 | 42.3% | 37 | 40.2% | 4 | 4.3% |
| EM | 1 | 3.1% | 0 | 3 | 9.3% | 14 | 43.7% | 14 | 43.7% | ||
| Procedures and therapeutic interventions initiated while in the ED | Admitting | 3 | 3.2% | 20 | 21.7% | 34 | 36.9% | 29 | 31.5% | 6 | 6.5% |
| EM | 1 | 3.1% | 0 | 3 | 9.3% | 18 | 56.2% | 10 | 31.2% | ||
| Trend in the patient's clinical condition while in the ED | Admitting | 12 | 13.1% | 27 | 29.6% | 33 | 36.2% | 17 | 18.6% | 2 | 2.1% |
| EM | 4 | 12.5% | 1 | 3.1% | 5 | 15.6% | 13 | 40.6% | 9 | 28.1% | |
| Current clinical condition of the patient (at time of handoff) | Admitting | 3 | 3.2% | 24 | 26.0% | 41 | 44.5% | 18 | 19.5% | 6 | 6.5% |
| EM | 1 | 3.1% | 1 | 3.1% | 3 | 9.3% | 13 | 40.6% | 14 | 43.7% | |
| Pending diagnostic studies (labs, imaging), if ordered | Admitting | 12 | 13.0% | 32 | 34.7% | 29 | 31.5% | 17 | 18.4% | 2 | 2.1% |
| EM | 0 | 5 | 15.6% | 6 | 18.7% | 14 | 43.7% | 7 | 21.8% | ||
| During handoff, how often are clinical questions asked about the patient being admitted? | Admitting | 2 | 2.1% | 1 | 1.0% | 13 | 14.1% | 29 | 31.5% | 47 | 51.0% |
| EM | 0 | 0 | 5 | 15.6% | 8 | 25.0% | 13 | 40.6% | 6 | 18.7% | |
| In general, how often do you agree with the clinical decisions made by the EM physician? | Admitting | 1 | 1.0% | 26 | 27.9% | 56 | 60.2% | 10 | 10.7% | 0 | 0 |
| Generally, how often do you feel you have to defend your clinical decisions to the admitting service? | EM | 2 | 6.2% | 15 | 46.8% | 5 | 15.6% | 10 | 31.2% | 0 | 0 |
| How often do you have clinically meaningful face‐to‐face communication with the EM/admitting physician about the patient being admitted? | Admitting | 24 | 25.8% | 38 | 40.8% | 22 | 23.6% | 8 | 8.6% | 1 | 1.0% |
| EM | 14 | 43.7% | 13 | 40.6% | 4 | 12.5% | 1 | 3.1% | 0 | ||
| On average, how often do competing clinical responsibilities distract you during handoff? | Admitting | 6 | 6.5% | 34 | 36.9% | 29 | 31.5% | 20 | 21.7% | 3 | 3.2% |
| EM | 7 | 21.8% | 8 | 25.0% | 9 | 28.1% | 8 | 25.0% | 0 | 0 | |
| On average, how often do environmental factors distract you during handoff? | Admitting | 44 | 48.3% | 31 | 34.0% | 10 | 10.9% | 6 | 6.5% | 0 | 0 |
| EM | 7 | 21.8% | 11 | 34.3% | 8 | 25.0% | 4 | 12.5% | 2 | 6.2% | |
The processes for assigning responsibilities following the initial handoff differed between admitting services, and within a service the process was often dynamic. For example, within the university‐based IM and community‐based FM services, the assignment process varied depending on timing (day vs night, weekday vs weekend). For the critical care medicine and cardiology services, fellows accepted admission handoff calls, and depending on competing clinical responsibilities and the patient's stability, either evaluated the patient independently or sent a resident to perform a preliminary evaluation. We reviewed and classified these varied admission assignment strategies into 4 general schemes (Figure 1). All 5 admitting services relied partly or entirely on housestaff for receiving admission handoffs, as did the EM service.
Communication Quality and Content
Cronbach's was 0.72 for general handoff questions and 0.89 for clinical information questions. Compared with EM respondents, admitting physicians reported worse quality of communication (P < 0.001) and less confidence in the handoff system's ability to ensure patient safety (P=0.04). Admitting physicians reported communication of clinical information occurred less frequently than EM physicians for all 8 content areas (P < 0.001 for all). There were no significant differences in responses between various levels of training and service affiliations.
Interpersonal Perceptions
EM respondents reported admitting physicians asked clinical questions less frequently than did admitting respondents (P < 0.001). Ninety‐four percent of EM physicians (n=30) felt they had to defend their clinical decisions at least sometimes. EM interns (P=0.009) and faculty (P=0.01) were more likely than residents to report feeling defensive. Most admitting physicians (60%, n=56) often agreed with decisions made by the EM provider, but 29% (n=27) agreed less than half the time. One‐third of admitting (n=31) and 16% of EM physicians (n=5) reported routine (ie, >50% of admissions) meaningful face‐to‐face communication with one another at the time of admission.
Responsibilities
When asked who was primarily responsible for patients boarding in the ED, defined as nonemergent patient care that occurs after handoff, but before a patient is physically transferred from the ED, 37.6% (n=47) of respondents answered the admitting physician, 21.6% (n=27) answered the EM physician, 34.4% (n=43) answered both, and 6.4% (n=8) answered don't know. Responses were similar for EM and admitting physicians.
Organizational Factors
Fifty‐six percent of all respondents (n=69) reported they were distracted during handoffs by competing clinical duties 50% of the time. Environmental factors, such as noise, more commonly distracted EM physicians (P=0.001). Approximately 60% (n=56) of admitting physicians reported using a triage system to distribute admissions, with a resultant 57% (n=32) reporting sequential handoffs (ie, handoffs of handoffs) occurred at least sometimes. About 80% of EM physicians (n=23) reported that shift change led to sequential handoffs at least sometimes. Seventy‐eight percent (n=67) of physicians felt sequential handoffs had a negative impact on patient care.
Patient Safety
Thirty‐four percent of admitting (n=30) and 19% of EM physicians (n=6) reported a patient was harmed or suffered a near miss in the past 3 months because of an ineffective handoff, with 58% (n=21) reporting 2 examples. Twenty‐four respondents described 29 adverse events. Respondents described perceived mistakes in diagnosis (n=11), treatment (n=16), and disposition (n=12), with some examples falling into more than 1 category. Absent or ineffective communication contributed to 27 of 29 examples. Other commonly cited areas of vulnerability included uncertain assignment of responsibility, sequential handoffs, and patient boarding.
DISCUSSION
Based upon physician self‐reporting, we identified perceived barriers to safe ED admission handoff across several domains. This study adds to the literature, as it provides a cross‐section of multiple inpatient services with varying admission schemes to underscore the complexities facing hospitals in safely transitioning patients between units. As noted in previous studies, one‐third of physicians reported a handoff‐related adverse event,[15] and there was significant disagreement between handoff participants about communication of critical information.[21, 26] These differences in perceptions suggest a failure of physicians to accurately transfer information to create a shared understanding of patient care,[21] which is the central function of handoffs.
EM physicians frequently felt that admitting physicians did not trust their clinical decisions, a perception supported by the fact that over 25% of admitting respondents' usually disagreed with decisions in the ED. Interdisciplinary trust is central in negotiating a shared plan of care[13] and mitigating conflict to ensure a safe transition of patient care.[16] Handoffs are complex social interactions, and feelings of defensiveness and mistrust are likely exacerbated by in‐group/out‐group biases,[15] conflicting information expectations,[19] and discordant ways of interpreting and framing handoff interactions.[13] Interestingly, EM residents were less likely than interns or faculty to report feeling defensive. This may be in part because residents from EM and admitting services develop relationships during interdisciplinary rotations, which may help facilitate future handoff interactions.[27] The fact that EM respondents felt defensive, despite reporting less‐frequent questioning than admitting physicians, suggests that tone and content of questions played an important role. These findings support the importance of interdisciplinary education and standardization of handoff communication between ED and admitting physicians.[23] Beach and colleagues have recommended a conceptual framework for interunit handoffs between EM and hospital physicians, but further research is needed to measure its impact in real‐world settings.[14]
We also found great variability in admitting services' processes for assigning patient‐care responsibility following the initial handoff. Even within an individual service, these processes were often dynamic and relied on physicians at different levels of training. This has several potential consequences. First, it may be difficult for physicians engaged in a handoff to know the level of experience and expertise of one another. These contextual variables play an important role in how handoff information is conveyed, as less experienced clinicians may require explicit information that a more experienced provider may infer.[1, 21] Second, the variability in admission assignment processes may further exacerbate uncertainty regarding responsibility for patients boarding in the ED, making it increasingly difficult for nurses and ancillary staff to know which physician is ultimately responsible for patient care. Finally, the diversity of admission schemes may complicate the development of standardized interunit handoff protocols, policy, and education.
A related finding was that sequential handoffs were common within both EM and admitting services. EM shift handoffs have their own set of barriers,[28] which can lead to ineffective communication.[29] Likewise, about two‐thirds of admitting respondents reported using an admission triage system. The goal of such systems is to simplify complex call schedules and diverse patient assignment schemes within admitting services, thus streamlining the admission process. These systems may also allow for more consistency in the quality of handoff communication through the creation of triage specialists. These potential advantages need to be weighed against the increased risk of communication breakdown. The introduction of sequential handoffs creates a game of telephone, in which there is no direct communication between the first and final caregivers (Figure 1), allowing misinformation to be propagated forward.[30] Sequential handoffs contributed to several reported adverse events, and the majority of surveyed physicians felt they negatively impacted patient care. Further research is necessary to determine the impact of centralized triage systems and to explore strategies to mitigate information decay that results from sequential handoffs, as quality‐improvement interventions may be of limited benefit if downstream communication remains ineffective. Potential strategies may include standardizing sequential handoff communication, leveraging centralized handoff notes within electronic health records, or developing handoff systems that ensure direct communication between the EM physician and the ultimate admitting provider.
Limitations
This was a single‐institution study, so results may not be generalizable, as handoff processes vary among hospitals.[24] Our study relied on a novel survey instrument, for which validity and reliability are uncertain, although internal consistency was good for domains that could be tested (Cronbach's 0.720.89). As with other survey‐based studies, participant selection, hindsight, recall, and response biases may have influenced the results. We attempted to minimize these risks by pilot testing the survey, targeting a relatively large number of respondents across multiple services, and by making efforts to maximize the response rate by contacting eligible participants both in person and via email. Because results reflect self‐reported perceptions, we cannot prove that the factors studied are actually associated with adverse outcomes, nor can we quantify their relative importance. Nevertheless, the reported perceptions raise concerns that warrant further study.
FUTURE DIRECTIONS
Further research is needed to examine interventions that may improve clinically relevant outcomes. Development of structured admission handoff protocols should be collaborative[31] and focus on clinical judgment, rather than rote recitation of data.[14] Based on our study findings, we are pilot testing a standardized approach for ED‐to‐hospital handoffs, and portions of this survey will be repeated in the postintervention assessment.
At our institution, housestaff at all levels of training regularly participated in the handoff process. The Accreditation Council for Graduate Medical Education requires that residents demonstrate competence in performing handoffs,[7] yet handoff training and assessment are inconsistent,[23, 32, 33] and published interventions have focused primarily on within‐unit handoffs.[34, 35, 36] Additional training should focus on the unique aspects of interunit handoffs. Approaches could include interprofessional communication training, simulation training, and enhanced assessment methods. Additionally, increasing face‐to‐face communication, perhaps as part of bedside handoffs, could improve relationships and the development of a shared mental model of patient care. More direct involvement by attending physicians will also be important, as there is evidence that such oversight may improve training[36] and safety,[37] as more experienced physicians better integrate handoff information.[21]
CONCLUSION
We identified several perceived barriers to safe interunit handoff from the ED to the inpatient setting. Handoff‐related adverse events, a pattern of conflicting physician perceptions, and frequent sequential handoffs were of particular concern. Our findings support the need for collaborative efforts to improve interdisciplinary communication.
Disclosure
Nothing to report.
- , . Handoffs in hospitals: a review of the literature on information exchange while transferring patient responsibility or control. Available at: http://deepblue.lib.umich.edu/handle/2027.42/61498. Updated 2009. Accessed May 15, 2014.
- . Handoffs causing patient harm: a survey of medical and surgical house staff. Jt Comm J Qual Patient Saf. 2008;34(10):563–570.
- . Consequences of inadequate sign‐out for patient care. Arch Intern Med. 2008;168(16):1755–1760.
- , . A systematic review of failures in handoff communication during intrahospital transfers. Jt Comm J Qual Patient Saf. 2011;37(6):274–284.
- , , , , . Managing discontinuity in academic medical centers: strategies for a safe and effective resident sign‐out. J Hosp Med. 2006;1(4):257–266.
- , . A model for building a standardized hand‐off protocol. Jt Comm J Qual Patient Saf. 2006;32(11):646–655.
- Accreditation Council for Graduate Medical Education. ACGME common program requirements. Available at: https://www.acgme.org/acgmeweb/Portals/0/PFAssets/ProgramRequirements/CPRs2013.pdf. Updated 2013. Accessed May 7, 2014.
- Association of American Medical Colleges. Core entrustable professional activities for entering residency. Available at: https://members.aamc.org/eweb/upload/Core%20EPA%20Faculty%20and%20Learner%20Guide.pdf. Updated 2014. Accessed July 7, 2014.
- Accreditation Council for Graduate Medical Education and American Board of Internal Medicine. The internal medicine milestones. Available at: http://www.acgme.org/acgmeweb/portals/0/pdfs/milestones/internalmedicinemilestones.pdf. Updated 2012. Accessed December 23, 2013.
- Accreditation Council for Graduate Medical Education and American Board of Emergency Medicine. The emergency medicine milestones. Available at: https://www.abem.org/public/docs/default‐source/migrated‐documents‐and‐files/em‐milestones.pdf?sfvrsn=4. Updated 2012. Accessed December 23, 2013.
- Accreditation Council for Graduate Medical Education and American Board of Family Medicine. The family medicine milestone project. Available at: http://www.acgme.org/acgmeweb/Portals/0/PDFs/Milestones/FamilyMedicineMilestones.pdf. Updated 2013. Accessed October 31, 2014.
- Accreditation Council for Graduate Medical Education and American Board of Pediatrics. The pediatrics milestone project. Available at: http://acgme.org/acgmeweb/Portals/0/PDFs/Milestones/PediatricsMilestones.pdf. Updated 2013. Accessed October, 31, 2014.
- , . The unappreciated challenges of between‐unit handoffs: negotiating and coordinating across boundaries. Ann Emerg Med. 2013;61(2):155–160.
- , , , et al. Improving interunit transitions of care between emergency physicians and hospital medicine physicians: a conceptual approach. Acad Emerg Med. 2012;19(10):1188–1195.
- , , , , , . Dropping the baton: a qualitative analysis of failures during the transition from emergency department to inpatient care. Ann Emerg Med. 2009;53(6):701–710.e4.
- , , , . Conflict prevention, conflict mitigation, and manifestations of conflict during emergency department consultations. Acad Emerg Med. 2014;21(3):308–313.
- , , , . I'm clear, you're clear, we're all clear: improving consultation communication skills in undergraduate medical education. Acad Med. 2013;88(6):753–758.
- , , , . Emergency physician to admitting physician handovers: an exploratory study. Proc Hum Factors Ergon Soc Annu Meet. 2002;46(16):1511–1515.
- , , . Communicating in the “gray zone”: perceptions about emergency physician hospitalist handoffs and patient safety. Acad Emerg Med. 2007;14(10):884–894.
- , . Chart biopsy: an emerging medical practice enabled by electronic health records and its impacts on emergency department‐inpatient admission handoffs. J Am Med Inform Assoc. 2013;20(2):260–267.
- , , , , . Admission handoff communications: clinician's shared understanding of patient severity of illness and problems. J Patient Saf. 2009;5(4):237–242.
- , , , et al. Exploring emergency physician‐hospitalist handoff interactions: development of the handoff communication assessment. Ann Emerg Med. 2010;55(2):161–170.
- , , , , , . Interunit handoffs of patients and transfers of information: a survey of current practices. Ann Emerg Med. 2014;64(4):343–349.e5.
- , , , et al. A conceptual framework for studying the safety of transitions in emergency care. In: Henriksen K, Battles JB, Marks ES, Lewin DI, eds. Advances in Patient Safety: From Research to Implementation. Vol. 2: Concepts and Methodology. Rockville, MD: Agency for Healthcare Research and Quality; 2005:309–321.
- , , , , , . Patient care transitions from the emergency department to the medicine ward: evaluation of a standardized electronic signout tool. Int J Qual Health Care. 2014;26(4):337–347.
- , , , , . Interns overestimate the effectiveness of their hand‐off communication. Pediatrics. 2010;125(3):491–496.
- , , , . Understanding the impact of residents' interpersonal relationships during emergency department referrals and consultations. J Grad Med Educ. 2013;5(4):576–581.
- , , , et al. Improving handoffs in the emergency department. Ann Emerg Med. 2010;55(2):171–180.
- , , . ED handoffs: observed practices and communication errors. Am J Emerg Med. 2011;29(5):502–511.
- , , , , . Characterizing information decay in patient handoffs. J Surg Educ. 2014;71(4):480–485.
- , , . Emergency medicine and hospital medicine: a call for collaboration. J Emerg Med. 2012;43(2):328–334.
- , , , et al. A survey of handoff practices in emergency medicine. Am J Med Qual. 2014;29(5):408–414.
- . Transfers of patient care between house staff on internal medicine wards: a national survey. Arch Intern Med. 2006;166(11):1173–1177.
- , , , , , . Effect of a systems intervention on the quality and safety of patient handoffs in an internal medicine residency program. J Gen Intern Med. 2013;28(8):986–993.
- , , , et al. Rates of medical errors and preventable adverse events among hospitalized children following implementation of a resident handoff bundle. JAMA. 2013;310(21):2262–2270.
- , , , et al. A structured handoff program for interns. Acad Med. 2009;84(3):347–352.
- , , , et al. Experience with faculty supervision of an electronic resident sign‐out system. Am J Med. 2010;123(4):376–381.
© 2015 Society of Hospital Medicine

Sepsis and Septic Shock Readmission Risk
Despite its decreasing mortality, sepsis remains a leading reason for intensive care unit (ICU) admission and is associated with crude mortality in excess of 25%.[1, 2] In the United States there are between 660,000 and 750,000 sepsis hospitalizations annually, with the direct costs surpassing $24 billion.[3, 4, 5] As mortality rates have begun to fall, attention has shifted to issues of morbidity and recovery, the intermediate and longer‐term consequences associated with survivorship, and how interventions made while the patient is acutely ill in the ICU alter later health outcomes.[3, 5, 6, 7, 8]
One area of particular interest is the need for healthcare utilization following an acute admission for sepsis, and specifically rehospitalization within 30 days of discharge. This outcome is important not just from the perspective of the patient's well‐being, but also from the point of view of healthcare financing. Through the establishment of Hospital Readmission Reduction Program, the Centers for Medicare and Medicaid Services have sharply reduced reimbursement to hospitals for excessive rates of 30‐day readmissions.[9]
For sepsis, little is known about such readmissions, and even less about how to prevent them. A handful of studies suggest that this rate is between 5% and 26%.[10, 11, 12, 13] Whereas some of these studies looked at some of the factors that impact readmissions,[11, 12] none examined the potential contribution of microbiology of sepsis to this outcome.
To explore these questions, we conducted a single‐center retrospective cohort study among critically ill patients admitted to the ICU with severe culture‐positive sepsis and/or septic shock and determined the rate of early posthospital discharge readmission. In addition, we sought to elucidate predictors of subsequent readmission.
METHODS
Study Design and Ethical Standards
We conducted a single‐center retrospective cohort study from January 2008 to December 2012. The study was approved by the Washington University School of Medicine Human Studies Committee, and informed consent was waived because the data collection was retrospective without any patient‐identifying information. The study was performed in accordance with the ethical standards of the 1964 Declaration of Helsinki and its later amendments. Aspects of our methodology have been previously published.[14]
Primary Endpoint
All‐cause readmission to an acute‐care facility in the 30 days following discharge after the index hospitalization with sepsis served as the primary endpoint. The index hospitalizations occurred at the Barnes‐Jewish Hospital, a 1200‐bed inner‐city academic institution that serves as the main teaching institution for BJC HealthCare, a large integrated healthcare system of both inpatient and outpatient care. BJC includes a total of 13 hospitals in a compact geographic region surrounding and including St. Louis, Missouri, and we included readmission to any of these hospitals in our analysis. Persons treated within this healthcare system are, in nearly all cases, readmitted to 1 of the system's participating 13 hospitals. If a patient who receives healthcare in the system presents to an out‐of‐system hospital, he/she is often transferred back into the integrated system because of issues of insurance coverage.
Study Cohort
All consecutive adult ICU patients were included if (1) They had a positive blood culture for a pathogen (Cultures positive only for coagulase negative Staphylococcus aureus were excluded as contaminants.), (2) there was an International Classification of Diseases, Ninth Revision, Clinical Modification (ICD‐9‐CM) code corresponding to an acute organ dysfunction,[4] and (3) they survived their index hospitalization. Only the first episode of sepsis was included as the index hospitalization.
Definitions
All‐cause 30‐day readmission, was defined as a repeat hospitalization within 30 days of discharge from the index hospitalization among survivors of culture‐positive severe sepsis or septic shock. The definition of severe sepsis was based on discharge ICD‐9‐CM codes for acute organ dysfunction.[3] Patients were classified as having septic shock if vasopressors (norepinephrine, dopamine, epinephrine, phenylephrine, or vasopressin) were initiated within 24 hours of the blood culture collection date and time.
Initially appropriate antimicrobial treatment (IAAT) was deemed appropriate if the initially prescribed antibiotic regimen was active against the identified pathogen based on in vitro susceptibility testing and administered for at least 24 hours within 24 hours following blood culture collection. All other regimens were classified as non‐IAAT. Combination antimicrobial treatment was not required for IAAT designation.[15] Prior antibiotic exposure and prior hospitalization occurred within the preceding 90 days, and prior bacteremia within 30 days of the index episode. Multidrug resistance (MDR) among Gram‐negative bacteria was defined as nonsusceptibility to at least 1 antimicrobial agent from at least 3 different antimicrobial classes.[16] Both extended spectrum ‐lactamase (ESBL) organisms and carbapenemase‐producing Enterobacteriaceae were identified via molecular testing.
Healthcare‐associated (HCA) infections were defined by the presence of at least 1 of the following: (1) recent hospitalization, (2) immune suppression (defined as any primary immune deficiency or acquired immune deficiency syndrome or exposure within 3 prior months to immunosuppressive treatmentschemotherapy, radiation therapy, or steroids), (3) nursing home residence, (4) hemodialysis, (5) prior antibiotics. and (6) index bacteremia deemed a hospital‐acquired bloodstream infection (occurring >2 days following index admission date). Acute kidney injury (AKI) was defined according to the RIFLE (Risk, Injury, Failure, Loss, End‐stage) criteria based on the greatest change in serum creatinine (SCr).[17]
Data Elements
Patient‐specific baseline characteristics and process of care variables were collected from the automated hospital medical record, microbiology database, and pharmacy database of Barnes‐Jewish Hospital. Electronic inpatient and outpatient medical records available for all patients in the BJC HealthCare system were reviewed to determine prior antibiotic exposure. The baseline characteristics collected during the index hospitalization included demographics and comorbid conditions. The comorbidities were identified based on their corresponding ICD‐9‐CM codes. The Acute Physiology and Chronic Health Evaluation (APACHE) II and Charlson comorbidity scores were calculated based on clinical data present during the 24 hours after the positive blood cultures were obtained.[18] This was done to accommodate patients with community‐acquired and healthcare‐associated community‐onset infections who only had clinical data available after blood cultures were drawn. Lowest and highest SCr levels were collected during the index hospitalization to determine each patient's AKI status.
Statistical Analyses
Continuous variables were reported as means with standard deviations and as medians with 25th and 75th percentiles. Differences between mean values were tested via the Student t test, and between medians using the Mann‐Whitney U test. Categorical data were summarized as proportions, and the 2 test or Fisher exact test for small samples was used to examine differences between groups. We developed multiple logistic regression models to identify clinical risk factors that were associated with 30‐day all‐cause readmission. All risk factors that were significant at 0.20 in the univariate analyses, as well as all biologically plausible factors even if they did not reach this level of significance, were included in the models. All variables entered into the models were assessed for collinearity, and interaction terms were tested. The most parsimonious models were derived using the backward manual elimination method, and the best‐fitting model was chosen based on the area under the receiver operating characteristics curve (AUROC or the C statistic). The model's calibration was assessed with the Hosmer‐Lemeshow goodness‐of‐fit test. All tests were 2‐tailed, and a P value <0.05 represented statistical significance.
All computations were performed in Stata/SE, version 9 (StataCorp, College Station, TX).
Role of Sponsor
The sponsor had no role in the design, analyses, interpretation, or publication of the study.
RESULTS
Among the 1697 patients with severe sepsis or septic shock who were discharged alive from the hospital, 543 (32.0%) required a rehospitalization within 30 days. There were no differences in age or gender distribution between the groups (Table 1). All comorbidities examined were more prevalent among those with a 30‐day readmission than among those without, with the median Charlson comorbidity score reflecting this imbalance (5 vs 4, P<0.001). Similarly, most of the HCA risk factors were more prevalent among the readmitted group than the comparator group, with HCA sepsis among 94.2% of the former and 90.7% of the latter (P = 0.014).
| 30‐Day Readmission = Yes | 30‐Day Readmission = No | ||||
|---|---|---|---|---|---|
| N = 543 | % = 32.00% | N = 1,154 | % = 68.00% | P Value | |
| |||||
| Baseline characteristics | |||||
| Age, y | |||||
| Mean SD | 58.5 15.7 | 59.5 15.8 | |||
| Median (25, 75) | 60 (49, 69) | 60 (50, 70) | 0.297 | ||
| Race | |||||
| Caucasian | 335 | 61.69% | 769 | 66.64% | 0.046 |
| African American | 157 | 28.91% | 305 | 26.43% | 0.284 |
| Other | 9 | 1.66% | 22 | 1.91% | 0.721 |
| Sex, female | 244 | 44.94% | 537 | 46.53% | 0.538 |
| Admission source | |||||
| Home | 374 | 68.88% | 726 | 62.91% | 0.016 |
| Nursing home, rehab, or LTAC | 39 | 7.81% | 104 | 9.01% | 0.206 |
| Transfer from another hospital | 117 | 21.55% | 297 | 25.74% | 0.061 |
| Comorbidities | |||||
| CHF | 131 | 24.13% | 227 | 19.67% | 0.036 |
| COPD | 156 | 28.73% | 253 | 21.92% | 0.002 |
| CLD | 83 | 15.29% | 144 | 12.48% | 0.113 |
| DM | 175 | 32.23% | 296 | 25.65% | 0.005 |
| CKD | 137 | 25.23% | 199 | 17.24% | <0.001 |
| Malignancy | 225 | 41.44% | 395 | 34.23% | 0.004 |
| HIV | 11 | 2.03% | 10 | 0.87% | 0.044 |
| Charlson comorbidity score | |||||
| Mean SD | 5.24 3.32 | 4.48 3.35 | |||
| Median (25, 75) | 5 (3, 8) | 4 (2, 7) | <0.001 | ||
| HCA RF | 503 | 94.19% | 1,019 | 90.66% | 0.014 |
| Hemodialysis | 65 | 12.01% | 114 | 9.92% | 0.192 |
| Immune suppression | 193 | 36.07% | 352 | 31.21% | 0.044 |
| Prior hospitalization | 339 | 65.07% | 620 | 57.09% | 0.002 |
| Nursing home residence | 39 | 7.81% | 104 | 9.01% | 0.206 |
| Prior antibiotics | 301 | 55.43% | 568 | 49.22% | 0.017 |
| Hospital‐acquired BSI* | 240 | 44.20% | 485 | 42.03% | 0.399 |
| Prior bacteremia within 30 days | 88 | 16.21% | 154 | 13.34% | 0.116 |
| Sepsis‐related parameters | |||||
| LOS prior to bacteremia, d | |||||
| Mean SD | 6.65 11.22 | 5.88 10.81 | |||
| Median (25, 75) | 1 (0, 10) | 0 (0, 8) | 0.250 | ||
| Surgery | |||||
| None | 362 | 66.67% | 836 | 72.44% | 0.015 |
| Abdominal | 104 | 19.15% | 167 | 14.47% | 0.014 |
| Extra‐abdominal | 73 | 13.44% | 135 | 11.70% | 0.306 |
| Status unknown | 4 | 0.74% | 16 | 1.39% | 0.247 |
| Central line | 333 | 64.41% | 637 | 57.80% | 0.011 |
| TPN at the time of bacteremia or prior to it during index hospitalization | 52 | 9.74% | 74 | 5.45% | 0.017 |
| APACHE II | |||||
| Mean SD | 15.08 5.47 | 15.35 5.43 | |||
| Median (25, 75) | 15 (11, 18) | 15 (12, 19) | 0.275 | ||
| Severe sepsis | 361 | 66.48% | 747 | 64.73% | 0.480 |
| Septic shock requiring vasopressors | 182 | 33.52% | 407 | 35.27% | |
| On MV | 104 | 19.22% | 251 | 21.90% | 0.208 |
| Peak WBC (103/L) | |||||
| Mean SD | 22.26 25.20 | 22.14 17.99 | |||
| Median (25, 75) | 17.1 (8.9, 30.6) | 16.9 (10, 31) | 0.654 | ||
| Lowest serum SCr, mg/dL | |||||
| Mean SD | 1.02 1.05 | 0.96 1.03 | |||
| Median (25, 75) | 0.68 (0.5, 1.06) | 0.66 (0.49, 0.96) | 0.006 | ||
| Highest serum SCr, mg/dL | |||||
| Mean SD | 2.81 2.79 | 2.46 2.67 | |||
| Median (25, 75) | 1.68 (1.04, 3.3) | 1.41 (0.94, 2.61) | 0.001 | ||
| RIFLE category | |||||
| None | 81 | 14.92% | 213 | 18.46% | 0.073 |
| Risk | 112 | 20.63% | 306 | 26.52% | 0.009 |
| Injury | 133 | 24.49% | 247 | 21.40% | 0.154 |
| Failure | 120 | 22.10% | 212 | 18.37% | 0.071 |
| Loss | 50 | 9.21% | 91 | 7.89% | 0.357 |
| End‐stage | 47 | 8.66% | 85 | 7.37% | 0.355 |
| Infection source | |||||
| Urine | 95 | 17.50% | 258 | 22.36% | 0.021 |
| Abdomen | 69 | 12.71% | 113 | 9.79% | 0.070 |
| Lung | 93 | 17.13% | 232 | 20.10% | 0.146 |
| Line | 91 | 16.76% | 150 | 13.00% | 0.038 |
| CNS | 1 | 0.18% | 16 | 1.39% | 0.012 |
| Skin | 51 | 9.39% | 82 | 7.11% | 0.102 |
| Unknown | 173 | 31.86% | 375 | 32.50% | 0.794 |
During the index hospitalization, 589 patients (34.7%) suffered from septic shock requiring vasopressors; this did not impact the 30‐day readmission risk (Table 1). Commensurately, markers of severity of acute illness (APACHE II score, mechanical ventilation, peak white blood cell count) did not differ between the groups. With respect to the primary source of sepsis, urine was less, whereas central nervous system was more likely among those readmitted within 30 days. Similarly, there was a significant imbalance between the groups in the prevalence of AKI (Table 1). Specifically, those who did require a readmission were slightly less likely to have sustained no AKI (RIFLE: None; 14.9% vs 18.5%, P = 0.073). Those requiring readmission were also less likely to be in the category RIFLE: Risk (20.6% vs 26.5%, P = 0.009). The direction of this disparity was reversed for the Injury and Failure categories. No differences between groups were seen among those with categories Loss and end‐stage kidney disease (ESKD) (Table 1).
The microbiology of sepsis did not differ in most respects between the 30‐day readmission groups, save for several organisms (Table 2). Most strikingly, those who required a readmission were more likely than those who did not to be infected with Bacteroides spp, Candida spp, an MDR or an ESBL organism (Table 2). As for the outcomes of the index hospitalization, those with a repeat admission had a longer overall and postonset of sepsis initial hospital length of stay, and were less likely to be discharged either home without home health care or transferred to another hospital at the end of their index hospitalization (Table 3).
| 30‐Day Readmission = Yes | 30‐Day Readmission = No | P Value | |||
|---|---|---|---|---|---|
| N | % | N | % | ||
| |||||
| 543 | 32.00% | 1,154 | 68.00% | ||
| Gram‐positive BSI | 260 | 47.88% | 580 | 50.26% | 0.376 |
| Staphylococcus aureus | 138 | 25.41% | 287 | 24.87% | 0.810 |
| MRSA | 78 | 14.36% | 147 | 12.74% | 0.358 |
| VISA | 6 | 1.10% | 9 | 0.78% | 0.580 |
| Streptococcus pneumoniae | 7 | 1.29% | 33 | 2.86% | 0.058 |
| Streptococcus spp | 34 | 6.26% | 81 | 7.02% | 0.606 |
| Peptostreptococcus spp | 5 | 0.92% | 15 | 1.30% | 0.633 |
| Clostridium perfringens | 4 | 0.74% | 10 | 0.87% | 1.000 |
| Enterococcus faecalis | 54 | 9.94% | 108 | 9.36% | 0.732 |
| Enterococcus faecium | 29 | 5.34% | 63 | 5.46% | 1.000 |
| VRE | 36 | 6.63% | 70 | 6.07% | 0.668 |
| Gram‐negative BSI | 231 | 42.54% | 515 | 44.63% | 0.419 |
| Escherichia coli | 54 | 9.94% | 151 | 13.08% | 0.067 |
| Klebsiella pneumoniae | 54 | 9.94% | 108 | 9.36% | 0.723 |
| Klebsiella oxytoca | 11 | 2.03% | 18 | 1.56% | 0.548 |
| Enterobacter aerogenes | 6 | 1.10% | 13 | 1.13% | 1.000 |
| Enterobacter cloacae | 21 | 3.87% | 44 | 3.81% | 1.000 |
| Pseudomonas aeruginosa | 28 | 5.16% | 65 | 5.63% | 0.733 |
| Acinetobacter spp | 8 | 1.47% | 27 | 2.34% | 0.276 |
| Bacteroides spp | 25 | 4.60% | 30 | 2.60% | 0.039 |
| Serratia marcescens | 14 | 2.58% | 21 | 1.82% | 0.360 |
| Stenotrophomonas maltophilia | 3 | 0.55% | 8 | 0.69% | 1.000 |
| Achromobacter spp | 2 | 0.37% | 3 | 0.17% | 0.597 |
| Aeromonas spp | 2 | 0.37% | 1 | 0.09% | 0.241 |
| Burkholderia cepacia | 0 | 0.00% | 6 | 0.52% | 0.186 |
| Citrobacter freundii | 2 | 0.37% | 15 | 1.39% | 0.073 |
| Fusobacterium spp | 7 | 1.29% | 10 | 0.87% | 0.438 |
| Haemophilus influenzae | 1 | 0.18% | 4 | 0.35% | 1.000 |
| Prevotella spp | 1 | 0.18% | 6 | 0.52% | 0.441 |
| Proteus mirabilis | 9 | 1.66% | 39 | 3.38% | 0.058 |
| MDR PA | 2 | 0.37% | 7 | 0.61% | 0.727 |
| ESBL | 10 | 6.25% | 8 | 2.06% | 0.017 |
| CRE | 2 | 1.25% | 0 | 0.00% | 0.028 |
| MDR Gram‐negative or Gram‐positive | 231 | 47.53% | 450 | 41.86% | 0.036 |
| Candida spp | 58 | 10.68% | 76 | 6.59% | 0.004 |
| Polymicrobal BSI | 50 | 9.21% | 111 | 9.62% | 0.788 |
| Initially inappropriate treatment | 119 | 21.92% | 207 | 17.94% | 0.052 |
| 30‐Day Readmission = Yes | 30‐Day Readmission = No | ||||
|---|---|---|---|---|---|
| N = 543 | % = 32.00% | N = 1,154 | % = 68.00% | P Value | |
| |||||
| Hospital LOS, days | |||||
| Mean SD | 26.44 23.27 | 23.58 21.79 | 0.019 | ||
| Median (25, 75) | 19.16 (9.66, 35.86) | 17.77 (8.9, 30.69) | |||
| Hospital LOS following BSI onset, days | |||||
| Mean SD | 19.80 18.54 | 17.69 17.08 | 0.022 | ||
| Median (25, 75) | 13.9 (7.9, 25.39) | 12.66 (7.05, 22.66) | |||
| Discharge destination | |||||
| Home | 125 | 23.02% | 334 | 28.94% | 0.010 |
| Home with home care | 163 | 30.02% | 303 | 26.26% | 0.105 |
| Rehab | 81 | 14.92% | 149 | 12.91% | 0.260 |
| LTAC | 41 | 7.55% | 87 | 7.54% | 0.993 |
| Transfer to another hospital | 1 | 0.18% | 19 | 1.65% | 0.007 |
| SNF | 132 | 24.31% | 262 | 22.70% | 0.465 |
In a logistic regression model, 5 factors emerged as predictors of 30‐day readmission (Table 4). Having RIFLE: Injury or RIFLE: Failure carried an approximately 2‐fold increase in the odds of 30‐day rehospitalization (odds ratio: 1.95, 95% confidence interval: 1.302.93, P = 0.001) relative to having a RIFLE: None or RIFLE: Risk. Although having strong association with this outcome, harboring an ESBL organism or Bacteroides spp were both relatively infrequent events (3.3% ESBL and 3.2% Bacteroides spp). Infection with Escherichia coli and urine as the source of sepsis both appeared to be significantly protective against a readmission (Table 4). The model's discrimination was moderate (AUROC = 0.653) and its calibration adequate (Hosmer‐Lemeshow P = 0.907). (See Supporting Information, Appendix 1, in the online version of this article for the steps in the development of the final model.)
| OR | 95% CI | P Value | |
|---|---|---|---|
| |||
| ESBL | 4.503 | 1.42914.190 | 0.010 |
| RIFLE: Injury or Failure (reference: RIFLE: None or Risk) | 1.951 | 1.2972.933 | 0.001 |
| Bacteroides spp | 2.044 | 1.0583.948 | 0.033 |
| Source: urine | 0.583 | 0.3470.979 | 0.041 |
| Escherichia coli | 0.494 | 0.2700.904 | 0.022 |
DISCUSSION
In this single‐center retrospective cohort study, nearly one‐third of survivors of culture‐positive severe sepsis or septic shock required a rehospitalization within 30 days of discharge from their index admission. Factors that contributed to a higher odds of rehospitalization were having mild‐to‐moderate AKI (RIFLE: Injury or RIFLE: Failure) and infection with ESBL organisms or Bacteroides spp, whereas urine as the source of sepsis and E coli as the pathogen appeared to be protective.
A recent study by Hua and colleagues examining the New York Statewide Planning and Research Cooperative System for the years 2008 to 2010 noted a 16.2% overall rate of 30‐day rehospitalization among survivors of initial critical illness.[11] Just as we observed, Hua et al. concluded that development of AKI correlated with readmission. Because they relied on administrative data for their analysis, AKI was diagnosed when hemodialysis was utilized. Examining AKI using SCr changes, our findings add a layer of granularity to the relationship between AKI stages and early readmission. Specifically, we failed to detect any rise in the odds of rehospitalization when either very mild (RIFLE: Risk) or severe (RIFLE: Loss or RIFLE: ESKD) AKI was present. Only when either RIFLE: Injury or RIFLE: Failure developed did the odds of readmission rise. In addition to diverging definitions between our studies, differences in populations also likely yielded different results.[11] Although Hua et al. examined all admissions to the ICU regardless of the diagnosis or illness severity, our cohort consisted of only those ICU patients who survived culture‐positive severe sepsis/septic shock. Because AKI is a known risk factor for mortality in sepsis,[19] the potential for immortal time bias leaves a smaller pool of surviving patients with ESKD at risk for readmission. Regardless of the explanation, it may be prudent to focus on preventing AKI not only to improve survival, but also from the standpoint of diminishing the risk of an early readmission.
Four additional studies have examined the frequency of early readmissions among survivors of critical illness. Liu et al. noted 17.9% 30‐day rehospitalization rate among sepsis survivors.[12] Factors associated with the risk of early readmission included acute and chronic diseases burdens, index hospital LOS, and the need for the ICU in the index sepsis admission. In contrast to our cohort, all of whom were in the ICU during their index episode, less than two‐thirds of the entire population studied by Liu had required an ICU admission. Additionally, Liu's study did not specifically examine the potential impact of AKI or of microbiology on this outcome.
Prescott and coworkers examined healthcare utilization following an episode of severe sepsis.[13] Among other findings, they reported a 30‐day readmission rate of 26.5% among survivors. Although closer to our estimate, this study included all patients surviving a severe sepsis hospitalization, and not only those with a positive culture. These investigators did not examine predictors of readmission.[13]
Horkan et al. examined specifically whether there was an association between AKI and postdischarge outcomes, including 30‐day readmission risk, in a large cohort of patients who survived their critical illness.[20] In it they found that readmission risk ranged from 19% to 21%, depending on the extent of the AKI. Moreover, similar to our findings, they reported that in an adjusted analysis RIFLE: Injury and RIFLE: Failure were associated with a rise in the odds of a 30‐day rehospitalizaiton. In contrast to our study, Horkan et al. did detect an increase in the odds of this outcome associated with RIFLE: Risk. There are likely at least 3 reasons for this difference. First, we focused only on patients with severe sepsis or septic shock, whereas Horkan and colleagues included all critical illness survivors. Second, we were able to explore the impact of microbiology on this outcome. Third, Horkan's study included an order of magnitude more patients than did ours, thus making it more likely either to have the power to detect a true association that we may have lacked or to be more susceptible to type I error.
Finally, Goodwin and colleagues utilized 3 states' databases included in the Health Care and Utilization Project (HCUP) from the Agency for Healthcare Research and Quality to study frequency and risk factors for 30‐day readmission among survivors of severe sepsis.[21] Patients were identified based on the use of the severe sepsis (995.92) and septic shock (785.52). These authors found a 30‐day readmission rate of 26%. Although chronic renal disease, among several other factors, was associated with an increase in this risk, the data source did not permit these investigators to examine the impact of AKI on the outcomes. Similarly, HCUP data do not contain microbiology, a distinct difference from our analysis.
If clinicians are to pursue strategies to reduce the risk of an all‐cause 30‐day readmission, the key goal is not simply to identify all variables associated with readmission, but to focus on factors that are potentially modifiable. Although neither Hua nor Liu and their teams identified any additional factors that are potentially modifiable,[11, 12] in the present study, among the 5 factors we identified, the development of mild to moderate AKI during the index hospitalization may deserve stronger consideration for efforts at prevention. Although one cannot conclude automatically that preventing AKI in this population could mitigate some of the early rehospitalization risk, critically ill patients are frequently exposed to a multitude of nephrotoxic agents. Those caring for subjects with sepsis should reevaluate the risk‐benefit equation of these factors more cautiously and apply guideline‐recommended AKI prevention strategies more aggressively, particularly because a relatively minor change in SCr resulted in an excess risk of readmission.[22]
In addition to AKI, which is potentially modifiable, we identified several other clinical factors predictive of 30‐day readmission, which are admittedly not preventable. Thus, microbiology was predictive of this outcome, with E coli engendering fewer and Bacteroides spp and ESBL organisms more early rehospitalizations. Similarly, urine as the source of sepsis was associated with a lower risk for this endpoint.
Our study has a number of limitations. As a retrospective cohort, it is subject to bias, most notably a selection bias. Specifically, because the flagship hospital of the BJC HealthCare system is a referral center, it is possible that we did not capture all readmissions. However, generally, if a patient who receives healthcare within 1 of the BJC hospitals presents to a nonsystem hospital, that patient is nearly always transferred back into the integrated system because of issues of insurance coverage. Analysis of certain diagnosis‐related groups has indicated that 73% of all patients overall discharged from 4 of the large BJC system institutions who require a readmission within 30 days of discharge return to a BJC hospital (personal communication, Financial Analysis and Decision Support Department at BJC to Dr. Kollef May 12, 2015). Therefore, we may have misclassified the outcome in as many as 180 patients. The fact that our readmission rate was fully double that seen in Hua et al.'s and Liu et al.'s studies, and somewhat higher than that reported by Prescott et al., attests not only to the population differences, but also to the fact that we are unlikely to have missed a substantial percentage of readmissions.[11, 12, 13] Furthermore, to mitigate biases, we enrolled all consecutive patients meeting the predetermined criteria. Missing from our analysis are events that occurred between the index discharge and the readmission. Likewise, we were unable to obtain such potentially important variables as code status or outpatient mortality following discharge. These intervening factors, if included in subsequent studies, may increase the predictive power of the model. Because we relied on administrative coding to identify cases of severe sepsis and septic shock, it is possible that there is misclassification within our cohort. Recent studies indicate, however, that the Angus definition, used in our study, has high negative and positive predictive values for severe sepsis identification.[23] It is still possible that our cohort is skewed toward a more severely ill population, making our results less generalizable to the less severely ill septic patients.[24] The study was performed at a single healthcare system and included only cases of severe sepsis or septic shock that had a positive blood culture, and thus the findings may not be broadly generalizable either to patients without a positive blood culture or to institutions that do not resemble it.
In summary, we have demonstrated that survivors of culture‐positive severe sepsis or septic shock have a high rate of 30‐day rehospitalization. Because the US federal government's initiatives deem 30‐day readmissions to be a quality metric and penalize institutions with higher‐than average readmission rates, a high volume of critically ill patients with culture‐positive severe sepsis and septic shock may disproportionately put an institution at risk for such penalties. Unfortunately, not many of the determinants of readmission are amenable to prevention. As sepsis survival continues to improve, hospitals will need to concentrate their resources on coordinating care of these complex patients so as to improve both individual quality of life and the quality of care that they provide.
Disclosures
This study was supported by a research grant from Cubist Pharmaceuticals, Lexington, Massachusetts. Dr. Kollef's time was in part supported by the Barnes‐Jewish Hospital Foundation. The authors report no conflicts of interest.
- , , , et al; Sepsis Occurrence in Acutely Ill Patients Investigators. Sepsis in European intensive care units: results of the SOAP study. Crit Care Med. 2006;34:344–353
- , , , et al. Death in the United States, 2007. NCHS Data Brief. 2009;26:1–8.
- , , , et al. The epidemiology of sepsis in the United States from 1979 through 2000. N Engl J Med. 2003;348:1548–1564.
- , , , , , . Epidemiology of severe sepsis in the United States: analysis of incidence, outcome, and associated costs of care. Crit Care Med. 2001;29:1303–1310.
- , , , et al: Hospitalizations, costs, and outcomes of severe sepsis in the United States 2003 to 2007. Crit Care Med. 2012;40:754–761.
- , , , et al. Facing the challenge: decreasing case fatality rates in severe sepsis despite increasing hospitalization. Crit Care Med. 2005;33:2555–2562.
- , , , et al. Rapid increase in hospitalization and mortality rates for severe sepsis in the United States: a trend analysis from 1993 to 2003. Crit Care Med. 2007;35:1244–1250.
- , , , , . Two decades of mortality trends among patients with severe sepsis: a comparative meta‐analysis. Crit Care Med. 2014;42:625–631.
- , , , et al. Preventing 30‐day hospital readmissions: a systematic review and meta‐analysis of randomized trials. JAMA Intern Med. 2014;174:1095–1107.
- , . Trends in septicemia hospitalizations and readmissions in selected HCUP states, 2005 and 2010. HCUP Statistical Brief #161. Agency for Healthcare Research and Quality, Rockville, MD. Available at: http://www.hcup‐us.ahrq.gov/reports/statbriefs/sb161.pdf. Published September 2013, Accessed January 13, 2015.
- , , , . Early and late unplanned rehospitalizations for survivors of critical illness. Crit Care Med. 2015;43:430–438.
- , , , , , . Hospital readmission and healthcare utilization following sepsis in community settings. J Hosp Med. 2014;9:502–507.
- , , , , . Increased 1‐year healthcare use in survivors of severe sepsis. Am J Respir Crit Care Med. 2014;190:62–69.
- , , , , . Multi‐drug resistance, inappropriate initial antibiotic therapy and mortality in Gram‐negative severe sepsis and septic shock: a retrospective cohort study. Crit Care. 2014;18:596.
- , , . Does combination antimicrobial therapy reduce mortality in Gram‐negative bacteraemia? A meta‐analysis. Lancet Infect Dis. 2004;4:519–527.
- , , , et al. Multidrug‐resistant, extensively drug‐resistant and pandrug‐resistant bacteria: an international expert proposal for interim standard definitions for acquired resistance. Clin Microbiol Infect. 2012;18:268–281.
- , , , , ; Acute Dialysis Quality Initiative Workgroup. Acute renal failure—definition, outcome measures, animal models, fluid therapy and information technology needs: the Second International Consensus Conference of the Acute Dialysis Quality Initiative (ADQI) Group. Crit Care. 2004;8:R204–R212.
- , , , . APACHE II: a severity of disease classification system. Crit Care Med. 1985;13:818–829.
- , , , et al. RIFLE criteria for acute kidney injury are associated with hospital mortality in critically ill patients: a cohort analysis. Crit Care. 2006;10:R73
- , , , , , . The association of acute kidney injury in the critically ill and postdischarge outcomes: a cohort study. Crit Care Med. 2015;43:354–364.
- , , , . Frequency, cost, and risk factors of readmissions among severe sepsis survivors. Crit Care Med. 2015;43:738–746.
- Acute Kidney Injury Work Group. Kidney disease: improving global outcomes (KDIGO). KDIGO clinical practice guideline for acute kidney injury. Kidney Int Suppl. 2012;2:1–138. Available at: http://www.kdigo.org/clinical_practice_guidelines/pdf/KDIGO%20AKI%20Guideline.pdf. Accessed March 4, 2015.
- , , , , , . Validity of administrative data in recording sepsis: a systematic review. Crit Care. 2015;19(1):139.
- , , , , , . Severe sepsis cohorts derived from claims‐based strategies appear to be biased toward a more severely ill patient population. Crit Care Med. 2013;41:945–953.
Despite its decreasing mortality, sepsis remains a leading reason for intensive care unit (ICU) admission and is associated with crude mortality in excess of 25%.[1, 2] In the United States there are between 660,000 and 750,000 sepsis hospitalizations annually, with the direct costs surpassing $24 billion.[3, 4, 5] As mortality rates have begun to fall, attention has shifted to issues of morbidity and recovery, the intermediate and longer‐term consequences associated with survivorship, and how interventions made while the patient is acutely ill in the ICU alter later health outcomes.[3, 5, 6, 7, 8]
One area of particular interest is the need for healthcare utilization following an acute admission for sepsis, and specifically rehospitalization within 30 days of discharge. This outcome is important not just from the perspective of the patient's well‐being, but also from the point of view of healthcare financing. Through the establishment of Hospital Readmission Reduction Program, the Centers for Medicare and Medicaid Services have sharply reduced reimbursement to hospitals for excessive rates of 30‐day readmissions.[9]
For sepsis, little is known about such readmissions, and even less about how to prevent them. A handful of studies suggest that this rate is between 5% and 26%.[10, 11, 12, 13] Whereas some of these studies looked at some of the factors that impact readmissions,[11, 12] none examined the potential contribution of microbiology of sepsis to this outcome.
To explore these questions, we conducted a single‐center retrospective cohort study among critically ill patients admitted to the ICU with severe culture‐positive sepsis and/or septic shock and determined the rate of early posthospital discharge readmission. In addition, we sought to elucidate predictors of subsequent readmission.
METHODS
Study Design and Ethical Standards
We conducted a single‐center retrospective cohort study from January 2008 to December 2012. The study was approved by the Washington University School of Medicine Human Studies Committee, and informed consent was waived because the data collection was retrospective without any patient‐identifying information. The study was performed in accordance with the ethical standards of the 1964 Declaration of Helsinki and its later amendments. Aspects of our methodology have been previously published.[14]
Primary Endpoint
All‐cause readmission to an acute‐care facility in the 30 days following discharge after the index hospitalization with sepsis served as the primary endpoint. The index hospitalizations occurred at the Barnes‐Jewish Hospital, a 1200‐bed inner‐city academic institution that serves as the main teaching institution for BJC HealthCare, a large integrated healthcare system of both inpatient and outpatient care. BJC includes a total of 13 hospitals in a compact geographic region surrounding and including St. Louis, Missouri, and we included readmission to any of these hospitals in our analysis. Persons treated within this healthcare system are, in nearly all cases, readmitted to 1 of the system's participating 13 hospitals. If a patient who receives healthcare in the system presents to an out‐of‐system hospital, he/she is often transferred back into the integrated system because of issues of insurance coverage.
Study Cohort
All consecutive adult ICU patients were included if (1) They had a positive blood culture for a pathogen (Cultures positive only for coagulase negative Staphylococcus aureus were excluded as contaminants.), (2) there was an International Classification of Diseases, Ninth Revision, Clinical Modification (ICD‐9‐CM) code corresponding to an acute organ dysfunction,[4] and (3) they survived their index hospitalization. Only the first episode of sepsis was included as the index hospitalization.
Definitions
All‐cause 30‐day readmission, was defined as a repeat hospitalization within 30 days of discharge from the index hospitalization among survivors of culture‐positive severe sepsis or septic shock. The definition of severe sepsis was based on discharge ICD‐9‐CM codes for acute organ dysfunction.[3] Patients were classified as having septic shock if vasopressors (norepinephrine, dopamine, epinephrine, phenylephrine, or vasopressin) were initiated within 24 hours of the blood culture collection date and time.
Initially appropriate antimicrobial treatment (IAAT) was deemed appropriate if the initially prescribed antibiotic regimen was active against the identified pathogen based on in vitro susceptibility testing and administered for at least 24 hours within 24 hours following blood culture collection. All other regimens were classified as non‐IAAT. Combination antimicrobial treatment was not required for IAAT designation.[15] Prior antibiotic exposure and prior hospitalization occurred within the preceding 90 days, and prior bacteremia within 30 days of the index episode. Multidrug resistance (MDR) among Gram‐negative bacteria was defined as nonsusceptibility to at least 1 antimicrobial agent from at least 3 different antimicrobial classes.[16] Both extended spectrum ‐lactamase (ESBL) organisms and carbapenemase‐producing Enterobacteriaceae were identified via molecular testing.
Healthcare‐associated (HCA) infections were defined by the presence of at least 1 of the following: (1) recent hospitalization, (2) immune suppression (defined as any primary immune deficiency or acquired immune deficiency syndrome or exposure within 3 prior months to immunosuppressive treatmentschemotherapy, radiation therapy, or steroids), (3) nursing home residence, (4) hemodialysis, (5) prior antibiotics. and (6) index bacteremia deemed a hospital‐acquired bloodstream infection (occurring >2 days following index admission date). Acute kidney injury (AKI) was defined according to the RIFLE (Risk, Injury, Failure, Loss, End‐stage) criteria based on the greatest change in serum creatinine (SCr).[17]
Data Elements
Patient‐specific baseline characteristics and process of care variables were collected from the automated hospital medical record, microbiology database, and pharmacy database of Barnes‐Jewish Hospital. Electronic inpatient and outpatient medical records available for all patients in the BJC HealthCare system were reviewed to determine prior antibiotic exposure. The baseline characteristics collected during the index hospitalization included demographics and comorbid conditions. The comorbidities were identified based on their corresponding ICD‐9‐CM codes. The Acute Physiology and Chronic Health Evaluation (APACHE) II and Charlson comorbidity scores were calculated based on clinical data present during the 24 hours after the positive blood cultures were obtained.[18] This was done to accommodate patients with community‐acquired and healthcare‐associated community‐onset infections who only had clinical data available after blood cultures were drawn. Lowest and highest SCr levels were collected during the index hospitalization to determine each patient's AKI status.
Statistical Analyses
Continuous variables were reported as means with standard deviations and as medians with 25th and 75th percentiles. Differences between mean values were tested via the Student t test, and between medians using the Mann‐Whitney U test. Categorical data were summarized as proportions, and the 2 test or Fisher exact test for small samples was used to examine differences between groups. We developed multiple logistic regression models to identify clinical risk factors that were associated with 30‐day all‐cause readmission. All risk factors that were significant at 0.20 in the univariate analyses, as well as all biologically plausible factors even if they did not reach this level of significance, were included in the models. All variables entered into the models were assessed for collinearity, and interaction terms were tested. The most parsimonious models were derived using the backward manual elimination method, and the best‐fitting model was chosen based on the area under the receiver operating characteristics curve (AUROC or the C statistic). The model's calibration was assessed with the Hosmer‐Lemeshow goodness‐of‐fit test. All tests were 2‐tailed, and a P value <0.05 represented statistical significance.
All computations were performed in Stata/SE, version 9 (StataCorp, College Station, TX).
Role of Sponsor
The sponsor had no role in the design, analyses, interpretation, or publication of the study.
RESULTS
Among the 1697 patients with severe sepsis or septic shock who were discharged alive from the hospital, 543 (32.0%) required a rehospitalization within 30 days. There were no differences in age or gender distribution between the groups (Table 1). All comorbidities examined were more prevalent among those with a 30‐day readmission than among those without, with the median Charlson comorbidity score reflecting this imbalance (5 vs 4, P<0.001). Similarly, most of the HCA risk factors were more prevalent among the readmitted group than the comparator group, with HCA sepsis among 94.2% of the former and 90.7% of the latter (P = 0.014).
| 30‐Day Readmission = Yes | 30‐Day Readmission = No | ||||
|---|---|---|---|---|---|
| N = 543 | % = 32.00% | N = 1,154 | % = 68.00% | P Value | |
| |||||
| Baseline characteristics | |||||
| Age, y | |||||
| Mean SD | 58.5 15.7 | 59.5 15.8 | |||
| Median (25, 75) | 60 (49, 69) | 60 (50, 70) | 0.297 | ||
| Race | |||||
| Caucasian | 335 | 61.69% | 769 | 66.64% | 0.046 |
| African American | 157 | 28.91% | 305 | 26.43% | 0.284 |
| Other | 9 | 1.66% | 22 | 1.91% | 0.721 |
| Sex, female | 244 | 44.94% | 537 | 46.53% | 0.538 |
| Admission source | |||||
| Home | 374 | 68.88% | 726 | 62.91% | 0.016 |
| Nursing home, rehab, or LTAC | 39 | 7.81% | 104 | 9.01% | 0.206 |
| Transfer from another hospital | 117 | 21.55% | 297 | 25.74% | 0.061 |
| Comorbidities | |||||
| CHF | 131 | 24.13% | 227 | 19.67% | 0.036 |
| COPD | 156 | 28.73% | 253 | 21.92% | 0.002 |
| CLD | 83 | 15.29% | 144 | 12.48% | 0.113 |
| DM | 175 | 32.23% | 296 | 25.65% | 0.005 |
| CKD | 137 | 25.23% | 199 | 17.24% | <0.001 |
| Malignancy | 225 | 41.44% | 395 | 34.23% | 0.004 |
| HIV | 11 | 2.03% | 10 | 0.87% | 0.044 |
| Charlson comorbidity score | |||||
| Mean SD | 5.24 3.32 | 4.48 3.35 | |||
| Median (25, 75) | 5 (3, 8) | 4 (2, 7) | <0.001 | ||
| HCA RF | 503 | 94.19% | 1,019 | 90.66% | 0.014 |
| Hemodialysis | 65 | 12.01% | 114 | 9.92% | 0.192 |
| Immune suppression | 193 | 36.07% | 352 | 31.21% | 0.044 |
| Prior hospitalization | 339 | 65.07% | 620 | 57.09% | 0.002 |
| Nursing home residence | 39 | 7.81% | 104 | 9.01% | 0.206 |
| Prior antibiotics | 301 | 55.43% | 568 | 49.22% | 0.017 |
| Hospital‐acquired BSI* | 240 | 44.20% | 485 | 42.03% | 0.399 |
| Prior bacteremia within 30 days | 88 | 16.21% | 154 | 13.34% | 0.116 |
| Sepsis‐related parameters | |||||
| LOS prior to bacteremia, d | |||||
| Mean SD | 6.65 11.22 | 5.88 10.81 | |||
| Median (25, 75) | 1 (0, 10) | 0 (0, 8) | 0.250 | ||
| Surgery | |||||
| None | 362 | 66.67% | 836 | 72.44% | 0.015 |
| Abdominal | 104 | 19.15% | 167 | 14.47% | 0.014 |
| Extra‐abdominal | 73 | 13.44% | 135 | 11.70% | 0.306 |
| Status unknown | 4 | 0.74% | 16 | 1.39% | 0.247 |
| Central line | 333 | 64.41% | 637 | 57.80% | 0.011 |
| TPN at the time of bacteremia or prior to it during index hospitalization | 52 | 9.74% | 74 | 5.45% | 0.017 |
| APACHE II | |||||
| Mean SD | 15.08 5.47 | 15.35 5.43 | |||
| Median (25, 75) | 15 (11, 18) | 15 (12, 19) | 0.275 | ||
| Severe sepsis | 361 | 66.48% | 747 | 64.73% | 0.480 |
| Septic shock requiring vasopressors | 182 | 33.52% | 407 | 35.27% | |
| On MV | 104 | 19.22% | 251 | 21.90% | 0.208 |
| Peak WBC (103/L) | |||||
| Mean SD | 22.26 25.20 | 22.14 17.99 | |||
| Median (25, 75) | 17.1 (8.9, 30.6) | 16.9 (10, 31) | 0.654 | ||
| Lowest serum SCr, mg/dL | |||||
| Mean SD | 1.02 1.05 | 0.96 1.03 | |||
| Median (25, 75) | 0.68 (0.5, 1.06) | 0.66 (0.49, 0.96) | 0.006 | ||
| Highest serum SCr, mg/dL | |||||
| Mean SD | 2.81 2.79 | 2.46 2.67 | |||
| Median (25, 75) | 1.68 (1.04, 3.3) | 1.41 (0.94, 2.61) | 0.001 | ||
| RIFLE category | |||||
| None | 81 | 14.92% | 213 | 18.46% | 0.073 |
| Risk | 112 | 20.63% | 306 | 26.52% | 0.009 |
| Injury | 133 | 24.49% | 247 | 21.40% | 0.154 |
| Failure | 120 | 22.10% | 212 | 18.37% | 0.071 |
| Loss | 50 | 9.21% | 91 | 7.89% | 0.357 |
| End‐stage | 47 | 8.66% | 85 | 7.37% | 0.355 |
| Infection source | |||||
| Urine | 95 | 17.50% | 258 | 22.36% | 0.021 |
| Abdomen | 69 | 12.71% | 113 | 9.79% | 0.070 |
| Lung | 93 | 17.13% | 232 | 20.10% | 0.146 |
| Line | 91 | 16.76% | 150 | 13.00% | 0.038 |
| CNS | 1 | 0.18% | 16 | 1.39% | 0.012 |
| Skin | 51 | 9.39% | 82 | 7.11% | 0.102 |
| Unknown | 173 | 31.86% | 375 | 32.50% | 0.794 |
During the index hospitalization, 589 patients (34.7%) suffered from septic shock requiring vasopressors; this did not impact the 30‐day readmission risk (Table 1). Commensurately, markers of severity of acute illness (APACHE II score, mechanical ventilation, peak white blood cell count) did not differ between the groups. With respect to the primary source of sepsis, urine was less, whereas central nervous system was more likely among those readmitted within 30 days. Similarly, there was a significant imbalance between the groups in the prevalence of AKI (Table 1). Specifically, those who did require a readmission were slightly less likely to have sustained no AKI (RIFLE: None; 14.9% vs 18.5%, P = 0.073). Those requiring readmission were also less likely to be in the category RIFLE: Risk (20.6% vs 26.5%, P = 0.009). The direction of this disparity was reversed for the Injury and Failure categories. No differences between groups were seen among those with categories Loss and end‐stage kidney disease (ESKD) (Table 1).
The microbiology of sepsis did not differ in most respects between the 30‐day readmission groups, save for several organisms (Table 2). Most strikingly, those who required a readmission were more likely than those who did not to be infected with Bacteroides spp, Candida spp, an MDR or an ESBL organism (Table 2). As for the outcomes of the index hospitalization, those with a repeat admission had a longer overall and postonset of sepsis initial hospital length of stay, and were less likely to be discharged either home without home health care or transferred to another hospital at the end of their index hospitalization (Table 3).
| 30‐Day Readmission = Yes | 30‐Day Readmission = No | P Value | |||
|---|---|---|---|---|---|
| N | % | N | % | ||
| |||||
| 543 | 32.00% | 1,154 | 68.00% | ||
| Gram‐positive BSI | 260 | 47.88% | 580 | 50.26% | 0.376 |
| Staphylococcus aureus | 138 | 25.41% | 287 | 24.87% | 0.810 |
| MRSA | 78 | 14.36% | 147 | 12.74% | 0.358 |
| VISA | 6 | 1.10% | 9 | 0.78% | 0.580 |
| Streptococcus pneumoniae | 7 | 1.29% | 33 | 2.86% | 0.058 |
| Streptococcus spp | 34 | 6.26% | 81 | 7.02% | 0.606 |
| Peptostreptococcus spp | 5 | 0.92% | 15 | 1.30% | 0.633 |
| Clostridium perfringens | 4 | 0.74% | 10 | 0.87% | 1.000 |
| Enterococcus faecalis | 54 | 9.94% | 108 | 9.36% | 0.732 |
| Enterococcus faecium | 29 | 5.34% | 63 | 5.46% | 1.000 |
| VRE | 36 | 6.63% | 70 | 6.07% | 0.668 |
| Gram‐negative BSI | 231 | 42.54% | 515 | 44.63% | 0.419 |
| Escherichia coli | 54 | 9.94% | 151 | 13.08% | 0.067 |
| Klebsiella pneumoniae | 54 | 9.94% | 108 | 9.36% | 0.723 |
| Klebsiella oxytoca | 11 | 2.03% | 18 | 1.56% | 0.548 |
| Enterobacter aerogenes | 6 | 1.10% | 13 | 1.13% | 1.000 |
| Enterobacter cloacae | 21 | 3.87% | 44 | 3.81% | 1.000 |
| Pseudomonas aeruginosa | 28 | 5.16% | 65 | 5.63% | 0.733 |
| Acinetobacter spp | 8 | 1.47% | 27 | 2.34% | 0.276 |
| Bacteroides spp | 25 | 4.60% | 30 | 2.60% | 0.039 |
| Serratia marcescens | 14 | 2.58% | 21 | 1.82% | 0.360 |
| Stenotrophomonas maltophilia | 3 | 0.55% | 8 | 0.69% | 1.000 |
| Achromobacter spp | 2 | 0.37% | 3 | 0.17% | 0.597 |
| Aeromonas spp | 2 | 0.37% | 1 | 0.09% | 0.241 |
| Burkholderia cepacia | 0 | 0.00% | 6 | 0.52% | 0.186 |
| Citrobacter freundii | 2 | 0.37% | 15 | 1.39% | 0.073 |
| Fusobacterium spp | 7 | 1.29% | 10 | 0.87% | 0.438 |
| Haemophilus influenzae | 1 | 0.18% | 4 | 0.35% | 1.000 |
| Prevotella spp | 1 | 0.18% | 6 | 0.52% | 0.441 |
| Proteus mirabilis | 9 | 1.66% | 39 | 3.38% | 0.058 |
| MDR PA | 2 | 0.37% | 7 | 0.61% | 0.727 |
| ESBL | 10 | 6.25% | 8 | 2.06% | 0.017 |
| CRE | 2 | 1.25% | 0 | 0.00% | 0.028 |
| MDR Gram‐negative or Gram‐positive | 231 | 47.53% | 450 | 41.86% | 0.036 |
| Candida spp | 58 | 10.68% | 76 | 6.59% | 0.004 |
| Polymicrobal BSI | 50 | 9.21% | 111 | 9.62% | 0.788 |
| Initially inappropriate treatment | 119 | 21.92% | 207 | 17.94% | 0.052 |
| 30‐Day Readmission = Yes | 30‐Day Readmission = No | ||||
|---|---|---|---|---|---|
| N = 543 | % = 32.00% | N = 1,154 | % = 68.00% | P Value | |
| |||||
| Hospital LOS, days | |||||
| Mean SD | 26.44 23.27 | 23.58 21.79 | 0.019 | ||
| Median (25, 75) | 19.16 (9.66, 35.86) | 17.77 (8.9, 30.69) | |||
| Hospital LOS following BSI onset, days | |||||
| Mean SD | 19.80 18.54 | 17.69 17.08 | 0.022 | ||
| Median (25, 75) | 13.9 (7.9, 25.39) | 12.66 (7.05, 22.66) | |||
| Discharge destination | |||||
| Home | 125 | 23.02% | 334 | 28.94% | 0.010 |
| Home with home care | 163 | 30.02% | 303 | 26.26% | 0.105 |
| Rehab | 81 | 14.92% | 149 | 12.91% | 0.260 |
| LTAC | 41 | 7.55% | 87 | 7.54% | 0.993 |
| Transfer to another hospital | 1 | 0.18% | 19 | 1.65% | 0.007 |
| SNF | 132 | 24.31% | 262 | 22.70% | 0.465 |
In a logistic regression model, 5 factors emerged as predictors of 30‐day readmission (Table 4). Having RIFLE: Injury or RIFLE: Failure carried an approximately 2‐fold increase in the odds of 30‐day rehospitalization (odds ratio: 1.95, 95% confidence interval: 1.302.93, P = 0.001) relative to having a RIFLE: None or RIFLE: Risk. Although having strong association with this outcome, harboring an ESBL organism or Bacteroides spp were both relatively infrequent events (3.3% ESBL and 3.2% Bacteroides spp). Infection with Escherichia coli and urine as the source of sepsis both appeared to be significantly protective against a readmission (Table 4). The model's discrimination was moderate (AUROC = 0.653) and its calibration adequate (Hosmer‐Lemeshow P = 0.907). (See Supporting Information, Appendix 1, in the online version of this article for the steps in the development of the final model.)
| OR | 95% CI | P Value | |
|---|---|---|---|
| |||
| ESBL | 4.503 | 1.42914.190 | 0.010 |
| RIFLE: Injury or Failure (reference: RIFLE: None or Risk) | 1.951 | 1.2972.933 | 0.001 |
| Bacteroides spp | 2.044 | 1.0583.948 | 0.033 |
| Source: urine | 0.583 | 0.3470.979 | 0.041 |
| Escherichia coli | 0.494 | 0.2700.904 | 0.022 |
DISCUSSION
In this single‐center retrospective cohort study, nearly one‐third of survivors of culture‐positive severe sepsis or septic shock required a rehospitalization within 30 days of discharge from their index admission. Factors that contributed to a higher odds of rehospitalization were having mild‐to‐moderate AKI (RIFLE: Injury or RIFLE: Failure) and infection with ESBL organisms or Bacteroides spp, whereas urine as the source of sepsis and E coli as the pathogen appeared to be protective.
A recent study by Hua and colleagues examining the New York Statewide Planning and Research Cooperative System for the years 2008 to 2010 noted a 16.2% overall rate of 30‐day rehospitalization among survivors of initial critical illness.[11] Just as we observed, Hua et al. concluded that development of AKI correlated with readmission. Because they relied on administrative data for their analysis, AKI was diagnosed when hemodialysis was utilized. Examining AKI using SCr changes, our findings add a layer of granularity to the relationship between AKI stages and early readmission. Specifically, we failed to detect any rise in the odds of rehospitalization when either very mild (RIFLE: Risk) or severe (RIFLE: Loss or RIFLE: ESKD) AKI was present. Only when either RIFLE: Injury or RIFLE: Failure developed did the odds of readmission rise. In addition to diverging definitions between our studies, differences in populations also likely yielded different results.[11] Although Hua et al. examined all admissions to the ICU regardless of the diagnosis or illness severity, our cohort consisted of only those ICU patients who survived culture‐positive severe sepsis/septic shock. Because AKI is a known risk factor for mortality in sepsis,[19] the potential for immortal time bias leaves a smaller pool of surviving patients with ESKD at risk for readmission. Regardless of the explanation, it may be prudent to focus on preventing AKI not only to improve survival, but also from the standpoint of diminishing the risk of an early readmission.
Four additional studies have examined the frequency of early readmissions among survivors of critical illness. Liu et al. noted 17.9% 30‐day rehospitalization rate among sepsis survivors.[12] Factors associated with the risk of early readmission included acute and chronic diseases burdens, index hospital LOS, and the need for the ICU in the index sepsis admission. In contrast to our cohort, all of whom were in the ICU during their index episode, less than two‐thirds of the entire population studied by Liu had required an ICU admission. Additionally, Liu's study did not specifically examine the potential impact of AKI or of microbiology on this outcome.
Prescott and coworkers examined healthcare utilization following an episode of severe sepsis.[13] Among other findings, they reported a 30‐day readmission rate of 26.5% among survivors. Although closer to our estimate, this study included all patients surviving a severe sepsis hospitalization, and not only those with a positive culture. These investigators did not examine predictors of readmission.[13]
Horkan et al. examined specifically whether there was an association between AKI and postdischarge outcomes, including 30‐day readmission risk, in a large cohort of patients who survived their critical illness.[20] In it they found that readmission risk ranged from 19% to 21%, depending on the extent of the AKI. Moreover, similar to our findings, they reported that in an adjusted analysis RIFLE: Injury and RIFLE: Failure were associated with a rise in the odds of a 30‐day rehospitalizaiton. In contrast to our study, Horkan et al. did detect an increase in the odds of this outcome associated with RIFLE: Risk. There are likely at least 3 reasons for this difference. First, we focused only on patients with severe sepsis or septic shock, whereas Horkan and colleagues included all critical illness survivors. Second, we were able to explore the impact of microbiology on this outcome. Third, Horkan's study included an order of magnitude more patients than did ours, thus making it more likely either to have the power to detect a true association that we may have lacked or to be more susceptible to type I error.
Finally, Goodwin and colleagues utilized 3 states' databases included in the Health Care and Utilization Project (HCUP) from the Agency for Healthcare Research and Quality to study frequency and risk factors for 30‐day readmission among survivors of severe sepsis.[21] Patients were identified based on the use of the severe sepsis (995.92) and septic shock (785.52). These authors found a 30‐day readmission rate of 26%. Although chronic renal disease, among several other factors, was associated with an increase in this risk, the data source did not permit these investigators to examine the impact of AKI on the outcomes. Similarly, HCUP data do not contain microbiology, a distinct difference from our analysis.
If clinicians are to pursue strategies to reduce the risk of an all‐cause 30‐day readmission, the key goal is not simply to identify all variables associated with readmission, but to focus on factors that are potentially modifiable. Although neither Hua nor Liu and their teams identified any additional factors that are potentially modifiable,[11, 12] in the present study, among the 5 factors we identified, the development of mild to moderate AKI during the index hospitalization may deserve stronger consideration for efforts at prevention. Although one cannot conclude automatically that preventing AKI in this population could mitigate some of the early rehospitalization risk, critically ill patients are frequently exposed to a multitude of nephrotoxic agents. Those caring for subjects with sepsis should reevaluate the risk‐benefit equation of these factors more cautiously and apply guideline‐recommended AKI prevention strategies more aggressively, particularly because a relatively minor change in SCr resulted in an excess risk of readmission.[22]
In addition to AKI, which is potentially modifiable, we identified several other clinical factors predictive of 30‐day readmission, which are admittedly not preventable. Thus, microbiology was predictive of this outcome, with E coli engendering fewer and Bacteroides spp and ESBL organisms more early rehospitalizations. Similarly, urine as the source of sepsis was associated with a lower risk for this endpoint.
Our study has a number of limitations. As a retrospective cohort, it is subject to bias, most notably a selection bias. Specifically, because the flagship hospital of the BJC HealthCare system is a referral center, it is possible that we did not capture all readmissions. However, generally, if a patient who receives healthcare within 1 of the BJC hospitals presents to a nonsystem hospital, that patient is nearly always transferred back into the integrated system because of issues of insurance coverage. Analysis of certain diagnosis‐related groups has indicated that 73% of all patients overall discharged from 4 of the large BJC system institutions who require a readmission within 30 days of discharge return to a BJC hospital (personal communication, Financial Analysis and Decision Support Department at BJC to Dr. Kollef May 12, 2015). Therefore, we may have misclassified the outcome in as many as 180 patients. The fact that our readmission rate was fully double that seen in Hua et al.'s and Liu et al.'s studies, and somewhat higher than that reported by Prescott et al., attests not only to the population differences, but also to the fact that we are unlikely to have missed a substantial percentage of readmissions.[11, 12, 13] Furthermore, to mitigate biases, we enrolled all consecutive patients meeting the predetermined criteria. Missing from our analysis are events that occurred between the index discharge and the readmission. Likewise, we were unable to obtain such potentially important variables as code status or outpatient mortality following discharge. These intervening factors, if included in subsequent studies, may increase the predictive power of the model. Because we relied on administrative coding to identify cases of severe sepsis and septic shock, it is possible that there is misclassification within our cohort. Recent studies indicate, however, that the Angus definition, used in our study, has high negative and positive predictive values for severe sepsis identification.[23] It is still possible that our cohort is skewed toward a more severely ill population, making our results less generalizable to the less severely ill septic patients.[24] The study was performed at a single healthcare system and included only cases of severe sepsis or septic shock that had a positive blood culture, and thus the findings may not be broadly generalizable either to patients without a positive blood culture or to institutions that do not resemble it.
In summary, we have demonstrated that survivors of culture‐positive severe sepsis or septic shock have a high rate of 30‐day rehospitalization. Because the US federal government's initiatives deem 30‐day readmissions to be a quality metric and penalize institutions with higher‐than average readmission rates, a high volume of critically ill patients with culture‐positive severe sepsis and septic shock may disproportionately put an institution at risk for such penalties. Unfortunately, not many of the determinants of readmission are amenable to prevention. As sepsis survival continues to improve, hospitals will need to concentrate their resources on coordinating care of these complex patients so as to improve both individual quality of life and the quality of care that they provide.
Disclosures
This study was supported by a research grant from Cubist Pharmaceuticals, Lexington, Massachusetts. Dr. Kollef's time was in part supported by the Barnes‐Jewish Hospital Foundation. The authors report no conflicts of interest.
- , , , et al; Sepsis Occurrence in Acutely Ill Patients Investigators. Sepsis in European intensive care units: results of the SOAP study. Crit Care Med. 2006;34:344–353
- , , , et al. Death in the United States, 2007. NCHS Data Brief. 2009;26:1–8.
- , , , et al. The epidemiology of sepsis in the United States from 1979 through 2000. N Engl J Med. 2003;348:1548–1564.
- , , , , , . Epidemiology of severe sepsis in the United States: analysis of incidence, outcome, and associated costs of care. Crit Care Med. 2001;29:1303–1310.
- , , , et al: Hospitalizations, costs, and outcomes of severe sepsis in the United States 2003 to 2007. Crit Care Med. 2012;40:754–761.
- , , , et al. Facing the challenge: decreasing case fatality rates in severe sepsis despite increasing hospitalization. Crit Care Med. 2005;33:2555–2562.
- , , , et al. Rapid increase in hospitalization and mortality rates for severe sepsis in the United States: a trend analysis from 1993 to 2003. Crit Care Med. 2007;35:1244–1250.
- , , , , . Two decades of mortality trends among patients with severe sepsis: a comparative meta‐analysis. Crit Care Med. 2014;42:625–631.
- , , , et al. Preventing 30‐day hospital readmissions: a systematic review and meta‐analysis of randomized trials. JAMA Intern Med. 2014;174:1095–1107.
- , . Trends in septicemia hospitalizations and readmissions in selected HCUP states, 2005 and 2010. HCUP Statistical Brief #161. Agency for Healthcare Research and Quality, Rockville, MD. Available at: http://www.hcup‐us.ahrq.gov/reports/statbriefs/sb161.pdf. Published September 2013, Accessed January 13, 2015.
- , , , . Early and late unplanned rehospitalizations for survivors of critical illness. Crit Care Med. 2015;43:430–438.
- , , , , , . Hospital readmission and healthcare utilization following sepsis in community settings. J Hosp Med. 2014;9:502–507.
- , , , , . Increased 1‐year healthcare use in survivors of severe sepsis. Am J Respir Crit Care Med. 2014;190:62–69.
- , , , , . Multi‐drug resistance, inappropriate initial antibiotic therapy and mortality in Gram‐negative severe sepsis and septic shock: a retrospective cohort study. Crit Care. 2014;18:596.
- , , . Does combination antimicrobial therapy reduce mortality in Gram‐negative bacteraemia? A meta‐analysis. Lancet Infect Dis. 2004;4:519–527.
- , , , et al. Multidrug‐resistant, extensively drug‐resistant and pandrug‐resistant bacteria: an international expert proposal for interim standard definitions for acquired resistance. Clin Microbiol Infect. 2012;18:268–281.
- , , , , ; Acute Dialysis Quality Initiative Workgroup. Acute renal failure—definition, outcome measures, animal models, fluid therapy and information technology needs: the Second International Consensus Conference of the Acute Dialysis Quality Initiative (ADQI) Group. Crit Care. 2004;8:R204–R212.
- , , , . APACHE II: a severity of disease classification system. Crit Care Med. 1985;13:818–829.
- , , , et al. RIFLE criteria for acute kidney injury are associated with hospital mortality in critically ill patients: a cohort analysis. Crit Care. 2006;10:R73
- , , , , , . The association of acute kidney injury in the critically ill and postdischarge outcomes: a cohort study. Crit Care Med. 2015;43:354–364.
- , , , . Frequency, cost, and risk factors of readmissions among severe sepsis survivors. Crit Care Med. 2015;43:738–746.
- Acute Kidney Injury Work Group. Kidney disease: improving global outcomes (KDIGO). KDIGO clinical practice guideline for acute kidney injury. Kidney Int Suppl. 2012;2:1–138. Available at: http://www.kdigo.org/clinical_practice_guidelines/pdf/KDIGO%20AKI%20Guideline.pdf. Accessed March 4, 2015.
- , , , , , . Validity of administrative data in recording sepsis: a systematic review. Crit Care. 2015;19(1):139.
- , , , , , . Severe sepsis cohorts derived from claims‐based strategies appear to be biased toward a more severely ill patient population. Crit Care Med. 2013;41:945–953.
© 2015 Society of Hospital Medicine
Dyspnea Assessment and Management Survey
Dyspnea, defined as a subjective experience of breathing discomfort,[1] is the seventh most frequent reason adult patients present to the emergency room and the most frequent cause for emergency room visits in patients 65 years or older.[2] Moreover, dyspnea is experienced by 49% of patients hospitalized with a medical condition[3, 4, 5] and by 70% of patients who are seriously ill.[6]
Based on evidence that patients are not treated consistently and effectively for relief of their shortness of breath, the American College of Chest Physicians (ACCP) statement on dyspnea management in patients with advanced lung or heart disease recommended that patients should be asked to rate their dyspnea, and the rating should be routinely documented in the medical record to guide management.[7] Although clinicians may question the utility of routine assessment of dyspnea using a standardized scale, studies have found that the prevalence of dyspnea reported from chart review is much lower than when patients are directly interviewed.[8] This may be the result of underrecognition of dyspnea or poor documentation by physicians, or that patients may not communicate their symptoms unless the physician specifically asks. As is the case with pain, routine assessment of dyspnea severity could lead to improved clinical management and greater patient‐centered care. However, unlike in the case of pain, regulatory bodies, such as the Joint Commission for Accreditation of Healthcare Organization, do not require routine dyspnea assessment.[9]
Currently, there are more than 40,000 hospitalists in the United States, and the vast majority of hospitals with >200 beds have a hospitalist group.[10] Hospitalists care for over 60% of inpatients[11] and play a major role in the management of patients with acute cardiopulmonary diseases. If standardized approaches for the assessment and documentation of dyspnea are to be implemented, hospitalists would be a key stakeholder group for utilizing enhanced clinical information about dyspnea. Therefore, we evaluated attitudes and practices of hospitalists in regard to the assessment and management of dyspnea, including the potential benefits and challenges related to the implementation of standardized assessment. We hypothesized that hospitalists would believe that a dyspnea scale for assessment of severity could improve their management of patients with cardiovascular diseases. Further, we hypothesized that physicians who agreed with the general statement that dyspnea is an important clinical problem would be more likely to believe that routine dyspnea assessment would be valuable.
METHODS
Study Sample
We invited 255 attending hospitalists from 9 geographically and structurally diverse hospitals to complete a survey about the assessment and management of dyspnea. The 9 hospitals represent range of practice environments including 4 academic medical centers, 2 community teaching and 3 nonteaching hospitals, 1 Veterans Administration hospital, and 2 staff‐model HMOs (see Supporting Table 1 in the online version of this article). The survey was distributed online using REDCap (Research Electronic Data Capture), a secure web‐based interface application.[12] A coinvestigator who was a pulmonary critical‐care physician at each site sent an initial email to their hospitalist groups that alerted them to expect a survey from the principal investigator. This notification was subsequently followed by an email invitation containing an informational cover letter and a link to the online survey. The cover letter stated that the completed surveys would not be stored at the local sites and that all the analyzed data would be deidentified. Nonrespondents were sent reminders at 2 and 4 weeks after the initial mailing. A $25 electronic gift card was provided as a gesture of appreciation for their time. The survey was conducted between September 2013 and December 2013.
The study was approved by the Baystate Health Institutional Review Board, Springfield, Massachusetts, with a waiver for written informed consent.
Questionnaire
We developed a 17‐item instrument based on a review of the dyspnea literature and a prior ACCP survey.[12] Questions were piloted with 4 hospitalists at a single institution and modified to improve face validity and clarity (see Supporting Information in the online version of this article for the full survey).
Hospitalists were asked to consider the care of patients admitted for acute cardiopulmonary disease, including heart failure, chronic obstructive pulmonary disease, and pneumonia. A series of 5‐point Likert scales were used to assess the respondents level of agreement with statements related to the following domains: the importance of dyspnea in clinical care, the potential benefits and challenges of routine dyspnea assessment (statements such as: Having a standardized assessment of dyspnea severity would be helpful in management of patients with cardiopulmonary diseases. Dyspnea assessment by a scale should be part of the vital signs for patients with cardiopulmonary diseases.), and management of dyspnea (questions regarding the use of opioids and other nonpharmacological therapies). Additional questions were asked about current assessment practices (questions such as: How often do you assess severity of dyspnea? What is your approach in assessing dyspnea? with options of choosing a categorical or numerical scale), if dyspnea is assessed in their institution by nurses and how often, and the influence of dyspnea severity assessment on their management. The survey had 1 question that solicited comments from the participants: If you don't think that it would be useful to have a standardized dyspnea assessment, please tell us why.
Data Analysis
Responses to survey questions were summarized via counts and percentages in each response category. Adopting the methodology used in the ACCP consensus statement, strongly agree and somewhat agree were combined into a single category of agreement. We also presented percentage of responses in the 2 levels of agreement (strongly agree and somewhat agree) for each question in a bar graph.
Associations between tertiles of physicians' time in practice and attitude toward dyspnea were evaluated via 2 or Fisher exact test.
To examine how answers to the first 2 questions, which assessed attitude toward importance of dyspnea in clinical care, affect answers to the remaining questions, we grouped respondents in 3 categories (strongly agree, agree to these questions, do not agree) and tested the associations using 2 or Fisher exact test.
All analyses were performed using SAS version 9.3 (SAS institute, Inc., Cary, NC) and Stata release 13.1 (StataCorp, College Station, TX).
RESULTS
Overall, 178 (69.8%) of 255 identified hospitalists completed the survey, and all 9 participating hospitals had a response rate greater than 50%. The median number of years in practice was 6 (range, 038 years). A majority (77.5%) of respondents agreed with the statement that dyspnea is 1 of the major symptoms of patients with cardiopulmonary disease, and that its treatment is central to the management of these patients (77.0%) (Figure 1).
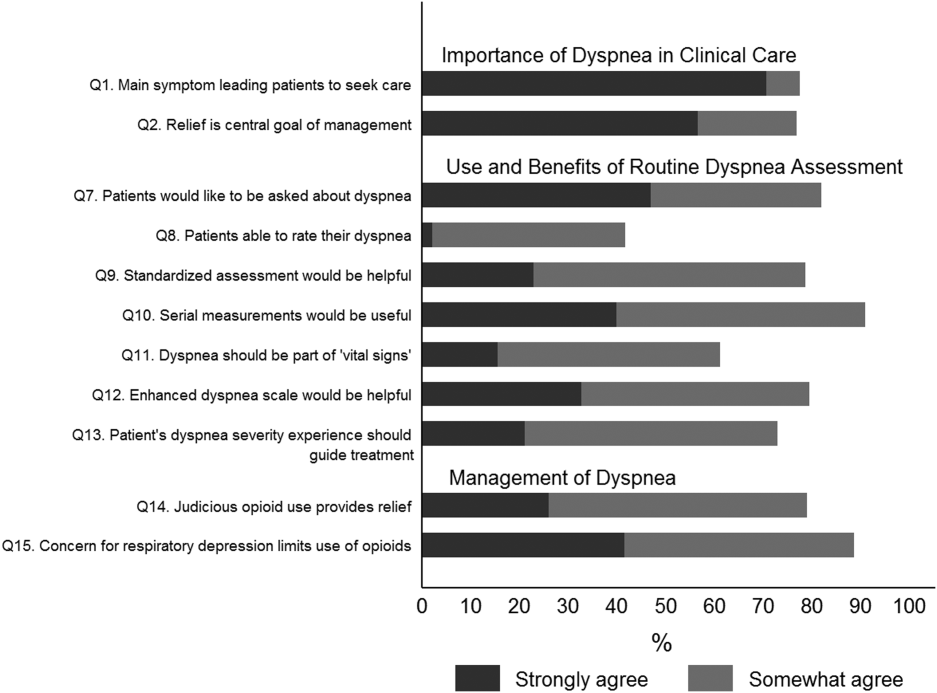
Attitude and Practices Surrounding Dyspnea Assessment
When asked about their current assessment of dyspnea, a majority (84.3%) of the hospitalists stated that they assess dyspnea on a daily basis; two‐thirds indicated that they use a categorical scale (ie, no shortness of breath, improved or worsened compared with a prior date), and one‐third indicated that they ask whether the patient is dyspneic or not. Fifty‐six percent of hospitalists stated that dyspnea is regularly assessed by nurses in their hospital.
The majority of respondents agreed (78.6%, 23.0% strongly and 55.6% somewhat agree) that standardized assessment of dyspnea severity, using a numeric scale and serial measurements as part of the vital signs, would benefit the management of patients with cardiopulmonary diseases. Furthermore, 79.6% (33.0% strongly and 46.6% somewhat agree) reported that using a dyspnea scale that included information to further characterize the patient‐reported experience, such as the level of distress associated with dyspnea, would be helpful in management.
Approximately 90% of the hospitalists indicated that awareness of dyspnea severity has an influence on clinical decision making, including whether to intensify treatment of underlying conditions, to pursue additional diagnostic testing, or to modify discharge timing. Additionally, two‐thirds of hospitalists agreed that awareness of dyspnea severity influences their decision to add opioids, whereas only one‐third prescribed nonpharmacologic symptom‐oriented treatment (Table 1).
| Frequency (%) | |
|---|---|
| |
| When caring for patients with acute cardiopulmonary diseases, how often do you assess severity of dyspnea?* | |
| At admission | 66 (37.1) |
| At discharge | 59 (33.2) |
| Daily until discharge | 150 (84.3) |
| More often than daily | 58 (32.6) |
| Which description best characterizes your approach to assessing dyspnea severity? | |
| I don't regularly ask about dyspnea severity | 3 (1.7) |
| I ask the patient whether or not they are having shortness of breath | 50 (28.3) |
| I ask the patient to rate the severity of shortness of breath using a numeric scale | 4 (2.3) |
| I ask the patient to rate the severity of shortness of breath using a categorical scale (eg, somewhat SOB, no SOB, improved or worsened compared with a prior date) | 120 (67.8) |
| When is dyspnea severity assessed and documented by nursing at your hospital?* | |
| Dyspnea is not routinely assessed | 60 (33.7) |
| At admission | 30 (16.9) |
| Daily | 43 (24.2) |
| Each shift | 64 (36.0) |
| Awareness of dyspnea severity affects my management by:* | |
| Influencing my decision to intensify treatment of the patient's underlying condition | 170 (95.5) |
| Influencing my decision to pursue additional diagnostic testing | 160 (89.9) |
| Influencing my decision to add pharmacologic‐based, symptom‐oriented treatment for dyspnea, such as opioids | 115 (64.6) |
| Influencing my decision to add nonpharmacologic‐based, symptom‐oriented treatment for dyspnea, such as fans or pursed lip breathing technique | 58 (32.6) |
| Influencing my decision regarding timing of discharge | 162 (91.0) |
| Which of the following nonpharmacologic therapies are effective for the relief of dyspnea?* | |
| Pursed lip breathing | 113 (63.5) |
| Relaxation techniques | 137 (77.0) |
| Noninvasive ventilation | 143 (80.3) |
| O2 for nonhypoxemic patients | 89 (50.0) |
| Cool air/fan | 125 (70.2) |
| Cognitive behavioral strategies | 101 (56.7) |
Forty‐two percent of the respondents agreed that patients are able to rate their dyspnea on a scale (2.3% strongly agree and 40.0% agree), and 73.0% indicated that patient experience of dyspnea should guide management independent of physiologic measures such as respiratory rate and oxygen saturation (Figure 1).
Several potential barriers were identified among the 18 participants who did not think that a standardized assessment of dyspnea would be beneficial, including concerns that (1) a dyspnea severity scale is too subjective and numerical scales are not useful for a subjective symptom (19.0%), (2) patients may overrate their symptom or will not be able to rate their dyspnea using a scale (31.0%), or (3) categorical description is sufficient (31.0%).
Practices in Dyspnea Management
Seventy‐nine percent of respondents agreed with the statement that judicious use of opioids can provide relief of dyspnea (26.1% strongly and 52.8% agreed), and 88.7% hospitalists identified the risk of respiratory depression as 1 of the barriers for the limited use of opioids. The majority of physicians (60%80%) considered nonpharmacologic therapies effective for symptomatic treatment of dyspnea, including in the order of agreement: noninvasive ventilation, relaxation techniques, cool air/fan, use of pursed lip breathing, and oxygen for nonhypoxemic patients (Table 1).
Physician Experience and Attitudes Toward Dyspnea Management
When we stratified hospitalists in tertiles of median years of time in practice (median [range]: 2 [04], 6 [58] and 15 [938]), we did not find an association with any of the responses to the questions.
Attitude Regarding the Importance of Dyspnea in Clinical Care and Responses to Subsequent Questions
Respondents who strongly agree or agree that dyspnea is the primary presenting symptom in patients with cardiovascular condition and that dyspnea relief is central to the management of these patients were more likely to believe that patients would like to be asked about their dyspnea (61.2% vs 30.2% vs 29.7%). They also had a more positive attitude about the usefulness of a standardized assessment of dyspnea and the inclusion of the assessment of dyspnea by a scale in the vital signs (Table 2).
| Description | Do Not Agree, n (%) | Somewhat Agree, n (%) | Strongly Agree, n (%) | P Value* |
|---|---|---|---|---|
| ||||
| 37 (20.9) | 43 (24.3) | 97 (54.8) | ||
| Which description best characterizes your approach to assessing dyspnea severity? | 0.552 | |||
| I don't regularly ask about dyspnea severity | 0 (0) | 0 (0) | 3 (3.1) | |
| I ask the patient whether or not they are having shortness of breath | 11 (29.7) | 14 (32.6) | 25 (25.8) | |
| I ask the patient to rate the severity of shortness of breath using a numeric scale | 2 (5.4) | 1 (2.3) | 1 (1.0) | |
| I ask the patient to rate the severity of shortness of breath using a categorical scale (e.g., somewhat shortness of breath, no shortness of breath, improved or worsened compared with a prior date) | 24 (64.9) | 28 (65.1) | 68 (70.1) | |
| Patients would like me to ask them about their dyspnea. | <0.0001 | |||
| Somewhat agree | 9 (24.3) | 21 (48.8) | 32 (32.7) | |
| Strongly agree | 11 (29.7) | 13 (30.2) | 60 (61.2) | |
| Patients are able to rate their own dyspnea intensity on a scale of 0‐10. | 0.432 | |||
| Somewhat agree | 12 (32.4) | 16 (37.2) | 42 (43.3) | |
| Strongly agree | 2 (5.4) | 0 (0) | 2 (2.1) | |
| Having a standardized assessment of dyspnea severity would be helpful to me in management of patients with cardiopulmonary diseases. | 0.026 | |||
| Somewhat agree | 17 (46.0) | 25 (58.1) | 57 (58.2) | |
| Strongly agree | 7 (18.9) | 6 (14.0) | 28 (28.6) | |
| Serial measurements of dyspnea would be useful for assessing response to therapy. | 0.042 | |||
| Somewhat agree | 14 (37.8) | 28 (65.1) | 48 (49.5) | |
| Strongly agree | 16 (43.2) | 12 (27.9) | 43 (44.3) | |
| Dyspnea assessment by a scale should be part of the vital signs for patients with cardiopulmonary diseases. | 0.042 | |||
| Somewhat agree | 13 (35.1) | 17 (39.5) | 51 (52.0) | |
| Strongly agree | 4 (10.8) | 5 (11.6) | 19 (19.4) | |
| Using an enhanced dyspnea scale that includes information about the following 4 features 1) Current dyspnea severity, 2) Worst dyspnea ever, 3) Improvement of dyspnea since admission, 4) Acceptability of current level of dyspnea, would be more helpful for my management than a single question focused on dyspnea severity. | 0.03 | |||
| Somewhat agree | 14 (40.0) | 24 (55.8) | 44 (44.9) | |
| Strongly agree | 9 (25.7) | 9 (20.9) | 40 (40.8) | |
| The patients experience of dyspnea should be used to guide treatment decisions independent of objective measures such as respiratory rate and oxygen saturation. | 0.10 | |||
| Somewhat agree | 20 (54.0) | 21 (48.8) | 51 (52.0) | |
| Strongly agree | 5 (13.5) | 6 (14.0) | 27 (27.6) | |
| Judicious use of oral and/or parenteral opioids can provide relief of dyspnea. | 0.21 | |||
| Somewhat agree | 20 (54.0) | 23 (54.8) | 50 (51.6) | |
| Strongly agree | 10 (27.0) | 6 (14.3) | 30 (30.9) | |
| Limited use of opioids for relief of dyspnea in patients with advanced cardiopulmonary disorders is often due to concerns of respiratory depression. | 0.71 | |||
| Somewhat agree | 17 (46.0) | 23 (54.8) | 43 (43.9) | |
| Strongly agree | 15 (40.5) | 14 (33.3) | 45 (45.9) | |
DISCUSSION
In this survey of 178 most hospitalists from a diverse group of 9 US hospitals, we found that most indicate that severity of dyspnea has a profound influence on their clinical practice (including their decision whether to intensify treatments such as diuretics or bronchodilators, to pursue additional diagnostic testing, add opioids or other nonpharmacological treatments) and ultimately their decision regarding the timing of hospital discharge. More importantly, whereas less than half reported experience with standardized assessment of dyspnea severity, most stated that such data would be very useful in their practice.
Despite being a highly prevalent symptom in diverse patient populations, several studies have shown that documentation of dyspnea is sporadic and evaluation of dyspnea quality of care is not routinely performed.[13, 14, 15] Statements from a number of professional societies, including the ACCP, the American Thoracic Society and the Canadian Respiratory Society, recommend that dyspnea management should rely on patient reporting, and that dyspnea severity should be recorded.[1, 4, 7] Assessment is an essential step to guide interventions; however, simply asking about the presence or absence of dyspnea is insufficient.
Several rating scales have been validated and might be implementable in the acute care setting, including the Numerical Rating Scale and the Visual Assessment Scale.[16, 17, 18, 19, 20] Our survey shows that standardized documentation of dyspnea severity in clinical practice is uncommon. However, most hospitalists in our study believed that assessment of dyspnea, using a standardized scale, would positively impact their management of patients with cardiopulmonary disease.
There are a number of potential benefits of routine assessment of dyspnea in hospitalized patients. Implementation of a standardized approach to dyspnea measurement would result in more uniform assessment and documentation practices, and in turn greater awareness among members of the patient‐care team. Though not sufficient to improve care, measurement is necessary because physicians do not always recognize the severity of patients' dyspnea or may not recognize its presence. A retrospective study that assessed the prevalence of symptoms in 410 ambulatory patients showed that one‐quarter of patients had dyspnea, but only half of them told their doctor about it.[21] Two other studies of patients with cancer diagnoses found that 30%70% of patients had dyspnea, but the symptom was recognized in only half of them; even when recognized, dyspnea severity was frequently underrated by physicians.[21, 22] Importantly, underestimation appears to correlate with underutilization of symptomatic management of dyspnea.[8]
Although the results of our survey are encouraging, they highlight a number of potential barriers and misconceptions among hospitalists. For example, although dyspnea can be characterized only by the person experiencing it, only 42% of our survey respondents believed that patients are able to rate their dyspnea intensity on a scale. Some of these responses may be influenced by the fact that dyspnea scales are not currently available to patients under their care. Another explanation is that similar to the case for pain, some hospitalists may believe that patients will exaggerate dyspnea severity. Almost one‐third of the respondents stated that objective measures, such as respiratory rate or oxygen saturation, are more important than a patient's experience of dyspnea in guiding the treatment, and that dyspnea is a subjective symptom and not a vital sign itself. Hospitalists who appreciated the importance of dyspnea in clinical practice were more likely to support the implementation of a standardized dyspnea scale for dyspnea assessment.
Although the potential benefits of including routine measurement of dyspnea in standard hospital practice may seem obvious, evidence that implementing routine assessment improves patient care or outcomes is lacking. Even if hospitalists see the value of dyspnea assessment, asking nurses to collect and document additional information would represent a substantial change in hospital workflow. Finally, without specific protocols to guide care, it is unclear whether physicians will be able to use new information about dyspnea severity effectively. Future studies need to evaluate the impact of implementing routine dyspnea assessment on the management of patients with cardiopulmonary diseases including the use of evidence‐based interventions and reducing the use of less valuable care.
Most hospitalists agreed with the basic principles of dyspnea treatment in patients with advanced cardiopulmonary disease after the primary disease had been stabilized. Effective measures are available, and several guidelines endorse opioids in dyspnea management.[1, 4, 7] However, many clinicians are uncomfortable with this approach for dyspnea, and opioids remain underused. In our study, almost 90% of physicians recognized that concerns about respiratory depression limits opioids use as a treatment. A qualitative study that explored the physicians' perspective toward opioids showed that most physicians were reluctant to prescribe opioids for refractory dyspnea, describing a lack of related knowledge and experience, and fears related to the potential adverse effects. The findings of our study also outline the need to better educate residents and hospitalists on the assessment and management of dyspnea, including prescribing opioids for refractory dyspnea.[23]
Study Strengths and Limitations
This study has several strengths. To our knowledge, it is the first to explore hospitalists' perspectives on incorporating dyspnea assessment in their clinical practice. Hospitalists are the attending physicians for a large majority of inpatients and would be the main users of a dyspnea severity scale. Our questionnaire survey included a large number of hospitalists, from 9 geographically and structurally diverse hospitals, which increased the generalizability of the findings to other hospitals around the country.
The study also has several limitations that need be kept in mind in interpreting the study results. First, desirability bias may have exaggerated some of the positive views expressed by hospitalists toward implementation of routine assessment of dyspnea. Second, because this was a survey, the estimates of dyspnea assessment and documentation practices of both physicians and nurses were based on the respondents' perception and not an objective review of medical records, and the results may be different from actual practice. Third, this was not a population‐based random sample of hospitalists, and it may not be entirely representative; however, those surveyed were from a diverse set of sites with different geographical location, size, academic affiliation, and practice environment, and their time in practice varied widely. Last, we do not have information on nonrespondents, and there is a possibility of nonresponse bias, although the high response rate lessens the risk.
CONCLUSIONS
The results of this survey suggest that most hospitalists believe that routine assessment of dyspnea severity would enhance their clinical decision making and improve patient care. Standardized assessment of dyspnea might result in better awareness of this symptom among providers, reduce undertreatment and mistreatment, and ultimately result in better outcomes for patients. However, implementation of the routine assessment of dyspnea would change current clinical practices and may have a significant effect on existing nursing and physician workflows. Additional research is needed to determine the feasibility and impact on outcomes of routine dyspnea assessment.
Acknowledgements
The authors wish to acknowledge Ms. Anu Joshi for her help with editing the manuscript and assisting with table preparations.
Disclosures
Dr. Stefan is supported by grant K01HL114631‐01A1 from the National Heart, Lung, and Blood Institute of the National Institutes of Health, and by the National Center for Research Resources and the National Center for Advancing Translational Sciences, National Institutes of Health, through grant UL1RR025752. The funder had no role in the design and conduct of the study; collection, management, analysis, and interpretation of the data; preparation, review, or approval of the manuscript; and decision to submit the manuscript for publication. M.S.S. and P.K.L. conceived of the study. M.S.S. acquired the data with the help of all collaborators. M.S.S., P.K.L., P.S.P., and A.P. analyzed and interpreted the data. M.S.S. drafted the manuscript. All authors critically reviewed the manuscript for intellectual content. M.S.S., P.K.L., and A.P. had full access to all of the data in the study and take responsibility for the integrity of the data and the accuracy of the data analysis. M.S.S. is the guarantor for this article, and is responsible for the content of the article, including data and analysis. The authors report no conflicts of interest.
- , , , et al. An Official American Thoracic Society Statement: Update on the Mechanisms, Assessment, and Management of Dyspnea. Am J Respir Crit Care Med. 2012;185(4):435–452.
- CDC/ National Center for Health Statistics. National Hospital Amulatory Medical Care Survey: 2011 Emergency Department Summary Tables. http://www.cdc.gov/nchs/data/ahcd/nhamcs_emergency/2011_ed_web_tables.pdf. Accessed May 15, 2015.
- , , , . Signs and symptoms of heart failure: are you asking the right questions? Am J Crit Care. 2010;19(5):443–452.
- , , , et al. Managing dyspnea in patients with advanced chronic obstructive pulmonary disease: a Canadian Thoracic Society clinical practice guideline. Can Respir J. 2011;18(2):69–78.
- , . Prevalence of distressing symptoms in hospitalised patients on medical wards: A cross‐sectional study. BMC Palliat Care. 2008;7:16.
- , . Dyspnea in terminally ill cancer patients. Chest. 1986;89(2):234–236.
- , , , et al. American College of Chest Physicians consensus statement on the management of dyspnea in patients with advanced lung or heart disease. Chest. 2010;137(3):674–691.
- , . Common symptoms in ambulatory care: incidence, evaluation, therapy, and outcome. Am J Med. 1989;86(3):262–266.
- The Joint Commission. Facts about Pain Management. http://www.jointcommission.org/pain_management/. Accessed May, 15, 2015.
- . Hospitalist programs in the age of healthcare reform. J Healthc Manag. 2010;55(6):378–380.
- , , , . The Use of Hospitalists by Small Rural Hospitals: Results of a National Survey. Med Care Res Rev. 2014;71(4):356–366.
- Tufts CTSI. REDCap [Internet]. Tufts Clinical and Translational Science Institute. http://www.tuftsctsi.org/Services-and-Consultation/REDCap.aspx. Accessed May, 15, 2015.
- , . Multi‐dimensional Assessment of Dyspnea. Dyspnoea in Advanced Disease: A guide to clinical management; 2005.
- , , , et al. Cancer care quality measures: symptoms and end‐of‐life care. Evid Rep Technol Assess (Full Rep). 2006(137):1–77.
- . Defining and measuring quality palliative and end‐of‐life care in the intensive care unit. Crit Care Med. 2006;34(11 Suppl):S309–316.
- . Validation of a vertical visual analogue scale as a measure of clinical dyspnea. Rehabil Nurs. 1989;14(6):323–325.
- . Can a self‐rating 0‐10 scale for dyspnea yield a common language that is understood by ED nurses, patients, and their families? J Emerg Nurs. 2000;26(3):233–234.
- , , . Measurement of dyspnea: word labeled visual analog scale vs. verbal ordinal scale. Respir Physiol Neurobiol. 2003;134(2):77–83.
- , , , , , . Verbal numerical scales are as reliable and sensitive as visual analog scales for rating dyspnea in young and older subjects. Respir Physiol Neurobiol. 2007;157(2‐3):360–365.
- , , , , . Validation of a three‐factor measurement model of dyspnea in hospitalized adults with heart failure. Heart Lung. 2011;41(1):44–56.
- , , . Patient reporting and doctor recognition of dyspnoea in a comprehensive cancer centre. Intern Med J. 2006;36(6):381–384.
- , , , . Lung cancer and dyspnea: the patient's perception. Oncol Nurs Forum. 1986;13(5):19–24.
- , , , . Opioids, respiratory function, and dyspnea. Am J Hosp Palliat Care. 2003;20(1):57–61.
Dyspnea, defined as a subjective experience of breathing discomfort,[1] is the seventh most frequent reason adult patients present to the emergency room and the most frequent cause for emergency room visits in patients 65 years or older.[2] Moreover, dyspnea is experienced by 49% of patients hospitalized with a medical condition[3, 4, 5] and by 70% of patients who are seriously ill.[6]
Based on evidence that patients are not treated consistently and effectively for relief of their shortness of breath, the American College of Chest Physicians (ACCP) statement on dyspnea management in patients with advanced lung or heart disease recommended that patients should be asked to rate their dyspnea, and the rating should be routinely documented in the medical record to guide management.[7] Although clinicians may question the utility of routine assessment of dyspnea using a standardized scale, studies have found that the prevalence of dyspnea reported from chart review is much lower than when patients are directly interviewed.[8] This may be the result of underrecognition of dyspnea or poor documentation by physicians, or that patients may not communicate their symptoms unless the physician specifically asks. As is the case with pain, routine assessment of dyspnea severity could lead to improved clinical management and greater patient‐centered care. However, unlike in the case of pain, regulatory bodies, such as the Joint Commission for Accreditation of Healthcare Organization, do not require routine dyspnea assessment.[9]
Currently, there are more than 40,000 hospitalists in the United States, and the vast majority of hospitals with >200 beds have a hospitalist group.[10] Hospitalists care for over 60% of inpatients[11] and play a major role in the management of patients with acute cardiopulmonary diseases. If standardized approaches for the assessment and documentation of dyspnea are to be implemented, hospitalists would be a key stakeholder group for utilizing enhanced clinical information about dyspnea. Therefore, we evaluated attitudes and practices of hospitalists in regard to the assessment and management of dyspnea, including the potential benefits and challenges related to the implementation of standardized assessment. We hypothesized that hospitalists would believe that a dyspnea scale for assessment of severity could improve their management of patients with cardiovascular diseases. Further, we hypothesized that physicians who agreed with the general statement that dyspnea is an important clinical problem would be more likely to believe that routine dyspnea assessment would be valuable.
METHODS
Study Sample
We invited 255 attending hospitalists from 9 geographically and structurally diverse hospitals to complete a survey about the assessment and management of dyspnea. The 9 hospitals represent range of practice environments including 4 academic medical centers, 2 community teaching and 3 nonteaching hospitals, 1 Veterans Administration hospital, and 2 staff‐model HMOs (see Supporting Table 1 in the online version of this article). The survey was distributed online using REDCap (Research Electronic Data Capture), a secure web‐based interface application.[12] A coinvestigator who was a pulmonary critical‐care physician at each site sent an initial email to their hospitalist groups that alerted them to expect a survey from the principal investigator. This notification was subsequently followed by an email invitation containing an informational cover letter and a link to the online survey. The cover letter stated that the completed surveys would not be stored at the local sites and that all the analyzed data would be deidentified. Nonrespondents were sent reminders at 2 and 4 weeks after the initial mailing. A $25 electronic gift card was provided as a gesture of appreciation for their time. The survey was conducted between September 2013 and December 2013.
The study was approved by the Baystate Health Institutional Review Board, Springfield, Massachusetts, with a waiver for written informed consent.
Questionnaire
We developed a 17‐item instrument based on a review of the dyspnea literature and a prior ACCP survey.[12] Questions were piloted with 4 hospitalists at a single institution and modified to improve face validity and clarity (see Supporting Information in the online version of this article for the full survey).
Hospitalists were asked to consider the care of patients admitted for acute cardiopulmonary disease, including heart failure, chronic obstructive pulmonary disease, and pneumonia. A series of 5‐point Likert scales were used to assess the respondents level of agreement with statements related to the following domains: the importance of dyspnea in clinical care, the potential benefits and challenges of routine dyspnea assessment (statements such as: Having a standardized assessment of dyspnea severity would be helpful in management of patients with cardiopulmonary diseases. Dyspnea assessment by a scale should be part of the vital signs for patients with cardiopulmonary diseases.), and management of dyspnea (questions regarding the use of opioids and other nonpharmacological therapies). Additional questions were asked about current assessment practices (questions such as: How often do you assess severity of dyspnea? What is your approach in assessing dyspnea? with options of choosing a categorical or numerical scale), if dyspnea is assessed in their institution by nurses and how often, and the influence of dyspnea severity assessment on their management. The survey had 1 question that solicited comments from the participants: If you don't think that it would be useful to have a standardized dyspnea assessment, please tell us why.
Data Analysis
Responses to survey questions were summarized via counts and percentages in each response category. Adopting the methodology used in the ACCP consensus statement, strongly agree and somewhat agree were combined into a single category of agreement. We also presented percentage of responses in the 2 levels of agreement (strongly agree and somewhat agree) for each question in a bar graph.
Associations between tertiles of physicians' time in practice and attitude toward dyspnea were evaluated via 2 or Fisher exact test.
To examine how answers to the first 2 questions, which assessed attitude toward importance of dyspnea in clinical care, affect answers to the remaining questions, we grouped respondents in 3 categories (strongly agree, agree to these questions, do not agree) and tested the associations using 2 or Fisher exact test.
All analyses were performed using SAS version 9.3 (SAS institute, Inc., Cary, NC) and Stata release 13.1 (StataCorp, College Station, TX).
RESULTS
Overall, 178 (69.8%) of 255 identified hospitalists completed the survey, and all 9 participating hospitals had a response rate greater than 50%. The median number of years in practice was 6 (range, 038 years). A majority (77.5%) of respondents agreed with the statement that dyspnea is 1 of the major symptoms of patients with cardiopulmonary disease, and that its treatment is central to the management of these patients (77.0%) (Figure 1).
Attitude and Practices Surrounding Dyspnea Assessment
When asked about their current assessment of dyspnea, a majority (84.3%) of the hospitalists stated that they assess dyspnea on a daily basis; two‐thirds indicated that they use a categorical scale (ie, no shortness of breath, improved or worsened compared with a prior date), and one‐third indicated that they ask whether the patient is dyspneic or not. Fifty‐six percent of hospitalists stated that dyspnea is regularly assessed by nurses in their hospital.
The majority of respondents agreed (78.6%, 23.0% strongly and 55.6% somewhat agree) that standardized assessment of dyspnea severity, using a numeric scale and serial measurements as part of the vital signs, would benefit the management of patients with cardiopulmonary diseases. Furthermore, 79.6% (33.0% strongly and 46.6% somewhat agree) reported that using a dyspnea scale that included information to further characterize the patient‐reported experience, such as the level of distress associated with dyspnea, would be helpful in management.
Approximately 90% of the hospitalists indicated that awareness of dyspnea severity has an influence on clinical decision making, including whether to intensify treatment of underlying conditions, to pursue additional diagnostic testing, or to modify discharge timing. Additionally, two‐thirds of hospitalists agreed that awareness of dyspnea severity influences their decision to add opioids, whereas only one‐third prescribed nonpharmacologic symptom‐oriented treatment (Table 1).
| Frequency (%) | |
|---|---|
| |
| When caring for patients with acute cardiopulmonary diseases, how often do you assess severity of dyspnea?* | |
| At admission | 66 (37.1) |
| At discharge | 59 (33.2) |
| Daily until discharge | 150 (84.3) |
| More often than daily | 58 (32.6) |
| Which description best characterizes your approach to assessing dyspnea severity? | |
| I don't regularly ask about dyspnea severity | 3 (1.7) |
| I ask the patient whether or not they are having shortness of breath | 50 (28.3) |
| I ask the patient to rate the severity of shortness of breath using a numeric scale | 4 (2.3) |
| I ask the patient to rate the severity of shortness of breath using a categorical scale (eg, somewhat SOB, no SOB, improved or worsened compared with a prior date) | 120 (67.8) |
| When is dyspnea severity assessed and documented by nursing at your hospital?* | |
| Dyspnea is not routinely assessed | 60 (33.7) |
| At admission | 30 (16.9) |
| Daily | 43 (24.2) |
| Each shift | 64 (36.0) |
| Awareness of dyspnea severity affects my management by:* | |
| Influencing my decision to intensify treatment of the patient's underlying condition | 170 (95.5) |
| Influencing my decision to pursue additional diagnostic testing | 160 (89.9) |
| Influencing my decision to add pharmacologic‐based, symptom‐oriented treatment for dyspnea, such as opioids | 115 (64.6) |
| Influencing my decision to add nonpharmacologic‐based, symptom‐oriented treatment for dyspnea, such as fans or pursed lip breathing technique | 58 (32.6) |
| Influencing my decision regarding timing of discharge | 162 (91.0) |
| Which of the following nonpharmacologic therapies are effective for the relief of dyspnea?* | |
| Pursed lip breathing | 113 (63.5) |
| Relaxation techniques | 137 (77.0) |
| Noninvasive ventilation | 143 (80.3) |
| O2 for nonhypoxemic patients | 89 (50.0) |
| Cool air/fan | 125 (70.2) |
| Cognitive behavioral strategies | 101 (56.7) |
Forty‐two percent of the respondents agreed that patients are able to rate their dyspnea on a scale (2.3% strongly agree and 40.0% agree), and 73.0% indicated that patient experience of dyspnea should guide management independent of physiologic measures such as respiratory rate and oxygen saturation (Figure 1).
Several potential barriers were identified among the 18 participants who did not think that a standardized assessment of dyspnea would be beneficial, including concerns that (1) a dyspnea severity scale is too subjective and numerical scales are not useful for a subjective symptom (19.0%), (2) patients may overrate their symptom or will not be able to rate their dyspnea using a scale (31.0%), or (3) categorical description is sufficient (31.0%).
Practices in Dyspnea Management
Seventy‐nine percent of respondents agreed with the statement that judicious use of opioids can provide relief of dyspnea (26.1% strongly and 52.8% agreed), and 88.7% hospitalists identified the risk of respiratory depression as 1 of the barriers for the limited use of opioids. The majority of physicians (60%80%) considered nonpharmacologic therapies effective for symptomatic treatment of dyspnea, including in the order of agreement: noninvasive ventilation, relaxation techniques, cool air/fan, use of pursed lip breathing, and oxygen for nonhypoxemic patients (Table 1).
Physician Experience and Attitudes Toward Dyspnea Management
When we stratified hospitalists in tertiles of median years of time in practice (median [range]: 2 [04], 6 [58] and 15 [938]), we did not find an association with any of the responses to the questions.
Attitude Regarding the Importance of Dyspnea in Clinical Care and Responses to Subsequent Questions
Respondents who strongly agree or agree that dyspnea is the primary presenting symptom in patients with cardiovascular condition and that dyspnea relief is central to the management of these patients were more likely to believe that patients would like to be asked about their dyspnea (61.2% vs 30.2% vs 29.7%). They also had a more positive attitude about the usefulness of a standardized assessment of dyspnea and the inclusion of the assessment of dyspnea by a scale in the vital signs (Table 2).
| Description | Do Not Agree, n (%) | Somewhat Agree, n (%) | Strongly Agree, n (%) | P Value* |
|---|---|---|---|---|
| ||||
| 37 (20.9) | 43 (24.3) | 97 (54.8) | ||
| Which description best characterizes your approach to assessing dyspnea severity? | 0.552 | |||
| I don't regularly ask about dyspnea severity | 0 (0) | 0 (0) | 3 (3.1) | |
| I ask the patient whether or not they are having shortness of breath | 11 (29.7) | 14 (32.6) | 25 (25.8) | |
| I ask the patient to rate the severity of shortness of breath using a numeric scale | 2 (5.4) | 1 (2.3) | 1 (1.0) | |
| I ask the patient to rate the severity of shortness of breath using a categorical scale (e.g., somewhat shortness of breath, no shortness of breath, improved or worsened compared with a prior date) | 24 (64.9) | 28 (65.1) | 68 (70.1) | |
| Patients would like me to ask them about their dyspnea. | <0.0001 | |||
| Somewhat agree | 9 (24.3) | 21 (48.8) | 32 (32.7) | |
| Strongly agree | 11 (29.7) | 13 (30.2) | 60 (61.2) | |
| Patients are able to rate their own dyspnea intensity on a scale of 0‐10. | 0.432 | |||
| Somewhat agree | 12 (32.4) | 16 (37.2) | 42 (43.3) | |
| Strongly agree | 2 (5.4) | 0 (0) | 2 (2.1) | |
| Having a standardized assessment of dyspnea severity would be helpful to me in management of patients with cardiopulmonary diseases. | 0.026 | |||
| Somewhat agree | 17 (46.0) | 25 (58.1) | 57 (58.2) | |
| Strongly agree | 7 (18.9) | 6 (14.0) | 28 (28.6) | |
| Serial measurements of dyspnea would be useful for assessing response to therapy. | 0.042 | |||
| Somewhat agree | 14 (37.8) | 28 (65.1) | 48 (49.5) | |
| Strongly agree | 16 (43.2) | 12 (27.9) | 43 (44.3) | |
| Dyspnea assessment by a scale should be part of the vital signs for patients with cardiopulmonary diseases. | 0.042 | |||
| Somewhat agree | 13 (35.1) | 17 (39.5) | 51 (52.0) | |
| Strongly agree | 4 (10.8) | 5 (11.6) | 19 (19.4) | |
| Using an enhanced dyspnea scale that includes information about the following 4 features 1) Current dyspnea severity, 2) Worst dyspnea ever, 3) Improvement of dyspnea since admission, 4) Acceptability of current level of dyspnea, would be more helpful for my management than a single question focused on dyspnea severity. | 0.03 | |||
| Somewhat agree | 14 (40.0) | 24 (55.8) | 44 (44.9) | |
| Strongly agree | 9 (25.7) | 9 (20.9) | 40 (40.8) | |
| The patients experience of dyspnea should be used to guide treatment decisions independent of objective measures such as respiratory rate and oxygen saturation. | 0.10 | |||
| Somewhat agree | 20 (54.0) | 21 (48.8) | 51 (52.0) | |
| Strongly agree | 5 (13.5) | 6 (14.0) | 27 (27.6) | |
| Judicious use of oral and/or parenteral opioids can provide relief of dyspnea. | 0.21 | |||
| Somewhat agree | 20 (54.0) | 23 (54.8) | 50 (51.6) | |
| Strongly agree | 10 (27.0) | 6 (14.3) | 30 (30.9) | |
| Limited use of opioids for relief of dyspnea in patients with advanced cardiopulmonary disorders is often due to concerns of respiratory depression. | 0.71 | |||
| Somewhat agree | 17 (46.0) | 23 (54.8) | 43 (43.9) | |
| Strongly agree | 15 (40.5) | 14 (33.3) | 45 (45.9) | |
DISCUSSION
In this survey of 178 most hospitalists from a diverse group of 9 US hospitals, we found that most indicate that severity of dyspnea has a profound influence on their clinical practice (including their decision whether to intensify treatments such as diuretics or bronchodilators, to pursue additional diagnostic testing, add opioids or other nonpharmacological treatments) and ultimately their decision regarding the timing of hospital discharge. More importantly, whereas less than half reported experience with standardized assessment of dyspnea severity, most stated that such data would be very useful in their practice.
Despite being a highly prevalent symptom in diverse patient populations, several studies have shown that documentation of dyspnea is sporadic and evaluation of dyspnea quality of care is not routinely performed.[13, 14, 15] Statements from a number of professional societies, including the ACCP, the American Thoracic Society and the Canadian Respiratory Society, recommend that dyspnea management should rely on patient reporting, and that dyspnea severity should be recorded.[1, 4, 7] Assessment is an essential step to guide interventions; however, simply asking about the presence or absence of dyspnea is insufficient.
Several rating scales have been validated and might be implementable in the acute care setting, including the Numerical Rating Scale and the Visual Assessment Scale.[16, 17, 18, 19, 20] Our survey shows that standardized documentation of dyspnea severity in clinical practice is uncommon. However, most hospitalists in our study believed that assessment of dyspnea, using a standardized scale, would positively impact their management of patients with cardiopulmonary disease.
There are a number of potential benefits of routine assessment of dyspnea in hospitalized patients. Implementation of a standardized approach to dyspnea measurement would result in more uniform assessment and documentation practices, and in turn greater awareness among members of the patient‐care team. Though not sufficient to improve care, measurement is necessary because physicians do not always recognize the severity of patients' dyspnea or may not recognize its presence. A retrospective study that assessed the prevalence of symptoms in 410 ambulatory patients showed that one‐quarter of patients had dyspnea, but only half of them told their doctor about it.[21] Two other studies of patients with cancer diagnoses found that 30%70% of patients had dyspnea, but the symptom was recognized in only half of them; even when recognized, dyspnea severity was frequently underrated by physicians.[21, 22] Importantly, underestimation appears to correlate with underutilization of symptomatic management of dyspnea.[8]
Although the results of our survey are encouraging, they highlight a number of potential barriers and misconceptions among hospitalists. For example, although dyspnea can be characterized only by the person experiencing it, only 42% of our survey respondents believed that patients are able to rate their dyspnea intensity on a scale. Some of these responses may be influenced by the fact that dyspnea scales are not currently available to patients under their care. Another explanation is that similar to the case for pain, some hospitalists may believe that patients will exaggerate dyspnea severity. Almost one‐third of the respondents stated that objective measures, such as respiratory rate or oxygen saturation, are more important than a patient's experience of dyspnea in guiding the treatment, and that dyspnea is a subjective symptom and not a vital sign itself. Hospitalists who appreciated the importance of dyspnea in clinical practice were more likely to support the implementation of a standardized dyspnea scale for dyspnea assessment.
Although the potential benefits of including routine measurement of dyspnea in standard hospital practice may seem obvious, evidence that implementing routine assessment improves patient care or outcomes is lacking. Even if hospitalists see the value of dyspnea assessment, asking nurses to collect and document additional information would represent a substantial change in hospital workflow. Finally, without specific protocols to guide care, it is unclear whether physicians will be able to use new information about dyspnea severity effectively. Future studies need to evaluate the impact of implementing routine dyspnea assessment on the management of patients with cardiopulmonary diseases including the use of evidence‐based interventions and reducing the use of less valuable care.
Most hospitalists agreed with the basic principles of dyspnea treatment in patients with advanced cardiopulmonary disease after the primary disease had been stabilized. Effective measures are available, and several guidelines endorse opioids in dyspnea management.[1, 4, 7] However, many clinicians are uncomfortable with this approach for dyspnea, and opioids remain underused. In our study, almost 90% of physicians recognized that concerns about respiratory depression limits opioids use as a treatment. A qualitative study that explored the physicians' perspective toward opioids showed that most physicians were reluctant to prescribe opioids for refractory dyspnea, describing a lack of related knowledge and experience, and fears related to the potential adverse effects. The findings of our study also outline the need to better educate residents and hospitalists on the assessment and management of dyspnea, including prescribing opioids for refractory dyspnea.[23]
Study Strengths and Limitations
This study has several strengths. To our knowledge, it is the first to explore hospitalists' perspectives on incorporating dyspnea assessment in their clinical practice. Hospitalists are the attending physicians for a large majority of inpatients and would be the main users of a dyspnea severity scale. Our questionnaire survey included a large number of hospitalists, from 9 geographically and structurally diverse hospitals, which increased the generalizability of the findings to other hospitals around the country.
The study also has several limitations that need be kept in mind in interpreting the study results. First, desirability bias may have exaggerated some of the positive views expressed by hospitalists toward implementation of routine assessment of dyspnea. Second, because this was a survey, the estimates of dyspnea assessment and documentation practices of both physicians and nurses were based on the respondents' perception and not an objective review of medical records, and the results may be different from actual practice. Third, this was not a population‐based random sample of hospitalists, and it may not be entirely representative; however, those surveyed were from a diverse set of sites with different geographical location, size, academic affiliation, and practice environment, and their time in practice varied widely. Last, we do not have information on nonrespondents, and there is a possibility of nonresponse bias, although the high response rate lessens the risk.
CONCLUSIONS
The results of this survey suggest that most hospitalists believe that routine assessment of dyspnea severity would enhance their clinical decision making and improve patient care. Standardized assessment of dyspnea might result in better awareness of this symptom among providers, reduce undertreatment and mistreatment, and ultimately result in better outcomes for patients. However, implementation of the routine assessment of dyspnea would change current clinical practices and may have a significant effect on existing nursing and physician workflows. Additional research is needed to determine the feasibility and impact on outcomes of routine dyspnea assessment.
Acknowledgements
The authors wish to acknowledge Ms. Anu Joshi for her help with editing the manuscript and assisting with table preparations.
Disclosures
Dr. Stefan is supported by grant K01HL114631‐01A1 from the National Heart, Lung, and Blood Institute of the National Institutes of Health, and by the National Center for Research Resources and the National Center for Advancing Translational Sciences, National Institutes of Health, through grant UL1RR025752. The funder had no role in the design and conduct of the study; collection, management, analysis, and interpretation of the data; preparation, review, or approval of the manuscript; and decision to submit the manuscript for publication. M.S.S. and P.K.L. conceived of the study. M.S.S. acquired the data with the help of all collaborators. M.S.S., P.K.L., P.S.P., and A.P. analyzed and interpreted the data. M.S.S. drafted the manuscript. All authors critically reviewed the manuscript for intellectual content. M.S.S., P.K.L., and A.P. had full access to all of the data in the study and take responsibility for the integrity of the data and the accuracy of the data analysis. M.S.S. is the guarantor for this article, and is responsible for the content of the article, including data and analysis. The authors report no conflicts of interest.
- , , , et al. An Official American Thoracic Society Statement: Update on the Mechanisms, Assessment, and Management of Dyspnea. Am J Respir Crit Care Med. 2012;185(4):435–452.
- CDC/ National Center for Health Statistics. National Hospital Amulatory Medical Care Survey: 2011 Emergency Department Summary Tables. http://www.cdc.gov/nchs/data/ahcd/nhamcs_emergency/2011_ed_web_tables.pdf. Accessed May 15, 2015.
- , , , . Signs and symptoms of heart failure: are you asking the right questions? Am J Crit Care. 2010;19(5):443–452.
- , , , et al. Managing dyspnea in patients with advanced chronic obstructive pulmonary disease: a Canadian Thoracic Society clinical practice guideline. Can Respir J. 2011;18(2):69–78.
- , . Prevalence of distressing symptoms in hospitalised patients on medical wards: A cross‐sectional study. BMC Palliat Care. 2008;7:16.
- , . Dyspnea in terminally ill cancer patients. Chest. 1986;89(2):234–236.
- , , , et al. American College of Chest Physicians consensus statement on the management of dyspnea in patients with advanced lung or heart disease. Chest. 2010;137(3):674–691.
- , . Common symptoms in ambulatory care: incidence, evaluation, therapy, and outcome. Am J Med. 1989;86(3):262–266.
- The Joint Commission. Facts about Pain Management. http://www.jointcommission.org/pain_management/. Accessed May, 15, 2015.
- . Hospitalist programs in the age of healthcare reform. J Healthc Manag. 2010;55(6):378–380.
- , , , . The Use of Hospitalists by Small Rural Hospitals: Results of a National Survey. Med Care Res Rev. 2014;71(4):356–366.
- Tufts CTSI. REDCap [Internet]. Tufts Clinical and Translational Science Institute. http://www.tuftsctsi.org/Services-and-Consultation/REDCap.aspx. Accessed May, 15, 2015.
- , . Multi‐dimensional Assessment of Dyspnea. Dyspnoea in Advanced Disease: A guide to clinical management; 2005.
- , , , et al. Cancer care quality measures: symptoms and end‐of‐life care. Evid Rep Technol Assess (Full Rep). 2006(137):1–77.
- . Defining and measuring quality palliative and end‐of‐life care in the intensive care unit. Crit Care Med. 2006;34(11 Suppl):S309–316.
- . Validation of a vertical visual analogue scale as a measure of clinical dyspnea. Rehabil Nurs. 1989;14(6):323–325.
- . Can a self‐rating 0‐10 scale for dyspnea yield a common language that is understood by ED nurses, patients, and their families? J Emerg Nurs. 2000;26(3):233–234.
- , , . Measurement of dyspnea: word labeled visual analog scale vs. verbal ordinal scale. Respir Physiol Neurobiol. 2003;134(2):77–83.
- , , , , , . Verbal numerical scales are as reliable and sensitive as visual analog scales for rating dyspnea in young and older subjects. Respir Physiol Neurobiol. 2007;157(2‐3):360–365.
- , , , , . Validation of a three‐factor measurement model of dyspnea in hospitalized adults with heart failure. Heart Lung. 2011;41(1):44–56.
- , , . Patient reporting and doctor recognition of dyspnoea in a comprehensive cancer centre. Intern Med J. 2006;36(6):381–384.
- , , , . Lung cancer and dyspnea: the patient's perception. Oncol Nurs Forum. 1986;13(5):19–24.
- , , , . Opioids, respiratory function, and dyspnea. Am J Hosp Palliat Care. 2003;20(1):57–61.
© 2015 Society of Hospital Medicine

Simulation Resident‐as‐Teacher Program
Residency training, in addition to developing clinical competence among trainees, is charged with improving resident teaching skills. The Liaison Committee on Medical Education and the Accreditation Council for Graduate Medical Education require that residents be provided with training or resources to develop their teaching skills.[1, 2] A variety of resident‐as‐teacher (RaT) programs have been described; however, the optimal format of such programs remains in question.[3] High‐fidelity medical simulation using mannequins has been shown to be an effective teaching tool in various medical specialties[4, 5, 6, 7] and may prove to be useful in teacher training.[8] Teaching in a simulation‐based environment can give participants the opportunity to apply their teaching skills in a clinical environment, as they would on the wards, but in a more controlled, predictable setting and without compromising patient safety. In addition, simulation offers the opportunity to engage in deliberate practice by allowing teachers to facilitate the same case on multiple occasions with different learners. Deliberate practice, which involves task repetition with feedback aimed at improving performance, has been shown to be important in developing expertise.[9]
We previously described the first use of a high‐fidelity simulation curriculum for internal medicine (IM) interns focused on clinical decision‐making skills, in which second‐ and third‐year residents served as facilitators.[10, 11] Herein, we describe a RaT program in which residents participated in a workshop, then served as facilitators in the intern curriculum and received feedback from faculty. We hypothesized that such a program would improve residents' teaching and feedback skills, both in the simulation environment and on the wards.
METHODS
We conducted a single‐group study evaluating teaching and feedback skills among upper‐level resident facilitators before and after participation in the RaT program. We measured residents' teaching skills using pre‐ and post‐program self‐assessments as well as evaluations completed by the intern learners after each session and at the completion of the curriculum.
Setting and Participants
We embedded the RaT program within a simulation curriculum administered July to October of 2013 for all IM interns at Massachusetts General Hospital (interns in the preliminary program who planned to pursue another field after the completion of the intern year were excluded) (n = 52). We invited postgraduate year (PGY) II and III residents (n = 102) to participate in the IM simulation program as facilitators via email. The curriculum consisted of 8 cases focusing on acute clinical scenarios encountered on the general medicine wards. The cases were administered during 1‐hour sessions 4 mornings per week from 7 AM to 8 AM prior to clinical duties. Interns completed the curriculum over 4 sessions during their outpatient rotation. The case topics were (1) hypertensive emergency, (2) post‐procedure bleed, (3) congestive heart failure, (4) atrial fibrillation with rapid ventricular response, (5) altered mental status/alcohol withdrawal, (6) nonsustained ventricular tachycardia heralding acute coronary syndrome, (7) cardiac tamponade, and (8) anaphylaxis. During each session, groups of 2 to 3 interns worked through 2 cases using a high‐fidelity mannequin (Laerdal 3G, Wappingers Falls, NY) with 2 resident facilitators. One facilitator operated the mannequin, while the other served as a nurse. Each case was followed by a structured debriefing led by 1 of the resident facilitators (facilitators switched roles for the second case). The number of sessions facilitated varied for each resident based on individual schedules and preferences.
Four senior residents who were appointed as simulation leaders (G.A.A., J.K.H., R.K., Z.S.) and 2 faculty advisors (P.F.C., E.M.M.) administered the program. Simulation resident leaders scheduled facilitators and interns and participated in a portion of simulation sessions as facilitators, but they were not analyzed as participants for the purposes of this study. The curriculum was administered without interfering with clinical duties, and no additional time was protected for interns or residents participating in the curriculum.
Resident‐as‐Teacher Program Structure
We invited participating resident facilitators to attend a 1‐hour interactive workshop prior to serving as facilitators. The workshop focused on building learner‐centered and small‐group teaching skills, as well as introducing residents to a 5‐stage debriefing framework developed by the authors and based on simulation debriefing best practices (Table 1).[12, 13, 14]
| Stage of Debriefing | Action | Rationale |
|---|---|---|
| ||
| Emotional response | Elicit learners' emotions about the case | It is important to acknowledge and address both positive and negative emotions that arise during the case before debriefing the specific medical and communications aspects of the case. Unaddressed emotional responses may hinder subsequent debriefing. |
| Objectives* | Elicit learners' objectives and combine them with the stated learning objectives of the case to determine debriefing objectives | The limited amount of time allocated for debriefing (1520 minutes) does not allow the facilitator to cover all aspects of medical management and communication skills in a particular case. Focusing on the most salient objectives, including those identified by the learners, allows the facilitator to engage in learner‐centered debriefing. |
| Analysis | Analyze the learners' approach to the case | Analyzing the learners' approach to the case using the advocacy‐inquiry method[11] seeks to uncover the learner's assumptions/frameworks behind the decision made during the case. This approach allows the facilitator to understand the learners' thought process and target teaching points to more precisely address the learners' needs. |
| Teaching | Address knowledge gaps and incorrect assumptions | Learner‐centered debriefing within a limited timeframe requires teaching to be brief and targeted toward the defined objectives. It should also address the knowledge gaps and incorrect assumptions uncovered during the analysis phase. |
| Summary | Summarize key takeaways | Summarizing highlights the key points of the debriefing and can be used to suggest further exploration of topics through self‐study (if necessary). |
Resident facilitators were observed by simulation faculty and simulation resident leaders throughout the intern curriculum and given structured feedback either in‐person immediately after completion of the simulation session or via a detailed same‐day e‐mail if the time allotted for feedback was not sufficient. Feedback was structured by the 5 stages of debriefing described in Table 1, and included soliciting residents' observations on the teaching experience and specific behaviors observed by faculty during the scenarios. E‐mail feedback (also structured by stages of debriefing and including observed behaviors) was typically followed by verbal feedback during the next simulation session.
The RaT program was composed of 3 elements: the workshop, case facilitation, and direct observation with feedback. Because we felt that the opportunity for directly observed teaching and feedback in a ward‐like controlled environment was a unique advantage offered by the simulation setting, we included all residents who served as facilitators in the analysis, regardless of whether or not they had attended the workshop.
Evaluation Instruments
Survey instruments were developed by the investigators, reviewed by several experts in simulation, pilot tested among residents not participating in the simulation program, and revised by the investigators.
Pre‐program Facilitator Survey
Prior to the RaT workshop, resident facilitators completed a baseline survey evaluating their preparedness to teach and give feedback on the wards and in a simulation‐based setting on a 5‐point scale (see Supporting Information, Appendix I, in the online version of this article).
Post‐program Facilitator Survey
Approximately 3 weeks after completion of the intern simulation curriculum, resident facilitators were asked to complete an online post‐program survey, which remained open for 1 month (residents completed this survey anywhere from 3 weeks to 4 months after their participation in the RaT program depending on the timing of their facilitation). The survey asked residents to evaluate their comfort with their current post‐program teaching skills as well as their pre‐program skills in retrospect, as previous research demonstrated that learners may overestimate their skills prior to training programs.[15] Resident facilitators could complete the surveys nonanonymously to allow for matched‐pairs analysis of the change in teaching skills over the course of the program (see Supporting Information, Appendix II, in the online version of this article).
Intern Evaluation of Facilitator Debriefing Skills
After each case, intern learners were asked to anonymously evaluate the teaching effectiveness of the lead resident facilitator using the adapted Debriefing Assessment for Simulation in Healthcare (DASH) instrument.[16] The DASH instrument evaluated the following domains: (1) instructor maintained an engaging context for learning, (2) instructor structured the debriefing in an organized way, (3) instructor provoked in‐depth discussions that led me to reflect on my performance, (4) instructor identified what I did well or poorly and why, (5) instructor helped me see how to improve or how to sustain good performance, (6) overall effectiveness of the simulation session (see Supporting Information, Appendix III, in the online version of this article).
Post‐program Intern Survey
Two months following the completion of the simulation curriculum, intern learners received an anonymous online post‐program evaluation assessing program efficacy and resident facilitator teaching (see Supporting Information, Appendix IV, in the online version of this article).
Statistical Analysis
Teaching skills and learners' DASH ratings were compared using the Student t test, Pearson 2 test, and Fisher exact test as appropriate. Pre‐ and post‐program rating of teaching skills was undertaken in aggregate and as a matched‐pairs analysis.
The study was approved by the Partners Institutional Review Board.
RESULTS
Forty‐one resident facilitators participated in 118 individual simulation sessions encompassing 236 case scenarios. Thirty‐four residents completed the post‐program facilitator survey and were included in the analysis. Of these, 26 (76%) participated in the workshop and completed the pre‐program survey. Twenty‐three of the 34 residents (68%) completed the post‐program evaluation nonanonymously (13 PGY‐II, 10 PGY‐III). Of these, 16 completed the pre‐program survey nonanonymously. The average number of sessions facilitated by each resident was 3.9 (range, 112).
Pre‐ and Post‐program Self‐Assessment of Residents' Teaching Skills
Participation in the simulation RaT program led to improvements in resident facilitators' self‐reported teaching skills across multiple domains (Table 2). These results were consistent when using the retrospective pre‐program assessment in matched‐pairs analysis (n=34) and when performing the analysis using the true pre‐program preparedness compared to post‐program comfort with teaching skills in a non‐matched‐pairs fashion (n = 26) and matched‐pairs fashion (n = 16). We report P values for the more conservative estimates using the retrospective pre‐program assessment matched‐pairs analysis. The most significant improvements occurred in residents' ability to teach in a simulated environment (2.81 to 4.16, P < 0.001 [5‐point scale]) and give feedback (3.35 to 3.77, P < 0.001).
| Pre‐program Rating (n = 34) | Post‐program Rating (n = 34) | P Value | |
|---|---|---|---|
| |||
| Teaching on rounds | 3.75 | 4.03 | 0.005 |
| Teaching on wards outside rounds | 3.83 | 4.07 | 0.007 |
| Teaching in simulation | 2.81 | 4.16 | <0.001 |
| Giving feedback | 3.35 | 3.77 | <0.001 |
Resident facilitators reported that participation in the RaT program had a significant impact on their teaching skills both within and outside of the simulation environment (Table 3). However, the greatest gains were seen in the domain of teaching in simulation. It was also noted that participation in the program improved resident facilitators' medical knowledge.
| Category | Not at All | Slightly Improved | Moderately Improved | Greatly Improved | Not Sure |
|---|---|---|---|---|---|
| Teaching on rounds, n = 34 | 4 (12%) | 12 (35%) | 13 (38%) | 4 (12%) | 1 (3%) |
| Teaching on wards outside rounds, n = 34 | 3 (9%) | 13 (38%) | 12 (35%) | 5 (15%) | 1 (3%) |
| Teaching in simulation, n = 34 | 0 (0%) | 4 (12%) | 7 (21%) | 23 (68%) | 0 (0%) |
| Giving feedback, n = 34 | 4 (12%) | 10 (29%) | 12 (35%) | 6 (18%) | 2 (6%) |
| Medical knowledge, n = 34 | 2 (6%) | 11 (32%) | 18 (53%) | 3 (9%) | 0 (0%) |
Subgroup analyses were performed comparing the perceived improvement in teaching and feedback skills among those who did or did not attend the facilitator workshop, those who facilitated 5 or more versus less than 5 sessions, and those who received or did not receive direct observation and feedback from faculty. Although numerically greater gains were seen across all 4 domains among those who attended the workshop, facilitated 5 or more sessions, or received feedback from faculty, only teaching on rounds and on the wards outside rounds reached statistical significance (Table 4). It should be noted that all residents who facilitated 5 or more sessions also attended the workshop and received feedback from faculty. We also compared perceived improvement among PGY‐II and PGY‐III residents. In contrast to PGY‐II residents, who demonstrated an improvement in all 4 domains, PGY‐III residents only demonstrated improvement in simulation‐based teaching.
| Pre‐program | Post‐program | P Value | Pre‐program | Post‐program | P Value | |
|---|---|---|---|---|---|---|
| Facilitated Less Than 5 Sessions (n = 18) | Facilitated 5 or More Sessions (n = 11) | |||||
| Did Not Attend Workshop (n = 10) | Attended Workshop (n = 22) | |||||
| Received Feedback From Resident Leaders Only (n = 11) | Received Faculty Feedback (n = 21) | |||||
| PGY‐II (n = 13) | PGY‐III (n = 9) | |||||
| ||||||
| Teaching on rounds | 3.68 | 3.79 | 0.16 | 3.85 | 4.38 | 0.01 |
| Teaching on wards outside rounds | 3.82 | 4 | 0.08 | 3.85 | 4.15 | 0.04 |
| Teaching in simulation | 2.89 | 4.06 | <0.01 | 2.69 | 4.31 | <0.01 |
| Giving feedback | 3.33 | 3.67 | 0.01 | 3.38 | 3.92 | 0.01 |
| Teaching on rounds | 4 | 4.1 | 0.34 | 3.64 | 4 | <0.01 |
| Teaching on wards outside rounds | 4 | 4 | 1.00 | 3.76 | 4.1 | <0.01 |
| Teaching in simulation | 2.89 | 4.11 | <0.01 | 2.77 | 4.18 | <0.01 |
| Giving feedback | 3.56 | 3.78 | 0.17 | 3.27 | 3.77 | <0.01 |
| Teaching on rounds | 3.55 | 3.82 | 0.19 | 3.86 | 4.14 | 0.01 |
| Teaching on wards outside rounds | 4 | 4 | 1.00 | 3.75 | 4.1 | <0.01 |
| Teaching in simulation | 2.7 | 3.8 | <0.01 | 2.86 | 4.33 | <0.01 |
| Giving feedback | 3.2 | 3.6 | 0.04 | 3.43 | 3.86 | <0.01 |
| Teaching on rounds | 3.38 | 3.85 | 0.03 | 4.22 | 4.22 | 1 |
| Teaching on wards outside rounds | 3.54 | 3.85 | 0.04 | 4.14 | 4.14 | 1 |
| Teaching in simulation | 2.46 | 4.15 | <0.01 | 3.13 | 4.13 | <0.01 |
| Giving feedback | 3.23 | 3.62 | 0.02 | 3.5 | 3.88 | 0.08 |
Intern Learners' Assessment of Resident Facilitators and the Program Overall
During the course of the program, intern learners completed 166 DASH ratings evaluating 34 resident facilitators (see Supporting Information, Appendix V, in the online version of this article). Ratings for the 6 DASH items ranged from 6.49 to 6.73 (7‐point scale), demonstrating a high level of facilitator efficacy across multiple domains. No differences in DASH scores were noted among subgroups of resident facilitators described in the previous paragraph.
Thirty‐eight of 52 intern learners (73%) completed the post‐program survey.
| Facilitator Behaviors | Very Often, >75% | Often, >50% | Sometimes, 25%50% | Rarely, <25% | Never |
|---|---|---|---|---|---|
| Elicited emotional reactions, n = 38 | 18 (47%) | 16 (42%) | 4 (11%) | 0 (0%) | 0 (0%) |
| Elicited objectives from learner, n = 37 | 26 (69%) | 8 (22%) | 2 (6%) | 1 (3%) | 0 (0%) |
| Asked to share clinical reasoning, n = 38 | 21 (56%) | 13 (33%) | 4 (11%) | 0 (0%) | 0 (0%) |
| Summarized learning points, n = 38 | 31 (81%) | 7 (19%) | 0 (0%) | 0 (0%) | 0 (0%) |
| Spoke for less than half of the session, n = 38 | 8 (22%) | 17 (44%) | 11 (28%) | 2 (6%) | 0 (0%) |
All intern learners rated the overall simulation experience as either excellent (81%) or good (19%) on the post‐program evaluation (4 or 5 on a 5‐point Likert scale, respectively). All interns strongly agreed (72%) or agreed (28%) that the simulation sessions improved their ability to manage acute clinical scenarios. Interns reported that resident facilitators frequently utilized specific debriefing techniques covered in the RaT curriculum during the debriefing sessions (Table 5).
DISCUSSION
We describe a unique RaT program embedded within a high‐fidelity medical simulation curriculum for IM interns. Our study demonstrates that resident facilitators noted an improvement in their teaching and feedback skills, both in the simulation setting and on the wards. Intern learners rated residents' teaching skills and the overall simulation curriculum highly, suggesting that residents were effective teachers.
The use of simulation in trainee‐as‐teacher curricula holds promise because it can provide an opportunity to teach in an environment closely approximating the wards, where trainees have the most opportunities to teach. However, in contrast to true ward‐based teaching, simulation can provide predictable scenarios in a controlled environment, which eliminates the distractions and unpredictability that exist on the wards, without compromising patient safety. Recently, Tofil et al. described the first use of simulation in a trainee‐as‐teacher program.[17] The investigators utilized a 1‐time simulation‐based teaching session, during which pediatric fellows completed a teacher‐training workshop, developed and served as facilitators in a simulated case, and received feedback. The use of simulation allowed fellows an opportunity to apply newly acquired skills in a controlled environment and receive feedback, which has been shown to improve teaching skills.[18]
The experience from our program expands on that of Tofil et al., as well as previously described trainee‐as‐teacher curricula, by introducing a component of deliberate practice that is unique to the simulation setting and has been absent from most previously described RaT programs.[3] Most residents had the opportunity to facilitate the same case on multiple occasions, allowing them to receive feedback and make adjustments. Residents who facilitated 5 or more sessions demonstrated more improvement, particularly in teaching outside of simulation, than residents who facilitated fewer sessions. It is notable that PGY‐II resident facilitators reported an improvement in their teaching skills on the wards, though less pronounced as compared to teaching in the simulation‐based environment, suggesting that benefits of the program may extend to nonsimulation‐based settings. Additional studies focusing on objective evaluation of ward‐based teaching are needed to further explore this phenomenon. Finally, the self‐reported improvements in medical knowledge by resident facilitators may serve as another benefit of our program.
Analysis of learner‐level data collected in the postcurriculum intern survey and DASH ratings provides additional support for the effectiveness of the RaT program. The majority of intern learners reported that resident facilitators used the techniques covered in our program frequently during debriefings. In addition, DASH scores clustered around maximum efficacy for all facilitators, suggesting that residents were effective teachers. Although we cannot directly assess whether the differences demonstrated in resident facilitators' self‐assessments translated to their teaching or were significant from the learners' perspective, these results support the hypothesis that self‐assessed improvements in teaching and feedback skills were significant.
In addition to improving resident teaching skills, our program had a positive impact on intern learners as evidenced by intern evaluations of the simulation curriculum. While utilizing relatively few faculty resources, our program was able to deliver an extensive and well‐received simulation curriculum to over 50 interns. The fact that 40% of second‐ and third‐year residents volunteered to teach in the program despite the early morning timing of the sessions speaks to the interest that trainees have in teaching in this setting. This model can serve as an important and efficient learning platform in residency training programs. It may be particularly salient to IM training programs where implementation of simulation curricula is challenging due to large numbers of residents and limited faculty resources. The barriers to and lessons learned from our experience with implementing the simulation curriculum have been previously described.[10, 11]
Our study has several limitations. Changes in residents' teaching skills were self‐assessed, which may be inaccurate as learners may overestimate their abilities.[19] Although we collected data on the experiences of intern learners that supported residents' self‐assessment, further studies using more objective measures (such as the Objective Structured Teaching Exercise[20]) should be undertaken. We did not objectively assess improvement of residents' teaching skills on the wards, with the exception of the residents' self assessment. Due to the timing of survey administration, some residents had as little as 1 month between completion of the curriculum and responding to the post‐curriculum survey, limiting their ability to evaluate their teaching skills on the wards. The transferability of the skills gained in simulation‐based teaching to teaching on the wards deserves further study. We cannot definitively attribute perceived improvement of teaching skills to the RaT program without a control group. However, the frequent use of recommended techniques during debriefing, which are not typically taught in other settings, supports the efficacy of the RaT program.
Our study did not allow us to determine which of the 3 components of the RaT program (workshop, facilitation practice, or direct observation and feedback) had the greatest impact on teaching skills or DASH ratings, as those who facilitated more sessions also completed the other components of the program. Furthermore, there may have been a selection bias among facilitators who facilitated more sessions. Because only 16 of 34 participants completed both the pre‐program and post‐program self‐assessments in a non‐anonymous fashion, we were not able to analyze the effect of pre‐program factors, such as prior teaching experience, on program outcomes. It should also be noted that allowing resident facilitators the option to complete the survey non‐anonymously could have biased our results. The simulation curriculum was conducted in a single center, and resident facilitators were self‐selecting; therefore, our results may not be generalizable. Finally, the DASH instrument was only administered after the RaT workshop and was likely limited further by the ceiling effect created by the learners' high satisfaction with the simulation program overall.
In summary, our simulation‐based RaT program improved resident facilitators' self‐reported teaching and feedback skills. Simulation‐based training provided an opportunity for deliberate practice of teaching skills in a controlled environment, which was a unique component of the program. The impact of deliberate practice on resident teaching skills and optimal methods to incorporate deliberate practice in RaT programs deserves further study. Our curriculum design may serve as a model for the development of simulation programs that can be employed to improve both intern learning and resident teaching skills.
Acknowledgements
The authors acknowledge Deborah Navedo, PhD, Assistant Professor, Massachusetts General Hospital Institute of Health Professions, and Emily M. Hayden, MD, Assistant Professor, Department of Emergency Medicine, Massachusetts General Hospital and Harvard Medical School, for their assistance with development of the RaT curriculum. The authors thank Dr. Jenny Rudolph, Senior Director, Institute for Medical Simulation at the Center for Medical Simulation, for her help in teaching us to use the DASH instrument. The authors also thank Dr. Daniel Hunt, MD, Associate Professor, Department of Medicine, Massachusetts General Hospital and Harvard Medical School, for his thoughtful review of this manuscript.
Disclosure: Nothing to report.
- Liaison Committee on Medical Education. Functions and structure of a medical school: standards for accreditation of medical education programs leading to the M.D. degree. Washington, DC, and Chicago, IL: Association of American Medical Colleges and American Medical Association; 2000.
- Accreditation Council for Graduate Medical Education. ACGME program requirements for graduate medical education in pediatrics. Available at: http://www.acgme.org/acgmeweb/Portals/0/PFAssets/2013-PR-FAQ-PIF/320_pediatrics_07012013.pdf. Accessed June 18, 2014.
- , , , . A systematic review of resident‐as‐teacher programmes. Med Educ. 2009;43(12):1129–1140.
- , , , et al. The utility of simulation in medical education: what is the evidence? Mt Sinai J Med. 2009;76:330–343.
- , , , et al. National growth in simulation training within emergency medicine residency programs, 2003–2008. Acad Emerg Med. 2008;15:1113–1116.
- , , , et al. Simulation center accreditation and programmatic benchmarks: a review for emergency medicine. Acad Emerg Med. 2010;17(10):1093–1103.
- . How much evidence does it take? A cumulative meta‐analysis of outcomes of simulation‐based education. Med Educ. 2014;48(8):750–760.
- , , , et al.. Resident‐as‐teacher: a suggested curriculum for emergency medicine. Acad Emerg Med. 2006;13(6):677–679.
- . Deliberate practice and the acquisition and maintenance of expert performance in medicine and related domains. Acad Med. 2004;79(10 suppl):S70–S81.
- , , , , , . Pilot program utilizing medical simulation in clinical decision making training for internal medicine interns. J Grad Med Educ. 2012;4:490–495.
- , , , et al. How we implemented a resident‐led medical simulation curriculum in a large internal medicine residency program. Med Teach. 2014;36(4):279–283.
- , , , . There's no such thing as “nonjudgmental” debriefing: a theory and method for debriefing with good judgment. Simul Healthc. 2006;1:49–55.
- , , , . Improving faculty feedback to resident trainees during a simulated case: a randomized, controlled trial of an educational intervention. Anesthesiology. 2014;120(1):160–171.
- . Introduction to debriefing. Semin Perinatol. 2013:37(3)166–174.
- , . Response‐shift bias: a source of contamination of self‐report measures. J Appl Psychol. 1979;4:93–106.
- Center for Medical Simulation. Debriefing assessment for simulation in healthcare. Available at: http://www.harvardmedsim.org/debriefing‐assesment‐simulation‐healthcare.php. Accessed June 18, 2014.
- , , , et al. A novel iterative‐learner simulation model: fellows as teachers. J Grad Med Educ. 2014;6(1):127–132.
- , , . Direct observation of faculty with feedback: an effective means of improving patient‐centered and learner‐centered teaching skills. Teach Learn Med. 2007;19(3):278–286.
- , . Unskilled and unaware of it: how difficulties in recognizing one's own incompetence lead to inflated self assessments. J Pers Soc Psychol. 1999;77:1121–1134.
- , , , et al. Reliability and validity of an objective structured teaching examination for generalist resident teachers. Acad Med. 2002;77(10 suppl):S29–S32.
Residency training, in addition to developing clinical competence among trainees, is charged with improving resident teaching skills. The Liaison Committee on Medical Education and the Accreditation Council for Graduate Medical Education require that residents be provided with training or resources to develop their teaching skills.[1, 2] A variety of resident‐as‐teacher (RaT) programs have been described; however, the optimal format of such programs remains in question.[3] High‐fidelity medical simulation using mannequins has been shown to be an effective teaching tool in various medical specialties[4, 5, 6, 7] and may prove to be useful in teacher training.[8] Teaching in a simulation‐based environment can give participants the opportunity to apply their teaching skills in a clinical environment, as they would on the wards, but in a more controlled, predictable setting and without compromising patient safety. In addition, simulation offers the opportunity to engage in deliberate practice by allowing teachers to facilitate the same case on multiple occasions with different learners. Deliberate practice, which involves task repetition with feedback aimed at improving performance, has been shown to be important in developing expertise.[9]
We previously described the first use of a high‐fidelity simulation curriculum for internal medicine (IM) interns focused on clinical decision‐making skills, in which second‐ and third‐year residents served as facilitators.[10, 11] Herein, we describe a RaT program in which residents participated in a workshop, then served as facilitators in the intern curriculum and received feedback from faculty. We hypothesized that such a program would improve residents' teaching and feedback skills, both in the simulation environment and on the wards.
METHODS
We conducted a single‐group study evaluating teaching and feedback skills among upper‐level resident facilitators before and after participation in the RaT program. We measured residents' teaching skills using pre‐ and post‐program self‐assessments as well as evaluations completed by the intern learners after each session and at the completion of the curriculum.
Setting and Participants
We embedded the RaT program within a simulation curriculum administered July to October of 2013 for all IM interns at Massachusetts General Hospital (interns in the preliminary program who planned to pursue another field after the completion of the intern year were excluded) (n = 52). We invited postgraduate year (PGY) II and III residents (n = 102) to participate in the IM simulation program as facilitators via email. The curriculum consisted of 8 cases focusing on acute clinical scenarios encountered on the general medicine wards. The cases were administered during 1‐hour sessions 4 mornings per week from 7 AM to 8 AM prior to clinical duties. Interns completed the curriculum over 4 sessions during their outpatient rotation. The case topics were (1) hypertensive emergency, (2) post‐procedure bleed, (3) congestive heart failure, (4) atrial fibrillation with rapid ventricular response, (5) altered mental status/alcohol withdrawal, (6) nonsustained ventricular tachycardia heralding acute coronary syndrome, (7) cardiac tamponade, and (8) anaphylaxis. During each session, groups of 2 to 3 interns worked through 2 cases using a high‐fidelity mannequin (Laerdal 3G, Wappingers Falls, NY) with 2 resident facilitators. One facilitator operated the mannequin, while the other served as a nurse. Each case was followed by a structured debriefing led by 1 of the resident facilitators (facilitators switched roles for the second case). The number of sessions facilitated varied for each resident based on individual schedules and preferences.
Four senior residents who were appointed as simulation leaders (G.A.A., J.K.H., R.K., Z.S.) and 2 faculty advisors (P.F.C., E.M.M.) administered the program. Simulation resident leaders scheduled facilitators and interns and participated in a portion of simulation sessions as facilitators, but they were not analyzed as participants for the purposes of this study. The curriculum was administered without interfering with clinical duties, and no additional time was protected for interns or residents participating in the curriculum.
Resident‐as‐Teacher Program Structure
We invited participating resident facilitators to attend a 1‐hour interactive workshop prior to serving as facilitators. The workshop focused on building learner‐centered and small‐group teaching skills, as well as introducing residents to a 5‐stage debriefing framework developed by the authors and based on simulation debriefing best practices (Table 1).[12, 13, 14]
| Stage of Debriefing | Action | Rationale |
|---|---|---|
| ||
| Emotional response | Elicit learners' emotions about the case | It is important to acknowledge and address both positive and negative emotions that arise during the case before debriefing the specific medical and communications aspects of the case. Unaddressed emotional responses may hinder subsequent debriefing. |
| Objectives* | Elicit learners' objectives and combine them with the stated learning objectives of the case to determine debriefing objectives | The limited amount of time allocated for debriefing (1520 minutes) does not allow the facilitator to cover all aspects of medical management and communication skills in a particular case. Focusing on the most salient objectives, including those identified by the learners, allows the facilitator to engage in learner‐centered debriefing. |
| Analysis | Analyze the learners' approach to the case | Analyzing the learners' approach to the case using the advocacy‐inquiry method[11] seeks to uncover the learner's assumptions/frameworks behind the decision made during the case. This approach allows the facilitator to understand the learners' thought process and target teaching points to more precisely address the learners' needs. |
| Teaching | Address knowledge gaps and incorrect assumptions | Learner‐centered debriefing within a limited timeframe requires teaching to be brief and targeted toward the defined objectives. It should also address the knowledge gaps and incorrect assumptions uncovered during the analysis phase. |
| Summary | Summarize key takeaways | Summarizing highlights the key points of the debriefing and can be used to suggest further exploration of topics through self‐study (if necessary). |
Resident facilitators were observed by simulation faculty and simulation resident leaders throughout the intern curriculum and given structured feedback either in‐person immediately after completion of the simulation session or via a detailed same‐day e‐mail if the time allotted for feedback was not sufficient. Feedback was structured by the 5 stages of debriefing described in Table 1, and included soliciting residents' observations on the teaching experience and specific behaviors observed by faculty during the scenarios. E‐mail feedback (also structured by stages of debriefing and including observed behaviors) was typically followed by verbal feedback during the next simulation session.
The RaT program was composed of 3 elements: the workshop, case facilitation, and direct observation with feedback. Because we felt that the opportunity for directly observed teaching and feedback in a ward‐like controlled environment was a unique advantage offered by the simulation setting, we included all residents who served as facilitators in the analysis, regardless of whether or not they had attended the workshop.
Evaluation Instruments
Survey instruments were developed by the investigators, reviewed by several experts in simulation, pilot tested among residents not participating in the simulation program, and revised by the investigators.
Pre‐program Facilitator Survey
Prior to the RaT workshop, resident facilitators completed a baseline survey evaluating their preparedness to teach and give feedback on the wards and in a simulation‐based setting on a 5‐point scale (see Supporting Information, Appendix I, in the online version of this article).
Post‐program Facilitator Survey
Approximately 3 weeks after completion of the intern simulation curriculum, resident facilitators were asked to complete an online post‐program survey, which remained open for 1 month (residents completed this survey anywhere from 3 weeks to 4 months after their participation in the RaT program depending on the timing of their facilitation). The survey asked residents to evaluate their comfort with their current post‐program teaching skills as well as their pre‐program skills in retrospect, as previous research demonstrated that learners may overestimate their skills prior to training programs.[15] Resident facilitators could complete the surveys nonanonymously to allow for matched‐pairs analysis of the change in teaching skills over the course of the program (see Supporting Information, Appendix II, in the online version of this article).
Intern Evaluation of Facilitator Debriefing Skills
After each case, intern learners were asked to anonymously evaluate the teaching effectiveness of the lead resident facilitator using the adapted Debriefing Assessment for Simulation in Healthcare (DASH) instrument.[16] The DASH instrument evaluated the following domains: (1) instructor maintained an engaging context for learning, (2) instructor structured the debriefing in an organized way, (3) instructor provoked in‐depth discussions that led me to reflect on my performance, (4) instructor identified what I did well or poorly and why, (5) instructor helped me see how to improve or how to sustain good performance, (6) overall effectiveness of the simulation session (see Supporting Information, Appendix III, in the online version of this article).
Post‐program Intern Survey
Two months following the completion of the simulation curriculum, intern learners received an anonymous online post‐program evaluation assessing program efficacy and resident facilitator teaching (see Supporting Information, Appendix IV, in the online version of this article).
Statistical Analysis
Teaching skills and learners' DASH ratings were compared using the Student t test, Pearson 2 test, and Fisher exact test as appropriate. Pre‐ and post‐program rating of teaching skills was undertaken in aggregate and as a matched‐pairs analysis.
The study was approved by the Partners Institutional Review Board.
RESULTS
Forty‐one resident facilitators participated in 118 individual simulation sessions encompassing 236 case scenarios. Thirty‐four residents completed the post‐program facilitator survey and were included in the analysis. Of these, 26 (76%) participated in the workshop and completed the pre‐program survey. Twenty‐three of the 34 residents (68%) completed the post‐program evaluation nonanonymously (13 PGY‐II, 10 PGY‐III). Of these, 16 completed the pre‐program survey nonanonymously. The average number of sessions facilitated by each resident was 3.9 (range, 112).
Pre‐ and Post‐program Self‐Assessment of Residents' Teaching Skills
Participation in the simulation RaT program led to improvements in resident facilitators' self‐reported teaching skills across multiple domains (Table 2). These results were consistent when using the retrospective pre‐program assessment in matched‐pairs analysis (n=34) and when performing the analysis using the true pre‐program preparedness compared to post‐program comfort with teaching skills in a non‐matched‐pairs fashion (n = 26) and matched‐pairs fashion (n = 16). We report P values for the more conservative estimates using the retrospective pre‐program assessment matched‐pairs analysis. The most significant improvements occurred in residents' ability to teach in a simulated environment (2.81 to 4.16, P < 0.001 [5‐point scale]) and give feedback (3.35 to 3.77, P < 0.001).
| Pre‐program Rating (n = 34) | Post‐program Rating (n = 34) | P Value | |
|---|---|---|---|
| |||
| Teaching on rounds | 3.75 | 4.03 | 0.005 |
| Teaching on wards outside rounds | 3.83 | 4.07 | 0.007 |
| Teaching in simulation | 2.81 | 4.16 | <0.001 |
| Giving feedback | 3.35 | 3.77 | <0.001 |
Resident facilitators reported that participation in the RaT program had a significant impact on their teaching skills both within and outside of the simulation environment (Table 3). However, the greatest gains were seen in the domain of teaching in simulation. It was also noted that participation in the program improved resident facilitators' medical knowledge.
| Category | Not at All | Slightly Improved | Moderately Improved | Greatly Improved | Not Sure |
|---|---|---|---|---|---|
| Teaching on rounds, n = 34 | 4 (12%) | 12 (35%) | 13 (38%) | 4 (12%) | 1 (3%) |
| Teaching on wards outside rounds, n = 34 | 3 (9%) | 13 (38%) | 12 (35%) | 5 (15%) | 1 (3%) |
| Teaching in simulation, n = 34 | 0 (0%) | 4 (12%) | 7 (21%) | 23 (68%) | 0 (0%) |
| Giving feedback, n = 34 | 4 (12%) | 10 (29%) | 12 (35%) | 6 (18%) | 2 (6%) |
| Medical knowledge, n = 34 | 2 (6%) | 11 (32%) | 18 (53%) | 3 (9%) | 0 (0%) |
Subgroup analyses were performed comparing the perceived improvement in teaching and feedback skills among those who did or did not attend the facilitator workshop, those who facilitated 5 or more versus less than 5 sessions, and those who received or did not receive direct observation and feedback from faculty. Although numerically greater gains were seen across all 4 domains among those who attended the workshop, facilitated 5 or more sessions, or received feedback from faculty, only teaching on rounds and on the wards outside rounds reached statistical significance (Table 4). It should be noted that all residents who facilitated 5 or more sessions also attended the workshop and received feedback from faculty. We also compared perceived improvement among PGY‐II and PGY‐III residents. In contrast to PGY‐II residents, who demonstrated an improvement in all 4 domains, PGY‐III residents only demonstrated improvement in simulation‐based teaching.
| Pre‐program | Post‐program | P Value | Pre‐program | Post‐program | P Value | |
|---|---|---|---|---|---|---|
| Facilitated Less Than 5 Sessions (n = 18) | Facilitated 5 or More Sessions (n = 11) | |||||
| Did Not Attend Workshop (n = 10) | Attended Workshop (n = 22) | |||||
| Received Feedback From Resident Leaders Only (n = 11) | Received Faculty Feedback (n = 21) | |||||
| PGY‐II (n = 13) | PGY‐III (n = 9) | |||||
| ||||||
| Teaching on rounds | 3.68 | 3.79 | 0.16 | 3.85 | 4.38 | 0.01 |
| Teaching on wards outside rounds | 3.82 | 4 | 0.08 | 3.85 | 4.15 | 0.04 |
| Teaching in simulation | 2.89 | 4.06 | <0.01 | 2.69 | 4.31 | <0.01 |
| Giving feedback | 3.33 | 3.67 | 0.01 | 3.38 | 3.92 | 0.01 |
| Teaching on rounds | 4 | 4.1 | 0.34 | 3.64 | 4 | <0.01 |
| Teaching on wards outside rounds | 4 | 4 | 1.00 | 3.76 | 4.1 | <0.01 |
| Teaching in simulation | 2.89 | 4.11 | <0.01 | 2.77 | 4.18 | <0.01 |
| Giving feedback | 3.56 | 3.78 | 0.17 | 3.27 | 3.77 | <0.01 |
| Teaching on rounds | 3.55 | 3.82 | 0.19 | 3.86 | 4.14 | 0.01 |
| Teaching on wards outside rounds | 4 | 4 | 1.00 | 3.75 | 4.1 | <0.01 |
| Teaching in simulation | 2.7 | 3.8 | <0.01 | 2.86 | 4.33 | <0.01 |
| Giving feedback | 3.2 | 3.6 | 0.04 | 3.43 | 3.86 | <0.01 |
| Teaching on rounds | 3.38 | 3.85 | 0.03 | 4.22 | 4.22 | 1 |
| Teaching on wards outside rounds | 3.54 | 3.85 | 0.04 | 4.14 | 4.14 | 1 |
| Teaching in simulation | 2.46 | 4.15 | <0.01 | 3.13 | 4.13 | <0.01 |
| Giving feedback | 3.23 | 3.62 | 0.02 | 3.5 | 3.88 | 0.08 |
Intern Learners' Assessment of Resident Facilitators and the Program Overall
During the course of the program, intern learners completed 166 DASH ratings evaluating 34 resident facilitators (see Supporting Information, Appendix V, in the online version of this article). Ratings for the 6 DASH items ranged from 6.49 to 6.73 (7‐point scale), demonstrating a high level of facilitator efficacy across multiple domains. No differences in DASH scores were noted among subgroups of resident facilitators described in the previous paragraph.
Thirty‐eight of 52 intern learners (73%) completed the post‐program survey.
| Facilitator Behaviors | Very Often, >75% | Often, >50% | Sometimes, 25%50% | Rarely, <25% | Never |
|---|---|---|---|---|---|
| Elicited emotional reactions, n = 38 | 18 (47%) | 16 (42%) | 4 (11%) | 0 (0%) | 0 (0%) |
| Elicited objectives from learner, n = 37 | 26 (69%) | 8 (22%) | 2 (6%) | 1 (3%) | 0 (0%) |
| Asked to share clinical reasoning, n = 38 | 21 (56%) | 13 (33%) | 4 (11%) | 0 (0%) | 0 (0%) |
| Summarized learning points, n = 38 | 31 (81%) | 7 (19%) | 0 (0%) | 0 (0%) | 0 (0%) |
| Spoke for less than half of the session, n = 38 | 8 (22%) | 17 (44%) | 11 (28%) | 2 (6%) | 0 (0%) |
All intern learners rated the overall simulation experience as either excellent (81%) or good (19%) on the post‐program evaluation (4 or 5 on a 5‐point Likert scale, respectively). All interns strongly agreed (72%) or agreed (28%) that the simulation sessions improved their ability to manage acute clinical scenarios. Interns reported that resident facilitators frequently utilized specific debriefing techniques covered in the RaT curriculum during the debriefing sessions (Table 5).
DISCUSSION
We describe a unique RaT program embedded within a high‐fidelity medical simulation curriculum for IM interns. Our study demonstrates that resident facilitators noted an improvement in their teaching and feedback skills, both in the simulation setting and on the wards. Intern learners rated residents' teaching skills and the overall simulation curriculum highly, suggesting that residents were effective teachers.
The use of simulation in trainee‐as‐teacher curricula holds promise because it can provide an opportunity to teach in an environment closely approximating the wards, where trainees have the most opportunities to teach. However, in contrast to true ward‐based teaching, simulation can provide predictable scenarios in a controlled environment, which eliminates the distractions and unpredictability that exist on the wards, without compromising patient safety. Recently, Tofil et al. described the first use of simulation in a trainee‐as‐teacher program.[17] The investigators utilized a 1‐time simulation‐based teaching session, during which pediatric fellows completed a teacher‐training workshop, developed and served as facilitators in a simulated case, and received feedback. The use of simulation allowed fellows an opportunity to apply newly acquired skills in a controlled environment and receive feedback, which has been shown to improve teaching skills.[18]
The experience from our program expands on that of Tofil et al., as well as previously described trainee‐as‐teacher curricula, by introducing a component of deliberate practice that is unique to the simulation setting and has been absent from most previously described RaT programs.[3] Most residents had the opportunity to facilitate the same case on multiple occasions, allowing them to receive feedback and make adjustments. Residents who facilitated 5 or more sessions demonstrated more improvement, particularly in teaching outside of simulation, than residents who facilitated fewer sessions. It is notable that PGY‐II resident facilitators reported an improvement in their teaching skills on the wards, though less pronounced as compared to teaching in the simulation‐based environment, suggesting that benefits of the program may extend to nonsimulation‐based settings. Additional studies focusing on objective evaluation of ward‐based teaching are needed to further explore this phenomenon. Finally, the self‐reported improvements in medical knowledge by resident facilitators may serve as another benefit of our program.
Analysis of learner‐level data collected in the postcurriculum intern survey and DASH ratings provides additional support for the effectiveness of the RaT program. The majority of intern learners reported that resident facilitators used the techniques covered in our program frequently during debriefings. In addition, DASH scores clustered around maximum efficacy for all facilitators, suggesting that residents were effective teachers. Although we cannot directly assess whether the differences demonstrated in resident facilitators' self‐assessments translated to their teaching or were significant from the learners' perspective, these results support the hypothesis that self‐assessed improvements in teaching and feedback skills were significant.
In addition to improving resident teaching skills, our program had a positive impact on intern learners as evidenced by intern evaluations of the simulation curriculum. While utilizing relatively few faculty resources, our program was able to deliver an extensive and well‐received simulation curriculum to over 50 interns. The fact that 40% of second‐ and third‐year residents volunteered to teach in the program despite the early morning timing of the sessions speaks to the interest that trainees have in teaching in this setting. This model can serve as an important and efficient learning platform in residency training programs. It may be particularly salient to IM training programs where implementation of simulation curricula is challenging due to large numbers of residents and limited faculty resources. The barriers to and lessons learned from our experience with implementing the simulation curriculum have been previously described.[10, 11]
Our study has several limitations. Changes in residents' teaching skills were self‐assessed, which may be inaccurate as learners may overestimate their abilities.[19] Although we collected data on the experiences of intern learners that supported residents' self‐assessment, further studies using more objective measures (such as the Objective Structured Teaching Exercise[20]) should be undertaken. We did not objectively assess improvement of residents' teaching skills on the wards, with the exception of the residents' self assessment. Due to the timing of survey administration, some residents had as little as 1 month between completion of the curriculum and responding to the post‐curriculum survey, limiting their ability to evaluate their teaching skills on the wards. The transferability of the skills gained in simulation‐based teaching to teaching on the wards deserves further study. We cannot definitively attribute perceived improvement of teaching skills to the RaT program without a control group. However, the frequent use of recommended techniques during debriefing, which are not typically taught in other settings, supports the efficacy of the RaT program.
Our study did not allow us to determine which of the 3 components of the RaT program (workshop, facilitation practice, or direct observation and feedback) had the greatest impact on teaching skills or DASH ratings, as those who facilitated more sessions also completed the other components of the program. Furthermore, there may have been a selection bias among facilitators who facilitated more sessions. Because only 16 of 34 participants completed both the pre‐program and post‐program self‐assessments in a non‐anonymous fashion, we were not able to analyze the effect of pre‐program factors, such as prior teaching experience, on program outcomes. It should also be noted that allowing resident facilitators the option to complete the survey non‐anonymously could have biased our results. The simulation curriculum was conducted in a single center, and resident facilitators were self‐selecting; therefore, our results may not be generalizable. Finally, the DASH instrument was only administered after the RaT workshop and was likely limited further by the ceiling effect created by the learners' high satisfaction with the simulation program overall.
In summary, our simulation‐based RaT program improved resident facilitators' self‐reported teaching and feedback skills. Simulation‐based training provided an opportunity for deliberate practice of teaching skills in a controlled environment, which was a unique component of the program. The impact of deliberate practice on resident teaching skills and optimal methods to incorporate deliberate practice in RaT programs deserves further study. Our curriculum design may serve as a model for the development of simulation programs that can be employed to improve both intern learning and resident teaching skills.
Acknowledgements
The authors acknowledge Deborah Navedo, PhD, Assistant Professor, Massachusetts General Hospital Institute of Health Professions, and Emily M. Hayden, MD, Assistant Professor, Department of Emergency Medicine, Massachusetts General Hospital and Harvard Medical School, for their assistance with development of the RaT curriculum. The authors thank Dr. Jenny Rudolph, Senior Director, Institute for Medical Simulation at the Center for Medical Simulation, for her help in teaching us to use the DASH instrument. The authors also thank Dr. Daniel Hunt, MD, Associate Professor, Department of Medicine, Massachusetts General Hospital and Harvard Medical School, for his thoughtful review of this manuscript.
Disclosure: Nothing to report.
- Liaison Committee on Medical Education. Functions and structure of a medical school: standards for accreditation of medical education programs leading to the M.D. degree. Washington, DC, and Chicago, IL: Association of American Medical Colleges and American Medical Association; 2000.
- Accreditation Council for Graduate Medical Education. ACGME program requirements for graduate medical education in pediatrics. Available at: http://www.acgme.org/acgmeweb/Portals/0/PFAssets/2013-PR-FAQ-PIF/320_pediatrics_07012013.pdf. Accessed June 18, 2014.
- , , , . A systematic review of resident‐as‐teacher programmes. Med Educ. 2009;43(12):1129–1140.
- , , , et al. The utility of simulation in medical education: what is the evidence? Mt Sinai J Med. 2009;76:330–343.
- , , , et al. National growth in simulation training within emergency medicine residency programs, 2003–2008. Acad Emerg Med. 2008;15:1113–1116.
- , , , et al. Simulation center accreditation and programmatic benchmarks: a review for emergency medicine. Acad Emerg Med. 2010;17(10):1093–1103.
- . How much evidence does it take? A cumulative meta‐analysis of outcomes of simulation‐based education. Med Educ. 2014;48(8):750–760.
- , , , et al.. Resident‐as‐teacher: a suggested curriculum for emergency medicine. Acad Emerg Med. 2006;13(6):677–679.
- . Deliberate practice and the acquisition and maintenance of expert performance in medicine and related domains. Acad Med. 2004;79(10 suppl):S70–S81.
- , , , , , . Pilot program utilizing medical simulation in clinical decision making training for internal medicine interns. J Grad Med Educ. 2012;4:490–495.
- , , , et al. How we implemented a resident‐led medical simulation curriculum in a large internal medicine residency program. Med Teach. 2014;36(4):279–283.
- , , , . There's no such thing as “nonjudgmental” debriefing: a theory and method for debriefing with good judgment. Simul Healthc. 2006;1:49–55.
- , , , . Improving faculty feedback to resident trainees during a simulated case: a randomized, controlled trial of an educational intervention. Anesthesiology. 2014;120(1):160–171.
- . Introduction to debriefing. Semin Perinatol. 2013:37(3)166–174.
- , . Response‐shift bias: a source of contamination of self‐report measures. J Appl Psychol. 1979;4:93–106.
- Center for Medical Simulation. Debriefing assessment for simulation in healthcare. Available at: http://www.harvardmedsim.org/debriefing‐assesment‐simulation‐healthcare.php. Accessed June 18, 2014.
- , , , et al. A novel iterative‐learner simulation model: fellows as teachers. J Grad Med Educ. 2014;6(1):127–132.
- , , . Direct observation of faculty with feedback: an effective means of improving patient‐centered and learner‐centered teaching skills. Teach Learn Med. 2007;19(3):278–286.
- , . Unskilled and unaware of it: how difficulties in recognizing one's own incompetence lead to inflated self assessments. J Pers Soc Psychol. 1999;77:1121–1134.
- , , , et al. Reliability and validity of an objective structured teaching examination for generalist resident teachers. Acad Med. 2002;77(10 suppl):S29–S32.
© 2015 Society of Hospital Medicine
Pharmacist Pain E-Consults That Result in a Therapy Change
The enormity of chronic pain among the veteran population makes pain management within the VA a critical issue. Of the veterans returning from Operation Enduring Freedom/Operation Iraqi Freedom (OEF/OIF), chronic pain is the most common report.1 Of equal concern is the lack of available pain specialists in the U.S. There are < 4,000 pain specialists in the U.S., and even fewer pain specialists are available within the VA system, making it difficult for veterans to access pain care and timely treatment.2
Furthermore, one of the biggest challenges surrounding pain management is the lack of proper training received by generalists and primary care providers (PCPs). Whereas opioid therapy was previously prescribed mainly by specialists and mainly to cancer patients, that is no longer the case. Today, nonspecialists frequently prescribe opioids, and 95% of long-acting opioids are for chronic, noncancer pain.1 In a majority of reviewed pain electronic consultations (e-consults) completed by the pain specialty pharmacist at the Bay Pines VA Healthcare System (BPVAHCS), the patient was not currently receiving opioid therapy, suggesting PCPs’ lack of comfort and training in chronic pain management. Effective and appropriate pain management from the patient perspective and confidence and reassurance from the prescriber standpoint cannot be successfully achieved without drastic improvements in education and training.
Related: Urologist Workforce Variation Across the VHA
The inception of the E-Consult Pain Service arose from a grant from VA National Innovations in Consult Management to 3 VA facilities in Florida: BPVAHCS; Orlando VAMC, and North Florida/South Georgia Veterans Health Systems.3 At the Orlando VAMC, PCPs needed advice on pain management for patients while they waited to see a pain clinic specialist, so a Pain Help Line was implemented to provide immediate consults, but miscommunication between recommendations given and their implementation limited its utility. That eventually led to an E-Consult Pain Service, which provided formal full chart reviews for pain management cases.
The E-Consult Pain Service program included 2 full-time pharmacists, a part-time pain psychologist, and a pain physician. Its goal was to assist PCPs with patient-specific pain management recommendations. The consult service did not replace specialty pain clinics, nor was it meant to provide continual pain management. Additional, separate pain e-consults could be scheduled as a follow-up to a previous consult or for new pain management issues. Although the recommendations in the consults were available for the provider’s use, it was at the provider’s discretion as to whether the recommendations were accepted and implemented.
The E-Consult Pain Service
The E-Consult Pain Service at the BPVAHCS started July 2011. Staffed by a full-time physician and pain specialty pharmacist, the program provides electronic chart review and recommendations to PCPs regarding complex pain management issues. About three-fourths of their time was spent directly on the consults, which took between 1 and 5 business days to complete. Their remaining time was spent on educational initiatives and administrative duties.
The BPVAHCS is a complexity level 1a facility providing comprehensive health care. The facility comprises a 192-acute care bed hospital (includes intensive care, medical, surgical, and psychiatric units); a 112-bed community living center; a 65-bed domiciliary; and a 34-bed residential treatment program.
Related: A Medical Specialty e-Consult Program in a VA Health Care System
Initially, the program was developed to provide pain management support to PCPs in the community-based outpatient clinics (CBOCs) but expanded to all BPVAHCS providers. With the expansion, the program helped reduce a 3-month delay for patients waiting to be seen in the pain clinic. Goals of the program included improving patient outcomes and safety while minimizing opioid therapy risks. These goals are met through an individual case consultation as well as formal educational programs for providers.
The purpose of this study was to obtain data evaluating the characteristics of recommendations made by a pharmacist through pain e-consults at the BPVAHCS and the percentage of consults that resulted in a change in therapy. Future research is warranted to provide clarity on why specific recommendations are or are not being accepted, patient outcomes, and PCPs’ perception on the program’s utility.
Methods
An institutional review board-exempt, retrospective chart review was conducted at the BPVAHCS to determine the percentage of patients whose pain regimen changed as a result of a pain e-consult completed by a pain specialty pharmacist. Although the BPVAHCS E-Consult Pain Service comprised a physician and a pain specialty pharmacist, this study was focused solely on the role and recommendations by the pharmacist. The characteristics of those recommendations and their acceptance/rejection rate were then recorded. Of note, the physician completed separate e-consults, and the frequency of input by the physician on pharmacist recommendations was not collected.
Patients who had a pain e-consult regarding chronic, noncancer pain between January 1, 2012, and March 31, 2012, were identified for inclusion in the study. Charts were selected based on consults submitted by providers. No consults for headaches were requested in the selected time frame.
Chronic pain is defined as persistent pain with or without an identifiable organic cause, lasting longer than 3 to 6 months.1 Use of the term chronic pain throughout this article refers to chronic, noncancer pain. Criteria for exclusion included patients who received a pain e-consult but died before September 30, 2012.
Data Collection
Patients identified for inclusion had their charts reviewed 6 months after completion of the consult in order to allow sufficient time for potential implementation of recommendations. Patient demographics, name and dose of pain medications, requesting practitioner, type of chronic pain, recommendation of pain e-consult, and consult outcome(s) were recorded for all participants.
The primary outcome of the study was the percentage of recommendations, both pharmacologic and nonpharmacologic, made by the pain specialty pharmacist and accepted and implemented by the consulting provider.
Results
A total of 127 patient charts were identified for inclusion. Five patients died prior to September 30, 2012, and were excluded from the study, leaving 122 charts for review. All 122 charts reviewed by the pain specialty pharmacist included recommendations. Most patients were male (95.1%) and white (75.6%). The most common source of chronic pain was back pain (66.4%) (Table).
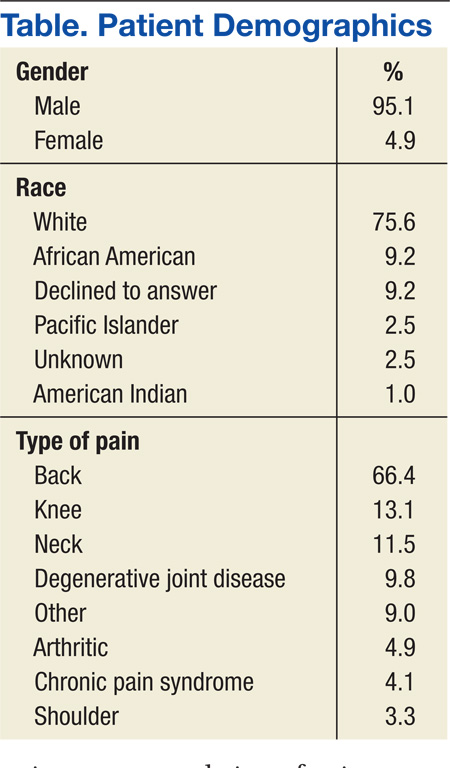
Primary Outcome
The pain specialty pharmacist pharmacologic treatment option recommendations varied significantly: add and/or change topical (80% of the 122 patients); add and/or change selective norepinephrine reuptake inhibitor (SNRI) (79%); add and/or change antiepileptic drug (AED) therapy (75%); discontinue opioid (52%); reduce opioid (48%); add and/or change nonsteroidal anti- inflammatory drug (NSAID) (45%); and taper/discontinue benzodiazepine (BZD) (13%) (Figure 1).
Primary care providers could choose to accept or ignore the recommendation, and of all the pharmacologic recommendations made, about 50% were implemented. The rate of PCP implementation of the pharmacist’s recommendations varied: add and/or change AED therapy (54%); add and/or change topical (44%); reduce opioid (42%); discontinue opioid (41%); taper/discontinue BZD (38%); add and/or change SNRI (36%); and add and/or change NSAID (33%).
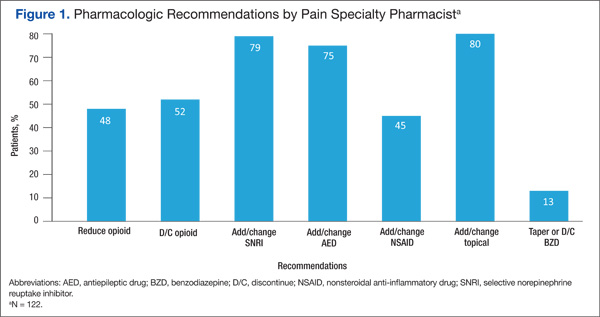
Despite the most frequent recommendations made by pharmacists, the 3 most accepted and implemented by providers were addition and/or change in AED therapy, addition and/or change in topical therapy, and a decrease in opioid dose. Changes in therapy were identified as either a dose decrease or increase in the existing agent, whereas a new agent was considered an addition to existing pain therapy.
The rates of nonpharmacologic recommendations made by the pharmacist were as follows: ordering additional labs, primarily vitamin D and testosterone levels (55%); referral to physical therapy (PT) (54%); weight loss (51%); smoking cessation (43%); specialty referral (42%); order new urine drug screen (UDS) (35%); referral to pain school education program (26%); transcutaneous electrical nerve stimulation (TENS) (25%); referral to the substance abuse treatment program (SATP) (15%); and update opioid agreement (OA) (9%) (Figure 2).
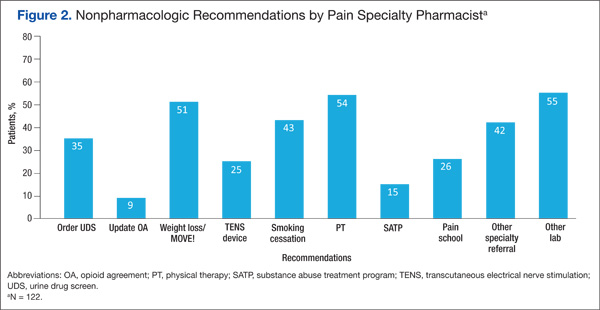
Nonpharmacologic treatment acceptance rates were as follows: order new UDS (67%); update OA (45%); referral to SATP (33%); referral to PT (33%); order additional labs, primarily vitamin D and testosterone levels (27%); specialty referral (22%); TENS (19%); weight loss (18%); referral to pain school education program (16%); smoking cessation (6%); and music therapy (0%). The top 3 accepted recommendations were obtainment of a new UDS; updating the patient’s OA; and tied for third, referral to PT or the SATP.
Discussion
Including a pharmacist as part of a pain e-consult team may provide support to PCPs for managing chronic pain as well as for measuring improved adherence to VA/DoD guidelines for chronic pain. Pharmacists can offer recommendations for nontraditional pain therapies that PCPs may be unaware of or are unfamiliar with, such as the use of nonnarcotic agents and various nonpharmacologic options. For example, recommend testing for vitamin D levels. Vitamin D deficiency is common among the general population, and a project completed by Roesel and Engel specifically addressed vitamin D deficiency and pain in OEF/OIF veterans.4 Other studies have shown a correlation between vitamin D supplementation and a reduction in musculoskeletal pain or the association between low vitamin D levels and hypersensitivity in patients with chronic pain.5-7 Studies have also demonstrated a link between vitamin D deficiency and depression, which is well known to augment or increase patient awareness of somatic reports, like pain.8
Of all the pharmacologic recommendations made, about 50% were implemented. It is noteworthy to mention that although a change/ addition in SNRI therapy was recommended by the pharmacist 79% of the time, it was accepted and implemented by the PCP only one-third of the time. Many veterans have co-occurring mental health conditions, which are often managed by a psychiatrist, who is typically not the consulting provider (the PCP is). The PCP may be hesitant to change antidepressant therapy for fear of destabilizing the patient or because the PCP was not the antidepressant therapy prescriber. However, the incidence of co-occurring seizure disorders among veterans is much less than that of mental health disorders, making PCPs much more likely to accept and/or change AEDs. Interestingly, the majority of pain specialty pharmacist e-consults involved chronic pain management, further demonstrating the lack of comfort, time, and/or proper training for PCPs in general pain management.
Related: The Rapid Rise of e-Consults Across Specialty Care
Although the e-consult program at the BPVAHCS consisted solely of a physician and a pain specialty pharmacist, the purpose of this project was to evaluate the characteristics of recommendations made by a pharmacist and the percentage of consults that resulted in a therapy change. The physician was responsible for separate consults, and their recommendations were not collected. However, it is important to recognize that the pain specialty pharmacist and physician performed identical roles on the team, each recommending both pharmacologic and nonpharmacologic treatment options in every consult.
Related Programs
The VA Boston Healthcare System (VABHS) is composed of 3 main facilities and 5 CBOCs across eastern Massachusetts. Although veterans in the eastern part of the state are able to receive primary care at a CBOC, specialty care is provided primarily at 2 of the main locations in the Boston area. Therefore, the VABHS began an e-consult program in order to facilitate patient access to specialty providers for patients unable to participate in a face-to-face visit.
The purpose of the VABHS study was to examine the implementation and provider perception of an e-consult program within a large VA system, to provide timely patient access to specialty care. The pilot program was initiated in 2 specialty clinics in 2011 but expanded to 12 specialty clinics within 9 months. The specialty clinics included allergy, cardiology, endocrinology, gastroenterology, hematology, infectious disease, nephrology, oncology, palliative care, pulmonary disease, rheumatology, and sleep medicine. Outcomes of the VABHS e-consult program revealed that a majority of PCPs were satisfied with the use of e-consults, whereas specialists were less satisfied. The PCP-perceived benefits to patients included avoidance of unnecessary travel, faster clinical input, and avoidance of unnecessary copays.9
Like the VABHS, the use of pain e-consults at BPVAHCS helps reduce the burden of face-to-face clinic visits and eliminate accessibility barriers for veterans. This study differs from the VABHS in that PCPs requested onetime consults focused solely on pain management. The pain specialty pharmacist at BPVAHCS did not provide longitudinal care; measure patient outcomes, such as satisfaction, reduction in pain, or improved functionally; or examine provider satisfaction. Additionally, unlike the BPVAHCS program, there was no indication whether a pharmacist played a role in the program.9
Other studies have explored the role of a pain pharmacist in the inpatient setting offering consults on patient-controlled analgesia and in patients with a history of substance abuse.10,11 Another recent study similarly looked at the effectiveness of a pharmacist-led medication review in chronic pain management. The aim was to assess patient outcomes: decrease in pain intensity and improvement in physical functioning.12 Another study involving a nurse and pharmacist-led chronic pain clinic in a primary care setting conducted in England showed improvement in patient-reported pain and reduction in secondary referrals.13
Limitations
Limitations of the study included short study duration (6 months); use of a newly implemented E-Consult Pain Service; lack of pharmacist follow-up on acceptance/rejection of their recommendation; inability to determine patient outcome(s), as consults were for a single point in time, regarding a therapy recommendation; lack of access to non-VA medications; and patient refusal to change current pain regimen.
Patient refusal inhibited providers from implementing therapy changes recommended by the pharmacist and therefore could have negatively impacted study outcomes. Raw data were used for this study, and there were no statistical analyses conducted. Furthermore, lack of other formal e-consult programs within BPVAHCS to compare the acceptance/rejection of pharmacist recommendations for other conditions and lack of a third-party review of pharmacist recommendations to ensure standard of care may have limited this study.
Future Research
As the E-Consult Pain Service continues, research regarding the value of the pain specialty pharmacist may be warranted. Additional research is needed to identify the reasons that recommendations were accepted or ignored, whether the recommendations were beneficial to the patients, and the PCPs’ perception on the usefulness of a pain e-consult program. When the program started, 14% of patients at BPVAHCS were taking opioids. The pain e-consult program handled a small percentage of these patients.
The authors considered proactively reviewing all patients on > 100 mg morphine equivalents of opioids daily but did not have adequate staff to support the review. It may be helpful to identify those patients taking opioids but do not have a consult. The role of the pain e-consult pharmacist may be expanded to assist PCPs, including leading patient education classes to explain the concept and purpose of the opioid treatment agreement; reinforcing expected behaviors and outcomes of patients prescribed opioids; assisting providers with interpreting UDSs and notifying providers of aberrant behaviors; and educating providers on opioid risk mitigation through seminars or academic detailing.
Furthermore, future research may be warranted to determine the prospective role of a pain specialty pharmacist on longitudinal measures, such as pain outcomes, patient satisfaction, improvement in quality of life and/or function, as well as to determine provider perspective and satisfaction of the program. Finally, it would be interesting to compare and contrast the recommendations and outcomes between the pharmacist and physician team at the BPVAHCS.
Conclusion
The addition of a pain specialty pharmacist as part of the E-Consult Pain Service seems to provide support to prescribing PCPs in general chronic pain management, as well as measuring improved adherence to VA/DoD guidelines for chronic pain.
Acknowledgments
This material is the result of work supported with resources and the use of facilities at the Bay Pines VA Healthcare System.
Author disclosures
The authors report no actual or potential conflicts of interest with regard to this article.
Disclaimer
The opinions expressed herein are those of the authors and do not necessarily reflect those of Federal Practitioner, Frontline Medical Communications Inc., the U.S. Government, or any of its agencies. This article may discuss unlabeled or investigational use of certain drugs. Please review the complete prescribing information for specific drugs or drug combinations—including indications, contraindications, warnings, and adverse effects—before administering pharmacologic therapy to patients.
1. U.S. Department of Veterans Affairs. Management of opioid therapy for chronic pain. U.S. Department of Veterans Affairs Website. http://www.healthquality.va.gov/guidelines/Pain/cot. Published May 2010. Accessed May 25, 2015.
2. Boyle AM. VA ahead of schedule in improving chronic pain care. U.S. Medicine. 2012. http://www.usmedicine.com/agencies/department-of-veterans-affairs/va-ahead-of-schedule-in-improving -chronic-pain-care. Accessed June 16, 2015.
3. Sproul RD. Bridging the gap: e-consult pain service for the primary care physician. Am Soc Pain Educ. 2012;8(1).
4. Roesel T, Engel C. Vitamin D levels and their correlation to pain, fatigue, anxiety, and other co-morbidities in specialized care program service members seen at the Deployment Health Clinical Center. In: Deployment Health Clinical Center Annual Report 2011: pp28-29. http://www.pdhealth.mil/downloads/DHCC_AR_2011.pdf. Accessed May 25, 2015.
5. Le Goaziou MF, Kellou N, Flori M, et al. Vitamin D supplementation for diffuse musculoskeletal pain: results of a before-and-after study. Eur J Gen Pract. 2014;20(1):3-9.
6. Abbasi M, Hashemipour S, Hajmanuchehri F, Kazemifar AM. Is vitamin D deficiency associated with non specific musculoskeletal pain? Glob J Health Sci. 2012;11;5(1):107-111.
7. Von Känel R, Müller-Hartmannsgruber V, Kokinogenis G, Egloff N. Vitamin D and central hypersensitivity in patients with chronic pain. Pain Med. 2014;15(9):1609-1618.
8. Anglin RE, Samaan Z, Walter SD, McDonald SD. Vitamin D deficiency and depression in adults: systematic review and meta-analysis. Br J Psychiatry. 2013;202:100-107.
9. McAdams M, Cannavo L, Orlander JD. A medical specialty e-consult program in a VA healthcare system. Fed Pract. 2014;31(5):26-31.
10. Fan T, Elgourt T. Pain management pharmacy service in a community hospital. Am J Health Syst Pharm. 2008;65(16):1560-1565.
11. Andrews LB, Bridgeman MB, Dalal KS, et al. Implementation of pharmacist-driven pain management consultation service for hospitalised adults with a history of substance abuse. Int J Clin Pract. 2013;67(12):1342-1349.
12. Hadi M, Alldred D, Briggs M, Munyombwe T, Closs SJ. Effectiveness of pharmacist-led medication review in chronic pain management: systematic review and meta-analysis. Clin J Pain. 2014;30(11):1006-1014.
13. Briggs M, Closs SJ, Marczewski K, Barratt J. A feasibility study of a combined nurse/pharmacist-led chronic pain clinic in primary care. Qual Prim Care. 2008;16(2):91-94.
The enormity of chronic pain among the veteran population makes pain management within the VA a critical issue. Of the veterans returning from Operation Enduring Freedom/Operation Iraqi Freedom (OEF/OIF), chronic pain is the most common report.1 Of equal concern is the lack of available pain specialists in the U.S. There are < 4,000 pain specialists in the U.S., and even fewer pain specialists are available within the VA system, making it difficult for veterans to access pain care and timely treatment.2
Furthermore, one of the biggest challenges surrounding pain management is the lack of proper training received by generalists and primary care providers (PCPs). Whereas opioid therapy was previously prescribed mainly by specialists and mainly to cancer patients, that is no longer the case. Today, nonspecialists frequently prescribe opioids, and 95% of long-acting opioids are for chronic, noncancer pain.1 In a majority of reviewed pain electronic consultations (e-consults) completed by the pain specialty pharmacist at the Bay Pines VA Healthcare System (BPVAHCS), the patient was not currently receiving opioid therapy, suggesting PCPs’ lack of comfort and training in chronic pain management. Effective and appropriate pain management from the patient perspective and confidence and reassurance from the prescriber standpoint cannot be successfully achieved without drastic improvements in education and training.
Related: Urologist Workforce Variation Across the VHA
The inception of the E-Consult Pain Service arose from a grant from VA National Innovations in Consult Management to 3 VA facilities in Florida: BPVAHCS; Orlando VAMC, and North Florida/South Georgia Veterans Health Systems.3 At the Orlando VAMC, PCPs needed advice on pain management for patients while they waited to see a pain clinic specialist, so a Pain Help Line was implemented to provide immediate consults, but miscommunication between recommendations given and their implementation limited its utility. That eventually led to an E-Consult Pain Service, which provided formal full chart reviews for pain management cases.
The E-Consult Pain Service program included 2 full-time pharmacists, a part-time pain psychologist, and a pain physician. Its goal was to assist PCPs with patient-specific pain management recommendations. The consult service did not replace specialty pain clinics, nor was it meant to provide continual pain management. Additional, separate pain e-consults could be scheduled as a follow-up to a previous consult or for new pain management issues. Although the recommendations in the consults were available for the provider’s use, it was at the provider’s discretion as to whether the recommendations were accepted and implemented.
The E-Consult Pain Service
The E-Consult Pain Service at the BPVAHCS started July 2011. Staffed by a full-time physician and pain specialty pharmacist, the program provides electronic chart review and recommendations to PCPs regarding complex pain management issues. About three-fourths of their time was spent directly on the consults, which took between 1 and 5 business days to complete. Their remaining time was spent on educational initiatives and administrative duties.
The BPVAHCS is a complexity level 1a facility providing comprehensive health care. The facility comprises a 192-acute care bed hospital (includes intensive care, medical, surgical, and psychiatric units); a 112-bed community living center; a 65-bed domiciliary; and a 34-bed residential treatment program.
Related: A Medical Specialty e-Consult Program in a VA Health Care System
Initially, the program was developed to provide pain management support to PCPs in the community-based outpatient clinics (CBOCs) but expanded to all BPVAHCS providers. With the expansion, the program helped reduce a 3-month delay for patients waiting to be seen in the pain clinic. Goals of the program included improving patient outcomes and safety while minimizing opioid therapy risks. These goals are met through an individual case consultation as well as formal educational programs for providers.
The purpose of this study was to obtain data evaluating the characteristics of recommendations made by a pharmacist through pain e-consults at the BPVAHCS and the percentage of consults that resulted in a change in therapy. Future research is warranted to provide clarity on why specific recommendations are or are not being accepted, patient outcomes, and PCPs’ perception on the program’s utility.
Methods
An institutional review board-exempt, retrospective chart review was conducted at the BPVAHCS to determine the percentage of patients whose pain regimen changed as a result of a pain e-consult completed by a pain specialty pharmacist. Although the BPVAHCS E-Consult Pain Service comprised a physician and a pain specialty pharmacist, this study was focused solely on the role and recommendations by the pharmacist. The characteristics of those recommendations and their acceptance/rejection rate were then recorded. Of note, the physician completed separate e-consults, and the frequency of input by the physician on pharmacist recommendations was not collected.
Patients who had a pain e-consult regarding chronic, noncancer pain between January 1, 2012, and March 31, 2012, were identified for inclusion in the study. Charts were selected based on consults submitted by providers. No consults for headaches were requested in the selected time frame.
Chronic pain is defined as persistent pain with or without an identifiable organic cause, lasting longer than 3 to 6 months.1 Use of the term chronic pain throughout this article refers to chronic, noncancer pain. Criteria for exclusion included patients who received a pain e-consult but died before September 30, 2012.
Data Collection
Patients identified for inclusion had their charts reviewed 6 months after completion of the consult in order to allow sufficient time for potential implementation of recommendations. Patient demographics, name and dose of pain medications, requesting practitioner, type of chronic pain, recommendation of pain e-consult, and consult outcome(s) were recorded for all participants.
The primary outcome of the study was the percentage of recommendations, both pharmacologic and nonpharmacologic, made by the pain specialty pharmacist and accepted and implemented by the consulting provider.
Results
A total of 127 patient charts were identified for inclusion. Five patients died prior to September 30, 2012, and were excluded from the study, leaving 122 charts for review. All 122 charts reviewed by the pain specialty pharmacist included recommendations. Most patients were male (95.1%) and white (75.6%). The most common source of chronic pain was back pain (66.4%) (Table).
Primary Outcome
The pain specialty pharmacist pharmacologic treatment option recommendations varied significantly: add and/or change topical (80% of the 122 patients); add and/or change selective norepinephrine reuptake inhibitor (SNRI) (79%); add and/or change antiepileptic drug (AED) therapy (75%); discontinue opioid (52%); reduce opioid (48%); add and/or change nonsteroidal anti- inflammatory drug (NSAID) (45%); and taper/discontinue benzodiazepine (BZD) (13%) (Figure 1).
Primary care providers could choose to accept or ignore the recommendation, and of all the pharmacologic recommendations made, about 50% were implemented. The rate of PCP implementation of the pharmacist’s recommendations varied: add and/or change AED therapy (54%); add and/or change topical (44%); reduce opioid (42%); discontinue opioid (41%); taper/discontinue BZD (38%); add and/or change SNRI (36%); and add and/or change NSAID (33%).
Despite the most frequent recommendations made by pharmacists, the 3 most accepted and implemented by providers were addition and/or change in AED therapy, addition and/or change in topical therapy, and a decrease in opioid dose. Changes in therapy were identified as either a dose decrease or increase in the existing agent, whereas a new agent was considered an addition to existing pain therapy.
The rates of nonpharmacologic recommendations made by the pharmacist were as follows: ordering additional labs, primarily vitamin D and testosterone levels (55%); referral to physical therapy (PT) (54%); weight loss (51%); smoking cessation (43%); specialty referral (42%); order new urine drug screen (UDS) (35%); referral to pain school education program (26%); transcutaneous electrical nerve stimulation (TENS) (25%); referral to the substance abuse treatment program (SATP) (15%); and update opioid agreement (OA) (9%) (Figure 2).
Nonpharmacologic treatment acceptance rates were as follows: order new UDS (67%); update OA (45%); referral to SATP (33%); referral to PT (33%); order additional labs, primarily vitamin D and testosterone levels (27%); specialty referral (22%); TENS (19%); weight loss (18%); referral to pain school education program (16%); smoking cessation (6%); and music therapy (0%). The top 3 accepted recommendations were obtainment of a new UDS; updating the patient’s OA; and tied for third, referral to PT or the SATP.
Discussion
Including a pharmacist as part of a pain e-consult team may provide support to PCPs for managing chronic pain as well as for measuring improved adherence to VA/DoD guidelines for chronic pain. Pharmacists can offer recommendations for nontraditional pain therapies that PCPs may be unaware of or are unfamiliar with, such as the use of nonnarcotic agents and various nonpharmacologic options. For example, recommend testing for vitamin D levels. Vitamin D deficiency is common among the general population, and a project completed by Roesel and Engel specifically addressed vitamin D deficiency and pain in OEF/OIF veterans.4 Other studies have shown a correlation between vitamin D supplementation and a reduction in musculoskeletal pain or the association between low vitamin D levels and hypersensitivity in patients with chronic pain.5-7 Studies have also demonstrated a link between vitamin D deficiency and depression, which is well known to augment or increase patient awareness of somatic reports, like pain.8
Of all the pharmacologic recommendations made, about 50% were implemented. It is noteworthy to mention that although a change/ addition in SNRI therapy was recommended by the pharmacist 79% of the time, it was accepted and implemented by the PCP only one-third of the time. Many veterans have co-occurring mental health conditions, which are often managed by a psychiatrist, who is typically not the consulting provider (the PCP is). The PCP may be hesitant to change antidepressant therapy for fear of destabilizing the patient or because the PCP was not the antidepressant therapy prescriber. However, the incidence of co-occurring seizure disorders among veterans is much less than that of mental health disorders, making PCPs much more likely to accept and/or change AEDs. Interestingly, the majority of pain specialty pharmacist e-consults involved chronic pain management, further demonstrating the lack of comfort, time, and/or proper training for PCPs in general pain management.
Related: The Rapid Rise of e-Consults Across Specialty Care
Although the e-consult program at the BPVAHCS consisted solely of a physician and a pain specialty pharmacist, the purpose of this project was to evaluate the characteristics of recommendations made by a pharmacist and the percentage of consults that resulted in a therapy change. The physician was responsible for separate consults, and their recommendations were not collected. However, it is important to recognize that the pain specialty pharmacist and physician performed identical roles on the team, each recommending both pharmacologic and nonpharmacologic treatment options in every consult.
Related Programs
The VA Boston Healthcare System (VABHS) is composed of 3 main facilities and 5 CBOCs across eastern Massachusetts. Although veterans in the eastern part of the state are able to receive primary care at a CBOC, specialty care is provided primarily at 2 of the main locations in the Boston area. Therefore, the VABHS began an e-consult program in order to facilitate patient access to specialty providers for patients unable to participate in a face-to-face visit.
The purpose of the VABHS study was to examine the implementation and provider perception of an e-consult program within a large VA system, to provide timely patient access to specialty care. The pilot program was initiated in 2 specialty clinics in 2011 but expanded to 12 specialty clinics within 9 months. The specialty clinics included allergy, cardiology, endocrinology, gastroenterology, hematology, infectious disease, nephrology, oncology, palliative care, pulmonary disease, rheumatology, and sleep medicine. Outcomes of the VABHS e-consult program revealed that a majority of PCPs were satisfied with the use of e-consults, whereas specialists were less satisfied. The PCP-perceived benefits to patients included avoidance of unnecessary travel, faster clinical input, and avoidance of unnecessary copays.9
Like the VABHS, the use of pain e-consults at BPVAHCS helps reduce the burden of face-to-face clinic visits and eliminate accessibility barriers for veterans. This study differs from the VABHS in that PCPs requested onetime consults focused solely on pain management. The pain specialty pharmacist at BPVAHCS did not provide longitudinal care; measure patient outcomes, such as satisfaction, reduction in pain, or improved functionally; or examine provider satisfaction. Additionally, unlike the BPVAHCS program, there was no indication whether a pharmacist played a role in the program.9
Other studies have explored the role of a pain pharmacist in the inpatient setting offering consults on patient-controlled analgesia and in patients with a history of substance abuse.10,11 Another recent study similarly looked at the effectiveness of a pharmacist-led medication review in chronic pain management. The aim was to assess patient outcomes: decrease in pain intensity and improvement in physical functioning.12 Another study involving a nurse and pharmacist-led chronic pain clinic in a primary care setting conducted in England showed improvement in patient-reported pain and reduction in secondary referrals.13
Limitations
Limitations of the study included short study duration (6 months); use of a newly implemented E-Consult Pain Service; lack of pharmacist follow-up on acceptance/rejection of their recommendation; inability to determine patient outcome(s), as consults were for a single point in time, regarding a therapy recommendation; lack of access to non-VA medications; and patient refusal to change current pain regimen.
Patient refusal inhibited providers from implementing therapy changes recommended by the pharmacist and therefore could have negatively impacted study outcomes. Raw data were used for this study, and there were no statistical analyses conducted. Furthermore, lack of other formal e-consult programs within BPVAHCS to compare the acceptance/rejection of pharmacist recommendations for other conditions and lack of a third-party review of pharmacist recommendations to ensure standard of care may have limited this study.
Future Research
As the E-Consult Pain Service continues, research regarding the value of the pain specialty pharmacist may be warranted. Additional research is needed to identify the reasons that recommendations were accepted or ignored, whether the recommendations were beneficial to the patients, and the PCPs’ perception on the usefulness of a pain e-consult program. When the program started, 14% of patients at BPVAHCS were taking opioids. The pain e-consult program handled a small percentage of these patients.
The authors considered proactively reviewing all patients on > 100 mg morphine equivalents of opioids daily but did not have adequate staff to support the review. It may be helpful to identify those patients taking opioids but do not have a consult. The role of the pain e-consult pharmacist may be expanded to assist PCPs, including leading patient education classes to explain the concept and purpose of the opioid treatment agreement; reinforcing expected behaviors and outcomes of patients prescribed opioids; assisting providers with interpreting UDSs and notifying providers of aberrant behaviors; and educating providers on opioid risk mitigation through seminars or academic detailing.
Furthermore, future research may be warranted to determine the prospective role of a pain specialty pharmacist on longitudinal measures, such as pain outcomes, patient satisfaction, improvement in quality of life and/or function, as well as to determine provider perspective and satisfaction of the program. Finally, it would be interesting to compare and contrast the recommendations and outcomes between the pharmacist and physician team at the BPVAHCS.
Conclusion
The addition of a pain specialty pharmacist as part of the E-Consult Pain Service seems to provide support to prescribing PCPs in general chronic pain management, as well as measuring improved adherence to VA/DoD guidelines for chronic pain.
Acknowledgments
This material is the result of work supported with resources and the use of facilities at the Bay Pines VA Healthcare System.
Author disclosures
The authors report no actual or potential conflicts of interest with regard to this article.
Disclaimer
The opinions expressed herein are those of the authors and do not necessarily reflect those of Federal Practitioner, Frontline Medical Communications Inc., the U.S. Government, or any of its agencies. This article may discuss unlabeled or investigational use of certain drugs. Please review the complete prescribing information for specific drugs or drug combinations—including indications, contraindications, warnings, and adverse effects—before administering pharmacologic therapy to patients.
1. U.S. Department of Veterans Affairs. Management of opioid therapy for chronic pain. U.S. Department of Veterans Affairs Website. http://www.healthquality.va.gov/guidelines/Pain/cot. Published May 2010. Accessed May 25, 2015.
2. Boyle AM. VA ahead of schedule in improving chronic pain care. U.S. Medicine. 2012. http://www.usmedicine.com/agencies/department-of-veterans-affairs/va-ahead-of-schedule-in-improving -chronic-pain-care. Accessed June 16, 2015.
3. Sproul RD. Bridging the gap: e-consult pain service for the primary care physician. Am Soc Pain Educ. 2012;8(1).
4. Roesel T, Engel C. Vitamin D levels and their correlation to pain, fatigue, anxiety, and other co-morbidities in specialized care program service members seen at the Deployment Health Clinical Center. In: Deployment Health Clinical Center Annual Report 2011: pp28-29. http://www.pdhealth.mil/downloads/DHCC_AR_2011.pdf. Accessed May 25, 2015.
5. Le Goaziou MF, Kellou N, Flori M, et al. Vitamin D supplementation for diffuse musculoskeletal pain: results of a before-and-after study. Eur J Gen Pract. 2014;20(1):3-9.
6. Abbasi M, Hashemipour S, Hajmanuchehri F, Kazemifar AM. Is vitamin D deficiency associated with non specific musculoskeletal pain? Glob J Health Sci. 2012;11;5(1):107-111.
7. Von Känel R, Müller-Hartmannsgruber V, Kokinogenis G, Egloff N. Vitamin D and central hypersensitivity in patients with chronic pain. Pain Med. 2014;15(9):1609-1618.
8. Anglin RE, Samaan Z, Walter SD, McDonald SD. Vitamin D deficiency and depression in adults: systematic review and meta-analysis. Br J Psychiatry. 2013;202:100-107.
9. McAdams M, Cannavo L, Orlander JD. A medical specialty e-consult program in a VA healthcare system. Fed Pract. 2014;31(5):26-31.
10. Fan T, Elgourt T. Pain management pharmacy service in a community hospital. Am J Health Syst Pharm. 2008;65(16):1560-1565.
11. Andrews LB, Bridgeman MB, Dalal KS, et al. Implementation of pharmacist-driven pain management consultation service for hospitalised adults with a history of substance abuse. Int J Clin Pract. 2013;67(12):1342-1349.
12. Hadi M, Alldred D, Briggs M, Munyombwe T, Closs SJ. Effectiveness of pharmacist-led medication review in chronic pain management: systematic review and meta-analysis. Clin J Pain. 2014;30(11):1006-1014.
13. Briggs M, Closs SJ, Marczewski K, Barratt J. A feasibility study of a combined nurse/pharmacist-led chronic pain clinic in primary care. Qual Prim Care. 2008;16(2):91-94.
Development of a Virtual Pharmacy Resident Conference
The VHA is the nation’s largest provider of pharmacy residency programs offering > 150 programs.1 The American Society of Health-System Pharmacists (ASHP) is the accreditation body for these pharmacy residency programs. One of the several ASHP residency standards is the presentation of a resident project at an annual conference.2,3 To meet the requirement, U.S. residency programs send pharmacy residents to regional conferences to present their projects.
Often only pharmacy residents and their project preceptors attend the regional conferences. Most pharmacists who work at each institution are not able to attend and do not have the opportunity to benefit from resident research directly related to the pharmacy profession and the facilities where the research is conducted.
Related: Treatment of Ampicillin-Resistant Enterococcus faecium Urinary Tract Infections
Reasons for not being able to attend these regional resident conferences include financial limitations as well as staffing and work requirements. The expenses associated with attending regional resident conferences include conference registration, transportation, lodging, meals, and other incidental expenses. These expenses could easily surpass several hundred dollars per attendee.
The requirements to obtain travel reimbursement for VHA employees to attend conferences for professional development have become increasingly more complex. This has presented the VHA with a unique challenge to provide its employees with professional development opportunities that do not require travel.
One option is to develop virtual learning environments, which eliminate the need for travel and conference-related expenses. Virtual learning has been a successful and convenient platform for professional development and has recently emerged within the pharmacy profession.4 In 2012, the American College of Clinical Pharmacy hosted its first Virtual Poster Symposium, which allowed participants to visit posters and interact with presenters online.5 At the VHA, pharmacists also have the opportunity to deliver and attend virtual presentations through the VA Learning University system.
To provide increased exposure and understanding to pharmacy resident research within the limitations of the VHA employee travel reimbursement system, a virtual pharmacy resident conference was developed. This article describes the steps taken to develop a conference and its impact on the pharmacists and pharmacy residents of VISN 11.
Methods
Planning for the VISN 11 Virtual Pharmacy Resident Conference started in June 2013 during the annual call for education programming from the VHA Employee Education System (EES). A proposal for the virtual conference, explaining its purpose and structure, was submitted to EES at that time, and approval was granted in August 2013.
Planning Process
Once approved, an EES representative provided guidance through the planning process and serve as a liaison between the planning committee and the desired educational accreditation body, the Accreditation Council for Pharmacy Education (ACPE). For any educational program receiving continuing education (CE) credit from ACPE, an ACPE Planning Committee must be formed that includes a licensed pharmacist.6
The ACPE credit approval process then requires a needs assessment. The needs assessment identified a current gap within the profession and highlighted how the proposed education programming filled this gap. For the VISN 11 Virtual Pharmacy Resident Conference, the needs assessment included the challenges surrounding professional travel reimbursement and the missed learning opportunity for VA pharmacists who were not able to learn from resident research projects. Developing a virtual conference was proposed to fill this gap; pharmacists within the VISN could attend presentations from their workstations in order to stay abreast of pharmacy resident projects while gaining required CE hours for license renewal.
After the needs assessment was approved, a brochure and a content alignment worksheet was developed. The brochure identified the date and time of the conference, the target audience, and included a statement of purpose. The content alignment worksheet listed the program (presentation) title, the faculty delivering the presentation, and objectives. The completed brochure and content alignment worksheet was submitted to ACPE for credit hours approval. In the VHA, it is a VHA employee who coordinates ACPE activities for the entire health system.
Gaining Support
Another important step was to gain the support of VHA pharmacy leadership. In September 2013, an informational meeting was held to discuss the proposal and request feedback from the pharmacy chiefs, supervisors, and residency program directors at each facility within VISN 11. Following this meeting, each facility was given 1 month to determine whether the pharmacy residents at each respective facility would participate in the virtual conference. Once the planning committee had a final list of participating residents, an official announcement of the virtual conference was made to the pharmacy residents, chiefs of pharmacy, supervisors, and residency pharmacy directors.
Participating pharmacy residents submitted presentation titles to the ACPE planning committee and identified which of the 3 content tracks the research fell into: ambulatory care, acute care, or pharmacy administration. A presentation schedule was then developed.
VISN 11 pharmacists were invited to register for each of the presentations. Registration took place through the VHA Talent Management System. Presentations were delivered through Microsoft Lync (Redmond, WA), a web-based communication and conferencing platform. The VA eHealth University could have been used to achieve the same outcome.
Statistical Analysis
Presentation content breakdown and attendance rates from the VISN 11 Virtual Pharmacy Resident Conference were analyzed using descriptive statistics. The comparison of attendance rates at the virtual conference with those expected for the regional face-to-face conference was analyzed using a single sample t test.
Results
The VISN 11 Virtual Pharmacy Resident Conference took place May 5-7, 2014. Twenty-six of the 29 pharmacy residents in VISN 11 delivered 23 presentations. Three presentations had 2 presenters each, as these had completed their research as a team. Each presentation was approved by ACPE for 0.5 CE hours for a total of 11.5 CE hours available to participants.
Of the 23 presentations, 16 (69.6%) focused on ambulatory care, 5 (21.7%) on pharmacy administration, and 2 (8.7%) on acute care (Figure 1). The ambulatory care presentations were divided into subgroups of diabetes (n = 6), mental health (n = 4), anticoagulation (n = 4), and cardiology (n = 2). Diabetes and cardiology presentations were delivered on day 1 of the conference, mental health and anticoagulation on day 2, and acute care and pharmacy administration on day 3.

A total of 386 VISN 11 pharmacists were invited to attend the virtual conference and 71 pharmacists (18.4%) registered for at least 1 presentation. VISN 11 pharmacy participation at the virtual conference was increased by 50% compared with the attendance at the 29th Annual Great Lakes Pharmacy Resident Conference, hosted by Purdue University, where only 47 VISN 11 pharmacists (12.2%) were expected to attend, based on results of a VISN-wide survey (95% confidence interval, 0.15-0.23; P < .001) (Figure 2).

On average, each participant attended 7 presentations and earned 3.5 hours of ACPE credit. Of the pharmacists who registered, 14 (19.7%) were pharmacy residents. Of note, registration was not required to deliver a presentation, which explains why the number of pharmacy residents registered to attend (14) was less than the number of pharmacy residents that delivered presentations (26).
More pharmacists registered for ambulatory care presentations (76.2%), followed by pharmacy administration (16.4%) and acute care (7.4%). These differences may be explained by the variability in the number of presentations within each content track. The registration for ambulatory care presentations, when stratified by content subgroup, was 45.7% for diabetes, 22.6% for mental health, 21.2% for anticoagulation, and 10.5% for cardiology.
The first day of the conference had the largest number of participants with 42.8% of all registrants, followed by 33.4% of registrants attending presentations on day 2 and 23.8% on day 3. The presentation with the largest number of registrants was in the diabetes subgroup, which was presented on the first day of the conference. The pharmacy administration presentation was held on the third and final day of the conference and had the lowest number of registrants. An average of 21.2 pharmacists registered for each presentation.
Discussion
The VISN 11 Virtual Pharmacy Resident Conference was structured in a way that offered benefits to multiple groups. First, the virtual conference served as a medium for pharmacy residents to present their yearlong research projects and meet an ASHP residency requirement. Second, the virtual conference greatly expanded the audience size and potential impact of the presentations. Traditionally, resident research projects have been available to the few pharmacists who are able to attend an in-person conference. Almost 20% of all VISN 11 pharmacists were able to attend at least 1 presentation over the course of the 3-day conference. Attendance may increase as the virtual conference becomes more familiar to the VISN 11 pharmacy staff.
Access to a larger audience may help more pharmacists understand veteran-specific research. The information discovered through these research projects may be valuable to advance the clinical and administrative role of pharmacy within each facility as well as the entire VISN. Previously, staff pharmacists could not easily learn about resident research projects taking place at their local and neighboring VA facilities. In addition to the increased impact having a larger audience size also increases staff buy-in and feedback toward the projects.
Related:Non–Daily-Dosed Rosuvastatin in Statin-Intolerant Veterans
Individual VHA facilities frequently try to find ways to increase collaboration between VISN sites. The virtual conference format can help this collaboration. Sharing information between sites through a virtual conference may decrease duplication of projects across facilities, and each facility can learn from the mistakes of the others as well as the successes.
The VHA has a standing contract with ACPE, and therefore, registration fees were not required for this conference. For health systems that may not have such a contract, an ACPE registration fee may be required; however, this fee would still be considerably lower than the travel costs of an in-person conference.
Experience preparing and delivering a virtual presentation is useful for pharmacy residents. Delivering a virtual presentation offers its own set of challenges, such as learning how to engage an audience. Exposure to this type of public speaking may benefit residents as they progress on their career paths.
To prepare for this conference, a tutorial was created to help develop presentations. Residents were encouraged to learn how to not only deliver the presentation using the web conference technology, but also incorporate active learning exercises throughout the presentation to maximize involvement and engagement of the audience. For most resident presenters, this was the first experience delivering a virtual presentation.
Finally, a virtual conference format allows pharmacists to obtain ACPE credit hours required for license renewal.
In addition to the many benefits offered through virtual conferences, there are also some limitations. Many learners enjoy the personal element that comes with an in-person presentation. Although the use of webcams is available for virtual conferences, some of this human element may still be lost. Additionally, in-person conferences provide professional networking opportunities, which are not as readily available through virtual conferences.
The majority of presentations for this conference were related to ambulatory care, which is to be expected in a VHA setting, given the multitude of outpatient clinics in the VHA health system. Of ambulatory care presentations, most participants attended presentations that focused on diabetes or cardiology (day 1 of the conference).
However, some technology difficulties occurred on the first day of the conference, which might explain the decreased participation on subsequent days. Afternoon hours were selected as the time to host the virtual conference, because it was believed this would increase the opportunity for participation, as several pharmacists were expected to be unavailable in the morning hours due to increased workload and/or clinical responsibilities.
A follow-up questionnaire was available to participants after the conference. The majority of responses received indicated positive feedback in regards to the ease of conference participation, applicability of information gained to specific facilities, as well as availability of ACPE CE hours. In the future, the intent is to expand the VISN 11 Virtual Pharmacy Resident Conference to also include CE credit for pharmacy technicians, which requires some additional steps in the ACPE credit approval process. Also, presentations will be recorded and available either live or on-demand for CE credit.
Conclusion
The VISN 11 Virtual Pharmacy Resident Conference was an innovative, educational program that allowed pharmacy residents to meet the ASHP requirement to present residency research at an annual conference, while also providing the opportunity for pharmacists to have a more encompassing understanding of research taking place within the VISN and meet their CE requirements.
The virtual conference format may be applied to any multisite health system where members from pharmacy services would benefit from the presentations. Last, pharmacy residents will gain new techniques and experience in developing and delivering a virtual presentation, which will prove be a useful skill set for the future.
Author Disclosures
The authors report no actual or potential conflicts of interest with regard to this article.
Disclaimer
The opinions expressed herein are those of the authors and do not necessarily reflect those of Federal Practitioner, Frontline Medical Communications Inc., the U.S. Government, or any of its agencies. This article may discuss unlabeled or investigational use of certain drugs. Please review the complete prescribing information for specific drugs or drug combinations—including indications, contraindications, warnings, and adverse effects—before administering pharmacologic therapy to patients.
1. U.S. Department of Veterans Affairs. Discover more options with a VA pharmacy residency. U.S. Department of Veterans Affairs Website. http://www.vacareers.va.gov/careers/pharmacists /residency.asp. Updated January 2, 2014. Accessed June 8, 2015.
2. American Society of Health-System Pharmacists. ASHP Accreditation Standard For Postgraduate Year One (PGY1) Pharmacy Residency Programs. American Society of Health-System Pharmacists Website. http://www.ashp.org/DocLibrary/Accreditation/ASD-PGY1-Standard.aspx. Updated April 13, 2012. Accessed June 8, 2015.
3. American Society of Health-System Pharmacists. ASHP Accreditation Standard For Postgraduate Year Two (PGY2) Pharmacy Residency Programs. American Society of Health-System Pharmacists Website. http://www.ashp.org/DocLibrary/Accreditation/ASD-PGY2-Standard.aspx. Updated April 13, 2012. Accessed June 8, 2015.
4. Sloan R. Poster presentations in the virtual world. J Contin Educ Nurs. 2012;43(11):485-486.
5. American College of Clinical Pharmacy. Virtual poster symposium. American College of Clinical Pharmacy Website. http://www.accp.com/meetings/virtual.aspx. Accessed June 8, 2015.
6. Accreditation Council for Pharmacy Education. Accreditation Standards for Continuing Pharmacy Education, Version 2. Chicago, IL: Accreditation Council for Pharmacy Education; 2007. https://www.acpe-accredit.org/pdf/CPE_Standards_Final.pdf. Updated March 2014. Accessed June 8, 2015.
The VHA is the nation’s largest provider of pharmacy residency programs offering > 150 programs.1 The American Society of Health-System Pharmacists (ASHP) is the accreditation body for these pharmacy residency programs. One of the several ASHP residency standards is the presentation of a resident project at an annual conference.2,3 To meet the requirement, U.S. residency programs send pharmacy residents to regional conferences to present their projects.
Often only pharmacy residents and their project preceptors attend the regional conferences. Most pharmacists who work at each institution are not able to attend and do not have the opportunity to benefit from resident research directly related to the pharmacy profession and the facilities where the research is conducted.
Related: Treatment of Ampicillin-Resistant Enterococcus faecium Urinary Tract Infections
Reasons for not being able to attend these regional resident conferences include financial limitations as well as staffing and work requirements. The expenses associated with attending regional resident conferences include conference registration, transportation, lodging, meals, and other incidental expenses. These expenses could easily surpass several hundred dollars per attendee.
The requirements to obtain travel reimbursement for VHA employees to attend conferences for professional development have become increasingly more complex. This has presented the VHA with a unique challenge to provide its employees with professional development opportunities that do not require travel.
One option is to develop virtual learning environments, which eliminate the need for travel and conference-related expenses. Virtual learning has been a successful and convenient platform for professional development and has recently emerged within the pharmacy profession.4 In 2012, the American College of Clinical Pharmacy hosted its first Virtual Poster Symposium, which allowed participants to visit posters and interact with presenters online.5 At the VHA, pharmacists also have the opportunity to deliver and attend virtual presentations through the VA Learning University system.
To provide increased exposure and understanding to pharmacy resident research within the limitations of the VHA employee travel reimbursement system, a virtual pharmacy resident conference was developed. This article describes the steps taken to develop a conference and its impact on the pharmacists and pharmacy residents of VISN 11.
Methods
Planning for the VISN 11 Virtual Pharmacy Resident Conference started in June 2013 during the annual call for education programming from the VHA Employee Education System (EES). A proposal for the virtual conference, explaining its purpose and structure, was submitted to EES at that time, and approval was granted in August 2013.
Planning Process
Once approved, an EES representative provided guidance through the planning process and serve as a liaison between the planning committee and the desired educational accreditation body, the Accreditation Council for Pharmacy Education (ACPE). For any educational program receiving continuing education (CE) credit from ACPE, an ACPE Planning Committee must be formed that includes a licensed pharmacist.6
The ACPE credit approval process then requires a needs assessment. The needs assessment identified a current gap within the profession and highlighted how the proposed education programming filled this gap. For the VISN 11 Virtual Pharmacy Resident Conference, the needs assessment included the challenges surrounding professional travel reimbursement and the missed learning opportunity for VA pharmacists who were not able to learn from resident research projects. Developing a virtual conference was proposed to fill this gap; pharmacists within the VISN could attend presentations from their workstations in order to stay abreast of pharmacy resident projects while gaining required CE hours for license renewal.
After the needs assessment was approved, a brochure and a content alignment worksheet was developed. The brochure identified the date and time of the conference, the target audience, and included a statement of purpose. The content alignment worksheet listed the program (presentation) title, the faculty delivering the presentation, and objectives. The completed brochure and content alignment worksheet was submitted to ACPE for credit hours approval. In the VHA, it is a VHA employee who coordinates ACPE activities for the entire health system.
Gaining Support
Another important step was to gain the support of VHA pharmacy leadership. In September 2013, an informational meeting was held to discuss the proposal and request feedback from the pharmacy chiefs, supervisors, and residency program directors at each facility within VISN 11. Following this meeting, each facility was given 1 month to determine whether the pharmacy residents at each respective facility would participate in the virtual conference. Once the planning committee had a final list of participating residents, an official announcement of the virtual conference was made to the pharmacy residents, chiefs of pharmacy, supervisors, and residency pharmacy directors.
Participating pharmacy residents submitted presentation titles to the ACPE planning committee and identified which of the 3 content tracks the research fell into: ambulatory care, acute care, or pharmacy administration. A presentation schedule was then developed.
VISN 11 pharmacists were invited to register for each of the presentations. Registration took place through the VHA Talent Management System. Presentations were delivered through Microsoft Lync (Redmond, WA), a web-based communication and conferencing platform. The VA eHealth University could have been used to achieve the same outcome.
Statistical Analysis
Presentation content breakdown and attendance rates from the VISN 11 Virtual Pharmacy Resident Conference were analyzed using descriptive statistics. The comparison of attendance rates at the virtual conference with those expected for the regional face-to-face conference was analyzed using a single sample t test.
Results
The VISN 11 Virtual Pharmacy Resident Conference took place May 5-7, 2014. Twenty-six of the 29 pharmacy residents in VISN 11 delivered 23 presentations. Three presentations had 2 presenters each, as these had completed their research as a team. Each presentation was approved by ACPE for 0.5 CE hours for a total of 11.5 CE hours available to participants.
Of the 23 presentations, 16 (69.6%) focused on ambulatory care, 5 (21.7%) on pharmacy administration, and 2 (8.7%) on acute care (Figure 1). The ambulatory care presentations were divided into subgroups of diabetes (n = 6), mental health (n = 4), anticoagulation (n = 4), and cardiology (n = 2). Diabetes and cardiology presentations were delivered on day 1 of the conference, mental health and anticoagulation on day 2, and acute care and pharmacy administration on day 3.
A total of 386 VISN 11 pharmacists were invited to attend the virtual conference and 71 pharmacists (18.4%) registered for at least 1 presentation. VISN 11 pharmacy participation at the virtual conference was increased by 50% compared with the attendance at the 29th Annual Great Lakes Pharmacy Resident Conference, hosted by Purdue University, where only 47 VISN 11 pharmacists (12.2%) were expected to attend, based on results of a VISN-wide survey (95% confidence interval, 0.15-0.23; P < .001) (Figure 2).
On average, each participant attended 7 presentations and earned 3.5 hours of ACPE credit. Of the pharmacists who registered, 14 (19.7%) were pharmacy residents. Of note, registration was not required to deliver a presentation, which explains why the number of pharmacy residents registered to attend (14) was less than the number of pharmacy residents that delivered presentations (26).
More pharmacists registered for ambulatory care presentations (76.2%), followed by pharmacy administration (16.4%) and acute care (7.4%). These differences may be explained by the variability in the number of presentations within each content track. The registration for ambulatory care presentations, when stratified by content subgroup, was 45.7% for diabetes, 22.6% for mental health, 21.2% for anticoagulation, and 10.5% for cardiology.
The first day of the conference had the largest number of participants with 42.8% of all registrants, followed by 33.4% of registrants attending presentations on day 2 and 23.8% on day 3. The presentation with the largest number of registrants was in the diabetes subgroup, which was presented on the first day of the conference. The pharmacy administration presentation was held on the third and final day of the conference and had the lowest number of registrants. An average of 21.2 pharmacists registered for each presentation.
Discussion
The VISN 11 Virtual Pharmacy Resident Conference was structured in a way that offered benefits to multiple groups. First, the virtual conference served as a medium for pharmacy residents to present their yearlong research projects and meet an ASHP residency requirement. Second, the virtual conference greatly expanded the audience size and potential impact of the presentations. Traditionally, resident research projects have been available to the few pharmacists who are able to attend an in-person conference. Almost 20% of all VISN 11 pharmacists were able to attend at least 1 presentation over the course of the 3-day conference. Attendance may increase as the virtual conference becomes more familiar to the VISN 11 pharmacy staff.
Access to a larger audience may help more pharmacists understand veteran-specific research. The information discovered through these research projects may be valuable to advance the clinical and administrative role of pharmacy within each facility as well as the entire VISN. Previously, staff pharmacists could not easily learn about resident research projects taking place at their local and neighboring VA facilities. In addition to the increased impact having a larger audience size also increases staff buy-in and feedback toward the projects.
Related:Non–Daily-Dosed Rosuvastatin in Statin-Intolerant Veterans
Individual VHA facilities frequently try to find ways to increase collaboration between VISN sites. The virtual conference format can help this collaboration. Sharing information between sites through a virtual conference may decrease duplication of projects across facilities, and each facility can learn from the mistakes of the others as well as the successes.
The VHA has a standing contract with ACPE, and therefore, registration fees were not required for this conference. For health systems that may not have such a contract, an ACPE registration fee may be required; however, this fee would still be considerably lower than the travel costs of an in-person conference.
Experience preparing and delivering a virtual presentation is useful for pharmacy residents. Delivering a virtual presentation offers its own set of challenges, such as learning how to engage an audience. Exposure to this type of public speaking may benefit residents as they progress on their career paths.
To prepare for this conference, a tutorial was created to help develop presentations. Residents were encouraged to learn how to not only deliver the presentation using the web conference technology, but also incorporate active learning exercises throughout the presentation to maximize involvement and engagement of the audience. For most resident presenters, this was the first experience delivering a virtual presentation.
Finally, a virtual conference format allows pharmacists to obtain ACPE credit hours required for license renewal.
In addition to the many benefits offered through virtual conferences, there are also some limitations. Many learners enjoy the personal element that comes with an in-person presentation. Although the use of webcams is available for virtual conferences, some of this human element may still be lost. Additionally, in-person conferences provide professional networking opportunities, which are not as readily available through virtual conferences.
The majority of presentations for this conference were related to ambulatory care, which is to be expected in a VHA setting, given the multitude of outpatient clinics in the VHA health system. Of ambulatory care presentations, most participants attended presentations that focused on diabetes or cardiology (day 1 of the conference).
However, some technology difficulties occurred on the first day of the conference, which might explain the decreased participation on subsequent days. Afternoon hours were selected as the time to host the virtual conference, because it was believed this would increase the opportunity for participation, as several pharmacists were expected to be unavailable in the morning hours due to increased workload and/or clinical responsibilities.
A follow-up questionnaire was available to participants after the conference. The majority of responses received indicated positive feedback in regards to the ease of conference participation, applicability of information gained to specific facilities, as well as availability of ACPE CE hours. In the future, the intent is to expand the VISN 11 Virtual Pharmacy Resident Conference to also include CE credit for pharmacy technicians, which requires some additional steps in the ACPE credit approval process. Also, presentations will be recorded and available either live or on-demand for CE credit.
Conclusion
The VISN 11 Virtual Pharmacy Resident Conference was an innovative, educational program that allowed pharmacy residents to meet the ASHP requirement to present residency research at an annual conference, while also providing the opportunity for pharmacists to have a more encompassing understanding of research taking place within the VISN and meet their CE requirements.
The virtual conference format may be applied to any multisite health system where members from pharmacy services would benefit from the presentations. Last, pharmacy residents will gain new techniques and experience in developing and delivering a virtual presentation, which will prove be a useful skill set for the future.
Author Disclosures
The authors report no actual or potential conflicts of interest with regard to this article.
Disclaimer
The opinions expressed herein are those of the authors and do not necessarily reflect those of Federal Practitioner, Frontline Medical Communications Inc., the U.S. Government, or any of its agencies. This article may discuss unlabeled or investigational use of certain drugs. Please review the complete prescribing information for specific drugs or drug combinations—including indications, contraindications, warnings, and adverse effects—before administering pharmacologic therapy to patients.
1. U.S. Department of Veterans Affairs. Discover more options with a VA pharmacy residency. U.S. Department of Veterans Affairs Website. http://www.vacareers.va.gov/careers/pharmacists /residency.asp. Updated January 2, 2014. Accessed June 8, 2015.
2. American Society of Health-System Pharmacists. ASHP Accreditation Standard For Postgraduate Year One (PGY1) Pharmacy Residency Programs. American Society of Health-System Pharmacists Website. http://www.ashp.org/DocLibrary/Accreditation/ASD-PGY1-Standard.aspx. Updated April 13, 2012. Accessed June 8, 2015.
3. American Society of Health-System Pharmacists. ASHP Accreditation Standard For Postgraduate Year Two (PGY2) Pharmacy Residency Programs. American Society of Health-System Pharmacists Website. http://www.ashp.org/DocLibrary/Accreditation/ASD-PGY2-Standard.aspx. Updated April 13, 2012. Accessed June 8, 2015.
4. Sloan R. Poster presentations in the virtual world. J Contin Educ Nurs. 2012;43(11):485-486.
5. American College of Clinical Pharmacy. Virtual poster symposium. American College of Clinical Pharmacy Website. http://www.accp.com/meetings/virtual.aspx. Accessed June 8, 2015.
6. Accreditation Council for Pharmacy Education. Accreditation Standards for Continuing Pharmacy Education, Version 2. Chicago, IL: Accreditation Council for Pharmacy Education; 2007. https://www.acpe-accredit.org/pdf/CPE_Standards_Final.pdf. Updated March 2014. Accessed June 8, 2015.
Telejustice: Reaching Incarcerated Veterans via Telehealth
The mission of the veterans justice programs (VJPs), which began in 2007 with the initiation of Health Care for Re-entry Veterans (HCRV) and expanded in 2009 to include Veterans Justice Outreach (VJO), is to prevent homelessness and provide justice-involved veterans with timely access to mental health and substance abuse services or other VA benefits.1 About 50% of homeless veterans have a history with the criminal justice system, and about 10% of all individuals incarcerated in the U.S. are veterans.2
Related: Redesign of a Screening Process for VA Homeless Housing
As the VA’ s use of telehealth services increases at non-VA settings, new opportunities emerge to reach veterans. One such population is incarcerated veterans, who can receive VJO and HCRV services. This article focuses primarily on the implementation of jail/prison outreach via clinical video telehealth (CVT) by VJO, which has already expanded to court liaison work (also provided by VJO) and may further expand to jail/prison outreach by HCRV. The article also describes the development and implementation of the VA’ s first telejustice program (TJP) at the VA Portland Health Care System (HCS) and briefly presents a second TJP at the VA New Jersey HCS Lyons Campus. Currently, there are about 15 known telejustice programs across the VA (Table 1).
Background
Overall, there were about 57,000 veterans seen in VJPs in fiscal year (FY) 2014, an estimated 11% increase over the previous year and an estimated 45% increase from FY12.3 Until November 2012, incarcerated veterans were able to access VJO services only by a face-to-face visit with traveling VA providers. Clinical video telehealth, conducted between a patient and a provider through real-time two-way communication, is a viable option to help improve access to care. In FY14, there were about 248,000 unique veterans who used CVT technologies to access about 660,000 appointments.4
Telemental health (TMH) via clinic-based CVT was first implemented in the VA in 2003. To date, more than 500,000 TMH encounters have occurred. Clinical video telehealth into the home (CVT-IH), which is focused on nonclinic settings was implemented nationally by VHA telehealth services in February 2013. Utilization of CVT-IH has increased from about 1,300 veterans seen (about 6,900 visits) in FY12 to about 4,200 veterans seen (about 20,000 visits) in FY14.4 Nationally, from June 2011 to April 2014, about 150 veterans received some form of VJO services via telehealth through a total of about 500 visits.

Each VAMC has a VJO specialist who serves as a liaison between the VA and law enforcement, court (particularly Veterans Treatment Courts and other collaborative treatment courts), and jails. About 225 VJO specialists provide a variety of services, including outreach, treatment matching/linkage assessment, court liaison and court team participation, and education/training to law enforcement on veteran-centric issues such as posttraumatic stress disorder (PTSD) and traumatic brain injury. Specialists spend significant time traveling to provide these jail/prison
outreach services.
The VA Portland HCS specialist, a licensed clinical social worker, had been in contact with representatives at the Deschutes County Adult Jail in Oregon and had determined there were veterans who could benefit from VA services, but she was unable to make the 322-mile round-trip in 1 day to conduct her visits. She contacted Peter Shore, PsyD, in 2010, then a clinical psychologist at the same VA who was conducting home-based TMH visits, and inquired whether it would be possible to see veterans in the jail via a webcam and personal computer. That was the start of the first VA telejustice program.
Portland Pilot
The VJO specialist at the VA Portland HCS initiated this project in early 2012. The Portland TJP used the same technology, staff, and approach that had been implemented in December 2009 through the Home-Based TMH (HBTMH) pilot. The HBTMH pilot (2009-2012), which predated the national CVT-IH program, included about 40 mental health care providers. It was the first VA pilot to successfully connect providers with veterans in their homes via Internet, webcam, and personal computer. During this period, about 250 veterans were seen in an estimated 750 clinical encounters. About 80% of those enrolled indicated they would not have received any mental health treatment were it not for the availability of HBMTH.
In May 2012, Dr. Shore was awarded a VHA Innovation grant through the VA Office for Innovation to expand the HBTMH pilot to VISN 20 via VHA Innovation 669. The Portland TJP was able to expedite implementation through the grant. In addition to continuing the mission of the HBTMH pilot to deliver behavioral health services into the homes of veterans, the Innovation 669 program was established to focus on the advancement of clinical video visits into a variety of non-VA settings, using alternative technologies, including iPads, netbooks, and alternatives to Cisco Jabber (San Jose, CA), the VA-approved videoconferencing software.
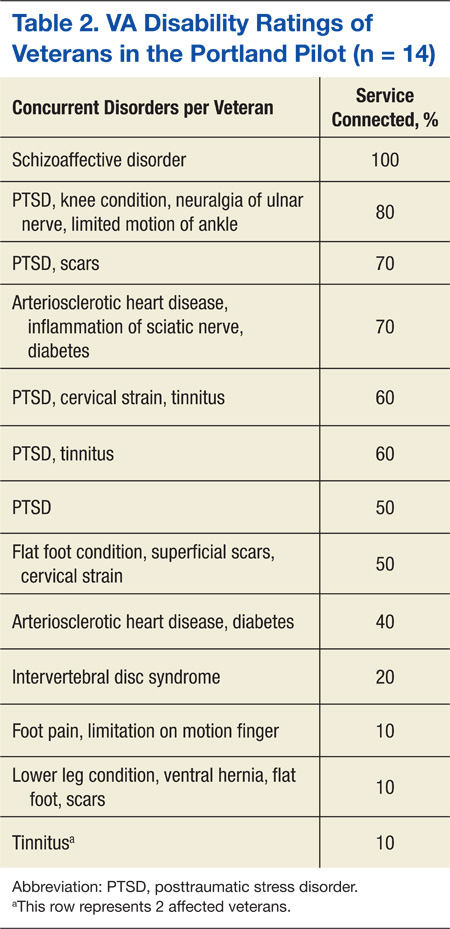
The Portland VJO specialist saw the first veteran on November 27, 2012. Through May 28, 2015, she has conducted 28 assessments with incarcerated veterans via CVT. Among the 28 individuals were 15 army, 11 navy, and 2 marine
veterans aged 24 to 70 years (mean 49.6 y). All 28 veterans were identified as male and white (non-Hispanic). Fifty percent of the veterans seen had at least 1 service-connected disability, and all 28 veterans had at least 1 recorded mental health diagnosis (Tables 2 and 3) (Belinda Maddy, LCSW, written communication, June 9, 2015).
Many of the veterans enrolled in the Portland pilot were able to successfully access services at the VA for substance abuse treatment, PTSD treatment, other mental health services, and/or medical services (Belinda Maddy, LCSW, written communication, June 9, 2015). Like the HBTMH pilot, the Portland VJO pilot has also yielded numerous unexpected patient outcomes, including access to services otherwise not available, access to community resources, enrollment in VA services, and an increase in social connectedness.
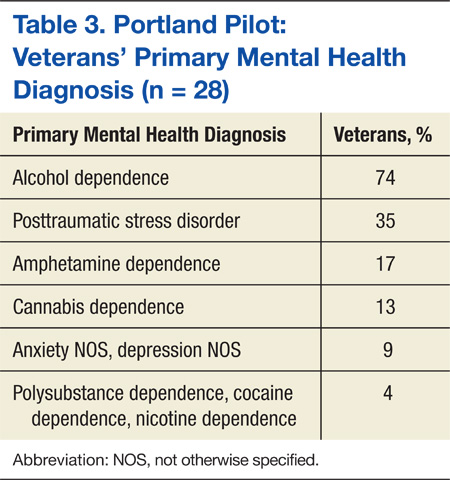
“This saved my life,” said one veteran in a testimonial. “Now I have a chance to get treatment instead of prison.” Another veteran noted, “I need to not live in this area to be able to learn how to be sober. Going to a long-term treatment program will help me learn how to live sober so I can stay out of trouble.”
New Jersey Pilot
Similar to the Portland pilot, the VA New Jersey HCS VJP specialist spearheaded the pilot and in June 2013 visited with the warden at the Mercer County Correction Center. In November 2014, a year and a half later and with numerous steps in between, a memorandum of understanding (MOU) and telehealth service agreement (TSA) were signed (Mark Correale, LICSW, written communication, June 10, 2015).
For documentation, the New Jersey specialist established a VA MOU and a TSA; whereas the Portland pilot used documentation specific to the Innovation 669 program (http://vaww.visn20.portal.va.gov/sites/clinical/TH/TeleJustice/SitePages/Home.aspx). From the outset, the specialist explored the CVT-IH model of using an Internet connection, Jabber software, and webcam. According to Mr. Correale (June 10, 2015), VA telehealth-issued webcams and Jabber video used on a VA campus did not work. In testing, it failed to provide synced video and audio but was successful after switching to the Cisco EX90 (San Jose, CA).
Mr. Correale was able to get access to desktop technology in the jail, where a stand-alone monitor was connected to a network inside the facility. As of June 2015, the New Jersey pilot has successfully made 9 videoconferencing connections in Monmouth County and has an additional signed MOU for Hudson County.
Related: Using Life Stories to Connect Veterans and Providers
Mr. Correale (June 10, 2015) indicated, “Dialing into a web-based system from the VA would have been outside the traditional VA telehealth arrangement and was therefore not pursued further.” This indicated that the web-based system used by the Portland VJO specialist may not be accepted at all VA facilities.
In the New Jersey pilot, a video-telephone booth was used, which had an EX90 desktop monitor and connection to the jail’s network. The VA information technology (IT) personnel obtained contact numbers for videoconferencing locations within the New Jersey justice system through an arrangement with the New Jersey State Parole Board. The specialist coordinated with the correctional officers (COs) responsible for escorting veterans to the chosen locations regarding privacy and visit scheduling. The CO would escort the veteran to the video-telephone booth in the jail. For scheduling and completing the encounter, the specialist scheduled the appointment time in VISTA, as did the specialist in Portland.
Discussion
A key element of the Portland pilot was autonomy. The pilot was implemented in the context of a VHA Innovation grant, which reduced a number of required approvals. Utilizing a web-based solution also eliminated significant technical obstacles. A peer technical consultant was on-call during each scheduled appointment and provided all technical support. The peer technical consultant, who had logged 2,500 hours of volunteer services in the HBTMH pilot and who worked full-time as a contractor in the Innovation 669 program, was a critical component to the success of the Portland pilot. The Portland pilot demonstrated an effective, simple, and cost-responsible clinical pathway to connect VA providers with incarcerated veterans through telehealth technologies.
The New Jersey pilot also demonstrated a feasible pathway to connect with incarcerated veterans, achieved through a different approach. The New Jersey pilot accessed incarcerated veterans through the correction center’s internal videoconferencing system, whereas the Portland pilot used VA-approved software over the Internet.
In both cases, the driver for success was the VJO specialist. The New Jersey specialist, Mr. Correale (June 10, 2015) suggested, “It’s helpful to find out what works locally and try to adapt the telehealth model that’s already working.” It is also important for the VJO specialist to get to know local and VISN telehealth staff, as they potentially could provide access to a variety of resources, including assistance with the TSA, locating appropriate equipment, etc. In both pilots, the specialists were very flexible in amending their protocols, documentation, and/or clinic times.
Related: Funding for Innovative Federal Employees
Although there is no national mandate to establish TJPs, there is support from VJO leadership for specialists to investigate the need in their local communities. Information contained in this article and supporting documentation and resources available on the Tele-Justice SharePoint site can provide an adequate starting point for any VJO specialist to initiate their own pilot. Communication through the various VJO listservs is also another mode of acquiring information for those interested in pursuing similar telejustice services.
Compensation and Pension (C&P) examinations for mental health provide a rich opportunity for further exploration. Much of the same operational guidance in this article may be applied to a C&P for mental health clinics. The only significant difference would be the referral source and how the encounter is charted.
Program Launch
A successful telehealth program launch is achieved through distinct development, planning, and implementation stages. Embedded throughout the process are building good relationships, consistent and transparent communication, and coordination. Clinical services drive the need for telehealth; telehealth should not drive the need for clinical services.
A descriptive analysis was approved as a quality improvement project by the institutional review board of the VA Portland HCS. Using information from the 2 pilot projects, the intent is to furnish practical guidance for those developing a TJP. If there is anything the reader should take away from the following guide, it is that implementing a VA TJP is very possible.
Development
Identify the need. With every telehealth program comes a fundamental question: Is there a need to deliver clinical services from a distance? The need can be viewed in many ways, but at the core is access. Identifying a need can be any of the following: travel burden, a judge interested in addressing the increasing number of veterans on their docket, limited resources at the jail/prison for transporting veterans to court hearings, inability to identify a C&P examiner willing to see a veteran in a correctional facility, or a need for the VJP to increase the number of veterans served. In the New Jersey pilot, the local VJO specialist spent time with the New Jersey County Jail Wardens Association to describe how screening justice-involved veterans via telehealth may create more opportunities for veterans and positively impact recidivism.
Evaluate feasibility. Is there buy-in from local leadership and local telehealth personnel? Does the distant site (non-VA) administration agree to a telehealth program? Does the technology at the distant site permit a videoconferencing connection? Are there individuals at the court/jail/prison who can serve as points of contact to assist with a variety of tasks?
Planning
Coordinate with the local facility telehealth coordinator (FTC). All VAMCs have an FTC whose primary role is to implement telehealth programs at the facility. As with any relatively new initiative, the FTC may be unfamiliar with the feasibility of a TJP. It is important to work closely with the FTC to ensure all necessary steps are taken, consistent with national policy regarding telehealth in non-VA settings. For most, the national CVT-IH platform will be the logical approach to establishing a TJP. In some instances, involvement with either the VISN telehealth program manager and/or the VISN behavioral health director may be recommended in addition to the VJP specialist’s supervisor.
In general, the FTC will assist with all required documentation, establishment of a clinic, and ongoing technical support. The FTC may also provide needed guidance with logistics around technical specifications at the distant site.
Conduct a site visit. Meeting with administrative and technology decision makers at the site is an important part of the process and is an opportunity to alleviate any apprehension. They may want to hear more about how telehealth is used at the VA, telehealth research in general, and/or other active TJPs.
Identify a suitable space. There will be a variety of appointments that may be considered for the TJP. If the appointment is an encounter between the provider and veteran, it is recommended to find a space at the detention facility that is as private as possible. The law library, which has windows and a cage, was the designated space for the Portland pilot. The desktop computer and webcam were situated on the outside of the cage. The veteran entered the cage with the correctional officer, who established the Internet connection (Figure).
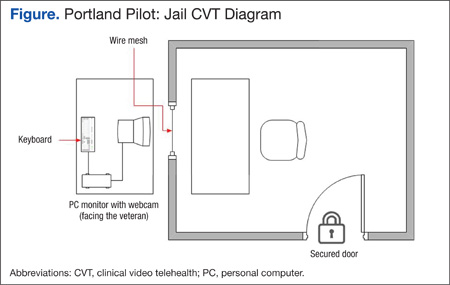
Identify a point of contact and staff at the distant site. As feasibility is evaluated, identifying a point of contact at the distant site is vital. During the site visit, it is important to meet with the point of contact to review any ongoing logistic issues. One or more staff members should be available to escort the veteran into the space where the telehealth appointment will occur. In some cases, a correctional officer will be on standby during the appointment to address any technical issues with the VA provider and/or in case of a medical or behavioral emergency. In most if not all cases, it is important for the staff member at the distant site to have telephone contact information for the VA provider and/or their respective technical support contact person.
Evaluate technology. Does the distant site facility have Internet access for the space under consideration? If it does, it is likely the FTC will follow the protocols outlined in the CVT-IH platform. Although Jabber is currently the only nationally accepted video teleconferencing software, VISN 20 has successfully used Vidyo (Hackensack, NJ) and VSee (Sunnyvale, CA) on iPads for VISN 20 mobile telehealth programs and is in the process to deploy alternative software solutions and iPads for all VISN 20 TJPs. If the jail/prison facility is open to discussing using their own videoconferencing technologies to bridge into the VA system, these efforts should be coordinated through the FTC. In some cases, the correctional facility will request a desktop computer or laptop with Internet access. The most common issue that prevents a program from being further developed is the lack of viable technology.
VA facility preparation. After the site visit is complete, the FTC should assist with the planning process. This will include identifying a telehealth clinical technician on the VA side and development of appropriate documentation and emergency management protocols. The planning package will also include a MOU between the local VA program leadership representatives and the institution/justice entity where the veteran is being served.
Emergency management protocols must include, at a minimum, a point of contact at the distant site and a contingency point of contact. Phone numbers for each should be acquired well in advance. At the beginning of each session, the provider should have access to those names and numbers in case an emergency arises during the session. At the same time, the VA provider should communicate the emergency protocols to the veteran receiving the services. In the event of an emergency, the provider should do whatever possible to remain connected via video with the veteran and call the distant site point of contact to assist with the emergency. Importantly, participants should follow emergency protocols as outlined by the correctional facility. Readers may contact the author at
[email protected] for a copy of the Portland pilot emergency protocol.
A telehealth clinic will need to be built to capture workload. In most cases, this will be a CVT-IH clinic at the facility. Typically, the FTC will initiate the process with the facility clinical applications coordinator to establish the appropriate clinic build. As the program begins to take shape, an operations manual or practice guidelines will need to be created and updated regularly.
Implementation
After the setup documentation has been completed and before the first appointment, the technology support person and the distant site point of contact should be contacted to confirm the appointment and assist in establishing the Internet connection. (An implementation checklist is available at http://wp.me/p6jTLD-5.)
As the TJP grows, it will be important to evaluate and test the technology, technical support, staffing, and modifications to local protocols to ensure the safety and welfare of the veteran and the provider. Also consider whether the program will collect data and if so, what type.
The Portland pilot collected a variety of data sets, including provider and veteran perspectives on their experiences with the technology. The VHA Innovation 669 program used a brief technology impact questionnaire, designed to monitor how technology has impacted quality of care.5 Data was collected iteratively and used in part to improve aspects of the program. This included both veteran and provider satisfaction, clinical outcomes, quality of life, and levels of occupational and social functioning.
Conclusion
Reaching incarcerated veterans sends an important message: The VA will go to great lengths to ensure that veterans have access to services to help ease the transition back into the community. Connecting with incarcerated veterans via telehealth takes the VA mission to a new level.
Given the wide array of technical solutions currently being used in correctional facilities, VA TJPs may benefit from exploring a consumer-based technology solution. However, one factor in expanding VA TJPs is that current telehealth systems rely on VA Office of Information and Technology resources that build systems within the VA network. There are privacy and security standards the VA adheres to in order to maintain a safe clinical video connection.
There are private sector companies that offer Internet-based access to secure video to connect physicians and mental health professionals. Given the significant variability in IT across correctional facilities, VA TJPs could expand their access into correctional facilities by deploying a web-based clinical video solution, similar to those currently available in the private sector. The technology already exists, and although taking this approach would need to be thoroughly vetted, it could significantly expand VA TJPs and eliminate several obstacles outlined in
this article.
Acknowledgments
Joel Rosenthal, PhD, national training director for Veterans Justice Outreach programs, has provided enduring support to VJPs. To Linda Maddy, the Portland VJO specialist—Being the first to do anything in the VA takes courage and tenacity. To Mark Correale, the NJ VJO specialist, for his tireless efforts. A special thanks to the VHA Innovation 669 team: Chuck Brown, Kit Teague, Trevor Davis, Sean O’Connor, Tracy Dekelboum, and William “Bear” Cannon for providing ongoing support to the Portland telejustice providers and distant jail staff. Mary Lu is providing editorial and research support on this and other telehealth-related projects. This article is dedicated to justice-involved men and women who have served our nation and to those VA employees who dare to be disruptive in order to reach them.
Author disclosures
The author reports no actual or potential conflicts of interest with regard to this article.
Disclaimer
The opinions expressed herein are those of the author and do not necessarily reflect those of Federal Practitioner, Frontline Medical Communications Inc., the U.S. Government, or any of its agencies. This article may discuss unlabeled or investigational use of certain drugs. Please review complete prescribing information for specific drugs or drug combinations—including indications, contraindications, warnings, and adverse effects—before administering pharmacologic therapy to patients.
1. McGuire J, Clark S. Veterans Justice Outreach Initiative (VJO). Washington, DC: Veterans Health Administration; 2009.
2. U.S. Department of Veterans Affairs. Veterans Health Administration Fact Sheet. VA Services for Veterans Involved in the Justice System: VA’s Veterans Justice Outreach Program. Washington, DC: Veterans Health Administration; 2011.
3. Veterans Health Administration Support Service Center. Homeless Services Briefing Book. Veterans Affairs Intranet Website. http://vaww.fcdm.med.va.gov/pas/en/src/Proclarity.asp. Accessed June 8, 2015.
4. Veterans Health Administration Support Service Center. Virtual care and telehealth report. https://securereports2.vssc.med.va.gov/Reports/Pages/Folder.aspx?ViewMode=Detail. Accessed June 8, 2015.
5. Shore P, Davis T. Technology Impact Questionnaire (TIQ). http://wp.me/p2toog-1f. Published 2014. Accessed June 8, 2015.
The mission of the veterans justice programs (VJPs), which began in 2007 with the initiation of Health Care for Re-entry Veterans (HCRV) and expanded in 2009 to include Veterans Justice Outreach (VJO), is to prevent homelessness and provide justice-involved veterans with timely access to mental health and substance abuse services or other VA benefits.1 About 50% of homeless veterans have a history with the criminal justice system, and about 10% of all individuals incarcerated in the U.S. are veterans.2
Related: Redesign of a Screening Process for VA Homeless Housing
As the VA’ s use of telehealth services increases at non-VA settings, new opportunities emerge to reach veterans. One such population is incarcerated veterans, who can receive VJO and HCRV services. This article focuses primarily on the implementation of jail/prison outreach via clinical video telehealth (CVT) by VJO, which has already expanded to court liaison work (also provided by VJO) and may further expand to jail/prison outreach by HCRV. The article also describes the development and implementation of the VA’ s first telejustice program (TJP) at the VA Portland Health Care System (HCS) and briefly presents a second TJP at the VA New Jersey HCS Lyons Campus. Currently, there are about 15 known telejustice programs across the VA (Table 1).
Background
Overall, there were about 57,000 veterans seen in VJPs in fiscal year (FY) 2014, an estimated 11% increase over the previous year and an estimated 45% increase from FY12.3 Until November 2012, incarcerated veterans were able to access VJO services only by a face-to-face visit with traveling VA providers. Clinical video telehealth, conducted between a patient and a provider through real-time two-way communication, is a viable option to help improve access to care. In FY14, there were about 248,000 unique veterans who used CVT technologies to access about 660,000 appointments.4
Telemental health (TMH) via clinic-based CVT was first implemented in the VA in 2003. To date, more than 500,000 TMH encounters have occurred. Clinical video telehealth into the home (CVT-IH), which is focused on nonclinic settings was implemented nationally by VHA telehealth services in February 2013. Utilization of CVT-IH has increased from about 1,300 veterans seen (about 6,900 visits) in FY12 to about 4,200 veterans seen (about 20,000 visits) in FY14.4 Nationally, from June 2011 to April 2014, about 150 veterans received some form of VJO services via telehealth through a total of about 500 visits.
Each VAMC has a VJO specialist who serves as a liaison between the VA and law enforcement, court (particularly Veterans Treatment Courts and other collaborative treatment courts), and jails. About 225 VJO specialists provide a variety of services, including outreach, treatment matching/linkage assessment, court liaison and court team participation, and education/training to law enforcement on veteran-centric issues such as posttraumatic stress disorder (PTSD) and traumatic brain injury. Specialists spend significant time traveling to provide these jail/prison
outreach services.
The VA Portland HCS specialist, a licensed clinical social worker, had been in contact with representatives at the Deschutes County Adult Jail in Oregon and had determined there were veterans who could benefit from VA services, but she was unable to make the 322-mile round-trip in 1 day to conduct her visits. She contacted Peter Shore, PsyD, in 2010, then a clinical psychologist at the same VA who was conducting home-based TMH visits, and inquired whether it would be possible to see veterans in the jail via a webcam and personal computer. That was the start of the first VA telejustice program.
Portland Pilot
The VJO specialist at the VA Portland HCS initiated this project in early 2012. The Portland TJP used the same technology, staff, and approach that had been implemented in December 2009 through the Home-Based TMH (HBTMH) pilot. The HBTMH pilot (2009-2012), which predated the national CVT-IH program, included about 40 mental health care providers. It was the first VA pilot to successfully connect providers with veterans in their homes via Internet, webcam, and personal computer. During this period, about 250 veterans were seen in an estimated 750 clinical encounters. About 80% of those enrolled indicated they would not have received any mental health treatment were it not for the availability of HBMTH.
In May 2012, Dr. Shore was awarded a VHA Innovation grant through the VA Office for Innovation to expand the HBTMH pilot to VISN 20 via VHA Innovation 669. The Portland TJP was able to expedite implementation through the grant. In addition to continuing the mission of the HBTMH pilot to deliver behavioral health services into the homes of veterans, the Innovation 669 program was established to focus on the advancement of clinical video visits into a variety of non-VA settings, using alternative technologies, including iPads, netbooks, and alternatives to Cisco Jabber (San Jose, CA), the VA-approved videoconferencing software.
The Portland VJO specialist saw the first veteran on November 27, 2012. Through May 28, 2015, she has conducted 28 assessments with incarcerated veterans via CVT. Among the 28 individuals were 15 army, 11 navy, and 2 marine
veterans aged 24 to 70 years (mean 49.6 y). All 28 veterans were identified as male and white (non-Hispanic). Fifty percent of the veterans seen had at least 1 service-connected disability, and all 28 veterans had at least 1 recorded mental health diagnosis (Tables 2 and 3) (Belinda Maddy, LCSW, written communication, June 9, 2015).
Many of the veterans enrolled in the Portland pilot were able to successfully access services at the VA for substance abuse treatment, PTSD treatment, other mental health services, and/or medical services (Belinda Maddy, LCSW, written communication, June 9, 2015). Like the HBTMH pilot, the Portland VJO pilot has also yielded numerous unexpected patient outcomes, including access to services otherwise not available, access to community resources, enrollment in VA services, and an increase in social connectedness.
“This saved my life,” said one veteran in a testimonial. “Now I have a chance to get treatment instead of prison.” Another veteran noted, “I need to not live in this area to be able to learn how to be sober. Going to a long-term treatment program will help me learn how to live sober so I can stay out of trouble.”
New Jersey Pilot
Similar to the Portland pilot, the VA New Jersey HCS VJP specialist spearheaded the pilot and in June 2013 visited with the warden at the Mercer County Correction Center. In November 2014, a year and a half later and with numerous steps in between, a memorandum of understanding (MOU) and telehealth service agreement (TSA) were signed (Mark Correale, LICSW, written communication, June 10, 2015).
For documentation, the New Jersey specialist established a VA MOU and a TSA; whereas the Portland pilot used documentation specific to the Innovation 669 program (http://vaww.visn20.portal.va.gov/sites/clinical/TH/TeleJustice/SitePages/Home.aspx). From the outset, the specialist explored the CVT-IH model of using an Internet connection, Jabber software, and webcam. According to Mr. Correale (June 10, 2015), VA telehealth-issued webcams and Jabber video used on a VA campus did not work. In testing, it failed to provide synced video and audio but was successful after switching to the Cisco EX90 (San Jose, CA).
Mr. Correale was able to get access to desktop technology in the jail, where a stand-alone monitor was connected to a network inside the facility. As of June 2015, the New Jersey pilot has successfully made 9 videoconferencing connections in Monmouth County and has an additional signed MOU for Hudson County.
Related: Using Life Stories to Connect Veterans and Providers
Mr. Correale (June 10, 2015) indicated, “Dialing into a web-based system from the VA would have been outside the traditional VA telehealth arrangement and was therefore not pursued further.” This indicated that the web-based system used by the Portland VJO specialist may not be accepted at all VA facilities.
In the New Jersey pilot, a video-telephone booth was used, which had an EX90 desktop monitor and connection to the jail’s network. The VA information technology (IT) personnel obtained contact numbers for videoconferencing locations within the New Jersey justice system through an arrangement with the New Jersey State Parole Board. The specialist coordinated with the correctional officers (COs) responsible for escorting veterans to the chosen locations regarding privacy and visit scheduling. The CO would escort the veteran to the video-telephone booth in the jail. For scheduling and completing the encounter, the specialist scheduled the appointment time in VISTA, as did the specialist in Portland.
Discussion
A key element of the Portland pilot was autonomy. The pilot was implemented in the context of a VHA Innovation grant, which reduced a number of required approvals. Utilizing a web-based solution also eliminated significant technical obstacles. A peer technical consultant was on-call during each scheduled appointment and provided all technical support. The peer technical consultant, who had logged 2,500 hours of volunteer services in the HBTMH pilot and who worked full-time as a contractor in the Innovation 669 program, was a critical component to the success of the Portland pilot. The Portland pilot demonstrated an effective, simple, and cost-responsible clinical pathway to connect VA providers with incarcerated veterans through telehealth technologies.
The New Jersey pilot also demonstrated a feasible pathway to connect with incarcerated veterans, achieved through a different approach. The New Jersey pilot accessed incarcerated veterans through the correction center’s internal videoconferencing system, whereas the Portland pilot used VA-approved software over the Internet.
In both cases, the driver for success was the VJO specialist. The New Jersey specialist, Mr. Correale (June 10, 2015) suggested, “It’s helpful to find out what works locally and try to adapt the telehealth model that’s already working.” It is also important for the VJO specialist to get to know local and VISN telehealth staff, as they potentially could provide access to a variety of resources, including assistance with the TSA, locating appropriate equipment, etc. In both pilots, the specialists were very flexible in amending their protocols, documentation, and/or clinic times.
Related: Funding for Innovative Federal Employees
Although there is no national mandate to establish TJPs, there is support from VJO leadership for specialists to investigate the need in their local communities. Information contained in this article and supporting documentation and resources available on the Tele-Justice SharePoint site can provide an adequate starting point for any VJO specialist to initiate their own pilot. Communication through the various VJO listservs is also another mode of acquiring information for those interested in pursuing similar telejustice services.
Compensation and Pension (C&P) examinations for mental health provide a rich opportunity for further exploration. Much of the same operational guidance in this article may be applied to a C&P for mental health clinics. The only significant difference would be the referral source and how the encounter is charted.
Program Launch
A successful telehealth program launch is achieved through distinct development, planning, and implementation stages. Embedded throughout the process are building good relationships, consistent and transparent communication, and coordination. Clinical services drive the need for telehealth; telehealth should not drive the need for clinical services.
A descriptive analysis was approved as a quality improvement project by the institutional review board of the VA Portland HCS. Using information from the 2 pilot projects, the intent is to furnish practical guidance for those developing a TJP. If there is anything the reader should take away from the following guide, it is that implementing a VA TJP is very possible.
Development
Identify the need. With every telehealth program comes a fundamental question: Is there a need to deliver clinical services from a distance? The need can be viewed in many ways, but at the core is access. Identifying a need can be any of the following: travel burden, a judge interested in addressing the increasing number of veterans on their docket, limited resources at the jail/prison for transporting veterans to court hearings, inability to identify a C&P examiner willing to see a veteran in a correctional facility, or a need for the VJP to increase the number of veterans served. In the New Jersey pilot, the local VJO specialist spent time with the New Jersey County Jail Wardens Association to describe how screening justice-involved veterans via telehealth may create more opportunities for veterans and positively impact recidivism.
Evaluate feasibility. Is there buy-in from local leadership and local telehealth personnel? Does the distant site (non-VA) administration agree to a telehealth program? Does the technology at the distant site permit a videoconferencing connection? Are there individuals at the court/jail/prison who can serve as points of contact to assist with a variety of tasks?
Planning
Coordinate with the local facility telehealth coordinator (FTC). All VAMCs have an FTC whose primary role is to implement telehealth programs at the facility. As with any relatively new initiative, the FTC may be unfamiliar with the feasibility of a TJP. It is important to work closely with the FTC to ensure all necessary steps are taken, consistent with national policy regarding telehealth in non-VA settings. For most, the national CVT-IH platform will be the logical approach to establishing a TJP. In some instances, involvement with either the VISN telehealth program manager and/or the VISN behavioral health director may be recommended in addition to the VJP specialist’s supervisor.
In general, the FTC will assist with all required documentation, establishment of a clinic, and ongoing technical support. The FTC may also provide needed guidance with logistics around technical specifications at the distant site.
Conduct a site visit. Meeting with administrative and technology decision makers at the site is an important part of the process and is an opportunity to alleviate any apprehension. They may want to hear more about how telehealth is used at the VA, telehealth research in general, and/or other active TJPs.
Identify a suitable space. There will be a variety of appointments that may be considered for the TJP. If the appointment is an encounter between the provider and veteran, it is recommended to find a space at the detention facility that is as private as possible. The law library, which has windows and a cage, was the designated space for the Portland pilot. The desktop computer and webcam were situated on the outside of the cage. The veteran entered the cage with the correctional officer, who established the Internet connection (Figure).
Identify a point of contact and staff at the distant site. As feasibility is evaluated, identifying a point of contact at the distant site is vital. During the site visit, it is important to meet with the point of contact to review any ongoing logistic issues. One or more staff members should be available to escort the veteran into the space where the telehealth appointment will occur. In some cases, a correctional officer will be on standby during the appointment to address any technical issues with the VA provider and/or in case of a medical or behavioral emergency. In most if not all cases, it is important for the staff member at the distant site to have telephone contact information for the VA provider and/or their respective technical support contact person.
Evaluate technology. Does the distant site facility have Internet access for the space under consideration? If it does, it is likely the FTC will follow the protocols outlined in the CVT-IH platform. Although Jabber is currently the only nationally accepted video teleconferencing software, VISN 20 has successfully used Vidyo (Hackensack, NJ) and VSee (Sunnyvale, CA) on iPads for VISN 20 mobile telehealth programs and is in the process to deploy alternative software solutions and iPads for all VISN 20 TJPs. If the jail/prison facility is open to discussing using their own videoconferencing technologies to bridge into the VA system, these efforts should be coordinated through the FTC. In some cases, the correctional facility will request a desktop computer or laptop with Internet access. The most common issue that prevents a program from being further developed is the lack of viable technology.
VA facility preparation. After the site visit is complete, the FTC should assist with the planning process. This will include identifying a telehealth clinical technician on the VA side and development of appropriate documentation and emergency management protocols. The planning package will also include a MOU between the local VA program leadership representatives and the institution/justice entity where the veteran is being served.
Emergency management protocols must include, at a minimum, a point of contact at the distant site and a contingency point of contact. Phone numbers for each should be acquired well in advance. At the beginning of each session, the provider should have access to those names and numbers in case an emergency arises during the session. At the same time, the VA provider should communicate the emergency protocols to the veteran receiving the services. In the event of an emergency, the provider should do whatever possible to remain connected via video with the veteran and call the distant site point of contact to assist with the emergency. Importantly, participants should follow emergency protocols as outlined by the correctional facility. Readers may contact the author at
[email protected] for a copy of the Portland pilot emergency protocol.
A telehealth clinic will need to be built to capture workload. In most cases, this will be a CVT-IH clinic at the facility. Typically, the FTC will initiate the process with the facility clinical applications coordinator to establish the appropriate clinic build. As the program begins to take shape, an operations manual or practice guidelines will need to be created and updated regularly.
Implementation
After the setup documentation has been completed and before the first appointment, the technology support person and the distant site point of contact should be contacted to confirm the appointment and assist in establishing the Internet connection. (An implementation checklist is available at http://wp.me/p6jTLD-5.)
As the TJP grows, it will be important to evaluate and test the technology, technical support, staffing, and modifications to local protocols to ensure the safety and welfare of the veteran and the provider. Also consider whether the program will collect data and if so, what type.
The Portland pilot collected a variety of data sets, including provider and veteran perspectives on their experiences with the technology. The VHA Innovation 669 program used a brief technology impact questionnaire, designed to monitor how technology has impacted quality of care.5 Data was collected iteratively and used in part to improve aspects of the program. This included both veteran and provider satisfaction, clinical outcomes, quality of life, and levels of occupational and social functioning.
Conclusion
Reaching incarcerated veterans sends an important message: The VA will go to great lengths to ensure that veterans have access to services to help ease the transition back into the community. Connecting with incarcerated veterans via telehealth takes the VA mission to a new level.
Given the wide array of technical solutions currently being used in correctional facilities, VA TJPs may benefit from exploring a consumer-based technology solution. However, one factor in expanding VA TJPs is that current telehealth systems rely on VA Office of Information and Technology resources that build systems within the VA network. There are privacy and security standards the VA adheres to in order to maintain a safe clinical video connection.
There are private sector companies that offer Internet-based access to secure video to connect physicians and mental health professionals. Given the significant variability in IT across correctional facilities, VA TJPs could expand their access into correctional facilities by deploying a web-based clinical video solution, similar to those currently available in the private sector. The technology already exists, and although taking this approach would need to be thoroughly vetted, it could significantly expand VA TJPs and eliminate several obstacles outlined in
this article.
Acknowledgments
Joel Rosenthal, PhD, national training director for Veterans Justice Outreach programs, has provided enduring support to VJPs. To Linda Maddy, the Portland VJO specialist—Being the first to do anything in the VA takes courage and tenacity. To Mark Correale, the NJ VJO specialist, for his tireless efforts. A special thanks to the VHA Innovation 669 team: Chuck Brown, Kit Teague, Trevor Davis, Sean O’Connor, Tracy Dekelboum, and William “Bear” Cannon for providing ongoing support to the Portland telejustice providers and distant jail staff. Mary Lu is providing editorial and research support on this and other telehealth-related projects. This article is dedicated to justice-involved men and women who have served our nation and to those VA employees who dare to be disruptive in order to reach them.
Author disclosures
The author reports no actual or potential conflicts of interest with regard to this article.
Disclaimer
The opinions expressed herein are those of the author and do not necessarily reflect those of Federal Practitioner, Frontline Medical Communications Inc., the U.S. Government, or any of its agencies. This article may discuss unlabeled or investigational use of certain drugs. Please review complete prescribing information for specific drugs or drug combinations—including indications, contraindications, warnings, and adverse effects—before administering pharmacologic therapy to patients.
1. McGuire J, Clark S. Veterans Justice Outreach Initiative (VJO). Washington, DC: Veterans Health Administration; 2009.
2. U.S. Department of Veterans Affairs. Veterans Health Administration Fact Sheet. VA Services for Veterans Involved in the Justice System: VA’s Veterans Justice Outreach Program. Washington, DC: Veterans Health Administration; 2011.
3. Veterans Health Administration Support Service Center. Homeless Services Briefing Book. Veterans Affairs Intranet Website. http://vaww.fcdm.med.va.gov/pas/en/src/Proclarity.asp. Accessed June 8, 2015.
4. Veterans Health Administration Support Service Center. Virtual care and telehealth report. https://securereports2.vssc.med.va.gov/Reports/Pages/Folder.aspx?ViewMode=Detail. Accessed June 8, 2015.
5. Shore P, Davis T. Technology Impact Questionnaire (TIQ). http://wp.me/p2toog-1f. Published 2014. Accessed June 8, 2015.
A Physical Therapist’s Role in Clinical Video Telehealth
Clinical video telehealth (CVT) uses live, interactive audio and video technology to connect patients with health care providers (HCPs) at remote facilities, allowing the patient to be examined and interviewed by a provider. An immediate evaluation of the patient is facilitated by the HCP’s ability to answer any questions, provide recommendations, and interact directly with the patient.
This article describes the VA’ s commitment to and uses of CVT, outlines various physical therapists’ roles in CVT, and details a specific physical therapist’s CVT practice.
The VA is recognized as a leader in this growing method of delivering direct patient care, combining the benefit of face-to-face interaction with the convenience of reduced travel. In 2013, the VA spent $500 million nationally on a telehealth expansion project to improve veteran access to health care. This expansion has continued, and telehealth capabilities have reached 152 VAMCs and clinics throughout the U.S.1 The VA was most recently recognized for its efforts in Hospitals & Health Networks, deeming VA as a “2014 most wired” U.S. hospital.2
Related: Helping Patients Set Goals for Better Health
To date, CVT has grown in the VA to include a multitude of specialty services. Clinical video telehealth fills an important niche in the VA community, providing flexible care to veterans when and where they need it. Providers use CVT to make diagnoses, manage care, perform checkups, and educate patients. It allows patients to come to many of the VA community-based outpatient clinics (CBOCs) and receive care from specialists or providers who may be located in the main facility, another state, or even across the country. Publications documenting successful video telehealth technology in the VHA include positive patient and provider satisfaction, accuracy of measuring physical function, merits in providing group weight loss programs, effective cognitive-behavioral and physical therapy group protocol, as well as a telehealth collaborative care program for persons with HIV in rural areas.3-7
Physical therapists (PTs) are making use of technology that brings care to the patient rather than the patient to the care. For instance, PTs have used this service for patients with spinal cord injuries for whom prolonged sitting during travel has the potential risk of worsening a sore or ulcer.6 By incorporating CVT into their practices, PTs can address current, evolving, and future health care needs.
PT’s Perspective
Yevgenia Gitlin-Nitti, PT, of the Miami VA Healthcare System (MVAHCS) works at the Key West CBOC, which consists of 1 primary care physician, 1 nurse practitioner, 2 registered nurses, 2 social workers, 1 psychiatrist, 1 PT, and 3 support staff. Over 160 miles from the Miami VA HCS where all the specialists are located, Key West CBOC needs remote services.
Working with 3 different clinics—spine, diabetes, and MOVE! (Management of Overweight and/or Obesity for Veterans Everywhere)—has allowed the PT to develop a thorough understanding of the need for telehealth services. Specifically, the spine clinic visits are designed to have a patient consult with a physical medicine and rehabilitation physician regarding any spine issues. The PT’s role in the spine clinic CVT is to serve as the extension of the evaluating physician’s hands. Physical therapists are trained to perform various orthopedic and neurologic tests and other vitals such as weight, blood pressure, and pulse. The PT is also trained to palpate and feel for soft tissue abnormalities, joint and quality of movement, and bony anomalies on behalf of the physician at the remote location.
Related: A Call to Action: Intensive Lifestyle Intervention Against Diabesity
The spine clinic typically meets for 1 hour, once a month, with 2 scheduled patients individually evaluated. The PT presents the patient to the physician via CVT and takes the patient through a comprehensive physical evaluation as per the physician’s requests. The Computerized Patient Record System allows both parties to view magnetic resonance images, X-rays, and other pertinent test results. The physician may then order additional tests, procedures, and/or consults with other specialty clinics.
The PT also leads a monthly diabetes CVT group session for Key West patients. A nutritionist and a certified diabetes educator nurse attend the session from the MVAHCS via CVT. The PT can be present in the room with the patient while the other specialty clinic provider is remote. The PT’s role is to educate the participants about exercise for better blood sugar control and to maintain foot care.
Related: Experiences of Veterans With Diabetes From Shared Medical Appointments
Oftentimes, the PT may make referrals to podiatry at the MVAHCS and may need to conduct a CVT session to help with the podiatry physical examination. Similarly, the PT also contributes to a weekly MOVE! class, which consists of Key West patients in a group appointment that includes a Miami-based nutritionist joining via CVT. Some MOVE! classes are set up with the PT educating patients remotely at other CBOCs on exercise and even performing exercises together via CVT. Other clinics are set up in Key West with the PT alongside the patient while another HCP observes via CVT. In the Key West CVT service, the PT educates patients on exercise with a focus on managing weight and staying healthy.
In fiscal year 2013, the PT successfully conducted over 120 CVT encounters in the diabetes and MOVE! CVT clinics and 9 CVT encounters in the spine clinic.
Conclusion
Multiple benefits have been observed from providing CVT clinics. Increasing the accessibility to these clinics makes it easier for veterans to keep their appointments. Also, CVT allows HCPs to reach patients who otherwise would likely not seek care because of the lack of access to specialists at the closest facility. This service can help patients who cannot physically travel great distances because of their conditions and who otherwise may not have been seen.1
Nonetheless, telehealth does have some drawbacks. There is the chance that the audio/video connection may be interrupted by severe weather.6 Equipment breakdown, other connectivity issues, and the HCP’s inability to touch and feel the patient during the evaluation are also limitations.
Ultimately, this personalized service can be recognized as convenient, cutting-edge, and most important, can improve the quality and timeliness of care to patients.
Author disclosures
The authors report no actual or potential conflicts of interest with regard to this article.
Disclaimer
The opinions expressed herein are those of the authors and do not necessarily reflect those of Federal Practitioner, Frontline Medical Communications Inc., the U.S. Government, or any of its agencies. This article may discuss unlabeled or investigational use of certain drugs. Please review complete prescribing information for specific drugs or drug combinations—including indications, contraindications, warnings, and adverse effects—before administering pharmacologic therapy to patients.
1. Fleisher C. At White River Junction VA, doctor is in—and on screen. Valley News. July 31, 2013. http://www.vnews.com/home/7851132-95/at-white-river-junction-va-doctor-is-in-and-on-screen. Accessed June 10, 2015.
2. Weinstock M, Hoppszallern S. 2014 most wired. Hospitals & Health Networks. July 9, 2014. http://www.hhnmag.com/Magazine/2014/Jul/mostwired-health-it-technology-data. Accessed June 10, 2015.
3. Wakefield BJ, Buresh KA, Flanagan JR, Kienzle MG. Interactive video specialty consultations in long-term care. J Am Geriatr Soc. 2004;52(5):789-793.
4. Hoenig H, Tate L, Dumbleton S, et al. A quality assurance study of the accuracy of measuring physical function under current conditions for use of clinical video telehealth. Arch Phys Med Rehabil. 2013;94(5):998-1002.
5. Ahrendt AD, Kattelmann KK, Rector TS, Maddox DA. The effectiveness of telemedicine for weight management in the MOVE! program. J Rural Health. 2014;30(1):113-119.
6. Palyo SA, Schopmeyer KA, McQuaid JR. Tele-pain management: use of videoconferencing technology in the delivery of an integrated cognitive-behavioral and physical therapy group intervention. Psychol Serv. 2012;9(2):200-202.
7. Ohl M, Dillon D, Moeckli J, et al. Mixed-methods evaluation of a telehealth collaborative care program for persons with HIV infection in a rural setting. J Gen Intern Med. 2013;28(9):1165-1173.
Clinical video telehealth (CVT) uses live, interactive audio and video technology to connect patients with health care providers (HCPs) at remote facilities, allowing the patient to be examined and interviewed by a provider. An immediate evaluation of the patient is facilitated by the HCP’s ability to answer any questions, provide recommendations, and interact directly with the patient.
This article describes the VA’ s commitment to and uses of CVT, outlines various physical therapists’ roles in CVT, and details a specific physical therapist’s CVT practice.
The VA is recognized as a leader in this growing method of delivering direct patient care, combining the benefit of face-to-face interaction with the convenience of reduced travel. In 2013, the VA spent $500 million nationally on a telehealth expansion project to improve veteran access to health care. This expansion has continued, and telehealth capabilities have reached 152 VAMCs and clinics throughout the U.S.1 The VA was most recently recognized for its efforts in Hospitals & Health Networks, deeming VA as a “2014 most wired” U.S. hospital.2
Related: Helping Patients Set Goals for Better Health
To date, CVT has grown in the VA to include a multitude of specialty services. Clinical video telehealth fills an important niche in the VA community, providing flexible care to veterans when and where they need it. Providers use CVT to make diagnoses, manage care, perform checkups, and educate patients. It allows patients to come to many of the VA community-based outpatient clinics (CBOCs) and receive care from specialists or providers who may be located in the main facility, another state, or even across the country. Publications documenting successful video telehealth technology in the VHA include positive patient and provider satisfaction, accuracy of measuring physical function, merits in providing group weight loss programs, effective cognitive-behavioral and physical therapy group protocol, as well as a telehealth collaborative care program for persons with HIV in rural areas.3-7
Physical therapists (PTs) are making use of technology that brings care to the patient rather than the patient to the care. For instance, PTs have used this service for patients with spinal cord injuries for whom prolonged sitting during travel has the potential risk of worsening a sore or ulcer.6 By incorporating CVT into their practices, PTs can address current, evolving, and future health care needs.
PT’s Perspective
Yevgenia Gitlin-Nitti, PT, of the Miami VA Healthcare System (MVAHCS) works at the Key West CBOC, which consists of 1 primary care physician, 1 nurse practitioner, 2 registered nurses, 2 social workers, 1 psychiatrist, 1 PT, and 3 support staff. Over 160 miles from the Miami VA HCS where all the specialists are located, Key West CBOC needs remote services.
Working with 3 different clinics—spine, diabetes, and MOVE! (Management of Overweight and/or Obesity for Veterans Everywhere)—has allowed the PT to develop a thorough understanding of the need for telehealth services. Specifically, the spine clinic visits are designed to have a patient consult with a physical medicine and rehabilitation physician regarding any spine issues. The PT’s role in the spine clinic CVT is to serve as the extension of the evaluating physician’s hands. Physical therapists are trained to perform various orthopedic and neurologic tests and other vitals such as weight, blood pressure, and pulse. The PT is also trained to palpate and feel for soft tissue abnormalities, joint and quality of movement, and bony anomalies on behalf of the physician at the remote location.
Related: A Call to Action: Intensive Lifestyle Intervention Against Diabesity
The spine clinic typically meets for 1 hour, once a month, with 2 scheduled patients individually evaluated. The PT presents the patient to the physician via CVT and takes the patient through a comprehensive physical evaluation as per the physician’s requests. The Computerized Patient Record System allows both parties to view magnetic resonance images, X-rays, and other pertinent test results. The physician may then order additional tests, procedures, and/or consults with other specialty clinics.
The PT also leads a monthly diabetes CVT group session for Key West patients. A nutritionist and a certified diabetes educator nurse attend the session from the MVAHCS via CVT. The PT can be present in the room with the patient while the other specialty clinic provider is remote. The PT’s role is to educate the participants about exercise for better blood sugar control and to maintain foot care.
Related: Experiences of Veterans With Diabetes From Shared Medical Appointments
Oftentimes, the PT may make referrals to podiatry at the MVAHCS and may need to conduct a CVT session to help with the podiatry physical examination. Similarly, the PT also contributes to a weekly MOVE! class, which consists of Key West patients in a group appointment that includes a Miami-based nutritionist joining via CVT. Some MOVE! classes are set up with the PT educating patients remotely at other CBOCs on exercise and even performing exercises together via CVT. Other clinics are set up in Key West with the PT alongside the patient while another HCP observes via CVT. In the Key West CVT service, the PT educates patients on exercise with a focus on managing weight and staying healthy.
In fiscal year 2013, the PT successfully conducted over 120 CVT encounters in the diabetes and MOVE! CVT clinics and 9 CVT encounters in the spine clinic.
Conclusion
Multiple benefits have been observed from providing CVT clinics. Increasing the accessibility to these clinics makes it easier for veterans to keep their appointments. Also, CVT allows HCPs to reach patients who otherwise would likely not seek care because of the lack of access to specialists at the closest facility. This service can help patients who cannot physically travel great distances because of their conditions and who otherwise may not have been seen.1
Nonetheless, telehealth does have some drawbacks. There is the chance that the audio/video connection may be interrupted by severe weather.6 Equipment breakdown, other connectivity issues, and the HCP’s inability to touch and feel the patient during the evaluation are also limitations.
Ultimately, this personalized service can be recognized as convenient, cutting-edge, and most important, can improve the quality and timeliness of care to patients.
Author disclosures
The authors report no actual or potential conflicts of interest with regard to this article.
Disclaimer
The opinions expressed herein are those of the authors and do not necessarily reflect those of Federal Practitioner, Frontline Medical Communications Inc., the U.S. Government, or any of its agencies. This article may discuss unlabeled or investigational use of certain drugs. Please review complete prescribing information for specific drugs or drug combinations—including indications, contraindications, warnings, and adverse effects—before administering pharmacologic therapy to patients.
1. Fleisher C. At White River Junction VA, doctor is in—and on screen. Valley News. July 31, 2013. http://www.vnews.com/home/7851132-95/at-white-river-junction-va-doctor-is-in-and-on-screen. Accessed June 10, 2015.
2. Weinstock M, Hoppszallern S. 2014 most wired. Hospitals & Health Networks. July 9, 2014. http://www.hhnmag.com/Magazine/2014/Jul/mostwired-health-it-technology-data. Accessed June 10, 2015.
3. Wakefield BJ, Buresh KA, Flanagan JR, Kienzle MG. Interactive video specialty consultations in long-term care. J Am Geriatr Soc. 2004;52(5):789-793.
4. Hoenig H, Tate L, Dumbleton S, et al. A quality assurance study of the accuracy of measuring physical function under current conditions for use of clinical video telehealth. Arch Phys Med Rehabil. 2013;94(5):998-1002.
5. Ahrendt AD, Kattelmann KK, Rector TS, Maddox DA. The effectiveness of telemedicine for weight management in the MOVE! program. J Rural Health. 2014;30(1):113-119.
6. Palyo SA, Schopmeyer KA, McQuaid JR. Tele-pain management: use of videoconferencing technology in the delivery of an integrated cognitive-behavioral and physical therapy group intervention. Psychol Serv. 2012;9(2):200-202.
7. Ohl M, Dillon D, Moeckli J, et al. Mixed-methods evaluation of a telehealth collaborative care program for persons with HIV infection in a rural setting. J Gen Intern Med. 2013;28(9):1165-1173.