User login
Evaluation of E-Consults in the VHA: Provider Perspectives
Electronic consultations (e-consults), also called e-referrals, are an alternative method of obtaining general patient information through the electronic health record (EHR) shared by primary care providers (PCPs) and specialists in the VHA. In the e-consult system, test results, medication lists, and other pertinent data are available.1 Many PCPs are willing to use new technologies to maximize practice efficiency and patient convenience.2 In the VHA’s hub-and-spoke model of care, e-consults have the potential to make delivery of specialty care more efficient by prearranging or completing necessary diagnostic testing and redirecting inappropriate referrals to the correct specialists.1
Some early studies of e-consults report better communication, improved referral appropriateness, and greater access to specialty care as well as better continuity of care and information transfer between patients and PCPs.3-5 Researchers at the VA Boston Healthcare System in Massachusetts found that 61% of specialists surveyed agreed that e-consults improve quality of care and found the approach beneficial to help initiate diagnostic testing prior to a face-to-face visit.6 However, researchers at the Michael E. DeBakey VAMC in Houston, Texas, found no improvement in care coordination.7 To date, there have been no large-scale evaluations of e-consult programs or assessments of implementation of e-consult programs.
Related: HHS Grants Fund Health IT in Communities
In early 2011, the VHA Office of Specialty Care Services (OSCS), Office of Specialty Care Transformation launched a national e-consult pilot as part of a broader effort to improve the delivery of patient-centered specialty care. This initiative was based on core concepts advanced by the American College of Physicians, which highlighted the importance of specialty care within a patient- centered medical home and provided a framework for collaboration.8,9 The goals of the e-consult program were to improve access to specialty care for veterans and their PCPs, to enhance the collaborative relationship between PCPs and specialists, and to augment PCP education.
The OSCS created an Electronic Consultation Implementation Guide to help sites develop and implement each of their e-consult programs.10 The Implementation Guide established operating rules, strategies for engaging key stakeholders, and recommendations for provider education and training.
As with face-to-face referrals, e-consults are organized in a hub-and-spoke model, where community-based outpatient clinics (CBOCs) are linked to a central VAMC. An e-consult can be accessed by any CBOC, VAMC, medical center-based primary care clinic or specialist, and between medical centers that share the same EHR. There were 217,014 completed e-consults between May 2011 and December 2013 across VHA.11
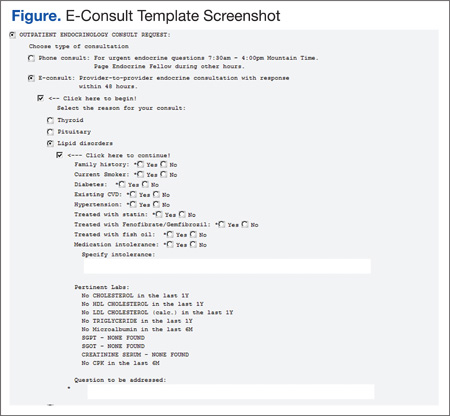
Some programs created an e-consult template to aid in the transition to electronic referrals (Figure). Although not mandatory, the template helped organize needed information to expedite the e-consult.
The objective of this evaluation is to describe the implementation of e-consults from the perspectives of PCPs, specialists, and other key staff involved in the pilot. Key findings were related to: (1) how the e-consult pilot was implemented; (2) how implementation of the e-consult pilot affected providers; and (3) to what extent the e-consult pilot achieved programmatic objectives from the provider’s perspective.
Methods
The authors conducted a key informant analysis with 2 waves of interviews at 8 e-consult pilot sites across the U.S., selected for variation on early progress in implementation. The sites cannot be identified based on an agreement with the VA Office of Labor-Management Relations.
Setting
The e-consult pilot involved 15 VAMCs in 2 cohorts: alpha sites, which began using e-consults in May 2011, and beta sites, which began using e-consults in July 2011. The alpha sites included 10 VAMCs in 12 medical specialties, with a total of 21 facility-specialty combinations. For the evaluation, sites were defined based on specialty, regardless of location within the same medical center (eg, cardiology and diabetes at the same VAMC would be 2 sites). Beta sites included 5 VAMCs with 6 medical specialties for a total of 6 sites. For 1 year, alpha sites received $175,000 and beta sites received $150,000 to support start-up activities.
Initial specialties included diabetes, hepatitis C, geriatrics, cardiology, liver transplant, dementia, gastrointestinal disease, pulmonary medicine, rheumatology, pain management, neurosurgery, infectious diseases, hematology/oncology, and vascular surgery. Facilities could add additional e-consult specialties but did not receive further funding.
Sample
Study participants were selected from 8 of the 15 pilot sites (geographic site/specialty combinations). Site selection was based on 2 measures of baseline e-consult implementation: (1) overall e-consult implementation rates, measured as the ratio of e-consults to all consults for the specialties of interest; and (2) CBOC participation, measured as the ratio of e-consults for patients from CBOCs vs e-consults for patients from primary care clinics located within the 152 VAMCs. Participation with CBOCs was important for ensuring that implementation factors that influenced uptake of e-consults within tertiary medical centers and between VAMCs and CBOCs could be identified. Two e-consult sites were randomly selected from each of the 4 resulting categories (VAMC high volume, VAMC low volume, CBOC high volume, and CBOC low volume). Volume data of e-consults were obtained from the VA Corporate Data Warehouse and assessed from the beginning of the pilot period to initial site selection, May 2011 to February 2012.
Respondents were identified using a modified snowball sampling process. Snowball sampling is a qualitative sampling technique that identifies study participants, who then identify other potential participants to participate in the study. The researchers started with the local e-consult initiative lead and then contacted the directors of primary care and specialty care services for help identifying PCPs, specialists, and support staff (nurse practitioners, pharmacists, program managers, informatics staff, and medical support personnel) engaged in the initiative. The goal for follow-up interviews was to interview at least 2 of the following respondents at each site: e-consult project manager, PCP, and/or specialist. Due to turnover and changes in clinic roles, some follow-up interviews were conducted with different individuals from the baseline interviews.
Data Collection
Interviews followed semistructured interview guidelines and included open-ended questions designed to elicit rich responses to a variety of aspects related to e-consult implementation, including patient needs, communication, leadership, resources, priorities, knowledge about the program, and unintended consequences. Follow-up interviews addressed how e-consults impacted the quality of specialty care; the impact of e-consults on Patient Aligned Care Teams (PACTs), the VHA patient-centered medical home initiative for primary care; and how e-consults have been used, eg, whether patients were involved in the decision to seek an e-consult.
Two interviewers who had participated in a 1-day, in-person training covering both data collection and analyzing key informant data conducted the 40 to 60 minute telephone interviews. One team member conducted the interview while the other took field notes. Interviews were also recorded. Follow-up probes were used to elicit specific examples and ensure sufficiently rich data. Following each interview, the notetaker reviewed the audio recording and filled in details in the field notes. The interview team debriefed and reviewed the augmented field notes and audio recordings, which became the primary data sources for the study.
Analysis
This was a qualitative descriptive analysis.12 Interview data were analyzed using an iterative, inductive content analysis method using an open coding approach (ie, a priori codes were not defined for this portion of the analysis).13 Two members of the research team used audio recordings and summary transcripts simultaneously to code data. Summary transcripts were compared with the recorded interviews to assure fidelity.
The researchers used Atlas.ti (Berlin, Germany) qualitative data analysis software to organize the coding process. Emergent codes were iteratively added throughout the analysis to reflect quotations that did not adequately fit previously developed codes. Codes were combined weekly to biweekly. After the combinations were completed, the analytics team met to review meanings of codes to ensure consistency of coding and interpretations.
To create categories, broad themes were identified from interview responses and grouped under high- order headings that described distinct aspects of participant experience. The analysis was intentionally kept close to the original data to reflect and describe the participant’s experience as accurately as possible. In support of analytical rigor, members of the multidisciplinary research team, composed of clinicians, implementation scientists, and mixed methodologists, reviewed findings to assess their thoroughness, comprehensiveness, and representativeness across roles and participating sites.14
Results
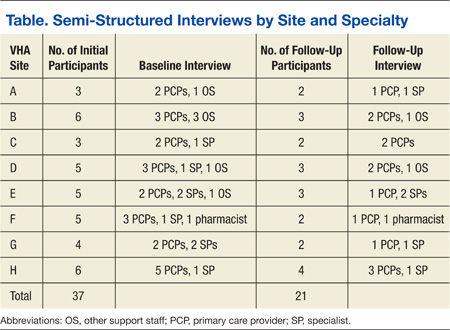
The e-consult evaluation period was from November 1, 2011, to July 31, 2013. Key conclusions were drawn from both alpha and beta sites (Table). Baseline interviews were conducted with 37 participants at 8 sites from April 10, 2012, to August 6, 2012. Follow-up interviews were conducted with 21 of the 37 participants at the 8 sites. Follow-up interviews with either a PCP or specialist could not be scheduled at 1 site. Follow-up interviews were conducted from April 16, 2013, to June 18, 2013. Open coding continued until saturation (the point at which subsequent data failed to produce new findings).15 This occurred after analysis of 22 baseline interviews (12 PCPs, 6 specialists, 1 pharmacist, and 4 other staff members) and 17 follow-up interviews (10 PCPs, 4 specialists, 1 pharmacist, and 2 other staff members).
Implementation
The e-consults provided a programmatic structure to the more informal practice of obtaining diagnostic or therapeutic advice from a specialist. Several of the specialists interviewed described having previously used existing informal consult processes that were “like e-consult.” These specialists reported that their practice patterns did not change significantly since implementing e-consults, because they have been “using the Computerized Patient Record System (CPRS) in an e-consult way for many years.” In these cases, the primary change resulting from the initiative was that national VHA workload policy was revised so that e-consults were assigned a CPT (Current Procedural Terminology) code and specialists began receiving workload credit for completing e-consults.
At sites where an informal e-consult practice was already in place, the initiative was consistently described as flexible. Many specialists reported that this degree of flexibility allowed them to make a relatively easy transition to e-consults by adopting new mechanisms to support existing processes. The e-consult initiative also allowed specialists to formally document this work and to increase the efficiency of specialty care.
Specialists drove the implementation process across sites. The e-consults were envisioned as a collaborative process; however, during initial interviews, few specialists mentioned PCPs when describing the development and implementation of the e-consult program. Primary care providers also reported having little awareness of or input into how the initiative was implemented, although this had little consequence on the use of e-consults.
In a rare case, a PCP reported that poorly designed, lengthy e-consult templates were a major barrier to using e-consults for specific specialties. The PCP said, “E-consults have created an elaborate but extraordinarily cumbersome tool that is difficult for PCPs to actually accomplish, because you have a consult menu that requires a lot of data to be entered—a lot of history from the chart, a lot of exam findings, a lot of previous cognitive testing scores; neurologic findings—lab and imaging tests.”
Still, many other PCPs described receiving detailed information and guidance from e-consults. “E-consults help me to be more accurate. Many providers don’t have a comfort with pain management. To get guidance and education and to really hold our hand, this is how to do this…this has been a big change. If they give you a great response, then [for] the next patient [with that condition], you go back to that note and then follow what was said there,” said one PCP.
In follow-up interviews, providers and other key staff stated there were more data available on the patient as a result of the e-consult and, consequently, even when specialists determined that a patient needed an in-person visit, the data obtained in the e-consult improved the quality of the in-person consultation.
Enhanced Communication and Collaboration
Neither the PCPs nor the specialists were aware of the collaborative intent of the initiative. They focused, instead, on other key aims, such as increasing accessibility and minimizing unnecessary patient travel. Most participants were generally positive about e-consults during baseline interviews, and this perception increased over time.
Both the PCPs and the specialists reported improved communication following the launch of e-consults. In follow-up interviews, some PCPs reported that before e-consults, they had trouble getting timely responses from specialists unless they knew them personally. “You had to know the person in the old days,” one respondent said. “After e-consults, responses improved…e-consult is available to have the resources to tap that knowledge base, and the team is answering the question. I think it opens up access and information and knowledge to everybody.”
Many PCPs spoke positively about this new communication tool as an opportunity to learn from specialists and said they valued the input they received. They felt the increased interaction between the 2 groups positively benefited patient care. One example cited that collaborative communication improved care coordination for veterans: “We are able to step in with e-consults to coordinate services, and this has been huge in improving care.”
Furthermore, follow-up interviews found that all participating PCPs and specialists were communicating more frequently and effectively. “Services that have embraced e-consult give a lot of great information flowing back; it’s closer to a real-time conversation,” said one respondent.
Related: Home-Based Video Telehealth for Veterans With Dementia
In baseline interviews, some specialists described how e-consults went against their belief that patient care is synonymous with face-to-face medical treatment and voiced dissatisfaction with e-consults as “sitting in front of a computer” rather than “seeing patients.” Others were concerned that medical center administration would not recognize the time it takes to conduct an e-consult and therefore not add necessary specialists staff. “E-consults take work and time, just like seeing a patient. I worry that won’t be seen,” one specialist said.
In order to successfully implement the e-consult initiative, providers and staff needed to incorporate new processes into their daily workflow.
Most sites did not develop a mechanism in which specialists received feedback regarding the outcome of their consultations. This lack of response created anxiety for some specialists in the absence of the face-to-face encounter, leaving some wondering whether they or the PCP had missed anything. According to one specialist, “That’s always in the back of your head: ‘Have I [the specialist] missed something?’”
In follow-up interviews, none of these concerns were raised. Primary care providers tended to speak of the care provided by specialists through e-consults in very positive terms, except in those instances where PCPs felt the e-consult template was difficult to use and required too much time to complete. “I was worried in the beginning about patients thinking less of me, but we ask for help all the time. We’re asking for help and not inconveniencing the patient; they seem to like it very much,” one PCP said.
The e-consults also complement PACTs. Initially, a few participants described soliciting patient input regarding the choice to have an e-consult or a face-to-face visit. During follow-up interviews, participants highlighted how well e-consults fit in to the PACT philosophy. One participant said, “The PACT team seeks to improve quality of care. E-consult fits very well with this, because answers to questions can come quickly, and the veteran may not need to come back to the clinic to be seen, even though things are still getting accomplished. E-consult works very well. E-consults were credited with improving access to specialty care as a tool for PACT.”
Achieving Program Objectives
Based on interviews, support for the e-consult program has increased over time as providers have gained experience with the program and have seen its benefits. Respondents at all sites consistently supported the concept of e-consults and expressed their belief in the importance and value of e-consults in improving patient-c entered care, primarily by reducing the need for patients to travel to see specialists, reducing the time to obtain feedback from specialists, and maintaining the provision of high quality care.
“Last year we only had 2 clinics categorized as e-consults. As of now we have 14 e-consults available for our providers. I think the numbers are growing. They are realizing the value of e-consults as far as the provider’s needs being met,” said one respondent.
The e-consults were credited with improving access to specialty care for veterans. Several participants stated that e-consults improved access to specialty care services and decreased travel for veterans. “It’s another way of getting care to the patient when the patient needs it without having to wait,” said one respondent.
Many PCPs described how difficult it was for patients to get to specialty appointments—particularly for their elderly, disabled, and rural patients—before the implementation of e-consults. “I like the fact that patients who live very far don’t have to come back. A lot of our patients are older…diabetic, see me Monday and back on Thursday. Now, they are able to stay home and follow the recommendations I write,” said one PCP.
Most providers were of the opinion that patients liked the program. “I think e-consults are helping patients...It’s been very successful regarding decreasing travel…Quicker response time for specialty care,” said a PCP. Several providers also stated in follow-up interviews that there was a greater degree of patient participation in the e-consult process and that “patients are definitely informed.”
Discussion
Most PCPs reported that the e-consults were an effective means of consultation and contained the information they needed to provide high-quality coordinated care. Most also found e-consult templates easy to complete. A majority of PCPs felt sufficient control over the choice of whether to use e-consults or an in-person visit, and a minority of patients were involved in the decision to receive an e-consult. Although the OSCS outlined guiding principles and operational rules in the Implementation Guide to help sites implement the e-consult program, its contribution was limited. Few examples were found that engaged PCPs in development of the e-consult program locally; involving patients in the decision to obtain a specialty consult electronically or in person; and PCPs feeding back results to specialists.
Implementing e-consults posed a number of challenges, including lack of resources to respond to referral requests, lack of referral policies and standardized procedures, and confusion related to roles and responsibilities. This is consistent with findings from another VHA research project of e-consults in 2 VHA health systems that was conducted prior to this national level e-consult pilot.7
Related: Using Facilitative Coaching to Support Patient Aligned Care Teams
Communication by OSCS of key aspects of the e-consult initiative will be critical as more sites implement e-consults. Since initiation of this pilot, workload specifications and credit have changed from 1 code to 3 codes, to more accurately reflect the amount of time a specialist consultant spends reviewing the EHR and responding to the consult. Without seeing the patient directly, specialists are more reliant on the PCP to describe the problem and provide adequate information in the e-consult request in order to provide recommendations back to the PCP.
Primary care physicians need to know that e-consults are available and determine when they are appropriate. A template or other guidance may be helpful to ensure adequate information is provided in the e-consult request; and the information provided by the specialist in response to the e-consult has to be sufficient for the PCP to provide care. VHA continues to expand the use of e-consults throughout the system, as this pilot found that the electronic option was often more timely than were face-to-face consultations. The result of this evaluation has informed national implementation of this effort.
Limitations
There are 3 main limitations to this study. First, because there was no practical way to preidentify participants who participated in implementing e-consults, a modified snowball sampling was used. However, this limited the degree to which the group was representative of the pilot participants. Second, the authors reported findings from a real-world initiative, not an experimental study. As such, not all participants in the first wave of key informant interviews were available for follow-up interview, which may have introduced bias. Third, the VHA is unlike most of the rest of the U.S. health care system in that it is a fully integrated system with salaried PCPs and specialists and an EHR.
Generalizability of the study may be limited, as a modified snowball sampling approach is not entirely random and has potential for community bias, because initial participants influence subsequent sampling. Additionally, though the sample size (n = 37) was sufficient for qualitative, in-depth analysis, it may be too small for confident generalization of findings. However, as health care moves toward an accountable care organization system, the authors’ analysis may provide insights.
Issues include revision of reimbursement policy for e-consults and developing or coordinating informational technology infrastructures to permit e-consults. It is also important to note that this evaluation reports solely on the extent of implementation of e-consults and the effects of e-consult implementation from the perspectives of staff, including specialists and PCPs.
Evaluating the effectiveness of the program in improving access, care coordination, and patient satisfaction was beyond the scope of the study. Further research is needed, because findings on those outcomes are critical for drawing inferences about this study’s implementation results.
Conclusion
The assessment of the e-consult system by providers and staff was based on a perception that e-consults are a valuable tool in providing greater access to quality care. Currently, e-consults have been expanded across VHA in medical and surgical specialties. VHA policymakers have drafted field guidance and a communication plan to support these efforts.
Acknowledgement
This material is based on work supported by the VA Office of Specialty Care Transformation, the office overseeing the e-consult initiative, and the Office of Research and Development Quality Enhancement Research Initiative.
Author disclosures
The authors report no actual or potential conflicts of interest with regard to this article.
Disclaimer
The opinions expressed herein are those of the authors and do not necessarily reflect those of Federal Practitioner, Frontline Medical Communications Inc., the U.S. Government, or any of its agencies. This article may discuss unlabeled or investigational use of certain drugs. Please review the complete prescribing information for specific drugs or drug combinations—including indications, contraindications, warnings, and adverse effects—before administering pharmacologic therapy to patients.
1. Chen AH, Murphy EJ, Yee HF Jr. eReferral—a new model for integrated care. N Engl J Med. 2013;368(26):2450-2453.
2. Hanna L, May C, Fairhurst K. The place of information and communication technology-mediated consultations in primary care: GPs’ perspectives. Fam Pract. 2012;29(3):361-366.
3. Kim-Hwang JE, Chen AH, Bell DS, Guzman D, Yee HF Jr, Kushel MB. Evaluating electronic referrals for specialty care at a public hospital. J Gen Intern Med. 2010;25(10):1123-1128.
4. Straus SG, Chen AH, Yee HF Jr, Kushel MB, Bell DS. Implementation of an electronic referral system for outpatient specialty care. AMIA Annu Symp Proc. 2011;2011:1337-1346.
5. Horner K, Wagner E, Tufano J. Electronic consultations between primary and specialty care clinicians: early insights. Issue Brief (Commonw Fund). 2011;23:1-14.
6. McAdams M, Cannavo L, Orlander JD. A medical specialty e-consult program in a VA health care system. Fed Pract. 2014;31(5):26-31.
7. Hysong SJ, Esquivel A, Sittig DF, et al. Towards successful coordination of electronic health record based-referrals: a qualitative analysis. Implement Sci. 2011;6:84.
8. American College of Physicians. The Patient- Centered Medical Home Neighbor: The Interface of the Patient-Centered Medical Home with Specialty/Subspecialty Practices. Philadelphia, PA: American College of Physicians; 2010. Policy paper.
9. Fisher ES. Building a medical neighborhood for the medical home. N Engl J Med. 2008;359(12): 1202-1205.
10. Department of Veterans Affairs. Electronic Consultation (E-Consult) Implementation Guide, Version 1.2. Washington, DC: Department of Veterans Affairs, Office of Specialty Care Services, Specialty Care Transformation. 2013.
11. Kirsh S, Cary E, Aron DC et al. Results of a national pilot project for specialty care e-consultation in primary care medical homes: the impact of specialty e-consultation on access. Am J Manag Care. In press.
12. Sandelowski M. Whatever happened to qualitative description? Res Nurs Health. 2000;23(4):334-340.
13. Elo S, Kyngäs H. The qualitative content analysis process. J Adv Nurs. 2008;62(1):107-115.
14. Giacomini MK, Cook DJ. Users’ guides to the medical literature: XXIII. Qualitative research in health care A. Are the results of the study valid? Evidence-Based Medicine Working Group. JAMA. 2000;284(3):357-362.
15. Sandelowski M. The problem of rigor in qualitative research. ANS Adv Nurs Sci. 1986;8(3):27-37.
Electronic consultations (e-consults), also called e-referrals, are an alternative method of obtaining general patient information through the electronic health record (EHR) shared by primary care providers (PCPs) and specialists in the VHA. In the e-consult system, test results, medication lists, and other pertinent data are available.1 Many PCPs are willing to use new technologies to maximize practice efficiency and patient convenience.2 In the VHA’s hub-and-spoke model of care, e-consults have the potential to make delivery of specialty care more efficient by prearranging or completing necessary diagnostic testing and redirecting inappropriate referrals to the correct specialists.1
Some early studies of e-consults report better communication, improved referral appropriateness, and greater access to specialty care as well as better continuity of care and information transfer between patients and PCPs.3-5 Researchers at the VA Boston Healthcare System in Massachusetts found that 61% of specialists surveyed agreed that e-consults improve quality of care and found the approach beneficial to help initiate diagnostic testing prior to a face-to-face visit.6 However, researchers at the Michael E. DeBakey VAMC in Houston, Texas, found no improvement in care coordination.7 To date, there have been no large-scale evaluations of e-consult programs or assessments of implementation of e-consult programs.
Related: HHS Grants Fund Health IT in Communities
In early 2011, the VHA Office of Specialty Care Services (OSCS), Office of Specialty Care Transformation launched a national e-consult pilot as part of a broader effort to improve the delivery of patient-centered specialty care. This initiative was based on core concepts advanced by the American College of Physicians, which highlighted the importance of specialty care within a patient- centered medical home and provided a framework for collaboration.8,9 The goals of the e-consult program were to improve access to specialty care for veterans and their PCPs, to enhance the collaborative relationship between PCPs and specialists, and to augment PCP education.
The OSCS created an Electronic Consultation Implementation Guide to help sites develop and implement each of their e-consult programs.10 The Implementation Guide established operating rules, strategies for engaging key stakeholders, and recommendations for provider education and training.
As with face-to-face referrals, e-consults are organized in a hub-and-spoke model, where community-based outpatient clinics (CBOCs) are linked to a central VAMC. An e-consult can be accessed by any CBOC, VAMC, medical center-based primary care clinic or specialist, and between medical centers that share the same EHR. There were 217,014 completed e-consults between May 2011 and December 2013 across VHA.11
Some programs created an e-consult template to aid in the transition to electronic referrals (Figure). Although not mandatory, the template helped organize needed information to expedite the e-consult.
The objective of this evaluation is to describe the implementation of e-consults from the perspectives of PCPs, specialists, and other key staff involved in the pilot. Key findings were related to: (1) how the e-consult pilot was implemented; (2) how implementation of the e-consult pilot affected providers; and (3) to what extent the e-consult pilot achieved programmatic objectives from the provider’s perspective.
Methods
The authors conducted a key informant analysis with 2 waves of interviews at 8 e-consult pilot sites across the U.S., selected for variation on early progress in implementation. The sites cannot be identified based on an agreement with the VA Office of Labor-Management Relations.
Setting
The e-consult pilot involved 15 VAMCs in 2 cohorts: alpha sites, which began using e-consults in May 2011, and beta sites, which began using e-consults in July 2011. The alpha sites included 10 VAMCs in 12 medical specialties, with a total of 21 facility-specialty combinations. For the evaluation, sites were defined based on specialty, regardless of location within the same medical center (eg, cardiology and diabetes at the same VAMC would be 2 sites). Beta sites included 5 VAMCs with 6 medical specialties for a total of 6 sites. For 1 year, alpha sites received $175,000 and beta sites received $150,000 to support start-up activities.
Initial specialties included diabetes, hepatitis C, geriatrics, cardiology, liver transplant, dementia, gastrointestinal disease, pulmonary medicine, rheumatology, pain management, neurosurgery, infectious diseases, hematology/oncology, and vascular surgery. Facilities could add additional e-consult specialties but did not receive further funding.
Sample
Study participants were selected from 8 of the 15 pilot sites (geographic site/specialty combinations). Site selection was based on 2 measures of baseline e-consult implementation: (1) overall e-consult implementation rates, measured as the ratio of e-consults to all consults for the specialties of interest; and (2) CBOC participation, measured as the ratio of e-consults for patients from CBOCs vs e-consults for patients from primary care clinics located within the 152 VAMCs. Participation with CBOCs was important for ensuring that implementation factors that influenced uptake of e-consults within tertiary medical centers and between VAMCs and CBOCs could be identified. Two e-consult sites were randomly selected from each of the 4 resulting categories (VAMC high volume, VAMC low volume, CBOC high volume, and CBOC low volume). Volume data of e-consults were obtained from the VA Corporate Data Warehouse and assessed from the beginning of the pilot period to initial site selection, May 2011 to February 2012.
Respondents were identified using a modified snowball sampling process. Snowball sampling is a qualitative sampling technique that identifies study participants, who then identify other potential participants to participate in the study. The researchers started with the local e-consult initiative lead and then contacted the directors of primary care and specialty care services for help identifying PCPs, specialists, and support staff (nurse practitioners, pharmacists, program managers, informatics staff, and medical support personnel) engaged in the initiative. The goal for follow-up interviews was to interview at least 2 of the following respondents at each site: e-consult project manager, PCP, and/or specialist. Due to turnover and changes in clinic roles, some follow-up interviews were conducted with different individuals from the baseline interviews.
Data Collection
Interviews followed semistructured interview guidelines and included open-ended questions designed to elicit rich responses to a variety of aspects related to e-consult implementation, including patient needs, communication, leadership, resources, priorities, knowledge about the program, and unintended consequences. Follow-up interviews addressed how e-consults impacted the quality of specialty care; the impact of e-consults on Patient Aligned Care Teams (PACTs), the VHA patient-centered medical home initiative for primary care; and how e-consults have been used, eg, whether patients were involved in the decision to seek an e-consult.
Two interviewers who had participated in a 1-day, in-person training covering both data collection and analyzing key informant data conducted the 40 to 60 minute telephone interviews. One team member conducted the interview while the other took field notes. Interviews were also recorded. Follow-up probes were used to elicit specific examples and ensure sufficiently rich data. Following each interview, the notetaker reviewed the audio recording and filled in details in the field notes. The interview team debriefed and reviewed the augmented field notes and audio recordings, which became the primary data sources for the study.
Analysis
This was a qualitative descriptive analysis.12 Interview data were analyzed using an iterative, inductive content analysis method using an open coding approach (ie, a priori codes were not defined for this portion of the analysis).13 Two members of the research team used audio recordings and summary transcripts simultaneously to code data. Summary transcripts were compared with the recorded interviews to assure fidelity.
The researchers used Atlas.ti (Berlin, Germany) qualitative data analysis software to organize the coding process. Emergent codes were iteratively added throughout the analysis to reflect quotations that did not adequately fit previously developed codes. Codes were combined weekly to biweekly. After the combinations were completed, the analytics team met to review meanings of codes to ensure consistency of coding and interpretations.
To create categories, broad themes were identified from interview responses and grouped under high- order headings that described distinct aspects of participant experience. The analysis was intentionally kept close to the original data to reflect and describe the participant’s experience as accurately as possible. In support of analytical rigor, members of the multidisciplinary research team, composed of clinicians, implementation scientists, and mixed methodologists, reviewed findings to assess their thoroughness, comprehensiveness, and representativeness across roles and participating sites.14
Results
The e-consult evaluation period was from November 1, 2011, to July 31, 2013. Key conclusions were drawn from both alpha and beta sites (Table). Baseline interviews were conducted with 37 participants at 8 sites from April 10, 2012, to August 6, 2012. Follow-up interviews were conducted with 21 of the 37 participants at the 8 sites. Follow-up interviews with either a PCP or specialist could not be scheduled at 1 site. Follow-up interviews were conducted from April 16, 2013, to June 18, 2013. Open coding continued until saturation (the point at which subsequent data failed to produce new findings).15 This occurred after analysis of 22 baseline interviews (12 PCPs, 6 specialists, 1 pharmacist, and 4 other staff members) and 17 follow-up interviews (10 PCPs, 4 specialists, 1 pharmacist, and 2 other staff members).
Implementation
The e-consults provided a programmatic structure to the more informal practice of obtaining diagnostic or therapeutic advice from a specialist. Several of the specialists interviewed described having previously used existing informal consult processes that were “like e-consult.” These specialists reported that their practice patterns did not change significantly since implementing e-consults, because they have been “using the Computerized Patient Record System (CPRS) in an e-consult way for many years.” In these cases, the primary change resulting from the initiative was that national VHA workload policy was revised so that e-consults were assigned a CPT (Current Procedural Terminology) code and specialists began receiving workload credit for completing e-consults.
At sites where an informal e-consult practice was already in place, the initiative was consistently described as flexible. Many specialists reported that this degree of flexibility allowed them to make a relatively easy transition to e-consults by adopting new mechanisms to support existing processes. The e-consult initiative also allowed specialists to formally document this work and to increase the efficiency of specialty care.
Specialists drove the implementation process across sites. The e-consults were envisioned as a collaborative process; however, during initial interviews, few specialists mentioned PCPs when describing the development and implementation of the e-consult program. Primary care providers also reported having little awareness of or input into how the initiative was implemented, although this had little consequence on the use of e-consults.
In a rare case, a PCP reported that poorly designed, lengthy e-consult templates were a major barrier to using e-consults for specific specialties. The PCP said, “E-consults have created an elaborate but extraordinarily cumbersome tool that is difficult for PCPs to actually accomplish, because you have a consult menu that requires a lot of data to be entered—a lot of history from the chart, a lot of exam findings, a lot of previous cognitive testing scores; neurologic findings—lab and imaging tests.”
Still, many other PCPs described receiving detailed information and guidance from e-consults. “E-consults help me to be more accurate. Many providers don’t have a comfort with pain management. To get guidance and education and to really hold our hand, this is how to do this…this has been a big change. If they give you a great response, then [for] the next patient [with that condition], you go back to that note and then follow what was said there,” said one PCP.
In follow-up interviews, providers and other key staff stated there were more data available on the patient as a result of the e-consult and, consequently, even when specialists determined that a patient needed an in-person visit, the data obtained in the e-consult improved the quality of the in-person consultation.
Enhanced Communication and Collaboration
Neither the PCPs nor the specialists were aware of the collaborative intent of the initiative. They focused, instead, on other key aims, such as increasing accessibility and minimizing unnecessary patient travel. Most participants were generally positive about e-consults during baseline interviews, and this perception increased over time.
Both the PCPs and the specialists reported improved communication following the launch of e-consults. In follow-up interviews, some PCPs reported that before e-consults, they had trouble getting timely responses from specialists unless they knew them personally. “You had to know the person in the old days,” one respondent said. “After e-consults, responses improved…e-consult is available to have the resources to tap that knowledge base, and the team is answering the question. I think it opens up access and information and knowledge to everybody.”
Many PCPs spoke positively about this new communication tool as an opportunity to learn from specialists and said they valued the input they received. They felt the increased interaction between the 2 groups positively benefited patient care. One example cited that collaborative communication improved care coordination for veterans: “We are able to step in with e-consults to coordinate services, and this has been huge in improving care.”
Furthermore, follow-up interviews found that all participating PCPs and specialists were communicating more frequently and effectively. “Services that have embraced e-consult give a lot of great information flowing back; it’s closer to a real-time conversation,” said one respondent.
Related: Home-Based Video Telehealth for Veterans With Dementia
In baseline interviews, some specialists described how e-consults went against their belief that patient care is synonymous with face-to-face medical treatment and voiced dissatisfaction with e-consults as “sitting in front of a computer” rather than “seeing patients.” Others were concerned that medical center administration would not recognize the time it takes to conduct an e-consult and therefore not add necessary specialists staff. “E-consults take work and time, just like seeing a patient. I worry that won’t be seen,” one specialist said.
In order to successfully implement the e-consult initiative, providers and staff needed to incorporate new processes into their daily workflow.
Most sites did not develop a mechanism in which specialists received feedback regarding the outcome of their consultations. This lack of response created anxiety for some specialists in the absence of the face-to-face encounter, leaving some wondering whether they or the PCP had missed anything. According to one specialist, “That’s always in the back of your head: ‘Have I [the specialist] missed something?’”
In follow-up interviews, none of these concerns were raised. Primary care providers tended to speak of the care provided by specialists through e-consults in very positive terms, except in those instances where PCPs felt the e-consult template was difficult to use and required too much time to complete. “I was worried in the beginning about patients thinking less of me, but we ask for help all the time. We’re asking for help and not inconveniencing the patient; they seem to like it very much,” one PCP said.
The e-consults also complement PACTs. Initially, a few participants described soliciting patient input regarding the choice to have an e-consult or a face-to-face visit. During follow-up interviews, participants highlighted how well e-consults fit in to the PACT philosophy. One participant said, “The PACT team seeks to improve quality of care. E-consult fits very well with this, because answers to questions can come quickly, and the veteran may not need to come back to the clinic to be seen, even though things are still getting accomplished. E-consult works very well. E-consults were credited with improving access to specialty care as a tool for PACT.”
Achieving Program Objectives
Based on interviews, support for the e-consult program has increased over time as providers have gained experience with the program and have seen its benefits. Respondents at all sites consistently supported the concept of e-consults and expressed their belief in the importance and value of e-consults in improving patient-c entered care, primarily by reducing the need for patients to travel to see specialists, reducing the time to obtain feedback from specialists, and maintaining the provision of high quality care.
“Last year we only had 2 clinics categorized as e-consults. As of now we have 14 e-consults available for our providers. I think the numbers are growing. They are realizing the value of e-consults as far as the provider’s needs being met,” said one respondent.
The e-consults were credited with improving access to specialty care for veterans. Several participants stated that e-consults improved access to specialty care services and decreased travel for veterans. “It’s another way of getting care to the patient when the patient needs it without having to wait,” said one respondent.
Many PCPs described how difficult it was for patients to get to specialty appointments—particularly for their elderly, disabled, and rural patients—before the implementation of e-consults. “I like the fact that patients who live very far don’t have to come back. A lot of our patients are older…diabetic, see me Monday and back on Thursday. Now, they are able to stay home and follow the recommendations I write,” said one PCP.
Most providers were of the opinion that patients liked the program. “I think e-consults are helping patients...It’s been very successful regarding decreasing travel…Quicker response time for specialty care,” said a PCP. Several providers also stated in follow-up interviews that there was a greater degree of patient participation in the e-consult process and that “patients are definitely informed.”
Discussion
Most PCPs reported that the e-consults were an effective means of consultation and contained the information they needed to provide high-quality coordinated care. Most also found e-consult templates easy to complete. A majority of PCPs felt sufficient control over the choice of whether to use e-consults or an in-person visit, and a minority of patients were involved in the decision to receive an e-consult. Although the OSCS outlined guiding principles and operational rules in the Implementation Guide to help sites implement the e-consult program, its contribution was limited. Few examples were found that engaged PCPs in development of the e-consult program locally; involving patients in the decision to obtain a specialty consult electronically or in person; and PCPs feeding back results to specialists.
Implementing e-consults posed a number of challenges, including lack of resources to respond to referral requests, lack of referral policies and standardized procedures, and confusion related to roles and responsibilities. This is consistent with findings from another VHA research project of e-consults in 2 VHA health systems that was conducted prior to this national level e-consult pilot.7
Related: Using Facilitative Coaching to Support Patient Aligned Care Teams
Communication by OSCS of key aspects of the e-consult initiative will be critical as more sites implement e-consults. Since initiation of this pilot, workload specifications and credit have changed from 1 code to 3 codes, to more accurately reflect the amount of time a specialist consultant spends reviewing the EHR and responding to the consult. Without seeing the patient directly, specialists are more reliant on the PCP to describe the problem and provide adequate information in the e-consult request in order to provide recommendations back to the PCP.
Primary care physicians need to know that e-consults are available and determine when they are appropriate. A template or other guidance may be helpful to ensure adequate information is provided in the e-consult request; and the information provided by the specialist in response to the e-consult has to be sufficient for the PCP to provide care. VHA continues to expand the use of e-consults throughout the system, as this pilot found that the electronic option was often more timely than were face-to-face consultations. The result of this evaluation has informed national implementation of this effort.
Limitations
There are 3 main limitations to this study. First, because there was no practical way to preidentify participants who participated in implementing e-consults, a modified snowball sampling was used. However, this limited the degree to which the group was representative of the pilot participants. Second, the authors reported findings from a real-world initiative, not an experimental study. As such, not all participants in the first wave of key informant interviews were available for follow-up interview, which may have introduced bias. Third, the VHA is unlike most of the rest of the U.S. health care system in that it is a fully integrated system with salaried PCPs and specialists and an EHR.
Generalizability of the study may be limited, as a modified snowball sampling approach is not entirely random and has potential for community bias, because initial participants influence subsequent sampling. Additionally, though the sample size (n = 37) was sufficient for qualitative, in-depth analysis, it may be too small for confident generalization of findings. However, as health care moves toward an accountable care organization system, the authors’ analysis may provide insights.
Issues include revision of reimbursement policy for e-consults and developing or coordinating informational technology infrastructures to permit e-consults. It is also important to note that this evaluation reports solely on the extent of implementation of e-consults and the effects of e-consult implementation from the perspectives of staff, including specialists and PCPs.
Evaluating the effectiveness of the program in improving access, care coordination, and patient satisfaction was beyond the scope of the study. Further research is needed, because findings on those outcomes are critical for drawing inferences about this study’s implementation results.
Conclusion
The assessment of the e-consult system by providers and staff was based on a perception that e-consults are a valuable tool in providing greater access to quality care. Currently, e-consults have been expanded across VHA in medical and surgical specialties. VHA policymakers have drafted field guidance and a communication plan to support these efforts.
Acknowledgement
This material is based on work supported by the VA Office of Specialty Care Transformation, the office overseeing the e-consult initiative, and the Office of Research and Development Quality Enhancement Research Initiative.
Author disclosures
The authors report no actual or potential conflicts of interest with regard to this article.
Disclaimer
The opinions expressed herein are those of the authors and do not necessarily reflect those of Federal Practitioner, Frontline Medical Communications Inc., the U.S. Government, or any of its agencies. This article may discuss unlabeled or investigational use of certain drugs. Please review the complete prescribing information for specific drugs or drug combinations—including indications, contraindications, warnings, and adverse effects—before administering pharmacologic therapy to patients.
1. Chen AH, Murphy EJ, Yee HF Jr. eReferral—a new model for integrated care. N Engl J Med. 2013;368(26):2450-2453.
2. Hanna L, May C, Fairhurst K. The place of information and communication technology-mediated consultations in primary care: GPs’ perspectives. Fam Pract. 2012;29(3):361-366.
3. Kim-Hwang JE, Chen AH, Bell DS, Guzman D, Yee HF Jr, Kushel MB. Evaluating electronic referrals for specialty care at a public hospital. J Gen Intern Med. 2010;25(10):1123-1128.
4. Straus SG, Chen AH, Yee HF Jr, Kushel MB, Bell DS. Implementation of an electronic referral system for outpatient specialty care. AMIA Annu Symp Proc. 2011;2011:1337-1346.
5. Horner K, Wagner E, Tufano J. Electronic consultations between primary and specialty care clinicians: early insights. Issue Brief (Commonw Fund). 2011;23:1-14.
6. McAdams M, Cannavo L, Orlander JD. A medical specialty e-consult program in a VA health care system. Fed Pract. 2014;31(5):26-31.
7. Hysong SJ, Esquivel A, Sittig DF, et al. Towards successful coordination of electronic health record based-referrals: a qualitative analysis. Implement Sci. 2011;6:84.
8. American College of Physicians. The Patient- Centered Medical Home Neighbor: The Interface of the Patient-Centered Medical Home with Specialty/Subspecialty Practices. Philadelphia, PA: American College of Physicians; 2010. Policy paper.
9. Fisher ES. Building a medical neighborhood for the medical home. N Engl J Med. 2008;359(12): 1202-1205.
10. Department of Veterans Affairs. Electronic Consultation (E-Consult) Implementation Guide, Version 1.2. Washington, DC: Department of Veterans Affairs, Office of Specialty Care Services, Specialty Care Transformation. 2013.
11. Kirsh S, Cary E, Aron DC et al. Results of a national pilot project for specialty care e-consultation in primary care medical homes: the impact of specialty e-consultation on access. Am J Manag Care. In press.
12. Sandelowski M. Whatever happened to qualitative description? Res Nurs Health. 2000;23(4):334-340.
13. Elo S, Kyngäs H. The qualitative content analysis process. J Adv Nurs. 2008;62(1):107-115.
14. Giacomini MK, Cook DJ. Users’ guides to the medical literature: XXIII. Qualitative research in health care A. Are the results of the study valid? Evidence-Based Medicine Working Group. JAMA. 2000;284(3):357-362.
15. Sandelowski M. The problem of rigor in qualitative research. ANS Adv Nurs Sci. 1986;8(3):27-37.
Isotretinoin Treatment in Patients With Acne Vulgaris: Does It Impact Muscle Strength, Fatigue, and Endurance?
Isotretinoin is a vitamin A derivative that frequently is used in the treatment of acne vulgaris.1,2 Although isotretinoin generally is associated with favorable effects, adverse effects also have been reported.3-5 Musculoskeletal side effects can include myalgia, sacroiliitis, back pain, diffuse idiopathic skeletal hyperostosis, ligament and tendon calcifications, bone resorption, and reduced collagen synthesis.6,7 Elevated creatine kinase (CK) levels also have been reported in 15% to 50% of patients with isotretinoin-induced myalgia.8 However, there are limited data available on the effects of isotretinoin treatment on muscle strength. The objective of this study was to evaluate the impact of isotretinoin on muscle strength, fatigue, and endurance using an isokinetic dynamometer.
Methods
Study Design and Participants
The study followed a pretest-posttest design including 27 patients with acne vulgaris who were treated with oral isotretinoin (age range, 18–40 years) as well as 26 control patients for comparison. Exclusion criteria were renal or liver disease, uncontrolled hypertension, heart failure, malignancy, thyroid and bone disorders (eg, parathyroid disease, osteomalacia), use of drugs that can affect skeletal metabolism (eg, corticosteroids, heparin, anticonvulsants), and history of trauma to and/or surgery of the lower extremities. All patients were informed of the study procedure and informed consent was obtained. The study protocol was approved by the local ethics committee.
Data Collection
Participant demographics and clinical features (eg, sex, age, body mass index [BMI]) were obtained. Participants in the treatment group received oral isotretinoin 0.5 mg/kg once daily for 1 month, followed by an increased dose of 1 mg/kg once daily for 2 months. Isokinetic measurements of the knee muscles were performed on the nondominant side at baseline and at 3-month follow-up. Reports of muscular side effects were noted during the course of treatment.
Isokinetic Evaluation
A calibrated isokinetic dynamometer was used to conduct isokinetic evaluations. After performing 5 submaximal warm-up contractions, concentric peak torque (PT) values of the quadriceps and hamstrings at 60° and 180° per second angular velocities (AVs), hamstring strength to quadriceps strength ratio (H:Q ratio), and muscle fatigue were evaluated. The isokinetic test protocol included 10 repeats at 60° per second, 15 seconds of rest, and 15 repeats at 180° per second.
Statistical Analysis
Data analysis was conducted using SPSS software version 20.0. Data were expressed as mean (standard deviation [SD]). After checking normal distribution with the Kolmogorov-Smirnov test, independent t tests were used to compare the baseline parameters between the treatment and control groups. Paired t tests and Wilcoxon signed rank tests were used to compare baseline and posttreatment values where appropriate. The results were for those who completed treatment. Statistical significance was set at P<.05.
Results
Twenty-seven participants (24 female; 3 male) with newly diagnosed acne vulgaris were enrolled in the treatment group along with 26 controls (23 female; 3 male). One of the participants in the treatment group did not tolerate isotretinoin due to headache and was excluded from the study. The mean (SD) age of the participants was 20.6 (1.6) years for the treatment group and 21.3 (1.5) years for the control group, and the mean (SD) BMI for both groups was 21.8 (2.8) and 21.5 (1.8), respectively. Participant demographics and isokinetic values at baseline are presented in Table 1. No significant differences between the treatment and control groups for participant sex, age, or BMI were noted (P>.05).

Of the 26 participants in the treatment group, 5 reported myalgia and nonspecific back pain. Isokinetic measurements of the treatment group obtained using the dynamometer are shown in Table 2. Although the PT of the hamstring and quadriceps at both 60° and 180° per second AV was decreased at 3-month follow-up, there was no significant difference compared to baseline (P>.05). Additionally, no significant difference in H:Q ratio or muscle fatigue was noted (P>.05), and no significant difference in isokinetic measurements was seen in participants with myalgia (n=5) at 3-month follow-up versus baseline (P>.05).

Comment
This study aimed to investigate the short-term effects of isotretinoin treatment on muscle strength, fatigue, and endurance in patients with acne vulgaris, which has not been widely evaluated in the literature. Although maximal PT of the hamstring and quadriceps in the isotretinoin treatment group was decreased at 3-month follow-up, there was no statistically significant difference in all parameters (ie, PT at 60° and 180° per second, H:Q ratio, muscle fatigue) versus baseline. These findings showed that systemic isotretinoin was not associated with muscle dysfunction in this patient population.
Myalgia, particularly associated with exercise, has been seen in approximately 50% of patients treated with isotretinoin.6 Furthermore, Goulden et al9 reported that patients with higher CK levels might be at an increased risk for developing rhabdomyolysis in the setting of isotretinoin treatment. High CK levels indicate serious muscular cell damage and are usually associated with release of myoglobin from muscular cells.10 In the current study, 5 participants reported myalgia and nonspecific back pain at 3-month follow-up; however, no participants reported muscle weakness. Differences in the isokinetic measurements of participants with myalgia at baseline and at 3-month follow-up were not statistically significant.
Muscles mainly consist of type I (slow oxidative), type IIA (fast oxidative), and type IIB (fast glycolytic) muscle fibers. Type I fibers produce low force and high endurance, type IIB fibers produce high force and low endurance, and type IIA fibers fall in between the two. At low AVs (eg, 60° per second), only type II fibers contract. As the AV increases (eg, 180° per second), only type II fibers contract. Consequently, the observation of a decrease in the isokinetic test parameters at low or high AVs indicate the decrease in type I or type II contracting muscle fibers.11,12 In our study, the isokinetic values did not significantly change. As such, we concluded that isotretinoin treatment did not result in the reduction of muscle fibers in our patient population.
The H:Q ratio is the indicator of muscle balance and dynamic stabilization of the knee. It is calculated by dividing the PT of the hamstrings by the PT of the quadriceps in concentric motion.13 Additionally, muscle fatigue demonstrates the endurance of the contraction of type IIB fibers (anaerobic).14 In our study, isotretinoin treatment did not impact the H:Q ratio or muscle fatigue.
This study included a few important limitations. The sample size was small, particularly concerning the number of participants who reported myalgia. The lack of laboratory evaluations (eg, creatinine kinase) also was a limitation. Finally, the short study period limited the conclusions that could be drawn from the data.
Conclusion
Results from the current study revealed that systemic isotretinoin treatment did not alter muscle strength, fatigue, or endurance. Further studies taking into account histologic evaluations with larger sample sizes and long-term follow-up are needed.
1. Yıldızgören MT, Karatas Togral A, Baki AE, et al. Effects of isotretinoin treatment on cartilage and tendon thicknesses: an ultrasonographic study [published online ahead of print July 2, 2014]. Clin Rheumatol. doi:10.1007/s10067-014-2733-9.
2. Karatas Togral A, Yıldızgören MT, Mustu Koryürek Ö, et al. Can isotretinoin induce SAPHO syndrome? West Indian Med J. In press.
3. Yıldızgören MT, Ekiz T, Karatas Togral A. Bilateral sacroiliitis induced by systemic isotretinoin treatment. West Indian Med J. In press.
4. Chapman MS. Vitamin A: history, current uses, and controversies. Semin Cutan Med Surg. 2012;31:11-16.
5. Blasiak RC, Stamey CR, Burkhart CN, et al. High-dose isotretinoin treatment and the rate of retrial, relapse, and adverse effects in patients with acne vulgaris. JAMA Dermatol. 2013;149:1392.
6. Penniston KL, Tanumihardjo SA. The acute and chronic toxic effects of vitamin A. Am J Clin Nutr. 2006;83:191-201.
7. DiGiovanna JJ. Isotretinoin effects on bone. J Am Acad Dermatol. 2001;45:S176-S182.
8. Heudes AM, Laroche L. Muscular damage during isotretinoin treatment. Ann Dermatol Venereol. 1998;125:94-97.
9. Goulden V, Layton AM, Cunliffe WJ. Long term safety of isotretinoin as a treatment for acne vulgaris. Br J Dermatol. 1994;131:360-363.
10. Fiallo P, Tagliapietra AG. Severe acute myopathy induced by isotretinoin. Arch Dermatol. 1996;132:1521-1522.
11. Impellizzeri FM, Bizzini M, Rampinini E, et al. Reliability of isokinetic strength imbalance ratios measured using the Cybex NORM dynamometer.
Clin Physiol Funct Imaging. 2008;28:113-119.
12. Brown LE. Isokinetics in Human Performance. Champaign, IL: Human Kinetics; 2000.
13. Alangari AS, Al-Hazzaa HM. Normal isometric and isokinetic peak torques of hamstring and quadriceps muscles in young adult Saudi males. Neurosciences (Riyadh). 2004;9:165-170.
14. Pincivero DM, Gear WS, Sterner RL, et al. Gender differences in the relationship between quadriceps work and fatigue during high intensity exercise. J Strength Cond Res. 2000;14:202-206.
Isotretinoin is a vitamin A derivative that frequently is used in the treatment of acne vulgaris.1,2 Although isotretinoin generally is associated with favorable effects, adverse effects also have been reported.3-5 Musculoskeletal side effects can include myalgia, sacroiliitis, back pain, diffuse idiopathic skeletal hyperostosis, ligament and tendon calcifications, bone resorption, and reduced collagen synthesis.6,7 Elevated creatine kinase (CK) levels also have been reported in 15% to 50% of patients with isotretinoin-induced myalgia.8 However, there are limited data available on the effects of isotretinoin treatment on muscle strength. The objective of this study was to evaluate the impact of isotretinoin on muscle strength, fatigue, and endurance using an isokinetic dynamometer.
Methods
Study Design and Participants
The study followed a pretest-posttest design including 27 patients with acne vulgaris who were treated with oral isotretinoin (age range, 18–40 years) as well as 26 control patients for comparison. Exclusion criteria were renal or liver disease, uncontrolled hypertension, heart failure, malignancy, thyroid and bone disorders (eg, parathyroid disease, osteomalacia), use of drugs that can affect skeletal metabolism (eg, corticosteroids, heparin, anticonvulsants), and history of trauma to and/or surgery of the lower extremities. All patients were informed of the study procedure and informed consent was obtained. The study protocol was approved by the local ethics committee.
Data Collection
Participant demographics and clinical features (eg, sex, age, body mass index [BMI]) were obtained. Participants in the treatment group received oral isotretinoin 0.5 mg/kg once daily for 1 month, followed by an increased dose of 1 mg/kg once daily for 2 months. Isokinetic measurements of the knee muscles were performed on the nondominant side at baseline and at 3-month follow-up. Reports of muscular side effects were noted during the course of treatment.
Isokinetic Evaluation
A calibrated isokinetic dynamometer was used to conduct isokinetic evaluations. After performing 5 submaximal warm-up contractions, concentric peak torque (PT) values of the quadriceps and hamstrings at 60° and 180° per second angular velocities (AVs), hamstring strength to quadriceps strength ratio (H:Q ratio), and muscle fatigue were evaluated. The isokinetic test protocol included 10 repeats at 60° per second, 15 seconds of rest, and 15 repeats at 180° per second.
Statistical Analysis
Data analysis was conducted using SPSS software version 20.0. Data were expressed as mean (standard deviation [SD]). After checking normal distribution with the Kolmogorov-Smirnov test, independent t tests were used to compare the baseline parameters between the treatment and control groups. Paired t tests and Wilcoxon signed rank tests were used to compare baseline and posttreatment values where appropriate. The results were for those who completed treatment. Statistical significance was set at P<.05.
Results
Twenty-seven participants (24 female; 3 male) with newly diagnosed acne vulgaris were enrolled in the treatment group along with 26 controls (23 female; 3 male). One of the participants in the treatment group did not tolerate isotretinoin due to headache and was excluded from the study. The mean (SD) age of the participants was 20.6 (1.6) years for the treatment group and 21.3 (1.5) years for the control group, and the mean (SD) BMI for both groups was 21.8 (2.8) and 21.5 (1.8), respectively. Participant demographics and isokinetic values at baseline are presented in Table 1. No significant differences between the treatment and control groups for participant sex, age, or BMI were noted (P>.05).
Of the 26 participants in the treatment group, 5 reported myalgia and nonspecific back pain. Isokinetic measurements of the treatment group obtained using the dynamometer are shown in Table 2. Although the PT of the hamstring and quadriceps at both 60° and 180° per second AV was decreased at 3-month follow-up, there was no significant difference compared to baseline (P>.05). Additionally, no significant difference in H:Q ratio or muscle fatigue was noted (P>.05), and no significant difference in isokinetic measurements was seen in participants with myalgia (n=5) at 3-month follow-up versus baseline (P>.05).
Comment
This study aimed to investigate the short-term effects of isotretinoin treatment on muscle strength, fatigue, and endurance in patients with acne vulgaris, which has not been widely evaluated in the literature. Although maximal PT of the hamstring and quadriceps in the isotretinoin treatment group was decreased at 3-month follow-up, there was no statistically significant difference in all parameters (ie, PT at 60° and 180° per second, H:Q ratio, muscle fatigue) versus baseline. These findings showed that systemic isotretinoin was not associated with muscle dysfunction in this patient population.
Myalgia, particularly associated with exercise, has been seen in approximately 50% of patients treated with isotretinoin.6 Furthermore, Goulden et al9 reported that patients with higher CK levels might be at an increased risk for developing rhabdomyolysis in the setting of isotretinoin treatment. High CK levels indicate serious muscular cell damage and are usually associated with release of myoglobin from muscular cells.10 In the current study, 5 participants reported myalgia and nonspecific back pain at 3-month follow-up; however, no participants reported muscle weakness. Differences in the isokinetic measurements of participants with myalgia at baseline and at 3-month follow-up were not statistically significant.
Muscles mainly consist of type I (slow oxidative), type IIA (fast oxidative), and type IIB (fast glycolytic) muscle fibers. Type I fibers produce low force and high endurance, type IIB fibers produce high force and low endurance, and type IIA fibers fall in between the two. At low AVs (eg, 60° per second), only type II fibers contract. As the AV increases (eg, 180° per second), only type II fibers contract. Consequently, the observation of a decrease in the isokinetic test parameters at low or high AVs indicate the decrease in type I or type II contracting muscle fibers.11,12 In our study, the isokinetic values did not significantly change. As such, we concluded that isotretinoin treatment did not result in the reduction of muscle fibers in our patient population.
The H:Q ratio is the indicator of muscle balance and dynamic stabilization of the knee. It is calculated by dividing the PT of the hamstrings by the PT of the quadriceps in concentric motion.13 Additionally, muscle fatigue demonstrates the endurance of the contraction of type IIB fibers (anaerobic).14 In our study, isotretinoin treatment did not impact the H:Q ratio or muscle fatigue.
This study included a few important limitations. The sample size was small, particularly concerning the number of participants who reported myalgia. The lack of laboratory evaluations (eg, creatinine kinase) also was a limitation. Finally, the short study period limited the conclusions that could be drawn from the data.
Conclusion
Results from the current study revealed that systemic isotretinoin treatment did not alter muscle strength, fatigue, or endurance. Further studies taking into account histologic evaluations with larger sample sizes and long-term follow-up are needed.
1. Yıldızgören MT, Karatas Togral A, Baki AE, et al. Effects of isotretinoin treatment on cartilage and tendon thicknesses: an ultrasonographic study [published online ahead of print July 2, 2014]. Clin Rheumatol. doi:10.1007/s10067-014-2733-9.
2. Karatas Togral A, Yıldızgören MT, Mustu Koryürek Ö, et al. Can isotretinoin induce SAPHO syndrome? West Indian Med J. In press.
3. Yıldızgören MT, Ekiz T, Karatas Togral A. Bilateral sacroiliitis induced by systemic isotretinoin treatment. West Indian Med J. In press.
4. Chapman MS. Vitamin A: history, current uses, and controversies. Semin Cutan Med Surg. 2012;31:11-16.
5. Blasiak RC, Stamey CR, Burkhart CN, et al. High-dose isotretinoin treatment and the rate of retrial, relapse, and adverse effects in patients with acne vulgaris. JAMA Dermatol. 2013;149:1392.
6. Penniston KL, Tanumihardjo SA. The acute and chronic toxic effects of vitamin A. Am J Clin Nutr. 2006;83:191-201.
7. DiGiovanna JJ. Isotretinoin effects on bone. J Am Acad Dermatol. 2001;45:S176-S182.
8. Heudes AM, Laroche L. Muscular damage during isotretinoin treatment. Ann Dermatol Venereol. 1998;125:94-97.
9. Goulden V, Layton AM, Cunliffe WJ. Long term safety of isotretinoin as a treatment for acne vulgaris. Br J Dermatol. 1994;131:360-363.
10. Fiallo P, Tagliapietra AG. Severe acute myopathy induced by isotretinoin. Arch Dermatol. 1996;132:1521-1522.
11. Impellizzeri FM, Bizzini M, Rampinini E, et al. Reliability of isokinetic strength imbalance ratios measured using the Cybex NORM dynamometer.
Clin Physiol Funct Imaging. 2008;28:113-119.
12. Brown LE. Isokinetics in Human Performance. Champaign, IL: Human Kinetics; 2000.
13. Alangari AS, Al-Hazzaa HM. Normal isometric and isokinetic peak torques of hamstring and quadriceps muscles in young adult Saudi males. Neurosciences (Riyadh). 2004;9:165-170.
14. Pincivero DM, Gear WS, Sterner RL, et al. Gender differences in the relationship between quadriceps work and fatigue during high intensity exercise. J Strength Cond Res. 2000;14:202-206.
- Musculoskeletal adverse effects have been reported due to isotretinoin treatment.
- This study investigated the effects of isotretinoin on muscle strength, fatigue, and endurance in patients with acne vulgaris using an isokinetic dynamometer.
- Systemic isotretinoin treatment did not alter muscle strength, fatigue, or endurance.

A Phase 3 Randomized, Double-blind, Vehicle-Controlled Trial of Azelaic Acid Foam 15% in the Treatment of Papulopustular Rosacea
Rosacea is a common dermatologic disorder that generally is characterized by erythema as well as papules and pustules on the cheeks, chin, forehead, and nose. Moreover, telangiectasia and burning or stinging sensations often occur.1,2 These clinical manifestations and other related ones frequently lead to the perception of “sensitive skin.” Rosacea patients often experience low self-esteem, anxiety, and social embarrassment.3 Reports of the gender distribution of the disease vary but often show female predominance.4 Although it also occurs in darker skin types, rosacea is more common in individuals with lighter skin.1
The etiology of rosacea is not yet fully understood, but the underlying pathology has been attributed to dysregulated immune responses. Although the flares of a typical fluctuating disease course often are caused by exogenous triggers, there is evidence that an underlying genetic component predisposes some individuals to pathologic changes associated with the condition.5 Augmented immune activity and proinflammatory signaling appear to induce the infiltration of inflammatory elements into affected areas.2 These regions show dilated vasculature and increased cutaneous blood flow secondary to inflammation. Systemic oxidative stress also may contribute to epidermal dysfunction, as the antioxidant capacity of the skin in patients with rosacea is depleted relative to that of healthy individuals. The biochemical and vascular changes characteristic of rosacea coincide with aberrant permeability of the stratum corneum.6 The resulting decreased hydration and water loss across the skin contribute to the sensitivity and irritation typical of the disease.2
Current guidelines for the optimal management of rosacea with papulopustular lesions recommend skin care, photoprotection, and topical therapy. Depending on the severity of disease and the likelihood of adherence to a topical regimen, use of oral agents may be warranted.7
Azelaic acid (AzA), an unbranched saturated dicarboxylic acid (1,7-heptanedicarboxylic acid) that occurs in plants, is one of several US Food and Drug Administration–approved topical agents for the treatment of inflammatory lesions in rosacea.8 Although the pathophysiology of rosacea is not yet fully understood, there is a growing consensus about the role of proinflammatory molecules (eg, kallikrein 5, cathelicidins) as well as reactive oxygen species (ROS).9 Azelaic acid has been demonstrated to modulate the inflammatory response in normal human keratinocytes through several pathways, including modulation of the signaling pathways of peroxisome proliferator-activated receptor g and nuclear factor kB, concurrent with the observed inhibition of proinflammatory cytokine secretion.10 Additionally, AzA can inhibit the release of ROS from neutrophils and also may reduce ROS by direct scavenging effects.11 Further, AzA shows direct inhibition of kallikrein 5 in human keratinocytes as well as a reduction of the expression of kallikrein 5 and cathelicidin in murine skin and the facial skin of patients with rosacea.12
In a series of randomized trials in patients with papulopustular rosacea (PPR), AzA has shown clinical efficacy and safety as a topical treatment.13-15 Based on these studies, a gel formulation of AzA with a 15% concentration has been approved for treating inflammatory papules and pustules of mild to moderate rosacea.16
Although AzA delivered in a gel matrix is an effective therapy, topical delivery of active pharmaceutical ingredients via foam is often preferred over traditional vehicles in patients with sensitive skin. Patient rationale for favoring foam includes improved appearance and ease of application, namely easier to spread with a reduced need to manipulate inflamed skin.17 Also, data reveal that patients may be more compliant with a treatment that meets their needs such as an optimized foam formulation.18 In addition, the lipid components of an optimized formulation are thought to contribute to an improved skin condition.19 The foam vehicle used in this study is a proprietary oil-in-water formulation that includes fatty alcohols and triglycerides. The novel delivery of AzA in a foam formulation will provide clinicians and patients with a new option for improved individualized care.
We report the primary results of a phase 3 study in patients with PPR comparing the efficacy and safety of twice-daily AzA foam 15% with vehicle foam. The phase 3 study builds on the results of a prior randomized double-blind trial (N=401) that demonstrated significant improvements relative to vehicle in therapeutic success rate (P=.017) and decreased inflammatory lesion count (ILC)(P<.001) among patients treated with AzA foam 15%.8
Methods
Study Design
This phase 3 randomized, double-blind, vehicle-controlled, parallel-group, multicenter study was conducted in patients with PPR according to Good Clinical Practice guidelines in 48 study centers in the United States. The objective was to evaluate a 12-week, twice-daily (morning and evening) course of AzA foam 15% versus vehicle.
Participants were men and women aged 18 years or older with moderate to severe PPR (as determined by investigator global assessment [IGA]) presenting with 12 to 50 papules and/or pustules and persistent erythema with or without telangiectasia. Informed consent was obtained from all participants before any study-related activities were carried out.
The study products were applied to the entire facial area each morning and evening at a dose of 0.5 g, thus administering 150 mg of AzA daily in the active arm of the trial (computerized randomization 1:1). The treatment period lasted 12 weeks, and participants were evaluated at baseline and weeks 4, 8, and 12. The follow-up period lasted 4 weeks following the end of treatment (EoT) and was concluded with one final end-of-study visit.
Efficacy Evaluations
There were 2 coprimary efficacy end points. Therapeutic success rate was evaluated using the IGA scale (clear, minimal, mild, moderate, or severe). Treatment success was defined as an IGA score of either clear or minimal (with at least a 2-step improvement) at EoT, whereas treatment failure was constituted by IGA scores of mild, moderate, or severe.
The second coprimary end point was the nominal change in ILC from baseline to EoT as determined by the total number of facial papules and pustules. Efficacy and safety parameters were evaluated at weeks 4, 8, and 12, as well as at the end of the 4-week follow-up period. Throughout the study, the investigator, participants, and all study personnel remained blinded.
Safety
Information about adverse events (AEs) was collected at each study visit, and AEs were graded according to seriousness (yes or no) and intensity (mild, moderate, or severe).
Statistical Analysis
Efficacy was confirmed by analysis of the treatment success rate at EoT with Cochran-Mantel-Haenszel test statistics, including a point estimate and 95% confidence interval (CI) for the odds ratio. Change in ILC at EoT was analyzed via an analysis of covariance model using treatment, center, and baseline lesion count as factors. (Additional methods can be found in the Appendix below.)
Results
Study Participants
Of the 1156 patients who were screened for eligibility, 961 were randomized to treatment with AzA foam (n=484) or vehicle (n=477)(Figure 1). Sixty-four (13.2%) participants in the AzA foam group and 79 (16.6%) in the vehicle group discontinued treatment before completing the study. The most common reasons for discontinuation were participant withdrawal from the study and lost to follow-up. Six (1.2%) participants from the AzA foam group and 12 (2.5%) from the vehicle group discontinued because of AEs. All safety and efficacy data presented are based on the full analysis set, which consisted of the 961 participants randomized to treatment.

Demographic and baseline characteristics were balanced between the treatment groups (Table 1). The majority of participants were female (73.0%) and white (95.5%), reflecting the patient populations of independent studies that found a higher prevalence of rosacea in women and lighter skin types.4 There were no significant differences in baseline measures of PPR severity between the treatment groups. Participants in the AzA foam and vehicle groups had a mean ILC of 21.7 and 21.2, respectively, and 76.4% of participants had more than 14 lesions. All participants had an IGA score of moderate (86.8%) or severe (13.2%). Moderate or severe erythema was present in 91.5% of participants.
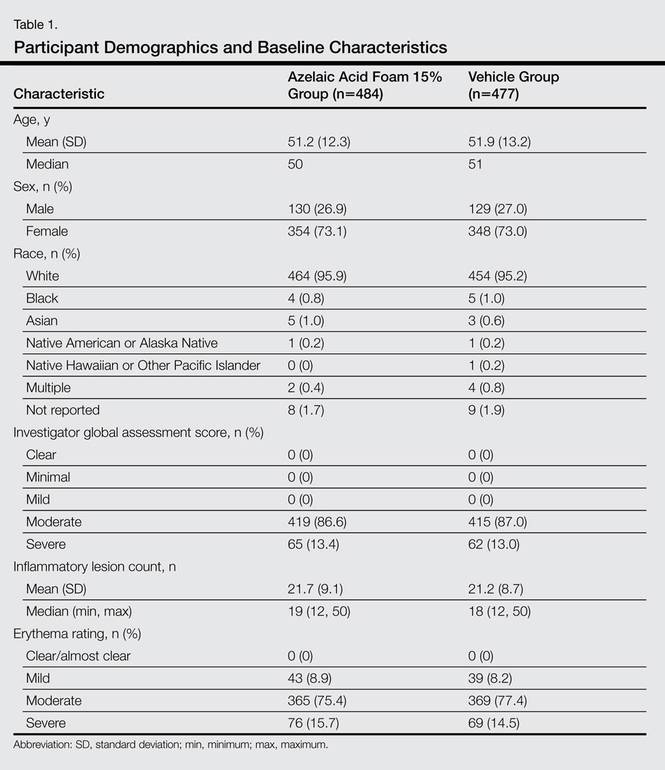
Treatment compliance, as measured by the percentage of expected doses that were actually administered, was 97.1% in the AzA foam group and 95.9% in the vehicle group.
Efficacy
Results from both primary end points demonstrated superior efficacy of AzA foam over vehicle. The AzA foam group achieved a greater IGA success rate at EoT compared with the vehicle group (32.0% vs 23.5%; Cochran-Mantel-Haenszel test center-adjusted P<.001; odds ratio, 1.6; 95% CI, 1.2-2.2). Treatment success rate was higher in the AzA foam group than in the vehicle group at every time point past baseline (Figure 2). Similarly, the decrease in mean nominal ILC values was greater in the AzA foam group at every time point after baseline (Figure 3), and the treatment difference at EoT was statistically significant in favor of AzA foam (-2.7, F1,920=23.7, P<.001; 95% CI, -3.8 to -1.6). The divergence between treatment groups at week 4 reveals an onset of AzA effect early in the study.

|
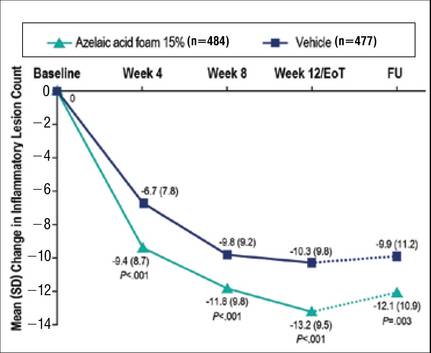
|
Although the AzA foam group showed significantly better efficacy results than the vehicle group for the coprimary end points, participants in the vehicle group did show appreciable IGA success rates (23.5%) and changes in ILC (-10.3) at EoT (Figures 2 and 3).
Notably, the AzA foam group maintained better results than vehicle for both primary end points even at the end of the 4-week follow-up after EoT (Figures 2 and 3). Sensitivity analysis (data not shown) confirmed the findings from the full analysis set.
Safety
Adverse events were experienced by 149 (30.8%) participants in the AzA foam group and 119 (24.9%) in the vehicle group. The most common noncutaneous AEs (>1% of participants) reported during AzA foam treatment were nasopharyngitis, headache, upper respiratory tract infection, and influenza. In the vehicle group, the most common noncutaneous AEs reported were nasopharyngitis and headache. Drug-related AEs (relationship assessed by the investigator) were reported slightly more often in the AzA foam group (7.6%) than in the vehicle group (4.6%). Drug-related AEs were predominantly cutaneous and occurred at the site of application (Table 2). Drug-related cutaneous AEs were more common in the AzA foam group (7.0%) than in the vehicle group (4.4%). Although serious AEs were more common in the vehicle group, all were regarded as unrelated to the study medication. A single death occurred in the vehicle group due to an accident unrelated to the study drug.
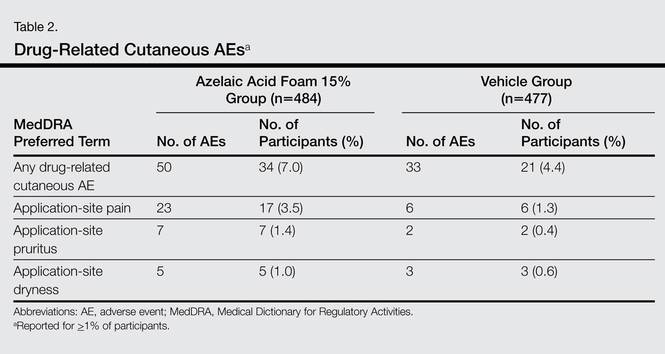
The most frequent drug-related AEs in participants treated with AzA foam versus vehicle were application-site pain (3.5% vs 1.3%), application-site pruritus (1.4% vs 0.4%), and application-site dryness (1.0% vs 0.6%). The classical rosacea symptom of stinging is subsumed under the term application-site pain, according to MedDRA (Medical Dictionary for Regulatory Activities).
All other drug-related AEs occurred at a frequency of less than 1% in participants from both groups. Serious AEs were rare and unrelated to treatment, with 3 AEs reported in the AzA foam group and 4 in the vehicle group. Adverse events leading to study drug withdrawal occurred in less than 2% of participants and were more common in the vehicle group (2.5%) than in the AzA foam group (1.2%). Of the 3 drug-related AEs leading to withdrawal in the AzA foam group, 2 were due to cutaneous reaction and 1 was due to a burning sensation. The number of active drug-related cutaneous AEs was highest during the first 4 weeks of treatment and declined over the course of the study (eFigure).
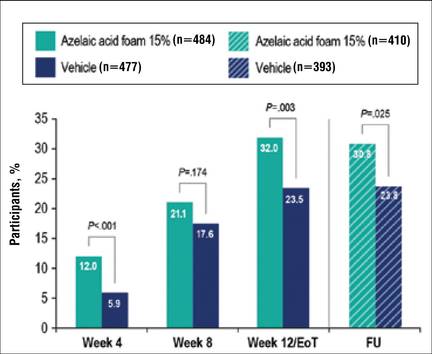
More than 96% of AEs were resolved by the end of the study. Of the participants experiencing AEs that did not resolve during the course of the study, 16 were in the AzA foam group and 10 in the vehicle group. Six unresolved AEs were drug related, with 3 occurring in each treatment group. Unresolved drug-related cutaneous AEs in the AzA foam group were pain, pruritus, and dryness at the application site.
Comment
Overall, the results from this phase 3 trial demonstrate that the new foam formulation of AzA was efficacious and safe in a 12-week, twice-daily course of treatment for moderate to severe PPR. The AzA foam formulation was significantly superior to vehicle (P<.001) for both primary efficacy end points. Participants in the AzA foam group achieved therapeutic success at a higher rate than the vehicle group, and the change in nominal ILC at EoT was significantly greater for participants treated with AzA foam than for those treated with vehicle (P<.001). Differences between the 2 treatment groups for the coprimary end point measures arose early in the study, demonstrating that symptoms were rapidly controlled. Between weeks 8 and 12 (EoT), the rate of increase of beneficial effects in the AzA foam group remained high, while the vehicle group showed a notable slowing. There was no indication of any rebound effect in overall disease severity subsequent to EoT. After 4 weeks of follow-up, there was still a beneficial treatment effect present in favor of the AzA foam group, as indicated by the persistence of improvements in both coprimary end point measures throughout the follow-up period.
Analyses of alternative populations and secondary end points (data not shown) supported the efficacy results reported here. There was no indication of irregular study center effects, and the sensitivity analyses demonstrated robustness of the data for the observed treatment effects.
The use of vehicle foam alone appeared to be beneficial in reducing ILC and improving IGA rating, which suggests that the properties of the new foam formulation are favorable for the inflamed lesional skin of rosacea. Of note, other dermatology studies, including trials in rosacea, have reported therapeutic effects of vehicle treatment that may be attributable to the positive effects of skin care with certain formulations.20
Azelaic acid foam was well tolerated in the current study. More than 93% of AEs in either treatment group were of mild or moderate severity. The incidence of drug-related AEs was low in both groups and mainly occurred at the application site. There were no drug-related severe or serious AEs. The low incidence of reported drug-related noncutaneous AEs in the AzA foam group (dysgeusia in 1 patient and headache in 2 patients) supports the known favorable systemic tolerance profile of AzA.
Although most drug-related AEs occurred at the application site, they were generally transient, with the majority of events in the AzA foam group lasting no more than 1 hour. Most cutaneous AEs developed early in the study. In the AzA foam group, the prevalence of drug-related cutaneous AEs dropped at every time interval as the study progressed (eFigure). Very few AEs of any type persisted through the end of the study. These safety results were accompanied by a high compliance rate and a high participation rate throughout the course of the study. Taken together, the available data for this AzA foam formulation support a favorable tolerability profile. The results of this study are consistent with and expand on data from an earlier investigation of similar design.8
Conclusion
The development of an AzA foam formulation with higher lipid content was intended to expand the treatment options available to physicians and patients who are managing rosacea. Most topical dermatologic treatments are currently delivered in classical formulations such as creams or gels, but patients who use topical therapies have rated messiness and ease of application among the most important characteristics affecting quality of life.17,21 Foam formulations may offer improvements in this regard; ease of application may minimize unnecessary manipulation of inflamed skin and contribute to a high level of user satisfaction.22 However, the design of the current study was limited to evaluating only the AzA foam formulation versus a foam vehicle, and direct comparisons of clinical efficacy and tolerability to other AzA topical preparations were not performed. Nonetheless, patients have previously reported that they would be more likely to comply with a recommended course of dermatologic foam therapy than other topical formulations.18 The proposed foam formulation was designed to attend to the specific needs of the dry and sensitive skin in rosacea by combining the demonstrated efficacy properties exhibited by AzA gel 15% with the good tolerability and acceptability of a lipid-containing foam formulation. Development of this formulation was targeted to obtain a product that would be highly spreadable, dry quickly, and be easy to apply. The available data for this AzA foam formulation support the value of this option in the topical treatment of rosacea. The success in reduction of overall disease severity, lack of any rebound after EoT, and the observed tolerability and high adherence rates suggest that this novel formulation is a useful addition to current treatment options for rosacea.
Addendum
After release of the study data for unblinding and statistical evaluation, the following inconsistency regarding patient distribution was noted: 1 participant was incorrectly evaluated as part of the AzA foam analysis group when in fact this patient was randomized to vehicle and was treated throughout the study with vehicle. This participant did not experience any AE and did not show any IGA improvement at the EoT. As this single case did not have an impact on the statistical conclusions or interpretation of the results, the released study data have not been changed. This deviation was described as a database erratum in the study report.
Acknowledgement—Editorial support through inVentiv Medical Communications, New York, New York, was provided by Bayer HealthCare Pharmaceuticals Inc.
APPENDIX
Supplementary Methods
Supplementary Study Design
This study met all local legal and regulatory requirements and was conducted according to the principles of the Declaration of Helsinki and the International Conference on Harmonization Good Clinical Practice guidelines. Before the start of the study and implementation, the protocol and all amendments were approved by the appropriate independent ethics committee or institutional review board at each study site. Two protocol amendments were implemented before the first participant visit.
Exclusion criteria included the presence of dermatoses that could interfere with rosacea diagnosis or evaluation, facial laser surgery or topical use of any medication to treat rosacea within 6 weeks before randomization, systemic use of any medications to treat rosacea, and known unresponsiveness to AzA treatment. Further standard exclusion criteria included alcohol or drug use or parallel participation in other clinical studies, which were necessary to exclude undue influence on study evaluations and/or participant safety. The study was conducted by qualified investigators at 48 centers in the United States.
The investigational product was filled in identical containers according to the randomization list generated by a computer program using blocks. Complete blocks of study medication were distributed to the centers. Eligible participants were randomized 1:1 into either AzA foam or vehicle treatment groups by assignment of a randomization number at baseline. A blind investigational product under the same randomization number was dispensed to and returned from participants by study personnel who were not involved in the assessments. Blinding was achieved by using labels on the investigational products that did not allow identification of the true medication.
Compliance was evaluated from participant diaries as well as the number of expected doses and actually applied doses.
Additional Efficacy Evaluations
A number of secondary variables (not reported here) were assessed, including changes in other manifestations of PPR, as well as participant assessments of treatment response, tolerability, cosmetic preferences, and quality of life.
Additional Safety
Investigators reported a yes or no response as to whether there was a reasonable causal relationship between AEs and treatment. Moreover, AEs that began at the start of or during treatment were considered treatment emergent. Cutaneous AEs were further assessed regarding location and duration. An AE was deemed local if it occurred at the application site and transient if it subsided within 60 minutes of onset.
Statistical Analysis
The primary efficacy analyses presented here were based on the full analysis set of participants who were randomized and had medication dispensed. For participants with no EoT value, the last nonmissing value was used including baseline (last-observation-carried-forward methodology). Participants who discontinued treatment prematurely because of lack of efficacy were considered to be treatment failures, regardless of the reported IGA score. Statistical significance was needed for both coprimary efficacy variables at a 1-sided 2.5% significance level to show confirmed superiority of AzA foam versus vehicle.
A number of sensitivity analyses were performed, including an analysis of the coprimary end points using observed data, analysis of the per-protocol population of participants who did not prematurely discontinue treatment and had no major protocol deviations, subgroup analyses, and the use of statistical methods to investigate the effect of missing observations. Analyses of success rate and nominal change in ILC were repeated for each postbaseline visit using χ² and t tests, respectively. All summary and statistical analyses were performed according to the study protocol (unchanged after the start of the study) using SAS version 9.2.
Results from a prior study provided the basis for the sample size, which was calculated to show a significant difference in both primary efficacy end points with a power of 90%.8 To allow for dropouts, 480 participants in each treatment group were to be randomized for a total of 960 participants.
1. Wilkin J, Dahl M, Detmar M, et al. Standard classification of rosacea: report of the National Rosacea Society Expert Committee on the Classification and Staging of Rosacea. J Am Acad Dermatol. 2002;46:584-587.
2. Del Rosso JQ. Advances in understanding and managing rosacea: part 1: connecting the dots between pathophysiological mechanisms and common clinical features of rosacea with emphasis on vascular changes and facial erythema. J Clin Aesthet Dermatol. 2012;5:16-25.
3. Huynh TT. Burden of disease: the psychosocial impact of rosacea on a patient’s quality of life. Am Health Drug Benefits. 2013;6:348-354.
4. Tan J, Berg M. Rosacea: current state of epidemiology. J Am Acad Dermatol. 2013;69(6 suppl 1):S27-S35.
5. Steinhoff M, Schauber J, Leyden JJ. New insights into rosacea pathophysiology: a review of recent findings. J Am Acad Dermatol. 2013;69(6 suppl 1):S15-S26.
6. Wollina U. Recent advances in the understanding and management of rosacea. F1000Prime Rep. 2014;6:50.
7. Del Rosso JQ, Thiboutot D, Gallo R, et al. Consensus recommendations from the American Acne & Rosacea Society on the management of rosacea, part 5: a guide on the management of rosacea. Cutis. 2014;93:134-138.
8. Draelos ZD, Elewski B, Staedtler G, et al. Azelaic acid foam 15% in the treatment of papulopustular rosacea: a randomized, double-blind, vehicle-controlled study. Cutis. 2013;92:306-317.
9. Yamasaki K, Di Nardo A, Bardan A, et al. Increased serine protease activity and cathelicidin promotes skin inflammation in rosacea. Nat Med. 2007;13:975-980.
10. Mastrofrancesco A, Ottaviani M, Aspite N, et al. Azelaic acid modulates the inflammatory response in normal human keratinocytes through PPARg activation. Exp Dermatol. 2010;19:813-820.
11. Akamatsu H, Komura J, Asada Y, et al. Inhibitory effect of azelaic acid on neutrophil functions: a possible cause for its efficacy in treating pathogenetically unrelated diseases. Arch Dermatol Res. 1991;283:162-166.
12. Coda AB, Hata T, Miller J, et al. Cathelicidin, kalli-krein 5, and serine protease activity is inhibited during treatment of rosacea with azelaic acid 15% gel. J Am Acad Dermatol. 2013;69:570-577.
13. van Zuuren EJ, Kramer SF, Carter BR, et al. Effective and evidence-based management strategies for rosacea: summary of a Cochrane systematic review. Br J Dermatol. 2011;165:760-781.
14. Thiboutot D, Thieroff-Ekerdt R, Graupe K. Efficacy and safety of azelaic acid (15%) gel as a new treatment for papulopustular rosacea: results from two vehicle-controlled, randomized phase III studies. J Am Acad Dermatol. 2003;48:836-845.
15. Thiboutot DM, Fleischer AB Jr, Del Rosso JQ, et al. Azelaic acid 15% gel once daily versus twice daily in papulopustular rosacea. J Drugs Dermatol. 2008;7:541-546.
16. Finacea [package insert]. Whippany, NJ: Bayer HealthCare Pharmaceuticals Inc; 2015.
17. Zhao Y, Jones SA, Brown MB. Dynamic foams in topical drug delivery. J Pharm Pharmacol. 2010;62:678-684.
18. Gottlieb AB, Ford RO, Spellman MC. The efficacy and tolerability of clobetasol propionate foam 0.05% in the treatment of mild to moderate plaque-type psoriasis of nonscalp regions. J Cutan Med Surg. 2003;7:185-192.
19. Loden M. Role of topical emollients and moisturizers in the treatment of dry skin barrier disorders. Am J Clin Dermatol. 2003;4:771-788.
20. Jackson JM, Pelle M. Topical rosacea therapy: the importance of vehicles for efficacy, tolerability and compliance. J Drugs Dermatol. 2011;10:627-633.
21. Housman TS, Mellen BG, Rapp SR, et al. Patients with psoriasis prefer solution and foam vehicles: a quantitative assessment of vehicle preference. Cutis. 2002;70:327-332.
22. Kircik LH, Bikowski JB. Vehicles matter: topical foam formulations. Practical Dermatology. January 2012(suppl):3-18.
Rosacea is a common dermatologic disorder that generally is characterized by erythema as well as papules and pustules on the cheeks, chin, forehead, and nose. Moreover, telangiectasia and burning or stinging sensations often occur.1,2 These clinical manifestations and other related ones frequently lead to the perception of “sensitive skin.” Rosacea patients often experience low self-esteem, anxiety, and social embarrassment.3 Reports of the gender distribution of the disease vary but often show female predominance.4 Although it also occurs in darker skin types, rosacea is more common in individuals with lighter skin.1
The etiology of rosacea is not yet fully understood, but the underlying pathology has been attributed to dysregulated immune responses. Although the flares of a typical fluctuating disease course often are caused by exogenous triggers, there is evidence that an underlying genetic component predisposes some individuals to pathologic changes associated with the condition.5 Augmented immune activity and proinflammatory signaling appear to induce the infiltration of inflammatory elements into affected areas.2 These regions show dilated vasculature and increased cutaneous blood flow secondary to inflammation. Systemic oxidative stress also may contribute to epidermal dysfunction, as the antioxidant capacity of the skin in patients with rosacea is depleted relative to that of healthy individuals. The biochemical and vascular changes characteristic of rosacea coincide with aberrant permeability of the stratum corneum.6 The resulting decreased hydration and water loss across the skin contribute to the sensitivity and irritation typical of the disease.2
Current guidelines for the optimal management of rosacea with papulopustular lesions recommend skin care, photoprotection, and topical therapy. Depending on the severity of disease and the likelihood of adherence to a topical regimen, use of oral agents may be warranted.7
Azelaic acid (AzA), an unbranched saturated dicarboxylic acid (1,7-heptanedicarboxylic acid) that occurs in plants, is one of several US Food and Drug Administration–approved topical agents for the treatment of inflammatory lesions in rosacea.8 Although the pathophysiology of rosacea is not yet fully understood, there is a growing consensus about the role of proinflammatory molecules (eg, kallikrein 5, cathelicidins) as well as reactive oxygen species (ROS).9 Azelaic acid has been demonstrated to modulate the inflammatory response in normal human keratinocytes through several pathways, including modulation of the signaling pathways of peroxisome proliferator-activated receptor g and nuclear factor kB, concurrent with the observed inhibition of proinflammatory cytokine secretion.10 Additionally, AzA can inhibit the release of ROS from neutrophils and also may reduce ROS by direct scavenging effects.11 Further, AzA shows direct inhibition of kallikrein 5 in human keratinocytes as well as a reduction of the expression of kallikrein 5 and cathelicidin in murine skin and the facial skin of patients with rosacea.12
In a series of randomized trials in patients with papulopustular rosacea (PPR), AzA has shown clinical efficacy and safety as a topical treatment.13-15 Based on these studies, a gel formulation of AzA with a 15% concentration has been approved for treating inflammatory papules and pustules of mild to moderate rosacea.16
Although AzA delivered in a gel matrix is an effective therapy, topical delivery of active pharmaceutical ingredients via foam is often preferred over traditional vehicles in patients with sensitive skin. Patient rationale for favoring foam includes improved appearance and ease of application, namely easier to spread with a reduced need to manipulate inflamed skin.17 Also, data reveal that patients may be more compliant with a treatment that meets their needs such as an optimized foam formulation.18 In addition, the lipid components of an optimized formulation are thought to contribute to an improved skin condition.19 The foam vehicle used in this study is a proprietary oil-in-water formulation that includes fatty alcohols and triglycerides. The novel delivery of AzA in a foam formulation will provide clinicians and patients with a new option for improved individualized care.
We report the primary results of a phase 3 study in patients with PPR comparing the efficacy and safety of twice-daily AzA foam 15% with vehicle foam. The phase 3 study builds on the results of a prior randomized double-blind trial (N=401) that demonstrated significant improvements relative to vehicle in therapeutic success rate (P=.017) and decreased inflammatory lesion count (ILC)(P<.001) among patients treated with AzA foam 15%.8
Methods
Study Design
This phase 3 randomized, double-blind, vehicle-controlled, parallel-group, multicenter study was conducted in patients with PPR according to Good Clinical Practice guidelines in 48 study centers in the United States. The objective was to evaluate a 12-week, twice-daily (morning and evening) course of AzA foam 15% versus vehicle.
Participants were men and women aged 18 years or older with moderate to severe PPR (as determined by investigator global assessment [IGA]) presenting with 12 to 50 papules and/or pustules and persistent erythema with or without telangiectasia. Informed consent was obtained from all participants before any study-related activities were carried out.
The study products were applied to the entire facial area each morning and evening at a dose of 0.5 g, thus administering 150 mg of AzA daily in the active arm of the trial (computerized randomization 1:1). The treatment period lasted 12 weeks, and participants were evaluated at baseline and weeks 4, 8, and 12. The follow-up period lasted 4 weeks following the end of treatment (EoT) and was concluded with one final end-of-study visit.
Efficacy Evaluations
There were 2 coprimary efficacy end points. Therapeutic success rate was evaluated using the IGA scale (clear, minimal, mild, moderate, or severe). Treatment success was defined as an IGA score of either clear or minimal (with at least a 2-step improvement) at EoT, whereas treatment failure was constituted by IGA scores of mild, moderate, or severe.
The second coprimary end point was the nominal change in ILC from baseline to EoT as determined by the total number of facial papules and pustules. Efficacy and safety parameters were evaluated at weeks 4, 8, and 12, as well as at the end of the 4-week follow-up period. Throughout the study, the investigator, participants, and all study personnel remained blinded.
Safety
Information about adverse events (AEs) was collected at each study visit, and AEs were graded according to seriousness (yes or no) and intensity (mild, moderate, or severe).
Statistical Analysis
Efficacy was confirmed by analysis of the treatment success rate at EoT with Cochran-Mantel-Haenszel test statistics, including a point estimate and 95% confidence interval (CI) for the odds ratio. Change in ILC at EoT was analyzed via an analysis of covariance model using treatment, center, and baseline lesion count as factors. (Additional methods can be found in the Appendix below.)
Results
Study Participants
Of the 1156 patients who were screened for eligibility, 961 were randomized to treatment with AzA foam (n=484) or vehicle (n=477)(Figure 1). Sixty-four (13.2%) participants in the AzA foam group and 79 (16.6%) in the vehicle group discontinued treatment before completing the study. The most common reasons for discontinuation were participant withdrawal from the study and lost to follow-up. Six (1.2%) participants from the AzA foam group and 12 (2.5%) from the vehicle group discontinued because of AEs. All safety and efficacy data presented are based on the full analysis set, which consisted of the 961 participants randomized to treatment.
Demographic and baseline characteristics were balanced between the treatment groups (Table 1). The majority of participants were female (73.0%) and white (95.5%), reflecting the patient populations of independent studies that found a higher prevalence of rosacea in women and lighter skin types.4 There were no significant differences in baseline measures of PPR severity between the treatment groups. Participants in the AzA foam and vehicle groups had a mean ILC of 21.7 and 21.2, respectively, and 76.4% of participants had more than 14 lesions. All participants had an IGA score of moderate (86.8%) or severe (13.2%). Moderate or severe erythema was present in 91.5% of participants.
Treatment compliance, as measured by the percentage of expected doses that were actually administered, was 97.1% in the AzA foam group and 95.9% in the vehicle group.
Efficacy
Results from both primary end points demonstrated superior efficacy of AzA foam over vehicle. The AzA foam group achieved a greater IGA success rate at EoT compared with the vehicle group (32.0% vs 23.5%; Cochran-Mantel-Haenszel test center-adjusted P<.001; odds ratio, 1.6; 95% CI, 1.2-2.2). Treatment success rate was higher in the AzA foam group than in the vehicle group at every time point past baseline (Figure 2). Similarly, the decrease in mean nominal ILC values was greater in the AzA foam group at every time point after baseline (Figure 3), and the treatment difference at EoT was statistically significant in favor of AzA foam (-2.7, F1,920=23.7, P<.001; 95% CI, -3.8 to -1.6). The divergence between treatment groups at week 4 reveals an onset of AzA effect early in the study.
|
|
|
|
Although the AzA foam group showed significantly better efficacy results than the vehicle group for the coprimary end points, participants in the vehicle group did show appreciable IGA success rates (23.5%) and changes in ILC (-10.3) at EoT (Figures 2 and 3).
Notably, the AzA foam group maintained better results than vehicle for both primary end points even at the end of the 4-week follow-up after EoT (Figures 2 and 3). Sensitivity analysis (data not shown) confirmed the findings from the full analysis set.
Safety
Adverse events were experienced by 149 (30.8%) participants in the AzA foam group and 119 (24.9%) in the vehicle group. The most common noncutaneous AEs (>1% of participants) reported during AzA foam treatment were nasopharyngitis, headache, upper respiratory tract infection, and influenza. In the vehicle group, the most common noncutaneous AEs reported were nasopharyngitis and headache. Drug-related AEs (relationship assessed by the investigator) were reported slightly more often in the AzA foam group (7.6%) than in the vehicle group (4.6%). Drug-related AEs were predominantly cutaneous and occurred at the site of application (Table 2). Drug-related cutaneous AEs were more common in the AzA foam group (7.0%) than in the vehicle group (4.4%). Although serious AEs were more common in the vehicle group, all were regarded as unrelated to the study medication. A single death occurred in the vehicle group due to an accident unrelated to the study drug.
The most frequent drug-related AEs in participants treated with AzA foam versus vehicle were application-site pain (3.5% vs 1.3%), application-site pruritus (1.4% vs 0.4%), and application-site dryness (1.0% vs 0.6%). The classical rosacea symptom of stinging is subsumed under the term application-site pain, according to MedDRA (Medical Dictionary for Regulatory Activities).
All other drug-related AEs occurred at a frequency of less than 1% in participants from both groups. Serious AEs were rare and unrelated to treatment, with 3 AEs reported in the AzA foam group and 4 in the vehicle group. Adverse events leading to study drug withdrawal occurred in less than 2% of participants and were more common in the vehicle group (2.5%) than in the AzA foam group (1.2%). Of the 3 drug-related AEs leading to withdrawal in the AzA foam group, 2 were due to cutaneous reaction and 1 was due to a burning sensation. The number of active drug-related cutaneous AEs was highest during the first 4 weeks of treatment and declined over the course of the study (eFigure).
More than 96% of AEs were resolved by the end of the study. Of the participants experiencing AEs that did not resolve during the course of the study, 16 were in the AzA foam group and 10 in the vehicle group. Six unresolved AEs were drug related, with 3 occurring in each treatment group. Unresolved drug-related cutaneous AEs in the AzA foam group were pain, pruritus, and dryness at the application site.
Comment
Overall, the results from this phase 3 trial demonstrate that the new foam formulation of AzA was efficacious and safe in a 12-week, twice-daily course of treatment for moderate to severe PPR. The AzA foam formulation was significantly superior to vehicle (P<.001) for both primary efficacy end points. Participants in the AzA foam group achieved therapeutic success at a higher rate than the vehicle group, and the change in nominal ILC at EoT was significantly greater for participants treated with AzA foam than for those treated with vehicle (P<.001). Differences between the 2 treatment groups for the coprimary end point measures arose early in the study, demonstrating that symptoms were rapidly controlled. Between weeks 8 and 12 (EoT), the rate of increase of beneficial effects in the AzA foam group remained high, while the vehicle group showed a notable slowing. There was no indication of any rebound effect in overall disease severity subsequent to EoT. After 4 weeks of follow-up, there was still a beneficial treatment effect present in favor of the AzA foam group, as indicated by the persistence of improvements in both coprimary end point measures throughout the follow-up period.
Analyses of alternative populations and secondary end points (data not shown) supported the efficacy results reported here. There was no indication of irregular study center effects, and the sensitivity analyses demonstrated robustness of the data for the observed treatment effects.
The use of vehicle foam alone appeared to be beneficial in reducing ILC and improving IGA rating, which suggests that the properties of the new foam formulation are favorable for the inflamed lesional skin of rosacea. Of note, other dermatology studies, including trials in rosacea, have reported therapeutic effects of vehicle treatment that may be attributable to the positive effects of skin care with certain formulations.20
Azelaic acid foam was well tolerated in the current study. More than 93% of AEs in either treatment group were of mild or moderate severity. The incidence of drug-related AEs was low in both groups and mainly occurred at the application site. There were no drug-related severe or serious AEs. The low incidence of reported drug-related noncutaneous AEs in the AzA foam group (dysgeusia in 1 patient and headache in 2 patients) supports the known favorable systemic tolerance profile of AzA.
Although most drug-related AEs occurred at the application site, they were generally transient, with the majority of events in the AzA foam group lasting no more than 1 hour. Most cutaneous AEs developed early in the study. In the AzA foam group, the prevalence of drug-related cutaneous AEs dropped at every time interval as the study progressed (eFigure). Very few AEs of any type persisted through the end of the study. These safety results were accompanied by a high compliance rate and a high participation rate throughout the course of the study. Taken together, the available data for this AzA foam formulation support a favorable tolerability profile. The results of this study are consistent with and expand on data from an earlier investigation of similar design.8
Conclusion
The development of an AzA foam formulation with higher lipid content was intended to expand the treatment options available to physicians and patients who are managing rosacea. Most topical dermatologic treatments are currently delivered in classical formulations such as creams or gels, but patients who use topical therapies have rated messiness and ease of application among the most important characteristics affecting quality of life.17,21 Foam formulations may offer improvements in this regard; ease of application may minimize unnecessary manipulation of inflamed skin and contribute to a high level of user satisfaction.22 However, the design of the current study was limited to evaluating only the AzA foam formulation versus a foam vehicle, and direct comparisons of clinical efficacy and tolerability to other AzA topical preparations were not performed. Nonetheless, patients have previously reported that they would be more likely to comply with a recommended course of dermatologic foam therapy than other topical formulations.18 The proposed foam formulation was designed to attend to the specific needs of the dry and sensitive skin in rosacea by combining the demonstrated efficacy properties exhibited by AzA gel 15% with the good tolerability and acceptability of a lipid-containing foam formulation. Development of this formulation was targeted to obtain a product that would be highly spreadable, dry quickly, and be easy to apply. The available data for this AzA foam formulation support the value of this option in the topical treatment of rosacea. The success in reduction of overall disease severity, lack of any rebound after EoT, and the observed tolerability and high adherence rates suggest that this novel formulation is a useful addition to current treatment options for rosacea.
Addendum
After release of the study data for unblinding and statistical evaluation, the following inconsistency regarding patient distribution was noted: 1 participant was incorrectly evaluated as part of the AzA foam analysis group when in fact this patient was randomized to vehicle and was treated throughout the study with vehicle. This participant did not experience any AE and did not show any IGA improvement at the EoT. As this single case did not have an impact on the statistical conclusions or interpretation of the results, the released study data have not been changed. This deviation was described as a database erratum in the study report.
Acknowledgement—Editorial support through inVentiv Medical Communications, New York, New York, was provided by Bayer HealthCare Pharmaceuticals Inc.
APPENDIX
Supplementary Methods
Supplementary Study Design
This study met all local legal and regulatory requirements and was conducted according to the principles of the Declaration of Helsinki and the International Conference on Harmonization Good Clinical Practice guidelines. Before the start of the study and implementation, the protocol and all amendments were approved by the appropriate independent ethics committee or institutional review board at each study site. Two protocol amendments were implemented before the first participant visit.
Exclusion criteria included the presence of dermatoses that could interfere with rosacea diagnosis or evaluation, facial laser surgery or topical use of any medication to treat rosacea within 6 weeks before randomization, systemic use of any medications to treat rosacea, and known unresponsiveness to AzA treatment. Further standard exclusion criteria included alcohol or drug use or parallel participation in other clinical studies, which were necessary to exclude undue influence on study evaluations and/or participant safety. The study was conducted by qualified investigators at 48 centers in the United States.
The investigational product was filled in identical containers according to the randomization list generated by a computer program using blocks. Complete blocks of study medication were distributed to the centers. Eligible participants were randomized 1:1 into either AzA foam or vehicle treatment groups by assignment of a randomization number at baseline. A blind investigational product under the same randomization number was dispensed to and returned from participants by study personnel who were not involved in the assessments. Blinding was achieved by using labels on the investigational products that did not allow identification of the true medication.
Compliance was evaluated from participant diaries as well as the number of expected doses and actually applied doses.
Additional Efficacy Evaluations
A number of secondary variables (not reported here) were assessed, including changes in other manifestations of PPR, as well as participant assessments of treatment response, tolerability, cosmetic preferences, and quality of life.
Additional Safety
Investigators reported a yes or no response as to whether there was a reasonable causal relationship between AEs and treatment. Moreover, AEs that began at the start of or during treatment were considered treatment emergent. Cutaneous AEs were further assessed regarding location and duration. An AE was deemed local if it occurred at the application site and transient if it subsided within 60 minutes of onset.
Statistical Analysis
The primary efficacy analyses presented here were based on the full analysis set of participants who were randomized and had medication dispensed. For participants with no EoT value, the last nonmissing value was used including baseline (last-observation-carried-forward methodology). Participants who discontinued treatment prematurely because of lack of efficacy were considered to be treatment failures, regardless of the reported IGA score. Statistical significance was needed for both coprimary efficacy variables at a 1-sided 2.5% significance level to show confirmed superiority of AzA foam versus vehicle.
A number of sensitivity analyses were performed, including an analysis of the coprimary end points using observed data, analysis of the per-protocol population of participants who did not prematurely discontinue treatment and had no major protocol deviations, subgroup analyses, and the use of statistical methods to investigate the effect of missing observations. Analyses of success rate and nominal change in ILC were repeated for each postbaseline visit using χ² and t tests, respectively. All summary and statistical analyses were performed according to the study protocol (unchanged after the start of the study) using SAS version 9.2.
Results from a prior study provided the basis for the sample size, which was calculated to show a significant difference in both primary efficacy end points with a power of 90%.8 To allow for dropouts, 480 participants in each treatment group were to be randomized for a total of 960 participants.
1. Wilkin J, Dahl M, Detmar M, et al. Standard classification of rosacea: report of the National Rosacea Society Expert Committee on the Classification and Staging of Rosacea. J Am Acad Dermatol. 2002;46:584-587.
2. Del Rosso JQ. Advances in understanding and managing rosacea: part 1: connecting the dots between pathophysiological mechanisms and common clinical features of rosacea with emphasis on vascular changes and facial erythema. J Clin Aesthet Dermatol. 2012;5:16-25.
3. Huynh TT. Burden of disease: the psychosocial impact of rosacea on a patient’s quality of life. Am Health Drug Benefits. 2013;6:348-354.
4. Tan J, Berg M. Rosacea: current state of epidemiology. J Am Acad Dermatol. 2013;69(6 suppl 1):S27-S35.
5. Steinhoff M, Schauber J, Leyden JJ. New insights into rosacea pathophysiology: a review of recent findings. J Am Acad Dermatol. 2013;69(6 suppl 1):S15-S26.
6. Wollina U. Recent advances in the understanding and management of rosacea. F1000Prime Rep. 2014;6:50.
7. Del Rosso JQ, Thiboutot D, Gallo R, et al. Consensus recommendations from the American Acne & Rosacea Society on the management of rosacea, part 5: a guide on the management of rosacea. Cutis. 2014;93:134-138.
8. Draelos ZD, Elewski B, Staedtler G, et al. Azelaic acid foam 15% in the treatment of papulopustular rosacea: a randomized, double-blind, vehicle-controlled study. Cutis. 2013;92:306-317.
9. Yamasaki K, Di Nardo A, Bardan A, et al. Increased serine protease activity and cathelicidin promotes skin inflammation in rosacea. Nat Med. 2007;13:975-980.
10. Mastrofrancesco A, Ottaviani M, Aspite N, et al. Azelaic acid modulates the inflammatory response in normal human keratinocytes through PPARg activation. Exp Dermatol. 2010;19:813-820.
11. Akamatsu H, Komura J, Asada Y, et al. Inhibitory effect of azelaic acid on neutrophil functions: a possible cause for its efficacy in treating pathogenetically unrelated diseases. Arch Dermatol Res. 1991;283:162-166.
12. Coda AB, Hata T, Miller J, et al. Cathelicidin, kalli-krein 5, and serine protease activity is inhibited during treatment of rosacea with azelaic acid 15% gel. J Am Acad Dermatol. 2013;69:570-577.
13. van Zuuren EJ, Kramer SF, Carter BR, et al. Effective and evidence-based management strategies for rosacea: summary of a Cochrane systematic review. Br J Dermatol. 2011;165:760-781.
14. Thiboutot D, Thieroff-Ekerdt R, Graupe K. Efficacy and safety of azelaic acid (15%) gel as a new treatment for papulopustular rosacea: results from two vehicle-controlled, randomized phase III studies. J Am Acad Dermatol. 2003;48:836-845.
15. Thiboutot DM, Fleischer AB Jr, Del Rosso JQ, et al. Azelaic acid 15% gel once daily versus twice daily in papulopustular rosacea. J Drugs Dermatol. 2008;7:541-546.
16. Finacea [package insert]. Whippany, NJ: Bayer HealthCare Pharmaceuticals Inc; 2015.
17. Zhao Y, Jones SA, Brown MB. Dynamic foams in topical drug delivery. J Pharm Pharmacol. 2010;62:678-684.
18. Gottlieb AB, Ford RO, Spellman MC. The efficacy and tolerability of clobetasol propionate foam 0.05% in the treatment of mild to moderate plaque-type psoriasis of nonscalp regions. J Cutan Med Surg. 2003;7:185-192.
19. Loden M. Role of topical emollients and moisturizers in the treatment of dry skin barrier disorders. Am J Clin Dermatol. 2003;4:771-788.
20. Jackson JM, Pelle M. Topical rosacea therapy: the importance of vehicles for efficacy, tolerability and compliance. J Drugs Dermatol. 2011;10:627-633.
21. Housman TS, Mellen BG, Rapp SR, et al. Patients with psoriasis prefer solution and foam vehicles: a quantitative assessment of vehicle preference. Cutis. 2002;70:327-332.
22. Kircik LH, Bikowski JB. Vehicles matter: topical foam formulations. Practical Dermatology. January 2012(suppl):3-18.
Enoxaparin and Warfarin for Venous Thromboembolism Prophylaxis in Total Hip Arthroplasty: To Bridge or Not to Bridge?
According to the literature, the rate of deep venous thrombosis after total hip arthroplasty (THA) can be high (45%-63%) without prophylactic anticoagulation.1-6 A meta-analysis of 13 studies found a rate of 51%.7 As lower extremity deep venous thrombi are the initial source of symptomatic pulmonary emboli in about 90% of cases,8 THA patients are usually given medication postoperatively focused on prevention of these thromboembolic events.9 Chemoprophylaxis may involve warfarin, enoxaparin, or their combination in an anticoagulation bridge. Enoxaparin is one of many low-molecular-weight heparins (LMWHs). All LMWHs exert their anticoagulant effect by binding to antithrombin III.10 The binding of LMWH to antithrombin III catalyzes the inhibition of factor Xa by antithrombin III, disrupting clot formation.11
In its hydroquinone form, vitamin K is essential as a cofactor for carboxylation of the glutamic acid residues of the amino-terminals of the coagulation proteins II, VII, IX, and X, leading to their activation. Anticoagulation by warfarin is achieved by the inhibition of the reductase enzymes that produce vitamin K hydroquinone in the liver from vitamin K epoxide.12 This inhibition prevents activation of the clotting proteins.12,13 Prophylaxis with enoxaparin or warfarin can reduce the rate of venous thromboembolic disease to 3.6% and 3.7%, respectively.2 However, these medications inhibit the clotting cascade, and their use risks prolonging the healing process.9 The delay increases the risk for wound infection,14 which can lead to a longer hospital stay and therefore higher costs.
We conducted a study to compare patients who received warfarin only with patients who received warfarin bridged with enoxaparin as antithrombotic chemoprophylaxis after THA. Outcomes of interest were number of days until a dry wound was observed and length of hospital stay. We hypothesized that, compared with warfarin-only therapy, bridged therapy would increase the risk for prolonged wound healing and result in longer hospital stays.
Materials and Methods
At our 746-bed academic medical center, 121 THAs were performed between January 1, 2008 and December 31, 2009. This study was approved by the center’s Office for Human Subjects Protections institutional review board (IRB). The research involved collecting or studying existing data, documents, and records recorded anonymously by the investigator in such a manner that subjects could not be identified, directly or through identifiers linked to the subjects, and therefore patient consent was not needed. Therefore, the IRB waived the need for consent. Relevant data included in this study were extracted from patient medical records, given within 35 days of surgery. For each patient, discharge notes provided data on the hospital course, and nurses’ notes provided data on wound status after THA.
Propensity Score Matching
For accurate analysis, it was important to consider confounding factors in both patient groups. Some covariates that may influence accurate analysis are age,15 diabetes,16 sex,15,17 hypertension,18 and body mass index.15,19Propensity score, defined as the conditional probability of receiving treatment, given the observed background covariates, was initially defined by Rosenbaum20 and Rubin.21 The motivation behind propensity scores can be understood by considering an idealized situation in which the 2 groups are similar on all background characteristics. In nonexperimental studies, researchers aim to find for each treated individual a comparison individual who looks exactly the same as the treated individual with respect to observed pretreatment covariates. Thus, assuming no hidden bias, any difference in outcomes within these pairs can be attributed to the variable of interest and not to any other differences between the treated and comparison individuals. Our study is a typical nonexperimental retrospective study in which the 2 groups being compared are patients receiving warfarin only or warfarin bridged with enoxaparin. To minimize the influence of background covariates, we used matching procedures and present our results both with and without the use of matching techniques.
Data and Results
There are different matching algorithms aimed at matching groups. In our study, the optimal matching procedure alone could not produce adequately matched data, so we used both optimal matching20 and genetic matching.22,23 Genetic matching procedure with replacement22 can produce well-matched data—it matched each patient in the warfarin-only group with a patient in the bridged-therapy group and allowed different patients to be matched with 1 similar patient in the control group. However, as the same patients in the bridged-therapy group might be matched multiple times, it would complicate the after-matching analysis. We therefore used a 2-step matching procedure to obtain well-matched data, and a simplified analysis procedure after matching. In the first step, we implemented genetic matching with replacement, as introduced by Abadie and Imbens,22 to match each warfarin-only patient with 1 bridged-therapy patient. In the second step, we applied optimal matching to the 2 groups. This 2-step matching turned out to produce better matched pairs, as denoted by Rubin.21 Both matching steps were implemented using the MatchIt function in R.24
The balance of matching is checked using criteria suggested by Rubin21: (1) standardized difference of means of propensity score, (2) ratio of variances in propensity score in treated and control groups, and (3) for each covariate, ratio of variance in residuals orthogonal to propensity score in treated and control groups.
Table 1 lists the means of the background covariates for each group before and after matching. Table 2 lists the balance check results suggested by Rubin.21 After matching, all standardized differences of means are smaller than 0.25, and the variance ratios are between 0.5 and 2, which are the standards suggested21 for regression adjustment to be valid after matching.
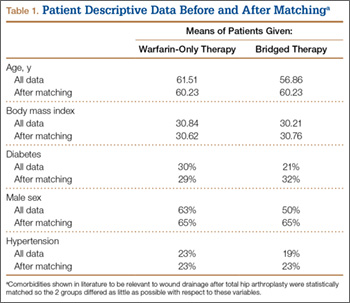
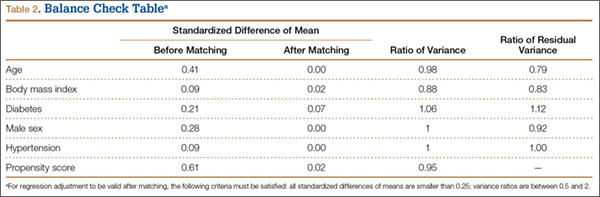
After genetic matching, 31 bridged-therapy patients and 57 warfarin-only patients remained. After optimal matching, there were 31 patients in each group. Poisson regressions of datasets before and after matching adjustment were fitted.
Results
Wounds of bridged-therapy patients took longer to heal than wounds of warfarin-only patients both before (odds ratio, 2.16; P < .05) and after matching data (odds ratio, 2.39; P < .05) with respect to confounding factors. In addition, bridged-therapy patients had longer hospital stays both before (odds ratio 1.20; P < .05) and after matching data (odds ratio, 1.27; P < .05) with respect to confounding factors. Figures 1 and 2 are histograms displaying the 2 groups and their outcomes.
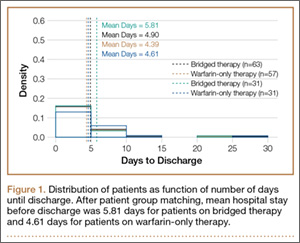
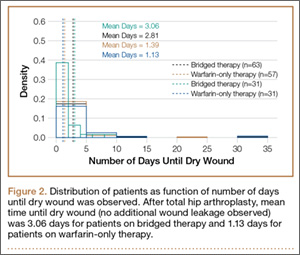
Discussion
For patients undergoing THA procedures, several important considerations should be taken into account. Colwell and colleagues2 showed that, compared with warfarin, enoxaparin offered a 0.1% higher rate of protection against venous thromboembolic disease after THA. However, patients given enoxaparin may face increased risks.25 Hallevi and colleagues26 demonstrated that, compared with warfarin, enoxaparin bridging increased the risk for serious bleeding in patients with cardioembolic stroke. In our review of the literature, we learned that the benefits of bridge therapy in thromboembolic disease have yet to be investigated in THA.
At our academic hospital, the extra costs associated with bridge therapy can be as much as about $200027 per day per patient. These costs can go much higher, depending on type of patient and types of resources used. Over the 2-year period covered by our study, the costs of using enoxaparin amounted to about $151,200 ($2000 × 1.2 days per patient). If bridging offers no significant protection against thromboembolic disease, then it would be more cost-effective to use a single anticoagulant, particularly enoxaparin, for high-risk patients.
There are significant risk factors associated with prolonged healing of surgical wounds. Protocols outlining these factors may help reduce costs. In addition, when deciding on the use of aggressive anticoagulation therapy, surgeons must consider the risks for prolonged leakage and infection in addition to the risk for thromboembolic disease. Protocols may aid in this process as well. Our study results showed that, compared with warfarin-only therapy, bridged therapy (enoxaparin and warfarin) was associated with longer hospital stays. Further research should examine whether there are advantages that justify the higher risks of delayed wound healing and subsequent infection. Improving our understanding of risk factors associated with anticoagulation therapy will make orthopedic surgery safer for patients.
1. Bergqvist D, Benoni G, Björgell O, et al. Low-molecular-weight heparin (enoxaparin) as prophylaxis against venous thromboembolism after total hip replacement. N Engl J Med. 1996;335(10):696-700.
2. Colwell CW Jr, Collis DK, Paulson R, et al. Comparison of enoxaparin and warfarin for the prevention of venous thromboembolic disease after total hip arthroplasty. Evaluation during hospitalization and three months after discharge. J Bone Joint Surg Am. 1999;81(7):932-940.
3. Haake DA, Berkman SA. Venous thromboembolic disease after hip surgery. Risk factors, prophylaxis, and diagnosis. Clin Orthop Relat Res. 1989;(242):212-231.
4. Johnson R, Carmichael JH, Almond HG, Loynes RP. Deep venous thrombosis following Charnley arthroplasty. Clin Orthop Relat Res. 1978;(132):24-30.
5. Stamatakis JD, Kakkar VV, Sagar S, Lawrence D, Nairn D, Bentley PG. Femoral vein thrombosis and total hip replacement. Br Med J. 1977;2(6081):223-225.
6. Turpie AG, Levine MN, Hirsh J, et al. A randomized controlled trial of a low-molecular-weight heparin (enoxaparin) to prevent deep-vein thrombosis in patients undergoing elective hip surgery. N Engl J Med. 1986;315(15):925-929.
7. Clagett GP, Anderson FA Jr, Heit J, Levine MN, Wheeler HB. Prevention of venous thromboembolism. Chest. 1995;108(4 suppl):312S-334S.
8. Westrich GH, Sánchez PM. Prevention and treatment of thromboembolic disease: an overview. Instr Course Lect. 2002;51:471-480.
9. Colwell CW Jr, Froimson MI, Mont MA, et al. Thrombosis prevention after total hip arthroplasty: a prospective, randomized trial comparing a mobile compression device with low-molecular-weight heparin. J Bone Joint Surg Am. 2010;92(3):527-535.
10. Fareed J, Jeske W, Hoppensteadt D, Clarizio R, Walenga JM. Low-molecular-weight heparins: pharmacologic profile and product differentiation. Am J Cardiol. 1998;82(5B):3L-10L.
11. Gerlach AT, Pickworth KK, Seth SK, Tanna SB, Barnes JF. Enoxaparin and bleeding complications: a review in patients with and without renal insufficiency. Pharmacotherapy. 2000;20(7):771-775.
12. Kamali F, Wood P, Ward A. Vitamin K deficiency amplifies anticoagulation response to ximelagatran: possible implications for direct thrombin inhibitors and their clinical safety. Ann Hematol. 2009;88(2):141-149.
13. Choonara IA, Malia RG, Haynes BP, et al. The relationship between inhibition of vitamin K1 2,3-epoxide reductase and reduction of clotting factor activity with warfarin. Br J Clin Pharmacol. 1988;25(1):1-7.
14. Saleh K, Olson M, Resig S, et al. Predictors of wound infection in hip and knee joint replacement: results from a 20 year surveillance program. J Orthop Res. 2002;20(3):506-515.
15. Ridgeway S, Wilson J, Charlet A, Kafatos G, Pearson A, Coello R. Infection of the surgical site after arthroplasty of the hip. J Bone Joint Surg Br. 2005;87(6):844-850.
16. Lai K, Bohm ER, Burnell C, Hedden DR. Presence of medical comorbidities in patients with infected primary hip or knee arthroplasties. J Arthroplasty. 2007;22(5):651-656.
17. Kurtz SM, Lau E, Schmier J, Ong KL, Zhao K, Parvizi J. Infection burden for hip and knee arthroplasty in the United States. J Arthroplasty. 2008;23(7):984-991.
18. Ahmed AA, Mooar PA, Kleiner M, Torg JS, Miyamoto CT. Hypertensive patients show delayed wound healing following total hip arthroplasty. PLoS One. 2011;6(8):e23224.
19. Lübbeke A, Stern R, Garavaglia G, Zurcher L, Hoffmeyer P. Differences in outcomes of obese women and men undergoing primary total hip arthroplasty. Arthritis Rheum. 2007;57(2):327-334.
20. Rosenbaum PR. A characterization of optimal designs for observational studies. J R Stat Soc Ser B. 1991;53(3):597-610.
21. Rubin DB. Using propensity scores to help design observational studies: application to the tobacco litigation. Health Serv Outcomes Res Methodol. 2001;2(1):169-188.
22. Abadie A, Imbens GW. Simple and Bias-Corrected Matching Estimators for Average Treatment Effects. Berkeley, CA: Department of Economics, University of California; 2002.
23. Diamond A, Sekhon J. Genetic matching for estimating causal effects: a new method of achieving balance in observational studies. Paper presented at: Annual Meeting of the Midwest Political Science Association; April 2005; Chicago, IL.
24. Imai K, King G, Lau O. logit: logistic regression for dichotomous dependent variables. In: Imai K, King G, Lau O. Zelig: Everyone’s Statistical Software. 2011; 238-244. http://gking.harvard.edu/zelig. Accessed May 26, 2015.
25. Patel VP, Walsh M, Sehgal B, Preston C, DeWal H, Di Cesare PE. Factors associated with prolonged wound drainage after primary total hip and knee arthroplasty. J Bone Joint Surg Am. 2007;89(1):33-38.
26. Hallevi H, Albright KC, Martin-Schild S, et al. Anticoagulation after cardioembolic stroke: to bridge or not to bridge? Arch Neurol. 2008;65(9):1169-1173.
27. Henry J. Kaiser Family Foundation. Hospital adjusted expenses per inpatient day [2010]. http://kff.org/other/state-indicator/expenses-per-inpatient-day/#table. Accessed May 26, 2015.
According to the literature, the rate of deep venous thrombosis after total hip arthroplasty (THA) can be high (45%-63%) without prophylactic anticoagulation.1-6 A meta-analysis of 13 studies found a rate of 51%.7 As lower extremity deep venous thrombi are the initial source of symptomatic pulmonary emboli in about 90% of cases,8 THA patients are usually given medication postoperatively focused on prevention of these thromboembolic events.9 Chemoprophylaxis may involve warfarin, enoxaparin, or their combination in an anticoagulation bridge. Enoxaparin is one of many low-molecular-weight heparins (LMWHs). All LMWHs exert their anticoagulant effect by binding to antithrombin III.10 The binding of LMWH to antithrombin III catalyzes the inhibition of factor Xa by antithrombin III, disrupting clot formation.11
In its hydroquinone form, vitamin K is essential as a cofactor for carboxylation of the glutamic acid residues of the amino-terminals of the coagulation proteins II, VII, IX, and X, leading to their activation. Anticoagulation by warfarin is achieved by the inhibition of the reductase enzymes that produce vitamin K hydroquinone in the liver from vitamin K epoxide.12 This inhibition prevents activation of the clotting proteins.12,13 Prophylaxis with enoxaparin or warfarin can reduce the rate of venous thromboembolic disease to 3.6% and 3.7%, respectively.2 However, these medications inhibit the clotting cascade, and their use risks prolonging the healing process.9 The delay increases the risk for wound infection,14 which can lead to a longer hospital stay and therefore higher costs.
We conducted a study to compare patients who received warfarin only with patients who received warfarin bridged with enoxaparin as antithrombotic chemoprophylaxis after THA. Outcomes of interest were number of days until a dry wound was observed and length of hospital stay. We hypothesized that, compared with warfarin-only therapy, bridged therapy would increase the risk for prolonged wound healing and result in longer hospital stays.
Materials and Methods
At our 746-bed academic medical center, 121 THAs were performed between January 1, 2008 and December 31, 2009. This study was approved by the center’s Office for Human Subjects Protections institutional review board (IRB). The research involved collecting or studying existing data, documents, and records recorded anonymously by the investigator in such a manner that subjects could not be identified, directly or through identifiers linked to the subjects, and therefore patient consent was not needed. Therefore, the IRB waived the need for consent. Relevant data included in this study were extracted from patient medical records, given within 35 days of surgery. For each patient, discharge notes provided data on the hospital course, and nurses’ notes provided data on wound status after THA.
Propensity Score Matching
For accurate analysis, it was important to consider confounding factors in both patient groups. Some covariates that may influence accurate analysis are age,15 diabetes,16 sex,15,17 hypertension,18 and body mass index.15,19Propensity score, defined as the conditional probability of receiving treatment, given the observed background covariates, was initially defined by Rosenbaum20 and Rubin.21 The motivation behind propensity scores can be understood by considering an idealized situation in which the 2 groups are similar on all background characteristics. In nonexperimental studies, researchers aim to find for each treated individual a comparison individual who looks exactly the same as the treated individual with respect to observed pretreatment covariates. Thus, assuming no hidden bias, any difference in outcomes within these pairs can be attributed to the variable of interest and not to any other differences between the treated and comparison individuals. Our study is a typical nonexperimental retrospective study in which the 2 groups being compared are patients receiving warfarin only or warfarin bridged with enoxaparin. To minimize the influence of background covariates, we used matching procedures and present our results both with and without the use of matching techniques.
Data and Results
There are different matching algorithms aimed at matching groups. In our study, the optimal matching procedure alone could not produce adequately matched data, so we used both optimal matching20 and genetic matching.22,23 Genetic matching procedure with replacement22 can produce well-matched data—it matched each patient in the warfarin-only group with a patient in the bridged-therapy group and allowed different patients to be matched with 1 similar patient in the control group. However, as the same patients in the bridged-therapy group might be matched multiple times, it would complicate the after-matching analysis. We therefore used a 2-step matching procedure to obtain well-matched data, and a simplified analysis procedure after matching. In the first step, we implemented genetic matching with replacement, as introduced by Abadie and Imbens,22 to match each warfarin-only patient with 1 bridged-therapy patient. In the second step, we applied optimal matching to the 2 groups. This 2-step matching turned out to produce better matched pairs, as denoted by Rubin.21 Both matching steps were implemented using the MatchIt function in R.24
The balance of matching is checked using criteria suggested by Rubin21: (1) standardized difference of means of propensity score, (2) ratio of variances in propensity score in treated and control groups, and (3) for each covariate, ratio of variance in residuals orthogonal to propensity score in treated and control groups.
Table 1 lists the means of the background covariates for each group before and after matching. Table 2 lists the balance check results suggested by Rubin.21 After matching, all standardized differences of means are smaller than 0.25, and the variance ratios are between 0.5 and 2, which are the standards suggested21 for regression adjustment to be valid after matching.
After genetic matching, 31 bridged-therapy patients and 57 warfarin-only patients remained. After optimal matching, there were 31 patients in each group. Poisson regressions of datasets before and after matching adjustment were fitted.
Results
Wounds of bridged-therapy patients took longer to heal than wounds of warfarin-only patients both before (odds ratio, 2.16; P < .05) and after matching data (odds ratio, 2.39; P < .05) with respect to confounding factors. In addition, bridged-therapy patients had longer hospital stays both before (odds ratio 1.20; P < .05) and after matching data (odds ratio, 1.27; P < .05) with respect to confounding factors. Figures 1 and 2 are histograms displaying the 2 groups and their outcomes.
Discussion
For patients undergoing THA procedures, several important considerations should be taken into account. Colwell and colleagues2 showed that, compared with warfarin, enoxaparin offered a 0.1% higher rate of protection against venous thromboembolic disease after THA. However, patients given enoxaparin may face increased risks.25 Hallevi and colleagues26 demonstrated that, compared with warfarin, enoxaparin bridging increased the risk for serious bleeding in patients with cardioembolic stroke. In our review of the literature, we learned that the benefits of bridge therapy in thromboembolic disease have yet to be investigated in THA.
At our academic hospital, the extra costs associated with bridge therapy can be as much as about $200027 per day per patient. These costs can go much higher, depending on type of patient and types of resources used. Over the 2-year period covered by our study, the costs of using enoxaparin amounted to about $151,200 ($2000 × 1.2 days per patient). If bridging offers no significant protection against thromboembolic disease, then it would be more cost-effective to use a single anticoagulant, particularly enoxaparin, for high-risk patients.
There are significant risk factors associated with prolonged healing of surgical wounds. Protocols outlining these factors may help reduce costs. In addition, when deciding on the use of aggressive anticoagulation therapy, surgeons must consider the risks for prolonged leakage and infection in addition to the risk for thromboembolic disease. Protocols may aid in this process as well. Our study results showed that, compared with warfarin-only therapy, bridged therapy (enoxaparin and warfarin) was associated with longer hospital stays. Further research should examine whether there are advantages that justify the higher risks of delayed wound healing and subsequent infection. Improving our understanding of risk factors associated with anticoagulation therapy will make orthopedic surgery safer for patients.
1. Bergqvist D, Benoni G, Björgell O, et al. Low-molecular-weight heparin (enoxaparin) as prophylaxis against venous thromboembolism after total hip replacement. N Engl J Med. 1996;335(10):696-700.
2. Colwell CW Jr, Collis DK, Paulson R, et al. Comparison of enoxaparin and warfarin for the prevention of venous thromboembolic disease after total hip arthroplasty. Evaluation during hospitalization and three months after discharge. J Bone Joint Surg Am. 1999;81(7):932-940.
3. Haake DA, Berkman SA. Venous thromboembolic disease after hip surgery. Risk factors, prophylaxis, and diagnosis. Clin Orthop Relat Res. 1989;(242):212-231.
4. Johnson R, Carmichael JH, Almond HG, Loynes RP. Deep venous thrombosis following Charnley arthroplasty. Clin Orthop Relat Res. 1978;(132):24-30.
5. Stamatakis JD, Kakkar VV, Sagar S, Lawrence D, Nairn D, Bentley PG. Femoral vein thrombosis and total hip replacement. Br Med J. 1977;2(6081):223-225.
6. Turpie AG, Levine MN, Hirsh J, et al. A randomized controlled trial of a low-molecular-weight heparin (enoxaparin) to prevent deep-vein thrombosis in patients undergoing elective hip surgery. N Engl J Med. 1986;315(15):925-929.
7. Clagett GP, Anderson FA Jr, Heit J, Levine MN, Wheeler HB. Prevention of venous thromboembolism. Chest. 1995;108(4 suppl):312S-334S.
8. Westrich GH, Sánchez PM. Prevention and treatment of thromboembolic disease: an overview. Instr Course Lect. 2002;51:471-480.
9. Colwell CW Jr, Froimson MI, Mont MA, et al. Thrombosis prevention after total hip arthroplasty: a prospective, randomized trial comparing a mobile compression device with low-molecular-weight heparin. J Bone Joint Surg Am. 2010;92(3):527-535.
10. Fareed J, Jeske W, Hoppensteadt D, Clarizio R, Walenga JM. Low-molecular-weight heparins: pharmacologic profile and product differentiation. Am J Cardiol. 1998;82(5B):3L-10L.
11. Gerlach AT, Pickworth KK, Seth SK, Tanna SB, Barnes JF. Enoxaparin and bleeding complications: a review in patients with and without renal insufficiency. Pharmacotherapy. 2000;20(7):771-775.
12. Kamali F, Wood P, Ward A. Vitamin K deficiency amplifies anticoagulation response to ximelagatran: possible implications for direct thrombin inhibitors and their clinical safety. Ann Hematol. 2009;88(2):141-149.
13. Choonara IA, Malia RG, Haynes BP, et al. The relationship between inhibition of vitamin K1 2,3-epoxide reductase and reduction of clotting factor activity with warfarin. Br J Clin Pharmacol. 1988;25(1):1-7.
14. Saleh K, Olson M, Resig S, et al. Predictors of wound infection in hip and knee joint replacement: results from a 20 year surveillance program. J Orthop Res. 2002;20(3):506-515.
15. Ridgeway S, Wilson J, Charlet A, Kafatos G, Pearson A, Coello R. Infection of the surgical site after arthroplasty of the hip. J Bone Joint Surg Br. 2005;87(6):844-850.
16. Lai K, Bohm ER, Burnell C, Hedden DR. Presence of medical comorbidities in patients with infected primary hip or knee arthroplasties. J Arthroplasty. 2007;22(5):651-656.
17. Kurtz SM, Lau E, Schmier J, Ong KL, Zhao K, Parvizi J. Infection burden for hip and knee arthroplasty in the United States. J Arthroplasty. 2008;23(7):984-991.
18. Ahmed AA, Mooar PA, Kleiner M, Torg JS, Miyamoto CT. Hypertensive patients show delayed wound healing following total hip arthroplasty. PLoS One. 2011;6(8):e23224.
19. Lübbeke A, Stern R, Garavaglia G, Zurcher L, Hoffmeyer P. Differences in outcomes of obese women and men undergoing primary total hip arthroplasty. Arthritis Rheum. 2007;57(2):327-334.
20. Rosenbaum PR. A characterization of optimal designs for observational studies. J R Stat Soc Ser B. 1991;53(3):597-610.
21. Rubin DB. Using propensity scores to help design observational studies: application to the tobacco litigation. Health Serv Outcomes Res Methodol. 2001;2(1):169-188.
22. Abadie A, Imbens GW. Simple and Bias-Corrected Matching Estimators for Average Treatment Effects. Berkeley, CA: Department of Economics, University of California; 2002.
23. Diamond A, Sekhon J. Genetic matching for estimating causal effects: a new method of achieving balance in observational studies. Paper presented at: Annual Meeting of the Midwest Political Science Association; April 2005; Chicago, IL.
24. Imai K, King G, Lau O. logit: logistic regression for dichotomous dependent variables. In: Imai K, King G, Lau O. Zelig: Everyone’s Statistical Software. 2011; 238-244. http://gking.harvard.edu/zelig. Accessed May 26, 2015.
25. Patel VP, Walsh M, Sehgal B, Preston C, DeWal H, Di Cesare PE. Factors associated with prolonged wound drainage after primary total hip and knee arthroplasty. J Bone Joint Surg Am. 2007;89(1):33-38.
26. Hallevi H, Albright KC, Martin-Schild S, et al. Anticoagulation after cardioembolic stroke: to bridge or not to bridge? Arch Neurol. 2008;65(9):1169-1173.
27. Henry J. Kaiser Family Foundation. Hospital adjusted expenses per inpatient day [2010]. http://kff.org/other/state-indicator/expenses-per-inpatient-day/#table. Accessed May 26, 2015.
Evaluation of 3 Fixation Devices for Tibial-Sided Anterior Cruciate Ligament Graft Backup Fixation
Restoration of stability with return to activity is generally expected after anterior cruciate ligament (ACL) reconstruction; long-term success rates range from 75% to 95%.1 However, graft failure occurs most frequently with soft-tissue grafts fixated only with interference screws.2,3 Fixation failure also occurs more frequently at the tibial site.2 This failure has been attributed to extensive graft slippage in cases of soft-tissue fixation with interference screws.2 Interference screw fixation alone, with a double-looped hamstring tendon graft, fails at 350 N in young human tibiae.4,5 However, failure is limited with use of a bone–tendon–bone graft or with backup fixation, particularly at the tibial site.3 The superiority of bicortical fixation has also been proven.5-7
In addition, as shown in a goat model, ACL graft fixation is a major cause of failure in the immediate postoperative period, before biological incorporation of the graft.8 Fixation techniques for soft-tissue grafts must withstand stresses during the healing period (grafts may take up to 12 weeks to incorporate).9 Failures may result from forces exerted on the graft—forces that may be as high as 450 to 700 N during daily activities.10,11 Within the tibial tunnel, various fixation devices are used, including interference screws, staples, pins, buttons, and interference screw/sheath constructs.12,13 Primary fixation is commonly achieved with interference screws because of their ease of insertion and greater stiffness. However, fixation of the soft-tissue graft is influenced by several variables, including bone density, insertion torque, thread geometry, and interference screw material.14-16 Many of these variables, which are a source of inconsistency and concern during the immediate postoperative period, have led surgeons to seek alternative methods of backup fixation at the tibial site. Nevertheless, good clinical and subjective results have been found after ACL reconstruction with a 4-stranded semitendinosus tendon at 10-year follow-up.17
An anchor used in rotator cuff repair is the SwiveLock system (Arthrex). Major advantages of this system include ease and speed of insertion, good strength, and reduced need for later hardware removal.
We conducted a study to biomechanically evaluate 3 methods of tibial-sided fixation for ACL reconstruction: fully threaded interference screw only, interference screw backed with 4.75-mm SwiveLock anchor, and fully threaded bio-interference screw backed with 4.5-mm bicortical screw. We hypothesized that a fully threaded bio-interference screw backed with a 4.75-mm SwiveLock anchor would provide mechanical strength no different from that provided by backup fixation with a bicortical post at the tibial site. We further hypothesized that SwiveLock backup fixation would provide more strength than fixation with bio-interference screw alone.
Materials and Methods
The design of this study was adapted from one used by Walsh and colleagues,3 who compared 3 fixation methods: retrograde interference screw, suture button, and combined fixation. Tibiae inspected before selection showed no signs of injury or abnormality. Bovine extensor tendons, which lacked any defects along their entire length, were stored in saline 0.9% solution. Both the tibiae and the extensor tendons were stored at –20°C before completion of the tibial-sided ACL reconstruction. Thirty fresh-frozen, skeletally mature porcine proximal tibiae were selected and thawed at 4°C before preparation. Specimens were prepared by potting the diaphysis in fiberglass resin, and a tunnel 9 mm in diameter was drilled through the anteromedial aspect of the tibia.
For consistency, one author (CAV) prepared all 30 specimens. Both tails of all 30 bovine extensor tendons were whip-stitched with No. 2 FiberLoop (Arthrex) 9 mm in diameter. Grafts and tibiae were randomly divided into 3 sample groups. The first group was prepared by antegrade graft fixation within the tibial tunnel using a fully threaded 9×28-mm BioComposite interference screw (Arthrex). The second and third groups used the same primary fixation within the tibial tunnel along with 2 types of secondary fixation. These backup fixation groups included a 4.5-mm titanium bicortical post (Arthrex) and a 4.75-mm BioComposite SwiveLock C anchor (Arthrex) (Figure 1). The FiberLoop at the ends of the distal graft tails for backup groups were fixated 1 cm distal to the tibial tunnel and tapped before insertion of backup devices (Figures 2A, 2B). Insertion was completed after 4.5-mm bicortical and 4.75-mm unicortical drilling and tapping of the anteromedial cortices for the titanium posts and SwiveLocks, respectively. The free ends of the whip-stitched No. 2 FiberLoop were tied to the proximal end of the titanium post with a single surgical knot followed by 5 square knots.3 The free ends of the No. 2 FiberLoop were inserted into the eyelet of the 4.75-mm SwiveLock and 1 cm directly inferior to the tibial tunnel. Interference fit of FiberLoop with SwiveLock was achieved within the corticocancellous bone of the tibiae. All samples retained a 30-mm tendon loop superior to the tibial plateau to simulate intra-articular ACL length. Specimens were then stored at –20°C and thawed at 4°C before biomechanical testing.
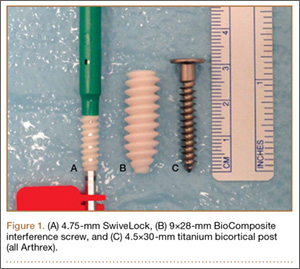
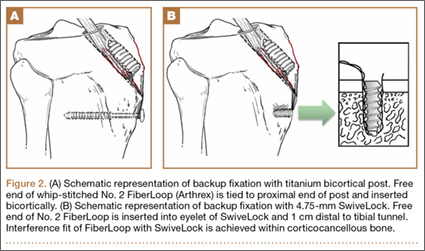
Each of the 30 tibiae was tested once. Each testing group consisted of 10 porcine tibiae. The tendons were kept moist during the entire testing procedure by spraying them thoroughly with saline 0.9% solution. Mechanical testing was performed with an Instron 8871 system with a 5-kN load cell secured to the crosshead. A fixed-angle aperture, attached to the testing surface, was adjusted so that the tendon would be pulled in line with the tibial tunnel. A hook fixture suspended from clevis and dowel was used to secure the tendon to the crosshead (Figure 3). A small preload of 5 N manually applied to each sample was followed by a precycling regimen of 10 cycles between 10 N and 50 N at 1 Hz. Precycling was performed to remove slack from the system. Mechanical testing consisted of 500 cycles between 50 N and 250 N at 1 Hz followed by pull to failure at 20 mm per minute. Load and displacement data were recorded at 500 Hz.
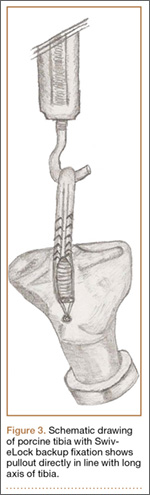
An a priori power analysis was not performed because 6 specimens per group in the study from which the testing protocol was adapted demonstrated sufficient power among 3 testing categories.3 In addition, other studies have demonstrated similar testing protocols using 10 specimens per testing group.7,12,13,18 The data for each sample were analyzed with OriginPro 8.0 software (OriginLab). Ultimate load, yield load, stiffness, and cyclic displacement of the 3 sample groups were compared with 1-way analysis of variance (α = 0.05). Holm-Sidak tests were used for post hoc analysis.19P < .05 was statistically significant.
Results
None of the 30 specimens failed during preloading. Modes of failure were consistent among groups. All 10 specimens in the interference-screw-only group failed by graft slippage past the screw in the tibial tunnel. Nineteen of the 20 specimens in the backup-fixation groups failed by graft slippage past the screw and suture cutout through the distal graft tail. In the bicortical-post backup group, 1 failure was attributed to tendon tearing proximal to whip-stitching. There were no instances of hardware breakage or failure of either titanium screw or SwiveLock anchor.
Mean (SD) cyclic displacement was higher in the interference-screw-only group, 3.5 (2.2) mm, than in the SwiveLock backup group, 2.6 (0.5) mm, and the bicortical-post backup group, 2.1 (0.6) mm; no statistical significance was demonstrated between any 2 of these groups alone (P = .12) (Figure 4). Mean (SD) pullout stiffness was higher in the bicortical-post backup group, 192 (48) N/mm, than in the SwiveLock backup group, 164 (53) N/mm, and the screw-only group, 163 (64) N/mm (P = .42) (Figure 5). Mean (SD) initial load at 5 mm of displacement was higher in the bicortical-post backup group, 482 (156) N, and the SwiveLock backup group, 423 (94) N, than in the screw-only group, 381 (169) N (P = .30).
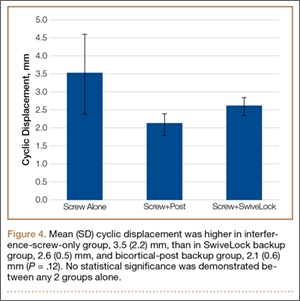
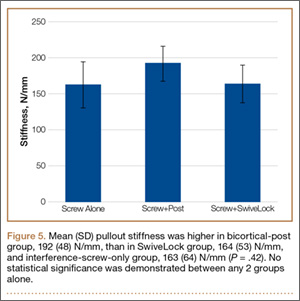
Mean (SD) yield load was higher in the bicortical-post backup group, 829 (253) N, than in the SwiveLock backup group, 642 (172) N, and the interference-screw-only group, 496 (133) N (P = .003). Statistical significance was demonstrated between the screw-only and bicortical-post groups (P = .002) and between the screw-only and SwiveLock groups (P = .048). There was no statistical difference between the bicortical-post and SwiveLock groups (P = .07).
Mean (SD) ultimate load to failure was higher in the bicortical-post backup group, 1148 (186) N, than in the SwiveLock backup group, 1007 (176) N, and the interference-screw-only group, 778 (139) N (Figure 6). The difference was statistically significant, whereby the screw-only group failed at a lower load compared with the bicortical-post group (P < .001) and the SwiveLock group (P = .005). The 2 backup groups were not statistically different (P = .1).
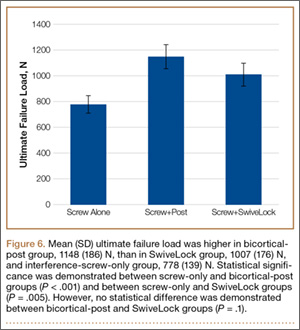
Discussion
We investigated whether a fully threaded bio-interference screw backed with a 4.75-mm SwiveLock anchor would provide mechanically equivalent pullout strength within the tibial tunnel during ACL reconstruction with soft-tissue allografts in comparison either with a fully threaded bio-interference screw backed with a bicortical post or with a fully threaded bio-interference screw without backup fixation. The results of the study support this hypothesis. With SwiveLock used for backup fixation, there was no significant difference in stiffness or cyclic load displacement between the screw-only, SwiveLock, and bicortical-post groups. However, adding backup fixation could particularly help improve fixation consistency. Specifically, although after only 500 cycles there was no statistically significant difference in cyclic displacement, continued cycling may be clinically relevant if graft slippage exceeded limits to allow for healing within the tibial tunnel. Conversely, a significantly larger difference was found between the SwiveLock, bicortical-post, and screw-only groups in yield load and ultimate load to failure. However, there was no significant difference between the SwiveLock and bicortical-post groups.
In this study, interference screw with SwiveLock backup demonstrated a mean (SD) ultimate load to failure of 1007 (176) N, comparable to that found by Walsh and colleagues3 for retrograde bio-interference screw with suture button, 1027 (157.11) N. In a study comparing quadrupled hamstring tibial graft fixation, Intrafix (DePuy Mitek) and an 8×25-mm Bioscrew (Linvatec) demonstrated mean (SD) single-cycle yield loads of 1332 (304) N and 612 (176) N, respectively.13 These results are similar to the ultimate yield loads in the present study: bicortical-post group, 1148 (186) N; SwiveLock group, 1007 (176) N; screw-only group, 778 (139) N. Differences may be attributed to hamstring tendons used in a quadrupled manner in the aforementioned study.12,13 Last, mean (SD) ultimate load to failure in a study that used only a retrograde bio-interference screw (9×20 mm) was 679.00 (109.44) N,3 similar to the 778 (139) N found for interference-screw-only in the present study. The difference is likely attributable to the longer screw (9×28 mm) in our study. Using SwiveLock C in cortical bone, Barber and colleagues18 found mean (SD) loads to failure up to 711.9 (89.1) N.
Clinically, it has been shown that a statistically significant increase in anterior laxity occurred between 4 months and 2 years in 10.7% of patients who underwent hamstring ACL reconstruction.20 The knees were clinically categorized as unstable or severely abnormal. The authors concluded that the clinical outcome was more likely influenced by the methods used to fix the free ends of the graft, specifically with 2 staples or a washer. To simulate early postoperative rehabilitation in the present study, cyclic loading of the graft was performed. Ultimate load to failure was then determined in order to evaluate catastrophic failure strength of the backup fixation devices in comparison with the interference-screw-only group without supplementary fixation.
It has been shown in autologous hamstring ACL reconstruction that a centrally placed polyethylene screw with sheath (Intrafix) performed as well as a standard, eccentrically placed metal interference screw with staple.10 It is therefore logical that backup fixation with use of a similar device (eg, SwiveLock, bicortical post) is necessary to ensure comparable clinical outcomes in relation to a screw/sheath device that has been shown to endure the highest yield loads.2,9,12,13,21-23 Potential benefits of using SwiveLock anchors for backup fixation include a statistically significant increased mean (SD) ultimate yield load of 229 (176) N over interference screw only. These results are similar to those in comparable studies: 218.3 (59.7) N24 and 165 (24.15) N25 in healthy bone with a reported bone mineral density (BMD) of 1.39 g/cm2, similar to that of skeletally mature porcine tibia (1.220-1.675 g/cm²).3 In addition, ease of insertion of this device over a bicortical post was demonstrated. The titanium post required bicortical drilling as well as measurement with a depth gauge to ensure adequate screw length. This process appeared to require more time during specimen preparation and theoretically could prove to be more dangerous clinically.7 However, caution in using a SwiveLock anchor in osteoporotic bone is advised because of reduced pullout strength.26 In this case, bicortical-post backup fixation may be more suitable. Moreover, although not demonstrated in this study, hardware prominence and irritation with a post may cause postoperative morbidity necessitating future removal.20 Hardware removal was the most common reason for additional surgery using hamstring tendons as graft.20 A second surgery for hardware removal was required in 21% of these patients.20 This is unlikely to occur with a SwiveLock, as the anchor is buried within cortical bone.
Limitations
Regarding use of nonhuman tissues in a biomechanical model, porcine tibiae and bovine extensor tendons were used because of availability, consistency among specimens, and cost-effectiveness. However, bovine extensor tendons have been shown to exhibit stiffness and viscoelastic properties similar to those of a human hamstring graft.27 In addition, the BMD of the porcine tibiae used in this study was not tested because of time involved and cost-efficiency. However, it has been shown that average BMD of porcine tibiae, 1.220-1.675 g/cm², is similar to that in a young athletic population, 1.24-1.62 g/cm2.3,28-31 We therefore assumed similarity to a young athletic population and uniformity of BMD of the porcine tibiae used in this study.
In addition, the biomechanical testing protocol did not simulate physiologic loading within the tibial tunnel. Moreover, the testing protocol used loads of only 250 N during cyclic testing for 500 cycles. This simulates only the early rehabilitation period and not the healing period, which may last up to 12 weeks.9 In addition, as previously mentioned, forces on the graft may be as high as 450 to 700 N.11,32 Pullout testing in line with the long axis of the tibia was performed in order to compare mechanical testing results with those of similar studies.3,12,13 Last, the P of .07 for the comparison of ultimate load to failure between the 2 backup fixation groups suggests that this study may have been underpowered.
Conclusion
This study demonstrated an effective, alternative, and equivalent backup fixation device that can help prevent graft slippage within the tibial tunnel during soft-tissue ACL reconstruction. Potential benefits of using SwiveLock anchors for backup fixation include a significantly increased ultimate yield load (229 N) when supplementing an interference screw, ease of insertion compared with a bicortical post, and the improbable need for future hardware removal. We support using SwiveLock for supplementary fixation at the tibial tunnel site when using soft-tissue grafts in ACL reconstruction.
1. Wetzler MJ, Bartolozzi AR, Gillespie MJ, Rubenstein DL, Ciccotti MG, Miller LS. Revision anterior cruciate ligament reconstruction. Oper Tech Orthop. 1996;6(3):181-189.
2. Scheffler SU, Südkamp NP, Göckenjan A, Hoffmann RF, Weiler A. Biomechanical comparison of hamstring and patellar tendon graft anterior cruciate ligament reconstruction techniques: the impact of fixation level and fixation method under cyclic loading. Arthroscopy. 2002;18(3):304-315.
3. Walsh MP, Wijdicks CA, Parker JB, Hapa O, LaPrade RF. A comparison between a retrograde interference screw, suture button, and combined fixation on the tibial side in an all-inside anterior cruciate ligament reconstruction: a biomechanical study in a porcine model. Am J Sports Med. 2009;37(1):160-167.
4. Howell SM, Hull ML. Aggressive rehabilitation using hamstring tendons: graft construct, tibial tunnel placement, fixation properties, and clinical outcome. Am J Knee Surg. 1998;11(2):120-127.
5. Magen HE, Howell SM, Hull ML. Structural properties of six tibial fixation methods for anterior cruciate ligament soft tissue grafts. Am J Sports Med. 1999;27(1):35-43.
6. Beynnon BD, Meriam CM, Ryder SH, Fleming BC, Johnson RJ. The effect of screw insertion torque on tendons fixed with spiked washers. Am J Sports Med. 1998;26(4):536-539.
7. Post WR, King SS. Neurovascular risk of bicortical tibial drilling for screw and spiked washer fixation of soft-tissue anterior cruciate ligament graft. Arthroscopy. 2001;17(3):244-247.
8. Holden JP, Grood ES, Butler DL, et al. Biomechanics of fascia lata ligament replacements: early postoperative changes in the goat. J Orthop Res. 1988;6(5):639-647.
9. Rodeo SA, Arnoczky SP, Torzilli PA, Hidaka C, Warren RF. Tendon-healing in a bone tunnel. A biomechanical and histological study in the dog. J Bone Joint Surg Am. 1993;75(12):1795-1803.
10. Frank CB, Jackson DW. The science of reconstruction of the anterior cruciate ligament. J Bone Joint Surg Am. 1997;79(10):1556-1576.
11. Markolf KL, Willems MJ, Jackson SR, Finerman GA. In situ calibration of miniature sensors implanted into the anterior cruciate ligament. Part I: strain measurements. J Orthop Res. 1998;16(4):455-463.
12. Kousa P, Teppo LN, Jarvinen TL, Vihavainen M, Kannus P, Jarvinen M. The fixation strength of six hamstring tendon graft fixation devices in anterior cruciate ligament reconstruction: I. Femoral site. Am J Sports Med. 2003;3 (2)1:174-181.
13. Kousa P, Jarvinen TL, Vihavainen M, Kannus P, Jarvinen M. The fixation strength of six hamstring tendon graft fixation devices in anterior cruciate ligament reconstruction: II. Tibial site. Am J Sports Med. 2003;31(2):182-188.
14. Brand JC Jr, Pienkowski D, Steenlage E, Hamilton D, Johnson DL, Caborn DN. Interference screw fixation strength of a quadrupled hamstring tendon graft is directly related to bone mineral density and insertion torque. Am J Sports Med. 2000;28(5):705-710.
15. Weiler A, Hoffmann RF, Siepe CJ, Kolbeck SF, Südkamp NP. The influence of screw geometry on hamstring tendon interference fit fixation. Am J Sports Med. 2000;28(3):356-359.
16. Weiler A, Hoffmann RF, Stähelin AC, Bail HJ, Siepe CJ, Südkamp NP. Hamstring tendon fixation using interference screws: a biomechanical study in calf tibial bone. Arthroscopy. 1998;14(1):29-37.
17. Streich NA, Reichenbacher S, Barié A, Buchner M, Schmitt H. Long-term outcome of anterior cruciate ligament reconstruction with an autologous four-strand semitendinosus tendon autograft. Int Orthop. 2013;37(2):279-284.
18. Barber FA, Herbert MA, Beavis C, Barrera Oro F. Suture anchor materials, eyelets, and designs: update 2008. Arthroscopy. 2008;24(8):859-867.
19. Aickin M, Gensler H. Adjusting for multiple testing when reporting research results: the Bonferroni vs Holm methods. Am J Public Health. 1996;86(5):726-728.
20. Howell SM, Deutsch ML. Comparison of endoscopic and two-incision techniques for reconstructing a torn anterior cruciate ligament using hamstring tendons. Arthroscopy. 1999;15(6):594-606.
21. Gwynne-Jones DP, Draffin J, Vane A, Craig R, McMahon S. Failure strengths of concentric and eccentric implants for hamstring graft fixation. ANZ J Surg. 2008;78(3):177-181.
22. Hayes DA, Watts MC, Tevelen GA, Crawford RW. Central versus peripheral tibial screw placement in hamstring anterior cruciate ligament reconstruction: in vitro biomechanics. Arthroscopy. 2005;21(6):703-706.
23. Shino K, Pflaster DS. Comparison of eccentric and concentric screw placement for hamstring graft fixation in the tibial tunnel. Knee Surg Sports Traumatol Arthrosc. 2000;8(2):73-75.
24. Prevrhal S, Fuerst T, Fan B, et al. Quantitative ultrasound of the tibia depends on both cortical density and thickness. Osteoporosis Int. 2001;12(1):28-34.
25. Pietschmann MF, Gülecyüz MF, Fieseler S, et al. Biomechanical stability of knotless suture anchors used in rotator cuff repair in healthy and osteopenic bone. Arthroscopy. 2010;26(8):1035-1044.
26. Burns JP, Snyder SJ, Albritton M. Arthroscopic rotator cuff repair using triple-loaded anchors, suture shuttles, and suture savers. J Am Acad Orthop Surg. 2007;15(7):432-444.
27. Tetsumura S, Fujita A, Nakajima M, Abe M. Biomechanical comparison of different fixation methods on the tibial side in anterior cruciate ligament reconstruction: a biomechanical study in porcine tibial bone. J Orthop Sci. 2006;11(3):278-282.
28. Alfredson H, Nordstrom P, Lorentzon R. Total and regional bone mass in female soccer players. Calcif Tissue Int. 1996;59(6):438-442.
29. Nevill AM, Holder RL, Stewart AD. Modeling elite male athletes’ peripheral bone mass, assessed using regional dual x-ray absorptiometry. Bone. 2003;32(1):62-68.
30. Nordström P, Lorentzon R. Site-specific bone mass differences of the lower extremities in 17-year-old ice hockey players. Calcif Tissue Int. 1996;59(6):4443-4448.
31. Patzer T, Santo G, Olender GD, Wellmann M, Hurschler C, Schofer MD. Suprapectoral or subpectoral position for biceps tenodesis: biomechanical comparison of four different techniques in both positions. J Shoulder Elbow Surg. 2012;21(1):116-125.
32. De Wall M, Scholes CJ, Patel S, Coolican MR, Parker DA. Tibial fixation in anterior cruciate ligament reconstruction: a prospective randomized study comparing metal interference screw and staples with a centrally placed polyethylene screw and sheath. Am J Sports Med. 2011;39(9):1858-1864.
Restoration of stability with return to activity is generally expected after anterior cruciate ligament (ACL) reconstruction; long-term success rates range from 75% to 95%.1 However, graft failure occurs most frequently with soft-tissue grafts fixated only with interference screws.2,3 Fixation failure also occurs more frequently at the tibial site.2 This failure has been attributed to extensive graft slippage in cases of soft-tissue fixation with interference screws.2 Interference screw fixation alone, with a double-looped hamstring tendon graft, fails at 350 N in young human tibiae.4,5 However, failure is limited with use of a bone–tendon–bone graft or with backup fixation, particularly at the tibial site.3 The superiority of bicortical fixation has also been proven.5-7
In addition, as shown in a goat model, ACL graft fixation is a major cause of failure in the immediate postoperative period, before biological incorporation of the graft.8 Fixation techniques for soft-tissue grafts must withstand stresses during the healing period (grafts may take up to 12 weeks to incorporate).9 Failures may result from forces exerted on the graft—forces that may be as high as 450 to 700 N during daily activities.10,11 Within the tibial tunnel, various fixation devices are used, including interference screws, staples, pins, buttons, and interference screw/sheath constructs.12,13 Primary fixation is commonly achieved with interference screws because of their ease of insertion and greater stiffness. However, fixation of the soft-tissue graft is influenced by several variables, including bone density, insertion torque, thread geometry, and interference screw material.14-16 Many of these variables, which are a source of inconsistency and concern during the immediate postoperative period, have led surgeons to seek alternative methods of backup fixation at the tibial site. Nevertheless, good clinical and subjective results have been found after ACL reconstruction with a 4-stranded semitendinosus tendon at 10-year follow-up.17
An anchor used in rotator cuff repair is the SwiveLock system (Arthrex). Major advantages of this system include ease and speed of insertion, good strength, and reduced need for later hardware removal.
We conducted a study to biomechanically evaluate 3 methods of tibial-sided fixation for ACL reconstruction: fully threaded interference screw only, interference screw backed with 4.75-mm SwiveLock anchor, and fully threaded bio-interference screw backed with 4.5-mm bicortical screw. We hypothesized that a fully threaded bio-interference screw backed with a 4.75-mm SwiveLock anchor would provide mechanical strength no different from that provided by backup fixation with a bicortical post at the tibial site. We further hypothesized that SwiveLock backup fixation would provide more strength than fixation with bio-interference screw alone.
Materials and Methods
The design of this study was adapted from one used by Walsh and colleagues,3 who compared 3 fixation methods: retrograde interference screw, suture button, and combined fixation. Tibiae inspected before selection showed no signs of injury or abnormality. Bovine extensor tendons, which lacked any defects along their entire length, were stored in saline 0.9% solution. Both the tibiae and the extensor tendons were stored at –20°C before completion of the tibial-sided ACL reconstruction. Thirty fresh-frozen, skeletally mature porcine proximal tibiae were selected and thawed at 4°C before preparation. Specimens were prepared by potting the diaphysis in fiberglass resin, and a tunnel 9 mm in diameter was drilled through the anteromedial aspect of the tibia.
For consistency, one author (CAV) prepared all 30 specimens. Both tails of all 30 bovine extensor tendons were whip-stitched with No. 2 FiberLoop (Arthrex) 9 mm in diameter. Grafts and tibiae were randomly divided into 3 sample groups. The first group was prepared by antegrade graft fixation within the tibial tunnel using a fully threaded 9×28-mm BioComposite interference screw (Arthrex). The second and third groups used the same primary fixation within the tibial tunnel along with 2 types of secondary fixation. These backup fixation groups included a 4.5-mm titanium bicortical post (Arthrex) and a 4.75-mm BioComposite SwiveLock C anchor (Arthrex) (Figure 1). The FiberLoop at the ends of the distal graft tails for backup groups were fixated 1 cm distal to the tibial tunnel and tapped before insertion of backup devices (Figures 2A, 2B). Insertion was completed after 4.5-mm bicortical and 4.75-mm unicortical drilling and tapping of the anteromedial cortices for the titanium posts and SwiveLocks, respectively. The free ends of the whip-stitched No. 2 FiberLoop were tied to the proximal end of the titanium post with a single surgical knot followed by 5 square knots.3 The free ends of the No. 2 FiberLoop were inserted into the eyelet of the 4.75-mm SwiveLock and 1 cm directly inferior to the tibial tunnel. Interference fit of FiberLoop with SwiveLock was achieved within the corticocancellous bone of the tibiae. All samples retained a 30-mm tendon loop superior to the tibial plateau to simulate intra-articular ACL length. Specimens were then stored at –20°C and thawed at 4°C before biomechanical testing.
Each of the 30 tibiae was tested once. Each testing group consisted of 10 porcine tibiae. The tendons were kept moist during the entire testing procedure by spraying them thoroughly with saline 0.9% solution. Mechanical testing was performed with an Instron 8871 system with a 5-kN load cell secured to the crosshead. A fixed-angle aperture, attached to the testing surface, was adjusted so that the tendon would be pulled in line with the tibial tunnel. A hook fixture suspended from clevis and dowel was used to secure the tendon to the crosshead (Figure 3). A small preload of 5 N manually applied to each sample was followed by a precycling regimen of 10 cycles between 10 N and 50 N at 1 Hz. Precycling was performed to remove slack from the system. Mechanical testing consisted of 500 cycles between 50 N and 250 N at 1 Hz followed by pull to failure at 20 mm per minute. Load and displacement data were recorded at 500 Hz.
An a priori power analysis was not performed because 6 specimens per group in the study from which the testing protocol was adapted demonstrated sufficient power among 3 testing categories.3 In addition, other studies have demonstrated similar testing protocols using 10 specimens per testing group.7,12,13,18 The data for each sample were analyzed with OriginPro 8.0 software (OriginLab). Ultimate load, yield load, stiffness, and cyclic displacement of the 3 sample groups were compared with 1-way analysis of variance (α = 0.05). Holm-Sidak tests were used for post hoc analysis.19P < .05 was statistically significant.
Results
None of the 30 specimens failed during preloading. Modes of failure were consistent among groups. All 10 specimens in the interference-screw-only group failed by graft slippage past the screw in the tibial tunnel. Nineteen of the 20 specimens in the backup-fixation groups failed by graft slippage past the screw and suture cutout through the distal graft tail. In the bicortical-post backup group, 1 failure was attributed to tendon tearing proximal to whip-stitching. There were no instances of hardware breakage or failure of either titanium screw or SwiveLock anchor.
Mean (SD) cyclic displacement was higher in the interference-screw-only group, 3.5 (2.2) mm, than in the SwiveLock backup group, 2.6 (0.5) mm, and the bicortical-post backup group, 2.1 (0.6) mm; no statistical significance was demonstrated between any 2 of these groups alone (P = .12) (Figure 4). Mean (SD) pullout stiffness was higher in the bicortical-post backup group, 192 (48) N/mm, than in the SwiveLock backup group, 164 (53) N/mm, and the screw-only group, 163 (64) N/mm (P = .42) (Figure 5). Mean (SD) initial load at 5 mm of displacement was higher in the bicortical-post backup group, 482 (156) N, and the SwiveLock backup group, 423 (94) N, than in the screw-only group, 381 (169) N (P = .30).
Mean (SD) yield load was higher in the bicortical-post backup group, 829 (253) N, than in the SwiveLock backup group, 642 (172) N, and the interference-screw-only group, 496 (133) N (P = .003). Statistical significance was demonstrated between the screw-only and bicortical-post groups (P = .002) and between the screw-only and SwiveLock groups (P = .048). There was no statistical difference between the bicortical-post and SwiveLock groups (P = .07).
Mean (SD) ultimate load to failure was higher in the bicortical-post backup group, 1148 (186) N, than in the SwiveLock backup group, 1007 (176) N, and the interference-screw-only group, 778 (139) N (Figure 6). The difference was statistically significant, whereby the screw-only group failed at a lower load compared with the bicortical-post group (P < .001) and the SwiveLock group (P = .005). The 2 backup groups were not statistically different (P = .1).
Discussion
We investigated whether a fully threaded bio-interference screw backed with a 4.75-mm SwiveLock anchor would provide mechanically equivalent pullout strength within the tibial tunnel during ACL reconstruction with soft-tissue allografts in comparison either with a fully threaded bio-interference screw backed with a bicortical post or with a fully threaded bio-interference screw without backup fixation. The results of the study support this hypothesis. With SwiveLock used for backup fixation, there was no significant difference in stiffness or cyclic load displacement between the screw-only, SwiveLock, and bicortical-post groups. However, adding backup fixation could particularly help improve fixation consistency. Specifically, although after only 500 cycles there was no statistically significant difference in cyclic displacement, continued cycling may be clinically relevant if graft slippage exceeded limits to allow for healing within the tibial tunnel. Conversely, a significantly larger difference was found between the SwiveLock, bicortical-post, and screw-only groups in yield load and ultimate load to failure. However, there was no significant difference between the SwiveLock and bicortical-post groups.
In this study, interference screw with SwiveLock backup demonstrated a mean (SD) ultimate load to failure of 1007 (176) N, comparable to that found by Walsh and colleagues3 for retrograde bio-interference screw with suture button, 1027 (157.11) N. In a study comparing quadrupled hamstring tibial graft fixation, Intrafix (DePuy Mitek) and an 8×25-mm Bioscrew (Linvatec) demonstrated mean (SD) single-cycle yield loads of 1332 (304) N and 612 (176) N, respectively.13 These results are similar to the ultimate yield loads in the present study: bicortical-post group, 1148 (186) N; SwiveLock group, 1007 (176) N; screw-only group, 778 (139) N. Differences may be attributed to hamstring tendons used in a quadrupled manner in the aforementioned study.12,13 Last, mean (SD) ultimate load to failure in a study that used only a retrograde bio-interference screw (9×20 mm) was 679.00 (109.44) N,3 similar to the 778 (139) N found for interference-screw-only in the present study. The difference is likely attributable to the longer screw (9×28 mm) in our study. Using SwiveLock C in cortical bone, Barber and colleagues18 found mean (SD) loads to failure up to 711.9 (89.1) N.
Clinically, it has been shown that a statistically significant increase in anterior laxity occurred between 4 months and 2 years in 10.7% of patients who underwent hamstring ACL reconstruction.20 The knees were clinically categorized as unstable or severely abnormal. The authors concluded that the clinical outcome was more likely influenced by the methods used to fix the free ends of the graft, specifically with 2 staples or a washer. To simulate early postoperative rehabilitation in the present study, cyclic loading of the graft was performed. Ultimate load to failure was then determined in order to evaluate catastrophic failure strength of the backup fixation devices in comparison with the interference-screw-only group without supplementary fixation.
It has been shown in autologous hamstring ACL reconstruction that a centrally placed polyethylene screw with sheath (Intrafix) performed as well as a standard, eccentrically placed metal interference screw with staple.10 It is therefore logical that backup fixation with use of a similar device (eg, SwiveLock, bicortical post) is necessary to ensure comparable clinical outcomes in relation to a screw/sheath device that has been shown to endure the highest yield loads.2,9,12,13,21-23 Potential benefits of using SwiveLock anchors for backup fixation include a statistically significant increased mean (SD) ultimate yield load of 229 (176) N over interference screw only. These results are similar to those in comparable studies: 218.3 (59.7) N24 and 165 (24.15) N25 in healthy bone with a reported bone mineral density (BMD) of 1.39 g/cm2, similar to that of skeletally mature porcine tibia (1.220-1.675 g/cm²).3 In addition, ease of insertion of this device over a bicortical post was demonstrated. The titanium post required bicortical drilling as well as measurement with a depth gauge to ensure adequate screw length. This process appeared to require more time during specimen preparation and theoretically could prove to be more dangerous clinically.7 However, caution in using a SwiveLock anchor in osteoporotic bone is advised because of reduced pullout strength.26 In this case, bicortical-post backup fixation may be more suitable. Moreover, although not demonstrated in this study, hardware prominence and irritation with a post may cause postoperative morbidity necessitating future removal.20 Hardware removal was the most common reason for additional surgery using hamstring tendons as graft.20 A second surgery for hardware removal was required in 21% of these patients.20 This is unlikely to occur with a SwiveLock, as the anchor is buried within cortical bone.
Limitations
Regarding use of nonhuman tissues in a biomechanical model, porcine tibiae and bovine extensor tendons were used because of availability, consistency among specimens, and cost-effectiveness. However, bovine extensor tendons have been shown to exhibit stiffness and viscoelastic properties similar to those of a human hamstring graft.27 In addition, the BMD of the porcine tibiae used in this study was not tested because of time involved and cost-efficiency. However, it has been shown that average BMD of porcine tibiae, 1.220-1.675 g/cm², is similar to that in a young athletic population, 1.24-1.62 g/cm2.3,28-31 We therefore assumed similarity to a young athletic population and uniformity of BMD of the porcine tibiae used in this study.
In addition, the biomechanical testing protocol did not simulate physiologic loading within the tibial tunnel. Moreover, the testing protocol used loads of only 250 N during cyclic testing for 500 cycles. This simulates only the early rehabilitation period and not the healing period, which may last up to 12 weeks.9 In addition, as previously mentioned, forces on the graft may be as high as 450 to 700 N.11,32 Pullout testing in line with the long axis of the tibia was performed in order to compare mechanical testing results with those of similar studies.3,12,13 Last, the P of .07 for the comparison of ultimate load to failure between the 2 backup fixation groups suggests that this study may have been underpowered.
Conclusion
This study demonstrated an effective, alternative, and equivalent backup fixation device that can help prevent graft slippage within the tibial tunnel during soft-tissue ACL reconstruction. Potential benefits of using SwiveLock anchors for backup fixation include a significantly increased ultimate yield load (229 N) when supplementing an interference screw, ease of insertion compared with a bicortical post, and the improbable need for future hardware removal. We support using SwiveLock for supplementary fixation at the tibial tunnel site when using soft-tissue grafts in ACL reconstruction.
1. Wetzler MJ, Bartolozzi AR, Gillespie MJ, Rubenstein DL, Ciccotti MG, Miller LS. Revision anterior cruciate ligament reconstruction. Oper Tech Orthop. 1996;6(3):181-189.
2. Scheffler SU, Südkamp NP, Göckenjan A, Hoffmann RF, Weiler A. Biomechanical comparison of hamstring and patellar tendon graft anterior cruciate ligament reconstruction techniques: the impact of fixation level and fixation method under cyclic loading. Arthroscopy. 2002;18(3):304-315.
3. Walsh MP, Wijdicks CA, Parker JB, Hapa O, LaPrade RF. A comparison between a retrograde interference screw, suture button, and combined fixation on the tibial side in an all-inside anterior cruciate ligament reconstruction: a biomechanical study in a porcine model. Am J Sports Med. 2009;37(1):160-167.
4. Howell SM, Hull ML. Aggressive rehabilitation using hamstring tendons: graft construct, tibial tunnel placement, fixation properties, and clinical outcome. Am J Knee Surg. 1998;11(2):120-127.
5. Magen HE, Howell SM, Hull ML. Structural properties of six tibial fixation methods for anterior cruciate ligament soft tissue grafts. Am J Sports Med. 1999;27(1):35-43.
6. Beynnon BD, Meriam CM, Ryder SH, Fleming BC, Johnson RJ. The effect of screw insertion torque on tendons fixed with spiked washers. Am J Sports Med. 1998;26(4):536-539.
7. Post WR, King SS. Neurovascular risk of bicortical tibial drilling for screw and spiked washer fixation of soft-tissue anterior cruciate ligament graft. Arthroscopy. 2001;17(3):244-247.
8. Holden JP, Grood ES, Butler DL, et al. Biomechanics of fascia lata ligament replacements: early postoperative changes in the goat. J Orthop Res. 1988;6(5):639-647.
9. Rodeo SA, Arnoczky SP, Torzilli PA, Hidaka C, Warren RF. Tendon-healing in a bone tunnel. A biomechanical and histological study in the dog. J Bone Joint Surg Am. 1993;75(12):1795-1803.
10. Frank CB, Jackson DW. The science of reconstruction of the anterior cruciate ligament. J Bone Joint Surg Am. 1997;79(10):1556-1576.
11. Markolf KL, Willems MJ, Jackson SR, Finerman GA. In situ calibration of miniature sensors implanted into the anterior cruciate ligament. Part I: strain measurements. J Orthop Res. 1998;16(4):455-463.
12. Kousa P, Teppo LN, Jarvinen TL, Vihavainen M, Kannus P, Jarvinen M. The fixation strength of six hamstring tendon graft fixation devices in anterior cruciate ligament reconstruction: I. Femoral site. Am J Sports Med. 2003;3 (2)1:174-181.
13. Kousa P, Jarvinen TL, Vihavainen M, Kannus P, Jarvinen M. The fixation strength of six hamstring tendon graft fixation devices in anterior cruciate ligament reconstruction: II. Tibial site. Am J Sports Med. 2003;31(2):182-188.
14. Brand JC Jr, Pienkowski D, Steenlage E, Hamilton D, Johnson DL, Caborn DN. Interference screw fixation strength of a quadrupled hamstring tendon graft is directly related to bone mineral density and insertion torque. Am J Sports Med. 2000;28(5):705-710.
15. Weiler A, Hoffmann RF, Siepe CJ, Kolbeck SF, Südkamp NP. The influence of screw geometry on hamstring tendon interference fit fixation. Am J Sports Med. 2000;28(3):356-359.
16. Weiler A, Hoffmann RF, Stähelin AC, Bail HJ, Siepe CJ, Südkamp NP. Hamstring tendon fixation using interference screws: a biomechanical study in calf tibial bone. Arthroscopy. 1998;14(1):29-37.
17. Streich NA, Reichenbacher S, Barié A, Buchner M, Schmitt H. Long-term outcome of anterior cruciate ligament reconstruction with an autologous four-strand semitendinosus tendon autograft. Int Orthop. 2013;37(2):279-284.
18. Barber FA, Herbert MA, Beavis C, Barrera Oro F. Suture anchor materials, eyelets, and designs: update 2008. Arthroscopy. 2008;24(8):859-867.
19. Aickin M, Gensler H. Adjusting for multiple testing when reporting research results: the Bonferroni vs Holm methods. Am J Public Health. 1996;86(5):726-728.
20. Howell SM, Deutsch ML. Comparison of endoscopic and two-incision techniques for reconstructing a torn anterior cruciate ligament using hamstring tendons. Arthroscopy. 1999;15(6):594-606.
21. Gwynne-Jones DP, Draffin J, Vane A, Craig R, McMahon S. Failure strengths of concentric and eccentric implants for hamstring graft fixation. ANZ J Surg. 2008;78(3):177-181.
22. Hayes DA, Watts MC, Tevelen GA, Crawford RW. Central versus peripheral tibial screw placement in hamstring anterior cruciate ligament reconstruction: in vitro biomechanics. Arthroscopy. 2005;21(6):703-706.
23. Shino K, Pflaster DS. Comparison of eccentric and concentric screw placement for hamstring graft fixation in the tibial tunnel. Knee Surg Sports Traumatol Arthrosc. 2000;8(2):73-75.
24. Prevrhal S, Fuerst T, Fan B, et al. Quantitative ultrasound of the tibia depends on both cortical density and thickness. Osteoporosis Int. 2001;12(1):28-34.
25. Pietschmann MF, Gülecyüz MF, Fieseler S, et al. Biomechanical stability of knotless suture anchors used in rotator cuff repair in healthy and osteopenic bone. Arthroscopy. 2010;26(8):1035-1044.
26. Burns JP, Snyder SJ, Albritton M. Arthroscopic rotator cuff repair using triple-loaded anchors, suture shuttles, and suture savers. J Am Acad Orthop Surg. 2007;15(7):432-444.
27. Tetsumura S, Fujita A, Nakajima M, Abe M. Biomechanical comparison of different fixation methods on the tibial side in anterior cruciate ligament reconstruction: a biomechanical study in porcine tibial bone. J Orthop Sci. 2006;11(3):278-282.
28. Alfredson H, Nordstrom P, Lorentzon R. Total and regional bone mass in female soccer players. Calcif Tissue Int. 1996;59(6):438-442.
29. Nevill AM, Holder RL, Stewart AD. Modeling elite male athletes’ peripheral bone mass, assessed using regional dual x-ray absorptiometry. Bone. 2003;32(1):62-68.
30. Nordström P, Lorentzon R. Site-specific bone mass differences of the lower extremities in 17-year-old ice hockey players. Calcif Tissue Int. 1996;59(6):4443-4448.
31. Patzer T, Santo G, Olender GD, Wellmann M, Hurschler C, Schofer MD. Suprapectoral or subpectoral position for biceps tenodesis: biomechanical comparison of four different techniques in both positions. J Shoulder Elbow Surg. 2012;21(1):116-125.
32. De Wall M, Scholes CJ, Patel S, Coolican MR, Parker DA. Tibial fixation in anterior cruciate ligament reconstruction: a prospective randomized study comparing metal interference screw and staples with a centrally placed polyethylene screw and sheath. Am J Sports Med. 2011;39(9):1858-1864.
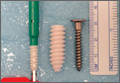
Risk Factors for Thromboembolic Events After Surgery for Ankle Fractures
Venous thromboembolic events (VTEs), encompassing both deep vein thrombosis (DVT) and pulmonary embolism (PE), are potentially fatal events that can occur after orthopedic surgery.1 In patients who do not receive prophylaxis, VTE incidence can be as high as 70% for total hip arthroplasty,2 26% for hip fracture,3 and 5% for ankle fracture.4 Based on the relatively low incidence of VTE after ankle fractures and insufficient evidence for VTE prophylaxis in this population, the American Orthopaedic Foot and Ankle Society and the American College of Chest Physicians do not recommend routine screening or prophylaxis for VTE in patients with ankle fractures.1,5 Nevertheless, certain patients may be at increased risk for VTE after open reduction and internal fixation (ORIF) of an ankle fracture. In such cases, further consideration for prophylaxis may be warranted.
Other studies of VTEs have identified general risk factors of increased age, obesity, prior thromboembolic disease, oral contraceptive use, multitrauma, varicose veins, and prolonged immobilization, among others.1,6,7 In orthopedics, most of this research comes from total joint arthroplasty and hip fracture studies. However, there is relatively limited data for ankle fracture. The best studies directly addressing VTE after ORIF of ankle fractures have had important limitations, including missing patient data and suboptimal capture of VTE occurrences,8-10 possibly leading to underestimates of the incidence of VTEs.
Given the limited data available, we conducted a retrospective national-cohort study to determine the incidence of and independent risk factors for VTEs after ankle fracture ORIF. If patients who are at higher risk for VTE can be identified, they can and should be carefully monitored and be considered for VTE prophylaxis. This information is needed for patient counseling and clinical decision-making.
Materials and Methods
This retrospective study used the American College of Surgeons National Surgical Quality Improvement Program (ACS-NSQIP) database, which captures data from more than 370 participating US hospitals.11 In ACS-NSQIP, 150 patient variables are collected from operative reports, medical records, and patient interviews by trained clinical reviewers.11,12 Patients are identified prospectively and randomly sampled at participating hospitals. Routine auditing is performed to ensure high-quality data. Clinical data are collected for the entire 30-day postoperative period, regardless of discharge status during this time.
Patients who underwent ankle fracture ORIF between 2005 and 2012 were identified in the ACS-NSQIP database. They were initially selected by the postoperative diagnosis of ankle fracture (International Classification of Diseases, Ninth Revision codes 824.0-824.9). Of these patients, only those with primary Current Procedural Terminology codes 27766 (ORIF of medial malleolus fracture), 27769 (ORIF of posterior malleolus fracture), 27792 (ORIF of lateral malleolus fracture), 27814 (ORIF of bimalleollar fracture), and 27822/27823 (ORIF of trimalleollar fracture) were included in the analysis. Patients with incomplete perioperative data were excluded, leaving 4412 patients (out of the initial 4785) for analysis.
Patient characteristics, including sex, age, height, weight, and history of smoking, were collected from the ACS-NSQIP database. Body mass index (BMI) was calculated from each patient’s height and weight. Age was divided into approximately 20-year increments, beginning with age 18 years, in order to compare younger, middle-aged, and elderly groups of patients with ankle fractures. BMI was divided into categories based on the World Health Organization definitions of obesity: under 25 kg/m2 (normal weight), 25 to 30 kg/m2 (overweight), 30 to 35 kg/m2 (class I obesity), and 35 kg/m2 or over (class II and class III obesity).13
Information about medical comorbidities is also available in the ACS-NSQIP database. History of pulmonary disease was defined as a history of dyspnea, severe chronic obstructive pulmonary disease, ventilator-assisted respiration within 48 hours before surgery, or current pneumonia. History of heart disease was defined as a history of congestive heart failure (CHF) or angina within 1 month before admission, myocardial infarction within 6 months before admission, cardiac surgery, or percutaneous coronary intervention. American Society of Anesthesiologists (ASA) classes 3 and above signify severe systemic disease. Steroid use was defined as requiring regular administration of corticosteroid medications within 1 month before surgery. Disseminated cancer was defined as a malignancy that has spread to 1 or more sites besides the primary site.
Functional status was defined as the ability to perform activities of daily living (ADLs) within 30 days before surgery. Best functional status during this period was recorded. ACS-NSQIP defines ADLs as the “activities usually performed in the course of a normal day in a person’s life,” including bathing, feeding, dressing, toileting, and mobility. An independent patient does not require assistance for any ADLs; a partially dependent patient requires assistance for some ADLs; and a totally dependent patient requires assistance in all ADLs. Partially and totally dependent patients were grouped for analysis. Anesthesia type was separated into general and nongeneral, which includes monitored anesthesia care, spinal anesthesia, and regional anesthesia.
ACS-NSQIP also records the occurrence of multiple events up to 30 days after surgery. For our study, VTE was defined as the occurrence of a DVT or a PE during this period. ACS-NSQIP defines DVT as a new blood clot or thrombus identified within a vein—with confirmation by duplex ultrasonography, venogram, or computed tomography (CT)—that required therapy (anticoagulation, placement of vena cava filter, and/or clipping of vena cava). PE is recorded if ventilation/perfusion (VQ) scan, CT examination, transesophageal echocardiogram, pulmonary arteriogram, CT angiogram, or any other definitive modality is positive.
Statistical analyses were performed with Stata Version 11.2 (StataCorp). Demographic and comorbidity variables were tested for association with occurrence of VTE using bivariate and multivariate logistic regression.
Final multivariate models were constructed with a backward stepwise process that initially included all potential variables and sequentially excluded variables with the highest P value until only those with P < .200 remained. Variables with .050 < P < .200 were left in the model to control for potential confounding but are not considered significantly associated with the outcome. Statistical significance was established at a 2-sided α of 0.050 (P < .050). The fitness of the final logistic regression model was assessed with the C statistic and the Hosmer-Lemeshow goodness-of-fit test.
Results
For the 4412 ankle fracture patients who met the inclusion criteria, mean (SD) age was 50.9 (18.2) years, and mean (SD) BMI was 30.4 (7.6) kg/m2. The cohort was 40.4% male. Surgery was performed on 235 patients (5.3%) with medial malleolus fracture, 1143 patients (25.9%) with lateral malleolus fracture, 1705 patients (38.6%) with bimalleollar fracture, and 1329 patients (30.1%) with trimalleollar fracture. Table 1 summarizes the patient characteristics.
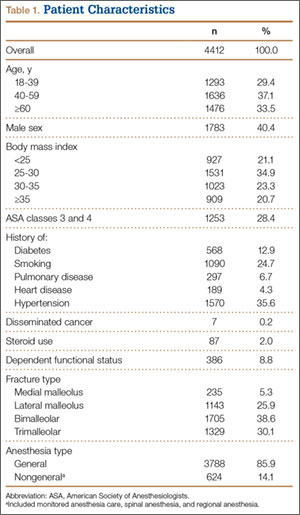
Of the 33 patients (0.8%) with a VTE recorded within the first 30 postoperative days, 16 (0.4% of all patients) had a DVT recorded, 14 (0.3% of all patients) had a PE recorded, and 3 (0.1% of all patients) had both a DVT and a PE recorded. In 13 (39.4%) of the 33 patients with a VTE, the event occurred after discharge. VTEs were reported a mean (SD) of 11.5 (9.6) days after surgery. No patient in this study died of VTE.
Bivariate logistic regressions were performed to test the association of each patient variable with the occurrence of a VTE. Results are listed in Table 2. The bivariate analyses revealed significant associations between VTE after ankle fracture ORIF and the patient variables of age 60 years or older (odds ratio [OR], 2.40; 95% confidence interval [CI], 1.01-5.72), class I obesity (BMI, 30-35 kg/m2: OR, 5.15, 95% CI, 1.14-23.28), class II and class III obesity (BMI, ≥35 kg/m2: OR, 6.33, 95% CI, 1.41-28.38), ASA classes 3 and 4 (OR, 3.05; 95% CI, 1.53-6.08), history of heart disease (OR, 5.10; 95% CI, 2.08-12.49), history of hypertension (OR, 2.81; 95% CI, 1.39-5.66), and dependent functional status (OR, 3.39; 95% CI, 1.52-7.56).
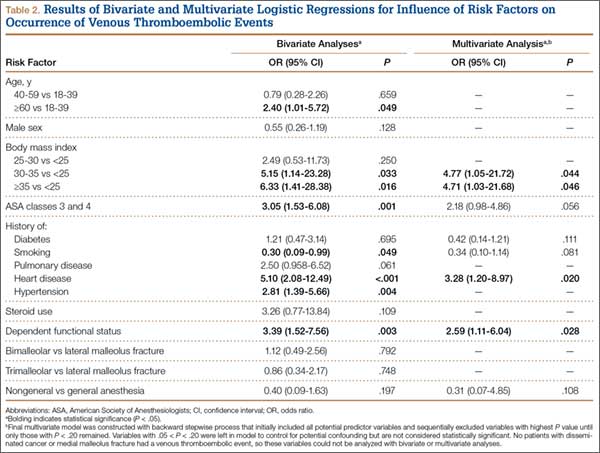
Multivariate logistic regression was used to control for potential confounding variables and determine which factors were independently associated with VTEs. Results of this analysis are listed in Table 2 as well. The multivariate analysis revealed that the patient variables of class I obesity (BMI, 30-35 kg/m2: OR, 4.77; 95% CI, 1.05-21.72; P = .044), class II and class III obesity (BMI, ≥35 kg/m2: OR, 4.71; 95% CI, 1.03-21.68; P = .046), history of heart disease (OR, 3.28; 95% CI, 1.20-8.97; P = .020), and dependent functional status (OR, 2.59; 95% CI, 1.11-6.04; P = .028) were independently associated with an increased rate of VTEs. Of note, anesthesia type was not significantly associated with occurrence of VTE on bivariate or multivariate analysis.
The C statistic of the final multivariate model was 0.76, indicating very good distinguishing ability. The Hosmer-Lemeshow goodness-of-fit test showed no evidence of lack of fit.
Discussion
Citing the lack of conclusive evidence and the low incidence of VTE after ankle fracture surgery, current recommendations are to avoid routine VTE prophylaxis in the postoperative management of patients who undergo this surgery.1,5 However, it is important to identify patients who are at increased risk, as some may benefit from VTE prophylaxis. In the present study, we used the large, high-quality ACS-NSQIP database collecting information from multiple US hospitals to examine risk factors for VTE after ankle fracture ORIF. We identified 4412 patients who underwent ankle fracture ORIF between 2005 and 2012, and found an overall VTE incidence of 0.8%. Multivariate analysis identified obesity, history of heart disease, and dependent functional status as independent risk factors for VTE after ankle fracture ORIF.
This study’s 0.8% incidence of VTE after ankle fracture ORIF is consistent with the range (0.29%-5%) reported in other ankle fracture studies.4,8-10,14-18 We found that VTEs occurred a mean of about 11 days after surgery, and no patient died of VTE.
Obesity (BMI, ≥30 kg/m2) had the strongest association with VTEs in this study. Obesity, which is a growing public health concern, can make postoperative care and mobilization more difficult.19 Obesity has previously been associated with VTEs after ankle fractures, and BMI of over 25 kg/m2 is one of the Caprini criteria for thrombosis risk factor assessment.6,10 In our study, however, BMI of 25 to 30 kg/m2 was not associated with an increased VTE rate, indicating that moderately overweight patients may not be at significantly higher risk for VTE (compared with patients with normal BMI) and may not need VTE prophylaxis. VTE prophylaxis after ankle fracture surgery may be considered in patients with BMI over 30 kg/m2.
History of heart disease was also associated with VTEs in this study. Patients with a history of heart disease were at 3 times the risk for VTE within 30 days of ankle fracture surgery. This association is also consistent with the Caprini criteria, which include acute myocardial infarction and CHF as risk factors for venous thrombosis.6 Other studies have found associations between CHF and VTE and between cardiovascular risk factors and VTE.7,20 The association between cardiovascular disease and VTE may derive from the decreased venous flow rate associated with CHF or an overall vascular disease state. These patients may benefit from heightened surveillance and postoperative prophylaxis for VTE.
Dependent functional status was the final risk factor found to be associated with VTE after ankle fracture ORIF. This association likely derives from an inability to mobilize independently, leading to increased venous stasis. Immobilization has been previously associated with increased risk for VTE after ankle surgery.7,14,16,20 Caretakers should be aware of this increased risk during the postoperative period and diligently monitor these patients for signs and symptoms of VTE. Prophylaxis may also be considered in this patient population.
Several risk factors that were significant on bivariate analysis (increased age; increased ASA class; history of diabetes, pulmonary disease, hypertension) were not significant in the final multivariate model. This finding suggests covariance between these factors and those that were significant in the final multivariate model. In particular, age and increased overall comorbidity (represented by increased ASA class) were not significant in our multivariate model—contrary to findings of other studies.8-10 It is possible that history of heart disease alone was responsible for the association between overall comorbidity and VTE in those studies. In the present study, separating and controlling for individual comorbidities could have allowed this association to be more precisely characterized.
The characteristics of the ACS-NSQIP database limited our study in several ways. First, although ACS-NSQIP makes significant efforts to collect as many patient variables as possible, some information is not captured. Data about additional factors that may affect VTE risk (eg, history of previous VTE, hypercoagulable state, history of malignancy other than disseminated cancer, tourniquet time, patient position in operating room) were not available. Second, data are collected only on those postoperative adverse events that occur within 30 days after surgery; data on VTEs that occur later are not captured. However, it has been shown that the majority of VTEs occur within the first 30 days after lower extremity trauma and surgery,21,22 so this follow-up interval was deemed adequate for capture of VTE data. Third, the database does not include information on the prophylactic regimens used for these patients—which may have weakened the associations between predictor variables and VTE risk and led to an underestimated effect size. VTE incidence, as well as the odds of developing a VTE with one of the identified risk factors, may actually be higher than reported in this study.
Conclusion
VTEs are serious complications that can occur after ORIF of ankle fractures. In this study, the overall incidence of VTE after ankle fracture ORIF was 0.8%. Although the American Orthopaedic Foot and Ankle Society and the American College of Chest Physicians do not recommend routine screening or prophylaxis for VTE in patients with ankle fractures,1,5 the results of this study showed there may be a benefit in emphasizing VTE prophylaxis after ankle fracture ORIF in patients with obesity, history of heart disease, or dependent functional status. At minimum, these patients should be more carefully monitored for development of VTEs.
1. American Orthopaedic Foot and Ankle Society. Position statement: the use of VTED prophylaxis in foot and ankle surgery. http://www.aofas.org/medical-community/health-policy/Documents/VTED-Position-Statement-Approv-7-9-13-FINAL.pdf. Updated 2013. Accessed May 10, 2015.
2. Grady-Benson JC, Oishi CS, Hanson PB, Colwell CW Jr, Otis SM, Walker RH. Routine postoperative duplex ultrasonography screening and monitoring for the detection of deep vein thrombosis. A survey of 110 total hip arthroplasties. Clin Orthop Relat Res. 1994;(307):130-141.
3. Salzman EW, Harris WH, DeSanctis RW. Anticoagulation for prevention of thromboembolism following fractures of the hip. New Engl J Med. 1966;275(3):122-130.
4. Patil S, Gandhi J, Curzon I, Hui AC. Incidence of deep-vein thrombosis in patients with fractures of the ankle treated in a plaster cast. J Bone Joint Surg Br. 2007;89(10):1340-1343.
5. Falck-Ytter Y, Francis CW, Johanson NA, et al; American College of Chest Physicians. Prevention of VTE in orthopedic surgery patients: Antithrombotic Therapy and Prevention of Thrombosis, 9th ed: American College of Chest Physicians Evidence-Based Clinical Practice Guidelines. Chest. 2012;141(2 suppl):e278S-e325S.
6. Caprini JA. Thrombosis risk assessment as a guide to quality patient care. Dis Mon. 2005;51(2-3):70-78.
7. Mayle RE Jr, DiGiovanni CW, Lin SS, Tabrizi P, Chou LB. Current concepts review: venous thromboembolic disease in foot and ankle surgery. Foot Ankle Int. 2007;28(11):1207-1216.
8. Jameson SS, Augustine A, James P, et al. Venous thromboembolic events following foot and ankle surgery in the English National Health Service. J Bone Joint Surg Br. 2011;93(4):490-497.
9. SooHoo NF, Eagan M, Krenek L, Zingmond DS. Incidence and factors predicting pulmonary embolism and deep venous thrombosis following surgical treatment of ankle fractures. Foot Ankle Surg. 2011;17(4):259-262.
10. Shibuya N, Frost CH, Campbell JD, Davis ML, Jupiter DC. Incidence of acute deep vein thrombosis and pulmonary embolism in foot and ankle trauma: analysis of the National Trauma Data Bank. J Foot Ankle Surg. 2012;51(1):63-68.
11. American College of Surgeons National Surgical Quality Improvement Program. User Guide for the 2012 ACS NSQIP Participant Use Data File. http://site.acsnsqip.org/wp-content/uploads/2013/10/ACSNSQIP.PUF_.UserGuide.2012.pdf. Published October 2013. Accessed May 10, 2015.
12. Khuri SF, Henderson WG, Daley J, et al; Principal Investigators of Patient Safety in Surgery Study. Successful implementation of the Department of Veterans Affairs’ National Surgical Quality Improvement Program in the private sector: the Patient Safety in Surgery study. Ann Surg. 2008;248(2):329-336.
13. Must A, Spadano J, Coakley EH, Field AE, Colditz G, Dietz WH. The disease burden associated with overweight and obesity. JAMA. 1999;282(16):1523-1529.
14. Mizel MS, Temple HT, Michelson JD, et al. Thromboembolism after foot and ankle surgery. A multicenter study. Clin Orthop Relat Res. 1998;(348):180-185.
15. Solis G, Saxby T. Incidence of DVT following surgery of the foot and ankle. Foot Ankle Int. 2002;23(5):411-414.
16. Hanslow SS, Grujic L, Slater HK, Chen D. Thromboembolic disease after foot and ankle surgery. Foot Ankle Int. 2006;27(9):693-695.
17. Pelet S, Roger ME, Belzile EL, Bouchard M. The incidence of thromboembolic events in surgically treated ankle fracture. J Bone Joint Surg Am. 2012;94(6):502-506.
18. Manafi Rasi A, Kazemian G, Emami Moghadam M, et al. Deep vein thrombosis following below knee immobilization: the need for chemoprophylaxis. Trauma Mon. 2013;17(4):367-369.
19. Sabharwal S, Root MZ. Impact of obesity on orthopaedics. J Bone Joint Surg Am. 2012;94(11):1045-1052.
20. Kadous A, Abdelgawad AA, Kanlic E. Deep venous thrombosis and pulmonary embolism after surgical treatment of ankle fractures: a case report and review of literature. J Foot Ankle Surg. 2012;51(4):457-463.
21. Forsythe RM, Peitzman AB, DeCato T, et al. Early lower extremity fracture fixation and the risk of early pulmonary embolus: filter before fixation? J Trauma. 2011;70(6):1381-1388.
22. Bjørnarå BT, Gudmundsen TE, Dahl OE. Frequency and timing of clinical venous thromboembolism after major joint surgery. J Bone Joint Surg Br. 2006;88(3):386-391.
Venous thromboembolic events (VTEs), encompassing both deep vein thrombosis (DVT) and pulmonary embolism (PE), are potentially fatal events that can occur after orthopedic surgery.1 In patients who do not receive prophylaxis, VTE incidence can be as high as 70% for total hip arthroplasty,2 26% for hip fracture,3 and 5% for ankle fracture.4 Based on the relatively low incidence of VTE after ankle fractures and insufficient evidence for VTE prophylaxis in this population, the American Orthopaedic Foot and Ankle Society and the American College of Chest Physicians do not recommend routine screening or prophylaxis for VTE in patients with ankle fractures.1,5 Nevertheless, certain patients may be at increased risk for VTE after open reduction and internal fixation (ORIF) of an ankle fracture. In such cases, further consideration for prophylaxis may be warranted.
Other studies of VTEs have identified general risk factors of increased age, obesity, prior thromboembolic disease, oral contraceptive use, multitrauma, varicose veins, and prolonged immobilization, among others.1,6,7 In orthopedics, most of this research comes from total joint arthroplasty and hip fracture studies. However, there is relatively limited data for ankle fracture. The best studies directly addressing VTE after ORIF of ankle fractures have had important limitations, including missing patient data and suboptimal capture of VTE occurrences,8-10 possibly leading to underestimates of the incidence of VTEs.
Given the limited data available, we conducted a retrospective national-cohort study to determine the incidence of and independent risk factors for VTEs after ankle fracture ORIF. If patients who are at higher risk for VTE can be identified, they can and should be carefully monitored and be considered for VTE prophylaxis. This information is needed for patient counseling and clinical decision-making.
Materials and Methods
This retrospective study used the American College of Surgeons National Surgical Quality Improvement Program (ACS-NSQIP) database, which captures data from more than 370 participating US hospitals.11 In ACS-NSQIP, 150 patient variables are collected from operative reports, medical records, and patient interviews by trained clinical reviewers.11,12 Patients are identified prospectively and randomly sampled at participating hospitals. Routine auditing is performed to ensure high-quality data. Clinical data are collected for the entire 30-day postoperative period, regardless of discharge status during this time.
Patients who underwent ankle fracture ORIF between 2005 and 2012 were identified in the ACS-NSQIP database. They were initially selected by the postoperative diagnosis of ankle fracture (International Classification of Diseases, Ninth Revision codes 824.0-824.9). Of these patients, only those with primary Current Procedural Terminology codes 27766 (ORIF of medial malleolus fracture), 27769 (ORIF of posterior malleolus fracture), 27792 (ORIF of lateral malleolus fracture), 27814 (ORIF of bimalleollar fracture), and 27822/27823 (ORIF of trimalleollar fracture) were included in the analysis. Patients with incomplete perioperative data were excluded, leaving 4412 patients (out of the initial 4785) for analysis.
Patient characteristics, including sex, age, height, weight, and history of smoking, were collected from the ACS-NSQIP database. Body mass index (BMI) was calculated from each patient’s height and weight. Age was divided into approximately 20-year increments, beginning with age 18 years, in order to compare younger, middle-aged, and elderly groups of patients with ankle fractures. BMI was divided into categories based on the World Health Organization definitions of obesity: under 25 kg/m2 (normal weight), 25 to 30 kg/m2 (overweight), 30 to 35 kg/m2 (class I obesity), and 35 kg/m2 or over (class II and class III obesity).13
Information about medical comorbidities is also available in the ACS-NSQIP database. History of pulmonary disease was defined as a history of dyspnea, severe chronic obstructive pulmonary disease, ventilator-assisted respiration within 48 hours before surgery, or current pneumonia. History of heart disease was defined as a history of congestive heart failure (CHF) or angina within 1 month before admission, myocardial infarction within 6 months before admission, cardiac surgery, or percutaneous coronary intervention. American Society of Anesthesiologists (ASA) classes 3 and above signify severe systemic disease. Steroid use was defined as requiring regular administration of corticosteroid medications within 1 month before surgery. Disseminated cancer was defined as a malignancy that has spread to 1 or more sites besides the primary site.
Functional status was defined as the ability to perform activities of daily living (ADLs) within 30 days before surgery. Best functional status during this period was recorded. ACS-NSQIP defines ADLs as the “activities usually performed in the course of a normal day in a person’s life,” including bathing, feeding, dressing, toileting, and mobility. An independent patient does not require assistance for any ADLs; a partially dependent patient requires assistance for some ADLs; and a totally dependent patient requires assistance in all ADLs. Partially and totally dependent patients were grouped for analysis. Anesthesia type was separated into general and nongeneral, which includes monitored anesthesia care, spinal anesthesia, and regional anesthesia.
ACS-NSQIP also records the occurrence of multiple events up to 30 days after surgery. For our study, VTE was defined as the occurrence of a DVT or a PE during this period. ACS-NSQIP defines DVT as a new blood clot or thrombus identified within a vein—with confirmation by duplex ultrasonography, venogram, or computed tomography (CT)—that required therapy (anticoagulation, placement of vena cava filter, and/or clipping of vena cava). PE is recorded if ventilation/perfusion (VQ) scan, CT examination, transesophageal echocardiogram, pulmonary arteriogram, CT angiogram, or any other definitive modality is positive.
Statistical analyses were performed with Stata Version 11.2 (StataCorp). Demographic and comorbidity variables were tested for association with occurrence of VTE using bivariate and multivariate logistic regression.
Final multivariate models were constructed with a backward stepwise process that initially included all potential variables and sequentially excluded variables with the highest P value until only those with P < .200 remained. Variables with .050 < P < .200 were left in the model to control for potential confounding but are not considered significantly associated with the outcome. Statistical significance was established at a 2-sided α of 0.050 (P < .050). The fitness of the final logistic regression model was assessed with the C statistic and the Hosmer-Lemeshow goodness-of-fit test.
Results
For the 4412 ankle fracture patients who met the inclusion criteria, mean (SD) age was 50.9 (18.2) years, and mean (SD) BMI was 30.4 (7.6) kg/m2. The cohort was 40.4% male. Surgery was performed on 235 patients (5.3%) with medial malleolus fracture, 1143 patients (25.9%) with lateral malleolus fracture, 1705 patients (38.6%) with bimalleollar fracture, and 1329 patients (30.1%) with trimalleollar fracture. Table 1 summarizes the patient characteristics.
Of the 33 patients (0.8%) with a VTE recorded within the first 30 postoperative days, 16 (0.4% of all patients) had a DVT recorded, 14 (0.3% of all patients) had a PE recorded, and 3 (0.1% of all patients) had both a DVT and a PE recorded. In 13 (39.4%) of the 33 patients with a VTE, the event occurred after discharge. VTEs were reported a mean (SD) of 11.5 (9.6) days after surgery. No patient in this study died of VTE.
Bivariate logistic regressions were performed to test the association of each patient variable with the occurrence of a VTE. Results are listed in Table 2. The bivariate analyses revealed significant associations between VTE after ankle fracture ORIF and the patient variables of age 60 years or older (odds ratio [OR], 2.40; 95% confidence interval [CI], 1.01-5.72), class I obesity (BMI, 30-35 kg/m2: OR, 5.15, 95% CI, 1.14-23.28), class II and class III obesity (BMI, ≥35 kg/m2: OR, 6.33, 95% CI, 1.41-28.38), ASA classes 3 and 4 (OR, 3.05; 95% CI, 1.53-6.08), history of heart disease (OR, 5.10; 95% CI, 2.08-12.49), history of hypertension (OR, 2.81; 95% CI, 1.39-5.66), and dependent functional status (OR, 3.39; 95% CI, 1.52-7.56).
Multivariate logistic regression was used to control for potential confounding variables and determine which factors were independently associated with VTEs. Results of this analysis are listed in Table 2 as well. The multivariate analysis revealed that the patient variables of class I obesity (BMI, 30-35 kg/m2: OR, 4.77; 95% CI, 1.05-21.72; P = .044), class II and class III obesity (BMI, ≥35 kg/m2: OR, 4.71; 95% CI, 1.03-21.68; P = .046), history of heart disease (OR, 3.28; 95% CI, 1.20-8.97; P = .020), and dependent functional status (OR, 2.59; 95% CI, 1.11-6.04; P = .028) were independently associated with an increased rate of VTEs. Of note, anesthesia type was not significantly associated with occurrence of VTE on bivariate or multivariate analysis.
The C statistic of the final multivariate model was 0.76, indicating very good distinguishing ability. The Hosmer-Lemeshow goodness-of-fit test showed no evidence of lack of fit.
Discussion
Citing the lack of conclusive evidence and the low incidence of VTE after ankle fracture surgery, current recommendations are to avoid routine VTE prophylaxis in the postoperative management of patients who undergo this surgery.1,5 However, it is important to identify patients who are at increased risk, as some may benefit from VTE prophylaxis. In the present study, we used the large, high-quality ACS-NSQIP database collecting information from multiple US hospitals to examine risk factors for VTE after ankle fracture ORIF. We identified 4412 patients who underwent ankle fracture ORIF between 2005 and 2012, and found an overall VTE incidence of 0.8%. Multivariate analysis identified obesity, history of heart disease, and dependent functional status as independent risk factors for VTE after ankle fracture ORIF.
This study’s 0.8% incidence of VTE after ankle fracture ORIF is consistent with the range (0.29%-5%) reported in other ankle fracture studies.4,8-10,14-18 We found that VTEs occurred a mean of about 11 days after surgery, and no patient died of VTE.
Obesity (BMI, ≥30 kg/m2) had the strongest association with VTEs in this study. Obesity, which is a growing public health concern, can make postoperative care and mobilization more difficult.19 Obesity has previously been associated with VTEs after ankle fractures, and BMI of over 25 kg/m2 is one of the Caprini criteria for thrombosis risk factor assessment.6,10 In our study, however, BMI of 25 to 30 kg/m2 was not associated with an increased VTE rate, indicating that moderately overweight patients may not be at significantly higher risk for VTE (compared with patients with normal BMI) and may not need VTE prophylaxis. VTE prophylaxis after ankle fracture surgery may be considered in patients with BMI over 30 kg/m2.
History of heart disease was also associated with VTEs in this study. Patients with a history of heart disease were at 3 times the risk for VTE within 30 days of ankle fracture surgery. This association is also consistent with the Caprini criteria, which include acute myocardial infarction and CHF as risk factors for venous thrombosis.6 Other studies have found associations between CHF and VTE and between cardiovascular risk factors and VTE.7,20 The association between cardiovascular disease and VTE may derive from the decreased venous flow rate associated with CHF or an overall vascular disease state. These patients may benefit from heightened surveillance and postoperative prophylaxis for VTE.
Dependent functional status was the final risk factor found to be associated with VTE after ankle fracture ORIF. This association likely derives from an inability to mobilize independently, leading to increased venous stasis. Immobilization has been previously associated with increased risk for VTE after ankle surgery.7,14,16,20 Caretakers should be aware of this increased risk during the postoperative period and diligently monitor these patients for signs and symptoms of VTE. Prophylaxis may also be considered in this patient population.
Several risk factors that were significant on bivariate analysis (increased age; increased ASA class; history of diabetes, pulmonary disease, hypertension) were not significant in the final multivariate model. This finding suggests covariance between these factors and those that were significant in the final multivariate model. In particular, age and increased overall comorbidity (represented by increased ASA class) were not significant in our multivariate model—contrary to findings of other studies.8-10 It is possible that history of heart disease alone was responsible for the association between overall comorbidity and VTE in those studies. In the present study, separating and controlling for individual comorbidities could have allowed this association to be more precisely characterized.
The characteristics of the ACS-NSQIP database limited our study in several ways. First, although ACS-NSQIP makes significant efforts to collect as many patient variables as possible, some information is not captured. Data about additional factors that may affect VTE risk (eg, history of previous VTE, hypercoagulable state, history of malignancy other than disseminated cancer, tourniquet time, patient position in operating room) were not available. Second, data are collected only on those postoperative adverse events that occur within 30 days after surgery; data on VTEs that occur later are not captured. However, it has been shown that the majority of VTEs occur within the first 30 days after lower extremity trauma and surgery,21,22 so this follow-up interval was deemed adequate for capture of VTE data. Third, the database does not include information on the prophylactic regimens used for these patients—which may have weakened the associations between predictor variables and VTE risk and led to an underestimated effect size. VTE incidence, as well as the odds of developing a VTE with one of the identified risk factors, may actually be higher than reported in this study.
Conclusion
VTEs are serious complications that can occur after ORIF of ankle fractures. In this study, the overall incidence of VTE after ankle fracture ORIF was 0.8%. Although the American Orthopaedic Foot and Ankle Society and the American College of Chest Physicians do not recommend routine screening or prophylaxis for VTE in patients with ankle fractures,1,5 the results of this study showed there may be a benefit in emphasizing VTE prophylaxis after ankle fracture ORIF in patients with obesity, history of heart disease, or dependent functional status. At minimum, these patients should be more carefully monitored for development of VTEs.
1. American Orthopaedic Foot and Ankle Society. Position statement: the use of VTED prophylaxis in foot and ankle surgery. http://www.aofas.org/medical-community/health-policy/Documents/VTED-Position-Statement-Approv-7-9-13-FINAL.pdf. Updated 2013. Accessed May 10, 2015.
2. Grady-Benson JC, Oishi CS, Hanson PB, Colwell CW Jr, Otis SM, Walker RH. Routine postoperative duplex ultrasonography screening and monitoring for the detection of deep vein thrombosis. A survey of 110 total hip arthroplasties. Clin Orthop Relat Res. 1994;(307):130-141.
3. Salzman EW, Harris WH, DeSanctis RW. Anticoagulation for prevention of thromboembolism following fractures of the hip. New Engl J Med. 1966;275(3):122-130.
4. Patil S, Gandhi J, Curzon I, Hui AC. Incidence of deep-vein thrombosis in patients with fractures of the ankle treated in a plaster cast. J Bone Joint Surg Br. 2007;89(10):1340-1343.
5. Falck-Ytter Y, Francis CW, Johanson NA, et al; American College of Chest Physicians. Prevention of VTE in orthopedic surgery patients: Antithrombotic Therapy and Prevention of Thrombosis, 9th ed: American College of Chest Physicians Evidence-Based Clinical Practice Guidelines. Chest. 2012;141(2 suppl):e278S-e325S.
6. Caprini JA. Thrombosis risk assessment as a guide to quality patient care. Dis Mon. 2005;51(2-3):70-78.
7. Mayle RE Jr, DiGiovanni CW, Lin SS, Tabrizi P, Chou LB. Current concepts review: venous thromboembolic disease in foot and ankle surgery. Foot Ankle Int. 2007;28(11):1207-1216.
8. Jameson SS, Augustine A, James P, et al. Venous thromboembolic events following foot and ankle surgery in the English National Health Service. J Bone Joint Surg Br. 2011;93(4):490-497.
9. SooHoo NF, Eagan M, Krenek L, Zingmond DS. Incidence and factors predicting pulmonary embolism and deep venous thrombosis following surgical treatment of ankle fractures. Foot Ankle Surg. 2011;17(4):259-262.
10. Shibuya N, Frost CH, Campbell JD, Davis ML, Jupiter DC. Incidence of acute deep vein thrombosis and pulmonary embolism in foot and ankle trauma: analysis of the National Trauma Data Bank. J Foot Ankle Surg. 2012;51(1):63-68.
11. American College of Surgeons National Surgical Quality Improvement Program. User Guide for the 2012 ACS NSQIP Participant Use Data File. http://site.acsnsqip.org/wp-content/uploads/2013/10/ACSNSQIP.PUF_.UserGuide.2012.pdf. Published October 2013. Accessed May 10, 2015.
12. Khuri SF, Henderson WG, Daley J, et al; Principal Investigators of Patient Safety in Surgery Study. Successful implementation of the Department of Veterans Affairs’ National Surgical Quality Improvement Program in the private sector: the Patient Safety in Surgery study. Ann Surg. 2008;248(2):329-336.
13. Must A, Spadano J, Coakley EH, Field AE, Colditz G, Dietz WH. The disease burden associated with overweight and obesity. JAMA. 1999;282(16):1523-1529.
14. Mizel MS, Temple HT, Michelson JD, et al. Thromboembolism after foot and ankle surgery. A multicenter study. Clin Orthop Relat Res. 1998;(348):180-185.
15. Solis G, Saxby T. Incidence of DVT following surgery of the foot and ankle. Foot Ankle Int. 2002;23(5):411-414.
16. Hanslow SS, Grujic L, Slater HK, Chen D. Thromboembolic disease after foot and ankle surgery. Foot Ankle Int. 2006;27(9):693-695.
17. Pelet S, Roger ME, Belzile EL, Bouchard M. The incidence of thromboembolic events in surgically treated ankle fracture. J Bone Joint Surg Am. 2012;94(6):502-506.
18. Manafi Rasi A, Kazemian G, Emami Moghadam M, et al. Deep vein thrombosis following below knee immobilization: the need for chemoprophylaxis. Trauma Mon. 2013;17(4):367-369.
19. Sabharwal S, Root MZ. Impact of obesity on orthopaedics. J Bone Joint Surg Am. 2012;94(11):1045-1052.
20. Kadous A, Abdelgawad AA, Kanlic E. Deep venous thrombosis and pulmonary embolism after surgical treatment of ankle fractures: a case report and review of literature. J Foot Ankle Surg. 2012;51(4):457-463.
21. Forsythe RM, Peitzman AB, DeCato T, et al. Early lower extremity fracture fixation and the risk of early pulmonary embolus: filter before fixation? J Trauma. 2011;70(6):1381-1388.
22. Bjørnarå BT, Gudmundsen TE, Dahl OE. Frequency and timing of clinical venous thromboembolism after major joint surgery. J Bone Joint Surg Br. 2006;88(3):386-391.
Isolating Suture Slippage During Cadaveric Testing of Knotless Anchors
Knotless suture anchor fixation techniques continue to evolve as efficient, low-profile options for arthroscopic rotator cuff repair (RCR).1,2 Excellent outcomes have been reported for constructs that use knotless fixation laterally, typically in suture bridge-type configurations.2-4 Early comparative biomechanical and clinical studies have also demonstrated equivalent results for all-knotless versus conventional constructs for arthroscopic RCR.5-10 Given the increased use and availability of multiple implant designs, it is important to supplement our clinical knowledge of these devices with laboratory studies delineating the biomechanical properties of the anchors that are used to help guide appropriate clinical use of the implants in specific patient populations.
Several biomechanical studies have shown suture slippage to be the weak but crucial link in the design of knotless anchors and the most likely mode of in vivo failure.11,12 Other studies have demonstrated frequent anchor dislodgement from bone, but these analyses involved use of elderly cadaveric specimens and relatively high-force testing protocols.12,13 Because suture-retention force may have exceeded anchor resistance to pullout (imparted by weak cadaveric bone in such biomechanical settings), the focus on suture-retention properties was limited.11 It is thought that, in clinical practice, the majority of patients who undergo RCR tend not to generate the high forces (relative to resistance to bone pullout) used to cause the anchor pullouts observed in biomechanical studies, particularly in the early postoperative setting.11-15 Cadaveric testing, however, often involves use of specimens with diminished bone mineral density (BMD), relative to age, because of the illness and other factors leading to death and donation.
Using a novel testing apparatus, we isolated, analyzed, and compared suture slippage in 2 anchor designs, one with entirely press-fit suture clamping and the other reliant on an intrinsic suture-locking mechanism.
Materials and Methods
Six human cadaveric proximal humeri specimens were used for this biomechanical study. Mean (SD) age was 53.3 (5.7) years (range, 46-59 years). Middle-aged specimens were used in order to best represent the quality of bone typically encountered in RCR surgery. To approximate tissue in clinical use, we used fresh-frozen cadaver tissue. Specimens were maintained at –20°C until about 24 hours before use and then were thawed to room temperature for testing. Specimens were included only if they had a completely intact humeral head and no prior surgery or hardware placement. Before instrumentation, dual-energy x-ray absorptiometry with a QDR-1000 scanner (Hologic) was used to determine BMD of all proximal humeri.
Two knotless suture anchors were compared: PushLock (4.5×18.5 mm; Arthrex) and ReelX STT (5.5×19.4 mm; Stryker). These anchors have multiple surgical indications (including RCR), allow patient-specific tissue tensioning, and use polyetheretherketone eyelets. The clamping force for PushLock depends entirely on the interference fit achieved for the suture between the outside of the anchor and the surrounding trabecular/cortical bone after device insertion, whereas the suture in ReelX is secured within the anchor shaft entirely by an internal ratchet-locking mechanism.
For anchor insertion, shoulders were dissected down to the greater tuberosity of the proximal humerus, and all implants were inserted (by a fellowship-trained surgeon in accordance with manufacturer guidelines) at a 25° insertion angle with manufacturer-supplied instruments. One anchor of each type (Figure 1) was inserted into the center of the rotator cuff footprint on the greater tuberosity of each specimen. Anterior and posterior positions were randomized, and an anchor from the other group was inserted into the matching location on the contralateral matched-pair specimen. In all instances, distance between the anterior and posterior anchors was 2 cm, and anchors were placed midway between the articular margin and the lateral edge of the greater tuberosity (Figure 2). Two strands of size 2 ultrahigh-molecular-weight–polyethylene Force Fiber (Stryker) were loaded into all anchors.
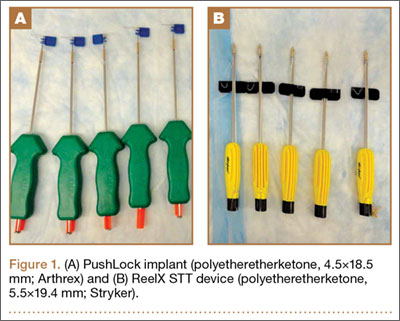
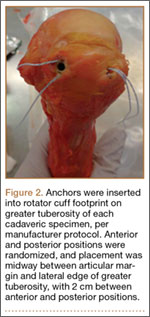
A custom urethane fixture was secured over the center of each anchor to allow testing to focus on suture slippage by minimizing anchor migration (Figure 3). The small aperture of this device allowed suture tails to pass freely through the center of the fixture but prevented disengagement and proximal migration of the suture anchor from the underlying bone through contact of the urethane fixture with the anchor perimeter. Any system deformation observed during testing was restricted to the suture and/or the anchor’s suture-locking mechanism. Testing fixtures also oriented the suture anchor coaxial with the axis of tension, creating a worst-case loading scenario (Figure 3).
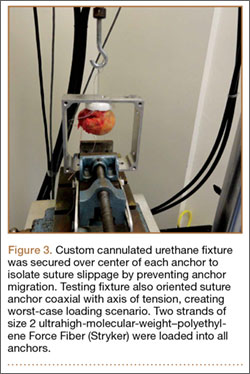
PushLock implants were inserted with 5 pounds of tension, as indicated, using a manufacturer-supplied suture tensioner, and ReelX devices were inserted and locked with 2 full rotations, as specified by the manufacturer. After one end of each suture was cut, as would be done in vivo, the 2 other suture ends, which would have been part of the RCR in vivo, were tied together to form an 8-cm circumference loop that was brought through the urethane fixture. Humeri were then mounted in a materials testing system (MTS 810; MTS Systems) servohydraulic load frame, and the suture loop was passed around a cross-bar on the actuator of the testing device. A mechanical testing protocol consisting of modest repetitive forces was carefully chosen to simulate expected activity during rehabilitation after RCR.15 In this protocol, a 60-second preload of 10 N was followed by tensile loading between 10 N and 90 N at a frequency of 0.5 Hz for 500 cycles.15 Cycle duration at 3 mm and 5 mm of suture slippage (threshold for clinical failure) was recorded.12,16,17 In addition, suture slippage was measured after 1, 10, 50, 100, 200, 300, 400, and 500 cycles. The first 5 test cycles were not counted in the analysis to control for initial knot slippage. Finally, after completion of dynamic testing, samples were loaded at a displacement rate of 0.5 mm/s for tension-to-failure testing in the custom fixtures. Maximum failure load, stiffness, and failure mode were recorded. Ultimate failure was defined as suture breakage or gross suture slippage.
Paired Student t test was used to determine significant differences in suture slippage distance between the 2 groups at various cycle durations. In addition, Kaplan-Meier survival test was used to determine statistical differences in sample survival during the dynamic loading test.
Results
Mean (SD) BMD of the cadaveric shoulder specimens was 0.55 (0.13) g/cm2 (range, 0.29-0.68 g/cm2). The testing fixtures isolated suture slippage from anchor–bone disengagement. All 6 PushLock implants demonstrated slippage of more than 3 mm, and 5 of the 6 demonstrated slippage of more than 5 mm. All 6 ReelX devices exhibited slippage of less than 3 mm. In addition, PushLock demonstrated more suture slippage at cycles 1, 10, and 100 (P < .05) and more maximum slippage after 500 cycles (mean, 11.2 mm; SD, 4.7 mm) compared with ReelX (mean, 1.9 mm; SD, 0.5 mm) (P = .004). Figure 4 shows mean suture slippage at each cycle.
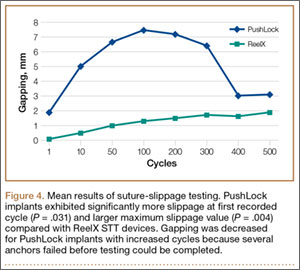
Kaplan-Meier analysis revealed significantly (λ2 = 8.170; P = .0043) decreased survival after dynamic testing for PushLock versus ReelX (Figure 5). Survival was defined as suture slippage of less than 5 mm after completion of dynamic testing. Only 1 of the 6 PushLock anchors completed dynamic testing; the other 5 failed via complete suture slippage from the anchor before testing could be completed. All 6 ReelX devices survived dynamic testing.
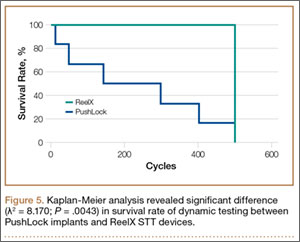
Therefore, 1 PushLock implant and all 6 ReelX devices were available for subsequent load-to-failure testing. Failure in this setting was defined as suture slippage of more than 10 mm or suture breakage. The PushLock implant failed at a maximum force of 171.8 N with a stiffness of 74.4 N/mm and eventually exhibited gross suture slippage. All 6 ReelX devices failed at a mean (SD) maximum of 273.5 (20.2) N, with a mean (SD) stiffness of 74.1 (17) N/mm. Mechanism of failure for all ReelX devices was suture breakage during the tensile load-to-failure test.
Discussion
We evaluated a new technique designed to isolate suture slippage in knotless anchors used for RCR. The impetus for developing this new method was to provide a means for better analyzing the ability of a knotless anchor to resist suture slippage in the cadaveric biomechanical testing setting. Suture slippage is an important mode of failure during such analyses.11,12 Significant slippage occurred in a range of implants before half the anchor–bone pullout strength was reached in a study using young bovine femoral heads.11 In another study, using young, high-BMD cadaveric humeral heads, initial slippage and maximum failure loads were equivalent among numerous devices using various suture-retention mechanisms, and suture slippage was the most common failure mode.12 Nevertheless, other biomechanical studies have demonstrated frequent failure caused by anchor pullout in elderly human cadaveric specimens with diminished BMD, often with high-force testing protocols.12,13 In the more modest-force, in vivo rehabilitative environment, suture slippage rather than anchor dislodgement may be the main failure mode.11-15
We compared the PushLock implant and its entirely press-fit suture clamping design with the ReelX device, which relies on an intrinsic suture-locking mechanism. Middle-aged (mean, 53.3 years; SD, 5.7 years) cadaveric humeri were tested under physiologically relevant biomechanical conditions to begin to help identify how relatively osteopenic bone may affect suture-retention properties for a given implant. The results showed that the study methodology prevented implant failure via anchor–bone pullout. To our knowledge, this was the first study to exclusively analyze suture slippage in knotless anchors. The findings indicated that implants that rely heavily on a tight interference fit of the suture between the anchor and the surrounding bone may exhibit early slippage and failure after RCR in middle-aged patients with relative osteopenia.11,12 However, this study also demonstrated that devices with intrinsic clamping mechanisms that do not depend on the quality of surrounding bone may better resist suture slippage. It is not clear that all knotless anchors with intrinsic locking mechanisms function equivalently. For instance, Pietschmann and colleagues12 found that 2 of 10 implants with a different internal clamping device were unable to resist failure via suture slippage, even in healthy bone. Similarly, in a study comparing ReelX devices with implants having a different internal suture-retention mechanism, ReelX failed at higher ultimate loads, and typically via anchor dislodgement, versus suture slippage in the other implants.18
It is important to note that, in the present study, the loads at which sutures broke in the intrinsic clamping anchors approached the maximum contractile force of the supraspinatus muscle (302 N).19,20 In addition, these loads were above the resistance of the rotator cuff tendon to cut out with modern suture material.21
This study’s limitations include use of an in vitro human cadaveric model that precluded analysis of the effects of postoperative healing. Biomechanical testing was also performed in a single row-type suture configuration with the rotator cuff tendon removed. Fixtures used during testing oriented the load coaxially with the axis of tension, creating a worst-case loading scenario. Although this form of testing may limit its clinical applicability, its purpose was to critically isolate how well a knotless anchor could resist suture slippage. The methods we used were also limited because the stability of the bone–anchor interface was not assessed. For patients with osteopenia, anchor pullout rather than suture slippage could be the most limiting factor for knotless anchor construct failure, and therefore further testing of both failure modes is needed. Future biomechanical studies should compare various knotless anchors’ suture-slippage characteristics in other constructs in physiologic testing orientations, including double-row and suture-bridge configurations, as well as with intact rotator cuff tendons. In addition, use of labral tape as a substitute for polyblend suture has been suggested to limit suture slippage, and this technique theoretically could have changed the results of this study.22
Conclusion
An implant with an internal ratcheting mechanism for suture retention demonstrated significantly less suture slippage in an axial tension evaluation protocol than a device reliant on interference fit of the suture between the anchor and surrounding bone. In the clinical setting, this may allow for less gap formation during the healing phase following RCR with a knotless anchor. There was also increased maximum load to failure, demonstrating an increased load until catastrophic failure using a device with a ratcheting internal locking mechanism.
1. Thal R. A knotless suture anchor. Design, function, and biomechanical testing. Am J Sports Med. 2001;29(5):646-649.
2. Cole BJ, ElAttrache NS, Anbari A. Arthroscopic rotator cuff repairs: an anatomic and biomechanical rationale for different suture-anchor repair configurations. Arthroscopy. 2007;23(6):662-669.
3. Kim KC, Shin HD, Cha SM, Lee WY. Comparison of repair integrity and functional outcomes for 3 arthroscopic suture bridge rotator cuff repair techniques. Am J Sports Med. 2013;41(2):271-277.
4. Choi CH, Kim SK, Cho MR, et al. Functional outcomes and structural integrity after double-pulley suture bridge rotator cuff repair using serial ultrasonographic examination. J Shoulder Elbow Surg. 2012;21(12):1753-1763.
5. Brown BS, Cooper AD, McIff TE, Key VH, Toby EB. Initial fixation and cyclic loading stability of knotless suture anchors for rotator cuff repair. J Shoulder Elbow Surg. 2008;17(2):313-318.
6. Burkhart SS, Adams CR, Burkhart SS, Schoolfield JD. A biomechanical comparison of 2 techniques of footprint reconstruction for rotator cuff repair: the SwiveLock-FiberChain construct versus standard double-row repair. Arthroscopy. 2009;25(3):274-281.
7. Hepp P, Osterhoff G, Engel T, Marquass B, Klink T, Josten C. Biomechanical evaluation of knotless anatomical double-layer double-row rotator cuff repair: a comparative ex vivo study. Am J Sports Med. 2009;37(7):1363-1369.
8. Maguire M, Goldberg J, Bokor D, et al. Biomechanical evaluation of four different transosseous-equivalent/suture bridge rotator cuff repairs. Knee Surg Sports Traumatol Arthrosc. 2011;19(9):1582-1587.
9. Millar NL, Wu X, Tantau R, Silverstone E, Murrell GA. Open versus two forms of arthroscopic rotator cuff repair. Clin Orthop Relat Res. 2009;467(4):966-978.
10. Rhee YG, Cho NS, Parke CS. Arthroscopic rotator cuff repair using modified Mason-Allen medial row stitch: knotless versus knot-tying suture bridge technique. Am J Sports Med. 2012;40(11):2440-2447.
11. Wieser K, Farshad M, Vlachopoulos L, Ruffieux K, Gerber C, Meyer DC. Suture slippage in knotless suture anchors as a potential failure mechanism in rotator cuff repair. Arthroscopy. 2012;28(11):1622-1627.
12. Pietschmann MF, Gülecyüz MF, Fieseler S, et al. Biomechanical stability of knotless suture anchors used in rotator cuff repair in healthy and osteopenic bone. Arthroscopy. 2010;26(8):1035-1044.
13. Barber FA, Hapa O, Bynum JA. Comparative testing by cyclic loading of rotator cuff suture anchors containing multiple high-strength sutures. Arthroscopy. 2010;26(9 suppl):S134-S141.
14. Barber FA, Coons DA, Ruiz-Suarez M. Cyclic load testing of biodegradable suture anchors containing 2 high-strength sutures. Arthroscopy. 2007;23(4):355-360.
15. Bynum CK, Lee S, Mahar A, Tasto J, Pedowitz R. Failure mode of suture anchors as a function of insertion depth. Am J Sports Med. 2005;33(7):1030-1034.
16. Gerber C, Schneeberger AG, Beck M, Schlegel U. Mechanical strength of repairs of the rotator cuff. J Bone Joint Surg Br. 1994;76(3):371-380.
17. Schneeberger AG, von Roll A, Kalberer F, Jacob HA, Gerber C. Mechanical strength of arthroscopic rotator cuff repair techniques: an in vitro study. J Bone Joint Surg Am. 2002;84(12):2152-2160.
18. Efird C, Traub S, Baldini T, et al. Knotless single-row rotator cuff repair: a comparative biomechanical study of 2 knotless suture anchors. Orthopedics. 2013;36(8):e1033-e1037.
19. Wright PB, Budoff JE, Yeh ML, Kelm ZS, Luo ZP. Strength of damaged suture: an in vitro study. Arthroscopy. 2006;22(12):1270-1275.
20. Burkhart SS. A stepwise approach to arthroscopic rotator cuff repair based on biomechanical principles. Arthroscopy. 2000;16(1):82-90.
21. Bisson LJ, Manohar LM. A biomechanical comparison of the pullout strength of No. 2 FiberWire suture and 2-mm FiberWire tape in bovine rotator cuff tendons. Arthroscopy. 2010;26(11):1463-1468.
22. Burkhart SS, Denard PJ, Konicek J, Hanypsiak BT. Biomechanical validation of load-sharing rip-stop fixation for the repair of tissue-deficient rotator cuff tears. Am J Sports Med. 2014;42(2):457-462.
Knotless suture anchor fixation techniques continue to evolve as efficient, low-profile options for arthroscopic rotator cuff repair (RCR).1,2 Excellent outcomes have been reported for constructs that use knotless fixation laterally, typically in suture bridge-type configurations.2-4 Early comparative biomechanical and clinical studies have also demonstrated equivalent results for all-knotless versus conventional constructs for arthroscopic RCR.5-10 Given the increased use and availability of multiple implant designs, it is important to supplement our clinical knowledge of these devices with laboratory studies delineating the biomechanical properties of the anchors that are used to help guide appropriate clinical use of the implants in specific patient populations.
Several biomechanical studies have shown suture slippage to be the weak but crucial link in the design of knotless anchors and the most likely mode of in vivo failure.11,12 Other studies have demonstrated frequent anchor dislodgement from bone, but these analyses involved use of elderly cadaveric specimens and relatively high-force testing protocols.12,13 Because suture-retention force may have exceeded anchor resistance to pullout (imparted by weak cadaveric bone in such biomechanical settings), the focus on suture-retention properties was limited.11 It is thought that, in clinical practice, the majority of patients who undergo RCR tend not to generate the high forces (relative to resistance to bone pullout) used to cause the anchor pullouts observed in biomechanical studies, particularly in the early postoperative setting.11-15 Cadaveric testing, however, often involves use of specimens with diminished bone mineral density (BMD), relative to age, because of the illness and other factors leading to death and donation.
Using a novel testing apparatus, we isolated, analyzed, and compared suture slippage in 2 anchor designs, one with entirely press-fit suture clamping and the other reliant on an intrinsic suture-locking mechanism.
Materials and Methods
Six human cadaveric proximal humeri specimens were used for this biomechanical study. Mean (SD) age was 53.3 (5.7) years (range, 46-59 years). Middle-aged specimens were used in order to best represent the quality of bone typically encountered in RCR surgery. To approximate tissue in clinical use, we used fresh-frozen cadaver tissue. Specimens were maintained at –20°C until about 24 hours before use and then were thawed to room temperature for testing. Specimens were included only if they had a completely intact humeral head and no prior surgery or hardware placement. Before instrumentation, dual-energy x-ray absorptiometry with a QDR-1000 scanner (Hologic) was used to determine BMD of all proximal humeri.
Two knotless suture anchors were compared: PushLock (4.5×18.5 mm; Arthrex) and ReelX STT (5.5×19.4 mm; Stryker). These anchors have multiple surgical indications (including RCR), allow patient-specific tissue tensioning, and use polyetheretherketone eyelets. The clamping force for PushLock depends entirely on the interference fit achieved for the suture between the outside of the anchor and the surrounding trabecular/cortical bone after device insertion, whereas the suture in ReelX is secured within the anchor shaft entirely by an internal ratchet-locking mechanism.
For anchor insertion, shoulders were dissected down to the greater tuberosity of the proximal humerus, and all implants were inserted (by a fellowship-trained surgeon in accordance with manufacturer guidelines) at a 25° insertion angle with manufacturer-supplied instruments. One anchor of each type (Figure 1) was inserted into the center of the rotator cuff footprint on the greater tuberosity of each specimen. Anterior and posterior positions were randomized, and an anchor from the other group was inserted into the matching location on the contralateral matched-pair specimen. In all instances, distance between the anterior and posterior anchors was 2 cm, and anchors were placed midway between the articular margin and the lateral edge of the greater tuberosity (Figure 2). Two strands of size 2 ultrahigh-molecular-weight–polyethylene Force Fiber (Stryker) were loaded into all anchors.
A custom urethane fixture was secured over the center of each anchor to allow testing to focus on suture slippage by minimizing anchor migration (Figure 3). The small aperture of this device allowed suture tails to pass freely through the center of the fixture but prevented disengagement and proximal migration of the suture anchor from the underlying bone through contact of the urethane fixture with the anchor perimeter. Any system deformation observed during testing was restricted to the suture and/or the anchor’s suture-locking mechanism. Testing fixtures also oriented the suture anchor coaxial with the axis of tension, creating a worst-case loading scenario (Figure 3).
PushLock implants were inserted with 5 pounds of tension, as indicated, using a manufacturer-supplied suture tensioner, and ReelX devices were inserted and locked with 2 full rotations, as specified by the manufacturer. After one end of each suture was cut, as would be done in vivo, the 2 other suture ends, which would have been part of the RCR in vivo, were tied together to form an 8-cm circumference loop that was brought through the urethane fixture. Humeri were then mounted in a materials testing system (MTS 810; MTS Systems) servohydraulic load frame, and the suture loop was passed around a cross-bar on the actuator of the testing device. A mechanical testing protocol consisting of modest repetitive forces was carefully chosen to simulate expected activity during rehabilitation after RCR.15 In this protocol, a 60-second preload of 10 N was followed by tensile loading between 10 N and 90 N at a frequency of 0.5 Hz for 500 cycles.15 Cycle duration at 3 mm and 5 mm of suture slippage (threshold for clinical failure) was recorded.12,16,17 In addition, suture slippage was measured after 1, 10, 50, 100, 200, 300, 400, and 500 cycles. The first 5 test cycles were not counted in the analysis to control for initial knot slippage. Finally, after completion of dynamic testing, samples were loaded at a displacement rate of 0.5 mm/s for tension-to-failure testing in the custom fixtures. Maximum failure load, stiffness, and failure mode were recorded. Ultimate failure was defined as suture breakage or gross suture slippage.
Paired Student t test was used to determine significant differences in suture slippage distance between the 2 groups at various cycle durations. In addition, Kaplan-Meier survival test was used to determine statistical differences in sample survival during the dynamic loading test.
Results
Mean (SD) BMD of the cadaveric shoulder specimens was 0.55 (0.13) g/cm2 (range, 0.29-0.68 g/cm2). The testing fixtures isolated suture slippage from anchor–bone disengagement. All 6 PushLock implants demonstrated slippage of more than 3 mm, and 5 of the 6 demonstrated slippage of more than 5 mm. All 6 ReelX devices exhibited slippage of less than 3 mm. In addition, PushLock demonstrated more suture slippage at cycles 1, 10, and 100 (P < .05) and more maximum slippage after 500 cycles (mean, 11.2 mm; SD, 4.7 mm) compared with ReelX (mean, 1.9 mm; SD, 0.5 mm) (P = .004). Figure 4 shows mean suture slippage at each cycle.
Kaplan-Meier analysis revealed significantly (λ2 = 8.170; P = .0043) decreased survival after dynamic testing for PushLock versus ReelX (Figure 5). Survival was defined as suture slippage of less than 5 mm after completion of dynamic testing. Only 1 of the 6 PushLock anchors completed dynamic testing; the other 5 failed via complete suture slippage from the anchor before testing could be completed. All 6 ReelX devices survived dynamic testing.
Therefore, 1 PushLock implant and all 6 ReelX devices were available for subsequent load-to-failure testing. Failure in this setting was defined as suture slippage of more than 10 mm or suture breakage. The PushLock implant failed at a maximum force of 171.8 N with a stiffness of 74.4 N/mm and eventually exhibited gross suture slippage. All 6 ReelX devices failed at a mean (SD) maximum of 273.5 (20.2) N, with a mean (SD) stiffness of 74.1 (17) N/mm. Mechanism of failure for all ReelX devices was suture breakage during the tensile load-to-failure test.
Discussion
We evaluated a new technique designed to isolate suture slippage in knotless anchors used for RCR. The impetus for developing this new method was to provide a means for better analyzing the ability of a knotless anchor to resist suture slippage in the cadaveric biomechanical testing setting. Suture slippage is an important mode of failure during such analyses.11,12 Significant slippage occurred in a range of implants before half the anchor–bone pullout strength was reached in a study using young bovine femoral heads.11 In another study, using young, high-BMD cadaveric humeral heads, initial slippage and maximum failure loads were equivalent among numerous devices using various suture-retention mechanisms, and suture slippage was the most common failure mode.12 Nevertheless, other biomechanical studies have demonstrated frequent failure caused by anchor pullout in elderly human cadaveric specimens with diminished BMD, often with high-force testing protocols.12,13 In the more modest-force, in vivo rehabilitative environment, suture slippage rather than anchor dislodgement may be the main failure mode.11-15
We compared the PushLock implant and its entirely press-fit suture clamping design with the ReelX device, which relies on an intrinsic suture-locking mechanism. Middle-aged (mean, 53.3 years; SD, 5.7 years) cadaveric humeri were tested under physiologically relevant biomechanical conditions to begin to help identify how relatively osteopenic bone may affect suture-retention properties for a given implant. The results showed that the study methodology prevented implant failure via anchor–bone pullout. To our knowledge, this was the first study to exclusively analyze suture slippage in knotless anchors. The findings indicated that implants that rely heavily on a tight interference fit of the suture between the anchor and the surrounding bone may exhibit early slippage and failure after RCR in middle-aged patients with relative osteopenia.11,12 However, this study also demonstrated that devices with intrinsic clamping mechanisms that do not depend on the quality of surrounding bone may better resist suture slippage. It is not clear that all knotless anchors with intrinsic locking mechanisms function equivalently. For instance, Pietschmann and colleagues12 found that 2 of 10 implants with a different internal clamping device were unable to resist failure via suture slippage, even in healthy bone. Similarly, in a study comparing ReelX devices with implants having a different internal suture-retention mechanism, ReelX failed at higher ultimate loads, and typically via anchor dislodgement, versus suture slippage in the other implants.18
It is important to note that, in the present study, the loads at which sutures broke in the intrinsic clamping anchors approached the maximum contractile force of the supraspinatus muscle (302 N).19,20 In addition, these loads were above the resistance of the rotator cuff tendon to cut out with modern suture material.21
This study’s limitations include use of an in vitro human cadaveric model that precluded analysis of the effects of postoperative healing. Biomechanical testing was also performed in a single row-type suture configuration with the rotator cuff tendon removed. Fixtures used during testing oriented the load coaxially with the axis of tension, creating a worst-case loading scenario. Although this form of testing may limit its clinical applicability, its purpose was to critically isolate how well a knotless anchor could resist suture slippage. The methods we used were also limited because the stability of the bone–anchor interface was not assessed. For patients with osteopenia, anchor pullout rather than suture slippage could be the most limiting factor for knotless anchor construct failure, and therefore further testing of both failure modes is needed. Future biomechanical studies should compare various knotless anchors’ suture-slippage characteristics in other constructs in physiologic testing orientations, including double-row and suture-bridge configurations, as well as with intact rotator cuff tendons. In addition, use of labral tape as a substitute for polyblend suture has been suggested to limit suture slippage, and this technique theoretically could have changed the results of this study.22
Conclusion
An implant with an internal ratcheting mechanism for suture retention demonstrated significantly less suture slippage in an axial tension evaluation protocol than a device reliant on interference fit of the suture between the anchor and surrounding bone. In the clinical setting, this may allow for less gap formation during the healing phase following RCR with a knotless anchor. There was also increased maximum load to failure, demonstrating an increased load until catastrophic failure using a device with a ratcheting internal locking mechanism.
1. Thal R. A knotless suture anchor. Design, function, and biomechanical testing. Am J Sports Med. 2001;29(5):646-649.
2. Cole BJ, ElAttrache NS, Anbari A. Arthroscopic rotator cuff repairs: an anatomic and biomechanical rationale for different suture-anchor repair configurations. Arthroscopy. 2007;23(6):662-669.
3. Kim KC, Shin HD, Cha SM, Lee WY. Comparison of repair integrity and functional outcomes for 3 arthroscopic suture bridge rotator cuff repair techniques. Am J Sports Med. 2013;41(2):271-277.
4. Choi CH, Kim SK, Cho MR, et al. Functional outcomes and structural integrity after double-pulley suture bridge rotator cuff repair using serial ultrasonographic examination. J Shoulder Elbow Surg. 2012;21(12):1753-1763.
5. Brown BS, Cooper AD, McIff TE, Key VH, Toby EB. Initial fixation and cyclic loading stability of knotless suture anchors for rotator cuff repair. J Shoulder Elbow Surg. 2008;17(2):313-318.
6. Burkhart SS, Adams CR, Burkhart SS, Schoolfield JD. A biomechanical comparison of 2 techniques of footprint reconstruction for rotator cuff repair: the SwiveLock-FiberChain construct versus standard double-row repair. Arthroscopy. 2009;25(3):274-281.
7. Hepp P, Osterhoff G, Engel T, Marquass B, Klink T, Josten C. Biomechanical evaluation of knotless anatomical double-layer double-row rotator cuff repair: a comparative ex vivo study. Am J Sports Med. 2009;37(7):1363-1369.
8. Maguire M, Goldberg J, Bokor D, et al. Biomechanical evaluation of four different transosseous-equivalent/suture bridge rotator cuff repairs. Knee Surg Sports Traumatol Arthrosc. 2011;19(9):1582-1587.
9. Millar NL, Wu X, Tantau R, Silverstone E, Murrell GA. Open versus two forms of arthroscopic rotator cuff repair. Clin Orthop Relat Res. 2009;467(4):966-978.
10. Rhee YG, Cho NS, Parke CS. Arthroscopic rotator cuff repair using modified Mason-Allen medial row stitch: knotless versus knot-tying suture bridge technique. Am J Sports Med. 2012;40(11):2440-2447.
11. Wieser K, Farshad M, Vlachopoulos L, Ruffieux K, Gerber C, Meyer DC. Suture slippage in knotless suture anchors as a potential failure mechanism in rotator cuff repair. Arthroscopy. 2012;28(11):1622-1627.
12. Pietschmann MF, Gülecyüz MF, Fieseler S, et al. Biomechanical stability of knotless suture anchors used in rotator cuff repair in healthy and osteopenic bone. Arthroscopy. 2010;26(8):1035-1044.
13. Barber FA, Hapa O, Bynum JA. Comparative testing by cyclic loading of rotator cuff suture anchors containing multiple high-strength sutures. Arthroscopy. 2010;26(9 suppl):S134-S141.
14. Barber FA, Coons DA, Ruiz-Suarez M. Cyclic load testing of biodegradable suture anchors containing 2 high-strength sutures. Arthroscopy. 2007;23(4):355-360.
15. Bynum CK, Lee S, Mahar A, Tasto J, Pedowitz R. Failure mode of suture anchors as a function of insertion depth. Am J Sports Med. 2005;33(7):1030-1034.
16. Gerber C, Schneeberger AG, Beck M, Schlegel U. Mechanical strength of repairs of the rotator cuff. J Bone Joint Surg Br. 1994;76(3):371-380.
17. Schneeberger AG, von Roll A, Kalberer F, Jacob HA, Gerber C. Mechanical strength of arthroscopic rotator cuff repair techniques: an in vitro study. J Bone Joint Surg Am. 2002;84(12):2152-2160.
18. Efird C, Traub S, Baldini T, et al. Knotless single-row rotator cuff repair: a comparative biomechanical study of 2 knotless suture anchors. Orthopedics. 2013;36(8):e1033-e1037.
19. Wright PB, Budoff JE, Yeh ML, Kelm ZS, Luo ZP. Strength of damaged suture: an in vitro study. Arthroscopy. 2006;22(12):1270-1275.
20. Burkhart SS. A stepwise approach to arthroscopic rotator cuff repair based on biomechanical principles. Arthroscopy. 2000;16(1):82-90.
21. Bisson LJ, Manohar LM. A biomechanical comparison of the pullout strength of No. 2 FiberWire suture and 2-mm FiberWire tape in bovine rotator cuff tendons. Arthroscopy. 2010;26(11):1463-1468.
22. Burkhart SS, Denard PJ, Konicek J, Hanypsiak BT. Biomechanical validation of load-sharing rip-stop fixation for the repair of tissue-deficient rotator cuff tears. Am J Sports Med. 2014;42(2):457-462.

Comparison of Outcomes and Costs of Tension-Band and Locking-Plate Osteosynthesis in Transverse Olecranon Fractures: A Matched-Cohort Study
Olecranon fractures are a common injury, representing 10% of all upper extremity fractures.1 Displaced fractures require fixation to restore anatomical alignment and minimize posttraumatic arthrosis.2,3 Multiple surgical techniques have been developed to treat these fractures, with implant choice largely dictated by fracture pattern and associated injuries. Simple, noncomminuted, transverse, proximal fractures can be treated with a tension-band construct, and fractures that are comminuted, oblique, distal to the midpoint of the sigmoid notch, or associated with complex elbow injuries generally require locking-plate fixation.4,5 Although both tension bands and locking plates have been used successfully (Figures 1A, 1B), they remain some of the most frequently removed orthopedic implants, usually because of implant prominence.6

Both fixation devices have potential advantages and disadvantages. Tension-band fixation requires relatively “low-tech” instrumentation and implants and, as a result, has less cost and potentially less operative time for application. As it is smaller than a plate-and-screw construct, a tension band may be less prone to prominence, but this has not been substantiated in the literature.7-14 Implant migration has been a reported complication of tension-band fixation.7,11,13,15
Locking-plate fixation has been shown to be biomechanically stronger,16 and some reports have shown fewer repeat operations for implant prominence than with tension-band fixation.1,8,17-22 Because of more advanced product development and manufacturing, however, it comes at a higher cost. Plate fixation also requires more steps for application, which may require more operative time, and implant prominence has remained a problem, even with modern plates with lower profiles.19
Previous studies of olecranon fixation have included complex fractures and osteotomies or did not include current-generation precontoured locking plates. We found no other study that compared the outcomes, complications, and costs of tension-band and modern locking-plate fixation of isolated transverse olecranon fractures.
To determine if there are significant differences in outcomes and costs between tension-band and locking-plate fixation of transverse olecranon fractures in adults, we retrospectively compared functional outcomes, complications, and costs in 2 matched cohorts of displaced transverse olecranon fractures. We hypothesized that there would be no differences in functional outcomes, implant prominence, posttraumatic arthrosis, complications, or operative time, but that costs would be less with tension-band fixation.
Materials and Methods
After obtaining institutional review board approval, we retrospectively reviewed the medical records of patients who had undergone fixation of an isolated, transverse, noncomminuted olecranon fracture (Orthopaedic Trauma Association 21B1) at our institution between 2004 and 2011. Inclusion criteria included use of a tension-band construct or a precontoured locking plate, skeletal maturity at time of injury, and minimum 2-year follow-up. Exclusion criteria were open fractures, osteotomies, any other ipsilateral upper extremity fracture, and fractures with comminution, obliquity, or distal location.
Although, based on fracture pattern, tension-band fixation is appropriate for olecranon osteotomies used for distal humeral exposure, we did not include osteotomies because functional outcomes would likely be different from those of true olecranon fractures, in addition to the possibility that the soft-tissue injury from a distal humeral fracture and resultant exposure could result in a different level of implant prominence. To control for demographic variables, we used a cohort design in which patients were matched on age and length of follow-up.
During the study period, we treated 287 olecranon fractures. Forty-nine patients met the inclusion criteria. The study population consisted of 20 patients, 10 in each cohort matched on age and length of follow-up. There were no statistically significant differences between groups in demographic variables, including dominant arm involved and number of worker’s compensation claims (Table 1). Mechanisms of injury were similar in the groups. In the tension-band group, 9 patients fell directly onto their elbow, and 1 fell onto her outstretched hand. In the locking-plate group, 8 patients fell directly onto the elbow, 1 fell onto her outstretched hand, and 1 was injured in a motorcycle accident.
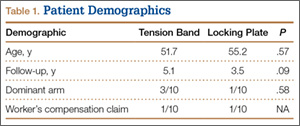
All surgeons, regardless of implant selected, used a posterior incision that curved slightly laterally about the tip of the olecranon. Surgeon preference determined which fixation construct to use. Tension-band fixation was performed using 2 bicortical Kirschner wires and a stainless-steel wire through a distal drill hole to complete the tension band. Of the 10 locking-plate constructs used, 4 were PERI-LOC olecranon locking plates (Smith & Nephew), 3 were LCP olecranon plates (Synthes), and 3 were periarticular proximal ulna locking plates (Zimmer).
All returning patients were seen by either Dr. Amini or Mr. Wilson and underwent range of motion (ROM) measurement with a goniometer; assessment for subjective and objective implant prominence (graded none, mild, moderate, or severe/already had implant removed); and functional scoring using the Mayo Elbow Performance Score (MEPS) and the Quick Disability of the Arm, Shoulder, and Hand (QDASH). Results were classified excellent (MEPS, >90), good (75-89), fair (60-74), and poor (<60).23
Anteroposterior and lateral radiographs of the elbow were obtained at follow-up and were examined for maintenance/integrity of implants, radiographic union, and posttraumatic arthrosis. Arthrosis was graded using the Broberg and Morrey24 classification: grade 0 (normal elbow), grade 1 (slight joint-space narrowing with minimal osteophyte formation), grade 2 (moderate joint-space narrowing with moderate osteophyte formation), grade 3 (severe degenerative changes with gross destruction of joint).
Medical records were examined to determine surgery time. Billing information was examined to determine charges related to each operation, specifically the charge for the implants and the overall charge for the operation, which included anesthesia charges. Subsequent operations were included as applicable.
Student t test was used to compare differences in normative data, and Pearson χ2 test to compare differences in categorical data. Differences with P < .05 were considered significant.
Results
There were no clinically or statistically significant differences in ROM or functional outcomes (Table 2). According to MEPS, results were excellent in 8 and good in 2 patients in the tension-band group and excellent in 7 and good in 3 patients in the locking-plate group.
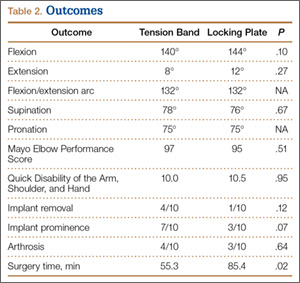
In patients who had implants removed, average time to subsequent procedure was 6.2 months, and all patients who underwent implant removal did so before 1-year follow-up. Implant removal was required in 4 tension-band patients and 1 locking-plate patient (P = .12). Similarly, 7 tension-band patients (including those with implants removed) and 3 locking-plate patients had implant-related symptoms, with the difference trending (P = .07) toward significance (Table 2).
Patients who elected to have their implants removed tended to be younger than those who did not (45.7 vs 56.0 years); the difference (P = .14) was not significant. Worker’s compensation status did not affect the decision to undergo implant removal. At final follow-up, there were no differences in ROM or functional outcomes between patients who had implants removed and those who did not. No variable predicted which patients had implants removed or not (Table 3).
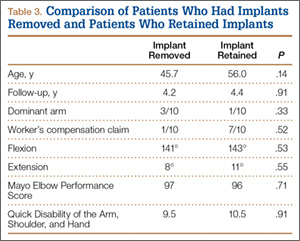
Implant charges were $207.97 for the tension-band cohort and $6688.52 for the locking-plate cohort (P < .0001). Operative charges for the index procedures were $5171.06 for tension-band fixation and $14,160.26 for locking-plate fixation (P < .0001). Overall operative charges, including charges for subsequent operations, were $6598.36 in the tension-band cohort and $14,333.46 in the locking-plate cohort (P = .001). In a comparison of combined charges for index procedure and implant removal (excluding other repeat operations), charges were $6025.56 for the tension-band cohort and $14,333.46 for the locking-plate cohort (P = .0002). Even if all patients with tension-band fixation and no patients with locking-plate fixation had implant removal, mean charges for all operative care would still be significantly (P = .0005) less in the tension-band cohort than in the locking-plate cohort ($7307.31 vs $14,160.26) (Table 4).
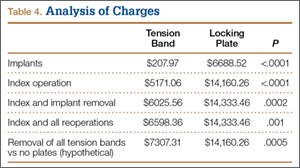
Surgery time was significantly (P = .025) less for tension-band fixation than for locking-plate fixation (55.3 vs 85.4 minutes) (Table 2).
Four tension-band patients and 3 locking-plate patients had radiographic evidence of grade 1 posttraumatic arthrosis (P = .64). None required subsequent procedures. Patients with posttraumatic arthrosis had slightly less flexion, but there was no difference in overall flexion-extension arc or functional outcomes between patients with and without arthrosis (Table 5).
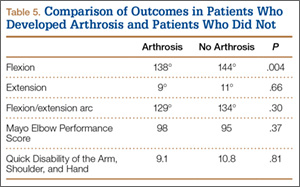
The locking-plate cohort had no other complications, and the tension-band cohort had 3. In 1 tension-band patient, the wire disengaged from the Kirschner wires. The fracture healed, but a subsequent procedure was required for symptomatic implant prominence (Figures 2A–2C). Another tension-band patient developed both posttraumatic arthrofibrosis and cubital tunnel syndrome, in addition to a prominent implant. She underwent capsular release, ulnar nerve transposition, and implant removal. At final follow-up, motion was improved, and ulnar nerve symptoms were resolved. There were no infections in either group. Overall, there were no statistically significant differences in complications between groups.
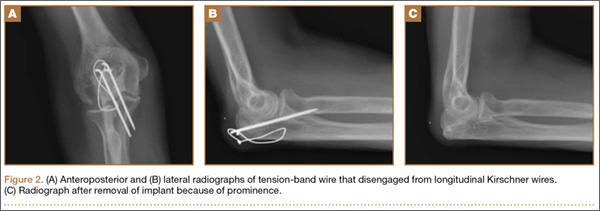
Discussion
We conducted this study to determine differences between tension-band and locking-plate fixation of isolated, closed, noncomminuted, transverse olecranon fractures. Few studies have directly compared tension-band and locking-plate fixation,8,10,19,25 particularly in reference to outcomes of functional scores, implant prominence, complications, operative time, and cost-effectiveness. We found no study that clinically compared these implants since the advent of precontoured locking plates, and no study that compared results in similar fracture patterns. In our study, we found no differences in functional or radiographic outcomes between groups, but significant differences in charges and overall cost of care.
Our findings suggest that patients return to high functional level an average of 4.3 years after fixation of an olecranon fracture with either a tension band or a locking plate. Both cohorts achieved QDASH scores equivalent to normative values for the general population,26 and all patients in both cohorts achieved either good or excellent results based on MEPS values.23 This is comparable to reported functional outcomes in the literature, with previous reports suggesting 86% to 92% of patients obtain good or excellent results.1,7,8,12,14,17,18,27 The rate of posttraumatic arthrosis in both cohorts was low, and, when present, arthrosis was radiographically mild (no patient had grade 2 or 3 arthrosis). Patients with and without radiographic evidence of arthrosis had similar ROM and functional outcomes.
Our findings also suggest a trend toward fewer implant-related symptoms and less need for implant removal in patients treated with locking plates. Although both implants have high rates of prominence requiring removal, most studies support our findings that tension bands are more prominent than locking plates. Fixation has been reported to cause prominence requiring removal in 42% to 82% of patients with tension bands7-14 and 0% to 47% of patients with locking plates.1,8,17,18,20-22,28 It is important to note that many earlier studies either were conducted before the advent of precontoured locking plates or were not comparative.1,7,9-14,17,18,20-22,28 In one recent study, however, Edwards and colleagues19 surveyed 138 patients and found very similar implant removal rates: 63.6% for tension bands and 62.5% for locking plates. Nevertheless, implant removal rates for fixation of olecranon fractures remain high, regardless of implant used.
Our data did not reveal any difference in ROM or functional outcomes between patients who had and did not have implants removed. This suggests, first, that QDASH and MEPS may not be sensitive in identifying patients with implant prominence, as neither questionnaire incorporates implant prominence into its scoring, and, second, that implant removal does not significantly impair ROM. As a result, surgeons should consider asking patients specifically about symptoms of prominent implants once there is convincing evidence of union and counseling them about implant removal if appropriate.
To our knowledge, the differences in cost and operative time between tension-band and locking-plate fixation have not been previously reported. Our data suggest that the financial differences resulted mainly from implant charges; overall, tension-band fixation was roughly half the cost of locking-plate fixation. In addition, in patients who eventually had implants removed, the cost of implant removal was relatively small compared with the cost of the initial fixation in both cohorts. As a result, even if all patients in the tension-band cohort and no patients in the locking-plate cohort had implants removed, tension-band fixation and subsequent implant removal would still cost half as much as locking-plate fixation without implant removal. Moreover, fixation with a tension band took roughly 30 minutes less than fixation with a plate. Less time in the operating room likely contributed to the additional cost savings realized with tension-band fixation beyond those directly resulting from implant cost.
The strength of this study lies in the homogeneity of cohorts. Each cohort was matched primarily on age and secondarily on length of follow-up. All patients had closed, proximal, transverse fractures without comminution, and we excluded olecranon osteotomies as these represent an entity different from true fractures. Fractures with comminution or distal extension may represent more severe injuries, and functional scores, complications, hardware prominence, and operative time might have been affected by inclusion of these fractures. Further, there were no infections in either group to skew the rate of implant prominence or removal.
The weaknesses of the study lie in its limited sample sizes, retrospective design, and lack of long-term follow-up. Group size was limited by our attempts to create homogenous cohorts. As a result, some patients were not included as participants because of strict exclusion criteria. Most notably, we excluded any fracture not appropriate for tension-band fixation, as well as open fractures and osteotomies. Despite the retrospective nature of the study, all patients were examined by the investigators at final follow-up (minimum, 2 years) for the purpose of this study. It is possible that these functional results may not be sustained over the long term, as the risk for posttraumatic arthrosis in articular injuries builds with time. Although some patients may want to have implants removed later, all our study patients who had implants removed had them removed within 1 year, and all 20 patients were reached at minimum 2-year follow-up. Thus, it is unlikely but possible that some of the other study patients will elect to have implants removed.
1. Buijze G, Kloen P. Clinical evaluation of locking compression plate fixation for comminuted olecranon fractures. J Bone Joint Surg Am. 2009;91(10):
2416-2420.
2. Newman SD, Mauffrey C, Krikler S. Olecranon fractures. Injury. 2009;40(6):575-581.
3. Veillette CJ, Steinmann SP. Olecranon fractures. Orthop Clin North Am. 2008;39(2):229-236.
4. Baecher N, Edwards S. Olecranon fractures. J Hand Surg Am. 2013;38(3):593-604.
5. Hak DJ, Golladay GJ. Olecranon fractures: treatment options. J Am Acad Orthop Surg. 2000;8(4):266-275.
6. Busam ML, Esther RJ, Obremskey WT. Hardware removal: indications and expectations. J Am Acad Orthop Surg. 2006;14(2):113-120.
7. Chalidis BE, Sachinis NC, Samoladas EP, Dimitriou CG, Pournaras JD. Is tension band wiring technique the “gold standard” for the treatment of olecranon fractures? A long term functional outcome study. J Orthop Surg Res. 2008;3:9.
8. Hume MC, Wiss DA. Olecranon fractures: a clinical and radiographic comparison of tension-band wiring and plate fixation. Clin Orthop Relat Res. 1992;(285):229-235.
9. Karlsson MK, Hasserius R, Besjakov J, Karlsson C, Josefsson PO. Comparison of tension-band and figure-of-eight wiring techniques for treatment of olecranon fractures. J Shoulder Elbow Surg. 2002;11(4):377-382.
10. Lindenhovius AL, Brouwer KM, Doornberg JN, Ring DC, Kloen P. Long-term outcome of operatively treated fracture-dislocations of the olecranon. J Orthop Trauma. 2008;22(5):325-331.
11. Macko D, Szabo RM. Complications of tension-band wiring of olecranon fractures. J Bone Joint Surg Am. 1985;67(9):1396-1401.
12. Romero JM, Miran A, Jensen CH. Complications and re-operation rate after tension-band wiring of olecranon fractures. J Orthop Sci. 2000;5(4):318-320.
13. Rommens PM, Schneider RU, Reuter M. Functional results after operative treatment of olecranon fractures. Acta Chir Belg. 2004;104(2):191-197.
14. Villanueva P, Osorio F, Commessatti M, Sanchez-Sotelo J. Tension-band wiring for olecranon fractures: analysis of risk factors for failure. J Shoulder Elbow Surg. 2006;15(3):351-356.
15. Sahajpal D, Wright TW. Proximal ulna fractures. J Hand Surg Am. 2009;34(2):357-362.
16. Rouleau DM, Sandman E, van Riet R, Galatz LM. Management of fractures of the proximal ulna. J Am Acad Orthop Surg. 2013;21(3):149-160.
17. Anderson ML, Larson AN, Merten SM, Steinmann SP. Congruent elbow plate fixation of olecranon fractures. J Orthop Trauma. 2007;21(6):386-393.
18. Bailey CS, MacDermid J, Patterson SD, King GJ. Outcome of plate fixation of olecranon fractures. J Orthop Trauma. 2001;15(8):542-548.
19. Edwards SG, Cohen MS, Lattanza LL, et al. Surgeon perceptions and patient outcomes regarding proximal ulna fixation: a multicenter experience. J Shoulder Elbow Surg. 2012;21(12):1637-1643.
20. Munoz-Mahamud E, Fernandez-Valencia JA, Riba J. Plate osteosynthesis for severe olecranon fractures. J Orthop Surg. 2010;18(1):80-84.
21. Simpson NS, Goodman LA, Jupiter JB. Contoured LCDC plating of the proximal ulna. Injury. 1996;27(6):411-417.
22. Tejwani NC, Garnham IR, Wolinsky PR, Kummer FJ, Koval KJ. Posterior olecranon plating: biomechanical and clinical evaluation of a new operative technique. Bull Hosp Jt Dis. 2002-2003;61(1-2):27-31.
23. Morrey BF, An KN. Functional evaluation of the elbow. In: Morrey BF, Sanchez-Sotelo J, eds. The Elbow and Its Disorders. 4th ed. Philadelphia, PA: Elsevier; 2008:87-88.
24. Broberg MA, Morrey BF. The results of delayed excision of the radial head for fracture. J Bone Joint Surg Am. 1986;68(5):669-674.
25. Horne JG, Tanzer TL. Olecranon fractures: a review of 100 cases. J Trauma. 1981;21(6):469-472.
26. Hunsaker FG, Cioffi DA, Amadio PC, Wright JG, Caughlin B. The American Academy of Orthopaedic Surgeons outcomes instruments: normative values from the general population. J Bone Joint Surg Am. 2002;84(2):208-215.
27. Ikeda M, Fukushima Y, Kobayashi Y, Oka Y. Comminuted fractures of the olecranon. Management by bone graft from the iliac crest and multiple tension-band wiring. J Bone Joint Surg Br. 2001;83(6):805-808.
28. Erturer RE, Sever C, Sonmez MM, Ozcelik IB, Akman S, Ozturk I. Results of open reduction and plate osteosynthesis in comminuted fracture of the olecranon. J Shoulder Elbow Surg. 2011;20(3):449-454.
Olecranon fractures are a common injury, representing 10% of all upper extremity fractures.1 Displaced fractures require fixation to restore anatomical alignment and minimize posttraumatic arthrosis.2,3 Multiple surgical techniques have been developed to treat these fractures, with implant choice largely dictated by fracture pattern and associated injuries. Simple, noncomminuted, transverse, proximal fractures can be treated with a tension-band construct, and fractures that are comminuted, oblique, distal to the midpoint of the sigmoid notch, or associated with complex elbow injuries generally require locking-plate fixation.4,5 Although both tension bands and locking plates have been used successfully (Figures 1A, 1B), they remain some of the most frequently removed orthopedic implants, usually because of implant prominence.6
Both fixation devices have potential advantages and disadvantages. Tension-band fixation requires relatively “low-tech” instrumentation and implants and, as a result, has less cost and potentially less operative time for application. As it is smaller than a plate-and-screw construct, a tension band may be less prone to prominence, but this has not been substantiated in the literature.7-14 Implant migration has been a reported complication of tension-band fixation.7,11,13,15
Locking-plate fixation has been shown to be biomechanically stronger,16 and some reports have shown fewer repeat operations for implant prominence than with tension-band fixation.1,8,17-22 Because of more advanced product development and manufacturing, however, it comes at a higher cost. Plate fixation also requires more steps for application, which may require more operative time, and implant prominence has remained a problem, even with modern plates with lower profiles.19
Previous studies of olecranon fixation have included complex fractures and osteotomies or did not include current-generation precontoured locking plates. We found no other study that compared the outcomes, complications, and costs of tension-band and modern locking-plate fixation of isolated transverse olecranon fractures.
To determine if there are significant differences in outcomes and costs between tension-band and locking-plate fixation of transverse olecranon fractures in adults, we retrospectively compared functional outcomes, complications, and costs in 2 matched cohorts of displaced transverse olecranon fractures. We hypothesized that there would be no differences in functional outcomes, implant prominence, posttraumatic arthrosis, complications, or operative time, but that costs would be less with tension-band fixation.
Materials and Methods
After obtaining institutional review board approval, we retrospectively reviewed the medical records of patients who had undergone fixation of an isolated, transverse, noncomminuted olecranon fracture (Orthopaedic Trauma Association 21B1) at our institution between 2004 and 2011. Inclusion criteria included use of a tension-band construct or a precontoured locking plate, skeletal maturity at time of injury, and minimum 2-year follow-up. Exclusion criteria were open fractures, osteotomies, any other ipsilateral upper extremity fracture, and fractures with comminution, obliquity, or distal location.
Although, based on fracture pattern, tension-band fixation is appropriate for olecranon osteotomies used for distal humeral exposure, we did not include osteotomies because functional outcomes would likely be different from those of true olecranon fractures, in addition to the possibility that the soft-tissue injury from a distal humeral fracture and resultant exposure could result in a different level of implant prominence. To control for demographic variables, we used a cohort design in which patients were matched on age and length of follow-up.
During the study period, we treated 287 olecranon fractures. Forty-nine patients met the inclusion criteria. The study population consisted of 20 patients, 10 in each cohort matched on age and length of follow-up. There were no statistically significant differences between groups in demographic variables, including dominant arm involved and number of worker’s compensation claims (Table 1). Mechanisms of injury were similar in the groups. In the tension-band group, 9 patients fell directly onto their elbow, and 1 fell onto her outstretched hand. In the locking-plate group, 8 patients fell directly onto the elbow, 1 fell onto her outstretched hand, and 1 was injured in a motorcycle accident.
All surgeons, regardless of implant selected, used a posterior incision that curved slightly laterally about the tip of the olecranon. Surgeon preference determined which fixation construct to use. Tension-band fixation was performed using 2 bicortical Kirschner wires and a stainless-steel wire through a distal drill hole to complete the tension band. Of the 10 locking-plate constructs used, 4 were PERI-LOC olecranon locking plates (Smith & Nephew), 3 were LCP olecranon plates (Synthes), and 3 were periarticular proximal ulna locking plates (Zimmer).
All returning patients were seen by either Dr. Amini or Mr. Wilson and underwent range of motion (ROM) measurement with a goniometer; assessment for subjective and objective implant prominence (graded none, mild, moderate, or severe/already had implant removed); and functional scoring using the Mayo Elbow Performance Score (MEPS) and the Quick Disability of the Arm, Shoulder, and Hand (QDASH). Results were classified excellent (MEPS, >90), good (75-89), fair (60-74), and poor (<60).23
Anteroposterior and lateral radiographs of the elbow were obtained at follow-up and were examined for maintenance/integrity of implants, radiographic union, and posttraumatic arthrosis. Arthrosis was graded using the Broberg and Morrey24 classification: grade 0 (normal elbow), grade 1 (slight joint-space narrowing with minimal osteophyte formation), grade 2 (moderate joint-space narrowing with moderate osteophyte formation), grade 3 (severe degenerative changes with gross destruction of joint).
Medical records were examined to determine surgery time. Billing information was examined to determine charges related to each operation, specifically the charge for the implants and the overall charge for the operation, which included anesthesia charges. Subsequent operations were included as applicable.
Student t test was used to compare differences in normative data, and Pearson χ2 test to compare differences in categorical data. Differences with P < .05 were considered significant.
Results
There were no clinically or statistically significant differences in ROM or functional outcomes (Table 2). According to MEPS, results were excellent in 8 and good in 2 patients in the tension-band group and excellent in 7 and good in 3 patients in the locking-plate group.
In patients who had implants removed, average time to subsequent procedure was 6.2 months, and all patients who underwent implant removal did so before 1-year follow-up. Implant removal was required in 4 tension-band patients and 1 locking-plate patient (P = .12). Similarly, 7 tension-band patients (including those with implants removed) and 3 locking-plate patients had implant-related symptoms, with the difference trending (P = .07) toward significance (Table 2).
Patients who elected to have their implants removed tended to be younger than those who did not (45.7 vs 56.0 years); the difference (P = .14) was not significant. Worker’s compensation status did not affect the decision to undergo implant removal. At final follow-up, there were no differences in ROM or functional outcomes between patients who had implants removed and those who did not. No variable predicted which patients had implants removed or not (Table 3).
Implant charges were $207.97 for the tension-band cohort and $6688.52 for the locking-plate cohort (P < .0001). Operative charges for the index procedures were $5171.06 for tension-band fixation and $14,160.26 for locking-plate fixation (P < .0001). Overall operative charges, including charges for subsequent operations, were $6598.36 in the tension-band cohort and $14,333.46 in the locking-plate cohort (P = .001). In a comparison of combined charges for index procedure and implant removal (excluding other repeat operations), charges were $6025.56 for the tension-band cohort and $14,333.46 for the locking-plate cohort (P = .0002). Even if all patients with tension-band fixation and no patients with locking-plate fixation had implant removal, mean charges for all operative care would still be significantly (P = .0005) less in the tension-band cohort than in the locking-plate cohort ($7307.31 vs $14,160.26) (Table 4).
Surgery time was significantly (P = .025) less for tension-band fixation than for locking-plate fixation (55.3 vs 85.4 minutes) (Table 2).
Four tension-band patients and 3 locking-plate patients had radiographic evidence of grade 1 posttraumatic arthrosis (P = .64). None required subsequent procedures. Patients with posttraumatic arthrosis had slightly less flexion, but there was no difference in overall flexion-extension arc or functional outcomes between patients with and without arthrosis (Table 5).
The locking-plate cohort had no other complications, and the tension-band cohort had 3. In 1 tension-band patient, the wire disengaged from the Kirschner wires. The fracture healed, but a subsequent procedure was required for symptomatic implant prominence (Figures 2A–2C). Another tension-band patient developed both posttraumatic arthrofibrosis and cubital tunnel syndrome, in addition to a prominent implant. She underwent capsular release, ulnar nerve transposition, and implant removal. At final follow-up, motion was improved, and ulnar nerve symptoms were resolved. There were no infections in either group. Overall, there were no statistically significant differences in complications between groups.
Discussion
We conducted this study to determine differences between tension-band and locking-plate fixation of isolated, closed, noncomminuted, transverse olecranon fractures. Few studies have directly compared tension-band and locking-plate fixation,8,10,19,25 particularly in reference to outcomes of functional scores, implant prominence, complications, operative time, and cost-effectiveness. We found no study that clinically compared these implants since the advent of precontoured locking plates, and no study that compared results in similar fracture patterns. In our study, we found no differences in functional or radiographic outcomes between groups, but significant differences in charges and overall cost of care.
Our findings suggest that patients return to high functional level an average of 4.3 years after fixation of an olecranon fracture with either a tension band or a locking plate. Both cohorts achieved QDASH scores equivalent to normative values for the general population,26 and all patients in both cohorts achieved either good or excellent results based on MEPS values.23 This is comparable to reported functional outcomes in the literature, with previous reports suggesting 86% to 92% of patients obtain good or excellent results.1,7,8,12,14,17,18,27 The rate of posttraumatic arthrosis in both cohorts was low, and, when present, arthrosis was radiographically mild (no patient had grade 2 or 3 arthrosis). Patients with and without radiographic evidence of arthrosis had similar ROM and functional outcomes.
Our findings also suggest a trend toward fewer implant-related symptoms and less need for implant removal in patients treated with locking plates. Although both implants have high rates of prominence requiring removal, most studies support our findings that tension bands are more prominent than locking plates. Fixation has been reported to cause prominence requiring removal in 42% to 82% of patients with tension bands7-14 and 0% to 47% of patients with locking plates.1,8,17,18,20-22,28 It is important to note that many earlier studies either were conducted before the advent of precontoured locking plates or were not comparative.1,7,9-14,17,18,20-22,28 In one recent study, however, Edwards and colleagues19 surveyed 138 patients and found very similar implant removal rates: 63.6% for tension bands and 62.5% for locking plates. Nevertheless, implant removal rates for fixation of olecranon fractures remain high, regardless of implant used.
Our data did not reveal any difference in ROM or functional outcomes between patients who had and did not have implants removed. This suggests, first, that QDASH and MEPS may not be sensitive in identifying patients with implant prominence, as neither questionnaire incorporates implant prominence into its scoring, and, second, that implant removal does not significantly impair ROM. As a result, surgeons should consider asking patients specifically about symptoms of prominent implants once there is convincing evidence of union and counseling them about implant removal if appropriate.
To our knowledge, the differences in cost and operative time between tension-band and locking-plate fixation have not been previously reported. Our data suggest that the financial differences resulted mainly from implant charges; overall, tension-band fixation was roughly half the cost of locking-plate fixation. In addition, in patients who eventually had implants removed, the cost of implant removal was relatively small compared with the cost of the initial fixation in both cohorts. As a result, even if all patients in the tension-band cohort and no patients in the locking-plate cohort had implants removed, tension-band fixation and subsequent implant removal would still cost half as much as locking-plate fixation without implant removal. Moreover, fixation with a tension band took roughly 30 minutes less than fixation with a plate. Less time in the operating room likely contributed to the additional cost savings realized with tension-band fixation beyond those directly resulting from implant cost.
The strength of this study lies in the homogeneity of cohorts. Each cohort was matched primarily on age and secondarily on length of follow-up. All patients had closed, proximal, transverse fractures without comminution, and we excluded olecranon osteotomies as these represent an entity different from true fractures. Fractures with comminution or distal extension may represent more severe injuries, and functional scores, complications, hardware prominence, and operative time might have been affected by inclusion of these fractures. Further, there were no infections in either group to skew the rate of implant prominence or removal.
The weaknesses of the study lie in its limited sample sizes, retrospective design, and lack of long-term follow-up. Group size was limited by our attempts to create homogenous cohorts. As a result, some patients were not included as participants because of strict exclusion criteria. Most notably, we excluded any fracture not appropriate for tension-band fixation, as well as open fractures and osteotomies. Despite the retrospective nature of the study, all patients were examined by the investigators at final follow-up (minimum, 2 years) for the purpose of this study. It is possible that these functional results may not be sustained over the long term, as the risk for posttraumatic arthrosis in articular injuries builds with time. Although some patients may want to have implants removed later, all our study patients who had implants removed had them removed within 1 year, and all 20 patients were reached at minimum 2-year follow-up. Thus, it is unlikely but possible that some of the other study patients will elect to have implants removed.
1. Buijze G, Kloen P. Clinical evaluation of locking compression plate fixation for comminuted olecranon fractures. J Bone Joint Surg Am. 2009;91(10):
2416-2420.
2. Newman SD, Mauffrey C, Krikler S. Olecranon fractures. Injury. 2009;40(6):575-581.
3. Veillette CJ, Steinmann SP. Olecranon fractures. Orthop Clin North Am. 2008;39(2):229-236.
4. Baecher N, Edwards S. Olecranon fractures. J Hand Surg Am. 2013;38(3):593-604.
5. Hak DJ, Golladay GJ. Olecranon fractures: treatment options. J Am Acad Orthop Surg. 2000;8(4):266-275.
6. Busam ML, Esther RJ, Obremskey WT. Hardware removal: indications and expectations. J Am Acad Orthop Surg. 2006;14(2):113-120.
7. Chalidis BE, Sachinis NC, Samoladas EP, Dimitriou CG, Pournaras JD. Is tension band wiring technique the “gold standard” for the treatment of olecranon fractures? A long term functional outcome study. J Orthop Surg Res. 2008;3:9.
8. Hume MC, Wiss DA. Olecranon fractures: a clinical and radiographic comparison of tension-band wiring and plate fixation. Clin Orthop Relat Res. 1992;(285):229-235.
9. Karlsson MK, Hasserius R, Besjakov J, Karlsson C, Josefsson PO. Comparison of tension-band and figure-of-eight wiring techniques for treatment of olecranon fractures. J Shoulder Elbow Surg. 2002;11(4):377-382.
10. Lindenhovius AL, Brouwer KM, Doornberg JN, Ring DC, Kloen P. Long-term outcome of operatively treated fracture-dislocations of the olecranon. J Orthop Trauma. 2008;22(5):325-331.
11. Macko D, Szabo RM. Complications of tension-band wiring of olecranon fractures. J Bone Joint Surg Am. 1985;67(9):1396-1401.
12. Romero JM, Miran A, Jensen CH. Complications and re-operation rate after tension-band wiring of olecranon fractures. J Orthop Sci. 2000;5(4):318-320.
13. Rommens PM, Schneider RU, Reuter M. Functional results after operative treatment of olecranon fractures. Acta Chir Belg. 2004;104(2):191-197.
14. Villanueva P, Osorio F, Commessatti M, Sanchez-Sotelo J. Tension-band wiring for olecranon fractures: analysis of risk factors for failure. J Shoulder Elbow Surg. 2006;15(3):351-356.
15. Sahajpal D, Wright TW. Proximal ulna fractures. J Hand Surg Am. 2009;34(2):357-362.
16. Rouleau DM, Sandman E, van Riet R, Galatz LM. Management of fractures of the proximal ulna. J Am Acad Orthop Surg. 2013;21(3):149-160.
17. Anderson ML, Larson AN, Merten SM, Steinmann SP. Congruent elbow plate fixation of olecranon fractures. J Orthop Trauma. 2007;21(6):386-393.
18. Bailey CS, MacDermid J, Patterson SD, King GJ. Outcome of plate fixation of olecranon fractures. J Orthop Trauma. 2001;15(8):542-548.
19. Edwards SG, Cohen MS, Lattanza LL, et al. Surgeon perceptions and patient outcomes regarding proximal ulna fixation: a multicenter experience. J Shoulder Elbow Surg. 2012;21(12):1637-1643.
20. Munoz-Mahamud E, Fernandez-Valencia JA, Riba J. Plate osteosynthesis for severe olecranon fractures. J Orthop Surg. 2010;18(1):80-84.
21. Simpson NS, Goodman LA, Jupiter JB. Contoured LCDC plating of the proximal ulna. Injury. 1996;27(6):411-417.
22. Tejwani NC, Garnham IR, Wolinsky PR, Kummer FJ, Koval KJ. Posterior olecranon plating: biomechanical and clinical evaluation of a new operative technique. Bull Hosp Jt Dis. 2002-2003;61(1-2):27-31.
23. Morrey BF, An KN. Functional evaluation of the elbow. In: Morrey BF, Sanchez-Sotelo J, eds. The Elbow and Its Disorders. 4th ed. Philadelphia, PA: Elsevier; 2008:87-88.
24. Broberg MA, Morrey BF. The results of delayed excision of the radial head for fracture. J Bone Joint Surg Am. 1986;68(5):669-674.
25. Horne JG, Tanzer TL. Olecranon fractures: a review of 100 cases. J Trauma. 1981;21(6):469-472.
26. Hunsaker FG, Cioffi DA, Amadio PC, Wright JG, Caughlin B. The American Academy of Orthopaedic Surgeons outcomes instruments: normative values from the general population. J Bone Joint Surg Am. 2002;84(2):208-215.
27. Ikeda M, Fukushima Y, Kobayashi Y, Oka Y. Comminuted fractures of the olecranon. Management by bone graft from the iliac crest and multiple tension-band wiring. J Bone Joint Surg Br. 2001;83(6):805-808.
28. Erturer RE, Sever C, Sonmez MM, Ozcelik IB, Akman S, Ozturk I. Results of open reduction and plate osteosynthesis in comminuted fracture of the olecranon. J Shoulder Elbow Surg. 2011;20(3):449-454.
American Academy of Orthopaedic Surgeons Disclosure Policy Fails to Accurately Inform Its Members of Potential Conflicts of Interest
The relationship and collaboration between orthopedic surgeons and the orthopedic industry are considerable. Orthopedic surgeons can provide companies with important clinical input into the design of implants, facilitate commercialization of innovations developed by clinician entrepreneurs, and help provide rapid dissemination of new technologies.1,2 However, these relationships can result in conflicts of interest, thereby influencing the physicians’ judgment and choices and ultimately patient care.3,4 Making these potential conflicts transparent through physician disclosures is an accepted way to limit the negative effects of these relationships.5 The relationship between orthopedic surgeons and industry was brought to the forefront in 2007 with a settlement between the US Department of Justice (DOJ) and the 5 largest orthopedic implant makers.6 Among other things, this settlement required that each company publicly disclose on its website, beginning in 2008, the names and locations of all surgeons and organizations it paid, and how much. The DOJ settlement was one of the impetuses that led many orthopedic societies to adopt either voluntary or mandatory disclosure policies for their members.
In 2007, the American Academy of Orthopaedic Surgeons (AAOS) developed an orthopedic disclosure program to promote transparency and confidence in its educational programs and decisions.7 One of the 2 main purposes of the disclosure program is “streamlining the disclosure process for orthopedic surgeons and others involved in organizational governance, all formats of continuing medical education [CME] and authors of enduring materials, clinical practice guidelines (CPG) and appropriate use criteria (AUC) development and editors-in-chief and editorial boards, from whom disclosure is required.”8 Disclosure is mandatory only for participants in the AAOS CME programs (including any podium or poster presentation) or authors of enduring materials; members of the AAOS Board of Directors, Board of Councilors, Board of Specialty Societies, councils, cabinets, committees, project teams, or other AAOS governance groups; editors-in-chief and editorial boards; and AAOS guideline development workgroups. Members who fail to disclose are informed they cannot participate in AAOS activities. All other members of the organization are not required to disclose any industry-related relationships, and any disclosure is completely voluntary.7 This seems contrary to the second main goal of the disclosure policy: “increase transparency throughout AAOS by making this disclosure program available to the public and to AAOS members.”8
We conducted a study to compare the disclosures posted by the top orthopedic companies with the disclosures made by their surgeon-consultants and to determine how many of these surgeons have disclosed this information on the AAOS website.
Materials and Methods
On November 26, 2012, we reviewed the websites of the top 13 orthopedic device companies by revenue (Stryker, DePuy Orthopaedics, Zimmer Holdings, Smith & Nephew, Synthes, Medtronic Spine, Biomet, DJO Global, Orthofix, NuVasive, Wright Medical Group, ArthroCare, Exactech)9 to identify their surgeon-consultants for 2011. We excluded non-US surgeons (DOJ disclosure not required), revenues under $1000, and reimbursement for meals and travel. Although the DOJ settlement required that each company disclose on its website, beginning in 2008, the names and locations of its paid consultants and the amounts paid, the settlement did not stipulate how long this must be continued. Of the 13 companies, only 6 (Stryker, DePuy, Smith & Nephew, Medtronic, Wright, Exactech) continued listing and updating surgeon disclosure information.
As the companies differed in how they defined surgeon consulting services, we defined surgeon-consultant payments as the sum of consulting payments, royalty payments, and research support. We searched for each surgeon-consultant’s name in the AAOS orthopedic disclosure program database.7 From the database, we determined whether the surgeon was a member of AAOS. All members were then categorized into those who disclosed all their payments, those who incompletely disclosed their payments, those who did not disclose any payments, and those who did not provide any information. They were then subdivided into those who had and had not participated in CME activities at the AAOS annual meeting in 2011 (participants were listed in the meeting proceedings). This does not take into account AAOS members who presented at other AAOS-sponsored CME courses during 2011 and who therefore were required to disclose. The information was categorized by company, payment amount, and overall. To simplify matters and deal with varying corporate categories, we divided payments into 4 amount groups: less than $10,000, $10,000 to $100,000, $100,001 to $1 million, and more than $1 million. Some orthopedic companies reported surgeon payments as categorical rather than exact amounts. In these cases, we coded the payment as the midpoint of the range.
Results
Overall, 549 AAOS members received payments of more than $1000 from at least 1 of the 6 companies. Of these surgeons, 307 (56%) fully disclosed their payments, and 242 (44%) did not (Table 1). Of the 32 surgeons who were on 2 corporate payment lists, 24 disclosed both companies, 6 disclosed only 1 company, and 2 failed to disclose either company. AAOS members who did not disclose payments received less than $10,000 (average, $3706) in 37% of cases (Table 2), between $10,000 and $100,000 (average, $34,025) in 54% of cases, between $100,001 and $1 million (average, $290,505) in 8% of cases, and more than $1 million (average, $5,126,000) in less than 1% of cases.
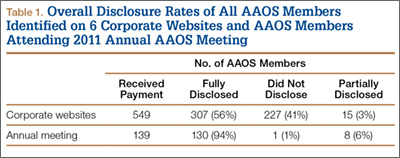
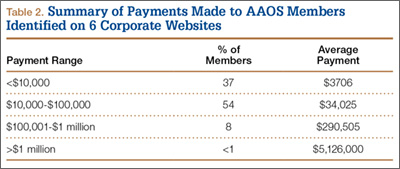
Number of consultants, number of surgeons not disclosing payments, and value of these payments varied from company to company (Table 3). The company with the most consultants listed 185 AAOS members, of which 37% had not disclosed payments (average, $39,604). Second was the company that listed 108 members; 39% had not disclosed payments (average, $38,426). The third company listed 102 members, of which 56% had not disclosed payments (average, $217,340). The company with the fourth most consultants listed 84 members; 43% had not disclosed payments (average, $9841). Next to last was the company listing 42 members, of which 52% had not disclosed payments (average, $160,634). The company with the fewest consultants listed 28 members; 61% had not disclosed payments (average $85,388).
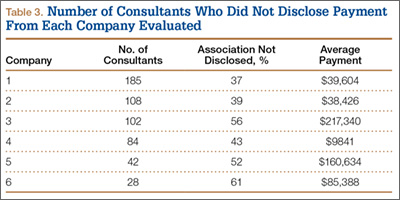
Of AAOS members who attended the 2011 annual meeting, 94% fully disclosed industry payments (Table 1). Only 7% of the membership either failed to disclose or incompletely disclosed this relationship. In 36 cases (26%), members disclosed a financial relationship with at least 1 orthopedic company, but this relationship was not listed on the company’s website. One of the companies was responsible for 47% of the underreporting.
Discussion
In this study, we evaluated whether surgeons fully disclosed (on the website for the AAOS disclosure program) payments they received from orthopedic companies. Overall compliance was poor, with 44% of surgeons not disclosing payments. The percentage of surgeons disclosing corporate relationships and payments received varied among orthopedic companies. It is unclear whether this reflects partial reporting, or AAOS disclosure policy being mandatory only for select members rather than the entire membership.
This study had a few limitations, none of which had a substantive impact on the results or conclusions. First, we could not determine how many AAOS members who were required to disclose actually disclosed. There is no mechanism for determining which members are involved in activities that require disclosure. Nonetheless, the intent of the policy is to make collaborations between orthopedic surgeons and industry transparent in order to address concerns about potential conflicts of interest. That 44% of AAOS members did not disclose their relationships cannot be considered a success. Second, information was available on the websites of only 6 of the top 15 orthopedic companies—a result stemming from the DOJ’s failure to specify how long these companies must continue posting disclosures. In this study, the lowest nondisclosure rate was 37%, and there is no reason to suspect that any other group of surgeon-consultants would be any more compliant with AAOS’s policy.
There are few reports on the effects of the DOJ settlement on the behavior of surgeon-consultants who are AAOS members. Hockenberry and colleagues10 found that, since the settlement, surgeon payments have increased, number of consultants has decreased, and the proportion of consultants from academia has increased. They thought their findings confirmed concerns that orthopedic device makers would deliberately select high-volume orthopedic surgeons as consultants in order to increase sales of their implants and gain market share at the expense of their competitors. The authors thought that AAOS had some power to address disclosure through its influence on its members, but that influence may not be enough. Jegede and colleagues11 found that a significant percentage (41%) of orthopedic surgeons who received corporate payments and presented at the AAOS annual meeting were inconsistent in submitting disclosure information. Results of the present study suggest that AAOS policy is weak and does not adequately address the issue and provide full transparency, either within the organization or to the public, of all its members’ industry relationships.
As the preeminent provider of musculoskeletal education to orthopedic surgeons and others, and with a membership totaling almost 39,000, AAOS is one of the most important orthopedic societies in the world. AAOS has clearly stated that one of its goals is to increase transparency by making its surgeon disclosure program available to AAOS members and the public. However, it can be completely transparent only if all its members are required to disclose their corporate relationships. This study demonstrated that AAOS’s policy of mandatory disclosure for select members and voluntary disclosure for all other members is ineffective. We found that 44% of members failed to disclose industry-derived payments. This inadequate level of compliance runs contrary to the AAOS goal of increasing transparency of surgeon–industry consulting by making its surgeon disclosure program available to AAOS members and the public. The AAOS disclosure program and the potential consequences of noncompliance need to be reevaluated by the organization if it wants its program to succeed.
1. Crowninshield RD, Callaghan JJ. The orthopaedic profession and the industry partnership. Clin Orthop Relat Res. 2007;(457):73-77.
2. White AP, Vaccaro AR, Zdeblick T. Counterpoint: physician–industry relationships can be ethically established, and conflicts of interest can be ethically managed. Spine. 2007;32(11 suppl):S53-S57.
3. Steinbrook R. Online disclosure of physician–industry relationships. N Engl J Med. 2009;360(4):325-327.
4. Steinbrook R. Disclosure of industry payments to physicians. N Engl J Med. 2008;359(6):559-561.
5. Weinfurt KP, Friedman JY, Dinan MA, et al. Disclosing conflicts of interest in clinical research: views of institutional review boards, conflict of interest committees, and investigators. J Law Med Ethics. 2006;34(3):581-591, 481.
6. US Attorney’s Office, District of New Jersey. Monitoring and deferred prosecution agreements terminated with companies in hip and knee replacement industry [press release]. Federal Bureau of Investigation, Newark Division website. http://www.fbi.gov/newark/press-releases/2009/nk033009a.htm. March 30, 2009. Accessed May 13, 2015.
7. AAOS mandatory disclosure policy. American Academy of Orthopaedic Surgeons website. http://www.aaos.org/about/policies/DisclosurePolicy.asp. Adopted February 2007. Revised December 2009, February 2012. Accessed May 13, 2015.
8. The AAOS orthopaedic disclosure program. American Academy of Orthopaedic Surgeons website. http://www7.aaos.org/education/disclosure. Accessed May 13, 2015.
9. Top 15 ortho companies by revenue [based on 2011 full-year financials]. OrthoStreams website. http://orthostreams.com/top-15-ortho-companies-by-revenue/http://orthostreams.com/2012/03/the-top-15-orthopedic-companies-ranked-by-2011 revenue/. Accessed May 13, 2015.
10. Hockenberry JM, Weigel P, Auerbach A, Cram P. Financial payments by orthopedic device makers to orthopedic surgeons. Arch Intern Med. 2011;171(19):1759-1765.
11. Jegede KA, Ju B, Miller CP, Whang P, Grauer JN. Quantifying the variability of financial disclosure information reported by authors presenting research at multiple sports medicine conferences. Am J Orthop. 2011;40(11):583-587.
The relationship and collaboration between orthopedic surgeons and the orthopedic industry are considerable. Orthopedic surgeons can provide companies with important clinical input into the design of implants, facilitate commercialization of innovations developed by clinician entrepreneurs, and help provide rapid dissemination of new technologies.1,2 However, these relationships can result in conflicts of interest, thereby influencing the physicians’ judgment and choices and ultimately patient care.3,4 Making these potential conflicts transparent through physician disclosures is an accepted way to limit the negative effects of these relationships.5 The relationship between orthopedic surgeons and industry was brought to the forefront in 2007 with a settlement between the US Department of Justice (DOJ) and the 5 largest orthopedic implant makers.6 Among other things, this settlement required that each company publicly disclose on its website, beginning in 2008, the names and locations of all surgeons and organizations it paid, and how much. The DOJ settlement was one of the impetuses that led many orthopedic societies to adopt either voluntary or mandatory disclosure policies for their members.
In 2007, the American Academy of Orthopaedic Surgeons (AAOS) developed an orthopedic disclosure program to promote transparency and confidence in its educational programs and decisions.7 One of the 2 main purposes of the disclosure program is “streamlining the disclosure process for orthopedic surgeons and others involved in organizational governance, all formats of continuing medical education [CME] and authors of enduring materials, clinical practice guidelines (CPG) and appropriate use criteria (AUC) development and editors-in-chief and editorial boards, from whom disclosure is required.”8 Disclosure is mandatory only for participants in the AAOS CME programs (including any podium or poster presentation) or authors of enduring materials; members of the AAOS Board of Directors, Board of Councilors, Board of Specialty Societies, councils, cabinets, committees, project teams, or other AAOS governance groups; editors-in-chief and editorial boards; and AAOS guideline development workgroups. Members who fail to disclose are informed they cannot participate in AAOS activities. All other members of the organization are not required to disclose any industry-related relationships, and any disclosure is completely voluntary.7 This seems contrary to the second main goal of the disclosure policy: “increase transparency throughout AAOS by making this disclosure program available to the public and to AAOS members.”8
We conducted a study to compare the disclosures posted by the top orthopedic companies with the disclosures made by their surgeon-consultants and to determine how many of these surgeons have disclosed this information on the AAOS website.
Materials and Methods
On November 26, 2012, we reviewed the websites of the top 13 orthopedic device companies by revenue (Stryker, DePuy Orthopaedics, Zimmer Holdings, Smith & Nephew, Synthes, Medtronic Spine, Biomet, DJO Global, Orthofix, NuVasive, Wright Medical Group, ArthroCare, Exactech)9 to identify their surgeon-consultants for 2011. We excluded non-US surgeons (DOJ disclosure not required), revenues under $1000, and reimbursement for meals and travel. Although the DOJ settlement required that each company disclose on its website, beginning in 2008, the names and locations of its paid consultants and the amounts paid, the settlement did not stipulate how long this must be continued. Of the 13 companies, only 6 (Stryker, DePuy, Smith & Nephew, Medtronic, Wright, Exactech) continued listing and updating surgeon disclosure information.
As the companies differed in how they defined surgeon consulting services, we defined surgeon-consultant payments as the sum of consulting payments, royalty payments, and research support. We searched for each surgeon-consultant’s name in the AAOS orthopedic disclosure program database.7 From the database, we determined whether the surgeon was a member of AAOS. All members were then categorized into those who disclosed all their payments, those who incompletely disclosed their payments, those who did not disclose any payments, and those who did not provide any information. They were then subdivided into those who had and had not participated in CME activities at the AAOS annual meeting in 2011 (participants were listed in the meeting proceedings). This does not take into account AAOS members who presented at other AAOS-sponsored CME courses during 2011 and who therefore were required to disclose. The information was categorized by company, payment amount, and overall. To simplify matters and deal with varying corporate categories, we divided payments into 4 amount groups: less than $10,000, $10,000 to $100,000, $100,001 to $1 million, and more than $1 million. Some orthopedic companies reported surgeon payments as categorical rather than exact amounts. In these cases, we coded the payment as the midpoint of the range.
Results
Overall, 549 AAOS members received payments of more than $1000 from at least 1 of the 6 companies. Of these surgeons, 307 (56%) fully disclosed their payments, and 242 (44%) did not (Table 1). Of the 32 surgeons who were on 2 corporate payment lists, 24 disclosed both companies, 6 disclosed only 1 company, and 2 failed to disclose either company. AAOS members who did not disclose payments received less than $10,000 (average, $3706) in 37% of cases (Table 2), between $10,000 and $100,000 (average, $34,025) in 54% of cases, between $100,001 and $1 million (average, $290,505) in 8% of cases, and more than $1 million (average, $5,126,000) in less than 1% of cases.
Number of consultants, number of surgeons not disclosing payments, and value of these payments varied from company to company (Table 3). The company with the most consultants listed 185 AAOS members, of which 37% had not disclosed payments (average, $39,604). Second was the company that listed 108 members; 39% had not disclosed payments (average, $38,426). The third company listed 102 members, of which 56% had not disclosed payments (average, $217,340). The company with the fourth most consultants listed 84 members; 43% had not disclosed payments (average, $9841). Next to last was the company listing 42 members, of which 52% had not disclosed payments (average, $160,634). The company with the fewest consultants listed 28 members; 61% had not disclosed payments (average $85,388).
Of AAOS members who attended the 2011 annual meeting, 94% fully disclosed industry payments (Table 1). Only 7% of the membership either failed to disclose or incompletely disclosed this relationship. In 36 cases (26%), members disclosed a financial relationship with at least 1 orthopedic company, but this relationship was not listed on the company’s website. One of the companies was responsible for 47% of the underreporting.
Discussion
In this study, we evaluated whether surgeons fully disclosed (on the website for the AAOS disclosure program) payments they received from orthopedic companies. Overall compliance was poor, with 44% of surgeons not disclosing payments. The percentage of surgeons disclosing corporate relationships and payments received varied among orthopedic companies. It is unclear whether this reflects partial reporting, or AAOS disclosure policy being mandatory only for select members rather than the entire membership.
This study had a few limitations, none of which had a substantive impact on the results or conclusions. First, we could not determine how many AAOS members who were required to disclose actually disclosed. There is no mechanism for determining which members are involved in activities that require disclosure. Nonetheless, the intent of the policy is to make collaborations between orthopedic surgeons and industry transparent in order to address concerns about potential conflicts of interest. That 44% of AAOS members did not disclose their relationships cannot be considered a success. Second, information was available on the websites of only 6 of the top 15 orthopedic companies—a result stemming from the DOJ’s failure to specify how long these companies must continue posting disclosures. In this study, the lowest nondisclosure rate was 37%, and there is no reason to suspect that any other group of surgeon-consultants would be any more compliant with AAOS’s policy.
There are few reports on the effects of the DOJ settlement on the behavior of surgeon-consultants who are AAOS members. Hockenberry and colleagues10 found that, since the settlement, surgeon payments have increased, number of consultants has decreased, and the proportion of consultants from academia has increased. They thought their findings confirmed concerns that orthopedic device makers would deliberately select high-volume orthopedic surgeons as consultants in order to increase sales of their implants and gain market share at the expense of their competitors. The authors thought that AAOS had some power to address disclosure through its influence on its members, but that influence may not be enough. Jegede and colleagues11 found that a significant percentage (41%) of orthopedic surgeons who received corporate payments and presented at the AAOS annual meeting were inconsistent in submitting disclosure information. Results of the present study suggest that AAOS policy is weak and does not adequately address the issue and provide full transparency, either within the organization or to the public, of all its members’ industry relationships.
As the preeminent provider of musculoskeletal education to orthopedic surgeons and others, and with a membership totaling almost 39,000, AAOS is one of the most important orthopedic societies in the world. AAOS has clearly stated that one of its goals is to increase transparency by making its surgeon disclosure program available to AAOS members and the public. However, it can be completely transparent only if all its members are required to disclose their corporate relationships. This study demonstrated that AAOS’s policy of mandatory disclosure for select members and voluntary disclosure for all other members is ineffective. We found that 44% of members failed to disclose industry-derived payments. This inadequate level of compliance runs contrary to the AAOS goal of increasing transparency of surgeon–industry consulting by making its surgeon disclosure program available to AAOS members and the public. The AAOS disclosure program and the potential consequences of noncompliance need to be reevaluated by the organization if it wants its program to succeed.
1. Crowninshield RD, Callaghan JJ. The orthopaedic profession and the industry partnership. Clin Orthop Relat Res. 2007;(457):73-77.
2. White AP, Vaccaro AR, Zdeblick T. Counterpoint: physician–industry relationships can be ethically established, and conflicts of interest can be ethically managed. Spine. 2007;32(11 suppl):S53-S57.
3. Steinbrook R. Online disclosure of physician–industry relationships. N Engl J Med. 2009;360(4):325-327.
4. Steinbrook R. Disclosure of industry payments to physicians. N Engl J Med. 2008;359(6):559-561.
5. Weinfurt KP, Friedman JY, Dinan MA, et al. Disclosing conflicts of interest in clinical research: views of institutional review boards, conflict of interest committees, and investigators. J Law Med Ethics. 2006;34(3):581-591, 481.
6. US Attorney’s Office, District of New Jersey. Monitoring and deferred prosecution agreements terminated with companies in hip and knee replacement industry [press release]. Federal Bureau of Investigation, Newark Division website. http://www.fbi.gov/newark/press-releases/2009/nk033009a.htm. March 30, 2009. Accessed May 13, 2015.
7. AAOS mandatory disclosure policy. American Academy of Orthopaedic Surgeons website. http://www.aaos.org/about/policies/DisclosurePolicy.asp. Adopted February 2007. Revised December 2009, February 2012. Accessed May 13, 2015.
8. The AAOS orthopaedic disclosure program. American Academy of Orthopaedic Surgeons website. http://www7.aaos.org/education/disclosure. Accessed May 13, 2015.
9. Top 15 ortho companies by revenue [based on 2011 full-year financials]. OrthoStreams website. http://orthostreams.com/top-15-ortho-companies-by-revenue/http://orthostreams.com/2012/03/the-top-15-orthopedic-companies-ranked-by-2011 revenue/. Accessed May 13, 2015.
10. Hockenberry JM, Weigel P, Auerbach A, Cram P. Financial payments by orthopedic device makers to orthopedic surgeons. Arch Intern Med. 2011;171(19):1759-1765.
11. Jegede KA, Ju B, Miller CP, Whang P, Grauer JN. Quantifying the variability of financial disclosure information reported by authors presenting research at multiple sports medicine conferences. Am J Orthop. 2011;40(11):583-587.
Planned Readmission Algorithm
The Centers for Medicare & Medicaid Services (CMS) publicly reports all‐cause risk‐standardized readmission rates after acute‐care hospitalization for acute myocardial infarction, pneumonia, heart failure, total hip and knee arthroplasty, chronic obstructive pulmonary disease, stroke, and for patients hospital‐wide.[1, 2, 3, 4, 5] Ideally, these measures should capture unplanned readmissions that arise from acute clinical events requiring urgent rehospitalization. Planned readmissions, which are scheduled admissions usually involving nonurgent procedures, may not be a signal of quality of care. Including planned readmissions in readmission quality measures could create a disincentive to provide appropriate care to patients who are scheduled for elective or necessary procedures unrelated to the quality of the prior admission. Accordingly, under contract to the CMS, we were asked to develop an algorithm to identify planned readmissions. A version of this algorithm is now incorporated into all publicly reported readmission measures.
Given the widespread use of the planned readmission algorithm in public reporting and its implications for hospital quality measurement and evaluation, the objective of this study was to describe the development process, and to validate and refine the algorithm by reviewing charts of readmitted patients.
METHODS
Algorithm Development
To create a planned readmission algorithm, we first defined planned. We determined that readmissions for obstetrical delivery, maintenance chemotherapy, major organ transplant, and rehabilitation should always be considered planned in the sense that they are desired and/or inevitable, even if not specifically planned on a certain date. Apart from these specific types of readmissions, we defined planned readmissions as nonacute readmissions for scheduled procedures, because the vast majority of planned admissions are related to procedures. We also defined readmissions for acute illness or for complications of care as unplanned for the purposes of a quality measure. Even if such readmissions included a potentially planned procedure, because complications of care represent an important dimension of quality that should not be excluded from outcome measurement, these admissions should not be removed from the measure outcome. This definition of planned readmissions does not imply that all unplanned readmissions are unexpected or avoidable. However, it has proven very difficult to reliably define avoidable readmissions, even by expert review of charts, and we did not attempt to do so here.[6, 7]
In the second stage, we operationalized this definition into an algorithm. We used the Agency for Healthcare Research and Quality's Clinical Classification Software (CCS) codes to group thousands of individual procedure and diagnosis International Classification of Disease, Ninth Revision, Clinical Modification (ICD‐9‐CM) codes into clinically coherent, mutually exclusive procedure CCS categories and mutually exclusive diagnosis CCS categories, respectively. Clinicians on the investigative team reviewed the procedure categories to identify those that are commonly planned and that would require inpatient admission. We also reviewed the diagnosis categories to identify acute diagnoses unlikely to accompany elective procedures. We then created a flow diagram through which every readmission could be run to determine whether it was planned or unplanned based on our categorizations of procedures and diagnoses (Figure 1, and Supporting Information, Appendix A, in the online version of this article). This version of the algorithm (v1.0) was submitted to the National Quality Forum (NQF) as part of the hospital‐wide readmission measure. The measure (NQR #1789) received endorsement in April 2012.

In the third stage of development, we posted the algorithm for 2 public comment periods and recruited 27 outside experts to review and refine the algorithm following a standardized, structured process (see Supporting Information, Appendix B, in the online version of this article). Because the measures publicly report and hold hospitals accountable for unplanned readmission rates, we felt it most important that the algorithm include as few planned readmissions in the reported, unplanned outcome as possible (ie, have high negative predictive value). Therefore, in equivocal situations in which experts felt procedure categories were equally often planned or unplanned, we added those procedures to the potentially planned list. We also solicited feedback from hospitals on algorithm performance during a confidential test run of the hospital‐wide readmission measure in the fall of 2012. Based on all of this feedback, we made a number of changes to the algorithm, which was then identified as v2.1. Version 2.1 of the algorithm was submitted to the NQF as part of the endorsement process for the acute myocardial infarction and heart failure readmission measures and was endorsed by the NQF in January 2013. The algorithm (v2.1) is now applied, adapted if necessary, to all publicly reported readmission measures.[8]
Algorithm Validation: Study Cohort
We recruited 2 hospital systems to participate in a chart validation study of the accuracy of the planned readmission algorithm (v2.1). Within these 2 health systems, we selected 7 hospitals with varying bed size, teaching status, and safety‐net status. Each included 1 large academic teaching hospital that serves as a regional referral center. For each hospital's index admissions, we applied the inclusion and exclusion criteria from the hospital‐wide readmission measure. Index admissions were included for patients age 65 years or older; enrolled in Medicare fee‐for‐service (FFS); discharged from a nonfederal, short‐stay, acute‐care hospital or critical access hospital; without an in‐hospital death; not transferred to another acute‐care facility; and enrolled in Part A Medicare for 1 year prior to discharge. We excluded index admissions for patients without at least 30 days postdischarge enrollment in FFS Medicare, discharged against medical advice, admitted for medical treatment of cancer or primary psychiatric disease, admitted to a Prospective Payment System‐exempt cancer hospital, or who died during the index hospitalization. In addition, for this study, we included only index admissions that were followed by a readmission to a hospital within the participating health system between July 1, 2011 and June 30, 2012. Institutional review board approval was obtained from each of the participating health systems, which granted waivers of signed informed consent and Health Insurance Portability and Accountability Act waivers.
Algorithm Validation: Sample Size Calculation
We determined a priori that the minimum acceptable positive predictive value, or proportion of all readmissions the algorithm labels planned that are truly planned, would be 60%, and the minimum acceptable negative predictive value, or proportion of all readmissions the algorithm labels as unplanned that are truly unplanned, would be 80%. We calculated the sample size required to be confident of these values 10% and determined we would need a total of 291 planned charts and 162 unplanned charts. We inflated these numbers by 20% to account for missing or unobtainable charts for a total of 550 charts. To achieve this sample size, we included all eligible readmissions from all participating hospitals that were categorized as planned. At the 5 smaller hospitals, we randomly selected an equal number of unplanned readmissions occurring at any hospital in its healthcare system. At the 2 largest hospitals, we randomly selected 50 unplanned readmissions occurring at any hospital in its healthcare system.
Algorithm Validation: Data Abstraction
We developed an abstraction tool, tested and refined it using sample charts, and built the final the tool into a secure, password‐protected Microsoft Access 2007 (Microsoft Corp., Redmond, WA) database (see Supporting Information, Appendix C, in the online version of this article). Experienced chart abstractors with RN or MD degrees from each hospital site participated in a 1‐hour training session to become familiar with reviewing medical charts, defining planned/unplanned readmissions, and the data abstraction process. For each readmission, we asked abstractors to review as needed: emergency department triage and physician notes, admission history and physical, operative report, discharge summary, and/or discharge summary from a prior admission. The abstractors verified the accuracy of the administrative billing data, including procedures and principal diagnosis. In addition, they abstracted the source of admission and dates of all major procedures. Then the abstractors provided their opinion and supporting rationale as to whether a readmission was planned or unplanned. They were not asked to determine whether the readmission was preventable. To determine the inter‐rater reliability of data abstraction, an independent abstractor at each health system recoded a random sample of 10% of the charts.
Statistical Analysis
To ensure that we had obtained a representative sample of charts, we identified the 10 most commonly planned procedures among cases identified as planned by the algorithm in the validation cohort and then compared this with planned cases nationally. To confirm the reliability of the abstraction process, we used the kappa statistic to determine the inter‐rater reliability of the determination of planned or unplanned status. Additionally, the full study team, including 5 practicing clinicians, reviewed the details of every chart abstraction in which the algorithm was found to have misclassified the readmission as planned or unplanned. In 11 cases we determined that the abstractor had misunderstood the definition of planned readmission (ie, not all direct admissions are necessarily planned) and we reclassified the chart review assignment accordingly.
We calculated sensitivity, specificity, positive predictive value, and negative predictive value of the algorithm for the validation cohort as a whole, weighted to account for the prevalence of planned readmissions as defined by the algorithm in the national data (7.8%). Weighting is necessary because we did not obtain a pure random sample, but rather selected a stratified sample that oversampled algorithm‐identified planned readmissions.[9] We also calculated these rates separately for large hospitals (>600 beds) and for small hospitals (600 beds).
Finally, we examined performance of the algorithm for individual procedures and diagnoses to determine whether any procedures or diagnoses should be added or removed from the algorithm. First, we reviewed the diagnoses, procedures, and brief narratives provided by the abstractors for all cases in which the algorithm misclassified the readmission as either planned or unplanned. Second, we calculated the positive predictive value for each procedure that had been flagged as planned by the algorithm, and reviewed all readmissions (correctly and incorrectly classified) in which procedures with low positive predictive value took place. We also calculated the frequency with which the procedure was the only qualifying procedure resulting in an accurate or inaccurate classification. Third, to identify changes that should be made to the lists of acute and nonacute diagnoses, we reviewed the principal diagnosis for all readmissions misclassified by the algorithm as either planned or unplanned, and examined the specific ICD‐9‐CM codes within each CCS group that were most commonly associated with misclassifications.
After determining the changes that should be made to the algorithm based on these analyses, we recalculated the sensitivity, specificity, positive predictive value, and negative predictive value of the proposed revised algorithm (v3.0). All analyses used SAS version 9.3 (SAS Institute, Cary, NC).
RESULTS
Study Cohort
Characteristics of participating hospitals are shown in Table 1. Hospitals represented in this sample ranged in size, teaching status, and safety net status, although all were nonprofit. We selected 663 readmissions for review, 363 planned and 300 unplanned. Overall we were able to select 80% of hospitals planned cases for review; the remainder occurred at hospitals outside the participating hospital system. Abstractors were able to locate and review 634 (96%) of the eligible charts (range, 86%100% per hospital). The kappa statistic for inter‐rater reliability was 0.83.
| Description | Hospitals, N | Readmissions Selected for Review, N* | Readmissions Reviewed, N (% of Eligible) | Unplanned Readmissions Reviewed, N | Planned Readmissions Reviewed, N | % of Hospital's Planned Readmissions Reviewed* | |
|---|---|---|---|---|---|---|---|
| |||||||
| All hospitals | 7 | 663 | 634 (95.6) | 283 | 351 | 77.3 | |
| No. of beds | >600 | 2 | 346 | 339 (98.0) | 116 | 223 | 84.5 |
| >300600 | 2 | 190 | 173 (91.1) | 85 | 88 | 87.1 | |
| <300 | 3 | 127 | 122 (96.0) | 82 | 40 | 44.9 | |
| Ownership | Government | 0 | |||||
| For profit | 0 | ||||||
| Not for profit | 7 | 663 | 634 (95.6) | 283 | 351 | 77.3 | |
| Teaching status | Teaching | 2 | 346 | 339 (98.0) | 116 | 223 | 84.5 |
| Nonteaching | 5 | 317 | 295 (93.1) | 167 | 128 | 67.4 | |
| Safety net status | Safety net | 2 | 346 | 339 (98.0) | 116 | 223 | 84.5 |
| Nonsafety net | 5 | 317 | 295 (93.1) | 167 | 128 | 67.4 | |
| Region | New England | 3 | 409 | 392 (95.8) | 155 | 237 | 85.9 |
| South Central | 4 | 254 | 242 (95.3) | 128 | 114 | 64.0 | |
The study sample included 57/67 (85%) of the procedure or condition categories on the potentially planned list. The most common procedure CCS categories among planned readmissions (v2.1) in the validation cohort were very similar to those in the national dataset (see Supporting Information, Appendix D, in the online version of this article). Of the top 20 most commonly planned procedure CCS categories in the validation set, all but 2, therapeutic radiology for cancer treatment (CCS 211) and peripheral vascular bypass (CCS 55), were among the top 20 most commonly planned procedure CCS categories in the national data.
Test Characteristics of Algorithm
The weighted test characteristics of the current algorithm (v2.1) are shown in Table 2. Overall, the algorithm correctly identified 266 readmissions as unplanned and 181 readmissions as planned, and misidentified 170 readmissions as planned and 15 as unplanned. Once weighted to account for the stratified sampling design, the overall prevalence of true planned readmissions was 8.9% of readmissions. The weighted sensitivity was 45.1% overall and was higher in large teaching centers than in smaller community hospitals. The weighted specificity was 95.9%. The positive predictive value was 51.6%, and the negative predictive value was 94.7%.
| Cohort | Sensitivity | Specificity | Positive Predictive Value | Negative Predictive Value |
|---|---|---|---|---|
| Algorithm v2.1 | ||||
| Full cohort | 45.1% | 95.9% | 51.6% | 94.7% |
| Large hospitals | 50.9% | 96.1% | 53.8% | 95.6% |
| Small hospitals | 40.2% | 95.5% | 47.7% | 94.0% |
| Revised algorithm v3.0 | ||||
| Full cohort | 49.8% | 96.5% | 58.7% | 94.5% |
| Large hospitals | 57.1% | 96.8% | 63.0% | 95.9% |
| Small hospitals | 42.6% | 95.9% | 52.6% | 93.9% |
Accuracy of Individual Diagnoses and Procedures
The positive predictive value of the algorithm for individual procedure categories varied widely, from 0% to 100% among procedures with at least 10 cases (Table 3). The procedure for which the algorithm was least accurate was CCS 211, therapeutic radiology for cancer treatment (0% positive predictive value). By contrast, maintenance chemotherapy (90%) and other therapeutic procedures, hemic and lymphatic system (100%) were most accurate. Common procedures with less than 50% positive predictive value (ie, that the algorithm commonly misclassified as planned) were diagnostic cardiac catheterization (25%); debridement of wound, infection, or burn (25%); amputation of lower extremity (29%); insertion, revision, replacement, removal of cardiac pacemaker or cardioverter/defibrillator (33%); and other hernia repair (43%). Of these, diagnostic cardiac catheterization and cardiac devices are the first and second most common procedures nationally, respectively.
| Readmission Procedure CCS Code | Total Categorized as Planned by Algorithm, N | Verified as Planned by Chart Review, N | Positive Predictive Value |
|---|---|---|---|
| |||
| 47 Diagnostic cardiac catheterization; coronary arteriography | 44 | 11 | 25% |
| 224 Cancer chemotherapy | 40 | 22 | 55% |
| 157 Amputation of lower extremity | 31 | 9 | 29% |
| 49 Other operating room heart procedures | 27 | 16 | 59% |
| 48 Insertion, revision, replacement, removal of cardiac pacemaker or cardioverter/defibrillator | 24 | 8 | 33% |
| 43 Heart valve procedures | 20 | 16 | 80% |
| Maintenance chemotherapy (diagnosis CCS 45) | 20 | 18 | 90% |
| 78 Colorectal resection | 18 | 9 | 50% |
| 169 Debridement of wound, infection or burn | 16 | 4 | 25% |
| 84 Cholecystectomy and common duct exploration | 16 | 5 | 31% |
| 99 Other OR gastrointestinal therapeutic procedures | 16 | 8 | 50% |
| 158 Spinal fusion | 15 | 11 | 73% |
| 142 Partial excision bone | 14 | 10 | 71% |
| 86 Other hernia repair | 14 | 6 | 42% |
| 44 Coronary artery bypass graft | 13 | 10 | 77% |
| 67 Other therapeutic procedures, hemic and lymphatic system | 13 | 13 | 100% |
| 211 Therapeutic radiology for cancer treatment | 12 | 0 | 0% |
| 45 Percutaneous transluminal coronary angioplasty | 11 | 7 | 64% |
| Total | 497 | 272 | 54.7% |
The readmissions with least abstractor agreement were those involving CCS 157 (amputation of lower extremity) and CCS 169 (debridement of wound, infection or burn). Readmissions for these procedures were nearly always performed as a consequence of acute worsening of chronic conditions such as osteomyelitis or ulceration. Abstractors were divided over whether these readmissions were appropriate to call planned.
Changes to the Algorithm
We determined that the accuracy of the algorithm would be improved by removing 2 procedure categories from the planned procedure list (therapeutic radiation [CCS 211] and cancer chemotherapy [CCS 224]), adding 1 diagnosis category to the acute diagnosis list (hypertension with complications [CCS 99]), and splitting 2 diagnosis condition categories into acute and nonacute ICD‐9‐CM codes (pancreatic disorders [CCS 149] and biliary tract disease [CCS 152]). Detailed rationales for each modification to the planned readmission algorithm are described in Table 4. We felt further examination of diagnostic cardiac catheterization and cardiac devices was warranted given their high frequency, despite low positive predictive value. We also elected not to alter the categorization of amputation or debridement because it was not easy to determine whether these admissions were planned or unplanned even with chart review. We plan further analyses of these procedure categories.
| Action | Diagnosis or Procedure Category | Algorithm | Chart | N | Rationale for Change |
|---|---|---|---|---|---|
| |||||
| Remove from planned procedure list | Therapeutic radiation (CCS 211) | Accurate | The algorithm was inaccurate in every case. All therapeutic radiology during readmissions was performed because of acute illness (pain crisis, neurologic crisis) or because scheduled treatment occurred during an unplanned readmission. In national data, this ranks as the 25th most common planned procedure identified by the algorithm v2.1. | ||
| Planned | Planned | 0 | |||
| Unplanned | Unplanned | 0 | |||
| Inaccurate | |||||
| Unplanned | Planned | 0 | |||
| Planned | Unplanned | 12 | |||
| Cancer chemotherapy (CCS 224) | Accurate | Of the 22 correctly identified as planned, 18 (82%) would already have been categorized as planned because of a principal diagnosis of maintenance chemotherapy. Therefore, removing CCS 224 from the planned procedure list would only miss a small fraction of planned readmissions but would avoid a large number of misclassifications. In national data, this ranks as the 8th most common planned procedure identified by the algorithm v2.1. | |||
| Planned | Planned | 22 | |||
| Unplanned | Unplanned | 0 | |||
| Inaccurate | |||||
| Unplanned | Planned | 0 | |||
| Planned | Unplanned | 18 | |||
| Add to planned procedure list | None | The abstractors felt a planned readmission was missed by the algorithm in 15 cases. A handful of these cases were missed because the planned procedure was not on the current planned procedure list; however, those procedures (eg, abdominal paracentesis, colonoscopy, endoscopy) were nearly always unplanned overall and should therefore not be added as procedures that potentially qualify as an admission as planned. | |||
| Remove from acute diagnosis list | None | The abstractors felt a planned readmission was missed by the algorithm in 15 cases. The relevant disqualifying acute diagnoses were much more often associated with unplanned readmissions in our dataset. | |||
| Add to acute diagnosis list | Hypertension with complications (CCS 99) | Accurate | This CCS was associated with only 1 planned readmission (for elective nephrectomy, a very rare procedure). Every other time this CCS appeared in the dataset, it was associated with an unplanned readmission (12/13, 92%); 10 of those, however, were misclassified by the algorithm as planned because they were not excluded by diagnosis (91% error rate). Consequently, adding this CCS to the acute diagnosis list is likely to miss only a very small fraction of planned readmissions, while making the overall algorithm much more accurate. | ||
| Planned | Planned | 1 | |||
| Unplanned | Unplanned | 2 | |||
| Inaccurate | |||||
| Unplanned | Planned | 0 | |||
| Planned | Unplanned | 10 | |||
| Split diagnosis condition category into component ICD‐9 codes | Pancreatic disorders (CCS 152) | Accurate | ICD‐9 code 577.0 (acute pancreatitis) is the only acute code in this CCS. Acute pancreatitis was present in 2 cases that were misclassified as planned. Clinically, there is no situation in which a planned procedure would reasonably be performed in the setting of acute pancreatitis. Moving ICD‐9 code 577.0 to the acute list and leaving the rest of the ICD‐9 codes in CCS 152 on the nonacute list will enable the algorithm to continue to identify planned procedures for chronic pancreatitis. | ||
| Planned | Planned | 0 | |||
| Unplanned | Unplanned | 1 | |||
| Inaccurate | |||||
| Unplanned | Planned | 0 | |||
| Planned | Unplanned | 2 | |||
| Biliary tract disease (CCS 149) | Accurate | This CCS is a mix of acute and chronic diagnoses. Of 14 charts classified as planned with CCS 149 in the principal diagnosis field, 12 were misclassified (of which 10 were associated with cholecystectomy). Separating out the acute and nonacute diagnoses will increase the accuracy of the algorithm while still ensuring that planned cholecystectomies and other procedures can be identified. Of the ICD‐9 codes in CCS 149, the following will be added to the acute diagnosis list: 574.0, 574.3, 574.6, 574.8, 575.0, 575.12, 576.1. | |||
| Planned | Planned | 2 | |||
| Unplanned | Unplanned | 3 | |||
| Inaccurate | |||||
| Unplanned | Planned | 0 | |||
| Planned | Unplanned | 12 | |||
| Consider for change after additional study | Diagnostic cardiac catheterization (CCS 47) | Accurate | The algorithm misclassified as planned 25/38 (66%) unplanned readmissions in which diagnostic catheterizations were the only qualifying planned procedure. It also correctly identified 3/3 (100%) planned readmissions in which diagnostic cardiac catheterizations were the only qualifying planned procedure. This is the highest volume procedure in national data. | ||
| Planned | Planned | 3* | |||
| Unplanned | Unplanned | 13* | |||
| Inaccurate | |||||
| Unplanned | Planned | 0* | |||
| Planned | Unplanned | 25* | |||
| Insertion, revision, replacement, removal of cardiac pacemaker or cardioverter/defibrillator (CCS 48) | Accurate | The algorithm misclassified as planned 4/5 (80%) unplanned readmissions in which cardiac devices were the only qualifying procedure. However, it also correctly identified 7/8 (87.5%) planned readmissions in which cardiac devices were the only qualifying planned procedure. CCS 48 is the second most common planned procedure category nationally. | |||
| Planned | Planned | 7 | |||
| Unplanned | Unplanned | 1 | |||
| Inaccurate | |||||
| Unplanned | Planned | 1 | |||
| Planned | Unplanned | 4 | |||
The revised algorithm (v3.0) had a weighted sensitivity of 49.8%, weighted specificity of 96.5%, positive predictive value of 58.7%, and negative predictive value of 94.5% (Table 2). In aggregate, these changes would increase the reported unplanned readmission rate from 16.0% to 16.1% in the hospital‐wide readmission measure, using 2011 to 2012 data, and would decrease the fraction of all readmissions considered planned from 7.8% to 7.2%.
DISCUSSION
We developed an algorithm based on administrative data that in its currently implemented form is very accurate at identifying unplanned readmissions, ensuring that readmissions included in publicly reported readmission measures are likely to be truly unplanned. However, nearly half of readmissions the algorithm classifies as planned are actually unplanned. That is, the algorithm is overcautious in excluding unplanned readmissions that could have counted as outcomes, particularly among admissions that include diagnostic cardiac catheterization or placement of cardiac devices (pacemakers, defibrillators). However, these errors only occur within the 7.8% of readmissions that are classified as planned and therefore do not affect overall readmission rates dramatically. A perfect algorithm would reclassify approximately half of these planned readmissions as unplanned, increasing the overall readmission rate by 0.6 percentage points.
On the other hand, the algorithm also only identifies approximately half of true planned readmissions as planned. Because the true prevalence of planned readmissions is low (approximately 9% of readmissions based on weighted chart review prevalence, or an absolute rate of 1.4%), this low sensitivity has a small effect on algorithm performance. Removing all true planned readmissions from the measure outcome would decrease the overall readmission rate by 0.8 percentage points, similar to the expected 0.6 percentage point increase that would result from better identifying unplanned readmissions; thus, a perfect algorithm would likely decrease the reported unplanned readmission rate by a net 0.2%. Overall, the existing algorithm appears to come close to the true prevalence of planned readmissions, despite inaccuracy on an individual‐case basis. The algorithm performed best at large hospitals, which are at greatest risk of being statistical outliers and of accruing penalties under the Hospital Readmissions Reduction Program.[10]
We identified several changes that marginally improved the performance of the algorithm by reducing the number of unplanned readmissions that are incorrectly removed from the measure, while avoiding the inappropriate inclusion of planned readmissions in the outcome. This revised algorithm, v3.0, was applied to public reporting of readmission rates at the end of 2014. Overall, implementing these changes increases the reported readmission rate very slightly. We also identified other procedures associated with high inaccuracy rates, removal of which would have larger impact on reporting rates, and which therefore merit further evaluation.
There are other potential methods of identifying planned readmissions. For instance, as of October 1, 2013, new administrative billing codes were created to allow hospitals to indicate that a patient was discharged with a planned acute‐care hospital inpatient readmission, without limitation as to when it will take place.[11] This code must be used at the time of the index admission to indicate that a future planned admission is expected, and was specified only to be used for neonates and patients with acute myocardial infarction. This approach, however, would omit planned readmissions that are not known to the initial discharging team, potentially missing planned readmissions. Conversely, some patients discharged with a plan for readmission may be unexpectedly readmitted for an unplanned reason. Given that the new codes were not available at the time we conducted the validation study, we were not able to determine how often the billing codes accurately identified planned readmissions. This would be an important area to consider for future study.
An alternative approach would be to create indicator codes to be applied at the time of readmission that would indicate whether that admission was planned or unplanned. Such a code would have the advantage of allowing each planned readmission to be flagged by the admitting clinicians at the time of admission rather than by an algorithm that inherently cannot be perfect. However, identifying planned readmissions at the time of readmission would also create opportunity for gaming and inconsistent application of definitions between hospitals; additional checks would need to be put in place to guard against these possibilities.
Our study has some limitations. We relied on the opinion of chart abstractors to determine whether a readmission was planned or unplanned; in a few cases, such as smoldering wounds that ultimately require surgical intervention, that determination is debatable. Abstractions were done at local institutions to minimize risks to patient privacy, and therefore we could not centrally verify determinations of planned status except by reviewing source of admission, dates of procedures, and narrative comments reported by the abstractors. Finally, we did not have sufficient volume of planned procedures to determine accuracy of the algorithm for less common procedure categories or individual procedures within categories.
In summary, we developed an algorithm to identify planned readmissions from administrative data that had high specificity and moderate sensitivity, and refined it based on chart validation. This algorithm is in use in public reporting of readmission measures to maximize the probability that the reported readmission rates represent truly unplanned readmissions.[12]
Disclosures: Financial supportThis work was performed under contract HHSM‐500‐2008‐0025I/HHSM‐500‐T0001, Modification No. 000008, titled Measure Instrument Development and Support, funded by the Centers for Medicare and Medicaid Services (CMS), an agency of the US Department of Health and Human Services. Drs. Horwitz and Ross are supported by the National Institute on Aging (K08 AG038336 and K08 AG032886, respectively) and by the American Federation for Aging Research through the Paul B. Beeson Career Development Award Program. Dr. Krumholz is supported by grant U01 HL105270‐05 (Center for Cardiovascular Outcomes Research at Yale University) from the National Heart, Lung, and Blood Institute. No funding source had any role in the study design; in the collection, analysis, and interpretation of data; or in the writing of the article. The CMS reviewed and approved the use of its data for this work and approved submission of the manuscript. All authors have completed the Unified Competing Interest form at
- , , , et al. Development, validation, and results of a measure of 30‐day readmission following hospitalization for pneumonia. J Hosp Med. 2011;6(3):142–150.
- , , , et al. An administrative claims measure suitable for profiling hospital performance based on 30‐day all‐cause readmission rates among patients with acute myocardial infarction. Circ Cardiovasc Qual Outcomes. 2011;4(2):243–252.
- , , , et al. An administrative claims measure suitable for profiling hospital performance on the basis of 30‐day all‐cause readmission rates among patients with heart failure. Circ Cardiovasc Qual Outcomes. 2008;1:29–37.
- , , , et al. Hospital‐level 30‐day all‐cause risk‐standardized readmission rate following elective primary total hip arthroplasty (THA) and/or total knee arthroplasty (TKA). Available at: http://www.qualitynet.org/dcs/ContentServer?c=Page161(supp10 l):S66–S75.
- , , A meta‐analysis of hospital 30‐day avoidable readmission rates. J Eval Clin Pract. 2011;18(6):1211–1218.
- , , , , Proportion of hospital readmissions deemed avoidable: a systematic review. CMAJ. 2011;183(7):E391–E402.
- , , , et al. Centers for Medicare 3(4):477–492.
- , Characteristics of hospitals receiving penalties under the Hospital Readmissions Reduction Program. JAMA. 2013;309(4):342–343.
- Centers for Medicare and Medicaid Services. Inpatient Prospective Payment System/Long‐Term Care Hospital (IPPS/LTCH) final rule. Fed Regist. 2013;78:50533–50534.
- , , Massachusetts health reforms: uninsurance remains low, self‐reported health status improves as state prepares to tackle costs. Health Aff (Millwood). 2012;31(2):444–451.
The Centers for Medicare & Medicaid Services (CMS) publicly reports all‐cause risk‐standardized readmission rates after acute‐care hospitalization for acute myocardial infarction, pneumonia, heart failure, total hip and knee arthroplasty, chronic obstructive pulmonary disease, stroke, and for patients hospital‐wide.[1, 2, 3, 4, 5] Ideally, these measures should capture unplanned readmissions that arise from acute clinical events requiring urgent rehospitalization. Planned readmissions, which are scheduled admissions usually involving nonurgent procedures, may not be a signal of quality of care. Including planned readmissions in readmission quality measures could create a disincentive to provide appropriate care to patients who are scheduled for elective or necessary procedures unrelated to the quality of the prior admission. Accordingly, under contract to the CMS, we were asked to develop an algorithm to identify planned readmissions. A version of this algorithm is now incorporated into all publicly reported readmission measures.
Given the widespread use of the planned readmission algorithm in public reporting and its implications for hospital quality measurement and evaluation, the objective of this study was to describe the development process, and to validate and refine the algorithm by reviewing charts of readmitted patients.
METHODS
Algorithm Development
To create a planned readmission algorithm, we first defined planned. We determined that readmissions for obstetrical delivery, maintenance chemotherapy, major organ transplant, and rehabilitation should always be considered planned in the sense that they are desired and/or inevitable, even if not specifically planned on a certain date. Apart from these specific types of readmissions, we defined planned readmissions as nonacute readmissions for scheduled procedures, because the vast majority of planned admissions are related to procedures. We also defined readmissions for acute illness or for complications of care as unplanned for the purposes of a quality measure. Even if such readmissions included a potentially planned procedure, because complications of care represent an important dimension of quality that should not be excluded from outcome measurement, these admissions should not be removed from the measure outcome. This definition of planned readmissions does not imply that all unplanned readmissions are unexpected or avoidable. However, it has proven very difficult to reliably define avoidable readmissions, even by expert review of charts, and we did not attempt to do so here.[6, 7]
In the second stage, we operationalized this definition into an algorithm. We used the Agency for Healthcare Research and Quality's Clinical Classification Software (CCS) codes to group thousands of individual procedure and diagnosis International Classification of Disease, Ninth Revision, Clinical Modification (ICD‐9‐CM) codes into clinically coherent, mutually exclusive procedure CCS categories and mutually exclusive diagnosis CCS categories, respectively. Clinicians on the investigative team reviewed the procedure categories to identify those that are commonly planned and that would require inpatient admission. We also reviewed the diagnosis categories to identify acute diagnoses unlikely to accompany elective procedures. We then created a flow diagram through which every readmission could be run to determine whether it was planned or unplanned based on our categorizations of procedures and diagnoses (Figure 1, and Supporting Information, Appendix A, in the online version of this article). This version of the algorithm (v1.0) was submitted to the National Quality Forum (NQF) as part of the hospital‐wide readmission measure. The measure (NQR #1789) received endorsement in April 2012.
In the third stage of development, we posted the algorithm for 2 public comment periods and recruited 27 outside experts to review and refine the algorithm following a standardized, structured process (see Supporting Information, Appendix B, in the online version of this article). Because the measures publicly report and hold hospitals accountable for unplanned readmission rates, we felt it most important that the algorithm include as few planned readmissions in the reported, unplanned outcome as possible (ie, have high negative predictive value). Therefore, in equivocal situations in which experts felt procedure categories were equally often planned or unplanned, we added those procedures to the potentially planned list. We also solicited feedback from hospitals on algorithm performance during a confidential test run of the hospital‐wide readmission measure in the fall of 2012. Based on all of this feedback, we made a number of changes to the algorithm, which was then identified as v2.1. Version 2.1 of the algorithm was submitted to the NQF as part of the endorsement process for the acute myocardial infarction and heart failure readmission measures and was endorsed by the NQF in January 2013. The algorithm (v2.1) is now applied, adapted if necessary, to all publicly reported readmission measures.[8]
Algorithm Validation: Study Cohort
We recruited 2 hospital systems to participate in a chart validation study of the accuracy of the planned readmission algorithm (v2.1). Within these 2 health systems, we selected 7 hospitals with varying bed size, teaching status, and safety‐net status. Each included 1 large academic teaching hospital that serves as a regional referral center. For each hospital's index admissions, we applied the inclusion and exclusion criteria from the hospital‐wide readmission measure. Index admissions were included for patients age 65 years or older; enrolled in Medicare fee‐for‐service (FFS); discharged from a nonfederal, short‐stay, acute‐care hospital or critical access hospital; without an in‐hospital death; not transferred to another acute‐care facility; and enrolled in Part A Medicare for 1 year prior to discharge. We excluded index admissions for patients without at least 30 days postdischarge enrollment in FFS Medicare, discharged against medical advice, admitted for medical treatment of cancer or primary psychiatric disease, admitted to a Prospective Payment System‐exempt cancer hospital, or who died during the index hospitalization. In addition, for this study, we included only index admissions that were followed by a readmission to a hospital within the participating health system between July 1, 2011 and June 30, 2012. Institutional review board approval was obtained from each of the participating health systems, which granted waivers of signed informed consent and Health Insurance Portability and Accountability Act waivers.
Algorithm Validation: Sample Size Calculation
We determined a priori that the minimum acceptable positive predictive value, or proportion of all readmissions the algorithm labels planned that are truly planned, would be 60%, and the minimum acceptable negative predictive value, or proportion of all readmissions the algorithm labels as unplanned that are truly unplanned, would be 80%. We calculated the sample size required to be confident of these values 10% and determined we would need a total of 291 planned charts and 162 unplanned charts. We inflated these numbers by 20% to account for missing or unobtainable charts for a total of 550 charts. To achieve this sample size, we included all eligible readmissions from all participating hospitals that were categorized as planned. At the 5 smaller hospitals, we randomly selected an equal number of unplanned readmissions occurring at any hospital in its healthcare system. At the 2 largest hospitals, we randomly selected 50 unplanned readmissions occurring at any hospital in its healthcare system.
Algorithm Validation: Data Abstraction
We developed an abstraction tool, tested and refined it using sample charts, and built the final the tool into a secure, password‐protected Microsoft Access 2007 (Microsoft Corp., Redmond, WA) database (see Supporting Information, Appendix C, in the online version of this article). Experienced chart abstractors with RN or MD degrees from each hospital site participated in a 1‐hour training session to become familiar with reviewing medical charts, defining planned/unplanned readmissions, and the data abstraction process. For each readmission, we asked abstractors to review as needed: emergency department triage and physician notes, admission history and physical, operative report, discharge summary, and/or discharge summary from a prior admission. The abstractors verified the accuracy of the administrative billing data, including procedures and principal diagnosis. In addition, they abstracted the source of admission and dates of all major procedures. Then the abstractors provided their opinion and supporting rationale as to whether a readmission was planned or unplanned. They were not asked to determine whether the readmission was preventable. To determine the inter‐rater reliability of data abstraction, an independent abstractor at each health system recoded a random sample of 10% of the charts.
Statistical Analysis
To ensure that we had obtained a representative sample of charts, we identified the 10 most commonly planned procedures among cases identified as planned by the algorithm in the validation cohort and then compared this with planned cases nationally. To confirm the reliability of the abstraction process, we used the kappa statistic to determine the inter‐rater reliability of the determination of planned or unplanned status. Additionally, the full study team, including 5 practicing clinicians, reviewed the details of every chart abstraction in which the algorithm was found to have misclassified the readmission as planned or unplanned. In 11 cases we determined that the abstractor had misunderstood the definition of planned readmission (ie, not all direct admissions are necessarily planned) and we reclassified the chart review assignment accordingly.
We calculated sensitivity, specificity, positive predictive value, and negative predictive value of the algorithm for the validation cohort as a whole, weighted to account for the prevalence of planned readmissions as defined by the algorithm in the national data (7.8%). Weighting is necessary because we did not obtain a pure random sample, but rather selected a stratified sample that oversampled algorithm‐identified planned readmissions.[9] We also calculated these rates separately for large hospitals (>600 beds) and for small hospitals (600 beds).
Finally, we examined performance of the algorithm for individual procedures and diagnoses to determine whether any procedures or diagnoses should be added or removed from the algorithm. First, we reviewed the diagnoses, procedures, and brief narratives provided by the abstractors for all cases in which the algorithm misclassified the readmission as either planned or unplanned. Second, we calculated the positive predictive value for each procedure that had been flagged as planned by the algorithm, and reviewed all readmissions (correctly and incorrectly classified) in which procedures with low positive predictive value took place. We also calculated the frequency with which the procedure was the only qualifying procedure resulting in an accurate or inaccurate classification. Third, to identify changes that should be made to the lists of acute and nonacute diagnoses, we reviewed the principal diagnosis for all readmissions misclassified by the algorithm as either planned or unplanned, and examined the specific ICD‐9‐CM codes within each CCS group that were most commonly associated with misclassifications.
After determining the changes that should be made to the algorithm based on these analyses, we recalculated the sensitivity, specificity, positive predictive value, and negative predictive value of the proposed revised algorithm (v3.0). All analyses used SAS version 9.3 (SAS Institute, Cary, NC).
RESULTS
Study Cohort
Characteristics of participating hospitals are shown in Table 1. Hospitals represented in this sample ranged in size, teaching status, and safety net status, although all were nonprofit. We selected 663 readmissions for review, 363 planned and 300 unplanned. Overall we were able to select 80% of hospitals planned cases for review; the remainder occurred at hospitals outside the participating hospital system. Abstractors were able to locate and review 634 (96%) of the eligible charts (range, 86%100% per hospital). The kappa statistic for inter‐rater reliability was 0.83.
| Description | Hospitals, N | Readmissions Selected for Review, N* | Readmissions Reviewed, N (% of Eligible) | Unplanned Readmissions Reviewed, N | Planned Readmissions Reviewed, N | % of Hospital's Planned Readmissions Reviewed* | |
|---|---|---|---|---|---|---|---|
| |||||||
| All hospitals | 7 | 663 | 634 (95.6) | 283 | 351 | 77.3 | |
| No. of beds | >600 | 2 | 346 | 339 (98.0) | 116 | 223 | 84.5 |
| >300600 | 2 | 190 | 173 (91.1) | 85 | 88 | 87.1 | |
| <300 | 3 | 127 | 122 (96.0) | 82 | 40 | 44.9 | |
| Ownership | Government | 0 | |||||
| For profit | 0 | ||||||
| Not for profit | 7 | 663 | 634 (95.6) | 283 | 351 | 77.3 | |
| Teaching status | Teaching | 2 | 346 | 339 (98.0) | 116 | 223 | 84.5 |
| Nonteaching | 5 | 317 | 295 (93.1) | 167 | 128 | 67.4 | |
| Safety net status | Safety net | 2 | 346 | 339 (98.0) | 116 | 223 | 84.5 |
| Nonsafety net | 5 | 317 | 295 (93.1) | 167 | 128 | 67.4 | |
| Region | New England | 3 | 409 | 392 (95.8) | 155 | 237 | 85.9 |
| South Central | 4 | 254 | 242 (95.3) | 128 | 114 | 64.0 | |
The study sample included 57/67 (85%) of the procedure or condition categories on the potentially planned list. The most common procedure CCS categories among planned readmissions (v2.1) in the validation cohort were very similar to those in the national dataset (see Supporting Information, Appendix D, in the online version of this article). Of the top 20 most commonly planned procedure CCS categories in the validation set, all but 2, therapeutic radiology for cancer treatment (CCS 211) and peripheral vascular bypass (CCS 55), were among the top 20 most commonly planned procedure CCS categories in the national data.
Test Characteristics of Algorithm
The weighted test characteristics of the current algorithm (v2.1) are shown in Table 2. Overall, the algorithm correctly identified 266 readmissions as unplanned and 181 readmissions as planned, and misidentified 170 readmissions as planned and 15 as unplanned. Once weighted to account for the stratified sampling design, the overall prevalence of true planned readmissions was 8.9% of readmissions. The weighted sensitivity was 45.1% overall and was higher in large teaching centers than in smaller community hospitals. The weighted specificity was 95.9%. The positive predictive value was 51.6%, and the negative predictive value was 94.7%.
| Cohort | Sensitivity | Specificity | Positive Predictive Value | Negative Predictive Value |
|---|---|---|---|---|
| Algorithm v2.1 | ||||
| Full cohort | 45.1% | 95.9% | 51.6% | 94.7% |
| Large hospitals | 50.9% | 96.1% | 53.8% | 95.6% |
| Small hospitals | 40.2% | 95.5% | 47.7% | 94.0% |
| Revised algorithm v3.0 | ||||
| Full cohort | 49.8% | 96.5% | 58.7% | 94.5% |
| Large hospitals | 57.1% | 96.8% | 63.0% | 95.9% |
| Small hospitals | 42.6% | 95.9% | 52.6% | 93.9% |
Accuracy of Individual Diagnoses and Procedures
The positive predictive value of the algorithm for individual procedure categories varied widely, from 0% to 100% among procedures with at least 10 cases (Table 3). The procedure for which the algorithm was least accurate was CCS 211, therapeutic radiology for cancer treatment (0% positive predictive value). By contrast, maintenance chemotherapy (90%) and other therapeutic procedures, hemic and lymphatic system (100%) were most accurate. Common procedures with less than 50% positive predictive value (ie, that the algorithm commonly misclassified as planned) were diagnostic cardiac catheterization (25%); debridement of wound, infection, or burn (25%); amputation of lower extremity (29%); insertion, revision, replacement, removal of cardiac pacemaker or cardioverter/defibrillator (33%); and other hernia repair (43%). Of these, diagnostic cardiac catheterization and cardiac devices are the first and second most common procedures nationally, respectively.
| Readmission Procedure CCS Code | Total Categorized as Planned by Algorithm, N | Verified as Planned by Chart Review, N | Positive Predictive Value |
|---|---|---|---|
| |||
| 47 Diagnostic cardiac catheterization; coronary arteriography | 44 | 11 | 25% |
| 224 Cancer chemotherapy | 40 | 22 | 55% |
| 157 Amputation of lower extremity | 31 | 9 | 29% |
| 49 Other operating room heart procedures | 27 | 16 | 59% |
| 48 Insertion, revision, replacement, removal of cardiac pacemaker or cardioverter/defibrillator | 24 | 8 | 33% |
| 43 Heart valve procedures | 20 | 16 | 80% |
| Maintenance chemotherapy (diagnosis CCS 45) | 20 | 18 | 90% |
| 78 Colorectal resection | 18 | 9 | 50% |
| 169 Debridement of wound, infection or burn | 16 | 4 | 25% |
| 84 Cholecystectomy and common duct exploration | 16 | 5 | 31% |
| 99 Other OR gastrointestinal therapeutic procedures | 16 | 8 | 50% |
| 158 Spinal fusion | 15 | 11 | 73% |
| 142 Partial excision bone | 14 | 10 | 71% |
| 86 Other hernia repair | 14 | 6 | 42% |
| 44 Coronary artery bypass graft | 13 | 10 | 77% |
| 67 Other therapeutic procedures, hemic and lymphatic system | 13 | 13 | 100% |
| 211 Therapeutic radiology for cancer treatment | 12 | 0 | 0% |
| 45 Percutaneous transluminal coronary angioplasty | 11 | 7 | 64% |
| Total | 497 | 272 | 54.7% |
The readmissions with least abstractor agreement were those involving CCS 157 (amputation of lower extremity) and CCS 169 (debridement of wound, infection or burn). Readmissions for these procedures were nearly always performed as a consequence of acute worsening of chronic conditions such as osteomyelitis or ulceration. Abstractors were divided over whether these readmissions were appropriate to call planned.
Changes to the Algorithm
We determined that the accuracy of the algorithm would be improved by removing 2 procedure categories from the planned procedure list (therapeutic radiation [CCS 211] and cancer chemotherapy [CCS 224]), adding 1 diagnosis category to the acute diagnosis list (hypertension with complications [CCS 99]), and splitting 2 diagnosis condition categories into acute and nonacute ICD‐9‐CM codes (pancreatic disorders [CCS 149] and biliary tract disease [CCS 152]). Detailed rationales for each modification to the planned readmission algorithm are described in Table 4. We felt further examination of diagnostic cardiac catheterization and cardiac devices was warranted given their high frequency, despite low positive predictive value. We also elected not to alter the categorization of amputation or debridement because it was not easy to determine whether these admissions were planned or unplanned even with chart review. We plan further analyses of these procedure categories.
| Action | Diagnosis or Procedure Category | Algorithm | Chart | N | Rationale for Change |
|---|---|---|---|---|---|
| |||||
| Remove from planned procedure list | Therapeutic radiation (CCS 211) | Accurate | The algorithm was inaccurate in every case. All therapeutic radiology during readmissions was performed because of acute illness (pain crisis, neurologic crisis) or because scheduled treatment occurred during an unplanned readmission. In national data, this ranks as the 25th most common planned procedure identified by the algorithm v2.1. | ||
| Planned | Planned | 0 | |||
| Unplanned | Unplanned | 0 | |||
| Inaccurate | |||||
| Unplanned | Planned | 0 | |||
| Planned | Unplanned | 12 | |||
| Cancer chemotherapy (CCS 224) | Accurate | Of the 22 correctly identified as planned, 18 (82%) would already have been categorized as planned because of a principal diagnosis of maintenance chemotherapy. Therefore, removing CCS 224 from the planned procedure list would only miss a small fraction of planned readmissions but would avoid a large number of misclassifications. In national data, this ranks as the 8th most common planned procedure identified by the algorithm v2.1. | |||
| Planned | Planned | 22 | |||
| Unplanned | Unplanned | 0 | |||
| Inaccurate | |||||
| Unplanned | Planned | 0 | |||
| Planned | Unplanned | 18 | |||
| Add to planned procedure list | None | The abstractors felt a planned readmission was missed by the algorithm in 15 cases. A handful of these cases were missed because the planned procedure was not on the current planned procedure list; however, those procedures (eg, abdominal paracentesis, colonoscopy, endoscopy) were nearly always unplanned overall and should therefore not be added as procedures that potentially qualify as an admission as planned. | |||
| Remove from acute diagnosis list | None | The abstractors felt a planned readmission was missed by the algorithm in 15 cases. The relevant disqualifying acute diagnoses were much more often associated with unplanned readmissions in our dataset. | |||
| Add to acute diagnosis list | Hypertension with complications (CCS 99) | Accurate | This CCS was associated with only 1 planned readmission (for elective nephrectomy, a very rare procedure). Every other time this CCS appeared in the dataset, it was associated with an unplanned readmission (12/13, 92%); 10 of those, however, were misclassified by the algorithm as planned because they were not excluded by diagnosis (91% error rate). Consequently, adding this CCS to the acute diagnosis list is likely to miss only a very small fraction of planned readmissions, while making the overall algorithm much more accurate. | ||
| Planned | Planned | 1 | |||
| Unplanned | Unplanned | 2 | |||
| Inaccurate | |||||
| Unplanned | Planned | 0 | |||
| Planned | Unplanned | 10 | |||
| Split diagnosis condition category into component ICD‐9 codes | Pancreatic disorders (CCS 152) | Accurate | ICD‐9 code 577.0 (acute pancreatitis) is the only acute code in this CCS. Acute pancreatitis was present in 2 cases that were misclassified as planned. Clinically, there is no situation in which a planned procedure would reasonably be performed in the setting of acute pancreatitis. Moving ICD‐9 code 577.0 to the acute list and leaving the rest of the ICD‐9 codes in CCS 152 on the nonacute list will enable the algorithm to continue to identify planned procedures for chronic pancreatitis. | ||
| Planned | Planned | 0 | |||
| Unplanned | Unplanned | 1 | |||
| Inaccurate | |||||
| Unplanned | Planned | 0 | |||
| Planned | Unplanned | 2 | |||
| Biliary tract disease (CCS 149) | Accurate | This CCS is a mix of acute and chronic diagnoses. Of 14 charts classified as planned with CCS 149 in the principal diagnosis field, 12 were misclassified (of which 10 were associated with cholecystectomy). Separating out the acute and nonacute diagnoses will increase the accuracy of the algorithm while still ensuring that planned cholecystectomies and other procedures can be identified. Of the ICD‐9 codes in CCS 149, the following will be added to the acute diagnosis list: 574.0, 574.3, 574.6, 574.8, 575.0, 575.12, 576.1. | |||
| Planned | Planned | 2 | |||
| Unplanned | Unplanned | 3 | |||
| Inaccurate | |||||
| Unplanned | Planned | 0 | |||
| Planned | Unplanned | 12 | |||
| Consider for change after additional study | Diagnostic cardiac catheterization (CCS 47) | Accurate | The algorithm misclassified as planned 25/38 (66%) unplanned readmissions in which diagnostic catheterizations were the only qualifying planned procedure. It also correctly identified 3/3 (100%) planned readmissions in which diagnostic cardiac catheterizations were the only qualifying planned procedure. This is the highest volume procedure in national data. | ||
| Planned | Planned | 3* | |||
| Unplanned | Unplanned | 13* | |||
| Inaccurate | |||||
| Unplanned | Planned | 0* | |||
| Planned | Unplanned | 25* | |||
| Insertion, revision, replacement, removal of cardiac pacemaker or cardioverter/defibrillator (CCS 48) | Accurate | The algorithm misclassified as planned 4/5 (80%) unplanned readmissions in which cardiac devices were the only qualifying procedure. However, it also correctly identified 7/8 (87.5%) planned readmissions in which cardiac devices were the only qualifying planned procedure. CCS 48 is the second most common planned procedure category nationally. | |||
| Planned | Planned | 7 | |||
| Unplanned | Unplanned | 1 | |||
| Inaccurate | |||||
| Unplanned | Planned | 1 | |||
| Planned | Unplanned | 4 | |||
The revised algorithm (v3.0) had a weighted sensitivity of 49.8%, weighted specificity of 96.5%, positive predictive value of 58.7%, and negative predictive value of 94.5% (Table 2). In aggregate, these changes would increase the reported unplanned readmission rate from 16.0% to 16.1% in the hospital‐wide readmission measure, using 2011 to 2012 data, and would decrease the fraction of all readmissions considered planned from 7.8% to 7.2%.
DISCUSSION
We developed an algorithm based on administrative data that in its currently implemented form is very accurate at identifying unplanned readmissions, ensuring that readmissions included in publicly reported readmission measures are likely to be truly unplanned. However, nearly half of readmissions the algorithm classifies as planned are actually unplanned. That is, the algorithm is overcautious in excluding unplanned readmissions that could have counted as outcomes, particularly among admissions that include diagnostic cardiac catheterization or placement of cardiac devices (pacemakers, defibrillators). However, these errors only occur within the 7.8% of readmissions that are classified as planned and therefore do not affect overall readmission rates dramatically. A perfect algorithm would reclassify approximately half of these planned readmissions as unplanned, increasing the overall readmission rate by 0.6 percentage points.
On the other hand, the algorithm also only identifies approximately half of true planned readmissions as planned. Because the true prevalence of planned readmissions is low (approximately 9% of readmissions based on weighted chart review prevalence, or an absolute rate of 1.4%), this low sensitivity has a small effect on algorithm performance. Removing all true planned readmissions from the measure outcome would decrease the overall readmission rate by 0.8 percentage points, similar to the expected 0.6 percentage point increase that would result from better identifying unplanned readmissions; thus, a perfect algorithm would likely decrease the reported unplanned readmission rate by a net 0.2%. Overall, the existing algorithm appears to come close to the true prevalence of planned readmissions, despite inaccuracy on an individual‐case basis. The algorithm performed best at large hospitals, which are at greatest risk of being statistical outliers and of accruing penalties under the Hospital Readmissions Reduction Program.[10]
We identified several changes that marginally improved the performance of the algorithm by reducing the number of unplanned readmissions that are incorrectly removed from the measure, while avoiding the inappropriate inclusion of planned readmissions in the outcome. This revised algorithm, v3.0, was applied to public reporting of readmission rates at the end of 2014. Overall, implementing these changes increases the reported readmission rate very slightly. We also identified other procedures associated with high inaccuracy rates, removal of which would have larger impact on reporting rates, and which therefore merit further evaluation.
There are other potential methods of identifying planned readmissions. For instance, as of October 1, 2013, new administrative billing codes were created to allow hospitals to indicate that a patient was discharged with a planned acute‐care hospital inpatient readmission, without limitation as to when it will take place.[11] This code must be used at the time of the index admission to indicate that a future planned admission is expected, and was specified only to be used for neonates and patients with acute myocardial infarction. This approach, however, would omit planned readmissions that are not known to the initial discharging team, potentially missing planned readmissions. Conversely, some patients discharged with a plan for readmission may be unexpectedly readmitted for an unplanned reason. Given that the new codes were not available at the time we conducted the validation study, we were not able to determine how often the billing codes accurately identified planned readmissions. This would be an important area to consider for future study.
An alternative approach would be to create indicator codes to be applied at the time of readmission that would indicate whether that admission was planned or unplanned. Such a code would have the advantage of allowing each planned readmission to be flagged by the admitting clinicians at the time of admission rather than by an algorithm that inherently cannot be perfect. However, identifying planned readmissions at the time of readmission would also create opportunity for gaming and inconsistent application of definitions between hospitals; additional checks would need to be put in place to guard against these possibilities.
Our study has some limitations. We relied on the opinion of chart abstractors to determine whether a readmission was planned or unplanned; in a few cases, such as smoldering wounds that ultimately require surgical intervention, that determination is debatable. Abstractions were done at local institutions to minimize risks to patient privacy, and therefore we could not centrally verify determinations of planned status except by reviewing source of admission, dates of procedures, and narrative comments reported by the abstractors. Finally, we did not have sufficient volume of planned procedures to determine accuracy of the algorithm for less common procedure categories or individual procedures within categories.
In summary, we developed an algorithm to identify planned readmissions from administrative data that had high specificity and moderate sensitivity, and refined it based on chart validation. This algorithm is in use in public reporting of readmission measures to maximize the probability that the reported readmission rates represent truly unplanned readmissions.[12]
Disclosures: Financial supportThis work was performed under contract HHSM‐500‐2008‐0025I/HHSM‐500‐T0001, Modification No. 000008, titled Measure Instrument Development and Support, funded by the Centers for Medicare and Medicaid Services (CMS), an agency of the US Department of Health and Human Services. Drs. Horwitz and Ross are supported by the National Institute on Aging (K08 AG038336 and K08 AG032886, respectively) and by the American Federation for Aging Research through the Paul B. Beeson Career Development Award Program. Dr. Krumholz is supported by grant U01 HL105270‐05 (Center for Cardiovascular Outcomes Research at Yale University) from the National Heart, Lung, and Blood Institute. No funding source had any role in the study design; in the collection, analysis, and interpretation of data; or in the writing of the article. The CMS reviewed and approved the use of its data for this work and approved submission of the manuscript. All authors have completed the Unified Competing Interest form at
- , , , et al. Development, validation, and results of a measure of 30‐day readmission following hospitalization for pneumonia. J Hosp Med. 2011;6(3):142–150.
- , , , et al. An administrative claims measure suitable for profiling hospital performance based on 30‐day all‐cause readmission rates among patients with acute myocardial infarction. Circ Cardiovasc Qual Outcomes. 2011;4(2):243–252.
- , , , et al. An administrative claims measure suitable for profiling hospital performance on the basis of 30‐day all‐cause readmission rates among patients with heart failure. Circ Cardiovasc Qual Outcomes. 2008;1:29–37.
- , , , et al. Hospital‐level 30‐day all‐cause risk‐standardized readmission rate following elective primary total hip arthroplasty (THA) and/or total knee arthroplasty (TKA). Available at: http://www.qualitynet.org/dcs/ContentServer?c=Page161(supp10 l):S66–S75.
- , , A meta‐analysis of hospital 30‐day avoidable readmission rates. J Eval Clin Pract. 2011;18(6):1211–1218.
- , , , , Proportion of hospital readmissions deemed avoidable: a systematic review. CMAJ. 2011;183(7):E391–E402.
- , , , et al. Centers for Medicare 3(4):477–492.
- , Characteristics of hospitals receiving penalties under the Hospital Readmissions Reduction Program. JAMA. 2013;309(4):342–343.
- Centers for Medicare and Medicaid Services. Inpatient Prospective Payment System/Long‐Term Care Hospital (IPPS/LTCH) final rule. Fed Regist. 2013;78:50533–50534.
- , , Massachusetts health reforms: uninsurance remains low, self‐reported health status improves as state prepares to tackle costs. Health Aff (Millwood). 2012;31(2):444–451.
© 2015 Society of Hospital Medicine