User login
Perceptions of Current Note Quality
The electronic health record (EHR) has revolutionized the practice of medicine. As part of the economic stimulus package in 2009, Congress enacted the Health Information Technology for Economic and Clinical Health Act, which included incentives for physicians and hospitals to adopt an EHR by 2015. In the setting of more limited duty hours and demands for increased clinical productivity, EHRs have functions that may improve the quality and efficiency of clinical documentation.[1, 2, 3, 4, 5]
The process of note writing and the use of notes for clinical care have changed substantially with EHR implementation. Use of efficiency tools (ie, copy forward functions and autopopulation of data) may increase the speed of documentation.[5] Notes in an EHR are more legible and accessible and may be able to organize data to improve clinical care.[6]
Yet, many have commented on the negative consequences of documentation in an EHR. In a New England Journal of Medicine Perspective article, Drs. Hartzband and Groopman wrote, we have observed the electronic medical record become a powerful vehicle for perpetuating erroneous information, leading to diagnostic errors that gain momentum when passed on electronically.[7] As a result, the copy forward and autopopulation functions have come under significant scrutiny.[8, 9, 10] A survey conducted at 2 academic institutions found that 71% of residents and attendings believed that the copy forward function led to inconsistencies and outdated information.[11] Autopopulation has been criticized for creating lengthy notes full of trivial or redundant data, a phenomenon termed note bloat. Bloated notes may be less effective as a communication tool.[12] Additionally, the process of composing a note often stimulates critical thinking and may lead to changes in care. The act of copying forward a previous note and autopopulating data bypasses that process and in effect may suppress critical thinking.[13] Previous studies have raised numerous concerns regarding copy forward and autopopulation functionality in the EHR. Many have described the duplication of outdated data and the possibility of the introduction and perpetuation of errors.[14, 15, 16] The Veterans Affairs (VA) Puget Sound Health system evaluated 6322 copy events and found that 1 in 10 electronic patient charts contained an instance of high‐risk copying.[17] In a survey of faculty and residents at a single academic medical center, the majority of users of copy and paste functionality recognized the hazards; they responded that their notes may contain more outdated (66%) and more inconsistent information (69%). Yet, most felt copy forwarding improved the documentation of the entire hospital course (87%), overall physician documentation (69%), and should definitely be continued (91%).[11] Others have complained about the impact of copy forward on the expression of clinical reasoning.[7, 9, 18]
Previous discussions on the topic of overall note quality following EHR implementation have been limited to perspectives or opinion pieces of individual attending providers.[18] We conducted a survey across 4 academic institutions to analyze both housestaff and attendings perceptions of the quality of notes since the implementation of an EHR to better inform the discussion of the impact of an EHR on note quality.
METHODS
Participants
Surveys were administered via email to interns, residents (second‐, third‐, or fourth‐year residents, hereafter referred to as residents) and attendings at 4 academic hospitals that use the Epic EHR (Epic Corp., Madison, WI). The 4 institutions each adopted the Epic EHR, with mandatory faculty and resident training, between 1 and 5 years prior to the survey. Three of the institutions previously used systems with electronic notes, whereas the fourth institution previously used a system with handwritten notes. The study participation emails included a link to an online survey in REDCap.[19] We included interns and residents from the following types of residency programs: internal medicine categorical or primary care, medicine‐pediatrics, or medicine‐psychiatry. For housestaff (the combination of both interns and residents), exclusion criteria included preliminary or transitional year interns, or any interns or residents from other specialties who rotate on the medicine service. For attendings, participants included hospitalists, general internal medicine attendings, chief residents, and subspecialty medicine attendings, each of whom had worked for any amount of time on the inpatient medicine teaching service in the prior 12 months.
Design
We developed 3 unique surveys for interns, residents, and attendings to assess their perception of inpatient progress notes (see Supporting Information, Appendix, in the online version of this article). The surveys incorporated questions from 2 previously published sources, the 9‐item Physician Documentation Quality Instrument (PDQI‐9) (see online Appendix), a validated note‐scoring tool, and the Accreditation Council for Graduate Medical Education note‐writing competency checklists.[20] Additionally, faculty at the participating institutions developed questions to address practices and attitudes toward autopopulation, copy forward, and the purposes of a progress note. Responses were based on a 5‐point Likert scale. The intern and resident surveys asked for self‐evaluation of their own progress notes and those of their peers, whereas the attending surveys asked for assessment of housestaff notes.
The survey was left open for a total of 55 days and participants were sent reminder emails. The study received a waiver from the institutional review board at all 4 institutions.
Data Analysis
Study data were collected and managed using REDCap electronic data capture tools hosted at the University of California, San Francisco (UCSF).[19] The survey data were analyzed and the figures were created using Microsoft Excel 2008 (Microsoft Corp., Redmond, WA). Mean values for each survey question were calculated. Differences between the means among the groups were assessed using 2‐sample t tests. P values <0.05 were considered statistically significant.
RESULTS
Demographics
We received 99 completed surveys from interns, 155 completed surveys from residents, and 153 completed surveys from attendings across the 4 institutions. The overall response rate for interns was 68%, ranging from 59% at the University of California, San Diego (UCSD) to 74% at the University of Iowa. The overall response rate for residents was 49%, ranging from 38% at UCSF to 66% at the University of California, Los Angeles. The overall response rate for attendings was 70%, ranging from 53% at UCSD to 74% at UCSF.
A total of 78% of interns and 72% of residents had used an EHR at a prior institution. Of the residents, 90 were second‐year residents, 64 were third‐year residents, and 2 were fourth‐year residents. A total of 76% of attendings self‐identified as hospitalists.
Overall Assessment of Note Quality
Participants were asked to rate the quality of progress notes on a 5‐point scale (poor, fair, good, very good, excellent). Half of interns and residents rated their own progress notes as very good or excellent. A total of 44% percent of interns and 24% of residents rated their peers notes as very good or excellent, whereas only 15% of attending physicians rated housestaff notes as very good or excellent.
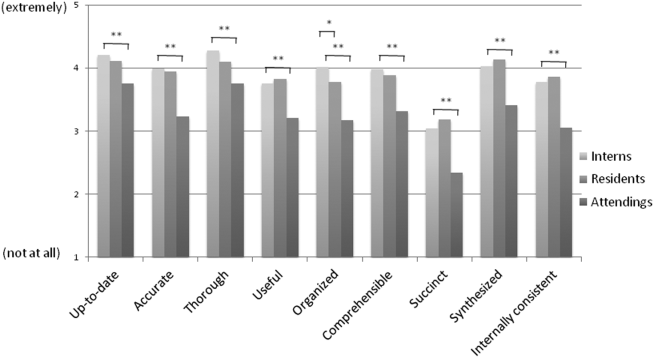
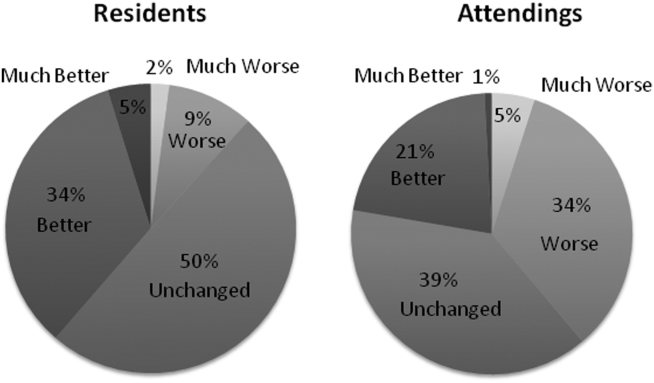
When asked to rate the change in progress note quality since their hospital had adopted the EHR, the majority of residents answered unchanged or better, and the majority of attendings answered unchanged or worse (Figure 1).

PDQI‐9 Framework
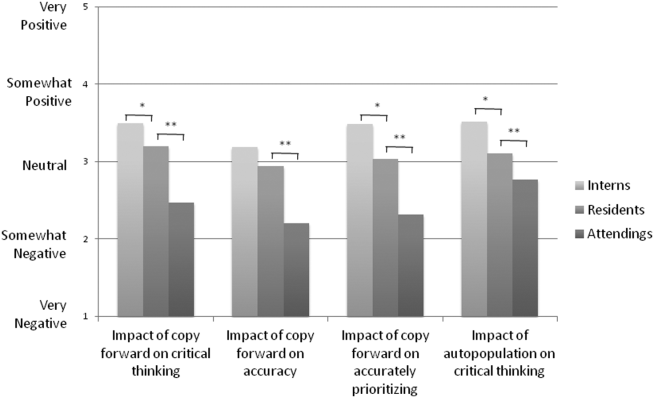
Participants answered each PDQI‐9 question on a 5‐point Likert scale ranging from not at all (1) to extremely (5). In 8 of the 9 PDQI‐9 domains, there were no significant differences between interns and residents. Across each domain, attending perceptions of housestaff notes were significantly lower than housestaff perceptions of their own notes (P<0.001) (Figure 2). Both housestaff and attendings gave the highest ratings to thorough, up to date, and synthesized and the lowest rating to succinct.
Copy Forward and Autopopulation
Overall, the effect of copy forward and autopopulation on critical thinking, note accuracy, and prioritizing the problem list was thought to be neutral or somewhat positive by interns, neutral by residents, and neutral or somewhat negative by attendings (P<0.001) (Figure 3). In all, 16% of interns, 22% of residents, and 55% of attendings reported that copy forward had a somewhat negative or very negative impact on critical thinking (P<0.001). In all, 16% of interns, 29% of residents and 39% of attendings thought that autopopulation had a somewhat negative or very negative impact on critical thinking (P<0.001).
Purpose of Progress Notes
Participants were provided with 7 possible purposes of a progress note and asked to rate the importance of each stated purpose. There was nearly perfect agreement between interns, residents, and attendings in the rank order of the importance of each purpose of a progress note (Table 1). Attendings and housestaff ranked communication with other providers and documenting important events and the plan for the day as the 2 most important purposes of a progress note, and billing and quality improvement as less important.
| Interns | Residents | Attendings | |
|---|---|---|---|
| Communication with other providers | 1 | 1 | 2 |
| Documenting important events and the plan for the day | 2 | 2 | 1 |
| Prioritizing issues going forward in the patient's care | 3 | 3 | 3 |
| Medicolegal | 4 | 4 | 4 |
| Stimulate critical thinking | 5 | 5 | 5 |
| Billing | 6 | 6 | 6 |
| Quality improvement | 7 | 7 | 7 |
DISCUSSION
This is the first large multicenter analysis of both attendings and housestaff perceptions of note quality in the EHR era. The findings provide insight into important differences and similarities in the perceptions of the 2 groups. Most striking is the difference in opinion of overall note quality, with only a small minority of faculty rating current housestaff notes as very good or excellent, whereas a much larger proportion of housestaff rated their own notes and those of their peers to be of high quality. Though participants were not specifically asked why note quality in general was suboptimal, housestaff and faculty rankings of specific domains from the PDQI‐9 may yield an important clue. Specifically, all groups expressed that the weakest attribute of current progress notes is succinct. This finding is consistent with the note bloat phenomenon, which has been maligned as a consequence of EHR implementation.[7, 14, 18, 21, 22]
One interesting finding was that only 5% of interns rated the notes of other housestaff as fair or poor. One possible explanation for this may be the tendency for an individual to enhance or augment the status or performance of the group to which he or she belongs as a mechanism to increase self‐image, known as the social identity theory.[23] Thus, housestaff may not criticize their peers to allow for identification with a group that is not deficient in note writing.
The more positive assessment of overall note quality among housestaff could be related to the different roles of housestaff and attendings on a teaching service. On a teaching service, housestaff are typically the writer, whereas attendings are almost exclusively the reader of progress notes. Housestaff may reap benefits, including efficiency, beyond the finished product. A perception of higher quality may reflect the process of note writing, data gathering, and critical thinking required to build an assessment and plan. The scores on the PDQI‐9 support this notion, as housestaff rated all 9 domains significantly higher than attendings.
Housestaff and attendings held greater differences of opinion with respect to the EHR's impact on note quality. Generally, housestaff perceived the EHR to have improved progress note quality, whereas attendings perceived the opposite. One explanation could be that these results reflect changing stages of development of physicians well described through the RIME framework (reporter, interpreter, manager, educator). Attendings may expect notes to reflect synthesis and analysis, whereas trainees may be satisfied with the data gathering that an EHR facilitates. In our survey, the trend of answers from intern to resident to attending suggests an evolving process of attitudes toward note quality.
The above reasons may also explain why housestaff were generally more positive than attendings about the effect of copy forward and autopopulation functions on critical thinking. Perhaps, as these functions can potentially increase efficiency and decrease time spent at the computer, although data are mixed on this finding, housestaff may have more time to spend with patients or develop a thorough plan and thus rate these functions positively.
Notably, housestaff and attendings had excellent agreement on the purposes of a progress note. They agreed that the 2 most important purposes were communication with other providers and documenting important events and the plan for the day. These are the 2 listed purposes that are most directly related to patient care. If future interventions to improve note quality require housestaff and attendings to significantly change their behavior, a focus on the impact on patient care might yield the best results.
There were several limitations in our study. Any study based on self‐assessment is subject to bias. A previous meta‐analysis and review described poor to moderate correlations between self‐assessed and external measures of performance.[24, 25] The survey data were aggregated from 4 institutions despite somewhat different, though relatively high, response rates between the institutions. There could be a response bias; those who did not respond may have systematically different perceptions of note quality. It should be noted that the general demographics of the respondents reflected those of the housestaff and attendings at 4 academic centers. All 4 of the participating institutions adopted the Epic EHR within the last several years of the survey being administered, and perceptions of note quality may be biased depending on the prior system used (ie, change from handwritten to electronic vs electronic to other electronic system). In addition, the survey results reflect experience with only 1 EHR, and our results may not apply to other EHR vendors or institutions like the VA, which have a long‐standing system in place. Last, we did not explore the impact of perceived note quality on the measured or perceived quality of care. One previous study found no direct correlation between note quality and clinical quality.[26]
There are several future directions for research based on our findings. First, potential differences between housestaff and attending perceptions of note quality could be further teased apart by studying the perceptions of attendings on a nonteaching service who write their own daily progress notes. Second, housestaff perceptions on why copy forward and autopopulation may increase critical thinking could be explored further with more direct questioning. Finally, although our study captured only perceptions of note quality, validated tools could be used to objectively measure note quality; these measurements could then be compared to perception of note quality as well as clinical outcomes.
Given the prevalence and the apparent belief that the benefits of an EHR outweigh the hazards, institutions should embrace these innovations but take steps to mitigate the potential errors and problems associated with copy forward and autopopulation. The results of our study should help inform future interventions.
Acknowledgements
The authors acknowledge the contributions of Russell Leslie from the University of Iowa.
Disclosure: Nothing to report.
- , , , et al. Systematic review: impact of health information technology on quality, efficiency, and costs of medical care. Ann Intern Med. 2006;144(10):742–752.
- , , , , . Clinical information technologies and inpatient outcomes: a multiple hospital study. Arch Intern Med. 2009;169(2):108–114.
- , , , et al. Effect of computerized physician order entry and a team intervention on prevention of serious medication errors. JAMA. 1998;280(15):1311–1316.
- , , , . Electronic health records and quality of diabetes care. N Engl J Med. 2011;365(9):825–833.
- , , , et al. The impact of a clinical information system in an intensive care unit. J Clin Monit Comput. 2008;22(1):31–36.
- , . Can electronic clinical documentation help prevent diagnostic errors? N Engl J Med. 2010;362(12):1066–1069.
- , . Off the record—avoiding the pitfalls of going electronic. N Eng J Med. 2008;358(16):1656–1658.
- , , . Copying and pasting of examinations within the electronic medical record. Int J Med Inform. 2007;76(suppl 1):S122–S128.
- , . Copy and paste: a remediable hazard of electronic health records. Am J Med. 2009;122(6):495–496.
- , , . The role of copy‐and‐paste in the hospital electronic health record. JAMA Intern Med. 2014;174(8):1217–1218.
- , , , , , . Physicians’ attitudes towards copy and pasting in electronic note writing. J Gen Intern Med. 2009;24(1):63–68.
- , , , , . Medical education in the electronic medical record (EMR) era: benefits, challenges, and future directions. Acad Med. 2013;88(6):748–752.
- , . Educational impact of the electronic medical record. J Surg Educ. 2012;69(1):105–112.
- , , , , , . Direct text entry in electronic progress notes. An evaluation of input errors. Methods Inf Med. 2003;42(1):61–67.
- . The clinical record: a 200‐year‐old 21st‐century challenge. Ann Intern Med. 2010;153(10):682–683.
- . Sloppy and paste. Morbidity and Mortality Rounds on the Web. Available at: http://www.webmm.ahrq.gov/case.aspx?caseID=274. Published July 2012. Accessed September 26, 2014.
- , , , . Are electronic medical records trustworthy? Observations on copying, pasting and duplication. AMIA Annu Symp Proc. 2003:269–273.
- . A piece of my mind. John Lennon's elbow. JAMA. 2012;308(5):463–464.
- , , , , , . Research electronic data capture (REDCap)—a metadata‐driven methodology and workflow process for providing translational research informatics support. J Biomed Inform. 2009;42(2):377–381.
- , , . ACGME competency note checklist. Available at: http://www.im.org/p/cm/ld/fid=831. Accessed August 8, 2013.
- , , , . Assessing electronic note quality using the Physician Documentation Quality Instrument (PDQI‐9). Appl Clin Inform. 2012;3(2):164–174.
- , , , . Quantifying clinical narrative redundancy in an electronic health record. J Am Med Inform Assoc. 2010;17(1):49–53.
- , . The social identity theory of intergroup behavior. In: Psychology of Intergroup Relations. 2nd ed. Chicago, IL: Nelson‐Hall Publishers; 1986:7–24.
- , . Student self‐assessment in higher education: a meta‐analysis. Rev Educ Res. 1989;59:395–430.
- . A review of the validity and accuracy of self‐assessments in health professions training. Acad Med. 1991;66:762–769.
- , , , , . Association of note quality and quality of care: a cross‐sectional study. BMJ Qual Saf. 2014;23(5):406–413.
The electronic health record (EHR) has revolutionized the practice of medicine. As part of the economic stimulus package in 2009, Congress enacted the Health Information Technology for Economic and Clinical Health Act, which included incentives for physicians and hospitals to adopt an EHR by 2015. In the setting of more limited duty hours and demands for increased clinical productivity, EHRs have functions that may improve the quality and efficiency of clinical documentation.[1, 2, 3, 4, 5]
The process of note writing and the use of notes for clinical care have changed substantially with EHR implementation. Use of efficiency tools (ie, copy forward functions and autopopulation of data) may increase the speed of documentation.[5] Notes in an EHR are more legible and accessible and may be able to organize data to improve clinical care.[6]
Yet, many have commented on the negative consequences of documentation in an EHR. In a New England Journal of Medicine Perspective article, Drs. Hartzband and Groopman wrote, we have observed the electronic medical record become a powerful vehicle for perpetuating erroneous information, leading to diagnostic errors that gain momentum when passed on electronically.[7] As a result, the copy forward and autopopulation functions have come under significant scrutiny.[8, 9, 10] A survey conducted at 2 academic institutions found that 71% of residents and attendings believed that the copy forward function led to inconsistencies and outdated information.[11] Autopopulation has been criticized for creating lengthy notes full of trivial or redundant data, a phenomenon termed note bloat. Bloated notes may be less effective as a communication tool.[12] Additionally, the process of composing a note often stimulates critical thinking and may lead to changes in care. The act of copying forward a previous note and autopopulating data bypasses that process and in effect may suppress critical thinking.[13] Previous studies have raised numerous concerns regarding copy forward and autopopulation functionality in the EHR. Many have described the duplication of outdated data and the possibility of the introduction and perpetuation of errors.[14, 15, 16] The Veterans Affairs (VA) Puget Sound Health system evaluated 6322 copy events and found that 1 in 10 electronic patient charts contained an instance of high‐risk copying.[17] In a survey of faculty and residents at a single academic medical center, the majority of users of copy and paste functionality recognized the hazards; they responded that their notes may contain more outdated (66%) and more inconsistent information (69%). Yet, most felt copy forwarding improved the documentation of the entire hospital course (87%), overall physician documentation (69%), and should definitely be continued (91%).[11] Others have complained about the impact of copy forward on the expression of clinical reasoning.[7, 9, 18]
Previous discussions on the topic of overall note quality following EHR implementation have been limited to perspectives or opinion pieces of individual attending providers.[18] We conducted a survey across 4 academic institutions to analyze both housestaff and attendings perceptions of the quality of notes since the implementation of an EHR to better inform the discussion of the impact of an EHR on note quality.
METHODS
Participants
Surveys were administered via email to interns, residents (second‐, third‐, or fourth‐year residents, hereafter referred to as residents) and attendings at 4 academic hospitals that use the Epic EHR (Epic Corp., Madison, WI). The 4 institutions each adopted the Epic EHR, with mandatory faculty and resident training, between 1 and 5 years prior to the survey. Three of the institutions previously used systems with electronic notes, whereas the fourth institution previously used a system with handwritten notes. The study participation emails included a link to an online survey in REDCap.[19] We included interns and residents from the following types of residency programs: internal medicine categorical or primary care, medicine‐pediatrics, or medicine‐psychiatry. For housestaff (the combination of both interns and residents), exclusion criteria included preliminary or transitional year interns, or any interns or residents from other specialties who rotate on the medicine service. For attendings, participants included hospitalists, general internal medicine attendings, chief residents, and subspecialty medicine attendings, each of whom had worked for any amount of time on the inpatient medicine teaching service in the prior 12 months.
Design
We developed 3 unique surveys for interns, residents, and attendings to assess their perception of inpatient progress notes (see Supporting Information, Appendix, in the online version of this article). The surveys incorporated questions from 2 previously published sources, the 9‐item Physician Documentation Quality Instrument (PDQI‐9) (see online Appendix), a validated note‐scoring tool, and the Accreditation Council for Graduate Medical Education note‐writing competency checklists.[20] Additionally, faculty at the participating institutions developed questions to address practices and attitudes toward autopopulation, copy forward, and the purposes of a progress note. Responses were based on a 5‐point Likert scale. The intern and resident surveys asked for self‐evaluation of their own progress notes and those of their peers, whereas the attending surveys asked for assessment of housestaff notes.
The survey was left open for a total of 55 days and participants were sent reminder emails. The study received a waiver from the institutional review board at all 4 institutions.
Data Analysis
Study data were collected and managed using REDCap electronic data capture tools hosted at the University of California, San Francisco (UCSF).[19] The survey data were analyzed and the figures were created using Microsoft Excel 2008 (Microsoft Corp., Redmond, WA). Mean values for each survey question were calculated. Differences between the means among the groups were assessed using 2‐sample t tests. P values <0.05 were considered statistically significant.
RESULTS
Demographics
We received 99 completed surveys from interns, 155 completed surveys from residents, and 153 completed surveys from attendings across the 4 institutions. The overall response rate for interns was 68%, ranging from 59% at the University of California, San Diego (UCSD) to 74% at the University of Iowa. The overall response rate for residents was 49%, ranging from 38% at UCSF to 66% at the University of California, Los Angeles. The overall response rate for attendings was 70%, ranging from 53% at UCSD to 74% at UCSF.
A total of 78% of interns and 72% of residents had used an EHR at a prior institution. Of the residents, 90 were second‐year residents, 64 were third‐year residents, and 2 were fourth‐year residents. A total of 76% of attendings self‐identified as hospitalists.
Overall Assessment of Note Quality
Participants were asked to rate the quality of progress notes on a 5‐point scale (poor, fair, good, very good, excellent). Half of interns and residents rated their own progress notes as very good or excellent. A total of 44% percent of interns and 24% of residents rated their peers notes as very good or excellent, whereas only 15% of attending physicians rated housestaff notes as very good or excellent.
When asked to rate the change in progress note quality since their hospital had adopted the EHR, the majority of residents answered unchanged or better, and the majority of attendings answered unchanged or worse (Figure 1).
PDQI‐9 Framework
Participants answered each PDQI‐9 question on a 5‐point Likert scale ranging from not at all (1) to extremely (5). In 8 of the 9 PDQI‐9 domains, there were no significant differences between interns and residents. Across each domain, attending perceptions of housestaff notes were significantly lower than housestaff perceptions of their own notes (P<0.001) (Figure 2). Both housestaff and attendings gave the highest ratings to thorough, up to date, and synthesized and the lowest rating to succinct.
Copy Forward and Autopopulation
Overall, the effect of copy forward and autopopulation on critical thinking, note accuracy, and prioritizing the problem list was thought to be neutral or somewhat positive by interns, neutral by residents, and neutral or somewhat negative by attendings (P<0.001) (Figure 3). In all, 16% of interns, 22% of residents, and 55% of attendings reported that copy forward had a somewhat negative or very negative impact on critical thinking (P<0.001). In all, 16% of interns, 29% of residents and 39% of attendings thought that autopopulation had a somewhat negative or very negative impact on critical thinking (P<0.001).
Purpose of Progress Notes
Participants were provided with 7 possible purposes of a progress note and asked to rate the importance of each stated purpose. There was nearly perfect agreement between interns, residents, and attendings in the rank order of the importance of each purpose of a progress note (Table 1). Attendings and housestaff ranked communication with other providers and documenting important events and the plan for the day as the 2 most important purposes of a progress note, and billing and quality improvement as less important.
| Interns | Residents | Attendings | |
|---|---|---|---|
| Communication with other providers | 1 | 1 | 2 |
| Documenting important events and the plan for the day | 2 | 2 | 1 |
| Prioritizing issues going forward in the patient's care | 3 | 3 | 3 |
| Medicolegal | 4 | 4 | 4 |
| Stimulate critical thinking | 5 | 5 | 5 |
| Billing | 6 | 6 | 6 |
| Quality improvement | 7 | 7 | 7 |
DISCUSSION
This is the first large multicenter analysis of both attendings and housestaff perceptions of note quality in the EHR era. The findings provide insight into important differences and similarities in the perceptions of the 2 groups. Most striking is the difference in opinion of overall note quality, with only a small minority of faculty rating current housestaff notes as very good or excellent, whereas a much larger proportion of housestaff rated their own notes and those of their peers to be of high quality. Though participants were not specifically asked why note quality in general was suboptimal, housestaff and faculty rankings of specific domains from the PDQI‐9 may yield an important clue. Specifically, all groups expressed that the weakest attribute of current progress notes is succinct. This finding is consistent with the note bloat phenomenon, which has been maligned as a consequence of EHR implementation.[7, 14, 18, 21, 22]
One interesting finding was that only 5% of interns rated the notes of other housestaff as fair or poor. One possible explanation for this may be the tendency for an individual to enhance or augment the status or performance of the group to which he or she belongs as a mechanism to increase self‐image, known as the social identity theory.[23] Thus, housestaff may not criticize their peers to allow for identification with a group that is not deficient in note writing.
The more positive assessment of overall note quality among housestaff could be related to the different roles of housestaff and attendings on a teaching service. On a teaching service, housestaff are typically the writer, whereas attendings are almost exclusively the reader of progress notes. Housestaff may reap benefits, including efficiency, beyond the finished product. A perception of higher quality may reflect the process of note writing, data gathering, and critical thinking required to build an assessment and plan. The scores on the PDQI‐9 support this notion, as housestaff rated all 9 domains significantly higher than attendings.
Housestaff and attendings held greater differences of opinion with respect to the EHR's impact on note quality. Generally, housestaff perceived the EHR to have improved progress note quality, whereas attendings perceived the opposite. One explanation could be that these results reflect changing stages of development of physicians well described through the RIME framework (reporter, interpreter, manager, educator). Attendings may expect notes to reflect synthesis and analysis, whereas trainees may be satisfied with the data gathering that an EHR facilitates. In our survey, the trend of answers from intern to resident to attending suggests an evolving process of attitudes toward note quality.
The above reasons may also explain why housestaff were generally more positive than attendings about the effect of copy forward and autopopulation functions on critical thinking. Perhaps, as these functions can potentially increase efficiency and decrease time spent at the computer, although data are mixed on this finding, housestaff may have more time to spend with patients or develop a thorough plan and thus rate these functions positively.
Notably, housestaff and attendings had excellent agreement on the purposes of a progress note. They agreed that the 2 most important purposes were communication with other providers and documenting important events and the plan for the day. These are the 2 listed purposes that are most directly related to patient care. If future interventions to improve note quality require housestaff and attendings to significantly change their behavior, a focus on the impact on patient care might yield the best results.
There were several limitations in our study. Any study based on self‐assessment is subject to bias. A previous meta‐analysis and review described poor to moderate correlations between self‐assessed and external measures of performance.[24, 25] The survey data were aggregated from 4 institutions despite somewhat different, though relatively high, response rates between the institutions. There could be a response bias; those who did not respond may have systematically different perceptions of note quality. It should be noted that the general demographics of the respondents reflected those of the housestaff and attendings at 4 academic centers. All 4 of the participating institutions adopted the Epic EHR within the last several years of the survey being administered, and perceptions of note quality may be biased depending on the prior system used (ie, change from handwritten to electronic vs electronic to other electronic system). In addition, the survey results reflect experience with only 1 EHR, and our results may not apply to other EHR vendors or institutions like the VA, which have a long‐standing system in place. Last, we did not explore the impact of perceived note quality on the measured or perceived quality of care. One previous study found no direct correlation between note quality and clinical quality.[26]
There are several future directions for research based on our findings. First, potential differences between housestaff and attending perceptions of note quality could be further teased apart by studying the perceptions of attendings on a nonteaching service who write their own daily progress notes. Second, housestaff perceptions on why copy forward and autopopulation may increase critical thinking could be explored further with more direct questioning. Finally, although our study captured only perceptions of note quality, validated tools could be used to objectively measure note quality; these measurements could then be compared to perception of note quality as well as clinical outcomes.
Given the prevalence and the apparent belief that the benefits of an EHR outweigh the hazards, institutions should embrace these innovations but take steps to mitigate the potential errors and problems associated with copy forward and autopopulation. The results of our study should help inform future interventions.
Acknowledgements
The authors acknowledge the contributions of Russell Leslie from the University of Iowa.
Disclosure: Nothing to report.
- , , , et al. Systematic review: impact of health information technology on quality, efficiency, and costs of medical care. Ann Intern Med. 2006;144(10):742–752.
- , , , , . Clinical information technologies and inpatient outcomes: a multiple hospital study. Arch Intern Med. 2009;169(2):108–114.
- , , , et al. Effect of computerized physician order entry and a team intervention on prevention of serious medication errors. JAMA. 1998;280(15):1311–1316.
- , , , . Electronic health records and quality of diabetes care. N Engl J Med. 2011;365(9):825–833.
- , , , et al. The impact of a clinical information system in an intensive care unit. J Clin Monit Comput. 2008;22(1):31–36.
- , . Can electronic clinical documentation help prevent diagnostic errors? N Engl J Med. 2010;362(12):1066–1069.
- , . Off the record—avoiding the pitfalls of going electronic. N Eng J Med. 2008;358(16):1656–1658.
- , , . Copying and pasting of examinations within the electronic medical record. Int J Med Inform. 2007;76(suppl 1):S122–S128.
- , . Copy and paste: a remediable hazard of electronic health records. Am J Med. 2009;122(6):495–496.
- , , . The role of copy‐and‐paste in the hospital electronic health record. JAMA Intern Med. 2014;174(8):1217–1218.
- , , , , , . Physicians’ attitudes towards copy and pasting in electronic note writing. J Gen Intern Med. 2009;24(1):63–68.
- , , , , . Medical education in the electronic medical record (EMR) era: benefits, challenges, and future directions. Acad Med. 2013;88(6):748–752.
- , . Educational impact of the electronic medical record. J Surg Educ. 2012;69(1):105–112.
- , , , , , . Direct text entry in electronic progress notes. An evaluation of input errors. Methods Inf Med. 2003;42(1):61–67.
- . The clinical record: a 200‐year‐old 21st‐century challenge. Ann Intern Med. 2010;153(10):682–683.
- . Sloppy and paste. Morbidity and Mortality Rounds on the Web. Available at: http://www.webmm.ahrq.gov/case.aspx?caseID=274. Published July 2012. Accessed September 26, 2014.
- , , , . Are electronic medical records trustworthy? Observations on copying, pasting and duplication. AMIA Annu Symp Proc. 2003:269–273.
- . A piece of my mind. John Lennon's elbow. JAMA. 2012;308(5):463–464.
- , , , , , . Research electronic data capture (REDCap)—a metadata‐driven methodology and workflow process for providing translational research informatics support. J Biomed Inform. 2009;42(2):377–381.
- , , . ACGME competency note checklist. Available at: http://www.im.org/p/cm/ld/fid=831. Accessed August 8, 2013.
- , , , . Assessing electronic note quality using the Physician Documentation Quality Instrument (PDQI‐9). Appl Clin Inform. 2012;3(2):164–174.
- , , , . Quantifying clinical narrative redundancy in an electronic health record. J Am Med Inform Assoc. 2010;17(1):49–53.
- , . The social identity theory of intergroup behavior. In: Psychology of Intergroup Relations. 2nd ed. Chicago, IL: Nelson‐Hall Publishers; 1986:7–24.
- , . Student self‐assessment in higher education: a meta‐analysis. Rev Educ Res. 1989;59:395–430.
- . A review of the validity and accuracy of self‐assessments in health professions training. Acad Med. 1991;66:762–769.
- , , , , . Association of note quality and quality of care: a cross‐sectional study. BMJ Qual Saf. 2014;23(5):406–413.
© 2015 Society of Hospital Medicine
Hospital Deaths Among HIV Patients
Successfully treated human immunodeficiency virus (HIV)‐infected individuals in the United States currently have life expectancy and mortality rates that are similar to the general population.[1, 2, 3, 4] A large multinational study found that the excess mortality rate among HIV‐positive individuals decreased from 40.8 to 6.1 per 1000 person‐years from pre‐1995 to 2006.1 This is largely due to improved access to comprehensive HIV care, in particular widespread antiretroviral (ART) use. However, the proportion of deaths that are not classically considered acquired immunodeficiency syndrome (AIDS)‐related such as liver disease, cardiovascular disease, and non‐AIDS malignancy has increased,[1, 5, 6, 7] particularly among patients with higher CD4 T‐cell counts.[5, 8] Additionally, despite overall decline in mortality, there is evidence of racial and gender differences, with increased mortality risk associated with female gender and black race.[9, 10]
In the current ART era, HIV care has shifted focus from inpatient to outpatient care, with more emphasis on chronic disease management. However, hospitalization rates among HIV‐positive persons remain higher than that of the general population.[11, 12] A cross‐sectional study of HIV‐infected persons in the United States estimated a hospitalization rate of 26.6 per 100 persons in 2009,[13] compared to a rate of 11.9 for the general population during the same year.[14] Possible reasons for higher hospitalization rates include complications of aging or other chronic comorbidities, and consequences of behavioral risk factors such tobacco use and substance abuse.
Characterizing deaths among inpatient HIV‐infected individuals in the ART era is important to developing targeted interventions to further reduce mortality. Prior studies examining in‐hospital deaths of HIV‐positive patients evaluated more limited time periods,[15, 16, 17, 18] and thus did not necessarily assess the full spectrum of changes in mortality that have occurred with the introduction of ART. Furthermore, these studies described causes of death, but did not consistently identify factors associated with non‐AIDS deaths. We examined the trends in in‐hospital deaths among HIV‐infected patients from 1995 to 2011 and identified contributing factors to mortality. As the HIV population is aging, we hypothesized that HIV‐infected patients are more likely to die from nonAIDS‐related death in the late ART era due to factors related to cardiovascular and liver disease, compared to the early ART era.
METHODS
The study was performed at YaleNew Haven Hospital, an urban tertiary care academic teaching hospital with 1008 beds and the state of Connecticut's largest ambulatory HIV clinic. Connecticut ranks seventh nationally (10/100,000) in HIV prevalence; New Haven is second among Connecticut cities in the number of people living with HIV/AIDS.[19] We reviewed all patients with an International Classification of Diseases, Ninth Revision (ICD‐9) code of HIV or AIDS (ICD‐9 codes V08 and 042) who died during hospitalization between January 1, 1995 to December 31, 2011. The Yale Human Investigation Committee granted ethical approval to conduct the study.
A standardized data collection tool was used to abstract demographic characteristics (ie, age, gender, and race), medical comorbidities (ie, diabetes, chronic kidney disease, chronic hepatitis B or C, liver cirrhosis, hypertension, coronary artery disease, congestive heart failure, chronic obstructive lung disease, alcohol and substance abuse), ART use (yes or no), HIV viral load (VL), CD4 cell count, and causes of death. Comorbidities were defined using the Coding of Death in HIV Project protocol, a multinational endeavor to standardize data collection in studies of HIV‐positive patients.[20] Chronic kidney disease included individuals with National Kidney Foundation stage I to V disease. Chronic hepatitis B or C infection was identified in patients who had serologic testing indicative of prior infection. Alcohol and substance abuse were identified when source documents mentioned any history of current alcohol or illicit drug abuse or dependence. ART use was defined as documentation of ART on admission or prescription during hospitalization. This included individuals who were on 2 or more ART agents. The last HIV VL and CD4 cell count available within 1 year and closest to death were recorded. HIV VL suppression was defined as <400 copies/mL.
Two clinicians independently classified the cause of death as AIDS related or non‐AIDS related in accordance with published definitions.[21, 22] Cause of death was determined by review of the medical record, discharge diagnosis, and autopsy report when available. Official death certificates were not available for review. There was discordance in assigning 23 of the 400 causes of death. In these cases, the medical record was reviewed and determined by consensus between the 2 clinicians.
AIDS‐related deaths were categorized as nonspecified AIDS, AIDS infection, and AIDS malignancy. AIDS‐related deaths were defined as those caused by conditions meeting the Centers for Disease Control and Prevention AIDS case definition.[22] Non‐specified AIDS deaths were those occurring in patients with a CD4 count 50 cells/mm3 or with an AIDS‐defining illness, who died from a condition that was not clearly AIDS related. This included septic shock of unclear etiology, first known episode of pneumonia, a gastrointestinal bleed of unclear etiology, and altered mental status of unclear etiology when cerebrospinal fluid analysis or imaging of the brain was not available.
Non‐AIDS deaths included non‐AIDS infection in patients with a CD4 count >50 cells/mm3, cardiovascular disease, liver disease, non‐AIDS malignancy, and renal disease (Table 1). Deaths classified as other incorporated the deaths that did not fall into these categories. Chronic obstructive pulmonary disease (COPD) exacerbation and status asthmaticus were included in this category, because there was only 1 death from each of these causes.
| |
| Non‐AIDS infection | Infectious etiology not on the list of AIDS‐defining conditions, such as Clostridium difficile colitis, endocarditis, bacteremia, nonrecurrent bacterial pneumonia, or septic shock of unclear cause without a CD4 count of less than 50 cells/mm3 or a documented opportunistic infection |
| Cardiovascular disease | Cardiac arrest without clear cause, ischemic or hemorrhagic stroke, congestive heart failure (respiratory failure most likely due to pulmonary edema in the setting of known systolic or diastolic heart failure), myocardial infarction, and cardiac arrhythmia |
| Liver disease | Complications of cirrhosis such as variceal bleed, hepatic encephalopathy, hepatorenal syndrome, and acute liver failure |
| Renal disease | Complications of acute renal failure such as hyperkalemia leading to cardiac arrest. Complications of end‐stage renal disease such as stopping hemodialysis or calciphylaxis |
| Non‐AIDS malignancy | Malignancies not on the AIDS indicator diagnostic list |
| Other causes | Drug overdose, trauma, suicide, Stevens‐Johnson syndrome, macrophage activation syndrome, hemorrhagic pancreatitis, status asthmaticus, COPD exacerbation, status epilepticus of unclear cause, complications of idiopathic thrombocytopenic purpura, and diabetic ketoacidosis |
The early ART era was defined as 1995 to 2001 and the late ART era from 2002 to 2011. During the early period, combination ART was introduced and significantly impacted overall mortality.[23, 24] The late ART era better reflected current in‐hospital deaths and was compared to the early era to evaluate trends over time.[15, 25]
2 analysis and parametric (t test and analysis of variance) methods compared categorical and continuous variables, respectively. Bivariate analysis was used to determine associations with AIDS versus non‐AIDS deaths in the entire study cohort. Multivariable logistic regression was used to identify correlates of non‐AIDS deaths in the (1) complete 17‐year period and (2) late ART era. For all analyses, a P value <0.05 was considered statistically significant. All statistical analysis was performed using SAS 9.3 (SAS Institute, Cary, NC).
RESULTS
Among 12,183 hospital discharges of HIV‐infected patients from 1995 to 2011, 406 (3.3%) died. Six medical records were missing or incomplete; 400 were available for review. The proportion of hospitalized HIV‐infected patients who died declined from 6.2% in 1995 to 1.5% in 2011 (P<0.0001).
Table 2 summarizes all 400 patients' demographic and clinical characteristics, and cause of death. The majority were male (65.5%), nonwhite (73.3%), and taking ART (65.9%), though only one‐third achieved a VL <400 copies/mL on the most recent measurement available in the year prior to death. The majority (56.3%) died due to nonAIDS‐related causes.
| Total, n=400 | Early Era, n=207 | Late Era, n=193 | P Value | |
|---|---|---|---|---|
| ||||
| Median age, y (IQR) | 45 (3852) | 41 (3547) | 49 (4357) | <0.0001 |
| Male gender, no. (%) | 262 (65.5) | 141 (68.1) | 121 (62.7) | 0.25 |
| Race, no. (%) | ||||
| Black | 238 (59.5) | 124 (59.9) | 114 (59.1) | 0.87 |
| White | 105 (26.3) | 55 (26.6) | 50 (25.9) | 0.88 |
| Hispanic | 55 (13.8) | 27 (13.0) | 28 (14.5) | 0.67 |
| Median CD4 cells/mm3 (IQR)a | 90 (12248) | 50 (10150) | 153 (22399) | <0.0001 |
| HIV VL 400 copies/mL, no. (%)b | 77 (31.3) | 12 (13.3) | 65 (41.7) | <0.0001 |
| On ART, no. (%) | 257 (65.9) | 120 (58.3) | 137 (74.5) | 0.0008 |
| Cause of death, no. (%) | ||||
| AIDS‐related, no. (%) | 175 (43.8) | 118 (57.0) | 57 (29.5) | <0.0001 |
| AIDS infection | 85 (21.3) | 58 (28.0) | 27 (14.0) | 0.82 |
| Nonspecified AIDS | 73 (18.3) | 46 (22.2) | 27 (14.0) | 0.99 |
| AIDS malignancy | 17 (4.3) | 14 (6.8) | 3 (1.6) | 0.17 |
| Non‐AIDS‐related, no. (%) | 225 (56.3) | 89 (43.0) | 136 (70.5) | <0.0001 |
| Non‐AIDS infection | 81 (20.3) | 32 (15.5) | 49 (25.4) | 0.99 |
| Cardiovascular | 45 (11.3) | 16 (7.7) | 29 (15.0) | 0.54 |
| Liver related | 34 (8.5) | 18 (8.7) | 16 (8.3) | 0.08 |
| Malignancy | 31 (7.8) | 6 (2.9) | 25 (13.0) | 0.01 |
| Renal failure | 18 (4.5) | 8 (3.9) | 10 (5.2) | 0.66 |
| Other, no. (%) | 16 (4.1) | 9 (4.5) | 7 (3.6) | 0.16 |
Among all AIDS‐related deaths from 1995 to 2011 (Table 2), AIDS‐defining infection was the most common cause (21.3%), followed by nonspecified AIDS (18.3%), and AIDS malignancy (4.3%). The proportion of nonAIDS‐related deaths increased significantly over time (Figure 1). The most common cause of nonAIDS‐related deaths was non‐AIDS infection (20.3%), followed by cardiovascular disease (11.3%), liver disease (8.5%), malignancy (7.8%), and renal failure (4.5%). The most common non‐AIDS infection was sepsis in 43 patients (60.6%), followed by nonrecurrent bacterial pneumonia in 24 patients (33.8%) and Clostridium difficile infection in 4 patients (5.6%). NonAIDS‐related malignancy was the only category to significantly increase from the early ART to late ART era (P=0.01).

Compared to those dying of AIDS‐related causes over the 17‐year period (Table 3), patients dying of nonAIDS‐related causes were older (P<0.0001), less likely to have a CD4 count 200 cells/mm3 (P<0.0001), and more likely to be on ART and virologically suppressed (P<0.0001). Patients who died from nonAIDS‐related causes were also more likely to have diabetes mellitus (P=0.01), chronic kidney disease (P<0.0001), hepatitis C (P<0.0001), liver cirrhosis (P<0.0001), hypertension (P=0.0002), coronary artery disease (P=0.004), and COPD (P=0.04). Of note, there was no statistically significant difference in gender, race, or substance abuse between AIDS‐related and nonAIDS‐related deaths.
| AIDS, n=175 | Non‐AIDS, n=225 | P Value | |
|---|---|---|---|
| |||
| Median age, y (IQR) | 40 (3548) | 48 (4255) | <0.0001 |
| Male gender, no. (%) | 115 (43.9) | 147 (56.1) | 0.94 |
| Race, no. (%) | |||
| Black | 105 (60.3) | 133 (59.4) | 0.84 |
| White | 41 (23.6) | 64 (28.6) | 0.26 |
| Hispanic | 28 (16.1) | 27 (12.1) | 0.25 |
| On ART, no. (%) | 97 (55.8) | 160 (74.1) | 0.0001 |
| CD4 <200 cells/mm3, no. (%)a | 167 (97.1) | 95 (47.2) | <0.0001 |
| HIV VL 400 copies/mL, no. (%)b | 2 (4.1) | 75 (38.1) | <0.0001 |
| Comorbidities, no. (%) | |||
| Diabetes | 13 (7.4) | 35 (15.6) | 0.01 |
| Renal disease | |||
| CKD | 21 (12) | 73 (32.4) | <0.0001 |
| On dialysis | 9 (5.1) | 47 (20.9) | <0.0001 |
| Liver disease | |||
| Hepatitis C | 38 (21.7) | 130 (57.8) | <0.0001 |
| Cirrhosis | 14 (8) | 67 (29.8) | <0.0001 |
| Cardiovascular disease | |||
| Hypertension | 18 (10.3) | 56 (24.9) | 0.0002 |
| CAD | 2 (1.1) | 16 (7.1) | 0.004 |
| CHF | 13 (7.4) | 29 (12.9) | 0.08 |
| COPD | 5 (2.9) | 17 (7.6) | 0.04 |
| Alcohol abuse | 9 (5.1) | 18 (8.0) | 0.26 |
| Polysubstance abuse | 10 (5.7) | 22 (9.8) | 0.14 |
Associations With Non‐AIDS Deaths
Among all clinical factors associated with non‐AIDS deaths (Table 4), only the last CD4 within the year prior to death >200 cells/mm3, VL 400 copies/mL in the year prior to death, and liver and cardiovascular comorbidities were independently associated with non‐AIDS deaths. The last CD4 count >200 cells/mm3 in the year prior to death was the strongest correlate (odds ratio [OR]: 16.5; 95% CI: 5.351.4) of non‐AIDS deaths, whereas gender and race were not significant.
| Overall (19952011) | Early Era (19952001) | Late Era (20022011) | ||||
|---|---|---|---|---|---|---|
| Deaths | 400 | 207 | 193 | |||
| Non‐AIDS | 225 | 89 | 136 | |||
| AIDS | 175 | 118 | 57 | |||
| Odds Ratio (95% CI)a | Adjusted Odds Ratio (95% CI)b | Odds Ratio (95% CI)a | Adjusted Odds Ratiob (95% CI) | Odds Ratio (95% CI)a | Adjusted Odds Ratio (95% CI)b | |
| ||||||
| Clinical factors | ||||||
| Age (per year) | 1.06 (1.04‐1.08) | c | 1.03 (1.01‐1.06) | c | 1.07 (1.03‐1.1) | c |
| Male gender | 0.98 (0.6‐1.5) | c | 1.04 (0.6‐1.9) | c | 1.1 (0.6‐2.0) | c |
| White race (vs nonwhite) | 0.8 (0.5‐1.2) | c | 1.2 (0.6‐2.2) | c | 0.4 (0.2‐0.8) | c |
| CD4 >200 cells/mm3d | 37.6 (14.895.5) | 16.5 (5.351.4) | 24.4 (7.183.2) | 17.4 (3.488.3) | 45.4 (10.5195.5) | 25.9 (5.0134.5) |
| HIV VL 400 copies/mL‖ | 13.6 (5.235.3) | 7.5 (2.324.4) | 9.4 (1.276.6) | c | 15.6 (5.246.4) | 10.9 (2.448.8) |
| On ART | 2.3 (1.5‐3.5) | c | 1.6 (0.9‐2.8) | c | 2.7 (1.35.3) | c |
| Comorbidities | ||||||
| Lung diseasee | 1.9 (1.013.5) | c | 2.4 (1.025.5) | c | 1.5 (0.6‐3.9) | c |
| Kidney diseasee | 3.5 (2.16.0) | c | 3.5 (1.7‐7.3) | 4.9 (1.417.8) | 3.1 (1.47.2) | c |
| Depression | 1.6 (0.8‐ 3.2) | c | 2.5 (0.9‐6.6) | c | 0.95 (0.4‐2.5) | c |
| Substance abusee | 1.9 (1.13.6) | c | 3.7 (1.59.5) | c | 0.9 (0.4‐2.1) | c |
| Diabetes | 2.3 (1.24.5) | c | 2.0 (0.7‐5.5) | c | 1.9 (0.7‐5.0) | c |
| Liver diseasee | 3.6 (2.45.4) | 4.5 (2.29.3) | 2.4 (1.4‐4.3) | 4.4 (1.512.7) | 4.3 (2.28.3) | 7.5 (2.423.4) |
| Cardiovascular diseasee | 2.9 (1.8‐4.6) | 4.2 (1.89.9) | 1.8 (0.9‐3.5) | 4.6 (2.010.3) | 6.8 (1.924.0) | |
In the early ART era (19952001), only CD4 count, renal disease, and cardiovascular disease were independently associated with non‐AIDS deaths; the last CD4 count <200 cells/mm3 in the year prior to death was associated most strongly (OR: 17.4; 95% CI: 3.488.3) with non‐AIDS death, whereas again, gender and race were not significant correlates of non‐AIDS death.
In the late ART era (20022011), similar to those for the entire 17‐year time period, independent correlates of non‐AIDS deaths included last CD4 <200 cells/mm3 in the year prior to death, VL 400 copies/mL in the last year prior to death, and liver and cardiovascular disease. Last CD4 count >200 cells/mm3 in the year prior to death (OR: 25.9; 95% CI: 5134.5) was most strongly correlated with non‐AIDS deaths in the late ART era. Nonwhite patients had a lower likelihood of nonAIDS‐related death (OR: 0.4; 95% CI: 0.2‐0.8), but this was not significant on multivariable regression analysis. Gender difference was not statistically significant.
DISCUSSION
Our study demonstrated changes in the causes of death among HIV‐infected hospitalized patients from 1995 to 2011. To our knowledge, this is the longest duration retrospective analysis of in‐hospital deaths among HIV‐infected patients during the ART era. Knowledge of the changes in comorbidities and causes of death among hospitalized HIV‐infected patients during the ART era could help inpatient providers focus diagnostic and therapeutic efforts and improve overall care. Our findings emphasize that HIV‐infected patients remain at high risk for complications from non‐AIDS infections, even when their immune system has been restored as measured by the CD4 cell count, and at increased risk of cardiovascular and liver disease, which highlights the need to carefully monitor HIV‐positive patients admitted with these conditions.
Comparison of AIDS‐related and nonAIDS‐related deaths in 2 time periods has revealed important findings. First, inpatient deaths of HIV‐infected patients have decreased dramatically (from 6.2% to 1.5%, P<0.0001), and the mortality due to nonAIDS‐related causes has increased significantly over time. Second, we defined demographic and clinical characteristics independently associated with HIV‐infected inpatient mortality. Third, a substantial proportion of in‐hospital deaths were caused by potentially preventable non‐AIDS as well as AIDS‐related diseases.
The striking decline in hospital deaths over time is likely the result of expanded ART use resulting in improved immunologic profiles. NonAIDS‐related causes were responsible for almost three‐quarters of deaths in this large inpatient HIV‐positive population during the late ART era. Similar findings have been reported from other settings in industrialized countries.[5, 7, 16, 17, 18, 26, 27] In our urban population, although cardiovascular disease, liver disease, renal failure, and malignancy were frequent causes of non‐AIDS death, the most common cause was non‐AIDS infection. Further, the proportion of deaths due to non‐AIDS infections did not decrease significantly over time.
A similar study of HIV‐positive inpatients in New York City also found that the majority of non‐AIDS deaths were due to non‐AIDS infections in the ART era.[17] The most common causes of non‐AIDS infection identified in the study were identical to ours: unspecified sepsis followed by nonrecurrent bacterial pneumonia and Clostridium difficile infection. Evidence suggests that individuals with HIV infection have multiple immunological defects that not only lead to increased susceptibility to bacterial infection but also to an unregulated inflammatory response, even in patients who are on ART and virologically suppressed.[28, 29] This highlights the need for hospital physicians to evaluate an HIV‐infected patient's risk for more routine infections that are not commonly considered AIDS related in addition to traditional opportunistic infections. It also implies that inpatient providers should carefully monitor HIV‐positive patients admitted for bacterial infections, as they remain at higher risk for the development of septic shock.
Cardiovascular and liver disease represented the next most common causes of death, which is similar to the New York City study and is consistent with other studies from the ART era.[15, 16, 17, 18] Although deaths due directly to cardiovascular and liver disease did not significantly change over time, these represented the major comorbidities associated with non‐AIDS mortality and, along with renal disease, increased significantly over the study period. There are accumulating studies indicating that HIV infection is associated with accelerated coronary artery disease due to the immune and inflammatory response to the viral replication.[30] Additionally, ART side effects such as hyperlipidemia, metabolic syndrome, and insulin resistance contribute to an increased cardiovascular risk profile.[31] Our findings emphasize the importance of assessing comorbidities not classically considered HIV related. For example, acute coronary syndrome should be in the differential diagnosis for HIV‐infected patients admitted with chest pain regardless of age. Furthermore, HIV‐infected patients are at increased risk for hepatitis B and C coinfection due to related behavioral risk, and coinfection is associated with rapid progression to liver cirrhosis[32, 33, 34] and increased risk for oncogenesis over time rapidly expanding therapeutic options will benefit patients with chronic liver disease.[35, 36, 37]
Although the numbers are relatively small, non‐AIDS malignancy deaths more than quadrupled from the early to the late ART eras. This finding likely underestimates the proportion of overall hospital deaths due to non‐AIDS malignancies given the increased use of hospice facilities and community‐based care,[38] though it is consistent with increasing trends noted in other studies.[39] Doubling of malignancy as a cause of death among AIDS patients from 2000 to 2010 was reported in a French study, as well as in a large multicohort study from 1999 to 2011, consistent with our findings.[16, 40] Developing and implementing screening guidelines for non‐AIDS malignancy among those with HIV at the primary care level may potentially reduce this upward trend.[41] Inpatient providers need to be aware of this trend and consider undiagnosed non‐AIDS malignancy as part of their differential diagnosis when evaluating HIV‐positive patients.
Although emphasis has been placed on non‐AIDS causes, nearly one‐half of all deaths for the entire period, and almost one‐third of deaths in the late ART era were still due to AIDS‐related causes. This is similar to a study of 40,000 patients in Europe and North America from 1996 to 2006, where AIDS deaths comprised almost half of all deaths,[7] as well as a French national study,[16] and remains characteristic of resource‐limited settings.[42] This indicates the need for continued vigilance toward earlier HIV case detection and retention in care to prevent disease progression and AIDS‐related mortality. Primary care and hospital physicians should assess risk for HIV infection in all patients and institute universal HIV testing in both the inpatient and outpatient settings.
Although the majority of our sample was nonwhite and male, there was sufficient demographic diversity to determine that race and gender differences were not statistically significant contributors to mortality. In contrast, hospital‐based and population‐based studies reporting racial and gender disparities in HIV‐associated mortality have attributed this to poor access to health care.[9, 17, 43, 44, 45, 46] Compared to the New York City study, patients in our study had comparable median age and CD4 cell count, but also had greater ART use and better virologic control.[17] We speculate that in our smaller urban area, characterized by strong community and clinical HIV programs, patients may have had improved access to care without regard to race and gender.
Our study strengths include a large sample size, a diverse population with a relatively high proportion of women, and varied age and race, as well as data acquired in a standardized fashion over a prolonged period of ART availability. Further, 2 clinicians classified causes of death independently, utilizing validated definitions to minimize bias. Our late ART era evaluation is consistent with other HIV cohort studies,[25] though we utilized multivariate analysis to uncover independent correlates of mortality, a feature not employed in other studies.[16, 17]
We also recognize several limitations in our study. Our study design was associated with the recognized limitations of retrospective research, including missing data. We examined in‐hospital deaths at a single urban hospital in the Northeastern United States only, affecting the generalizability of our findings. The study did not include a control group of hospitalized HIV‐infected patients who survived or hospitalized HIV‐negative patients who died, which might have further strengthened our findings. Despite these limitations, this study provides important observations that can inform strategies to impact HIV‐associated mortality in the inpatient setting.
In conclusion, the mortality profile of hospitalized HIV‐infected patients has evolved with the epidemic. Caring for the hospitalized HIV‐infected patient has become increasingly complex because patients are more likely to suffer from multiple comorbidities, especially cardiovascular and liver diseases, and to die from non‐AIDS causes. Inpatient providers need to understand the changing trends in chronic HIV disease management as patients are living longer with antiretroviral therapy and are increasingly likely to succumb to nonAIDS‐related causes of death. Clinicians can no longer remain focused on AIDS‐defining opportunistic infections and need to recognize the emerging importance of chronic comorbidities when developing a differential diagnosis, and the higher risk of death due to non‐AIDS infectious causes. Physicians caring for hospitalized patients should appreciate the current trends in the HIV epidemic to provide comprehensive and appropriate interventions that can reduce mortality for HIV‐infected inpatients.
Disclosures: This research was supported by the National Institute of Allergy and Infectious Diseases (S.S.; 1K23AI089260). The authors report no conflicts of interest.
- , , , et al. Changes in the risk of death after HIV seroconversion compared with mortality in the general population. JAMA. 2008;300:51–59.
- , , . Improvement in the health of HIV‐infected persons in care: reducing disparities. Clin Infect Dis. 2012;55:1242–1251.
- , , , et al. Mortality in well controlled HIV in the continuous antiretroviral therapy arms of the SMART and ESPRIT trials compared with the general population. AIDS. 2013;27:973–979.
- , , , et al. Mortality of HIV‐infected patients starting potent antiretroviral therapy: comparison with the general population in nine industrialized countries. Int J Epidemiol. 2009;38:1624–1633.
- , , , et al. Mortality in the highly active antiretroviral therapy era: changing causes of death and disease in the HIV outpatient study. J Acquir Immune Defic Syndr. 2006;43:27–34.
- , , , et al. Risk, predictors, and mortality associated with non‐AIDS events in newly diagnosed HIV‐infected patients: role of antiretroviral therapy. AIDS. 2013;27:181–189.
- Antiretroviral Therapy Cohort Collaboration. Causes of death in HIV‐1‐infected patients treated with antiretroviral therapy, 1996–2006: collaborative analysis of 13 HIV cohort studies. Clin Infect Dis. 2010;50:1387–1396.
- , , , et al. Risk of all‐cause mortality associated with nonfatal AIDS and serious non‐AIDS events among adults infected with HIV. AIDS. 2010;24:697–706.
- , , , et al. Race and sex differences in antiretroviral therapy use and mortality among HIV‐infected persons in care. J Infect Dis. 2009;199:991–998.
- , , , . The influence of sex, race/ethnicity, and educational attainment on human immunodeficiency virus death rates among adults, 1993–2007. Arch Intern Med. 2012;172:1591–1598.
- , , , et al. Rates of hospitalizations and associated diagnoses in a large multisite cohort of HIV patients in the United States, 1994–2005. AIDS. 2008;22:1345–1354.
- , , , et al. Trends and causes of hospitalizations among HIV‐infected persons during the late HAART era: what is the impact of CD4 counts and HAART use? J Acquir Immune Defic Syndr. 2010;54:248–257.
- , . Hospitalization rates of people living with HIV in the United States, 2009. Public Health Rep. 2014;129:178–186.
- Agency for Healthcare Research and Quality. 2009 National Healthcare Quality Report. Available at: http://archive.ahrq.gov/research/findings/nhqrdr/nhqr09. Accessed May 8, 2015.
- , , , et al. Comparisons of causes of death and mortality rates among HIV‐infected persons: analysis of the pre‐, early, and late HAART (Highly Active Antiretroviral Therapy) Eras. J Acquir Immune Defic Syndr. 2006;41:194–200.
- , , , et al. Causes of death among HIV‐infected patients in France in 2010 (national survey): trends since 2000. AIDS. 2014;28:1181–1191.
- , , , , , . All‐cause mortality in hospitalized HIV‐infected patients at an acute tertiary care hospital with a comprehensive outpatient HIV care program in New York City in the era of highly active antiretroviral therapy (HAART). Infection. 2013;41:545–551.
- , , , . Causes of death among persons with AIDS in the era of highly active antiretroviral therapy: New York City. Ann Intern Med. 2006;145:397–406.
- Connecticut Department of Public Health. TB, HIV, STD 12:109–117.
- , , , et al. 1993 revised classification system for HIV infection and expanded surveillance case definition for AIDS among adolescents and adults. MMWR Recomm Rep. 1992;41:1–19.
- , , , et al. Patterns of the hazard of death after AIDS through the evolution of antiretroviral therapy: 1984–2004. AIDS. 2005;19:2009–2018.
- , , , et al. Continued improvement in survival among HIV‐infected individuals with newer forms of highly active antiretroviral therapy. AIDS. 2007;21:685–692.
- , , , et al. Predictive accuracy of the Veterans Aging Cohort Study index for mortality with HIV infection: a North American cross cohort analysis. J Acquir Immune Defic Syndr. 2013;62:149–163.
- , , , et al. Non‐AIDS‐defining deaths and immunodeficiency in the era of combination antiretroviral therapy. AIDS. 2009;23:1743–1753.
- , , , et al. Causes of death in HIV‐infected patients from the Cologne‐Bonn cohort. Infection. 2014;42:135–140.
- , , , et al. Invasive pneumococcal disease in patients infected with HIV: still a threat in the era of highly active antiretroviral therapy. Clin Infect Dis. 2004;38:1623–1628.
- , , . The effect of HIV infection on the host response to bacterial sepsis. Lancet Infect Dis. 2015;15:95–108.
- , , , et al. HIV infection and the risk of acute myocardial infarction. JAMA Intern Med. 2013;173:614–622.
- . Epidemiology of coronary heart disease in patients with human immunodeficiency virus. Rev Cardiovasc Med. 2014;15(suppl 1):S1–S8.
- , . Impact of human immunodeficiency virus infection on the prevalence and severity of steatosis in patients with chronic hepatitis C virus infection. J Hepatol. 2006;44:1026–1032.
- , , , et al. Influence of human immunodeficiency virus infection on the course of hepatitis C virus infection: a meta‐analysis. Clin Infect Dis. 2001;33:562–569.
- , . Coinfection with HIV‐1 and HCV–a one‐two punch. Gastroenterology. 2009;137:795–814.
- , , , et al. Hepatocellular carcinoma in HIV‐infected patients: epidemiological features, clinical presentation and outcome. AIDS. 2004;18:2285–2293.
- , , , et al. Presentation and outcome of hepatocellular carcinoma in HIV‐infected patients: a U.S.‐Canadian multicenter study. J Hepatol. 2007;47:527–537.
- , , , et al. Ledipasvir and sofosbuvir for 8 or 12 weeks for chronic HCV without cirrhosis. N Engl J Med. 2014;370:1879–1888.
- , , , et al. HIV as a chronic disease: implications for long‐term care at an AIDS‐dedicated skilled nursing facility. J Urban Health. 2000;77:187–203.
- , , , , , . Causes of death in HIV patients and the evolution of an AIDS hospice: 1988–2008. AIDS Res Treat. 2012;2012:390406.
- , , , et al. Trends in underlying causes of death in people with HIV from 1999 to 2011 (D:A:D): a multicohort collaboration. Lancet. 2014;384:241–248.
- , . Screening guidelines for non‐AIDS defining cancers in HIV‐infected individuals. Curr Opin Oncol. 2013;25:518–525.
- , , , et al. Disease patterns and causes of death of hospitalized HIV‐positive adults in West Africa: a multicountry survey in the antiretroviral treatment era. J Int AIDS Soc. 2014;17:18797.
- , , , . Recent trends in hospital utilization and mortality for HIV infection: 2000–2005. J Natl Med Assoc. 2010;102:1131–1138.
- , . Differences in HIV‐related hospitalization among white, black, and Hispanic men and women of Florida. Women Health. 2008;47:1–18.
- , , , . Effect of race and/or ethnicity in use of antiretrovirals and prophylaxis for opportunistic infection: a review of the literature. Public Health Rep. 2002;117:233–251; discussion 1–2.
- . HIV/AIDS in women and racial/ethnic minorities in the U.S. Curr Infect Dis Rep. 2012;14:53–60.
- , , , . Management of human immunodeficiency virus infection in advanced age. JAMA. 2013;309:1397–1405.
Successfully treated human immunodeficiency virus (HIV)‐infected individuals in the United States currently have life expectancy and mortality rates that are similar to the general population.[1, 2, 3, 4] A large multinational study found that the excess mortality rate among HIV‐positive individuals decreased from 40.8 to 6.1 per 1000 person‐years from pre‐1995 to 2006.1 This is largely due to improved access to comprehensive HIV care, in particular widespread antiretroviral (ART) use. However, the proportion of deaths that are not classically considered acquired immunodeficiency syndrome (AIDS)‐related such as liver disease, cardiovascular disease, and non‐AIDS malignancy has increased,[1, 5, 6, 7] particularly among patients with higher CD4 T‐cell counts.[5, 8] Additionally, despite overall decline in mortality, there is evidence of racial and gender differences, with increased mortality risk associated with female gender and black race.[9, 10]
In the current ART era, HIV care has shifted focus from inpatient to outpatient care, with more emphasis on chronic disease management. However, hospitalization rates among HIV‐positive persons remain higher than that of the general population.[11, 12] A cross‐sectional study of HIV‐infected persons in the United States estimated a hospitalization rate of 26.6 per 100 persons in 2009,[13] compared to a rate of 11.9 for the general population during the same year.[14] Possible reasons for higher hospitalization rates include complications of aging or other chronic comorbidities, and consequences of behavioral risk factors such tobacco use and substance abuse.
Characterizing deaths among inpatient HIV‐infected individuals in the ART era is important to developing targeted interventions to further reduce mortality. Prior studies examining in‐hospital deaths of HIV‐positive patients evaluated more limited time periods,[15, 16, 17, 18] and thus did not necessarily assess the full spectrum of changes in mortality that have occurred with the introduction of ART. Furthermore, these studies described causes of death, but did not consistently identify factors associated with non‐AIDS deaths. We examined the trends in in‐hospital deaths among HIV‐infected patients from 1995 to 2011 and identified contributing factors to mortality. As the HIV population is aging, we hypothesized that HIV‐infected patients are more likely to die from nonAIDS‐related death in the late ART era due to factors related to cardiovascular and liver disease, compared to the early ART era.
METHODS
The study was performed at YaleNew Haven Hospital, an urban tertiary care academic teaching hospital with 1008 beds and the state of Connecticut's largest ambulatory HIV clinic. Connecticut ranks seventh nationally (10/100,000) in HIV prevalence; New Haven is second among Connecticut cities in the number of people living with HIV/AIDS.[19] We reviewed all patients with an International Classification of Diseases, Ninth Revision (ICD‐9) code of HIV or AIDS (ICD‐9 codes V08 and 042) who died during hospitalization between January 1, 1995 to December 31, 2011. The Yale Human Investigation Committee granted ethical approval to conduct the study.
A standardized data collection tool was used to abstract demographic characteristics (ie, age, gender, and race), medical comorbidities (ie, diabetes, chronic kidney disease, chronic hepatitis B or C, liver cirrhosis, hypertension, coronary artery disease, congestive heart failure, chronic obstructive lung disease, alcohol and substance abuse), ART use (yes or no), HIV viral load (VL), CD4 cell count, and causes of death. Comorbidities were defined using the Coding of Death in HIV Project protocol, a multinational endeavor to standardize data collection in studies of HIV‐positive patients.[20] Chronic kidney disease included individuals with National Kidney Foundation stage I to V disease. Chronic hepatitis B or C infection was identified in patients who had serologic testing indicative of prior infection. Alcohol and substance abuse were identified when source documents mentioned any history of current alcohol or illicit drug abuse or dependence. ART use was defined as documentation of ART on admission or prescription during hospitalization. This included individuals who were on 2 or more ART agents. The last HIV VL and CD4 cell count available within 1 year and closest to death were recorded. HIV VL suppression was defined as <400 copies/mL.
Two clinicians independently classified the cause of death as AIDS related or non‐AIDS related in accordance with published definitions.[21, 22] Cause of death was determined by review of the medical record, discharge diagnosis, and autopsy report when available. Official death certificates were not available for review. There was discordance in assigning 23 of the 400 causes of death. In these cases, the medical record was reviewed and determined by consensus between the 2 clinicians.
AIDS‐related deaths were categorized as nonspecified AIDS, AIDS infection, and AIDS malignancy. AIDS‐related deaths were defined as those caused by conditions meeting the Centers for Disease Control and Prevention AIDS case definition.[22] Non‐specified AIDS deaths were those occurring in patients with a CD4 count 50 cells/mm3 or with an AIDS‐defining illness, who died from a condition that was not clearly AIDS related. This included septic shock of unclear etiology, first known episode of pneumonia, a gastrointestinal bleed of unclear etiology, and altered mental status of unclear etiology when cerebrospinal fluid analysis or imaging of the brain was not available.
Non‐AIDS deaths included non‐AIDS infection in patients with a CD4 count >50 cells/mm3, cardiovascular disease, liver disease, non‐AIDS malignancy, and renal disease (Table 1). Deaths classified as other incorporated the deaths that did not fall into these categories. Chronic obstructive pulmonary disease (COPD) exacerbation and status asthmaticus were included in this category, because there was only 1 death from each of these causes.
| |
| Non‐AIDS infection | Infectious etiology not on the list of AIDS‐defining conditions, such as Clostridium difficile colitis, endocarditis, bacteremia, nonrecurrent bacterial pneumonia, or septic shock of unclear cause without a CD4 count of less than 50 cells/mm3 or a documented opportunistic infection |
| Cardiovascular disease | Cardiac arrest without clear cause, ischemic or hemorrhagic stroke, congestive heart failure (respiratory failure most likely due to pulmonary edema in the setting of known systolic or diastolic heart failure), myocardial infarction, and cardiac arrhythmia |
| Liver disease | Complications of cirrhosis such as variceal bleed, hepatic encephalopathy, hepatorenal syndrome, and acute liver failure |
| Renal disease | Complications of acute renal failure such as hyperkalemia leading to cardiac arrest. Complications of end‐stage renal disease such as stopping hemodialysis or calciphylaxis |
| Non‐AIDS malignancy | Malignancies not on the AIDS indicator diagnostic list |
| Other causes | Drug overdose, trauma, suicide, Stevens‐Johnson syndrome, macrophage activation syndrome, hemorrhagic pancreatitis, status asthmaticus, COPD exacerbation, status epilepticus of unclear cause, complications of idiopathic thrombocytopenic purpura, and diabetic ketoacidosis |
The early ART era was defined as 1995 to 2001 and the late ART era from 2002 to 2011. During the early period, combination ART was introduced and significantly impacted overall mortality.[23, 24] The late ART era better reflected current in‐hospital deaths and was compared to the early era to evaluate trends over time.[15, 25]
2 analysis and parametric (t test and analysis of variance) methods compared categorical and continuous variables, respectively. Bivariate analysis was used to determine associations with AIDS versus non‐AIDS deaths in the entire study cohort. Multivariable logistic regression was used to identify correlates of non‐AIDS deaths in the (1) complete 17‐year period and (2) late ART era. For all analyses, a P value <0.05 was considered statistically significant. All statistical analysis was performed using SAS 9.3 (SAS Institute, Cary, NC).
RESULTS
Among 12,183 hospital discharges of HIV‐infected patients from 1995 to 2011, 406 (3.3%) died. Six medical records were missing or incomplete; 400 were available for review. The proportion of hospitalized HIV‐infected patients who died declined from 6.2% in 1995 to 1.5% in 2011 (P<0.0001).
Table 2 summarizes all 400 patients' demographic and clinical characteristics, and cause of death. The majority were male (65.5%), nonwhite (73.3%), and taking ART (65.9%), though only one‐third achieved a VL <400 copies/mL on the most recent measurement available in the year prior to death. The majority (56.3%) died due to nonAIDS‐related causes.
| Total, n=400 | Early Era, n=207 | Late Era, n=193 | P Value | |
|---|---|---|---|---|
| ||||
| Median age, y (IQR) | 45 (3852) | 41 (3547) | 49 (4357) | <0.0001 |
| Male gender, no. (%) | 262 (65.5) | 141 (68.1) | 121 (62.7) | 0.25 |
| Race, no. (%) | ||||
| Black | 238 (59.5) | 124 (59.9) | 114 (59.1) | 0.87 |
| White | 105 (26.3) | 55 (26.6) | 50 (25.9) | 0.88 |
| Hispanic | 55 (13.8) | 27 (13.0) | 28 (14.5) | 0.67 |
| Median CD4 cells/mm3 (IQR)a | 90 (12248) | 50 (10150) | 153 (22399) | <0.0001 |
| HIV VL 400 copies/mL, no. (%)b | 77 (31.3) | 12 (13.3) | 65 (41.7) | <0.0001 |
| On ART, no. (%) | 257 (65.9) | 120 (58.3) | 137 (74.5) | 0.0008 |
| Cause of death, no. (%) | ||||
| AIDS‐related, no. (%) | 175 (43.8) | 118 (57.0) | 57 (29.5) | <0.0001 |
| AIDS infection | 85 (21.3) | 58 (28.0) | 27 (14.0) | 0.82 |
| Nonspecified AIDS | 73 (18.3) | 46 (22.2) | 27 (14.0) | 0.99 |
| AIDS malignancy | 17 (4.3) | 14 (6.8) | 3 (1.6) | 0.17 |
| Non‐AIDS‐related, no. (%) | 225 (56.3) | 89 (43.0) | 136 (70.5) | <0.0001 |
| Non‐AIDS infection | 81 (20.3) | 32 (15.5) | 49 (25.4) | 0.99 |
| Cardiovascular | 45 (11.3) | 16 (7.7) | 29 (15.0) | 0.54 |
| Liver related | 34 (8.5) | 18 (8.7) | 16 (8.3) | 0.08 |
| Malignancy | 31 (7.8) | 6 (2.9) | 25 (13.0) | 0.01 |
| Renal failure | 18 (4.5) | 8 (3.9) | 10 (5.2) | 0.66 |
| Other, no. (%) | 16 (4.1) | 9 (4.5) | 7 (3.6) | 0.16 |
Among all AIDS‐related deaths from 1995 to 2011 (Table 2), AIDS‐defining infection was the most common cause (21.3%), followed by nonspecified AIDS (18.3%), and AIDS malignancy (4.3%). The proportion of nonAIDS‐related deaths increased significantly over time (Figure 1). The most common cause of nonAIDS‐related deaths was non‐AIDS infection (20.3%), followed by cardiovascular disease (11.3%), liver disease (8.5%), malignancy (7.8%), and renal failure (4.5%). The most common non‐AIDS infection was sepsis in 43 patients (60.6%), followed by nonrecurrent bacterial pneumonia in 24 patients (33.8%) and Clostridium difficile infection in 4 patients (5.6%). NonAIDS‐related malignancy was the only category to significantly increase from the early ART to late ART era (P=0.01).
Compared to those dying of AIDS‐related causes over the 17‐year period (Table 3), patients dying of nonAIDS‐related causes were older (P<0.0001), less likely to have a CD4 count 200 cells/mm3 (P<0.0001), and more likely to be on ART and virologically suppressed (P<0.0001). Patients who died from nonAIDS‐related causes were also more likely to have diabetes mellitus (P=0.01), chronic kidney disease (P<0.0001), hepatitis C (P<0.0001), liver cirrhosis (P<0.0001), hypertension (P=0.0002), coronary artery disease (P=0.004), and COPD (P=0.04). Of note, there was no statistically significant difference in gender, race, or substance abuse between AIDS‐related and nonAIDS‐related deaths.
| AIDS, n=175 | Non‐AIDS, n=225 | P Value | |
|---|---|---|---|
| |||
| Median age, y (IQR) | 40 (3548) | 48 (4255) | <0.0001 |
| Male gender, no. (%) | 115 (43.9) | 147 (56.1) | 0.94 |
| Race, no. (%) | |||
| Black | 105 (60.3) | 133 (59.4) | 0.84 |
| White | 41 (23.6) | 64 (28.6) | 0.26 |
| Hispanic | 28 (16.1) | 27 (12.1) | 0.25 |
| On ART, no. (%) | 97 (55.8) | 160 (74.1) | 0.0001 |
| CD4 <200 cells/mm3, no. (%)a | 167 (97.1) | 95 (47.2) | <0.0001 |
| HIV VL 400 copies/mL, no. (%)b | 2 (4.1) | 75 (38.1) | <0.0001 |
| Comorbidities, no. (%) | |||
| Diabetes | 13 (7.4) | 35 (15.6) | 0.01 |
| Renal disease | |||
| CKD | 21 (12) | 73 (32.4) | <0.0001 |
| On dialysis | 9 (5.1) | 47 (20.9) | <0.0001 |
| Liver disease | |||
| Hepatitis C | 38 (21.7) | 130 (57.8) | <0.0001 |
| Cirrhosis | 14 (8) | 67 (29.8) | <0.0001 |
| Cardiovascular disease | |||
| Hypertension | 18 (10.3) | 56 (24.9) | 0.0002 |
| CAD | 2 (1.1) | 16 (7.1) | 0.004 |
| CHF | 13 (7.4) | 29 (12.9) | 0.08 |
| COPD | 5 (2.9) | 17 (7.6) | 0.04 |
| Alcohol abuse | 9 (5.1) | 18 (8.0) | 0.26 |
| Polysubstance abuse | 10 (5.7) | 22 (9.8) | 0.14 |
Associations With Non‐AIDS Deaths
Among all clinical factors associated with non‐AIDS deaths (Table 4), only the last CD4 within the year prior to death >200 cells/mm3, VL 400 copies/mL in the year prior to death, and liver and cardiovascular comorbidities were independently associated with non‐AIDS deaths. The last CD4 count >200 cells/mm3 in the year prior to death was the strongest correlate (odds ratio [OR]: 16.5; 95% CI: 5.351.4) of non‐AIDS deaths, whereas gender and race were not significant.
| Overall (19952011) | Early Era (19952001) | Late Era (20022011) | ||||
|---|---|---|---|---|---|---|
| Deaths | 400 | 207 | 193 | |||
| Non‐AIDS | 225 | 89 | 136 | |||
| AIDS | 175 | 118 | 57 | |||
| Odds Ratio (95% CI)a | Adjusted Odds Ratio (95% CI)b | Odds Ratio (95% CI)a | Adjusted Odds Ratiob (95% CI) | Odds Ratio (95% CI)a | Adjusted Odds Ratio (95% CI)b | |
| ||||||
| Clinical factors | ||||||
| Age (per year) | 1.06 (1.04‐1.08) | c | 1.03 (1.01‐1.06) | c | 1.07 (1.03‐1.1) | c |
| Male gender | 0.98 (0.6‐1.5) | c | 1.04 (0.6‐1.9) | c | 1.1 (0.6‐2.0) | c |
| White race (vs nonwhite) | 0.8 (0.5‐1.2) | c | 1.2 (0.6‐2.2) | c | 0.4 (0.2‐0.8) | c |
| CD4 >200 cells/mm3d | 37.6 (14.895.5) | 16.5 (5.351.4) | 24.4 (7.183.2) | 17.4 (3.488.3) | 45.4 (10.5195.5) | 25.9 (5.0134.5) |
| HIV VL 400 copies/mL‖ | 13.6 (5.235.3) | 7.5 (2.324.4) | 9.4 (1.276.6) | c | 15.6 (5.246.4) | 10.9 (2.448.8) |
| On ART | 2.3 (1.5‐3.5) | c | 1.6 (0.9‐2.8) | c | 2.7 (1.35.3) | c |
| Comorbidities | ||||||
| Lung diseasee | 1.9 (1.013.5) | c | 2.4 (1.025.5) | c | 1.5 (0.6‐3.9) | c |
| Kidney diseasee | 3.5 (2.16.0) | c | 3.5 (1.7‐7.3) | 4.9 (1.417.8) | 3.1 (1.47.2) | c |
| Depression | 1.6 (0.8‐ 3.2) | c | 2.5 (0.9‐6.6) | c | 0.95 (0.4‐2.5) | c |
| Substance abusee | 1.9 (1.13.6) | c | 3.7 (1.59.5) | c | 0.9 (0.4‐2.1) | c |
| Diabetes | 2.3 (1.24.5) | c | 2.0 (0.7‐5.5) | c | 1.9 (0.7‐5.0) | c |
| Liver diseasee | 3.6 (2.45.4) | 4.5 (2.29.3) | 2.4 (1.4‐4.3) | 4.4 (1.512.7) | 4.3 (2.28.3) | 7.5 (2.423.4) |
| Cardiovascular diseasee | 2.9 (1.8‐4.6) | 4.2 (1.89.9) | 1.8 (0.9‐3.5) | 4.6 (2.010.3) | 6.8 (1.924.0) | |
In the early ART era (19952001), only CD4 count, renal disease, and cardiovascular disease were independently associated with non‐AIDS deaths; the last CD4 count <200 cells/mm3 in the year prior to death was associated most strongly (OR: 17.4; 95% CI: 3.488.3) with non‐AIDS death, whereas again, gender and race were not significant correlates of non‐AIDS death.
In the late ART era (20022011), similar to those for the entire 17‐year time period, independent correlates of non‐AIDS deaths included last CD4 <200 cells/mm3 in the year prior to death, VL 400 copies/mL in the last year prior to death, and liver and cardiovascular disease. Last CD4 count >200 cells/mm3 in the year prior to death (OR: 25.9; 95% CI: 5134.5) was most strongly correlated with non‐AIDS deaths in the late ART era. Nonwhite patients had a lower likelihood of nonAIDS‐related death (OR: 0.4; 95% CI: 0.2‐0.8), but this was not significant on multivariable regression analysis. Gender difference was not statistically significant.
DISCUSSION
Our study demonstrated changes in the causes of death among HIV‐infected hospitalized patients from 1995 to 2011. To our knowledge, this is the longest duration retrospective analysis of in‐hospital deaths among HIV‐infected patients during the ART era. Knowledge of the changes in comorbidities and causes of death among hospitalized HIV‐infected patients during the ART era could help inpatient providers focus diagnostic and therapeutic efforts and improve overall care. Our findings emphasize that HIV‐infected patients remain at high risk for complications from non‐AIDS infections, even when their immune system has been restored as measured by the CD4 cell count, and at increased risk of cardiovascular and liver disease, which highlights the need to carefully monitor HIV‐positive patients admitted with these conditions.
Comparison of AIDS‐related and nonAIDS‐related deaths in 2 time periods has revealed important findings. First, inpatient deaths of HIV‐infected patients have decreased dramatically (from 6.2% to 1.5%, P<0.0001), and the mortality due to nonAIDS‐related causes has increased significantly over time. Second, we defined demographic and clinical characteristics independently associated with HIV‐infected inpatient mortality. Third, a substantial proportion of in‐hospital deaths were caused by potentially preventable non‐AIDS as well as AIDS‐related diseases.
The striking decline in hospital deaths over time is likely the result of expanded ART use resulting in improved immunologic profiles. NonAIDS‐related causes were responsible for almost three‐quarters of deaths in this large inpatient HIV‐positive population during the late ART era. Similar findings have been reported from other settings in industrialized countries.[5, 7, 16, 17, 18, 26, 27] In our urban population, although cardiovascular disease, liver disease, renal failure, and malignancy were frequent causes of non‐AIDS death, the most common cause was non‐AIDS infection. Further, the proportion of deaths due to non‐AIDS infections did not decrease significantly over time.
A similar study of HIV‐positive inpatients in New York City also found that the majority of non‐AIDS deaths were due to non‐AIDS infections in the ART era.[17] The most common causes of non‐AIDS infection identified in the study were identical to ours: unspecified sepsis followed by nonrecurrent bacterial pneumonia and Clostridium difficile infection. Evidence suggests that individuals with HIV infection have multiple immunological defects that not only lead to increased susceptibility to bacterial infection but also to an unregulated inflammatory response, even in patients who are on ART and virologically suppressed.[28, 29] This highlights the need for hospital physicians to evaluate an HIV‐infected patient's risk for more routine infections that are not commonly considered AIDS related in addition to traditional opportunistic infections. It also implies that inpatient providers should carefully monitor HIV‐positive patients admitted for bacterial infections, as they remain at higher risk for the development of septic shock.
Cardiovascular and liver disease represented the next most common causes of death, which is similar to the New York City study and is consistent with other studies from the ART era.[15, 16, 17, 18] Although deaths due directly to cardiovascular and liver disease did not significantly change over time, these represented the major comorbidities associated with non‐AIDS mortality and, along with renal disease, increased significantly over the study period. There are accumulating studies indicating that HIV infection is associated with accelerated coronary artery disease due to the immune and inflammatory response to the viral replication.[30] Additionally, ART side effects such as hyperlipidemia, metabolic syndrome, and insulin resistance contribute to an increased cardiovascular risk profile.[31] Our findings emphasize the importance of assessing comorbidities not classically considered HIV related. For example, acute coronary syndrome should be in the differential diagnosis for HIV‐infected patients admitted with chest pain regardless of age. Furthermore, HIV‐infected patients are at increased risk for hepatitis B and C coinfection due to related behavioral risk, and coinfection is associated with rapid progression to liver cirrhosis[32, 33, 34] and increased risk for oncogenesis over time rapidly expanding therapeutic options will benefit patients with chronic liver disease.[35, 36, 37]
Although the numbers are relatively small, non‐AIDS malignancy deaths more than quadrupled from the early to the late ART eras. This finding likely underestimates the proportion of overall hospital deaths due to non‐AIDS malignancies given the increased use of hospice facilities and community‐based care,[38] though it is consistent with increasing trends noted in other studies.[39] Doubling of malignancy as a cause of death among AIDS patients from 2000 to 2010 was reported in a French study, as well as in a large multicohort study from 1999 to 2011, consistent with our findings.[16, 40] Developing and implementing screening guidelines for non‐AIDS malignancy among those with HIV at the primary care level may potentially reduce this upward trend.[41] Inpatient providers need to be aware of this trend and consider undiagnosed non‐AIDS malignancy as part of their differential diagnosis when evaluating HIV‐positive patients.
Although emphasis has been placed on non‐AIDS causes, nearly one‐half of all deaths for the entire period, and almost one‐third of deaths in the late ART era were still due to AIDS‐related causes. This is similar to a study of 40,000 patients in Europe and North America from 1996 to 2006, where AIDS deaths comprised almost half of all deaths,[7] as well as a French national study,[16] and remains characteristic of resource‐limited settings.[42] This indicates the need for continued vigilance toward earlier HIV case detection and retention in care to prevent disease progression and AIDS‐related mortality. Primary care and hospital physicians should assess risk for HIV infection in all patients and institute universal HIV testing in both the inpatient and outpatient settings.
Although the majority of our sample was nonwhite and male, there was sufficient demographic diversity to determine that race and gender differences were not statistically significant contributors to mortality. In contrast, hospital‐based and population‐based studies reporting racial and gender disparities in HIV‐associated mortality have attributed this to poor access to health care.[9, 17, 43, 44, 45, 46] Compared to the New York City study, patients in our study had comparable median age and CD4 cell count, but also had greater ART use and better virologic control.[17] We speculate that in our smaller urban area, characterized by strong community and clinical HIV programs, patients may have had improved access to care without regard to race and gender.
Our study strengths include a large sample size, a diverse population with a relatively high proportion of women, and varied age and race, as well as data acquired in a standardized fashion over a prolonged period of ART availability. Further, 2 clinicians classified causes of death independently, utilizing validated definitions to minimize bias. Our late ART era evaluation is consistent with other HIV cohort studies,[25] though we utilized multivariate analysis to uncover independent correlates of mortality, a feature not employed in other studies.[16, 17]
We also recognize several limitations in our study. Our study design was associated with the recognized limitations of retrospective research, including missing data. We examined in‐hospital deaths at a single urban hospital in the Northeastern United States only, affecting the generalizability of our findings. The study did not include a control group of hospitalized HIV‐infected patients who survived or hospitalized HIV‐negative patients who died, which might have further strengthened our findings. Despite these limitations, this study provides important observations that can inform strategies to impact HIV‐associated mortality in the inpatient setting.
In conclusion, the mortality profile of hospitalized HIV‐infected patients has evolved with the epidemic. Caring for the hospitalized HIV‐infected patient has become increasingly complex because patients are more likely to suffer from multiple comorbidities, especially cardiovascular and liver diseases, and to die from non‐AIDS causes. Inpatient providers need to understand the changing trends in chronic HIV disease management as patients are living longer with antiretroviral therapy and are increasingly likely to succumb to nonAIDS‐related causes of death. Clinicians can no longer remain focused on AIDS‐defining opportunistic infections and need to recognize the emerging importance of chronic comorbidities when developing a differential diagnosis, and the higher risk of death due to non‐AIDS infectious causes. Physicians caring for hospitalized patients should appreciate the current trends in the HIV epidemic to provide comprehensive and appropriate interventions that can reduce mortality for HIV‐infected inpatients.
Disclosures: This research was supported by the National Institute of Allergy and Infectious Diseases (S.S.; 1K23AI089260). The authors report no conflicts of interest.
- , , , et al. Changes in the risk of death after HIV seroconversion compared with mortality in the general population. JAMA. 2008;300:51–59.
- , , . Improvement in the health of HIV‐infected persons in care: reducing disparities. Clin Infect Dis. 2012;55:1242–1251.
- , , , et al. Mortality in well controlled HIV in the continuous antiretroviral therapy arms of the SMART and ESPRIT trials compared with the general population. AIDS. 2013;27:973–979.
- , , , et al. Mortality of HIV‐infected patients starting potent antiretroviral therapy: comparison with the general population in nine industrialized countries. Int J Epidemiol. 2009;38:1624–1633.
- , , , et al. Mortality in the highly active antiretroviral therapy era: changing causes of death and disease in the HIV outpatient study. J Acquir Immune Defic Syndr. 2006;43:27–34.
- , , , et al. Risk, predictors, and mortality associated with non‐AIDS events in newly diagnosed HIV‐infected patients: role of antiretroviral therapy. AIDS. 2013;27:181–189.
- Antiretroviral Therapy Cohort Collaboration. Causes of death in HIV‐1‐infected patients treated with antiretroviral therapy, 1996–2006: collaborative analysis of 13 HIV cohort studies. Clin Infect Dis. 2010;50:1387–1396.
- , , , et al. Risk of all‐cause mortality associated with nonfatal AIDS and serious non‐AIDS events among adults infected with HIV. AIDS. 2010;24:697–706.
- , , , et al. Race and sex differences in antiretroviral therapy use and mortality among HIV‐infected persons in care. J Infect Dis. 2009;199:991–998.
- , , , . The influence of sex, race/ethnicity, and educational attainment on human immunodeficiency virus death rates among adults, 1993–2007. Arch Intern Med. 2012;172:1591–1598.
- , , , et al. Rates of hospitalizations and associated diagnoses in a large multisite cohort of HIV patients in the United States, 1994–2005. AIDS. 2008;22:1345–1354.
- , , , et al. Trends and causes of hospitalizations among HIV‐infected persons during the late HAART era: what is the impact of CD4 counts and HAART use? J Acquir Immune Defic Syndr. 2010;54:248–257.
- , . Hospitalization rates of people living with HIV in the United States, 2009. Public Health Rep. 2014;129:178–186.
- Agency for Healthcare Research and Quality. 2009 National Healthcare Quality Report. Available at: http://archive.ahrq.gov/research/findings/nhqrdr/nhqr09. Accessed May 8, 2015.
- , , , et al. Comparisons of causes of death and mortality rates among HIV‐infected persons: analysis of the pre‐, early, and late HAART (Highly Active Antiretroviral Therapy) Eras. J Acquir Immune Defic Syndr. 2006;41:194–200.
- , , , et al. Causes of death among HIV‐infected patients in France in 2010 (national survey): trends since 2000. AIDS. 2014;28:1181–1191.
- , , , , , . All‐cause mortality in hospitalized HIV‐infected patients at an acute tertiary care hospital with a comprehensive outpatient HIV care program in New York City in the era of highly active antiretroviral therapy (HAART). Infection. 2013;41:545–551.
- , , , . Causes of death among persons with AIDS in the era of highly active antiretroviral therapy: New York City. Ann Intern Med. 2006;145:397–406.
- Connecticut Department of Public Health. TB, HIV, STD 12:109–117.
- , , , et al. 1993 revised classification system for HIV infection and expanded surveillance case definition for AIDS among adolescents and adults. MMWR Recomm Rep. 1992;41:1–19.
- , , , et al. Patterns of the hazard of death after AIDS through the evolution of antiretroviral therapy: 1984–2004. AIDS. 2005;19:2009–2018.
- , , , et al. Continued improvement in survival among HIV‐infected individuals with newer forms of highly active antiretroviral therapy. AIDS. 2007;21:685–692.
- , , , et al. Predictive accuracy of the Veterans Aging Cohort Study index for mortality with HIV infection: a North American cross cohort analysis. J Acquir Immune Defic Syndr. 2013;62:149–163.
- , , , et al. Non‐AIDS‐defining deaths and immunodeficiency in the era of combination antiretroviral therapy. AIDS. 2009;23:1743–1753.
- , , , et al. Causes of death in HIV‐infected patients from the Cologne‐Bonn cohort. Infection. 2014;42:135–140.
- , , , et al. Invasive pneumococcal disease in patients infected with HIV: still a threat in the era of highly active antiretroviral therapy. Clin Infect Dis. 2004;38:1623–1628.
- , , . The effect of HIV infection on the host response to bacterial sepsis. Lancet Infect Dis. 2015;15:95–108.
- , , , et al. HIV infection and the risk of acute myocardial infarction. JAMA Intern Med. 2013;173:614–622.
- . Epidemiology of coronary heart disease in patients with human immunodeficiency virus. Rev Cardiovasc Med. 2014;15(suppl 1):S1–S8.
- , . Impact of human immunodeficiency virus infection on the prevalence and severity of steatosis in patients with chronic hepatitis C virus infection. J Hepatol. 2006;44:1026–1032.
- , , , et al. Influence of human immunodeficiency virus infection on the course of hepatitis C virus infection: a meta‐analysis. Clin Infect Dis. 2001;33:562–569.
- , . Coinfection with HIV‐1 and HCV–a one‐two punch. Gastroenterology. 2009;137:795–814.
- , , , et al. Hepatocellular carcinoma in HIV‐infected patients: epidemiological features, clinical presentation and outcome. AIDS. 2004;18:2285–2293.
- , , , et al. Presentation and outcome of hepatocellular carcinoma in HIV‐infected patients: a U.S.‐Canadian multicenter study. J Hepatol. 2007;47:527–537.
- , , , et al. Ledipasvir and sofosbuvir for 8 or 12 weeks for chronic HCV without cirrhosis. N Engl J Med. 2014;370:1879–1888.
- , , , et al. HIV as a chronic disease: implications for long‐term care at an AIDS‐dedicated skilled nursing facility. J Urban Health. 2000;77:187–203.
- , , , , , . Causes of death in HIV patients and the evolution of an AIDS hospice: 1988–2008. AIDS Res Treat. 2012;2012:390406.
- , , , et al. Trends in underlying causes of death in people with HIV from 1999 to 2011 (D:A:D): a multicohort collaboration. Lancet. 2014;384:241–248.
- , . Screening guidelines for non‐AIDS defining cancers in HIV‐infected individuals. Curr Opin Oncol. 2013;25:518–525.
- , , , et al. Disease patterns and causes of death of hospitalized HIV‐positive adults in West Africa: a multicountry survey in the antiretroviral treatment era. J Int AIDS Soc. 2014;17:18797.
- , , , . Recent trends in hospital utilization and mortality for HIV infection: 2000–2005. J Natl Med Assoc. 2010;102:1131–1138.
- , . Differences in HIV‐related hospitalization among white, black, and Hispanic men and women of Florida. Women Health. 2008;47:1–18.
- , , , . Effect of race and/or ethnicity in use of antiretrovirals and prophylaxis for opportunistic infection: a review of the literature. Public Health Rep. 2002;117:233–251; discussion 1–2.
- . HIV/AIDS in women and racial/ethnic minorities in the U.S. Curr Infect Dis Rep. 2012;14:53–60.
- , , , . Management of human immunodeficiency virus infection in advanced age. JAMA. 2013;309:1397–1405.
© 2015 Society of Hospital Medicine

Priorities and Gender Pay Gap
Hospitalists are a growing workforce numbering over 40,000 physicians, one‐third of whom are women.[1] Flexibility of work schedules and control over personal time have been the traditional selling points of the specialty.[2] Multiple studies of physician work life reveal growing physician dissatisfaction and a high prevalence of burnout.[3] To mitigate burnout risk, leaders in hospital medicine recognize the importance of creating a sustainable profession that offers both job and career satisfaction as well as work‐life balance and, importantly, fairness within the work environment.[4] Although success in some of these endeavors has been realized sporadically, sustaining work‐life balance and fairness in the specialty remains a work in progress, whereas evidence of high job attrition and pay inequities remain.[5, 6]
Pay inequity for women relative to men continues to be pervasive in medicine, including among early‐career physicians, researchers, and various specialists.[6, 7, 8, 9, 10, 11, 12, 13] The earnings gap seems to persist for physicians, even as federal efforts such as the Fair Pay Act of 2013 and the Paycheck Fairness Act of 2014 aim to end wage discrimination.[11, 14] Differences in specialty, part‐time status, and practice type do not mitigate the disparity.[8, 10, 15] Additional explanations have been proposed to explain the variability, including gender differences in negotiating skills, lack of opportunities to join networks of influence within organizations, and implicit or explicit bias and discrimination.[12, 16, 17, 18, 19, 20]
The earnings gap is also a consequence of what is commonly called the glass ceiling.[18, 19] Most agree that obstacles to fair advancement of women include absence of collaborative environments and role models who have successfully achieved work‐life balance.[17, 20, 21, 22] Somewhat surprisingly, women leaders in medicine seem to suffer greater income disparity than nonleaders; this income gap is prevalent among leaders in other elite professions as well.[7, 23] It is unknown whether women physicians' emphasis on work‐life balance, seen repeatedly in surveys, explains any of the pay disparity.[24] Little research to date has examined whether work‐life priorities of women in hospital medicine differ from men.
In this study, we sought to examine differences in job priorities between men and women hospitalists. In particular, we examine the relative prioritization of substantial pay to job satisfaction. We also examined gender differences in work patterns and earnings to explore potential sources of the persistent gender earnings gap.
METHODS
We analyzed data from the 20092010 Hospital Medicine Physician Worklife Survey, the design of which is detailed elsewhere.[4] Briefly, a 118‐item survey was administered by mail to a stratified sample of hospitalists from the Society of Hospital Medicine database and 3 large multisite hospitalist groups. A single survey item asked respondents to identify up to 4 out of 12 most important domains to their satisfaction with a hospitalist job. The domains were distilled from focus groups of nationally representative hospitalists as described previously,[4] and the survey item allowed up to one‐third of these domains to be identified as respondents' personal priorities. The list included: optimal variety of tasks, optimal workload, substantial pay, collegiality with other physicians, recognition by leaders, rewarding relationships with patients, satisfaction with nurses, optimal autonomy, control over personal time, fairness within organization, ample availability of resources to do job, and organizational climate of trust and belonging. We tabulated and ranked the frequency with which respondents selected each satisfaction domain by gender. Due to the nonstandard format of the survey item, we a priori decided to analyze only responses that were completed as instructed.
We also used demographic data including detailed work characteristics, clinical and nonclinical workload, total pretax earnings in 2009 as a hospitalist, and self‐identification as leader of their hospital medicine group. Respondent characteristics were tabulated and gender differences were tested using the t test, rank sum test, and the Fischer exact test as appropriate. We also listed the number of nonrespondents for each item. In estimating gender differences in earnings, we opted to use multiple‐imputation techniques to more conservatively account for greater variance inherent in the presence of missing data. Consistent with existing guidelines,[25] we demonstrated that item responses were not missing monotonically by visually inspecting patterns of nonresponse. We further demonstrated that data were missing at random by showing that response patterns of completed survey items did not predict whether or not a given variable response was missing using logistic regression models. We found no significant differences between respondents with complete and missing data. We verified that appropriate regression models for each variable on every other variable converged. We used Stata 13.1 (StataCorp, College Station, TX) to perform multiple imputations using chain equations (mi impute chain) to create 10 imputed tables for 7 normally distributed continuous variables using the ordinary least squares method, 3 non‐normally distributed variables using the predictive mean matching method, 2 nonordinal categorical variables using the multinomial logit method, and 1 binary variable using the logit method.[26, 27] Gender, pediatric specialty status, region of practice, and whether or not respondents prioritized substantial pay for job satisfaction were used as regular variables without missing data points.
Differences in earnings were assessed using a multivariate ordinary linear regression model applied to the imputed datasets fitted by forward selection of explanatory variables using P < 0.20 in bivariate analysis for inclusion and manual backward elimination of all statistically nonsignificant variables. We tested the significance of the women leader interaction term in the final parsimonious model. We used the usual significance threshold of P < 0.05 for inferences. Our analysis of publicly available anonymous data was exempt from IRB review.
RESULTS
Of the 816 survey respondents (response rate 25.6%), 40 either omitted the item soliciting work priorities or completed it incorrectly. Data from the remaining 776 respondents were used for the present analysis. Respondent characteristics are tabulated in Table 1. The characteristics of hospitalists by age, gender, specialty, practice model, and practice region were representative of US hospitalists from other surveys.[28]
| Women | Men | P Value | No. of Missing Responses | |
|---|---|---|---|---|
| ||||
| No. | 263 | 513 | 0 | |
| Role, n (%) | <0.01 | 0 | ||
| Frontline hospitalist | 201 (76) | 337 (66) | ||
| Hospitalist leader | 53 (24) | 176 (34) | ||
| Age, y, mean (SD) | 42 (8) | 45 (9) | <0.01 | 67 |
| Years in current job, mean (SD) | 5 (4) | 6 (5) | 0.07 | 14 |
| Specialty, n (%) | <0.01 | 0 | ||
| Internal medicine | 160 (61) | 369 (72) | ||
| Pediatrics | 56 (21) | 57 (11) | ||
| Other | 39 (15) | 47 (9) | ||
| Family medicine | 8 (3) | 40 (8) | ||
| Practice model, n (%) | 0.02 | 19 | ||
| Hospital employed | 110 (43) | 227 (46) | ||
| Multispecialty group | 44 (17) | 68 (14) | ||
| University/medical school | 47 (18) | 58 (12) | ||
| Multistate group | 27 (11) | 73 (15) | ||
| Local hospitalist group | 22 (8) | 65 (13) | ||
| Other | 7 (3) | 9 (2) | ||
| Practice region, n (%) | 0.14 | 0 | ||
| Southeast | 56 (21) | 151 (29) | ||
| Midwest | 58 (22) | 106 (21) | ||
| Northeast | 54 (21) | 96 (19) | ||
| Southwest | 44 (17) | 83 (16) | ||
| West | 51 (19) | 77 (15) | ||
| Full‐time equivalents, n (%) | <0.01 | 42 | ||
| <100% | 46 (18) | 60 (12) | ||
| 100% | 202 (81) | 402 (83) | ||
| >100% | 2 (1) | 22 (5) | ||
| Days per month doing clinical work if FTE 100%, median (IQR) | 15 (1418) | 16 (1420) | 0.12 | 11 |
| Hours per day doing clinical work, median (IQR) | 11 (912) | 11 (912) | 0.67 | 30 |
| Consecutive days doing clinical work, median (IQR) | 7 (57) | 7 (57) | 0.94 | 17 |
| Percentage of work at night, median (IQR) | 15 (530) | 15 (525) | 0.45 | 16 |
| Percentage of night work in hospital if working nights, median (IQR) | 100 (5100) | 100 (10100) | 0.12 | 8 |
| Hours per month doing nonclinical work, median (IQR) | 12 (540) | 15 (540) | 0.77 | 26 |
| Estimated daily billable encounters, mean (IQR) | 14 (1116) | 15 (1218) | 0.01 | 54 |
| Total earnings in fiscal year 2009, median US$1,000 (IQR) | 185 (150210) | 202 (180240) | <0.01 | 56 |
| Marriage/domestic partnership status, n (%) | 0.15 | 43 | ||
| Married/currently in DP | 197 (80) | 421 (86) | ||
| Never married/never in DP | 26 (11) | 42 (9) | ||
| Divorced or separated | 18 (7) | 20 (4) | ||
| Other | 4 (2) | 5 (1) | ||
| Dependent children under 7 years old living in home, n (%) | 0.22 | 42 | ||
| 0 | 136 (55) | 265 (54) | ||
| 1 | 47 (19) | 92 (19) | ||
| 2 | 52 (21) | 87 (18) | ||
| 3 | 12 (5) | 43 (9) | ||
Several gender differences were seen in the characteristics of hospitalists and their work (Table 1). Women compared to men hospitalists were less likely to be leaders, more likely to be pediatricians, work in university settings, and practice in Western states. Women compared to men, on average, were younger by 3 years, worked fewer full‐time equivalents (FTEs), worked a greater percentage of nights, and reported fewer billable encounters per shift. They were also more likely to be divorced or separated.
Job satisfaction priorities differed for women and men hospitalists. Table 2 lists job satisfaction domains in descending order of the frequency prioritized by men. The largest proportion of women and men prioritized optimal workload. However, although substantial pay was prioritized next most frequently by men, more women prioritized collegiality and control over personal time than substantial pay.
| Women, % | Rank | Men, % | Rank | |
|---|---|---|---|---|
| Optimal workload | 59 | 1 | 59 | 1 |
| Substantial pay | 41 | 4 | 50 | 2 |
| Control over personal time | 44 | 3 | 41 | 3 |
| Collegiality with physicians | 47 | 2 | 38 | 4 |
| Rewarding relationships with patients | 35 | 5 | 34 | 5 |
| Organizational climate of trust and belonging | 27 | 7 | 33 | 6 |
| Ample availability of resources to do job | 24 | 9 | 27 | 7 |
| Optimal autonomy | 26 | 8 | 24 | 8 |
| Fairness within organization | 15 | 10 | 23 | 9 |
| Optimal variety of tasks | 29 | 6 | 22 | 10 |
| Recognition by leaders | 11 | 12 | 10 | 11 |
| Satisfaction with nurses | 12 | 11 | 7 | 12 |
Key differences in individual characteristics, work patterns, and indicating substantial pay as a priority were associated with self‐reported total earnings in 2009 from respondents' work as a hospitalist. As shown in Table 3, the inclusion of detailed productivity measures such as FTE, days of monthly clinical work, and estimated number of daily billable encounters yielded a model that explained 33% of variance in earnings. After adjusting for significant covariates including pediatric specialty, practice model, geography, and amount and type of clinical work, the estimated underpayment of women compared to men was $14,581. Hospitalists who prioritized substantial pay earned $10,771 more than those who did not. The female x leader interaction term testing the hypothesis that gender disparity is greater among leaders than frontline hospitalists was not statistically significant ($16,720, P = 0.087) and excluded from the final model.
| Differences in Salary, 2009 US$ (95% CI) | P Value | |
|---|---|---|
| ||
| Women | 14,581 (23,074 to 6,089) | <0.01 |
| Leader | 21,997 (13,313 to 30,682) | <0.01 |
| Prioritized substantial pay | 10,771 (2,651 to 18,891) | <0.01 |
| Pediatric specialty | 31,126 (43,007 to 19,244) | <0.01 |
| Practice model | ||
| Hospital employed | REF | |
| Multispecialty group | 1,922 (13,891 to 10,047) | 0.75 |
| University/medical school | 33,503 (46,336 to 20,671) | <0.01 |
| Multistate group | 6,505 (72,69 to 20,279) | 0.35 |
| Local hospitalist group | 9,330 (4,352 to 23,012) | 0.18 |
| Other | 17,364 (45,741 to 11,012) | 0.23 |
| Practice region | ||
| Southeast | REF | |
| Midwest | 1,225 (10,595 to 13,044) | 0.84 |
| Northeast | 15,712 (28,182 to 3,242) | 0.01 |
| Southwest | 722 (13,545 to 12,101) | 0.91 |
| West | 5,251 (7,383 to 17,885) | 0.41 |
| FTE | 1,021 (762 to 1,279) | <0.01 |
| Days per month doing clinical work | 1,209 (443 to 1,975) | <0.01 |
| Estimated daily billable encounters | 608 (20 to 1,196) | 0.04 |
DISCUSSION
In a national stratified sample of US hospitalists, we found gender differences in job satisfaction priorities and hospitalist work characteristics. We also confirmed the persistence of a substantial gender earnings disparity. Lower earnings among women compared to men hospitalists were present in our data after controlling for age, pediatric specialty, practice model, geography, type of clinical work, and productivity measures. The gender earnings disparity noted in 1999[6] persists, although it appears to have decreased, possibly indicating progress toward equity. We showed that women hospitalists' relative tendency not to prioritize pay explains a significant portion of the residual income gap.
Hoff examined hospitalist earnings in a large national survey of hospitalists in 1999. Our cohorts differed in age and experience (both lower in the Hoff study). An estimated $24,000 ($124,266 vs. $148,132) earnings gap between women and men was greater than our estimate of $14,581 following an interval of 10 years. Although survey items differed, both studies found that women were less interested in pay than men when considering a hospitalist job. Hoff also found that work setting and attitudes about pay and lifestyle were significantly related to earnings. We extended the previous analyses of gender differences in job satisfaction priorities, work, and demographic characteristics to explain the earnings gap and understand how it may be remedied.
When considering job satisfaction, we found that more men than women prioritized substantial pay and that prioritization of substantial pay was directly related to higher earnings. Therefore, fewer women prioritizing pay partly explains women's lower earnings. Reasons for why fewer women prioritize pay were not assessed in this study but may include factors like being part of 2‐income households and competing commitments.[29] Priorities may even be influenced by empirically observed gender differences in discussions of financial matters, governed by cultural norms. Such norms may implicitly sanction employers to offer women less pay than men for the same or similar work. Women may disadvantage themselves by negotiating less or less well than men for higher starting and promotion salaries. They may be perceived more negatively than men when they do negotiate pay, leading to unintended negative consequences such as loss of social networks, decreased likability, and even loss of job offers.[29, 30, 31, 32]
More women prioritized optimal variety of tasks (6th most prevalent among women and 10th among men). Women who highly rate optimal variety of tasks as a job satisfier may choose positions in which they teach, perform research, and participate in hospital committees and quality‐improvement work, but offer lower pay. Yet hours per month doing nonclinical work was not significantly different between men and women, nor associated with earnings differences in our earnings models. Understanding whether women self‐select into hospitalist jobs with like‐minded colleagues to achieve complementary fit or end up supplementing their skills with hospitalists with different priorities may inform strategies to reduce the gender income disparity.[5] Unlike disparities between various hospital medicine groups, systematic disparities within practices risk generating low levels of organizational fairness and burnout among employees.
Not surprisingly, productivity was positively associated with earnings but did not fully account for the gender earnings gap. Our data demonstrated that women, on average, were associated with work characteristics that expectedly generate less compensation. For example, women were younger, more often part time, academic, pediatric, less often leaders, and reported fewer billable encounters compared to men. These differences account for some of the earnings gap between men and women, but these factors were controlled for in the earnings model. In addition, our analysis may have underestimated the gap by not incorporating loss of fringe benefits from part‐time status and not comprehensively counting incentive pay associated with high productivity. Other work patterns more commonly associated with women suggest an imbalance in reimbursement. More women than men work nights that are often compensated at higher rates than daytime work, yet their average pay was less, suggesting that compensation for night work may need to be adjusted to reflect its unique burdens and responsibilities.[33]
Although the gender pay gap was not more extreme among leaders compared to frontline hospitalists in our data, the trend, nonetheless, underscores an important consideration. Whereas clinical work is paid for in mostly measurable ways, pay for leadership may be influenced by intangible factors such as reputation, negotiation, and confidence that may disadvantage women relative to men.[7, 19, 23, 34, 35, 36] Efforts to overcome implicit gender bias should be most effective when we consciously couple fair promotion of women to leadership with fair compensation commensurate with their male peers.[21]
Our data are vulnerable to nonresponse bias.[1, 4, 5] Post hoc analyses demonstrated that distributions of age, gender, practice model and region of our respondents were similar to other nationally representative cohorts of hospitalists. Consequently, we believe our data can make valid estimates about a nationally representative sample of hospitalists. However, we acknowledge several additional weaknesses of self‐reported data, including recall bias and accuracy of productivity figures, which were rounded to variable significant digits by respondents. Earnings analysis using this data was intended to be exploratory, but the findings echoed analyses using more authoritative data sources.[11] Still, we made inferences conservatively by adopting multiple imputation techniques for dealing with nonresponse surveys in adherence to established reporting guidelines.[25] We also note several limitations relevant to multiple imputations. The greater prevalence of missing data for survey items soliciting earnings and the number of billable encounters suggest they were not truly missing at random as assumed. However, we showed that missingness is unrelated to the variables under study, justifying use of the technique. The wider measures of variance derived from multiple imputations make us vulnerable to not detecting associations that may exist.
The gender earnings gap found in hospital medicine echoes the gap found in multiple medical specialties, including but not limited to pediatrics, academic medicine, gastroenterology, and plastic surgery.[7, 8, 9, 11, 12, 13, 37] Hospital medicine employment models and practice patterns have important structural differences compared to previously studied populations that could mitigate factors contributing to women physicians' lower earnings. However, despite well‐defined working hours, lack of control over the number of patient encounters per day and high prevalence of hospital‐employed practice models, the gender earnings gap persists. We showed that lower prioritization for pay may reflect the self‐selection of women into lower paying jobs. Unmeasured factors, including implicit bias and differences in negotiations, social networks and mentoring opportunities[38, 39] may also contribute to pay differences between men and women hospitalists. As hospital medicine tackles gender inequities and other disparities, strategies to assess and address fair physician compensation must be on the table.
- , , , , ; Society of Hospital Medicine Career Satisfaction Task F. Job characteristics, satisfaction, and burnout across hospitalist practice models. J Hosp Med. 2012;7(5):402–410.
- , . The emerging role of “hospitalists” in the American health care system. N Engl J Med. 1996;335(7):514–517.
- , , , et al. Organizational climate, stress, and error in primary care: The MEMO study. In: Henriksen K, Battles JB, Marks ES, Lewin DI, eds. Advances in Patient Safety: From Research to Implementation. Vol. 1. Research Findings. Rockville, MD; Agency for Healthcare Research and Quality; 2005.
- , , , , . Worklife and satisfaction of hospitalists: toward flourishing careers. J Gen Intern Med. 2012;27(1):28–36.
- , , , , . Person‐job fit: an exploratory cross‐sectional analysis of hospitalists. J Hosp Med. 2013;8(2):96–101.
- . Doing the same and earning less: male and female physicians in a new medical specialty. Inquiry. 2004;41(3):301–315.
- , , , . Compensation and advancement of women in academic medicine: Is there equity? Ann Intern Med. 2004;141(3):205–212.
- . Differences in earnings between male and female physicians. N Engl J Med. 1996;334(15):960–964.
- , , , , , . Gender differences in the salaries of physician researchers. JAMA. 2012;307(22):2410–2417.
- , , , , , . The work lives of women physicians results from the physician work life study. The SGIM Career Satisfaction Study Group. J Gen Intern Med. 2000;15(6):372–380.
- , , , . The $16,819 pay gap for newly trained physicians: the unexplained trend of men earning more than women. Health Aff (Millwood). 2011;30(2):193–201.
- , , , . Assessing gender equity in a large academic department of pediatrics. Acad Med. 2012;87(1):98–104.
- , , , , , . Gender disparity in the practice of gastroenterology: the first 5 years of a career. Am J Gastroenterol. 2005;100(2):259–264.
- H.R. 438, Fair Pay Act of 2013. 113th Congress (2013‐2014).
- , , , , . Topics to ponder: part‐time practice and pay parity. Gend Med. 2010;7(4):350–356.
- , . Understanding and finding mentorship: a review for junior faculty. J Palliat Med. 2010;13(11):1373–1379.
- , , , et al. Career development for women in academic medicine: Multiple interventions in a department of medicine. JAMA. 1996;276(11):898–905.
- , , , , , . Sex differences in academic advancement. Results of a national study of pediatricians. N Engl J Med. 1996;335(17):1282–1289.
- , , , . Promotion of women physicians in academic medicine. Glass ceiling or sticky floor? JAMA. 1995;273(13):1022–1025.
- , , , , . Stories from early‐career women physicians who have left academic medicine: a qualitative study at a single institution. Acad Med. 2011;86(6):752–758.
- , , , , . Experiencing the culture of academic medicine: gender matters, a national study. J Gen Intern Med. 2013;28(2):201–207.
- , . Why aren't there more women leaders in academic medicine? tHe views of clinical department chairs. Acad Med. 2001;76(5):453–465.
- . The gender gap in executive compensation: the role of female directors and chief executive officers. Ann Am Acad Pol Soc Sci. 2012(639):258–278.
- , , . Keys to career satisfaction: insights from a survey of women pediatric surgeons. J Pediatr Surg. 2004;39(6):984–990.
- , , , et al. Multiple imputation for missing data in epidemiological and clinical research: potential and pitfalls. BMJ. 2009;338:b2393.
- Imputation and Variance Estimation Software [computer program]. Ann Arbor, MI: Universtiy of Michigan; 2007.
- , , . Multiple Imputation using chained equations: issues and guidance for practice. Stat Med. 2010;30(4):377–399.
- State of Hospital Medicine: 2010 Report Based on 2009 Data. Englewood, CO and Philadelphia, PA: Medical Group Management Association and Society of Hospital Medicine; 2010.
- , . The Changing Face of Medicine: Women Doctors and the Evolution Of Health Care in America. Ithaca, NY: ILR Press/Cornell University Press; 2008.
- , . Women Don't Ask: Negotiation and the Gender Divide. Princeton, NJ: Princeton University Press; 2003.
- , , , et al. Negotiation in academic medicine: a necessary career skill. J Womens Health (Larchmt). 2007;16(2):235–244.
- . Women and salary negotiation: the costs of self‐advocacy. Psychol Women Q. 2001;25:65–76.
- State of Hospital Medicine: 2014 Report Based on 2013 Data. Englewood, CO and Philadelphia, PA: Medical Group Management Association and Society of Hospital Medicine; 2014.
- , , . Interventions that affect gender bias in hiring: a systematic review. Acad Med. 2009;84(10):1440–1446.
- , . Sociology. The gender gap in NIH grant applications. Science. 2008;322(5907):1472–1474.
- , , , . Organizational climate and family life: how these factors affect the status of women faculty at one medical school. Acad Med. 2009;84(1):87–94.
- , , . Gender differences in the professional and private lives of plastic surgeons. Ann Plast Surg. 2010;64(6):775–779.
- . Gender and supportive co‐worker relations in the medical profession. Gend Work Organ. 2014;21(1):1–17.
- , . Stuck in the out‐group: Jennifer can't grow up, Jane's invisible, and Janet's over the hill. J Womens Health (Larchmt). 2014;23(6):481–484.
Hospitalists are a growing workforce numbering over 40,000 physicians, one‐third of whom are women.[1] Flexibility of work schedules and control over personal time have been the traditional selling points of the specialty.[2] Multiple studies of physician work life reveal growing physician dissatisfaction and a high prevalence of burnout.[3] To mitigate burnout risk, leaders in hospital medicine recognize the importance of creating a sustainable profession that offers both job and career satisfaction as well as work‐life balance and, importantly, fairness within the work environment.[4] Although success in some of these endeavors has been realized sporadically, sustaining work‐life balance and fairness in the specialty remains a work in progress, whereas evidence of high job attrition and pay inequities remain.[5, 6]
Pay inequity for women relative to men continues to be pervasive in medicine, including among early‐career physicians, researchers, and various specialists.[6, 7, 8, 9, 10, 11, 12, 13] The earnings gap seems to persist for physicians, even as federal efforts such as the Fair Pay Act of 2013 and the Paycheck Fairness Act of 2014 aim to end wage discrimination.[11, 14] Differences in specialty, part‐time status, and practice type do not mitigate the disparity.[8, 10, 15] Additional explanations have been proposed to explain the variability, including gender differences in negotiating skills, lack of opportunities to join networks of influence within organizations, and implicit or explicit bias and discrimination.[12, 16, 17, 18, 19, 20]
The earnings gap is also a consequence of what is commonly called the glass ceiling.[18, 19] Most agree that obstacles to fair advancement of women include absence of collaborative environments and role models who have successfully achieved work‐life balance.[17, 20, 21, 22] Somewhat surprisingly, women leaders in medicine seem to suffer greater income disparity than nonleaders; this income gap is prevalent among leaders in other elite professions as well.[7, 23] It is unknown whether women physicians' emphasis on work‐life balance, seen repeatedly in surveys, explains any of the pay disparity.[24] Little research to date has examined whether work‐life priorities of women in hospital medicine differ from men.
In this study, we sought to examine differences in job priorities between men and women hospitalists. In particular, we examine the relative prioritization of substantial pay to job satisfaction. We also examined gender differences in work patterns and earnings to explore potential sources of the persistent gender earnings gap.
METHODS
We analyzed data from the 20092010 Hospital Medicine Physician Worklife Survey, the design of which is detailed elsewhere.[4] Briefly, a 118‐item survey was administered by mail to a stratified sample of hospitalists from the Society of Hospital Medicine database and 3 large multisite hospitalist groups. A single survey item asked respondents to identify up to 4 out of 12 most important domains to their satisfaction with a hospitalist job. The domains were distilled from focus groups of nationally representative hospitalists as described previously,[4] and the survey item allowed up to one‐third of these domains to be identified as respondents' personal priorities. The list included: optimal variety of tasks, optimal workload, substantial pay, collegiality with other physicians, recognition by leaders, rewarding relationships with patients, satisfaction with nurses, optimal autonomy, control over personal time, fairness within organization, ample availability of resources to do job, and organizational climate of trust and belonging. We tabulated and ranked the frequency with which respondents selected each satisfaction domain by gender. Due to the nonstandard format of the survey item, we a priori decided to analyze only responses that were completed as instructed.
We also used demographic data including detailed work characteristics, clinical and nonclinical workload, total pretax earnings in 2009 as a hospitalist, and self‐identification as leader of their hospital medicine group. Respondent characteristics were tabulated and gender differences were tested using the t test, rank sum test, and the Fischer exact test as appropriate. We also listed the number of nonrespondents for each item. In estimating gender differences in earnings, we opted to use multiple‐imputation techniques to more conservatively account for greater variance inherent in the presence of missing data. Consistent with existing guidelines,[25] we demonstrated that item responses were not missing monotonically by visually inspecting patterns of nonresponse. We further demonstrated that data were missing at random by showing that response patterns of completed survey items did not predict whether or not a given variable response was missing using logistic regression models. We found no significant differences between respondents with complete and missing data. We verified that appropriate regression models for each variable on every other variable converged. We used Stata 13.1 (StataCorp, College Station, TX) to perform multiple imputations using chain equations (mi impute chain) to create 10 imputed tables for 7 normally distributed continuous variables using the ordinary least squares method, 3 non‐normally distributed variables using the predictive mean matching method, 2 nonordinal categorical variables using the multinomial logit method, and 1 binary variable using the logit method.[26, 27] Gender, pediatric specialty status, region of practice, and whether or not respondents prioritized substantial pay for job satisfaction were used as regular variables without missing data points.
Differences in earnings were assessed using a multivariate ordinary linear regression model applied to the imputed datasets fitted by forward selection of explanatory variables using P < 0.20 in bivariate analysis for inclusion and manual backward elimination of all statistically nonsignificant variables. We tested the significance of the women leader interaction term in the final parsimonious model. We used the usual significance threshold of P < 0.05 for inferences. Our analysis of publicly available anonymous data was exempt from IRB review.
RESULTS
Of the 816 survey respondents (response rate 25.6%), 40 either omitted the item soliciting work priorities or completed it incorrectly. Data from the remaining 776 respondents were used for the present analysis. Respondent characteristics are tabulated in Table 1. The characteristics of hospitalists by age, gender, specialty, practice model, and practice region were representative of US hospitalists from other surveys.[28]
| Women | Men | P Value | No. of Missing Responses | |
|---|---|---|---|---|
| ||||
| No. | 263 | 513 | 0 | |
| Role, n (%) | <0.01 | 0 | ||
| Frontline hospitalist | 201 (76) | 337 (66) | ||
| Hospitalist leader | 53 (24) | 176 (34) | ||
| Age, y, mean (SD) | 42 (8) | 45 (9) | <0.01 | 67 |
| Years in current job, mean (SD) | 5 (4) | 6 (5) | 0.07 | 14 |
| Specialty, n (%) | <0.01 | 0 | ||
| Internal medicine | 160 (61) | 369 (72) | ||
| Pediatrics | 56 (21) | 57 (11) | ||
| Other | 39 (15) | 47 (9) | ||
| Family medicine | 8 (3) | 40 (8) | ||
| Practice model, n (%) | 0.02 | 19 | ||
| Hospital employed | 110 (43) | 227 (46) | ||
| Multispecialty group | 44 (17) | 68 (14) | ||
| University/medical school | 47 (18) | 58 (12) | ||
| Multistate group | 27 (11) | 73 (15) | ||
| Local hospitalist group | 22 (8) | 65 (13) | ||
| Other | 7 (3) | 9 (2) | ||
| Practice region, n (%) | 0.14 | 0 | ||
| Southeast | 56 (21) | 151 (29) | ||
| Midwest | 58 (22) | 106 (21) | ||
| Northeast | 54 (21) | 96 (19) | ||
| Southwest | 44 (17) | 83 (16) | ||
| West | 51 (19) | 77 (15) | ||
| Full‐time equivalents, n (%) | <0.01 | 42 | ||
| <100% | 46 (18) | 60 (12) | ||
| 100% | 202 (81) | 402 (83) | ||
| >100% | 2 (1) | 22 (5) | ||
| Days per month doing clinical work if FTE 100%, median (IQR) | 15 (1418) | 16 (1420) | 0.12 | 11 |
| Hours per day doing clinical work, median (IQR) | 11 (912) | 11 (912) | 0.67 | 30 |
| Consecutive days doing clinical work, median (IQR) | 7 (57) | 7 (57) | 0.94 | 17 |
| Percentage of work at night, median (IQR) | 15 (530) | 15 (525) | 0.45 | 16 |
| Percentage of night work in hospital if working nights, median (IQR) | 100 (5100) | 100 (10100) | 0.12 | 8 |
| Hours per month doing nonclinical work, median (IQR) | 12 (540) | 15 (540) | 0.77 | 26 |
| Estimated daily billable encounters, mean (IQR) | 14 (1116) | 15 (1218) | 0.01 | 54 |
| Total earnings in fiscal year 2009, median US$1,000 (IQR) | 185 (150210) | 202 (180240) | <0.01 | 56 |
| Marriage/domestic partnership status, n (%) | 0.15 | 43 | ||
| Married/currently in DP | 197 (80) | 421 (86) | ||
| Never married/never in DP | 26 (11) | 42 (9) | ||
| Divorced or separated | 18 (7) | 20 (4) | ||
| Other | 4 (2) | 5 (1) | ||
| Dependent children under 7 years old living in home, n (%) | 0.22 | 42 | ||
| 0 | 136 (55) | 265 (54) | ||
| 1 | 47 (19) | 92 (19) | ||
| 2 | 52 (21) | 87 (18) | ||
| 3 | 12 (5) | 43 (9) | ||
Several gender differences were seen in the characteristics of hospitalists and their work (Table 1). Women compared to men hospitalists were less likely to be leaders, more likely to be pediatricians, work in university settings, and practice in Western states. Women compared to men, on average, were younger by 3 years, worked fewer full‐time equivalents (FTEs), worked a greater percentage of nights, and reported fewer billable encounters per shift. They were also more likely to be divorced or separated.
Job satisfaction priorities differed for women and men hospitalists. Table 2 lists job satisfaction domains in descending order of the frequency prioritized by men. The largest proportion of women and men prioritized optimal workload. However, although substantial pay was prioritized next most frequently by men, more women prioritized collegiality and control over personal time than substantial pay.
| Women, % | Rank | Men, % | Rank | |
|---|---|---|---|---|
| Optimal workload | 59 | 1 | 59 | 1 |
| Substantial pay | 41 | 4 | 50 | 2 |
| Control over personal time | 44 | 3 | 41 | 3 |
| Collegiality with physicians | 47 | 2 | 38 | 4 |
| Rewarding relationships with patients | 35 | 5 | 34 | 5 |
| Organizational climate of trust and belonging | 27 | 7 | 33 | 6 |
| Ample availability of resources to do job | 24 | 9 | 27 | 7 |
| Optimal autonomy | 26 | 8 | 24 | 8 |
| Fairness within organization | 15 | 10 | 23 | 9 |
| Optimal variety of tasks | 29 | 6 | 22 | 10 |
| Recognition by leaders | 11 | 12 | 10 | 11 |
| Satisfaction with nurses | 12 | 11 | 7 | 12 |
Key differences in individual characteristics, work patterns, and indicating substantial pay as a priority were associated with self‐reported total earnings in 2009 from respondents' work as a hospitalist. As shown in Table 3, the inclusion of detailed productivity measures such as FTE, days of monthly clinical work, and estimated number of daily billable encounters yielded a model that explained 33% of variance in earnings. After adjusting for significant covariates including pediatric specialty, practice model, geography, and amount and type of clinical work, the estimated underpayment of women compared to men was $14,581. Hospitalists who prioritized substantial pay earned $10,771 more than those who did not. The female x leader interaction term testing the hypothesis that gender disparity is greater among leaders than frontline hospitalists was not statistically significant ($16,720, P = 0.087) and excluded from the final model.
| Differences in Salary, 2009 US$ (95% CI) | P Value | |
|---|---|---|
| ||
| Women | 14,581 (23,074 to 6,089) | <0.01 |
| Leader | 21,997 (13,313 to 30,682) | <0.01 |
| Prioritized substantial pay | 10,771 (2,651 to 18,891) | <0.01 |
| Pediatric specialty | 31,126 (43,007 to 19,244) | <0.01 |
| Practice model | ||
| Hospital employed | REF | |
| Multispecialty group | 1,922 (13,891 to 10,047) | 0.75 |
| University/medical school | 33,503 (46,336 to 20,671) | <0.01 |
| Multistate group | 6,505 (72,69 to 20,279) | 0.35 |
| Local hospitalist group | 9,330 (4,352 to 23,012) | 0.18 |
| Other | 17,364 (45,741 to 11,012) | 0.23 |
| Practice region | ||
| Southeast | REF | |
| Midwest | 1,225 (10,595 to 13,044) | 0.84 |
| Northeast | 15,712 (28,182 to 3,242) | 0.01 |
| Southwest | 722 (13,545 to 12,101) | 0.91 |
| West | 5,251 (7,383 to 17,885) | 0.41 |
| FTE | 1,021 (762 to 1,279) | <0.01 |
| Days per month doing clinical work | 1,209 (443 to 1,975) | <0.01 |
| Estimated daily billable encounters | 608 (20 to 1,196) | 0.04 |
DISCUSSION
In a national stratified sample of US hospitalists, we found gender differences in job satisfaction priorities and hospitalist work characteristics. We also confirmed the persistence of a substantial gender earnings disparity. Lower earnings among women compared to men hospitalists were present in our data after controlling for age, pediatric specialty, practice model, geography, type of clinical work, and productivity measures. The gender earnings disparity noted in 1999[6] persists, although it appears to have decreased, possibly indicating progress toward equity. We showed that women hospitalists' relative tendency not to prioritize pay explains a significant portion of the residual income gap.
Hoff examined hospitalist earnings in a large national survey of hospitalists in 1999. Our cohorts differed in age and experience (both lower in the Hoff study). An estimated $24,000 ($124,266 vs. $148,132) earnings gap between women and men was greater than our estimate of $14,581 following an interval of 10 years. Although survey items differed, both studies found that women were less interested in pay than men when considering a hospitalist job. Hoff also found that work setting and attitudes about pay and lifestyle were significantly related to earnings. We extended the previous analyses of gender differences in job satisfaction priorities, work, and demographic characteristics to explain the earnings gap and understand how it may be remedied.
When considering job satisfaction, we found that more men than women prioritized substantial pay and that prioritization of substantial pay was directly related to higher earnings. Therefore, fewer women prioritizing pay partly explains women's lower earnings. Reasons for why fewer women prioritize pay were not assessed in this study but may include factors like being part of 2‐income households and competing commitments.[29] Priorities may even be influenced by empirically observed gender differences in discussions of financial matters, governed by cultural norms. Such norms may implicitly sanction employers to offer women less pay than men for the same or similar work. Women may disadvantage themselves by negotiating less or less well than men for higher starting and promotion salaries. They may be perceived more negatively than men when they do negotiate pay, leading to unintended negative consequences such as loss of social networks, decreased likability, and even loss of job offers.[29, 30, 31, 32]
More women prioritized optimal variety of tasks (6th most prevalent among women and 10th among men). Women who highly rate optimal variety of tasks as a job satisfier may choose positions in which they teach, perform research, and participate in hospital committees and quality‐improvement work, but offer lower pay. Yet hours per month doing nonclinical work was not significantly different between men and women, nor associated with earnings differences in our earnings models. Understanding whether women self‐select into hospitalist jobs with like‐minded colleagues to achieve complementary fit or end up supplementing their skills with hospitalists with different priorities may inform strategies to reduce the gender income disparity.[5] Unlike disparities between various hospital medicine groups, systematic disparities within practices risk generating low levels of organizational fairness and burnout among employees.
Not surprisingly, productivity was positively associated with earnings but did not fully account for the gender earnings gap. Our data demonstrated that women, on average, were associated with work characteristics that expectedly generate less compensation. For example, women were younger, more often part time, academic, pediatric, less often leaders, and reported fewer billable encounters compared to men. These differences account for some of the earnings gap between men and women, but these factors were controlled for in the earnings model. In addition, our analysis may have underestimated the gap by not incorporating loss of fringe benefits from part‐time status and not comprehensively counting incentive pay associated with high productivity. Other work patterns more commonly associated with women suggest an imbalance in reimbursement. More women than men work nights that are often compensated at higher rates than daytime work, yet their average pay was less, suggesting that compensation for night work may need to be adjusted to reflect its unique burdens and responsibilities.[33]
Although the gender pay gap was not more extreme among leaders compared to frontline hospitalists in our data, the trend, nonetheless, underscores an important consideration. Whereas clinical work is paid for in mostly measurable ways, pay for leadership may be influenced by intangible factors such as reputation, negotiation, and confidence that may disadvantage women relative to men.[7, 19, 23, 34, 35, 36] Efforts to overcome implicit gender bias should be most effective when we consciously couple fair promotion of women to leadership with fair compensation commensurate with their male peers.[21]
Our data are vulnerable to nonresponse bias.[1, 4, 5] Post hoc analyses demonstrated that distributions of age, gender, practice model and region of our respondents were similar to other nationally representative cohorts of hospitalists. Consequently, we believe our data can make valid estimates about a nationally representative sample of hospitalists. However, we acknowledge several additional weaknesses of self‐reported data, including recall bias and accuracy of productivity figures, which were rounded to variable significant digits by respondents. Earnings analysis using this data was intended to be exploratory, but the findings echoed analyses using more authoritative data sources.[11] Still, we made inferences conservatively by adopting multiple imputation techniques for dealing with nonresponse surveys in adherence to established reporting guidelines.[25] We also note several limitations relevant to multiple imputations. The greater prevalence of missing data for survey items soliciting earnings and the number of billable encounters suggest they were not truly missing at random as assumed. However, we showed that missingness is unrelated to the variables under study, justifying use of the technique. The wider measures of variance derived from multiple imputations make us vulnerable to not detecting associations that may exist.
The gender earnings gap found in hospital medicine echoes the gap found in multiple medical specialties, including but not limited to pediatrics, academic medicine, gastroenterology, and plastic surgery.[7, 8, 9, 11, 12, 13, 37] Hospital medicine employment models and practice patterns have important structural differences compared to previously studied populations that could mitigate factors contributing to women physicians' lower earnings. However, despite well‐defined working hours, lack of control over the number of patient encounters per day and high prevalence of hospital‐employed practice models, the gender earnings gap persists. We showed that lower prioritization for pay may reflect the self‐selection of women into lower paying jobs. Unmeasured factors, including implicit bias and differences in negotiations, social networks and mentoring opportunities[38, 39] may also contribute to pay differences between men and women hospitalists. As hospital medicine tackles gender inequities and other disparities, strategies to assess and address fair physician compensation must be on the table.
- , , , , ; Society of Hospital Medicine Career Satisfaction Task F. Job characteristics, satisfaction, and burnout across hospitalist practice models. J Hosp Med. 2012;7(5):402–410.
- , . The emerging role of “hospitalists” in the American health care system. N Engl J Med. 1996;335(7):514–517.
- , , , et al. Organizational climate, stress, and error in primary care: The MEMO study. In: Henriksen K, Battles JB, Marks ES, Lewin DI, eds. Advances in Patient Safety: From Research to Implementation. Vol. 1. Research Findings. Rockville, MD; Agency for Healthcare Research and Quality; 2005.
- , , , , . Worklife and satisfaction of hospitalists: toward flourishing careers. J Gen Intern Med. 2012;27(1):28–36.
- , , , , . Person‐job fit: an exploratory cross‐sectional analysis of hospitalists. J Hosp Med. 2013;8(2):96–101.
- . Doing the same and earning less: male and female physicians in a new medical specialty. Inquiry. 2004;41(3):301–315.
- , , , . Compensation and advancement of women in academic medicine: Is there equity? Ann Intern Med. 2004;141(3):205–212.
- . Differences in earnings between male and female physicians. N Engl J Med. 1996;334(15):960–964.
- , , , , , . Gender differences in the salaries of physician researchers. JAMA. 2012;307(22):2410–2417.
- , , , , , . The work lives of women physicians results from the physician work life study. The SGIM Career Satisfaction Study Group. J Gen Intern Med. 2000;15(6):372–380.
- , , , . The $16,819 pay gap for newly trained physicians: the unexplained trend of men earning more than women. Health Aff (Millwood). 2011;30(2):193–201.
- , , , . Assessing gender equity in a large academic department of pediatrics. Acad Med. 2012;87(1):98–104.
- , , , , , . Gender disparity in the practice of gastroenterology: the first 5 years of a career. Am J Gastroenterol. 2005;100(2):259–264.
- H.R. 438, Fair Pay Act of 2013. 113th Congress (2013‐2014).
- , , , , . Topics to ponder: part‐time practice and pay parity. Gend Med. 2010;7(4):350–356.
- , . Understanding and finding mentorship: a review for junior faculty. J Palliat Med. 2010;13(11):1373–1379.
- , , , et al. Career development for women in academic medicine: Multiple interventions in a department of medicine. JAMA. 1996;276(11):898–905.
- , , , , , . Sex differences in academic advancement. Results of a national study of pediatricians. N Engl J Med. 1996;335(17):1282–1289.
- , , , . Promotion of women physicians in academic medicine. Glass ceiling or sticky floor? JAMA. 1995;273(13):1022–1025.
- , , , , . Stories from early‐career women physicians who have left academic medicine: a qualitative study at a single institution. Acad Med. 2011;86(6):752–758.
- , , , , . Experiencing the culture of academic medicine: gender matters, a national study. J Gen Intern Med. 2013;28(2):201–207.
- , . Why aren't there more women leaders in academic medicine? tHe views of clinical department chairs. Acad Med. 2001;76(5):453–465.
- . The gender gap in executive compensation: the role of female directors and chief executive officers. Ann Am Acad Pol Soc Sci. 2012(639):258–278.
- , , . Keys to career satisfaction: insights from a survey of women pediatric surgeons. J Pediatr Surg. 2004;39(6):984–990.
- , , , et al. Multiple imputation for missing data in epidemiological and clinical research: potential and pitfalls. BMJ. 2009;338:b2393.
- Imputation and Variance Estimation Software [computer program]. Ann Arbor, MI: Universtiy of Michigan; 2007.
- , , . Multiple Imputation using chained equations: issues and guidance for practice. Stat Med. 2010;30(4):377–399.
- State of Hospital Medicine: 2010 Report Based on 2009 Data. Englewood, CO and Philadelphia, PA: Medical Group Management Association and Society of Hospital Medicine; 2010.
- , . The Changing Face of Medicine: Women Doctors and the Evolution Of Health Care in America. Ithaca, NY: ILR Press/Cornell University Press; 2008.
- , . Women Don't Ask: Negotiation and the Gender Divide. Princeton, NJ: Princeton University Press; 2003.
- , , , et al. Negotiation in academic medicine: a necessary career skill. J Womens Health (Larchmt). 2007;16(2):235–244.
- . Women and salary negotiation: the costs of self‐advocacy. Psychol Women Q. 2001;25:65–76.
- State of Hospital Medicine: 2014 Report Based on 2013 Data. Englewood, CO and Philadelphia, PA: Medical Group Management Association and Society of Hospital Medicine; 2014.
- , , . Interventions that affect gender bias in hiring: a systematic review. Acad Med. 2009;84(10):1440–1446.
- , . Sociology. The gender gap in NIH grant applications. Science. 2008;322(5907):1472–1474.
- , , , . Organizational climate and family life: how these factors affect the status of women faculty at one medical school. Acad Med. 2009;84(1):87–94.
- , , . Gender differences in the professional and private lives of plastic surgeons. Ann Plast Surg. 2010;64(6):775–779.
- . Gender and supportive co‐worker relations in the medical profession. Gend Work Organ. 2014;21(1):1–17.
- , . Stuck in the out‐group: Jennifer can't grow up, Jane's invisible, and Janet's over the hill. J Womens Health (Larchmt). 2014;23(6):481–484.
© 2015 Society of Hospital Medicine
Discharge Before Noon
It is thought that late afternoon hospital discharges create admission bottlenecks in the emergency department (ED).[1] As hospital occupancy increases, so too does ED boarding time.[2] Increased ED boarding time can result in increased length of stay (LOS)[3] and reduced patient and staff satisfaction.[4] Early in the day discharge programs are intended to improve hospital throughput.[5, 6, 7, 8, 9] Yet, ED admission timing is, in part, determined by external fluctuations in ED volume and acuity that early discharges do not impact.[10] We previously reported that high levels of discharge before noon (DBN) from inpatient medicine units is achievable through a multidisciplinary intervention.[5] We now evaluate the effect of this intervention upon admission patterns and the sustainability of the DBN initiative.
The DBN intervention consisted of afternoon interdisciplinary rounds, a checklist of team members' responsibilities, a standardized electronic communication tool, and daily feedback on the DBN rate.[5] The intervention resulted in an increase in the DBN rate from 11% to 38% in the first 13 months. We previously reported effects upon the discharged patient as measured by the observed to expected length of stay (O:E LOS) and 30‐day readmission rate. We now assess the effect of our DBN initiative on the subsequent patient and hospital throughput. Our objectives for this study were: (1) to determine the effect of DBN on the admission arrival times and admissions per hour to the units, and (2) in a separate data collection and analysis, to determine if the increased DBN rate is sustainable. We hypothesize that DBN results in admissions arriving onto the units earlier in the day. We further hypothesize that because of this redistribution, DBN will level the load of admissions, reducing admissions per hour peaks that can occur late in the day.
METHODS
Study Design, Participants, and Setting
This is a pre‐/postretrospective analysis evaluating the effect of a previously described DBN intervention.[5] Two inpatient acute‐care medicine units at NYU Langone Medical Center's Tisch Hospital, a 725‐bed, urban, academic medical center, were included in the analysis. All patients admitted to the units underwent the intervention.
Intervention
The DBN intervention began with a multidisciplinary kickoff event in which all team members received education on the importance of DBN, a clear description of roles in the DBN process, and a corresponding checklist of responsibilities. The checklist was utilized at new afternoon interdisciplinary rounds intended to identify next‐day DBNs. Patients identified in afternoon interdisciplinary rounds were logged in a DBN website that generated twice‐daily automated emails to communicate the planned DBN list to frontline staff and key stakeholders. Daily, real‐time feedback on the DBN rate was provided to floor staff.
Measures
Admission Arrival Time
The arrival location and time to any hospital area (ED, radiology, inpatient medical unit) is recorded in the electronic medical record (Epic, Madison, WI) at the time the patient arrives by the patient unit assistant or unit clerk. We obtained the arrival time to each hospital unit throughout the patient's hospitalization for all patients arriving to the study units during their hospitalization between June 1, 2011 and March 4, 2012 (the baseline period) and March 5, 2012 and June 31, 2013 (the intervention period). Data from October 25, 2012 to the end of January 2013 were excluded due to hospital closure from Hurricane Sandy. These time periods and exclusions match those used in our previous DBN article.[5] To match that study's criteria, we excluded patients on the units in the patient class observation, inpatient hospice, and those patients whose discharge disposition was expired or hospice.
ED Admissions
All patients with a first inpatient unit location of ED and no other inpatient unit location prior to arrival on the study units were included in the ED admission analysis. Units that treat but do not provide long‐term boarding/housing of inpatientssuch as radiology, hemodialysis, and cardiac catheterizationwere not considered in determining ED admission status. Even if a patient had recorded arrival to those areas between ED and study unit arrival, these patients were considered ED admissions, as they were never admitted to another inpatient unit.
Transfers and Direct Admissions
All patients whose first inpatient unit location was the study units were included in the transfers and direct admissions analysis. Those patients who were recorded as coming from another inpatient unit (such as another medical, surgical, step‐down, intensive care, or other specialty unit) prior to study unit arrival were included as intrahospital transfers.
Level Load of Admissions
Level loading is a lean methodology term that describes reducing the unevenness in a production line to enhance efficiency.[11] We evaluated this by comparing the admissions per hour (density distribution) to the studied units in the pre‐ and postintervention periods.
Sustainability of the DBN Intervention
The DBN intervention, as described in our original article, continues uninterrupted. Using the same methodology, inclusion criteria, exclusion criteria, and data analysis previously described, we gathered the discharge date and time as recorded by the patient unit assistant for all patients discharged from the study units for the 18 months (July 1, 2013 to December 31, 2014) after our original article to evaluate the sustainability of our improvement in DBN rates.
Statistical Analysis
Median admission time to the floor was compared between the 2 time periods using the Wilcoxon rank sum test. This is a non parametric test of the null hypothesis that the two time periods have the same distributions of admission time to the floor. To evaluate statistical significance, each admission time is arranged in order of magnitude and assigned a rank. The sum of the ranks for each group is calculated and the smaller rank sum (the W statistic) is compared to an expected range of values based on the sample sizes. If this value is out of range then one can reject the null hypothesis. The density distributions of admissions during the 2 time periods were compared using the Kolmogorov‐Smirnov test. The 2‐sided Kolmogorov‐Smirnov test evaluates the maximum distance (D) between the distributions of 2 samples.[12] We chose this test because it evaluates differences between both the position and shape of the distributions of the samples.
RESULTS
Setting Characteristics
The units had an average occupancy rate of 86.8% for the duration of the study. The average number of total discharges per day was 9.8. The average absolute length of stay was 5.6 days.
Admission Arrival Time to the Unit
ED Admissions
A total of 6566 patients were admitted from the ED to the units, 2756 in the baseline period and 3810 in the intervention period. The median arrival time to the units of ED admissions grouped by hour of the day moved by 1 hour, from 5 pm to 4 pm from the baseline to intervention period, and this change was statistically significant (W=16,211,778, P<0.01) (Figure 1).

Transfers and Direct Admissions
A total of 823 patients were transferred or directly admitted to the units, 310 in the baseline period and 513 in the intervention period. The median arrival time to the units grouped by hour of the day moved 1 hour from 5 pm to 4 pm, and this change was statistically significant (W=324,532, P<0.01) (Figure 2).
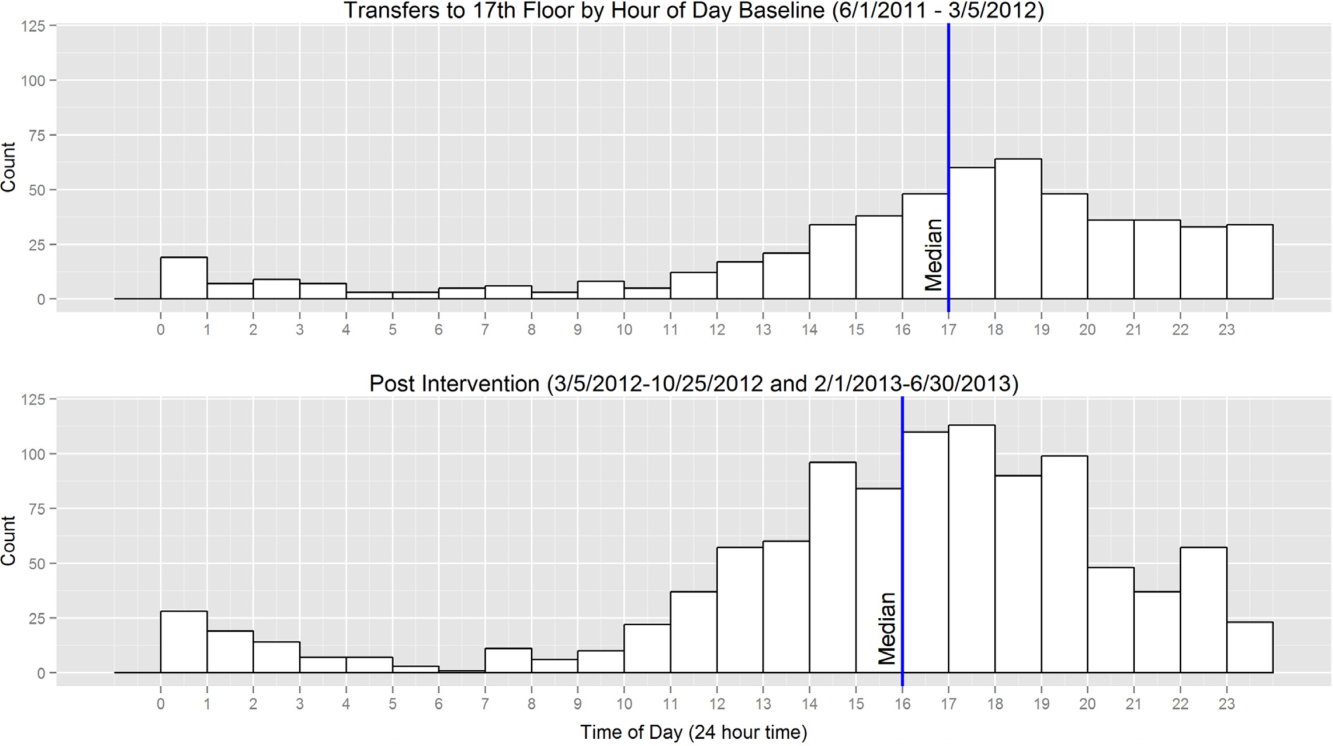
Level Load of Admissions
In the baseline period, the highest density of ED admissions occurred during the 5‐hour period from 5 pm to 10 pm, when 42.3% of daily admissions arrived (Figure 3). In the intervention period, the highest density of admissions occurred during the 5‐hour period from 3 pm to 8 pm, when 40.0% of daily admissions arrived. The difference between the density distributions for the 2 time periods was found to be statistically significant using the Kolmogorov‐Smirnov test (D=0.03, P<0.01).
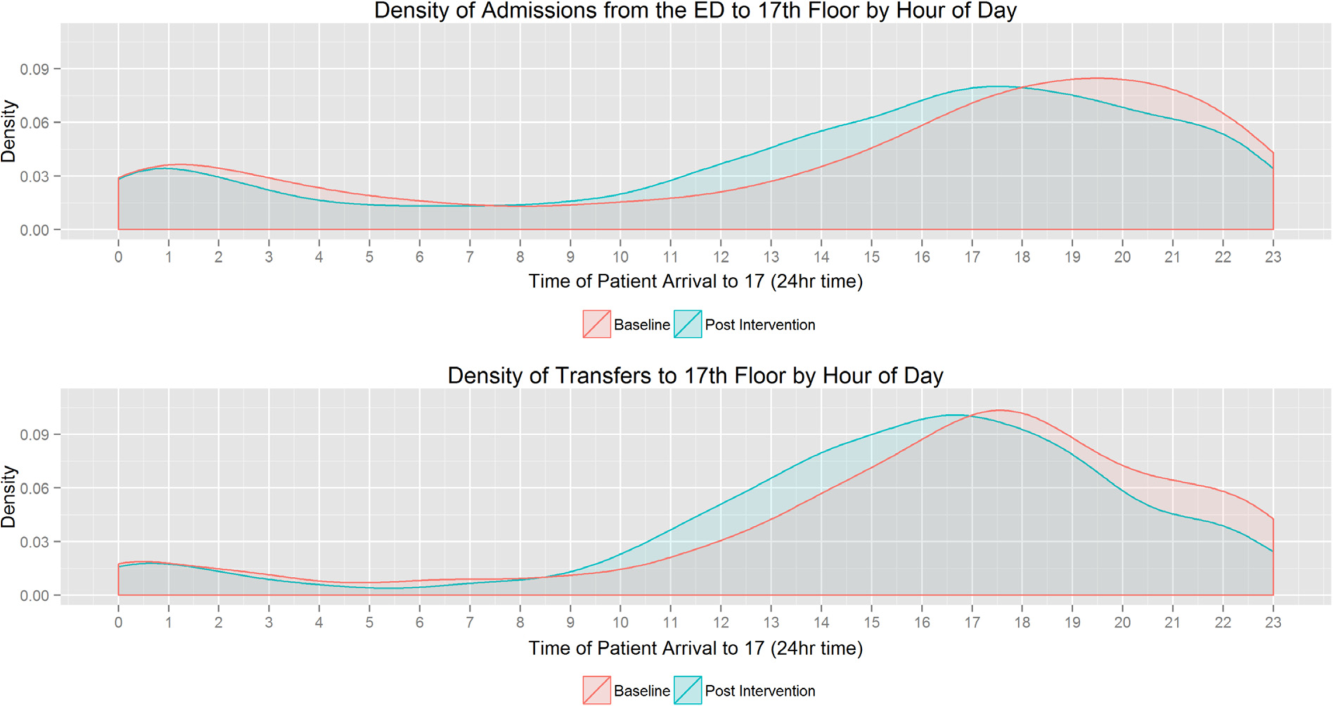
In the baseline period, the highest density of transfers and direct admissions occurred during the 5‐hour period from 3 pm to 8 pm, when 51.7% of daily admissions arrived (Figure 3). In the intervention time period, the highest density of transfers and direct admissions occurred during the 5‐hour time period from 2 pm to 7 pm, when 50.3% of daily admissions arrived. The difference between the density distributions of transfers and direct admissions for the 2 time periods was not statistically significant using the Kolmogorov‐Smirnov test (D=0.04, P=0.3).
Sustainability of the DBN Intervention
For the 18 months after the prior reported DBN intervention period, an additional 5505 total discharges were included for analysis. Of these, 1796 were DBN. The average DBN rate for the study units from March 5, 2012 until December 31, 2014 (the original intervention period plus the additional 18 months of new data) is 35% (Figure 4).
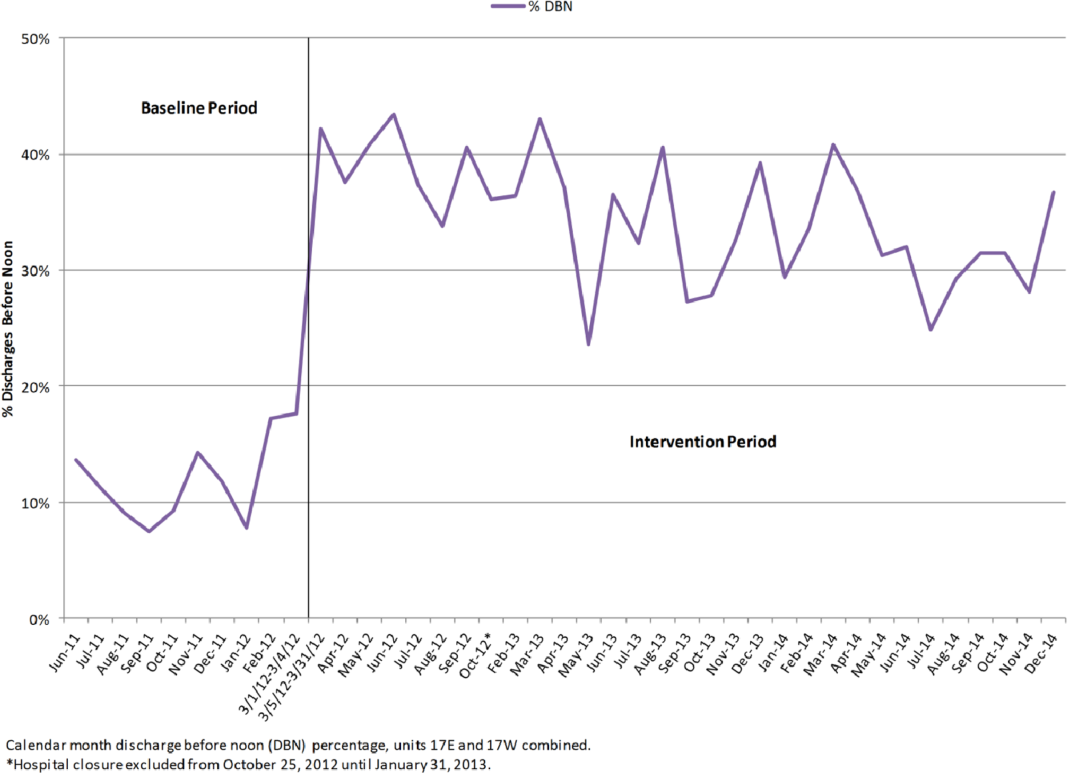
DISCUSSION
The potential effects of DBN are multiple. By reducing the O:E LOS and allowing patients the time to acquire their medications, make follow‐up appointments, and ask questions while providers are still in the hospital, our DBN initiative impacts the discharged patient's quality, safety, and efficiency of care.[5] We now report how the DBN initiative potentially impacts the subsequent patient's efficiency of care and hospital throughput. In addition, we show that the DBN initiative is sustainable over years.
Over the same time course as our initial DBN intervention, we found a statistically significant change in the time when admitted patients arrive on the floor. This was true of those patients admitted through the ED and those directly admitted to the floor. In a complex hospital system with many factors both internal (bed cleaning, patient transportation) and external (natural variations in ED volume and acuity) affecting the timing of admissions, it is important to note that increasing the DBN rate correlates with a change in median admission arrival time. From a patient safety standpoint, any initiative that moves admissions away from evening and night hours and takes advantage of (usually more robust) day staffing is a potentially favorable intervention.[13]
We observed a statistically significant reduction of highest frequency peaks of ED admissions. It appears that opening beds up earlier in the day through DBN may help level the load of admissions from the ED. There was no effect on highest frequency peaks of transfer admissions to the floor. This may be due to the timing of transfers being dependent on factors other than bed availability, such as timing of transportation to the hospital or the timing of planned treatment.
We also found that the DBN intervention has created sustainable increases in the DBN rate. Since our initial publication, we have received direct communication from physicians, administrators and managers in 6 different states and 2 foreign countries asking for additional information or reporting that their hospitals are pursuing similar goals. Some of the most common questions asked include: Are your results sustained? and What do you think is a reasonable DBN goal? We have attempted to answer both of these questions. We previously reported improvement to an average DBN rate of 38% over the first 13 intervention months. With more time, we now see an absolute DBN rate of 35%. In November 2014, we restructured our medicine service to become geographic, so that the same group of doctors, trainees, nurses, care managers, and social workers care for patients on a single ward. Since this initiative, our DBN rate has climbed to greater than 40%. We hope to report further on this new intervention in the future. Similar hospital centers can consider using our experience on an inpatient acute‐care medical unit in an urban environment as a benchmark for setting hospital metric goals for early‐in‐the‐day discharge.
Several studies have previously reported on early‐in‐the‐day discharge initiatives. These were smaller studies that focused on descriptions of the type of intervention, including a discharge brunch on an obstetrics floor,[8] scheduled discharges,[6] in‐room displays of expected day and time of discharge,[9] and a physician‐centered discharge process.[7] Our study is substantially larger, focused on inpatient medicine units, and reports the effect of significant changes in DBN on patient and hospital metrics.
Our study had several limitations. The study is based in a single site, potentially limiting the generalizability of our findings. The hospital underwent tremendous change during the course of the intervention, including its temporary closure due to Hurricane Sandy. We cannot exclude effects related to shifts in volume and possible differences in the pre‐ and post‐time period patient populations. The prior study evaluated the population of discharged patients, but the admission analysis in this study involves the population of admitted patients. There may be slight differences in the populations due to the inclusion of patients who were admitted but not discharged from the units (for instance due to transfer after admission). Though the findings on admission arrival time correlate well with the increasing DBN rates, as they occur during the same time and in the same direction (earlier in the day), we are unable to conclude if the effect is causative. There were many interventions ongoing throughout the hospital to improve throughput, and these programs could have created local trends that confound our data. We are also unable to evaluate the clinical significance of a 1‐hour shift in median admission arrival time. Each hospital system must determine for itself if the time and resource investment in DBN is worth the change in admission timing described. We completed this analysis with the perspective of the inpatient medical unit experience, including the timing and number of admissions arriving to the units. We cannot exclude the possibility that changes in arrival times or boarding trends in the ED contribute to our findings.
CONCLUSION
In our hospital, a successful DBN initiative correlates with movement of ED admissions and transfers onto the inpatient units earlier in the day. There was a leveling of the load for ED admissions over the same time period. DBN continues to be an achievable hospital goal, and we provide a potential benchmark for similar hospitals.
Disclosure
Nothing to report.
- , , , Impact of admission and discharge peak times on hospital overcrowding. Stud Health Technol Inform. 2011;168:82–88.
- , , , et al. Time series analysis of emergency department length of stay per 8‐hour shift. West J Emerg Med. 2012;13(2):163–168.
- , , , , , Boarding inpatients in the emergency department increases discharged patient length of stay. J Emerg Med. 2013;44(1):230–235.
- , Overcrowding in the nation's emergency departments: complex causes and disturbing effects. Ann Emerg Med. 2000;35(1):63–68.
- , , , et al. Discharge before noon: an achievable hospital goal. J Hosp Med. 2014;9(4):210–214.
- , , All roads lead to scheduled discharges. Nursing. 2008;38(12):61–63.
- , , , Discharging patients earlier in the day: a concept worth evaluating. Health Care Manag (Frederick). 2007;26(2):142–146.
- , The discharge brunch: reducing chaos and increasing smiles on the OB unit. Nurs Womens Health. 2009;13(5):402–409.
- , , , et al. In‐room display of day and time patient is anticipated to leave hospital: a “discharge appointment”. J Hosp Med. 2007;2(1):13–16.
- , , , , , Emergency department crowding: factors influencing flow. West J Emerg Med. 2010;11(1):10–15.
- The Toyota Way: 14 Management Principles From the World's Greatest Manufacturer. New York, NY: McGraw‐Hill; 2004.
- Comparing Distributions. New York, NY: Springer; 2010.
- , , , et al. Survival from in‐hospital cardiac arrest during nights and weekends. JAMA. 2008;299(7):785–792.
It is thought that late afternoon hospital discharges create admission bottlenecks in the emergency department (ED).[1] As hospital occupancy increases, so too does ED boarding time.[2] Increased ED boarding time can result in increased length of stay (LOS)[3] and reduced patient and staff satisfaction.[4] Early in the day discharge programs are intended to improve hospital throughput.[5, 6, 7, 8, 9] Yet, ED admission timing is, in part, determined by external fluctuations in ED volume and acuity that early discharges do not impact.[10] We previously reported that high levels of discharge before noon (DBN) from inpatient medicine units is achievable through a multidisciplinary intervention.[5] We now evaluate the effect of this intervention upon admission patterns and the sustainability of the DBN initiative.
The DBN intervention consisted of afternoon interdisciplinary rounds, a checklist of team members' responsibilities, a standardized electronic communication tool, and daily feedback on the DBN rate.[5] The intervention resulted in an increase in the DBN rate from 11% to 38% in the first 13 months. We previously reported effects upon the discharged patient as measured by the observed to expected length of stay (O:E LOS) and 30‐day readmission rate. We now assess the effect of our DBN initiative on the subsequent patient and hospital throughput. Our objectives for this study were: (1) to determine the effect of DBN on the admission arrival times and admissions per hour to the units, and (2) in a separate data collection and analysis, to determine if the increased DBN rate is sustainable. We hypothesize that DBN results in admissions arriving onto the units earlier in the day. We further hypothesize that because of this redistribution, DBN will level the load of admissions, reducing admissions per hour peaks that can occur late in the day.
METHODS
Study Design, Participants, and Setting
This is a pre‐/postretrospective analysis evaluating the effect of a previously described DBN intervention.[5] Two inpatient acute‐care medicine units at NYU Langone Medical Center's Tisch Hospital, a 725‐bed, urban, academic medical center, were included in the analysis. All patients admitted to the units underwent the intervention.
Intervention
The DBN intervention began with a multidisciplinary kickoff event in which all team members received education on the importance of DBN, a clear description of roles in the DBN process, and a corresponding checklist of responsibilities. The checklist was utilized at new afternoon interdisciplinary rounds intended to identify next‐day DBNs. Patients identified in afternoon interdisciplinary rounds were logged in a DBN website that generated twice‐daily automated emails to communicate the planned DBN list to frontline staff and key stakeholders. Daily, real‐time feedback on the DBN rate was provided to floor staff.
Measures
Admission Arrival Time
The arrival location and time to any hospital area (ED, radiology, inpatient medical unit) is recorded in the electronic medical record (Epic, Madison, WI) at the time the patient arrives by the patient unit assistant or unit clerk. We obtained the arrival time to each hospital unit throughout the patient's hospitalization for all patients arriving to the study units during their hospitalization between June 1, 2011 and March 4, 2012 (the baseline period) and March 5, 2012 and June 31, 2013 (the intervention period). Data from October 25, 2012 to the end of January 2013 were excluded due to hospital closure from Hurricane Sandy. These time periods and exclusions match those used in our previous DBN article.[5] To match that study's criteria, we excluded patients on the units in the patient class observation, inpatient hospice, and those patients whose discharge disposition was expired or hospice.
ED Admissions
All patients with a first inpatient unit location of ED and no other inpatient unit location prior to arrival on the study units were included in the ED admission analysis. Units that treat but do not provide long‐term boarding/housing of inpatientssuch as radiology, hemodialysis, and cardiac catheterizationwere not considered in determining ED admission status. Even if a patient had recorded arrival to those areas between ED and study unit arrival, these patients were considered ED admissions, as they were never admitted to another inpatient unit.
Transfers and Direct Admissions
All patients whose first inpatient unit location was the study units were included in the transfers and direct admissions analysis. Those patients who were recorded as coming from another inpatient unit (such as another medical, surgical, step‐down, intensive care, or other specialty unit) prior to study unit arrival were included as intrahospital transfers.
Level Load of Admissions
Level loading is a lean methodology term that describes reducing the unevenness in a production line to enhance efficiency.[11] We evaluated this by comparing the admissions per hour (density distribution) to the studied units in the pre‐ and postintervention periods.
Sustainability of the DBN Intervention
The DBN intervention, as described in our original article, continues uninterrupted. Using the same methodology, inclusion criteria, exclusion criteria, and data analysis previously described, we gathered the discharge date and time as recorded by the patient unit assistant for all patients discharged from the study units for the 18 months (July 1, 2013 to December 31, 2014) after our original article to evaluate the sustainability of our improvement in DBN rates.
Statistical Analysis
Median admission time to the floor was compared between the 2 time periods using the Wilcoxon rank sum test. This is a non parametric test of the null hypothesis that the two time periods have the same distributions of admission time to the floor. To evaluate statistical significance, each admission time is arranged in order of magnitude and assigned a rank. The sum of the ranks for each group is calculated and the smaller rank sum (the W statistic) is compared to an expected range of values based on the sample sizes. If this value is out of range then one can reject the null hypothesis. The density distributions of admissions during the 2 time periods were compared using the Kolmogorov‐Smirnov test. The 2‐sided Kolmogorov‐Smirnov test evaluates the maximum distance (D) between the distributions of 2 samples.[12] We chose this test because it evaluates differences between both the position and shape of the distributions of the samples.
RESULTS
Setting Characteristics
The units had an average occupancy rate of 86.8% for the duration of the study. The average number of total discharges per day was 9.8. The average absolute length of stay was 5.6 days.
Admission Arrival Time to the Unit
ED Admissions
A total of 6566 patients were admitted from the ED to the units, 2756 in the baseline period and 3810 in the intervention period. The median arrival time to the units of ED admissions grouped by hour of the day moved by 1 hour, from 5 pm to 4 pm from the baseline to intervention period, and this change was statistically significant (W=16,211,778, P<0.01) (Figure 1).
Transfers and Direct Admissions
A total of 823 patients were transferred or directly admitted to the units, 310 in the baseline period and 513 in the intervention period. The median arrival time to the units grouped by hour of the day moved 1 hour from 5 pm to 4 pm, and this change was statistically significant (W=324,532, P<0.01) (Figure 2).
Level Load of Admissions
In the baseline period, the highest density of ED admissions occurred during the 5‐hour period from 5 pm to 10 pm, when 42.3% of daily admissions arrived (Figure 3). In the intervention period, the highest density of admissions occurred during the 5‐hour period from 3 pm to 8 pm, when 40.0% of daily admissions arrived. The difference between the density distributions for the 2 time periods was found to be statistically significant using the Kolmogorov‐Smirnov test (D=0.03, P<0.01).
In the baseline period, the highest density of transfers and direct admissions occurred during the 5‐hour period from 3 pm to 8 pm, when 51.7% of daily admissions arrived (Figure 3). In the intervention time period, the highest density of transfers and direct admissions occurred during the 5‐hour time period from 2 pm to 7 pm, when 50.3% of daily admissions arrived. The difference between the density distributions of transfers and direct admissions for the 2 time periods was not statistically significant using the Kolmogorov‐Smirnov test (D=0.04, P=0.3).
Sustainability of the DBN Intervention
For the 18 months after the prior reported DBN intervention period, an additional 5505 total discharges were included for analysis. Of these, 1796 were DBN. The average DBN rate for the study units from March 5, 2012 until December 31, 2014 (the original intervention period plus the additional 18 months of new data) is 35% (Figure 4).
DISCUSSION
The potential effects of DBN are multiple. By reducing the O:E LOS and allowing patients the time to acquire their medications, make follow‐up appointments, and ask questions while providers are still in the hospital, our DBN initiative impacts the discharged patient's quality, safety, and efficiency of care.[5] We now report how the DBN initiative potentially impacts the subsequent patient's efficiency of care and hospital throughput. In addition, we show that the DBN initiative is sustainable over years.
Over the same time course as our initial DBN intervention, we found a statistically significant change in the time when admitted patients arrive on the floor. This was true of those patients admitted through the ED and those directly admitted to the floor. In a complex hospital system with many factors both internal (bed cleaning, patient transportation) and external (natural variations in ED volume and acuity) affecting the timing of admissions, it is important to note that increasing the DBN rate correlates with a change in median admission arrival time. From a patient safety standpoint, any initiative that moves admissions away from evening and night hours and takes advantage of (usually more robust) day staffing is a potentially favorable intervention.[13]
We observed a statistically significant reduction of highest frequency peaks of ED admissions. It appears that opening beds up earlier in the day through DBN may help level the load of admissions from the ED. There was no effect on highest frequency peaks of transfer admissions to the floor. This may be due to the timing of transfers being dependent on factors other than bed availability, such as timing of transportation to the hospital or the timing of planned treatment.
We also found that the DBN intervention has created sustainable increases in the DBN rate. Since our initial publication, we have received direct communication from physicians, administrators and managers in 6 different states and 2 foreign countries asking for additional information or reporting that their hospitals are pursuing similar goals. Some of the most common questions asked include: Are your results sustained? and What do you think is a reasonable DBN goal? We have attempted to answer both of these questions. We previously reported improvement to an average DBN rate of 38% over the first 13 intervention months. With more time, we now see an absolute DBN rate of 35%. In November 2014, we restructured our medicine service to become geographic, so that the same group of doctors, trainees, nurses, care managers, and social workers care for patients on a single ward. Since this initiative, our DBN rate has climbed to greater than 40%. We hope to report further on this new intervention in the future. Similar hospital centers can consider using our experience on an inpatient acute‐care medical unit in an urban environment as a benchmark for setting hospital metric goals for early‐in‐the‐day discharge.
Several studies have previously reported on early‐in‐the‐day discharge initiatives. These were smaller studies that focused on descriptions of the type of intervention, including a discharge brunch on an obstetrics floor,[8] scheduled discharges,[6] in‐room displays of expected day and time of discharge,[9] and a physician‐centered discharge process.[7] Our study is substantially larger, focused on inpatient medicine units, and reports the effect of significant changes in DBN on patient and hospital metrics.
Our study had several limitations. The study is based in a single site, potentially limiting the generalizability of our findings. The hospital underwent tremendous change during the course of the intervention, including its temporary closure due to Hurricane Sandy. We cannot exclude effects related to shifts in volume and possible differences in the pre‐ and post‐time period patient populations. The prior study evaluated the population of discharged patients, but the admission analysis in this study involves the population of admitted patients. There may be slight differences in the populations due to the inclusion of patients who were admitted but not discharged from the units (for instance due to transfer after admission). Though the findings on admission arrival time correlate well with the increasing DBN rates, as they occur during the same time and in the same direction (earlier in the day), we are unable to conclude if the effect is causative. There were many interventions ongoing throughout the hospital to improve throughput, and these programs could have created local trends that confound our data. We are also unable to evaluate the clinical significance of a 1‐hour shift in median admission arrival time. Each hospital system must determine for itself if the time and resource investment in DBN is worth the change in admission timing described. We completed this analysis with the perspective of the inpatient medical unit experience, including the timing and number of admissions arriving to the units. We cannot exclude the possibility that changes in arrival times or boarding trends in the ED contribute to our findings.
CONCLUSION
In our hospital, a successful DBN initiative correlates with movement of ED admissions and transfers onto the inpatient units earlier in the day. There was a leveling of the load for ED admissions over the same time period. DBN continues to be an achievable hospital goal, and we provide a potential benchmark for similar hospitals.
Disclosure
Nothing to report.
- , , , Impact of admission and discharge peak times on hospital overcrowding. Stud Health Technol Inform. 2011;168:82–88.
- , , , et al. Time series analysis of emergency department length of stay per 8‐hour shift. West J Emerg Med. 2012;13(2):163–168.
- , , , , , Boarding inpatients in the emergency department increases discharged patient length of stay. J Emerg Med. 2013;44(1):230–235.
- , Overcrowding in the nation's emergency departments: complex causes and disturbing effects. Ann Emerg Med. 2000;35(1):63–68.
- , , , et al. Discharge before noon: an achievable hospital goal. J Hosp Med. 2014;9(4):210–214.
- , , All roads lead to scheduled discharges. Nursing. 2008;38(12):61–63.
- , , , Discharging patients earlier in the day: a concept worth evaluating. Health Care Manag (Frederick). 2007;26(2):142–146.
- , The discharge brunch: reducing chaos and increasing smiles on the OB unit. Nurs Womens Health. 2009;13(5):402–409.
- , , , et al. In‐room display of day and time patient is anticipated to leave hospital: a “discharge appointment”. J Hosp Med. 2007;2(1):13–16.
- , , , , , Emergency department crowding: factors influencing flow. West J Emerg Med. 2010;11(1):10–15.
- The Toyota Way: 14 Management Principles From the World's Greatest Manufacturer. New York, NY: McGraw‐Hill; 2004.
- Comparing Distributions. New York, NY: Springer; 2010.
- , , , et al. Survival from in‐hospital cardiac arrest during nights and weekends. JAMA. 2008;299(7):785–792.
© 2015 Society of Hospital Medicine
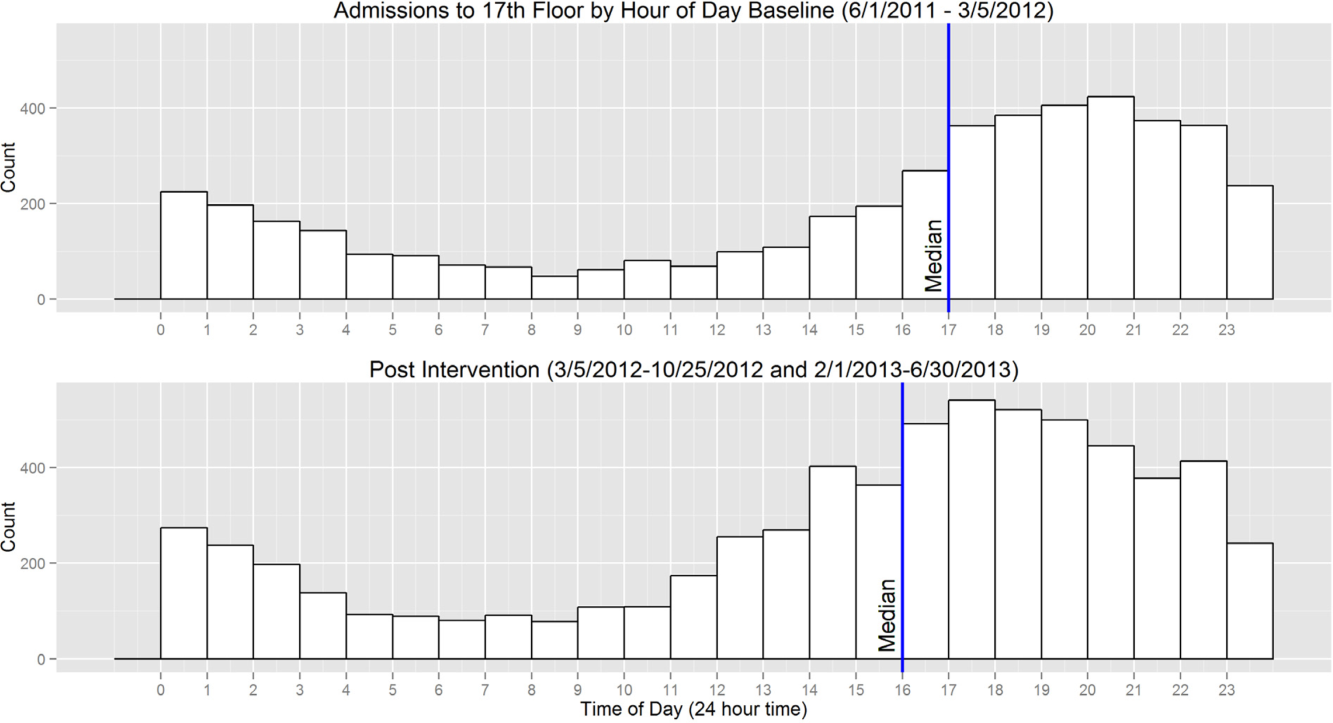
Variation in Readmission Rates by EDs
Readmissions of Medicare beneficiaries within 30 days of discharge are frequent and costly.[1] Concern about readmissions has prompted the Centers for Medicare & Medicaid Services (CMS) to reduce payments to hospitals with excess readmissions.[2] Research has identified a number of patient clinical and socio‐demographic factors associated with readmissions.[3] However, interventions designed to reduce readmissions have met with limited success. In a systematic review, no single intervention was regularly effective in reducing readmissions, despite the fact that interventions have targeted both predischarge, transition of care, and postdischarge processes of care.[4]
The different trajectories of care experienced by patients after hospital discharge, and their effect on risk of readmission, have been incompletely studied. Although early outpatient follow‐up after discharge is associated with lower readmission rates,[5, 6] a factor that has been minimally studied is the role of the emergency department (ED) and the ED provider in readmissions. The ED and ED providers feature prominently in the care received by patients shortly after discharge from a hospital. About a quarter of all hospitalized Medicare patients are evaluated in an ED within 30 days of discharge,[7, 8] and a majority of readmissions within 30 days of discharge are precipitated by an ED visit.[9] Hence, we asked whether when a recently discharged patient is seen in an ED, does the rate of readmission vary by ED provider and by ED facility?
We used Texas Medicare claims data to examine patients visiting the ED within 30 days of discharge from an initial hospitalization to determine if their risk of readmission varies by the ED provider caring for them and by the ED facility they visit.
METHODS
Sources of Data
We used claims from the years 2007 to 2011 for 100% of Texas Medicare beneficiaries, including Medicare beneficiary summary files, Medicare Provider Analysis and Review (MedPAR) files, Outpatient Standard Analytical Files (OutSAF), and Medicare Carrier files. We obtained diagnosis‐related group associated information, including weights, and Major Diagnostic Category from CMS, and used Provider of Services files to determine facility characteristics.
Establishment of the Study Cohort
From 2008 through 2011 MedPAR files, we initially selected all hospital discharges from acute‐care hospitals in Texas. From these 3,191,160 admissions, we excluded those discharged dead or transferred to other acute‐care hospitals (N=230,343), those who were younger than 66 years at admission (N=736,685) and those without complete Parts A and B enrollment or with any health maintenance organization enrollment in the 12 months prior to and 2 months after the admission of interest (N=596,427). From the remaining 1,627,705 discharges, we identified 302,949 discharges that were followed by at least 1 ED visit within 30 days.
We applied the algorithm developed by Kaskie et al. to identify ED visits.[10] We identified claims for ED services with Current Procedural Terminology (CPT) codes 99281‐99285 from Carrier files and bundled claims with overlapping dates or those that were within 1 day of each other. Then we identified claims for ED services using the same CPT codes from OutSAF and bundled those with overlapping dates or those that were within 3 days of each other. Finally, we bundled Carrier and OutSAF claims with overlapping dates and defined them as the same ED visit. From these, we retained only the first ED visit. We excluded those receiving care from multiple ED providers during the ED visit (N=38,565), and those who had a readmission before the first ED visit (N=1436), leaving 262,948 ED visits. For patients who had more than 1 hospitalization followed by an ED visit in a given year, we selected the first hospitalization, resulting in 199,143 ED visits. We then selected ED providers associated with at least 30 ED visits in this cohort, resulting in 1922 ED providers and 174,209 ED visits. For analyses where we examined both ED provider and facility variation in admission rates, we eliminated ED providers that generated charges from more than 1 ED facility, resulting in 525 providers and 48,883 ED visits at 143 ED facilities.
Measures
Patient Characteristics
We categorized beneficiaries by age, gender, and ethnicity using Medicare beneficiary summary files. We used the Medicaid indicator as a proxy of low socioeconomic status. We obtained information on weekend admission, emergent admission, discharge destination, and diagnosis‐related groupt (DRG) from MedPAR files. We identified comorbidities using the claims from MedPAR, Carrier, and OutSAF files in the year prior to the admission.[11] We identified total hospitalizations and outpatient visits in the prior year from MedPAR files and Carrier files, respectively. We obtained education status at the level of zip code of residence from the 2011 American Community Survey estimates from the United States Census Bureau. We determined urban or rural residence using the 2013 Rural‐Urban Continuum Codes developed by the United States Department of Agriculture.
ED Facility Characteristics
We used the provider number of the ED facility to link to the Provider of Services files and obtained information on medical school affiliation, facility size, and for profit status.
Study Outcomes
The outcome of this study was readmission after an ED visit within 30 days of discharge from an initial hospitalization. We defined readmission after an ED visit as a hospitalization starting the day of or the day following the ED visit
Statistical Analyses
We performed 2‐level analyses where patients were clustered with ED providers to examine variation among ED providers. The effect of ED providers was modeled as a random effect to account for the correlation among the patients cared for by the same ED provider. We derived ED provider‐specific estimates from models adjusted for patient age, gender, race/ethnicity, rural or urban residence, Medicaid eligibility, education at the zip code level of residence, and characteristics of the initial admission (emergency admission, weekend admission, discharge destination, its major diagnostic category and DRG weight). We also adjusted for comorbidities, number of hospitalizations, and number of physician visits in the year before the initial admission.
We also conducted 2‐level analyses where patients were nested in ED facilities and 3‐level analyses where patients were nested in ED providers and ED providers were nested in ED facilities. We adjusted for all factors described above. We computed the change in the variance between 2‐level and 2‐level analyses to determine the variation in readmission rates that was explained by the ED provider and the ED facility. All analyses were performed with SAS version 9.2 (SAS Institute Inc., Cary, NC).
RESULTS
We identified 174,209 patients who visited an ED within 30 days of discharge from an initial hospitalization. Table 1 describes the characteristics of these patients as well as the readmission rates associated with these characteristics. The rate of readmission of our cohort of 1,627,705 discharges with or without a following ED visit was 16.2%, whereas the rate of readmission following an ED visit in our final cohort of 174,209 patients was 52.67%. This readmission rate increased with age, from 49.31% for patients between 66 and 70 years of age to 55.33% for patients older than 85 years. There were minor variations by gender and ethnicity. Patients residing in metropolitan areas or in zip codes with low education levels had higher readmission rates, as did those whose original admission was classified as emergency or those who were not discharged home.
| Patient Characteristic | No. of ED Visits (%) | % Readmitted | Odds Ratio (95% CI)a |
|---|---|---|---|
| MeanSD, Median (Q1Q3) | Odds Ratio (95% CI)a | ||
| |||
| Overall | 174,209 (100) | 52.67 | |
| Age, y | |||
| 6670 | 32,962 (18.92) | 49.31 | 1.00 |
| 7175 | 34,979 (20.08) | 51.48 | 1.10 (1.06‐1.13)b |
| 7680 | 36,728 (21.08) | 53.01 | 1.15 (1.12‐1.19)b |
| 8185 | 34,784 (19.97) | 54.05 | 1.19 (1.15‐1.23)b |
| >85 | 34,756 (19.95) | 55.33 | 1.25 (1.21‐1.29)b |
| Gender | |||
| Male | 71,049 (40.78) | 52.95 | 1.02 (1.00‐1.04) |
| Female | 103,160 (59.22) | 52.48 | 1.00 |
| Race | |||
| Non‐Hispanic white | 124,312 (71.36) | 52.77 | 1.00 |
| Black | 16,809 (9.65) | 51.45 | 0.84 (0.81‐0.87)b |
| Hispanic | 30,618 (17.58) | 52.70 | 0.88 (0.85‐0.91)b |
| Other | 2,470 (1.42) | 55.71 | 1.06 (0.97‐1.15) |
| Rural/urban residence | |||
| Metropolitan | 136,739 (78.49) | 53.88 | 1.00 |
| Nonmetropolitan | 35,000 (20.09) | 48.16 | 0.96 (0.93‐0.99)b |
| Rural | 2,448 (1.41) | 50.04 | 1.04 (0.95‐1.13) |
| Medicaid eligible | |||
| No | 128,909 (74.00) | 52.65 | 1.00 |
| Yes | 45,300 (26.00) | 52.72 | 0.97 (0.94‐0.99)b |
| Education levelc | |||
| 1st quartile (lowest) | 43,863 (25.18) | 54.61 | 1.00 |
| 2nd quartile | 43,316 (24.86) | 53.92 | 1.00 (0.97‐1.03) |
| 3rd quartile | 43,571 (25.01) | 50.72 | 0.99 (0.96‐1.02) |
| 4th quartile (highest) | 43,318 (24.87) | 51.98 | 1.01 (0.97‐1.04) |
| Emergency admission | |||
| No | 99,101 (56.89) | 51.15 | 1.00 |
| Yes | 75,108 (43.11) | 54.68 | 1.07 (1.05‐1.09)b |
| Weekend admission | |||
| No | 131,266 (75.35) | 52.45 | 1.00 |
| Yes | 42,943 (24.65) | 53.35 | 1.01 (0.99‐1.04) |
| Discharge destination | |||
| Home | 122,542 (70.34) | 50.90 | 1.00 |
| Inpatient rehabilitation facility | 9,512 (5.46) | 55.48 | 1.31 (1.25‐1.37)b |
| Skilled nursing facility | 37,248 (21.38) | 57.25 | 1.29 (1.26‐1.33)b |
| Other | 4,907 (2.82) | 56.88 | 1.14 (1.07‐1.21)b |
| DRG weight (per unit) | 1.561.27, 0.82 (1.16‐1.83) | 1.06 (1.05‐1.07)b | |
| Hospitalization in the prior year (per hospitalization) | 1.031.49, 0.00 (1.00‐2.00) | 1.04 (1.03‐1.04)b | |
| Physician visits in the prior year (per 10 visits) | 11.759.80, 5.00 (10.00‐17.00) | 0.97 (0.96‐0.98)b | |
Table 1 also presents the odds of readmission adjusted for all other factors in the table and also adjusted for clustering within ED providers in a 2‐level model. Increasing age, white race, metropolitan residence, nonhome discharge, higher severity of illness, more hospitalizations in the prior year, fewer physician visits in the prior year, and an emergency initial admission were each associated with a higher readmission rate.
We next generated estimates of readmission rates for each ED provider from the adjusted 2‐level models. Figure 1 shows the adjusted cumulative readmission rates for the 1922 ED providers. This figure shows the mean value and 95% confidence intervals of the readmission rates for each provider. Dark vertical lines indicate providers whose readmission rate differed significantly from the mean adjusted readmission rate of 52.1% for all providers. Of the ED providers, 14.2% had significantly higher readmission rates. The mean readmission rate for these 272 providers was 67.2%. Of the ED providers, 14.7% had significantly lower readmission rates. The mean readmission rate for these 283 providers was 36.8%.

To determine the contribution of the ED facility to the variation in readmission rates, we restricted our analysis to 48,883 patients (28.06% of our cohort) seen by 525 ED providers who were associated with only 1 facility (total of 143 facilities). Table 2 describes the unadjusted readmission rates stratified by specific characteristics of those facilities. The unadjusted readmission rate increased with the size of the associated hospital, from 47.61% for hospitals with less than 100 beds to 57.06% for hospitals with more than 400 beds. The readmission rate for nonprofit facilities was 53.81% and for for‐profit facilities was 57.39%. Facilities with no medical school affiliation had a readmission rate of 54.51%, whereas those with a major affiliation had a readmission rate of 58.72%.
| ED Facility Characteristic | No. of ED Visits (%) | % Readmitted | Odds Ratio (95% CI)a |
|---|---|---|---|
| |||
| Overall | 48,883 | ||
| Total beds | |||
| 100 | 3,936 (8.05) | 47.61 | 1.00 |
| 101200 | 6,251 (12.79) | 52.07 | 1.38 (1.06‐1.81)b |
| 201400 | 13,000 (26.59) | 56.26 | 1.69 (1.32‐2.17)b |
| >400 | 25,696 (52.57) | 57.06 | 1.77 (1.35‐2.33)b |
| Type of control | |||
| Nonprofit | 24,999 (51.14) | 53.81 | 1.00 |
| Proprietary | 17,108 (35.00) | 57.39 | 1.32 (1.09‐1.61)b |
| Government | 6,776 (13.86) | 56.60 | 1.11 (0.88‐1.41) |
| Medical school affiliation | |||
| Major | 6,487 (13.27) | 58.72 | 1.00 |
| Limited | 7,066 (14.45) | 56.37 | 0.85 (0.58‐1.25) |
| Graduate | 3,164 (6.47) | 56.19 | 0.71 (0.44‐1.15) |
| No affiliation | 32,166 (65.80) | 54.51 | 0.78 (0.57‐1.05) |
| If the same hospital patient was discharged from | |||
| Yes | 38,532 (78.82) | 55.64 | 0.96 (0.91‐1.00) |
| No | 10,351 (21.18) | 54.73 | 1.00 |
With this smaller cohort, we performed 2 types of 2‐level models, where patients clustered within ED facilities and ER providers, respectively, and a 3‐level model accounting for clustering of patients within providers and of providers within facilities. From the facility‐patient 2‐level model, the variance of the ED facility was 0.2718 (95% confidence interval [CI]: 0.2083‐0.3696). From the provider‐patient 2‐level model, the variance of ED provider was 0.2532 (95% CI: 0.2166‐0.3002). However, when the 3‐level model was performed, the variance of ED provider decreased to 0.0893 (95% CI: 0.0723‐0.1132) and the variance of ED facility dropped to 0.2316 (95% CI: 0.1704‐0.3331) . This indicates 65% of the variation among ED providers was explained by the ED facility, and in contrast, 15% of the variation among ED facilities was explained by ED providers.
Table 2 also shows the adjusted odds of readmission generated from the 3‐level model. Patients receiving care in ED facilities in hospitals with more beds and in for‐profit hospitals were at higher risk for readmission. It is possible that patients seen at the ED associated with the discharging hospital had a lower risk of readmission. This finding was close to being statistically significant (P=0.051).
We repeated all the above analyses using an outcome of readmission anytime between the ED visit and 30 days after discharge from the initial hospitalization (rather than readmission on the day of or after the ED visit). All analyses produced results similar to the results presented above. For example, Figure 2 shows the adjusted cumulative readmission rates for the 1922 ED providers using this outcome. Of the ED providers, 12.8% had higher and 12.5% had lower readmission rates as compared to the mean readmission rate for all ED providers. The Spearman correlation coefficient between the rank of ED providers in immediate readmission rate (Figure 1) and readmission rate within 30 days of hospital discharge (Figure 2) was 0.94 (P<0.001).
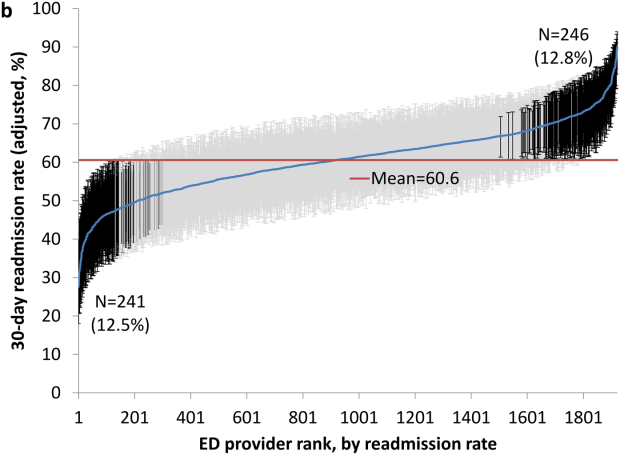
DISCUSSION
This study found substantial variation in readmission rates by ED provider, despite controlling for patient clinical and sociodemographic factors. In 3‐level models, the ED facility explained a substantial part of the variation by ED provider, with patients seen at larger facilities and for‐profit facilities having higher readmission rates.
Variation among ED facilities and ED providers in readmission rates has not previously been studied. There is literature on the variation in ED facility and ED provider admission rates. As readmissions are a subset of all admissions, this literature provides context to our findings. Abualenain et al. examined admission rates for 89 ED physicians for adult patients presenting with an acute medical or surgical complaint at 3 EDs in a health system.[12] After adjusting for patient and clinical characteristics, admission rates varied from 21% to 49% among physicians and from 27% to 41% among 3 facilities. Two other studies from single hospitals have found similar variation among providers.[13, 14] The reasons for the variation among ED providers presumably relate to subjective aspects of clinical assessment and the reluctance of providers to rely solely on objective scales, even when they are available.[14, 15] Variation in admission rates among different facilities may relate to clustering of providers with similar practice styles within facilities, lack of clinical guidelines for certain conditions, as well as differences among facilities in the socioeconomic status and access to primary care of their clientele.[12, 16, 17] For example, Pines et al. have shown that ED facility admission rates are higher in communities with fewer primary care physicians per capita and are influenced by the prevailing county level admission rates.[16] Capp et al. showed persistent variation in admission rates across hospitals, despite adjusting for clinical criteria such as vital signs, chief complaints, and severity of illness.[18]
Structural differences in ED facilities may also influence the decision to admit. We found that patients visiting ED facilities in hospitals with more beds had a higher readmission rate. ED facility systems of care such as observation units or protocols are associated with lower admission rates.[19, 20] Finally, certain hospitals may actively influence the admission practice patterns of their ED providers. We noted that patients seen at for‐profit ED facilities had a greater risk of readmission. A similar finding has been described by Pines et al., who noted higher admission rates at for‐profit facilities.[16] In an extreme example, a recent Justice Department lawsuit alleged that a for‐profit hospital chain used software systems and financial incentives to ED providers to increase admissions.[21]
It is possible that the providers with low readmission rates may have inappropriately released patients who truly should have been admitted. A signal that this occurred would be if these patients were readmitted in the days after the ED visits. We examined this possibility by additionally examining readmissions occurring anytime between the ED visit until 30 days after discharge from the initial hospitalization. The results were similar to when we only included readmissions that occurred immediately following the ED visit, with a very high correlation (r=0.94) between the ranking of the ED providers by readmission rates in both circumstances. This suggests that the decisions of the ED providers with low readmission rates to admit or release from the ED were likely appropriate.
Our research has limitations. We studied patients with fee‐for‐service Medicare in a single large state in the United States over a 4‐year period. Our findings may not be generalizable to younger patient populations, other regions with different sociodemographic patterns and healthcare systems, or other time periods. We could not control for many factors that may impact the risk of readmission but are not measured in Medicare databases (eg, clinical data such as vital signs, measures of quality of transition from discharging hospital, ED provider workload). To attribute care to a single ED provider, we excluded patients who were taken care of by multiple ED providers. These patients may have different needs from our study population (eg, more complex issues and longer stays in the ED) and may bias our results.
This study provides a new direction for research and quality improvement targeting readmissions. Research should extend beyond the discharge transition and examine the entire trajectory of posthospitalization care to better understand readmissions. Based directly on this study, research could investigate the practice patterns of ED providers and systems of care at ED facilities that affect readmissions rates. Such investigation could inform quality improvement efforts to standardize care for patients in the ED.
CMS policies hold hospitals accountable for readmissions of the patients they discharge, but do not address the admission process in the ED that leads to readmissions of recently discharged patients. Given the present study, and the fact that the proportion of all hospital admissions that occur through the ED has grown to 44%,[22] consideration of the role of the ED in public policy efforts to discourage unnecessary inpatient care may be appropriate.
In summary, this study shows that a recently discharged patient's chances of being readmitted depends partly on the ED provider who evaluates them and on the ED facility at which they seek care. ED provider practice patterns and ED facility systems of care may be a target for interventions aimed at decreasing readmission rates.
Disclosures
This research was supported by grants from the National Institutes of Health (AG033134 and K05CA134923) and from the Agency for Healthcare Research and Quality (R24H5022134). The authors report no conflicts of interest.
- , , Rehospitalizations among patients in the Medicare Fee‐for‐Service Program. N Engl J Med. 2009;360:1418–1428.
- Centers for Medicare 306:1688–1698.
- , , , , Interventions to reduce 30‐day rehospitalization: a systematic review. Ann Intern Med. 2011;155:520–528.
- , , , , Outpatient follow‐up visit and 30‐day emergency department visit and readmission in patients hospitalized for chronic obstructive pulmonary disease. Arch Intern Med. 2010;170:1664–1670.
- , , , et al. Relationship between early physician follow‐up and 30‐day readmission among Medicare beneficiaries hospitalized for heart failure. JAMA. 2010;303:1716–1722.
- , , After hospitalization: a Dartmouth Atlas report on post‐acute care for Medicare beneficiaries. Dartmouth Atlas website. Available at: www.dartmouthatlas.org/downloads/reports/Post_discharge_events_092811.pdf. Accessed August 8, 2013.
- , , , Emergency department visits after hospital discharge: a missing part of the equation. Ann Emerg Med. 2013;62:145–150.
- , , , Emergency department visits after surgery are common for Medicare patients, suggesting opportunities to improve care. Health Aff (Millwood). 2013;32:1600–1607.
- , , , et al. Defining emergency department episodes by severity and intensity: a 15‐year study of Medicare beneficiaries. BMC Health Serv Res. 2010;10:1–13.
- , , , Comorbidity measures for use with administrative data. Med Care. 1998;36:8–27.
- , , , , , Emergency department physician‐level and hospital‐level variation in admission rates. Ann Emerg Med. 2013;61:638–643.
- , , , et al. Hospital admission decision for patients with community‐acquired pneumonia: variability among physicians in an emergency department. Ann Emerg Med. 2012;59:35–41.
- , , Individual emergency physician admission rates: predictably unpredictable. CJEM. 2009;11(2):149–155.
- , , , , , Reasons why emergency department providers do not rely on the pneumonia severity index to determine the initial site of treatment for patients with pneumonia. Clin Infect Dis. 2009;49:e100–e108.
- , , Variation in emergency department admission rates across the United States. Med Care Res Rev. 2013;70:218–231.
- , , , , , Variation in US hospital emergency department admission rates by clinical condition. Med Care. 2015;53:237–244.
- , , , et al. Hospital variation in risk‐standardized hospital admission rates from US EDs among adults. Am J Emerg Med. 2014;32:837–843.
- , , The effect of an observation unit on the rate of ED admission and discharge for pyelonephritis. Am J Emerg Med. 2010;28:682–688.
- , , , , , Protocol‐driven emergency department observation units offer savings, shorter stays, and reduced admissions. Health Aff (Millwood). 2013;32:2149–2156.
- , Hospital chain said to scheme to inflate bills. New York Times. January 23, 2014. Available at: http://www.nytimes.com/2014/01/24/business/hospital‐chain‐said‐to‐scheme‐to‐inflate‐bills.html?emc=eta1367:391–393.
Readmissions of Medicare beneficiaries within 30 days of discharge are frequent and costly.[1] Concern about readmissions has prompted the Centers for Medicare & Medicaid Services (CMS) to reduce payments to hospitals with excess readmissions.[2] Research has identified a number of patient clinical and socio‐demographic factors associated with readmissions.[3] However, interventions designed to reduce readmissions have met with limited success. In a systematic review, no single intervention was regularly effective in reducing readmissions, despite the fact that interventions have targeted both predischarge, transition of care, and postdischarge processes of care.[4]
The different trajectories of care experienced by patients after hospital discharge, and their effect on risk of readmission, have been incompletely studied. Although early outpatient follow‐up after discharge is associated with lower readmission rates,[5, 6] a factor that has been minimally studied is the role of the emergency department (ED) and the ED provider in readmissions. The ED and ED providers feature prominently in the care received by patients shortly after discharge from a hospital. About a quarter of all hospitalized Medicare patients are evaluated in an ED within 30 days of discharge,[7, 8] and a majority of readmissions within 30 days of discharge are precipitated by an ED visit.[9] Hence, we asked whether when a recently discharged patient is seen in an ED, does the rate of readmission vary by ED provider and by ED facility?
We used Texas Medicare claims data to examine patients visiting the ED within 30 days of discharge from an initial hospitalization to determine if their risk of readmission varies by the ED provider caring for them and by the ED facility they visit.
METHODS
Sources of Data
We used claims from the years 2007 to 2011 for 100% of Texas Medicare beneficiaries, including Medicare beneficiary summary files, Medicare Provider Analysis and Review (MedPAR) files, Outpatient Standard Analytical Files (OutSAF), and Medicare Carrier files. We obtained diagnosis‐related group associated information, including weights, and Major Diagnostic Category from CMS, and used Provider of Services files to determine facility characteristics.
Establishment of the Study Cohort
From 2008 through 2011 MedPAR files, we initially selected all hospital discharges from acute‐care hospitals in Texas. From these 3,191,160 admissions, we excluded those discharged dead or transferred to other acute‐care hospitals (N=230,343), those who were younger than 66 years at admission (N=736,685) and those without complete Parts A and B enrollment or with any health maintenance organization enrollment in the 12 months prior to and 2 months after the admission of interest (N=596,427). From the remaining 1,627,705 discharges, we identified 302,949 discharges that were followed by at least 1 ED visit within 30 days.
We applied the algorithm developed by Kaskie et al. to identify ED visits.[10] We identified claims for ED services with Current Procedural Terminology (CPT) codes 99281‐99285 from Carrier files and bundled claims with overlapping dates or those that were within 1 day of each other. Then we identified claims for ED services using the same CPT codes from OutSAF and bundled those with overlapping dates or those that were within 3 days of each other. Finally, we bundled Carrier and OutSAF claims with overlapping dates and defined them as the same ED visit. From these, we retained only the first ED visit. We excluded those receiving care from multiple ED providers during the ED visit (N=38,565), and those who had a readmission before the first ED visit (N=1436), leaving 262,948 ED visits. For patients who had more than 1 hospitalization followed by an ED visit in a given year, we selected the first hospitalization, resulting in 199,143 ED visits. We then selected ED providers associated with at least 30 ED visits in this cohort, resulting in 1922 ED providers and 174,209 ED visits. For analyses where we examined both ED provider and facility variation in admission rates, we eliminated ED providers that generated charges from more than 1 ED facility, resulting in 525 providers and 48,883 ED visits at 143 ED facilities.
Measures
Patient Characteristics
We categorized beneficiaries by age, gender, and ethnicity using Medicare beneficiary summary files. We used the Medicaid indicator as a proxy of low socioeconomic status. We obtained information on weekend admission, emergent admission, discharge destination, and diagnosis‐related groupt (DRG) from MedPAR files. We identified comorbidities using the claims from MedPAR, Carrier, and OutSAF files in the year prior to the admission.[11] We identified total hospitalizations and outpatient visits in the prior year from MedPAR files and Carrier files, respectively. We obtained education status at the level of zip code of residence from the 2011 American Community Survey estimates from the United States Census Bureau. We determined urban or rural residence using the 2013 Rural‐Urban Continuum Codes developed by the United States Department of Agriculture.
ED Facility Characteristics
We used the provider number of the ED facility to link to the Provider of Services files and obtained information on medical school affiliation, facility size, and for profit status.
Study Outcomes
The outcome of this study was readmission after an ED visit within 30 days of discharge from an initial hospitalization. We defined readmission after an ED visit as a hospitalization starting the day of or the day following the ED visit
Statistical Analyses
We performed 2‐level analyses where patients were clustered with ED providers to examine variation among ED providers. The effect of ED providers was modeled as a random effect to account for the correlation among the patients cared for by the same ED provider. We derived ED provider‐specific estimates from models adjusted for patient age, gender, race/ethnicity, rural or urban residence, Medicaid eligibility, education at the zip code level of residence, and characteristics of the initial admission (emergency admission, weekend admission, discharge destination, its major diagnostic category and DRG weight). We also adjusted for comorbidities, number of hospitalizations, and number of physician visits in the year before the initial admission.
We also conducted 2‐level analyses where patients were nested in ED facilities and 3‐level analyses where patients were nested in ED providers and ED providers were nested in ED facilities. We adjusted for all factors described above. We computed the change in the variance between 2‐level and 2‐level analyses to determine the variation in readmission rates that was explained by the ED provider and the ED facility. All analyses were performed with SAS version 9.2 (SAS Institute Inc., Cary, NC).
RESULTS
We identified 174,209 patients who visited an ED within 30 days of discharge from an initial hospitalization. Table 1 describes the characteristics of these patients as well as the readmission rates associated with these characteristics. The rate of readmission of our cohort of 1,627,705 discharges with or without a following ED visit was 16.2%, whereas the rate of readmission following an ED visit in our final cohort of 174,209 patients was 52.67%. This readmission rate increased with age, from 49.31% for patients between 66 and 70 years of age to 55.33% for patients older than 85 years. There were minor variations by gender and ethnicity. Patients residing in metropolitan areas or in zip codes with low education levels had higher readmission rates, as did those whose original admission was classified as emergency or those who were not discharged home.
| Patient Characteristic | No. of ED Visits (%) | % Readmitted | Odds Ratio (95% CI)a |
|---|---|---|---|
| MeanSD, Median (Q1Q3) | Odds Ratio (95% CI)a | ||
| |||
| Overall | 174,209 (100) | 52.67 | |
| Age, y | |||
| 6670 | 32,962 (18.92) | 49.31 | 1.00 |
| 7175 | 34,979 (20.08) | 51.48 | 1.10 (1.06‐1.13)b |
| 7680 | 36,728 (21.08) | 53.01 | 1.15 (1.12‐1.19)b |
| 8185 | 34,784 (19.97) | 54.05 | 1.19 (1.15‐1.23)b |
| >85 | 34,756 (19.95) | 55.33 | 1.25 (1.21‐1.29)b |
| Gender | |||
| Male | 71,049 (40.78) | 52.95 | 1.02 (1.00‐1.04) |
| Female | 103,160 (59.22) | 52.48 | 1.00 |
| Race | |||
| Non‐Hispanic white | 124,312 (71.36) | 52.77 | 1.00 |
| Black | 16,809 (9.65) | 51.45 | 0.84 (0.81‐0.87)b |
| Hispanic | 30,618 (17.58) | 52.70 | 0.88 (0.85‐0.91)b |
| Other | 2,470 (1.42) | 55.71 | 1.06 (0.97‐1.15) |
| Rural/urban residence | |||
| Metropolitan | 136,739 (78.49) | 53.88 | 1.00 |
| Nonmetropolitan | 35,000 (20.09) | 48.16 | 0.96 (0.93‐0.99)b |
| Rural | 2,448 (1.41) | 50.04 | 1.04 (0.95‐1.13) |
| Medicaid eligible | |||
| No | 128,909 (74.00) | 52.65 | 1.00 |
| Yes | 45,300 (26.00) | 52.72 | 0.97 (0.94‐0.99)b |
| Education levelc | |||
| 1st quartile (lowest) | 43,863 (25.18) | 54.61 | 1.00 |
| 2nd quartile | 43,316 (24.86) | 53.92 | 1.00 (0.97‐1.03) |
| 3rd quartile | 43,571 (25.01) | 50.72 | 0.99 (0.96‐1.02) |
| 4th quartile (highest) | 43,318 (24.87) | 51.98 | 1.01 (0.97‐1.04) |
| Emergency admission | |||
| No | 99,101 (56.89) | 51.15 | 1.00 |
| Yes | 75,108 (43.11) | 54.68 | 1.07 (1.05‐1.09)b |
| Weekend admission | |||
| No | 131,266 (75.35) | 52.45 | 1.00 |
| Yes | 42,943 (24.65) | 53.35 | 1.01 (0.99‐1.04) |
| Discharge destination | |||
| Home | 122,542 (70.34) | 50.90 | 1.00 |
| Inpatient rehabilitation facility | 9,512 (5.46) | 55.48 | 1.31 (1.25‐1.37)b |
| Skilled nursing facility | 37,248 (21.38) | 57.25 | 1.29 (1.26‐1.33)b |
| Other | 4,907 (2.82) | 56.88 | 1.14 (1.07‐1.21)b |
| DRG weight (per unit) | 1.561.27, 0.82 (1.16‐1.83) | 1.06 (1.05‐1.07)b | |
| Hospitalization in the prior year (per hospitalization) | 1.031.49, 0.00 (1.00‐2.00) | 1.04 (1.03‐1.04)b | |
| Physician visits in the prior year (per 10 visits) | 11.759.80, 5.00 (10.00‐17.00) | 0.97 (0.96‐0.98)b | |
Table 1 also presents the odds of readmission adjusted for all other factors in the table and also adjusted for clustering within ED providers in a 2‐level model. Increasing age, white race, metropolitan residence, nonhome discharge, higher severity of illness, more hospitalizations in the prior year, fewer physician visits in the prior year, and an emergency initial admission were each associated with a higher readmission rate.
We next generated estimates of readmission rates for each ED provider from the adjusted 2‐level models. Figure 1 shows the adjusted cumulative readmission rates for the 1922 ED providers. This figure shows the mean value and 95% confidence intervals of the readmission rates for each provider. Dark vertical lines indicate providers whose readmission rate differed significantly from the mean adjusted readmission rate of 52.1% for all providers. Of the ED providers, 14.2% had significantly higher readmission rates. The mean readmission rate for these 272 providers was 67.2%. Of the ED providers, 14.7% had significantly lower readmission rates. The mean readmission rate for these 283 providers was 36.8%.
To determine the contribution of the ED facility to the variation in readmission rates, we restricted our analysis to 48,883 patients (28.06% of our cohort) seen by 525 ED providers who were associated with only 1 facility (total of 143 facilities). Table 2 describes the unadjusted readmission rates stratified by specific characteristics of those facilities. The unadjusted readmission rate increased with the size of the associated hospital, from 47.61% for hospitals with less than 100 beds to 57.06% for hospitals with more than 400 beds. The readmission rate for nonprofit facilities was 53.81% and for for‐profit facilities was 57.39%. Facilities with no medical school affiliation had a readmission rate of 54.51%, whereas those with a major affiliation had a readmission rate of 58.72%.
| ED Facility Characteristic | No. of ED Visits (%) | % Readmitted | Odds Ratio (95% CI)a |
|---|---|---|---|
| |||
| Overall | 48,883 | ||
| Total beds | |||
| 100 | 3,936 (8.05) | 47.61 | 1.00 |
| 101200 | 6,251 (12.79) | 52.07 | 1.38 (1.06‐1.81)b |
| 201400 | 13,000 (26.59) | 56.26 | 1.69 (1.32‐2.17)b |
| >400 | 25,696 (52.57) | 57.06 | 1.77 (1.35‐2.33)b |
| Type of control | |||
| Nonprofit | 24,999 (51.14) | 53.81 | 1.00 |
| Proprietary | 17,108 (35.00) | 57.39 | 1.32 (1.09‐1.61)b |
| Government | 6,776 (13.86) | 56.60 | 1.11 (0.88‐1.41) |
| Medical school affiliation | |||
| Major | 6,487 (13.27) | 58.72 | 1.00 |
| Limited | 7,066 (14.45) | 56.37 | 0.85 (0.58‐1.25) |
| Graduate | 3,164 (6.47) | 56.19 | 0.71 (0.44‐1.15) |
| No affiliation | 32,166 (65.80) | 54.51 | 0.78 (0.57‐1.05) |
| If the same hospital patient was discharged from | |||
| Yes | 38,532 (78.82) | 55.64 | 0.96 (0.91‐1.00) |
| No | 10,351 (21.18) | 54.73 | 1.00 |
With this smaller cohort, we performed 2 types of 2‐level models, where patients clustered within ED facilities and ER providers, respectively, and a 3‐level model accounting for clustering of patients within providers and of providers within facilities. From the facility‐patient 2‐level model, the variance of the ED facility was 0.2718 (95% confidence interval [CI]: 0.2083‐0.3696). From the provider‐patient 2‐level model, the variance of ED provider was 0.2532 (95% CI: 0.2166‐0.3002). However, when the 3‐level model was performed, the variance of ED provider decreased to 0.0893 (95% CI: 0.0723‐0.1132) and the variance of ED facility dropped to 0.2316 (95% CI: 0.1704‐0.3331) . This indicates 65% of the variation among ED providers was explained by the ED facility, and in contrast, 15% of the variation among ED facilities was explained by ED providers.
Table 2 also shows the adjusted odds of readmission generated from the 3‐level model. Patients receiving care in ED facilities in hospitals with more beds and in for‐profit hospitals were at higher risk for readmission. It is possible that patients seen at the ED associated with the discharging hospital had a lower risk of readmission. This finding was close to being statistically significant (P=0.051).
We repeated all the above analyses using an outcome of readmission anytime between the ED visit and 30 days after discharge from the initial hospitalization (rather than readmission on the day of or after the ED visit). All analyses produced results similar to the results presented above. For example, Figure 2 shows the adjusted cumulative readmission rates for the 1922 ED providers using this outcome. Of the ED providers, 12.8% had higher and 12.5% had lower readmission rates as compared to the mean readmission rate for all ED providers. The Spearman correlation coefficient between the rank of ED providers in immediate readmission rate (Figure 1) and readmission rate within 30 days of hospital discharge (Figure 2) was 0.94 (P<0.001).
DISCUSSION
This study found substantial variation in readmission rates by ED provider, despite controlling for patient clinical and sociodemographic factors. In 3‐level models, the ED facility explained a substantial part of the variation by ED provider, with patients seen at larger facilities and for‐profit facilities having higher readmission rates.
Variation among ED facilities and ED providers in readmission rates has not previously been studied. There is literature on the variation in ED facility and ED provider admission rates. As readmissions are a subset of all admissions, this literature provides context to our findings. Abualenain et al. examined admission rates for 89 ED physicians for adult patients presenting with an acute medical or surgical complaint at 3 EDs in a health system.[12] After adjusting for patient and clinical characteristics, admission rates varied from 21% to 49% among physicians and from 27% to 41% among 3 facilities. Two other studies from single hospitals have found similar variation among providers.[13, 14] The reasons for the variation among ED providers presumably relate to subjective aspects of clinical assessment and the reluctance of providers to rely solely on objective scales, even when they are available.[14, 15] Variation in admission rates among different facilities may relate to clustering of providers with similar practice styles within facilities, lack of clinical guidelines for certain conditions, as well as differences among facilities in the socioeconomic status and access to primary care of their clientele.[12, 16, 17] For example, Pines et al. have shown that ED facility admission rates are higher in communities with fewer primary care physicians per capita and are influenced by the prevailing county level admission rates.[16] Capp et al. showed persistent variation in admission rates across hospitals, despite adjusting for clinical criteria such as vital signs, chief complaints, and severity of illness.[18]
Structural differences in ED facilities may also influence the decision to admit. We found that patients visiting ED facilities in hospitals with more beds had a higher readmission rate. ED facility systems of care such as observation units or protocols are associated with lower admission rates.[19, 20] Finally, certain hospitals may actively influence the admission practice patterns of their ED providers. We noted that patients seen at for‐profit ED facilities had a greater risk of readmission. A similar finding has been described by Pines et al., who noted higher admission rates at for‐profit facilities.[16] In an extreme example, a recent Justice Department lawsuit alleged that a for‐profit hospital chain used software systems and financial incentives to ED providers to increase admissions.[21]
It is possible that the providers with low readmission rates may have inappropriately released patients who truly should have been admitted. A signal that this occurred would be if these patients were readmitted in the days after the ED visits. We examined this possibility by additionally examining readmissions occurring anytime between the ED visit until 30 days after discharge from the initial hospitalization. The results were similar to when we only included readmissions that occurred immediately following the ED visit, with a very high correlation (r=0.94) between the ranking of the ED providers by readmission rates in both circumstances. This suggests that the decisions of the ED providers with low readmission rates to admit or release from the ED were likely appropriate.
Our research has limitations. We studied patients with fee‐for‐service Medicare in a single large state in the United States over a 4‐year period. Our findings may not be generalizable to younger patient populations, other regions with different sociodemographic patterns and healthcare systems, or other time periods. We could not control for many factors that may impact the risk of readmission but are not measured in Medicare databases (eg, clinical data such as vital signs, measures of quality of transition from discharging hospital, ED provider workload). To attribute care to a single ED provider, we excluded patients who were taken care of by multiple ED providers. These patients may have different needs from our study population (eg, more complex issues and longer stays in the ED) and may bias our results.
This study provides a new direction for research and quality improvement targeting readmissions. Research should extend beyond the discharge transition and examine the entire trajectory of posthospitalization care to better understand readmissions. Based directly on this study, research could investigate the practice patterns of ED providers and systems of care at ED facilities that affect readmissions rates. Such investigation could inform quality improvement efforts to standardize care for patients in the ED.
CMS policies hold hospitals accountable for readmissions of the patients they discharge, but do not address the admission process in the ED that leads to readmissions of recently discharged patients. Given the present study, and the fact that the proportion of all hospital admissions that occur through the ED has grown to 44%,[22] consideration of the role of the ED in public policy efforts to discourage unnecessary inpatient care may be appropriate.
In summary, this study shows that a recently discharged patient's chances of being readmitted depends partly on the ED provider who evaluates them and on the ED facility at which they seek care. ED provider practice patterns and ED facility systems of care may be a target for interventions aimed at decreasing readmission rates.
Disclosures
This research was supported by grants from the National Institutes of Health (AG033134 and K05CA134923) and from the Agency for Healthcare Research and Quality (R24H5022134). The authors report no conflicts of interest.
- , , Rehospitalizations among patients in the Medicare Fee‐for‐Service Program. N Engl J Med. 2009;360:1418–1428.
- Centers for Medicare 306:1688–1698.
- , , , , Interventions to reduce 30‐day rehospitalization: a systematic review. Ann Intern Med. 2011;155:520–528.
- , , , , Outpatient follow‐up visit and 30‐day emergency department visit and readmission in patients hospitalized for chronic obstructive pulmonary disease. Arch Intern Med. 2010;170:1664–1670.
- , , , et al. Relationship between early physician follow‐up and 30‐day readmission among Medicare beneficiaries hospitalized for heart failure. JAMA. 2010;303:1716–1722.
- , , After hospitalization: a Dartmouth Atlas report on post‐acute care for Medicare beneficiaries. Dartmouth Atlas website. Available at: www.dartmouthatlas.org/downloads/reports/Post_discharge_events_092811.pdf. Accessed August 8, 2013.
- , , , Emergency department visits after hospital discharge: a missing part of the equation. Ann Emerg Med. 2013;62:145–150.
- , , , Emergency department visits after surgery are common for Medicare patients, suggesting opportunities to improve care. Health Aff (Millwood). 2013;32:1600–1607.
- , , , et al. Defining emergency department episodes by severity and intensity: a 15‐year study of Medicare beneficiaries. BMC Health Serv Res. 2010;10:1–13.
- , , , Comorbidity measures for use with administrative data. Med Care. 1998;36:8–27.
- , , , , , Emergency department physician‐level and hospital‐level variation in admission rates. Ann Emerg Med. 2013;61:638–643.
- , , , et al. Hospital admission decision for patients with community‐acquired pneumonia: variability among physicians in an emergency department. Ann Emerg Med. 2012;59:35–41.
- , , Individual emergency physician admission rates: predictably unpredictable. CJEM. 2009;11(2):149–155.
- , , , , , Reasons why emergency department providers do not rely on the pneumonia severity index to determine the initial site of treatment for patients with pneumonia. Clin Infect Dis. 2009;49:e100–e108.
- , , Variation in emergency department admission rates across the United States. Med Care Res Rev. 2013;70:218–231.
- , , , , , Variation in US hospital emergency department admission rates by clinical condition. Med Care. 2015;53:237–244.
- , , , et al. Hospital variation in risk‐standardized hospital admission rates from US EDs among adults. Am J Emerg Med. 2014;32:837–843.
- , , The effect of an observation unit on the rate of ED admission and discharge for pyelonephritis. Am J Emerg Med. 2010;28:682–688.
- , , , , , Protocol‐driven emergency department observation units offer savings, shorter stays, and reduced admissions. Health Aff (Millwood). 2013;32:2149–2156.
- , Hospital chain said to scheme to inflate bills. New York Times. January 23, 2014. Available at: http://www.nytimes.com/2014/01/24/business/hospital‐chain‐said‐to‐scheme‐to‐inflate‐bills.html?emc=eta1367:391–393.
© 2015 Society of Hospital Medicine
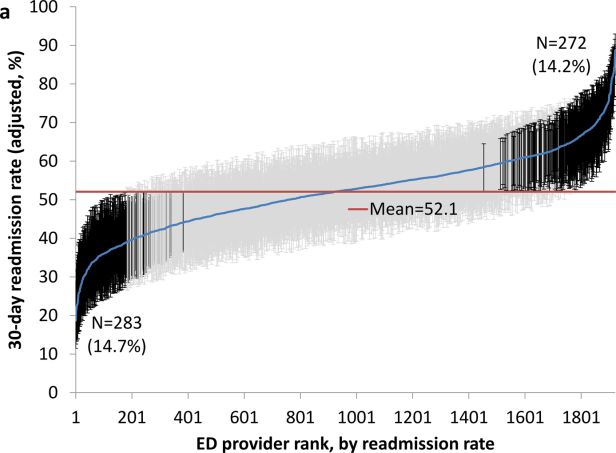
Weekend Discharge and Readmission
Hospital readmission, defined as an admission to a hospital within 30 days of discharge from an acute‐care hospitalization, is associated with short‐term morbidity, mortality, and medical costs.[1] In 2013, the Patient Protection and Affordable Care Act began assigning financial penalties to hospitals based on performance against benchmarks on readmission for acute myocardial infarction (AMI), pneumonia (PNA), and congestive heart failure (CHF) through its Hospital Readmission Reduction Program (HRRP).[2] In its third year, the program recently announced penalties for 2,610 hospitals that will total over $428 million.[3] Despite increased attention to this issue, few interventions have been identified that effectively reduce hospital readmissions.[4, 5]
Hospital discharge is a complex process that aims to achieve the safe transfer of care of a hospitalized patient to another setting (eg, home, skilled nursing facility [SNF]). Success depends on adequate staffing of physicians, nurses, case managers, social workers, and pharmacists; clear communication among patients and providers; and integrated coordination of care. Although much focus has been placed on the association between weekend hospital admission and increased mortality,[6, 7, 8] very little is known about the impact of weekend hospital discharge on outcomes, specifically hospital readmission rates. Furthermore, previous studies on this topic, based on Canadian data, have produced conflicting results.[9, 10, 11]
Staffing of physicians, physician extenders (eg, physician assistants or nurse practitioners), nurses, case managers, social workers, and ancillary staff (eg, physical and occupational therapists) are all typically reduced on the weekend. Patients may be cared for by covering healthcare providers. These factors may have important implications on the timeliness of discharge, accuracy of discharge instructions, safety of discharge (eg, clearance by physical therapy), and medication reconciliation, among others. Clinic offices are more likely to be closed, and therefore, some follow‐up appointments may inadvertently not be scheduled, and lack of timely postdischarge follow‐up may be associated with higher rates of readmission.[12] Reduced outpatient pharmacy availability may also cause delays in patients receiving their medications,[13] which may exacerbate failed transition to the outpatient setting due to medication noncompliance.[14]
Based on this rationale, the current study was designed to investigate the association between weekend discharge and 30‐ and 90‐ day readmissions in patients hospitalized for medical diagnoses included in Centers for Medicare and Medicaid Services' HRRP.[15] To do so, a large‐state, all‐payer discharge database with individual patient record linkage numbers (RLN) was selected to capture all readmissions, even those to a different hospital. We hypothesized that patients who are discharged on a weekend would have higher hospital readmission rates compared to those discharged on a weekday.
METHODS
Approval was obtained from both the California Committee for the Protection of Human Subjects and the Stanford University Institutional Review Board. The California Office of State Health Planning and Development (OSHPD) 2012 Patient Discharge Data (PDD) was utilized for this study. The OSHPD‐PDD contains records for all patients admitted and eventually discharged from every general, acute, nonfederal hospital within the state. Demographic variables contained in the dataset include age, gender, race, and a unique RLN (an individually assigned number based on the patient's social security number and other demographics) to associate discharged patients with subsequent hospitalizations. Clinical information collected included principal diagnosis (indication for admission), 24 additional diagnoses with an indicator as to whether or not the condition was present on admission (POA) to differentiate comorbidities from complications, and principle procedure codes. Details about the admission included date of admission and discharge, admission type (scheduled or unscheduled), expected payer/emnsurance and disposition (home, acute rehabilitation, skilled nursing facility, residential facility, other). Details about the hospital included a unique identification number to indicate the location of care for both index/discharge and subsequent readmission.
International Classification of Disease, Ninth Edition, Clinical Modification (ICD‐9‐CM) coding schema were used to identify all patients admitted with the principal diagnosis of AMI (ICD‐9‐CM code 410.xx), CHF (428.xx), or PNA (480.xx‐486.xx). We excluded patients who were coded as having in‐hospital mortality, as these patients would not be eligible for readmission, those who were transferred to a different inpatient acute‐care facility, and those with invalid RLNs. Patients were separated into 2 groups based on the day of discharge. Weekday was defined as Monday through Friday, whereas weekend was defined as Saturday and Sunday. The Charlson Comorbidity Index was calculated based on POA comorbidities.
Demographic data, hospital variables, and readmission rates were directly compared for patients discharged on a weekend compared to weekday after admission for AMI, CHF, or PNA. Hospital readmission was defined as the first inpatient hospitalization for any reason at either 30 or 90 days following discharge from an index acute‐care hospitalization. Hospital identification codes were used to determine whether the readmission occurred at the index (discharging) hospital or to a different facility. The principal diagnosis for the subsequent admission was assessed to identify the most common reasons for readmission.
The [2] test and Student t test were used to compare mean values between the 2 groups when appropriate, with statistical significance set as P<0.05. Univariate and multivariable logistic regression models were built to estimate the odds of hospital readmission based on weekend versus weekday discharge after controlling for age, gender, race, Charlson Comorbidity Index, discharge disposition, payer status, length of stay, presence of complication, and admission type. All statistical analyses were 2‐tailed and performed using SAS 9.3 for windows (SAS Institute Inc., Cary, NC). The odds ratio (OR) was considered significant when it was not equal to 1, the 95% confidence interval (CI) did not include 1, and the P value was less than 0.05.
RESULTS
Patient Characteristics
There were 266,519 patients hospitalized with a principal diagnosis of AMI, CHF, or PNA in California during 2012 and met all inclusion criteria. The cohort consisted of 77,853 (29.2%) with AMI, 91,327 (34.3%) with CHF, and 97,339 (36.5%) with PNA. A total of 60,097 (22.5%) patients were discharged on the weekend compared to 206,422 (77.5%) on a weekday, which was similar across diagnosis groups. Differences in gender, age, race, Charlson comorbidity score, insurance status, type of admission, or occurrence of complications between patients who were discharged on the weekend versus weekday are listed in Table 1. Patients discharged on a weekend had a shorter average length of stay (LOS) (AMI: 4.05.6 days vs 4.67.7 days; CHF: 5.19.3 vs 6.034.1; PNA: 5.011.7 vs 5.710.7). A higher proportion of these patients were discharged to home (AMI: 67.1% vs 63.8%; CHF: 53.3% vs 49.4%; PNA: 57.0% vs 52.9%), whereas a smaller proportion were discharged to an SNF (AMI: 7.0% vs 9.6%; CHF: 11.2% vs 15.9%; PNA: 12.8% vs 17.8%).
| AMI | CHF | PNA | ||||
|---|---|---|---|---|---|---|
| Weekend | Weekday | Weekend | Weekday | Weekend | Weekday | |
| ||||||
| No. (%) | 18,061 (23.2) | 59,792 (76.8) | 20,487 (22.4) | 70,840 (77.6) | 21,549 (22.1) | 75,790 (77.9) |
| Age, y | ||||||
| 044 | 4.7 | 4.5 | 4.5 | 4.1 | 9.4 | 8.6 |
| 4554 | 13.1 | 13.0 | 8.5 | 8.3 | 9.8 | 9.9 |
| 5564 | 22.6 | 22.4 | 14.3 | 14.6 | 14.9 | 14.9 |
| 6574 | 22.5 | 22.7 | 19.2 | 18.7 | 18.3 | 18.0 |
| 7584 | 21.4 | 21.4 | 26.4 | 26.3 | 24.1 | 24.0 |
| 85+ | 15.6 | 16.0 | 27.2 | 28.0 | 23.5 | 24.5 |
| Mean (SD) | 68.5 (14.3) | 68.7 (14.3) | 73.3 (15.1) | 3.6 (15.0) | 70.0 (17.6) | 70.5 (17.4) |
| Sex | ||||||
| Male | 62.0 | 61.7 | 51.7 | 51.4 | 47.9 | 47.0 |
| Female | 38.0 | 38.3 | 48.3 | 48.6 | 52.1 | 52.1 |
| Race | ||||||
| White | 63.5 | 62.9 | 58.7 | 58.5 | 63.0 | 62.4 |
| Black | 6.9 | 7.3 | 12.0 | 12.1 | 7.7 | 8.0 |
| Hispanic | 19.5 | 20.0 | 20.3 | 20.6 | 20.4 | 20.7 |
| API | 10.0 | 9.7 | 9.0 | 8.8 | 8.8 | 8.9 |
| Charlson Comorbidity Index | ||||||
| 0 | 30.7 | 30.1 | 9.4 | 9.5 | 23.0 | 22.2 |
| 1 | 25.1 | 24.9 | 19.5 | 19.8 | 25.7 | 26.4 |
| 2 | 14.9 | 15.2 | 20.4 | 20.3 | 17.3 | 17.4 |
| 3 | 29.2 | 29.8 | 50.8 | 50.4 | 34.0 | 34.1 |
| Mean (SD) | 2.1 (2.2) | 2.1 (2.2) | 3.0 (2.3) | 3.0 (2.3) | 2.4 (2.6) | 2.4 (2.5) |
| Payer status | ||||||
| Private | 25.4 | 25.1 | 11.3 | 10.7 | 15.7 | 14.4 |
| Medicare | 57.6 | 57.9 | 72.7 | 73.1 | 67.1 | 68.1 |
| Medicaid | 8.0 | 8.0 | 10.0 | 10.6 | 11.5 | 11.8 |
| No insurance | 4.2 | 4.0 | 2.7 | 2.3 | 2.6 | 2.5 |
| Unknown | 4.8 | 4.9 | 3.3 | 3.3 | 3.2 | 3.2 |
| Complication | ||||||
| Urinary tract infection | 6.0 | 6.8 | 10.3 | 10.8 | 10.2 | 11.0 |
| Acute MI | 6.7 | 6.9 | 2.7 | 2.6 | 1.2 | 1.2 |
| DVT/PE | 0.02 | 0.02 | 0.01 | 0.01 | 0.03 | 0.03 |
| Pneumonia | 0.06 | 0.05 | 0.09 | 0.08 | 0.1 | 0.1 |
| Hemorrhage | 1.7 | 1.7 | 1.5 | 1.5 | 1.2 | 1.1 |
| Sepsis | 3.5 | 3.6 | 6.2 | 6.0 | 7.4 | 7.6 |
| Mean length of stay (SD) | 4.0 (5.6) | 4.6 (7.7) | 5.1 (9.3) | 6.0 (34.1) | 5.0 (11.7) | 5.7 (10.7) |
| Disposition | ||||||
| Home | 67.1 | 63.8 | 53.3 | 49.4 | 57.0 | 52.9 |
| Acute rehabilitation | 1.9 | 3.2 | 0.7 | 0.9 | 0.5 | 0.7 |
| Skilled nursing facility | 7.0 | 9.6 | 11.2 | 15.9 | 12.8 | 17.8 |
| Residential facility | 0.4 | 0.5 | 0.9 | 1.0 | 1.1 | 1.4 |
| Other | 23.6 | 23.0 | 33.9 | 32.8 | 28.6 | 27.2 |
| Admission type | ||||||
| Elective | 8.9 | 10.1 | 7.9 | 9.1 | 7.1 | 7.6 |
| Unplanned | 91.0 | 89.9 | 92.1 | 90.9 | 92.9 | 92.3 |
Rate, Reason, and Location of Readmission
Table 2 shows overall rates of readmission. Among all patients, there were no significant differences in the unadjusted readmission rates for patients being discharged on a weekend versus weekday at either 30 days (16.7% vs 17.0%, P=0.14) or 90 days (26.9% vs 27.5%, P=0.05) (Table 2). Unadjusted 30‐day readmission rates were similar between the 2 groups for AMI (21.9% vs 21.9%, P=0.94) and PNA (12.1% vs 12.4%, P=0.28), whereas they were higher for weekday discharges in CHF (15.4% vs 16.0%, P=0.04). Similar results were seen for 90‐day readmission rates. To elucidate the impact of discharge disposition, a subset analysis was performed based on day of discharge and disposition (Figure 1). There was no difference in rates of readmission among patients discharged home on a weekend versus weekday (AMI: 21.3% vs 21.1%, P=0.78; CHF: 12.2% vs 12.6%, P=0.29; PNA: 8.3% vs 8.6%, P=0.29).
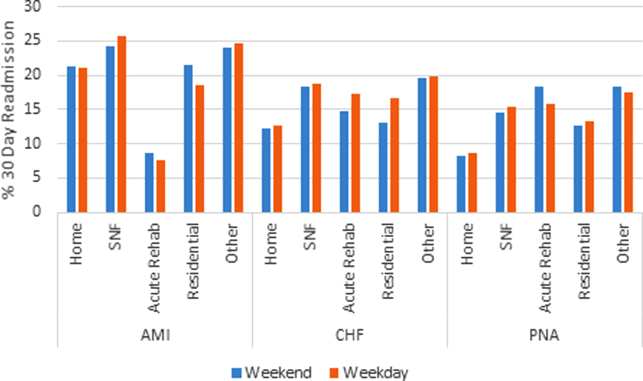
Abbreviations: AMI, acute myocardial infarction; CHF, congestive heart failure; PNA, pneumonia; SNF, skilled nursing facility.
| AMI | CHF | PNA | |||||||
|---|---|---|---|---|---|---|---|---|---|
| Weekend | Weekday | P Value | Weekend | Weekday | P Value | Weekend | Weekday | P Value | |
| |||||||||
| 30‐day readmission (%) | 3,954 (21.9) | 13,106 (21.9) | 0.94 | 3,162 (15.4) | 11,366 (16.0) | 0.04 | 2,608 (12.1) | 9,380 (12.4) | 0.28 |
| 90‐day readmission (%) | 5,253 (29.1) | 17,344 (29.0) | 0.84 | 5,994 (29.3) | 21,355 (30.2) | 0.008 | 4,698 (21.8) | 16,910 (22.3) | 0.11 |
The reason for hospital readmission was most frequently related to the principal diagnosis. Among patients discharged after hospitalization for AMI, 45.3% of readmissions had a principal diagnosis of AMI, whereas 13.9% listed readmission for angina or coronary artery disease. Of CHF discharges, at least 26.7% of readmissions were for CHF. PNA was the principal diagnosis in 19.8% of readmissions after admission for PNA. A significant proportion of patients (AMI: 64.8%, CHF: 35.0%, PNA: 32.9%) were readmitted to a different hospital than the discharging hospital.
Predictors of Readmission
On univariate logistic regression, discharge on a weekend was not associated with hospital readmission for patients admitted with AMI (OR: 1.0, 95% CI: 0.96‐1.04) or PNA (OR: 0.97, 95% CI: 0.93‐1.02) but was inversely associated for CHF (OR: 0.96, 95% CI: 0.91‐1.0). In multivariable models, weekend discharge was not associated with increased risk of readmission for any diagnosis (AMI [OR: 1.02, 95% CI: 0.98‐1.07], CHF [OR: 0.99, 95% CI: 0.95‐1.03], or PNA [OR: 1.02, 95% CI: 0.98‐1.07]; Table 3).
| AMI | CHF | PNA | ||||
|---|---|---|---|---|---|---|
| Univariate OR (95% CI) | Multivariable OR (95% CI) | Univariate OR (95% CI) | Multivariate OR (95% CI) | Univariate OR (95% CI) | Multivariate OR (95% CI) | |
| ||||||
| Weekend discharge | 1 (0.96‐1.04) | 1.02 (0.98‐1.06) | 0.96 (0.91‐1) | 0.99 (0.94‐1.03) | 0.97 (0.93‐1.02) | 1.02 (0.98‐1.07) |
| Age, y | ||||||
| 044 | ||||||
| 4554 | 1.02 (0.92‐1.12) | 0.96 (0.87‐1.07) | 1.04 (0.93‐1.16) | 1.00 (0.89‐1.11) | 1.08 (0.98‐1.19) | 0.93 (0.84‐1.03) |
| 5564 | 1.11 (1.02‐1.22) | 1.00 (0.91‐1.10) | 1.11 (1.01‐1.23) | 0.97 (0.88‐1.08) | 1.23 (1.13‐1.34) | 0.94 (0.86‐1.03) |
| 6574 | 1.31 (1.19‐1.43) | 1.04 (0.94‐1.15) | 1.1 (1‐1.22) | 0.90 (0.81‐1.01) | 1.29 (1.19‐1.41) | 0.87 (0.79‐0.96) |
| 7584 | 1.29 (1.18‐1.41) | 0.94 (0.85‐1.05) | 1.06 (0.97‐1.17) | 0.84 (0.75‐0.93) | 1.37 (1.27‐1.49) | 0.87 (0.79‐0.95) |
| 85+ | 1.03 (0.94‐1.13) | 0.72 (0.64‐0.81) | 0.98 (0.89‐1.08) | 0.76 (0.68‐0.84) | 1.31 (1.2‐1.41) | 0.78 (0.71‐0.86) |
| Gender | ||||||
| Female | ||||||
| Male | 1 (0.97‐1.04) | 1.1 (1.05‐1.14) | 1.06 (1.02‐1.1) | 1.08 (1.04‐1.12) | 1.13 (1.09‐1.18) | 1.15 (1.10‐1.19) |
| Race | ||||||
| White | ||||||
| Black | 1.17 (1.1‐1.25) | 1.12 (1.05‐1.20) | 1.06 (1‐1.12) | 1.03 (0.97‐1.09) | 1.11 (1.04‐1.19) | 1.07 (0.99‐1.15) |
| Hispanic | 1.11 (1.06‐1.16) | 1.12 (1.06‐1.17) | 1.05 (1‐1.1) | 1.04 (1.00‐1.10) | 0.93 (0.89‐0.98) | 0.95 (0.90‐1.00) |
| API | 1.14 (1.07‐1.2) | 1.09 (1.03‐1.16) | 1.01 (0.95‐1.08) | 1.00 (0.94‐1.07) | 0.97 (0.91‐1.04) | 0.93 (0.86‐0.99) |
| Charlson Comorbidity Index | ||||||
| 0 | ||||||
| 1 | 1.54 (1.46‐1.62) | 1.40 (1.32‐1.48) | 1.02 (0.95‐1.1) | 1.0 (0.92‐1.08) | 1.19 (1.12‐1.26) | 1.11 (1.04‐1.19) |
| 2 | 1.78 (1.69‐1.89) | 1.60 (1.51‐1.70) | 1.16 (1.08‐1.25) | 1.11 (1.03‐1.20) | 1.43 (1.34‐1.53) | 1.22 (1.14‐1.31) |
| 3 | 2.07 (1.97‐2.17) | 1.83 (1.73‐1.93) | 1.41 (1.32‐1.51) | 1.24 (1.15‐1.32) | 1.79 (1.69‐1.89) | 1.40 (1.31‐1.48) |
| Payer status | ||||||
| Private | ||||||
| Medicare | 1.02 (0.98‐1.06) | 0.89 (0.84‐0.95) | 1.04 (0.98‐1.11) | 1.04 (0.98‐1.12) | 1.29 (1.22‐1.37) | 1.06 (0.98‐1.13) |
| Medicaid | 0.89 (0.83‐0.96) | 0.83 (0.77‐0.89) | 1.2 (1.12‐1.3) | 1.23 (1.13‐1.33) | 1.28 (1.18‐1.38) | 1.18 (1.09‐1.28) |
| No insurance | 0.52 (0.46‐0.58) | 0.60 (0.53‐0.67) | 0.66 (0.57‐0.76) | 0.79 (0.68‐0.91) | 0.64 (0.54‐0.75) | 0.73 (0.61‐0.87) |
| Unknown | 0.71 (0.65‐0.78) | 0.77 (0.70‐0.84) | 0.91 (0.81‐1.03) | 1.02 (0.9‐1.15) | 0.9 (0.79‐1.03) | 0.93 (0.81‐1.06) |
| Disposition | ||||||
| Home | ||||||
| Acute care | 0.32 (0.27‐0.37) | 0.35 (0.29‐0.41) | 1.42 (1.18‐1.71) | 1.2 (1.05‐1.55) | 2.08 (1.69‐2.56) | 1.64 (1.32‐2.03) |
| SNF | 1.27 (1.2‐1.34) | 1.18 (1.10‐1.26) | 1.61 (1.53‐1.7) | 1.54 (1.46‐1.63) | 1.9 (1.81‐2.01) | 1.61 (1.52‐1.71) |
| Residential facility | 0.89 (0.68‐1.15) | 0.94 (0.72‐1.24) | 1.31 (1.1‐1.58) | 1.40 (1.16‐1.69) | 1.61 (1.37‐1.89) | 1.52 (1.29‐1.80) |
| Other | 1.21 (1.16‐1.26) | 1.10 (1.05‐1.15) | 1.72 (1.66‐1.79) | 1.59 (1.52‐1.66) | 2.31 (2.21‐2.41) | 1.88 (1.79‐1.98) |
| Length of stay* | 1.04 (1.02‐1.05) | 0.89 (0.87‐0.90) | 1.20 (1.19‐1.22) | 1.09 (1.08‐1.11) | 1.31 (1.29‐1.32) | 1.13 (1.1‐1.14) |
| Any complication | 3.14 (3.02‐3.26) | 2.61 (2.50‐2.73) | 1.52 (1.46‐1.59) | 1.35 (1.29‐1.41) | 1.70 (1.62‐1.78) | 1.39 (1.32‐1.45) |
| Admission type | ||||||
| Elective | ||||||
| Unplanned | 0.28 (0.27‐0.29) | 0.33 (0.31‐0.34) | 0.56 (0.54‐0.59) | 0.57 (0.53‐0.6) | 0.39 (0.37‐0.42) | 0.45 (0.42‐0.48) |
Increasing age, male gender, black race, greater Charlson Comorbidity Index, occurrence of any complication, and increased LOS were all associated with need for readmission on univariate analysis, though many of these associations weakened on multivariable analysis (Table 3). The effect of payer status on readmission was complex. Compared to private insurance, Medicare was associated with readmissions for patients with PNA (OR: 1.29, 95% CI: 1.22‐1.37) but not AMI (OR: 1.02, 95% CI: 0.98‐1.06) or CHF (OR: 1.04, 95% CI: 0.98‐1.11). Medicaid insurance was associated with readmission for CHF (OR: 1.20, 95% CI: 1.12‐1.30) and PNA (OR: 1.28, 95% CI: 1.18‐1.38) but appeared to be protective from readmission for AMI (OR: 0.89, 95% CI: 0.83‐0.96). Lack of insurance was associated with decreased odds of readmission for all diagnoses (P<0.05 for all models).
Models predicting 90‐day readmission rates showed similar results in all categories; therefore, the data are not shown.
DISCUSSION
We used a California statewide discharge database that linked individual patient records from all nonfederal hospitals to examine 30‐ and 90‐day hospital readmissions for CHF, AMI, and PNA. We hypothesized, but did not find, that weekend hospital discharge would be associated with higher hospital readmission rates. We did find other factors that were associated with hospital readmissions, including race, age, greater comorbidities, male gender, and discharge to an SNF. Nearly half of patients were readmitted for the same diagnosis as the initial discharge diagnosis, and nearly two‐thirds of the patients were readmitted to a hospital different from the discharging hospital.
Our study found some findings similar to prior investigations. First, the factors that predicted hospital readmission were complex and included age, race, gender, comorbidities, payer status, length of hospital stay, and the occurrence of a complication; most of these factors persisted after multivariable analysis but were not necessarily consistent across all admission diagnoses.[16, 17, 18] One finding of particular interest was the impact of insurance status. Specifically, lack of insurance was inversely associated with hospital readmission; this finding warrants further investigation. Our study is also similar to others in that we found that the most common reasons for readmission are typically related to the reason for the principal admission. Dharmarajan et al. previously studied the reason for readmission among hospitalized Medicare patients with AMI, CHF, and PNA, and found similarly high rates of identical admission diagnoses.[19] Furthermore, in our study, between 32% and 65% of 30‐day readmissions were to a hospital different than the discharging facility. Although few prior studies have had the ability to assess readmission to alternative hospitals, those who have done so in the past have found similar rates of divergence from the index facility.[20, 21]
Despite the apparent similarities to other studies, the current research question was specifically designed to investigate the weekend effect of hospital discharge. The term weekend effect refers to a phenomenon of worse clinical outcomes (eg, morbidity,[22] mortality,[6, 7] intensive care unit [ICU] readmission,[23] delays in appropriate diagnostic imaging[24, 25] and intervention,[26, 27] LOS,[28] and hospital costs[29]) for care delivered on a weekend. In a landmark study, Bell and Redelmeier demonstrated increased in‐house mortality for patients with ruptured abdominal aortic aneurysm, pulmonary embolism, or acute epiglottitis admitted through the emergency department on a weekend compared to weekday.[6] After controlling for patient variables, the association persisted, suggesting system‐related factors were contributory. Similarly, Kostis et al. showed that patients admitted to the hospital on a weekend with AMI had higher 30‐day mortality rates compared to those with weekday admission.[7] Finally, Aylin et al. demonstrated that mortality was 44% higher for patients undergoing elective surgery on a Friday and 82% higher for surgery on a weekend compared to a Monday.[30]
Despite this robust literature, fewer studies have evaluated the relationship between timing of discharge and outcomes. Much of the initial research has been focused on timing of discharge from the ICU. For example, transfer out of the ICU at night has been associated with higher in‐hospital mortality[31, 32, 33, 34, 35] as well as ICU readmission.[36, 37] Discharge from the ICU on a weekend has been associated with increased mortality in some studies[23] but not in others.[35, 38] Van Walraven and Bell were the first to investigate the impact of weekend hospital discharge on outcomes. In their analysis of all discharges from Ontario hospitals between 1990 and 2000, patients discharged on a Friday were at increased risk of death and 30‐day readmission compared to discharge on a Wednesday.[9] Beck et al. performed a similar study in pediatric patients but did not find a statistically significant effect of Friday discharge on readmission rates.[39] McAlister et al. specifically studied the effect of weekend (Saturday or Sunday) discharge on patients with CHF by analyzing discharges from Alberta, Canada hospitals between 1999 and 2009. Despite being comprised of lower‐risk patients, weekend discharge was associated with greater rates of 30‐ and 90‐day death and hospital readmission.[10] Conversely, McAlister et al. evaluated general medicine discharges from teaching hospitals in Alberta, Canada between 2009 and 2011 and found no difference in hospital readmission rates among those discharged on a weekend versus weekday.[11] The current investigation is the first to study hospitals in the United States to address this topic, an important consideration given differences in American and Canadian healthcare systems. Nevertheless, our results are similar to those of McAlister et al.,[11] who found no difference in hospital readmission rates based on day of discharge among patients with AMI, CHF, or PNA.
One potential explanation for finding a lack of correlation between weekend discharge and readmissions is that patients at higher risk for readmission are already selected toward weekday discharge. Our study found that patients discharged to an SNF, a group with higher odds of readmission, were less often discharged on a weekend. There may be other unmeasurable factors that differ between patients discharged on weekends versus weekdays. Also, factors that bias healthcare providers' decision making on timing of discharge are difficult to quantify and may differ between the 2 groups. Although our study hypothesis was driven by the perception that weekend discharges may fare poorly because of inadequate resources on the weekend, an alternative explanation for finding no association may be that current systems in place already do an effective job of discharge coordination on the weekend. Despite fears that staffing and equipment are significantly reduced during the weekend, perhaps weekend discharge resources are not the limiting factor in efforts to reduce readmissions.
Our results challenge the idea that weekend discharges predict hospital readmissions in California and argue for the relative safety of weekend discharges. Based on these findings, the routine delay in discharge of the complex medical patient until Monday for fear of discharge on a weekend does not seem warranted. Avoiding unnecessary delays in discharge should have positive effects on healthcare costs by reducing LOS. Two additional implications of our work are that single institution studies may underestimate readmission rates,[40] and that discharge to an SNF should receive special consideration in calculation of hospital‐level penalties for subsequent readmissions, as this group is associated with particularly higher risk.
There are some limitations to our study that should be acknowledged. The use of administrative data has well known limitations and the possibility of coding inaccuracy cannot be excluded.[41] Certain factors that could potentially differ between groups, such as illness severity, as well as details on the discharge process, were not available in this administrative database. In addition, elective readmissions were not excluded from the study. Also, because of the way the data were coded, a significant percentage of discharge dispositions were unknown. Finally, although morbidity and mortality have been studied in previous reports,[9, 10, 39] these data were not available for the current study, limiting the applicability of its conclusions.
CONCLUSIONS
In conclusion, among patients admitted with AMI, CHF, or PNA in California, discharge on a weekend is not associated with hospital readmission. Future studies on hospital readmissions should use a population‐based approach to accurately capture all readmissions following discharge.
Acknowledgments
Disclosure: Nothing to report.
- , Hospital readmissions as a measure of quality of health care: advantages and limitations. Arch Intern Med. 2000;160(8):1074–1081.
- , Hospital readmissions and the Affordable Care Act: paying for coordinated quality care. JAMA. 2011;306(16):1794–1795.
- Medicare fines 2,610 hospitals in third round of readmission penalties. Kaiser Health News. Available at: http://www.kaiserhealthnews.org/Stories/2014/October/02/Medicare‐readmissions‐penalties‐2015.aspx. Published October 2, 2014. Accessed October 2, 2014.
- , Interventions to decrease hospital readmissions: keys for cost‐effectiveness. JAMA Intern Med. 2013;173(8):695–698.
- , , , , Interventions to reduce 30‐day rehospitalization: a systematic review. Ann Intern Med. 2011;155(8):520–528.
- , Mortality among patients admitted to hospitals on weekends as compared with weekdays. N Engl J Med. 2001;345(9):663–668.
- , , , et al. Weekend versus weekday admission and mortality from myocardial infarction. N Engl J Med. 2007;356(11):1099–1109.
- , , , , , Mortality rate after nonelective hospital admission. Arch Surg 2011;146(5):545–551.
- , Risk of death or readmission among people discharged from hospital on Fridays. CMAJ. 2002;166(13):1672–1673.
- , , , , Postdischarge outcomes in heart failure are better for teaching hospitals and weekday discharges. Circ Heart Fail. 2013;6(5):922–929.
- , , , Similar outcomes among general medicine patients discharged on weekends. J Hosp Med. 2015;10(2):69–74.
- , , Post‐hospitalization transitions: examining the effects of timing of primary care provider follow‐up. J Hosp Med. 2010;5(7):392–397.
- , , , , The incidence and severity of adverse events affecting patients after discharge from the hospital. Ann Intern Med. 2003;138(3):161–167.
- , , , et al. Unintended medication discrepancies at the time of hospital admission. Arch Intern Med. 2005;165(4):424–429.
- Readmissions Reduction Program. August 2014. Available at: http://www.cms.gov/Medicare/Medicare‐Fee‐for‐Service‐Payment/AcuteInpatientPPS/Readmissions‐Reduction‐Program.html. Accessed October 2, 2014.
- , , Thirty‐day readmission rates for Medicare beneficiaries by race and site of care. JAMA. 2011;305(7):675–681.
- , , , et al. Hospital readmission in general medicine patients: a prediction model. J Gen Intern Med. 2009;25(3):211–219.
- , , Rehospitalizations among patients in the Medicare fee‐for‐service program. N Engl J Med. 2009;360(14):1418–1428.
- , , , et al. Diagnoses and timing of 30‐day readmissions after hospitalization for heart failure, acute myocardial infarction, or pneumonia. JAMA. 2013;309(4):355–363.
- , , , et al. Readmissions following pancreaticoduodenectomy for pancreas cancer: a population‐based appraisal. Ann Surg Oncol. 2009;16(3):554–561.
- , , , et al. Is same‐hospital readmission rate a good surrogate for all‐hospital readmission rate? Med Care. 2010;48(5):477–481.
- , , , et al. Worse outcomes in patients undergoing urgent surgery for left‐sided diverticulitis admitted on weekends vs weekdays: a population‐based study of 31 832 patients. Arch Surg. 2012;147(7):649–655.
- , , , et al. Mortality after discharge from the intensive care unit during the early weekend period: a population‐based cohort study in Denmark. Acta Anaesthesiol Scand. 2007;51(9):1225–1230.
- , , , Something for the weekend? JAMA Neurol. 2013;70(1):130.
- , , , , Dying for the weekend: a retrospective cohort study on the association between day of hospital presentation and the quality and safety of stroke care. Arch Neurol. 2012;69(10):1296–1302.
- , , , Effects of weekend admission on the outcomes and management of ruptured aortic aneurysms. J Vasc Surg. 2014;60(2):318–324
- , , , et al. Treatment delay in patients undergoing primary percutaneous coronary intervention for ST‐elevation myocardial infarction: a key process analysis of patient and program factors. Am Heart J. 2008;155(2):290–297.
- , , , et al. Weekend hospital admission and discharge for heart failure: association with quality of care and clinical outcomes. Am Heart J. 2009;158(3):451–458.
- , , , , Comparison of perioperative outcomes and cost of spinal fusion for cervical trauma: weekday versus weekend admissions. Spine. 2013;38(25):2178–2183.
- , , , , Day of week of procedure and 30 day mortality for elective surgery: retrospective analysis of hospital episode statistics. BMJ. 2013;346:f2424.
- , Consequences of discharges from intensive care at night. Lancet. 2000;355(9210):1138–1142.
- , , Waiting for the break of dawn? The effects of discharge time, discharge TISS scores and discharge facility on hospital mortality after intensive care. Intensive Care Med. 2002;28(9):1287–1293.
- , After‐hours discharges from intensive care are associated with increased mortality. Med J Aust. 2006;184(7):334–337.
- , Impact of intensive care unit discharge time on patient outcome. Crit Care Med. 2006;34(12):2946–2951.
- , , , Hospital mortality among adults admitted to and discharged from intensive care on weekends and evenings. J Crit Care. 2008;23(3):317–324.
- , , , et al. Factors associated with increased risk of readmission to intensive care in Australia. Intensive Care Med. 2011;37(11):1800–1808.
- , , , , After‐hours discharge from intensive care increases the risk of readmission and death. Anaesth Intensive Care. 2007;35(4):477–485.
- , , The effects of ICU admission and discharge times on mortality in Finland. Intensive Care Med. 2003;29(12):2144–2148.
- , , , , Day of discharge and hospital readmission rates within 30 days in children: a population‐based study. Paediatr Child Health. 2006;11(7):409–412.
- , , , Using same‐hospital readmission rates to estimate all‐hospital readmission rates. J Am Coll Surg. 2014;219(4):656–663.
- , , , et al. Evaluation of hospital readmissions in surgical patients: do administrative data tell the real story? JAMA Surg. 2014;149(8):759–764.
Hospital readmission, defined as an admission to a hospital within 30 days of discharge from an acute‐care hospitalization, is associated with short‐term morbidity, mortality, and medical costs.[1] In 2013, the Patient Protection and Affordable Care Act began assigning financial penalties to hospitals based on performance against benchmarks on readmission for acute myocardial infarction (AMI), pneumonia (PNA), and congestive heart failure (CHF) through its Hospital Readmission Reduction Program (HRRP).[2] In its third year, the program recently announced penalties for 2,610 hospitals that will total over $428 million.[3] Despite increased attention to this issue, few interventions have been identified that effectively reduce hospital readmissions.[4, 5]
Hospital discharge is a complex process that aims to achieve the safe transfer of care of a hospitalized patient to another setting (eg, home, skilled nursing facility [SNF]). Success depends on adequate staffing of physicians, nurses, case managers, social workers, and pharmacists; clear communication among patients and providers; and integrated coordination of care. Although much focus has been placed on the association between weekend hospital admission and increased mortality,[6, 7, 8] very little is known about the impact of weekend hospital discharge on outcomes, specifically hospital readmission rates. Furthermore, previous studies on this topic, based on Canadian data, have produced conflicting results.[9, 10, 11]
Staffing of physicians, physician extenders (eg, physician assistants or nurse practitioners), nurses, case managers, social workers, and ancillary staff (eg, physical and occupational therapists) are all typically reduced on the weekend. Patients may be cared for by covering healthcare providers. These factors may have important implications on the timeliness of discharge, accuracy of discharge instructions, safety of discharge (eg, clearance by physical therapy), and medication reconciliation, among others. Clinic offices are more likely to be closed, and therefore, some follow‐up appointments may inadvertently not be scheduled, and lack of timely postdischarge follow‐up may be associated with higher rates of readmission.[12] Reduced outpatient pharmacy availability may also cause delays in patients receiving their medications,[13] which may exacerbate failed transition to the outpatient setting due to medication noncompliance.[14]
Based on this rationale, the current study was designed to investigate the association between weekend discharge and 30‐ and 90‐ day readmissions in patients hospitalized for medical diagnoses included in Centers for Medicare and Medicaid Services' HRRP.[15] To do so, a large‐state, all‐payer discharge database with individual patient record linkage numbers (RLN) was selected to capture all readmissions, even those to a different hospital. We hypothesized that patients who are discharged on a weekend would have higher hospital readmission rates compared to those discharged on a weekday.
METHODS
Approval was obtained from both the California Committee for the Protection of Human Subjects and the Stanford University Institutional Review Board. The California Office of State Health Planning and Development (OSHPD) 2012 Patient Discharge Data (PDD) was utilized for this study. The OSHPD‐PDD contains records for all patients admitted and eventually discharged from every general, acute, nonfederal hospital within the state. Demographic variables contained in the dataset include age, gender, race, and a unique RLN (an individually assigned number based on the patient's social security number and other demographics) to associate discharged patients with subsequent hospitalizations. Clinical information collected included principal diagnosis (indication for admission), 24 additional diagnoses with an indicator as to whether or not the condition was present on admission (POA) to differentiate comorbidities from complications, and principle procedure codes. Details about the admission included date of admission and discharge, admission type (scheduled or unscheduled), expected payer/emnsurance and disposition (home, acute rehabilitation, skilled nursing facility, residential facility, other). Details about the hospital included a unique identification number to indicate the location of care for both index/discharge and subsequent readmission.
International Classification of Disease, Ninth Edition, Clinical Modification (ICD‐9‐CM) coding schema were used to identify all patients admitted with the principal diagnosis of AMI (ICD‐9‐CM code 410.xx), CHF (428.xx), or PNA (480.xx‐486.xx). We excluded patients who were coded as having in‐hospital mortality, as these patients would not be eligible for readmission, those who were transferred to a different inpatient acute‐care facility, and those with invalid RLNs. Patients were separated into 2 groups based on the day of discharge. Weekday was defined as Monday through Friday, whereas weekend was defined as Saturday and Sunday. The Charlson Comorbidity Index was calculated based on POA comorbidities.
Demographic data, hospital variables, and readmission rates were directly compared for patients discharged on a weekend compared to weekday after admission for AMI, CHF, or PNA. Hospital readmission was defined as the first inpatient hospitalization for any reason at either 30 or 90 days following discharge from an index acute‐care hospitalization. Hospital identification codes were used to determine whether the readmission occurred at the index (discharging) hospital or to a different facility. The principal diagnosis for the subsequent admission was assessed to identify the most common reasons for readmission.
The [2] test and Student t test were used to compare mean values between the 2 groups when appropriate, with statistical significance set as P<0.05. Univariate and multivariable logistic regression models were built to estimate the odds of hospital readmission based on weekend versus weekday discharge after controlling for age, gender, race, Charlson Comorbidity Index, discharge disposition, payer status, length of stay, presence of complication, and admission type. All statistical analyses were 2‐tailed and performed using SAS 9.3 for windows (SAS Institute Inc., Cary, NC). The odds ratio (OR) was considered significant when it was not equal to 1, the 95% confidence interval (CI) did not include 1, and the P value was less than 0.05.
RESULTS
Patient Characteristics
There were 266,519 patients hospitalized with a principal diagnosis of AMI, CHF, or PNA in California during 2012 and met all inclusion criteria. The cohort consisted of 77,853 (29.2%) with AMI, 91,327 (34.3%) with CHF, and 97,339 (36.5%) with PNA. A total of 60,097 (22.5%) patients were discharged on the weekend compared to 206,422 (77.5%) on a weekday, which was similar across diagnosis groups. Differences in gender, age, race, Charlson comorbidity score, insurance status, type of admission, or occurrence of complications between patients who were discharged on the weekend versus weekday are listed in Table 1. Patients discharged on a weekend had a shorter average length of stay (LOS) (AMI: 4.05.6 days vs 4.67.7 days; CHF: 5.19.3 vs 6.034.1; PNA: 5.011.7 vs 5.710.7). A higher proportion of these patients were discharged to home (AMI: 67.1% vs 63.8%; CHF: 53.3% vs 49.4%; PNA: 57.0% vs 52.9%), whereas a smaller proportion were discharged to an SNF (AMI: 7.0% vs 9.6%; CHF: 11.2% vs 15.9%; PNA: 12.8% vs 17.8%).
| AMI | CHF | PNA | ||||
|---|---|---|---|---|---|---|
| Weekend | Weekday | Weekend | Weekday | Weekend | Weekday | |
| ||||||
| No. (%) | 18,061 (23.2) | 59,792 (76.8) | 20,487 (22.4) | 70,840 (77.6) | 21,549 (22.1) | 75,790 (77.9) |
| Age, y | ||||||
| 044 | 4.7 | 4.5 | 4.5 | 4.1 | 9.4 | 8.6 |
| 4554 | 13.1 | 13.0 | 8.5 | 8.3 | 9.8 | 9.9 |
| 5564 | 22.6 | 22.4 | 14.3 | 14.6 | 14.9 | 14.9 |
| 6574 | 22.5 | 22.7 | 19.2 | 18.7 | 18.3 | 18.0 |
| 7584 | 21.4 | 21.4 | 26.4 | 26.3 | 24.1 | 24.0 |
| 85+ | 15.6 | 16.0 | 27.2 | 28.0 | 23.5 | 24.5 |
| Mean (SD) | 68.5 (14.3) | 68.7 (14.3) | 73.3 (15.1) | 3.6 (15.0) | 70.0 (17.6) | 70.5 (17.4) |
| Sex | ||||||
| Male | 62.0 | 61.7 | 51.7 | 51.4 | 47.9 | 47.0 |
| Female | 38.0 | 38.3 | 48.3 | 48.6 | 52.1 | 52.1 |
| Race | ||||||
| White | 63.5 | 62.9 | 58.7 | 58.5 | 63.0 | 62.4 |
| Black | 6.9 | 7.3 | 12.0 | 12.1 | 7.7 | 8.0 |
| Hispanic | 19.5 | 20.0 | 20.3 | 20.6 | 20.4 | 20.7 |
| API | 10.0 | 9.7 | 9.0 | 8.8 | 8.8 | 8.9 |
| Charlson Comorbidity Index | ||||||
| 0 | 30.7 | 30.1 | 9.4 | 9.5 | 23.0 | 22.2 |
| 1 | 25.1 | 24.9 | 19.5 | 19.8 | 25.7 | 26.4 |
| 2 | 14.9 | 15.2 | 20.4 | 20.3 | 17.3 | 17.4 |
| 3 | 29.2 | 29.8 | 50.8 | 50.4 | 34.0 | 34.1 |
| Mean (SD) | 2.1 (2.2) | 2.1 (2.2) | 3.0 (2.3) | 3.0 (2.3) | 2.4 (2.6) | 2.4 (2.5) |
| Payer status | ||||||
| Private | 25.4 | 25.1 | 11.3 | 10.7 | 15.7 | 14.4 |
| Medicare | 57.6 | 57.9 | 72.7 | 73.1 | 67.1 | 68.1 |
| Medicaid | 8.0 | 8.0 | 10.0 | 10.6 | 11.5 | 11.8 |
| No insurance | 4.2 | 4.0 | 2.7 | 2.3 | 2.6 | 2.5 |
| Unknown | 4.8 | 4.9 | 3.3 | 3.3 | 3.2 | 3.2 |
| Complication | ||||||
| Urinary tract infection | 6.0 | 6.8 | 10.3 | 10.8 | 10.2 | 11.0 |
| Acute MI | 6.7 | 6.9 | 2.7 | 2.6 | 1.2 | 1.2 |
| DVT/PE | 0.02 | 0.02 | 0.01 | 0.01 | 0.03 | 0.03 |
| Pneumonia | 0.06 | 0.05 | 0.09 | 0.08 | 0.1 | 0.1 |
| Hemorrhage | 1.7 | 1.7 | 1.5 | 1.5 | 1.2 | 1.1 |
| Sepsis | 3.5 | 3.6 | 6.2 | 6.0 | 7.4 | 7.6 |
| Mean length of stay (SD) | 4.0 (5.6) | 4.6 (7.7) | 5.1 (9.3) | 6.0 (34.1) | 5.0 (11.7) | 5.7 (10.7) |
| Disposition | ||||||
| Home | 67.1 | 63.8 | 53.3 | 49.4 | 57.0 | 52.9 |
| Acute rehabilitation | 1.9 | 3.2 | 0.7 | 0.9 | 0.5 | 0.7 |
| Skilled nursing facility | 7.0 | 9.6 | 11.2 | 15.9 | 12.8 | 17.8 |
| Residential facility | 0.4 | 0.5 | 0.9 | 1.0 | 1.1 | 1.4 |
| Other | 23.6 | 23.0 | 33.9 | 32.8 | 28.6 | 27.2 |
| Admission type | ||||||
| Elective | 8.9 | 10.1 | 7.9 | 9.1 | 7.1 | 7.6 |
| Unplanned | 91.0 | 89.9 | 92.1 | 90.9 | 92.9 | 92.3 |
Rate, Reason, and Location of Readmission
Table 2 shows overall rates of readmission. Among all patients, there were no significant differences in the unadjusted readmission rates for patients being discharged on a weekend versus weekday at either 30 days (16.7% vs 17.0%, P=0.14) or 90 days (26.9% vs 27.5%, P=0.05) (Table 2). Unadjusted 30‐day readmission rates were similar between the 2 groups for AMI (21.9% vs 21.9%, P=0.94) and PNA (12.1% vs 12.4%, P=0.28), whereas they were higher for weekday discharges in CHF (15.4% vs 16.0%, P=0.04). Similar results were seen for 90‐day readmission rates. To elucidate the impact of discharge disposition, a subset analysis was performed based on day of discharge and disposition (Figure 1). There was no difference in rates of readmission among patients discharged home on a weekend versus weekday (AMI: 21.3% vs 21.1%, P=0.78; CHF: 12.2% vs 12.6%, P=0.29; PNA: 8.3% vs 8.6%, P=0.29).
Abbreviations: AMI, acute myocardial infarction; CHF, congestive heart failure; PNA, pneumonia; SNF, skilled nursing facility.
| AMI | CHF | PNA | |||||||
|---|---|---|---|---|---|---|---|---|---|
| Weekend | Weekday | P Value | Weekend | Weekday | P Value | Weekend | Weekday | P Value | |
| |||||||||
| 30‐day readmission (%) | 3,954 (21.9) | 13,106 (21.9) | 0.94 | 3,162 (15.4) | 11,366 (16.0) | 0.04 | 2,608 (12.1) | 9,380 (12.4) | 0.28 |
| 90‐day readmission (%) | 5,253 (29.1) | 17,344 (29.0) | 0.84 | 5,994 (29.3) | 21,355 (30.2) | 0.008 | 4,698 (21.8) | 16,910 (22.3) | 0.11 |
The reason for hospital readmission was most frequently related to the principal diagnosis. Among patients discharged after hospitalization for AMI, 45.3% of readmissions had a principal diagnosis of AMI, whereas 13.9% listed readmission for angina or coronary artery disease. Of CHF discharges, at least 26.7% of readmissions were for CHF. PNA was the principal diagnosis in 19.8% of readmissions after admission for PNA. A significant proportion of patients (AMI: 64.8%, CHF: 35.0%, PNA: 32.9%) were readmitted to a different hospital than the discharging hospital.
Predictors of Readmission
On univariate logistic regression, discharge on a weekend was not associated with hospital readmission for patients admitted with AMI (OR: 1.0, 95% CI: 0.96‐1.04) or PNA (OR: 0.97, 95% CI: 0.93‐1.02) but was inversely associated for CHF (OR: 0.96, 95% CI: 0.91‐1.0). In multivariable models, weekend discharge was not associated with increased risk of readmission for any diagnosis (AMI [OR: 1.02, 95% CI: 0.98‐1.07], CHF [OR: 0.99, 95% CI: 0.95‐1.03], or PNA [OR: 1.02, 95% CI: 0.98‐1.07]; Table 3).
| AMI | CHF | PNA | ||||
|---|---|---|---|---|---|---|
| Univariate OR (95% CI) | Multivariable OR (95% CI) | Univariate OR (95% CI) | Multivariate OR (95% CI) | Univariate OR (95% CI) | Multivariate OR (95% CI) | |
| ||||||
| Weekend discharge | 1 (0.96‐1.04) | 1.02 (0.98‐1.06) | 0.96 (0.91‐1) | 0.99 (0.94‐1.03) | 0.97 (0.93‐1.02) | 1.02 (0.98‐1.07) |
| Age, y | ||||||
| 044 | ||||||
| 4554 | 1.02 (0.92‐1.12) | 0.96 (0.87‐1.07) | 1.04 (0.93‐1.16) | 1.00 (0.89‐1.11) | 1.08 (0.98‐1.19) | 0.93 (0.84‐1.03) |
| 5564 | 1.11 (1.02‐1.22) | 1.00 (0.91‐1.10) | 1.11 (1.01‐1.23) | 0.97 (0.88‐1.08) | 1.23 (1.13‐1.34) | 0.94 (0.86‐1.03) |
| 6574 | 1.31 (1.19‐1.43) | 1.04 (0.94‐1.15) | 1.1 (1‐1.22) | 0.90 (0.81‐1.01) | 1.29 (1.19‐1.41) | 0.87 (0.79‐0.96) |
| 7584 | 1.29 (1.18‐1.41) | 0.94 (0.85‐1.05) | 1.06 (0.97‐1.17) | 0.84 (0.75‐0.93) | 1.37 (1.27‐1.49) | 0.87 (0.79‐0.95) |
| 85+ | 1.03 (0.94‐1.13) | 0.72 (0.64‐0.81) | 0.98 (0.89‐1.08) | 0.76 (0.68‐0.84) | 1.31 (1.2‐1.41) | 0.78 (0.71‐0.86) |
| Gender | ||||||
| Female | ||||||
| Male | 1 (0.97‐1.04) | 1.1 (1.05‐1.14) | 1.06 (1.02‐1.1) | 1.08 (1.04‐1.12) | 1.13 (1.09‐1.18) | 1.15 (1.10‐1.19) |
| Race | ||||||
| White | ||||||
| Black | 1.17 (1.1‐1.25) | 1.12 (1.05‐1.20) | 1.06 (1‐1.12) | 1.03 (0.97‐1.09) | 1.11 (1.04‐1.19) | 1.07 (0.99‐1.15) |
| Hispanic | 1.11 (1.06‐1.16) | 1.12 (1.06‐1.17) | 1.05 (1‐1.1) | 1.04 (1.00‐1.10) | 0.93 (0.89‐0.98) | 0.95 (0.90‐1.00) |
| API | 1.14 (1.07‐1.2) | 1.09 (1.03‐1.16) | 1.01 (0.95‐1.08) | 1.00 (0.94‐1.07) | 0.97 (0.91‐1.04) | 0.93 (0.86‐0.99) |
| Charlson Comorbidity Index | ||||||
| 0 | ||||||
| 1 | 1.54 (1.46‐1.62) | 1.40 (1.32‐1.48) | 1.02 (0.95‐1.1) | 1.0 (0.92‐1.08) | 1.19 (1.12‐1.26) | 1.11 (1.04‐1.19) |
| 2 | 1.78 (1.69‐1.89) | 1.60 (1.51‐1.70) | 1.16 (1.08‐1.25) | 1.11 (1.03‐1.20) | 1.43 (1.34‐1.53) | 1.22 (1.14‐1.31) |
| 3 | 2.07 (1.97‐2.17) | 1.83 (1.73‐1.93) | 1.41 (1.32‐1.51) | 1.24 (1.15‐1.32) | 1.79 (1.69‐1.89) | 1.40 (1.31‐1.48) |
| Payer status | ||||||
| Private | ||||||
| Medicare | 1.02 (0.98‐1.06) | 0.89 (0.84‐0.95) | 1.04 (0.98‐1.11) | 1.04 (0.98‐1.12) | 1.29 (1.22‐1.37) | 1.06 (0.98‐1.13) |
| Medicaid | 0.89 (0.83‐0.96) | 0.83 (0.77‐0.89) | 1.2 (1.12‐1.3) | 1.23 (1.13‐1.33) | 1.28 (1.18‐1.38) | 1.18 (1.09‐1.28) |
| No insurance | 0.52 (0.46‐0.58) | 0.60 (0.53‐0.67) | 0.66 (0.57‐0.76) | 0.79 (0.68‐0.91) | 0.64 (0.54‐0.75) | 0.73 (0.61‐0.87) |
| Unknown | 0.71 (0.65‐0.78) | 0.77 (0.70‐0.84) | 0.91 (0.81‐1.03) | 1.02 (0.9‐1.15) | 0.9 (0.79‐1.03) | 0.93 (0.81‐1.06) |
| Disposition | ||||||
| Home | ||||||
| Acute care | 0.32 (0.27‐0.37) | 0.35 (0.29‐0.41) | 1.42 (1.18‐1.71) | 1.2 (1.05‐1.55) | 2.08 (1.69‐2.56) | 1.64 (1.32‐2.03) |
| SNF | 1.27 (1.2‐1.34) | 1.18 (1.10‐1.26) | 1.61 (1.53‐1.7) | 1.54 (1.46‐1.63) | 1.9 (1.81‐2.01) | 1.61 (1.52‐1.71) |
| Residential facility | 0.89 (0.68‐1.15) | 0.94 (0.72‐1.24) | 1.31 (1.1‐1.58) | 1.40 (1.16‐1.69) | 1.61 (1.37‐1.89) | 1.52 (1.29‐1.80) |
| Other | 1.21 (1.16‐1.26) | 1.10 (1.05‐1.15) | 1.72 (1.66‐1.79) | 1.59 (1.52‐1.66) | 2.31 (2.21‐2.41) | 1.88 (1.79‐1.98) |
| Length of stay* | 1.04 (1.02‐1.05) | 0.89 (0.87‐0.90) | 1.20 (1.19‐1.22) | 1.09 (1.08‐1.11) | 1.31 (1.29‐1.32) | 1.13 (1.1‐1.14) |
| Any complication | 3.14 (3.02‐3.26) | 2.61 (2.50‐2.73) | 1.52 (1.46‐1.59) | 1.35 (1.29‐1.41) | 1.70 (1.62‐1.78) | 1.39 (1.32‐1.45) |
| Admission type | ||||||
| Elective | ||||||
| Unplanned | 0.28 (0.27‐0.29) | 0.33 (0.31‐0.34) | 0.56 (0.54‐0.59) | 0.57 (0.53‐0.6) | 0.39 (0.37‐0.42) | 0.45 (0.42‐0.48) |
Increasing age, male gender, black race, greater Charlson Comorbidity Index, occurrence of any complication, and increased LOS were all associated with need for readmission on univariate analysis, though many of these associations weakened on multivariable analysis (Table 3). The effect of payer status on readmission was complex. Compared to private insurance, Medicare was associated with readmissions for patients with PNA (OR: 1.29, 95% CI: 1.22‐1.37) but not AMI (OR: 1.02, 95% CI: 0.98‐1.06) or CHF (OR: 1.04, 95% CI: 0.98‐1.11). Medicaid insurance was associated with readmission for CHF (OR: 1.20, 95% CI: 1.12‐1.30) and PNA (OR: 1.28, 95% CI: 1.18‐1.38) but appeared to be protective from readmission for AMI (OR: 0.89, 95% CI: 0.83‐0.96). Lack of insurance was associated with decreased odds of readmission for all diagnoses (P<0.05 for all models).
Models predicting 90‐day readmission rates showed similar results in all categories; therefore, the data are not shown.
DISCUSSION
We used a California statewide discharge database that linked individual patient records from all nonfederal hospitals to examine 30‐ and 90‐day hospital readmissions for CHF, AMI, and PNA. We hypothesized, but did not find, that weekend hospital discharge would be associated with higher hospital readmission rates. We did find other factors that were associated with hospital readmissions, including race, age, greater comorbidities, male gender, and discharge to an SNF. Nearly half of patients were readmitted for the same diagnosis as the initial discharge diagnosis, and nearly two‐thirds of the patients were readmitted to a hospital different from the discharging hospital.
Our study found some findings similar to prior investigations. First, the factors that predicted hospital readmission were complex and included age, race, gender, comorbidities, payer status, length of hospital stay, and the occurrence of a complication; most of these factors persisted after multivariable analysis but were not necessarily consistent across all admission diagnoses.[16, 17, 18] One finding of particular interest was the impact of insurance status. Specifically, lack of insurance was inversely associated with hospital readmission; this finding warrants further investigation. Our study is also similar to others in that we found that the most common reasons for readmission are typically related to the reason for the principal admission. Dharmarajan et al. previously studied the reason for readmission among hospitalized Medicare patients with AMI, CHF, and PNA, and found similarly high rates of identical admission diagnoses.[19] Furthermore, in our study, between 32% and 65% of 30‐day readmissions were to a hospital different than the discharging facility. Although few prior studies have had the ability to assess readmission to alternative hospitals, those who have done so in the past have found similar rates of divergence from the index facility.[20, 21]
Despite the apparent similarities to other studies, the current research question was specifically designed to investigate the weekend effect of hospital discharge. The term weekend effect refers to a phenomenon of worse clinical outcomes (eg, morbidity,[22] mortality,[6, 7] intensive care unit [ICU] readmission,[23] delays in appropriate diagnostic imaging[24, 25] and intervention,[26, 27] LOS,[28] and hospital costs[29]) for care delivered on a weekend. In a landmark study, Bell and Redelmeier demonstrated increased in‐house mortality for patients with ruptured abdominal aortic aneurysm, pulmonary embolism, or acute epiglottitis admitted through the emergency department on a weekend compared to weekday.[6] After controlling for patient variables, the association persisted, suggesting system‐related factors were contributory. Similarly, Kostis et al. showed that patients admitted to the hospital on a weekend with AMI had higher 30‐day mortality rates compared to those with weekday admission.[7] Finally, Aylin et al. demonstrated that mortality was 44% higher for patients undergoing elective surgery on a Friday and 82% higher for surgery on a weekend compared to a Monday.[30]
Despite this robust literature, fewer studies have evaluated the relationship between timing of discharge and outcomes. Much of the initial research has been focused on timing of discharge from the ICU. For example, transfer out of the ICU at night has been associated with higher in‐hospital mortality[31, 32, 33, 34, 35] as well as ICU readmission.[36, 37] Discharge from the ICU on a weekend has been associated with increased mortality in some studies[23] but not in others.[35, 38] Van Walraven and Bell were the first to investigate the impact of weekend hospital discharge on outcomes. In their analysis of all discharges from Ontario hospitals between 1990 and 2000, patients discharged on a Friday were at increased risk of death and 30‐day readmission compared to discharge on a Wednesday.[9] Beck et al. performed a similar study in pediatric patients but did not find a statistically significant effect of Friday discharge on readmission rates.[39] McAlister et al. specifically studied the effect of weekend (Saturday or Sunday) discharge on patients with CHF by analyzing discharges from Alberta, Canada hospitals between 1999 and 2009. Despite being comprised of lower‐risk patients, weekend discharge was associated with greater rates of 30‐ and 90‐day death and hospital readmission.[10] Conversely, McAlister et al. evaluated general medicine discharges from teaching hospitals in Alberta, Canada between 2009 and 2011 and found no difference in hospital readmission rates among those discharged on a weekend versus weekday.[11] The current investigation is the first to study hospitals in the United States to address this topic, an important consideration given differences in American and Canadian healthcare systems. Nevertheless, our results are similar to those of McAlister et al.,[11] who found no difference in hospital readmission rates based on day of discharge among patients with AMI, CHF, or PNA.
One potential explanation for finding a lack of correlation between weekend discharge and readmissions is that patients at higher risk for readmission are already selected toward weekday discharge. Our study found that patients discharged to an SNF, a group with higher odds of readmission, were less often discharged on a weekend. There may be other unmeasurable factors that differ between patients discharged on weekends versus weekdays. Also, factors that bias healthcare providers' decision making on timing of discharge are difficult to quantify and may differ between the 2 groups. Although our study hypothesis was driven by the perception that weekend discharges may fare poorly because of inadequate resources on the weekend, an alternative explanation for finding no association may be that current systems in place already do an effective job of discharge coordination on the weekend. Despite fears that staffing and equipment are significantly reduced during the weekend, perhaps weekend discharge resources are not the limiting factor in efforts to reduce readmissions.
Our results challenge the idea that weekend discharges predict hospital readmissions in California and argue for the relative safety of weekend discharges. Based on these findings, the routine delay in discharge of the complex medical patient until Monday for fear of discharge on a weekend does not seem warranted. Avoiding unnecessary delays in discharge should have positive effects on healthcare costs by reducing LOS. Two additional implications of our work are that single institution studies may underestimate readmission rates,[40] and that discharge to an SNF should receive special consideration in calculation of hospital‐level penalties for subsequent readmissions, as this group is associated with particularly higher risk.
There are some limitations to our study that should be acknowledged. The use of administrative data has well known limitations and the possibility of coding inaccuracy cannot be excluded.[41] Certain factors that could potentially differ between groups, such as illness severity, as well as details on the discharge process, were not available in this administrative database. In addition, elective readmissions were not excluded from the study. Also, because of the way the data were coded, a significant percentage of discharge dispositions were unknown. Finally, although morbidity and mortality have been studied in previous reports,[9, 10, 39] these data were not available for the current study, limiting the applicability of its conclusions.
CONCLUSIONS
In conclusion, among patients admitted with AMI, CHF, or PNA in California, discharge on a weekend is not associated with hospital readmission. Future studies on hospital readmissions should use a population‐based approach to accurately capture all readmissions following discharge.
Acknowledgments
Disclosure: Nothing to report.
- , Hospital readmissions as a measure of quality of health care: advantages and limitations. Arch Intern Med. 2000;160(8):1074–1081.
- , Hospital readmissions and the Affordable Care Act: paying for coordinated quality care. JAMA. 2011;306(16):1794–1795.
- Medicare fines 2,610 hospitals in third round of readmission penalties. Kaiser Health News. Available at: http://www.kaiserhealthnews.org/Stories/2014/October/02/Medicare‐readmissions‐penalties‐2015.aspx. Published October 2, 2014. Accessed October 2, 2014.
- , Interventions to decrease hospital readmissions: keys for cost‐effectiveness. JAMA Intern Med. 2013;173(8):695–698.
- , , , , Interventions to reduce 30‐day rehospitalization: a systematic review. Ann Intern Med. 2011;155(8):520–528.
- , Mortality among patients admitted to hospitals on weekends as compared with weekdays. N Engl J Med. 2001;345(9):663–668.
- , , , et al. Weekend versus weekday admission and mortality from myocardial infarction. N Engl J Med. 2007;356(11):1099–1109.
- , , , , , Mortality rate after nonelective hospital admission. Arch Surg 2011;146(5):545–551.
- , Risk of death or readmission among people discharged from hospital on Fridays. CMAJ. 2002;166(13):1672–1673.
- , , , , Postdischarge outcomes in heart failure are better for teaching hospitals and weekday discharges. Circ Heart Fail. 2013;6(5):922–929.
- , , , Similar outcomes among general medicine patients discharged on weekends. J Hosp Med. 2015;10(2):69–74.
- , , Post‐hospitalization transitions: examining the effects of timing of primary care provider follow‐up. J Hosp Med. 2010;5(7):392–397.
- , , , , The incidence and severity of adverse events affecting patients after discharge from the hospital. Ann Intern Med. 2003;138(3):161–167.
- , , , et al. Unintended medication discrepancies at the time of hospital admission. Arch Intern Med. 2005;165(4):424–429.
- Readmissions Reduction Program. August 2014. Available at: http://www.cms.gov/Medicare/Medicare‐Fee‐for‐Service‐Payment/AcuteInpatientPPS/Readmissions‐Reduction‐Program.html. Accessed October 2, 2014.
- , , Thirty‐day readmission rates for Medicare beneficiaries by race and site of care. JAMA. 2011;305(7):675–681.
- , , , et al. Hospital readmission in general medicine patients: a prediction model. J Gen Intern Med. 2009;25(3):211–219.
- , , Rehospitalizations among patients in the Medicare fee‐for‐service program. N Engl J Med. 2009;360(14):1418–1428.
- , , , et al. Diagnoses and timing of 30‐day readmissions after hospitalization for heart failure, acute myocardial infarction, or pneumonia. JAMA. 2013;309(4):355–363.
- , , , et al. Readmissions following pancreaticoduodenectomy for pancreas cancer: a population‐based appraisal. Ann Surg Oncol. 2009;16(3):554–561.
- , , , et al. Is same‐hospital readmission rate a good surrogate for all‐hospital readmission rate? Med Care. 2010;48(5):477–481.
- , , , et al. Worse outcomes in patients undergoing urgent surgery for left‐sided diverticulitis admitted on weekends vs weekdays: a population‐based study of 31 832 patients. Arch Surg. 2012;147(7):649–655.
- , , , et al. Mortality after discharge from the intensive care unit during the early weekend period: a population‐based cohort study in Denmark. Acta Anaesthesiol Scand. 2007;51(9):1225–1230.
- , , , Something for the weekend? JAMA Neurol. 2013;70(1):130.
- , , , , Dying for the weekend: a retrospective cohort study on the association between day of hospital presentation and the quality and safety of stroke care. Arch Neurol. 2012;69(10):1296–1302.
- , , , Effects of weekend admission on the outcomes and management of ruptured aortic aneurysms. J Vasc Surg. 2014;60(2):318–324
- , , , et al. Treatment delay in patients undergoing primary percutaneous coronary intervention for ST‐elevation myocardial infarction: a key process analysis of patient and program factors. Am Heart J. 2008;155(2):290–297.
- , , , et al. Weekend hospital admission and discharge for heart failure: association with quality of care and clinical outcomes. Am Heart J. 2009;158(3):451–458.
- , , , , Comparison of perioperative outcomes and cost of spinal fusion for cervical trauma: weekday versus weekend admissions. Spine. 2013;38(25):2178–2183.
- , , , , Day of week of procedure and 30 day mortality for elective surgery: retrospective analysis of hospital episode statistics. BMJ. 2013;346:f2424.
- , Consequences of discharges from intensive care at night. Lancet. 2000;355(9210):1138–1142.
- , , Waiting for the break of dawn? The effects of discharge time, discharge TISS scores and discharge facility on hospital mortality after intensive care. Intensive Care Med. 2002;28(9):1287–1293.
- , After‐hours discharges from intensive care are associated with increased mortality. Med J Aust. 2006;184(7):334–337.
- , Impact of intensive care unit discharge time on patient outcome. Crit Care Med. 2006;34(12):2946–2951.
- , , , Hospital mortality among adults admitted to and discharged from intensive care on weekends and evenings. J Crit Care. 2008;23(3):317–324.
- , , , et al. Factors associated with increased risk of readmission to intensive care in Australia. Intensive Care Med. 2011;37(11):1800–1808.
- , , , , After‐hours discharge from intensive care increases the risk of readmission and death. Anaesth Intensive Care. 2007;35(4):477–485.
- , , The effects of ICU admission and discharge times on mortality in Finland. Intensive Care Med. 2003;29(12):2144–2148.
- , , , , Day of discharge and hospital readmission rates within 30 days in children: a population‐based study. Paediatr Child Health. 2006;11(7):409–412.
- , , , Using same‐hospital readmission rates to estimate all‐hospital readmission rates. J Am Coll Surg. 2014;219(4):656–663.
- , , , et al. Evaluation of hospital readmissions in surgical patients: do administrative data tell the real story? JAMA Surg. 2014;149(8):759–764.
© 2015 Society of Hospital Medicine

Revision Rotator Cuff Reconstruction for Large Tears With Retraction: A Novel Technique Using Autogenous Tendon and Autologous Marrow
Primary rotator cuff repair is a common procedure that consistently yields favorable clinical results.1 Revision rotator cuff repair and reconstruction yield less consistent clinical results and are associated with a significant incidence of recurrent cuff tearing.2 Possible factors contributing to the loss of tissue continuity have included poor quality or frank loss of rotator cuff tissue, diminished biological potential of the rotator cuff tendon, and excessive mechanical stress on or strain of the reconstructive surgical construct.3
I conducted a pilot study involving a technique that addresses these potential factors, amalgamating several contemporary surgical methods with the addition of a novel step: an autogenous tendon graft incubated in autologous bone marrow concentrate.
Materials and Methods
Ten consecutive patients (7 men, 3 women) enrolled in this retrospective case series. Mean age at time of surgery was 58 years (range, 47-65 years). Mean follow-up was 24 months (range, 12-44 months), and no patients were lost to follow-up. Mean time between original primary repair and current reconstruction was 36 months (range, 6-120 months). Criteria for enrollment included unremitting shoulder pain, radiographs showing no significant degenerative joint disease, magnetic resonance imaging confirming a large (3-5 cm) full-thickness rotator cuff tear with retraction, and history of prior rotator cuff repair on the affected shoulder without associated biceps tenodesis. The intraoperative inclusion criterion was direct visualization of a 3- to 5-cm full-thickness rotator cuff tear with retraction of at least 3 cm. Validated Constant, American Shoulder and Elbow Surgeons (ASES), and University of California Los Angeles (UCLA) shoulder scoring systems were used to collect range-of-motion, pain, strength, daily function, and patient satisfaction data before and after surgery. Standard error was calculated. Two-sample t test was used for preoperative–postoperative comparisons. Postoperative integrity of the rotator cuff reconstruction was evaluated by an independent full-time academic musculoskeletal radiologist using dynamic diagnostic ultrasound (iU22 xMatrix Ultrasound System [Philips Healthcare] at L 9-3 MHz). Informed consent was obtained from each patient. The study was approved by institutional review board.
After induction of general anesthesia, each patient was placed in the lateral decubitus position. Bone marrow (60 mL) was aspirated through a 14-gauge needle from a dorsal iliac table, just inferior to the iliac crest (Figure 1). The patient was then placed into the beach-chair position on a surgical shoulder table. The aspirated marrow was centrifuged at 2800 and 3800 rpm for 14 to 17 minutes (Magellan Autologous Platelet Separator; Arteriocyte Medical Systems) to yield 10 mL of a concentrated (4- to 5-fold) mixture of platelet-rich plasma (PRP) and mesenchymal stem cells. Surgery was performed through a 3-cm oblique anterior mini-open incision between the anterior corner of the acromion and the coracoid process, as I previously described.4 The deltoid muscle was split, not detached. Acromioplasty and release of the coracoacromial ligament were performed. The rotator cuff was inspected under ×4.5 optical magnification. The cuff tissue was mobilized and débrided back to a healthy-appearing margin. The size and shape of the rotator cuff defect were then estimated. The long head of the biceps was harvested from its origin just distal to the superior glenoid labrum unto the intertubercular sulcus on the proximal humerus. The remainder of the biceps tendon was tenodesed to the surgical neck of the humerus. The biceps tendon graft was then manipulated and fashioned (by longitudinal partial-thickness incision and expansion) to fit the cuff defect (Figures 2, 3). The expanded graft was incubated in the concentrated marrow (10 mL) for 60 minutes (Figure 4). Débridement at the base of the greater tuberosity down to bleeding cancellous bone was followed by insertion of multiple bone anchors bearing several strands of No. 2 synthetic suture. These strands were then passed through the biceps tendon graft for secure fixation (Figure 5). The débrided end of the rotator cuff was then sewn to the biceps tendon graft using locking stitches under zero tissue tension with the arm in full adduction. The free end of the graft was sewn to the subscapularis tendon (Figure 6). The remaining marrow concentrate was injected both deep and superficial to the rotator cuff construct. No additional wound irrigation fluid was injected or suction drain inserted. After surgery, the patient was placed into an abduction pillow for 1 month and then engaged in passive motion for 1 month. Active-assisted motion began 3 months after surgery.

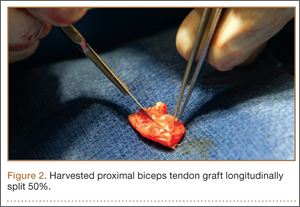
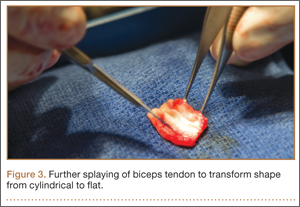
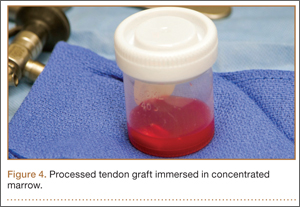
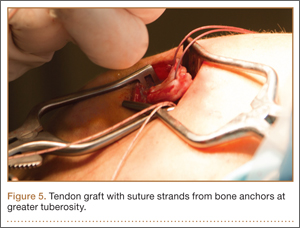
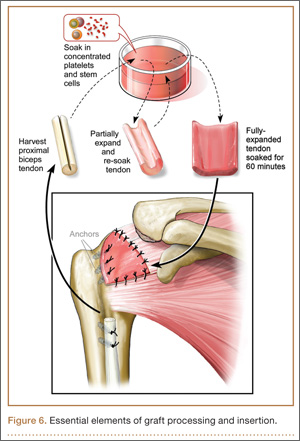
Results
Clinically, all patients improved with respect to pain, motion, strength, function, and satisfaction by virtue of the reconstructive surgery. After surgery, mean Constant score was increased, from 13 to 71 (P < .001). Mean ASES score increased from 18 to 75 (P < .001). Mean UCLA score increased from 4 to 28 (P < .001) (Table). Ultrasound showed 0% incidence of full-thickness retearing. Dynamic scanning during abduction showed maintained reduction of the humeral head within the glenoid socket; superior subluxation of the humeral head was not detected. The biceps tendon graft was continuous with the rotator cuff tendon, indicative of graft integration: tissue healing at the graft–bone and graft–tendon interfaces (Figures 7, 8). There were no intraoperative or postoperative patient-related complications.
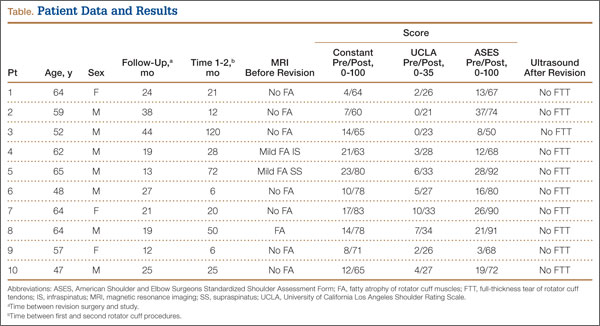
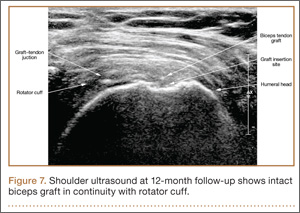
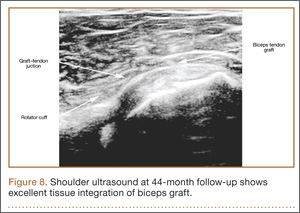
Discussion
Primary rotator cuff surgery is beneficial.5 Irrespective of technique, open versus arthroscopic,6 single- versus double-row repair,7 the clinical results have been satisfactory.8 Nevertheless, the “tissue failure” rate of rotator cuff surgery (full-thickness discontinuity of rotator cuff) has been as high as 31% in primary repairs.9 In revision rotator cuff repair and reconstruction, the radiographic tissue failure rate has been even higher, particularly in the setting of chronic large tears with retraction, with tissue failure rates up to 91%.10 Although small to medium full-thickness tears and retears are well tolerated by patients with reduced activity levels,11 and pain symptoms do not necessarily correlate with rotator cuff tear size,12 large retracted full-thickness tears in active patients seldom result in optimal clinical outcomes or patient satisfaction.13,14 In addition, although recurrent tearing does not preclude a satisfactory clinical result, maintenance of cuff tissue integrity tends to produce a better objective clinical score and a more desirable clinical outcome.2
Few evidence-based restorative solutions exist for large recurrent rotator cuff tears with retraction in active nongeriatric patients.15 The no-treatment option in this context may result in gradual enlargement of the tear, chronic pain, weakness, and progressive degeneration of the glenohumeral joint and acromiohumeral confluence—so-called rotator cuff arthropathy, for which reverse total shoulder arthroplasty is required.16,17 Partial repair of a large rotator cuff tear by margin convergence, interval slide, split deltoid flap, or nonanatomical reinsertion may improve clinical outcome scores but may not alter or prevent the progressive degenerative changes associated with rotator cuff arthropathy.18,19 Synthetic scaffolds with and without biological enhancement have been used with varying degrees of success, particularly pain improvement and tissue integration.20 Nevertheless, the failure rate has been reported to be 17% to 51%,21 and no evidence exists that allograft augmentation improves functional outcomes.22 Tendon transfer using the latissimus dorsi has also proved to be a surgical alternative in younger, active patients.23 However, dissection in this procedure is a major undertaking for both surgeon and patient—compared with the minimally invasive technique used in the present study.24
I selected a cohort of active, symptomatic patients for application of a synthesis of accepted surgical techniques through a mini-open incision in order to improve the reliability of the surgical construct while minimizing surgical morbidity. Débridement of marginal tissue, safe mobilization of remaining cuff, and tension-free suture line using locking sutures maximized the mechanical strength of the construct.25,26 Biological enhancement with autogenous tissue (the patient’s own biceps tendon) as graft material (scaffolding), as well as autologous concentrated marrow delivering viable responding cells and chemokine/cytokine biofactors, increased the probability of reparative activity at the graft site.27 The net effect was consistent tissue healing at a biologically challenging locus. Nonenhanced biceps tendon grafting in the setting of “irreparable” primary rotator cuff repair has had a 40-year history of orthopedic utility and an excellent record of clinical success.28 Nevertheless, the retear rate has been 7% to 30%.29 There are no previous reports of biologically enhanced autogenous biceps tendon grafting for reconstruction of a torn rotator cuff, either primary or in the setting of chronic revision surgery.
Previous well-designed PRP enhancement studies in the context of primary rotator cuff repair failed to demonstrate a consistent benefit with concentrated platelet-only augmentation.30,31 The shared experimental design of these published studies used intra-articular injection as the sole delivery method without guarantee that the injected platelets would migrate, adhere to, and persist at the intended destination, the healing edge of the rotator cuff. In the present study, extended exposure of the splayed tendon graft by incubation in concentrated marrow was specifically designed to increase the probability that biologically active components would settle at the desired location by cellular seeding and plasmatic imbibition.32 Furthermore, use of PRP for growth factor (platelet-derived, PDGF; basic fibroblast, bFGF; transforming, TGF-β; epidermal, EGF; vascular endothelial, VEGF; connective tissue, CTGF) therapy, in addition to pluripotential mesenchymal cells for marrow-derived stem cell therapy, is in theory biologically superior to use of PRP alone.33,34
The recent expansion of information about biologics has generated much interest in augmentation of soft-tissue healing. Unfortunately, the optimal technique of using cellular processing to upregulate stem-cell capacity at the graft interface is yet to be defined.35 Clinical studies using PRP and related products to promote tendon healing have been both inconsistent and contradictory with respect to benefit of outcome. As we have been unable to harness the biological potential of this medium, application of biologics in contemporary clinical orthopedics remains narrow, random, and infrequent. The technique presented in this clinical series appears to be a small advancement in a positive direction. The described construct provides a starting point for study, combining mechanical as well as biological steps to promote rotator cuff healing. The consistency of the outcome in a clinical model in which retearing is an expectation rather than an exception is noteworthy. The zero tissue failure rate at 1 to 4 years, compared with the literature values in similar patient cohorts, is very promising.36 The clinical outcome as measured by validated shoulder scores is also comparable to literature outcome values.19 Also noteworthy is the dynamic stability the construct gives to the glenohumeral joint. Ideally, the reconstructed rotator cuff provides active force coupling with the deltoid, simulating normal shoulder biomechanics. At a minimum, the reconstructed cuff provides a viable passive barrier to superior migration of the humeral head—thus supporting the mechanical efficiency of the deltoid and preventing rotator cuff arthropathy.
This study’s small sample (10 patients) puts its conclusions at risk for type I statistical error, in that too few patients were examined over a long enough period to demonstrate failure. Nevertheless, retears typically occur within 6 months of repair.37,38 Therefore, minimum follow-up of 1 year was deemed sufficient. None of the 10 patients had diabetes or another chronic comorbidity. Nine of the 10 had either no or only mild preoperative fatty atrophy of the rotator cuff muscles. Eight of the 10 were nonsmokers. These factors, which suggest optimal surgical candidates, may prove to be significant as the clinical series expands over time. Incubation of the autogenous biceps graft in concentrated marrow for 60 minutes was arbitrarily chosen. In future in vitro examination, marrow cell viability as a function of incubation time will be assessed.
Conclusion
In active, middle-aged patients with chronic recurrent large retracted rotator cuff tears, the technique presented here, using autogenous biceps tendon and autologous concentrated marrow containing PRP and mesenchymal cells, consistently yielded satisfactory clinical results and promoted rotator cuff tissue healing without full-thickness retearing.
1. Colvin AC, Egorova N, Harrison AK, Moskowitz A, Flatow EL. National trends in rotator cuff repair. J Bone Joint Surg Am. 2012;94(3):227-233.
2. Kim HM, Caldwell JM, Buza JA, et al. Factors affecting satisfaction and shoulder function in patients with a recurrent rotator cuff tear. J Bone Joint Surg Am. 2014;96(2):106-112.
3. George MS, Khazzam M. Current concepts review: revision rotator cuff repair. J Shoulder Elbow Surg. 2012;21(4):431-440.
4. Skoff HD. Conservative open acromioplasty. J Bone Joint Surg Br. 1995;77(6):933-936.
5. Mather RC 3rd, Koenig L, Acevedo D, et al. The societal and economic value of rotator cuff repair. J Bone Joint Surg Am. 2013;95(22):1993-2000.
6. Sauerbrey AM, Getz CL, Piancastelli M, Iannotti JP, Ramsey ML, Williams GR. Arthroscopic versus mini-open rotator cuff repair: a comparison of clinical outcome. Arthroscopy. 2005;21(12):1415-1420.
7. Koh KH, Kang KC, Lim TK, Shon MS, Yoo JC. Prospective randomized clinical trial of single- versus double-row suture anchor repair in 2- to 4-cm rotator cuff tears: clinical and magnetic resonance imaging results. Arthroscopy. 2011;27(4):453-462.
8. Galatz LM, Griggs S, Cameron BD, Iannotti JP. Prospective longitudinal analysis of post-operative shoulder function: a ten-year follow-up study of full thickness rotator cuff tears. J Bone Joint Surg Am. 2001;83(7):1052-1056.
9. Oh JH, Kim SH, Kang JY, Oh CH, Gong HS. Effect of age on functional and structural outcome after rotator cuff repair. Am J Sports Med. 2010;38(4):672-678.
10. Kim JH, Kim SH, Lee SK, Seo JW, Chun YMC. Arthroscopic repair of massive contracted rotator cuff tears: aggressive release with anterior and posterior interval slides do not improve cuff healing and integrity. J Bone Joint Surg Am. 2014;95(16):1482-1488.
11. Moosmayer S, Lund G, Seljom US, et al. Tendon repair compared with physiotherapy in the treatment of rotator cuff tears. J Bone Joint Surg Am. 2014;96(18):1504-1514.
12. Dunn WR, Kuhn JE, Sanders R, et al. Symptoms of pain do not correlate with rotator cuff tear severity. J Bone Joint Surg Am. 2014;96(10):793-800.
13. Lubiatowski P, Kaczmarek P, Dzianach M, et al. Clinical and biomechanical performance of patients with failed rotator cuff repair. Int Orthop. 2013;37(12):2395-2401.
14. Holtby R, Razmjou H. Relationship between clinical and surgical findings and reparability of large and massive rotator cuff tears: a longitudinal study. BMC Musculoskelet Disord. 2014;15:180.
15. Nho SJ, Delos D, Yadav H, et al. Biomechanical and biological augmentation for the treatment of massive rotator cuff tears. Am J Sports Med. 2010;38(3):619-629.
16. Moosmayer S, Tariq R, Stiris M, Smith HJ. The natural history of asymptomatic rotator cuff tears: a three-year follow-up of fifty cases. J Bone Joint Surg Am. 2013;95(14):1249-1255.
17. Neer CS 2nd, Craig EV, Fukuda H. Cuff-tear arthropathy. J Bone Joint Surg Am. 1983;65(9):1232-1244.
18. Bartl C, Louloumentas P, Konstantin H, et al. Long-term outcome and structural integrity following open repair of massive rotator cuff tears. Int J Shoulder Surg. 2012;6(1):1-8.
19. Paxton ES, Teefey SA, Dahiya N, Keener JD, Yamaguchi K, Galatz LM. Clinical and radiographic outcomes of failed repairs of large or massive rotator cuff tears: minimum ten-year follow-up. J Bone Joint Surg Am. 2013;95(7):627-632.
20. Longo UG, Lamberti A, Maffulli N, Denaro V. Tendon augmentation grafts: a systematic review. Br Med Bull. 2010;94:165-188.
21. Ciampi P, Scotti C, Nonis A, et al. The benefit of synthetic versus biological patch augmentation in the repair of posterosuperior massive rotator cuff tears: a 3-year follow-up study. Am J Sports Med. 2014;42(5):1169-1175.
22. Murhi AM. Rotator cuff tears and cuff tear arthropathy. In: Boyer MI, ed. AAOS Comprehensive Orthopedic Review. Vol 2. Rosemont, IL: American Academy of Orthopaedic Surgeons; 2014:921-929.
23. Namdari S, Voleti P, Baldwin K, Glaser D, Huffman GR. Latissimus dorsi tendon transfer for irreparable rotator cuff tears: a systematic review. J Bone Joint Surg Am. 2012;94(10):891-898.
24. Gerber C, Rahm SA, Catanzaro S, Farshad M, Moor BK. Latissimus dorsi tendon transfer for treatment of irreparable posterosuperior rotator cuff tears: long-term results at a minimum follow-up of ten years. J Bone Joint Surg Am. 2013;95(21):1920-1926.
25. Wagner JP, Krushall RJ, Masqueloet A, Gerber C. Anatomy and relationships of the suprascapular nerve: anatomical constraints to mobilization of the supraspinatus and infraspinatus muscles in the management of massive rotator cuff tears. J Bone Joint Surg Am. 1992;74(1):36-45.
26. Ponce BA, Hosemann CD, Reghava P, Tate JP, Sheppard ED, Ebenhardt AW. A biomechanical analysis of controllable intraoperative variables affecting the strength of rotator cuff repairs at the suture–tendon interface. Am J Sports Med. 2013;41(10):2256-2261.
27. Thomopoulos S. Tendon and ligaments. In: Boyer MI, ed. AAOS Comprehensive Orthopedic Review. Vol 2. Rosemont, IL: American Academy of Orthopaedic Surgeons; 2014:105-111.
28. Sano H, Mineta M, Kitz A, Itoi E. Tendon patch grafting using the long head of the biceps for irreparable massive rotator cuff tears. J Orthop Sci. 2010;15(3):310-316.
29. Rhee YG, Cho NS, Lim CT, Yi JW, Vishvanathan T. Bridging the gap in immobile massive rotator cuff tears: augmentation using the tenotomized biceps. Am J Sports Med. 2008;36(8):1511-1518.
30. Castricini R, Longo UG, De Benedetto M, et al. Platelet-rich plasma augmentation for arthroscopic rotator cuff repair: a randomized controlled trial. Am J Sports Med. 2011;39(2):258-265.
31. Rodeo SA, Delos, D, Williams, RJ, Adler RS, Pearle A, Warren RF. The effects of platelet-rich fibrin matrix on rotator cuff tendon healing: a prospective, randomized clinical study. Am J Sports Med. 2012;40(6):1234-1241.
32. Beitzel K, McCarthy MB, Cote MP, et al. Properties of biologic scaffolds and their response to mesenchymal stem cells. Arthroscopy. 2014;30(3):289-298.
33. Anz AW, Hackel JG, Nilssen ED, Andrews JR. Application of biologics in the treatment of rotator cuff, meniscus, cartilage and osteoarthritis. J Am Acad Orthop Surg. 2014;22(2):68-79.
34. Hernigou P, Flouzat Lachaniette CH, Delambre J, et al. Biologic augmentation of rotator cuff repair with mesenchymal stem cells during arthroscopy improves healing and prevents further tears: a case-controlled study. Int Orthop. 2014;38(9):1811-1818.
35. Hsu WK, Mishra A, Rodeo SR, et al. Platelet-rich plasma in orthopaedic applications: evidence-based recommendations for treatment. J Am Acad Orthop Surg. 2013;21(12):739-748.
36. Kowalsky MS, Keener JD. Revision arthroscopic rotator cuff repair: repair integrity and clinical outcome: surgical technique. J Bone Joint Surg Am. 2011;93(suppl 1):62-74.
37. Iannotti JP, Deutsch A, Green A, et al. Time to failure after rotator cuff repair: a prospective imaging study. J Bone Joint Surg Am. 2013;95(11):965-971.
38. Le BT, Wu XL, Lam PH, Murrell GA. Factors predicting rotator cuff retears: an analysis of 1000 consecutive rotator cuff repairs. Am J Sports Med. 2014;42(5):1134-1142.
Primary rotator cuff repair is a common procedure that consistently yields favorable clinical results.1 Revision rotator cuff repair and reconstruction yield less consistent clinical results and are associated with a significant incidence of recurrent cuff tearing.2 Possible factors contributing to the loss of tissue continuity have included poor quality or frank loss of rotator cuff tissue, diminished biological potential of the rotator cuff tendon, and excessive mechanical stress on or strain of the reconstructive surgical construct.3
I conducted a pilot study involving a technique that addresses these potential factors, amalgamating several contemporary surgical methods with the addition of a novel step: an autogenous tendon graft incubated in autologous bone marrow concentrate.
Materials and Methods
Ten consecutive patients (7 men, 3 women) enrolled in this retrospective case series. Mean age at time of surgery was 58 years (range, 47-65 years). Mean follow-up was 24 months (range, 12-44 months), and no patients were lost to follow-up. Mean time between original primary repair and current reconstruction was 36 months (range, 6-120 months). Criteria for enrollment included unremitting shoulder pain, radiographs showing no significant degenerative joint disease, magnetic resonance imaging confirming a large (3-5 cm) full-thickness rotator cuff tear with retraction, and history of prior rotator cuff repair on the affected shoulder without associated biceps tenodesis. The intraoperative inclusion criterion was direct visualization of a 3- to 5-cm full-thickness rotator cuff tear with retraction of at least 3 cm. Validated Constant, American Shoulder and Elbow Surgeons (ASES), and University of California Los Angeles (UCLA) shoulder scoring systems were used to collect range-of-motion, pain, strength, daily function, and patient satisfaction data before and after surgery. Standard error was calculated. Two-sample t test was used for preoperative–postoperative comparisons. Postoperative integrity of the rotator cuff reconstruction was evaluated by an independent full-time academic musculoskeletal radiologist using dynamic diagnostic ultrasound (iU22 xMatrix Ultrasound System [Philips Healthcare] at L 9-3 MHz). Informed consent was obtained from each patient. The study was approved by institutional review board.
After induction of general anesthesia, each patient was placed in the lateral decubitus position. Bone marrow (60 mL) was aspirated through a 14-gauge needle from a dorsal iliac table, just inferior to the iliac crest (Figure 1). The patient was then placed into the beach-chair position on a surgical shoulder table. The aspirated marrow was centrifuged at 2800 and 3800 rpm for 14 to 17 minutes (Magellan Autologous Platelet Separator; Arteriocyte Medical Systems) to yield 10 mL of a concentrated (4- to 5-fold) mixture of platelet-rich plasma (PRP) and mesenchymal stem cells. Surgery was performed through a 3-cm oblique anterior mini-open incision between the anterior corner of the acromion and the coracoid process, as I previously described.4 The deltoid muscle was split, not detached. Acromioplasty and release of the coracoacromial ligament were performed. The rotator cuff was inspected under ×4.5 optical magnification. The cuff tissue was mobilized and débrided back to a healthy-appearing margin. The size and shape of the rotator cuff defect were then estimated. The long head of the biceps was harvested from its origin just distal to the superior glenoid labrum unto the intertubercular sulcus on the proximal humerus. The remainder of the biceps tendon was tenodesed to the surgical neck of the humerus. The biceps tendon graft was then manipulated and fashioned (by longitudinal partial-thickness incision and expansion) to fit the cuff defect (Figures 2, 3). The expanded graft was incubated in the concentrated marrow (10 mL) for 60 minutes (Figure 4). Débridement at the base of the greater tuberosity down to bleeding cancellous bone was followed by insertion of multiple bone anchors bearing several strands of No. 2 synthetic suture. These strands were then passed through the biceps tendon graft for secure fixation (Figure 5). The débrided end of the rotator cuff was then sewn to the biceps tendon graft using locking stitches under zero tissue tension with the arm in full adduction. The free end of the graft was sewn to the subscapularis tendon (Figure 6). The remaining marrow concentrate was injected both deep and superficial to the rotator cuff construct. No additional wound irrigation fluid was injected or suction drain inserted. After surgery, the patient was placed into an abduction pillow for 1 month and then engaged in passive motion for 1 month. Active-assisted motion began 3 months after surgery.
Results
Clinically, all patients improved with respect to pain, motion, strength, function, and satisfaction by virtue of the reconstructive surgery. After surgery, mean Constant score was increased, from 13 to 71 (P < .001). Mean ASES score increased from 18 to 75 (P < .001). Mean UCLA score increased from 4 to 28 (P < .001) (Table). Ultrasound showed 0% incidence of full-thickness retearing. Dynamic scanning during abduction showed maintained reduction of the humeral head within the glenoid socket; superior subluxation of the humeral head was not detected. The biceps tendon graft was continuous with the rotator cuff tendon, indicative of graft integration: tissue healing at the graft–bone and graft–tendon interfaces (Figures 7, 8). There were no intraoperative or postoperative patient-related complications.
Discussion
Primary rotator cuff surgery is beneficial.5 Irrespective of technique, open versus arthroscopic,6 single- versus double-row repair,7 the clinical results have been satisfactory.8 Nevertheless, the “tissue failure” rate of rotator cuff surgery (full-thickness discontinuity of rotator cuff) has been as high as 31% in primary repairs.9 In revision rotator cuff repair and reconstruction, the radiographic tissue failure rate has been even higher, particularly in the setting of chronic large tears with retraction, with tissue failure rates up to 91%.10 Although small to medium full-thickness tears and retears are well tolerated by patients with reduced activity levels,11 and pain symptoms do not necessarily correlate with rotator cuff tear size,12 large retracted full-thickness tears in active patients seldom result in optimal clinical outcomes or patient satisfaction.13,14 In addition, although recurrent tearing does not preclude a satisfactory clinical result, maintenance of cuff tissue integrity tends to produce a better objective clinical score and a more desirable clinical outcome.2
Few evidence-based restorative solutions exist for large recurrent rotator cuff tears with retraction in active nongeriatric patients.15 The no-treatment option in this context may result in gradual enlargement of the tear, chronic pain, weakness, and progressive degeneration of the glenohumeral joint and acromiohumeral confluence—so-called rotator cuff arthropathy, for which reverse total shoulder arthroplasty is required.16,17 Partial repair of a large rotator cuff tear by margin convergence, interval slide, split deltoid flap, or nonanatomical reinsertion may improve clinical outcome scores but may not alter or prevent the progressive degenerative changes associated with rotator cuff arthropathy.18,19 Synthetic scaffolds with and without biological enhancement have been used with varying degrees of success, particularly pain improvement and tissue integration.20 Nevertheless, the failure rate has been reported to be 17% to 51%,21 and no evidence exists that allograft augmentation improves functional outcomes.22 Tendon transfer using the latissimus dorsi has also proved to be a surgical alternative in younger, active patients.23 However, dissection in this procedure is a major undertaking for both surgeon and patient—compared with the minimally invasive technique used in the present study.24
I selected a cohort of active, symptomatic patients for application of a synthesis of accepted surgical techniques through a mini-open incision in order to improve the reliability of the surgical construct while minimizing surgical morbidity. Débridement of marginal tissue, safe mobilization of remaining cuff, and tension-free suture line using locking sutures maximized the mechanical strength of the construct.25,26 Biological enhancement with autogenous tissue (the patient’s own biceps tendon) as graft material (scaffolding), as well as autologous concentrated marrow delivering viable responding cells and chemokine/cytokine biofactors, increased the probability of reparative activity at the graft site.27 The net effect was consistent tissue healing at a biologically challenging locus. Nonenhanced biceps tendon grafting in the setting of “irreparable” primary rotator cuff repair has had a 40-year history of orthopedic utility and an excellent record of clinical success.28 Nevertheless, the retear rate has been 7% to 30%.29 There are no previous reports of biologically enhanced autogenous biceps tendon grafting for reconstruction of a torn rotator cuff, either primary or in the setting of chronic revision surgery.
Previous well-designed PRP enhancement studies in the context of primary rotator cuff repair failed to demonstrate a consistent benefit with concentrated platelet-only augmentation.30,31 The shared experimental design of these published studies used intra-articular injection as the sole delivery method without guarantee that the injected platelets would migrate, adhere to, and persist at the intended destination, the healing edge of the rotator cuff. In the present study, extended exposure of the splayed tendon graft by incubation in concentrated marrow was specifically designed to increase the probability that biologically active components would settle at the desired location by cellular seeding and plasmatic imbibition.32 Furthermore, use of PRP for growth factor (platelet-derived, PDGF; basic fibroblast, bFGF; transforming, TGF-β; epidermal, EGF; vascular endothelial, VEGF; connective tissue, CTGF) therapy, in addition to pluripotential mesenchymal cells for marrow-derived stem cell therapy, is in theory biologically superior to use of PRP alone.33,34
The recent expansion of information about biologics has generated much interest in augmentation of soft-tissue healing. Unfortunately, the optimal technique of using cellular processing to upregulate stem-cell capacity at the graft interface is yet to be defined.35 Clinical studies using PRP and related products to promote tendon healing have been both inconsistent and contradictory with respect to benefit of outcome. As we have been unable to harness the biological potential of this medium, application of biologics in contemporary clinical orthopedics remains narrow, random, and infrequent. The technique presented in this clinical series appears to be a small advancement in a positive direction. The described construct provides a starting point for study, combining mechanical as well as biological steps to promote rotator cuff healing. The consistency of the outcome in a clinical model in which retearing is an expectation rather than an exception is noteworthy. The zero tissue failure rate at 1 to 4 years, compared with the literature values in similar patient cohorts, is very promising.36 The clinical outcome as measured by validated shoulder scores is also comparable to literature outcome values.19 Also noteworthy is the dynamic stability the construct gives to the glenohumeral joint. Ideally, the reconstructed rotator cuff provides active force coupling with the deltoid, simulating normal shoulder biomechanics. At a minimum, the reconstructed cuff provides a viable passive barrier to superior migration of the humeral head—thus supporting the mechanical efficiency of the deltoid and preventing rotator cuff arthropathy.
This study’s small sample (10 patients) puts its conclusions at risk for type I statistical error, in that too few patients were examined over a long enough period to demonstrate failure. Nevertheless, retears typically occur within 6 months of repair.37,38 Therefore, minimum follow-up of 1 year was deemed sufficient. None of the 10 patients had diabetes or another chronic comorbidity. Nine of the 10 had either no or only mild preoperative fatty atrophy of the rotator cuff muscles. Eight of the 10 were nonsmokers. These factors, which suggest optimal surgical candidates, may prove to be significant as the clinical series expands over time. Incubation of the autogenous biceps graft in concentrated marrow for 60 minutes was arbitrarily chosen. In future in vitro examination, marrow cell viability as a function of incubation time will be assessed.
Conclusion
In active, middle-aged patients with chronic recurrent large retracted rotator cuff tears, the technique presented here, using autogenous biceps tendon and autologous concentrated marrow containing PRP and mesenchymal cells, consistently yielded satisfactory clinical results and promoted rotator cuff tissue healing without full-thickness retearing.
1. Colvin AC, Egorova N, Harrison AK, Moskowitz A, Flatow EL. National trends in rotator cuff repair. J Bone Joint Surg Am. 2012;94(3):227-233.
2. Kim HM, Caldwell JM, Buza JA, et al. Factors affecting satisfaction and shoulder function in patients with a recurrent rotator cuff tear. J Bone Joint Surg Am. 2014;96(2):106-112.
3. George MS, Khazzam M. Current concepts review: revision rotator cuff repair. J Shoulder Elbow Surg. 2012;21(4):431-440.
4. Skoff HD. Conservative open acromioplasty. J Bone Joint Surg Br. 1995;77(6):933-936.
5. Mather RC 3rd, Koenig L, Acevedo D, et al. The societal and economic value of rotator cuff repair. J Bone Joint Surg Am. 2013;95(22):1993-2000.
6. Sauerbrey AM, Getz CL, Piancastelli M, Iannotti JP, Ramsey ML, Williams GR. Arthroscopic versus mini-open rotator cuff repair: a comparison of clinical outcome. Arthroscopy. 2005;21(12):1415-1420.
7. Koh KH, Kang KC, Lim TK, Shon MS, Yoo JC. Prospective randomized clinical trial of single- versus double-row suture anchor repair in 2- to 4-cm rotator cuff tears: clinical and magnetic resonance imaging results. Arthroscopy. 2011;27(4):453-462.
8. Galatz LM, Griggs S, Cameron BD, Iannotti JP. Prospective longitudinal analysis of post-operative shoulder function: a ten-year follow-up study of full thickness rotator cuff tears. J Bone Joint Surg Am. 2001;83(7):1052-1056.
9. Oh JH, Kim SH, Kang JY, Oh CH, Gong HS. Effect of age on functional and structural outcome after rotator cuff repair. Am J Sports Med. 2010;38(4):672-678.
10. Kim JH, Kim SH, Lee SK, Seo JW, Chun YMC. Arthroscopic repair of massive contracted rotator cuff tears: aggressive release with anterior and posterior interval slides do not improve cuff healing and integrity. J Bone Joint Surg Am. 2014;95(16):1482-1488.
11. Moosmayer S, Lund G, Seljom US, et al. Tendon repair compared with physiotherapy in the treatment of rotator cuff tears. J Bone Joint Surg Am. 2014;96(18):1504-1514.
12. Dunn WR, Kuhn JE, Sanders R, et al. Symptoms of pain do not correlate with rotator cuff tear severity. J Bone Joint Surg Am. 2014;96(10):793-800.
13. Lubiatowski P, Kaczmarek P, Dzianach M, et al. Clinical and biomechanical performance of patients with failed rotator cuff repair. Int Orthop. 2013;37(12):2395-2401.
14. Holtby R, Razmjou H. Relationship between clinical and surgical findings and reparability of large and massive rotator cuff tears: a longitudinal study. BMC Musculoskelet Disord. 2014;15:180.
15. Nho SJ, Delos D, Yadav H, et al. Biomechanical and biological augmentation for the treatment of massive rotator cuff tears. Am J Sports Med. 2010;38(3):619-629.
16. Moosmayer S, Tariq R, Stiris M, Smith HJ. The natural history of asymptomatic rotator cuff tears: a three-year follow-up of fifty cases. J Bone Joint Surg Am. 2013;95(14):1249-1255.
17. Neer CS 2nd, Craig EV, Fukuda H. Cuff-tear arthropathy. J Bone Joint Surg Am. 1983;65(9):1232-1244.
18. Bartl C, Louloumentas P, Konstantin H, et al. Long-term outcome and structural integrity following open repair of massive rotator cuff tears. Int J Shoulder Surg. 2012;6(1):1-8.
19. Paxton ES, Teefey SA, Dahiya N, Keener JD, Yamaguchi K, Galatz LM. Clinical and radiographic outcomes of failed repairs of large or massive rotator cuff tears: minimum ten-year follow-up. J Bone Joint Surg Am. 2013;95(7):627-632.
20. Longo UG, Lamberti A, Maffulli N, Denaro V. Tendon augmentation grafts: a systematic review. Br Med Bull. 2010;94:165-188.
21. Ciampi P, Scotti C, Nonis A, et al. The benefit of synthetic versus biological patch augmentation in the repair of posterosuperior massive rotator cuff tears: a 3-year follow-up study. Am J Sports Med. 2014;42(5):1169-1175.
22. Murhi AM. Rotator cuff tears and cuff tear arthropathy. In: Boyer MI, ed. AAOS Comprehensive Orthopedic Review. Vol 2. Rosemont, IL: American Academy of Orthopaedic Surgeons; 2014:921-929.
23. Namdari S, Voleti P, Baldwin K, Glaser D, Huffman GR. Latissimus dorsi tendon transfer for irreparable rotator cuff tears: a systematic review. J Bone Joint Surg Am. 2012;94(10):891-898.
24. Gerber C, Rahm SA, Catanzaro S, Farshad M, Moor BK. Latissimus dorsi tendon transfer for treatment of irreparable posterosuperior rotator cuff tears: long-term results at a minimum follow-up of ten years. J Bone Joint Surg Am. 2013;95(21):1920-1926.
25. Wagner JP, Krushall RJ, Masqueloet A, Gerber C. Anatomy and relationships of the suprascapular nerve: anatomical constraints to mobilization of the supraspinatus and infraspinatus muscles in the management of massive rotator cuff tears. J Bone Joint Surg Am. 1992;74(1):36-45.
26. Ponce BA, Hosemann CD, Reghava P, Tate JP, Sheppard ED, Ebenhardt AW. A biomechanical analysis of controllable intraoperative variables affecting the strength of rotator cuff repairs at the suture–tendon interface. Am J Sports Med. 2013;41(10):2256-2261.
27. Thomopoulos S. Tendon and ligaments. In: Boyer MI, ed. AAOS Comprehensive Orthopedic Review. Vol 2. Rosemont, IL: American Academy of Orthopaedic Surgeons; 2014:105-111.
28. Sano H, Mineta M, Kitz A, Itoi E. Tendon patch grafting using the long head of the biceps for irreparable massive rotator cuff tears. J Orthop Sci. 2010;15(3):310-316.
29. Rhee YG, Cho NS, Lim CT, Yi JW, Vishvanathan T. Bridging the gap in immobile massive rotator cuff tears: augmentation using the tenotomized biceps. Am J Sports Med. 2008;36(8):1511-1518.
30. Castricini R, Longo UG, De Benedetto M, et al. Platelet-rich plasma augmentation for arthroscopic rotator cuff repair: a randomized controlled trial. Am J Sports Med. 2011;39(2):258-265.
31. Rodeo SA, Delos, D, Williams, RJ, Adler RS, Pearle A, Warren RF. The effects of platelet-rich fibrin matrix on rotator cuff tendon healing: a prospective, randomized clinical study. Am J Sports Med. 2012;40(6):1234-1241.
32. Beitzel K, McCarthy MB, Cote MP, et al. Properties of biologic scaffolds and their response to mesenchymal stem cells. Arthroscopy. 2014;30(3):289-298.
33. Anz AW, Hackel JG, Nilssen ED, Andrews JR. Application of biologics in the treatment of rotator cuff, meniscus, cartilage and osteoarthritis. J Am Acad Orthop Surg. 2014;22(2):68-79.
34. Hernigou P, Flouzat Lachaniette CH, Delambre J, et al. Biologic augmentation of rotator cuff repair with mesenchymal stem cells during arthroscopy improves healing and prevents further tears: a case-controlled study. Int Orthop. 2014;38(9):1811-1818.
35. Hsu WK, Mishra A, Rodeo SR, et al. Platelet-rich plasma in orthopaedic applications: evidence-based recommendations for treatment. J Am Acad Orthop Surg. 2013;21(12):739-748.
36. Kowalsky MS, Keener JD. Revision arthroscopic rotator cuff repair: repair integrity and clinical outcome: surgical technique. J Bone Joint Surg Am. 2011;93(suppl 1):62-74.
37. Iannotti JP, Deutsch A, Green A, et al. Time to failure after rotator cuff repair: a prospective imaging study. J Bone Joint Surg Am. 2013;95(11):965-971.
38. Le BT, Wu XL, Lam PH, Murrell GA. Factors predicting rotator cuff retears: an analysis of 1000 consecutive rotator cuff repairs. Am J Sports Med. 2014;42(5):1134-1142.
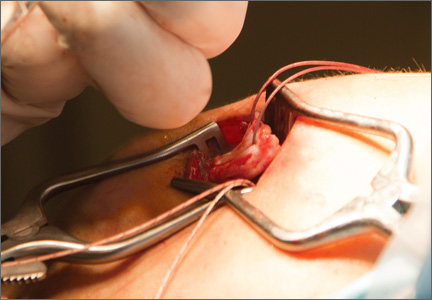
Total Hip Arthroplasty for Posttraumatic Osteoarthritis of the Hip Fares Worse Than THA for Primary Osteoarthritis
The incidence of hip fractures decreased between 1995 and 2005, but these injuries continue to occur in large numbers. Between 1986 and 2005, the mean annual number of hip fractures was 957.3/100,000, and the majority of these occurred in patients 75 to 84 years old.1 Investigators have described total hip arthroplasty (THA) performed after initial surgical treatment in patients who developed osteoarthritis (OA) of the hip secondary to a fracture.2-7 Only 1 of these studies compared these patients with a control group of patients who had THA for primary hip OA.2 No study included both previous proximal femur and acetabular fractures.
Postfracture OA may occur when there is residual articular incongruity after fracture or osteonecrosis of the femoral head. THA is commonly used to treat OA when more conservative treatments have failed.6 Other indications for conversion to THA include femoral neck nonunion, significant leg-length discrepancy, and femoral head damage caused by previous internal fixation.4
Given these conditions and previous study findings, THA performed in patients with previous hip fracture fixation is potentially more complicated than THA for primary OA. We therefore conducted a study to evaluate differences in sociodemographic factors, surgical details, and outcomes between patients who had THA for posttraumatic OA and patients who had THA for primary OA.
Materials and Methods
After obtaining institutional review board approval and patient consent, we used a prospective database to follow 3844 patients who had THA performed for OA by 1 of 17 different surgeons at a single center over an 8-year period. Patients who had THA for secondary causes of hip OA, developmental hip dysplasia, or inflammatory processes were excluded. Of the remaining 1199 patients, 62 (5.2%) had THA for posttraumatic OA after previous acetabular or proximal femur fracture fixation (Figures 1, 2) (no THA was performed at time of initial fracture treatment), and 1137 had THA for primary OA and served as the control group.
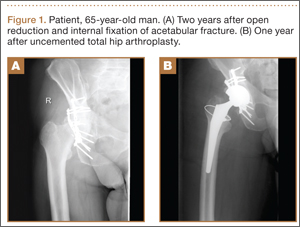
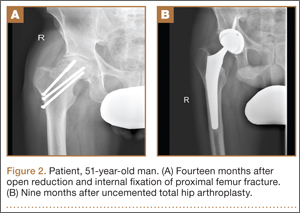
We collected data on age, sex, fracture location, reason for THA, time between open reduction and internal fixation (ORIF) and THA, type of components, cement use, leg-length discrepancy, intraoperative complications, blood loss, operating room time, and postoperative complications. All patients were aseptic at time of THA. All posttraumatic OA patients had previous hardware removed; the extent of hardware removal was dictated by the exposure required for prosthesis implantation. These patients were contacted, and clinical follow-up was assessed with modified Harris Hip Score (HHS).8 HHS was determined by Dr. Khurana. Statistical analysis was performed with Student t test and Pearson χ2 test using PASW Statistics 18 (SPSS, Chicago, Illinois).
The 62 posttraumatic OA patients had 63 fractures, 41 of the proximal femur (femoral neck and intertrochanteric; 65%) and 22 acetabular (35%). This group consisted of 33 females and 29 males. Their mean age at time of THA surgery was 58 years (range, 31-90 years). Mean age of the control patients was 59.4 years (range, 18-95 years). There were 35 right hips and 27 left hips in the posttrauma group. Mean body mass index (BMI) was 28.4 for the posttrauma group and 28.9 for the control group. There were no differences in age (P = .451), sex (P = .674), or BMI (P = .592) between the 2 groups (Table 1).
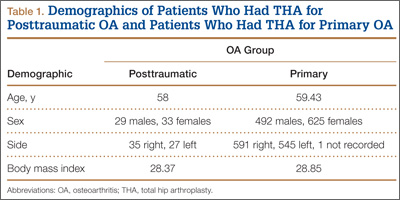
All 62 posttraumatic OA patients had complete hospital data, and 32 (52%) of the 62 underwent long-term follow-up (mean, 4.3 years; range, 4 months–10.5 years). At time of attempted contact (mean, 6.79 years after THA), 7 patients were deceased; cause of death was an unrelated medical condition (1) or unknown (6). The rest of the patients did not respond to multiple telephone and mail summons. Primary reasons for conversion to THA included OA (34 patients, 54%), development of osteonecrosis (12 patients, 19%), and nonunion (12 patients, 19%). The rest of the patients had fixation failure. The mechanisms of injury were motor vehicle accidents (30 patients), falls (20), and other causes (15).
Results
Thirty-two (52%) of the posttraumatic OA patients had a preoperative leg-length discrepancy. For these patients, mean time between initial fracture fixation and conversion to THA was 74 months (range, 1-480 months). Four patients required grafting with cancellous autogenous bone graft or allograft chips to fill a bony defect. Mean acetabular component diameter was 54 mm. Nineteen patients had acetabular fixation supplemented with screws. (Screw supplementation data were not recorded for control patients.) Three patients (4.7%) with an acetabular fracture had heterotopic bone removed at time of THA. Two patients underwent neurolysis of the sciatic nerve at time of surgery for preexisting nerve palsy.
Mean postoperative hemoglobin was 109 g/L in the posttraumatic OA group and 121 g/L in the control group (P <. 001). Mean postoperative hematocrit was 0.327 and 0.367, respectively (P < .001). Mean amount of Cell Saver (Haemonetics) used by patients was 176.2 and 72.9 mL, respectively (P < .001). Posttrauma patients lost a mean of 360 mL of blood more than control patients did (P < .001) and were transfused a mean of 1.59 units of blood, compared with 0.85 unit in the controls (P < .001). Patients with acetabular fractures required a mean of only 0.65 unit of transfused blood. Mean operating room time was 240.5 minutes for posttrauma patients and 135.6 minutes for control patients (P < .001). In the posttrauma group, mean size of the head of the femoral component was 29 mm (head size was not recorded for the control group). Posttrauma patients had 18 (29%) hybrid cemented hip replacements (femoral component only) and 44 uncemented hip replacements. Data on femoral stem size and type were not reported for either group.
Twenty-four posttrauma patients (39%) had a total of 63 perioperative complications, and 131 control patients (11.5%) had a total of 160 complications (P < .001). Complications in posttrauma patients with proximal femur fractures included excess bleeding (5 patients), in-hospital dislocations (2), and postoperative infections (4: 2 superficial wound infections, 1 implant infection requiring explant, 1 Clostridium difficile infection); in patients with acetabular fractures, there was only 1 dislocation (no infections). The posttraumatic OA group did not develop any symptomatic venous thromboembolic complications. One patient developed a sciatic nerve palsy after surgery. Of the 3 patients who sustained dislocations, 2 were treated with closed reduction and maintenance of implants, and 1 with revision THA. Complications in the control group included 3 infections, 4 dislocations, and 12 cases of extensive blood loss (Table 2).
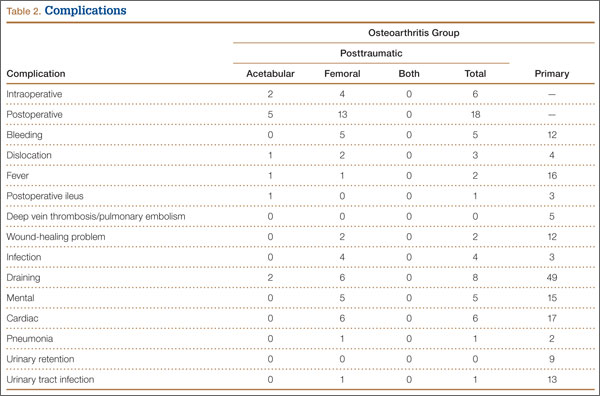
In patients with long-term follow-up, mean postoperative modified HHS was 81.33 (range, 34.1-100.1). Twelve patients had an excellent score (>90), 10 a good score (80-89), 4 a fair score (70-79), and 6 a poor score (<70). Mean HHS was 84.2 for the 16 patients with a femoral head or neck fracture, 77.7 for the 6 patients with an intertrochanteric fracture, and 84.3 for the 9 patients with an acetabular fracture. Nine patients reported using a cane, 3 required walkers, 2 required wheelchairs, and 18 did not require any walking support. Four (12.5%) of the 32 patients required THA revision a mean of 3.5 years (range, 2 months–8 years) after initial arthroplasty. Reasons for revision were infections (2 patients), multiple dislocations (1), and dissociation of acetabular lining (1) (Table 3). Two of the patients who underwent THA revision had a cemented femoral stem, and 2 did not have any cemented implants. Additional details of the femoral stem components were not available for either group.
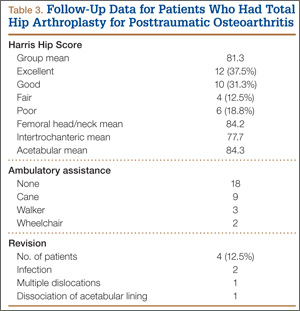
Discussion
Patients who develop posttraumatic OA of the hip have limited options. THA has emerged as an excellent option in cases of failed repair of fractures about the hip joint. The results of the present study are consistent with earlier findings of the effectiveness of THA in salvaging posttraumatic hips.2-7 THA for patients with posttraumatic arthritis of the hip after acetabular or proximal femur fracture is longer and more complicated than THA for primary OA, and there is significantly more blood loss. In addition, the rate of early failure appears to be higher.9
In this study, mean amount of blood transfused for patients with previous acetabular fracture was 0.65 unit, much less than the mean of 3.5 units noted by Weber and colleagues.6 In their study, complications associated with THA were increased in patients with posttraumatic OA from acetabular fractures. The authors attributed these complications to scarring from previous surgery, retained hardware, heterotopic bone, and residual osseous deformity and deficiency. Our results support their conclusion. Operating times were longer, as well as blood loss and the need for blood transfusions and other blood products were increased in the patients with posttraumatic OA, as compared with patients with primary OA. Fifteen percent of patients with an acetabular fracture had undergone removal of heterotopic bone at time of surgery—similar to the rate of 18% noted in the Weber study.6
Our results showed that the rate of revision THA was also higher than in patients with primary THA within the general population—reported to be about 4%.9 The higher rate may be the result of the additional surgeries performed on patients with fractures, or hardware retention increasing the infection risk over the years. Our revision rate of 12.5% was similar to the 19% found by Ranawat and colleagues7 in their study.
A majority of the patients in our study had favorable long-term HHS. Mean overall HHS was 83, slightly better than the 79 reported by Srivastav and colleagues.4 We found that patients with intertrochanteric fractures ultimately had worse outcome scores than patients with acetabular or femoral neck fractures. These results are consistent with findings reported by Mehlhoff and colleagues5 in a study comparing patients with femoral neck and intertrochanteric fractures. Mean HHS for the intertrochanteric fracture patients in our study was 77.7, comparable to the mean of 78 reported by Mehlhoff and colleagues.5 Mean HHS for the femoral neck or head fractures in our study was 84.2, similar to the mean of 81 they noted. Patients with a previous acetabular fracture in our study had a mean HHS of 84.3, consistent with the 84 reported by Ranawat and colleagues7 for patients who had initially undergone ORIF for acetabular fracture. Mean HHS in our study (83) was slightly less than the 88.5 reported by Shi and colleagues10 in their study of primary THAs.
Few studies have been conducted exclusively on one type of hip fracture (acetabular) or another (proximal femur), and all except 1 did not perform a comparison. Tabsh and colleagues2 compared similar cohorts but focused solely on patients with previous proximal femur fractures. The present study included a control group and both acetabular and proximal femur fractures, which allowed us to compare patients with and without previous fracture fixation and to consider the 2 different fracture types and see if they affected outcomes.
The strengths of this study include the large control group and the relatively short data-collection period. The shorter period decreased the influence of improvements in implants on patient outcomes. In addition, the control group was our own population, as we did not compare our cohort of patients with previous internal fixation and patients who had primary THAs in other studies, aside from comparisons for revision rates and HHS.
Although the ultimate long-term follow-up rate for patients with previous internal fixation was 50%, our sample size was still larger than that in most reported studies. Another weakness of our study was the large number of surgeons (17), representing an array of techniques, approaches, and surgical experience. All these factors could have influenced patient outcomes and operative data. In addition, data on revision rates and HHS were not available for our control group, so we could not directly compare these outcomes with those of the posttraumatic group. However, we used previously reported data on revision rates and HHS in primary THAs for comparison with the posttraumatic group.9,10
Conclusion
In this study, THA was a viable option for patients with posttraumatic arthritis from a previous acetabular or proximal femur fracture. The outcomes, however, were less reliable than the outcomes of primary THA for degenerative arthritis, and the complication rates were higher. Surgeons should counsel patients about the complexity of the procedure as well as its ultimately favorable outcomes. Surgeons should expect additional technical difficulties in the operating room when treating this patient population.
1. Brauer CA, Coca-Perraillon M, Cutler DM, Rosen AB. Incidence and mortality of hip fractures in the United States. JAMA. 2009;302(14):1573-1579.
2. Tabsh I, Waddell JP, Morton J. Total hip arthroplasty for complications of proximal femoral fractures. J Orthop Trauma. 1997;11(3):166-169.
3. Haidukewych GJ, Berry DJ. Hip arthroplasty for salvage of failed treatment of intertrochanteric hip fractures. J Bone Joint Surg Am. 2003;85(5):899-904.
4. Srivastav S, Mittal V, Agarwal S. Total hip arthroplasty following failed fixation of proximal hip fractures. Indian J Orthop. 2008;42(3):279-286.
5. Mehlhoff T, Landon GC, Tullos HS. Total hip arthroplasty following failed internal fixation of hip fractures. Clin Orthop Relat Res. 1991;(269):32-37.
6. Weber M, Berry DJ, Harmsen WS. Total hip arthroplasty after operative treatment of an acetabular fracture. J Bone Joint Surg Am. 1998;80(9):1295-1305.
7. Ranawat A, Zelken J, Helfet D, Buly R. Total hip arthroplasty for posttraumatic arthritis after acetabular fracture. J Arthroplasty. 2009;24(5):759-767.
8. Harris WH. Traumatic arthritis of the hip after dislocation and acetabular fractures: treatment by mold arthroplasty. An end-result study using a new method of result evaluation. J Bone Joint Surg Am. 1969;51(4):737-755.
9. Mahomed NN, Barrett JA, Katz JN, et al. Rates and outcomes of primary and revision total hip replacement in the United States Medicare population. J Bone Joint Surg Am. 2003;85(1):27-32.
10. Shi HY, Mau LW, Chang JK, Wang JW, Chiu HC. Responsiveness of the Harris Hip Score and the SF-36: five years after total hip arthroplasty. Qual Life Res. 2009;18(8):1053-1060.
The incidence of hip fractures decreased between 1995 and 2005, but these injuries continue to occur in large numbers. Between 1986 and 2005, the mean annual number of hip fractures was 957.3/100,000, and the majority of these occurred in patients 75 to 84 years old.1 Investigators have described total hip arthroplasty (THA) performed after initial surgical treatment in patients who developed osteoarthritis (OA) of the hip secondary to a fracture.2-7 Only 1 of these studies compared these patients with a control group of patients who had THA for primary hip OA.2 No study included both previous proximal femur and acetabular fractures.
Postfracture OA may occur when there is residual articular incongruity after fracture or osteonecrosis of the femoral head. THA is commonly used to treat OA when more conservative treatments have failed.6 Other indications for conversion to THA include femoral neck nonunion, significant leg-length discrepancy, and femoral head damage caused by previous internal fixation.4
Given these conditions and previous study findings, THA performed in patients with previous hip fracture fixation is potentially more complicated than THA for primary OA. We therefore conducted a study to evaluate differences in sociodemographic factors, surgical details, and outcomes between patients who had THA for posttraumatic OA and patients who had THA for primary OA.
Materials and Methods
After obtaining institutional review board approval and patient consent, we used a prospective database to follow 3844 patients who had THA performed for OA by 1 of 17 different surgeons at a single center over an 8-year period. Patients who had THA for secondary causes of hip OA, developmental hip dysplasia, or inflammatory processes were excluded. Of the remaining 1199 patients, 62 (5.2%) had THA for posttraumatic OA after previous acetabular or proximal femur fracture fixation (Figures 1, 2) (no THA was performed at time of initial fracture treatment), and 1137 had THA for primary OA and served as the control group.
We collected data on age, sex, fracture location, reason for THA, time between open reduction and internal fixation (ORIF) and THA, type of components, cement use, leg-length discrepancy, intraoperative complications, blood loss, operating room time, and postoperative complications. All patients were aseptic at time of THA. All posttraumatic OA patients had previous hardware removed; the extent of hardware removal was dictated by the exposure required for prosthesis implantation. These patients were contacted, and clinical follow-up was assessed with modified Harris Hip Score (HHS).8 HHS was determined by Dr. Khurana. Statistical analysis was performed with Student t test and Pearson χ2 test using PASW Statistics 18 (SPSS, Chicago, Illinois).
The 62 posttraumatic OA patients had 63 fractures, 41 of the proximal femur (femoral neck and intertrochanteric; 65%) and 22 acetabular (35%). This group consisted of 33 females and 29 males. Their mean age at time of THA surgery was 58 years (range, 31-90 years). Mean age of the control patients was 59.4 years (range, 18-95 years). There were 35 right hips and 27 left hips in the posttrauma group. Mean body mass index (BMI) was 28.4 for the posttrauma group and 28.9 for the control group. There were no differences in age (P = .451), sex (P = .674), or BMI (P = .592) between the 2 groups (Table 1).
All 62 posttraumatic OA patients had complete hospital data, and 32 (52%) of the 62 underwent long-term follow-up (mean, 4.3 years; range, 4 months–10.5 years). At time of attempted contact (mean, 6.79 years after THA), 7 patients were deceased; cause of death was an unrelated medical condition (1) or unknown (6). The rest of the patients did not respond to multiple telephone and mail summons. Primary reasons for conversion to THA included OA (34 patients, 54%), development of osteonecrosis (12 patients, 19%), and nonunion (12 patients, 19%). The rest of the patients had fixation failure. The mechanisms of injury were motor vehicle accidents (30 patients), falls (20), and other causes (15).
Results
Thirty-two (52%) of the posttraumatic OA patients had a preoperative leg-length discrepancy. For these patients, mean time between initial fracture fixation and conversion to THA was 74 months (range, 1-480 months). Four patients required grafting with cancellous autogenous bone graft or allograft chips to fill a bony defect. Mean acetabular component diameter was 54 mm. Nineteen patients had acetabular fixation supplemented with screws. (Screw supplementation data were not recorded for control patients.) Three patients (4.7%) with an acetabular fracture had heterotopic bone removed at time of THA. Two patients underwent neurolysis of the sciatic nerve at time of surgery for preexisting nerve palsy.
Mean postoperative hemoglobin was 109 g/L in the posttraumatic OA group and 121 g/L in the control group (P <. 001). Mean postoperative hematocrit was 0.327 and 0.367, respectively (P < .001). Mean amount of Cell Saver (Haemonetics) used by patients was 176.2 and 72.9 mL, respectively (P < .001). Posttrauma patients lost a mean of 360 mL of blood more than control patients did (P < .001) and were transfused a mean of 1.59 units of blood, compared with 0.85 unit in the controls (P < .001). Patients with acetabular fractures required a mean of only 0.65 unit of transfused blood. Mean operating room time was 240.5 minutes for posttrauma patients and 135.6 minutes for control patients (P < .001). In the posttrauma group, mean size of the head of the femoral component was 29 mm (head size was not recorded for the control group). Posttrauma patients had 18 (29%) hybrid cemented hip replacements (femoral component only) and 44 uncemented hip replacements. Data on femoral stem size and type were not reported for either group.
Twenty-four posttrauma patients (39%) had a total of 63 perioperative complications, and 131 control patients (11.5%) had a total of 160 complications (P < .001). Complications in posttrauma patients with proximal femur fractures included excess bleeding (5 patients), in-hospital dislocations (2), and postoperative infections (4: 2 superficial wound infections, 1 implant infection requiring explant, 1 Clostridium difficile infection); in patients with acetabular fractures, there was only 1 dislocation (no infections). The posttraumatic OA group did not develop any symptomatic venous thromboembolic complications. One patient developed a sciatic nerve palsy after surgery. Of the 3 patients who sustained dislocations, 2 were treated with closed reduction and maintenance of implants, and 1 with revision THA. Complications in the control group included 3 infections, 4 dislocations, and 12 cases of extensive blood loss (Table 2).
In patients with long-term follow-up, mean postoperative modified HHS was 81.33 (range, 34.1-100.1). Twelve patients had an excellent score (>90), 10 a good score (80-89), 4 a fair score (70-79), and 6 a poor score (<70). Mean HHS was 84.2 for the 16 patients with a femoral head or neck fracture, 77.7 for the 6 patients with an intertrochanteric fracture, and 84.3 for the 9 patients with an acetabular fracture. Nine patients reported using a cane, 3 required walkers, 2 required wheelchairs, and 18 did not require any walking support. Four (12.5%) of the 32 patients required THA revision a mean of 3.5 years (range, 2 months–8 years) after initial arthroplasty. Reasons for revision were infections (2 patients), multiple dislocations (1), and dissociation of acetabular lining (1) (Table 3). Two of the patients who underwent THA revision had a cemented femoral stem, and 2 did not have any cemented implants. Additional details of the femoral stem components were not available for either group.
Discussion
Patients who develop posttraumatic OA of the hip have limited options. THA has emerged as an excellent option in cases of failed repair of fractures about the hip joint. The results of the present study are consistent with earlier findings of the effectiveness of THA in salvaging posttraumatic hips.2-7 THA for patients with posttraumatic arthritis of the hip after acetabular or proximal femur fracture is longer and more complicated than THA for primary OA, and there is significantly more blood loss. In addition, the rate of early failure appears to be higher.9
In this study, mean amount of blood transfused for patients with previous acetabular fracture was 0.65 unit, much less than the mean of 3.5 units noted by Weber and colleagues.6 In their study, complications associated with THA were increased in patients with posttraumatic OA from acetabular fractures. The authors attributed these complications to scarring from previous surgery, retained hardware, heterotopic bone, and residual osseous deformity and deficiency. Our results support their conclusion. Operating times were longer, as well as blood loss and the need for blood transfusions and other blood products were increased in the patients with posttraumatic OA, as compared with patients with primary OA. Fifteen percent of patients with an acetabular fracture had undergone removal of heterotopic bone at time of surgery—similar to the rate of 18% noted in the Weber study.6
Our results showed that the rate of revision THA was also higher than in patients with primary THA within the general population—reported to be about 4%.9 The higher rate may be the result of the additional surgeries performed on patients with fractures, or hardware retention increasing the infection risk over the years. Our revision rate of 12.5% was similar to the 19% found by Ranawat and colleagues7 in their study.
A majority of the patients in our study had favorable long-term HHS. Mean overall HHS was 83, slightly better than the 79 reported by Srivastav and colleagues.4 We found that patients with intertrochanteric fractures ultimately had worse outcome scores than patients with acetabular or femoral neck fractures. These results are consistent with findings reported by Mehlhoff and colleagues5 in a study comparing patients with femoral neck and intertrochanteric fractures. Mean HHS for the intertrochanteric fracture patients in our study was 77.7, comparable to the mean of 78 reported by Mehlhoff and colleagues.5 Mean HHS for the femoral neck or head fractures in our study was 84.2, similar to the mean of 81 they noted. Patients with a previous acetabular fracture in our study had a mean HHS of 84.3, consistent with the 84 reported by Ranawat and colleagues7 for patients who had initially undergone ORIF for acetabular fracture. Mean HHS in our study (83) was slightly less than the 88.5 reported by Shi and colleagues10 in their study of primary THAs.
Few studies have been conducted exclusively on one type of hip fracture (acetabular) or another (proximal femur), and all except 1 did not perform a comparison. Tabsh and colleagues2 compared similar cohorts but focused solely on patients with previous proximal femur fractures. The present study included a control group and both acetabular and proximal femur fractures, which allowed us to compare patients with and without previous fracture fixation and to consider the 2 different fracture types and see if they affected outcomes.
The strengths of this study include the large control group and the relatively short data-collection period. The shorter period decreased the influence of improvements in implants on patient outcomes. In addition, the control group was our own population, as we did not compare our cohort of patients with previous internal fixation and patients who had primary THAs in other studies, aside from comparisons for revision rates and HHS.
Although the ultimate long-term follow-up rate for patients with previous internal fixation was 50%, our sample size was still larger than that in most reported studies. Another weakness of our study was the large number of surgeons (17), representing an array of techniques, approaches, and surgical experience. All these factors could have influenced patient outcomes and operative data. In addition, data on revision rates and HHS were not available for our control group, so we could not directly compare these outcomes with those of the posttraumatic group. However, we used previously reported data on revision rates and HHS in primary THAs for comparison with the posttraumatic group.9,10
Conclusion
In this study, THA was a viable option for patients with posttraumatic arthritis from a previous acetabular or proximal femur fracture. The outcomes, however, were less reliable than the outcomes of primary THA for degenerative arthritis, and the complication rates were higher. Surgeons should counsel patients about the complexity of the procedure as well as its ultimately favorable outcomes. Surgeons should expect additional technical difficulties in the operating room when treating this patient population.
1. Brauer CA, Coca-Perraillon M, Cutler DM, Rosen AB. Incidence and mortality of hip fractures in the United States. JAMA. 2009;302(14):1573-1579.
2. Tabsh I, Waddell JP, Morton J. Total hip arthroplasty for complications of proximal femoral fractures. J Orthop Trauma. 1997;11(3):166-169.
3. Haidukewych GJ, Berry DJ. Hip arthroplasty for salvage of failed treatment of intertrochanteric hip fractures. J Bone Joint Surg Am. 2003;85(5):899-904.
4. Srivastav S, Mittal V, Agarwal S. Total hip arthroplasty following failed fixation of proximal hip fractures. Indian J Orthop. 2008;42(3):279-286.
5. Mehlhoff T, Landon GC, Tullos HS. Total hip arthroplasty following failed internal fixation of hip fractures. Clin Orthop Relat Res. 1991;(269):32-37.
6. Weber M, Berry DJ, Harmsen WS. Total hip arthroplasty after operative treatment of an acetabular fracture. J Bone Joint Surg Am. 1998;80(9):1295-1305.
7. Ranawat A, Zelken J, Helfet D, Buly R. Total hip arthroplasty for posttraumatic arthritis after acetabular fracture. J Arthroplasty. 2009;24(5):759-767.
8. Harris WH. Traumatic arthritis of the hip after dislocation and acetabular fractures: treatment by mold arthroplasty. An end-result study using a new method of result evaluation. J Bone Joint Surg Am. 1969;51(4):737-755.
9. Mahomed NN, Barrett JA, Katz JN, et al. Rates and outcomes of primary and revision total hip replacement in the United States Medicare population. J Bone Joint Surg Am. 2003;85(1):27-32.
10. Shi HY, Mau LW, Chang JK, Wang JW, Chiu HC. Responsiveness of the Harris Hip Score and the SF-36: five years after total hip arthroplasty. Qual Life Res. 2009;18(8):1053-1060.
Using Life Stories to Connect Veterans and Providers
Anyone involved with the U.S. health care system has heard one or more of the following dispiriting comments. If you are a patient, you have heard or said, “I wish I felt like my provider understood me. He/she just doesn’t have the time.” If you are a provider, you have heard yourself or another provider say, “I wish I had more time to get to know my patients as people. I could do a better job or at least I could remember them without looking at the chart.” This article describes a novel program—My Life, My Story—instituted at the William S. Middleton Memorial Veterans Hospital (WSMMVH) in Madison, Wisconsin. The program uses personal narratives to foster a sense of connection between providers and their veteran patients.
Related: Infusing Gerontologic Practice Into PACT
My Life, My Story had its origins in a small performance improvement project aimed at helping psychiatric residents learn about their new outpatients during rotation. The clinic staff wanted residents to get to know their patients as people in addition to understanding the veterans’ medical conditions. The veterans were first offered the opportunity to come to writers’ workshops and create personal narratives that would be shared later with their clinicians. Unfortunately, only a few veterans were willing to take on this task.
A more patient-friendly approach for collecting and sharing the stories was developed and funded by the VHA Office of Patient-Centered Care and Cultural Transformation (OPCC&CT). Veterans who chose to participate worked with an interviewer/writer to create a personal narrative, which was then shared with their patient aligned care team (PACT). Another component of the interview process was the Personal Health Inventory (PHI), a questionnaire developed by the OPCC&CT that helps veterans articulate their goals and motivations for physical, social, psychological, and spiritual well-being.1 The PHI and personal narrative were paired, to give health care providers (HCPs) a sense of the veteran and their personal health goals.
Background
The health benefits of telling or writing the story of a difficult emotional event have been demonstrated by Pennebaker.2 In varied groups, from prisoners to patients with chronic pain, the writing or talking about experiences improved mood and lowered distress. In addition, studies of medically ill patients showed a decline in physician visits in the 2 to 6 months following the narrative process.3,4 Improved immune response was also shown for patients with hepatitis B, HIV, asthma, and rheumatoid arthritis in response to completing a narrative.5-7
Related: Experiences of Veterans With Diabetes From Shared Medical Appointments
But the writing task is difficult for many people, especially those with advanced illness. Interviewing these patients and writing their stories is a way to give them a voice that otherwise might go unheard.
Dignity therapy with terminally ill patients, a technique developed by Dr. H.M. Chochinov, used an expert to collect the story by bedside interview and to produce a dignity-enhancing life narrative.8-10 Wise and colleagues modified this process for patients with cancer stages III and IV by using telephone interviews, which showed reduced anger, depression, tension, and an increased sense of peace.11 Personal narratives in which patients tell their story and receive it in written form have been shown to reduce psychological distress, increase hope, and help the patient feel valued.10,12
Pennebaker hypothesized that several mechanisms account for these improvements in health measures.2 First, developing a narrative provides a contextual understanding of stressful events. Creating a personal narrative allows a patient to identify and give meaning to life’s struggles. Through this process, coping is hypothesized to occur.13-15 Second, storytelling connects the teller with a wider audience.16
Another study by Pennebaker and colleagues found an improvement in social connectedness in college students in the days following the disclosure of emotional stories.17 The study speculates that nondisclosure fosters isolation, whereas disclosure connects us with others, helping us to reach out to others and improving a sense of feeling understood.
Methods
Project staff were recruited to conduct the interviews and write the stories. Team members with varied backgrounds and experiences were selected: a nurse at the WSMMVH who served as an army interrogator in Afghanistan; a professional counselor with prior experience working for the VA; and a marriage and family therapist with a poetry MA.
Providers were recruited for participation in the project through (1) presentations to nursing staff on the inpatient units where stories were gathered; (2) compilations of de-identified stories from veterans on those units were distributed; (3) presentations on the project at outpatient clinics, where the narratives of veterans who were patients at those clinics were read aloud; and (4) discussions of the program at monthly hospital-wide meetings.
Related: Diabetes Patient-Centered Medical Home Approach
Patients were recruited from 2 inpatient units and 1 long-term rehabilitative care unit. Interviewers introduced themselves to the veterans, described the project, and gave each one a project brochure. Veterans were given the opportunity to be interviewed immediately, schedule a future interview, decide later, or not participate.
The majority of veterans who participated chose to be interviewed immediately. Scheduling interviews around procedures and discharges on busy inpatient units proved difficult. Overall participation rate was high: 60% of veterans who were told about the project eventually told their story.
Interview Process
Veterans signed a consent form before the interview, and the interviews were recorded on a digital audio recorder. They were informed they could choose to talk—or not talk—about any part of their life, the interviewer would write a draft of the story based on the interview and bring it back for their review, and the story would not be added to their patient record until they gave their approval. Spouses/partners were invited to participate if they desired.
Interviewers were encouraged to follow the lead of the veteran. Those who were clinicians were encouraged to “take off their clinician hat” during the interview. Unless guided otherwise by the veteran, the interview was semichronological and included the following subjects: birth and childhood, family, schooling, military service, relationships and/or marriage, children, career and employment, general health, and current hospital stay and presenting problem.
Interviews lasted about an hour, and 182 interviews were conducted. Interviews were frequently interrupted by HCPs who checked vitals, administering medications, rounding with residents, and so forth. If the HCP indicated that the patient could keep talking, the interview continued. If the patient had to leave the room for a procedure or medical appointment, the interviewer paused the recording and scheduled a time to come back and complete the interview.
After the interview, veterans were told that they could expect to see the first written draft of their story within 2 days. Veterans who were to be discharged the day of the interview or the following day were told that the story would be sent to them in the mail to review at home.
Personal Health Inventory
Interviewers introduced the PHI to veterans as an opportunity to identify their wellness goals and share these with the PACT. Veterans with late-stage cancer or in hospice care were given the option to skip the PHI. Of the 103 veterans who completed the PHI, 96 chose to have the interviewer read the questions and record their answers; only 7 chose to complete the PHI on their own.
One hundred eighty-two veterans completed personal narratives, and 103 completed the PHI. Incomplete PHIs occurred for the following reasons: hospice or end of life, 12; declined, 20; could not complete, 21; discharged, 19; lost to follow-up, 7.
Writing
The quality of the written stories was critical to the success of the project. Creativity was encouraged to produce stories that captured and brought to life the voice and spirit of the interview subject. The team identified the following features of a good story: (1) written in the first person; (2) nonjudgmental; (3) captures the voice of the veteran; (4) accurately reflects the content of the interview; and (5) nondiagnostic (not labeling).
A short story format was used to increase the likelihood that busy providers would read the narratives. Writers were encouraged to limit the length of the stories to 1 to 2 printed pages (650-1,300 words). Completed stories ranged from 95 words to 2,345 words with an average length of 1,053 words. Veterans wrote 3 and the interviewers wrote 178 narratives; 1 narrative was written by a team member who was not present during the interview but listened to the audio recording.
Editing Process
The first draft of the story was printed and given to the veteran to make any desired changes. Veterans reviewed and updated their stories in different ways. Some wrote their changes on the printed copy and had the writer return at a later time to pick it up. Others read through the story with the writer present and wrote their changes on the printed copy. Some had the writer read the story aloud and alerted the writer when an item needed changing.
Drafts were mailed to already discharged veterans, including a postage-paid return envelope to allow them to mail their changes to the team. After incorporating the veteran’s changes, the team member brought back a second draft of the story for the veteran to review. This process was repeated until the veteran gave final approval. Veterans could then approve whether to share their story with their PACT via the Computerized Patient Record System (CPRS).
Some participant attrition occurred at this point. Six veterans requested that their stories not go in the CPRS (although 3 of them requested printed copies). One veteran changed his mind after his story was added to the CPRS; the team then immediately removed it. Two veterans died shortly after being released from the hospital and before they could review their stories. The families of both these veterans requested that an audio file of the interview be mailed to them.
Sharing With Family and Providers
Veterans received a printed copy of the approved story and the option to have additional copies for family members. The average number of additional copies requested was 3. Family and friends responded positively to the interview process and stories. Spouses who sat in on the interviews always added something to the interview process, and some were active participants. Eight of the 182 stories were dual narratives that included the words of the veteran and his/her spouse.
Providers were alerted to the personal narratives and PHI via CPRS. The completed story was added to the veteran’s record with the title “My Story.” The story was then electronically cosigned to the veteran’s inpatient and outpatient PACT. Typically, this included 4 people: the inpatient resident and attending physician and the outpatient provider and nurse care manager. If other providers were directly involved in the care of the veteran (mental health, specialists, surgeons), they were also cosigned to the story. If a veteran received primary care outside WSMMVH, their PACT was notified of the presence of the story in CPRS (and given a copy) via encrypted e-mail, in the CPRS “Postings” section.


Program Feedback
The original interviewer/writer team members (2.5 full-time employee equivalent for 6 months) generated 182 stories. The corresponding My Story notes in the CPRS were cosigned to an average of 3.3 providers. The program received both formal (solicited) feedback and informal (unsolicited) feedback from veterans and providers.
After gathering the first 80 stories, the team solicited participant satisfaction data from interviewed veterans, using a 5-point Likert-type scale. Veteran reaction was positive (Figure 1). The team polled VA providers with an online anonymous survey, using the same Likert-type scale to see whether the story and PHI were useful to providers in their clinical practice. The results suggested they were (Figure 2).
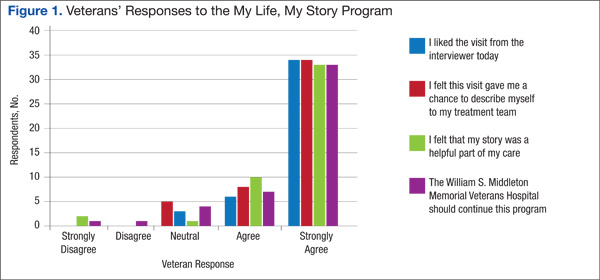
Perhaps the most enlightening and touching feedback were the following unsolicited e-mails and comments:
- I have so appreciated these stories, especially because they immediately become a source of connection with the veterans who come in (some for the first time) to see me about their heart failure. In the midst of a heavy “clinical” topic, knowing their stories has helped us form a stronger patient-provider relationship. It has provided moments of levity and a clear way to tell the patient that I am connecting with them and they are important. —VA employee
- I’m a veteran, and I love reading the real stories of veterans, told in their own words. For us, it’s always wonderful to feel like someone is listening. It’s good to feel like someone wants to hear what you’ve traveled through to get where you are. For those of us who put our lives, our health, our relationships, and our honor on the line for so many others, it’s great when someone will just take the time to listen and understand. It most definitely is very healing. —VA employee
- This is a great way to improve provider understanding and decrease bias and eliminate first impression issues, as people are generally ill and cranky when seeking medical care. —Veteran
- The My Story note was wonderful. I truly feel it has helped me to understand my patients better and to know where they are coming from. This is invaluable to the VA where experiences shape our patients in such a profound way. —VA employee
Recent developments at the WSMMVH suggest that veteran stories are becoming an accepted component of clinical care. The heart/lung transplant team requested that the My Story note be part of the transplant workup process for all new patients. The team also found that new HCPs who were assigned to a veteran regularly cosign that veteran’s My Story note to other providers on the care team. In addition, My Story referrals come from all types of HCPs and staff, both within the hospital and at primary care clinics.
Recent Developments
Two WSMMVH employees suggested using volunteers to gather stories and became the first volunteers: One was a housekeeper who had served in the U.S. Army during the Gulf War, and the other was a registered nurse; both had writing experience.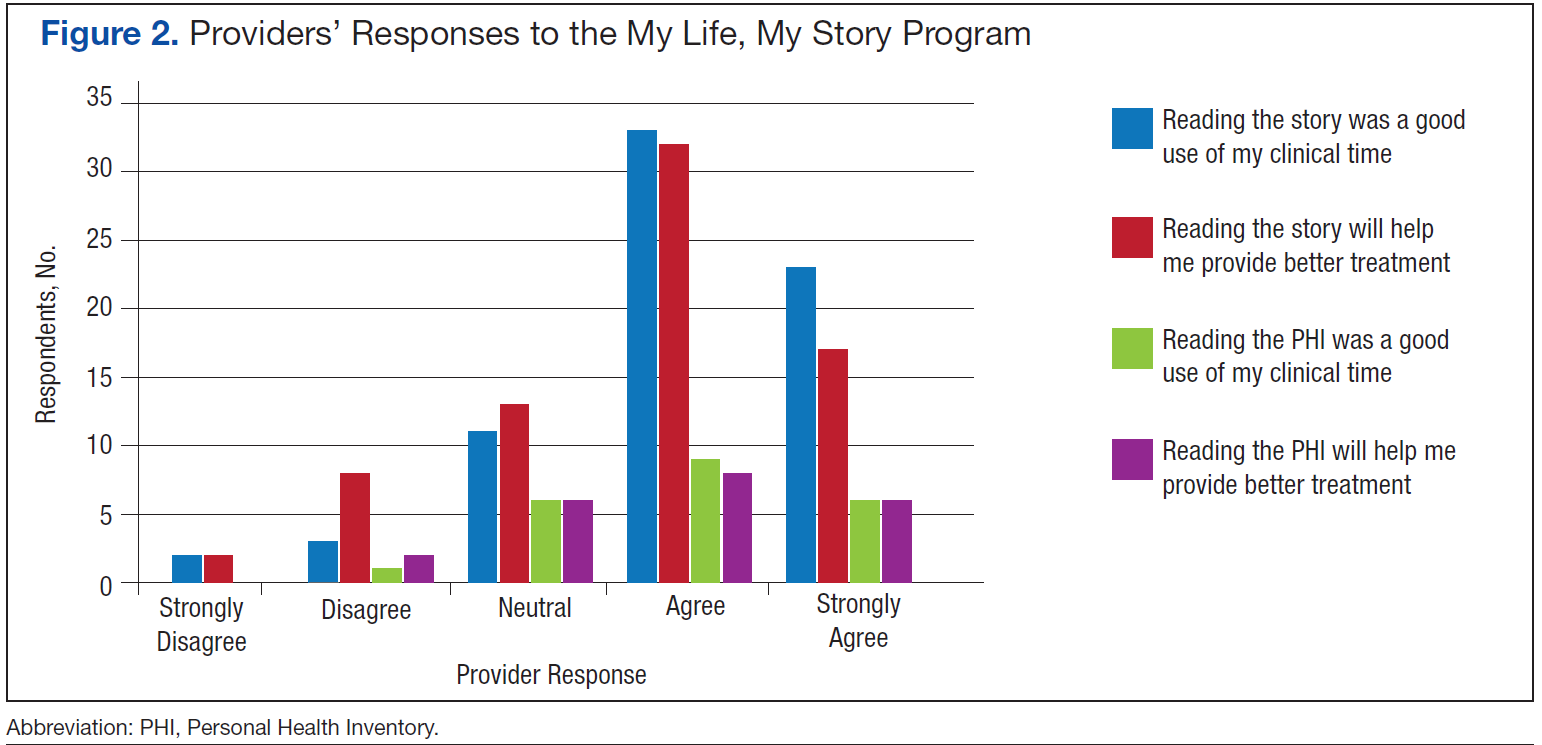
In 2014, staff trained 12 volunteers from the local community who have been trained to interview and write stories. The volunteers have varied professional backgrounds. All have a background and interest in writing or experience working in a health care setting; 2 are veterans. These volunteers are adding to the team at no additional cost. In development is a standardized training program and a method to look at story collection and writing fidelity, which will allow for further expansion of this program.
My Life, My Story continues to expand significantly. A total of 610 veterans have been interviewed, and 348 of these interviews were conducted by volunteers. The project now has 18 active volunteers with 4 more on a waiting list. A pilot has been launched at a WSMMVH outpatient clinic, which interviews VA primary care providers about their life stories and shares them with their veteran patients. There is now collaboration with the University of Wisconsin School of Medicine and Public Health in Madison to offer a 2-week My Story elective to fourth-year medical students in spring 2016. In March 2015, My Life, My Story expanded to 6 pilot facilities across the VA: Asheville, North Carolina; Bronx, New York; Iowa City, Iowa; Reno, Nevada; Topeka, Kansas; and White River Junction, Vermont.
Future Projects
- The team is currently analyzing the themes appearing in veteran stories, using grounded theory methodology
- The process for outpatients is being revised, using phone calls and telehealth modalities to collect stories
- The team members are examining relationships between themes in stories and health/wellness goals identified on the PHI
- Eventually, the team will study how this process might improve the veteran/provider relationship on measures of satisfaction with care, quality of care, and health outcomes. The authors will also assess the effects of this process on provider satisfaction and burnout
Conclusion
Veteran stories, when skillfully elicited and carefully crafted, give providers an opportunity to know their patients better, without impinging on their time. For veterans, the experience of being interviewed and the knowledge that their story will be shared with providers is an important recognition that they matter and have a voice in their health care. In a world of high-technology health care, where time is the only thing in short supply, My Life, My Story leverages the old-world technology of storytelling to bring providers and patients closer together.
Acknowledgments
The authors wish to acknowledge Amanda Hall and Jessica Jones who were interviewer/writers on the initial project. Both contributed immeasurably to the design and success of the project. The authors would also like to acknowledge Matt Spira who was our first volunteer interviewer and gave us the inspiration to recruit more volunteers. Volunteer Mary Johnston interviewed and wrote the sample veteran story in this article. We would also like to thank the nursing staff on 4A, 4B, and the community living center for their patience when we were in the way and for their support of the project. Last and most important, we would like to thank the veterans who were interviewed for this project. We have all learned more than we could have imagined from the stories that you shared with us. Your sacrifice, courage, and dedication both in the military and your personal lives are truly an inspiration. Thank you.
Author disclosures
The authors report no actual or potential conflicts of interest with regard to this article.
Disclaimer
The opinions expressed herein are those of the authors and do not necessarily reflect those of Federal Practitioner, Frontline Medical Communications Inc., the U.S. Government, or any of its agencies. This article may discuss unlabeled or investigational use of certain drugs. Please review the complete prescribing information for specific drugs or drug combinations—including indications, contraindications, warnings, and adverse effects—before administering pharmacologic therapy to patients.
1. Veterans Health Administration, Office of Patient Centered Care and Cultural Transformation. My Story Personal Health Inventory, Revision 20. U.S. Department of Veterans Affairs Website. http://www .va.gov/patientcenteredcare/docs/va-opcc-personal -health-inventory-final-508.pdf. Revised October 7, 2013. Accessed May 11, 2015.
2. Pennebaker JW. Telling stories: the health benefits of narrative. Lit Med. 2000;19(1):3-18.
3. Greenberg MA, Stone AA. Writing about disclosed versus undisclosed traumas: immediate and long term effects on mood and health. J Pers Soc Psychol. 1992;63:75-84.
4. Pennebaker JW, Beall SK. Confronting a traumatic event: toward an understanding of inhibition and disease. J Abnorm Psychol. 1986;95(3):274-281.
5. Petrie KJ, Booth RJ, Pennebaker JW, Davidson KP, Thomas MG. Disclosure of trauma and immune response to hepatitis B vaccination program. J Consult Clin Psychol. 1995;63(5):787-792.
6. Petrie KJ, Fontanilla I, Thomas MG, Booth RJ, Pennebaker JW. Effect of written emotional expression on immune function in patients with human immunodeficiency virus infection: a randomized trial. Psychosom Med. 2004;66(2):272-275.
7. Smyth JM, Stone AA, Hurewitz A, Kaell A. Effects of writing about stressful experiences on symptom reduction in patients with asthma or rheumatoid arthritis. JAMA. 1999;281(14):1304-1309.
8. Chochinov HM. Dignity-conserving care—a new model for palliative care: helping the patient feel valued. JAMA. 2002;287(17):2253-2260.
9. Chochinov HM, Hack T, Hassard T, Kristjanson LJ, McClement S, Harlos M. Understanding the will to live in patients near death. Psychosom. 2005;46(1):7-10.
10. Chochinov HM, Kristjanson LJ, Breitbart W, et al. Effect of dignity therapy on distress and end-of-life experience in terminally ill patients: a randomised controlled trial. Lancet Oncol. 2011;12(8):753-762.
11. Wise M, Marchand L, Roberts LJ, Chih M. Existential suffering in advanced cancer: the buffering effects of narrative: a randomized control trial. Poster presented at: University of Washington School of Medicine 6th Annual Department Fair; April 8, 2015; Seattle, Washington.
12. Hall S, Goddard C, Opio D, Speck PW, Martin P, Higginson IJ. A novel approach to enhancing hope in patients with advanced cancer: a randomised phase II trial of dignity therapy. BMJ Support Palliat Care. 2011;1(3):315-321.
13. Heiney SP. The healing power of story. Oncol Nurs Forum. 1995;22(6):899-904.
14. Hyden L-C. Illness and narrative. Soc Health Illness. 1997;19(1):48-69.
15. Carlick A, Biley FC. Thoughts on the therapeutic use of narrative in the promotion of coping in cancer care. Eur J Cancer Care (Engl). 2004;13(4):308-317.
16. Niederhoffer KG, Pennebaker JW. Sharing one’s story: on the benefits of writing or talking about emotional experience. In: Snyder CR, Lopez SJ, eds. Handbook of Positive Psychology. New York, NY: Oxford University Press; 2001:573-583.
17. Pennebaker JW, Kiecolt-Glaser JK, Glaser R. Disclosure of traumas and immune function: health implications for psychotherapy. J Consult Clin Psychol. 1988:56(2):239-245.
Anyone involved with the U.S. health care system has heard one or more of the following dispiriting comments. If you are a patient, you have heard or said, “I wish I felt like my provider understood me. He/she just doesn’t have the time.” If you are a provider, you have heard yourself or another provider say, “I wish I had more time to get to know my patients as people. I could do a better job or at least I could remember them without looking at the chart.” This article describes a novel program—My Life, My Story—instituted at the William S. Middleton Memorial Veterans Hospital (WSMMVH) in Madison, Wisconsin. The program uses personal narratives to foster a sense of connection between providers and their veteran patients.
Related: Infusing Gerontologic Practice Into PACT
My Life, My Story had its origins in a small performance improvement project aimed at helping psychiatric residents learn about their new outpatients during rotation. The clinic staff wanted residents to get to know their patients as people in addition to understanding the veterans’ medical conditions. The veterans were first offered the opportunity to come to writers’ workshops and create personal narratives that would be shared later with their clinicians. Unfortunately, only a few veterans were willing to take on this task.
A more patient-friendly approach for collecting and sharing the stories was developed and funded by the VHA Office of Patient-Centered Care and Cultural Transformation (OPCC&CT). Veterans who chose to participate worked with an interviewer/writer to create a personal narrative, which was then shared with their patient aligned care team (PACT). Another component of the interview process was the Personal Health Inventory (PHI), a questionnaire developed by the OPCC&CT that helps veterans articulate their goals and motivations for physical, social, psychological, and spiritual well-being.1 The PHI and personal narrative were paired, to give health care providers (HCPs) a sense of the veteran and their personal health goals.
Background
The health benefits of telling or writing the story of a difficult emotional event have been demonstrated by Pennebaker.2 In varied groups, from prisoners to patients with chronic pain, the writing or talking about experiences improved mood and lowered distress. In addition, studies of medically ill patients showed a decline in physician visits in the 2 to 6 months following the narrative process.3,4 Improved immune response was also shown for patients with hepatitis B, HIV, asthma, and rheumatoid arthritis in response to completing a narrative.5-7
Related: Experiences of Veterans With Diabetes From Shared Medical Appointments
But the writing task is difficult for many people, especially those with advanced illness. Interviewing these patients and writing their stories is a way to give them a voice that otherwise might go unheard.
Dignity therapy with terminally ill patients, a technique developed by Dr. H.M. Chochinov, used an expert to collect the story by bedside interview and to produce a dignity-enhancing life narrative.8-10 Wise and colleagues modified this process for patients with cancer stages III and IV by using telephone interviews, which showed reduced anger, depression, tension, and an increased sense of peace.11 Personal narratives in which patients tell their story and receive it in written form have been shown to reduce psychological distress, increase hope, and help the patient feel valued.10,12
Pennebaker hypothesized that several mechanisms account for these improvements in health measures.2 First, developing a narrative provides a contextual understanding of stressful events. Creating a personal narrative allows a patient to identify and give meaning to life’s struggles. Through this process, coping is hypothesized to occur.13-15 Second, storytelling connects the teller with a wider audience.16
Another study by Pennebaker and colleagues found an improvement in social connectedness in college students in the days following the disclosure of emotional stories.17 The study speculates that nondisclosure fosters isolation, whereas disclosure connects us with others, helping us to reach out to others and improving a sense of feeling understood.
Methods
Project staff were recruited to conduct the interviews and write the stories. Team members with varied backgrounds and experiences were selected: a nurse at the WSMMVH who served as an army interrogator in Afghanistan; a professional counselor with prior experience working for the VA; and a marriage and family therapist with a poetry MA.
Providers were recruited for participation in the project through (1) presentations to nursing staff on the inpatient units where stories were gathered; (2) compilations of de-identified stories from veterans on those units were distributed; (3) presentations on the project at outpatient clinics, where the narratives of veterans who were patients at those clinics were read aloud; and (4) discussions of the program at monthly hospital-wide meetings.
Related: Diabetes Patient-Centered Medical Home Approach
Patients were recruited from 2 inpatient units and 1 long-term rehabilitative care unit. Interviewers introduced themselves to the veterans, described the project, and gave each one a project brochure. Veterans were given the opportunity to be interviewed immediately, schedule a future interview, decide later, or not participate.
The majority of veterans who participated chose to be interviewed immediately. Scheduling interviews around procedures and discharges on busy inpatient units proved difficult. Overall participation rate was high: 60% of veterans who were told about the project eventually told their story.
Interview Process
Veterans signed a consent form before the interview, and the interviews were recorded on a digital audio recorder. They were informed they could choose to talk—or not talk—about any part of their life, the interviewer would write a draft of the story based on the interview and bring it back for their review, and the story would not be added to their patient record until they gave their approval. Spouses/partners were invited to participate if they desired.
Interviewers were encouraged to follow the lead of the veteran. Those who were clinicians were encouraged to “take off their clinician hat” during the interview. Unless guided otherwise by the veteran, the interview was semichronological and included the following subjects: birth and childhood, family, schooling, military service, relationships and/or marriage, children, career and employment, general health, and current hospital stay and presenting problem.
Interviews lasted about an hour, and 182 interviews were conducted. Interviews were frequently interrupted by HCPs who checked vitals, administering medications, rounding with residents, and so forth. If the HCP indicated that the patient could keep talking, the interview continued. If the patient had to leave the room for a procedure or medical appointment, the interviewer paused the recording and scheduled a time to come back and complete the interview.
After the interview, veterans were told that they could expect to see the first written draft of their story within 2 days. Veterans who were to be discharged the day of the interview or the following day were told that the story would be sent to them in the mail to review at home.
Personal Health Inventory
Interviewers introduced the PHI to veterans as an opportunity to identify their wellness goals and share these with the PACT. Veterans with late-stage cancer or in hospice care were given the option to skip the PHI. Of the 103 veterans who completed the PHI, 96 chose to have the interviewer read the questions and record their answers; only 7 chose to complete the PHI on their own.
One hundred eighty-two veterans completed personal narratives, and 103 completed the PHI. Incomplete PHIs occurred for the following reasons: hospice or end of life, 12; declined, 20; could not complete, 21; discharged, 19; lost to follow-up, 7.
Writing
The quality of the written stories was critical to the success of the project. Creativity was encouraged to produce stories that captured and brought to life the voice and spirit of the interview subject. The team identified the following features of a good story: (1) written in the first person; (2) nonjudgmental; (3) captures the voice of the veteran; (4) accurately reflects the content of the interview; and (5) nondiagnostic (not labeling).
A short story format was used to increase the likelihood that busy providers would read the narratives. Writers were encouraged to limit the length of the stories to 1 to 2 printed pages (650-1,300 words). Completed stories ranged from 95 words to 2,345 words with an average length of 1,053 words. Veterans wrote 3 and the interviewers wrote 178 narratives; 1 narrative was written by a team member who was not present during the interview but listened to the audio recording.
Editing Process
The first draft of the story was printed and given to the veteran to make any desired changes. Veterans reviewed and updated their stories in different ways. Some wrote their changes on the printed copy and had the writer return at a later time to pick it up. Others read through the story with the writer present and wrote their changes on the printed copy. Some had the writer read the story aloud and alerted the writer when an item needed changing.
Drafts were mailed to already discharged veterans, including a postage-paid return envelope to allow them to mail their changes to the team. After incorporating the veteran’s changes, the team member brought back a second draft of the story for the veteran to review. This process was repeated until the veteran gave final approval. Veterans could then approve whether to share their story with their PACT via the Computerized Patient Record System (CPRS).
Some participant attrition occurred at this point. Six veterans requested that their stories not go in the CPRS (although 3 of them requested printed copies). One veteran changed his mind after his story was added to the CPRS; the team then immediately removed it. Two veterans died shortly after being released from the hospital and before they could review their stories. The families of both these veterans requested that an audio file of the interview be mailed to them.
Sharing With Family and Providers
Veterans received a printed copy of the approved story and the option to have additional copies for family members. The average number of additional copies requested was 3. Family and friends responded positively to the interview process and stories. Spouses who sat in on the interviews always added something to the interview process, and some were active participants. Eight of the 182 stories were dual narratives that included the words of the veteran and his/her spouse.
Providers were alerted to the personal narratives and PHI via CPRS. The completed story was added to the veteran’s record with the title “My Story.” The story was then electronically cosigned to the veteran’s inpatient and outpatient PACT. Typically, this included 4 people: the inpatient resident and attending physician and the outpatient provider and nurse care manager. If other providers were directly involved in the care of the veteran (mental health, specialists, surgeons), they were also cosigned to the story. If a veteran received primary care outside WSMMVH, their PACT was notified of the presence of the story in CPRS (and given a copy) via encrypted e-mail, in the CPRS “Postings” section.
Program Feedback
The original interviewer/writer team members (2.5 full-time employee equivalent for 6 months) generated 182 stories. The corresponding My Story notes in the CPRS were cosigned to an average of 3.3 providers. The program received both formal (solicited) feedback and informal (unsolicited) feedback from veterans and providers.
After gathering the first 80 stories, the team solicited participant satisfaction data from interviewed veterans, using a 5-point Likert-type scale. Veteran reaction was positive (Figure 1). The team polled VA providers with an online anonymous survey, using the same Likert-type scale to see whether the story and PHI were useful to providers in their clinical practice. The results suggested they were (Figure 2).
Perhaps the most enlightening and touching feedback were the following unsolicited e-mails and comments:
- I have so appreciated these stories, especially because they immediately become a source of connection with the veterans who come in (some for the first time) to see me about their heart failure. In the midst of a heavy “clinical” topic, knowing their stories has helped us form a stronger patient-provider relationship. It has provided moments of levity and a clear way to tell the patient that I am connecting with them and they are important. —VA employee
- I’m a veteran, and I love reading the real stories of veterans, told in their own words. For us, it’s always wonderful to feel like someone is listening. It’s good to feel like someone wants to hear what you’ve traveled through to get where you are. For those of us who put our lives, our health, our relationships, and our honor on the line for so many others, it’s great when someone will just take the time to listen and understand. It most definitely is very healing. —VA employee
- This is a great way to improve provider understanding and decrease bias and eliminate first impression issues, as people are generally ill and cranky when seeking medical care. —Veteran
- The My Story note was wonderful. I truly feel it has helped me to understand my patients better and to know where they are coming from. This is invaluable to the VA where experiences shape our patients in such a profound way. —VA employee
Recent developments at the WSMMVH suggest that veteran stories are becoming an accepted component of clinical care. The heart/lung transplant team requested that the My Story note be part of the transplant workup process for all new patients. The team also found that new HCPs who were assigned to a veteran regularly cosign that veteran’s My Story note to other providers on the care team. In addition, My Story referrals come from all types of HCPs and staff, both within the hospital and at primary care clinics.
Recent Developments
Two WSMMVH employees suggested using volunteers to gather stories and became the first volunteers: One was a housekeeper who had served in the U.S. Army during the Gulf War, and the other was a registered nurse; both had writing experience.
In 2014, staff trained 12 volunteers from the local community who have been trained to interview and write stories. The volunteers have varied professional backgrounds. All have a background and interest in writing or experience working in a health care setting; 2 are veterans. These volunteers are adding to the team at no additional cost. In development is a standardized training program and a method to look at story collection and writing fidelity, which will allow for further expansion of this program.
My Life, My Story continues to expand significantly. A total of 610 veterans have been interviewed, and 348 of these interviews were conducted by volunteers. The project now has 18 active volunteers with 4 more on a waiting list. A pilot has been launched at a WSMMVH outpatient clinic, which interviews VA primary care providers about their life stories and shares them with their veteran patients. There is now collaboration with the University of Wisconsin School of Medicine and Public Health in Madison to offer a 2-week My Story elective to fourth-year medical students in spring 2016. In March 2015, My Life, My Story expanded to 6 pilot facilities across the VA: Asheville, North Carolina; Bronx, New York; Iowa City, Iowa; Reno, Nevada; Topeka, Kansas; and White River Junction, Vermont.
Future Projects
- The team is currently analyzing the themes appearing in veteran stories, using grounded theory methodology
- The process for outpatients is being revised, using phone calls and telehealth modalities to collect stories
- The team members are examining relationships between themes in stories and health/wellness goals identified on the PHI
- Eventually, the team will study how this process might improve the veteran/provider relationship on measures of satisfaction with care, quality of care, and health outcomes. The authors will also assess the effects of this process on provider satisfaction and burnout
Conclusion
Veteran stories, when skillfully elicited and carefully crafted, give providers an opportunity to know their patients better, without impinging on their time. For veterans, the experience of being interviewed and the knowledge that their story will be shared with providers is an important recognition that they matter and have a voice in their health care. In a world of high-technology health care, where time is the only thing in short supply, My Life, My Story leverages the old-world technology of storytelling to bring providers and patients closer together.
Acknowledgments
The authors wish to acknowledge Amanda Hall and Jessica Jones who were interviewer/writers on the initial project. Both contributed immeasurably to the design and success of the project. The authors would also like to acknowledge Matt Spira who was our first volunteer interviewer and gave us the inspiration to recruit more volunteers. Volunteer Mary Johnston interviewed and wrote the sample veteran story in this article. We would also like to thank the nursing staff on 4A, 4B, and the community living center for their patience when we were in the way and for their support of the project. Last and most important, we would like to thank the veterans who were interviewed for this project. We have all learned more than we could have imagined from the stories that you shared with us. Your sacrifice, courage, and dedication both in the military and your personal lives are truly an inspiration. Thank you.
Author disclosures
The authors report no actual or potential conflicts of interest with regard to this article.
Disclaimer
The opinions expressed herein are those of the authors and do not necessarily reflect those of Federal Practitioner, Frontline Medical Communications Inc., the U.S. Government, or any of its agencies. This article may discuss unlabeled or investigational use of certain drugs. Please review the complete prescribing information for specific drugs or drug combinations—including indications, contraindications, warnings, and adverse effects—before administering pharmacologic therapy to patients.
1. Veterans Health Administration, Office of Patient Centered Care and Cultural Transformation. My Story Personal Health Inventory, Revision 20. U.S. Department of Veterans Affairs Website. http://www .va.gov/patientcenteredcare/docs/va-opcc-personal -health-inventory-final-508.pdf. Revised October 7, 2013. Accessed May 11, 2015.
2. Pennebaker JW. Telling stories: the health benefits of narrative. Lit Med. 2000;19(1):3-18.
3. Greenberg MA, Stone AA. Writing about disclosed versus undisclosed traumas: immediate and long term effects on mood and health. J Pers Soc Psychol. 1992;63:75-84.
4. Pennebaker JW, Beall SK. Confronting a traumatic event: toward an understanding of inhibition and disease. J Abnorm Psychol. 1986;95(3):274-281.
5. Petrie KJ, Booth RJ, Pennebaker JW, Davidson KP, Thomas MG. Disclosure of trauma and immune response to hepatitis B vaccination program. J Consult Clin Psychol. 1995;63(5):787-792.
6. Petrie KJ, Fontanilla I, Thomas MG, Booth RJ, Pennebaker JW. Effect of written emotional expression on immune function in patients with human immunodeficiency virus infection: a randomized trial. Psychosom Med. 2004;66(2):272-275.
7. Smyth JM, Stone AA, Hurewitz A, Kaell A. Effects of writing about stressful experiences on symptom reduction in patients with asthma or rheumatoid arthritis. JAMA. 1999;281(14):1304-1309.
8. Chochinov HM. Dignity-conserving care—a new model for palliative care: helping the patient feel valued. JAMA. 2002;287(17):2253-2260.
9. Chochinov HM, Hack T, Hassard T, Kristjanson LJ, McClement S, Harlos M. Understanding the will to live in patients near death. Psychosom. 2005;46(1):7-10.
10. Chochinov HM, Kristjanson LJ, Breitbart W, et al. Effect of dignity therapy on distress and end-of-life experience in terminally ill patients: a randomised controlled trial. Lancet Oncol. 2011;12(8):753-762.
11. Wise M, Marchand L, Roberts LJ, Chih M. Existential suffering in advanced cancer: the buffering effects of narrative: a randomized control trial. Poster presented at: University of Washington School of Medicine 6th Annual Department Fair; April 8, 2015; Seattle, Washington.
12. Hall S, Goddard C, Opio D, Speck PW, Martin P, Higginson IJ. A novel approach to enhancing hope in patients with advanced cancer: a randomised phase II trial of dignity therapy. BMJ Support Palliat Care. 2011;1(3):315-321.
13. Heiney SP. The healing power of story. Oncol Nurs Forum. 1995;22(6):899-904.
14. Hyden L-C. Illness and narrative. Soc Health Illness. 1997;19(1):48-69.
15. Carlick A, Biley FC. Thoughts on the therapeutic use of narrative in the promotion of coping in cancer care. Eur J Cancer Care (Engl). 2004;13(4):308-317.
16. Niederhoffer KG, Pennebaker JW. Sharing one’s story: on the benefits of writing or talking about emotional experience. In: Snyder CR, Lopez SJ, eds. Handbook of Positive Psychology. New York, NY: Oxford University Press; 2001:573-583.
17. Pennebaker JW, Kiecolt-Glaser JK, Glaser R. Disclosure of traumas and immune function: health implications for psychotherapy. J Consult Clin Psychol. 1988:56(2):239-245.

Unusual Congenital Pulmonary Anomaly in an Adult Patient With Dyspnea
Anatomic variations may result in abnormal return from the pulmonary veins to the right side of the heart. This group of congenital anomalies, also known as partial anomalous pulmonary venous return (PAPVR), may connect oxygenated blood from the pulmonary vein to a systemic vein before reaching the right atrium. The most common PAPVR is derived from the left upper pulmonary vein, which then connects to the left innominate vein and drains into the superior vena cava (SVC).
Scimitar syndrome is a rare PAPVR variant in which part of or the entire right lung is drained by the pulmonary vein into the inferior vena cava (IVC), giving the curvilinear dimension the appearance of a Middle Eastern sword (scimitar). The syndrome is frequently associated with other abnormalities, such as right lung hypoplasia and abnormal right lung lobation, dextroposition of the heart, right pulmonary artery hypoplasia, systemic arterial blood supply to the right lower lung from the infradiaphragmatic aorta, atrial septal defects of the secundum type, right-sided diaphragmatic hernia, and horseshoe lung.1,2 The syndrome was first described in 1836 by Cooper during an autopsy of an infant, and Dotter diagnosed the first symptomatic patient in 1949.3,4
Case Report
A 62-year-old man, former smoker (40 pack-year), with a past medical history of arterial hypertension and asthma visited the clinic, reporting exertional dyspnea. He also reported oppressive, retrosternally located exertional chest pain, 6/10 in intensity, of 3 minutes’ duration that radiated to the right chest and ameliorated with rest. Symptoms had occurred every other day for the past year. His physical exam was remarkable for central obesity. Lung auscultation was essentially clear. There was no jugular vein distention. The patient’s heart showed a regular rate and rhythm without evidence of murmurs or gallops. There was no evidence of leg edema or cyanosis. The patient’s resting oxygen saturation of 98% remained unchanged after exercise.
Related: Venous Thromboembolism Prophylaxis in Acutely Ill Veterans With Respiratory Disease
An electrocardiogram showed normal sinus rhythm with no ischemic changes. A pulmonary function test showed a forced expiratory volume (FEV1) of 1.44 L (61% of predicted), forced vital capacity (FVC) of 1.99 L (68% of predicted), and slow vital capacity (SVC) of 2.09 L (60% of predicted), with an FEV1/SVC ratio of 68% of predicted. These results suggested moderate-to-severe obstructive ventilatory impairment.
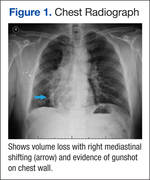
There was no response to bronchodilator therapy. Lung volumes were measured by plethysmography. The residual volume (RV), total lung capacity (TLC), and RV/TLC ratio were 2.57 L (147% of predicted), 4.66 L (88% of predicted), and 55%, respectively, suggesting severe air trapping. Diffusion lung capacity (DLCO) testing revealed 16.95 mL/min/mm Hg (73% of predicted) when corrected by hemoglobin and DLCO/alveolar volume of 4.97 mL/min/mm Hg/L (114% of predicted). This result was consistent with a mild reduction of gas transfer, which normalized when corrected by alveolar volume.
A posteroanterior chest radiograph image was remarkable for mediastinal shifting toward the right side, volume loss of the right lung, and evidence of a previous gunshot on the right chest wall (Figure 1). Previous chest imaging done in October 2009 showed an opacification of the right lower lung with indistinctness of the right cardiac border and partial obliteration of the right hemidiaphragm. The patient was treated with inhaled steroids and long- acting bronchodilators with partial improvement in dyspnea symptoms.
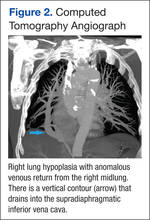
Myocardial perfusion imaging revealed scintigraphic evidence of heart rate-induced ischemia on the inferior and apical wall segments of the left ventricular myocardium. A transthoracic echocardiogram showed a very poor echocardiographic window. Left ventricular function seemed preserved. Transesophageal echocardiography was scheduled, but the patient missed the appointment.
Cardiac catheterization was only remarkable for 40% to 50% obstruction of the mid-left anterior descending artery, which did not explain the patient’s dyspnea or chest pain. Right side pressures were described as follows: right atrial mean, 10 mm Hg; right ventricle, 36/8 mm Hg; pulmonary artery, 33/16 mm Hg; pulmonary artery mean, 23 mm Hg; pulmonary capillary wedge pressure, 12 mm Hg; and a mean arterial pressure of 100 mm Hg. He had a left ventricle ejection fraction of 60%.
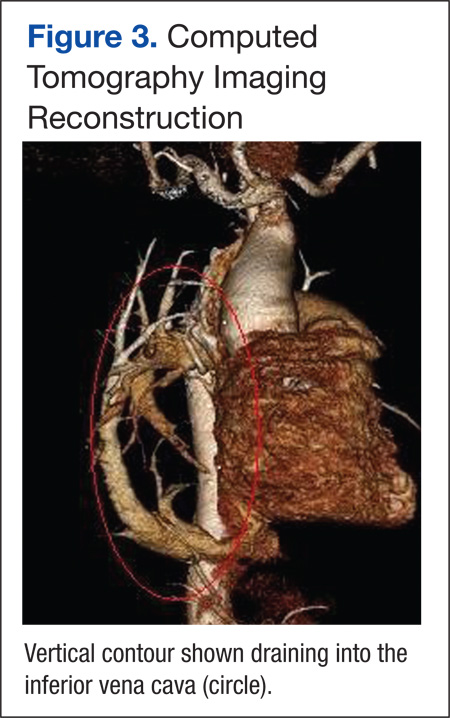
Because images suggested dextroposition of the heart and right lung hypoplasia, a chest computed tomography (CT) and angiography were done (Figure 2). The images showed hypoplasia of the right lung field with an anomalous venous return from the right midlung, having a vertical contour that drained into the supradiaphragmatic IVC. In addition, CT reconstruction demarcated the last mentioned contour draining into the IVC, consistent with scimitar syndrome (Figure 3). The patient was treated conservatively due to age, optimizing therapy for obstructive lung and cardiovascular disease.
Discussion
Partial anomalous pulmonary venous return is a relatively uncommon congenital anomaly, accounting for 0.5% to 1% of congenital heart disease.4,5 The characteristic abnormality is PAPVR of part of or the entire right lung to the IVC, either below the diaphragm or at the junction of the IVC and the right atrium. The rare combination (3%-5%) of an association of PAPVR, right lung hypoplasia, and dextroposition of the heart is designated scimitar syndrome. The scimitar vein sign is a characteristic chest roentgenographic finding of a crescentlike shadow in the right lower lung field where the curvilinear dimension gives the appearance of a scimitar sword.
Related: Another Reason Not to Smoke: Acute Eosinophilic Pneunomia
Normally, the pulmonary veins from the right and left lung carry oxygenated blood into the left atrium, then to the left ventricle, and then flowing out systemically. The SCV and IVC return the deoxygenated blood from the body system to the right atrium. From the right atrium, blood flows into the right ventricle, and then through pulmonary arteries, reaching the lungs where oxygenation occurs. In this syndrome, a left-to-right shunt is established when the anomalous pulmonary vein drains blood from the right lung into the IVC, resulting in an increased risk of developing right ventricular failure due to long-standing right ventricular volume overload.
Presentation and Diagnosis
There are two clinical presentations of scimitar syndrome: infantile and pediatric/adult. Infantile scimitar syndrome has a clinical presentation of tachypnea and heart failure within the first 2 months of life, with a high mortality rate. The pediatric/adult type is milder and frequently asymptomatic, and the diagnosis is usually incidental after performing an imaging study. Scimitar vein sign appears in 70% of the noninfantile cases, and lung hypoplasia is less severe. A spirometry may reveal mild deficits in vital capacity and FEV1. An electrocardiogram may show right ventricular hypertrophy.
Cardiac catheterization is required to confirm the diagnosis. Additionally, this procedure can help in the assessment of the pulmonary venous drainage course, pulmonary artery anatomy and pressure, scimitar vein stenosis, and presence of left-to-right shunt or other cardiac anomalies, if present. Other modalities have been suggested as alternative methods for diagnosing this condition, including the use of coronary CT and 3D echocardiography.6,7 However, these diagnostic tests are not available in all facilities and are very costly.
Treatment and Prognosis
Vida and colleagues conducted a multicentric study for the European Congenital Heart Surgeons Association on scimitar syndrome.8 Data were collected from 1997 to 2007 for 68 patients who underwent a surgical procedure. A total of 11 patients were categorized as late onset, and when compared with the infantile category, they had fewer postoperatory complications, hospital mortality, late mortality, and were less likely to develop pulmonary hypertension. Both pulmonary stenosis and pulmonary hypertension were linked with poor outcomes. It seems the younger the patient (infantile), the higher the possibility of complications and mortality. Adults who are incidentally diagnosed have a better outcome if asymptomatic. Findings such as hypoplastic lungs may predispose these patients to developing recurrent pneumonias.8,9
Related: Prevention of Venous Thromboembolism After Total Joint Replacement: A Rivaroxaban Update
Dusenbery and colleagues documented in a cohort study the relationship between poor survival and other variables. Significant variables included age at presentation, nonatrial septal defect (non-ASD) congenital heart disease, left pulmonary vein stenosis, and pulmonary artery pressure (PAP) at the time of presentation. Predictors of survival for nonsurgical patients were directly related to PAP at presentation and absence of non-ASD congenital heart disease. If the patient’s PAP is less than half of the systemic pressure, the survival is near 100% at 5 years from initial presentation.9
Surgery is the definitive treatment for PAPVR. However, asymptomatic patients with PAPVR with small left-to-right shunt do not require intervention, as the defect has no significant clinical impact, and patients have a normal life expectancy without correction.10
Surgical treatment may be considered in the following circumstances:
- A hemodynamically significant left-to-right shunt (a ratio of pulmonary to systemic blood flow is greater than 2:1), often manifested as right ventricular volume overload
- Recurrent pulmonary infections
- Compression or obstruction of surrounding structures caused by the anomalous vein
- During surgical repair of other major cardiac lesions, depending on the surgical risk of a repair and level and degree of shunting
Surgical options include redirecting the venous drainage to the left atria, ligation/embolization of vascular supply to the sequestered lobe, and pneumonectomy. The procedure complications may include thrombosis of the scimitar vein, lung infarct, hemoptysis, and pulmonary hypertension, which may lead to resection of the lung.11,12 Surgical procedures are recommended in cases where the patient has had recurrent lung infections or a significant degree of shunting. Studies have compared both approaches, demonstrating a better outcome after 10 years for those patients who were medically treated considering the aforementioned surgical indications.
Conclusion
Scimitar syndrome is a rare but welldescribed constellation of cardiopulmonary anomalies, accounting for 0.5% to 1% of congenital heart disease. It is a variant of PAPVR, in which part of or even the entire right lung is drained by right pulmonary veins that connect anomalously to the IVC. Although a diagnosis can be made by chest radiograph, further imaging is needed to corroborate the diagnosis and demonstrate other associated abnormalities.
Additional tests have been described in the literature, but these procedures are not available in all facilities and may incur a higher cost. Therefore, CT angiographic reconstruction is an alternative, noninvasive procedure. Surgery is the definitive treatment; however, asymptomatic patients with PAPVR and small left-to-right shunt do not require intervention.
Author disclosures
The authors report no actual or potential conflicts of interest with regard to this article.
Disclaimer
The opinions expressed herein are those of the authors and do not necessarily reflect those of Federal Practitioner, Frontline Medical Communications Inc., the U.S. Government, or any of its agencies. This article may discuss unlabeled or investigational use of certain drugs. Please review complete prescribing information for specific drugs or drug combinations—including indications, contraindications, warnings, and adverse effects—before administering pharmacologic therapy to patients.
1. Cooper G. Case of malformation of the thoracic viscera: consisting of imperfect development of the right lung, and transposition of the heart. London Med Gaz. 1836;18:600-602.
2. Spentzouris G, Zandian A, Cesmebasi A, et al. The clinical anatomy of the inferior vena cava: a review of common congenital anomalies and the considerations for clinicians. Clin Anat. 2014;27(8):1234-1243.
3. Neill CA, Ferencz C, Sabiston DC, Sheldon H. The familial occurrence of hypoplastic right lung with systemic arterial supply and venous drainage “scimitar syndrome.” Bull Johns Hopkins Hosp. 1960;107:1-21.
4. Ward KE, Mullins CE. Anomalous pulmonary venous connections, pulmonary vein stenosis, and atresia of the common pulmonary vein. In: Garson A, Bricker JT, Fisher DJ, Neish SR, eds. The Science and Practice of Pediatric Cardiology. 2nd ed. Baltimore, MD: Williams and Wilkins; 1998:1431-1461.
5. Garcia-Barreto L, Vega W, Deliz R, Rodriguez W. Right hilar abnormality in a young man. Respiration. 1996;63(4):246-250.
6. Simmons DB, Menon RS, Pomeroy WL, Batts TC, Slim AM. An unusual presentation of scimitar syndrome in a military service member. Case Rep Vasc Med. 2013;2013:632402.
7. Palios J, Pernetz MA, Clements S Jr, Lerakis S. Three-dimensional echocardiography images showing anomalous pulmonary venous return in an adult with scimitar syndrome. Echocardiography. 2014;31(3):E103.
8. Vida VL, Padalino MA, Boccuzzo G, et al. Scimitar syndrome: a European Congenital Heart Surgeons Association (ECHSA) multicentric study. Circulation. 2010;122(12):1159-1166.
9. Dusenbery SM, Geva T, Seale A, et al. Outcome predictors and implications for management of scimitar syndrome. Am Heart J. 2013;165(5):770-777.
10. Sehgal A, Loughran-Fowlds A. Scimitar syndrome. Indian J Pediatr. 2005;72(3):249-251.
11. Najm HK, Williams WG, Coles JG, Rebeyka IM, Freedom RM. Scimitar syndrome: twenty years’ experience and results of repair. J Thorac Cardiovasc Surg. 1996;112(5):1161-1169.
12. Dupuis C, Charaf LA, Brevière GM, Abou P, Rémy-Jardin M, Helmius G. The “adult” form of the scimitar syndrome. Am J Cardiol. 1992;70(4):502-507.
Anatomic variations may result in abnormal return from the pulmonary veins to the right side of the heart. This group of congenital anomalies, also known as partial anomalous pulmonary venous return (PAPVR), may connect oxygenated blood from the pulmonary vein to a systemic vein before reaching the right atrium. The most common PAPVR is derived from the left upper pulmonary vein, which then connects to the left innominate vein and drains into the superior vena cava (SVC).
Scimitar syndrome is a rare PAPVR variant in which part of or the entire right lung is drained by the pulmonary vein into the inferior vena cava (IVC), giving the curvilinear dimension the appearance of a Middle Eastern sword (scimitar). The syndrome is frequently associated with other abnormalities, such as right lung hypoplasia and abnormal right lung lobation, dextroposition of the heart, right pulmonary artery hypoplasia, systemic arterial blood supply to the right lower lung from the infradiaphragmatic aorta, atrial septal defects of the secundum type, right-sided diaphragmatic hernia, and horseshoe lung.1,2 The syndrome was first described in 1836 by Cooper during an autopsy of an infant, and Dotter diagnosed the first symptomatic patient in 1949.3,4
Case Report
A 62-year-old man, former smoker (40 pack-year), with a past medical history of arterial hypertension and asthma visited the clinic, reporting exertional dyspnea. He also reported oppressive, retrosternally located exertional chest pain, 6/10 in intensity, of 3 minutes’ duration that radiated to the right chest and ameliorated with rest. Symptoms had occurred every other day for the past year. His physical exam was remarkable for central obesity. Lung auscultation was essentially clear. There was no jugular vein distention. The patient’s heart showed a regular rate and rhythm without evidence of murmurs or gallops. There was no evidence of leg edema or cyanosis. The patient’s resting oxygen saturation of 98% remained unchanged after exercise.
Related: Venous Thromboembolism Prophylaxis in Acutely Ill Veterans With Respiratory Disease
An electrocardiogram showed normal sinus rhythm with no ischemic changes. A pulmonary function test showed a forced expiratory volume (FEV1) of 1.44 L (61% of predicted), forced vital capacity (FVC) of 1.99 L (68% of predicted), and slow vital capacity (SVC) of 2.09 L (60% of predicted), with an FEV1/SVC ratio of 68% of predicted. These results suggested moderate-to-severe obstructive ventilatory impairment.
There was no response to bronchodilator therapy. Lung volumes were measured by plethysmography. The residual volume (RV), total lung capacity (TLC), and RV/TLC ratio were 2.57 L (147% of predicted), 4.66 L (88% of predicted), and 55%, respectively, suggesting severe air trapping. Diffusion lung capacity (DLCO) testing revealed 16.95 mL/min/mm Hg (73% of predicted) when corrected by hemoglobin and DLCO/alveolar volume of 4.97 mL/min/mm Hg/L (114% of predicted). This result was consistent with a mild reduction of gas transfer, which normalized when corrected by alveolar volume.
A posteroanterior chest radiograph image was remarkable for mediastinal shifting toward the right side, volume loss of the right lung, and evidence of a previous gunshot on the right chest wall (Figure 1). Previous chest imaging done in October 2009 showed an opacification of the right lower lung with indistinctness of the right cardiac border and partial obliteration of the right hemidiaphragm. The patient was treated with inhaled steroids and long- acting bronchodilators with partial improvement in dyspnea symptoms.
Myocardial perfusion imaging revealed scintigraphic evidence of heart rate-induced ischemia on the inferior and apical wall segments of the left ventricular myocardium. A transthoracic echocardiogram showed a very poor echocardiographic window. Left ventricular function seemed preserved. Transesophageal echocardiography was scheduled, but the patient missed the appointment.
Cardiac catheterization was only remarkable for 40% to 50% obstruction of the mid-left anterior descending artery, which did not explain the patient’s dyspnea or chest pain. Right side pressures were described as follows: right atrial mean, 10 mm Hg; right ventricle, 36/8 mm Hg; pulmonary artery, 33/16 mm Hg; pulmonary artery mean, 23 mm Hg; pulmonary capillary wedge pressure, 12 mm Hg; and a mean arterial pressure of 100 mm Hg. He had a left ventricle ejection fraction of 60%.
Because images suggested dextroposition of the heart and right lung hypoplasia, a chest computed tomography (CT) and angiography were done (Figure 2). The images showed hypoplasia of the right lung field with an anomalous venous return from the right midlung, having a vertical contour that drained into the supradiaphragmatic IVC. In addition, CT reconstruction demarcated the last mentioned contour draining into the IVC, consistent with scimitar syndrome (Figure 3). The patient was treated conservatively due to age, optimizing therapy for obstructive lung and cardiovascular disease.
Discussion
Partial anomalous pulmonary venous return is a relatively uncommon congenital anomaly, accounting for 0.5% to 1% of congenital heart disease.4,5 The characteristic abnormality is PAPVR of part of or the entire right lung to the IVC, either below the diaphragm or at the junction of the IVC and the right atrium. The rare combination (3%-5%) of an association of PAPVR, right lung hypoplasia, and dextroposition of the heart is designated scimitar syndrome. The scimitar vein sign is a characteristic chest roentgenographic finding of a crescentlike shadow in the right lower lung field where the curvilinear dimension gives the appearance of a scimitar sword.
Related: Another Reason Not to Smoke: Acute Eosinophilic Pneunomia
Normally, the pulmonary veins from the right and left lung carry oxygenated blood into the left atrium, then to the left ventricle, and then flowing out systemically. The SCV and IVC return the deoxygenated blood from the body system to the right atrium. From the right atrium, blood flows into the right ventricle, and then through pulmonary arteries, reaching the lungs where oxygenation occurs. In this syndrome, a left-to-right shunt is established when the anomalous pulmonary vein drains blood from the right lung into the IVC, resulting in an increased risk of developing right ventricular failure due to long-standing right ventricular volume overload.
Presentation and Diagnosis
There are two clinical presentations of scimitar syndrome: infantile and pediatric/adult. Infantile scimitar syndrome has a clinical presentation of tachypnea and heart failure within the first 2 months of life, with a high mortality rate. The pediatric/adult type is milder and frequently asymptomatic, and the diagnosis is usually incidental after performing an imaging study. Scimitar vein sign appears in 70% of the noninfantile cases, and lung hypoplasia is less severe. A spirometry may reveal mild deficits in vital capacity and FEV1. An electrocardiogram may show right ventricular hypertrophy.
Cardiac catheterization is required to confirm the diagnosis. Additionally, this procedure can help in the assessment of the pulmonary venous drainage course, pulmonary artery anatomy and pressure, scimitar vein stenosis, and presence of left-to-right shunt or other cardiac anomalies, if present. Other modalities have been suggested as alternative methods for diagnosing this condition, including the use of coronary CT and 3D echocardiography.6,7 However, these diagnostic tests are not available in all facilities and are very costly.
Treatment and Prognosis
Vida and colleagues conducted a multicentric study for the European Congenital Heart Surgeons Association on scimitar syndrome.8 Data were collected from 1997 to 2007 for 68 patients who underwent a surgical procedure. A total of 11 patients were categorized as late onset, and when compared with the infantile category, they had fewer postoperatory complications, hospital mortality, late mortality, and were less likely to develop pulmonary hypertension. Both pulmonary stenosis and pulmonary hypertension were linked with poor outcomes. It seems the younger the patient (infantile), the higher the possibility of complications and mortality. Adults who are incidentally diagnosed have a better outcome if asymptomatic. Findings such as hypoplastic lungs may predispose these patients to developing recurrent pneumonias.8,9
Related: Prevention of Venous Thromboembolism After Total Joint Replacement: A Rivaroxaban Update
Dusenbery and colleagues documented in a cohort study the relationship between poor survival and other variables. Significant variables included age at presentation, nonatrial septal defect (non-ASD) congenital heart disease, left pulmonary vein stenosis, and pulmonary artery pressure (PAP) at the time of presentation. Predictors of survival for nonsurgical patients were directly related to PAP at presentation and absence of non-ASD congenital heart disease. If the patient’s PAP is less than half of the systemic pressure, the survival is near 100% at 5 years from initial presentation.9
Surgery is the definitive treatment for PAPVR. However, asymptomatic patients with PAPVR with small left-to-right shunt do not require intervention, as the defect has no significant clinical impact, and patients have a normal life expectancy without correction.10
Surgical treatment may be considered in the following circumstances:
- A hemodynamically significant left-to-right shunt (a ratio of pulmonary to systemic blood flow is greater than 2:1), often manifested as right ventricular volume overload
- Recurrent pulmonary infections
- Compression or obstruction of surrounding structures caused by the anomalous vein
- During surgical repair of other major cardiac lesions, depending on the surgical risk of a repair and level and degree of shunting
Surgical options include redirecting the venous drainage to the left atria, ligation/embolization of vascular supply to the sequestered lobe, and pneumonectomy. The procedure complications may include thrombosis of the scimitar vein, lung infarct, hemoptysis, and pulmonary hypertension, which may lead to resection of the lung.11,12 Surgical procedures are recommended in cases where the patient has had recurrent lung infections or a significant degree of shunting. Studies have compared both approaches, demonstrating a better outcome after 10 years for those patients who were medically treated considering the aforementioned surgical indications.
Conclusion
Scimitar syndrome is a rare but welldescribed constellation of cardiopulmonary anomalies, accounting for 0.5% to 1% of congenital heart disease. It is a variant of PAPVR, in which part of or even the entire right lung is drained by right pulmonary veins that connect anomalously to the IVC. Although a diagnosis can be made by chest radiograph, further imaging is needed to corroborate the diagnosis and demonstrate other associated abnormalities.
Additional tests have been described in the literature, but these procedures are not available in all facilities and may incur a higher cost. Therefore, CT angiographic reconstruction is an alternative, noninvasive procedure. Surgery is the definitive treatment; however, asymptomatic patients with PAPVR and small left-to-right shunt do not require intervention.
Author disclosures
The authors report no actual or potential conflicts of interest with regard to this article.
Disclaimer
The opinions expressed herein are those of the authors and do not necessarily reflect those of Federal Practitioner, Frontline Medical Communications Inc., the U.S. Government, or any of its agencies. This article may discuss unlabeled or investigational use of certain drugs. Please review complete prescribing information for specific drugs or drug combinations—including indications, contraindications, warnings, and adverse effects—before administering pharmacologic therapy to patients.
1. Cooper G. Case of malformation of the thoracic viscera: consisting of imperfect development of the right lung, and transposition of the heart. London Med Gaz. 1836;18:600-602.
2. Spentzouris G, Zandian A, Cesmebasi A, et al. The clinical anatomy of the inferior vena cava: a review of common congenital anomalies and the considerations for clinicians. Clin Anat. 2014;27(8):1234-1243.
3. Neill CA, Ferencz C, Sabiston DC, Sheldon H. The familial occurrence of hypoplastic right lung with systemic arterial supply and venous drainage “scimitar syndrome.” Bull Johns Hopkins Hosp. 1960;107:1-21.
4. Ward KE, Mullins CE. Anomalous pulmonary venous connections, pulmonary vein stenosis, and atresia of the common pulmonary vein. In: Garson A, Bricker JT, Fisher DJ, Neish SR, eds. The Science and Practice of Pediatric Cardiology. 2nd ed. Baltimore, MD: Williams and Wilkins; 1998:1431-1461.
5. Garcia-Barreto L, Vega W, Deliz R, Rodriguez W. Right hilar abnormality in a young man. Respiration. 1996;63(4):246-250.
6. Simmons DB, Menon RS, Pomeroy WL, Batts TC, Slim AM. An unusual presentation of scimitar syndrome in a military service member. Case Rep Vasc Med. 2013;2013:632402.
7. Palios J, Pernetz MA, Clements S Jr, Lerakis S. Three-dimensional echocardiography images showing anomalous pulmonary venous return in an adult with scimitar syndrome. Echocardiography. 2014;31(3):E103.
8. Vida VL, Padalino MA, Boccuzzo G, et al. Scimitar syndrome: a European Congenital Heart Surgeons Association (ECHSA) multicentric study. Circulation. 2010;122(12):1159-1166.
9. Dusenbery SM, Geva T, Seale A, et al. Outcome predictors and implications for management of scimitar syndrome. Am Heart J. 2013;165(5):770-777.
10. Sehgal A, Loughran-Fowlds A. Scimitar syndrome. Indian J Pediatr. 2005;72(3):249-251.
11. Najm HK, Williams WG, Coles JG, Rebeyka IM, Freedom RM. Scimitar syndrome: twenty years’ experience and results of repair. J Thorac Cardiovasc Surg. 1996;112(5):1161-1169.
12. Dupuis C, Charaf LA, Brevière GM, Abou P, Rémy-Jardin M, Helmius G. The “adult” form of the scimitar syndrome. Am J Cardiol. 1992;70(4):502-507.