User login
Treatment of Ampicillin-Resistant Enterococcus faecium Urinary Tract Infections
Enterococcus species account for about 110,000 urinary tract infections (UTIs) annually in the U.S.1 The most common species isolated are Enterococcus faecalis and Enterococcus faecium (E faecium). Amoxicillin is the drug of choice for the treatment of enterococcal UTIs. Second-line therapies include vancomycin and nitrofurantoin. Alternative therapies include daptomycin and linezolid; however, these newer agents ideally would be reserved for more serious infections to preserve activity.2
Increased E faecium resistance to ampicillin and vancomycin has limited the therapeutic options. The results of a study by Zhanel and colleagues assessed the prevalence of resistant enterococcal urine isolates in North America.3 Of the 658 E faecium urine isolates, about 96% were resistant to ampicillin and 94% were resistant to vancoymcin.3 Nitrofurantoin has much lower resistance rates; however, its use is contraindicated in patients with a creatinine clearance (CrCl) < 60 mL/min.4 Data supporting the contraindication are limited, but the results of a study by Oplinger and Andrews suggested that using nitrofurantoin in patients with a CrCl ≥ 40 mL/min may be safe and effective.5 A therapeutic dilemma may occur when resistant E faecium UTIs are encountered and viable treatment options are limited due to intolerances, administration difficulties, lack of susceptibility data, or cost.
Related: Antimicrobial Stewardship in an Outpatient Parenteral Antibiotic Therapy Program
Based on the current Clinical and Laboratory Standards Institute standard, Enterococcus species with a minimal inhibitory concentration (MIC) ≥ 16 μg/mL are considered ampicillin resistant. Microbiology laboratories use the same breakpoint regardless of the site of infection.6 Amoxicillin concentrates in the urine; therefore, urinary concentrations are much higher than serum concentrations. The mean serum peak concentration after a single dose of oral amoxicillin 500 mg is 7.6 μg/mL.7 After a single dose of oral amoxicillin 500 mg, the average concentration in pooled urine collected over 6 hours was 1,100 μg/mL.8
In 2002, Williamson and colleagues analyzed 30 ampicillin- resistant E faecium urine isolates. Reported MICs were 128 μg/mL (30%), 256 μg/mL (60%), and 512 μg/mL (10%).9 A more recent retrospective analysis analyzed 234 ampicillin-resistant E faecium urine isolates. The MIC ranged from 32 to 1,024 μg/mL, with a median MIC of 256 μg/mL. Only 5 isolates had an MIC value > 1,000 μg/mL, but each of these isolates was within 1 dilution of 512 μg/mL.10 Because penicillins exhibit time-dependent killing, an optimal response will occur as long as the urine concentration is above the MIC for at least 50% of the dosing interval.11 Therefore, therapeutic doses of amoxicillin are expected to produce urine concentrations that exceed the MIC of resistant E faecium urine isolates. The purpose of this study was to determine if amoxicillin was a viable treatment option for ampicillin-resistant E faecium UTIs based on this in vitro theory.
Methods
Veterans aged ≥ 18 years with a positive urine culture for ampicillin- resistant E faecium who received antibiotic therapy for cystitis at the Jesse Brown VA Medical Center (JBVAMC) from January 1, 2005, through June 22, 2010, were evaluated in this retrospective cohort study. Exclusion criteria were the presence of any other organisms in the initial urine culture, prostatic involvement, and the presence of E faecium in a blood culture. Subjects treated with multiple antibiotics concurrently and with sequential treatment of different antibiotics with no evaluation of efficacy between courses were also excluded.
Related: Urologist Workforce Variation Across the VHA
All included subjects were evaluated for resolution of symptoms; improvement in leukocyte esterase count and white blood cell (WBC) count from urine analysis (UA); and eradication of E faecium from a repeat urine culture. The response to treatment was classified as cure, presumed cure, or failure. The criteria for cure were based on the following: resolution of symptoms if present at baseline; repeat UA indicating improvement from the initial positive UA (if obtained); and eradication of E faecium in a repeat urine culture (if obtained).
At least 1 of the aforementioned criteria must have been met to be classified as cure. If more than 1 of the aforementioned criteria was present, then each one must have been met to be classified as cure. To be evaluated for presumed cure, the subject must have had symptoms at baseline. No documentation of ongoing symptoms in subjects who had an appropriate follow-up but did not have a repeat UA or urine culture indicated presumed cure. Persistence or worsening of pretreatment symptoms, a repeat UA without improvement from the initial positive UA, or a repeat urine culture demonstrating continued presence of E faecium indicated failure. The primary endpoint for the study was to determine whether amoxicillin was effective for the management of ampicillin-resistant E faecium UTIs. This study was conducted in compliance with the University of Illinois at Chicago Institutional Review Board and JBVAMC Human Subjects Research Committee requirements.
Results
This study included 20 positive urine cultures for ampicillin-resistant E faecium in 19 subjects. Nine cases were treated with amoxicillin, and 11 cases were treated with nitrofurantoin. At baseline, the mean age was 75 years, mean duration of therapy was 14 days, and all the subjects were male. The baseline characteristics of the 2 groups were similar with the exception of an older population, shorter duration of therapy, and increased incidence of chronic kidney disease in the amoxicillin treatment group, P = .02, .03, and .01, respectively.
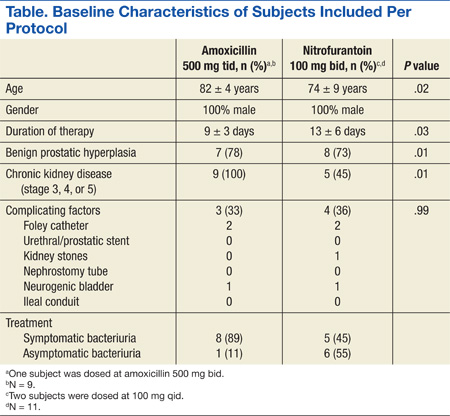
Symptoms were documented in 8 of 9 (89%) cases at the time of the positive culture in the amoxicillin treatment group and 5 of 11 (45%) cases in the nitrofurantoin treatment group (Table). The asymptomatic amoxicillin treatment group case and 5 of the 6 nitrofurantoin treatment group asymptomatic cases received treatment prior to a urologic procedure in accordance with the Infectious Diseases Society of America (IDSA) guidelines for the treatment of asymptomatic bacteriuria. The urologic procedures included transurethral resection of a bladder tumor, cystoscopy, urethral dilation, cystometrogram, and transurethral resection of the prostate. One asymptomatic subject in the nitrofurantoin group did not have any documentation to support an appropriate indication for treatment. All positive cultures were > 100,000 colonies/mL except for 1 culture in the nitrofurantoin treatment group, which was 45,000 colonies/mL, but because the subject was symptomatic, treatment was administered and a repeat urine culture was negative.
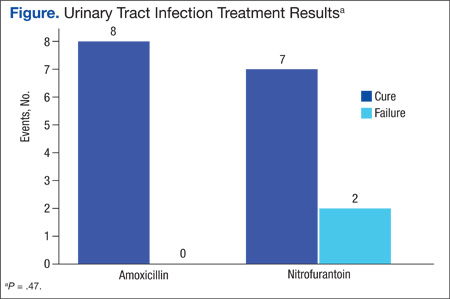
There were 8 cases classified as cure, 1 presumed cure, and no failures in the amoxicillin group. In the nitrofurantoin group, 7 cases were classified as cure, 1 presumed cure, and 3 failures. The presumed cures were excluded from the statistical analysis due to inability to ensure these cases were truly cured. Also excluded from the statistical analysis was one of the failures in the nitrofurantoin group, because the subject was asymptomatic with no known indication for treatment. This left 8 cases classified as cure and no failures in the amoxicillin group compared with 7 cases classified as cure and 2 failures in the nitrofurantoin group, P = .47 (Figure). Statistical analysis was performed using the Fisher exact test.
Discussion
There was no statistically significant difference between amoxicillin and nitrofurantoin for the treatment of ampicillin-resistant E faecium UTIs. There were no failures in the amoxicillin group despite all isolates displaying resistance based on current breakpoints, supporting the theory that higher urine concentrations of amoxicillin may overcome the MIC of resistant isolates.
Related: Novel Therapy for Treating Complicated UTIs
Of the 11 cases treated with nitrofurantoin, 3 were classified failures. The first failure in the nitrofurantoin group was an asymptomatic subject who did not have a repeat urine culture but had a repeat UA, which showed a persistent elevation in WBC and leukocyte esterase count. This subject was removed from the statistical analysis, as treatment was not indicated per IDSA guidelines. No reason could be identified for the second failure, as a repeat culture demonstrated continued presence of E faecium. Chronic kidney disease (CKD) contributed to the third failure in the nitrofurantoin treatment group; the subject’s CrCl was about 17 mL/min. After treatment, the subject had a repeat urine culture, which indicated the continued presence of E faecium. The subject was later successfully treated with amoxicillin. Both cultures in the same subject were included in the final analysis per protocol, as the subject had an adequate evaluation of efficacy between courses. Four additional cases with CKD were treated with nitrofurantoin; however, their CrCl ranged from 40 to 55 mL/min, and all were classified cure or presumed cure.
Limitations
There were several limitations to this study. Due to the strict inclusion and exclusion criteria, a limited number of subjects were evaluated. Given that this was a retrospective study, it is possible that symptoms were reported by a subject but not appropriately documented. Another significant limitation of this trial was that MICs were not determined due to the retrospective nature of the study. External validity was also limited due to a predominately elderly and male population. Safety data regarding different therapies were not collected, as this study evaluated only the efficacy of therapies.
Conclusion
Although this was a very small retrospective analysis, to the authors knowledge this is the first clinical study supporting the in vitro theory that amoxicillin (500 mg every 8 hours) may overcome the MIC of resistant isolates due to achievement of higher urinary concentrations. Because this was a small retrospective analysis, more prospective evidence is needed to confirm these results.
Acknowledgements
Heather Kim, biostatistician, University of Illinois at Chicago. CCTS Support: UL1RR029879.
Author disclosures
The authors report no actual or potential conflicts of interest with regard to this article.
Disclaimer
The opinions expressed herein are those of the authors and do not necessarily reflect those of Federal Practitioner, Frontline Medical Communications Inc., the U.S. Government, or any of its agencies. This article may discuss unlabeled or investigational use of certain drugs. Please review complete prescribing information for specific drugs or drug combinations—including indications, contraindications, warnings, and adverse effects—before administering pharmacologic therapy to patients.
1. Huycke MM, Sahm DF, Gilmore MS. Multiple-drug resistant enterococci: the nature of the problem and an agenda for the future. Emerg Infect Dis. 1998;4(2):239-249.
2. Heintz BH, Halilovic J, Christensen CL. Vancomycin -resistant enterococcal urinary tract infections. Pharmacotherapy. 2010;30(11):1136-1149.
3. Zhanel GG, Laing NM, Nichol KA, et al; NAVRESS Group. Antibiotic activity against urinary tract infection (UTI) isolates of vancomycin-resistant enterococci (VRE): results from the 2002 North American Vancomycin Resistant Enterococci Susceptibility Study (NAVRESS). J Antimicrob Chemother. 2003;52(3):382-388.
4. Macrobid [package insert]. Pine Brook, NJ: Almatica Pharma; 2013.
5. Oplinger M, Andrews CO. Nitrofurantoin contraindicated in patients with a creatinine clearance below 60 mL/min: looking for the evidence. Ann Pharmacother. 2013;47(1):106-111.
6. Clinical and Laboratory Standards Institute. Performance Standards for Antimicrobial Susceptibility Testing: Seventeenth Informational Supplement M100-S17. Wayne, PA: Clinical and Laboratory Standards Institute; 2007.
7. Gordon RC, Regamey C, Kirby WM. Comparative clinical pharmacology of amoxicillin and ampicillin administered orally. Antimicrob Agents Chemother. 1972;1(6):504-507.
8. Sutherland R, Croydon EA, Rolinson GN. Amoxycillin: a new semi-synthetic penicillin. Br Med J. 1972;3(5817):13-16.
9. Williamson JC, Craft DW, Butts JD, Raasch RH. In vitro assessment of urinary isolates of ampicillin-resistant enterococci. Ann Pharmacother. 2002;36(2):246-250.
10. Dumkow LE, Perri MB, Zervos M. Time to stop using alternatives to ampicillin for enterococcal UTIs? In-vitro susceptibility trends for enterococcus urinary isolates over a one-year period in Detroit. Poster presented at: 53rd Interscience Conference of Antimicrobial Agents and Chemotherapy (ICAAC); September 10-13, 2013; Denver, CO.
11. Quintiliani R. Using pharmacodynamics and pharmacokinetics concepts to optimize treatment of infectious diseases. Infect Med. 2004;21(5):219-232.
Enterococcus species account for about 110,000 urinary tract infections (UTIs) annually in the U.S.1 The most common species isolated are Enterococcus faecalis and Enterococcus faecium (E faecium). Amoxicillin is the drug of choice for the treatment of enterococcal UTIs. Second-line therapies include vancomycin and nitrofurantoin. Alternative therapies include daptomycin and linezolid; however, these newer agents ideally would be reserved for more serious infections to preserve activity.2
Increased E faecium resistance to ampicillin and vancomycin has limited the therapeutic options. The results of a study by Zhanel and colleagues assessed the prevalence of resistant enterococcal urine isolates in North America.3 Of the 658 E faecium urine isolates, about 96% were resistant to ampicillin and 94% were resistant to vancoymcin.3 Nitrofurantoin has much lower resistance rates; however, its use is contraindicated in patients with a creatinine clearance (CrCl) < 60 mL/min.4 Data supporting the contraindication are limited, but the results of a study by Oplinger and Andrews suggested that using nitrofurantoin in patients with a CrCl ≥ 40 mL/min may be safe and effective.5 A therapeutic dilemma may occur when resistant E faecium UTIs are encountered and viable treatment options are limited due to intolerances, administration difficulties, lack of susceptibility data, or cost.
Related: Antimicrobial Stewardship in an Outpatient Parenteral Antibiotic Therapy Program
Based on the current Clinical and Laboratory Standards Institute standard, Enterococcus species with a minimal inhibitory concentration (MIC) ≥ 16 μg/mL are considered ampicillin resistant. Microbiology laboratories use the same breakpoint regardless of the site of infection.6 Amoxicillin concentrates in the urine; therefore, urinary concentrations are much higher than serum concentrations. The mean serum peak concentration after a single dose of oral amoxicillin 500 mg is 7.6 μg/mL.7 After a single dose of oral amoxicillin 500 mg, the average concentration in pooled urine collected over 6 hours was 1,100 μg/mL.8
In 2002, Williamson and colleagues analyzed 30 ampicillin- resistant E faecium urine isolates. Reported MICs were 128 μg/mL (30%), 256 μg/mL (60%), and 512 μg/mL (10%).9 A more recent retrospective analysis analyzed 234 ampicillin-resistant E faecium urine isolates. The MIC ranged from 32 to 1,024 μg/mL, with a median MIC of 256 μg/mL. Only 5 isolates had an MIC value > 1,000 μg/mL, but each of these isolates was within 1 dilution of 512 μg/mL.10 Because penicillins exhibit time-dependent killing, an optimal response will occur as long as the urine concentration is above the MIC for at least 50% of the dosing interval.11 Therefore, therapeutic doses of amoxicillin are expected to produce urine concentrations that exceed the MIC of resistant E faecium urine isolates. The purpose of this study was to determine if amoxicillin was a viable treatment option for ampicillin-resistant E faecium UTIs based on this in vitro theory.
Methods
Veterans aged ≥ 18 years with a positive urine culture for ampicillin- resistant E faecium who received antibiotic therapy for cystitis at the Jesse Brown VA Medical Center (JBVAMC) from January 1, 2005, through June 22, 2010, were evaluated in this retrospective cohort study. Exclusion criteria were the presence of any other organisms in the initial urine culture, prostatic involvement, and the presence of E faecium in a blood culture. Subjects treated with multiple antibiotics concurrently and with sequential treatment of different antibiotics with no evaluation of efficacy between courses were also excluded.
Related: Urologist Workforce Variation Across the VHA
All included subjects were evaluated for resolution of symptoms; improvement in leukocyte esterase count and white blood cell (WBC) count from urine analysis (UA); and eradication of E faecium from a repeat urine culture. The response to treatment was classified as cure, presumed cure, or failure. The criteria for cure were based on the following: resolution of symptoms if present at baseline; repeat UA indicating improvement from the initial positive UA (if obtained); and eradication of E faecium in a repeat urine culture (if obtained).
At least 1 of the aforementioned criteria must have been met to be classified as cure. If more than 1 of the aforementioned criteria was present, then each one must have been met to be classified as cure. To be evaluated for presumed cure, the subject must have had symptoms at baseline. No documentation of ongoing symptoms in subjects who had an appropriate follow-up but did not have a repeat UA or urine culture indicated presumed cure. Persistence or worsening of pretreatment symptoms, a repeat UA without improvement from the initial positive UA, or a repeat urine culture demonstrating continued presence of E faecium indicated failure. The primary endpoint for the study was to determine whether amoxicillin was effective for the management of ampicillin-resistant E faecium UTIs. This study was conducted in compliance with the University of Illinois at Chicago Institutional Review Board and JBVAMC Human Subjects Research Committee requirements.
Results
This study included 20 positive urine cultures for ampicillin-resistant E faecium in 19 subjects. Nine cases were treated with amoxicillin, and 11 cases were treated with nitrofurantoin. At baseline, the mean age was 75 years, mean duration of therapy was 14 days, and all the subjects were male. The baseline characteristics of the 2 groups were similar with the exception of an older population, shorter duration of therapy, and increased incidence of chronic kidney disease in the amoxicillin treatment group, P = .02, .03, and .01, respectively.
Symptoms were documented in 8 of 9 (89%) cases at the time of the positive culture in the amoxicillin treatment group and 5 of 11 (45%) cases in the nitrofurantoin treatment group (Table). The asymptomatic amoxicillin treatment group case and 5 of the 6 nitrofurantoin treatment group asymptomatic cases received treatment prior to a urologic procedure in accordance with the Infectious Diseases Society of America (IDSA) guidelines for the treatment of asymptomatic bacteriuria. The urologic procedures included transurethral resection of a bladder tumor, cystoscopy, urethral dilation, cystometrogram, and transurethral resection of the prostate. One asymptomatic subject in the nitrofurantoin group did not have any documentation to support an appropriate indication for treatment. All positive cultures were > 100,000 colonies/mL except for 1 culture in the nitrofurantoin treatment group, which was 45,000 colonies/mL, but because the subject was symptomatic, treatment was administered and a repeat urine culture was negative.
There were 8 cases classified as cure, 1 presumed cure, and no failures in the amoxicillin group. In the nitrofurantoin group, 7 cases were classified as cure, 1 presumed cure, and 3 failures. The presumed cures were excluded from the statistical analysis due to inability to ensure these cases were truly cured. Also excluded from the statistical analysis was one of the failures in the nitrofurantoin group, because the subject was asymptomatic with no known indication for treatment. This left 8 cases classified as cure and no failures in the amoxicillin group compared with 7 cases classified as cure and 2 failures in the nitrofurantoin group, P = .47 (Figure). Statistical analysis was performed using the Fisher exact test.
Discussion
There was no statistically significant difference between amoxicillin and nitrofurantoin for the treatment of ampicillin-resistant E faecium UTIs. There were no failures in the amoxicillin group despite all isolates displaying resistance based on current breakpoints, supporting the theory that higher urine concentrations of amoxicillin may overcome the MIC of resistant isolates.
Related: Novel Therapy for Treating Complicated UTIs
Of the 11 cases treated with nitrofurantoin, 3 were classified failures. The first failure in the nitrofurantoin group was an asymptomatic subject who did not have a repeat urine culture but had a repeat UA, which showed a persistent elevation in WBC and leukocyte esterase count. This subject was removed from the statistical analysis, as treatment was not indicated per IDSA guidelines. No reason could be identified for the second failure, as a repeat culture demonstrated continued presence of E faecium. Chronic kidney disease (CKD) contributed to the third failure in the nitrofurantoin treatment group; the subject’s CrCl was about 17 mL/min. After treatment, the subject had a repeat urine culture, which indicated the continued presence of E faecium. The subject was later successfully treated with amoxicillin. Both cultures in the same subject were included in the final analysis per protocol, as the subject had an adequate evaluation of efficacy between courses. Four additional cases with CKD were treated with nitrofurantoin; however, their CrCl ranged from 40 to 55 mL/min, and all were classified cure or presumed cure.
Limitations
There were several limitations to this study. Due to the strict inclusion and exclusion criteria, a limited number of subjects were evaluated. Given that this was a retrospective study, it is possible that symptoms were reported by a subject but not appropriately documented. Another significant limitation of this trial was that MICs were not determined due to the retrospective nature of the study. External validity was also limited due to a predominately elderly and male population. Safety data regarding different therapies were not collected, as this study evaluated only the efficacy of therapies.
Conclusion
Although this was a very small retrospective analysis, to the authors knowledge this is the first clinical study supporting the in vitro theory that amoxicillin (500 mg every 8 hours) may overcome the MIC of resistant isolates due to achievement of higher urinary concentrations. Because this was a small retrospective analysis, more prospective evidence is needed to confirm these results.
Acknowledgements
Heather Kim, biostatistician, University of Illinois at Chicago. CCTS Support: UL1RR029879.
Author disclosures
The authors report no actual or potential conflicts of interest with regard to this article.
Disclaimer
The opinions expressed herein are those of the authors and do not necessarily reflect those of Federal Practitioner, Frontline Medical Communications Inc., the U.S. Government, or any of its agencies. This article may discuss unlabeled or investigational use of certain drugs. Please review complete prescribing information for specific drugs or drug combinations—including indications, contraindications, warnings, and adverse effects—before administering pharmacologic therapy to patients.
1. Huycke MM, Sahm DF, Gilmore MS. Multiple-drug resistant enterococci: the nature of the problem and an agenda for the future. Emerg Infect Dis. 1998;4(2):239-249.
2. Heintz BH, Halilovic J, Christensen CL. Vancomycin -resistant enterococcal urinary tract infections. Pharmacotherapy. 2010;30(11):1136-1149.
3. Zhanel GG, Laing NM, Nichol KA, et al; NAVRESS Group. Antibiotic activity against urinary tract infection (UTI) isolates of vancomycin-resistant enterococci (VRE): results from the 2002 North American Vancomycin Resistant Enterococci Susceptibility Study (NAVRESS). J Antimicrob Chemother. 2003;52(3):382-388.
4. Macrobid [package insert]. Pine Brook, NJ: Almatica Pharma; 2013.
5. Oplinger M, Andrews CO. Nitrofurantoin contraindicated in patients with a creatinine clearance below 60 mL/min: looking for the evidence. Ann Pharmacother. 2013;47(1):106-111.
6. Clinical and Laboratory Standards Institute. Performance Standards for Antimicrobial Susceptibility Testing: Seventeenth Informational Supplement M100-S17. Wayne, PA: Clinical and Laboratory Standards Institute; 2007.
7. Gordon RC, Regamey C, Kirby WM. Comparative clinical pharmacology of amoxicillin and ampicillin administered orally. Antimicrob Agents Chemother. 1972;1(6):504-507.
8. Sutherland R, Croydon EA, Rolinson GN. Amoxycillin: a new semi-synthetic penicillin. Br Med J. 1972;3(5817):13-16.
9. Williamson JC, Craft DW, Butts JD, Raasch RH. In vitro assessment of urinary isolates of ampicillin-resistant enterococci. Ann Pharmacother. 2002;36(2):246-250.
10. Dumkow LE, Perri MB, Zervos M. Time to stop using alternatives to ampicillin for enterococcal UTIs? In-vitro susceptibility trends for enterococcus urinary isolates over a one-year period in Detroit. Poster presented at: 53rd Interscience Conference of Antimicrobial Agents and Chemotherapy (ICAAC); September 10-13, 2013; Denver, CO.
11. Quintiliani R. Using pharmacodynamics and pharmacokinetics concepts to optimize treatment of infectious diseases. Infect Med. 2004;21(5):219-232.
Antimicrobial Dosing for Empiric and Documented Pseudomonas
Pseudomonas is a genus of aerobic, Gram-negative bacilli consisting of about 200 species. Pseudomonas aeruginosa (P aeruginosa) is the species most commonly associated with serious hospital-acquired infections and is commonly found in moist environments in hospitals, such as sinks, showers, and machinery/equipment. The symptoms of an infection by this bacterium are variable based on the site of infection and can manifest in various sites, such as the respiratory tract, urinary tract, ears, eyes, heart, skin, and soft tissue.1 General risk factors for infection with P aeruginosa include immunosuppression, history of lung disease, hospitalization lasting at least 5 days, history of repeated antibiotic use within 90 days, and a history of pseudomonal colonization/infection.
Related: Antibiotic Therapy and Bacterial Resistance in Patients With Spinal Cord Injury
Pseudomonas aeruginosa is a challenging organism to manage, as it is inherently resistant to many antibiotics. Furthermore, antibiotics effective against infections caused by P aeruginosa often require specific regimens as a result of the high minimum inhibitory concentration (MIC) of the organism. Two specific strategies that have been analyzed for proper coverage of P aeruginosa include the use of higher than usual doses and extended infusions. Due to significant challenges associated with obtaining patient outcomes data in human clinical trials, researchers often use Monte Carlo simulations, which are computational algorithms that simulate the variables of a study (ie, patient demographics) to be as real as possible to accurately predict therapeutic responses in patients.
Analyzing pharmacokinetic (PK) and pharmacodynamic (PD) indexes is valuable for determining therapeutic efficacy, as these indexes consider both the antibiotic dose/concentration and its effect over time in relation to response to therapy. The free-drug area under the concentration time curve (fAUC/MIC) ratio is a PK/PD value commonly used to describe the free-drug concentration over 24 hours that is above the MIC.2 The fAUC is dependent on creatinine clearance (CrCl) and, therefore, is specific to each patient. A threshold value for the fAUC/MIC is determined for an antibiotic, and a therapeutic regimen is dosed accordingly to assure fAUC/MIC attainment above the minimum threshold. The probability of target attainment (PTA), which is the probability that the threshold value of a PD index is achieved at a certain MIC, and the probability of cure (POC) for a given antibiotic regimen are used to determine the efficacy of an antibiotic in Monte Carlo simulations.2
Related: Bacteremia From an Unlikely Source
A study by Zelenitsky and colleagues evaluated the efficacy of 3 ciprofloxacin dosing regimens using Monte Carlo simulations (400 mg IV every 12 hours [standard dose], 400 mg IV every 8 hours [high dose], and a PD-targeted regimen dosed to attain an fAUC/MIC value > 86).3 An fAUC/MIC value of 86 was previously determined to predict cure rates of at least 90%.4 The Clinical and Laboratory Standards Institute defines a P aeruginosa MIC of ≤ 1 μg/mL to be susceptible and an MIC of ≥ 4 μg/mL to be resistant to ciprofloxacin.5
The researchers determined PTA and POC values for each regimen based on various MICs. The in vitro laboratory simulations revealed the PTA and POC values approached 100% for all 3 regimens when the MIC was 0.125 μg/mL. However, when the MIC was 1 μg/mL, the PTA for the standard and high dose was 0%, and the PD-targeted regimen was 40%. The POC was 27%, 40%, and 72% for the standard dose, high dose, and the PD-targeted regimen, respectively. Although the PD-targeted regimen was the most efficacious, it took doses exceeding 1,300 mg and 1,800 mg daily to achieve similar results. In addition, PD-targeted regimens are not practical for dosing due to patient variability in CrCl. From these simulations, it was concluded that the high dose of ciprofloxacin 400 mg IV every 8 hours should be recommended for treating Pseudomonas infections in patients with normal renal function.
Related: Antimicrobial Stewardship in an Outpatient Parenteral Antibiotic Therapy Program
In another study by Lodise and colleagues, researchers examined the clinical implications of an extended-infusion dosing strategy for piperacillin-tazobactam in the critically ill.6 The 2 piperacillin- tazobactam regimens evaluated were 3.375 g IV over 30 minutes given every 4 or 6 hours and 3.375 g IV over 4 hours given every 8 hours. The 14-day mortality rate in critically ill patients who received the extended- and intermittent-infusion regimens was 12.2% and 31.6%, respectively (P = .04). Additionally, patients receiving the extended-infusion regimen had a decreased in-house length of stay compared with the intermittent-infusion group (21 vs 38 days, P = .02). Despite having a lower drug concentration peak, the extended-infusion regimen maintains steady drug concentrations above the MIC for a greater period, resulting in prolonged therapeutic efficacy. Other antibiotics (cefepime7 and ceftazidime8) have been studied by using the same methodology of comparing intermittent and extended infusions and have had similar results.
Given the management challenges associated with P aeruginosa infections, it is important for clinicians to recognize patients who may have or be at risk of infection with P aeruginosa and use appropriate dosing regimens to effectively manage infections and improve patient outcomes.
Additional Note
An earlier version of this article appeared in the Pharmacy Related Newsletter: The Capsule, of the William S. Middleton Memorial Veterans Hospital.
Author disclosures
The authors report no actual or potential conflicts of interest with regard to this article.
Disclaimer
The opinions expressed herein are those of the authors and do not necessarily reflect those of Federal Practitioner, Frontline Medical Communications Inc., the U.S. Government, or any of its agencies. This article may discuss unlabeled or investigational use of certain drugs. Please review complete prescribing information for specific drugs or drug combinations—including indications, contraindications, warnings, and adverse effects—before administering pharmacologic therapy to patients.
1. Murray PR, Pfaller MA, Rosenthal KS. Medical Microbiology. 7th ed. Philadelphia, PA: Elsevier; 2012.
2. Mouton JW, Dudley MN, Cars O, Derendorf H, Drusano GL. Standardization of pharmacokinetic/pharmacodynamic (PK/PD) terminology for anti-infective drugs: an update. J Antimicrob Chemother. 2005;55(5):601-607.
3. Zelenitsky S, Ariano R, Harding G, Forrest A. Evaluating ciprofloxacin dosing for Pseudomonas aeruginosa infection by using clinical outcome-based Monte Carlo simulations. Antimicrob Agents Chemother. 2005;49(10):4009-4014.
4. Zelenitsky SA, Harding GK, Sun S, Ubhi K, Ariano RE. Treatment and outcome of Pseudomonas aeruginosa bacteraemia: an antibiotic pharmacodynamic analysis. J Antimicrob Chemother. 2003;52(4):668-674.
5. Clinical and Laboratory Standards Institute. Performance Standards for Antimicrobial Susceptibility Testing; Twenty-Third Informational Supplement. CLSI document M100-S23. Wayne, PA: Clinical and Laboratory Standards Institute; 2013:63.
6. Lodise TP Jr, Lomaestro B, Drusano GL. Piperacillin-tazobactam for Pseudomonas aeruginosa infection: clinical implications of an extended-infusion dosing strategy. Clin Infect Dis. 2007;44(3):357-363.
7. Mouton JW, Den Hollander JG. Killing of Pseudomonas aeruginosa during continuous and intermittent infusion of ceftazidime in an in vitro pharmacokinetic model. Antimicrob Agents Chemother. 1994;38(5):931-936
8. Bauer KA, West JE, O’Brien JM, Goff DA. Extended-infusion cefepime reduces mortality in patients with Pseudomonas aeruginosa infections. Antimicrob Agents Chemother. 2013;57(7):2907-2912.
Pseudomonas is a genus of aerobic, Gram-negative bacilli consisting of about 200 species. Pseudomonas aeruginosa (P aeruginosa) is the species most commonly associated with serious hospital-acquired infections and is commonly found in moist environments in hospitals, such as sinks, showers, and machinery/equipment. The symptoms of an infection by this bacterium are variable based on the site of infection and can manifest in various sites, such as the respiratory tract, urinary tract, ears, eyes, heart, skin, and soft tissue.1 General risk factors for infection with P aeruginosa include immunosuppression, history of lung disease, hospitalization lasting at least 5 days, history of repeated antibiotic use within 90 days, and a history of pseudomonal colonization/infection.
Related: Antibiotic Therapy and Bacterial Resistance in Patients With Spinal Cord Injury
Pseudomonas aeruginosa is a challenging organism to manage, as it is inherently resistant to many antibiotics. Furthermore, antibiotics effective against infections caused by P aeruginosa often require specific regimens as a result of the high minimum inhibitory concentration (MIC) of the organism. Two specific strategies that have been analyzed for proper coverage of P aeruginosa include the use of higher than usual doses and extended infusions. Due to significant challenges associated with obtaining patient outcomes data in human clinical trials, researchers often use Monte Carlo simulations, which are computational algorithms that simulate the variables of a study (ie, patient demographics) to be as real as possible to accurately predict therapeutic responses in patients.
Analyzing pharmacokinetic (PK) and pharmacodynamic (PD) indexes is valuable for determining therapeutic efficacy, as these indexes consider both the antibiotic dose/concentration and its effect over time in relation to response to therapy. The free-drug area under the concentration time curve (fAUC/MIC) ratio is a PK/PD value commonly used to describe the free-drug concentration over 24 hours that is above the MIC.2 The fAUC is dependent on creatinine clearance (CrCl) and, therefore, is specific to each patient. A threshold value for the fAUC/MIC is determined for an antibiotic, and a therapeutic regimen is dosed accordingly to assure fAUC/MIC attainment above the minimum threshold. The probability of target attainment (PTA), which is the probability that the threshold value of a PD index is achieved at a certain MIC, and the probability of cure (POC) for a given antibiotic regimen are used to determine the efficacy of an antibiotic in Monte Carlo simulations.2
Related: Bacteremia From an Unlikely Source
A study by Zelenitsky and colleagues evaluated the efficacy of 3 ciprofloxacin dosing regimens using Monte Carlo simulations (400 mg IV every 12 hours [standard dose], 400 mg IV every 8 hours [high dose], and a PD-targeted regimen dosed to attain an fAUC/MIC value > 86).3 An fAUC/MIC value of 86 was previously determined to predict cure rates of at least 90%.4 The Clinical and Laboratory Standards Institute defines a P aeruginosa MIC of ≤ 1 μg/mL to be susceptible and an MIC of ≥ 4 μg/mL to be resistant to ciprofloxacin.5
The researchers determined PTA and POC values for each regimen based on various MICs. The in vitro laboratory simulations revealed the PTA and POC values approached 100% for all 3 regimens when the MIC was 0.125 μg/mL. However, when the MIC was 1 μg/mL, the PTA for the standard and high dose was 0%, and the PD-targeted regimen was 40%. The POC was 27%, 40%, and 72% for the standard dose, high dose, and the PD-targeted regimen, respectively. Although the PD-targeted regimen was the most efficacious, it took doses exceeding 1,300 mg and 1,800 mg daily to achieve similar results. In addition, PD-targeted regimens are not practical for dosing due to patient variability in CrCl. From these simulations, it was concluded that the high dose of ciprofloxacin 400 mg IV every 8 hours should be recommended for treating Pseudomonas infections in patients with normal renal function.
Related: Antimicrobial Stewardship in an Outpatient Parenteral Antibiotic Therapy Program
In another study by Lodise and colleagues, researchers examined the clinical implications of an extended-infusion dosing strategy for piperacillin-tazobactam in the critically ill.6 The 2 piperacillin- tazobactam regimens evaluated were 3.375 g IV over 30 minutes given every 4 or 6 hours and 3.375 g IV over 4 hours given every 8 hours. The 14-day mortality rate in critically ill patients who received the extended- and intermittent-infusion regimens was 12.2% and 31.6%, respectively (P = .04). Additionally, patients receiving the extended-infusion regimen had a decreased in-house length of stay compared with the intermittent-infusion group (21 vs 38 days, P = .02). Despite having a lower drug concentration peak, the extended-infusion regimen maintains steady drug concentrations above the MIC for a greater period, resulting in prolonged therapeutic efficacy. Other antibiotics (cefepime7 and ceftazidime8) have been studied by using the same methodology of comparing intermittent and extended infusions and have had similar results.
Given the management challenges associated with P aeruginosa infections, it is important for clinicians to recognize patients who may have or be at risk of infection with P aeruginosa and use appropriate dosing regimens to effectively manage infections and improve patient outcomes.
Additional Note
An earlier version of this article appeared in the Pharmacy Related Newsletter: The Capsule, of the William S. Middleton Memorial Veterans Hospital.
Author disclosures
The authors report no actual or potential conflicts of interest with regard to this article.
Disclaimer
The opinions expressed herein are those of the authors and do not necessarily reflect those of Federal Practitioner, Frontline Medical Communications Inc., the U.S. Government, or any of its agencies. This article may discuss unlabeled or investigational use of certain drugs. Please review complete prescribing information for specific drugs or drug combinations—including indications, contraindications, warnings, and adverse effects—before administering pharmacologic therapy to patients.
1. Murray PR, Pfaller MA, Rosenthal KS. Medical Microbiology. 7th ed. Philadelphia, PA: Elsevier; 2012.
2. Mouton JW, Dudley MN, Cars O, Derendorf H, Drusano GL. Standardization of pharmacokinetic/pharmacodynamic (PK/PD) terminology for anti-infective drugs: an update. J Antimicrob Chemother. 2005;55(5):601-607.
3. Zelenitsky S, Ariano R, Harding G, Forrest A. Evaluating ciprofloxacin dosing for Pseudomonas aeruginosa infection by using clinical outcome-based Monte Carlo simulations. Antimicrob Agents Chemother. 2005;49(10):4009-4014.
4. Zelenitsky SA, Harding GK, Sun S, Ubhi K, Ariano RE. Treatment and outcome of Pseudomonas aeruginosa bacteraemia: an antibiotic pharmacodynamic analysis. J Antimicrob Chemother. 2003;52(4):668-674.
5. Clinical and Laboratory Standards Institute. Performance Standards for Antimicrobial Susceptibility Testing; Twenty-Third Informational Supplement. CLSI document M100-S23. Wayne, PA: Clinical and Laboratory Standards Institute; 2013:63.
6. Lodise TP Jr, Lomaestro B, Drusano GL. Piperacillin-tazobactam for Pseudomonas aeruginosa infection: clinical implications of an extended-infusion dosing strategy. Clin Infect Dis. 2007;44(3):357-363.
7. Mouton JW, Den Hollander JG. Killing of Pseudomonas aeruginosa during continuous and intermittent infusion of ceftazidime in an in vitro pharmacokinetic model. Antimicrob Agents Chemother. 1994;38(5):931-936
8. Bauer KA, West JE, O’Brien JM, Goff DA. Extended-infusion cefepime reduces mortality in patients with Pseudomonas aeruginosa infections. Antimicrob Agents Chemother. 2013;57(7):2907-2912.
Testosterone Replacement Therapy: Playing Catch-up With Patients
The objective of this article is to help primary care providers (PCPs) council patients regarding testosterone replacement therapy (TRT). This case will present a patient who initiated TRT at a community-based alternative medicine clinic. The case will be followed by a discussion regarding the standard diagnosis of hypogonadism, the potential benefits and risks of TRT, and a review of the current clinical guideline recommendations. Examples of information being disseminated to the general public by the complementary and alternative medicine (CAM) providers will be briefly reviewed for an increased awareness of the questions patients may pose regarding TRT.
Background
From 2000 to 2011, total testosterone sales increased 12-fold globally.1 Possible causes for the increase involved the aging population, newer options for TRT administration, and increased direct-to-consumer advertising. A low testosterone level (sometimes referred to as low T in consumer marketing materials) is associated with a variety of medical conditions (ie, low mood, increased body fat, declining athletic performance, and decreased sexual performance) that have become increasingly prevalent among middle aged and older men.2 It has also received attention as an intervention to reverse frailty and sarcopenia.3
Testosterone replacement therapy options include injectable solutions, transdermal gels and patches, pellet implants, or buccal tablets. The ease of administration of transdermal testosterone comes at a relatively high cost. Injectable testosterone preparations are generally the least expensive option, and many patients choose injections for this reason.
Related: Keeping an Open Mind on HRT
Testosterone prescriptions were most frequently written by PCPs with 36% coming from family practitioners and 20.1% from internal medicine practices, according to a Kaiser Permanente study.4 Endocrinologists (13.5%) and urologists (6.6%) were less likely to have written the prescriptions for patients.
Due, in part, to direct-to-consumer advertising and to the availability of online medical information, many men now present to their PCP questioning whether they might have low T. Others may have already started therapy at a CAM, integrative medicine, or anti-aging clinic.
Confusing the issue further, some CAM providers promote a variety of off-label medications and nutritional supplements for the treatment of low T, which seems to have struck a chord in the baby boomer generation. No other age group in history has tried to work so intensely on its physical condition and appearance.5 Much of the information marketed to consumers emphasizes that many traditionally trained physicians are not educated in the treatment of low T.
Case Report
Mr. C. is a 65-year-old man who was seen in the primary care clinic for the first time. He was accompanied by his much younger fiancée. She reported that Mr. C.’s energy and sexual interest were declining, and the patient reported his “get up and go had gotten up and left.” They sought medical advice from a CAM provider who ordered blood work and then explained that the symptoms were due to low testosterone. For the past 6 months he had been visiting the clinic weekly for testosterone injections.
Mr. C. reported feeling as good as a “40 year old.” He also reported that he started working with a personal trainer and had given up most junk food and alcohol. He had no symptoms of chest pain, erectile dysfunction, or significant urinary urgency, frequency, or nocturia.
Related: Will Testosterone Therapy Kill Your Patient?
The visits to a CAM provider had been an out-of-pocket expense, and he was hoping to transfer his treatment to the VA so the costs could be covered. Mr. C. failed to bring medical records from the other provider but remembered being told that all his tests were “fine” except for the low testosterone level.
His past history was notable for controlled type 2 diabetes mellitus for 8 years, hypertension, hyperlipidemia, and spinal stenosis. He had no history of benign prostatic hyperplasia or prostate cancer.
In addition to the testosterone (100 mg intramuscular injection weekly), his medication regimen included metoprolol 25 mg twice daily, atorvastatin 20 mg daily, acetaminophen 650 mg 3 times daily as needed, aspirin 81 mg daily, metformin 500 mg twice daily, vitamin D 2,000 IU daily, vitamin B12 1,000 mg daily, and Co-Q10 200 mg daily.
On physical examination, Mr. C.’s vitals were stable and his body mass index was in the overweight range at 29.8 kg/m2. His cardiopulmonary examination was normal. There was increased central obesity without palpable organomegaly. There was no gynecomastia, and he had normal amounts of axillary and pubic hair. There was no peripheral edema; his genitourinary examination included normal-sized testicles, and the prostate was smooth without nodules.
The PCP informed Mr. C. that he was familiar with the evaluation and management of testosterone therapy. He was advised that additional evaluation would be needed before determining whether the clinical benefit of TRT outweighed the potential risks.
Andropause
Testosterone levels in men are known to decline at a rate of 1% per year after aged 30 years.6 About 20% of men aged ≥ 60 years and 50% of men aged ≥ 80 years have low (hypogonadal) total testosterone levels.7 The clinical diagnosis of hypogonadism, however, is made on the basis of signs and symptoms consistent with androgen deficiency and a low serum morning testosterone level measured on serum on multiple occasions.8
Specific clinical signs and symptoms (“A” list) consistent with androgen deficiency include low libido and sexual activity; diminished spontaneous erections; gynecomastia; reduced facial, axillary, or pubic hair; small (≤ 5 mL) testes; inability to father children; loss of height, fractures, or other signs of bone loss; and hot flashes and night sweats.9
Less specific signs and symptoms (“B” list) of androgen deficiency include a decrease in energy or motivation, feelings of sadness or depression, poor concentration or memory, trouble sleeping, increased sleepiness, mild anemia, reduced muscle bulk or strength, increased body fat, and diminished physical performance.9
Making the clinical diagnosis of hypogonadism is challenging, because the clinical symptoms have a high prevalence in the older male population and overlap with many nonendocrine diseases. Testosterone replacement therapy has been associated weakly, but consistently, with improved sexual function,10-12 bone mineral density,13,14 fat free mass,13,14 strength,15,16 lipid profiles,17,18 insulin resistance,17,18 and with an increased time to ST segment depression during stress testing.19,20
Laboratory Evaluation
Serum total testosterone circulates in 3 forms: free testosterone, sex hormone-binding globulin (SHBG)-bound testosterone, and albumin-bound testosterone. Free testosterone is the most bio-available testosterone but represents only 2% to 3% of total testosterone.21 Whether total testosterone or free testosterone measurements most closely correlate with symptomatic androgen deficiency is a matter of debate.21 A total testosterone level is an appropriate screening test in young, healthy, and lean men for whom SHBG levels are presumably normal. However, a free or bioavailable testosterone level should be considered for men when there is a high likelihood of conditions that can affect SHBG levels.
Conditions that can decrease SHBG (and may result in a low total testosterone reading even when the free fraction may be normal) include obesity, metabolic syndrome, type 2 diabetes mellitus, hypothyroidism, nephrotic syndrome, chronic glucocorticoid use, and the use of progestins and anabolic steroids.21 Conditions that can increase SHBG (and may result in a normal total testosterone level in patients with hypogonadism, as they have low levels of free testosterone) include aging, cirrhosis, anticonvulsant use, hyperthyroidism, catabolic conditions, and HIV.21
Related: Effect of Statins on Total Testosterone Levels in Male Veterans
Serum testosterone levels generally peak in the early morning, followed by a progressive decline over the course of the day until they reach a nadir in the evening.21 Although it has been debated that morning testosterone levels are not necessary in older men due to a blunting of the circadian rhythm, many men aged 65 to 80 years who have low T in the afternoon will have normal testosterone levels when retested in the morning.22,23 Readings below a reference range of 280 ng/dL to 300 ng/dL on at least 2 different occasions support a diagnosis of hypogonadism.9
Follicle stimulating hormone (FSH) and luteinizing hormone (LH) laboratory tests may be ordered following confirmation of a low testosterone level. Prolactin levels and iron saturation can help evaluate for the presence of hyperprolactinemia and hemochromatosis, respectively. Primary hypogonadism due to testicular failure is diagnosed with high FSH, high LH, and low testosterone levels. Secondary hypogonadism due to hypothalamic or pituitary failure is diagnosed with low FSH, low LH, and low testosterone levels.
Hypothalamic or pituitary suppression from a nonendocrine condition may result in functional hypogonadotropic hypogonadism (FHH), which can be identified with low (or normal) FSH; low (or normal) LH; and low testosterone levels. Hypogonadotropic hypogonadism has been associated with depression, obesity, stress, and physical exertion; and FHH may also be associated with the use of multiple drugs and drug classes (spironolactone, anabolic and corticosteroids, ketoconazole, ethanol, anticonvulsants, immunosuppressants, tricyclic antidepressants, selective serotonin reuptake inhibitors, antipsychotics, and opioids).24,25 Even statin therapy has been associated with FHH.26,27 Testosterone levels will often recover if or when modifiable factors for FHH are corrected.28
Although there is no consensus on an absolute number that defines a low testosterone level, concern exists that there are economic incentives to raise the bar for normal and thereby increase the potential market for testosterone-raising products.29 Many commercial avenues for the treatment of low T do not follow the standards of the established medical community. Some websites suggest screening for low T with total and free testosterone levels for all men aged > 40 years. Others advise men to consider TRT if they have a total testosterone level of < 500 ng/dL or a free testosterone level that is not in the upper one-third range for men aged 21 to 49 years.30 Of even greater concern, Baillargeon and colleagues reported that 25% of all new androgen users had not had their testosterone levels measured in the 12 months before starting treatment.31 In another study, 40% of men who initiated TRT did not have a baseline measurement.32
Treatments
Before considering TRT, physicians need to emphasize lifestyle modifications as first-line treatment for hypogonadism. The most important modifications include weight loss, tobacco cessation, and moderation in alcohol use.
Patients need to be advised of possible adverse events (AEs) of TRT, which may include gynecomastia, polycythemia, sleep apnea, decreased high-density lipoprotein cholesterol, benign prostatic hypertrophy, infertility, testicular atrophy, and abnormal liver function tests. More recently, several studies have shown an association between TRT and an increase in cardiovascular complications, such as stroke, heart attacks, and death.
Prior to considering TRT, a careful history and physical examination, including a clinical prostate examination, should be performed. Minimum additional tests should include hematocrit, fasting lipid profile (FLP), complete metabolic profile (CMP), and prostate-specific antigen (PSA). Initiation of TRT is not recommended for patients with metastatic prostate cancer; breast cancer; an unevaluated prostate nodule; a PSA > 4 ng/mL (or > 3 ng/mL in African Americans or men with a first-degree relative with prostate cancer); hematocrit > 50%; untreated severe obstructive sleep apnea; uncontrolled or poorly controlled congestive heart failure; or an International Prostate Symptoms Score (IPSS) > 19.9
A past history of prostate cancer had previously been a contraindication for the use of TRT. However, more recent studies have shown that TRT can be used in those who have no evidence of active or metastatic disease and who are under the close supervision of a physician.33-35
Widespread screening is not recommended, and population-based surveys can be unreliable. Fifteen percent of healthy young men, for example, will have a low serum testosterone level in a given 24-hour period.9 Thirty percent of men with an initial testosterone level in the mildly hypogonadal range will have a normal testosterone level when retested; moreover the threshold below which AEs occur remains unknown.9
The goal of TRT is to achieve a total testosterone level in the 400 ng/mL to 700 ng/mL range with improved clinical signs and symptoms.9 Laboratory tests should be conducted at 3 months, 6 months, and then annually. These tests include hematocrit, PSA, and a testosterone level.32 Testing for CMP and FLP should also be considered. If, during therapy, the hematocrit is > 54%, the patient should be assessed for hypoxia and sleep apnea, and treatment should resume at a lower dose only when the hematocrit returns to baseline.9 A digital examination of the prostate is recommended for men with a PSA of > 0.6 ng/mL. A urologic consultation should be obtained for an increase in the PSA of > 1.4 ng/mL over 12 months, a PSA velocity of > 0.4 ng/mL per year (using the PSA after 6 months as a reference), or for an IPPS of > 19.9
Emerging Cardiovascular Concerns
The Testosterone for Older Men study, a randomized, placebo- controlled clinical trial of testosterone therapy in men with a high prevalence of cardiovascular disease, showed significantly greater improvements in leg-press, chest-press, and stair-climbing exercises while carrying a load compared with that in the placebo group.36 However, the study was stopped early due to an increased risk of cardiovascular AEs in those who received testosterone gel.
Vigen and colleagues examined a cohort of veterans who underwent coronary angiography and had a low serum testosterone level.37 The use of TRT in this cohort was also associated with an increased risk of adverse cardiovascular outcomes. This study generated several letters and a recent article in response that vigorously questioned the validity of the methods used and the conclusions reached.38-44 Prior clinical studies of TRT had not detected cardiac AEs, but these trials were generally of short duration and not powered for clinical endpoints.37
A FDA Safety Announcement as well as a VA National Pharmacy Benefits Management bulletin were based on the results of these studies.45 The FDA did not conclude that TRT increased the risk of stroke, heart attack, or death, but health care providers were asked to consider whether the benefits of TRT are likely to exceed the potential risk of treatment.
Direct-to-Consumer Marketing
Some direct-to-consumer marketing promotes the use of aromatase inhibitors, such as anastrozole. This class of medications prevents the conversion of endogenous and exogenous testosterone to estrogen by the aromatase enzyme, which is found predominately in abdominal adipose tissue. There is no evidence that naturally occurring elevations in estrogen cause low testosterone or that treatment of elevated estrogen with an aromatase inhibitor during TRT has any significant clinical benefit in terms of male sexuality.46 Nevertheless, some CAM providers now hypothesize that the increase in cardiovascular AEs with TRT noted in the recent studies may have been due to the increase in estrogen that is associated with TRT.46
The off-label use of clomiphene citrate to block the negative feedback of estrogen on the production of LH has been promoted as another potential treatment to increase testosterone levels. Luteinizing hormone is the pituitary analog of human chorionic gonadotropin (HCG). Many CAM providers also prescribe HCG to increase the testicles’ testosterone production.
Some consumer-focused media insist that the use of either clomiphene citrate or HCG will increase testosterone production and does not cause testicular atrophy, a known TRT- associated AE. This seems to increase the motivation of many men to try these off-label medications.
Some sources even posit a “conspiracy theory” that the FDA and pharmaceutical companies conspire to keep the price of transdermal TRT options high. Men are told that testosterone creams made at compounding pharmacies are much less expensive than are the transdermal pharmaceuticals, and they are urged to see a CAM provider to obtain a prescription for the compounded testosterone. In some cases, a sample prescription is included.47
Many supplements are available that claim to boost testosterone or suppress estrogen. Chrysin, for example, is a bioflavonoid that is marketed as having the potential to act as a natural aromatase inhibitor. Although studies have suggested the potential for chrysin to work in such a manner, the effectiveness may be attenuated by its low bioavailability in supplements.48 Long-term studies have not been conducted.49 Nettle root is a plant-derived compound that is stated to increase free testosterone levels by binding to SHBG, in place of testosterone, and by inhibiting the enzyme that converts testosterone to dihydrotestosterone. The clinical evidence of effectiveness is based on many open studies, and the significance and magnitude of the effect still needs more rigorous evaluation.50
Conclusions
Patients today are barraged with medical information through television, print advertising, radio, and the Internet. A recent study of online sources of herbal product information found that only 10.5% recommended a consultation with a health care professional and < 3% cited scientific literature to accompany their claims.51 Many patients present to their PCP with questions about TRT or have already started an intervention for low T. Complementary and alternative medicine providers of TRT have been able to capture a segment of the population that often has the motivation and disposable income to pursue nontraditional therapies.
All nutritional supplements contain a standard warning from the FDA: “The above statements have not been evaluated by the FDA. This product is not intended to diagnose, treat, cure or prevent any disease.” Providers should remind patients of the statement and point out the contradictions between the statement and the benefits touted by the supplement marketing literature.
Finally, despite the well- established role of testosterone in enhancing libido, its definitive role in erectile function had been controversial until evidence substantiated a key function for this hormone.52 Testosterone may facilitate erection by acting as a vasodilator of the penile arterioles and cavernous sinusoids and may ameliorate the response to the phosphodiesterase-5 inhibitors in hypogonadal men.53 Testosterone replacement alone in hypogonadal men can restore erectile dysfunction.51 However, hypogonadism is not a common finding in those with erectile dysfunction, only occurring in about 5% of cases.53
Allopathic providers are concerned about the vitality and sexual health of their aging male patients, but their enthusiasm for anti-aging treatments is often tempered by evidence-based studies that have shown a lack of efficacy or potentially serious health care risks. Unfortunately, many patients remain unaware of the controversies regarding TRT. For those patients who receive treatment through CAM providers and are convinced of the efficacy of their low-T treatment regimen, it is important to keep lines of communication open.
Author disclosures
The authors report no actual or potential conflicts of interest with regard to this article.
Disclaimer
The opinions expressed herein are those of the authors and do not necessarily reflect those of Federal Practitioner, Frontline Medical Communications Inc., the U.S. Government, or any of its agencies. This article may discuss unlabeled or investigational use of certain drugs. Please review complete prescribing information for specific drugs or drug combinations—including indications, contraindications, warnings, and adverse effects—before administering pharmacologic therapy to patients.
1. Handelsman D. Global trends in testosterone prescribing, 2000-2011: expanding the spectrum of prescription drug misuse. Med J Aust. 2013;199(8):548-551.
2. Hackett G. Testosterone and the heart. Int J Clin Pract. 2012;66(7):648-655.
3. Morley JE. Hypogonadism, testosterone, and nursing home residents. J Am Med Dir Assoc. 2013;14(6):381-383.
4. An J, Cheetham TC, Van Den Eeden S. PS3-36: testosterone replacement therapy patterns for aging males in a managed care setting. Clin Med Res. 2013;11(3):141.
5. Moschis G, Lee E, Marthur A, Strautman J. The Maturing Marketplace: Buying Habits of Baby Boomers and Their Parents. Westport, CT: Quorum Books; 2000.
6. Morley JE, Kaiser FE, Perry HM 3rd, et al. Longitudinal changes in testosterone, luteinizing hormone, and follicle stimulating hormone in healthy older men. Metabolism. 1997;46(4):410-413.
7. Harman SM, Metter EJ, Tobin JD, Pearson J, Blackman MR; Baltimore Longitudinal Study of Aging. Longitudinal effects of aging on serum total and free testosterone levels in healthy men. Baltimore Longitudinal Study of Aging. J Clin Endocrinol Metab. 2001;86(2):724-731.
8. Basaria S. Male hypogonadism. Lancet. 2014;383 (9924):1250-1263.
9. Bhasin S, Cunningham GR, Hayes FJ, et al; Task Force, Endocrine Society. Testosterone therapy in men with androgen deficiency syndromes. J Clin Endocrinol Metab. 2010;95(6):2536-2559.
10. Wang C, Swerdloff RS, Iranmanesh A, et al. Transdermal testosterone gel improves sexual function, mood, muscle strength, and body composition parameters in hypogonadal men. J Clin Endocrinol Metab. 2000;85(8):2839-2853.
11. Bolona ER, Uranga MV, Haddad RM, et al. Testosterone use in men with sexual dysfunction: a systematic review and meta-analysis of randomized placebo-controlled trials. Mayo Clin Proc. 2007;82(1):20-28.
12. Isidori AM, Giannetta E, Gianfrilli D, et al. Effects of testosterone on sexual function in men: results of a meta-analysis. Clin Endocrinol (Oxf). 2005;63(4):381-394.
13. Isidori AM, Giannetta E, Greco EA, et al. Effects of testosterone on body composition, bone metabolism and serum lipid profile in middle-aged men: a meta-analysis. Clin Endocrinol (Oxf). 2005;63(3):280-293.
14. Snyder PJ, Peachey H, Berlin JA, et al. Effects of testosterone replacement in hypogonadal men. J Clin Endocrinol Metab. 2000;85(8):2670-2677.
15. Sih R, Morley JE, Kaiser FE, Perry HM 3rd, Patrick P, Ross C. Testosterone replacement in older hypogonadal men: a 12-month randomized controlled trial. J Clin Endocrinol Metab. 1997;82(6):1661-1667.
16. Travison TG, Basaria S, Storer TW, et al. Clinical meaningfulness of the changes in muscle performance and physical function associated with testosterone administration in older men with mobility limitation. J Gerontol A Biol Sci Med Sci. 2011;66(10):1090-1099.
17. Jones TH, Arver S, Behre HM, et al; TIMES2 Investigators. Testosterone replacement in hypogonadal men with type 2 diabetes and/or metabolic syndrome. Diabetes Care. 2011;34(4):828-837.
18. Jones TH, Saad F. The effects of testosterone on risk factors for, and the mediators of, the atherosclerotic process. Atherosclerosis. 2009;207(2):318-327.
19. Mathur A, Malkin C, Saeed B, Muthusamy R, Jones TH, Channer K. Long-term benefits of testosterone replacement therapy on angina threshold and atheroma in men. Eur J Endocrinol. 2009;161(3):443-449.
20. Malkin CJ, Pugh PJ, Morris PD, et al. Testosterone replacement in hypogonadal men with angina improves ischaemic threshold and quality of life. Heart. 2004;90(8):871-876.
21. Paduch DA, Brannigan RE, Fuchs EF, Kim ED, Marmar JL, Sandlow JI. White Paper: The Laboratory Diagnosis of Testosterone Deficiency. http://www.auanet.org/common/pdf/education/clinical -guidance/Testosterone-Deficiency-WhitePaper.pdf. Published 2013. Accessed April 9, 2015.
22. Crawford ED, Barqawi AB, O’Donnell C, Morgentaler A. The association of time of day and serum testosterone concentration in a large screening population. BJU Int. 2007;100(3):509-513.
23. Brambilla DJ, O’Donnell AB, Matsumoto AM, McKinlay JB. Intraindividual variation in levels of serum testosterone and other reproductive and adrenal hormones in men. Clin Endocrinol (Oxf). 2007;67(6):853-862.
24. Kumar P, Kumar N, Thakur DS, Patidar A. Male hypogonadism: symptoms and treatment. J Adv Pharm Technol Res. 2010;1(3):297-301.
25. Montgomery K. Sexual desire disorders. Psychiatry (Edgmont). 2008;5(6):50-55.
26. Corona G, Boddi V, Balercia G, et al. The effect of statin therapy on testosterone levels in subjects consulting for erectile dysfunction. J Sex Med. 2010; 7(4 pt 1):1547-1556.
27. Schooling CM, Yeung SLA, Freeman G, Cowling BJ. The effect of statins on testosterone in men and women, a systematic review and meta-analysis of randomized controlled trials. BMC Med. 2013;11:57.
28. Wu FC, Tajar A, Pye SR, et al; European Male Aging Study Group. Hypothalamic-pituitary-testicular axis disruptions in older men are differentially linked to age and modifiable risk factors: the European Male Aging Study. J Clin Endocrinol Metab. 2008;93(7):2737-2745.
29. Schwartz LM, Woloshin S. Low “T” as in “template”: how to sell disease. JAMA Intern Med. 2013;173(15):1460-1462.
30. Male Hormone Modulation Therapy, Part 2. Life Extension Vitamins Website. http://www.lifeextension vitamins.com/mahomothpa2.html. Accessed April 9, 2015.
31. Baillargeon J, Urban RJ, Ottenbacher KJ, Pierson KS, Goodwin JS. Trends in androgen prescribing in the United States, 2001 to 2011. JAMA Intern Med. 2013;173(15):1465-1466.
32. Layton JB, Li D, Meier CR, et al. Testosterone lab testing and initiation in the United Kingdom and the United States, 2000 to 2011. J Clin Endocrinol Metab. 2014;99(3):835-842.
33. Ramasamy R, Fisher ES, Schlegel PN. Testosterone replacement and prostate cancer. Indian J Urol. 2012;28(2):123-128.
34. Marks, LS, Mazer NA, Mostaghel E, et al. Effect of testosterone replacement therapy on prostate tissue in men with late-onset hypogonadism: a randomized controlled trial. JAMA. 2006;296(19):2351-2361.
35. Coward RM, Simhan J, Carson CC 3rd. Prostate-specific antigen changes and prostate cancer in hypogonadal men treated with testosterone replacement therapy. BJU Int. 2009;103(9):1179-1183.
36. Basaria S, Coviello AD, Travison TG, et al. Adverse events associated with testosterone administration. N Engl J Med. 2010;363(2):109-122.
37. Vigen R, O’Donnell Cl, Barón AE, et al. Association of testosterone therapy with mortality, myocardial infarction, and stroke in men with low testosterone levels. JAMA. 2013;310(17):1829-1836.
38. Morgentaler A, Traish A, Kacker R. Deaths and cardiovascular events in men receiving testosterone. JAMA. 2014;311(9):961-962.
39. Jones TH, Channer K. Deaths and cardiovascular events in men receiving testosterone. JAMA. 2014;311(9):962-963.
40. Katz J, Nadelberg R. Deaths and cardiovascular events in men receiving testosterone. JAMA. 2014;311(9):963.
41. Riche D, Baker WL, Koch CA. Deaths and cardiovascular events in men receiving testosterone. JAMA. 2014;311(9):963-964.
42. Dhindsa S, Batra M, Dandona P. Deaths and cardiovascular events in men receiving testosterone. JAMA. 2014;311(9):964.
43. Ho PM, Barón AE, Wierman M. Deaths and cardiovascular events in men receiving testosterone—reply. JAMA. 2014;311(9):964-965.
44. Traish AM, Guay AT, Morgentaler A. Death by testosterone? We think not! J Sex Med. 2014;11(3):624-629.
45. U.S. Department of Veterans Affairs, Veterans Health Administration (VHA), Pharmacy Benefit Management Services (PBM), Medical Advisory Panel (MAP), and Center for Medication Safety (VA Medsafe. National PBM Bulletin. Testosterone products and cardiovascular safety. http://www.pbm.va.gov/PBM/vacenterformedicationsafety/nationalpbmbulletin/Testosterone_Products_and_Cardiovascular_Safety_NATIONAL_PBM_BULLETIN_02.pdf. Published February 7, 2014. Accessed April 9, 2015.
46. Kacker R, Traish AM, Morgentaler A. Estrogens in men: clinical implications for sexual function and treatment of testosterone deficiency. J Sex Med. 2012;9(6):1681-1696.
47. Faloon W. Vindication. Life Extension Magazine Website. http://www.lef.org/magazine /mag2008/dec2008_Harvard-Experts-Recommend -Testosterone-Replacement_02.htm. Published December 2008. Accessed April 9,2015.
48. Walle T, Otake Y, Brubaker JA, Walle UK, Halushka PV. Disposition and metabolism of the flavonoid chrysin in normal volunteers. Br J Clin Pharmacol. 2001;51(2):143-146.
49. Jana K, Yin X, Schiffer, et al. Chrysin, a natural flavonoid enhances steroidogenesis and steroidogenic acute regulatory protein gene expression in mouse Leydig cells. J Endocrinol. 2008;197(2):315-323.
50. Chrubasik JE, Roufogalis BD, Wagner H, Chrubasik S. A comprehensive review on the stinging nettle effect and efficacy profiles. Part II: urticae radix. Phytomedicine. 2007;14(7-8):568-579.
51. Owens C, Baergen R, Puckett D. Online sources of herbal product information. Am J Med. 2014;127(2):109-115.
52. Blute W, Hakimian P, Kashanian J, Shteynshluyger A, Lee M, Shabsigh R. Erectile dysfunction and testosterone deficiency. Front Horm Res. 2009;37:108-122.
53. Mikhail N. Does testosterone have a role in erectile dysfunction? Am J Med. 2006;119(5):373-382.
The objective of this article is to help primary care providers (PCPs) council patients regarding testosterone replacement therapy (TRT). This case will present a patient who initiated TRT at a community-based alternative medicine clinic. The case will be followed by a discussion regarding the standard diagnosis of hypogonadism, the potential benefits and risks of TRT, and a review of the current clinical guideline recommendations. Examples of information being disseminated to the general public by the complementary and alternative medicine (CAM) providers will be briefly reviewed for an increased awareness of the questions patients may pose regarding TRT.
Background
From 2000 to 2011, total testosterone sales increased 12-fold globally.1 Possible causes for the increase involved the aging population, newer options for TRT administration, and increased direct-to-consumer advertising. A low testosterone level (sometimes referred to as low T in consumer marketing materials) is associated with a variety of medical conditions (ie, low mood, increased body fat, declining athletic performance, and decreased sexual performance) that have become increasingly prevalent among middle aged and older men.2 It has also received attention as an intervention to reverse frailty and sarcopenia.3
Testosterone replacement therapy options include injectable solutions, transdermal gels and patches, pellet implants, or buccal tablets. The ease of administration of transdermal testosterone comes at a relatively high cost. Injectable testosterone preparations are generally the least expensive option, and many patients choose injections for this reason.
Related: Keeping an Open Mind on HRT
Testosterone prescriptions were most frequently written by PCPs with 36% coming from family practitioners and 20.1% from internal medicine practices, according to a Kaiser Permanente study.4 Endocrinologists (13.5%) and urologists (6.6%) were less likely to have written the prescriptions for patients.
Due, in part, to direct-to-consumer advertising and to the availability of online medical information, many men now present to their PCP questioning whether they might have low T. Others may have already started therapy at a CAM, integrative medicine, or anti-aging clinic.
Confusing the issue further, some CAM providers promote a variety of off-label medications and nutritional supplements for the treatment of low T, which seems to have struck a chord in the baby boomer generation. No other age group in history has tried to work so intensely on its physical condition and appearance.5 Much of the information marketed to consumers emphasizes that many traditionally trained physicians are not educated in the treatment of low T.
Case Report
Mr. C. is a 65-year-old man who was seen in the primary care clinic for the first time. He was accompanied by his much younger fiancée. She reported that Mr. C.’s energy and sexual interest were declining, and the patient reported his “get up and go had gotten up and left.” They sought medical advice from a CAM provider who ordered blood work and then explained that the symptoms were due to low testosterone. For the past 6 months he had been visiting the clinic weekly for testosterone injections.
Mr. C. reported feeling as good as a “40 year old.” He also reported that he started working with a personal trainer and had given up most junk food and alcohol. He had no symptoms of chest pain, erectile dysfunction, or significant urinary urgency, frequency, or nocturia.
Related: Will Testosterone Therapy Kill Your Patient?
The visits to a CAM provider had been an out-of-pocket expense, and he was hoping to transfer his treatment to the VA so the costs could be covered. Mr. C. failed to bring medical records from the other provider but remembered being told that all his tests were “fine” except for the low testosterone level.
His past history was notable for controlled type 2 diabetes mellitus for 8 years, hypertension, hyperlipidemia, and spinal stenosis. He had no history of benign prostatic hyperplasia or prostate cancer.
In addition to the testosterone (100 mg intramuscular injection weekly), his medication regimen included metoprolol 25 mg twice daily, atorvastatin 20 mg daily, acetaminophen 650 mg 3 times daily as needed, aspirin 81 mg daily, metformin 500 mg twice daily, vitamin D 2,000 IU daily, vitamin B12 1,000 mg daily, and Co-Q10 200 mg daily.
On physical examination, Mr. C.’s vitals were stable and his body mass index was in the overweight range at 29.8 kg/m2. His cardiopulmonary examination was normal. There was increased central obesity without palpable organomegaly. There was no gynecomastia, and he had normal amounts of axillary and pubic hair. There was no peripheral edema; his genitourinary examination included normal-sized testicles, and the prostate was smooth without nodules.
The PCP informed Mr. C. that he was familiar with the evaluation and management of testosterone therapy. He was advised that additional evaluation would be needed before determining whether the clinical benefit of TRT outweighed the potential risks.
Andropause
Testosterone levels in men are known to decline at a rate of 1% per year after aged 30 years.6 About 20% of men aged ≥ 60 years and 50% of men aged ≥ 80 years have low (hypogonadal) total testosterone levels.7 The clinical diagnosis of hypogonadism, however, is made on the basis of signs and symptoms consistent with androgen deficiency and a low serum morning testosterone level measured on serum on multiple occasions.8
Specific clinical signs and symptoms (“A” list) consistent with androgen deficiency include low libido and sexual activity; diminished spontaneous erections; gynecomastia; reduced facial, axillary, or pubic hair; small (≤ 5 mL) testes; inability to father children; loss of height, fractures, or other signs of bone loss; and hot flashes and night sweats.9
Less specific signs and symptoms (“B” list) of androgen deficiency include a decrease in energy or motivation, feelings of sadness or depression, poor concentration or memory, trouble sleeping, increased sleepiness, mild anemia, reduced muscle bulk or strength, increased body fat, and diminished physical performance.9
Making the clinical diagnosis of hypogonadism is challenging, because the clinical symptoms have a high prevalence in the older male population and overlap with many nonendocrine diseases. Testosterone replacement therapy has been associated weakly, but consistently, with improved sexual function,10-12 bone mineral density,13,14 fat free mass,13,14 strength,15,16 lipid profiles,17,18 insulin resistance,17,18 and with an increased time to ST segment depression during stress testing.19,20
Laboratory Evaluation
Serum total testosterone circulates in 3 forms: free testosterone, sex hormone-binding globulin (SHBG)-bound testosterone, and albumin-bound testosterone. Free testosterone is the most bio-available testosterone but represents only 2% to 3% of total testosterone.21 Whether total testosterone or free testosterone measurements most closely correlate with symptomatic androgen deficiency is a matter of debate.21 A total testosterone level is an appropriate screening test in young, healthy, and lean men for whom SHBG levels are presumably normal. However, a free or bioavailable testosterone level should be considered for men when there is a high likelihood of conditions that can affect SHBG levels.
Conditions that can decrease SHBG (and may result in a low total testosterone reading even when the free fraction may be normal) include obesity, metabolic syndrome, type 2 diabetes mellitus, hypothyroidism, nephrotic syndrome, chronic glucocorticoid use, and the use of progestins and anabolic steroids.21 Conditions that can increase SHBG (and may result in a normal total testosterone level in patients with hypogonadism, as they have low levels of free testosterone) include aging, cirrhosis, anticonvulsant use, hyperthyroidism, catabolic conditions, and HIV.21
Related: Effect of Statins on Total Testosterone Levels in Male Veterans
Serum testosterone levels generally peak in the early morning, followed by a progressive decline over the course of the day until they reach a nadir in the evening.21 Although it has been debated that morning testosterone levels are not necessary in older men due to a blunting of the circadian rhythm, many men aged 65 to 80 years who have low T in the afternoon will have normal testosterone levels when retested in the morning.22,23 Readings below a reference range of 280 ng/dL to 300 ng/dL on at least 2 different occasions support a diagnosis of hypogonadism.9
Follicle stimulating hormone (FSH) and luteinizing hormone (LH) laboratory tests may be ordered following confirmation of a low testosterone level. Prolactin levels and iron saturation can help evaluate for the presence of hyperprolactinemia and hemochromatosis, respectively. Primary hypogonadism due to testicular failure is diagnosed with high FSH, high LH, and low testosterone levels. Secondary hypogonadism due to hypothalamic or pituitary failure is diagnosed with low FSH, low LH, and low testosterone levels.
Hypothalamic or pituitary suppression from a nonendocrine condition may result in functional hypogonadotropic hypogonadism (FHH), which can be identified with low (or normal) FSH; low (or normal) LH; and low testosterone levels. Hypogonadotropic hypogonadism has been associated with depression, obesity, stress, and physical exertion; and FHH may also be associated with the use of multiple drugs and drug classes (spironolactone, anabolic and corticosteroids, ketoconazole, ethanol, anticonvulsants, immunosuppressants, tricyclic antidepressants, selective serotonin reuptake inhibitors, antipsychotics, and opioids).24,25 Even statin therapy has been associated with FHH.26,27 Testosterone levels will often recover if or when modifiable factors for FHH are corrected.28
Although there is no consensus on an absolute number that defines a low testosterone level, concern exists that there are economic incentives to raise the bar for normal and thereby increase the potential market for testosterone-raising products.29 Many commercial avenues for the treatment of low T do not follow the standards of the established medical community. Some websites suggest screening for low T with total and free testosterone levels for all men aged > 40 years. Others advise men to consider TRT if they have a total testosterone level of < 500 ng/dL or a free testosterone level that is not in the upper one-third range for men aged 21 to 49 years.30 Of even greater concern, Baillargeon and colleagues reported that 25% of all new androgen users had not had their testosterone levels measured in the 12 months before starting treatment.31 In another study, 40% of men who initiated TRT did not have a baseline measurement.32
Treatments
Before considering TRT, physicians need to emphasize lifestyle modifications as first-line treatment for hypogonadism. The most important modifications include weight loss, tobacco cessation, and moderation in alcohol use.
Patients need to be advised of possible adverse events (AEs) of TRT, which may include gynecomastia, polycythemia, sleep apnea, decreased high-density lipoprotein cholesterol, benign prostatic hypertrophy, infertility, testicular atrophy, and abnormal liver function tests. More recently, several studies have shown an association between TRT and an increase in cardiovascular complications, such as stroke, heart attacks, and death.
Prior to considering TRT, a careful history and physical examination, including a clinical prostate examination, should be performed. Minimum additional tests should include hematocrit, fasting lipid profile (FLP), complete metabolic profile (CMP), and prostate-specific antigen (PSA). Initiation of TRT is not recommended for patients with metastatic prostate cancer; breast cancer; an unevaluated prostate nodule; a PSA > 4 ng/mL (or > 3 ng/mL in African Americans or men with a first-degree relative with prostate cancer); hematocrit > 50%; untreated severe obstructive sleep apnea; uncontrolled or poorly controlled congestive heart failure; or an International Prostate Symptoms Score (IPSS) > 19.9
A past history of prostate cancer had previously been a contraindication for the use of TRT. However, more recent studies have shown that TRT can be used in those who have no evidence of active or metastatic disease and who are under the close supervision of a physician.33-35
Widespread screening is not recommended, and population-based surveys can be unreliable. Fifteen percent of healthy young men, for example, will have a low serum testosterone level in a given 24-hour period.9 Thirty percent of men with an initial testosterone level in the mildly hypogonadal range will have a normal testosterone level when retested; moreover the threshold below which AEs occur remains unknown.9
The goal of TRT is to achieve a total testosterone level in the 400 ng/mL to 700 ng/mL range with improved clinical signs and symptoms.9 Laboratory tests should be conducted at 3 months, 6 months, and then annually. These tests include hematocrit, PSA, and a testosterone level.32 Testing for CMP and FLP should also be considered. If, during therapy, the hematocrit is > 54%, the patient should be assessed for hypoxia and sleep apnea, and treatment should resume at a lower dose only when the hematocrit returns to baseline.9 A digital examination of the prostate is recommended for men with a PSA of > 0.6 ng/mL. A urologic consultation should be obtained for an increase in the PSA of > 1.4 ng/mL over 12 months, a PSA velocity of > 0.4 ng/mL per year (using the PSA after 6 months as a reference), or for an IPPS of > 19.9
Emerging Cardiovascular Concerns
The Testosterone for Older Men study, a randomized, placebo- controlled clinical trial of testosterone therapy in men with a high prevalence of cardiovascular disease, showed significantly greater improvements in leg-press, chest-press, and stair-climbing exercises while carrying a load compared with that in the placebo group.36 However, the study was stopped early due to an increased risk of cardiovascular AEs in those who received testosterone gel.
Vigen and colleagues examined a cohort of veterans who underwent coronary angiography and had a low serum testosterone level.37 The use of TRT in this cohort was also associated with an increased risk of adverse cardiovascular outcomes. This study generated several letters and a recent article in response that vigorously questioned the validity of the methods used and the conclusions reached.38-44 Prior clinical studies of TRT had not detected cardiac AEs, but these trials were generally of short duration and not powered for clinical endpoints.37
A FDA Safety Announcement as well as a VA National Pharmacy Benefits Management bulletin were based on the results of these studies.45 The FDA did not conclude that TRT increased the risk of stroke, heart attack, or death, but health care providers were asked to consider whether the benefits of TRT are likely to exceed the potential risk of treatment.
Direct-to-Consumer Marketing
Some direct-to-consumer marketing promotes the use of aromatase inhibitors, such as anastrozole. This class of medications prevents the conversion of endogenous and exogenous testosterone to estrogen by the aromatase enzyme, which is found predominately in abdominal adipose tissue. There is no evidence that naturally occurring elevations in estrogen cause low testosterone or that treatment of elevated estrogen with an aromatase inhibitor during TRT has any significant clinical benefit in terms of male sexuality.46 Nevertheless, some CAM providers now hypothesize that the increase in cardiovascular AEs with TRT noted in the recent studies may have been due to the increase in estrogen that is associated with TRT.46
The off-label use of clomiphene citrate to block the negative feedback of estrogen on the production of LH has been promoted as another potential treatment to increase testosterone levels. Luteinizing hormone is the pituitary analog of human chorionic gonadotropin (HCG). Many CAM providers also prescribe HCG to increase the testicles’ testosterone production.
Some consumer-focused media insist that the use of either clomiphene citrate or HCG will increase testosterone production and does not cause testicular atrophy, a known TRT- associated AE. This seems to increase the motivation of many men to try these off-label medications.
Some sources even posit a “conspiracy theory” that the FDA and pharmaceutical companies conspire to keep the price of transdermal TRT options high. Men are told that testosterone creams made at compounding pharmacies are much less expensive than are the transdermal pharmaceuticals, and they are urged to see a CAM provider to obtain a prescription for the compounded testosterone. In some cases, a sample prescription is included.47
Many supplements are available that claim to boost testosterone or suppress estrogen. Chrysin, for example, is a bioflavonoid that is marketed as having the potential to act as a natural aromatase inhibitor. Although studies have suggested the potential for chrysin to work in such a manner, the effectiveness may be attenuated by its low bioavailability in supplements.48 Long-term studies have not been conducted.49 Nettle root is a plant-derived compound that is stated to increase free testosterone levels by binding to SHBG, in place of testosterone, and by inhibiting the enzyme that converts testosterone to dihydrotestosterone. The clinical evidence of effectiveness is based on many open studies, and the significance and magnitude of the effect still needs more rigorous evaluation.50
Conclusions
Patients today are barraged with medical information through television, print advertising, radio, and the Internet. A recent study of online sources of herbal product information found that only 10.5% recommended a consultation with a health care professional and < 3% cited scientific literature to accompany their claims.51 Many patients present to their PCP with questions about TRT or have already started an intervention for low T. Complementary and alternative medicine providers of TRT have been able to capture a segment of the population that often has the motivation and disposable income to pursue nontraditional therapies.
All nutritional supplements contain a standard warning from the FDA: “The above statements have not been evaluated by the FDA. This product is not intended to diagnose, treat, cure or prevent any disease.” Providers should remind patients of the statement and point out the contradictions between the statement and the benefits touted by the supplement marketing literature.
Finally, despite the well- established role of testosterone in enhancing libido, its definitive role in erectile function had been controversial until evidence substantiated a key function for this hormone.52 Testosterone may facilitate erection by acting as a vasodilator of the penile arterioles and cavernous sinusoids and may ameliorate the response to the phosphodiesterase-5 inhibitors in hypogonadal men.53 Testosterone replacement alone in hypogonadal men can restore erectile dysfunction.51 However, hypogonadism is not a common finding in those with erectile dysfunction, only occurring in about 5% of cases.53
Allopathic providers are concerned about the vitality and sexual health of their aging male patients, but their enthusiasm for anti-aging treatments is often tempered by evidence-based studies that have shown a lack of efficacy or potentially serious health care risks. Unfortunately, many patients remain unaware of the controversies regarding TRT. For those patients who receive treatment through CAM providers and are convinced of the efficacy of their low-T treatment regimen, it is important to keep lines of communication open.
Author disclosures
The authors report no actual or potential conflicts of interest with regard to this article.
Disclaimer
The opinions expressed herein are those of the authors and do not necessarily reflect those of Federal Practitioner, Frontline Medical Communications Inc., the U.S. Government, or any of its agencies. This article may discuss unlabeled or investigational use of certain drugs. Please review complete prescribing information for specific drugs or drug combinations—including indications, contraindications, warnings, and adverse effects—before administering pharmacologic therapy to patients.
1. Handelsman D. Global trends in testosterone prescribing, 2000-2011: expanding the spectrum of prescription drug misuse. Med J Aust. 2013;199(8):548-551.
2. Hackett G. Testosterone and the heart. Int J Clin Pract. 2012;66(7):648-655.
3. Morley JE. Hypogonadism, testosterone, and nursing home residents. J Am Med Dir Assoc. 2013;14(6):381-383.
4. An J, Cheetham TC, Van Den Eeden S. PS3-36: testosterone replacement therapy patterns for aging males in a managed care setting. Clin Med Res. 2013;11(3):141.
5. Moschis G, Lee E, Marthur A, Strautman J. The Maturing Marketplace: Buying Habits of Baby Boomers and Their Parents. Westport, CT: Quorum Books; 2000.
6. Morley JE, Kaiser FE, Perry HM 3rd, et al. Longitudinal changes in testosterone, luteinizing hormone, and follicle stimulating hormone in healthy older men. Metabolism. 1997;46(4):410-413.
7. Harman SM, Metter EJ, Tobin JD, Pearson J, Blackman MR; Baltimore Longitudinal Study of Aging. Longitudinal effects of aging on serum total and free testosterone levels in healthy men. Baltimore Longitudinal Study of Aging. J Clin Endocrinol Metab. 2001;86(2):724-731.
8. Basaria S. Male hypogonadism. Lancet. 2014;383 (9924):1250-1263.
9. Bhasin S, Cunningham GR, Hayes FJ, et al; Task Force, Endocrine Society. Testosterone therapy in men with androgen deficiency syndromes. J Clin Endocrinol Metab. 2010;95(6):2536-2559.
10. Wang C, Swerdloff RS, Iranmanesh A, et al. Transdermal testosterone gel improves sexual function, mood, muscle strength, and body composition parameters in hypogonadal men. J Clin Endocrinol Metab. 2000;85(8):2839-2853.
11. Bolona ER, Uranga MV, Haddad RM, et al. Testosterone use in men with sexual dysfunction: a systematic review and meta-analysis of randomized placebo-controlled trials. Mayo Clin Proc. 2007;82(1):20-28.
12. Isidori AM, Giannetta E, Gianfrilli D, et al. Effects of testosterone on sexual function in men: results of a meta-analysis. Clin Endocrinol (Oxf). 2005;63(4):381-394.
13. Isidori AM, Giannetta E, Greco EA, et al. Effects of testosterone on body composition, bone metabolism and serum lipid profile in middle-aged men: a meta-analysis. Clin Endocrinol (Oxf). 2005;63(3):280-293.
14. Snyder PJ, Peachey H, Berlin JA, et al. Effects of testosterone replacement in hypogonadal men. J Clin Endocrinol Metab. 2000;85(8):2670-2677.
15. Sih R, Morley JE, Kaiser FE, Perry HM 3rd, Patrick P, Ross C. Testosterone replacement in older hypogonadal men: a 12-month randomized controlled trial. J Clin Endocrinol Metab. 1997;82(6):1661-1667.
16. Travison TG, Basaria S, Storer TW, et al. Clinical meaningfulness of the changes in muscle performance and physical function associated with testosterone administration in older men with mobility limitation. J Gerontol A Biol Sci Med Sci. 2011;66(10):1090-1099.
17. Jones TH, Arver S, Behre HM, et al; TIMES2 Investigators. Testosterone replacement in hypogonadal men with type 2 diabetes and/or metabolic syndrome. Diabetes Care. 2011;34(4):828-837.
18. Jones TH, Saad F. The effects of testosterone on risk factors for, and the mediators of, the atherosclerotic process. Atherosclerosis. 2009;207(2):318-327.
19. Mathur A, Malkin C, Saeed B, Muthusamy R, Jones TH, Channer K. Long-term benefits of testosterone replacement therapy on angina threshold and atheroma in men. Eur J Endocrinol. 2009;161(3):443-449.
20. Malkin CJ, Pugh PJ, Morris PD, et al. Testosterone replacement in hypogonadal men with angina improves ischaemic threshold and quality of life. Heart. 2004;90(8):871-876.
21. Paduch DA, Brannigan RE, Fuchs EF, Kim ED, Marmar JL, Sandlow JI. White Paper: The Laboratory Diagnosis of Testosterone Deficiency. http://www.auanet.org/common/pdf/education/clinical -guidance/Testosterone-Deficiency-WhitePaper.pdf. Published 2013. Accessed April 9, 2015.
22. Crawford ED, Barqawi AB, O’Donnell C, Morgentaler A. The association of time of day and serum testosterone concentration in a large screening population. BJU Int. 2007;100(3):509-513.
23. Brambilla DJ, O’Donnell AB, Matsumoto AM, McKinlay JB. Intraindividual variation in levels of serum testosterone and other reproductive and adrenal hormones in men. Clin Endocrinol (Oxf). 2007;67(6):853-862.
24. Kumar P, Kumar N, Thakur DS, Patidar A. Male hypogonadism: symptoms and treatment. J Adv Pharm Technol Res. 2010;1(3):297-301.
25. Montgomery K. Sexual desire disorders. Psychiatry (Edgmont). 2008;5(6):50-55.
26. Corona G, Boddi V, Balercia G, et al. The effect of statin therapy on testosterone levels in subjects consulting for erectile dysfunction. J Sex Med. 2010; 7(4 pt 1):1547-1556.
27. Schooling CM, Yeung SLA, Freeman G, Cowling BJ. The effect of statins on testosterone in men and women, a systematic review and meta-analysis of randomized controlled trials. BMC Med. 2013;11:57.
28. Wu FC, Tajar A, Pye SR, et al; European Male Aging Study Group. Hypothalamic-pituitary-testicular axis disruptions in older men are differentially linked to age and modifiable risk factors: the European Male Aging Study. J Clin Endocrinol Metab. 2008;93(7):2737-2745.
29. Schwartz LM, Woloshin S. Low “T” as in “template”: how to sell disease. JAMA Intern Med. 2013;173(15):1460-1462.
30. Male Hormone Modulation Therapy, Part 2. Life Extension Vitamins Website. http://www.lifeextension vitamins.com/mahomothpa2.html. Accessed April 9, 2015.
31. Baillargeon J, Urban RJ, Ottenbacher KJ, Pierson KS, Goodwin JS. Trends in androgen prescribing in the United States, 2001 to 2011. JAMA Intern Med. 2013;173(15):1465-1466.
32. Layton JB, Li D, Meier CR, et al. Testosterone lab testing and initiation in the United Kingdom and the United States, 2000 to 2011. J Clin Endocrinol Metab. 2014;99(3):835-842.
33. Ramasamy R, Fisher ES, Schlegel PN. Testosterone replacement and prostate cancer. Indian J Urol. 2012;28(2):123-128.
34. Marks, LS, Mazer NA, Mostaghel E, et al. Effect of testosterone replacement therapy on prostate tissue in men with late-onset hypogonadism: a randomized controlled trial. JAMA. 2006;296(19):2351-2361.
35. Coward RM, Simhan J, Carson CC 3rd. Prostate-specific antigen changes and prostate cancer in hypogonadal men treated with testosterone replacement therapy. BJU Int. 2009;103(9):1179-1183.
36. Basaria S, Coviello AD, Travison TG, et al. Adverse events associated with testosterone administration. N Engl J Med. 2010;363(2):109-122.
37. Vigen R, O’Donnell Cl, Barón AE, et al. Association of testosterone therapy with mortality, myocardial infarction, and stroke in men with low testosterone levels. JAMA. 2013;310(17):1829-1836.
38. Morgentaler A, Traish A, Kacker R. Deaths and cardiovascular events in men receiving testosterone. JAMA. 2014;311(9):961-962.
39. Jones TH, Channer K. Deaths and cardiovascular events in men receiving testosterone. JAMA. 2014;311(9):962-963.
40. Katz J, Nadelberg R. Deaths and cardiovascular events in men receiving testosterone. JAMA. 2014;311(9):963.
41. Riche D, Baker WL, Koch CA. Deaths and cardiovascular events in men receiving testosterone. JAMA. 2014;311(9):963-964.
42. Dhindsa S, Batra M, Dandona P. Deaths and cardiovascular events in men receiving testosterone. JAMA. 2014;311(9):964.
43. Ho PM, Barón AE, Wierman M. Deaths and cardiovascular events in men receiving testosterone—reply. JAMA. 2014;311(9):964-965.
44. Traish AM, Guay AT, Morgentaler A. Death by testosterone? We think not! J Sex Med. 2014;11(3):624-629.
45. U.S. Department of Veterans Affairs, Veterans Health Administration (VHA), Pharmacy Benefit Management Services (PBM), Medical Advisory Panel (MAP), and Center for Medication Safety (VA Medsafe. National PBM Bulletin. Testosterone products and cardiovascular safety. http://www.pbm.va.gov/PBM/vacenterformedicationsafety/nationalpbmbulletin/Testosterone_Products_and_Cardiovascular_Safety_NATIONAL_PBM_BULLETIN_02.pdf. Published February 7, 2014. Accessed April 9, 2015.
46. Kacker R, Traish AM, Morgentaler A. Estrogens in men: clinical implications for sexual function and treatment of testosterone deficiency. J Sex Med. 2012;9(6):1681-1696.
47. Faloon W. Vindication. Life Extension Magazine Website. http://www.lef.org/magazine /mag2008/dec2008_Harvard-Experts-Recommend -Testosterone-Replacement_02.htm. Published December 2008. Accessed April 9,2015.
48. Walle T, Otake Y, Brubaker JA, Walle UK, Halushka PV. Disposition and metabolism of the flavonoid chrysin in normal volunteers. Br J Clin Pharmacol. 2001;51(2):143-146.
49. Jana K, Yin X, Schiffer, et al. Chrysin, a natural flavonoid enhances steroidogenesis and steroidogenic acute regulatory protein gene expression in mouse Leydig cells. J Endocrinol. 2008;197(2):315-323.
50. Chrubasik JE, Roufogalis BD, Wagner H, Chrubasik S. A comprehensive review on the stinging nettle effect and efficacy profiles. Part II: urticae radix. Phytomedicine. 2007;14(7-8):568-579.
51. Owens C, Baergen R, Puckett D. Online sources of herbal product information. Am J Med. 2014;127(2):109-115.
52. Blute W, Hakimian P, Kashanian J, Shteynshluyger A, Lee M, Shabsigh R. Erectile dysfunction and testosterone deficiency. Front Horm Res. 2009;37:108-122.
53. Mikhail N. Does testosterone have a role in erectile dysfunction? Am J Med. 2006;119(5):373-382.
Deployment-Related Lung Disorders
Military deployed from World War II through the Vietnam War have had enough time for respiratory disorders with both short and long latencies to manifest. More recent deployments over the past 13 years to Iraq, Kuwait, Afghanistan, and other regions in southwest Asia (SWA) have been associated with a unique spectrum of respiratory disorders. The long-term respiratory effects of SWA deployments are unknown. This review will discuss deployment-related lung cancer and then focus primarily on the emerging respiratory disorders related to SWA deployment and case examples of deployment-related lung disease.
As the number of recent veterans in the VA health care system increases, primary care providers (PCPs) and specialists are increasingly faced with questions about potential hazards of deployment, referring patients to the VA Airborne Hazards and Open Burn Pit Registry, and evaluating patients with new-onset respiratory symptoms following deployment. Previous reviews and white papers have offered recommendations for evaluation and management; however, little has been reported in the form of case examples of patients with deployment-related lung disorders and their clinical course.1,2
Deployment-Associated Lung Cancer
Lung cancer is the leading cause of cancer death in the U.S. and around the world.3 Lung cancer in the U.S. causes more deaths than does the combination of breast, prostate, colon, and rectal cancers. Lung cancer is the second most common cancer and causes more deaths than does any other cancer in the VHA.4 Most cancers with an environmental cause have a significant latent period of decades between the exposure and cancer incidence. Thus, although lung cancer risk is relatively low in active-duty military personnel, the rate of lung cancer in VA patients is nearly double that of the general population, suggesting causes associated with military service.5
Tobacco
The main cause of lung cancer is tobacco smoking, which accounts for 85% to 90% of lung cancer in the U.S. The latent period between initiation of tobacco smoking and lung cancer incidence is typically ≥ 30 years. Military service has long been associated with tobacco smoking, due to past practices that included the provision of free cigarettes, the availability of cigarettes at reduced cost, smoking breaks, perceived relief from both stress and boredom, and social factors.6 More recently, the adverse effects (AEs) of smoking on health and readiness have been appreciated, and many incentives encouraging tobacco smoking have been eliminated. In 2009, the Institute of Medicine called for a tobacco-free military, and both the Secretary of the Navy and Secretary of Defense have seriously considered this change.7
The additional effect of deployment on smoking has been reported.8 The longitudinal Millennium Cohort study compared several smoking measures between 55,021 deployers and nondeployers who completed both baseline (acquired July 2001-June 2003) and follow-up questionnaires (acquired June 2004-January 2006). Smoking initiation affected 2.3% of deployers and 1.3% of nondeployers; smoking resumption showed a similar pattern with an increase of 39.4% compared with 28.7%. The overall prevalence of smoking increased 44% among nondeployers and 57% among deployers. Those never smokers exposed to combat were 60% more likely to initiate smoking compared with noncombat deployers. Thus, it is clear that tobacco smoking should be considered a deployment-related exposure that contributes to lung cancer risk.
Asbestos
In 1955, Doll published an analysis associating asbestos exposure with risk for lung cancer.9 Many naval veterans and shipyard workers had asbestos exposure, resulting in a spectrum of asbestos-related diseases, including bronchogenic cancer.10
Depleted Uranium
Depleted uranium was used in munitions during the first Gulf War and more recently during military operations in SWA as a part of Operation New Dawn (OND), Operation Iraqi Freedom (OIF), and Operation Enduring Freedom (OEF). Because of concerns of military personnel having complex exposure to depleted uranium, including via inhalation, the VA established the Depleted Uranium Surveillance Program, which has followed a cohort of service members exposed to inhaled depleted uranium during friendly fire in 1991. No significant differences between individuals with high urinary uranium levels and low urinary uranium levels were found in self-reported respiratory symptoms and pulmonary function testing (PFT). Additionally, 20 years after exposure to depleted uranium, there was no statistically significant difference of low-dose chest computed tomography (CT) evidence of lung cancer in these 2 groups.11
Mustard Gas
Mustard gas is considered a definite lung carcinogen.12,13 Both long-term, low-dose and short-term, high- intensity exposures are known to cause human lung cancer.14 Mustard gas was first widely used in warfare in World War I. Mustard gas was used in training for World War II; training accidents resulted in acute toxicity even in lower exposures. It was later used as a chemical warfare agent in the Iran-Iraq conflict in the late 1980s and early 1990s. It is estimated that about 4,000 U.S. service members have been acutely exposed to high concentrations of mustard gas. Sulfur mustard may be incorporated into improvised explosive devices, and there is concern that troops in Iraq have been exposed to this agent in sites previously used for manufacturing and storage.15
Agent Orange
The herbicide Agent Orange is commonly contaminated with dioxin, which has been demonstrated to be a tumor promoter in animal studies. Agent Orange was used widely in the Vietnam War. The National Academy of Sciences issued a report in 2001 reviewing evidence for a link between Agent Orange and various neoplasms. Evidence was strongest for Hodgkin lymphoma and soft tissue sarcoma. The evidence of an association between Agent Orange exposure and lung cancer was deemed only suggestive.16
Respiratory Disease Associated With Southwest Asia Deployment
Over the past 14 years, > 2.5 million U.S. military personnel and civilian contractors have been deployed as part of 3 major military operations: OEF in Afghanistan (2001 to present), OIF in Iraq (2003 to 2010), and OND in Iraq (2010 to present).17,18 Deployed personnel encounter a wide variety of inhalational exposures that include desert dust particulate matter, burn pit combustion products, environmental tobacco smoke, vehicular diesel exhaust, debris from detonations and explosions, and other unique or specific job-related exposures (Table 1).19,20

A number of recent studies have helped identify and characterize an emerging spectrum of deployment-related lung disorders, including asthma, rhinosinusitis, emphysema, bronchiolitis, granulomatous pneumonitis, and less common conditions such as acute eosinophilic pneumonia and rapidly progressive pulmonary fibrosis (Table 2).20-30 Still, diagnosis of these conditions is often challenging, and traditional diagnostic tools such as PFT and chest radiography may be normal or mildly abnormal despite significant histopathologic abnormalities on surgical lung biopsy.24,30,31

Deployment-Related Exposures
As listed in Table 1, there are a number of other exposures that may be encountered during deployment. Environmental air sampling was conducted in several locations in Iraq, Afghanistan, and sites in SWA as part of the Enhanced Particulate Matter Survey. All sites were notable for air pollutant levels that exceeded 15 μg/m3, the military exposure guideline for fine particulate matter (PM2.5). The PM2.5 fraction comprised geologic dust, burn pit emissions, and the heavy metals aluminum, cadmium, and lead.32,33
Respiratory Disorders
Reports of deployers with respiratory symptoms during and after deployment surfaced as early as 2004.34 The Millennium Cohort study reported a 1.7-fold higher rate of new-onset respiratory symptoms that was independent of smoking status, such as cough and shortness of breath, in deployers compared with nondeployers. These increased symptom rates were associated with land-based deployment and longer deployment duration.35 A number of epidemiologic studies also demonstrated an association between respiratory symptoms and environmental exposures encountered during deployment.36-39
Respiratory diseases such as asthma, acute eosinophilic pneumonia, and constrictive bronchiolitis have been reported following deployment to SWA, but a review of the literature supports a more expansive list of deployment-related respiratory diseases (Table 2).20-30 The following case examples describe findings in veterans referred to the authors’ clinic for evaluation of chest symptoms associated with deployment.
OEF/OIF/OND Case Studies
Case Study 1
A 42-year-old male never smoker presented to his VA PCP for evaluation of nonproductive cough, dyspnea on exertion, chest tightness, and recurrent episodes of bronchitis since 2004 when he was deployed to Afghanistan. He had no history of asthma or other chronic respiratory disease in childhood or adolescence.

The patient served as a Civil Affairs officer in the U.S. Army and was deployed to Bosnia in 1997, Afghanistan in 2004, and Camp Arif-Jan in Kuwait as well as Mosul, Iraq, in 2005. He was exposed to depleted uranium while serving in Bosnia. He also had exposures to sandstorms, desert dust, and burn pit combustion products while deployed to Afghanistan and Iraq. He developed symptoms of chest tightness and dyspnea on exertion during his 2004 deployment, with these symptoms persisting after returning home from deployment. His symptoms occurred frequently while running and limited his ability to pass his military physical fitness test requirements and train for marathons as he had done previously. He also had symptoms of chest tightness and excessive coughing at rest, which were treated with antibiotics by his medical provider as recurrent acute infectious/viral bronchitis.
The patient was medically discharged from the U.S. Army in July 2005, primarily due to musculoskeletal injuries. His past medical history was notable for PTSD, recurrent allergic rhinosinusitis, and lumbosacral back pain. Given persistent respiratory symptoms of dyspnea after walking 1 block, the patient presented to his VA PCP in early 2006.

The patient’s vital signs and physical examination were normal. Spirometry showed a mixed restrictive and obstructive pattern, prompting referral for pulmonary consultation. Full PFT demonstrated an abnormally increased residual volume and mildly decreased diffusion capacity (Table 3). Laryngoscopy was negative for vocal cord dysfunction. A chest X-ray showed mild airway wall thickening bilaterally in the lower lung fields. Subsequent high-resolution CT of the chest demonstrated diffuse centrilobular nodularity (Figure 1). Serial spirometry measurements over 8 months showed severe and worsening airflow limitation despite treatment with inhaled bronchodilator and corticosteroid therapy. Seeking diagnostic clarity, the patient was referred for surgical lung biopsy via video-assisted thorascopic surgery (VATS) within 6 months of initial consultation.

The patient’s lung biopsy demonstrated constrictive changes in bronchioles, hyperinflation, and multiple chemodectomas in all 3 lobes of the right lung (Figures 2 and 3). Three pulmonary pathologists reviewed the biopsy and confirmed findings of constrictive bronchiolitis. Serologies for connective tissue disease were negative, indicating no autoimmune cause of bronchiolitis.
As no specific etiology was identified, the patient was referred for a second opinion with a pulmonologist with expertise in interstitial lung disease. Finding no evidence of post- infectious or autoimmune bronchiolitis, the patient’s diagnosis of constrictive bronchiolitis was deemed to be idiopathic. A number of years later, following publication of a case series of 38 OEF/OIF deployers with biopsy-proven constrictive bronchiolitis, the patient was referred for consultation to an occupational lung disease clinic.24 He subsequently was diagnosed with deployment-related lung disease, as his constrictive bronchiolitis was thought to be related to exposures encountered during his OEF/OIF deployments from 2003 to 2005.

The patient was monitored with spirometry over the next few months. After observing a 10% decline in forced expiratory volume in 1 second (FEV1) over 9 months despite stable lung volumes and diffusion capacity, the patient was started on macrolide therapy with erythromycin 500 mg daily. He was switched to azithromycin 250 mg daily due to gastrointestinal AEs of nausea and diarrhea while taking erythromycin. He continued use of an inhaled corticosteroid (ICS), as well as bronchodilator therapy with albuterol and formoterol and had stable dyspnea.
The patient was treated briefly with prednisone 40 mg, but he discontinued this medication after 5 days due to worsening anxiety and PTSD symptoms. Azithromycin therapy was discontinued after 4 years, because no significant improvement was noted in the patient’s lung function. Spirometry, lung volumes, and diffusion testing were unchanged for 2 years following discontinuation of azithromycin and continuing therapy with an ICS, long-acting beta-agonist, and albuterol. The patient has stable dyspnea on exertion but exercises regularly and recently was able to complete a marathon.
Case Study 2
A 43-year-old female ex-smoker presented to a VA chest clinic for evaluation of cough that started during a 2003 deployment to Iraq as well as dyspnea on exertion and chest tightness that had been present since her 2010 to 2011 deployment to Afghanistan. The patient had no history of asthma or other chronic respiratory disease during childhood.
She enlisted in the U.S. Navy in 1987 and later served as a medic while in the Navy Reserves. When she joined the U.S. Navy, she easily passed a 1.5-mile physical fitness readiness test run-time requirement with an 8.5-minute run time. She had no respiratory symptoms and ran in several marathons until her first SWA deployment in 2003.
In April 2003, she was deployed for 3 months to work as a combat medic near the Kuwait and Iraq border. She had frequent exposure to desert dust and recalled 5 sandstorms that appeared like a “wall of sand” coming toward the base. A few weeks into this deployment, the patient developed a nonproductive cough that persisted after returning to the U.S. She stopped smoking for a few months after returning home but continued to have a nonproductive cough. She did not seek further medical attention, because she had no exercise-limiting symptoms.
The patient joined the Army National Guard in 2006 and was activated in 2009 to deploy to Afghanistan from January 2010 through January 2011. She was stationed at Bagram Airbase for the entire deployment and worked as a military police officer in the prison. She had exposure to sandstorms and burn pit combustion products. The prison was about 2 miles downwind from a large burn pit.
In October 2010, she quit smoking again because of new-onset chest tightness and dyspnea on exertion. However, her symptoms did not abate, and she noted increased chest tightness and difficulty catching her breath when running near the burn pit. While she tried to avoid the burn pit, she participated in competitive races and a 10-mile run along paths that were near the burn pit.

After returning from deployment, the patient presented to her VA PCP for evaluation of persistent nonproductive cough, chest tightness, and dyspnea on exertion. She was not taking any respiratory or allergy medications at the time of evaluation. Initial chest X-ray and spirometry were normal, and she was referred to the chest clinic for consultation. At the time of pulmonary consultation, the patient had a total smoking history of 15 pack-years but had now abstained from smoking for about 2 years. She reported residential exposure to pet birds for > 20 years. High-resolution chest imaging and full PFT with lung volumes and diffusion capacity were performed to evaluate for hypersensitivity pneumonitis.
Her vital signs, physical examination pulmonary function testing with spirometry, lung volumes, and diffusion testing were all normal (Table 4). Bronchial challenge to methacholine demonstrated airways hyperresponsiveness at a PC[-20] FEV1 of 1.25 mg/mL. High-resolution chest CT did not demonstrate air trapping, centrilobular nodules, or other evidence of chronic interstitial lung disease. A cardiopulmonary maximum multistage exercise test with arterial line placement showed normal exercise tolerance with the patient achieving 109% of the maximum predicted workload and 90% of predicted VO2 max.
The patient was diagnosed with deployment-related asthma based on the finding of airways hyperresponsiveness after bronchial challenge testing. Her asthma was considered deployment-related based on the temporal onset of cough and later chest tightness and dyspnea on exertion that occurred during deployment. Ongoing smoking cessation was emphasized.
The patient was started on bronchodilator therapy with albuterol prior to exercise and as needed, but she continued to have symptoms of chest tightness while exercising. Eventually, a low-dose ICS was initiated in conjunction with albuterol as needed. Her symptoms did not resolve with this regimen, but she did experience improvement in exertional chest tightness. This patient was not referred for biopsy given clinical findings of asthma. She will continue pulmonary monitoring every 6 months. However, if her symptoms worsen, she will undergo full PFT, which includes lung volumes and diffusion testing and possible repeat chest imaging.
Conclusion
These 2 cases are representative of the spectrum of deployment-related lung disease. This assessment requires a detailed chronologic occupational and environmental history, establishing a temporal link between respiratory symptoms and deployment exposures and evidence of lung disease on noninvasive testing (or confirmation by surgical lung biopsy in select cases) in which noninvasive testing is nondiagnostic.

Referral for surgical lung biopsy was particularly helpful in the first case, because it ruled out other lung diseases that are more responsive to systemic therapy. However, referral for surgical lung biopsy is not recommended in all patients, and in-depth discussion of the risks and benefits associated with surgery is recommended. Although diagnostic clarity is a benefit of surgical lung biopsy, the authors also discuss with patients that there is no currently available therapy for deployment-related lung disease and thus management is unlikely to change after biopsy. The recommended approach to diagnostic evaluation is shown in Figure 4.
In the authors’ experience, treatment of deployment-related asthma with standard asthma treatment usually improves or stabilizes respiratory symptoms but often does not result in complete resolution of symptoms. Improvement in lung function with systemic pharmacotherapy in the management of deployment-related lung diseases, such as constrictive bronchiolitis, respiratory bronchiolitis, emphysema, or granulomatous pneumonitis has not been observed. Although little is currently known about prognosis, utilization of data collected from the VA Airborne Hazards and Open Burn Pit Registry may contribute to the understanding of deployment exposures and long-term respiratory health effects.
Author disclosures
The authors report no actual or potential conflicts of interest with regard to this article.
Disclaimer
The opinions expressed herein are those of the authors and do not necessarily reflect those of Federal Practitioner, Frontline Medical Communications Inc., the U.S. Government, or any of its agencies. This article may discuss unlabeled or investigational use of certain drugs. Please review complete prescribing information for specific drugs or drug combinations—including indications, contraindications, warnings, and adverse effects—before administering pharmacologic therapy to patients.
1. Rose C, Abraham J, Harkins D, et al. Overview and recommendations for medical screening and diagnostic evaluation for postdeployment lung disease in returning US warfighters. J Occup Environ Med. 2012;54(6):746-751.
2. Morris MJ, Lucero PF, Zanders TB, Zacher LL. Diagnosis and management of chronic lung disease in deployed military personnel. Ther Adv Respir Dis. 2013;7(4):235-245.
3. Siegel R, Ma J, Zou Z, Jemal A. Cancer statistics, 2014. CA Cancer J Clin. 2014;64(1):9-29.
4. Zullig LL, Jackson GL, Dorn RA, et al. Cancer incidence among patients of the U.S. Veterans Affairs Health Care System. Mil Med. 2012;177(6):693-701.
5. Zhu K, Devesa SS, Wu H, et al. Cancer incidence in the U.S. military population: comparison with rates from the SEER program. Cancer Epidemiol Biomarkers Prev. 2009;18(6):1740-1745.
6. Smith EA, Jahnke SA, Poston WS, et al. Is it time for a tobacco-free military? N Engl J Med. 2014;371(7):589-591.
7. Combating Tobacco in Military and Veteran Populations. In: Bondurant S, Wedge R, eds. Washington, DC: National Academies Press; 2009.
8. Smith B, Ryan MA, Wingard DL, Patterson TL, Slymen DJ, Macera CA; Millennium Cohort Study Team. Cigarette smoking and military deployment: a prospective evaluation. Am J Prev Med. 2008;35(6):539-546.
9. Doll R. Mortality from lung cancer in asbestos workers. Br J Ind Med. 1955;12(2):81-86.
10. Krstev S, Stewart P, Rusiecki J, Blair A. Mortality among shipyard Coast Guard workers: a retrospective cohort study. Occup Environ Med. 2007;64(10):651-658.
11. Hines SE, Gucer P, Kligerman S, et al. Pulmonary health effects in Gulf War I service members exposed to depleted uranium. J Occup Environ Med. 2013;55(8):937-944.
12. World Health Organization, International Agency for Research on Cancer. IARC monographs on the evaluation of the carcinogenic risk of chemicals to man: some aziridines, N-, S- & O-mustards and selenium. IARC Monogr Eval Carcinog Risk Chem Man. 1975;9:1-268.
13. Field RW, Withers BL. Occupational and environmental causes of lung cancer. Clin Chest Med. 2012;33(4):681-703.
14. Ghanei M, Harandi AA. Lung carcinogenicity of sulfur mustard. Clin Lung Cancer. 2010;11(1):13-17.
15. Chivers CJ. The secret casualties of Iraq’s abandoned chemical weapons. New York Times. October 14, 2014. http://www.nytimes.com /interactive/2014/10/14/world/middleeast/us-casualties-of-iraq-chemical-weapons.html?_r=0. Accessed May 13, 2015.
16. Institute of Medicine (US) Committee to Review the Health Effects in Vietnam Veterans of Exposure to Herbicides (Third Biennial Update). Veterans and Agent Orange: Update 2000. Washington, DC: National Academies Press; 2001.
17. How to help military & veteran families before, during, and after deployment. Military Family Research Institute Web site. https://www.mfri.purdue.edu/resources/public/hth/HowToHelp _FamilyFriendNeighbor.pdf. Accessed November 6, 2014.
18. Torreon BS. U.S. periods of war and dates of current conflicts. Washington, DC: Congressional Research Service Report for Congress; December 28, 2012. http://fas.org/sgp/crs/natsec/RS21405.pdf. Accessed November 6, 2014.
19. Rose CS. Military service and lung disease. Clin Chest Med. 2012;33(4):705-714.
20. Szema AM. Occupational lung diseases among soldiers deployed to Iraq and Afghanistan. Occup Med Health Aff. 2013;1:10.4172/2329-6879.1000117.
21. Morris MJ, Dodson DW, Lucero PF, et al. Study of active duty military for pulmonary disease related to environmental deployment exposures (STAMPEDE). Am J Respir Crit Care Med. 2014;190(1):77-84.
22. Shorr AF, Scoville SL, Cersovsky SB, et al. Acute eosinophilic pneumonia among US Military personnel deployed in or near Iraq. JAMA. 2004;292(24): 2997-3005.
23. Roop SA, Niven AS, Calvin BE, Bader J, Zacher LL. The prevalence and impact of respiratory symptoms in asthmatics and nonasthmatics during deployment. Mil Med. 2007;172(12):1264-1269.
24. King MS, Eisenberg R, Newman JH, et al. Constrictive bronchiolitis in soldiers returning from Iraq and Afghanistan [published correction appears in N Engl J Med. 2011;365(18):1749]. N Engl J Med. 2011;365(3):222-230.
25. Sanders JW, Putnam SD, Frankart C, et al. Impact of illness and non-combat injury during Operations Iraqi Freedom and Enduring Freedom (Afghanistan). Am J Trop Med Hyg. 2005;73(4):713-719.
26. Stecker T, Fortney J, Owen R, McGovern MP, Williams S. Co-occurring medical, psychiatric, and alcohol-related disorders among veterans returning from Iraq and Afghanistan. Psychosomatics. 2010;51(6):503-507.
27. Szema AM, Peters MC, Weissinger KM, Gagliano CA, Chen JJ. New-onset asthma among soldiers serving in Iraq and Afghanistan. Allergy Asthma Proc. 2010;31(5):67-71.
28. Scoville SL. Acute eosinophilic pneumonia (AEP) among U.S. military personnel in the U.S. Central Command Area of Responsibility (USCENTCOM AOR). USACHPPM Information Paper. http://www.pdhealth.mil/AEP_Info_paper_01oct09.pdf. Published October 1, 2009. Accessed January 27, 2015.
29. Zembrzuska H, Collen J, Roop S. Pulmonary fibrosis presenting at post-deployment health screening. Am J Respir Crit Care Med. 2011;183:A4780. Abstract.
30. Dhoma S, Gottschall B, Robinson M, et al. Lung disease in deployers returning from Afghanistan and Iraq. Am J Respir Crit Care Med. 2013;187:A3669. Abstract.
31. Dhoma S, Cox C, Chung JH, et al. Chest tomography may predict histopathologic abnormalities in symptomatic deployers returning from Iraq and Afghanistan. Am J Respir Crit Care Med. 2014;189:A5102. Abstract.
32. Engelbrecht JP, McDonald EV, Gillies JA, Javanty RK, Casuccio G, Gertler AW. Characterizing mineral dusts and other aerosols from the Middle East – part I: ambient sampling. Inhal Toxicol. 2009;21(4):297-326.
33. Engelbrecht JP, McDonald EV, Gillies JA, Javanty RK, Casuccio G, Gertler AW. Characterizing mineral dusts and other aerosols from the Middle East – part 2: grab samples and re-suspensions. Inhal Toxicol. 2009;21(4):327-336.
34. Helmer DA, Rossignol M, Blatt M, Agarwal R, Teichman R, Lange G. Health and exposure concerns of veterans deployed to Iraq and Afghanistan. J Occup Environ Med. 2007;49(5):475-480.
35. Smith B, Wong CA, Smith TC, Boyko EJ, Gackstetter GD, Ryan MAK; for the Millennium Cohort Study Team. Newly reported respiratory symptoms and conditions among military personnel deployed to Iraq and Afghanistan: a prospective population-based study. Am J Epidemiol. 2009;170(11):1433-1442.
36. Abraham JH, DeBakey SF, Reid L, Zhou J, Baird CP. Does deployment to Iraq and Afghanistan affect respiratory health of US military personnel? J Occup Environ Med. 2012;54(6):740-745.
37. McAndrew LM, Teichman RF, Osinubi OY, Jasien JV, Quigley KS. Environmental exposure and health of Operation Enduring Freedom/Operation Iraqi Freedom veterans. J Occup Environ Med. 2012;54(6):665-669.
38. Quigley KS, McAndrew LM, Almeida L, et al. Prevalence of environmental and other military exposure concerns in Operation Enduring Freedom and Operation Iraqi Freedom veterans. J Occup Environ Med. 2012;54(6):659-664.
39. Teichman R. Exposures of concern to veterans returning from Afghanistan and Iraq. J Occup Environ Med. 2012;54(6):677-681.
Military deployed from World War II through the Vietnam War have had enough time for respiratory disorders with both short and long latencies to manifest. More recent deployments over the past 13 years to Iraq, Kuwait, Afghanistan, and other regions in southwest Asia (SWA) have been associated with a unique spectrum of respiratory disorders. The long-term respiratory effects of SWA deployments are unknown. This review will discuss deployment-related lung cancer and then focus primarily on the emerging respiratory disorders related to SWA deployment and case examples of deployment-related lung disease.
As the number of recent veterans in the VA health care system increases, primary care providers (PCPs) and specialists are increasingly faced with questions about potential hazards of deployment, referring patients to the VA Airborne Hazards and Open Burn Pit Registry, and evaluating patients with new-onset respiratory symptoms following deployment. Previous reviews and white papers have offered recommendations for evaluation and management; however, little has been reported in the form of case examples of patients with deployment-related lung disorders and their clinical course.1,2
Deployment-Associated Lung Cancer
Lung cancer is the leading cause of cancer death in the U.S. and around the world.3 Lung cancer in the U.S. causes more deaths than does the combination of breast, prostate, colon, and rectal cancers. Lung cancer is the second most common cancer and causes more deaths than does any other cancer in the VHA.4 Most cancers with an environmental cause have a significant latent period of decades between the exposure and cancer incidence. Thus, although lung cancer risk is relatively low in active-duty military personnel, the rate of lung cancer in VA patients is nearly double that of the general population, suggesting causes associated with military service.5
Tobacco
The main cause of lung cancer is tobacco smoking, which accounts for 85% to 90% of lung cancer in the U.S. The latent period between initiation of tobacco smoking and lung cancer incidence is typically ≥ 30 years. Military service has long been associated with tobacco smoking, due to past practices that included the provision of free cigarettes, the availability of cigarettes at reduced cost, smoking breaks, perceived relief from both stress and boredom, and social factors.6 More recently, the adverse effects (AEs) of smoking on health and readiness have been appreciated, and many incentives encouraging tobacco smoking have been eliminated. In 2009, the Institute of Medicine called for a tobacco-free military, and both the Secretary of the Navy and Secretary of Defense have seriously considered this change.7
The additional effect of deployment on smoking has been reported.8 The longitudinal Millennium Cohort study compared several smoking measures between 55,021 deployers and nondeployers who completed both baseline (acquired July 2001-June 2003) and follow-up questionnaires (acquired June 2004-January 2006). Smoking initiation affected 2.3% of deployers and 1.3% of nondeployers; smoking resumption showed a similar pattern with an increase of 39.4% compared with 28.7%. The overall prevalence of smoking increased 44% among nondeployers and 57% among deployers. Those never smokers exposed to combat were 60% more likely to initiate smoking compared with noncombat deployers. Thus, it is clear that tobacco smoking should be considered a deployment-related exposure that contributes to lung cancer risk.
Asbestos
In 1955, Doll published an analysis associating asbestos exposure with risk for lung cancer.9 Many naval veterans and shipyard workers had asbestos exposure, resulting in a spectrum of asbestos-related diseases, including bronchogenic cancer.10
Depleted Uranium
Depleted uranium was used in munitions during the first Gulf War and more recently during military operations in SWA as a part of Operation New Dawn (OND), Operation Iraqi Freedom (OIF), and Operation Enduring Freedom (OEF). Because of concerns of military personnel having complex exposure to depleted uranium, including via inhalation, the VA established the Depleted Uranium Surveillance Program, which has followed a cohort of service members exposed to inhaled depleted uranium during friendly fire in 1991. No significant differences between individuals with high urinary uranium levels and low urinary uranium levels were found in self-reported respiratory symptoms and pulmonary function testing (PFT). Additionally, 20 years after exposure to depleted uranium, there was no statistically significant difference of low-dose chest computed tomography (CT) evidence of lung cancer in these 2 groups.11
Mustard Gas
Mustard gas is considered a definite lung carcinogen.12,13 Both long-term, low-dose and short-term, high- intensity exposures are known to cause human lung cancer.14 Mustard gas was first widely used in warfare in World War I. Mustard gas was used in training for World War II; training accidents resulted in acute toxicity even in lower exposures. It was later used as a chemical warfare agent in the Iran-Iraq conflict in the late 1980s and early 1990s. It is estimated that about 4,000 U.S. service members have been acutely exposed to high concentrations of mustard gas. Sulfur mustard may be incorporated into improvised explosive devices, and there is concern that troops in Iraq have been exposed to this agent in sites previously used for manufacturing and storage.15
Agent Orange
The herbicide Agent Orange is commonly contaminated with dioxin, which has been demonstrated to be a tumor promoter in animal studies. Agent Orange was used widely in the Vietnam War. The National Academy of Sciences issued a report in 2001 reviewing evidence for a link between Agent Orange and various neoplasms. Evidence was strongest for Hodgkin lymphoma and soft tissue sarcoma. The evidence of an association between Agent Orange exposure and lung cancer was deemed only suggestive.16
Respiratory Disease Associated With Southwest Asia Deployment
Over the past 14 years, > 2.5 million U.S. military personnel and civilian contractors have been deployed as part of 3 major military operations: OEF in Afghanistan (2001 to present), OIF in Iraq (2003 to 2010), and OND in Iraq (2010 to present).17,18 Deployed personnel encounter a wide variety of inhalational exposures that include desert dust particulate matter, burn pit combustion products, environmental tobacco smoke, vehicular diesel exhaust, debris from detonations and explosions, and other unique or specific job-related exposures (Table 1).19,20
A number of recent studies have helped identify and characterize an emerging spectrum of deployment-related lung disorders, including asthma, rhinosinusitis, emphysema, bronchiolitis, granulomatous pneumonitis, and less common conditions such as acute eosinophilic pneumonia and rapidly progressive pulmonary fibrosis (Table 2).20-30 Still, diagnosis of these conditions is often challenging, and traditional diagnostic tools such as PFT and chest radiography may be normal or mildly abnormal despite significant histopathologic abnormalities on surgical lung biopsy.24,30,31
Deployment-Related Exposures
As listed in Table 1, there are a number of other exposures that may be encountered during deployment. Environmental air sampling was conducted in several locations in Iraq, Afghanistan, and sites in SWA as part of the Enhanced Particulate Matter Survey. All sites were notable for air pollutant levels that exceeded 15 μg/m3, the military exposure guideline for fine particulate matter (PM2.5). The PM2.5 fraction comprised geologic dust, burn pit emissions, and the heavy metals aluminum, cadmium, and lead.32,33
Respiratory Disorders
Reports of deployers with respiratory symptoms during and after deployment surfaced as early as 2004.34 The Millennium Cohort study reported a 1.7-fold higher rate of new-onset respiratory symptoms that was independent of smoking status, such as cough and shortness of breath, in deployers compared with nondeployers. These increased symptom rates were associated with land-based deployment and longer deployment duration.35 A number of epidemiologic studies also demonstrated an association between respiratory symptoms and environmental exposures encountered during deployment.36-39
Respiratory diseases such as asthma, acute eosinophilic pneumonia, and constrictive bronchiolitis have been reported following deployment to SWA, but a review of the literature supports a more expansive list of deployment-related respiratory diseases (Table 2).20-30 The following case examples describe findings in veterans referred to the authors’ clinic for evaluation of chest symptoms associated with deployment.
OEF/OIF/OND Case Studies
Case Study 1
A 42-year-old male never smoker presented to his VA PCP for evaluation of nonproductive cough, dyspnea on exertion, chest tightness, and recurrent episodes of bronchitis since 2004 when he was deployed to Afghanistan. He had no history of asthma or other chronic respiratory disease in childhood or adolescence.
The patient served as a Civil Affairs officer in the U.S. Army and was deployed to Bosnia in 1997, Afghanistan in 2004, and Camp Arif-Jan in Kuwait as well as Mosul, Iraq, in 2005. He was exposed to depleted uranium while serving in Bosnia. He also had exposures to sandstorms, desert dust, and burn pit combustion products while deployed to Afghanistan and Iraq. He developed symptoms of chest tightness and dyspnea on exertion during his 2004 deployment, with these symptoms persisting after returning home from deployment. His symptoms occurred frequently while running and limited his ability to pass his military physical fitness test requirements and train for marathons as he had done previously. He also had symptoms of chest tightness and excessive coughing at rest, which were treated with antibiotics by his medical provider as recurrent acute infectious/viral bronchitis.
The patient was medically discharged from the U.S. Army in July 2005, primarily due to musculoskeletal injuries. His past medical history was notable for PTSD, recurrent allergic rhinosinusitis, and lumbosacral back pain. Given persistent respiratory symptoms of dyspnea after walking 1 block, the patient presented to his VA PCP in early 2006.
The patient’s vital signs and physical examination were normal. Spirometry showed a mixed restrictive and obstructive pattern, prompting referral for pulmonary consultation. Full PFT demonstrated an abnormally increased residual volume and mildly decreased diffusion capacity (Table 3). Laryngoscopy was negative for vocal cord dysfunction. A chest X-ray showed mild airway wall thickening bilaterally in the lower lung fields. Subsequent high-resolution CT of the chest demonstrated diffuse centrilobular nodularity (Figure 1). Serial spirometry measurements over 8 months showed severe and worsening airflow limitation despite treatment with inhaled bronchodilator and corticosteroid therapy. Seeking diagnostic clarity, the patient was referred for surgical lung biopsy via video-assisted thorascopic surgery (VATS) within 6 months of initial consultation.
The patient’s lung biopsy demonstrated constrictive changes in bronchioles, hyperinflation, and multiple chemodectomas in all 3 lobes of the right lung (Figures 2 and 3). Three pulmonary pathologists reviewed the biopsy and confirmed findings of constrictive bronchiolitis. Serologies for connective tissue disease were negative, indicating no autoimmune cause of bronchiolitis.
As no specific etiology was identified, the patient was referred for a second opinion with a pulmonologist with expertise in interstitial lung disease. Finding no evidence of post- infectious or autoimmune bronchiolitis, the patient’s diagnosis of constrictive bronchiolitis was deemed to be idiopathic. A number of years later, following publication of a case series of 38 OEF/OIF deployers with biopsy-proven constrictive bronchiolitis, the patient was referred for consultation to an occupational lung disease clinic.24 He subsequently was diagnosed with deployment-related lung disease, as his constrictive bronchiolitis was thought to be related to exposures encountered during his OEF/OIF deployments from 2003 to 2005.
The patient was monitored with spirometry over the next few months. After observing a 10% decline in forced expiratory volume in 1 second (FEV1) over 9 months despite stable lung volumes and diffusion capacity, the patient was started on macrolide therapy with erythromycin 500 mg daily. He was switched to azithromycin 250 mg daily due to gastrointestinal AEs of nausea and diarrhea while taking erythromycin. He continued use of an inhaled corticosteroid (ICS), as well as bronchodilator therapy with albuterol and formoterol and had stable dyspnea.
The patient was treated briefly with prednisone 40 mg, but he discontinued this medication after 5 days due to worsening anxiety and PTSD symptoms. Azithromycin therapy was discontinued after 4 years, because no significant improvement was noted in the patient’s lung function. Spirometry, lung volumes, and diffusion testing were unchanged for 2 years following discontinuation of azithromycin and continuing therapy with an ICS, long-acting beta-agonist, and albuterol. The patient has stable dyspnea on exertion but exercises regularly and recently was able to complete a marathon.
Case Study 2
A 43-year-old female ex-smoker presented to a VA chest clinic for evaluation of cough that started during a 2003 deployment to Iraq as well as dyspnea on exertion and chest tightness that had been present since her 2010 to 2011 deployment to Afghanistan. The patient had no history of asthma or other chronic respiratory disease during childhood.
She enlisted in the U.S. Navy in 1987 and later served as a medic while in the Navy Reserves. When she joined the U.S. Navy, she easily passed a 1.5-mile physical fitness readiness test run-time requirement with an 8.5-minute run time. She had no respiratory symptoms and ran in several marathons until her first SWA deployment in 2003.
In April 2003, she was deployed for 3 months to work as a combat medic near the Kuwait and Iraq border. She had frequent exposure to desert dust and recalled 5 sandstorms that appeared like a “wall of sand” coming toward the base. A few weeks into this deployment, the patient developed a nonproductive cough that persisted after returning to the U.S. She stopped smoking for a few months after returning home but continued to have a nonproductive cough. She did not seek further medical attention, because she had no exercise-limiting symptoms.
The patient joined the Army National Guard in 2006 and was activated in 2009 to deploy to Afghanistan from January 2010 through January 2011. She was stationed at Bagram Airbase for the entire deployment and worked as a military police officer in the prison. She had exposure to sandstorms and burn pit combustion products. The prison was about 2 miles downwind from a large burn pit.
In October 2010, she quit smoking again because of new-onset chest tightness and dyspnea on exertion. However, her symptoms did not abate, and she noted increased chest tightness and difficulty catching her breath when running near the burn pit. While she tried to avoid the burn pit, she participated in competitive races and a 10-mile run along paths that were near the burn pit.
After returning from deployment, the patient presented to her VA PCP for evaluation of persistent nonproductive cough, chest tightness, and dyspnea on exertion. She was not taking any respiratory or allergy medications at the time of evaluation. Initial chest X-ray and spirometry were normal, and she was referred to the chest clinic for consultation. At the time of pulmonary consultation, the patient had a total smoking history of 15 pack-years but had now abstained from smoking for about 2 years. She reported residential exposure to pet birds for > 20 years. High-resolution chest imaging and full PFT with lung volumes and diffusion capacity were performed to evaluate for hypersensitivity pneumonitis.
Her vital signs, physical examination pulmonary function testing with spirometry, lung volumes, and diffusion testing were all normal (Table 4). Bronchial challenge to methacholine demonstrated airways hyperresponsiveness at a PC[-20] FEV1 of 1.25 mg/mL. High-resolution chest CT did not demonstrate air trapping, centrilobular nodules, or other evidence of chronic interstitial lung disease. A cardiopulmonary maximum multistage exercise test with arterial line placement showed normal exercise tolerance with the patient achieving 109% of the maximum predicted workload and 90% of predicted VO2 max.
The patient was diagnosed with deployment-related asthma based on the finding of airways hyperresponsiveness after bronchial challenge testing. Her asthma was considered deployment-related based on the temporal onset of cough and later chest tightness and dyspnea on exertion that occurred during deployment. Ongoing smoking cessation was emphasized.
The patient was started on bronchodilator therapy with albuterol prior to exercise and as needed, but she continued to have symptoms of chest tightness while exercising. Eventually, a low-dose ICS was initiated in conjunction with albuterol as needed. Her symptoms did not resolve with this regimen, but she did experience improvement in exertional chest tightness. This patient was not referred for biopsy given clinical findings of asthma. She will continue pulmonary monitoring every 6 months. However, if her symptoms worsen, she will undergo full PFT, which includes lung volumes and diffusion testing and possible repeat chest imaging.
Conclusion
These 2 cases are representative of the spectrum of deployment-related lung disease. This assessment requires a detailed chronologic occupational and environmental history, establishing a temporal link between respiratory symptoms and deployment exposures and evidence of lung disease on noninvasive testing (or confirmation by surgical lung biopsy in select cases) in which noninvasive testing is nondiagnostic.
Referral for surgical lung biopsy was particularly helpful in the first case, because it ruled out other lung diseases that are more responsive to systemic therapy. However, referral for surgical lung biopsy is not recommended in all patients, and in-depth discussion of the risks and benefits associated with surgery is recommended. Although diagnostic clarity is a benefit of surgical lung biopsy, the authors also discuss with patients that there is no currently available therapy for deployment-related lung disease and thus management is unlikely to change after biopsy. The recommended approach to diagnostic evaluation is shown in Figure 4.
In the authors’ experience, treatment of deployment-related asthma with standard asthma treatment usually improves or stabilizes respiratory symptoms but often does not result in complete resolution of symptoms. Improvement in lung function with systemic pharmacotherapy in the management of deployment-related lung diseases, such as constrictive bronchiolitis, respiratory bronchiolitis, emphysema, or granulomatous pneumonitis has not been observed. Although little is currently known about prognosis, utilization of data collected from the VA Airborne Hazards and Open Burn Pit Registry may contribute to the understanding of deployment exposures and long-term respiratory health effects.
Author disclosures
The authors report no actual or potential conflicts of interest with regard to this article.
Disclaimer
The opinions expressed herein are those of the authors and do not necessarily reflect those of Federal Practitioner, Frontline Medical Communications Inc., the U.S. Government, or any of its agencies. This article may discuss unlabeled or investigational use of certain drugs. Please review complete prescribing information for specific drugs or drug combinations—including indications, contraindications, warnings, and adverse effects—before administering pharmacologic therapy to patients.
1. Rose C, Abraham J, Harkins D, et al. Overview and recommendations for medical screening and diagnostic evaluation for postdeployment lung disease in returning US warfighters. J Occup Environ Med. 2012;54(6):746-751.
2. Morris MJ, Lucero PF, Zanders TB, Zacher LL. Diagnosis and management of chronic lung disease in deployed military personnel. Ther Adv Respir Dis. 2013;7(4):235-245.
3. Siegel R, Ma J, Zou Z, Jemal A. Cancer statistics, 2014. CA Cancer J Clin. 2014;64(1):9-29.
4. Zullig LL, Jackson GL, Dorn RA, et al. Cancer incidence among patients of the U.S. Veterans Affairs Health Care System. Mil Med. 2012;177(6):693-701.
5. Zhu K, Devesa SS, Wu H, et al. Cancer incidence in the U.S. military population: comparison with rates from the SEER program. Cancer Epidemiol Biomarkers Prev. 2009;18(6):1740-1745.
6. Smith EA, Jahnke SA, Poston WS, et al. Is it time for a tobacco-free military? N Engl J Med. 2014;371(7):589-591.
7. Combating Tobacco in Military and Veteran Populations. In: Bondurant S, Wedge R, eds. Washington, DC: National Academies Press; 2009.
8. Smith B, Ryan MA, Wingard DL, Patterson TL, Slymen DJ, Macera CA; Millennium Cohort Study Team. Cigarette smoking and military deployment: a prospective evaluation. Am J Prev Med. 2008;35(6):539-546.
9. Doll R. Mortality from lung cancer in asbestos workers. Br J Ind Med. 1955;12(2):81-86.
10. Krstev S, Stewart P, Rusiecki J, Blair A. Mortality among shipyard Coast Guard workers: a retrospective cohort study. Occup Environ Med. 2007;64(10):651-658.
11. Hines SE, Gucer P, Kligerman S, et al. Pulmonary health effects in Gulf War I service members exposed to depleted uranium. J Occup Environ Med. 2013;55(8):937-944.
12. World Health Organization, International Agency for Research on Cancer. IARC monographs on the evaluation of the carcinogenic risk of chemicals to man: some aziridines, N-, S- & O-mustards and selenium. IARC Monogr Eval Carcinog Risk Chem Man. 1975;9:1-268.
13. Field RW, Withers BL. Occupational and environmental causes of lung cancer. Clin Chest Med. 2012;33(4):681-703.
14. Ghanei M, Harandi AA. Lung carcinogenicity of sulfur mustard. Clin Lung Cancer. 2010;11(1):13-17.
15. Chivers CJ. The secret casualties of Iraq’s abandoned chemical weapons. New York Times. October 14, 2014. http://www.nytimes.com /interactive/2014/10/14/world/middleeast/us-casualties-of-iraq-chemical-weapons.html?_r=0. Accessed May 13, 2015.
16. Institute of Medicine (US) Committee to Review the Health Effects in Vietnam Veterans of Exposure to Herbicides (Third Biennial Update). Veterans and Agent Orange: Update 2000. Washington, DC: National Academies Press; 2001.
17. How to help military & veteran families before, during, and after deployment. Military Family Research Institute Web site. https://www.mfri.purdue.edu/resources/public/hth/HowToHelp _FamilyFriendNeighbor.pdf. Accessed November 6, 2014.
18. Torreon BS. U.S. periods of war and dates of current conflicts. Washington, DC: Congressional Research Service Report for Congress; December 28, 2012. http://fas.org/sgp/crs/natsec/RS21405.pdf. Accessed November 6, 2014.
19. Rose CS. Military service and lung disease. Clin Chest Med. 2012;33(4):705-714.
20. Szema AM. Occupational lung diseases among soldiers deployed to Iraq and Afghanistan. Occup Med Health Aff. 2013;1:10.4172/2329-6879.1000117.
21. Morris MJ, Dodson DW, Lucero PF, et al. Study of active duty military for pulmonary disease related to environmental deployment exposures (STAMPEDE). Am J Respir Crit Care Med. 2014;190(1):77-84.
22. Shorr AF, Scoville SL, Cersovsky SB, et al. Acute eosinophilic pneumonia among US Military personnel deployed in or near Iraq. JAMA. 2004;292(24): 2997-3005.
23. Roop SA, Niven AS, Calvin BE, Bader J, Zacher LL. The prevalence and impact of respiratory symptoms in asthmatics and nonasthmatics during deployment. Mil Med. 2007;172(12):1264-1269.
24. King MS, Eisenberg R, Newman JH, et al. Constrictive bronchiolitis in soldiers returning from Iraq and Afghanistan [published correction appears in N Engl J Med. 2011;365(18):1749]. N Engl J Med. 2011;365(3):222-230.
25. Sanders JW, Putnam SD, Frankart C, et al. Impact of illness and non-combat injury during Operations Iraqi Freedom and Enduring Freedom (Afghanistan). Am J Trop Med Hyg. 2005;73(4):713-719.
26. Stecker T, Fortney J, Owen R, McGovern MP, Williams S. Co-occurring medical, psychiatric, and alcohol-related disorders among veterans returning from Iraq and Afghanistan. Psychosomatics. 2010;51(6):503-507.
27. Szema AM, Peters MC, Weissinger KM, Gagliano CA, Chen JJ. New-onset asthma among soldiers serving in Iraq and Afghanistan. Allergy Asthma Proc. 2010;31(5):67-71.
28. Scoville SL. Acute eosinophilic pneumonia (AEP) among U.S. military personnel in the U.S. Central Command Area of Responsibility (USCENTCOM AOR). USACHPPM Information Paper. http://www.pdhealth.mil/AEP_Info_paper_01oct09.pdf. Published October 1, 2009. Accessed January 27, 2015.
29. Zembrzuska H, Collen J, Roop S. Pulmonary fibrosis presenting at post-deployment health screening. Am J Respir Crit Care Med. 2011;183:A4780. Abstract.
30. Dhoma S, Gottschall B, Robinson M, et al. Lung disease in deployers returning from Afghanistan and Iraq. Am J Respir Crit Care Med. 2013;187:A3669. Abstract.
31. Dhoma S, Cox C, Chung JH, et al. Chest tomography may predict histopathologic abnormalities in symptomatic deployers returning from Iraq and Afghanistan. Am J Respir Crit Care Med. 2014;189:A5102. Abstract.
32. Engelbrecht JP, McDonald EV, Gillies JA, Javanty RK, Casuccio G, Gertler AW. Characterizing mineral dusts and other aerosols from the Middle East – part I: ambient sampling. Inhal Toxicol. 2009;21(4):297-326.
33. Engelbrecht JP, McDonald EV, Gillies JA, Javanty RK, Casuccio G, Gertler AW. Characterizing mineral dusts and other aerosols from the Middle East – part 2: grab samples and re-suspensions. Inhal Toxicol. 2009;21(4):327-336.
34. Helmer DA, Rossignol M, Blatt M, Agarwal R, Teichman R, Lange G. Health and exposure concerns of veterans deployed to Iraq and Afghanistan. J Occup Environ Med. 2007;49(5):475-480.
35. Smith B, Wong CA, Smith TC, Boyko EJ, Gackstetter GD, Ryan MAK; for the Millennium Cohort Study Team. Newly reported respiratory symptoms and conditions among military personnel deployed to Iraq and Afghanistan: a prospective population-based study. Am J Epidemiol. 2009;170(11):1433-1442.
36. Abraham JH, DeBakey SF, Reid L, Zhou J, Baird CP. Does deployment to Iraq and Afghanistan affect respiratory health of US military personnel? J Occup Environ Med. 2012;54(6):740-745.
37. McAndrew LM, Teichman RF, Osinubi OY, Jasien JV, Quigley KS. Environmental exposure and health of Operation Enduring Freedom/Operation Iraqi Freedom veterans. J Occup Environ Med. 2012;54(6):665-669.
38. Quigley KS, McAndrew LM, Almeida L, et al. Prevalence of environmental and other military exposure concerns in Operation Enduring Freedom and Operation Iraqi Freedom veterans. J Occup Environ Med. 2012;54(6):659-664.
39. Teichman R. Exposures of concern to veterans returning from Afghanistan and Iraq. J Occup Environ Med. 2012;54(6):677-681.
Comparison of Carpal Tunnel Release Methods and Complications
Carpal tunnel release is one of the most common hand surgeries performed at the North Florida/South Georgia Veterans Health System (NFSGVHS). Depending on surgeon experience and comfort level, surgeries are performed through either the traditional open method or the endoscopic method, single or double port (Figures 1 and 2). The advantage of the endoscopic method is faster recovery and return to work; however, the endoscopic method requires more expensive equipment and a steeper learning curve for surgeons. Complications are uncommon but can create unsatisfactory patient experiences because of costly lost workdays and long travel distances to the medical facility.
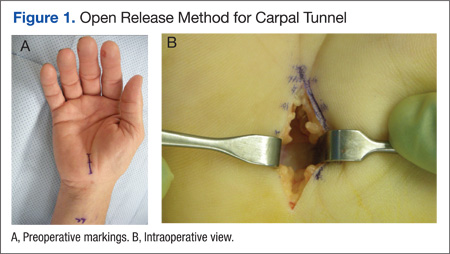
The purpose of this study was to compare the endoscopic method with the open carpal tunnel release method to determine whether there was an increased complication risk. Researchers anticipated that this information would help surgeons better inform patients of operative risks and prompt changes in NFSGVHS treatment plans to improve the quality of veteran care.
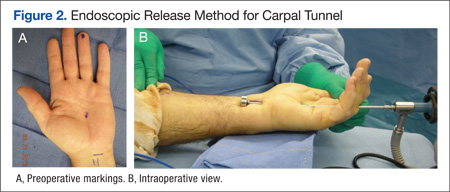
Methods
An Institutional Review Board- approved (#647-2011) retrospective review was done of patients who had carpal tunnel surgery performed by the NFSGVHS plastic surgery service from January 1, 2005, to December 31, 2010. Surgeries included in the review took place at the Malcom Randall VAMC in Gainesville and at the Lake City VAMC, both in Florida. Most of the surgeries included in the study were performed by a resident or fellow under the supervision of an attending physician. Eight different attending surgeons staffed the operations. Seven were board-certified or board-eligible plastic surgeons, 2 had advanced hand fellowship training, and 1 was a general surgeon with hand fellowship training. All hand fellowship-trained surgeons were in their first year of practice at the time of the study.
Only primary carpal tunnel releases were included in the study. Exclusion criteria included patients who were operated on by a service section other than the plastic surgery service (orthopedics or neurosurgery) and hands on which other procedures were performed during the same operation. Charts were reviewed for up to 1 year post surgery. Complications that required intervention were recorded. Researchers did not include pillar tenderness or an increase in occupational therapy visits as complications, due to the wide variety of patient tolerance to postoperative pain and varying motivation to return to work and daily routine.
Methods of release were endoscopic, open, or endoscopic converted to open. All but 6 of the completed endoscopic surgeries were performed using the double port Chow technique. The other 6 endoscopic surgeries were performed using the single port Agee technique at the distal wrist crease. There were 3 endoscopic converted to open cases that were performed using a single port, proximally-based technique in the midpalm. This method was abandoned after 3 unsuccessful endoscopic attempts, 1 resulting in digital nerve injury despite interactive cadaver labs prior to operative experience.
Endoscopic surgeries converted to open were recorded as open surgeries, because the patients had the full invasive experience. Researchers used the chi-square test and P value < .05 to compare the different methods of carpal tunnel release with identified complications.
Results and Complications
A total of 584 hands belonging to 452 patients were included in the study. Patients included 395 men and 57 women aged from 33 to 91 years. There were 271 endoscopic releases, 228 open releases, and 85 endoscopic converted to open releases. The NFSGVHS conversion rate was 23.7%. Complications in the converted cases (n = 4) were included in the open release results.
There were 40 complications in 38 hands. The overall complication rate was 6.5%. Complications noted were tendonitis presenting as De Quervain disease or trigger finger (9 endoscopic surgeries; 6 open surgeries), infection (2 endoscopic surgeries; 6 open surgeries), wound dehiscence (5 open surgeries), nerve injury (1 open surgery), respiratory distress (1 endoscopic), complex regional pain syndrome (1 open surgery), and scheduled returns to the operating room (OR) for recurrent, ongoing, or worsening symptoms (5 endoscopic surgeries; 5 open surgeries). Complications with an n > 1 were evaluated for statistical significance with P value < .05 (Table 1).
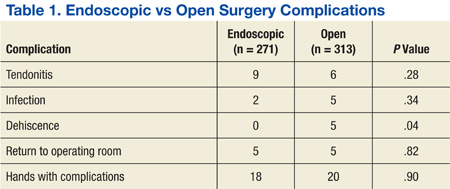
The NFSGVHS study had 10 patients return to the OR for open exploration (Table 2). Nine of these patients went back to the OR based on symptoms consistent with nerve conduction studies that had deteriorated compared with their preoperative studies. One endoscopic case was brought back to the OR for a suspected nerve injury without nerve conduction studies. Findings during reoperation included scar adhesions, incomplete release of ligaments, digital nerve injury, and negative explorations.
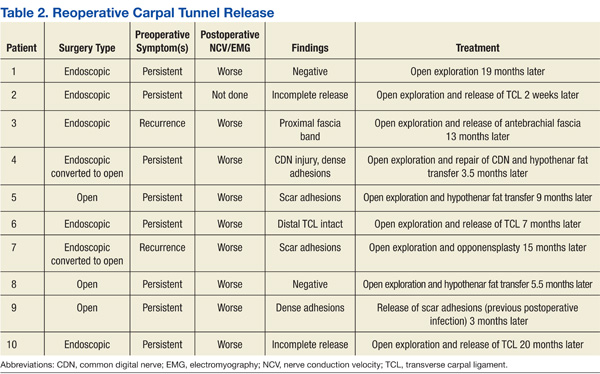
Two hypothenar fat transfers were performed to prevent scar adhesions in cases that had originally been open releases.1 Two of the open cases were endoscopic converted to open cases. One went back to the OR with a suspected nerve injury. Dense adhesions and an injured common digital nerve were identified and repaired. The second converted case that went back to the OR had a suspected, but unconfirmed, nerve injury to the motor branch. The diagnosis and treatment were delayed for more than a year due to the patient having other pressing medical and family concerns. An exploration found significant scar adhesions, and an opponensplasty was performed.
One patient had respiratory insufficiency secondary to chemical pneumonitis. The patient was sedated during an endoscopic carpal tunnel release, aspirated, and kept intubated in the intensive care unit until the morning after surgery.
An early complex regional pain syndrome diagnosis was made in a patient with underlying neuropathy and a preoperative “profound” median neuropathies diagnosis at the wrist with underlying peripheral neuropathy found on nerve conduction studies. The patient experienced an unusual amount of postoperative pain and edema after an uncomplicated open carpal tunnel release. This was treated with rapid intervention using anti- inflammatories and hand therapy. The patient also started a regimen of skin care, edema management, neuroreeducation, and contrast baths. Symptoms responded within a week.
There were 12 wound complications: 10 in open and 2 in endoscopic surgeries. Total wound complications were equally split between patients with and without diabetes. Infection and dehiscence were noted. Sutures were removed an average of 9.6 days after surgery in the patients whose wounds broke down. A statistically significant relationship was found only between the open method of release and wound dehiscence (P < .05).
There was no statistically significant difference in the overall complication rate in the NFSGVHS population when comparing endoscopic with open carpal tunnel release or when comparing the risk of postoperative tendonitis, wound infection, or return to the OR.
Discussion
Carpal tunnel syndrome was documented by James Paget in mid-19th century in reference to a distal radius fracture.2 It is the most common peripheral nerve compression, with an incidence ranging from 1 to 3 cases per 1,000 subjects per year and a prevalence of 50 cases per 1,000 subjects per year.3 In an active-duty U.S. military population, the incidence of carpal tunnel syndrome is 3.98 per 1,000 person years.4
Related: Risk Factors for Postoperative Complications in Trigger Finger Release
The endoscopic method of release was first introduced in 1989 by Okutsu and colleagues.5 About 500,000 carpal tunnel releases are now performed in the U.S. every year, with 50,000 performed endoscopically.3 There were 185 carpal tunnel releases (56 endoscopic and 129 open) performed at the NFSGVHS in 2012.6 The minimally invasive procedure was designed to preserve the overlying skin and fascia, promoting an earlier return to work and daily activities. This is particularly relevant for manual workers who desire rapid return of grip strength. Multiple published reports have found more rapid recovery based on a reduction in scar tenderness, increase in grip strength, or return to work.7-13 Patients seem to have equivalent results over the long term, ranging from 3 months to 1 year.7,8,13-15 Return to work was not evaluated in this study, because many patients were either retired or not working steadily.
The endoscopic method was criticized after its introduction due to its potential increase in major structural injury to the median nerve, ulnar nerve, palmar arch, ulnar artery, or flexor tendons.16 A meta-analysis found improved outcomes but a statistically significant higher complication rate in endoscopic, compared with open release (2.2% in endoscopic vs 1.2% in open).16 Referral patterns have found iatrogenic nerve injury in patients referred by surgeons without formal hand fellowship training.17 There is a wide variety of background training for surgeons who may offer carpal tunnel release, including plastic surgery, orthopedics, general surgery, and neurosurgery.
Major structural injuries were reported by hand surgeons using both open and endoscopic methods in a questionnaire sent to members of the American Society for Surgery of the Hand, indicating that either approach demands respect.18 A large review of the literature from 1966 to 2001 by Benson and colleagues found that the endoscopic approach was not more likely to produce injury to tendons, arteries, or nerves compared with the open approach and actually had a lower rate of structural damage (0.49% vs 0.19%).19 Researchers who conducted this study confirmed one common digital nerve injury in an endoscopic converted to open technique, using a distally-based port with the blade not being deployed via the endoscopic method. The endoscopic method has been found to have a higher rate of reversible nerve injury (neuropraxia) compared with the open technique.7,10,19
The NFSGVHS results found a higher rate of wound dehiscence. More frequent wound site complications, particularly infection, hypertrophic scar, and scar tenderness have been noted using the open method.3,8,20 This is probably due to the deeper and slightly larger incision used for the open method compared with the smaller and shallower incisions used for the endoscopic release.
There is the inevitable learning curve for the endoscopic release due to the more complicated nature of the procedure. The NFSGVHS conversion rate was 23.7% over the 5-year period from 2005 to 2010. All 3 fellowship- trained hand surgeons were in their first year of practice at the time of the study, so the authors anticipate a lower conversion rate in forthcoming studies. The NFSGVHS researchers did not consider converting to an open technique to be a complication and believe it is appropriate to teach plastic surgery residents and fellows to have a low threshold to convert when visualization is not optimal and the potential for significant injury exists. The learning curve and a higher conversion rate have been acknowledged by Beck and colleagues with no increase in morbidity.21
The authors anticipated finding an increased rate of tendonitis in the endoscopic method, as found by Goshtasby and colleagues, where trigger finger was found more frequently in the endoscopic patients.22 The NFSGVHS study found that the number of patients presenting for steroid injections to treat postoperative tendonitis in the hand and wrist was not statistically significant when comparing the 2 surgical methods of release (3.3% in endoscopic vs 1.9% in open; P = .28).
The NFSGVHS rate of return to the OR within a year of surgery was 1.7%. The researchers from NFSGHVS anticipated a higher rate of return to the OR for ongoing symptoms secondary to incomplete release of the transverse carpal ligament. Published studies have found an intact retinaculum to be a cause of persistent symptoms when smaller incisions are used.23,24 Five endoscopic cases and 5 open cases eventually returned to the OR for carpal tunnel exploration. Two of the patients were classified as recurrent, because they had improvement of symptoms initially but presented > 6 months later with new symptoms. Eight of the patients were classified as persistent, because they did not have an extended period of relief of preoperative symptoms (Table 2).25 There was no statistically significant difference in return to the OR in the 2 study groups. The NFSGVHS researchers did note a trend in more incomplete nerve releases in the endoscopic group and more scar adhesions as the etiology of symptoms in the open group who went back to surgery.
Published studies have found no difference in overall complication rates when comparing the open with the endoscopic method of release, which is consistent with NFSGVHS data.8,11,12,26
A limitation of the current retrospective study is the large number of providers who both operated on the patients and documented their postoperative findings. The strength of the study is that VA patients tend to stay within the VISN for their health care so postoperative problems will be identified and routed to the plastic surgery service for evaluation and treatment.
Clinical implications for the NFSGVHS practice are that surgeons can confidently offer both the open and endoscopic surgeries without an overall risk of increased complications to patients. Patients who are identified as higher risk for wound dehiscence, such as those who place an unusual amount of pressure on their palms due to assisted walking devices or are at a higher risk of falling onto the surgical site, will be steered toward an endoscopic surgery. The NFSGVHS began a splinting protocol in the early postoperative period that was not previously used on those select patients who have open carpal tunnel releases.
Conclusion
Wound dehiscence was the only statistically significant complication found in the NFSGVHS veteran population when comparing open with endoscopic carpal tunnel release. This can potentially be prevented in future patients by delaying the removal of sutures and prolonging the use of a protective dressing in patients who undergo open release. There was not a statistically significant increase in overall complications when using the minimally invasive method of release, which is consistent with existing literature.
Acknowledgement
This material is the result of work supported with resources and the use of facilities at the Malcom Randall VAMC.
Author disclosures
The authors report no actual or potential conflicts of interest with regard to this article.
Disclaimer
The opinions expressed herein are those of the authors and do not necessarily reflect those of Federal Practitioner, Frontline Medical Communications Inc., the U.S. Government, or any of its agencies. This article may discuss unlabeled or investigational use of certain drugs. Please review complete prescribing information for specific drugs or drug combinations—including indications, contraindications, warnings, and adverse effects—before administering pharmacologic therapy to patients.
1. Chrysopoulo MT, Greenberg JA, Kleinman WB. The hypothenar fat pad transposition flap: a modified surgical technique. Tech Hand Up Extrem Surg. 2006;10(3):150-156.
2. Paget J. Lectures on Surgical Pathology Delivered at the Royal College of Surgeons of England. London, England: Longman, Green, Brown, and Longmans; 1853.
3. Mintalucci DJ, Leinberry CF Jr. Open versus endoscopic carpal tunnel release. Orthop Clin North Am. 2012;43(4):431-437.
4. Wolf JM, Mountcastle S, Owens BD. Incidence of carpal tunnel syndrome in the US military population. Hand (NY). 2009;4(3):289-293.
5. Okutsu I, Ninomiya S, Takatori Y, Ugawa Y. Endoscopic management of carpal tunnel syndrome. Arthroscopy. 1989;5(1):11-18.
6. U.S. Department of Veterans Affairs. Health Information Systems and Technology Architecture Database, Ambulatory Surgical Case Load Report, 2012. Accessed March 14, 2013.
7. Larsen MB, Sørensen AI, Crone KL, Weis T, Boeckstyns ME. Carpal tunnel release: a randomized comparison of three surgical methods. J Hand Surg Eur Vol. 2013;38(6):646-650.
8. Malhotra R, Kiran EK, Dua A, Mallinath SG, Bhan S. Endoscopic versus open carpal tunnel release: a short-term comparative study. Indian J Orthop. 2007;41(1):57-61.
9. Sabesan VJ, Pedrotty D, Urbaniak JR, Aldridge JM 3rd. An evidence-based review of a single surgeon’s experience with endoscopic carpal tunnel release. J Surg Orthop Adv. 2012;21(3):117-121.
10. Thoma A, Veltri K, Haines T, Duku E. A meta-analysis of randomized controlled trials comparing endoscopic and open carpal tunnel decompression. Plast Reconstr Surg. 2004;114(5):1137-1146.
11. Tian Y, Zhao H, Wang T. Prospective comparison of endoscopic and open surgical methods for carpal tunnel syndrome. Chin Med Sci J. 2007;22(2):104-107.
12. Trumble TE, Diao E, Abrams RA, Gilbert-Anderson MM. Single-portal endoscopic carpal tunnel release compared with open release: a prospective, randomized trial. J Bone Joint Surg Am. 2002;84-A(7):1107-1115.
13. Vasiliadis HS, Xenakis TA, Mitsionis G, Paschos N, Georgoulis A. Endoscopic versus open carpal tunnel release. Arthroscopy. 2010:26(1):26-33.
14. Macdermid JC, Richards RS, Roth JH, Ross DC, King GJ. Endoscopic versus open carpal tunnel release: a randomized trial. J Hand Surg Am. 2003;28(3):475-480.
15. Aslani HR, Alizadeh K, Eajazi A, et al. Comparison of carpal tunnel release with three different techniques. Clin Neurol Neurosurg. 2012;114(7):965-968.
16. Kohanzadeh S, Herrera FA, Dobke M. Outcomes of open and endoscopic carpal tunnel release: a meta-analysis. Hand (NY). 2012;7(3):247-251.
17. Azari KK, Spiess AM, Buterbaugh GA, Imbriglia JE. Major nerve injuries associated with carpal tunnel release. Plast Reconstr Surg. 2007;119(6):1977-1978.
18. Palmer AK, Toivonen DA. Complications of endoscopic and open carpal tunnel release. J Hand Surg Am. 1999;24(3):561-565.
19. Benson LS, Bare AA, Nagle DJ, Harder VS, Williams CS, Visotsky JL. Complications of endoscopic and open carpal tunnel release. Arthroscopy. 2006;22(9):919-924, 924.e1-e2.
20. Gerritsen AA, Uitdehaag BM, van Geldere D, Scholten RJ, de Vet HC, Bouter LM. Systematic review of randomized clinical trials of surgical treatment for carpal tunnel syndrome. Br J Surg. 2001;88(10):1285-1295.
21. Beck JD, Deegan JH, Rhoades D, Klena JC. Results of endoscopic carpal tunnel release relative to surgeon experience with the Agee technique. J Hand Surg Am. 2011;36(1):61-64.
22. Goshtasby PH, Wheeler DR, Moy OJ. Risk factors for trigger finger occurrence after carpal tunnel release. Hand Surg. 2010;15(2):81-87.
23. Assmus H, Dombert T, Staub F. Reoperations for CTS because of recurrence or for correction [article in German]. Handchir Mikrochir Plast Chir. 2006;38(5):306-311.
24. Frik A, Baumeister RG. Re-intervention after carpal tunnel release [article in German]. Handchir Mikrochir Plast Chir. 2006;38(5):312-316.
25. Jones NF, Ahn HC, Eo S. Revision surgery for persistent and recurrent carpal tunnel syndrome and for failed carpal tunnel release. Plast Reconstr Surg. 2012;129(3):683-692.
26. Ferdinand RD, MacLean JG. Endoscopic versus open carpal tunnel release in bilateral carpal tunnel syndrome. A prospective, randomised, blinded assessment. J Bone Joint Surg Br. 2002:84(3):375-379.
Carpal tunnel release is one of the most common hand surgeries performed at the North Florida/South Georgia Veterans Health System (NFSGVHS). Depending on surgeon experience and comfort level, surgeries are performed through either the traditional open method or the endoscopic method, single or double port (Figures 1 and 2). The advantage of the endoscopic method is faster recovery and return to work; however, the endoscopic method requires more expensive equipment and a steeper learning curve for surgeons. Complications are uncommon but can create unsatisfactory patient experiences because of costly lost workdays and long travel distances to the medical facility.
The purpose of this study was to compare the endoscopic method with the open carpal tunnel release method to determine whether there was an increased complication risk. Researchers anticipated that this information would help surgeons better inform patients of operative risks and prompt changes in NFSGVHS treatment plans to improve the quality of veteran care.
Methods
An Institutional Review Board- approved (#647-2011) retrospective review was done of patients who had carpal tunnel surgery performed by the NFSGVHS plastic surgery service from January 1, 2005, to December 31, 2010. Surgeries included in the review took place at the Malcom Randall VAMC in Gainesville and at the Lake City VAMC, both in Florida. Most of the surgeries included in the study were performed by a resident or fellow under the supervision of an attending physician. Eight different attending surgeons staffed the operations. Seven were board-certified or board-eligible plastic surgeons, 2 had advanced hand fellowship training, and 1 was a general surgeon with hand fellowship training. All hand fellowship-trained surgeons were in their first year of practice at the time of the study.
Only primary carpal tunnel releases were included in the study. Exclusion criteria included patients who were operated on by a service section other than the plastic surgery service (orthopedics or neurosurgery) and hands on which other procedures were performed during the same operation. Charts were reviewed for up to 1 year post surgery. Complications that required intervention were recorded. Researchers did not include pillar tenderness or an increase in occupational therapy visits as complications, due to the wide variety of patient tolerance to postoperative pain and varying motivation to return to work and daily routine.
Methods of release were endoscopic, open, or endoscopic converted to open. All but 6 of the completed endoscopic surgeries were performed using the double port Chow technique. The other 6 endoscopic surgeries were performed using the single port Agee technique at the distal wrist crease. There were 3 endoscopic converted to open cases that were performed using a single port, proximally-based technique in the midpalm. This method was abandoned after 3 unsuccessful endoscopic attempts, 1 resulting in digital nerve injury despite interactive cadaver labs prior to operative experience.
Endoscopic surgeries converted to open were recorded as open surgeries, because the patients had the full invasive experience. Researchers used the chi-square test and P value < .05 to compare the different methods of carpal tunnel release with identified complications.
Results and Complications
A total of 584 hands belonging to 452 patients were included in the study. Patients included 395 men and 57 women aged from 33 to 91 years. There were 271 endoscopic releases, 228 open releases, and 85 endoscopic converted to open releases. The NFSGVHS conversion rate was 23.7%. Complications in the converted cases (n = 4) were included in the open release results.
There were 40 complications in 38 hands. The overall complication rate was 6.5%. Complications noted were tendonitis presenting as De Quervain disease or trigger finger (9 endoscopic surgeries; 6 open surgeries), infection (2 endoscopic surgeries; 6 open surgeries), wound dehiscence (5 open surgeries), nerve injury (1 open surgery), respiratory distress (1 endoscopic), complex regional pain syndrome (1 open surgery), and scheduled returns to the operating room (OR) for recurrent, ongoing, or worsening symptoms (5 endoscopic surgeries; 5 open surgeries). Complications with an n > 1 were evaluated for statistical significance with P value < .05 (Table 1).
The NFSGVHS study had 10 patients return to the OR for open exploration (Table 2). Nine of these patients went back to the OR based on symptoms consistent with nerve conduction studies that had deteriorated compared with their preoperative studies. One endoscopic case was brought back to the OR for a suspected nerve injury without nerve conduction studies. Findings during reoperation included scar adhesions, incomplete release of ligaments, digital nerve injury, and negative explorations.
Two hypothenar fat transfers were performed to prevent scar adhesions in cases that had originally been open releases.1 Two of the open cases were endoscopic converted to open cases. One went back to the OR with a suspected nerve injury. Dense adhesions and an injured common digital nerve were identified and repaired. The second converted case that went back to the OR had a suspected, but unconfirmed, nerve injury to the motor branch. The diagnosis and treatment were delayed for more than a year due to the patient having other pressing medical and family concerns. An exploration found significant scar adhesions, and an opponensplasty was performed.
One patient had respiratory insufficiency secondary to chemical pneumonitis. The patient was sedated during an endoscopic carpal tunnel release, aspirated, and kept intubated in the intensive care unit until the morning after surgery.
An early complex regional pain syndrome diagnosis was made in a patient with underlying neuropathy and a preoperative “profound” median neuropathies diagnosis at the wrist with underlying peripheral neuropathy found on nerve conduction studies. The patient experienced an unusual amount of postoperative pain and edema after an uncomplicated open carpal tunnel release. This was treated with rapid intervention using anti- inflammatories and hand therapy. The patient also started a regimen of skin care, edema management, neuroreeducation, and contrast baths. Symptoms responded within a week.
There were 12 wound complications: 10 in open and 2 in endoscopic surgeries. Total wound complications were equally split between patients with and without diabetes. Infection and dehiscence were noted. Sutures were removed an average of 9.6 days after surgery in the patients whose wounds broke down. A statistically significant relationship was found only between the open method of release and wound dehiscence (P < .05).
There was no statistically significant difference in the overall complication rate in the NFSGVHS population when comparing endoscopic with open carpal tunnel release or when comparing the risk of postoperative tendonitis, wound infection, or return to the OR.
Discussion
Carpal tunnel syndrome was documented by James Paget in mid-19th century in reference to a distal radius fracture.2 It is the most common peripheral nerve compression, with an incidence ranging from 1 to 3 cases per 1,000 subjects per year and a prevalence of 50 cases per 1,000 subjects per year.3 In an active-duty U.S. military population, the incidence of carpal tunnel syndrome is 3.98 per 1,000 person years.4
Related: Risk Factors for Postoperative Complications in Trigger Finger Release
The endoscopic method of release was first introduced in 1989 by Okutsu and colleagues.5 About 500,000 carpal tunnel releases are now performed in the U.S. every year, with 50,000 performed endoscopically.3 There were 185 carpal tunnel releases (56 endoscopic and 129 open) performed at the NFSGVHS in 2012.6 The minimally invasive procedure was designed to preserve the overlying skin and fascia, promoting an earlier return to work and daily activities. This is particularly relevant for manual workers who desire rapid return of grip strength. Multiple published reports have found more rapid recovery based on a reduction in scar tenderness, increase in grip strength, or return to work.7-13 Patients seem to have equivalent results over the long term, ranging from 3 months to 1 year.7,8,13-15 Return to work was not evaluated in this study, because many patients were either retired or not working steadily.
The endoscopic method was criticized after its introduction due to its potential increase in major structural injury to the median nerve, ulnar nerve, palmar arch, ulnar artery, or flexor tendons.16 A meta-analysis found improved outcomes but a statistically significant higher complication rate in endoscopic, compared with open release (2.2% in endoscopic vs 1.2% in open).16 Referral patterns have found iatrogenic nerve injury in patients referred by surgeons without formal hand fellowship training.17 There is a wide variety of background training for surgeons who may offer carpal tunnel release, including plastic surgery, orthopedics, general surgery, and neurosurgery.
Major structural injuries were reported by hand surgeons using both open and endoscopic methods in a questionnaire sent to members of the American Society for Surgery of the Hand, indicating that either approach demands respect.18 A large review of the literature from 1966 to 2001 by Benson and colleagues found that the endoscopic approach was not more likely to produce injury to tendons, arteries, or nerves compared with the open approach and actually had a lower rate of structural damage (0.49% vs 0.19%).19 Researchers who conducted this study confirmed one common digital nerve injury in an endoscopic converted to open technique, using a distally-based port with the blade not being deployed via the endoscopic method. The endoscopic method has been found to have a higher rate of reversible nerve injury (neuropraxia) compared with the open technique.7,10,19
The NFSGVHS results found a higher rate of wound dehiscence. More frequent wound site complications, particularly infection, hypertrophic scar, and scar tenderness have been noted using the open method.3,8,20 This is probably due to the deeper and slightly larger incision used for the open method compared with the smaller and shallower incisions used for the endoscopic release.
There is the inevitable learning curve for the endoscopic release due to the more complicated nature of the procedure. The NFSGVHS conversion rate was 23.7% over the 5-year period from 2005 to 2010. All 3 fellowship- trained hand surgeons were in their first year of practice at the time of the study, so the authors anticipate a lower conversion rate in forthcoming studies. The NFSGVHS researchers did not consider converting to an open technique to be a complication and believe it is appropriate to teach plastic surgery residents and fellows to have a low threshold to convert when visualization is not optimal and the potential for significant injury exists. The learning curve and a higher conversion rate have been acknowledged by Beck and colleagues with no increase in morbidity.21
The authors anticipated finding an increased rate of tendonitis in the endoscopic method, as found by Goshtasby and colleagues, where trigger finger was found more frequently in the endoscopic patients.22 The NFSGVHS study found that the number of patients presenting for steroid injections to treat postoperative tendonitis in the hand and wrist was not statistically significant when comparing the 2 surgical methods of release (3.3% in endoscopic vs 1.9% in open; P = .28).
The NFSGVHS rate of return to the OR within a year of surgery was 1.7%. The researchers from NFSGHVS anticipated a higher rate of return to the OR for ongoing symptoms secondary to incomplete release of the transverse carpal ligament. Published studies have found an intact retinaculum to be a cause of persistent symptoms when smaller incisions are used.23,24 Five endoscopic cases and 5 open cases eventually returned to the OR for carpal tunnel exploration. Two of the patients were classified as recurrent, because they had improvement of symptoms initially but presented > 6 months later with new symptoms. Eight of the patients were classified as persistent, because they did not have an extended period of relief of preoperative symptoms (Table 2).25 There was no statistically significant difference in return to the OR in the 2 study groups. The NFSGVHS researchers did note a trend in more incomplete nerve releases in the endoscopic group and more scar adhesions as the etiology of symptoms in the open group who went back to surgery.
Published studies have found no difference in overall complication rates when comparing the open with the endoscopic method of release, which is consistent with NFSGVHS data.8,11,12,26
A limitation of the current retrospective study is the large number of providers who both operated on the patients and documented their postoperative findings. The strength of the study is that VA patients tend to stay within the VISN for their health care so postoperative problems will be identified and routed to the plastic surgery service for evaluation and treatment.
Clinical implications for the NFSGVHS practice are that surgeons can confidently offer both the open and endoscopic surgeries without an overall risk of increased complications to patients. Patients who are identified as higher risk for wound dehiscence, such as those who place an unusual amount of pressure on their palms due to assisted walking devices or are at a higher risk of falling onto the surgical site, will be steered toward an endoscopic surgery. The NFSGVHS began a splinting protocol in the early postoperative period that was not previously used on those select patients who have open carpal tunnel releases.
Conclusion
Wound dehiscence was the only statistically significant complication found in the NFSGVHS veteran population when comparing open with endoscopic carpal tunnel release. This can potentially be prevented in future patients by delaying the removal of sutures and prolonging the use of a protective dressing in patients who undergo open release. There was not a statistically significant increase in overall complications when using the minimally invasive method of release, which is consistent with existing literature.
Acknowledgement
This material is the result of work supported with resources and the use of facilities at the Malcom Randall VAMC.
Author disclosures
The authors report no actual or potential conflicts of interest with regard to this article.
Disclaimer
The opinions expressed herein are those of the authors and do not necessarily reflect those of Federal Practitioner, Frontline Medical Communications Inc., the U.S. Government, or any of its agencies. This article may discuss unlabeled or investigational use of certain drugs. Please review complete prescribing information for specific drugs or drug combinations—including indications, contraindications, warnings, and adverse effects—before administering pharmacologic therapy to patients.
1. Chrysopoulo MT, Greenberg JA, Kleinman WB. The hypothenar fat pad transposition flap: a modified surgical technique. Tech Hand Up Extrem Surg. 2006;10(3):150-156.
2. Paget J. Lectures on Surgical Pathology Delivered at the Royal College of Surgeons of England. London, England: Longman, Green, Brown, and Longmans; 1853.
3. Mintalucci DJ, Leinberry CF Jr. Open versus endoscopic carpal tunnel release. Orthop Clin North Am. 2012;43(4):431-437.
4. Wolf JM, Mountcastle S, Owens BD. Incidence of carpal tunnel syndrome in the US military population. Hand (NY). 2009;4(3):289-293.
5. Okutsu I, Ninomiya S, Takatori Y, Ugawa Y. Endoscopic management of carpal tunnel syndrome. Arthroscopy. 1989;5(1):11-18.
6. U.S. Department of Veterans Affairs. Health Information Systems and Technology Architecture Database, Ambulatory Surgical Case Load Report, 2012. Accessed March 14, 2013.
7. Larsen MB, Sørensen AI, Crone KL, Weis T, Boeckstyns ME. Carpal tunnel release: a randomized comparison of three surgical methods. J Hand Surg Eur Vol. 2013;38(6):646-650.
8. Malhotra R, Kiran EK, Dua A, Mallinath SG, Bhan S. Endoscopic versus open carpal tunnel release: a short-term comparative study. Indian J Orthop. 2007;41(1):57-61.
9. Sabesan VJ, Pedrotty D, Urbaniak JR, Aldridge JM 3rd. An evidence-based review of a single surgeon’s experience with endoscopic carpal tunnel release. J Surg Orthop Adv. 2012;21(3):117-121.
10. Thoma A, Veltri K, Haines T, Duku E. A meta-analysis of randomized controlled trials comparing endoscopic and open carpal tunnel decompression. Plast Reconstr Surg. 2004;114(5):1137-1146.
11. Tian Y, Zhao H, Wang T. Prospective comparison of endoscopic and open surgical methods for carpal tunnel syndrome. Chin Med Sci J. 2007;22(2):104-107.
12. Trumble TE, Diao E, Abrams RA, Gilbert-Anderson MM. Single-portal endoscopic carpal tunnel release compared with open release: a prospective, randomized trial. J Bone Joint Surg Am. 2002;84-A(7):1107-1115.
13. Vasiliadis HS, Xenakis TA, Mitsionis G, Paschos N, Georgoulis A. Endoscopic versus open carpal tunnel release. Arthroscopy. 2010:26(1):26-33.
14. Macdermid JC, Richards RS, Roth JH, Ross DC, King GJ. Endoscopic versus open carpal tunnel release: a randomized trial. J Hand Surg Am. 2003;28(3):475-480.
15. Aslani HR, Alizadeh K, Eajazi A, et al. Comparison of carpal tunnel release with three different techniques. Clin Neurol Neurosurg. 2012;114(7):965-968.
16. Kohanzadeh S, Herrera FA, Dobke M. Outcomes of open and endoscopic carpal tunnel release: a meta-analysis. Hand (NY). 2012;7(3):247-251.
17. Azari KK, Spiess AM, Buterbaugh GA, Imbriglia JE. Major nerve injuries associated with carpal tunnel release. Plast Reconstr Surg. 2007;119(6):1977-1978.
18. Palmer AK, Toivonen DA. Complications of endoscopic and open carpal tunnel release. J Hand Surg Am. 1999;24(3):561-565.
19. Benson LS, Bare AA, Nagle DJ, Harder VS, Williams CS, Visotsky JL. Complications of endoscopic and open carpal tunnel release. Arthroscopy. 2006;22(9):919-924, 924.e1-e2.
20. Gerritsen AA, Uitdehaag BM, van Geldere D, Scholten RJ, de Vet HC, Bouter LM. Systematic review of randomized clinical trials of surgical treatment for carpal tunnel syndrome. Br J Surg. 2001;88(10):1285-1295.
21. Beck JD, Deegan JH, Rhoades D, Klena JC. Results of endoscopic carpal tunnel release relative to surgeon experience with the Agee technique. J Hand Surg Am. 2011;36(1):61-64.
22. Goshtasby PH, Wheeler DR, Moy OJ. Risk factors for trigger finger occurrence after carpal tunnel release. Hand Surg. 2010;15(2):81-87.
23. Assmus H, Dombert T, Staub F. Reoperations for CTS because of recurrence or for correction [article in German]. Handchir Mikrochir Plast Chir. 2006;38(5):306-311.
24. Frik A, Baumeister RG. Re-intervention after carpal tunnel release [article in German]. Handchir Mikrochir Plast Chir. 2006;38(5):312-316.
25. Jones NF, Ahn HC, Eo S. Revision surgery for persistent and recurrent carpal tunnel syndrome and for failed carpal tunnel release. Plast Reconstr Surg. 2012;129(3):683-692.
26. Ferdinand RD, MacLean JG. Endoscopic versus open carpal tunnel release in bilateral carpal tunnel syndrome. A prospective, randomised, blinded assessment. J Bone Joint Surg Br. 2002:84(3):375-379.
OSA and Outcomes in Ward Patients
Obstructive sleep apnea (OSA) is an increasingly prevalent condition characterized by intermittent airway obstruction during sleep, which leads to hypoxemia, hypercapnia, and fragmented sleep. The current prevalence estimates of moderate to severe OSA (apnea‐hypopnea index 15, measured as events/hour) in middle‐aged adults are approximately 13% in men and 6% in women.[1] OSA is a well‐described independent risk factor for long‐term neurocognitive, cardiovascular, and cerebrovascular morbidity and mortality.[2, 3, 4, 5, 6]
Recent studies have also identified OSA as an independent risk factor for adverse perioperative outcomes, including endotracheal intubation, intensive care unit (ICU) transfer, and increased length of stay.[7, 8, 9, 10, 11] Paradoxically, despite an increase in the risk of complications, several of these studies did not find an association between in‐hospital death and OSA even after controlling for potential confounders.[9, 10, 11] Furthermore, a recent study of patients hospitalized for pneumonia reported increased rates of clinical deterioration and mechanical ventilation, but also lower odds of inpatient mortality in patients with OSA.[12]
These studies may have been limited by the absence of physiologic data, which prevented controlling for severity of illness. It is also unclear whether these previously described associations between OSA and adverse clinical outcomes hold true for general hospital inpatients. OSA may be worsened by medications frequently used in hospitals, such as narcotics and benzodiazepines. Opiate use contributes to both central and obstructive sleep apneas,[13, 14] and benzodiazepines are known to produce airway smooth muscle relaxation and can cause respiratory depression.[15] In fact, the use of benzodiazepines has been implicated in the unmasking of OSA in patients with previously undiagnosed sleep‐disordered breathing.[16] These findings suggest mechanisms by which OSA could contribute to an increased risk in hospital ward patients for rapid response team (RRT) activation, ICU transfer, cardiac arrest, and in‐hospital death.
The aim of this study was to determine the independent association between OSA and in‐hospital mortality in ward patients. We also aimed to investigate the association of OSA with clinical deterioration on the wards, while controlling for patient characteristics, initial physiology, and severity of illness.
MATERIALS AND METHODS
Setting and Study Population
This observational cohort study was performed at an academic tertiary care medical center with approximately 500 beds. Data were obtained from all adult patients hospitalized on the wards between November 1, 2008 and October 1, 2013. Our hospital has utilized an RRT, led by a critical care nurse and respiratory therapist with hospitalist and pharmacist consultation available upon request, since 2008. This team is separate from the team that responds to a cardiac arrest. Criteria for RRT activation include tachypnea, tachycardia, hypotension, and staff worry, but specific vital sign thresholds are not specified.
The study analyzed deidentified data from the hospital's Clinical Research Data Warehouse, which is maintained by the Center for Research Informatics at The University of Chicago. The study protocol was approved by the University of Chicago Institutional Review Board (IRB #16995A).
Data Collection
Patient age, sex, race, body mass index (BMI), and location prior to ward admission (ie, whether they were admitted from the emergency department, transferred from the ICU, or directly admitted from clinic or home) were collected. Patients who underwent surgery during their admission were identified using the hospital's admission‐transfer‐discharge database. In addition, routinely collected vital signs (eg, respiratory rate, blood pressure, heart rate) were obtained from the electronic health record (Epic, Verona, WI). To determine severity of illness, the first set of vital signs measured on hospital presentation were utilized to calculate the cardiac arrest risk triage (CART) score, a vital‐signbased early warning score we previously developed and validated for predicting adverse events in our population.[17] The CART score ranges from 0 to 57, with points assigned for abnormalities in respiratory rate, heart rate, diastolic blood pressure, and age. If any vital sign was missing, the next available measurement was pulled into the set. If any vital sign remained missing after this change, the median value for that particular location (ie, wards, ICU, or emergency department) was imputed as previously described.[18, 19]
Patients with OSA were identified by the following International Classification of Diseases, Ninth Revision, Clinical Modification (ICD‐9‐CM) codes using inpatient and outpatient medical records: 278.03, 327.20, 327.23, 327.29, 780.51, 780.53, and 780.57 (Table 1). Data on other patient comorbidities, including coronary artery disease, congestive heart failure, arrhythmias, uncomplicated and complicated diabetes mellitus, hypertension, and cerebrovascular disease were collected using specific ICD‐9‐CM codes from both inpatient and outpatient records. Information on insurance payer was also collected from the hospital's billing database. Insurance payers were grouped into the following categories: private payer, Medicare/Medicaid, and no insurance. Patients with both public and private payers were counted as being privately insured.
| Diagnosis Code | Description | % of Sleep Apnea Diagnosesa |
|---|---|---|
| ||
| 327.23 | Obstructive sleep apnea | 65.6 |
| 780.57 | Unspecified sleep apnea | 19.4 |
| 780.53 | Hypersomnia with sleep apnea, unspecified | 11.7 |
| 780.51 | Insomnia with sleep apnea, unspecified | 1.5 |
| 327.2 | Organic sleep apnea, unspecified | 0.2 |
| 278.03 | Obesity hypoventilation syndrome | 1.7 |
Outcomes
The primary outcome of the study was in‐hospital mortality. Secondary outcomes included length of stay, RRT activation, transfer to the ICU, endotracheal intubation, cardiac arrest (defined as a loss of pulse with attempted resuscitation) on the wards, and a composite outcome of RRT activation, ICU transfer, and death. Because cardiac arrests on the wards result either in death or ICU transfer following successful resuscitation, this variable was omitted from the composite outcome. Cardiac arrests were identified using a prospectively validated quality improvement database that has been described previously.[20] ICU transfer was identified using the hospital's admission‐transfer‐discharge database. Only the index cardiac arrest, intubation, RRT, or ICU transfer for each admission was used in the study, but more than 1 type of outcome could occur for each patient (eg, a patient who died following an unsuccessful resuscitation attempt would count as both a cardiac arrest and a death).
Statistical Analysis
Patient characteristics were compared using Student t tests, Wilcoxon rank sum tests, and 2 statistics, as appropriate. Unadjusted logistic regression models were fit to estimate the change in odds of each adverse event and a composite outcome of any event for patient admissions with OSA compared to those without OSA. Adjusted logistic regression models were then fit for each outcome to control for patient characteristics (age, sex, BMI, insurance status, and individual comorbidities), location immediately prior to ward admission, and admission severity of illness (as measured by CART score). In the adjusted model, CART score, age, and number of comorbidities were entered linearly, with the addition of squared terms for age and CART score, as these variables showed nonlinear associations with the outcomes of interest. Race, surgical status, insurance payer, location prior to ward, and BMI (underweight, <18.5 kg/m2; normal weight, 18.524.9 kg/m2; overweight, 25.029.9 kg/m2; obese, 3039.9 kg/m2; and severely obese, (40 kg/m2) were modeled as categorical variables.
Given that an individual patient could experience multiple hospitalizations during the study period, we performed a sensitivity analysis of all adjusted and unadjusted models using a single randomly selected hospitalization for each unique patient. In addition, we performed a sensitivity analysis of all patients who were not admitted to the ICU prior to their ward stay. Finally, we performed subgroup analyses of all unadjusted and adjusted models for each BMI category and surgical status.
All tests of significance used a 2‐sided P value <0.05. Statistical analyses were completed using Stata version 12.0 (StataCorp, College Station, TX).
RESULTS
Patient Characteristics
During the study period, 93,676 patient admissions from 53,150 unique patients resulted in the occurrence of 1,069 RRT activations, 6,305 ICU transfers, and 1,239 in‐hospital deaths. Within our sample, 40,034 patients had at least 1 inpatient record and at least 1 outpatient record. OSA diagnosis was present in 5,625 patients (10.6% of the total sample), with 4,748 patients having an OSA diagnosis code entered during a hospitalization, 2,143 with an OSA diagnosis code entered during an outpatient encounter, and 877 with both inpatient and outpatient diagnosis codes. These patients identified as having OSA contributed 12,745 (13.6%) hospital admissions.
Patients with an OSA diagnosis were more likely to be older (median age 59 years [interquartile range 4968] vs 55 years [3868]), male (49% vs 42%), overweight or obese (88% vs 62%), and more likely to carry diagnoses of diabetes (53.8% vs 25.5%), hypertension (45.3% vs 18.2%), arrhythmias (44.4% vs 26.7%), coronary artery disease (46.8% vs 23.5%), heart failure (35.8% vs 13.5%), and cerebrovascular disease (13.5% vs 8.1%) than patients without an OSA diagnosis (all comparisons significant, P < 0.001) (Table 2).
| Characteristic | Patient Admissions With OSA Diagnoses, n = 12,745 | Patient Admissions Without OSA Diagnoses, n = 80,931 | P Value |
|---|---|---|---|
| |||
| Age, y, median (IQR) | 59 (4968) | 55 (3868) | <0.001 |
| Female, n (%) | 6,514 (51%) | 47,202 (58%) | <0.001 |
| Race, n (%) | <0.001 | ||
| White | 4,205 (33%) | 30,119 (37%) | |
| Black/African American | 7,024 (55%) | 38,561 (48%) | |
| Asian | 561 (4.4%) | 3,419 (4.2%) | |
| American Indian or Native Alaskan | 20 (0.2%) | 113 (0.1%) | |
| More than 1 race | 127 (1%) | 843 (1%) | |
| Race unknown | 808 (6%) | 7,876 (10%) | |
| Insurance status, n (%) | <0.001 | ||
| Private | 4,484 (35%) | 32,467 (40%) | |
| Medicare/Medicaid | 8,201 (64%) | 42,208 (58%) | |
| Uninsured | 53 (0.4%) | 1,190 (1%) | |
| Unknown | 4 (<0.1%) | 16 (<0.1%) | |
| Location prior to wards, n (%) | <0.001 | ||
| ICU | 1,400 (11%) | 8,065 (10%) | |
| Emergency department | 4,633 (36%) | 25,170 (31%) | |
| Ambulatory admission | 6,712 (53%) | 47,696 (59%) | |
| Body mass index, kg/m2, n (%) | <0.001 | ||
| Normal (18.525) | 1,431 (11%) | 26,560 (33%) | |
| Underweight (<18.5) | 122 (1%) | 4,256 (5%) | |
| Overweight (2530) | 2,484 (20%) | 23,761 (29%) | |
| Obese (3040) | 4,959 (39%) | 19,132 (24%) | |
| Severely obese (40) | 3,745 (29%) | 7,171 (9%) | |
| Initial cardiac arrest risk triage score, median (IQR) | 4 (09) | 4 (09) | <0.001 |
| Underwent surgery, n (%) | 4,482 (35%) | 28,843 (36%) | 0.3 |
| Comorbidities | |||
| Number of comorbidities, median (IQR) | 2 (14) | 1 (02) | <0.001 |
| Arrhythmia | 5,659 (44%) | 21,581 (27%) | <0.001 |
| Diabetes mellitus | 6,855 (54%) | 20,641 (26%) | <0.001 |
| Hypertension | 5,777 (45%) | 14,728 (18%) | <0.001 |
| Coronary artery disease | 5,958 (47%) | 18,979 (23%) | <0.001 |
| Cerebrovascular accident | 1,725 (14%) | 6,556 (8%) | <0.001 |
| Congestive heart failure | 4,559 (36%) | 10,919 (13%) | <0.001 |
Complications and Adverse Outcomes
In the unadjusted analyses, the overall incidence of adverse outcomes was higher among patient admissions with a diagnosis of OSA compared to those without OSA (Table 3). Those with OSA were more likely to experience RRT activation (1.5% vs 1.1%), ICU transfer (8% vs 7%), and endotracheal intubation (3.9% vs 2.9%) than those without OSA diagnoses (P < 0.001 for all comparisons). There was no significant difference in the incidence of cardiac arrest between the 2 groups, nor was there a significant difference in length of stay. Unadjusted inpatient mortality for OSA patient admissions was lower than that for non‐OSA hospitalizations (1.1% vs 1.4%, P < 0.05). A diagnosis of OSA was associated with increased unadjusted odds for RRT activation (odds ratio [OR]: 1.36 [1.16‐1.59]) and ICU transfer (OR: 1.28 [1.20‐1.38]). However, after controlling for confounders, OSA was not associated with increased odds for RRT activation (OR: 1.14 [0.95‐1.36]) or intubation (OR: 1.06 [0.94‐1.19]), and was associated with slightly decreased odds for ICU transfer (OR: 0.91 [0.84‐0.99]) (Figure 1). Those with OSA had decreased adjusted odds of cardiac arrest (OR: 0.72 [0.55‐0.95]) compared to those without OSA. OSA was also associated with decreased odds of in‐hospital mortality before (OR: 0.83 [0.70‐0.99]) and after (OR: 0.70 [0.58‐0.85]) controlling for confounders.
| Characteristic | Patient Admissions With OSA Diagnoses, n = 12,745 | Patient Admissions Without OSA Diagnoses, n = 80,931 | P Value |
|---|---|---|---|
| |||
| Outcomes, n (%) | |||
| Composite outcomea | 1,137 (9%) | 5,792 (7%) | <0.001 |
| In‐hospital death | 144 (1.1%) | 1,095 (1.4%) | 0.04 |
| Rapid response team call | 188 (1.5%) | 881 (1.1%) | <0.001 |
| ICU transfer | 1,045 (8%) | 5,260 (7%) | <0.001 |
| Cardiac arrest | 413 (0.5%) | 73 (0.6%) | 0.36 |
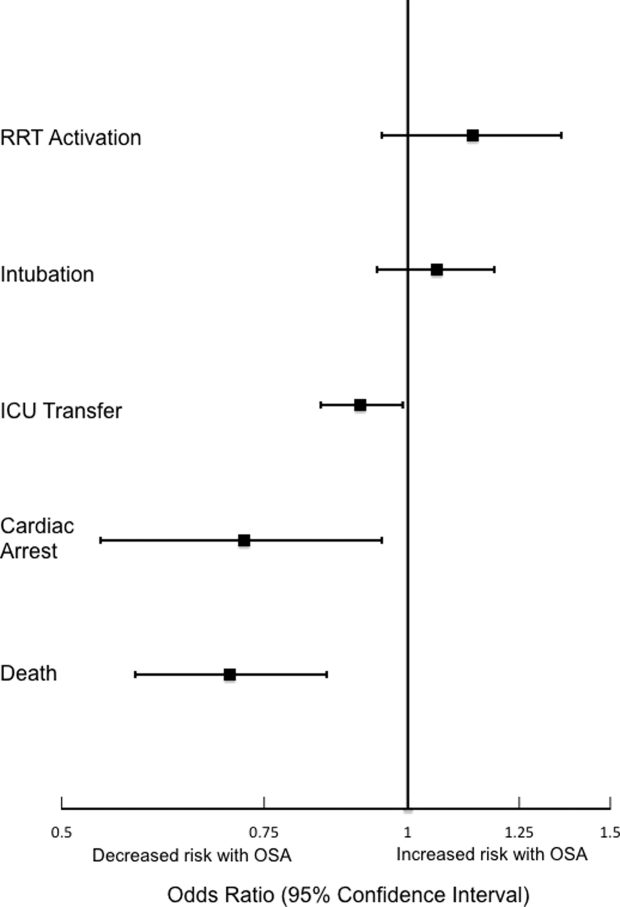
Sensitivity Analyses
The sensitivity analysis involving 1 randomly selected hospitalization per patient included a total of 53,150 patients. The results were similar to the main analysis, with adjusted odds of 1.01 (0.77‐1.32) for RRT activation, 0.86 (0.76‐0.96) for ICU transfer, and 0.69 (0.53‐0.89) for inpatient mortality. An additional sensitivity analysis included only patients who were not admitted to the ICU prior to their ward stay. This analysis included 84,211 hospitalizations and demonstrated similar findings, with adjusted odds of 0.70 for in‐hospital mortality (0.57‐0.87). Adjusted odds for RRT activation (OR: 1.12 [0.92‐1.37]) and ICU transfer (OR: 0.88 [0.81‐0.96] were also similar to the results of our main analysis.
Subgroup Analyses
Surgical and Nonsurgical Patients
Subgroup analyses of surgical versus nonsurgical patients (Figure 2) revealed similarly decreased adjusted odds of in‐hospital death for OSA patients in both groups (surgical OR: 0.69 [0.49‐0.97]; nonsurgical OR: 0.72 [0.58‐0.91]). Surgical patients with OSA diagnoses had decreased adjusted odds for ICU transfer (surgical OR: 0.82 [0.73‐0.92], but this finding was not seen in nonsurgical patients (OR: 1.03 [0.92‐1.15]).
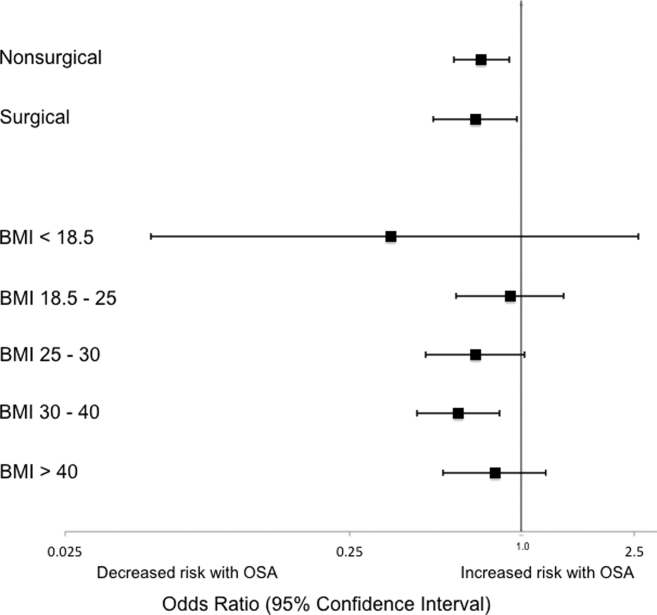
Patients Stratified by BMI
Examination across BMI categories (Figure 2) showed a significant decrease in adjusted odds of death for OSA patients with BMI 30 to 40 kg/m2 (OR: 0.60 [0.43‐0.84]). A nonsignificant decrease in adjusted odds of death was seen for OSA patients in all other groups. Adjusted odds ratios for the risk of RRT activation and ICU transfer in OSA patients within the different BMI categories were not statistically significant.
DISCUSSION
In this large observational single‐center cohort study, we found that OSA was associated with increased odds of adverse events, such as ICU transfers and RRT calls, but this risk was no longer present after adjusting for demographics, comorbidities, and presenting vital signs. Interestingly, we also found that patients with OSA had decreased adjusted odds for cardiac arrest and mortality. This mortality finding was robust to multiple sensitivity analyses and subgroup analyses. These results have significant implications for our understanding of the short‐term risks of sleep‐disordered breathing in hospitalized patients, and suggest the possibility that OSA is associated with a protective effect with regard to inpatient mortality.
Our findings are in line with other recent work in this area. In 2 large observational cohorts of surgical populations drawn from the nationally representative Nationwide Inpatient Sample administrative database, our group reported decreased odds of in‐hospital postoperative mortality in OSA patients.[10, 11] Using the same Nationwide Inpatient Sample, Lindenauer et al. showed that among inpatients hospitalized with pneumonia, OSA diagnosis was associated with increased rates of clinical deterioration but lower rates of inpatient mortality.[12] Although these 3 studies have identified decreased inpatient mortality among certain surgical populations and patients hospitalized with pneumonia, they are limited by using administrative databases that do not provide specific data on vital signs, presenting physiology, BMI, or race. Another important limitation of the Nationwide Inpatient Sample is the lack of any information on RRT activations and ICU transfers. Moreover, the database does not include information on outpatient diagnoses, which may have led to a significantly lower prevalence of OSA than expected in these studies. Despite the important methodological differences, our study corroborates this finding among a diverse cohort of hospitalized patients. Unlike these previous studies of postoperative patients or those hospitalized with pneumonia, we did not find an increased risk of adverse events associated with OSA after controlling for potential confounders.
The decreased mortality seen in OSA patients could be explained by these patients receiving more vigilant care, showing earlier signs of deterioration, or displaying more easily treatable forms of distress than patients without OSA. For example, earlier identification of deterioration could lead to earlier interventions, which could decrease inpatient mortality. In 2 studies of postsurgical patients,[10, 11] those with OSA diagnosis who developed respiratory failure were intubated earlier and received mechanical ventilation for a shorter period of time, suggesting that the cause of respiratory failure was rapidly reversible (eg, upper airway complications due to oversedation or excessive analgesia). However, we did not find increased adjusted odds of RRT activation or ICU transfer for OSA patients in our study, and so it is less likely that earlier recognition of decompensation occurred in our sample. In addition, our hospital did not have standardized practices for monitoring or managing OSA patients during the study period, which makes systematic early recognition of clinical deterioration among the OSA population in our study less likely.
Alternatively, there may be a true physiologic phenomenon providing a short‐term mortality benefit in those with OSA. It has been observed that patients with obesity (but without severe obesity) often have better outcomes after acute illness, whether by earlier or more frequent contact with medical care or heightened levels of metabolic reserve.[21, 22] However, our findings of decreased mortality for OSA patients remained even after controlling for BMI. An additional important possibility to consider is ischemic preconditioning, a well‐described phenomenon in which episodes of sublethal ischemia confer protection on tissues from subsequent ischemia/reperfusion damage.[23] Ischemic preconditioning has been demonstrated in models of cardiac and neural tissue[24, 25, 26] and has been shown to enhance stem cell survival by providing resistance to necrosis and lending functional benefits to heart, brain, and kidney models after transplantation.[25, 26, 27, 28, 29, 30, 31] The fundamentals of this concept may have applications in transplant and cardiac surgery,[32, 33] in the management of acute coronary syndromes and stroke,[32, 34, 35] and in athletic training and performance.[35, 36] Although OSA has been associated with long‐term cardiovascular morbidity and mortality,[2, 3, 4, 5, 6] the intermittent hypoxemia OSA patients experience could actually improve their ability to survive clinical deterioration in the short‐term (ie, during a hospitalization).
Limitations of our study include its conduction at a single center, which may prevent generalization to populations different than ours. Furthermore, during the study period, our hospital did not have formal guidelines or standardized management or monitoring practices for patients with OSA. Additionally, practices for managing OSA may vary across institutions. Therefore, our results may not be generalizable to hospitals with such protocols in place. However, as mentioned above, similar findings have been noted in studies using large, nationally representative administrative databases. In addition, we identified OSA via ICD‐9‐CM codes, which are likely insensitive for estimating the true prevalence of OSA in our sample. Despite this, our reported OSA prevalence of over 10% falls within the prevalence range reported in large epidemiological studies.[37, 38, 39] Finally, we did not have data on polysomnograms or treatment received for patients with OSA, so we do not know the severity of OSA or adequacy of treatment for these patients.
Notwithstanding our limitations, our study has several strengths. First, we included a large number of hospitalized patients across a diverse range of medical and surgical ward admissions, which increases the generalizability of our results. We also addressed potential confounders by including a large number of comorbidities and controlling for severity of presenting physiology with the CART score. The CART score, which contains physiologic variables such as respiratory rate, heart rate, and diastolic blood pressure, is an accurate predictor of cardiac arrest, ICU transfer, and in‐hospital mortality in our population.[40] Finally, we were able to obtain information about these diagnoses from outpatient as well as inpatient data.
In conclusion, we found that after adjustment for important confounders, OSA was associated with a decrease in hospital mortality and cardiac arrest but not with other adverse events on the wards. These results may suggest a protective benefit from OSA with regard to mortality, an advantage that could be explained by ischemic preconditioning or a higher level of care or vigilance not reflected by the number of RRT activations or ICU transfers experienced by these patients. Further research is needed to confirm these findings across other populations, to investigate the physiologic pathways by which OSA may produce these effects, and to examine the mechanisms by which treatment of OSA could influence these outcomes.
Acknowledgements
The authors thank Nicole Babuskow for administrative support, as well as Brian Furner and Timothy Holper for assistance with data acquisition.
Disclosures: Study concept and design: P.L., D.P.E, B.M., M.C.; acquisition of data: P.L.; analysis and interpretation of data: all authors; first drafting of the manuscript: P.L.; critical revision of the manuscript for important intellectual content: all authors; statistical analysis: P.L., F.Z., M.C.; obtained funding: D.P.E., M.C.; administrative, technical, and material support: F.Z., D.P.E.; study supervision: D.P.E, B.M., M.C.; data access and responsibility: P.L. and M.C. had full access to all the data in the study, and take responsibility for the integrity of the data and the accuracy of the data analysis. Drs. Churpek and Edelson have a patent pending (ARCD. P0535US.P2) for risk stratification algorithms for hospitalized patients. Dr. Churpek and Dr. Edelson are both supported by career development awards from the National Heart, Lung, and Blood Institute (K08 HL121080 and K23 HL097157, respectively). Dr. Churpek has received honoraria from Chest for invited speaking engagements. In addition, Dr. Edelson has received research support and honoraria from Philips Healthcare (Andover, MA), research support from the American Heart Association (Dallas, TX) and Laerdal Medical (Stavanger, Norway), and an honorarium from Early Sense (Tel Aviv, Israel). She has ownership interest in Quant HC (Chicago, IL), which is developing products for risk stratification of hospitalized patients. Dr. Mokhlesi is supported by National Institutes of Health grant R01HL119161. Dr. Mokhlesi has served as a consultant to Philips/Respironics and has received research support from Philips/Respironics.
- , , , , , . Increased prevalence of sleep‐disordered breathing in adults. Am J Epidemiol. 2013;177(9):1006–1014.
- , , , . Long‐term cardiovascular outcomes in men with obstructive sleep apnoea‐hypopnoea with or without treatment with continuous positive airway pressure: an observational study. Lancet. 2005;365(9464):1046–1053.
- , , , . Prospective study of the association between sleep‐disordered breathing and hypertension. N Engl J Med. 2000;342(19):1378–1384.
- , , , , , . Obstructive sleep apnea as a risk factor for stroke and death. N Engl J Med. 2005;353(19):2034–2041.
- , , , , . Obstructive sleep apnea and risk of cardiovascular events and all‐cause mortality: a decade‐long historical cohort study. PLoS Med. 2014;11(2):e1001599.
- , , , , , . Sleep apnea as an independent risk factor for all‐cause mortality: the Busselton Health Study. Sleep. 2008;31(8):1079–1085.
- , , , , . Postoperative complications in patients with obstructive sleep apnea. Chest. 2012;141(2):436–441.
- , , , , , . Meta‐analysis of the association between obstructive sleep apnoea and postoperative outcome. Br J Anaesth. 2012;109(6):897–906.
- , , , et al. The impact of sleep apnea on postoperative utilization of resources and adverse outcomes. Anesth Analg. 2014;118(2):407–418.
- , , , , , . Sleep‐disordered breathing and postoperative outcomes after bariatric surgery: analysis of the nationwide inpatient sample. Obes Surg. 2013;23(11):1842–1851.
- , , , , , . Sleep‐disordered breathing and postoperative outcomes after elective surgery: analysis of the nationwide inpatient sample. Chest. 2013;144:903–914.
- , , , , , . Prevalence, treatment and outcomes associated with obstructive sleep apnea among patients hospitalized with pneumonia. Chest. 2014;145(5):1032–1038.
- , , , et al. Experimental pain and opioid analgesia in volunteers at high risk for obstructive sleep apnea. PLoS One. 2013;8(1):e54807.
- , , , , . Increased CSF opioid activity in sleep apnea syndrome. Regression after successful treatment. Chest. 1989;96(2):250–254.
- , , , et al. Comparison of the relaxant effects of diazepam, flunitrazepam and midazolam on airway smooth muscle. Br J Anaesth. 1992;69(1):65–69.
- , . Effect of flurazepam on sleep‐disordered breathing and nocturnal oxygen desaturation in asymptomatic subjects. Am J Med. 1982;73(2):239–243.
- , , , , , . Derivation of a cardiac arrest prediction model using ward vital signs*. Crit Care Med. 2012;40(7):2102–2108.
- , , , , . Using electronic health record data to develop and validate a prediction model for adverse outcomes in the wards*. Crit Care Med. 2014;42(4):841–848.
- , , , et al. The APACHE III prognostic system. Risk prediction of hospital mortality for critically ill hospitalized adults. Chest. 1991;100(6):1619–1636.
- , , , , , . Predicting cardiac arrest on the wards: a nested case‐control study. Chest. 2012;141(5):1170–1176.
- , , , , , . Mortality of patients with respiratory insufficiency and adult respiratory distress syndrome after surgery: the obesity paradox. J Intensive Care Med. 2012;27(4):306–311.
- , , , et al. Body mass index and mortality in acute myocardial infarction patients. Am J Med. 2012(8);125:796–803.
- , , . Preconditioning with ischemia: a delay of lethal cell injury in ischemic myocardium. Circulation. 1986;74(5):1124–1136.
- , , , . Ischemic preconditioning slows energy metabolism and delays ultrastructural damage during a sustained ischemic episode. Circ Res. 1990;66(4):913–931.
- , , , et al. Transplantation of hypoxia‐preconditioned mesenchymal stem cells improves infarcted heart function via enhanced survival of implanted cells and angiogenesis. J Thorac Cardiovasc Surg. 2008;135(4):799–808.
- , , , et al. Hypoxic preconditioning with cobalt of bone marrow mesenchymal stem cells improves cell migration and enhances therapy for treatment of ischemic acute kidney injury. PLoS One. 2013;8(5):e62703.
- , . Human embryonic stem cell neural differentiation and enhanced cell survival promoted by hypoxic preconditioning. Cell Death Dis. 2010;1:e22.
- , , , et al. Ischemic pre‐conditioning enhances the mobilization and recruitment of bone marrow stem cells to protect against ischemia/reperfusion injury in the late phase. J Am Coll Cardiol. 2009;53(19):1814–1822.
- , , , et al. Hypoxic preconditioning enhances bone marrow mesenchymal stem cell migration via Kv2.1 channel and FAK activation. Am J Physiol Cell Physiol. 2011;301(2):C362–C372.
- , , , et al. In vitro hypoxic preconditioning of embryonic stem cells as a strategy of promoting cell survival and functional benefits after transplantation into the ischemic rat brain. Exp Neurol. 2008;210(2):656–670.
- , , , , . Transplantation of hypoxia preconditioned bone marrow mesenchymal stem cells enhances angiogenesis and neurogenesis after cerebral ischemia in rats. Neurobiol Dis. 2012;46(3):635–645.
- , , . Translation of remote ischaemic preconditioning into clinical practice. Lancet. 2009;374(9700):1557–1565.
- , , . Novel adjunctive treatments of myocardial infarction. World J Cardiol. 2014;6(6):434–443.
- , . Hypoxic‐preconditioning enhances the regenerative capacity of neural stem/progenitors in subventricular zone of newborn piglet brain. Stem Cell Res. 2013;11(2):669–686.
- , , , , . Ischemic preconditioning improves oxygen saturation and attenuates hypoxic pulmonary vasoconstriction at high altitude. High Alt Med Biol. 2014;15(2):155–161.
- , , , et al. Remote preconditioning improves maximal performance in highly trained athletes. Med Sci Sports Exerc. 2011;43(7):1280–1286.
- , , , . Obstructive sleep apnea‐hypopnea and related clinical features in a population‐based sample of subjects aged 30 to 70 yr. Am J Respir Crit Care Med. 2001;163(3 pt 1):685–689.
- , , , , , . The occurrence of sleep‐disordered breathing among middle‐aged adults. N Engl J Med. 1993;328(17):1230–1235.
- , , . Epidemiology of obstructive sleep apnea: a population health perspective. Am J Respir Crit Care Med. 2002;165(9):1217–1239.
- , , . Risk stratification of hospitalized patients on the wards. Chest. 2013;143(6):1758–1765.
Obstructive sleep apnea (OSA) is an increasingly prevalent condition characterized by intermittent airway obstruction during sleep, which leads to hypoxemia, hypercapnia, and fragmented sleep. The current prevalence estimates of moderate to severe OSA (apnea‐hypopnea index 15, measured as events/hour) in middle‐aged adults are approximately 13% in men and 6% in women.[1] OSA is a well‐described independent risk factor for long‐term neurocognitive, cardiovascular, and cerebrovascular morbidity and mortality.[2, 3, 4, 5, 6]
Recent studies have also identified OSA as an independent risk factor for adverse perioperative outcomes, including endotracheal intubation, intensive care unit (ICU) transfer, and increased length of stay.[7, 8, 9, 10, 11] Paradoxically, despite an increase in the risk of complications, several of these studies did not find an association between in‐hospital death and OSA even after controlling for potential confounders.[9, 10, 11] Furthermore, a recent study of patients hospitalized for pneumonia reported increased rates of clinical deterioration and mechanical ventilation, but also lower odds of inpatient mortality in patients with OSA.[12]
These studies may have been limited by the absence of physiologic data, which prevented controlling for severity of illness. It is also unclear whether these previously described associations between OSA and adverse clinical outcomes hold true for general hospital inpatients. OSA may be worsened by medications frequently used in hospitals, such as narcotics and benzodiazepines. Opiate use contributes to both central and obstructive sleep apneas,[13, 14] and benzodiazepines are known to produce airway smooth muscle relaxation and can cause respiratory depression.[15] In fact, the use of benzodiazepines has been implicated in the unmasking of OSA in patients with previously undiagnosed sleep‐disordered breathing.[16] These findings suggest mechanisms by which OSA could contribute to an increased risk in hospital ward patients for rapid response team (RRT) activation, ICU transfer, cardiac arrest, and in‐hospital death.
The aim of this study was to determine the independent association between OSA and in‐hospital mortality in ward patients. We also aimed to investigate the association of OSA with clinical deterioration on the wards, while controlling for patient characteristics, initial physiology, and severity of illness.
MATERIALS AND METHODS
Setting and Study Population
This observational cohort study was performed at an academic tertiary care medical center with approximately 500 beds. Data were obtained from all adult patients hospitalized on the wards between November 1, 2008 and October 1, 2013. Our hospital has utilized an RRT, led by a critical care nurse and respiratory therapist with hospitalist and pharmacist consultation available upon request, since 2008. This team is separate from the team that responds to a cardiac arrest. Criteria for RRT activation include tachypnea, tachycardia, hypotension, and staff worry, but specific vital sign thresholds are not specified.
The study analyzed deidentified data from the hospital's Clinical Research Data Warehouse, which is maintained by the Center for Research Informatics at The University of Chicago. The study protocol was approved by the University of Chicago Institutional Review Board (IRB #16995A).
Data Collection
Patient age, sex, race, body mass index (BMI), and location prior to ward admission (ie, whether they were admitted from the emergency department, transferred from the ICU, or directly admitted from clinic or home) were collected. Patients who underwent surgery during their admission were identified using the hospital's admission‐transfer‐discharge database. In addition, routinely collected vital signs (eg, respiratory rate, blood pressure, heart rate) were obtained from the electronic health record (Epic, Verona, WI). To determine severity of illness, the first set of vital signs measured on hospital presentation were utilized to calculate the cardiac arrest risk triage (CART) score, a vital‐signbased early warning score we previously developed and validated for predicting adverse events in our population.[17] The CART score ranges from 0 to 57, with points assigned for abnormalities in respiratory rate, heart rate, diastolic blood pressure, and age. If any vital sign was missing, the next available measurement was pulled into the set. If any vital sign remained missing after this change, the median value for that particular location (ie, wards, ICU, or emergency department) was imputed as previously described.[18, 19]
Patients with OSA were identified by the following International Classification of Diseases, Ninth Revision, Clinical Modification (ICD‐9‐CM) codes using inpatient and outpatient medical records: 278.03, 327.20, 327.23, 327.29, 780.51, 780.53, and 780.57 (Table 1). Data on other patient comorbidities, including coronary artery disease, congestive heart failure, arrhythmias, uncomplicated and complicated diabetes mellitus, hypertension, and cerebrovascular disease were collected using specific ICD‐9‐CM codes from both inpatient and outpatient records. Information on insurance payer was also collected from the hospital's billing database. Insurance payers were grouped into the following categories: private payer, Medicare/Medicaid, and no insurance. Patients with both public and private payers were counted as being privately insured.
| Diagnosis Code | Description | % of Sleep Apnea Diagnosesa |
|---|---|---|
| ||
| 327.23 | Obstructive sleep apnea | 65.6 |
| 780.57 | Unspecified sleep apnea | 19.4 |
| 780.53 | Hypersomnia with sleep apnea, unspecified | 11.7 |
| 780.51 | Insomnia with sleep apnea, unspecified | 1.5 |
| 327.2 | Organic sleep apnea, unspecified | 0.2 |
| 278.03 | Obesity hypoventilation syndrome | 1.7 |
Outcomes
The primary outcome of the study was in‐hospital mortality. Secondary outcomes included length of stay, RRT activation, transfer to the ICU, endotracheal intubation, cardiac arrest (defined as a loss of pulse with attempted resuscitation) on the wards, and a composite outcome of RRT activation, ICU transfer, and death. Because cardiac arrests on the wards result either in death or ICU transfer following successful resuscitation, this variable was omitted from the composite outcome. Cardiac arrests were identified using a prospectively validated quality improvement database that has been described previously.[20] ICU transfer was identified using the hospital's admission‐transfer‐discharge database. Only the index cardiac arrest, intubation, RRT, or ICU transfer for each admission was used in the study, but more than 1 type of outcome could occur for each patient (eg, a patient who died following an unsuccessful resuscitation attempt would count as both a cardiac arrest and a death).
Statistical Analysis
Patient characteristics were compared using Student t tests, Wilcoxon rank sum tests, and 2 statistics, as appropriate. Unadjusted logistic regression models were fit to estimate the change in odds of each adverse event and a composite outcome of any event for patient admissions with OSA compared to those without OSA. Adjusted logistic regression models were then fit for each outcome to control for patient characteristics (age, sex, BMI, insurance status, and individual comorbidities), location immediately prior to ward admission, and admission severity of illness (as measured by CART score). In the adjusted model, CART score, age, and number of comorbidities were entered linearly, with the addition of squared terms for age and CART score, as these variables showed nonlinear associations with the outcomes of interest. Race, surgical status, insurance payer, location prior to ward, and BMI (underweight, <18.5 kg/m2; normal weight, 18.524.9 kg/m2; overweight, 25.029.9 kg/m2; obese, 3039.9 kg/m2; and severely obese, (40 kg/m2) were modeled as categorical variables.
Given that an individual patient could experience multiple hospitalizations during the study period, we performed a sensitivity analysis of all adjusted and unadjusted models using a single randomly selected hospitalization for each unique patient. In addition, we performed a sensitivity analysis of all patients who were not admitted to the ICU prior to their ward stay. Finally, we performed subgroup analyses of all unadjusted and adjusted models for each BMI category and surgical status.
All tests of significance used a 2‐sided P value <0.05. Statistical analyses were completed using Stata version 12.0 (StataCorp, College Station, TX).
RESULTS
Patient Characteristics
During the study period, 93,676 patient admissions from 53,150 unique patients resulted in the occurrence of 1,069 RRT activations, 6,305 ICU transfers, and 1,239 in‐hospital deaths. Within our sample, 40,034 patients had at least 1 inpatient record and at least 1 outpatient record. OSA diagnosis was present in 5,625 patients (10.6% of the total sample), with 4,748 patients having an OSA diagnosis code entered during a hospitalization, 2,143 with an OSA diagnosis code entered during an outpatient encounter, and 877 with both inpatient and outpatient diagnosis codes. These patients identified as having OSA contributed 12,745 (13.6%) hospital admissions.
Patients with an OSA diagnosis were more likely to be older (median age 59 years [interquartile range 4968] vs 55 years [3868]), male (49% vs 42%), overweight or obese (88% vs 62%), and more likely to carry diagnoses of diabetes (53.8% vs 25.5%), hypertension (45.3% vs 18.2%), arrhythmias (44.4% vs 26.7%), coronary artery disease (46.8% vs 23.5%), heart failure (35.8% vs 13.5%), and cerebrovascular disease (13.5% vs 8.1%) than patients without an OSA diagnosis (all comparisons significant, P < 0.001) (Table 2).
| Characteristic | Patient Admissions With OSA Diagnoses, n = 12,745 | Patient Admissions Without OSA Diagnoses, n = 80,931 | P Value |
|---|---|---|---|
| |||
| Age, y, median (IQR) | 59 (4968) | 55 (3868) | <0.001 |
| Female, n (%) | 6,514 (51%) | 47,202 (58%) | <0.001 |
| Race, n (%) | <0.001 | ||
| White | 4,205 (33%) | 30,119 (37%) | |
| Black/African American | 7,024 (55%) | 38,561 (48%) | |
| Asian | 561 (4.4%) | 3,419 (4.2%) | |
| American Indian or Native Alaskan | 20 (0.2%) | 113 (0.1%) | |
| More than 1 race | 127 (1%) | 843 (1%) | |
| Race unknown | 808 (6%) | 7,876 (10%) | |
| Insurance status, n (%) | <0.001 | ||
| Private | 4,484 (35%) | 32,467 (40%) | |
| Medicare/Medicaid | 8,201 (64%) | 42,208 (58%) | |
| Uninsured | 53 (0.4%) | 1,190 (1%) | |
| Unknown | 4 (<0.1%) | 16 (<0.1%) | |
| Location prior to wards, n (%) | <0.001 | ||
| ICU | 1,400 (11%) | 8,065 (10%) | |
| Emergency department | 4,633 (36%) | 25,170 (31%) | |
| Ambulatory admission | 6,712 (53%) | 47,696 (59%) | |
| Body mass index, kg/m2, n (%) | <0.001 | ||
| Normal (18.525) | 1,431 (11%) | 26,560 (33%) | |
| Underweight (<18.5) | 122 (1%) | 4,256 (5%) | |
| Overweight (2530) | 2,484 (20%) | 23,761 (29%) | |
| Obese (3040) | 4,959 (39%) | 19,132 (24%) | |
| Severely obese (40) | 3,745 (29%) | 7,171 (9%) | |
| Initial cardiac arrest risk triage score, median (IQR) | 4 (09) | 4 (09) | <0.001 |
| Underwent surgery, n (%) | 4,482 (35%) | 28,843 (36%) | 0.3 |
| Comorbidities | |||
| Number of comorbidities, median (IQR) | 2 (14) | 1 (02) | <0.001 |
| Arrhythmia | 5,659 (44%) | 21,581 (27%) | <0.001 |
| Diabetes mellitus | 6,855 (54%) | 20,641 (26%) | <0.001 |
| Hypertension | 5,777 (45%) | 14,728 (18%) | <0.001 |
| Coronary artery disease | 5,958 (47%) | 18,979 (23%) | <0.001 |
| Cerebrovascular accident | 1,725 (14%) | 6,556 (8%) | <0.001 |
| Congestive heart failure | 4,559 (36%) | 10,919 (13%) | <0.001 |
Complications and Adverse Outcomes
In the unadjusted analyses, the overall incidence of adverse outcomes was higher among patient admissions with a diagnosis of OSA compared to those without OSA (Table 3). Those with OSA were more likely to experience RRT activation (1.5% vs 1.1%), ICU transfer (8% vs 7%), and endotracheal intubation (3.9% vs 2.9%) than those without OSA diagnoses (P < 0.001 for all comparisons). There was no significant difference in the incidence of cardiac arrest between the 2 groups, nor was there a significant difference in length of stay. Unadjusted inpatient mortality for OSA patient admissions was lower than that for non‐OSA hospitalizations (1.1% vs 1.4%, P < 0.05). A diagnosis of OSA was associated with increased unadjusted odds for RRT activation (odds ratio [OR]: 1.36 [1.16‐1.59]) and ICU transfer (OR: 1.28 [1.20‐1.38]). However, after controlling for confounders, OSA was not associated with increased odds for RRT activation (OR: 1.14 [0.95‐1.36]) or intubation (OR: 1.06 [0.94‐1.19]), and was associated with slightly decreased odds for ICU transfer (OR: 0.91 [0.84‐0.99]) (Figure 1). Those with OSA had decreased adjusted odds of cardiac arrest (OR: 0.72 [0.55‐0.95]) compared to those without OSA. OSA was also associated with decreased odds of in‐hospital mortality before (OR: 0.83 [0.70‐0.99]) and after (OR: 0.70 [0.58‐0.85]) controlling for confounders.
| Characteristic | Patient Admissions With OSA Diagnoses, n = 12,745 | Patient Admissions Without OSA Diagnoses, n = 80,931 | P Value |
|---|---|---|---|
| |||
| Outcomes, n (%) | |||
| Composite outcomea | 1,137 (9%) | 5,792 (7%) | <0.001 |
| In‐hospital death | 144 (1.1%) | 1,095 (1.4%) | 0.04 |
| Rapid response team call | 188 (1.5%) | 881 (1.1%) | <0.001 |
| ICU transfer | 1,045 (8%) | 5,260 (7%) | <0.001 |
| Cardiac arrest | 413 (0.5%) | 73 (0.6%) | 0.36 |
Sensitivity Analyses
The sensitivity analysis involving 1 randomly selected hospitalization per patient included a total of 53,150 patients. The results were similar to the main analysis, with adjusted odds of 1.01 (0.77‐1.32) for RRT activation, 0.86 (0.76‐0.96) for ICU transfer, and 0.69 (0.53‐0.89) for inpatient mortality. An additional sensitivity analysis included only patients who were not admitted to the ICU prior to their ward stay. This analysis included 84,211 hospitalizations and demonstrated similar findings, with adjusted odds of 0.70 for in‐hospital mortality (0.57‐0.87). Adjusted odds for RRT activation (OR: 1.12 [0.92‐1.37]) and ICU transfer (OR: 0.88 [0.81‐0.96] were also similar to the results of our main analysis.
Subgroup Analyses
Surgical and Nonsurgical Patients
Subgroup analyses of surgical versus nonsurgical patients (Figure 2) revealed similarly decreased adjusted odds of in‐hospital death for OSA patients in both groups (surgical OR: 0.69 [0.49‐0.97]; nonsurgical OR: 0.72 [0.58‐0.91]). Surgical patients with OSA diagnoses had decreased adjusted odds for ICU transfer (surgical OR: 0.82 [0.73‐0.92], but this finding was not seen in nonsurgical patients (OR: 1.03 [0.92‐1.15]).
Patients Stratified by BMI
Examination across BMI categories (Figure 2) showed a significant decrease in adjusted odds of death for OSA patients with BMI 30 to 40 kg/m2 (OR: 0.60 [0.43‐0.84]). A nonsignificant decrease in adjusted odds of death was seen for OSA patients in all other groups. Adjusted odds ratios for the risk of RRT activation and ICU transfer in OSA patients within the different BMI categories were not statistically significant.
DISCUSSION
In this large observational single‐center cohort study, we found that OSA was associated with increased odds of adverse events, such as ICU transfers and RRT calls, but this risk was no longer present after adjusting for demographics, comorbidities, and presenting vital signs. Interestingly, we also found that patients with OSA had decreased adjusted odds for cardiac arrest and mortality. This mortality finding was robust to multiple sensitivity analyses and subgroup analyses. These results have significant implications for our understanding of the short‐term risks of sleep‐disordered breathing in hospitalized patients, and suggest the possibility that OSA is associated with a protective effect with regard to inpatient mortality.
Our findings are in line with other recent work in this area. In 2 large observational cohorts of surgical populations drawn from the nationally representative Nationwide Inpatient Sample administrative database, our group reported decreased odds of in‐hospital postoperative mortality in OSA patients.[10, 11] Using the same Nationwide Inpatient Sample, Lindenauer et al. showed that among inpatients hospitalized with pneumonia, OSA diagnosis was associated with increased rates of clinical deterioration but lower rates of inpatient mortality.[12] Although these 3 studies have identified decreased inpatient mortality among certain surgical populations and patients hospitalized with pneumonia, they are limited by using administrative databases that do not provide specific data on vital signs, presenting physiology, BMI, or race. Another important limitation of the Nationwide Inpatient Sample is the lack of any information on RRT activations and ICU transfers. Moreover, the database does not include information on outpatient diagnoses, which may have led to a significantly lower prevalence of OSA than expected in these studies. Despite the important methodological differences, our study corroborates this finding among a diverse cohort of hospitalized patients. Unlike these previous studies of postoperative patients or those hospitalized with pneumonia, we did not find an increased risk of adverse events associated with OSA after controlling for potential confounders.
The decreased mortality seen in OSA patients could be explained by these patients receiving more vigilant care, showing earlier signs of deterioration, or displaying more easily treatable forms of distress than patients without OSA. For example, earlier identification of deterioration could lead to earlier interventions, which could decrease inpatient mortality. In 2 studies of postsurgical patients,[10, 11] those with OSA diagnosis who developed respiratory failure were intubated earlier and received mechanical ventilation for a shorter period of time, suggesting that the cause of respiratory failure was rapidly reversible (eg, upper airway complications due to oversedation or excessive analgesia). However, we did not find increased adjusted odds of RRT activation or ICU transfer for OSA patients in our study, and so it is less likely that earlier recognition of decompensation occurred in our sample. In addition, our hospital did not have standardized practices for monitoring or managing OSA patients during the study period, which makes systematic early recognition of clinical deterioration among the OSA population in our study less likely.
Alternatively, there may be a true physiologic phenomenon providing a short‐term mortality benefit in those with OSA. It has been observed that patients with obesity (but without severe obesity) often have better outcomes after acute illness, whether by earlier or more frequent contact with medical care or heightened levels of metabolic reserve.[21, 22] However, our findings of decreased mortality for OSA patients remained even after controlling for BMI. An additional important possibility to consider is ischemic preconditioning, a well‐described phenomenon in which episodes of sublethal ischemia confer protection on tissues from subsequent ischemia/reperfusion damage.[23] Ischemic preconditioning has been demonstrated in models of cardiac and neural tissue[24, 25, 26] and has been shown to enhance stem cell survival by providing resistance to necrosis and lending functional benefits to heart, brain, and kidney models after transplantation.[25, 26, 27, 28, 29, 30, 31] The fundamentals of this concept may have applications in transplant and cardiac surgery,[32, 33] in the management of acute coronary syndromes and stroke,[32, 34, 35] and in athletic training and performance.[35, 36] Although OSA has been associated with long‐term cardiovascular morbidity and mortality,[2, 3, 4, 5, 6] the intermittent hypoxemia OSA patients experience could actually improve their ability to survive clinical deterioration in the short‐term (ie, during a hospitalization).
Limitations of our study include its conduction at a single center, which may prevent generalization to populations different than ours. Furthermore, during the study period, our hospital did not have formal guidelines or standardized management or monitoring practices for patients with OSA. Additionally, practices for managing OSA may vary across institutions. Therefore, our results may not be generalizable to hospitals with such protocols in place. However, as mentioned above, similar findings have been noted in studies using large, nationally representative administrative databases. In addition, we identified OSA via ICD‐9‐CM codes, which are likely insensitive for estimating the true prevalence of OSA in our sample. Despite this, our reported OSA prevalence of over 10% falls within the prevalence range reported in large epidemiological studies.[37, 38, 39] Finally, we did not have data on polysomnograms or treatment received for patients with OSA, so we do not know the severity of OSA or adequacy of treatment for these patients.
Notwithstanding our limitations, our study has several strengths. First, we included a large number of hospitalized patients across a diverse range of medical and surgical ward admissions, which increases the generalizability of our results. We also addressed potential confounders by including a large number of comorbidities and controlling for severity of presenting physiology with the CART score. The CART score, which contains physiologic variables such as respiratory rate, heart rate, and diastolic blood pressure, is an accurate predictor of cardiac arrest, ICU transfer, and in‐hospital mortality in our population.[40] Finally, we were able to obtain information about these diagnoses from outpatient as well as inpatient data.
In conclusion, we found that after adjustment for important confounders, OSA was associated with a decrease in hospital mortality and cardiac arrest but not with other adverse events on the wards. These results may suggest a protective benefit from OSA with regard to mortality, an advantage that could be explained by ischemic preconditioning or a higher level of care or vigilance not reflected by the number of RRT activations or ICU transfers experienced by these patients. Further research is needed to confirm these findings across other populations, to investigate the physiologic pathways by which OSA may produce these effects, and to examine the mechanisms by which treatment of OSA could influence these outcomes.
Acknowledgements
The authors thank Nicole Babuskow for administrative support, as well as Brian Furner and Timothy Holper for assistance with data acquisition.
Disclosures: Study concept and design: P.L., D.P.E, B.M., M.C.; acquisition of data: P.L.; analysis and interpretation of data: all authors; first drafting of the manuscript: P.L.; critical revision of the manuscript for important intellectual content: all authors; statistical analysis: P.L., F.Z., M.C.; obtained funding: D.P.E., M.C.; administrative, technical, and material support: F.Z., D.P.E.; study supervision: D.P.E, B.M., M.C.; data access and responsibility: P.L. and M.C. had full access to all the data in the study, and take responsibility for the integrity of the data and the accuracy of the data analysis. Drs. Churpek and Edelson have a patent pending (ARCD. P0535US.P2) for risk stratification algorithms for hospitalized patients. Dr. Churpek and Dr. Edelson are both supported by career development awards from the National Heart, Lung, and Blood Institute (K08 HL121080 and K23 HL097157, respectively). Dr. Churpek has received honoraria from Chest for invited speaking engagements. In addition, Dr. Edelson has received research support and honoraria from Philips Healthcare (Andover, MA), research support from the American Heart Association (Dallas, TX) and Laerdal Medical (Stavanger, Norway), and an honorarium from Early Sense (Tel Aviv, Israel). She has ownership interest in Quant HC (Chicago, IL), which is developing products for risk stratification of hospitalized patients. Dr. Mokhlesi is supported by National Institutes of Health grant R01HL119161. Dr. Mokhlesi has served as a consultant to Philips/Respironics and has received research support from Philips/Respironics.
- , , , , , . Increased prevalence of sleep‐disordered breathing in adults. Am J Epidemiol. 2013;177(9):1006–1014.
- , , , . Long‐term cardiovascular outcomes in men with obstructive sleep apnoea‐hypopnoea with or without treatment with continuous positive airway pressure: an observational study. Lancet. 2005;365(9464):1046–1053.
- , , , . Prospective study of the association between sleep‐disordered breathing and hypertension. N Engl J Med. 2000;342(19):1378–1384.
- , , , , , . Obstructive sleep apnea as a risk factor for stroke and death. N Engl J Med. 2005;353(19):2034–2041.
- , , , , . Obstructive sleep apnea and risk of cardiovascular events and all‐cause mortality: a decade‐long historical cohort study. PLoS Med. 2014;11(2):e1001599.
- , , , , , . Sleep apnea as an independent risk factor for all‐cause mortality: the Busselton Health Study. Sleep. 2008;31(8):1079–1085.
- , , , , . Postoperative complications in patients with obstructive sleep apnea. Chest. 2012;141(2):436–441.
- , , , , , . Meta‐analysis of the association between obstructive sleep apnoea and postoperative outcome. Br J Anaesth. 2012;109(6):897–906.
- , , , et al. The impact of sleep apnea on postoperative utilization of resources and adverse outcomes. Anesth Analg. 2014;118(2):407–418.
- , , , , , . Sleep‐disordered breathing and postoperative outcomes after bariatric surgery: analysis of the nationwide inpatient sample. Obes Surg. 2013;23(11):1842–1851.
- , , , , , . Sleep‐disordered breathing and postoperative outcomes after elective surgery: analysis of the nationwide inpatient sample. Chest. 2013;144:903–914.
- , , , , , . Prevalence, treatment and outcomes associated with obstructive sleep apnea among patients hospitalized with pneumonia. Chest. 2014;145(5):1032–1038.
- , , , et al. Experimental pain and opioid analgesia in volunteers at high risk for obstructive sleep apnea. PLoS One. 2013;8(1):e54807.
- , , , , . Increased CSF opioid activity in sleep apnea syndrome. Regression after successful treatment. Chest. 1989;96(2):250–254.
- , , , et al. Comparison of the relaxant effects of diazepam, flunitrazepam and midazolam on airway smooth muscle. Br J Anaesth. 1992;69(1):65–69.
- , . Effect of flurazepam on sleep‐disordered breathing and nocturnal oxygen desaturation in asymptomatic subjects. Am J Med. 1982;73(2):239–243.
- , , , , , . Derivation of a cardiac arrest prediction model using ward vital signs*. Crit Care Med. 2012;40(7):2102–2108.
- , , , , . Using electronic health record data to develop and validate a prediction model for adverse outcomes in the wards*. Crit Care Med. 2014;42(4):841–848.
- , , , et al. The APACHE III prognostic system. Risk prediction of hospital mortality for critically ill hospitalized adults. Chest. 1991;100(6):1619–1636.
- , , , , , . Predicting cardiac arrest on the wards: a nested case‐control study. Chest. 2012;141(5):1170–1176.
- , , , , , . Mortality of patients with respiratory insufficiency and adult respiratory distress syndrome after surgery: the obesity paradox. J Intensive Care Med. 2012;27(4):306–311.
- , , , et al. Body mass index and mortality in acute myocardial infarction patients. Am J Med. 2012(8);125:796–803.
- , , . Preconditioning with ischemia: a delay of lethal cell injury in ischemic myocardium. Circulation. 1986;74(5):1124–1136.
- , , , . Ischemic preconditioning slows energy metabolism and delays ultrastructural damage during a sustained ischemic episode. Circ Res. 1990;66(4):913–931.
- , , , et al. Transplantation of hypoxia‐preconditioned mesenchymal stem cells improves infarcted heart function via enhanced survival of implanted cells and angiogenesis. J Thorac Cardiovasc Surg. 2008;135(4):799–808.
- , , , et al. Hypoxic preconditioning with cobalt of bone marrow mesenchymal stem cells improves cell migration and enhances therapy for treatment of ischemic acute kidney injury. PLoS One. 2013;8(5):e62703.
- , . Human embryonic stem cell neural differentiation and enhanced cell survival promoted by hypoxic preconditioning. Cell Death Dis. 2010;1:e22.
- , , , et al. Ischemic pre‐conditioning enhances the mobilization and recruitment of bone marrow stem cells to protect against ischemia/reperfusion injury in the late phase. J Am Coll Cardiol. 2009;53(19):1814–1822.
- , , , et al. Hypoxic preconditioning enhances bone marrow mesenchymal stem cell migration via Kv2.1 channel and FAK activation. Am J Physiol Cell Physiol. 2011;301(2):C362–C372.
- , , , et al. In vitro hypoxic preconditioning of embryonic stem cells as a strategy of promoting cell survival and functional benefits after transplantation into the ischemic rat brain. Exp Neurol. 2008;210(2):656–670.
- , , , , . Transplantation of hypoxia preconditioned bone marrow mesenchymal stem cells enhances angiogenesis and neurogenesis after cerebral ischemia in rats. Neurobiol Dis. 2012;46(3):635–645.
- , , . Translation of remote ischaemic preconditioning into clinical practice. Lancet. 2009;374(9700):1557–1565.
- , , . Novel adjunctive treatments of myocardial infarction. World J Cardiol. 2014;6(6):434–443.
- , . Hypoxic‐preconditioning enhances the regenerative capacity of neural stem/progenitors in subventricular zone of newborn piglet brain. Stem Cell Res. 2013;11(2):669–686.
- , , , , . Ischemic preconditioning improves oxygen saturation and attenuates hypoxic pulmonary vasoconstriction at high altitude. High Alt Med Biol. 2014;15(2):155–161.
- , , , et al. Remote preconditioning improves maximal performance in highly trained athletes. Med Sci Sports Exerc. 2011;43(7):1280–1286.
- , , , . Obstructive sleep apnea‐hypopnea and related clinical features in a population‐based sample of subjects aged 30 to 70 yr. Am J Respir Crit Care Med. 2001;163(3 pt 1):685–689.
- , , , , , . The occurrence of sleep‐disordered breathing among middle‐aged adults. N Engl J Med. 1993;328(17):1230–1235.
- , , . Epidemiology of obstructive sleep apnea: a population health perspective. Am J Respir Crit Care Med. 2002;165(9):1217–1239.
- , , . Risk stratification of hospitalized patients on the wards. Chest. 2013;143(6):1758–1765.
© 2015 Society of Hospital Medicine

Prevalence and Impact of Health-Related Internet and Smartphone Use Among Dermatology Patients
Patients increasingly use the Internet and/or smartphone applications (apps) to seek health information and track personal health data,1,2 typically in the spirit of being a more educated consumer. However, many patients use the Internet in an attempt to self-diagnose and independently find treatment options, thus avoiding (in their opinion) the need to seek in-person medical care. Additionally, electronic access to health information has expanded beyond computers to smartphones with apps that can provide users with a simple interface to personalize the health information they seek and receive.
Prior studies have shown that seeking online health information and health-related social media is more common among women, younger patients, those with a college education, and those with a higher income.3,4 However, the prevalence of health-related Internet and smartphone use among dermatology patients as well as how patients ultimately use this information is not well studied. This information about patient behavior is important because of the potential harm that may come from patient self-diagnosis, which may delay or prevent treatment, as well as the benefits of patient self-education, which may expedite diagnosis and treatment.5 We surveyed a heterogeneous patient population at 2 dermatology offices in a major academic medical center to assess the prevalence and predictors of Internet and smartphone use to obtain both general medical and dermatologic information among dermatology patients. We also evaluated the impact that health information obtained from online sources has on a patient’s degree of concern about cutaneous disease and the likelihood of seeing a dermatologist for a skin problem.
Methods
Survey and Participants
This study was approved by the institutional review board at the University of Pittsburgh, Pennsylvania. All patients aged 18 years or older who presented to the department of dermatology at 2 offices of the University of Pittsburgh Medical Center from September 2013 through July 2014 were invited to participate in an anonymous 33-question survey regarding their use of the Internet and smartphone apps to obtain health information and make health care decisions. Patients were asked to complete the survey prior to seeing a health care provider and return it to a locked box by the front desk before leaving the office. Survey questions were designed by physicians with content expertise (J.A.W. and L.K.F.) and were reviewed by a statistician with survey expertise (D.G.W.). The survey included questions about patient demographics, Internet and smartphone use (both general and health related), and specific sources accessed. The survey also inquired about the impact of health information obtained via the Internet and smartphone apps on respondents’ degree of worry about a hypothetical skin condition or lesion using a 5-point Likert scale (1=no worry; 5=very worried). Respondents also were asked which skin conditions they previously researched online and whether their findings impacted their decision to see a dermatologist. Additionally, respondents were asked to list the smartphone apps and other online health resources they had used within the last 3 months. Prior to distribution, the survey was piloted with 10 participants and no issues with comprehensibility were noted.
Statistical Analysis
We described demographic traits (eg, age, sex, race/ethnicity, level of education, income) and factors associated with access to health care (eg, specialist co-pay, travel time from dermatology office) of respondents using proportions. We evaluated respondents’ access to and use of Internet- and smartphone-based health information using proportions and used χ² tests to quantify differences by sex and age (<50 years and ≥50 years).
We analyzed the impact of Internet and smartphone-based health information on patient worry about skin conditions by obtaining median worry on a 5-point Likert scale. Due to the nonparametric nature of the data, we used the Mann-Whitney U test to quantify differences by sex and age (<50 and ≥50 years). We used multiple logistic regression to identify factors associated with 3 outcomes: (1) using the Internet to self-diagnose a dermatologic disease, (2) using the Internet to obtain dermatology-related information within the last 3 months, (3) and previously refraining from visiting a dermatologist based on reassurance from online resources. Predictors included the aforementioned demographic and health-care access–related traits. We also categorized smartphone apps used by respondents (ie, fitness/nutrition, reference, self-help, health monitoring, diagnostic aids, electronic medical record) and calculated the proportion of respondents with 1 or more of each type of app on their smartphones. Analyses were conducted in Stata 13.1 and IBM SPSS 22.0.
Results
Of 1000 patients who were invited to participate in the study, a total of 775 respondents completed the survey, yielding a response rate of 77.5%. The majority of respondents were aged 30 to 60 years (mean age [standard deviation], 44.5 [17.2] years; median age [interquartile range], 44 [29–59] years), female (66.7%), and non-Hispanic white (83.3%)(Table 1). The majority of respondents (88.8%) had completed at least some college. Nearly all respondents had medical insurance (97.8%), but annual household income and insurance co-pay varied considerably. Only 10.8% of respondents traveled more than an hour to our offices.
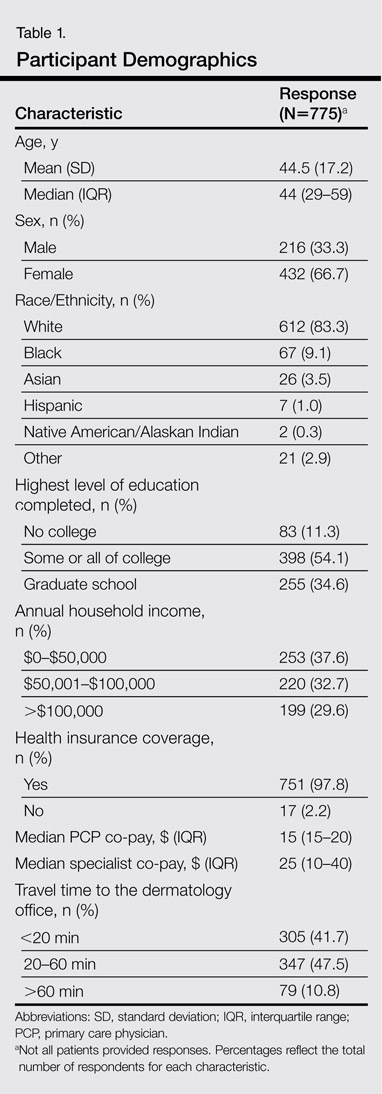
The majority of respondents had access to home Internet and owned a smartphone (Table 2). Use of the Internet to obtain health-related information in the 3 months prior to presentation was more common among females (77.9% vs 70.1%; P=.03) and respondents younger than 50 years (83.4% vs 62.5%; P<.001); the same was true for dermatology-related infor-mation (females: 43.2% vs 31.0%; P=.003; aged <50 years, 51.6% vs 22.2%; P<.001). The majority of respondents indicated that they use the Internet to obtain health-related information both before and after they see their doctor. Most respondents indicated that they sometimes discuss health-related information found on the Internet with a physician. Smartphone use to obtain health-related information was more common among respondents younger than 50 years versus those who were 50 years or older (55.5% vs 24.1%; P<.001), as was smartphone use to diagnose skin problems (20.0% vs 6.3%; P<.001).
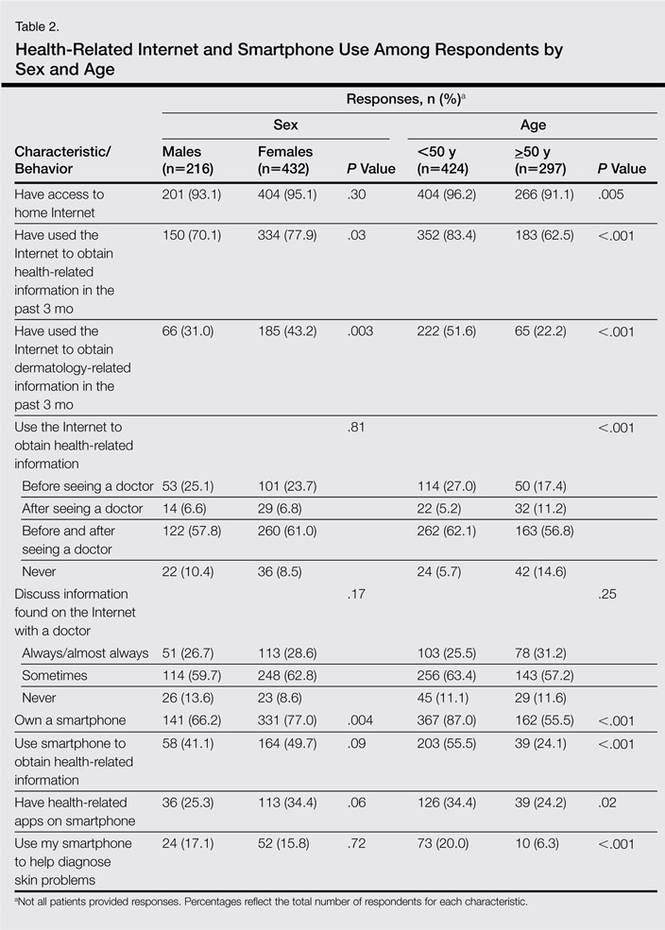
In multivariable analysis, use of the Internet or a smartphone to obtain health-related information was associated with younger age (<50 years) and a higher level of education (both P<.001). Use of the Internet to obtain dermatology-related information (P<.001) and use of a smartphone to help diagnose a skin problem (P=.001) was associated with younger age (<50 years) only. Income, sex, co-pay to see a dermatologist, and travel time to the dermatology office were not associated with use of online resources for general or dermatology-specific health-related information or assistance with diagnosing a skin problem.
Of 204 respondents who indicated that they previously attempted to self-diagnose a skin condition using the Internet, the most commonly researched condition was skin cancer/moles/unknown spots (64.7%), followed by rashes (40.7%), acne (20.6%), cosmetic issues (16.2%), psoriasis (12.7%), dermatitis (3.4%), warts (1.5%), tick bites (1.0%), and lupus (1.0%)(some respondents selected more than one condition). Only 7.0% of respondents indicated that they previously had refrained from visiting a dermatologist based on reassurance from online resources. Compared to the rest of the surveyed population, these respondents were younger (P=.001), but there were no significant differences in sex, highest level of education, household income, or travel time to the dermatology office. The most commonly researched condition among these respondents was acne (12 respondents), and 11 respondents indicated that they had attempted to self-diagnose a mole or potential cancer using online sources.
Of 557 respondents who owned a smartphone, 31.8% reported using at least 1 health-related app (mean number of health apps per respondent, 1.5). Of the apps that respondents used, 45.9% focused on fitness/nutrition, 28.7% provided reference information, 13.4% were a patient portal for receiving information from their electronic medical record, 8.6% provided a health monitoring function, 1.9% served as a diagnostic aid, and 1.5% provided coping assistance and emotional support for individuals with cognitive or emotional conditions; only 1 respondent reported using an app related to dermatology.
All respondents were asked to rate their anticipated degree of worry if the Internet or a smartphone app suggested that a skin lesion was benign versus dangerous on a 5-point scale. Overall, the median worry rating increased from 3 to 5 when information accessed via the Internet or a smartphone app suggested a lesion was dangerous rather than benign. A change in worry of 2 or more points was seen in 36.1% of females and 49.1% of males (P=.002) when information obtained via the Internet indicated a lesion was dangerous and in 47.5% of females and 58.8% of males (P=.006) when a smartphone app indicated that a lesion was dangerous. When information obtained via the Internet indicated a lesion was dangerous, a change in worry of 2 or more points was seen in 41.8% of respondents who were younger than 50 years and in 41.1% of those who were 50 years or older (P=.93). When a smartphone app indicated a lesion was dangerous, a change in worry of 2 or more points was seen in 50.2% of respondents who were younger than 50 years and in 52.2% of those who were 50 years or older (P=.61).
Discussion
In this cross-sectional study, we found that health-related Internet and smartphone use among dermatology patients is common and may impact both patients’ degree of concern about a skin lesion as well as the likelihood of seeking in-person medical care if they are reassured by the results of their online findings. Age and level of education were associated with Internet and smartphone use to obtain dermatology-related health information but not factors related to health care access. More patients used the Internet or a smartphone to obtain general medical information versus dermatology-related information. Respondents who indicated that they used the Internet to obtain health-related information tended to do so before visiting their physician.
Our finding that a patient’s level of worry about a hypothetical skin condition or lesion is influenced by health information obtained via the Internet or a smartphone app is concerning. One study found that participants who used a popular search engine to look for information about vaccine safety and dangers were directed to Web sites with inaccurate information more than 50% of the time, and 65% of the information they obtained from these sites was false.6 In our study, approximately 25% of respondents had previously consulted online resources to attempt toself-diagnose a skin condition. Online sources about dermatologic conditions were consulted most frequently for information about potential skin cancers, moles, and unknown spots. A prior study showed that smartphone apps that claim to aid patients in determining whether a skin lesion is low or high risk for melanoma often are inaccurate and are associated with a high rate of missed melanomas.5 Even though we surveyed patients who did end up seeing a dermatologist, some respondents had previously opted out of seeing a dermatologist based on information they had found online. Because our study was conducted among patients who chose to seek care at a dermatology office, the problem is likely greater than estimated from our findings because we had no way of reaching individuals who decided to completely forgo a visit with a dermatologist.
Although use of the Internet to obtain health-related information was common among older adults in our population, it was nearly universal in younger adults. Health-related smartphone use was more than twice as common in younger versus older adults, which could be due to an increased comfort with technology and its integration into daily life. The fact that age and education were associated with Internet use for dermatology-related health information but not household income or travel time to the dermatology office suggests that information seeking is not due to lack of resources limiting access to dermatologic care but rather to the greater role that rapid access to online information plays in patients’ lives. Our findings are similar to another study that examined the use of online sources for general health information.7
This study has several limitations. First, there may have been some selection bias. We specifically aimed to understand the health-related Internet and smartphone use among dermatology patients, thus restricting our sample to this population. By doing so, we were unable to assess the use of such resources by the general population, particularly those individuals who chose not to see a dermatologist at all based on their own online research. Our findings may not apply to other practices and regions of the country, as we implemented our study in one geographic location and in offices of an academic practice. Although our sample size and diversity with regard to income, education, and age suggest that our results are likely generalizable to many settings, it is important to note that nearly all respondents in this study had health insurance and our findings are thus not necessarily applicable to those individuals who are uninsured.
Conclusion
Our findings suggest that the availability of online health information regarding dermatologic conditions provides dermatologists with both opportunities and challenges. Many patients consult online resources for health information, and the popularity of this practice is likely to increase with time, particularly as newer smartphones with features designed to allow users to monitor their health are developed with health-conscious consumers in mind. Most large health care systems provide patients with resources to view laboratory results and communicate with physicians online. It is important for dermatologists to be involved in the development of high-quality online content that educates the public while also emphasizing the need to seek in-person medical care, particularly in potential cases of skin cancer. It also is important for patients to be involved in the content development process to ensure that the messages they take away from online resources are the ones physicians wish to convey. Ideally, online forms of education will increase patients’ sense of self-efficacy while encouraging appropriate consultation for potentially harmful skin conditions.
1. Atkinson NL, Saperstein SL, Pleis J. Using the Internet for health-related activities: findings from a national probability sample. J Med Internet Res. 2009;11:e4.
2. Ybarra M, Suman M. Reasons, assessments and actions taken: sex and age differences in uses of Internet health information. Health Educ Res. 2008;23:512-521.
3. Bhandari N, Shi Y, Jung K. Seeking health information online: does limited healthcare access matter? J Am Med Inform Assoc. 2014;21:1113-1117.
4. Thackeray R, Crookston BT, West JH. Correlates of health-related social media use among adults. J Med Internet Res. 2013;15:e21.
5. Wolf JA, Moreau JF, Akilov O, et al. Diagnostic inaccuracy of smartphone applications for melanoma detection. JAMA Dermatol. 2013;149:422-426.
6. Kortum P, Edwards C, Richards-Kortum R. The impact of inaccurate Internet health information in a secondary school learning environment. J Med Internet Res. 2008;10:e17.
7. Mead N, Varnam R, Rogers A, et al. What predicts patients’ interest in the internet as a health resource in primary care in England? J Health Serv Res Policy. 2003;8:33-39.
Patients increasingly use the Internet and/or smartphone applications (apps) to seek health information and track personal health data,1,2 typically in the spirit of being a more educated consumer. However, many patients use the Internet in an attempt to self-diagnose and independently find treatment options, thus avoiding (in their opinion) the need to seek in-person medical care. Additionally, electronic access to health information has expanded beyond computers to smartphones with apps that can provide users with a simple interface to personalize the health information they seek and receive.
Prior studies have shown that seeking online health information and health-related social media is more common among women, younger patients, those with a college education, and those with a higher income.3,4 However, the prevalence of health-related Internet and smartphone use among dermatology patients as well as how patients ultimately use this information is not well studied. This information about patient behavior is important because of the potential harm that may come from patient self-diagnosis, which may delay or prevent treatment, as well as the benefits of patient self-education, which may expedite diagnosis and treatment.5 We surveyed a heterogeneous patient population at 2 dermatology offices in a major academic medical center to assess the prevalence and predictors of Internet and smartphone use to obtain both general medical and dermatologic information among dermatology patients. We also evaluated the impact that health information obtained from online sources has on a patient’s degree of concern about cutaneous disease and the likelihood of seeing a dermatologist for a skin problem.
Methods
Survey and Participants
This study was approved by the institutional review board at the University of Pittsburgh, Pennsylvania. All patients aged 18 years or older who presented to the department of dermatology at 2 offices of the University of Pittsburgh Medical Center from September 2013 through July 2014 were invited to participate in an anonymous 33-question survey regarding their use of the Internet and smartphone apps to obtain health information and make health care decisions. Patients were asked to complete the survey prior to seeing a health care provider and return it to a locked box by the front desk before leaving the office. Survey questions were designed by physicians with content expertise (J.A.W. and L.K.F.) and were reviewed by a statistician with survey expertise (D.G.W.). The survey included questions about patient demographics, Internet and smartphone use (both general and health related), and specific sources accessed. The survey also inquired about the impact of health information obtained via the Internet and smartphone apps on respondents’ degree of worry about a hypothetical skin condition or lesion using a 5-point Likert scale (1=no worry; 5=very worried). Respondents also were asked which skin conditions they previously researched online and whether their findings impacted their decision to see a dermatologist. Additionally, respondents were asked to list the smartphone apps and other online health resources they had used within the last 3 months. Prior to distribution, the survey was piloted with 10 participants and no issues with comprehensibility were noted.
Statistical Analysis
We described demographic traits (eg, age, sex, race/ethnicity, level of education, income) and factors associated with access to health care (eg, specialist co-pay, travel time from dermatology office) of respondents using proportions. We evaluated respondents’ access to and use of Internet- and smartphone-based health information using proportions and used χ² tests to quantify differences by sex and age (<50 years and ≥50 years).
We analyzed the impact of Internet and smartphone-based health information on patient worry about skin conditions by obtaining median worry on a 5-point Likert scale. Due to the nonparametric nature of the data, we used the Mann-Whitney U test to quantify differences by sex and age (<50 and ≥50 years). We used multiple logistic regression to identify factors associated with 3 outcomes: (1) using the Internet to self-diagnose a dermatologic disease, (2) using the Internet to obtain dermatology-related information within the last 3 months, (3) and previously refraining from visiting a dermatologist based on reassurance from online resources. Predictors included the aforementioned demographic and health-care access–related traits. We also categorized smartphone apps used by respondents (ie, fitness/nutrition, reference, self-help, health monitoring, diagnostic aids, electronic medical record) and calculated the proportion of respondents with 1 or more of each type of app on their smartphones. Analyses were conducted in Stata 13.1 and IBM SPSS 22.0.
Results
Of 1000 patients who were invited to participate in the study, a total of 775 respondents completed the survey, yielding a response rate of 77.5%. The majority of respondents were aged 30 to 60 years (mean age [standard deviation], 44.5 [17.2] years; median age [interquartile range], 44 [29–59] years), female (66.7%), and non-Hispanic white (83.3%)(Table 1). The majority of respondents (88.8%) had completed at least some college. Nearly all respondents had medical insurance (97.8%), but annual household income and insurance co-pay varied considerably. Only 10.8% of respondents traveled more than an hour to our offices.
The majority of respondents had access to home Internet and owned a smartphone (Table 2). Use of the Internet to obtain health-related information in the 3 months prior to presentation was more common among females (77.9% vs 70.1%; P=.03) and respondents younger than 50 years (83.4% vs 62.5%; P<.001); the same was true for dermatology-related infor-mation (females: 43.2% vs 31.0%; P=.003; aged <50 years, 51.6% vs 22.2%; P<.001). The majority of respondents indicated that they use the Internet to obtain health-related information both before and after they see their doctor. Most respondents indicated that they sometimes discuss health-related information found on the Internet with a physician. Smartphone use to obtain health-related information was more common among respondents younger than 50 years versus those who were 50 years or older (55.5% vs 24.1%; P<.001), as was smartphone use to diagnose skin problems (20.0% vs 6.3%; P<.001).
In multivariable analysis, use of the Internet or a smartphone to obtain health-related information was associated with younger age (<50 years) and a higher level of education (both P<.001). Use of the Internet to obtain dermatology-related information (P<.001) and use of a smartphone to help diagnose a skin problem (P=.001) was associated with younger age (<50 years) only. Income, sex, co-pay to see a dermatologist, and travel time to the dermatology office were not associated with use of online resources for general or dermatology-specific health-related information or assistance with diagnosing a skin problem.
Of 204 respondents who indicated that they previously attempted to self-diagnose a skin condition using the Internet, the most commonly researched condition was skin cancer/moles/unknown spots (64.7%), followed by rashes (40.7%), acne (20.6%), cosmetic issues (16.2%), psoriasis (12.7%), dermatitis (3.4%), warts (1.5%), tick bites (1.0%), and lupus (1.0%)(some respondents selected more than one condition). Only 7.0% of respondents indicated that they previously had refrained from visiting a dermatologist based on reassurance from online resources. Compared to the rest of the surveyed population, these respondents were younger (P=.001), but there were no significant differences in sex, highest level of education, household income, or travel time to the dermatology office. The most commonly researched condition among these respondents was acne (12 respondents), and 11 respondents indicated that they had attempted to self-diagnose a mole or potential cancer using online sources.
Of 557 respondents who owned a smartphone, 31.8% reported using at least 1 health-related app (mean number of health apps per respondent, 1.5). Of the apps that respondents used, 45.9% focused on fitness/nutrition, 28.7% provided reference information, 13.4% were a patient portal for receiving information from their electronic medical record, 8.6% provided a health monitoring function, 1.9% served as a diagnostic aid, and 1.5% provided coping assistance and emotional support for individuals with cognitive or emotional conditions; only 1 respondent reported using an app related to dermatology.
All respondents were asked to rate their anticipated degree of worry if the Internet or a smartphone app suggested that a skin lesion was benign versus dangerous on a 5-point scale. Overall, the median worry rating increased from 3 to 5 when information accessed via the Internet or a smartphone app suggested a lesion was dangerous rather than benign. A change in worry of 2 or more points was seen in 36.1% of females and 49.1% of males (P=.002) when information obtained via the Internet indicated a lesion was dangerous and in 47.5% of females and 58.8% of males (P=.006) when a smartphone app indicated that a lesion was dangerous. When information obtained via the Internet indicated a lesion was dangerous, a change in worry of 2 or more points was seen in 41.8% of respondents who were younger than 50 years and in 41.1% of those who were 50 years or older (P=.93). When a smartphone app indicated a lesion was dangerous, a change in worry of 2 or more points was seen in 50.2% of respondents who were younger than 50 years and in 52.2% of those who were 50 years or older (P=.61).
Discussion
In this cross-sectional study, we found that health-related Internet and smartphone use among dermatology patients is common and may impact both patients’ degree of concern about a skin lesion as well as the likelihood of seeking in-person medical care if they are reassured by the results of their online findings. Age and level of education were associated with Internet and smartphone use to obtain dermatology-related health information but not factors related to health care access. More patients used the Internet or a smartphone to obtain general medical information versus dermatology-related information. Respondents who indicated that they used the Internet to obtain health-related information tended to do so before visiting their physician.
Our finding that a patient’s level of worry about a hypothetical skin condition or lesion is influenced by health information obtained via the Internet or a smartphone app is concerning. One study found that participants who used a popular search engine to look for information about vaccine safety and dangers were directed to Web sites with inaccurate information more than 50% of the time, and 65% of the information they obtained from these sites was false.6 In our study, approximately 25% of respondents had previously consulted online resources to attempt toself-diagnose a skin condition. Online sources about dermatologic conditions were consulted most frequently for information about potential skin cancers, moles, and unknown spots. A prior study showed that smartphone apps that claim to aid patients in determining whether a skin lesion is low or high risk for melanoma often are inaccurate and are associated with a high rate of missed melanomas.5 Even though we surveyed patients who did end up seeing a dermatologist, some respondents had previously opted out of seeing a dermatologist based on information they had found online. Because our study was conducted among patients who chose to seek care at a dermatology office, the problem is likely greater than estimated from our findings because we had no way of reaching individuals who decided to completely forgo a visit with a dermatologist.
Although use of the Internet to obtain health-related information was common among older adults in our population, it was nearly universal in younger adults. Health-related smartphone use was more than twice as common in younger versus older adults, which could be due to an increased comfort with technology and its integration into daily life. The fact that age and education were associated with Internet use for dermatology-related health information but not household income or travel time to the dermatology office suggests that information seeking is not due to lack of resources limiting access to dermatologic care but rather to the greater role that rapid access to online information plays in patients’ lives. Our findings are similar to another study that examined the use of online sources for general health information.7
This study has several limitations. First, there may have been some selection bias. We specifically aimed to understand the health-related Internet and smartphone use among dermatology patients, thus restricting our sample to this population. By doing so, we were unable to assess the use of such resources by the general population, particularly those individuals who chose not to see a dermatologist at all based on their own online research. Our findings may not apply to other practices and regions of the country, as we implemented our study in one geographic location and in offices of an academic practice. Although our sample size and diversity with regard to income, education, and age suggest that our results are likely generalizable to many settings, it is important to note that nearly all respondents in this study had health insurance and our findings are thus not necessarily applicable to those individuals who are uninsured.
Conclusion
Our findings suggest that the availability of online health information regarding dermatologic conditions provides dermatologists with both opportunities and challenges. Many patients consult online resources for health information, and the popularity of this practice is likely to increase with time, particularly as newer smartphones with features designed to allow users to monitor their health are developed with health-conscious consumers in mind. Most large health care systems provide patients with resources to view laboratory results and communicate with physicians online. It is important for dermatologists to be involved in the development of high-quality online content that educates the public while also emphasizing the need to seek in-person medical care, particularly in potential cases of skin cancer. It also is important for patients to be involved in the content development process to ensure that the messages they take away from online resources are the ones physicians wish to convey. Ideally, online forms of education will increase patients’ sense of self-efficacy while encouraging appropriate consultation for potentially harmful skin conditions.
1. Atkinson NL, Saperstein SL, Pleis J. Using the Internet for health-related activities: findings from a national probability sample. J Med Internet Res. 2009;11:e4.
2. Ybarra M, Suman M. Reasons, assessments and actions taken: sex and age differences in uses of Internet health information. Health Educ Res. 2008;23:512-521.
3. Bhandari N, Shi Y, Jung K. Seeking health information online: does limited healthcare access matter? J Am Med Inform Assoc. 2014;21:1113-1117.
4. Thackeray R, Crookston BT, West JH. Correlates of health-related social media use among adults. J Med Internet Res. 2013;15:e21.
5. Wolf JA, Moreau JF, Akilov O, et al. Diagnostic inaccuracy of smartphone applications for melanoma detection. JAMA Dermatol. 2013;149:422-426.
6. Kortum P, Edwards C, Richards-Kortum R. The impact of inaccurate Internet health information in a secondary school learning environment. J Med Internet Res. 2008;10:e17.
7. Mead N, Varnam R, Rogers A, et al. What predicts patients’ interest in the internet as a health resource in primary care in England? J Health Serv Res Policy. 2003;8:33-39.

Outcomes and Medication Use in a Longitudinal Cohort of Type 2 Diabetes Patients, 2006 to 2012
From the Wake Forest School of Medicine, Winston-Salem, NC.
Abstract
- Objective: To assess outcomes and pharmacotherapy in a cohort of patients with type 2 diabetes in a university-based family medicine teaching practice.
- Methods: We used ICD-9-CM codes to identify a cohort of patients with diabetes seen in 2006 and 2012. A total of 891 patients were identified who made follow-up visits in both years. We collected data on patient characteristics, pharmacotherapy, and outcomes for glycemia, blood pressure (BP), and low-density lipoprotein (LDL) cholesterol. We determined type and number of medications taken to achieve target outcomes.
- Results: A1C remained constant between 2006 and 2012 (7.6% to 7.7%) along with BMI (34.7 kg/m2 to 34.1 kg/m2), while mean LDL cholesterol significantly decreased from 109 mg/dL in 2006 to 98.8 mg/dL in 2012. The number of patients achieving a goal LDL < 100 mg/dL increased from 43.5 % in 2006 to 58.6% in 2012. The largest group with controlled A1C (< 7 %) were taking metformin with a sulfonylurea, DPP-4 inhibitor, glitazone or an injectable GLP-agonist. The majority achieved an LDL goal of < 100 mg/dl. The majority of hypertensive regimens included use of an ACE inhibitor or ARB with overall BP control achieved in at least 45% of patients.
- Conclusion: Multiple medications are necessary to achieve control among patients with type 2 diabetes over time and this cannot be attributed to an increase in BMI. Overall control for A1C and BP can be sustained and significantly decreased for LDL cholesterol using multiple medications, with the primary agent for LDL reduction being a statin.
Diabetes is an illness that affects an estimated 25.8 million Americans and is quickly becoming a worldwide epidemic [1,2]. Diabetes is a significant cause of both microvascular and macrovascular sequelae, but its frequent association with the comorbid conditions of hypertension and dyslipidemia further increases the risk of heart disease, stroke, peripheral vascular complications, and renal impairment [3–5]. The American Diabetes Association (ADA) publishes consensus guidelines annually to guide management for patients with diabetes. From 2006 to 2012, the accepted standard of medical care included achieving a hemoglobin A1C (A1C) measurement of < 7%, a low-density lipoprotein (LDL) level of < 100 mg/dL, and a blood pressure (BP) of < 130/80 mm Hg [6,7]. The National Health and Nutrition Examination Survey (NHANES) recently reported that the goal of simultaneous control of A1C, LDL and BP is met in only about 19% of diabetes patients [8]. Target glycemic control is relaxed to an A1C < 8% in some patients with multiple comorbidities, limited life span, or risk for hypoglycemia; and in 2013 the BP goal was modified to < 140/80 based on clinical trial evidence [9].
In combination with lifestyle modification, pharmacotherapy is a critical component of chronic disease management. Initial pharmacotherapy treatment recommendations include metformin for diabetes, an angiotensin-converting enzyme inhibitor (ACEI) or angiotensin II receptor blocker (ARB) for hypertension, and a statin for dyslipidemia [6,7,9]. In patients who already have a diagnosis of diabetes, achieving control becomes more difficult to accomplish with lifestyle alone, and the benefit of lifestyle intervention on all-cause mortality as well as cardiovascular and microvascular events remains a debated issue [10]. The need for pharmacologic agents in most patients with diabetes is inevitable. Metformin is the agent of choice for initial treatment with drug therapy, with the option of adding a variety of other oral or injectable medications based on clinician decision-making [7]. In this study, we reviewed data from a longitudinal cohort of type 2 diabetes patients and compared medication use and outcomes at 2 different time-points (2006 and 2012) to see how medical management and outcome measures changed over time.
Methods
Setting
Data were obtained from an academic family medicine clinic in the southeastern United States. Approximately 56,000 patient visits to this clinic are conducted annually. Family medicine residents in training, fellows, faculty physicians, physician assistants, a nutritionist, and diabetes educators care for patients seen in this practice.
Data Collection
A cohort of patients was identified using the International Classification of Diseases, 9th Revision, Clinical Modification codes for type 2 diabetes. The cohort comprised patients with diabetes in 2006 and 2012 who made follow-up visits in both years.
The data from both time-points were obtained from electronic medical record (EMR) data capture and structured chart review. Two reviewers reviewed 10% of the charts for accuracy after the data was pre-populated from the EMR. The following data were obtained: demographic variables (patient age, gender, and race), height, weight, insurance, smoking status, A1C, LDL, and BP measurements, pharmacotherapy for glycemia, hypertension, and hyperlipidemia, and number of medications needed for control. For variables that had multiple measures, we calculated an average for the year.
The study protocol was approved by the Institutional Review Board at Wake Forest School of Medicine.
Statistical Analysis
Descriptive statistics were performed to compute means, standard deviations, frequencies, and percentages for demographic variables and for glycemia, BP, LDL includ-ing patient characteristics, diabetes outcomes, and pharmacotherapy medication variables. Paired t tests were used to assess for a difference at the level of the patient in the means of the A1C, BP, and LDL between the 2 study time-points (2-sided alpha = 0.05). The non-parametric McNemar test was used to assess for differences in the proportions of patients at the identified goal for A1C, LDL, and BP for 2006 and 2012.
Results
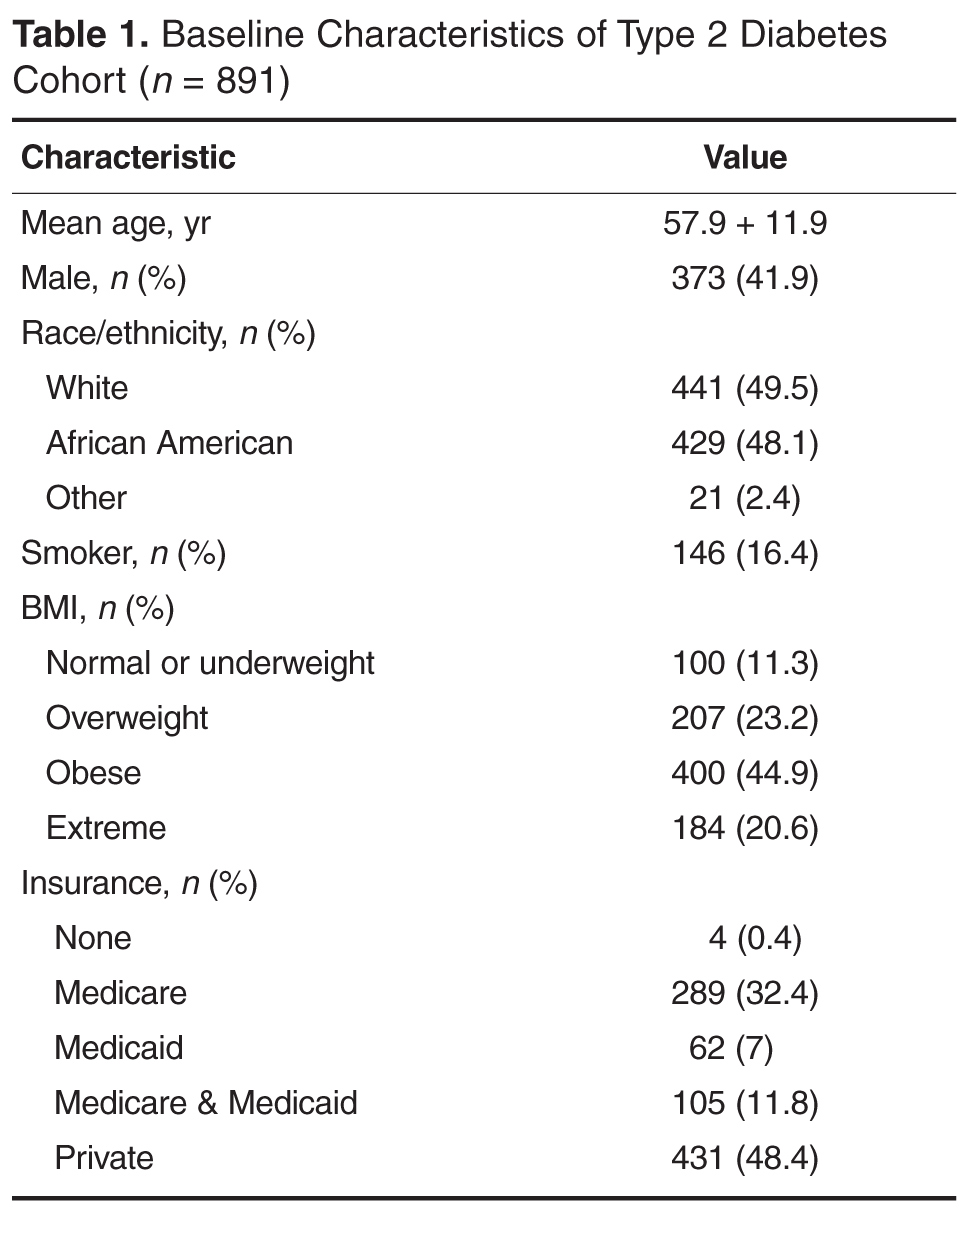
The number of visits per patient was 5.9 in 2006 and 5.3 in 2012. A1C remained constant between 2006 and 2012 (mean 7.6% vs. 7.7%, ± 1.8) along with body mass index (BMI), while mean LDL cholesterol significantly decreased from 109 ± 36.4 mg/dL in 2006 to 98.8 ± 40.4 mg/dL in 2012 (Table 2). Mean systolic BP marginally increased over the 6-year period from 131.5 ± 14.2 to 134.8 ± 16.1 mm Hg with diastolic BP remaining constant.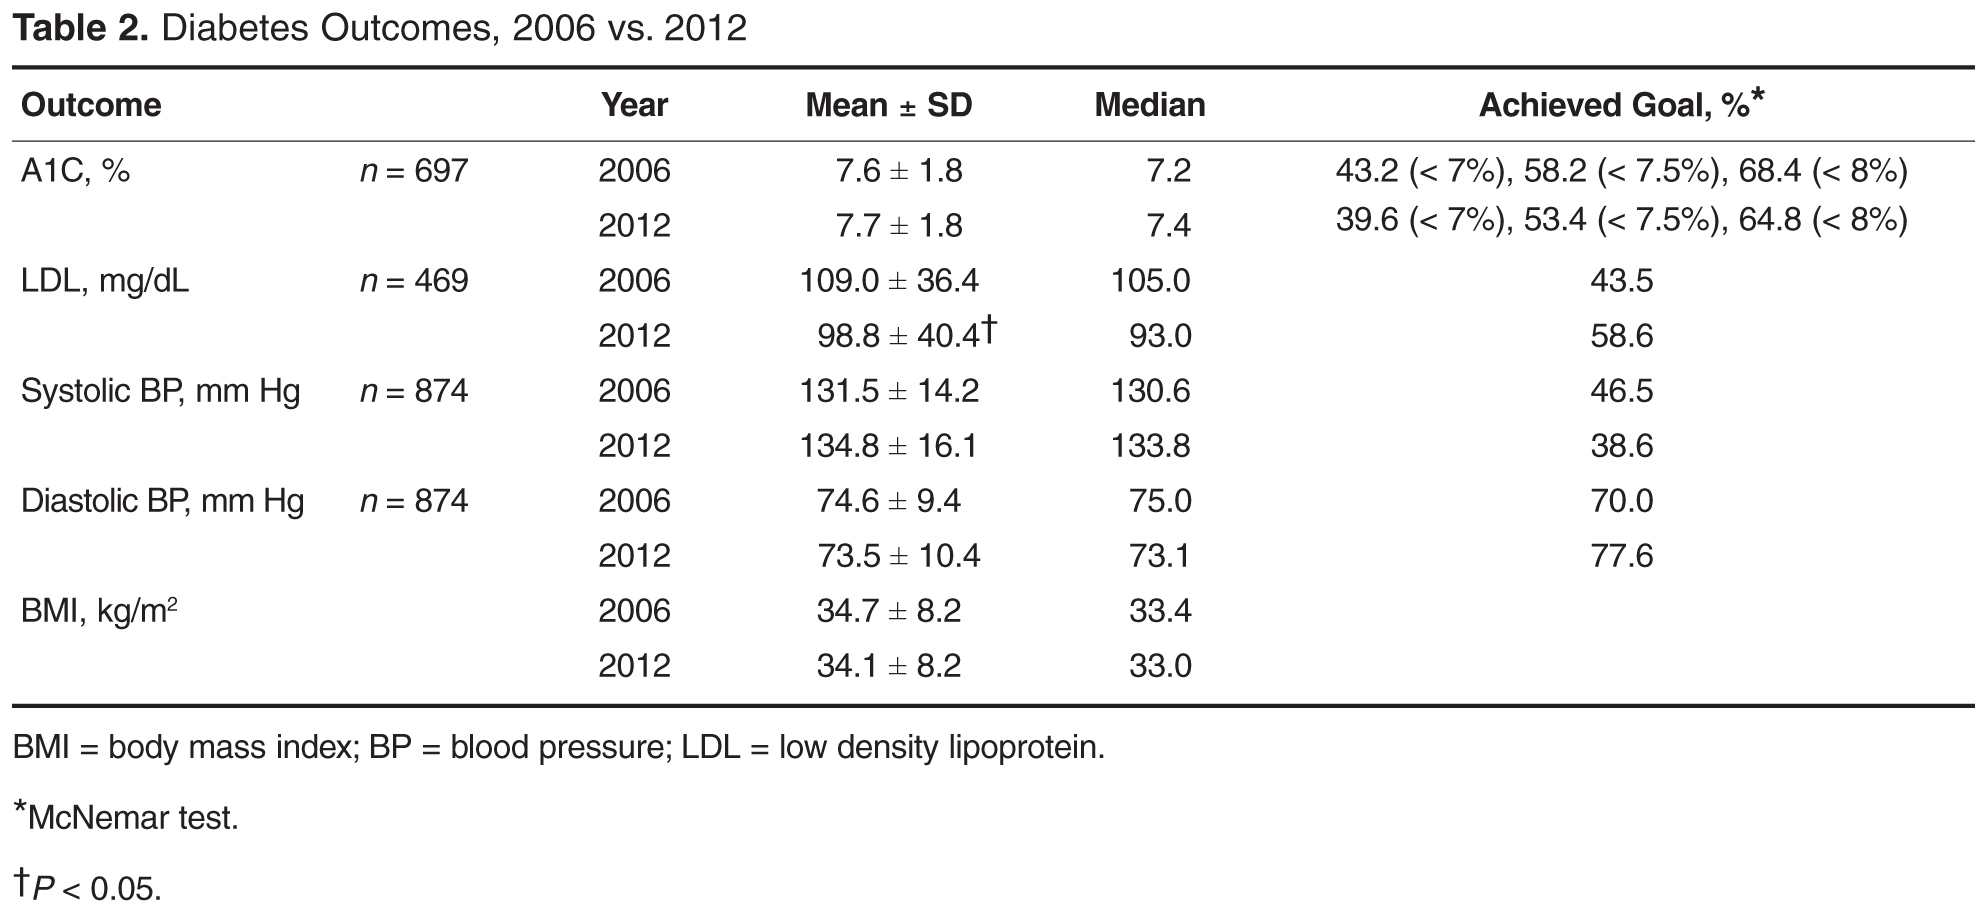
The percentage of patients achieving the less stringent A1C goal of < 8% comprised over 50% of the population at both time points; however, compared with 2006, in 2012 there was a lower percentage of patients at the more stringent A1C target of < 7% (43.2% vs. 39.6%). The percentage of patients achieving goal for systolic BP was significantly decreased to 38.6% in 2012 versus 46.5% in 2006 (Table 2). However, the proportion of patients with controlled diastolic BP rose significantly from 70% to 77.6%. The number of patients achieving goal LDL (< 100 mg/dL) increased from 43.5% in 2006 to 58.6% in 2012.
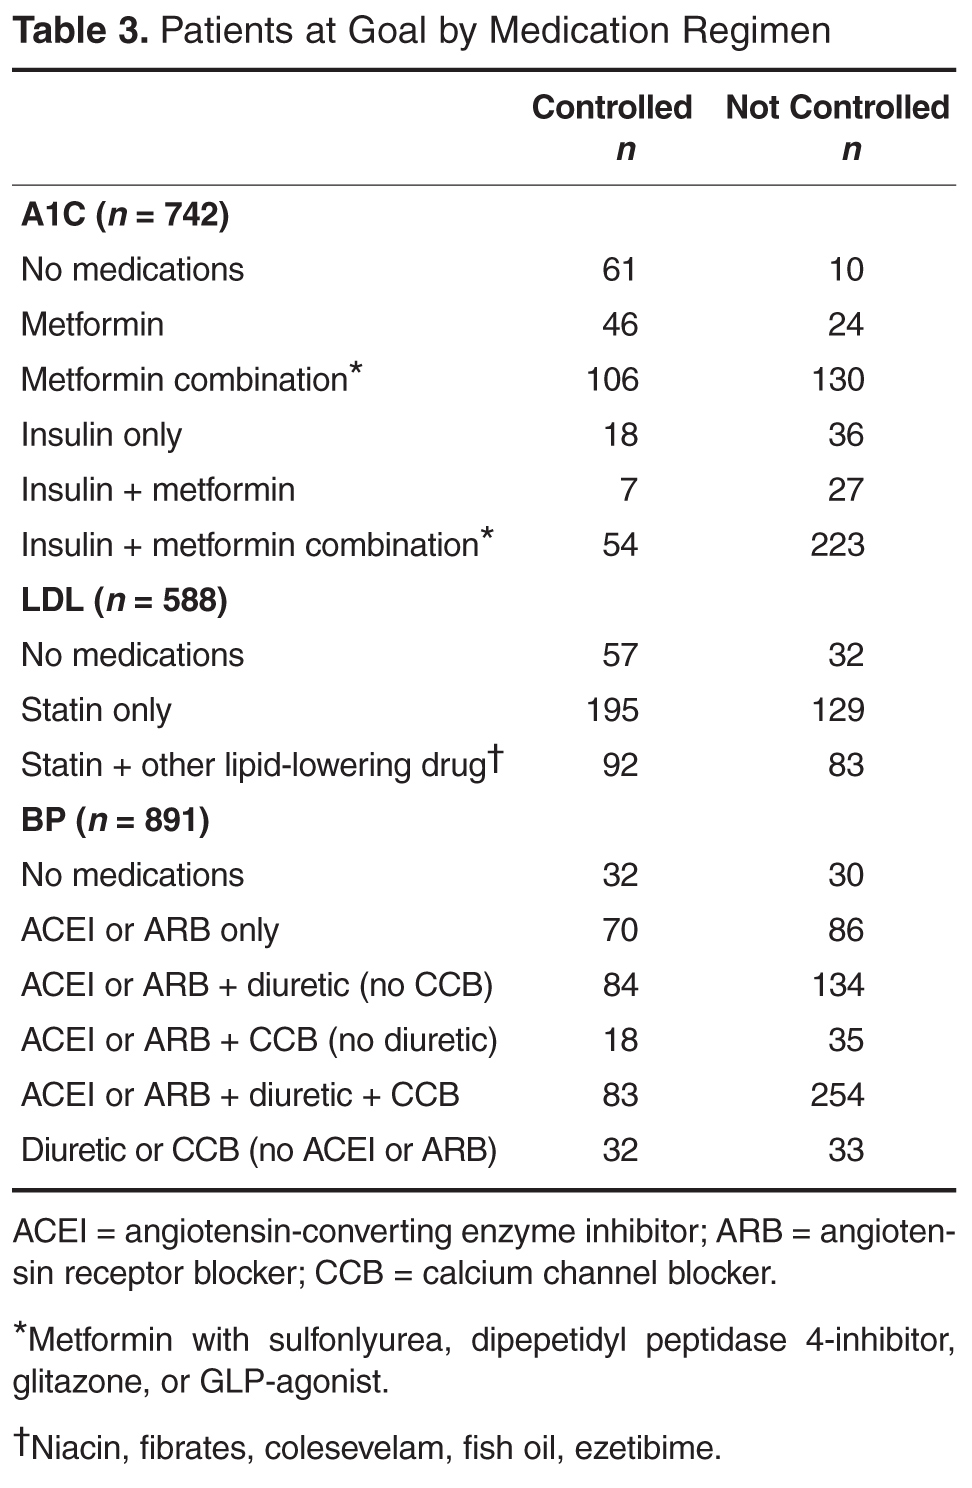
Table 3 shows number of patients at LDL goal of < 100 mg/dL by lipid-lowering agent. There was a large portion (n = 303 or 34%) of the 891 patients that did not have LDL values available in both 2006 and 2012. A total of 89 patients were taking no medications for LDL, with 64% achieving controlled levels. The large majority of patients were controlled on a single statin drug (n = 195, 59%) while those requiring more than a statin drug for control comprised 53% of patients (n = 92).
Table 3 shows achievement of BP < 130/80 by anti-hypertensive regimen. The majority of the hypertensive regimens included the use of an ACEI or an ARB, with overall BP control achieved in at least 45% of patients. The highest BP control (49%) was achieved in the diuretic and CCB–containing regimens without an ACEI or ARB, represented by a smaller group of patients (n = 65). There were 32 patients whose hypertension was controlled without antihypertensive therapy. Ninety-three percent of the cohort had data for evaluation in both years.
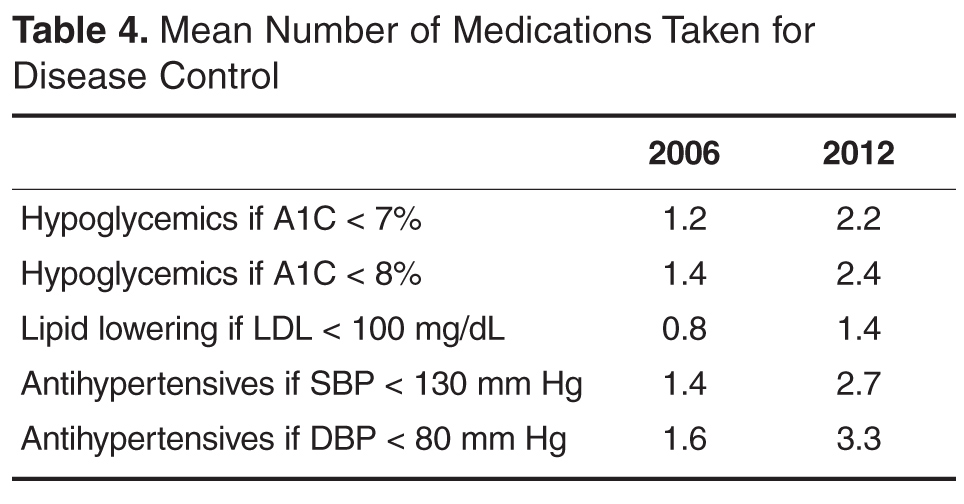
Discussion
Despite the availability of evidence-based guidelines and vast knowledge about microvascular and macrovascular complications due to diabetes, clinical goals for diabetes outcomes are not being routinely achieved in practice. More work is needed to achieve national standards of care. NHANES data from 2007 to 2010 revealed that 52.5% of patients with diabetes achieved an A1C of < 7% while 51.1% had a BP < 130/80 and 56.2% had an LDL < 100 mg/dL [8].
Improvement in LDL cholesterol was seen in the current study, and A1C remained constant during the 6-year time period. While mean A1C, BP, and LDL measurements were close to ADA target goals, a smaller proportion of patients were controlled in 2012 compared with 2006. Hoerger and colleagues [11] found using NHANES data 1999 to 2004 that mean A1C levels significantly declined over time, with 55.7% (up from 36.9%) achieving an A1C of < 7% by 2004 [11]. In our sample of patient with diabetes, only 39.6% were at A1C goal in 2012; 8.2% (61/742) achieved control with no medications.
Metformin is first-line therapy according to ADA recommendations. Most regimens in our study included this drug, with a large percentage of patients with controlled A1C taking this very affordable agent [12]. The combination regimens with metformin plus another oral therapy or 2 oral drugs with insulin resulted in a higher percentage of patients controlled compared to metformin or insulin monotherapy. From our previous chart review [13] of the entire practice of patients with diabetes (n = 1398) from 2006, A1C control was similarly achieved in patients taking insulin (31% vs. 33%) or insulin combinations (19% vs. 20%) from 2006 to 2012, respectively.
For LDL cholesterol control, 9.7% (57/588) of the cohort used no medications to reach goal. Statin use predominated, with 60% of the cohort reaching goal with a single statin agent. Approximately one-third (175/588) of evaluable patients were on more than 1 cholesterol medication, and about half of these (53%) reached goal. Over the 6-year period, atorvastatin become available generically, which may have impacted the number of patients able to use this statin. Compared with a recent literature review over a 12-year period of LDL attainment in primary care [14], the results of our study show equivalent or better LDL goal achievement among patient with diabetes.
The majority of the patients received an ACEI or ARB. There were a comparable number of patients controlled with ACEI or ARB with a diuretic, versus an ACEI or ARB with a diuretic and CCB. Large-scale clinical trials have shown that using an ACEI or ARB in combination with a CCB is superior to a hydrochlorathiazide-based combination for reducing risk of major cardiovascular events [15]. The Action to Control Cardiovascular Risk in Diabetes (ACCORD) trial showed that serious adverse events attributed to antihypertensive treatment occurred more frequently in the intensive therapy group (< 120/80) than in the standard therapy (< 140/80) group [16]. The stringent systolic BP goal in accord was accomplished using 3.4 medications. Aggressive lowering of BP may be dangerous in patients with diabetes and there is no benefit found in many large-scale studies [17]. The 2013 ADA goal for BP is now < 140/80 mm Hg, and while our data show that a significant increase in BP was seen over a 6-year period, the number of medications needed to control BP will likely be lower with the new ADA target and potentially safer.
In our cohort, over the 6-year period there was an increase in the number of medications needed to achieve glycemic, BP, and LDL goals. During this time, there were no major changes in the way the patients received care in the clinic environment. We cannot comment on whether lifestyle changes or diabetes education may have impacted the need for increased medication use. Limitations to this study include the unavailability of A1C (17%) and LDL (34%) data at both time points for every patient, inability to verify insurance data for the 2012 time period, and that the data are from a single practice. We also were unable to determine the duration of diabetes diagnosis due to a change in electronic medical record systems and lack of full documentation by providers.
These findings suggest that as patients live longer with type 2 diabetes, they will need increasing numbers of medications to achieve standard of care goals. Research has shown that there are challenges in implementing diabetes guidelines in primary care, including potential inaccuracies contained in electronic patient health information, inadequate coordination among health care providers, physician lack of awareness of guidelines, and clinical inertia [18]. As shown in the current study and other research, intensification of traditional therapies for glycemic control can sustain target outcomes without the risk of significant weight gain [19].
The chronic condition of diabetes is associated with medical complications as well as challenges for providing optimal care, despite advances in pharmacotherapy. As more medications are added to a patient’s regimen, adherence can become challenging. The cost of medications also warrants consideration. Research is needed to understand the impact on quality of life, cost of care, and outcomes of these regimens as well as whether lifestyle modifications can impact the number of medications needed by individual patients. The current study indicates that overall outcome control for A1C and BP can be sustained and significantly decreased for LDL cholesterol using multiple medications with the primary agent being a statin drug.
Acknowledgements: We would like to thank Drs. Elizabeth Strachan and Madhavi Peechara for their past contributions and diligence in the original chart review.
Corresponding author: Julienne K. Kirk, PharmD, CDE, Wake Forest School of Medicine, Medical Center Blvd., Winston-Salem, NC 27157-1084, [email protected].
Financial disclosures: None.
Author contributions: conception and design, JKK, KL, RWL; analysis and interpretation of data, JKK, SWD, KL, CAH, RWL; drafting of article, JKK, KL, RWL; critical revision of the article, JKK, KL, CAH; provision of study materials or patients, JKK, SWD; statistical expertise, SWD; administrative or technical support, CAH; collection and assembly of data, JKK, KL, CAH.
1. Centers for Disease Control and Prevention. National diabetes fact sheet: national estimates and general information on diabetes and prediabetes in the United States, 2011. Atlanta: US Department of Health and Human Services, Centers for Disease Control and Prevention, 2011.
2. Narayan KM, Boyle JP, Thompson TJ, et al. Lifetime risk for diabetes mellitus in the United States. JAMA 2003;290:1884–90.
3. McWilliams JM, Meara E, Zaslavsky AM, Ayanian JZ. Differences in control of cardiovascular disease and diabetes by race, ethnicity, and education: U.S. trends from 1999 to 2006 and effects of Medicare coverage. Ann Intern Med 2009;150:505–15.
4. Vouri SM, Shaw RF, Waterbury NV, et al. Prevalence of achievement of A1c, blood pressure, and cholesterol (ABC) goal in veterans with diabetes. Manag Care Pharm 2011;17:304–12.
5. Kirk JK, Bell RA, Bertoni AG, et al. Ethnic disparities: control of glycemia, blood pressure, and LDL cholesterol among US adults with type 2 diabetes. Ann Pharmacother 2005;39:1489–501.
6. American Diabetes Association. Standards of medical care in diabetes–2006. Diabetes Care 2006;29(Suppl 1):S4–S42.
7. American Diabetes Association. Standards of medical care in diabetes–2012. Diabetes Care 2012;35(Suppl 1):S11–S63.
8. Casagrande SS, Fradkin JE, Saydah SH, et al. The prevalence of meeting A1C, blood pressure, and LDL goals among people with diabetes, 1988-2010. Diabetes Care 2013;36:2271–9.
9. American Diabetes Association. Standards of medical care in diabetes–2013. Diabetes Care 2013;36(Suppl 1):S11–S66.
10. Schellenberg ES, Dryden DM, Vandermeer B, et al. Lifestyle intervention for patients with and at risk for type 2 diabetes: A systematic review and meta-analysis. Ann Inten Med 2013;159:543–51.
11. Hoerger TJ, Segel JE, Gregg EW, Saaddine JB. Is glycemic control improving in US adults? Diabetes Care 2008;31:81–6.
12. Inzucchi SE, Bergenstal RM, Buse JB, et al. Management of hyperglycemia in type 2 diabetes: a patient-centered approach. Diabetes Care 2012;35:1364–79.
13. Kirk JK, Strachan E, Martin CL, et al. Patient characteristics and process of care measures as predictors of glycemic control. J Clin Outcomes Manag 2010;17:27–30.
14. Chopra I, Kamal KM, Candrilli SD. Variations in blood pressure and lipid goal attainment in primary care. Curr Med Res Opin 2013;29:1115–25.
15. Jamerson K, Weber MA, Bakris GL, et al. Benazepril plus amlodipine or hydrochlorothiazide for hypertension in high-risk patients. N Engl J Med 2008;359:2417–28.
16. Grossman E. Blood pressure: the lower, the better. The con side. Diabetes Care 2011;34:S308–12.
17. Cushman WC, Evans GW, Byington RP, et al. Effects of intensive blood pressure control in type 2 diabetes mellitus. N Engl J Med 2010;362:1575–85.
18. Appiah B, Hong Y, Ory MG, et al. Challenges and opportunities for implementing diabetes self-management guidelines. J Am Board Fam Med 2013;26:90–2.
19. Best JD, Drury PL, Davis TME, et al. Glycemic control over 4 years in 4,900 people with type 2 diabetes. Diabetes Care 2012;35:1165–70.
From the Wake Forest School of Medicine, Winston-Salem, NC.
Abstract
- Objective: To assess outcomes and pharmacotherapy in a cohort of patients with type 2 diabetes in a university-based family medicine teaching practice.
- Methods: We used ICD-9-CM codes to identify a cohort of patients with diabetes seen in 2006 and 2012. A total of 891 patients were identified who made follow-up visits in both years. We collected data on patient characteristics, pharmacotherapy, and outcomes for glycemia, blood pressure (BP), and low-density lipoprotein (LDL) cholesterol. We determined type and number of medications taken to achieve target outcomes.
- Results: A1C remained constant between 2006 and 2012 (7.6% to 7.7%) along with BMI (34.7 kg/m2 to 34.1 kg/m2), while mean LDL cholesterol significantly decreased from 109 mg/dL in 2006 to 98.8 mg/dL in 2012. The number of patients achieving a goal LDL < 100 mg/dL increased from 43.5 % in 2006 to 58.6% in 2012. The largest group with controlled A1C (< 7 %) were taking metformin with a sulfonylurea, DPP-4 inhibitor, glitazone or an injectable GLP-agonist. The majority achieved an LDL goal of < 100 mg/dl. The majority of hypertensive regimens included use of an ACE inhibitor or ARB with overall BP control achieved in at least 45% of patients.
- Conclusion: Multiple medications are necessary to achieve control among patients with type 2 diabetes over time and this cannot be attributed to an increase in BMI. Overall control for A1C and BP can be sustained and significantly decreased for LDL cholesterol using multiple medications, with the primary agent for LDL reduction being a statin.
Diabetes is an illness that affects an estimated 25.8 million Americans and is quickly becoming a worldwide epidemic [1,2]. Diabetes is a significant cause of both microvascular and macrovascular sequelae, but its frequent association with the comorbid conditions of hypertension and dyslipidemia further increases the risk of heart disease, stroke, peripheral vascular complications, and renal impairment [3–5]. The American Diabetes Association (ADA) publishes consensus guidelines annually to guide management for patients with diabetes. From 2006 to 2012, the accepted standard of medical care included achieving a hemoglobin A1C (A1C) measurement of < 7%, a low-density lipoprotein (LDL) level of < 100 mg/dL, and a blood pressure (BP) of < 130/80 mm Hg [6,7]. The National Health and Nutrition Examination Survey (NHANES) recently reported that the goal of simultaneous control of A1C, LDL and BP is met in only about 19% of diabetes patients [8]. Target glycemic control is relaxed to an A1C < 8% in some patients with multiple comorbidities, limited life span, or risk for hypoglycemia; and in 2013 the BP goal was modified to < 140/80 based on clinical trial evidence [9].
In combination with lifestyle modification, pharmacotherapy is a critical component of chronic disease management. Initial pharmacotherapy treatment recommendations include metformin for diabetes, an angiotensin-converting enzyme inhibitor (ACEI) or angiotensin II receptor blocker (ARB) for hypertension, and a statin for dyslipidemia [6,7,9]. In patients who already have a diagnosis of diabetes, achieving control becomes more difficult to accomplish with lifestyle alone, and the benefit of lifestyle intervention on all-cause mortality as well as cardiovascular and microvascular events remains a debated issue [10]. The need for pharmacologic agents in most patients with diabetes is inevitable. Metformin is the agent of choice for initial treatment with drug therapy, with the option of adding a variety of other oral or injectable medications based on clinician decision-making [7]. In this study, we reviewed data from a longitudinal cohort of type 2 diabetes patients and compared medication use and outcomes at 2 different time-points (2006 and 2012) to see how medical management and outcome measures changed over time.
Methods
Setting
Data were obtained from an academic family medicine clinic in the southeastern United States. Approximately 56,000 patient visits to this clinic are conducted annually. Family medicine residents in training, fellows, faculty physicians, physician assistants, a nutritionist, and diabetes educators care for patients seen in this practice.
Data Collection
A cohort of patients was identified using the International Classification of Diseases, 9th Revision, Clinical Modification codes for type 2 diabetes. The cohort comprised patients with diabetes in 2006 and 2012 who made follow-up visits in both years.
The data from both time-points were obtained from electronic medical record (EMR) data capture and structured chart review. Two reviewers reviewed 10% of the charts for accuracy after the data was pre-populated from the EMR. The following data were obtained: demographic variables (patient age, gender, and race), height, weight, insurance, smoking status, A1C, LDL, and BP measurements, pharmacotherapy for glycemia, hypertension, and hyperlipidemia, and number of medications needed for control. For variables that had multiple measures, we calculated an average for the year.
The study protocol was approved by the Institutional Review Board at Wake Forest School of Medicine.
Statistical Analysis
Descriptive statistics were performed to compute means, standard deviations, frequencies, and percentages for demographic variables and for glycemia, BP, LDL includ-ing patient characteristics, diabetes outcomes, and pharmacotherapy medication variables. Paired t tests were used to assess for a difference at the level of the patient in the means of the A1C, BP, and LDL between the 2 study time-points (2-sided alpha = 0.05). The non-parametric McNemar test was used to assess for differences in the proportions of patients at the identified goal for A1C, LDL, and BP for 2006 and 2012.
Results
The number of visits per patient was 5.9 in 2006 and 5.3 in 2012. A1C remained constant between 2006 and 2012 (mean 7.6% vs. 7.7%, ± 1.8) along with body mass index (BMI), while mean LDL cholesterol significantly decreased from 109 ± 36.4 mg/dL in 2006 to 98.8 ± 40.4 mg/dL in 2012 (Table 2). Mean systolic BP marginally increased over the 6-year period from 131.5 ± 14.2 to 134.8 ± 16.1 mm Hg with diastolic BP remaining constant.
The percentage of patients achieving the less stringent A1C goal of < 8% comprised over 50% of the population at both time points; however, compared with 2006, in 2012 there was a lower percentage of patients at the more stringent A1C target of < 7% (43.2% vs. 39.6%). The percentage of patients achieving goal for systolic BP was significantly decreased to 38.6% in 2012 versus 46.5% in 2006 (Table 2). However, the proportion of patients with controlled diastolic BP rose significantly from 70% to 77.6%. The number of patients achieving goal LDL (< 100 mg/dL) increased from 43.5% in 2006 to 58.6% in 2012.
Table 3 shows number of patients at LDL goal of < 100 mg/dL by lipid-lowering agent. There was a large portion (n = 303 or 34%) of the 891 patients that did not have LDL values available in both 2006 and 2012. A total of 89 patients were taking no medications for LDL, with 64% achieving controlled levels. The large majority of patients were controlled on a single statin drug (n = 195, 59%) while those requiring more than a statin drug for control comprised 53% of patients (n = 92).
Table 3 shows achievement of BP < 130/80 by anti-hypertensive regimen. The majority of the hypertensive regimens included the use of an ACEI or an ARB, with overall BP control achieved in at least 45% of patients. The highest BP control (49%) was achieved in the diuretic and CCB–containing regimens without an ACEI or ARB, represented by a smaller group of patients (n = 65). There were 32 patients whose hypertension was controlled without antihypertensive therapy. Ninety-three percent of the cohort had data for evaluation in both years.
Discussion
Despite the availability of evidence-based guidelines and vast knowledge about microvascular and macrovascular complications due to diabetes, clinical goals for diabetes outcomes are not being routinely achieved in practice. More work is needed to achieve national standards of care. NHANES data from 2007 to 2010 revealed that 52.5% of patients with diabetes achieved an A1C of < 7% while 51.1% had a BP < 130/80 and 56.2% had an LDL < 100 mg/dL [8].
Improvement in LDL cholesterol was seen in the current study, and A1C remained constant during the 6-year time period. While mean A1C, BP, and LDL measurements were close to ADA target goals, a smaller proportion of patients were controlled in 2012 compared with 2006. Hoerger and colleagues [11] found using NHANES data 1999 to 2004 that mean A1C levels significantly declined over time, with 55.7% (up from 36.9%) achieving an A1C of < 7% by 2004 [11]. In our sample of patient with diabetes, only 39.6% were at A1C goal in 2012; 8.2% (61/742) achieved control with no medications.
Metformin is first-line therapy according to ADA recommendations. Most regimens in our study included this drug, with a large percentage of patients with controlled A1C taking this very affordable agent [12]. The combination regimens with metformin plus another oral therapy or 2 oral drugs with insulin resulted in a higher percentage of patients controlled compared to metformin or insulin monotherapy. From our previous chart review [13] of the entire practice of patients with diabetes (n = 1398) from 2006, A1C control was similarly achieved in patients taking insulin (31% vs. 33%) or insulin combinations (19% vs. 20%) from 2006 to 2012, respectively.
For LDL cholesterol control, 9.7% (57/588) of the cohort used no medications to reach goal. Statin use predominated, with 60% of the cohort reaching goal with a single statin agent. Approximately one-third (175/588) of evaluable patients were on more than 1 cholesterol medication, and about half of these (53%) reached goal. Over the 6-year period, atorvastatin become available generically, which may have impacted the number of patients able to use this statin. Compared with a recent literature review over a 12-year period of LDL attainment in primary care [14], the results of our study show equivalent or better LDL goal achievement among patient with diabetes.
The majority of the patients received an ACEI or ARB. There were a comparable number of patients controlled with ACEI or ARB with a diuretic, versus an ACEI or ARB with a diuretic and CCB. Large-scale clinical trials have shown that using an ACEI or ARB in combination with a CCB is superior to a hydrochlorathiazide-based combination for reducing risk of major cardiovascular events [15]. The Action to Control Cardiovascular Risk in Diabetes (ACCORD) trial showed that serious adverse events attributed to antihypertensive treatment occurred more frequently in the intensive therapy group (< 120/80) than in the standard therapy (< 140/80) group [16]. The stringent systolic BP goal in accord was accomplished using 3.4 medications. Aggressive lowering of BP may be dangerous in patients with diabetes and there is no benefit found in many large-scale studies [17]. The 2013 ADA goal for BP is now < 140/80 mm Hg, and while our data show that a significant increase in BP was seen over a 6-year period, the number of medications needed to control BP will likely be lower with the new ADA target and potentially safer.
In our cohort, over the 6-year period there was an increase in the number of medications needed to achieve glycemic, BP, and LDL goals. During this time, there were no major changes in the way the patients received care in the clinic environment. We cannot comment on whether lifestyle changes or diabetes education may have impacted the need for increased medication use. Limitations to this study include the unavailability of A1C (17%) and LDL (34%) data at both time points for every patient, inability to verify insurance data for the 2012 time period, and that the data are from a single practice. We also were unable to determine the duration of diabetes diagnosis due to a change in electronic medical record systems and lack of full documentation by providers.
These findings suggest that as patients live longer with type 2 diabetes, they will need increasing numbers of medications to achieve standard of care goals. Research has shown that there are challenges in implementing diabetes guidelines in primary care, including potential inaccuracies contained in electronic patient health information, inadequate coordination among health care providers, physician lack of awareness of guidelines, and clinical inertia [18]. As shown in the current study and other research, intensification of traditional therapies for glycemic control can sustain target outcomes without the risk of significant weight gain [19].
The chronic condition of diabetes is associated with medical complications as well as challenges for providing optimal care, despite advances in pharmacotherapy. As more medications are added to a patient’s regimen, adherence can become challenging. The cost of medications also warrants consideration. Research is needed to understand the impact on quality of life, cost of care, and outcomes of these regimens as well as whether lifestyle modifications can impact the number of medications needed by individual patients. The current study indicates that overall outcome control for A1C and BP can be sustained and significantly decreased for LDL cholesterol using multiple medications with the primary agent being a statin drug.
Acknowledgements: We would like to thank Drs. Elizabeth Strachan and Madhavi Peechara for their past contributions and diligence in the original chart review.
Corresponding author: Julienne K. Kirk, PharmD, CDE, Wake Forest School of Medicine, Medical Center Blvd., Winston-Salem, NC 27157-1084, [email protected].
Financial disclosures: None.
Author contributions: conception and design, JKK, KL, RWL; analysis and interpretation of data, JKK, SWD, KL, CAH, RWL; drafting of article, JKK, KL, RWL; critical revision of the article, JKK, KL, CAH; provision of study materials or patients, JKK, SWD; statistical expertise, SWD; administrative or technical support, CAH; collection and assembly of data, JKK, KL, CAH.
1. Centers for Disease Control and Prevention. National diabetes fact sheet: national estimates and general information on diabetes and prediabetes in the United States, 2011. Atlanta: US Department of Health and Human Services, Centers for Disease Control and Prevention, 2011.
2. Narayan KM, Boyle JP, Thompson TJ, et al. Lifetime risk for diabetes mellitus in the United States. JAMA 2003;290:1884–90.
3. McWilliams JM, Meara E, Zaslavsky AM, Ayanian JZ. Differences in control of cardiovascular disease and diabetes by race, ethnicity, and education: U.S. trends from 1999 to 2006 and effects of Medicare coverage. Ann Intern Med 2009;150:505–15.
4. Vouri SM, Shaw RF, Waterbury NV, et al. Prevalence of achievement of A1c, blood pressure, and cholesterol (ABC) goal in veterans with diabetes. Manag Care Pharm 2011;17:304–12.
5. Kirk JK, Bell RA, Bertoni AG, et al. Ethnic disparities: control of glycemia, blood pressure, and LDL cholesterol among US adults with type 2 diabetes. Ann Pharmacother 2005;39:1489–501.
6. American Diabetes Association. Standards of medical care in diabetes–2006. Diabetes Care 2006;29(Suppl 1):S4–S42.
7. American Diabetes Association. Standards of medical care in diabetes–2012. Diabetes Care 2012;35(Suppl 1):S11–S63.
8. Casagrande SS, Fradkin JE, Saydah SH, et al. The prevalence of meeting A1C, blood pressure, and LDL goals among people with diabetes, 1988-2010. Diabetes Care 2013;36:2271–9.
9. American Diabetes Association. Standards of medical care in diabetes–2013. Diabetes Care 2013;36(Suppl 1):S11–S66.
10. Schellenberg ES, Dryden DM, Vandermeer B, et al. Lifestyle intervention for patients with and at risk for type 2 diabetes: A systematic review and meta-analysis. Ann Inten Med 2013;159:543–51.
11. Hoerger TJ, Segel JE, Gregg EW, Saaddine JB. Is glycemic control improving in US adults? Diabetes Care 2008;31:81–6.
12. Inzucchi SE, Bergenstal RM, Buse JB, et al. Management of hyperglycemia in type 2 diabetes: a patient-centered approach. Diabetes Care 2012;35:1364–79.
13. Kirk JK, Strachan E, Martin CL, et al. Patient characteristics and process of care measures as predictors of glycemic control. J Clin Outcomes Manag 2010;17:27–30.
14. Chopra I, Kamal KM, Candrilli SD. Variations in blood pressure and lipid goal attainment in primary care. Curr Med Res Opin 2013;29:1115–25.
15. Jamerson K, Weber MA, Bakris GL, et al. Benazepril plus amlodipine or hydrochlorothiazide for hypertension in high-risk patients. N Engl J Med 2008;359:2417–28.
16. Grossman E. Blood pressure: the lower, the better. The con side. Diabetes Care 2011;34:S308–12.
17. Cushman WC, Evans GW, Byington RP, et al. Effects of intensive blood pressure control in type 2 diabetes mellitus. N Engl J Med 2010;362:1575–85.
18. Appiah B, Hong Y, Ory MG, et al. Challenges and opportunities for implementing diabetes self-management guidelines. J Am Board Fam Med 2013;26:90–2.
19. Best JD, Drury PL, Davis TME, et al. Glycemic control over 4 years in 4,900 people with type 2 diabetes. Diabetes Care 2012;35:1165–70.
Effect of Dementia on Discharges
The aging of the US population has profound effects on all aspects of healthcare. By 2050, 80 million Americans will be over age 65 years, and the proportion of the population over 85 years is expanding at 6 times the rate of the general population.[1] This major shift in demographics poses significant challenges to hospitalists and others who provide acute care. The prevalence of dementia mirrors the trend of increasing life expectancy. Age is the most significant risk factor for dementia.[2] The prevalence of Alzheimer's disease increases at a predictable rate, about 5% per year after age 65 years. Half of the participants in the Berlin Aging Study were demented at age 95 years.[3] The care of persons with dementia deserves attention, careful consideration, and planning, as they present special needs while hospitalized affecting outcomes, cost, and discharge planning.
It is uncommon for those over age 70 years to be free of chronic conditions that frequently require treatment in hospitals. A study of community‐dwelling patients with mild Alzheimer's disease followed for 3 years found that two‐thirds of the participants required at least 1 hospitalization.[4] Significant risk factors for hospitalization included age and burden of co‐morbidity. Declines in global cognition, episodic memory, and executive function have been found in elderly patients after hospitalization controlling for severity of illness and preadmission cognitive status.[5] Furthermore, according to a review of Medicare data published by the Alzheimer's Association, hospital costs for treating any medical condition with coexisting dementia were over 3 times those of nondemented patients with the same condition.[6] The same study reported nursing home costs and home health provision to be 10.2 and 3.8 times the costs for nondemented recipients, respectively.
This study addresses 2 questions prompted by the observations above: What are the trends of dementia prevalence among patients admitted to hospitals for common acute medical conditions and which diagnoses impact substantially the likelihood of discharge to home? Awareness of the prevalence of dementia comorbidity with conditions that generate hospitalization can provide a stimulus for institutions to allocate appropriate resources to address the special needs of persons with cognitive impairment. Hospitalists and providers at all levels of care armed with this information can adapt their practices and interventions to influence outcomes and transitions in care.
METHODS
Basic Data and Design
We performed a retrospective cross‐sectional study[7] of hospitalized patients using the National Inpatient Sample (NIS) of the Healthcare Cost and Utilization Project (HCUP), which contains annual hospital discharge data from a stratified, random sample of hospitals across the United States.[8] Data fields include diagnostic fields, procedure codes, age, sex, race, total charges, length of stay (LOS), admission source, and disposition status. The database for each year accessed contains hospital discharges accounting for 36,417,575 (2000) to 39,008,298 (2010) discharges per year. These databases for the years 2000 through 2012 allowed for examination of recent temporal trends in dementia, and assessment of dementia's association with discharge status after adjusting for relevant covariates.
Case Selection and Classification, and Data Elements
We defined dementia on the basis of International Classification of Diseases, Ninth Revision, Clinical Modification (ICD‐9) codes for dementia described by Quan et al.[9] (331.2, 290.* and 294.1) or Alzheimer's disease (ICD‐9 331.0). These ICD‐9 codes being present in any diagnosis field classified the hospitalization as having dementia as a comorbidity. All databases used in this study had Diagnosis Related Groups (DRGs) coding for version 18 and the similar DRG version 24. Both DRG versions were used to tabulate the frequency of dementia coding by DRG. Twelve medical DRGs that were among the 20 highest number of dementia coding diagnoses for each year were identified. Orthopedic DRGs, degenerative nervous system disorders, organic disturbances and mental retardation, psychoses, and rehabilitation DRGs were excluded from the study to focus on medical disorders without dementia as a component of the principal diagnosis. The DRGs for sepsis were also excluded, because significant change in the coding relating to mechanical ventilation duration were made on later DRG versions during the study period, making comparisons between different study years difficult. The DRGs chosen as inclusion criteria were 79 (respiratory infections and inflammations [noncommunity‐acquired pneumonia], 320 (kidney and urinary tract infections [UTI] age >17 years with complications or comorbidities [CC]), 141 (syncope and collapse with complications, comorbidities [syncope]), 14 (intracranial hemorrhage and stroke with infarction [stroke]), 89 (simple pneumonia and pleurisy age >17 years with CC [community‐acquired pneumonia)], 127 (heart failure and shock [CHF]), 88 (chronic obstructive pulmonary disease [COPD]), 138 cardiac arrhythmias and conduction disorders [arrhythmia]), 316 (kidney failure [AKI]), 182 (esophagitis/gastroenteritis age >17 years with CC [enteritis]), 174 (gastrointestinal hemorrhage with CC [GI bleed]), and 296 (nutritional and miscellaneous metabolic disorders [dehydration]). Only hospitalizations of patients aged 65 years were included, as geriatric patients were of primary interest.
The Charlson comorbidities as updated by Quan et al. (12 comordities)[10] were queried using published enhanced ICD‐9 algorithms.[9] Also tabulated were Alzheimer's disease (ICD‐9 331.0) and falls (E880E888).[11, 4] The primary reimbursement status coded as Medicaid or self‐pay was considered a field of interest, as it reflects socioeconomic status.[12] Medicare as the sole reimbursement source was also considered a field of interest, as this influences the hospital LOS requirement prior to reimbursable skilled nursing facilities (SNF) transfer.[13] Discharges were grouped into expired, discharge to home, transfers to SNF, and discharge to another acute‐care facility. Admission source from an SNF was identified.
Data Handling, Statistical Analysis, and Graphical Representation
The number of hospitalizations with dementia coding for each DRG was tabulated for each year. Negative binomial regression was performed using SAS for version 9.1 (SAS Institute, Cary, NC) for Windows (Microsoft Corp., Redmond, WA) to analyze time (year) effect for dementia in each DRG using the GENMOD procedure, taking into account the total number of hospitalizations for that DRG as the offset variable[14] as previously described.[15]
Most summary data generation and all logistic regression analyses were performed using SPSS for Windows version 13 (SPSS Inc., Chicago, IL). Multinomial logistic regression was performed to determine the degree to which dementia influenced the odds of being discharged home using SNF discharges as the reference group, with adjustment for other variables. The predictor variables included the updated Charlson comorbidities[10] and gender. As all patients chosen were age 65 years or older, this Charlson predictor variable was not part of the primary model. Expanded models added predictor variables: admission source from SNF, decade of age, calendar year, Medicaid or self‐pay status (socioeconomic status), Medicare alone status, and coding for a fall (E880E888). Model fit was examined.[16] Regression analyses were performed without race, an identifier missing in a significant number of discharges (14%28% per year).
RESULTS
General DRG Characteristics
The 12 DRG hospitalization dementia proportions are shown in Tables 1 and 2. The DRG hospitalizations studied constituted 29.8% of all hospitalizations in patients aged 65 years. The greatest number of hospitalizations was for DRG127 (CHF) and the least for DRG141 (syncope). The highest cumulative proportions of dementia codings (>13%) were associated with DRG79 (respiratory infections and inflammations [noncommunity‐acquired pneumonia)] and DRG320 (urinary tract infections age >17 years with CC [UTI]) (Table 2). The cumulative proportions (for all years) of dementia codings encompassing all years were between 5% and 11% in DRG141 (syncope), DRG89 (community‐acquired pneumonia), DRG316 (AKI), DRG174 (GI bleed), DRG296 (dehydration), and DRG14 (stroke). DRGs 88 (COPD), 182 (enteritis), 138 (arrhythmia), and 127 (CHF) had cumulative proportions >3% but <5%.
| DRG | Descriptor | Total No. | Median LOS | Discharge Dispositions (Dementia/Nondementia) | |||||
|---|---|---|---|---|---|---|---|---|---|
| Dementia | No Dementia | Dementia | No Dementia | Home (%) | Transfer (%) | SNF (%) | Death (%) | ||
| |||||||||
| 79 | Noncommunity‐acquired pneumonia | 415,127 | 1,958,315 | 6 | 6 | 21.4/37.8 | 1.4/2.0 | 63.5/47.7 | 13.8/12.4 |
| 14 | Stroke | 379,725 | 4,089,142 | 5 | 4 | 26.1/39.6 | 1.8/3.2 | 63.0/46.8 | 9.1/10.5 |
| 320 | Urinary tract infection | 540,994 | 2,889,678 | 4 | 4 | 35.2/56.7 | 1.0/1.2 | 61.8/40.2 | 2.0/1.9 |
| 141 | Syncope | 173,325 | 1,705,651 | 3 | 3 | 58.8/77.6 | 1.1/1.9 | 39.7/20.1 | 0.4/0.4 |
| 296 | Dehydration | 341,681 | 2,894,380 | 4 | 3 | 35.1/63.5 | 1.0/1.5 | 59.8/31.4 | 4.1/3.6 |
| 316 | Acute kidney injury | 243,264 | 2,812,584 | 5 | 5 | 31.2/58.9 | 1.5/2.5 | 59.7/31.6 | 7.6/6.9 |
| 89 | Community‐acquired pneumonia | 591,555 | 6,530,468 | 5 | 4 | 32.7/66.0 | 1.3/1.8 | 58.2/27.5 | 7.8/4.7 |
| 182 | Enteritis | 167,677 | 3,430,585 | 4 | 3 | 51.7/81.5 | 1.1/1.4 | 45.4/15.9 | 1.7/1.2 |
| 88 | Chronic obstructive pulmonary disease | 183,486 | 5,654,875 | 4 | 4 | 49.8/80.6 | 1.1/1.3 | 46.9/16.4 | 2.3/1.7 |
| 127 | Congestive heart failure | 389,838 | 9,012,723 | 4 | 4 | 42.9/70.9 | 1.3/2.9 | 49.7/22.1 | 6.0/4.1 |
| 174 | Gastrointestinal bleeding | 233,665 | 3,482,551 | 4 | 4 | 38.6/74.5 | 1.4/2.2 | 55.7/20.4 | 4.3/2.9 |
| 138 | Arrhythmia | 162,629 | 3,279,538 | 4 | 3 | 46.6/78.0 | 2.9/4.9 | 47.2/14.7 | 3.3/2.4 |
| DRG | Descriptor | Yearly Admissions for Each DRG (Range) | Year Effect for Dementia |
|---|---|---|---|
| |||
| 79 | Noncommunity‐acquired pneumonia | 158,155(2012)198,048(2008) | Negative effect* |
| 320 | Urinary tract infection | 205,540(2000)325,294(2011) | NS |
| 296 | Dehydration | 194,920(2012)298,446(2002) | Negative effect |
| 141 | Syncope | 113,476(2000)164,017(2009) | NS |
| 14 | Stroke | 312,783(2007)391,845(2000) | NS |
| 89 | Community‐acquired pneumonia | 462,245(2014)640,114(2005) | Negative effect* |
| 316 | Acute kidney injury | 111,127(2000)351,942(2011) | Positive effect* |
| 174 | Gastrointestinal bleeding | 269,621(2010)302,099(2004) | Negative effect |
| 182 | Enteritis | 251,949(2000)308,570(2005) | Positive effect |
| 138 | Arrhythmia | 235,060(2000)309,481(2011) | NS |
| 127 | Congestive heart failure | 608,355(2012)789,423(2001) | Positive effect |
| 88 | Chronic obstructive pulmonary disease | 395,055(2004)505,824(2011) | Positive effect |
Patients hospitalized with dementia were older, had a higher proportion of females (range, 50.8%73.9% dementia; range, 46.9%69.8% nondementia), and had more falls (range, 1.5%14.6% dementia; range, 0.9%14.5% nondementia). The median LOS was 1 day greater for hospitalizations with dementia coding for DRGs 14 (stroke), 89 (community‐acquired pneumonia), 138 (arrhythmia), 182 (enteritis), and 296 (dehydration) (Table 1).
Temporal Characteristics
Using negative binomial regression, a significant positive time effect for dementia (ie, a greater proportion of dementia hospitalizations was noted with more recent years) was observed in DRGs 316 (AKI), 127 (CHF), 182 (enteritis), and 88 (COPD) (Table 2). Negative time effects (ie, a lower proportion of dementia hospitalizations was noted with more recent years) were noted for DRGs 79 (noncommunity‐acquired pneumonia), 89 (community‐acquired pneumonia), 174 (GI bleed), and296 (dehydration) (Table 2).
Multivariate Effects of Dementia on Discharge Disposition
Nominal regression, using the Charlson comorbidities/variables only, showed that the presence of dementia was associated with an adjusted odds ratio of <0.5 (0.180.46) for being discharged home for all DRGs (Table 3). For DRGs 174 (GI bleed), 88 (COPD), 182 (enteritis), 138 (arrhythmia), 127 (CHF), and 89 [community‐acquired pneumonia], the adjusted odds ratio was 0.18 to 0.24 (a 76% reduction in the adjusted likelihood for being discharged home). In contrast, DRGs 14 (stroke), 79 (noncommunity‐acquired pneumonia), and 320 (UTI) had adjusted odds ratios of 0.41 to 0.46 (a <60% reduction in the adjusted likelihood for being discharged home). Including additional covariates other than the Charlson criteria resulted in higher odds ratios and better model fits, but had the same dichotomy of dementia effect odds ratios (Table 3). The proportion of hospitalizations with disposition correctly predicted by the Charlson comorbidities alone ranged from 59.4% to 82.6% (Table 3). All models predicted a greater proportion of cases than expected by chance alone, with models also including non‐Charlson covariates showing modestly better fits (Table 3). Dementia had the lowest odds ratio associated with home discharge among all the Charlson comorbidities for all DRGs studied. Collinearity of predictor (independent) variables was demonstrated only in DRG 88 (COPD) and in DRG 127 (CHF) with the respective COPD and CHF Charlson variables. Removing these variables from the respective predictor models in those DRGs did not change the odds ratio associated with dementia (data not shown). Performing nominal regression excluding patients transferred to acute facilities slightly improved model fit but did not significantly change the odds ratios (data not shown).
| DRG | Dementia With Charlson Variables Only | Dementia Enhanced Model | |||||
|---|---|---|---|---|---|---|---|
| % Predicted | OR | 95% CI | % Predicted | OR | 95% CI | ||
| |||||||
| Noncommunity‐acquired pneumonia | 79 | 61.2 | 0.46 | 0.460.47 | 64.9 | 0.51 | 0.510.52 |
| Stroke | 14 | 61.9 | 0.46 | 0.460.47 | 65.5 | 0.55 | 0.540.55 |
| Urinary tract infection | 320 | 59.4 | 0.41 | 0.400.41 | 63.3 | 0.45 | 0.450.46 |
| Syncope | 141 | 79.4 | 0.34 | 0.340.34 | 80.2 | 0.39 | 0.380.39 |
| Dehydration | 296 | 66.5 | 0.31 | 0.310.31 | 68.5 | 0.36 | 0.360.37 |
| Acute kidney injury | 316 | 65.2 | 0.28 | 0.280.29 | 68.4 | 0.35 | 0.350.36 |
| Community‐acquired pneumonia | 89 | 70.1 | 0.24 | 0.240.24 | 72.1 | 0.30 | 0.300.30 |
| Enteritis | 182 | 82.3 | 0.22 | 0.210.22 | 83.2 | 0.28 | 0.270.28 |
| Chronic obstructive pulmonary disease | 88 | 82.2 | 0.21 | 0.210.22 | 82.9 | 0.29 | 0.280.29 |
| Congestive heart failure | 127 | 75.3 | 0.27 | 0.270.27 | 76.8 | 0.33 | 0.320.33 |
| Gastrointestinal bleeding | 174 | 77.2 | 0.18 | 0.180.19 | 78.8 | 0.23 | 0.230.23 |
| Arrhythmia | 138 | 82.6 | 0.18 | 0.180.18 | 83.6 | 0.24 | 0.230.24 |
DISCUSSION
We found that dementia diagnosis has a significant negative impact on the likelihood of discharge to home for all the common acute medical conditions prompting hospitalization. The magnitude of this association varied significantly among DRGs. We found that dementia comorbidity strongly predicts nonhome discharge locations for a number of chronic conditions such as CHF and COPD. These findings could help inpatient and outpatient providers better anticipate postacute‐care needs. In addition, the increases in dementia‐associated admissions for CHF and COPD highlight a need to understand how the growing dementia population may impact hospitals' public reporting (and penalties) of hospital readmissions or ambulatory care‐sensitive hospitalization.
The prevalence of dementia over time changed for particular DRGs. We found hospitalizations for CHF and COPD DRGs to have an increase in dementia proportions over time. CHF and COPD are conditions with a prevalence of dementia comorbidity among Medicare recipients of 16% to 17%.[17] These 2 diagnoses, as well as dementia, have been shown to have statistical predictor effects for acute ambulatory‐care sensitive hospitalizations.[18] Ambulatory care‐sensitive conditions[19] and nursing homesensitive avoidable conditions are proposed indicators/classifiers of hospitalizations that could have been avoided by care in their respective nonhospital settings.[20, 21] The increasing dementia proportion over time in both CHF and COPD DRGs suggests that dementia may increasingly contribute to avoidable hospitalizations. The decrease in dementia proportion over time was in conditions that could be characterized as acute conditions (community‐acquired pneumonia, noncommunity‐acquired pneumonia, dehydration, and GI bleed), whereas the conditions with increasing dementia over time included at least 2 chronic conditions, namely CHF and COPD. It is not known why AKI and enteritis should also be associated with increasing dementia over time. These patterns may reflect differences in management. For example, certain acute conditions in dementia patients may have been increasingly treated in the nonhospital setting, avoiding hospitalization.
Medically unnecessary hospitalizations have been the focus of initiatives by the Centers for Medicare & Medicaid Services, and include the readmission reduction program[22] and the recovery audit program's prepayment review demonstration.[23, 24] Several of the DRGs with stronger dementia effects on discharge disposition have been targets of these programs, including CHF, community‐acquired pneumonia, and COPD in the former, and GI bleed, enteritis, and syncope in the latter. The findings of the current study demonstrate that the presence of dementia strongly influences discharge disposition more in certain diagnostic categories. Although disease severity, care access, preventative measures, or provider behavior may have affected the outcomes, the findings raise the distinct possibility that dementia care could have driven admission patterns differentially. Increased awareness of the influence of dementia on hospitalizations and hospitalization discharges is important not only for clinicians but also for the payors, who may penalize (through denial of hospitalization reimbursement) acute‐care facilities motivated to provide support to dementia patients who are unable to receive adequate care in the community. Furthermore, related to this issue is the Medicare policy that disallows reimbursement for SNF transfer admissions unless preceded by a 3‐day acute‐care hospitalization.[25] Hospitals often face a dilemma of whether to admit patients and keep them hospitalized for the requisite period of time to allow for SNF care to be provided, or to deny this option to patients by discharging them sooner (or not admitting them at all).
Demented persons are frequent visitors to emergency departments, and often the impairment in fundamental activities of daily living is immediately apparent to the nurses and physicians caring for them. How does hospital staff come to grips with the potential conflict between duty to the patient and financial solvency of the institution? When dementia is the chief concern but not an acceptable indication for admission (eg, clinical indication for inpatient care[26]), a search for a reimbursable DRG may ensue, and this could contribute to the variability of dementia comorbidity's impact on hospital discharge disposition noted in this study.
This study has strengths in that the data are sampled in a manner that allows national estimates to be made. Although administrative data, such as the NIS, have limitations in coding accuracy/variability, important quality factors influencing relevant outcomes in the United States have been quantified using the NIS.[27] Because the data were deidentified and sampled rather than being complete, readmissions could not be assessed. Readmission is an important measure of the effectiveness of comprehensive geriatric care models[28] and patient‐centered care. It is possible that more readmissions for the same patient in the same year could have accounted for some of the trend findings. Furthermore, readmissions for the same patient in a given year could have impacted on the time‐related dementia prevalence calculations used. Changes in coding practices also could have impacted the dementia prevalence trends noted.
This study utilized comorbidities that have been typically used to characterize inpatient mortality.[10] The focus of this study, however, was not on mortality but on home discharge. The use of multinomial logistic regression instead of binomial logistic regression was based on the intention to examine home discharge using skilled nursing facility discharge as a reference but also incorporatingand accounting forother significant dispositions in the model such as death and other institutional transfers. Quan et al.[10] used the C statistic to describe and compare a mortality prediction model fit with the Charlson versus other comorbidity indices in national datasets. This statistic, however, is not used in multinomial logistic regression. Thus, it is difficult to compare the present modeling with the published models based on mortality (as a dichotomous outcome). The logistic regression models generally showed highly significant predictor effects for all predictor variables utilized (including dementia), but with a variable degree of correct prediction of disposition.
We originally hypothesized that hospitalized patients with dementia would require care in settings other than home at discharge, based on various key clinical and demographic factors, and that dementia comorbidity would display similar adjusted predictor effects for various common DRGs. Our findings of greater dementia‐associated odds ratios for particular DRGs suggest a more complex and variable dementia role in certain types of hospitalization, and that there are potential limitations in using Agency for Healthcare Research and Quality prevention quality indicators,[7, 26] developed for the purpose of tracking hospitalization data to assess quality and access to community‐based medical care.
Acknowledgements
The authors acknowledge the assistance of Suh Lee, BA, during the summer of 2012. This work was supported in part by an intramural grant from New York Medical College.
Disclosure: Nothing to report.
- Federal Interagency Forum on Aging‐Related Statistics. Older Americans 2012: key indicators of well‐being (older Americans 2012). Washington, DC: US Government Printing Office; 2012.
- Alzheimer's Organization. Risk factors. Available at: http://www.alz.org/alzheimers_disease_causes_risk_factors.asp Accessed February 15, 2015.
- Baltes PB, Mayer KV, eds. The Berlin Aging Study: aging from 70 to 100. Cambridge, United Kingdom: Cambridge University Press; 1999.
- , , , et al. Hospitalization in community‐dwelling persons with Alzheimer's disease: frequency and causes. Am Geriatr Soc. 2010;58:1542–1548.
- , , , , , . Cognitive decline after hospitalization in a community population of older persons. Neurology. 2012;78:950–956.
- Alzheimer's Association. Alzheimer's disease and chronic health conditions: the real challenge for 21st century Medicare. Alzheimer's Association website. Available at: https://www.alz.org/national/documents/report_chroniccare.pdf. Published 2003. Accessed February 15, 2015.
- , . An overview of clinical research: the lay of the land. Lancet. 2002;359:57–61.
- Agency for Healthcare Research and Quality. Healthcare Cost and Utilization Project. HCUP databases. Available at: www.hcup-us.ahrq.gov/nisoverview.jsp. Modified December 11, 2013, Accessed May 31, 2015.
- , , , et al. Coding algorithms for defining comorbidities in ICD‐9‐CM and ICD‐10 administrative data. Med Care. 2005;43:1130–1139.
- , , , et al. Updating and validating the Charlson comorbidity index and score for risk adjustment in hospital discharge abstracts using data from 6 countries. Am J Epidemiol. 2011;173:676–682.
- , . Falls, injuries due to falls, and the risk of admission to a nursing home. N Engl J Med. 1997;337:1279–1284.
- , , , . Insurance status and the transfer of hospitalized patients: an observational study. Ann Intern Med. 2014;160:81–90.
- Centers for Medicare 118:392–404.
- , , . Drug‐induced, dementia‐associated and non‐dementia, non‐drug delirium hospitalizations in the United States, 1998‐2005: an analysis of the national inpatient sample. Drugs Aging. 2010;27:51–61.
- , , , . Multiple discriminate analysis and logistic regression. In: Multivariate Data Analysis. 7th ed. Upper Saddle River, NJ: Prentice Hall; 2009.
- . A growing inpatient imperative: Alzheimer's disease. Hosp Health Netw. 2009;83:26, 28, 30.
- , , , , . The central role of comorbidity in predicting ambulatory care sensitive hospitalizations. Eur J Public Health. 2014;24(1):66–72.
- Agency for Healthcare Research and Quality. Prevention quality indicators technical specifications. Version 4.4. March 2012. Available at: http://www.qualityindicators.ahrq.gov/Archive/PQI_TechSpec_V44.aspx. Accessed September 1, 2012.
- , , , . Hospital transfers of nursing home residents with advanced dementia. J Am Geriatr Soc. 2012;60:905–909.
- , , , , . Potentially Avoidable Hospitalizations for Elderly Long‐stay Residents in Nursing Homes. Med Care. 2013;51(8):673–681.
- Centers for Medicare 15:592–601.
- , . Measurement of potentially preventable hospitalizations. white paper prepared for the long term quality alliance. Available at: http://www.ltqa.org/wp-content/themes/ltqaMain/custom/images//PreventableHospitalizations_021512_2.pdf. Published February 2012. Accessed August 6, 2013.
The aging of the US population has profound effects on all aspects of healthcare. By 2050, 80 million Americans will be over age 65 years, and the proportion of the population over 85 years is expanding at 6 times the rate of the general population.[1] This major shift in demographics poses significant challenges to hospitalists and others who provide acute care. The prevalence of dementia mirrors the trend of increasing life expectancy. Age is the most significant risk factor for dementia.[2] The prevalence of Alzheimer's disease increases at a predictable rate, about 5% per year after age 65 years. Half of the participants in the Berlin Aging Study were demented at age 95 years.[3] The care of persons with dementia deserves attention, careful consideration, and planning, as they present special needs while hospitalized affecting outcomes, cost, and discharge planning.
It is uncommon for those over age 70 years to be free of chronic conditions that frequently require treatment in hospitals. A study of community‐dwelling patients with mild Alzheimer's disease followed for 3 years found that two‐thirds of the participants required at least 1 hospitalization.[4] Significant risk factors for hospitalization included age and burden of co‐morbidity. Declines in global cognition, episodic memory, and executive function have been found in elderly patients after hospitalization controlling for severity of illness and preadmission cognitive status.[5] Furthermore, according to a review of Medicare data published by the Alzheimer's Association, hospital costs for treating any medical condition with coexisting dementia were over 3 times those of nondemented patients with the same condition.[6] The same study reported nursing home costs and home health provision to be 10.2 and 3.8 times the costs for nondemented recipients, respectively.
This study addresses 2 questions prompted by the observations above: What are the trends of dementia prevalence among patients admitted to hospitals for common acute medical conditions and which diagnoses impact substantially the likelihood of discharge to home? Awareness of the prevalence of dementia comorbidity with conditions that generate hospitalization can provide a stimulus for institutions to allocate appropriate resources to address the special needs of persons with cognitive impairment. Hospitalists and providers at all levels of care armed with this information can adapt their practices and interventions to influence outcomes and transitions in care.
METHODS
Basic Data and Design
We performed a retrospective cross‐sectional study[7] of hospitalized patients using the National Inpatient Sample (NIS) of the Healthcare Cost and Utilization Project (HCUP), which contains annual hospital discharge data from a stratified, random sample of hospitals across the United States.[8] Data fields include diagnostic fields, procedure codes, age, sex, race, total charges, length of stay (LOS), admission source, and disposition status. The database for each year accessed contains hospital discharges accounting for 36,417,575 (2000) to 39,008,298 (2010) discharges per year. These databases for the years 2000 through 2012 allowed for examination of recent temporal trends in dementia, and assessment of dementia's association with discharge status after adjusting for relevant covariates.
Case Selection and Classification, and Data Elements
We defined dementia on the basis of International Classification of Diseases, Ninth Revision, Clinical Modification (ICD‐9) codes for dementia described by Quan et al.[9] (331.2, 290.* and 294.1) or Alzheimer's disease (ICD‐9 331.0). These ICD‐9 codes being present in any diagnosis field classified the hospitalization as having dementia as a comorbidity. All databases used in this study had Diagnosis Related Groups (DRGs) coding for version 18 and the similar DRG version 24. Both DRG versions were used to tabulate the frequency of dementia coding by DRG. Twelve medical DRGs that were among the 20 highest number of dementia coding diagnoses for each year were identified. Orthopedic DRGs, degenerative nervous system disorders, organic disturbances and mental retardation, psychoses, and rehabilitation DRGs were excluded from the study to focus on medical disorders without dementia as a component of the principal diagnosis. The DRGs for sepsis were also excluded, because significant change in the coding relating to mechanical ventilation duration were made on later DRG versions during the study period, making comparisons between different study years difficult. The DRGs chosen as inclusion criteria were 79 (respiratory infections and inflammations [noncommunity‐acquired pneumonia], 320 (kidney and urinary tract infections [UTI] age >17 years with complications or comorbidities [CC]), 141 (syncope and collapse with complications, comorbidities [syncope]), 14 (intracranial hemorrhage and stroke with infarction [stroke]), 89 (simple pneumonia and pleurisy age >17 years with CC [community‐acquired pneumonia)], 127 (heart failure and shock [CHF]), 88 (chronic obstructive pulmonary disease [COPD]), 138 cardiac arrhythmias and conduction disorders [arrhythmia]), 316 (kidney failure [AKI]), 182 (esophagitis/gastroenteritis age >17 years with CC [enteritis]), 174 (gastrointestinal hemorrhage with CC [GI bleed]), and 296 (nutritional and miscellaneous metabolic disorders [dehydration]). Only hospitalizations of patients aged 65 years were included, as geriatric patients were of primary interest.
The Charlson comorbidities as updated by Quan et al. (12 comordities)[10] were queried using published enhanced ICD‐9 algorithms.[9] Also tabulated were Alzheimer's disease (ICD‐9 331.0) and falls (E880E888).[11, 4] The primary reimbursement status coded as Medicaid or self‐pay was considered a field of interest, as it reflects socioeconomic status.[12] Medicare as the sole reimbursement source was also considered a field of interest, as this influences the hospital LOS requirement prior to reimbursable skilled nursing facilities (SNF) transfer.[13] Discharges were grouped into expired, discharge to home, transfers to SNF, and discharge to another acute‐care facility. Admission source from an SNF was identified.
Data Handling, Statistical Analysis, and Graphical Representation
The number of hospitalizations with dementia coding for each DRG was tabulated for each year. Negative binomial regression was performed using SAS for version 9.1 (SAS Institute, Cary, NC) for Windows (Microsoft Corp., Redmond, WA) to analyze time (year) effect for dementia in each DRG using the GENMOD procedure, taking into account the total number of hospitalizations for that DRG as the offset variable[14] as previously described.[15]
Most summary data generation and all logistic regression analyses were performed using SPSS for Windows version 13 (SPSS Inc., Chicago, IL). Multinomial logistic regression was performed to determine the degree to which dementia influenced the odds of being discharged home using SNF discharges as the reference group, with adjustment for other variables. The predictor variables included the updated Charlson comorbidities[10] and gender. As all patients chosen were age 65 years or older, this Charlson predictor variable was not part of the primary model. Expanded models added predictor variables: admission source from SNF, decade of age, calendar year, Medicaid or self‐pay status (socioeconomic status), Medicare alone status, and coding for a fall (E880E888). Model fit was examined.[16] Regression analyses were performed without race, an identifier missing in a significant number of discharges (14%28% per year).
RESULTS
General DRG Characteristics
The 12 DRG hospitalization dementia proportions are shown in Tables 1 and 2. The DRG hospitalizations studied constituted 29.8% of all hospitalizations in patients aged 65 years. The greatest number of hospitalizations was for DRG127 (CHF) and the least for DRG141 (syncope). The highest cumulative proportions of dementia codings (>13%) were associated with DRG79 (respiratory infections and inflammations [noncommunity‐acquired pneumonia)] and DRG320 (urinary tract infections age >17 years with CC [UTI]) (Table 2). The cumulative proportions (for all years) of dementia codings encompassing all years were between 5% and 11% in DRG141 (syncope), DRG89 (community‐acquired pneumonia), DRG316 (AKI), DRG174 (GI bleed), DRG296 (dehydration), and DRG14 (stroke). DRGs 88 (COPD), 182 (enteritis), 138 (arrhythmia), and 127 (CHF) had cumulative proportions >3% but <5%.
| DRG | Descriptor | Total No. | Median LOS | Discharge Dispositions (Dementia/Nondementia) | |||||
|---|---|---|---|---|---|---|---|---|---|
| Dementia | No Dementia | Dementia | No Dementia | Home (%) | Transfer (%) | SNF (%) | Death (%) | ||
| |||||||||
| 79 | Noncommunity‐acquired pneumonia | 415,127 | 1,958,315 | 6 | 6 | 21.4/37.8 | 1.4/2.0 | 63.5/47.7 | 13.8/12.4 |
| 14 | Stroke | 379,725 | 4,089,142 | 5 | 4 | 26.1/39.6 | 1.8/3.2 | 63.0/46.8 | 9.1/10.5 |
| 320 | Urinary tract infection | 540,994 | 2,889,678 | 4 | 4 | 35.2/56.7 | 1.0/1.2 | 61.8/40.2 | 2.0/1.9 |
| 141 | Syncope | 173,325 | 1,705,651 | 3 | 3 | 58.8/77.6 | 1.1/1.9 | 39.7/20.1 | 0.4/0.4 |
| 296 | Dehydration | 341,681 | 2,894,380 | 4 | 3 | 35.1/63.5 | 1.0/1.5 | 59.8/31.4 | 4.1/3.6 |
| 316 | Acute kidney injury | 243,264 | 2,812,584 | 5 | 5 | 31.2/58.9 | 1.5/2.5 | 59.7/31.6 | 7.6/6.9 |
| 89 | Community‐acquired pneumonia | 591,555 | 6,530,468 | 5 | 4 | 32.7/66.0 | 1.3/1.8 | 58.2/27.5 | 7.8/4.7 |
| 182 | Enteritis | 167,677 | 3,430,585 | 4 | 3 | 51.7/81.5 | 1.1/1.4 | 45.4/15.9 | 1.7/1.2 |
| 88 | Chronic obstructive pulmonary disease | 183,486 | 5,654,875 | 4 | 4 | 49.8/80.6 | 1.1/1.3 | 46.9/16.4 | 2.3/1.7 |
| 127 | Congestive heart failure | 389,838 | 9,012,723 | 4 | 4 | 42.9/70.9 | 1.3/2.9 | 49.7/22.1 | 6.0/4.1 |
| 174 | Gastrointestinal bleeding | 233,665 | 3,482,551 | 4 | 4 | 38.6/74.5 | 1.4/2.2 | 55.7/20.4 | 4.3/2.9 |
| 138 | Arrhythmia | 162,629 | 3,279,538 | 4 | 3 | 46.6/78.0 | 2.9/4.9 | 47.2/14.7 | 3.3/2.4 |
| DRG | Descriptor | Yearly Admissions for Each DRG (Range) | Year Effect for Dementia |
|---|---|---|---|
| |||
| 79 | Noncommunity‐acquired pneumonia | 158,155(2012)198,048(2008) | Negative effect* |
| 320 | Urinary tract infection | 205,540(2000)325,294(2011) | NS |
| 296 | Dehydration | 194,920(2012)298,446(2002) | Negative effect |
| 141 | Syncope | 113,476(2000)164,017(2009) | NS |
| 14 | Stroke | 312,783(2007)391,845(2000) | NS |
| 89 | Community‐acquired pneumonia | 462,245(2014)640,114(2005) | Negative effect* |
| 316 | Acute kidney injury | 111,127(2000)351,942(2011) | Positive effect* |
| 174 | Gastrointestinal bleeding | 269,621(2010)302,099(2004) | Negative effect |
| 182 | Enteritis | 251,949(2000)308,570(2005) | Positive effect |
| 138 | Arrhythmia | 235,060(2000)309,481(2011) | NS |
| 127 | Congestive heart failure | 608,355(2012)789,423(2001) | Positive effect |
| 88 | Chronic obstructive pulmonary disease | 395,055(2004)505,824(2011) | Positive effect |
Patients hospitalized with dementia were older, had a higher proportion of females (range, 50.8%73.9% dementia; range, 46.9%69.8% nondementia), and had more falls (range, 1.5%14.6% dementia; range, 0.9%14.5% nondementia). The median LOS was 1 day greater for hospitalizations with dementia coding for DRGs 14 (stroke), 89 (community‐acquired pneumonia), 138 (arrhythmia), 182 (enteritis), and 296 (dehydration) (Table 1).
Temporal Characteristics
Using negative binomial regression, a significant positive time effect for dementia (ie, a greater proportion of dementia hospitalizations was noted with more recent years) was observed in DRGs 316 (AKI), 127 (CHF), 182 (enteritis), and 88 (COPD) (Table 2). Negative time effects (ie, a lower proportion of dementia hospitalizations was noted with more recent years) were noted for DRGs 79 (noncommunity‐acquired pneumonia), 89 (community‐acquired pneumonia), 174 (GI bleed), and296 (dehydration) (Table 2).
Multivariate Effects of Dementia on Discharge Disposition
Nominal regression, using the Charlson comorbidities/variables only, showed that the presence of dementia was associated with an adjusted odds ratio of <0.5 (0.180.46) for being discharged home for all DRGs (Table 3). For DRGs 174 (GI bleed), 88 (COPD), 182 (enteritis), 138 (arrhythmia), 127 (CHF), and 89 [community‐acquired pneumonia], the adjusted odds ratio was 0.18 to 0.24 (a 76% reduction in the adjusted likelihood for being discharged home). In contrast, DRGs 14 (stroke), 79 (noncommunity‐acquired pneumonia), and 320 (UTI) had adjusted odds ratios of 0.41 to 0.46 (a <60% reduction in the adjusted likelihood for being discharged home). Including additional covariates other than the Charlson criteria resulted in higher odds ratios and better model fits, but had the same dichotomy of dementia effect odds ratios (Table 3). The proportion of hospitalizations with disposition correctly predicted by the Charlson comorbidities alone ranged from 59.4% to 82.6% (Table 3). All models predicted a greater proportion of cases than expected by chance alone, with models also including non‐Charlson covariates showing modestly better fits (Table 3). Dementia had the lowest odds ratio associated with home discharge among all the Charlson comorbidities for all DRGs studied. Collinearity of predictor (independent) variables was demonstrated only in DRG 88 (COPD) and in DRG 127 (CHF) with the respective COPD and CHF Charlson variables. Removing these variables from the respective predictor models in those DRGs did not change the odds ratio associated with dementia (data not shown). Performing nominal regression excluding patients transferred to acute facilities slightly improved model fit but did not significantly change the odds ratios (data not shown).
| DRG | Dementia With Charlson Variables Only | Dementia Enhanced Model | |||||
|---|---|---|---|---|---|---|---|
| % Predicted | OR | 95% CI | % Predicted | OR | 95% CI | ||
| |||||||
| Noncommunity‐acquired pneumonia | 79 | 61.2 | 0.46 | 0.460.47 | 64.9 | 0.51 | 0.510.52 |
| Stroke | 14 | 61.9 | 0.46 | 0.460.47 | 65.5 | 0.55 | 0.540.55 |
| Urinary tract infection | 320 | 59.4 | 0.41 | 0.400.41 | 63.3 | 0.45 | 0.450.46 |
| Syncope | 141 | 79.4 | 0.34 | 0.340.34 | 80.2 | 0.39 | 0.380.39 |
| Dehydration | 296 | 66.5 | 0.31 | 0.310.31 | 68.5 | 0.36 | 0.360.37 |
| Acute kidney injury | 316 | 65.2 | 0.28 | 0.280.29 | 68.4 | 0.35 | 0.350.36 |
| Community‐acquired pneumonia | 89 | 70.1 | 0.24 | 0.240.24 | 72.1 | 0.30 | 0.300.30 |
| Enteritis | 182 | 82.3 | 0.22 | 0.210.22 | 83.2 | 0.28 | 0.270.28 |
| Chronic obstructive pulmonary disease | 88 | 82.2 | 0.21 | 0.210.22 | 82.9 | 0.29 | 0.280.29 |
| Congestive heart failure | 127 | 75.3 | 0.27 | 0.270.27 | 76.8 | 0.33 | 0.320.33 |
| Gastrointestinal bleeding | 174 | 77.2 | 0.18 | 0.180.19 | 78.8 | 0.23 | 0.230.23 |
| Arrhythmia | 138 | 82.6 | 0.18 | 0.180.18 | 83.6 | 0.24 | 0.230.24 |
DISCUSSION
We found that dementia diagnosis has a significant negative impact on the likelihood of discharge to home for all the common acute medical conditions prompting hospitalization. The magnitude of this association varied significantly among DRGs. We found that dementia comorbidity strongly predicts nonhome discharge locations for a number of chronic conditions such as CHF and COPD. These findings could help inpatient and outpatient providers better anticipate postacute‐care needs. In addition, the increases in dementia‐associated admissions for CHF and COPD highlight a need to understand how the growing dementia population may impact hospitals' public reporting (and penalties) of hospital readmissions or ambulatory care‐sensitive hospitalization.
The prevalence of dementia over time changed for particular DRGs. We found hospitalizations for CHF and COPD DRGs to have an increase in dementia proportions over time. CHF and COPD are conditions with a prevalence of dementia comorbidity among Medicare recipients of 16% to 17%.[17] These 2 diagnoses, as well as dementia, have been shown to have statistical predictor effects for acute ambulatory‐care sensitive hospitalizations.[18] Ambulatory care‐sensitive conditions[19] and nursing homesensitive avoidable conditions are proposed indicators/classifiers of hospitalizations that could have been avoided by care in their respective nonhospital settings.[20, 21] The increasing dementia proportion over time in both CHF and COPD DRGs suggests that dementia may increasingly contribute to avoidable hospitalizations. The decrease in dementia proportion over time was in conditions that could be characterized as acute conditions (community‐acquired pneumonia, noncommunity‐acquired pneumonia, dehydration, and GI bleed), whereas the conditions with increasing dementia over time included at least 2 chronic conditions, namely CHF and COPD. It is not known why AKI and enteritis should also be associated with increasing dementia over time. These patterns may reflect differences in management. For example, certain acute conditions in dementia patients may have been increasingly treated in the nonhospital setting, avoiding hospitalization.
Medically unnecessary hospitalizations have been the focus of initiatives by the Centers for Medicare & Medicaid Services, and include the readmission reduction program[22] and the recovery audit program's prepayment review demonstration.[23, 24] Several of the DRGs with stronger dementia effects on discharge disposition have been targets of these programs, including CHF, community‐acquired pneumonia, and COPD in the former, and GI bleed, enteritis, and syncope in the latter. The findings of the current study demonstrate that the presence of dementia strongly influences discharge disposition more in certain diagnostic categories. Although disease severity, care access, preventative measures, or provider behavior may have affected the outcomes, the findings raise the distinct possibility that dementia care could have driven admission patterns differentially. Increased awareness of the influence of dementia on hospitalizations and hospitalization discharges is important not only for clinicians but also for the payors, who may penalize (through denial of hospitalization reimbursement) acute‐care facilities motivated to provide support to dementia patients who are unable to receive adequate care in the community. Furthermore, related to this issue is the Medicare policy that disallows reimbursement for SNF transfer admissions unless preceded by a 3‐day acute‐care hospitalization.[25] Hospitals often face a dilemma of whether to admit patients and keep them hospitalized for the requisite period of time to allow for SNF care to be provided, or to deny this option to patients by discharging them sooner (or not admitting them at all).
Demented persons are frequent visitors to emergency departments, and often the impairment in fundamental activities of daily living is immediately apparent to the nurses and physicians caring for them. How does hospital staff come to grips with the potential conflict between duty to the patient and financial solvency of the institution? When dementia is the chief concern but not an acceptable indication for admission (eg, clinical indication for inpatient care[26]), a search for a reimbursable DRG may ensue, and this could contribute to the variability of dementia comorbidity's impact on hospital discharge disposition noted in this study.
This study has strengths in that the data are sampled in a manner that allows national estimates to be made. Although administrative data, such as the NIS, have limitations in coding accuracy/variability, important quality factors influencing relevant outcomes in the United States have been quantified using the NIS.[27] Because the data were deidentified and sampled rather than being complete, readmissions could not be assessed. Readmission is an important measure of the effectiveness of comprehensive geriatric care models[28] and patient‐centered care. It is possible that more readmissions for the same patient in the same year could have accounted for some of the trend findings. Furthermore, readmissions for the same patient in a given year could have impacted on the time‐related dementia prevalence calculations used. Changes in coding practices also could have impacted the dementia prevalence trends noted.
This study utilized comorbidities that have been typically used to characterize inpatient mortality.[10] The focus of this study, however, was not on mortality but on home discharge. The use of multinomial logistic regression instead of binomial logistic regression was based on the intention to examine home discharge using skilled nursing facility discharge as a reference but also incorporatingand accounting forother significant dispositions in the model such as death and other institutional transfers. Quan et al.[10] used the C statistic to describe and compare a mortality prediction model fit with the Charlson versus other comorbidity indices in national datasets. This statistic, however, is not used in multinomial logistic regression. Thus, it is difficult to compare the present modeling with the published models based on mortality (as a dichotomous outcome). The logistic regression models generally showed highly significant predictor effects for all predictor variables utilized (including dementia), but with a variable degree of correct prediction of disposition.
We originally hypothesized that hospitalized patients with dementia would require care in settings other than home at discharge, based on various key clinical and demographic factors, and that dementia comorbidity would display similar adjusted predictor effects for various common DRGs. Our findings of greater dementia‐associated odds ratios for particular DRGs suggest a more complex and variable dementia role in certain types of hospitalization, and that there are potential limitations in using Agency for Healthcare Research and Quality prevention quality indicators,[7, 26] developed for the purpose of tracking hospitalization data to assess quality and access to community‐based medical care.
Acknowledgements
The authors acknowledge the assistance of Suh Lee, BA, during the summer of 2012. This work was supported in part by an intramural grant from New York Medical College.
Disclosure: Nothing to report.
- Federal Interagency Forum on Aging‐Related Statistics. Older Americans 2012: key indicators of well‐being (older Americans 2012). Washington, DC: US Government Printing Office; 2012.
- Alzheimer's Organization. Risk factors. Available at: http://www.alz.org/alzheimers_disease_causes_risk_factors.asp Accessed February 15, 2015.
- Baltes PB, Mayer KV, eds. The Berlin Aging Study: aging from 70 to 100. Cambridge, United Kingdom: Cambridge University Press; 1999.
- , , , et al. Hospitalization in community‐dwelling persons with Alzheimer's disease: frequency and causes. Am Geriatr Soc. 2010;58:1542–1548.
- , , , , , . Cognitive decline after hospitalization in a community population of older persons. Neurology. 2012;78:950–956.
- Alzheimer's Association. Alzheimer's disease and chronic health conditions: the real challenge for 21st century Medicare. Alzheimer's Association website. Available at: https://www.alz.org/national/documents/report_chroniccare.pdf. Published 2003. Accessed February 15, 2015.
- , . An overview of clinical research: the lay of the land. Lancet. 2002;359:57–61.
- Agency for Healthcare Research and Quality. Healthcare Cost and Utilization Project. HCUP databases. Available at: www.hcup-us.ahrq.gov/nisoverview.jsp. Modified December 11, 2013, Accessed May 31, 2015.
- , , , et al. Coding algorithms for defining comorbidities in ICD‐9‐CM and ICD‐10 administrative data. Med Care. 2005;43:1130–1139.
- , , , et al. Updating and validating the Charlson comorbidity index and score for risk adjustment in hospital discharge abstracts using data from 6 countries. Am J Epidemiol. 2011;173:676–682.
- , . Falls, injuries due to falls, and the risk of admission to a nursing home. N Engl J Med. 1997;337:1279–1284.
- , , , . Insurance status and the transfer of hospitalized patients: an observational study. Ann Intern Med. 2014;160:81–90.
- Centers for Medicare 118:392–404.
- , , . Drug‐induced, dementia‐associated and non‐dementia, non‐drug delirium hospitalizations in the United States, 1998‐2005: an analysis of the national inpatient sample. Drugs Aging. 2010;27:51–61.
- , , , . Multiple discriminate analysis and logistic regression. In: Multivariate Data Analysis. 7th ed. Upper Saddle River, NJ: Prentice Hall; 2009.
- . A growing inpatient imperative: Alzheimer's disease. Hosp Health Netw. 2009;83:26, 28, 30.
- , , , , . The central role of comorbidity in predicting ambulatory care sensitive hospitalizations. Eur J Public Health. 2014;24(1):66–72.
- Agency for Healthcare Research and Quality. Prevention quality indicators technical specifications. Version 4.4. March 2012. Available at: http://www.qualityindicators.ahrq.gov/Archive/PQI_TechSpec_V44.aspx. Accessed September 1, 2012.
- , , , . Hospital transfers of nursing home residents with advanced dementia. J Am Geriatr Soc. 2012;60:905–909.
- , , , , . Potentially Avoidable Hospitalizations for Elderly Long‐stay Residents in Nursing Homes. Med Care. 2013;51(8):673–681.
- Centers for Medicare 15:592–601.
- , . Measurement of potentially preventable hospitalizations. white paper prepared for the long term quality alliance. Available at: http://www.ltqa.org/wp-content/themes/ltqaMain/custom/images//PreventableHospitalizations_021512_2.pdf. Published February 2012. Accessed August 6, 2013.
© 2015 Society of Hospital Medicine
Reduction in Iatrogenic Pneumothorax
Iatrogenic pneumothorax (IAP) is a complication of invasive procedures that is associated with substantial morbidity and some mortality.[1] IAP is often avoidable, and in many cases can be prevented through adherence to evidence‐based guidelines and procedural techniques known to reduce the incidence of IAP.[2] IAP may occur with a subclavian (SC) or internal jugular (IJ) central venous catheter (CVC) insertion, but is more frequently associated with the SC approach.[3] Ultrasound guidance during IJ CVC insertion is associated with a lower risk as compared to guidance by anatomical landmarks.[4, 5] Other bedside procedures that are known to cause IAP include thoracentesis. This risk can also be reduced with the use of ultrasound guidance.[6]
Including simulation in training for CVC insertion has been demonstrated in meta‐analyses to improve both learner outcomes, including simulator performance and perceived confidence, and patient outcomes, including fewer failed CVC attempts and reduced incidence of IAP.[7] Even brief simulation workshops lasting less than two hours can improve patient safety during CVC insertion.[8]
The implementation of ultrasound‐based simulation and improved adherence to the actual use of ultrasound at the bedside can be motivated by tying competency‐based educational objectives (eg, CVC insertion) to clinical outcomes (ie, rates of IAP) and tracking both as part of a continuous quality‐improvement cycle.[9] Adherence to best practices for CVC insertion can also be improved through standardizing hospital‐wide policies and hands‐on training.[10] Involving many stakeholders, including nurses, physicians, nurse practioners and physician assistants, in a multidisciplinary team has been shown to help alter entrenched behaviors and reduce the incidence of central‐line associated bloodstream infections through long‐term adherence to evidence‐based interventions.[11]
LOCAL PROBLEM
The Agency for Healthcare Research and Quality (AHRQ) has designed Patient Safety Indicators (PSIs) (
Our hospital is a member of the University HealthSystem Consortium (UHC) (
Despite this, the PSI can highlight areas where quality‐improvement efforts might be best directed. In 2005 and 2006, our hospital was ranked within the lowest UHC performance quartile for all‐cause IAP PSI.
During FY 2006 (September 2005August 2006), root‐cause analysis on cases of IAP at our hospital found that CVC insertion (40%) was the most common procedure associated with IAP, with SC insertion causing 69% of CVC‐associated IAP. Other common procedures associated with IAP were operative/pacemaker (30%), thoracentesis (25%), and ventilator associated (5%). Ultrasound was not used in 2/5 cases of IJ CVC placement and 3/5 thoracentesis cases. Only 44% of CVC insertions had a procedure note.
Intended Improvement/Study Question
Our team set out to plan and implement a set of multifaceted interventions within 90 days. The short‐term goal was a 50% reduction in the CVC IAP and all‐cause IAP rate within 18 months, and the long‐term goal was sustained reduction of CVC IAP and all‐cause IAP rate.
METHODS
The format of this article is based on the standards for quality‐improvement reporting excellence guidelines for the reporting of studies on the effectiveness of quality‐improvement interventions.[14]
Setting
Stanford University Medical Center is an academic medical center with 465 beds and over 25,000 inpatient admissions per year, providing both general acute care services and tertiary medical care. Residents perform CVC bedside procedures when central venous access is needed, in the intensive care unit (ICU), operating room (OR), and inpatient units. Prior to this project, ultrasound equipment was only available in the emergency department (ED) and ICUs. There was no formal CVC procedure supervision policy, CVC training curriculum, and procedure note templates for documentation of CVC insertion.
Planning the Interventions
A multidisciplinary quality‐improvement team met weekly during the 90‐day design period from January 2007 to March 2007. Our team included representatives from the departments of medicine, anesthesia and critical care, surgery, nursing, and emergency medicine. We also partnered with our institution's clinical and administrative leaders, experts in simulation, and the hospital quality department.
We hypothesized that a standardized set of education and training interventions promoting ultrasound‐guided IJ CVC insertion as the method of choice at our hospital would significantly reduce our rate of CVC‐associated IAP. Our multifaceted intervention included: (1) clinical and documentation standards based on evidence, (2) cognitive aids, (3) simulation training, (4) purchase and deployment of ultrasound equipment, and (5) feedback to clinical services.
Our team followed the define, measure, analyze, improve, control (DMAIC) framework.[15] We set interval goals with target completion dates throughout the 90‐day period, identified owners of each goal, and tracked progress with a shared spreadsheet.
In the 90‐day intervention, we accomplished the following: (1) conducted root‐cause analysis of IAP cases for fiscal year 2006, (2) created clinical and documentation standards around CVC placement, (3) created cognitive aids and procedure note templates, (4) developed simulation training courses, and (5) requested purchase of additional ultrasound equipment.
Data Collection
To evaluate our progress in reducing the rates of IAP, we tracked the incidence of IAP using UHC and AHRQ PSI methodology. In collaboration with our hospital's quality department, we manually reviewed every PSI‐identified case of IAP. This review has focused on identifying whether or not pneumothorax actually occurred, and whether it was associated with CVC insertion. For those associated with CVC, data were collected for patient location and service, the procedure site, whether ultrasound was used, whether a chest tube was required, and the final disposition of the patient.
Demographic data (age, gender, case mix index [CMI]) shown in Table 1 were obtained through MIDAS+ Solutions (Tucson, Arizona), a proprietary database that contains healthcare management coded data. Total hospital CVC insertion rates were calculated using International Classification of Diseases, Ninth Revision (ICD‐9) coding for 38.93 and 38.97. ICU central lineassociated blood stream infections (CLABSI) data were obtained from internal collection by our infection control team. Number and location of CVCs placed in the ICU data were obtained from nursing flow sheets in our electronic medical record (EMR). Cost information was provided by our finance department using internal accounting.
| Patients With CVC Insertion | Year | ||||||||
|---|---|---|---|---|---|---|---|---|---|
| 2006 | 2007 | 2008 | 2009 | 2010 | 2011 | 2012 | 2013 | 2014 | |
| |||||||||
| Age, y (mean) | 55.0 | 55.5 | 55.0 | 57.0 | 56.5 | 58.5 | 57.5 | 59.0 | 58.5 |
| % female | 47.0 | 49.5 | 47.0 | 48.8 | 46.2 | 46.1 | 45.7 | 46.2 | 45.7 |
| Case‐mix index | 3.08 | 3.35 | 3.21 | 3.40 | 3.71 | 3.91 | 3.92 | 3.92 | 4.08 |
| Total no. of CVCs/year* | 1,593 | 1,141 | 1,589 | 2,250 | 2,441 | 2,774 | 2,754 | 2,722 | 2,845 |
| No. of CVCs/year in ICU | NA | NA | NA | 1,502 | 1,357 | 1,345 | 1,316 | 1,421 | 1,590 |
| No. of subclavians/year in ICU | NA | NA | NA | 167 | 75 | 70 | 83 | 75 | 97 |
| No. of IJs/year in ICU | NA | NA | NA | 898 | 773 | 681 | 677 | 713 | 876 |
| No. of femorals/year in ICU | NA | NA | NA | 212 | 152 | 203 | 171 | 198 | 206 |
| No. of PICCs/year in ICU | NA | NA | NA | 225 | 357 | 391 | 385 | 435 | 411 |
| Preintervention (2006) | Postintervention (20082014) | P Value | |||||||
| Age, y (mean) | 55.2 | 58.7 | <0.0001 | ||||||
| % female | 47.0% | 46.4% | 0.642 | ||||||
| Case‐mix index | 3.08 | 3.73 | <0.0001 | ||||||
| CVC insertion rate | 8.1% | 11.4% | <0.0001 | ||||||
| All Inpatients | Year | ||||||||
| 2006 | 2007 | 2008 | 2009 | 2010 | 2011 | 2012 | 2013 | 2014 | |
| Age, y (mean) | 57.1 | 57.2 | 56.8 | 57.2 | 57.5 | 58.0 | 58.0 | 57.9 | 58.3 |
| % female | 51.6 | 51.2 | 52.4 | 51.7 | 51.1 | 51.5 | 50.3 | 49.9 | 50.1 |
| Case‐mix index | 1.86 | 1.98 | 1.96 | 1.99 | 1.96 | 2.02 | 2.03 | 2.07 | 2.23 |
| Preintervention (2006) | Postintervention (20082014) | P Value | |||||||
| Age, y (mean) | 57.1 | 57.6 | <0.01 | ||||||
| % female | 51.6% | 50.9% | 0.07 | ||||||
| Case‐mix index | 1.86 | 2.03 | 0.13 | ||||||
| Central Line‐Associated Bloodstream Infections per 1,000 Central Line Days | |||||||||
| Preintervention | Postintervention | P Value | |||||||
| Short term (2006 vs 2008) | 1.8 | 0.60 | 0.004 | ||||||
| Long term (2006 vs 20082014) | 1.8 | 0.68 | <0.0001 | ||||||
The project granted a Notice of Determination of Approval from the Stanford Administrative Panels for the Protection of Human Subjects (institutional review board).
Methods of Evaluation/Analysis
For the purpose of this analysis, the preintervention period was defined as January 1, 2006 through December 31, 2006, our first year of IAP case review. We defined the intervention period as January 1, 2007 through December 31, 2007, during which we planned and implemented hospital‐wide standardization of CVC insertion practices and incorporated CVC insertion training simulation into resident orientation in July 2007. The postintervention period was defined as January 1, 2008 through December 31, 2014.
All statistical analyses were performed using Stata version 12.1 (StataCorp, College Station, TX). [2] tests were used to determine statistical differences in pre‐ versus postintervention patient demographic data (age, gender, CMI), CVC insertion rates, and CLABSI rates. Because IAP is a rare event, a statistical process control g‐chart was created using QI Macros (KnowWare International, Inc., Denver, CO) to show the number of CVC procedures between IAP. [2] and Fisher exact tests were used to determine statistical differences in CVC anatomic location and use of ultrasound pre‐ and postintervention. A 2‐sided Z test to show a difference in proportions was used to determine statistical differences in CVC‐related IAP rate and all‐cause IAP rate pre‐ and postintervention.
Measuring Adherence to Intervention
Location of CVC Placement and Ultrasound Guidance Pre‐ Versus Postintervention
We utilized the Stanford Clinical Informatics Center (SCCI) services for obtaining counts of patients. Custom queries were performed on SCCI's Stanford Translational Research Integrated Database Environment (STRIDE) platform[16] to search Stanford Hospital electronic heath records for patients. This search primarily involved getting counts for the number of patients with clinical notes that contained the keywords of interest. To identify documentation for placement of CVC from 2006 to 2014, procedure or operative notes containing the words central line or CVC were counted. Further subcounts were obtained by searching for additional keywords such as PICC [peripherally inserted central catheters], femoral, jugular, subclavian, and ultrasound.
Adherence to Intervention in the ICU in 2014
A total of 100 charts were reviewed from patients in our medical and surgical ICU with a CVC in 2014 to evaluate the current trend of central line placement and sustainability of our intervention. Fifty charts were initially randomly selected from the ICU cohort. For those who had multiple lines placed, only the first line was reviewed. Because the initial audit did not provide enough SC lines and we wanted to review more IJ lines, we randomly selected an additional 25 patients who had SC and 25 patients who had IJ to review. The following was collected during chart review: primary team, location of line placement, usage of ultrasound, usage of standard procedure template, supervision, level of training for supervisor, and level of training for staff who performed procedure.
Outcomes
The rate of CVC‐associated IAP was calculated as the total number of IAPs attributed to CVCs divided by the total number of CVCs inserted determined by ICD‐9 coding for 38.93 and 38.97. The total IAP rate was calculated as the total number of IAP/1000 discharges.
RESULTS
Interventions
Our team began the intervention in early 2007 with promotion of ultrasound‐guided IJ catheterization. Clinical exceptions included: (1) trauma or code situations where access to the neck is limited, (2) suspected or confirmed neck injuries, (3) presence of a tracheostomy, and (4) bilateral internal jugular sites unsuitable for catheterization.
Our hospital adopted new formal CVC insertion policies consistent with the above training and education efforts. All physicians were required to document CVC insertions using the template available in the EMR. To be certified to perform CVC insertion independently, trainee physicians were required to complete the simulation training and successfully place a minimum of 5 CVCs directly supervised by an already‐certified physician. This was consistent with the Accreditation Council for Graduate Medical Education suggested minimum requirement in 2007. In our critical care units, all CVC insertions must be supervised by an ICU fellow or attending.
To reinforce the on‐the‐ground work by our physician leaders, we created 2 education tools to embed best practices into our CVC insertion workflow. A checklist with best practices for CVC insertion that was distributed throughout the hospital via central line kits and educational flyers, and a CVC insertion procedure note template consistent with California Department of Public Health documentation requirements was made available in our EMR.
In June 2007, we integrated CVC insertion simulation training into procedure workshops required for all medicine, surgery, anesthesia, and emergency medicine trainees during their intern year. These workshops promoted ultrasound‐guided IJ catheterization and supporting evidence for the new IJ site preference. Training sessions were 2 to 3 hours, and included a demonstration of best‐practice CVC insertion, as well as training with simulation models supervised by an instructor using a standardized CVC checklist. These trainings used both the Blue Phantom human torso model (
Hospital administration provided funds to purchase ultrasound machines for patient units such as medicine, cardiology, ED, and ICU). A total of 4 Site‐Rite (Bard Access Systems, Inc., Salt Lake City, UT) ultrasounds were purchased in 2007. The hospital has continued to purchase ultrasound units yearly, and had 53 ultrasound units in 2014
Cases of IAP were continuously reviewed throughout the intervention period. Based on their higher CVC‐associated IAP rates, the ORs and catheterization lab were identified as having opportunities for improvement. In 2008, Hospital quality‐improvement leadership met with physician leaders in these areas to review their CVC‐related IAP data and to discuss strategies to reduce their IAP rates. These strategies included lessons learned from other services that had successfully decreased their IAP rates.
To sustain our gains, we continue to review all IAP through our coding quality, clinical documentation, quality reporting departments, and peer review. We have implemented other strategies to decrease IAP, such as the use of ultrasound guidance for bedside thoracentesis procedures, which became possible after the availability of more ultrasound devices. Training for ultrasound‐guided thoracentesis was done by our procedure‐team attending during supervision of residents.
Outcomes
Preintervention (January 1, 2006 to December 31, 2006)
There were a total of 26 cases of IAP in 2006. Of these, 15 (58%) were associated with CVC insertion (Figure 1). The single procedure associated with the largest proportion of IAP was SC CVC insertion (11 cases, 42% of all IAP cases). Eleven CVC‐associated IAPs were significant enough to require chest tube placement. Our hospital recorded a total of 1593 CVC insertions (ICD‐9 codes 38.93 and 38.97) in 2006.
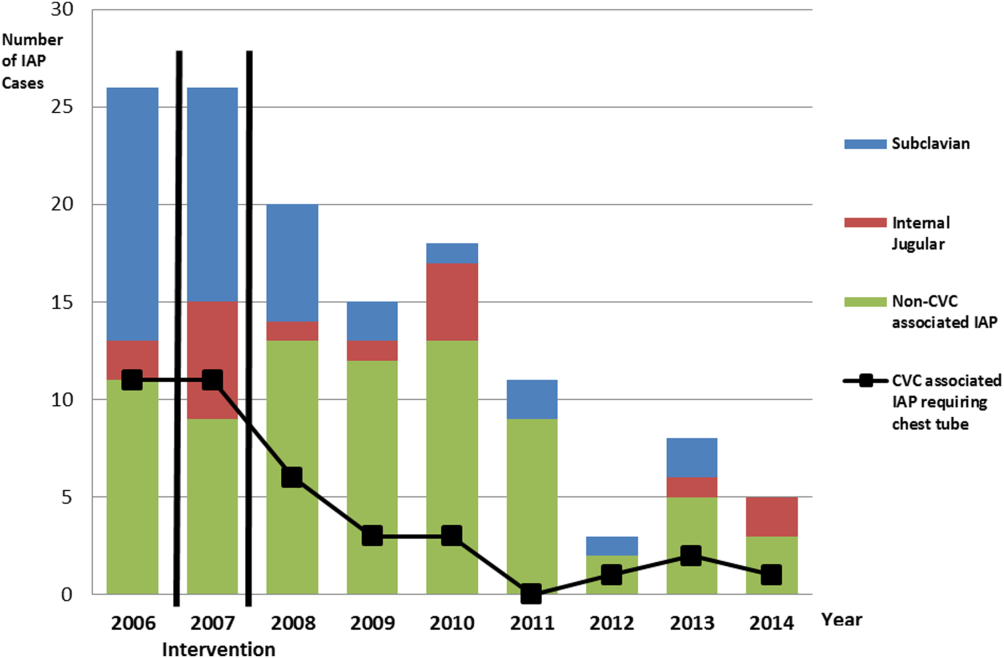
Postintervention (January 1, 2008 to December 31, 2014)
There were a total of 80 cases of IAP over 7 years, of which 24 (30%) were associated with CVC insertion. Of these, 16 required chest tube placement. In the last 4 years of the postintervention period (20112014), there were only 5 cases of CVC‐associated IAP requiring chest tube placement (Figure 1). There were a total of 12,000 CVC insertions recorded over the same period.
We successfully met both our short‐ and long‐term goals. Our preintervention CVC‐associated IAP rate was 0.94%, and our post‐intervention rate during 2008 was 0.44%, a short‐term reduction of 53% (P=0.088). Our average postintervention CVC‐associated IAP rate for the years 2008 through 2014 was 0.13%, a significant long‐term reduction of 86% (P<0.0001) (Table 2). The decrease in CVC‐associated IAP rates occurred despite an older patient population (P<0.001) and a higher CMI (P<0.001) in postintervention patients who received a CVC (Table 1). Special cause variation corresponding to a change in our process is demonstrated in Figure 2. The preintervention average number of procedures between IAP was 114.8 and increased to 460.7 in the postintervention period.
| Total CVC (n=95) | Subclavian (n=29) | Internal Jugular (n=58) | Femoral (n=8) | ||||||||||
|---|---|---|---|---|---|---|---|---|---|---|---|---|---|
| |||||||||||||
| Compliance to intervention | |||||||||||||
| US guided | 68.1% | 20.7% | 86.2% | 100.0% | |||||||||
| Procedure note completion | 90.4% | 93.1% | 86.2% | 100.0% | |||||||||
| Supervision | 70.2% | 77.8% | 73.1% | 87.5% | |||||||||
| Level of training | |||||||||||||
| Resident | 61.1% | 58.6% | 60.3% | 75.0% | |||||||||
| Fellow | 25.3% | 27.6% | 24.1% | 25.0% | |||||||||
| Attending | 4.2% | 6.9% | 3.4% | 0.0% | |||||||||
| Advance practitioner | 3.2% | 3.4% | 3.4% | 0.0% | |||||||||
| Unknown | 6.3% | 3.4% | 8.6% | 0.0% | |||||||||
| Supervisor type | |||||||||||||
| Resident | 3.0% | 4.8% | 2.6% | 0.0% | |||||||||
| Fellow | 54.5% | 33.3% | 57.9% | 100.0% | |||||||||
| Attending | 42.4% | 61.9% | 39.5% | 0.0% | |||||||||
| Location of CVC Placement | Internal Jugular (n=25) | Subclavian (n=25) | |||||||||||
| MICU | 32.0% | 32.0% | |||||||||||
| SICU* | 40.0% | 52.0% | |||||||||||
| Operating room | 28.0% | 16.0% | |||||||||||
| Average no. of attempts/procedure | 1.4 | 1.5 | |||||||||||
| Indications for subclavian insertion (n=25) | |||||||||||||
| Trauma/surgical site | 60.0% | ||||||||||||
| Need for additional access | 16.0% | ||||||||||||
| Unsuccessful IJ placement | 4.0% | ||||||||||||
| Unclear | 20.0% | ||||||||||||
| Iatrogenic Pneumothorax Rate (20062014) | Year | ||||||||||||
| 2006 | 2007 | 2008 | 2009 | 2010 | 2011 | 2012 | 2013 | 2014 | |||||
| % of CVC insertions associated with IAP | 0.94 | 1.49 | 0.44 | 0.13 | 0.20 | 0.07 | 0.04 | 0.11 | 0.07 | ||||
| All‐cause IAP per 1,000 discharges | 1.32 | 1.29 | 0.98 | 0.71 | 0.83 | 0.49 | 0.13 | 0.35 | 0.23 | ||||
| Preintervention | Postintervention | P Value | |||||||||||
| CVC‐ associated IAP short term (2006 vs 2008) | 0.94% | 0.44% | 0.088 | ||||||||||
| CVC‐associated IAP long term (2006 vs 20082014) | 0.94% | 0.13% | <0.0001 | ||||||||||
| All‐cause IAP per 1,000 discharges short term (2006 vs 2008) | 1.32 | 0.98 | <0.0001 | ||||||||||
| All‐cause IAP per 1,000 discharges long term (2006 vs 2008‐14) | 1.32 | 0.52 | <0.0001 | ||||||||||
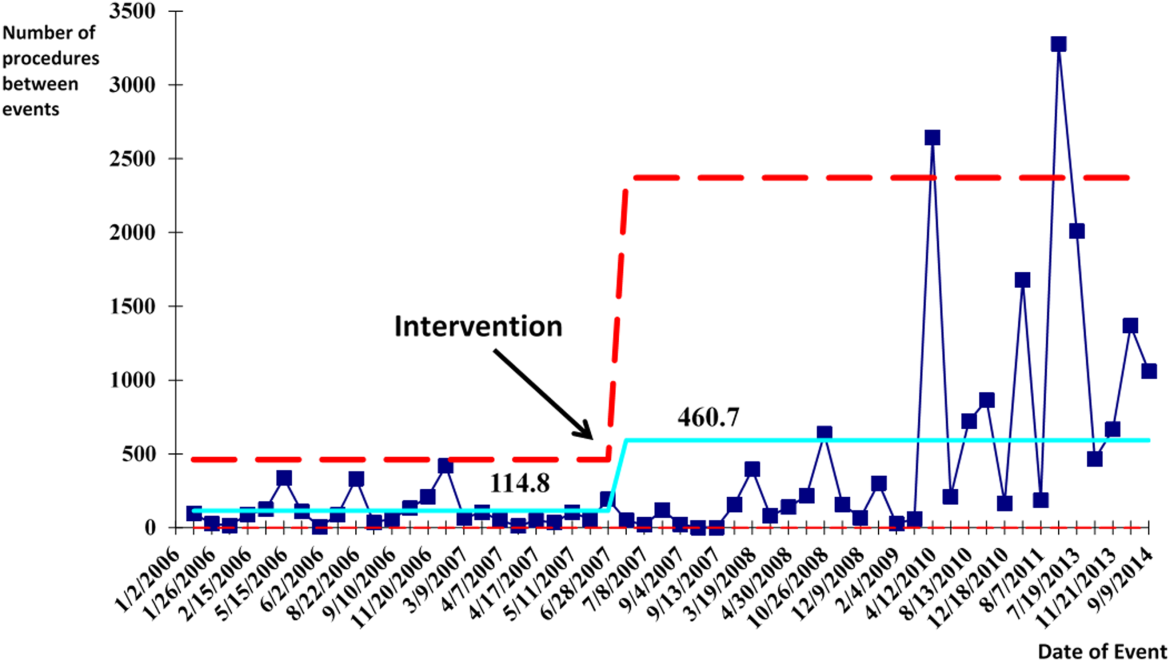
With the decrease in CVC‐associated IAP, we also saw a decrease in our all‐cause IAP rate per 1000 discharges from 1.32 in 2006 to 0.98 in 2008. This represents a 26% short‐term reduction (P<0.0001). We also saw a decrease in our all‐cause IAP rate per 1000 discharges to 0.52 from 2008 to 2014, representing a 61% long‐term reduction (P<0.0001). This decrease in all‐cause IAP postintervention occurred despite an older patient population (P<0.01) for all discharges. Our hospital is now in the highest performance UHC quartile for all‐cause IAP in 2012 to 2014.
After our multifaceted intervention in 2007, there was substantially more and consistent documentation of CVC procedure notes from less than 500 in 2006 to greater than 2000 in 2009. The distribution of CVC procedure notes in the pre‐ (2006) versus postintervention (20082014) period showed a decrease in the proportion of femoral lines from 15% to 11%, increase in IJ lines from 31% to 49%, and a decrease in SC from 54% to 40% (P=0.001). The distribution of IJ CVC procedure notes in the pre‐ (2006) versus postintervention (20082014) period showed an increase in the proportion of procedures with ultrasound documentation from 13% to 93% (P<0.001) (Figure 3).
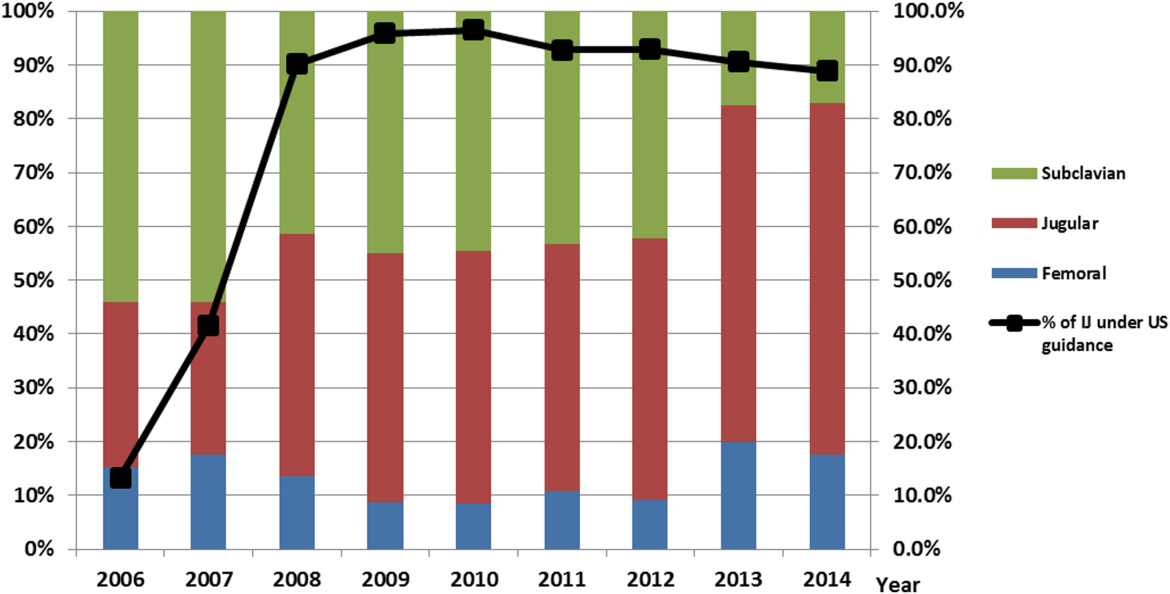
In our ICU 2014 audit, the majority of CVC lines were placed by residents under supervision (>70%), and most used the standard CVC note template to document the procedure (90%). Of the total CVC approach, 66% were IJ and 4% were SC. Eighty‐six percent used ultrasound during IJ placement. The majority of SC insertions were placed in the surgical ICU and had clear indications (80%) for placement. Of those, 75% were due to trauma (limited access to neck) or surgery (interfering with surgical site) (Table 2).
DISCUSSION
Summary
This quality‐improvement intervention demonstrates that a multidisciplinary team can successfully implement a multifaceted intervention that sustainably reduces the rate of IAP complications from CVC placement and improves patient safety over 7 years. We found high compliance with our intervention, which included an increase in CVC notes and documentation of ultrasound guidance. There was also an increase in the IJ approach in our postintervention period. We showed statistically significant long‐term reductions in both CVC‐associated and all‐cause IAP rates. From 2011 to 2014, there were only 5 cases of CVC‐associated IAP requiring chest tube placement. Post hoc analysis showed a statistically significant decrease in CLABSI rates (P<0.0001) from a preintervention rate of 1.6 infections per 1000 central line days to postintervention average rate of 0.68 infections per 1000 central line days. This decrease may be related to the incorporation of wide sterile barrier techniques in our CVC training workshops, checklists, and template procedure notes.
A strength of this study is the sustained significant long‐term reduction in IAP. There are few data that exist to describe sustained interventions in this area. Sustainability was achieved by integrating our interventions into ongoing programs that already existed in the hospital; we incorporated our simulation training into the existing new resident orientation, increased the availability of existing ultrasound equipment, and continued our IAP chart review through coding quality with feedback to involved services. The procedure note template continues to be easily available in our EMR, and the SC approach to CVC placement is limited to select cases.
Based on a post hoc cost‐benefit analysis, the financial benefits of decreasing the rate of IAP outweigh the costs associated with implementation of this initiative. The purchase cost for a Site‐Rite (Bard Access Systems) ultrasound machine was $18,000. The cost of materials for 1 workshop is $5000 annually. Cases from the Nationwide Inpatient Sample that were flagged by this PSI had 7.0% excess mortality, 4.4 days of excess hospitalization, and approximately $18,000 in excess hospital charges.[17, 18] Based on these data, if we had continued at our preintervention rate of CVC‐associated IAP requiring chest tube placement, we would estimate 9 additional CVC‐associated IAPs requiring chest tube insertion per year. This would result in over $180,000 of additional costs annually. Based on an initial cost of $100,000 for 4 workshops and the necessary equipment, we would have realized our cost savings in less than 1 year postintervention. These are all approximate costs, and further detailed analysis is needed.
One challenge with this intervention is the culture change away from using the SC approach, and the concern from trainees of how they would learn to perform SC CVC if needed. We would suggest dedicated SC CVC ultrasound training for those services who may need to use this approach (eg, neuroanesthesia and trauma).
Interpretation/Relation to Other Evidence
The field of implementation science can help explain why some projects are successful and others fail. We can further dissect the success of this project using an implementation science model similar to that described by French et al.[19] French et al. describe 4 behavior‐change techniques. These steps include (1) who needs to do what differently, (2) which barriers and enablers need to be addressed, (3) which intervention component could overcome the barriers and enhance enablers, and (4) how can behavior change be measured and understood. Barriers included suboptimal skills of residents, low awareness of evidence‐based guidelines, and entrenched practices inconsistent with best evidence. There was also a belief that IJ lines were more likely to become infected. Targeted behaviors needing to be done differently were the choice of CVC placement site and insertion technique. Barriers to change were assessed by asking members of the project team to explore with members of their service what led them to do CVC lines without ultrasound guidance. Enhancements focused on information provision, simulation practice, and persuasive communication. Behavior change was measured by tracking the number of IAPs, site of CVC, and documentation of technique. Continuation of these interventions based on this theoretical framework drove maintenance of gains.
We completed our main intervention planning in 90 days, and met our short‐term goal on schedule. The Institute for Healthcare Improvement (IHI) advocates that such short timelines are efficient mechanisms for developing and acting on projects. Other institutions have reported on similar rapid‐cycle planning and short‐term goal setting[20]
Limitations
Our study captures the experience of a quality‐improvement team at a single academic center, and our results may not be generalizable to other institutions. Our chart review process only occurred once a case had been identified through AHRQ PSI methodology. It is possible that the PSI does not capture all cases of IAP, although we believe our coding department has a very rigorous process to look for all IAP evidence in the patient's record. We used administrative data to determine the number of hospital‐wide CVC procedures.
Our compliance data with interventions from STRIDE are based on looking for key words in procedure note documentation (so undocumented notes are not captured). To validate this, we performed a manual audit of our adherence to our intervention in 2014, and those data are consistent with the results from our STRIDE data.
Our study's observational design also cannot control for exogenous effects on physician practice relating to CVC insertion or the overall risk of IAP. Some of our decrease in complications may be from the increase in PICC line use. Nevertheless, our CVC‐associated IAP rate has decreased despite >6000 non‐PICC CVCs in our ICU over the past 5 years, and a rising CMI (18% increase in postintervention period) and older population of patients with CVC insertion (P<0.0001)
CONCLUSIONS
We are the first, to our knowledge, to report a measurable improvement in reducing IAP patient outcomes that has been sustained for over 7 years. Our hospital is in the highest performance UHC quartile for all‐cause IAP in 2012 to 2014. A multidisciplinary quality‐improvement team, focused on evidence, patient safety, and standardization, can use a multifaceted intervention to sustainably improve patient outcomes. Promoting ultrasound‐guided IJ catheterization as the CVC insertion method of choice significantly reduced our hospital's rate of CVC‐associated IAP.
Acknowledgements
The authors acknowledge many who have contributed to this quality‐improvement project:
Irina Tokareva, Jay Lee, Kourt Bowes, and Gomathi Krishnan for data analysis; Laura Meinke for significant website curriculum; Fred Mihm, Sarah Williams, and John Kugler for leadership in ultrasound training; Kevin Tabb and Norm Rizk for hospital financial support of simulation workshops and ultrasound machines; Pooja Loftus and Helene Grossman for statistical analysis; Eric Hadhazy for data support; Joan Hendershott for cost information; Nancy Szaflarski for project management and manuscript review; and Isabella Chu for manuscript review.
Disclosures: STRIDE (Stanford Translational Research Integrated Database Environment) is a research and development project at Stanford University to create a standards‐based informatics platform supporting clinical and translational research. This STRIDE project was supported by the National Center for Research Resources and the National Center for Advancing Translational Sciences, National Institutes of Health, through grant UL1 RR025744. The content is solely the responsibility of the authors and does not necessarily represent the official views of the NIH. The authors report no conflicts of interest.
- , , . Significance of iatrogenic pneumothoraces. Chest. 1994;105(4):1147–1150.
- , , , , , . How to avoid and manage a pneumothorax. J Vasc Access. 2006;7(1):7–14.
- , , , . Iatrogenic pneumothorax: etiology, incidence and risk factors. Thorac Cardiovasc Surg. 2009;57(5):286–290.
- , , , et al. Real‐time ultrasound‐guided catheterisation of the internal jugular vein: a prospective comparison with the landmark technique in critical care patients. Crit Care. 2006;10(6):R162.
- , , . Safe placement of central venous catheters: a measured approach. J Intens Care Med. 2011;26(6):392–396.
- , , , . Reducing iatrogenic risk in thoracentesis: establishing best practice via experiential training in a zero‐risk environment. Chest. 2009;135(5):1315–1320.
- , , , , , . Use of simulation‐based education to improve outcomes of central venous catheterization: a systematic review and meta‐analysis. Acad Med. 2011;86(9):1137–1147.
- , , , , , . A prerotational, simulation‐based workshop improves the safety of central venous catheter insertion: results of a successful internal medicine house staff training program. Chest. 2011;140(3):652–658.
- , , , , . Linking residency training effectiveness to clinical outcomes: a quality improvement approach. Jt Comm J Qual Patient Saf. 2010;36(5):203–208.
- , , , et al. Education of physicians‐in‐training can decrease the risk for vascular catheter infection. Ann Intern Med. 2000;132(8):641–648.
- , , , et al. A multidisciplinary approach to reduce central line‐associated bloodstream infections. Jt Comm J Qual Patient Saf. 2013;39(2):61–69.
- , , , et al. Validity of selected Patient Safety Indicators: opportunities and concerns. J Am Coll Surg. 2011;212(6):924–934.
- , , , et al. Cases of iatrogenic pneumothorax can be identified from ICD‐9‐CM coded data. Am J Med Qual. 2010;25(3):218–224.
- , , , , ; SQUIRE development group. Publication guidelines for quality improvement studies in health care: evolution of the SQUIRE project. BMJ. 2009;338:a3152.
- . The Quality Toolbox. 2nd ed. Milwaukee, WI: ASQ Quality Press; 2005.
- , , , . STRIDE—an integrated standards‐based translational research informatics platform. AMIA Annu Symp Proc. 2009;2009:391–395.
- , , . Accidental iatrogenic pneumothorax in hospitalized patients. Med Care. 2006;44(2):182–186.
- , . Excess length of stay, charges, and mortality attributable to medical injuries during hospitalization. JAMA. 2003;290(14):1868–1874.
- , , , et al. Developing theory‐informed behaviour change interventions to implement evidence into practice: a systematic approach using the Theoretical Domains Framework. Implement Sci. 2012;7:38.
- , . Using rapid‐cycle quality improvement methodology to reduce feeding tubes in patients with advanced dementia: before and after study. BMJ. 2004;329(7464):491–494.
Iatrogenic pneumothorax (IAP) is a complication of invasive procedures that is associated with substantial morbidity and some mortality.[1] IAP is often avoidable, and in many cases can be prevented through adherence to evidence‐based guidelines and procedural techniques known to reduce the incidence of IAP.[2] IAP may occur with a subclavian (SC) or internal jugular (IJ) central venous catheter (CVC) insertion, but is more frequently associated with the SC approach.[3] Ultrasound guidance during IJ CVC insertion is associated with a lower risk as compared to guidance by anatomical landmarks.[4, 5] Other bedside procedures that are known to cause IAP include thoracentesis. This risk can also be reduced with the use of ultrasound guidance.[6]
Including simulation in training for CVC insertion has been demonstrated in meta‐analyses to improve both learner outcomes, including simulator performance and perceived confidence, and patient outcomes, including fewer failed CVC attempts and reduced incidence of IAP.[7] Even brief simulation workshops lasting less than two hours can improve patient safety during CVC insertion.[8]
The implementation of ultrasound‐based simulation and improved adherence to the actual use of ultrasound at the bedside can be motivated by tying competency‐based educational objectives (eg, CVC insertion) to clinical outcomes (ie, rates of IAP) and tracking both as part of a continuous quality‐improvement cycle.[9] Adherence to best practices for CVC insertion can also be improved through standardizing hospital‐wide policies and hands‐on training.[10] Involving many stakeholders, including nurses, physicians, nurse practioners and physician assistants, in a multidisciplinary team has been shown to help alter entrenched behaviors and reduce the incidence of central‐line associated bloodstream infections through long‐term adherence to evidence‐based interventions.[11]
LOCAL PROBLEM
The Agency for Healthcare Research and Quality (AHRQ) has designed Patient Safety Indicators (PSIs) (
Our hospital is a member of the University HealthSystem Consortium (UHC) (
Despite this, the PSI can highlight areas where quality‐improvement efforts might be best directed. In 2005 and 2006, our hospital was ranked within the lowest UHC performance quartile for all‐cause IAP PSI.
During FY 2006 (September 2005August 2006), root‐cause analysis on cases of IAP at our hospital found that CVC insertion (40%) was the most common procedure associated with IAP, with SC insertion causing 69% of CVC‐associated IAP. Other common procedures associated with IAP were operative/pacemaker (30%), thoracentesis (25%), and ventilator associated (5%). Ultrasound was not used in 2/5 cases of IJ CVC placement and 3/5 thoracentesis cases. Only 44% of CVC insertions had a procedure note.
Intended Improvement/Study Question
Our team set out to plan and implement a set of multifaceted interventions within 90 days. The short‐term goal was a 50% reduction in the CVC IAP and all‐cause IAP rate within 18 months, and the long‐term goal was sustained reduction of CVC IAP and all‐cause IAP rate.
METHODS
The format of this article is based on the standards for quality‐improvement reporting excellence guidelines for the reporting of studies on the effectiveness of quality‐improvement interventions.[14]
Setting
Stanford University Medical Center is an academic medical center with 465 beds and over 25,000 inpatient admissions per year, providing both general acute care services and tertiary medical care. Residents perform CVC bedside procedures when central venous access is needed, in the intensive care unit (ICU), operating room (OR), and inpatient units. Prior to this project, ultrasound equipment was only available in the emergency department (ED) and ICUs. There was no formal CVC procedure supervision policy, CVC training curriculum, and procedure note templates for documentation of CVC insertion.
Planning the Interventions
A multidisciplinary quality‐improvement team met weekly during the 90‐day design period from January 2007 to March 2007. Our team included representatives from the departments of medicine, anesthesia and critical care, surgery, nursing, and emergency medicine. We also partnered with our institution's clinical and administrative leaders, experts in simulation, and the hospital quality department.
We hypothesized that a standardized set of education and training interventions promoting ultrasound‐guided IJ CVC insertion as the method of choice at our hospital would significantly reduce our rate of CVC‐associated IAP. Our multifaceted intervention included: (1) clinical and documentation standards based on evidence, (2) cognitive aids, (3) simulation training, (4) purchase and deployment of ultrasound equipment, and (5) feedback to clinical services.
Our team followed the define, measure, analyze, improve, control (DMAIC) framework.[15] We set interval goals with target completion dates throughout the 90‐day period, identified owners of each goal, and tracked progress with a shared spreadsheet.
In the 90‐day intervention, we accomplished the following: (1) conducted root‐cause analysis of IAP cases for fiscal year 2006, (2) created clinical and documentation standards around CVC placement, (3) created cognitive aids and procedure note templates, (4) developed simulation training courses, and (5) requested purchase of additional ultrasound equipment.
Data Collection
To evaluate our progress in reducing the rates of IAP, we tracked the incidence of IAP using UHC and AHRQ PSI methodology. In collaboration with our hospital's quality department, we manually reviewed every PSI‐identified case of IAP. This review has focused on identifying whether or not pneumothorax actually occurred, and whether it was associated with CVC insertion. For those associated with CVC, data were collected for patient location and service, the procedure site, whether ultrasound was used, whether a chest tube was required, and the final disposition of the patient.
Demographic data (age, gender, case mix index [CMI]) shown in Table 1 were obtained through MIDAS+ Solutions (Tucson, Arizona), a proprietary database that contains healthcare management coded data. Total hospital CVC insertion rates were calculated using International Classification of Diseases, Ninth Revision (ICD‐9) coding for 38.93 and 38.97. ICU central lineassociated blood stream infections (CLABSI) data were obtained from internal collection by our infection control team. Number and location of CVCs placed in the ICU data were obtained from nursing flow sheets in our electronic medical record (EMR). Cost information was provided by our finance department using internal accounting.
| Patients With CVC Insertion | Year | ||||||||
|---|---|---|---|---|---|---|---|---|---|
| 2006 | 2007 | 2008 | 2009 | 2010 | 2011 | 2012 | 2013 | 2014 | |
| |||||||||
| Age, y (mean) | 55.0 | 55.5 | 55.0 | 57.0 | 56.5 | 58.5 | 57.5 | 59.0 | 58.5 |
| % female | 47.0 | 49.5 | 47.0 | 48.8 | 46.2 | 46.1 | 45.7 | 46.2 | 45.7 |
| Case‐mix index | 3.08 | 3.35 | 3.21 | 3.40 | 3.71 | 3.91 | 3.92 | 3.92 | 4.08 |
| Total no. of CVCs/year* | 1,593 | 1,141 | 1,589 | 2,250 | 2,441 | 2,774 | 2,754 | 2,722 | 2,845 |
| No. of CVCs/year in ICU | NA | NA | NA | 1,502 | 1,357 | 1,345 | 1,316 | 1,421 | 1,590 |
| No. of subclavians/year in ICU | NA | NA | NA | 167 | 75 | 70 | 83 | 75 | 97 |
| No. of IJs/year in ICU | NA | NA | NA | 898 | 773 | 681 | 677 | 713 | 876 |
| No. of femorals/year in ICU | NA | NA | NA | 212 | 152 | 203 | 171 | 198 | 206 |
| No. of PICCs/year in ICU | NA | NA | NA | 225 | 357 | 391 | 385 | 435 | 411 |
| Preintervention (2006) | Postintervention (20082014) | P Value | |||||||
| Age, y (mean) | 55.2 | 58.7 | <0.0001 | ||||||
| % female | 47.0% | 46.4% | 0.642 | ||||||
| Case‐mix index | 3.08 | 3.73 | <0.0001 | ||||||
| CVC insertion rate | 8.1% | 11.4% | <0.0001 | ||||||
| All Inpatients | Year | ||||||||
| 2006 | 2007 | 2008 | 2009 | 2010 | 2011 | 2012 | 2013 | 2014 | |
| Age, y (mean) | 57.1 | 57.2 | 56.8 | 57.2 | 57.5 | 58.0 | 58.0 | 57.9 | 58.3 |
| % female | 51.6 | 51.2 | 52.4 | 51.7 | 51.1 | 51.5 | 50.3 | 49.9 | 50.1 |
| Case‐mix index | 1.86 | 1.98 | 1.96 | 1.99 | 1.96 | 2.02 | 2.03 | 2.07 | 2.23 |
| Preintervention (2006) | Postintervention (20082014) | P Value | |||||||
| Age, y (mean) | 57.1 | 57.6 | <0.01 | ||||||
| % female | 51.6% | 50.9% | 0.07 | ||||||
| Case‐mix index | 1.86 | 2.03 | 0.13 | ||||||
| Central Line‐Associated Bloodstream Infections per 1,000 Central Line Days | |||||||||
| Preintervention | Postintervention | P Value | |||||||
| Short term (2006 vs 2008) | 1.8 | 0.60 | 0.004 | ||||||
| Long term (2006 vs 20082014) | 1.8 | 0.68 | <0.0001 | ||||||
The project granted a Notice of Determination of Approval from the Stanford Administrative Panels for the Protection of Human Subjects (institutional review board).
Methods of Evaluation/Analysis
For the purpose of this analysis, the preintervention period was defined as January 1, 2006 through December 31, 2006, our first year of IAP case review. We defined the intervention period as January 1, 2007 through December 31, 2007, during which we planned and implemented hospital‐wide standardization of CVC insertion practices and incorporated CVC insertion training simulation into resident orientation in July 2007. The postintervention period was defined as January 1, 2008 through December 31, 2014.
All statistical analyses were performed using Stata version 12.1 (StataCorp, College Station, TX). [2] tests were used to determine statistical differences in pre‐ versus postintervention patient demographic data (age, gender, CMI), CVC insertion rates, and CLABSI rates. Because IAP is a rare event, a statistical process control g‐chart was created using QI Macros (KnowWare International, Inc., Denver, CO) to show the number of CVC procedures between IAP. [2] and Fisher exact tests were used to determine statistical differences in CVC anatomic location and use of ultrasound pre‐ and postintervention. A 2‐sided Z test to show a difference in proportions was used to determine statistical differences in CVC‐related IAP rate and all‐cause IAP rate pre‐ and postintervention.
Measuring Adherence to Intervention
Location of CVC Placement and Ultrasound Guidance Pre‐ Versus Postintervention
We utilized the Stanford Clinical Informatics Center (SCCI) services for obtaining counts of patients. Custom queries were performed on SCCI's Stanford Translational Research Integrated Database Environment (STRIDE) platform[16] to search Stanford Hospital electronic heath records for patients. This search primarily involved getting counts for the number of patients with clinical notes that contained the keywords of interest. To identify documentation for placement of CVC from 2006 to 2014, procedure or operative notes containing the words central line or CVC were counted. Further subcounts were obtained by searching for additional keywords such as PICC [peripherally inserted central catheters], femoral, jugular, subclavian, and ultrasound.
Adherence to Intervention in the ICU in 2014
A total of 100 charts were reviewed from patients in our medical and surgical ICU with a CVC in 2014 to evaluate the current trend of central line placement and sustainability of our intervention. Fifty charts were initially randomly selected from the ICU cohort. For those who had multiple lines placed, only the first line was reviewed. Because the initial audit did not provide enough SC lines and we wanted to review more IJ lines, we randomly selected an additional 25 patients who had SC and 25 patients who had IJ to review. The following was collected during chart review: primary team, location of line placement, usage of ultrasound, usage of standard procedure template, supervision, level of training for supervisor, and level of training for staff who performed procedure.
Outcomes
The rate of CVC‐associated IAP was calculated as the total number of IAPs attributed to CVCs divided by the total number of CVCs inserted determined by ICD‐9 coding for 38.93 and 38.97. The total IAP rate was calculated as the total number of IAP/1000 discharges.
RESULTS
Interventions
Our team began the intervention in early 2007 with promotion of ultrasound‐guided IJ catheterization. Clinical exceptions included: (1) trauma or code situations where access to the neck is limited, (2) suspected or confirmed neck injuries, (3) presence of a tracheostomy, and (4) bilateral internal jugular sites unsuitable for catheterization.
Our hospital adopted new formal CVC insertion policies consistent with the above training and education efforts. All physicians were required to document CVC insertions using the template available in the EMR. To be certified to perform CVC insertion independently, trainee physicians were required to complete the simulation training and successfully place a minimum of 5 CVCs directly supervised by an already‐certified physician. This was consistent with the Accreditation Council for Graduate Medical Education suggested minimum requirement in 2007. In our critical care units, all CVC insertions must be supervised by an ICU fellow or attending.
To reinforce the on‐the‐ground work by our physician leaders, we created 2 education tools to embed best practices into our CVC insertion workflow. A checklist with best practices for CVC insertion that was distributed throughout the hospital via central line kits and educational flyers, and a CVC insertion procedure note template consistent with California Department of Public Health documentation requirements was made available in our EMR.
In June 2007, we integrated CVC insertion simulation training into procedure workshops required for all medicine, surgery, anesthesia, and emergency medicine trainees during their intern year. These workshops promoted ultrasound‐guided IJ catheterization and supporting evidence for the new IJ site preference. Training sessions were 2 to 3 hours, and included a demonstration of best‐practice CVC insertion, as well as training with simulation models supervised by an instructor using a standardized CVC checklist. These trainings used both the Blue Phantom human torso model (
Hospital administration provided funds to purchase ultrasound machines for patient units such as medicine, cardiology, ED, and ICU). A total of 4 Site‐Rite (Bard Access Systems, Inc., Salt Lake City, UT) ultrasounds were purchased in 2007. The hospital has continued to purchase ultrasound units yearly, and had 53 ultrasound units in 2014
Cases of IAP were continuously reviewed throughout the intervention period. Based on their higher CVC‐associated IAP rates, the ORs and catheterization lab were identified as having opportunities for improvement. In 2008, Hospital quality‐improvement leadership met with physician leaders in these areas to review their CVC‐related IAP data and to discuss strategies to reduce their IAP rates. These strategies included lessons learned from other services that had successfully decreased their IAP rates.
To sustain our gains, we continue to review all IAP through our coding quality, clinical documentation, quality reporting departments, and peer review. We have implemented other strategies to decrease IAP, such as the use of ultrasound guidance for bedside thoracentesis procedures, which became possible after the availability of more ultrasound devices. Training for ultrasound‐guided thoracentesis was done by our procedure‐team attending during supervision of residents.
Outcomes
Preintervention (January 1, 2006 to December 31, 2006)
There were a total of 26 cases of IAP in 2006. Of these, 15 (58%) were associated with CVC insertion (Figure 1). The single procedure associated with the largest proportion of IAP was SC CVC insertion (11 cases, 42% of all IAP cases). Eleven CVC‐associated IAPs were significant enough to require chest tube placement. Our hospital recorded a total of 1593 CVC insertions (ICD‐9 codes 38.93 and 38.97) in 2006.
Postintervention (January 1, 2008 to December 31, 2014)
There were a total of 80 cases of IAP over 7 years, of which 24 (30%) were associated with CVC insertion. Of these, 16 required chest tube placement. In the last 4 years of the postintervention period (20112014), there were only 5 cases of CVC‐associated IAP requiring chest tube placement (Figure 1). There were a total of 12,000 CVC insertions recorded over the same period.
We successfully met both our short‐ and long‐term goals. Our preintervention CVC‐associated IAP rate was 0.94%, and our post‐intervention rate during 2008 was 0.44%, a short‐term reduction of 53% (P=0.088). Our average postintervention CVC‐associated IAP rate for the years 2008 through 2014 was 0.13%, a significant long‐term reduction of 86% (P<0.0001) (Table 2). The decrease in CVC‐associated IAP rates occurred despite an older patient population (P<0.001) and a higher CMI (P<0.001) in postintervention patients who received a CVC (Table 1). Special cause variation corresponding to a change in our process is demonstrated in Figure 2. The preintervention average number of procedures between IAP was 114.8 and increased to 460.7 in the postintervention period.
| Total CVC (n=95) | Subclavian (n=29) | Internal Jugular (n=58) | Femoral (n=8) | ||||||||||
|---|---|---|---|---|---|---|---|---|---|---|---|---|---|
| |||||||||||||
| Compliance to intervention | |||||||||||||
| US guided | 68.1% | 20.7% | 86.2% | 100.0% | |||||||||
| Procedure note completion | 90.4% | 93.1% | 86.2% | 100.0% | |||||||||
| Supervision | 70.2% | 77.8% | 73.1% | 87.5% | |||||||||
| Level of training | |||||||||||||
| Resident | 61.1% | 58.6% | 60.3% | 75.0% | |||||||||
| Fellow | 25.3% | 27.6% | 24.1% | 25.0% | |||||||||
| Attending | 4.2% | 6.9% | 3.4% | 0.0% | |||||||||
| Advance practitioner | 3.2% | 3.4% | 3.4% | 0.0% | |||||||||
| Unknown | 6.3% | 3.4% | 8.6% | 0.0% | |||||||||
| Supervisor type | |||||||||||||
| Resident | 3.0% | 4.8% | 2.6% | 0.0% | |||||||||
| Fellow | 54.5% | 33.3% | 57.9% | 100.0% | |||||||||
| Attending | 42.4% | 61.9% | 39.5% | 0.0% | |||||||||
| Location of CVC Placement | Internal Jugular (n=25) | Subclavian (n=25) | |||||||||||
| MICU | 32.0% | 32.0% | |||||||||||
| SICU* | 40.0% | 52.0% | |||||||||||
| Operating room | 28.0% | 16.0% | |||||||||||
| Average no. of attempts/procedure | 1.4 | 1.5 | |||||||||||
| Indications for subclavian insertion (n=25) | |||||||||||||
| Trauma/surgical site | 60.0% | ||||||||||||
| Need for additional access | 16.0% | ||||||||||||
| Unsuccessful IJ placement | 4.0% | ||||||||||||
| Unclear | 20.0% | ||||||||||||
| Iatrogenic Pneumothorax Rate (20062014) | Year | ||||||||||||
| 2006 | 2007 | 2008 | 2009 | 2010 | 2011 | 2012 | 2013 | 2014 | |||||
| % of CVC insertions associated with IAP | 0.94 | 1.49 | 0.44 | 0.13 | 0.20 | 0.07 | 0.04 | 0.11 | 0.07 | ||||
| All‐cause IAP per 1,000 discharges | 1.32 | 1.29 | 0.98 | 0.71 | 0.83 | 0.49 | 0.13 | 0.35 | 0.23 | ||||
| Preintervention | Postintervention | P Value | |||||||||||
| CVC‐ associated IAP short term (2006 vs 2008) | 0.94% | 0.44% | 0.088 | ||||||||||
| CVC‐associated IAP long term (2006 vs 20082014) | 0.94% | 0.13% | <0.0001 | ||||||||||
| All‐cause IAP per 1,000 discharges short term (2006 vs 2008) | 1.32 | 0.98 | <0.0001 | ||||||||||
| All‐cause IAP per 1,000 discharges long term (2006 vs 2008‐14) | 1.32 | 0.52 | <0.0001 | ||||||||||
With the decrease in CVC‐associated IAP, we also saw a decrease in our all‐cause IAP rate per 1000 discharges from 1.32 in 2006 to 0.98 in 2008. This represents a 26% short‐term reduction (P<0.0001). We also saw a decrease in our all‐cause IAP rate per 1000 discharges to 0.52 from 2008 to 2014, representing a 61% long‐term reduction (P<0.0001). This decrease in all‐cause IAP postintervention occurred despite an older patient population (P<0.01) for all discharges. Our hospital is now in the highest performance UHC quartile for all‐cause IAP in 2012 to 2014.
After our multifaceted intervention in 2007, there was substantially more and consistent documentation of CVC procedure notes from less than 500 in 2006 to greater than 2000 in 2009. The distribution of CVC procedure notes in the pre‐ (2006) versus postintervention (20082014) period showed a decrease in the proportion of femoral lines from 15% to 11%, increase in IJ lines from 31% to 49%, and a decrease in SC from 54% to 40% (P=0.001). The distribution of IJ CVC procedure notes in the pre‐ (2006) versus postintervention (20082014) period showed an increase in the proportion of procedures with ultrasound documentation from 13% to 93% (P<0.001) (Figure 3).
In our ICU 2014 audit, the majority of CVC lines were placed by residents under supervision (>70%), and most used the standard CVC note template to document the procedure (90%). Of the total CVC approach, 66% were IJ and 4% were SC. Eighty‐six percent used ultrasound during IJ placement. The majority of SC insertions were placed in the surgical ICU and had clear indications (80%) for placement. Of those, 75% were due to trauma (limited access to neck) or surgery (interfering with surgical site) (Table 2).
DISCUSSION
Summary
This quality‐improvement intervention demonstrates that a multidisciplinary team can successfully implement a multifaceted intervention that sustainably reduces the rate of IAP complications from CVC placement and improves patient safety over 7 years. We found high compliance with our intervention, which included an increase in CVC notes and documentation of ultrasound guidance. There was also an increase in the IJ approach in our postintervention period. We showed statistically significant long‐term reductions in both CVC‐associated and all‐cause IAP rates. From 2011 to 2014, there were only 5 cases of CVC‐associated IAP requiring chest tube placement. Post hoc analysis showed a statistically significant decrease in CLABSI rates (P<0.0001) from a preintervention rate of 1.6 infections per 1000 central line days to postintervention average rate of 0.68 infections per 1000 central line days. This decrease may be related to the incorporation of wide sterile barrier techniques in our CVC training workshops, checklists, and template procedure notes.
A strength of this study is the sustained significant long‐term reduction in IAP. There are few data that exist to describe sustained interventions in this area. Sustainability was achieved by integrating our interventions into ongoing programs that already existed in the hospital; we incorporated our simulation training into the existing new resident orientation, increased the availability of existing ultrasound equipment, and continued our IAP chart review through coding quality with feedback to involved services. The procedure note template continues to be easily available in our EMR, and the SC approach to CVC placement is limited to select cases.
Based on a post hoc cost‐benefit analysis, the financial benefits of decreasing the rate of IAP outweigh the costs associated with implementation of this initiative. The purchase cost for a Site‐Rite (Bard Access Systems) ultrasound machine was $18,000. The cost of materials for 1 workshop is $5000 annually. Cases from the Nationwide Inpatient Sample that were flagged by this PSI had 7.0% excess mortality, 4.4 days of excess hospitalization, and approximately $18,000 in excess hospital charges.[17, 18] Based on these data, if we had continued at our preintervention rate of CVC‐associated IAP requiring chest tube placement, we would estimate 9 additional CVC‐associated IAPs requiring chest tube insertion per year. This would result in over $180,000 of additional costs annually. Based on an initial cost of $100,000 for 4 workshops and the necessary equipment, we would have realized our cost savings in less than 1 year postintervention. These are all approximate costs, and further detailed analysis is needed.
One challenge with this intervention is the culture change away from using the SC approach, and the concern from trainees of how they would learn to perform SC CVC if needed. We would suggest dedicated SC CVC ultrasound training for those services who may need to use this approach (eg, neuroanesthesia and trauma).
Interpretation/Relation to Other Evidence
The field of implementation science can help explain why some projects are successful and others fail. We can further dissect the success of this project using an implementation science model similar to that described by French et al.[19] French et al. describe 4 behavior‐change techniques. These steps include (1) who needs to do what differently, (2) which barriers and enablers need to be addressed, (3) which intervention component could overcome the barriers and enhance enablers, and (4) how can behavior change be measured and understood. Barriers included suboptimal skills of residents, low awareness of evidence‐based guidelines, and entrenched practices inconsistent with best evidence. There was also a belief that IJ lines were more likely to become infected. Targeted behaviors needing to be done differently were the choice of CVC placement site and insertion technique. Barriers to change were assessed by asking members of the project team to explore with members of their service what led them to do CVC lines without ultrasound guidance. Enhancements focused on information provision, simulation practice, and persuasive communication. Behavior change was measured by tracking the number of IAPs, site of CVC, and documentation of technique. Continuation of these interventions based on this theoretical framework drove maintenance of gains.
We completed our main intervention planning in 90 days, and met our short‐term goal on schedule. The Institute for Healthcare Improvement (IHI) advocates that such short timelines are efficient mechanisms for developing and acting on projects. Other institutions have reported on similar rapid‐cycle planning and short‐term goal setting[20]
Limitations
Our study captures the experience of a quality‐improvement team at a single academic center, and our results may not be generalizable to other institutions. Our chart review process only occurred once a case had been identified through AHRQ PSI methodology. It is possible that the PSI does not capture all cases of IAP, although we believe our coding department has a very rigorous process to look for all IAP evidence in the patient's record. We used administrative data to determine the number of hospital‐wide CVC procedures.
Our compliance data with interventions from STRIDE are based on looking for key words in procedure note documentation (so undocumented notes are not captured). To validate this, we performed a manual audit of our adherence to our intervention in 2014, and those data are consistent with the results from our STRIDE data.
Our study's observational design also cannot control for exogenous effects on physician practice relating to CVC insertion or the overall risk of IAP. Some of our decrease in complications may be from the increase in PICC line use. Nevertheless, our CVC‐associated IAP rate has decreased despite >6000 non‐PICC CVCs in our ICU over the past 5 years, and a rising CMI (18% increase in postintervention period) and older population of patients with CVC insertion (P<0.0001)
CONCLUSIONS
We are the first, to our knowledge, to report a measurable improvement in reducing IAP patient outcomes that has been sustained for over 7 years. Our hospital is in the highest performance UHC quartile for all‐cause IAP in 2012 to 2014. A multidisciplinary quality‐improvement team, focused on evidence, patient safety, and standardization, can use a multifaceted intervention to sustainably improve patient outcomes. Promoting ultrasound‐guided IJ catheterization as the CVC insertion method of choice significantly reduced our hospital's rate of CVC‐associated IAP.
Acknowledgements
The authors acknowledge many who have contributed to this quality‐improvement project:
Irina Tokareva, Jay Lee, Kourt Bowes, and Gomathi Krishnan for data analysis; Laura Meinke for significant website curriculum; Fred Mihm, Sarah Williams, and John Kugler for leadership in ultrasound training; Kevin Tabb and Norm Rizk for hospital financial support of simulation workshops and ultrasound machines; Pooja Loftus and Helene Grossman for statistical analysis; Eric Hadhazy for data support; Joan Hendershott for cost information; Nancy Szaflarski for project management and manuscript review; and Isabella Chu for manuscript review.
Disclosures: STRIDE (Stanford Translational Research Integrated Database Environment) is a research and development project at Stanford University to create a standards‐based informatics platform supporting clinical and translational research. This STRIDE project was supported by the National Center for Research Resources and the National Center for Advancing Translational Sciences, National Institutes of Health, through grant UL1 RR025744. The content is solely the responsibility of the authors and does not necessarily represent the official views of the NIH. The authors report no conflicts of interest.
- , , . Significance of iatrogenic pneumothoraces. Chest. 1994;105(4):1147–1150.
- , , , , , . How to avoid and manage a pneumothorax. J Vasc Access. 2006;7(1):7–14.
- , , , . Iatrogenic pneumothorax: etiology, incidence and risk factors. Thorac Cardiovasc Surg. 2009;57(5):286–290.
- , , , et al. Real‐time ultrasound‐guided catheterisation of the internal jugular vein: a prospective comparison with the landmark technique in critical care patients. Crit Care. 2006;10(6):R162.
- , , . Safe placement of central venous catheters: a measured approach. J Intens Care Med. 2011;26(6):392–396.
- , , , . Reducing iatrogenic risk in thoracentesis: establishing best practice via experiential training in a zero‐risk environment. Chest. 2009;135(5):1315–1320.
- , , , , , . Use of simulation‐based education to improve outcomes of central venous catheterization: a systematic review and meta‐analysis. Acad Med. 2011;86(9):1137–1147.
- , , , , , . A prerotational, simulation‐based workshop improves the safety of central venous catheter insertion: results of a successful internal medicine house staff training program. Chest. 2011;140(3):652–658.
- , , , , . Linking residency training effectiveness to clinical outcomes: a quality improvement approach. Jt Comm J Qual Patient Saf. 2010;36(5):203–208.
- , , , et al. Education of physicians‐in‐training can decrease the risk for vascular catheter infection. Ann Intern Med. 2000;132(8):641–648.
- , , , et al. A multidisciplinary approach to reduce central line‐associated bloodstream infections. Jt Comm J Qual Patient Saf. 2013;39(2):61–69.
- , , , et al. Validity of selected Patient Safety Indicators: opportunities and concerns. J Am Coll Surg. 2011;212(6):924–934.
- , , , et al. Cases of iatrogenic pneumothorax can be identified from ICD‐9‐CM coded data. Am J Med Qual. 2010;25(3):218–224.
- , , , , ; SQUIRE development group. Publication guidelines for quality improvement studies in health care: evolution of the SQUIRE project. BMJ. 2009;338:a3152.
- . The Quality Toolbox. 2nd ed. Milwaukee, WI: ASQ Quality Press; 2005.
- , , , . STRIDE—an integrated standards‐based translational research informatics platform. AMIA Annu Symp Proc. 2009;2009:391–395.
- , , . Accidental iatrogenic pneumothorax in hospitalized patients. Med Care. 2006;44(2):182–186.
- , . Excess length of stay, charges, and mortality attributable to medical injuries during hospitalization. JAMA. 2003;290(14):1868–1874.
- , , , et al. Developing theory‐informed behaviour change interventions to implement evidence into practice: a systematic approach using the Theoretical Domains Framework. Implement Sci. 2012;7:38.
- , . Using rapid‐cycle quality improvement methodology to reduce feeding tubes in patients with advanced dementia: before and after study. BMJ. 2004;329(7464):491–494.
© 2015 Society of Hospital Medicine
