User login
Family Physicians’ Referral Decisions
OBJECTIVE: To examine family physicians’ referral decisions, which we conceptualized as having 2 phases: whether to refer followed by to whom to refer.
STUDY DESIGN: Prospective cohort study.
POPULATION: All visits (N = 34,519) and new referrals (N = 2534) occurring during 15 consecutive business days in the offices of 141 family physicians in 87 practices located in 31 states.
OUTCOMES MEASURED: Rates of referral, reasons for referral, practitioners referred to, health problems prompting referral, and reasons for selecting particular specialists.
RESULTS: Approximately 1 in 20 (5.1%) office visits led to referral. Although 68% of referrals were made by physicians during office visits, 18% were made by physicians during telephone conversations with patients, 11% by office staff with input from the physician, and 3% by staff without physician input. Physicians endorsed a mean of 1.8 reasons for making a referral. They sought specialists’ advice on either diagnosis or treatment for 52.1% of referrals and asked the specialist to direct medical management for 25.9% and surgical management for 37.8%. Patient request was one reason for 13.6% of referrals. Fifty conditions accounted for 76% of all referrals. Surgical specialists were sent the largest share of referrals (45.4%), followed by medical specialists (31.0%), nonphysician clinicians (12.1%), obstetrician–gynecologists (4.6%), mental health professionals (4.2%), other practitioners (2.0%), and generalists (0.8%). Physicians recommended a specific practitioner to the patient for most (86.2%) referrals. Personal knowledge of the specialist was the most important reason for selecting a specific specialist.
CONCLUSIONS: Referrals are commonly made during encounters other than office visits, such as telephone conversations or staff–patient interactions, in primary care practice. Training in the referral process should ensure that family physicians obtain the skills necessary to expand their scope of practice, when appropriate; determine when and why a patient should be referred; and identify the type of practitioner to whom the patient should be sent.
- Approximately one third of referrals are made during encounters other than office visits to physicians.
- The type of presenting problem is a powerful determinant of whether a patient is referred.
- Obtaining advice is by far the most common reason for referral.
- Family physicians choose a specific specialist for most of their patients and value personal knowledge of specialists over all other factors during this selection process.
Conventionally, primary care physicians decided when to refer and to whom a patient should be referred.1,2 Specialists’ assistance was sought for diagnostic or therapeutic dilemmas,3,4 management of conditions that presented too infrequently to maintain clinical competence,5 and specialized procedures that fell outside a physician’s scope of practice.3,4 In some cases, physicians referred because patients requested to see a specialist.1,4
The reorganization of health care over the past few decades has dramatically altered the interactions between primary care physicians and specialists. The growth in multispecialty group practice arrangements6 has led to formal, organizationally defined linkages between practitioners. Managed health plans and medical groups7 encourage primary care physicians’ control over the referral process through such mechanisms as specialty referral authorizations, financial disincentives for making a referral, performance assessment of referral patterns, and referral guidelines. These changes have transformed a once-informal process into one rife with administrative restrictions on referral decision making.
The Ambulatory Sentinel Practice Network (ASPN) Referral Study was designed to describe and analyze primary care physicians’ referral decisions and their outcomes in the context of a changing health care system in the United States. The study occurred in the ASPN and other regional practice-based research networks. This report examines primary care physicians’ referral decisions. We conceptualized the referral decision as occurring in 2 phases: whether to refer followed by to whom to refer.2
Methods
Physician sample
Physicians were recruited from March 1997 to May 1998. Recruitment activities were directed to all physician members of ASPN, physicians affiliated with the Medical Group Management Association, local and regional networks (Minnesota Academy of Family Physicians Research Network, the Wisconsin Research Network, the Dartmouth Primary Cooperative Research Network (COOP), and the larger community of primary care physicians. The study was publicized via direct mailings to physicians, articles and notices in practice-based research network newsletters and journals, and presentations at conferences. Contact with physicians expressing interest was made by telephone.
Physicians were included in the study if they practiced in the United States and were not in residency or fellowship training. Of all physicians contacted, 342 expressed interest in the study and 182 completed some aspect of data collection. A total of 141 family physicians, 12 internists, and 1 pediatrician completed all phases of data collection. In this study, the 141 family physicians (41% members of ASPN) formed the physician sample. They delivered health care in 87 practices located in 31 states.
Procedures
Study protocols and materials, based on a similar practice-based research study conducted with pediatricians, were reviewed and approved by the Committee on Human Research of the Johns Hopkins School of Public Health and the Colorado Multi-Institutional Review Board.4,8,9 We conducted a pilot test in 5 practices; this test led to further refinements of methods and questionnaires.
Data collection occurred from September 1997 to February 1999, with 94% of physicians collecting data in 1998 only. Before beginning data collection, physicians completed a questionnaire concerning their practices and personal characteristics. Each practice selected a coordinator who communicated with research staff, learned study protocols, trained office staff and physicians, and monitored data quality. Coordinators completed a questionnaire about the organizational and financial components of their practice. They kept a log of all visits made during 15 consecutive business days and occurring during regularly scheduled office hours. A business day was defined as a half or full work day, provided that the physician held routine office hours. Each patient’s date of birth (5% missing), sex (2% missing), and principal diagnosis (5% missing) were recorded.
The coordinator kept another log of all referrals made by physicians, nurses, and other office staff. Referrals made during telephone conversations with patients were included. A referral was defined as a recommendation that a patient have a face-to-face encounter with another practitioner. We excluded referrals made to laboratories, radiologic facilities, emergency departments, hospitals for inpatient admission, and “curbside consultations” (ie, when the referring physician obtains advice from a specialist but does not send the patient for a visit).
A medical record abstractor assigned ICD-9-CM codes to diagnoses provided by office staff. We matched ICD codes to an expanded set of diagnosis clusters (EDCs). EDCs group ICD codes into clinically homogeneous categories using the methods developed by Schneeweiss.10 (For more information on EDCs, see http://acg.jhsph.edu.)
When physicians made a referral, they completed a questionnaire (response rate 93.9%) with items concerning the referral decision. Reasons for referral were based on our previously developed taxonomy used in a pediatric referral study4 and focus groups of family physicians convened during an annual ASPN convocation.
At the study’s conclusion, physicians received a report that compared their referral practice patterns with those of the entire sample. To defray office expenses associated with data collection, each practice was given a $100 stipend in addition to $5 for each physician referral.
Generalizability analysis
We compared referral rates of the study sample with the National Ambulatory Medical Care Survey (NAMCS), a nationally representative sample of office visits made to family physicians.11,12 We pooled surveys from 1989 to 1994, inclusive, when the majority of the items in the survey instruments remained unchanged.13 (The 1995–1999 surveys did not contain information on whether the visit led to referral.)
We selected visits made by patients enrolled in non-HMO health plans (NAMCS) and health plans that had neither capitated primary care physician payment nor gatekeeping arrangements (study sample). This was done because of the known effect of managed care in general, and of gatekeeping specifically, on increasing referral rates8,13 and the unequal distribution of managed care plans between the 2 samples. Unweighted visits yielded a sample size of 37,145; of these, 11,676 met the selection criteria.
The proportions of office visits referred were compared overall and by age, sex, and health condition. The 10 most frequently referred conditions in the study sample were used for the condition-specific referral rate assessments. Statistical significance was assessed by the chi-square statistic.
Results
Descriptive information on the 141 family physician sample is presented in Table 1. Physicians spent an average of 51.3 hours per week in their jobs. About 68% of their time was devoted to direct patient care. In most practices, a staff member coordinated administrative aspects of specialty referrals; 20% permitted patients to request a referral by leaving a voice mail message.
TABLE 1
FAMILY PHYSICIAN STUDY SAMPLE
| Personal Characteristics (N = 141 physicians) | Mean or Percentage |
|---|---|
| Age, mean (SD) | 45.3 (7.2) |
| Years in primary care practice, mean (SD) | 14.0 (7.9) |
| % female | 21.3 |
| Hours/week spent in: | |
| Direct patient care, mean (SD) | 34.7 (16.2) |
| Administration, mean (SD) | 6.5 (5.7) |
| Academic medicine, mean (SD) | 3.0 (5.3) |
| Research, mean (SD) | 1.2 (3.2) |
| Medical education, mean (SD) | 5.9 (8.8) |
| General Practice Characteristics (N = 87 practices) | |
| Practice arrangement, % | |
| Solo practice | 27.6 |
| 2- or 3-physician practice | 13.8 |
| Family practice group (more than 3 physicians) | 33.3 |
| Multispecialty group | 16.1 |
| Community health center | 5.8 |
| Hospital-based practice or clinic | 3.4 |
| Practice ownership, % | |
| Hospital | 46.5 |
| Insurer | 5.8 |
| Another medical group | 4.6 |
| Subgroup of physicians in practice | 5.8 |
| All physicians in practice | 30.2 |
| Publicly owned clinic | 7.0 |
| Number of physician FTEs per practice, mean (SD) | 4.6 (5.9) |
| Staff: physician FTE ratio per practice, mean (SD) | 3.7 (2.4) |
| Practice Characteristics Related to Referrals (N = 87 Practices) | |
| Practice has an administrative referral coordinator, % | 60.0 |
| Personnel permitted to refer a patient, % | |
| Nurses with physician input | 85.9 |
| Nurses without physician input | 14.5 |
| Administrative staff with physician input | 67.4 |
| Administrative staff without physician input | 7.1 |
| Referrals are made during telephone conversations with patients, % | 90.8 |
| Practice allows patients to request a referral by leaving a recorded message, % | 19.5 |
| FTE denotes full-time equivalents; SD, standard deviation. | |
Frequency of referral
The 141 family physicians had 34,519 office visits and made 2165 referrals during 1771 practice-days; 5.1% of office visits were referred. Physicians saw an average of 19.7 patients per day (range 7.0 to 48.4) and made 1.23 referrals per full practice-day (range 0 to 3.90). Referrals made during telephone conversations with patients accounted for 18.9% of all referrals made by physicians (range 0% to 100% per physician).
An additional 369 referrals (a rate of 0.21 referrals per practice-day) were made by staff. Overall, 68% of all referrals were made by physicians during visits with patients, 18% by physicians during telephone conversations with patients, 11% by staff with physician input, and 3% by staff without physician input. In 43.6% of referrals made during telephone conversations with patients, the telephone encounter was the first presentation to medical care for the health problem.
We compared percentages of office visits in which a referral was made in the study sample with percentages of such referrals by family physicians from the NAMCS surveys (1989–1994). The overall percentages did not significantly differ between the 2 groups (4.0% vs 3.7%, P > .05). Although physicians in the study sample were statistically less likely than NAMCS counterparts to refer children (1.6% vs 2.5%, P = .030), more likely to refer the elderly (4.8% vs 4.1%, P = .045), and more likely to refer females (4.1% vs 3.9%, P = .009), these differences were small. There were no differences between the groups in condition-specific referral rates. In sum, these results show that patients in the ASPN sample were equally likely to be referred as those in the NAMCS sample.
Reasons for referral
Table 2 shows the distribution of physicians’ reasons for making the referral. Physicians endorsed a mean of 1.8 different reasons for making the typical referral. Although patients requested to see a specialist for 13.6% of referrals, physicians recorded patient request as the only reason for referral just 1.1%.
We compared referrals made for uncommon conditions (lowest tertile of practice-prevalence) with common conditions (highest practice-prevalence tertile). The calculation of practice-prevalence was based on prior research: the numerator was visits made for the index condition, and the denominator was all visits in the sample.5 Uncommon conditions were more likely to be referred for medical management (38.5% vs 25.4%, P < .001), patient request (19.8% vs 12.3%, P = .005), and specialist request (4.9% vs 2.1%, P = .021). Common conditions were more likely to be sent to specialists because of failed current therapy (13.6% vs 3.8%, P < .001) and endoscopy (4.3% vs 0.5%, P = .013). There were no significant differences between the 2 groups in the chances of referral for advice on either diagnosis or treatment.
TABLE 2
REASONS FOR REFERRAL
| Reason for Referral* | % of Referrals |
|---|---|
| Advice | |
| On both treatment and diagnosis | 40.3 |
| On treatment only | 7.7 |
| On diagnosis only | 3.5 |
| Specialized skill | |
| Direct surgical management | 37.8 |
| Direct medical management | 25.9 |
| Nonsurgical technical procedure or test | 11.7 |
| Multidisciplinary care | 10.6 |
| Mental health counseling | 3.5 |
| Endoscopy | 3.3 |
| Patient education | 1.0 |
| Patient or third-party request | |
| Patient reques | 13.6 |
| Specialist request | 2.6 |
| Administrative renewal | 2.0 |
| Insurance guidelines | 1.0 |
| Other reasons | |
| Failed current therapy | 10.9 |
| Medicolegal concerns | 2.9 |
| Time constraints | 1.6 |
| * Reasons for referral are not mutually exclusive. Physicians endorsed an average of 1.8 different reasons for making the referral. The sample size of 2022 referrals was smaller than the total number of referrals because of incomplete physician response and a few questionnaires with missing data for these items. | |
Conditions referred
Table 3 presents condition-specific referral rates and the 2 most common types of specialists referred to for the top 25 referred health problems. (A complete listing of these data for all conditions reported by study physicians can be found in Table W1.) The 50 most commonly referred health problems accounted for 76% of all referrals made during office visits. Signs or symptoms accounted for 22.4% of all referrals. Condition-specific referral rates varied from a low of 1.9% for patients with otitis media to a high of 45.7% of visits referred for patients with cholelithiasis or cholecystitis. This range in referral rates translates into 24-fold variation in the chances of referral during an office visit based solely on the presenting problem.
TABLE 3
NUMBER OF OFFICE VISITS, REFERRAL RATES, AND SPECIALISTS REFERRED TO FOR TOP 15 REFERRED CONDITIONS*
| Condition (No. of Referrals) | No. of Visits for Condition | Referral Rate(% visits referred) | Two Most Common Specialists (% referrals) |
|---|---|---|---|
| Benign and unspecified neoplasm (127) | 808 | 15.7 | General surgeon (32.3) |
| Dermatologist (22.8) | |||
| Musculoskeletal signs and symptoms (109) | 1077 | 10.1 | Orthopedic surgeon (58.7) |
| Podiatrist (10.1) | |||
| Low back pain (77) | 1149 | 6.7 | Physical therapist (33.8) |
| Orthopedic surgeon (19.5) | |||
| Diabetes mellitus (56) | 1654 | 3.4 | Ophthalmologist (48.2) |
| Nutritionist (16.1) | |||
| Depression, anxiety, neuroses (53) | 1472 | 3.6 | Psychologist (39.6) |
| Psychiatrist (26.4) | |||
| Bursitis, synovitis, tenosynovitis (44) | 422 | 10.4 | Orthopedic surgeon (50.0) |
| Hand surgeon (15.9) | |||
| Urinary symptoms (37) | 272 | 13.6 | Urologist (75.7) |
| Nephrologist (16.2) | |||
| External abdominal hernias (35) | 77 | 45.5 | General surgeon (100) |
| Peripheral neuropathy, neuritis (33) | 249 | 13.3 | Orthopedic surgeon (27.3) |
| Neurologist (21.2) | |||
| Gastrointestinal signs and symptoms (29) | 182 | 15.9 | Gastroenterologist (79.3) |
| General surgeon (10.3) | |||
| Deafness, hearing loss (27) | 75 | 36.0 | Audiologist (63.0) |
| Otolaryngologist (37.0) | |||
| Acute sprains and strains (27) | 641 | 4.2 | Physical therapist (44.4) |
| Orthopedic surgeon (33.3) | |||
| Joint disorders, trauma related (25) | 108 | 23.1 | Orthopedic surgeon (84.0) |
| Physical therapist (8.0) | |||
| Otitis media (23) | 1185 | 1.9 | Otolaryngologist (95.7) |
| Audiologist (4.4) | |||
| Abdominal pain (23) | 645 | 3.6 | Gastroenterologist (39.1) |
| General surgeon (39.1) | |||
| * A complete listing of these data for all conditions reported by study physicians can be found in Table W1. | |||
Specialist selection
Referrals were made most often to surgical subspecialists (45.4%), followed by medical subspecialists (31.0%), nonphysician clinicians (12.1%), obstetriciangynecologists (ob/gyns) (4.6%), mental health professionals (4.2%), other physicians (2.0%), and generalists (0.8%). The 5 most common specialists to whom patients were referred were orthopedic surgeons (12.1%), general surgeons (9.1%), otolaryngologists (6.9%), gastroenterologists (6.6%), and dermatologists (6.0%). Among male patients, referral to urologists was the second most common type; among female patients, referral to ob/gyns was the third most common type.
Mental health referrals were made predominantly to psychologists (2.1% of all referrals), followed by psychiatrists (1.3%) and social workers (0.4%). The most common types of nonphysician clinicians referred to were physical therapists (4.5%), podiatrists (3.0%), nutritionists (1.5%), and audiologists (1.2%).
Referring physicians recommended a specific specialist to the patient for 86.2% of referrals. In descending rank order according to the mean importance rating (range 1 to 3), the reasons for selecting a particular specialist were personal knowledge of the specialist (2.6), quality of prior feedback (2.5), technical capacity (2.3), appointment availability (2.0), patient’s request (1.6), requirements of patient’s health plan (1.6), and proximity of the specialist to the patient’s home (1.6).
Table 4 shows the 3 most common health problems referred to 10 types of specialists. (An expanded version of this table that includes 29 specialists can be found in Table W2.) The majority of referrals for each type of specialist were for 1 to 3 health problems. Family physicians made 17.1% of all referrals to practitioners within their practices. Intrapractice referrals were significantly higher than the overall average for audiologists (40.0%, P = .031), nutritionists (45.2%, P = .004), and psychologists (46.3%, P < .001) and were lower for gastroenterologists (9.3%, P = .022) and rheumatologists (4.0%, P = .005).
TABLE 4
THREE MOST COMMON CONDITIONS REFERRED TO SELECTED SPECIALISTS*
| Type of Specialist (Nos. of Referrals) | Referred Health Problem | No. (Cumulative %) |
|---|---|---|
| Cardiologist (n = 94) | Cardiac arrhythmia | 20 (21.3) |
| Chest pain | 17 (39.4) | |
| Ischemic heart disease | 16 (56.4) | |
| Dermatologist (n = 121) | Benign and unspecified neoplasms | 36 (29.8) |
| Dermatitis and eczema | 18 44.6) | |
| Acne 10 | (52.9) | |
| Gastroenterologist (n = 135) | Gastrointestinal signs and symptoms | 26 (19.3) |
| Gastroesophageal reflux | 16 (31.1) | |
| Abdominal pain | 15 (42.2) | |
| General surgeon (n = 185) | Benign and unspecified neoplasms | 52 (28.1) |
| External abdominal hernias | 36 (47.6) | |
| Cholelithiasis, cholecystitis | 23 (60.0) | |
| Ophthalmologist (n = 109) | Diabetes mellitus | 32 (29.4) |
| Ophthalmic signs and symptoms | 17 (45.0) | |
| Cataract, aphakia | 9 (53.2) | |
| Orthopedic surgeon (n = 247) | Musculoskeletal signs and symptoms | 78 (31.6) |
| Bursitis, synovitis, tenosynovitis | 26 (42.1) | |
| Fractures, excluding digits | 22 (51.0) | |
| Otolaryngologist (n = 141) | Otitis media | 27 (19.2) |
| Sinusitis | 13 (28.4) | |
| Deafness, hearing loss | 11 (36.2) | |
| Ob/gyn (n = 93) | Menstrual disorders | 17 (18.3) |
| Female genital symptoms | 10 (29.0) | |
| Uterovaginal prolapse | 9 (38.7) | |
| * An expanded version of this table that includes 29 specialists can be found in Table W1. | ||
Discussion
This study shows that family physicians manage 95% of office visits without specialty referral. About one third of referrals made from primary care practices occur during encounters other than office visits. Referrals made by staff or during telephone conversations may be part of an integrated sequence of contacts between patients and physicians. Nonetheless, assisting patients in selecting a specialist, transferring relevant patient information, and scheduling specialty appointments (referral coordination activities) are more difficult to perform when patients are not seen in the office,14 because time is limited and integrating care is poorly reimbursed, if at all. When such referral decisions are made appropriately, they provide an efficient mechanism for decreasing workload in a busy primary care practice. Inappropriately made, they can lead to increased expense, unnecessary time spent with specialists, and poorly coordinated care.
We found that the rates of referral were substantially different among the most commonly referred conditions. Prior work has shown that the frequency with which conditions present to primary care physicians explains about 75% of the variation in condition-specific referral rates.5 The mix and severity of comorbidities are important determinants of annual patient referral rates15,16 and the chances of referral during a visit.5 Thus, the epidemiology of morbidity among a patient population is a critical factor that defines the boundaries between primary care physicians and specialists. The appreciation of these clinical determinants is crucial for any valid assessment of primary care physicians’ referral patterns.
Limitations
The study’s focus was on new referral decisions made by physicians to other practitioners. No information is provided about ongoing, long-term referrals in which the patient was already under the care of a specialist. The low rates of referral for conditions such as diabetes may be a consequence of this limitation. Patients with diabetes may already have been under the care of a specialist, thereby generating few new referrals. It is also important to note that even in health plans with gatekeeping arrangements, patients self-refer to specialty care13; this study did not include any information on self-referral. Patient self-referral appears to be most likely among sick patients, those with established relationships with a specialist, and patients who do not have a good relationship with a primary care physician.17
We did not obtain information on the number of telephone calls fielded by physicians each day. Without these data, we were unable to determine whether our methods had failed to capture some telephone referrals or to calculate telephone referral rates. In this study, family physicians made 18.9% of all referrals during telephone conversations, in contrast with pediatricians in another study4 who made 27.5% of all referrals by telephone. The difference in these proportions is not large and is probably explained by pediatricians’ greater use of the telephone for patient care.
It could be argued that the volunteer physicians in this study systematically differ from the typical family physician. The average number of visits per day among study physicians (19.7) is similar to a national estimate of 19.9 visits/day for family physicians in single specialty group practices.18 Furthermore, we found similar probabilities of referral overall and for the 10 most commonly referred conditions between study physicians and a national sample, suggesting that referral propensities between the 2 groups were similar.
Why family physicians refer
No value judgments can be made about the appropriateness of physicians’ reasons for referral. Physicians most commonly referred because they were uncertain about diagnosis or treatment and sought advice from another practitioner. For about 1 in 5 referrals, physicians recorded only a sign or symptom as the diagnosis, suggesting a reasonably high level of diagnostic uncertainty. Physicians’ tolerance of uncertainty varies markedly,19 making it difficult to judge questions about appropriateness of referrals that are made to reduce this uncertainty.
Another important reason for referral was that physicians deemed the management of the health problem to be outside their scope of practice. Physicians were more likely to refer a patient with a common problem after trying out a course of treatment than was the case for uncommon problems that were more likely to be referred for medical management.
Patients may raise the topic of possible referral. When physicians agree that referral is indicated, they almost always find other reasons for making the referral. Alternatively, physicians might make a decision to refer and justify it in part as being a result of patient request. Discussions on whether a referral is needed are common in primary care. Among referrals made in an Israeli family practice network, patients raised the topic of possible referral in 27% of cases.20 In a study of 856 internal medicine visits, 45% of patients indicated some desire to discuss the need for referral with their physician; however, physicians recognized these desires only about half the time.21
Selecting a specialist
Our results show that primary care physicians prefer to send their patients to specialists with whom they have developed a relationship. Physicians in this study maintained a high level of involvement in specialist selection, providing patients with the name of a specific practitioner for 86.2% of referrals. The most important factor in selecting a specialist in our study was the same as that found nearly 20 years ago by Ludke1: personal knowledge of the specialist. Physicians’ dissatisfaction with the specialty referral process in managed care settings22,23 could be a result of their reduced choice of specialists with whom they have forged personal relationships.
Slightly more than 1 in 6 referrals were made to specialists in the referring physician’s practice, consistent with movement of primary care physicians into multispecialty groups. Whether intrapractice referral holds any advantage over referrals outside the practice, such as better coordination and appointment adherence, awaits future study.
Our results show that physicians must not only select a specific practitioner but also choose among different types of practitioners. Some patients were sent to nonphysician clinicians and physicians (eg, podiatrists and orthopedic surgeons for acquired foot deformity), whereas others were sent to medical or surgical subspecialists (eg, nephrologists and urologists for urinary tract symptoms). These patterns are likely to reflect the need for multidisciplinary specialty care for some conditions. For instance, patients with diabetes may see an ophthalmologist for retinopathy evaluations and an endocrinologist for medical management consultation. For some conditions, there appears to be considerable uncertainty regarding the boundaries between specialists.24 Should a patient with a skin mass be sent to a general surgeon, a dermatologist, or a plastic surgeon? When should a patient with allergic rhinitis be sent to an allergist and when to an otolaryngologist? These referral patterns may reflect local care practices and specialist availability. They may also be a consequence of a surplus of specialists in this country and competition for patients.
In a survey of family physicians that was performed in the late 1980s, respondents reported that they were more likely to refer to internal medicine subspecialists than internists for adults, but preferred general pediatricians over pediatric subspecialists.25 Our findings suggest that the trend for adult patients remains, but there has been a shift away from general pediatricians toward subspecialists for pediatric referrals. These new patterns may be a consequence of greater availability of pediatric subspecialists, greater exposure of family physicians to pediatric consultants, and a larger share of family physicians who have completed residency training.
Implications for physician training
Fifty conditions accounted for 76% of all specialty referrals made during office visits in this study. Interactions with most types of specialists are generally limited to a few conditions; 3 health problems accounted for more than half of referrals to most specialties. Educators should ensure that these commonly referred conditions are emphasized in curricula that provide family physicians with the skills necessary to expand their scope of practice, when appropriate; determine when a patient should be referred; and identify the type of practitioner to whom the patient should be sent.
Physicians in training should be taught the skills required to recognize the boundaries of their clinical uncertainty and scopes of practice. A challenge for educators is to assist trainees in determining when to tolerate clinical uncertainty while employing a watchful waiting approach and when to initiate a more aggressive evaluation, including when to obtain specialty referral. Modes of implementing these approaches are likely to differ across conditions. Thus, it makes sense in physician training to place the greatest emphasis on conditions for which family physicians commonly refer.
Under certain circumstances, patient request for a specialty consultation may be a sufficient and legitimate reason for referral. For example, as we found in this study, patients with uncommon health problems may seek reassurance from specialists skilled in the management of their specific condition. Managing access to specialists, particularly when the physician is acting as an administrative gatekeeper to referrals, can be challenging.21 When doctors and patients disagree on the need for referral, patients may become dissatisfied with their health care26 and decide to self-refer to specialty care.17 In consideration of the increasing complexity of medical care, developing skills that help physicians discuss and negotiate access to specialized services with both patients and specialists has never been more timely.
Acknowledgments
This study was funded by grant no. R01 HS09377 from the Agency for Healthcare Research and Quality. James Werner and Laurie Vorel provided technical assistance with data collection and project implementation. Many physicians collected data for this study. Their time and devotion were invaluable to the success of this study. These physicians are listed by the states in which they practice. Arizona: Scott Ekdahl, DO; Arkansas: John Scott, MD; California: Andrew Ness, MD; Colorado: Howard Corren, MD; Nell Davis, MD; Timothy Dudley, MD; Audrey Farley, MD; Tillman Farley, MD; Charles Kay, MD; Joan FAMILY PHYSICIANS’ REFERRAL DECISIONS MacEachen, MD; George Maxted, MD; John Miller, MD; Kathy Miller, MD; Steven Milligan, MD; Frank Reed, MD; Louise Schottsteadt, MD; Lynne Spicer, MD; Laura Stein, MD; Lynn Strange, MD; Dan Sullivan, MD; Georgia: Linda Casteel, MD; Randy Cronic, MD; Bruno Denis, MD; Keith Ellis, MD; Kelly Erola, MD; Craig Fabel, MD; Russell Leubbert, DO; Richard Liotta, DO; Mark Majoch, MD; David Najjar, MD; James Snow, DO; Roslyn Taylor, MD; Illinois: Steven Lidvall, MD; Anna Meenan, MD; Eduardo Scholcoff, MD; Loyd Wollstadt, MD; Indiana: Paul Daluga, MD; Steven Phillipson, MD; Iowa: Ken Miller, MD; Janet Ryan, MD; Kansas: Wendell Ellis, DO; John R. Eplee, MD; Robert Moser, MD; Daniel Sontheimer, MD; Louisiana: Linda Stewart, MD; Michigan: Linda French, MD; John Hickner, MD; Minnesota: Ravi Balasubraman, MD; Dave Bucher, MD; William Davis, MD; Richard Gebhart, MD; Katie Guthrie, MD; Anthony Jaspers, MD; Timothy Komoto, MD; Glenn McCarty, DO; Stephen Mitrione, MD; Thomas Retzinger, MD; Paul Spilseth, MD; Ashlesha Tamboli, MD; Montana: Curt Kurtz, MD; Nevada: Coleen Lyons, MD; New Hampshire: Richard Douglass, MD; Paul Friedrichs, MD; Peter Hope, MD; Jonathan Mishcon, MD; New Jersey: John Orzano, MD; Winifred Waldron, MD; New York: Carmella Abraham, MD; R. Eugene Bailey, MD; Lorne Becker, MD; John DeSimone, MD; Miguel Diaz, MD; Rebecca Elliott, MD; John Glennon, MD; James Greenwald, MD; Glenn Griffin, MD; Eileen Hoffman, MD; L. Thomas Wolff, MD; North Carolina: Ed Bujold, MD; Thomas Detesco, MD; Dave Rogers, MD; Phil Sherrod, MD; Oklahoma: Laura Miller, DO; Mike Pontious, MD; Oregon: Douglas Eliason, DO; L.J. Fagnan, MD; Jerry Flaming, DO; Tom Flaming, DO; Jeffrey Humphrey, DO; Michael Kelber, MD; John Sattenspiel, MD; Pennsylvania: John Farmer, DO; Penitha Williams, MD; South Dakota: Fred Thanel, MD; Tennessee: Dan Brewer, MD; Michael Hartsell, MD; R. Louis Murphy, MD; John Parham, MD; Texas: Michael Averitt, DO; Sharon Barber, MD; Kim Patrick Bolton, MD; Robert Cortes, MD; Paul Gerdes, MD; Robert Henry, DO; Michael Kirkpatrick, MD; John Manning, MD; Shane Maxwell, MD; Luis Moreno, MD; Larry G. Padget, MD; Peter Sullivan, MD; Utah: Scott Endsley, MD; David Flinders, MD; Jim Giovino, MD; Eric Hogenson, MD; Dwayne Roberts, MD; Virginia: Duane Lawrence, MD; James Ledwith, MD; June Tunstall, MD; George Wortley, MD; Washington: John Anderson, MD; Elizabeth Wise, MD; West Virginia: Dan Doyle, MD; J. Michael Herr, DO; Wisconsin: Richard Anstett, MD, PhD; Walter Boisvert, MD; Lea Cornell, MD; Anne Eglash, MD; Rod Erickson, MD; Tom Frisby, MD; Terry Hankey, MD; Kevin Jessen, MD; Dan Landdeck, MD; Dave Lonsdorf, MD; Michael Pace, MD; Michael Saunders, MD; Catherine Soderqueist, MD; Jon Temte, MD; Vince Winklerprins, MD; Brian Woody, MD.
1. Ludke RL. An examination of the factors that influence patient referral decisions. Med Care 1982;20:782-96.
2. Schaffer WA, Holloman FC. Consultation and referral between physicians in the new medical practice environments. Ann Intern Med 1985;103:600-5.
3. Williams TF, White KL, Andrews LP, et al. Patient referral to a university clinic: patterns in a rural state. Am J Public Health 1960;50:1493-507.
4. Forrest CB, Glade GB, Baker A, Bocian A, Kang M, Starfield B. The pediatric primary–specialty care interface: how pediatricians refer children and adolescents to specialty care. Arch Pediatr Adolesc Med 1999;153:705-14.
5. Forrest CB, Reid RJ. Prevalence of health problems and primary care physicians’ specialty referral decisions. J Fam Pract 2001;50:427-32.
6. See http://www.managedcaredigest.com/edigest/tr2000/tr2000c5s01g01.html. Accessed May 9, 2001.
7. Landon BE, Wilson IB, Cleary PD. A conceptual model of the effects of health care organizations on the quality of medical care. JAMA 1998;279:1377-82.
8. Forrest CB, Glade GB, Starfield B, Baker A, Kang M, Reid RJ. Gatekeeping and referral of children and adolescents to specialty care. Pediatrics 1999;104:28-34.
9. Forrest CB, Glade GB, Baker AE, Bocian A, von Schrader S, Starfield B. Coordination of specialty referrals and physician satisfaction with referral care. Arch Pediatr Adolesc Med 2000;154:499-506.
10. Schneeweiss R, Rosenblatt RA, Cherkin DC, Kirdwood CR, Hart G. Diagnosis clusters: a new tool for analyzing the content of ambulatory medical care. Med Care. 1983;21:105-22.
11. Tenny JB, White KL, Williamson JW. National Ambulatory Medical Care Survey: background and methodology: United States, 1967–1972. Vital Health Stat 2. 1974; No 61.
12. Schappert SM. National Ambulatory Medical Care Survey: 1994 summary. Advance data from vital and health statistics; no. 273. Hyattsville, Md: National Center for Health Statistics; 1996.
13. Forrest CB, Reid R. Passing the baton: HMOs’ influence on referrals to specialty care. Health Aff (Millwood) 1997;16(6):157-62.
14. Glade GB, Forrest CB, Starfield B, Baker AE, Bocian A, Wasserman RC. Specialty referrals made during telephone conversations with parents. Amb Pediatrics. In press.
15. Salem-Schatz S, Morre G, Rucker M, Pearson SD. The case for case-mix adjustment in practice profiling: when good apples look bad. JAMA 1994;272:871-4.
16. Shea D, Stuart B, Vasey J, Nag S. Medicare physician referral patterns. Health Serv Res 1999;34:331-48.
17. Forrest CB, Weiner JP, Fowles J, et al. Self-referral in point-of-service plans. JAMA 2001;285:2223-31.
18. Aventis Pharmaceuticals Medical Group Practice Digest. Managed Care Digest Series 2000. Parsippany, NJ: Aventis Pharmaceuticals; 2000.
19. Gerrity MS, DeVallis RF, Earp JL. Physicians’ reactions to uncertainty in patient care: a new measure and new insights. Med Care 1990;28:724-36.
20. Tabenkin H, Oren B, Steinmetz D, Tamir A, Kitai E. Referrals of patients by family practitioners to consultants: a survey of the Israeli Family Practice Research Network. Fam Pract 1998;15:158-64.
21. Albertson GA, Lin CG, Kutner J, Schilling LM, Anderson SN, Anderson RJ. Recognition of patient referral desires in an academic managed care plan: frequency, determinants, and outcomes. J Gen Intern Med 2000;15:242-7.
22. Halm EA, Causino N, Blumenthal D. Is gatekeeping better than traditional care? A survey of physicians’ attitudes. JAMA 1997;278:1677-81.
23. Kerr EA, Hays RD, Mittman BS, Siu AL, Leake B, Brook RH. Primary care physicians’ satisfaction with quality of care in California capitated medical groups. JAMA 1997;278:308-12.
24. Cuesta IA, Kerr K, Simpson P, Jarvis JN. Subspecialty referral for pauciarticular juvenile rheumatoid arthritis. Arch Pediatr Adolesc Med 2000;154:122-5.
25. Vogt HB, Amundson LH. Family physician consultation/referral patterns. J Am Board Fam Pract 1988;1:106-11.
26. Grumbach K, Selby JV, Damberg C, et al. Resolving the gatekeeper conundrum: what patients value in primary care and referrals to specialists. JAMA 1999;282:261-6.
OBJECTIVE: To examine family physicians’ referral decisions, which we conceptualized as having 2 phases: whether to refer followed by to whom to refer.
STUDY DESIGN: Prospective cohort study.
POPULATION: All visits (N = 34,519) and new referrals (N = 2534) occurring during 15 consecutive business days in the offices of 141 family physicians in 87 practices located in 31 states.
OUTCOMES MEASURED: Rates of referral, reasons for referral, practitioners referred to, health problems prompting referral, and reasons for selecting particular specialists.
RESULTS: Approximately 1 in 20 (5.1%) office visits led to referral. Although 68% of referrals were made by physicians during office visits, 18% were made by physicians during telephone conversations with patients, 11% by office staff with input from the physician, and 3% by staff without physician input. Physicians endorsed a mean of 1.8 reasons for making a referral. They sought specialists’ advice on either diagnosis or treatment for 52.1% of referrals and asked the specialist to direct medical management for 25.9% and surgical management for 37.8%. Patient request was one reason for 13.6% of referrals. Fifty conditions accounted for 76% of all referrals. Surgical specialists were sent the largest share of referrals (45.4%), followed by medical specialists (31.0%), nonphysician clinicians (12.1%), obstetrician–gynecologists (4.6%), mental health professionals (4.2%), other practitioners (2.0%), and generalists (0.8%). Physicians recommended a specific practitioner to the patient for most (86.2%) referrals. Personal knowledge of the specialist was the most important reason for selecting a specific specialist.
CONCLUSIONS: Referrals are commonly made during encounters other than office visits, such as telephone conversations or staff–patient interactions, in primary care practice. Training in the referral process should ensure that family physicians obtain the skills necessary to expand their scope of practice, when appropriate; determine when and why a patient should be referred; and identify the type of practitioner to whom the patient should be sent.
- Approximately one third of referrals are made during encounters other than office visits to physicians.
- The type of presenting problem is a powerful determinant of whether a patient is referred.
- Obtaining advice is by far the most common reason for referral.
- Family physicians choose a specific specialist for most of their patients and value personal knowledge of specialists over all other factors during this selection process.
Conventionally, primary care physicians decided when to refer and to whom a patient should be referred.1,2 Specialists’ assistance was sought for diagnostic or therapeutic dilemmas,3,4 management of conditions that presented too infrequently to maintain clinical competence,5 and specialized procedures that fell outside a physician’s scope of practice.3,4 In some cases, physicians referred because patients requested to see a specialist.1,4
The reorganization of health care over the past few decades has dramatically altered the interactions between primary care physicians and specialists. The growth in multispecialty group practice arrangements6 has led to formal, organizationally defined linkages between practitioners. Managed health plans and medical groups7 encourage primary care physicians’ control over the referral process through such mechanisms as specialty referral authorizations, financial disincentives for making a referral, performance assessment of referral patterns, and referral guidelines. These changes have transformed a once-informal process into one rife with administrative restrictions on referral decision making.
The Ambulatory Sentinel Practice Network (ASPN) Referral Study was designed to describe and analyze primary care physicians’ referral decisions and their outcomes in the context of a changing health care system in the United States. The study occurred in the ASPN and other regional practice-based research networks. This report examines primary care physicians’ referral decisions. We conceptualized the referral decision as occurring in 2 phases: whether to refer followed by to whom to refer.2
Methods
Physician sample
Physicians were recruited from March 1997 to May 1998. Recruitment activities were directed to all physician members of ASPN, physicians affiliated with the Medical Group Management Association, local and regional networks (Minnesota Academy of Family Physicians Research Network, the Wisconsin Research Network, the Dartmouth Primary Cooperative Research Network (COOP), and the larger community of primary care physicians. The study was publicized via direct mailings to physicians, articles and notices in practice-based research network newsletters and journals, and presentations at conferences. Contact with physicians expressing interest was made by telephone.
Physicians were included in the study if they practiced in the United States and were not in residency or fellowship training. Of all physicians contacted, 342 expressed interest in the study and 182 completed some aspect of data collection. A total of 141 family physicians, 12 internists, and 1 pediatrician completed all phases of data collection. In this study, the 141 family physicians (41% members of ASPN) formed the physician sample. They delivered health care in 87 practices located in 31 states.
Procedures
Study protocols and materials, based on a similar practice-based research study conducted with pediatricians, were reviewed and approved by the Committee on Human Research of the Johns Hopkins School of Public Health and the Colorado Multi-Institutional Review Board.4,8,9 We conducted a pilot test in 5 practices; this test led to further refinements of methods and questionnaires.
Data collection occurred from September 1997 to February 1999, with 94% of physicians collecting data in 1998 only. Before beginning data collection, physicians completed a questionnaire concerning their practices and personal characteristics. Each practice selected a coordinator who communicated with research staff, learned study protocols, trained office staff and physicians, and monitored data quality. Coordinators completed a questionnaire about the organizational and financial components of their practice. They kept a log of all visits made during 15 consecutive business days and occurring during regularly scheduled office hours. A business day was defined as a half or full work day, provided that the physician held routine office hours. Each patient’s date of birth (5% missing), sex (2% missing), and principal diagnosis (5% missing) were recorded.
The coordinator kept another log of all referrals made by physicians, nurses, and other office staff. Referrals made during telephone conversations with patients were included. A referral was defined as a recommendation that a patient have a face-to-face encounter with another practitioner. We excluded referrals made to laboratories, radiologic facilities, emergency departments, hospitals for inpatient admission, and “curbside consultations” (ie, when the referring physician obtains advice from a specialist but does not send the patient for a visit).
A medical record abstractor assigned ICD-9-CM codes to diagnoses provided by office staff. We matched ICD codes to an expanded set of diagnosis clusters (EDCs). EDCs group ICD codes into clinically homogeneous categories using the methods developed by Schneeweiss.10 (For more information on EDCs, see http://acg.jhsph.edu.)
When physicians made a referral, they completed a questionnaire (response rate 93.9%) with items concerning the referral decision. Reasons for referral were based on our previously developed taxonomy used in a pediatric referral study4 and focus groups of family physicians convened during an annual ASPN convocation.
At the study’s conclusion, physicians received a report that compared their referral practice patterns with those of the entire sample. To defray office expenses associated with data collection, each practice was given a $100 stipend in addition to $5 for each physician referral.
Generalizability analysis
We compared referral rates of the study sample with the National Ambulatory Medical Care Survey (NAMCS), a nationally representative sample of office visits made to family physicians.11,12 We pooled surveys from 1989 to 1994, inclusive, when the majority of the items in the survey instruments remained unchanged.13 (The 1995–1999 surveys did not contain information on whether the visit led to referral.)
We selected visits made by patients enrolled in non-HMO health plans (NAMCS) and health plans that had neither capitated primary care physician payment nor gatekeeping arrangements (study sample). This was done because of the known effect of managed care in general, and of gatekeeping specifically, on increasing referral rates8,13 and the unequal distribution of managed care plans between the 2 samples. Unweighted visits yielded a sample size of 37,145; of these, 11,676 met the selection criteria.
The proportions of office visits referred were compared overall and by age, sex, and health condition. The 10 most frequently referred conditions in the study sample were used for the condition-specific referral rate assessments. Statistical significance was assessed by the chi-square statistic.
Results
Descriptive information on the 141 family physician sample is presented in Table 1. Physicians spent an average of 51.3 hours per week in their jobs. About 68% of their time was devoted to direct patient care. In most practices, a staff member coordinated administrative aspects of specialty referrals; 20% permitted patients to request a referral by leaving a voice mail message.
TABLE 1
FAMILY PHYSICIAN STUDY SAMPLE
| Personal Characteristics (N = 141 physicians) | Mean or Percentage |
|---|---|
| Age, mean (SD) | 45.3 (7.2) |
| Years in primary care practice, mean (SD) | 14.0 (7.9) |
| % female | 21.3 |
| Hours/week spent in: | |
| Direct patient care, mean (SD) | 34.7 (16.2) |
| Administration, mean (SD) | 6.5 (5.7) |
| Academic medicine, mean (SD) | 3.0 (5.3) |
| Research, mean (SD) | 1.2 (3.2) |
| Medical education, mean (SD) | 5.9 (8.8) |
| General Practice Characteristics (N = 87 practices) | |
| Practice arrangement, % | |
| Solo practice | 27.6 |
| 2- or 3-physician practice | 13.8 |
| Family practice group (more than 3 physicians) | 33.3 |
| Multispecialty group | 16.1 |
| Community health center | 5.8 |
| Hospital-based practice or clinic | 3.4 |
| Practice ownership, % | |
| Hospital | 46.5 |
| Insurer | 5.8 |
| Another medical group | 4.6 |
| Subgroup of physicians in practice | 5.8 |
| All physicians in practice | 30.2 |
| Publicly owned clinic | 7.0 |
| Number of physician FTEs per practice, mean (SD) | 4.6 (5.9) |
| Staff: physician FTE ratio per practice, mean (SD) | 3.7 (2.4) |
| Practice Characteristics Related to Referrals (N = 87 Practices) | |
| Practice has an administrative referral coordinator, % | 60.0 |
| Personnel permitted to refer a patient, % | |
| Nurses with physician input | 85.9 |
| Nurses without physician input | 14.5 |
| Administrative staff with physician input | 67.4 |
| Administrative staff without physician input | 7.1 |
| Referrals are made during telephone conversations with patients, % | 90.8 |
| Practice allows patients to request a referral by leaving a recorded message, % | 19.5 |
| FTE denotes full-time equivalents; SD, standard deviation. | |
Frequency of referral
The 141 family physicians had 34,519 office visits and made 2165 referrals during 1771 practice-days; 5.1% of office visits were referred. Physicians saw an average of 19.7 patients per day (range 7.0 to 48.4) and made 1.23 referrals per full practice-day (range 0 to 3.90). Referrals made during telephone conversations with patients accounted for 18.9% of all referrals made by physicians (range 0% to 100% per physician).
An additional 369 referrals (a rate of 0.21 referrals per practice-day) were made by staff. Overall, 68% of all referrals were made by physicians during visits with patients, 18% by physicians during telephone conversations with patients, 11% by staff with physician input, and 3% by staff without physician input. In 43.6% of referrals made during telephone conversations with patients, the telephone encounter was the first presentation to medical care for the health problem.
We compared percentages of office visits in which a referral was made in the study sample with percentages of such referrals by family physicians from the NAMCS surveys (1989–1994). The overall percentages did not significantly differ between the 2 groups (4.0% vs 3.7%, P > .05). Although physicians in the study sample were statistically less likely than NAMCS counterparts to refer children (1.6% vs 2.5%, P = .030), more likely to refer the elderly (4.8% vs 4.1%, P = .045), and more likely to refer females (4.1% vs 3.9%, P = .009), these differences were small. There were no differences between the groups in condition-specific referral rates. In sum, these results show that patients in the ASPN sample were equally likely to be referred as those in the NAMCS sample.
Reasons for referral
Table 2 shows the distribution of physicians’ reasons for making the referral. Physicians endorsed a mean of 1.8 different reasons for making the typical referral. Although patients requested to see a specialist for 13.6% of referrals, physicians recorded patient request as the only reason for referral just 1.1%.
We compared referrals made for uncommon conditions (lowest tertile of practice-prevalence) with common conditions (highest practice-prevalence tertile). The calculation of practice-prevalence was based on prior research: the numerator was visits made for the index condition, and the denominator was all visits in the sample.5 Uncommon conditions were more likely to be referred for medical management (38.5% vs 25.4%, P < .001), patient request (19.8% vs 12.3%, P = .005), and specialist request (4.9% vs 2.1%, P = .021). Common conditions were more likely to be sent to specialists because of failed current therapy (13.6% vs 3.8%, P < .001) and endoscopy (4.3% vs 0.5%, P = .013). There were no significant differences between the 2 groups in the chances of referral for advice on either diagnosis or treatment.
TABLE 2
REASONS FOR REFERRAL
| Reason for Referral* | % of Referrals |
|---|---|
| Advice | |
| On both treatment and diagnosis | 40.3 |
| On treatment only | 7.7 |
| On diagnosis only | 3.5 |
| Specialized skill | |
| Direct surgical management | 37.8 |
| Direct medical management | 25.9 |
| Nonsurgical technical procedure or test | 11.7 |
| Multidisciplinary care | 10.6 |
| Mental health counseling | 3.5 |
| Endoscopy | 3.3 |
| Patient education | 1.0 |
| Patient or third-party request | |
| Patient reques | 13.6 |
| Specialist request | 2.6 |
| Administrative renewal | 2.0 |
| Insurance guidelines | 1.0 |
| Other reasons | |
| Failed current therapy | 10.9 |
| Medicolegal concerns | 2.9 |
| Time constraints | 1.6 |
| * Reasons for referral are not mutually exclusive. Physicians endorsed an average of 1.8 different reasons for making the referral. The sample size of 2022 referrals was smaller than the total number of referrals because of incomplete physician response and a few questionnaires with missing data for these items. | |
Conditions referred
Table 3 presents condition-specific referral rates and the 2 most common types of specialists referred to for the top 25 referred health problems. (A complete listing of these data for all conditions reported by study physicians can be found in Table W1.) The 50 most commonly referred health problems accounted for 76% of all referrals made during office visits. Signs or symptoms accounted for 22.4% of all referrals. Condition-specific referral rates varied from a low of 1.9% for patients with otitis media to a high of 45.7% of visits referred for patients with cholelithiasis or cholecystitis. This range in referral rates translates into 24-fold variation in the chances of referral during an office visit based solely on the presenting problem.
TABLE 3
NUMBER OF OFFICE VISITS, REFERRAL RATES, AND SPECIALISTS REFERRED TO FOR TOP 15 REFERRED CONDITIONS*
| Condition (No. of Referrals) | No. of Visits for Condition | Referral Rate(% visits referred) | Two Most Common Specialists (% referrals) |
|---|---|---|---|
| Benign and unspecified neoplasm (127) | 808 | 15.7 | General surgeon (32.3) |
| Dermatologist (22.8) | |||
| Musculoskeletal signs and symptoms (109) | 1077 | 10.1 | Orthopedic surgeon (58.7) |
| Podiatrist (10.1) | |||
| Low back pain (77) | 1149 | 6.7 | Physical therapist (33.8) |
| Orthopedic surgeon (19.5) | |||
| Diabetes mellitus (56) | 1654 | 3.4 | Ophthalmologist (48.2) |
| Nutritionist (16.1) | |||
| Depression, anxiety, neuroses (53) | 1472 | 3.6 | Psychologist (39.6) |
| Psychiatrist (26.4) | |||
| Bursitis, synovitis, tenosynovitis (44) | 422 | 10.4 | Orthopedic surgeon (50.0) |
| Hand surgeon (15.9) | |||
| Urinary symptoms (37) | 272 | 13.6 | Urologist (75.7) |
| Nephrologist (16.2) | |||
| External abdominal hernias (35) | 77 | 45.5 | General surgeon (100) |
| Peripheral neuropathy, neuritis (33) | 249 | 13.3 | Orthopedic surgeon (27.3) |
| Neurologist (21.2) | |||
| Gastrointestinal signs and symptoms (29) | 182 | 15.9 | Gastroenterologist (79.3) |
| General surgeon (10.3) | |||
| Deafness, hearing loss (27) | 75 | 36.0 | Audiologist (63.0) |
| Otolaryngologist (37.0) | |||
| Acute sprains and strains (27) | 641 | 4.2 | Physical therapist (44.4) |
| Orthopedic surgeon (33.3) | |||
| Joint disorders, trauma related (25) | 108 | 23.1 | Orthopedic surgeon (84.0) |
| Physical therapist (8.0) | |||
| Otitis media (23) | 1185 | 1.9 | Otolaryngologist (95.7) |
| Audiologist (4.4) | |||
| Abdominal pain (23) | 645 | 3.6 | Gastroenterologist (39.1) |
| General surgeon (39.1) | |||
| * A complete listing of these data for all conditions reported by study physicians can be found in Table W1. | |||
Specialist selection
Referrals were made most often to surgical subspecialists (45.4%), followed by medical subspecialists (31.0%), nonphysician clinicians (12.1%), obstetriciangynecologists (ob/gyns) (4.6%), mental health professionals (4.2%), other physicians (2.0%), and generalists (0.8%). The 5 most common specialists to whom patients were referred were orthopedic surgeons (12.1%), general surgeons (9.1%), otolaryngologists (6.9%), gastroenterologists (6.6%), and dermatologists (6.0%). Among male patients, referral to urologists was the second most common type; among female patients, referral to ob/gyns was the third most common type.
Mental health referrals were made predominantly to psychologists (2.1% of all referrals), followed by psychiatrists (1.3%) and social workers (0.4%). The most common types of nonphysician clinicians referred to were physical therapists (4.5%), podiatrists (3.0%), nutritionists (1.5%), and audiologists (1.2%).
Referring physicians recommended a specific specialist to the patient for 86.2% of referrals. In descending rank order according to the mean importance rating (range 1 to 3), the reasons for selecting a particular specialist were personal knowledge of the specialist (2.6), quality of prior feedback (2.5), technical capacity (2.3), appointment availability (2.0), patient’s request (1.6), requirements of patient’s health plan (1.6), and proximity of the specialist to the patient’s home (1.6).
Table 4 shows the 3 most common health problems referred to 10 types of specialists. (An expanded version of this table that includes 29 specialists can be found in Table W2.) The majority of referrals for each type of specialist were for 1 to 3 health problems. Family physicians made 17.1% of all referrals to practitioners within their practices. Intrapractice referrals were significantly higher than the overall average for audiologists (40.0%, P = .031), nutritionists (45.2%, P = .004), and psychologists (46.3%, P < .001) and were lower for gastroenterologists (9.3%, P = .022) and rheumatologists (4.0%, P = .005).
TABLE 4
THREE MOST COMMON CONDITIONS REFERRED TO SELECTED SPECIALISTS*
| Type of Specialist (Nos. of Referrals) | Referred Health Problem | No. (Cumulative %) |
|---|---|---|
| Cardiologist (n = 94) | Cardiac arrhythmia | 20 (21.3) |
| Chest pain | 17 (39.4) | |
| Ischemic heart disease | 16 (56.4) | |
| Dermatologist (n = 121) | Benign and unspecified neoplasms | 36 (29.8) |
| Dermatitis and eczema | 18 44.6) | |
| Acne 10 | (52.9) | |
| Gastroenterologist (n = 135) | Gastrointestinal signs and symptoms | 26 (19.3) |
| Gastroesophageal reflux | 16 (31.1) | |
| Abdominal pain | 15 (42.2) | |
| General surgeon (n = 185) | Benign and unspecified neoplasms | 52 (28.1) |
| External abdominal hernias | 36 (47.6) | |
| Cholelithiasis, cholecystitis | 23 (60.0) | |
| Ophthalmologist (n = 109) | Diabetes mellitus | 32 (29.4) |
| Ophthalmic signs and symptoms | 17 (45.0) | |
| Cataract, aphakia | 9 (53.2) | |
| Orthopedic surgeon (n = 247) | Musculoskeletal signs and symptoms | 78 (31.6) |
| Bursitis, synovitis, tenosynovitis | 26 (42.1) | |
| Fractures, excluding digits | 22 (51.0) | |
| Otolaryngologist (n = 141) | Otitis media | 27 (19.2) |
| Sinusitis | 13 (28.4) | |
| Deafness, hearing loss | 11 (36.2) | |
| Ob/gyn (n = 93) | Menstrual disorders | 17 (18.3) |
| Female genital symptoms | 10 (29.0) | |
| Uterovaginal prolapse | 9 (38.7) | |
| * An expanded version of this table that includes 29 specialists can be found in Table W1. | ||
Discussion
This study shows that family physicians manage 95% of office visits without specialty referral. About one third of referrals made from primary care practices occur during encounters other than office visits. Referrals made by staff or during telephone conversations may be part of an integrated sequence of contacts between patients and physicians. Nonetheless, assisting patients in selecting a specialist, transferring relevant patient information, and scheduling specialty appointments (referral coordination activities) are more difficult to perform when patients are not seen in the office,14 because time is limited and integrating care is poorly reimbursed, if at all. When such referral decisions are made appropriately, they provide an efficient mechanism for decreasing workload in a busy primary care practice. Inappropriately made, they can lead to increased expense, unnecessary time spent with specialists, and poorly coordinated care.
We found that the rates of referral were substantially different among the most commonly referred conditions. Prior work has shown that the frequency with which conditions present to primary care physicians explains about 75% of the variation in condition-specific referral rates.5 The mix and severity of comorbidities are important determinants of annual patient referral rates15,16 and the chances of referral during a visit.5 Thus, the epidemiology of morbidity among a patient population is a critical factor that defines the boundaries between primary care physicians and specialists. The appreciation of these clinical determinants is crucial for any valid assessment of primary care physicians’ referral patterns.
Limitations
The study’s focus was on new referral decisions made by physicians to other practitioners. No information is provided about ongoing, long-term referrals in which the patient was already under the care of a specialist. The low rates of referral for conditions such as diabetes may be a consequence of this limitation. Patients with diabetes may already have been under the care of a specialist, thereby generating few new referrals. It is also important to note that even in health plans with gatekeeping arrangements, patients self-refer to specialty care13; this study did not include any information on self-referral. Patient self-referral appears to be most likely among sick patients, those with established relationships with a specialist, and patients who do not have a good relationship with a primary care physician.17
We did not obtain information on the number of telephone calls fielded by physicians each day. Without these data, we were unable to determine whether our methods had failed to capture some telephone referrals or to calculate telephone referral rates. In this study, family physicians made 18.9% of all referrals during telephone conversations, in contrast with pediatricians in another study4 who made 27.5% of all referrals by telephone. The difference in these proportions is not large and is probably explained by pediatricians’ greater use of the telephone for patient care.
It could be argued that the volunteer physicians in this study systematically differ from the typical family physician. The average number of visits per day among study physicians (19.7) is similar to a national estimate of 19.9 visits/day for family physicians in single specialty group practices.18 Furthermore, we found similar probabilities of referral overall and for the 10 most commonly referred conditions between study physicians and a national sample, suggesting that referral propensities between the 2 groups were similar.
Why family physicians refer
No value judgments can be made about the appropriateness of physicians’ reasons for referral. Physicians most commonly referred because they were uncertain about diagnosis or treatment and sought advice from another practitioner. For about 1 in 5 referrals, physicians recorded only a sign or symptom as the diagnosis, suggesting a reasonably high level of diagnostic uncertainty. Physicians’ tolerance of uncertainty varies markedly,19 making it difficult to judge questions about appropriateness of referrals that are made to reduce this uncertainty.
Another important reason for referral was that physicians deemed the management of the health problem to be outside their scope of practice. Physicians were more likely to refer a patient with a common problem after trying out a course of treatment than was the case for uncommon problems that were more likely to be referred for medical management.
Patients may raise the topic of possible referral. When physicians agree that referral is indicated, they almost always find other reasons for making the referral. Alternatively, physicians might make a decision to refer and justify it in part as being a result of patient request. Discussions on whether a referral is needed are common in primary care. Among referrals made in an Israeli family practice network, patients raised the topic of possible referral in 27% of cases.20 In a study of 856 internal medicine visits, 45% of patients indicated some desire to discuss the need for referral with their physician; however, physicians recognized these desires only about half the time.21
Selecting a specialist
Our results show that primary care physicians prefer to send their patients to specialists with whom they have developed a relationship. Physicians in this study maintained a high level of involvement in specialist selection, providing patients with the name of a specific practitioner for 86.2% of referrals. The most important factor in selecting a specialist in our study was the same as that found nearly 20 years ago by Ludke1: personal knowledge of the specialist. Physicians’ dissatisfaction with the specialty referral process in managed care settings22,23 could be a result of their reduced choice of specialists with whom they have forged personal relationships.
Slightly more than 1 in 6 referrals were made to specialists in the referring physician’s practice, consistent with movement of primary care physicians into multispecialty groups. Whether intrapractice referral holds any advantage over referrals outside the practice, such as better coordination and appointment adherence, awaits future study.
Our results show that physicians must not only select a specific practitioner but also choose among different types of practitioners. Some patients were sent to nonphysician clinicians and physicians (eg, podiatrists and orthopedic surgeons for acquired foot deformity), whereas others were sent to medical or surgical subspecialists (eg, nephrologists and urologists for urinary tract symptoms). These patterns are likely to reflect the need for multidisciplinary specialty care for some conditions. For instance, patients with diabetes may see an ophthalmologist for retinopathy evaluations and an endocrinologist for medical management consultation. For some conditions, there appears to be considerable uncertainty regarding the boundaries between specialists.24 Should a patient with a skin mass be sent to a general surgeon, a dermatologist, or a plastic surgeon? When should a patient with allergic rhinitis be sent to an allergist and when to an otolaryngologist? These referral patterns may reflect local care practices and specialist availability. They may also be a consequence of a surplus of specialists in this country and competition for patients.
In a survey of family physicians that was performed in the late 1980s, respondents reported that they were more likely to refer to internal medicine subspecialists than internists for adults, but preferred general pediatricians over pediatric subspecialists.25 Our findings suggest that the trend for adult patients remains, but there has been a shift away from general pediatricians toward subspecialists for pediatric referrals. These new patterns may be a consequence of greater availability of pediatric subspecialists, greater exposure of family physicians to pediatric consultants, and a larger share of family physicians who have completed residency training.
Implications for physician training
Fifty conditions accounted for 76% of all specialty referrals made during office visits in this study. Interactions with most types of specialists are generally limited to a few conditions; 3 health problems accounted for more than half of referrals to most specialties. Educators should ensure that these commonly referred conditions are emphasized in curricula that provide family physicians with the skills necessary to expand their scope of practice, when appropriate; determine when a patient should be referred; and identify the type of practitioner to whom the patient should be sent.
Physicians in training should be taught the skills required to recognize the boundaries of their clinical uncertainty and scopes of practice. A challenge for educators is to assist trainees in determining when to tolerate clinical uncertainty while employing a watchful waiting approach and when to initiate a more aggressive evaluation, including when to obtain specialty referral. Modes of implementing these approaches are likely to differ across conditions. Thus, it makes sense in physician training to place the greatest emphasis on conditions for which family physicians commonly refer.
Under certain circumstances, patient request for a specialty consultation may be a sufficient and legitimate reason for referral. For example, as we found in this study, patients with uncommon health problems may seek reassurance from specialists skilled in the management of their specific condition. Managing access to specialists, particularly when the physician is acting as an administrative gatekeeper to referrals, can be challenging.21 When doctors and patients disagree on the need for referral, patients may become dissatisfied with their health care26 and decide to self-refer to specialty care.17 In consideration of the increasing complexity of medical care, developing skills that help physicians discuss and negotiate access to specialized services with both patients and specialists has never been more timely.
Acknowledgments
This study was funded by grant no. R01 HS09377 from the Agency for Healthcare Research and Quality. James Werner and Laurie Vorel provided technical assistance with data collection and project implementation. Many physicians collected data for this study. Their time and devotion were invaluable to the success of this study. These physicians are listed by the states in which they practice. Arizona: Scott Ekdahl, DO; Arkansas: John Scott, MD; California: Andrew Ness, MD; Colorado: Howard Corren, MD; Nell Davis, MD; Timothy Dudley, MD; Audrey Farley, MD; Tillman Farley, MD; Charles Kay, MD; Joan FAMILY PHYSICIANS’ REFERRAL DECISIONS MacEachen, MD; George Maxted, MD; John Miller, MD; Kathy Miller, MD; Steven Milligan, MD; Frank Reed, MD; Louise Schottsteadt, MD; Lynne Spicer, MD; Laura Stein, MD; Lynn Strange, MD; Dan Sullivan, MD; Georgia: Linda Casteel, MD; Randy Cronic, MD; Bruno Denis, MD; Keith Ellis, MD; Kelly Erola, MD; Craig Fabel, MD; Russell Leubbert, DO; Richard Liotta, DO; Mark Majoch, MD; David Najjar, MD; James Snow, DO; Roslyn Taylor, MD; Illinois: Steven Lidvall, MD; Anna Meenan, MD; Eduardo Scholcoff, MD; Loyd Wollstadt, MD; Indiana: Paul Daluga, MD; Steven Phillipson, MD; Iowa: Ken Miller, MD; Janet Ryan, MD; Kansas: Wendell Ellis, DO; John R. Eplee, MD; Robert Moser, MD; Daniel Sontheimer, MD; Louisiana: Linda Stewart, MD; Michigan: Linda French, MD; John Hickner, MD; Minnesota: Ravi Balasubraman, MD; Dave Bucher, MD; William Davis, MD; Richard Gebhart, MD; Katie Guthrie, MD; Anthony Jaspers, MD; Timothy Komoto, MD; Glenn McCarty, DO; Stephen Mitrione, MD; Thomas Retzinger, MD; Paul Spilseth, MD; Ashlesha Tamboli, MD; Montana: Curt Kurtz, MD; Nevada: Coleen Lyons, MD; New Hampshire: Richard Douglass, MD; Paul Friedrichs, MD; Peter Hope, MD; Jonathan Mishcon, MD; New Jersey: John Orzano, MD; Winifred Waldron, MD; New York: Carmella Abraham, MD; R. Eugene Bailey, MD; Lorne Becker, MD; John DeSimone, MD; Miguel Diaz, MD; Rebecca Elliott, MD; John Glennon, MD; James Greenwald, MD; Glenn Griffin, MD; Eileen Hoffman, MD; L. Thomas Wolff, MD; North Carolina: Ed Bujold, MD; Thomas Detesco, MD; Dave Rogers, MD; Phil Sherrod, MD; Oklahoma: Laura Miller, DO; Mike Pontious, MD; Oregon: Douglas Eliason, DO; L.J. Fagnan, MD; Jerry Flaming, DO; Tom Flaming, DO; Jeffrey Humphrey, DO; Michael Kelber, MD; John Sattenspiel, MD; Pennsylvania: John Farmer, DO; Penitha Williams, MD; South Dakota: Fred Thanel, MD; Tennessee: Dan Brewer, MD; Michael Hartsell, MD; R. Louis Murphy, MD; John Parham, MD; Texas: Michael Averitt, DO; Sharon Barber, MD; Kim Patrick Bolton, MD; Robert Cortes, MD; Paul Gerdes, MD; Robert Henry, DO; Michael Kirkpatrick, MD; John Manning, MD; Shane Maxwell, MD; Luis Moreno, MD; Larry G. Padget, MD; Peter Sullivan, MD; Utah: Scott Endsley, MD; David Flinders, MD; Jim Giovino, MD; Eric Hogenson, MD; Dwayne Roberts, MD; Virginia: Duane Lawrence, MD; James Ledwith, MD; June Tunstall, MD; George Wortley, MD; Washington: John Anderson, MD; Elizabeth Wise, MD; West Virginia: Dan Doyle, MD; J. Michael Herr, DO; Wisconsin: Richard Anstett, MD, PhD; Walter Boisvert, MD; Lea Cornell, MD; Anne Eglash, MD; Rod Erickson, MD; Tom Frisby, MD; Terry Hankey, MD; Kevin Jessen, MD; Dan Landdeck, MD; Dave Lonsdorf, MD; Michael Pace, MD; Michael Saunders, MD; Catherine Soderqueist, MD; Jon Temte, MD; Vince Winklerprins, MD; Brian Woody, MD.
1. Ludke RL. An examination of the factors that influence patient referral decisions. Med Care 1982;20:782-96.
2. Schaffer WA, Holloman FC. Consultation and referral between physicians in the new medical practice environments. Ann Intern Med 1985;103:600-5.
3. Williams TF, White KL, Andrews LP, et al. Patient referral to a university clinic: patterns in a rural state. Am J Public Health 1960;50:1493-507.
4. Forrest CB, Glade GB, Baker A, Bocian A, Kang M, Starfield B. The pediatric primary–specialty care interface: how pediatricians refer children and adolescents to specialty care. Arch Pediatr Adolesc Med 1999;153:705-14.
5. Forrest CB, Reid RJ. Prevalence of health problems and primary care physicians’ specialty referral decisions. J Fam Pract 2001;50:427-32.
6. See http://www.managedcaredigest.com/edigest/tr2000/tr2000c5s01g01.html. Accessed May 9, 2001.
7. Landon BE, Wilson IB, Cleary PD. A conceptual model of the effects of health care organizations on the quality of medical care. JAMA 1998;279:1377-82.
8. Forrest CB, Glade GB, Starfield B, Baker A, Kang M, Reid RJ. Gatekeeping and referral of children and adolescents to specialty care. Pediatrics 1999;104:28-34.
9. Forrest CB, Glade GB, Baker AE, Bocian A, von Schrader S, Starfield B. Coordination of specialty referrals and physician satisfaction with referral care. Arch Pediatr Adolesc Med 2000;154:499-506.
10. Schneeweiss R, Rosenblatt RA, Cherkin DC, Kirdwood CR, Hart G. Diagnosis clusters: a new tool for analyzing the content of ambulatory medical care. Med Care. 1983;21:105-22.
11. Tenny JB, White KL, Williamson JW. National Ambulatory Medical Care Survey: background and methodology: United States, 1967–1972. Vital Health Stat 2. 1974; No 61.
12. Schappert SM. National Ambulatory Medical Care Survey: 1994 summary. Advance data from vital and health statistics; no. 273. Hyattsville, Md: National Center for Health Statistics; 1996.
13. Forrest CB, Reid R. Passing the baton: HMOs’ influence on referrals to specialty care. Health Aff (Millwood) 1997;16(6):157-62.
14. Glade GB, Forrest CB, Starfield B, Baker AE, Bocian A, Wasserman RC. Specialty referrals made during telephone conversations with parents. Amb Pediatrics. In press.
15. Salem-Schatz S, Morre G, Rucker M, Pearson SD. The case for case-mix adjustment in practice profiling: when good apples look bad. JAMA 1994;272:871-4.
16. Shea D, Stuart B, Vasey J, Nag S. Medicare physician referral patterns. Health Serv Res 1999;34:331-48.
17. Forrest CB, Weiner JP, Fowles J, et al. Self-referral in point-of-service plans. JAMA 2001;285:2223-31.
18. Aventis Pharmaceuticals Medical Group Practice Digest. Managed Care Digest Series 2000. Parsippany, NJ: Aventis Pharmaceuticals; 2000.
19. Gerrity MS, DeVallis RF, Earp JL. Physicians’ reactions to uncertainty in patient care: a new measure and new insights. Med Care 1990;28:724-36.
20. Tabenkin H, Oren B, Steinmetz D, Tamir A, Kitai E. Referrals of patients by family practitioners to consultants: a survey of the Israeli Family Practice Research Network. Fam Pract 1998;15:158-64.
21. Albertson GA, Lin CG, Kutner J, Schilling LM, Anderson SN, Anderson RJ. Recognition of patient referral desires in an academic managed care plan: frequency, determinants, and outcomes. J Gen Intern Med 2000;15:242-7.
22. Halm EA, Causino N, Blumenthal D. Is gatekeeping better than traditional care? A survey of physicians’ attitudes. JAMA 1997;278:1677-81.
23. Kerr EA, Hays RD, Mittman BS, Siu AL, Leake B, Brook RH. Primary care physicians’ satisfaction with quality of care in California capitated medical groups. JAMA 1997;278:308-12.
24. Cuesta IA, Kerr K, Simpson P, Jarvis JN. Subspecialty referral for pauciarticular juvenile rheumatoid arthritis. Arch Pediatr Adolesc Med 2000;154:122-5.
25. Vogt HB, Amundson LH. Family physician consultation/referral patterns. J Am Board Fam Pract 1988;1:106-11.
26. Grumbach K, Selby JV, Damberg C, et al. Resolving the gatekeeper conundrum: what patients value in primary care and referrals to specialists. JAMA 1999;282:261-6.
Do Primary Care Physicians Underprescribe Antibiotics for Peptic Ulcer Disease?
OBJECTIVE: To determine how often primary care physicians prescribe eradication therapy for peptic ulcer disease (PUD) and nonulcer dyspepsia (NUD).
STUDY DESIGN: During a 2-year period (1998–2000) we analyzed data concerning patients with PUD or NUD seen by 80 Italian primary care physicians uniformly distributed throughout the country. We classified patients as having a definitive or presumptive diagnosis on the basis of the completeness of the diagnostic workup and interpreted the prescription of antibiotics for dyspepsia as evidence of attempted eradication of Helicobacter pylori.
POPULATION: Consecutive ambulatory patients.
OUTCOME MEASURED: The frequency with which predefined groups of patients received eradication therapy.
RESULTS: Of 6866 patients, 690 (10%) received eradication therapy. Of 2162 patients with PUD, 596 (27.6%) received eradication therapy; of 4704 patients with NUD, however, only 94 (2%) received this treatment (P = .0001). A total of 341 (37.7%) of 904 PUD patients with a definitive diagnosis were given eradication therapy and 255 (20.3%) of 1258 PUD patients with a presumptive diagnosis were given therapy (P < .0001). In NUD patients, 7 of 743 (0.9%) with a definitive diagnosis received eradication therapy, while 87 (2.2%) of 3961 of those with a presumptive diagnosis received the same therapy (P = 0.025).
CONCLUSIONS: While Italian primary care physicians appropriately target eradication therapy for H pylori infection in patients with peptic ulcer disease rather than nonulcer disease, the intervention was still underused in these patients. Improvements in this prescribing behavior are needed.
Data from the medical literature1-3 and from 2 ad hoc international consensus conferences4,5 suggest that antibiotic therapy aimed at eradication of Helicobacter pylori causes persistent healing of peptic ulcer and should therefore be the treatment of choice for patients with peptic ulcer disease (PUD). While administering eradication therapy to H pylori–positive patients with nonulcer dyspepsia (NUD) remains under debate,6,7 such therapy is generally not recommended.
How these findings are used in clinical practice is largely unknown. Two surveys have reported rates of eradication therapy given by primary care physicians (PCPs) of close to 90% in PUD patients and 50% in NUD patients.8,9 This information is strongly biased, however, in fact that it was derived from answers to specific questions asked by mail. Responses indicate treatment under ideal conditions rather than real ones. To our knowledge, no reliable analysis on this subject is available.
Our work evaluated the frequency with which eradication therapy was administered in Italy to dyspeptic patients with and without PUD from September 1998 to September 2000. We assessed whether the performance of a complete diagnostic workup affected the rate at which eradication therapy was prescribed. We also evaluated the combination therapies that physicians used.
Methods
The study population included 7336 patients with a PCP’s diagnosis of PUD or NUD from September 1998 to September 2000. A total of 470 (6.4%) of these patients were referred to a gastroenterologist and excluded, leaving a final study population of 6866 patients.
Selection of physicians and data collection
In 1994, software designed by a team of epidemiologists and computer experts from Tor Vergata University, Rome, Italy, was given to 19,000 Italian PCPs. The software was designed to help physicians collect data from their patients during each visit.10 Data on the number of visits to PCPs during 1993 were obtained. One year later, 2000 physicians agreed to compare the percentage of patients included in their database with the total number of visits and to return their accumulated databases for quality control.
Among the 371 physicians with a quality database of good quality (defined as including at least 95% of their patients in the database and declaring a similar number of patients as in the previous year, 1993), 120 agreed to participate in our study. New software was designed to gather data concerning the performance of eradication therapy for H pylori in the past, the requests and results of upper gastrointestinal endoscopy and abdominal sonography, and the prescribed treatment. The diagnosis was required in the database (ie, it was not possible to have access to subsequent fields in the absence of these data). Furthermore, the software was able to recognize the pharmacologic class of each drug from its generic name. Regarding antibiotic prescriptions for patients in whom a diagnosis of PUD or NUD had been made, the physician was asked if the treatment was intended for the diagnosed disease or for unrelated conditions.
From the start of the study, physicians were asked to include in the new database all patients coming to the office for an initial visit to evaluate dyspepsia of at least 3 months’ duration. If new data concerning diagnostic procedures or treatment emerged during subsequent visits, these were added to the database. It was possible for the PCP to change the diagnosis on the basis of new findings. The diagnosis made during the last visit was considered the final diagnosis.
Although participating PCPs knew they were involved in a study concerning their behavior in treating dyspepsia, they did not know the study’s goal: to determine the rate at which they had prescribed eradication therapy to dyspeptic patients. Physicians were given personal computers as an incentive to participate in the study.
All computers were linked to a central server, located in the epidemiology laboratory of Tor Vergata University of Rome, to which all data were transferred weekly. Each patient was identified by a code number assigned by the attending physician.
The physicians who agreed to participate in the study were stratified according to the following geographic criteria. Approximately one half were in the north of Italy and the other half were in the south. Within each of these areas, approximately one half of participating PCPs worked in cities with 100,000 inhabitants or fewer and the other half in towns with more than 100,000 inhabitants. Forty PCPs were randomly excluded from the study to avoid overrepresentation of certain areas of the country, particularly large cities. Therefore, the data in our study refer to a total of 80 PCPs. The age range of participating physicians was 32 years to 63 years; 61 were men; and all had been practicing PCPs for at least 5 years (range: 5 years to 36 years). Eight PCPs were specialists: 6 in internal medicine, 1 in gynecology, and 1 in rheumatology.
A definitive diagnosis of peptic ulcer was based on findings obtained by the reference standard examination (upper gastrointestinal endoscopy for the definitive diagnosis of PUD) or by a combination of findings (a definitive diagnosis of NUD required normal findings at upper gastrointestinal endoscopy and abdominal sonography). In the other cases, the diagnosis was considered presumptive.
Therapy
We considered the combination therapies most frequently evaluated in clinical trials: bismuth-based triple therapy (bismuth plus metronidazole and tetracycline; bismuth plus clarithromycin and tetracycline; bismuth plus clarithromycin and amoxicillin; bismuth plus metronidazole and amoxicillin11,12); proton pump inhibitor (PPI)–based triple therapy (PPI plus 2 of the following: amoxicillin, clarithromycin, or metronidazole13); PPI-based dual therapy (PPI plus amoxicillin or clarithromycin or metronidazole14); and others (none of the former).
Statistical analysis
The chi-squared test was used to compare the frequency of discrete variables. A P value of less than .05 was required for statistical significance. Statistical Package for the Social Sciences software was used for the evaluation of significance.
Results
PUD was diagnosed in 2162 patients (1412 men, average age = 45 ± 15.8 years). NUD was diagnosed in 4704 patients (1328 men, average age = 42 ± 13.2 years). Among the 2162 patients with PUD, eradication therapy was prescribed for 481. However, since 115 of the 2162 patients had received such therapy before entering the study, the total number of patients who received antibiotic therapy was 596 (27.6%). Other treatments (mostly H2-receptor antagonists or PPIs) were prescribed to the remaining 1566 patients with PUD.
Eradication therapy was given to 94 (2%) of 4704 patients diagnosed with NUD (17 patients had received treatment before 1998). Table 1 shows that eradication therapy was prescribed more frequently for patients with PUD than for those with NUD (27.6% vs 2%; P = .0001).
Among patients with PUD, eradication therapy was prescribed more frequently for those with a definitive diagnosis than for those with a presumptive diagnosis (37.7% vs 20.3%, respectively; P < .0001), but the reverse was observed in NUD patients (0.9% vs 2.2%; P = .025) (Table 2). The latter difference is of uncertain clinical significance.
Of 904 patients with a definitive diagnosis of PUD, 223 had a newly diagnosed peptic ulcer; 97 (43.5%) of these were treated with eradication therapy. We observed no change in the percentage of patients with PUD receiving eradication therapy during the study period: 220 of 1005 (22%) during the first year and 261 out of 1157 (22.6%) during the second year.
Of the 80 PCPs, 72 prescribed some kind of eradication therapy. Seven of the 8 physicians who had never prescribed eradication therapy were living in small towns in the south of Italy. Other characteristics of the nonprescribers, such as age and sex, were similar to those of the remaining physicians.
Of 690 patients who received eradication therapy, the type of combination was known for 558. The combination regimen used for the 132 patients treated before the study began was not available. Of 558 patients, 301 (54%) were given PPI-based dual therapy and 225 (40.3%) received PPI-based triple therapy. Other treatments were prescribed to 32 (5.7%) patients (Table 3).
Among patients in whom dual therapy was prescribed, PPI plus clarithromycin was used in 242 patients (43.4% of the total population of treated patients; 80.4% of the subgroup receiving dual therapy). The combination of PPI, clarithromycin, and metronidazole was the most widely used treatment in patients who received triple therapy: it was prescribed to 192 patients (34.4% of all treated patients; 85.3% of the subgroup given PPI-based triple therapy).
Most patients for whom other therapies were prescribed received bismuth-containing combinations. A combination of bismuth and PPI was prescribed to 10 patients (1.8% of the total population). The drug was added to PPI-based triple therapy in 10 patients (1.8% of the total population) and to PPI-based dual therapy in 2 patients (0.4% of the total population). The remaining 10 patients were treated as follows: a combination of 2 antibiotics without PPI (2 patients), H2-based triple therapy (6 patients), or antibiotic monotherapy (2 patients). None of these combinations is known to eradicate H pylori effectively.
TABLE 1
FREQUENCY OF ERADICATION THERAPY OF HELICOBACTER PYLORI
| Diagnosis | Eradication Therapy No. (%) | No Eradication Therapy No. (%) |
|---|---|---|
| Peptic ulcer disease (n = 2162) | 596* (27.6) | 1566 (72.4) |
| Nonulcer dyspepsia (n = 4704) | 94* (2) | 4610 (98) |
| * P = .0001. | ||
TABLE 2
FREQUENCY OF ATTEMPTED ERADICATION BY DEFINITIVE OR PRESUMPTIVE DIAGNOSIS
| Diagnosis | Attempted Eradication (%) | Other Therapies (%) |
|---|---|---|
| Peptic ulcer disease | ||
| Definitive (n = 904) | 341 (37.7)* | 563 (62.3) |
| Presumptive (n = 1258) | 255 (20.3)* | 1003 (79.7) |
| Nonulcer dyspepsia | ||
| Definitive (n = 743) | 7 (0.9) † | 736 (99.1) |
| Presumptive (n = 3761) | 87 (2.2) † | 3684 (97.8) |
| *P < .0001. | ||
| †P < .025. | ||
TABLE 3
ERADICATION REGIMENS USED BY ITALIAN PRIMARY CARE PHYSICIANS
| Eradication Regimen | Patients: No. (%) |
|---|---|
| Dual therapy | 301 (54) |
| PPI + C | 242 (43.4) |
| PPI + A | 42 (7.5) |
| PPI + M | 17 (3.1) |
| Triple Therapy | 225 (40.3) |
| PPI + C + M | 192 (34.4) |
| PPI + C + A | 10 (3.6) |
| PPI + A + M | 13 (2.3) |
| Other | 32 (5.7) |
| A denotes amoxicillin; C, clarithromycin; M, metronidazole; PPI, proton pump inhibitor. | |
Discussion
The data from our study indicate that from 1998 to 2000, the majority of patients with PUD seen by the PCPs participating in the study were not treated with antibiotic therapy aimed at the eradication of H pylori.
In our series, only approximately one third of patients with a definitive diagnosis of PUD were treated with antibiotic therapy, a figure much lower than the 90% reported in nationwide surveys during 1995 and 1996 in the United States and Germany.8,9 We believe that the most important factor underlying this difference may be the study design. Our study was based on the actual treatment given by the physicians to their patients; previous studies, however, were based on responses to a mailed questionnaire. While the previous studies may reflect ways in which PCPs would ideally treat their patients, some discrepancy is unavoidable when passing from theory to practice.
Other studies based on real-world prescription data had results similar to ours, despite having a small sample size15,16 or studying underserved populations.17,18 In light of these data, we suspect that the underuse of antibiotic therapy for PUD disease is common in many areas of the Western world.
Since PCPs were not required to include information on H pylori testing in the database, we did not have reliable data on the frequency of testing or on the relative frequency of positive and negative results. Therefore, it is possible that the low number of prescriptions of eradication therapy for patients with PUD was caused by a high rate of H pylori–negative peptic ulcer. This seems improbable, however, since a high rate of H pylori–positive peptic ulcers has been reported in Italian patients.19
One likely reason for the low prescription rate of eradication therapy by PCPs was concern about patient compliance and the side effects of antibiotics. Although a recent study reported discontinuation of therapy because of adverse events or noncompliance in less than 10% of patients,7 it is well known that data on compliance coming from research studies are not automatically transferable to clinical practice.20
Since eradication therapy was prescribed by the majority of PCPs involved in our study, our findings suggest that an awareness of new information does not necessarily effect changes in physicians’ prescribing patterns.21-23 Both knowledge-oriented strategies (ie, purely educational interventions) and behavior-oriented interventions (ie, strategies intended to alter behavior, usually by incentives and penalties) are necessary to change physicians’ prescribing patterns regarding PUD. Furthermore, change strategies should be matched to the type of clinician. Our data suggests that most PCPs involved in our study are pragmatists.24 These physicians will not change their behavior in a way that would increase their workload or conflict with patient expectations. Therefore, to increase the rate of prescriptions of eradication therapy for PUD, it is crucial to remove obstacles (eg, facilitate the performance of H pylori testing and endoscopy) and to focus educational interventions on practical issues (eg, place emphasis on the fact that prescribing eradication therapy to these patients may lead to a reduction of visits in the future).
The very low rate of eradication therapy (less than 3%) for patients with NUD in our study seems at odds with the high prevalence (more than 50%) of eradication therapy prescribed by US physicians for patients with NUD.9 The same factors explaining the different rates of eradication therapy for patients with PUD apply to differing rates in patients with NUD.
Interestingly, antibiotic therapy was prescribed at a significantly lower rate for NUD patients with a definitive diagnosis. This fact suggests that physicians did not expect important benefits from H pylori eradication in patients who did not have gastroduodenal lesions. Another important finding was that most treated patients received less than optimal treatment. The majority of patients receiving eradication therapy were given a regimen consisting of no more than 2 drugs although this regimen is less effective25 and less convenient from a cost–benefit perspective than is a 3-drug combination.26,27 Our findings are strikingly similar to those of a small study performed in Scotland28 that showed that more than 55% of patients receiving eradication therapy were treated with PPI-based dual therapy. These data suggest that PCPs are choosing their prescribing options in relation to short-term cost minimization rather than long-term cost effectiveness.
Generalizing our data to the entire Italian health care system may not be valid. Although much attention was paid to the reliability of collected data and to creating a wide geographic distribution of physicians involved in the study, stringent criteria were used for inclusion: ownership of a personal computer, capability of using fairly complex software, and willingness to participate. The majority of Italian PCPs do not share these characteristics. This hypothesis is demonstrated by the fact that only 80 physicians were selected from the initial pool of 19,000. There is no reason, however, to suggest that the above-mentioned characteristics interfere with changing clinicians’ practice patterns.
Conclusions
Our study shows that recommendations for eradication therapy for PUD did not translate into clinical practice in Italy until at least 2000. This means that Italian PCPs failed to reap the clinical and financial benefits resulting from this treatment. This finding, in conjunction with the administration of suboptimal eradication therapy to treated patients, indicates the need for both educational efforts and behavior-oriented interventions aimed at causing the prescribing patterns of eradication therapy of Italian PCPs to conform to the standard reported in the literature.
Acknowledgments
The authors are indebted to Paola Piccolo, MD, for her assistance in the preparation of this manuscript and for English language consultation.
1. Graham DY, Lew GM, Klein PD, et al. Effect of treatment of Helicobacter pylori infection on the long term recurrence of gastric or duodenal ulcer. A randomized, controlled study. Ann Intern Med 1992;116:705-8.
2. Penston JG. Review article: Helicobacter pylori eradication–understandable caution but no excuse for inertia. Aliment Pharmacol Ther 1994;8:369-89.
3. Hopkins RJ, Girardi LS, Turney EA. Relationship between Helicobacter pylori eradication and reduced duodenal and gastric ulcer recurrence: a review. Gastroenterology 1996;110:1244-52.
4. NIH consensus development panel. Helicobacter pylori in peptic ulcer disease. JAMA 1994;272:65-9.
5. The European Helicobacter pylori Study Group (EHPSG). Current European concepts in the management of Helicobacter pylori infection. The Maastricht Consensus Report. Gut 1997;41:8-13.
6. McColl K, Murray L, El-Omar E, et al. Symptomatic benefit from eradicating Helicobacter pylori infection in patients with nonulcer dyspepsia. N Engl J Med 1998;339:1869-74.
7. Blum AL, Talley NJ, O’Morain C, et al. For the Omeprazole Plus Clarithromycin and Amoxicillin Effect One Year After Treatment (OCAY) Study Group. Lack of effect of treating Helicobacter pylori in patients with nonulcer dyspepsia. N Engl J Med 1998;339:1875-81.
8. Breuer T, Sudhop T, Goodman KJ, Graham DY, Malferteiner P. How do practicing clinicians manage Helicobacter pylori–related gastrointestinal diseases in Germany? A survey of gastroenterologists and family practitioners. Helicobacter 1998;1:1-8.
9. Breuer T, Goodman KJ, Malaty HM, Dudhop T, Graham DY. How do clinicians practicing in the US manage Helicobacter pylori–related gastrointestinal diseases? A comparison of primary care and specialist physicians. Am J Gastroenterol 1998;93:553-61.
10. Mariotti S, Buonomo E, Lucchetti G, Palombi L, Panfilo M, Fusiello S. An experimental network of general practitioner for purpose of epidemiologic surveillance in Italy. Proc Intl MEDINFO Conference. Vancouver, BC, Canada. 1995;1553-4.
11. Graham DY, Lew GM, Malaty HM, et al. Factors influencing the eradication of Helicobacter pylori with triple therapy. Gastroenterology 1992;102:493-6.
12. Chiba N, Rao BV, Rademaker JW, Hunt RH. Meta-analysis of the efficacy of antibiotic therapy in eradicating Helicobacter pylori. Am J Gastroenterol 1992;87:1716-27.
13. Walsh JH, Peterson WL. The treatment of Helicobacter pylori infection in the management of peptic ulcer disease. N Engl J Med 1995;333:984-91.
14. Schwartz H, Krause R, Sahba B, et al. Triple versus dual therapy for eradicating Helicobacter pylori and preventing ulcer recurrence: a randomized, double blind, multicenter study of lansoprazole, clarithromycin, and/or amoxicillin in different dosing regimens. Am J Gastroenterol 1998;93:584-90.
15. Roll J, Weng A, Newman J. Diagnosis and treatment of Helicobacter pylori infection among California Medicare patients. Arch Intern Med 1997;157:994-8.
16. Bodger K, Daly MJ, Heatley RV. Prescribing patterns for dyspepsia in primary care:a prospective study of selected general practitioner. Aliment Pharmacol Ther 1996;10:889-95.
17. Thamer M, Ray Fox N, Henderson SC, Rinehart CS, Sherman CR, Ferguson JH. Influence of the NIH Consensus Conference on Helicobacter pylori on physicians prescribing among a medicaid population. Med Care 1998;36:646-60.
18. Hood HM, Wark C, Burgess PA, Nicewander D, Scott MW. Screening for Helicobacter pylori and nonsteroidal anti-inflammatory drug use in Medicare patients hospitalized with peptic ulcer disease. Arch Intern Med 1999;159:149-54.
19. Palli D, Vaira D, Menegatti M, Saieva C. On behalf of the Italian Helicobacter pylori study group. A serologic survey of Helicobacter pylori infection in 3281 Italian patients endoscoped for upper gastrointestinal symptoms. Aliment Pharmacol Ther 1997;11:719-28.
20. Fennerty MB. Cure of Helicobacter pylori clinically indicated and economically wise. Arch Intern Med 1995;155:1929-32.
21. Kosecoff J, Kanouse DE, Rogers WH, McCloskey L, Winslow CM, Brook RH. Effect of the National Institutes of Health consensus development program on physician practice. JAMA 1987;258:2708-13.
22. Wortman PM, Vinokur A, Sechrest L. Do consensus conferences work? A process evaluation of the NIH consensus development program. J Health Polit Policy Law 1988;13:469-72.
23. Lomas J. Words without action? The production, dissemination and impact of consensus recommendations. Ann Rev Public Health 1991;12:41-5.
24. Wyszewianski L, Green L. Strategies for changing clinicians’ practice patterns. J Fam Pract 2000;49:461-64.
25. Goodwin CS, Mendall MM, Northfield TC. Helicobacter pylori infection. Lancet 1997;349:265-69.
26. Taylor J, Zagari M, Murphy K, Freston J. Pharmacoeconomic comparison of treatments for the eradication of Helicobacter pylori. Arch Intern Med 1997;157:87-97.
27. Vakil N, Fennerty M. Cost-effectiveness of treatment regimens for H pylori infection based on a community practice effectiveness study. Gastroenterology 1997;112:A47. Abstract.-
28. Penston JG, Mistry KR. Eradication of Helicobacter pylori in general practice. Aliment Pharmacol Ther 1996;10:139-45.
OBJECTIVE: To determine how often primary care physicians prescribe eradication therapy for peptic ulcer disease (PUD) and nonulcer dyspepsia (NUD).
STUDY DESIGN: During a 2-year period (1998–2000) we analyzed data concerning patients with PUD or NUD seen by 80 Italian primary care physicians uniformly distributed throughout the country. We classified patients as having a definitive or presumptive diagnosis on the basis of the completeness of the diagnostic workup and interpreted the prescription of antibiotics for dyspepsia as evidence of attempted eradication of Helicobacter pylori.
POPULATION: Consecutive ambulatory patients.
OUTCOME MEASURED: The frequency with which predefined groups of patients received eradication therapy.
RESULTS: Of 6866 patients, 690 (10%) received eradication therapy. Of 2162 patients with PUD, 596 (27.6%) received eradication therapy; of 4704 patients with NUD, however, only 94 (2%) received this treatment (P = .0001). A total of 341 (37.7%) of 904 PUD patients with a definitive diagnosis were given eradication therapy and 255 (20.3%) of 1258 PUD patients with a presumptive diagnosis were given therapy (P < .0001). In NUD patients, 7 of 743 (0.9%) with a definitive diagnosis received eradication therapy, while 87 (2.2%) of 3961 of those with a presumptive diagnosis received the same therapy (P = 0.025).
CONCLUSIONS: While Italian primary care physicians appropriately target eradication therapy for H pylori infection in patients with peptic ulcer disease rather than nonulcer disease, the intervention was still underused in these patients. Improvements in this prescribing behavior are needed.
Data from the medical literature1-3 and from 2 ad hoc international consensus conferences4,5 suggest that antibiotic therapy aimed at eradication of Helicobacter pylori causes persistent healing of peptic ulcer and should therefore be the treatment of choice for patients with peptic ulcer disease (PUD). While administering eradication therapy to H pylori–positive patients with nonulcer dyspepsia (NUD) remains under debate,6,7 such therapy is generally not recommended.
How these findings are used in clinical practice is largely unknown. Two surveys have reported rates of eradication therapy given by primary care physicians (PCPs) of close to 90% in PUD patients and 50% in NUD patients.8,9 This information is strongly biased, however, in fact that it was derived from answers to specific questions asked by mail. Responses indicate treatment under ideal conditions rather than real ones. To our knowledge, no reliable analysis on this subject is available.
Our work evaluated the frequency with which eradication therapy was administered in Italy to dyspeptic patients with and without PUD from September 1998 to September 2000. We assessed whether the performance of a complete diagnostic workup affected the rate at which eradication therapy was prescribed. We also evaluated the combination therapies that physicians used.
Methods
The study population included 7336 patients with a PCP’s diagnosis of PUD or NUD from September 1998 to September 2000. A total of 470 (6.4%) of these patients were referred to a gastroenterologist and excluded, leaving a final study population of 6866 patients.
Selection of physicians and data collection
In 1994, software designed by a team of epidemiologists and computer experts from Tor Vergata University, Rome, Italy, was given to 19,000 Italian PCPs. The software was designed to help physicians collect data from their patients during each visit.10 Data on the number of visits to PCPs during 1993 were obtained. One year later, 2000 physicians agreed to compare the percentage of patients included in their database with the total number of visits and to return their accumulated databases for quality control.
Among the 371 physicians with a quality database of good quality (defined as including at least 95% of their patients in the database and declaring a similar number of patients as in the previous year, 1993), 120 agreed to participate in our study. New software was designed to gather data concerning the performance of eradication therapy for H pylori in the past, the requests and results of upper gastrointestinal endoscopy and abdominal sonography, and the prescribed treatment. The diagnosis was required in the database (ie, it was not possible to have access to subsequent fields in the absence of these data). Furthermore, the software was able to recognize the pharmacologic class of each drug from its generic name. Regarding antibiotic prescriptions for patients in whom a diagnosis of PUD or NUD had been made, the physician was asked if the treatment was intended for the diagnosed disease or for unrelated conditions.
From the start of the study, physicians were asked to include in the new database all patients coming to the office for an initial visit to evaluate dyspepsia of at least 3 months’ duration. If new data concerning diagnostic procedures or treatment emerged during subsequent visits, these were added to the database. It was possible for the PCP to change the diagnosis on the basis of new findings. The diagnosis made during the last visit was considered the final diagnosis.
Although participating PCPs knew they were involved in a study concerning their behavior in treating dyspepsia, they did not know the study’s goal: to determine the rate at which they had prescribed eradication therapy to dyspeptic patients. Physicians were given personal computers as an incentive to participate in the study.
All computers were linked to a central server, located in the epidemiology laboratory of Tor Vergata University of Rome, to which all data were transferred weekly. Each patient was identified by a code number assigned by the attending physician.
The physicians who agreed to participate in the study were stratified according to the following geographic criteria. Approximately one half were in the north of Italy and the other half were in the south. Within each of these areas, approximately one half of participating PCPs worked in cities with 100,000 inhabitants or fewer and the other half in towns with more than 100,000 inhabitants. Forty PCPs were randomly excluded from the study to avoid overrepresentation of certain areas of the country, particularly large cities. Therefore, the data in our study refer to a total of 80 PCPs. The age range of participating physicians was 32 years to 63 years; 61 were men; and all had been practicing PCPs for at least 5 years (range: 5 years to 36 years). Eight PCPs were specialists: 6 in internal medicine, 1 in gynecology, and 1 in rheumatology.
A definitive diagnosis of peptic ulcer was based on findings obtained by the reference standard examination (upper gastrointestinal endoscopy for the definitive diagnosis of PUD) or by a combination of findings (a definitive diagnosis of NUD required normal findings at upper gastrointestinal endoscopy and abdominal sonography). In the other cases, the diagnosis was considered presumptive.
Therapy
We considered the combination therapies most frequently evaluated in clinical trials: bismuth-based triple therapy (bismuth plus metronidazole and tetracycline; bismuth plus clarithromycin and tetracycline; bismuth plus clarithromycin and amoxicillin; bismuth plus metronidazole and amoxicillin11,12); proton pump inhibitor (PPI)–based triple therapy (PPI plus 2 of the following: amoxicillin, clarithromycin, or metronidazole13); PPI-based dual therapy (PPI plus amoxicillin or clarithromycin or metronidazole14); and others (none of the former).
Statistical analysis
The chi-squared test was used to compare the frequency of discrete variables. A P value of less than .05 was required for statistical significance. Statistical Package for the Social Sciences software was used for the evaluation of significance.
Results
PUD was diagnosed in 2162 patients (1412 men, average age = 45 ± 15.8 years). NUD was diagnosed in 4704 patients (1328 men, average age = 42 ± 13.2 years). Among the 2162 patients with PUD, eradication therapy was prescribed for 481. However, since 115 of the 2162 patients had received such therapy before entering the study, the total number of patients who received antibiotic therapy was 596 (27.6%). Other treatments (mostly H2-receptor antagonists or PPIs) were prescribed to the remaining 1566 patients with PUD.
Eradication therapy was given to 94 (2%) of 4704 patients diagnosed with NUD (17 patients had received treatment before 1998). Table 1 shows that eradication therapy was prescribed more frequently for patients with PUD than for those with NUD (27.6% vs 2%; P = .0001).
Among patients with PUD, eradication therapy was prescribed more frequently for those with a definitive diagnosis than for those with a presumptive diagnosis (37.7% vs 20.3%, respectively; P < .0001), but the reverse was observed in NUD patients (0.9% vs 2.2%; P = .025) (Table 2). The latter difference is of uncertain clinical significance.
Of 904 patients with a definitive diagnosis of PUD, 223 had a newly diagnosed peptic ulcer; 97 (43.5%) of these were treated with eradication therapy. We observed no change in the percentage of patients with PUD receiving eradication therapy during the study period: 220 of 1005 (22%) during the first year and 261 out of 1157 (22.6%) during the second year.
Of the 80 PCPs, 72 prescribed some kind of eradication therapy. Seven of the 8 physicians who had never prescribed eradication therapy were living in small towns in the south of Italy. Other characteristics of the nonprescribers, such as age and sex, were similar to those of the remaining physicians.
Of 690 patients who received eradication therapy, the type of combination was known for 558. The combination regimen used for the 132 patients treated before the study began was not available. Of 558 patients, 301 (54%) were given PPI-based dual therapy and 225 (40.3%) received PPI-based triple therapy. Other treatments were prescribed to 32 (5.7%) patients (Table 3).
Among patients in whom dual therapy was prescribed, PPI plus clarithromycin was used in 242 patients (43.4% of the total population of treated patients; 80.4% of the subgroup receiving dual therapy). The combination of PPI, clarithromycin, and metronidazole was the most widely used treatment in patients who received triple therapy: it was prescribed to 192 patients (34.4% of all treated patients; 85.3% of the subgroup given PPI-based triple therapy).
Most patients for whom other therapies were prescribed received bismuth-containing combinations. A combination of bismuth and PPI was prescribed to 10 patients (1.8% of the total population). The drug was added to PPI-based triple therapy in 10 patients (1.8% of the total population) and to PPI-based dual therapy in 2 patients (0.4% of the total population). The remaining 10 patients were treated as follows: a combination of 2 antibiotics without PPI (2 patients), H2-based triple therapy (6 patients), or antibiotic monotherapy (2 patients). None of these combinations is known to eradicate H pylori effectively.
TABLE 1
FREQUENCY OF ERADICATION THERAPY OF HELICOBACTER PYLORI
| Diagnosis | Eradication Therapy No. (%) | No Eradication Therapy No. (%) |
|---|---|---|
| Peptic ulcer disease (n = 2162) | 596* (27.6) | 1566 (72.4) |
| Nonulcer dyspepsia (n = 4704) | 94* (2) | 4610 (98) |
| * P = .0001. | ||
TABLE 2
FREQUENCY OF ATTEMPTED ERADICATION BY DEFINITIVE OR PRESUMPTIVE DIAGNOSIS
| Diagnosis | Attempted Eradication (%) | Other Therapies (%) |
|---|---|---|
| Peptic ulcer disease | ||
| Definitive (n = 904) | 341 (37.7)* | 563 (62.3) |
| Presumptive (n = 1258) | 255 (20.3)* | 1003 (79.7) |
| Nonulcer dyspepsia | ||
| Definitive (n = 743) | 7 (0.9) † | 736 (99.1) |
| Presumptive (n = 3761) | 87 (2.2) † | 3684 (97.8) |
| *P < .0001. | ||
| †P < .025. | ||
TABLE 3
ERADICATION REGIMENS USED BY ITALIAN PRIMARY CARE PHYSICIANS
| Eradication Regimen | Patients: No. (%) |
|---|---|
| Dual therapy | 301 (54) |
| PPI + C | 242 (43.4) |
| PPI + A | 42 (7.5) |
| PPI + M | 17 (3.1) |
| Triple Therapy | 225 (40.3) |
| PPI + C + M | 192 (34.4) |
| PPI + C + A | 10 (3.6) |
| PPI + A + M | 13 (2.3) |
| Other | 32 (5.7) |
| A denotes amoxicillin; C, clarithromycin; M, metronidazole; PPI, proton pump inhibitor. | |
Discussion
The data from our study indicate that from 1998 to 2000, the majority of patients with PUD seen by the PCPs participating in the study were not treated with antibiotic therapy aimed at the eradication of H pylori.
In our series, only approximately one third of patients with a definitive diagnosis of PUD were treated with antibiotic therapy, a figure much lower than the 90% reported in nationwide surveys during 1995 and 1996 in the United States and Germany.8,9 We believe that the most important factor underlying this difference may be the study design. Our study was based on the actual treatment given by the physicians to their patients; previous studies, however, were based on responses to a mailed questionnaire. While the previous studies may reflect ways in which PCPs would ideally treat their patients, some discrepancy is unavoidable when passing from theory to practice.
Other studies based on real-world prescription data had results similar to ours, despite having a small sample size15,16 or studying underserved populations.17,18 In light of these data, we suspect that the underuse of antibiotic therapy for PUD disease is common in many areas of the Western world.
Since PCPs were not required to include information on H pylori testing in the database, we did not have reliable data on the frequency of testing or on the relative frequency of positive and negative results. Therefore, it is possible that the low number of prescriptions of eradication therapy for patients with PUD was caused by a high rate of H pylori–negative peptic ulcer. This seems improbable, however, since a high rate of H pylori–positive peptic ulcers has been reported in Italian patients.19
One likely reason for the low prescription rate of eradication therapy by PCPs was concern about patient compliance and the side effects of antibiotics. Although a recent study reported discontinuation of therapy because of adverse events or noncompliance in less than 10% of patients,7 it is well known that data on compliance coming from research studies are not automatically transferable to clinical practice.20
Since eradication therapy was prescribed by the majority of PCPs involved in our study, our findings suggest that an awareness of new information does not necessarily effect changes in physicians’ prescribing patterns.21-23 Both knowledge-oriented strategies (ie, purely educational interventions) and behavior-oriented interventions (ie, strategies intended to alter behavior, usually by incentives and penalties) are necessary to change physicians’ prescribing patterns regarding PUD. Furthermore, change strategies should be matched to the type of clinician. Our data suggests that most PCPs involved in our study are pragmatists.24 These physicians will not change their behavior in a way that would increase their workload or conflict with patient expectations. Therefore, to increase the rate of prescriptions of eradication therapy for PUD, it is crucial to remove obstacles (eg, facilitate the performance of H pylori testing and endoscopy) and to focus educational interventions on practical issues (eg, place emphasis on the fact that prescribing eradication therapy to these patients may lead to a reduction of visits in the future).
The very low rate of eradication therapy (less than 3%) for patients with NUD in our study seems at odds with the high prevalence (more than 50%) of eradication therapy prescribed by US physicians for patients with NUD.9 The same factors explaining the different rates of eradication therapy for patients with PUD apply to differing rates in patients with NUD.
Interestingly, antibiotic therapy was prescribed at a significantly lower rate for NUD patients with a definitive diagnosis. This fact suggests that physicians did not expect important benefits from H pylori eradication in patients who did not have gastroduodenal lesions. Another important finding was that most treated patients received less than optimal treatment. The majority of patients receiving eradication therapy were given a regimen consisting of no more than 2 drugs although this regimen is less effective25 and less convenient from a cost–benefit perspective than is a 3-drug combination.26,27 Our findings are strikingly similar to those of a small study performed in Scotland28 that showed that more than 55% of patients receiving eradication therapy were treated with PPI-based dual therapy. These data suggest that PCPs are choosing their prescribing options in relation to short-term cost minimization rather than long-term cost effectiveness.
Generalizing our data to the entire Italian health care system may not be valid. Although much attention was paid to the reliability of collected data and to creating a wide geographic distribution of physicians involved in the study, stringent criteria were used for inclusion: ownership of a personal computer, capability of using fairly complex software, and willingness to participate. The majority of Italian PCPs do not share these characteristics. This hypothesis is demonstrated by the fact that only 80 physicians were selected from the initial pool of 19,000. There is no reason, however, to suggest that the above-mentioned characteristics interfere with changing clinicians’ practice patterns.
Conclusions
Our study shows that recommendations for eradication therapy for PUD did not translate into clinical practice in Italy until at least 2000. This means that Italian PCPs failed to reap the clinical and financial benefits resulting from this treatment. This finding, in conjunction with the administration of suboptimal eradication therapy to treated patients, indicates the need for both educational efforts and behavior-oriented interventions aimed at causing the prescribing patterns of eradication therapy of Italian PCPs to conform to the standard reported in the literature.
Acknowledgments
The authors are indebted to Paola Piccolo, MD, for her assistance in the preparation of this manuscript and for English language consultation.
1. Graham DY, Lew GM, Klein PD, et al. Effect of treatment of Helicobacter pylori infection on the long term recurrence of gastric or duodenal ulcer. A randomized, controlled study. Ann Intern Med 1992;116:705-8.
2. Penston JG. Review article: Helicobacter pylori eradication–understandable caution but no excuse for inertia. Aliment Pharmacol Ther 1994;8:369-89.
3. Hopkins RJ, Girardi LS, Turney EA. Relationship between Helicobacter pylori eradication and reduced duodenal and gastric ulcer recurrence: a review. Gastroenterology 1996;110:1244-52.
4. NIH consensus development panel. Helicobacter pylori in peptic ulcer disease. JAMA 1994;272:65-9.
5. The European Helicobacter pylori Study Group (EHPSG). Current European concepts in the management of Helicobacter pylori infection. The Maastricht Consensus Report. Gut 1997;41:8-13.
6. McColl K, Murray L, El-Omar E, et al. Symptomatic benefit from eradicating Helicobacter pylori infection in patients with nonulcer dyspepsia. N Engl J Med 1998;339:1869-74.
7. Blum AL, Talley NJ, O’Morain C, et al. For the Omeprazole Plus Clarithromycin and Amoxicillin Effect One Year After Treatment (OCAY) Study Group. Lack of effect of treating Helicobacter pylori in patients with nonulcer dyspepsia. N Engl J Med 1998;339:1875-81.
8. Breuer T, Sudhop T, Goodman KJ, Graham DY, Malferteiner P. How do practicing clinicians manage Helicobacter pylori–related gastrointestinal diseases in Germany? A survey of gastroenterologists and family practitioners. Helicobacter 1998;1:1-8.
9. Breuer T, Goodman KJ, Malaty HM, Dudhop T, Graham DY. How do clinicians practicing in the US manage Helicobacter pylori–related gastrointestinal diseases? A comparison of primary care and specialist physicians. Am J Gastroenterol 1998;93:553-61.
10. Mariotti S, Buonomo E, Lucchetti G, Palombi L, Panfilo M, Fusiello S. An experimental network of general practitioner for purpose of epidemiologic surveillance in Italy. Proc Intl MEDINFO Conference. Vancouver, BC, Canada. 1995;1553-4.
11. Graham DY, Lew GM, Malaty HM, et al. Factors influencing the eradication of Helicobacter pylori with triple therapy. Gastroenterology 1992;102:493-6.
12. Chiba N, Rao BV, Rademaker JW, Hunt RH. Meta-analysis of the efficacy of antibiotic therapy in eradicating Helicobacter pylori. Am J Gastroenterol 1992;87:1716-27.
13. Walsh JH, Peterson WL. The treatment of Helicobacter pylori infection in the management of peptic ulcer disease. N Engl J Med 1995;333:984-91.
14. Schwartz H, Krause R, Sahba B, et al. Triple versus dual therapy for eradicating Helicobacter pylori and preventing ulcer recurrence: a randomized, double blind, multicenter study of lansoprazole, clarithromycin, and/or amoxicillin in different dosing regimens. Am J Gastroenterol 1998;93:584-90.
15. Roll J, Weng A, Newman J. Diagnosis and treatment of Helicobacter pylori infection among California Medicare patients. Arch Intern Med 1997;157:994-8.
16. Bodger K, Daly MJ, Heatley RV. Prescribing patterns for dyspepsia in primary care:a prospective study of selected general practitioner. Aliment Pharmacol Ther 1996;10:889-95.
17. Thamer M, Ray Fox N, Henderson SC, Rinehart CS, Sherman CR, Ferguson JH. Influence of the NIH Consensus Conference on Helicobacter pylori on physicians prescribing among a medicaid population. Med Care 1998;36:646-60.
18. Hood HM, Wark C, Burgess PA, Nicewander D, Scott MW. Screening for Helicobacter pylori and nonsteroidal anti-inflammatory drug use in Medicare patients hospitalized with peptic ulcer disease. Arch Intern Med 1999;159:149-54.
19. Palli D, Vaira D, Menegatti M, Saieva C. On behalf of the Italian Helicobacter pylori study group. A serologic survey of Helicobacter pylori infection in 3281 Italian patients endoscoped for upper gastrointestinal symptoms. Aliment Pharmacol Ther 1997;11:719-28.
20. Fennerty MB. Cure of Helicobacter pylori clinically indicated and economically wise. Arch Intern Med 1995;155:1929-32.
21. Kosecoff J, Kanouse DE, Rogers WH, McCloskey L, Winslow CM, Brook RH. Effect of the National Institutes of Health consensus development program on physician practice. JAMA 1987;258:2708-13.
22. Wortman PM, Vinokur A, Sechrest L. Do consensus conferences work? A process evaluation of the NIH consensus development program. J Health Polit Policy Law 1988;13:469-72.
23. Lomas J. Words without action? The production, dissemination and impact of consensus recommendations. Ann Rev Public Health 1991;12:41-5.
24. Wyszewianski L, Green L. Strategies for changing clinicians’ practice patterns. J Fam Pract 2000;49:461-64.
25. Goodwin CS, Mendall MM, Northfield TC. Helicobacter pylori infection. Lancet 1997;349:265-69.
26. Taylor J, Zagari M, Murphy K, Freston J. Pharmacoeconomic comparison of treatments for the eradication of Helicobacter pylori. Arch Intern Med 1997;157:87-97.
27. Vakil N, Fennerty M. Cost-effectiveness of treatment regimens for H pylori infection based on a community practice effectiveness study. Gastroenterology 1997;112:A47. Abstract.-
28. Penston JG, Mistry KR. Eradication of Helicobacter pylori in general practice. Aliment Pharmacol Ther 1996;10:139-45.
What Do Family Physicians Think About Spirituality In Clinical Practice?
OBJECTIVES: To describe the context in which physicians address patients’ spiritual concerns, including their attitudes toward this task, cues to discussion, practice patterns, and barriers and facilitators.
STUDY DESIGN: This was a qualitative study using semistructured interviews of 13 family physicians.
POPULATION: We selected board-certified Missouri family physicians in a nonrandom fashion to represent a range of demographic factors (age, sex, religious background), practice types (academic/community practice; urban/rural), and opinions and practice regarding physicians’ roles in addressing patients’ spiritual issues.
OUTCOMES MEASURED: We coded and evaluated transcribed interviews for themes.
RESULTS: Physicians who reported regularly addressing spiritual issues do so because of the primacy of spirituality in their lives and because of the scientific evidence associating spirituality with health. Respondents noted that patients’ spiritual questions arise from their unique responses to chronic illness, terminal illness, and life stressors. Physicians reported varying approaches to spiritual assessment; affirmed that spiritual discussions should be approached with sensitivity and integrity; and reported physician, patient, mutual physician–patient, and situational barriers. Facilitators of spiritual discussions included physicians’ modeling a life that includes a spiritual focus.
CONCLUSIONS: These physicians differ in their comfort and practice of addressing spiritual issues with patients but affirm a role for family physicians in responding to patients’ spiritual concerns. Factors that form a context for discussions of spiritual issues with patients include perceived barriers, physicians’ role definition, familiarity with factors likely to prompt spiritual questions, and recognition of principles guiding spiritual discussions.
- Family physicians differ in their views regarding the appropriateness of addressing patients’ spiritual issues, but they widely support a patient-centered approach to any spiritual assessment that is performed.
- Physician barriers to spiritual assessment may include upbringing and culture, lack of spiritual inclination or awareness, resistance to exposing personal beliefs, and belief that spiritual discussions will not have an impact on patients’ illnesses or lives.
- Facilitators to spiritual assessment may include communicating a willingness to have these discussions and the physician’s modeling a life of balance and spiritual maturity.
An emerging body of research supports the inclusion of spiritual issues in healthcare. Studies have correlated religious commitment with health.1-3 Many patients affirm the importance of spiritual factors in their lives.4-5 Recent studies demonstrate that many patients wish to have spirituality considered in their health care, especially during grave illness or emotional crisis.4-6 How to accomplish this objective is less clear. Although physicians possess spiritual assessment tools,7-11 broader issues such as physician attitudes, roles, and varied ways of dealing with spirituality have not been widely studied. Understanding this context is crucial if physicians are to include spiritual assessment in patient care.
Two studies of Midwestern family physicians found strong support for addressing patients’ spiritual concerns. In one survey, family physicians in Illinois (n = 210) believed that strong religious convictions positively affect older patients’ mental health (68%) and physical health (42%).12 These doctors supported physicians’ pursuing spiritual issues at patients’ request (88%) and when patients faced bereavement or impending death (66%). Similarly, Missouri family physicians (n = 231) affirmed that spiritual well-being is an important health component (96%) and that hospitalized patients with spiritual concerns should be referred to chaplains (86%).13 A far smaller percentage of these physicians, however, felt they should personally address patients’ spiritual questions (58%).
Despite acknowledging the importance of spiritual issues, the Missouri physicians seldom engaged patients in conversations about death and dying, meditation or quiet reflection, prayer, forgiveness, giving and receiving love, the role of a deity in illness, and the meaning or purpose of illness. They reported such barriers to spiritual discussions as lack of time (71%), inadequate training for taking spiritual histories (59%), and difficulty in identifying patients who want to discuss spiritual issues (56%). The gulf between physicians’ attitudes and practice of spiritual assessment suggests an incomplete understanding of their role in spiritual health.
A study by Craigie and Hobbs14 of 12 family physicians who are themselves deeply spiritual represents early progress toward understanding this role. These physicians perceived that their spirituality enabled them to experience sacredness in patient encounters, to view medicine as a mission, to maintain centeredness, and to serve as instruments of healing. They described themselves as facilitators and encouragers of patients’ spiritual values and resources. We reasoned that unlike the deeply spiritual respondents in the Craigie and Hobbs study, family physicians in general are likely to have a broad range of attitudes and practices regarding spiritual assessment. We sought to better understand the spectrum of views about the physician’s role in spiritual encounters, to describe family physicians’ approaches to addressing spiritual issues, and to further explore barriers to spiritual discussions and facilitators of these discussions.
Methods
We conducted semistructured interviews15 with 13 family physicians. Participants assessed their frequency of addressing patients’ spiritual issues and provided demographic information and practice characteristics. Interview topics included spirituality in the doctor-patient relationship, the practice of addressing spiritual issues, and perceived facilitators and barriers to discussing spiritual issues. Interviews were conducted by one of the authors (either A.D.B. or D.H.) or by a research assistant trained in qualitative investigation techniques. Interviews averaged 45 minutes in duration.
To guard against bias in advocating a particular stance toward spiritual assessment, we stressed to respondents that we wanted their honest observations and confirmed their statements throughout the interview. Before analyzing the data, we noted our preconceptions toward spiritual assessment. We consciously sought to avoid these biases while reviewing the data.16 To further reduce the likelihood of bias, we selected a research team whose members represented multiple academic disciplines and religious backgrounds.
Qualitative research aims to uncover new information and perspectives rather than to draw definitive conclusions from a representative study sample.17 Study participants were deliberately selected18 to represent a range of demographic factors (sex, age, religious background), practice types (academic or community practice; urban and rural), and practice regarding physicians’ role in addressing patients’ spiritual issues.
All study participants were board-certified family physicians in Missouri. Three participants were white women; 10 were white men. They ranged in age from 37 to 63 years. Three were in full-time community practice; all others were medical school or residency faculty. All but 1 faculty member reported previous community practice experience. Two participants practice in rural locations; 2 in community health centers; 1 in a metropolitan community practice; 4 in metropolitan community-based residency clinics; and 4 in a metropolitan university-based residency clinic. Subjects’ religious affiliations were Jewish (1), Christian (6), “Unitarian Universalist with Muslim leanings” (1), “Unitarian Universalist with Buddhist leanings” (1), “Unitarian” (2), “none” (1), and agnostic (1).
Interviews took place in participants’ offices. We informed them of the use of audiotapes during the telephone recruitment and obtained verbal consent before audiotaping. An Institutional Review Board approved our study.
Study staff transcribed the interviews verbatim. Investigators verified interview content through comparison with interviewers’ notes and entered the text into Ethnograph,19 a computer database program designed to organize textual material. Investigators used an iterative process to make an initial template for organizing and coding data.20 Our multiple readings of interviews led to further code revisions until consensus was reached regarding salient issues or themes.21,22 We solicited respondents’ views of the validity of the final codes and themes and of the accuracy of illustrative quotations.
Results
Six respondents reported regularly addressing spiritual issues with patients. One respondent reported an intermediate level of involvement; 6 reported that they do not regularly address spiritual issues. One physician was opposed to physicians’ addressing spiritual issues with patients.
The themes that emerged from the coded interviews were associated with 5 issues: (1) the appropriate role for physicians in addressing spiritual concerns; (2) situations in which physicians focus on spiritual issues (the nature and setting of these discussions); (3) how physicians address spiritual issues; (4) barriers to addressing spiritual issues; and (5) facilitators of spiritual assessment.
Physician’s role
Physicians who regularly discussed spirituality believed that the scientific evidence linking spirituality and positive health outcomes justified their actions. One study participant stated, “Every physician ought to be dealing with [patients’] spiritual issues. [For example,] how can you justify not talking about spirituality to a patient with depression when you can prove scientifically that strengthening faith commitment helps them? It really comes down to a quality of care issue.”
Some respondents believed that the primacy of spirituality in life provided a justification for addressing spiritual issues with patients. As one stated, “These values . . . get at the core of who you are. I would hope that I would be respectful and supportive” [whether or not I was a physician].
The respondents universally viewed themselves as supportive resources for patients through listening, validating spiritual beliefs, and remaining with patients during times of need. One expressed that healing occurs as physicians and patients connect as people, stating, “I don’t have to be a spiritual master. I can be a human being, trying to connect with another human being. That is a healing experience.”
Although several participants seldom addressed spiritual matters, only one strongly opposed the initiation of such discussions, out of concern about role definition and invasion of patients’ privacy. This participant felt that spiritual matters were “no more in the physician’s domain than questions regarding patients’ finances or their most evil thoughts.”
Nature and setting of discussions
Respondents reported specific patient illnesses and stressors that are likely to prompt spiritual discussions. These included terminal illness; chronic illness; specific conditions, such as heart disease, cancer, or miscarriage; depression, anxiety, or other psychiatric illness; pregnancy; and life stressors, including traumatic illness in the family. Other patient situations associated with spiritual discussions included the presence of symptoms without an explanation (eg, pain, insomnia, anorexia), loss of a bodily function, role change within the family, or an illness that erodes one’s self-concept.
Physician respondents also reported factors that often prompt them to ask spiritual questions. These included intensive care unit admission, new diagnosis of terminal illness, treatment failures, patients’ dissatisfaction with progress of treatment, and discussion of advanced care directives. The respondents who regularly address spiritual issues use screening questions that they tend to ask in response to a patient’s cues or crisis (Table 1).
Some respondents asserted that patients’ spiritual questions arise from their unique reactions to life stress and illness. One physician stated that patients’ questions have “more to do with their view of their illness than what the illness really is.” Spiritual questions commonly asked by patients covered a wide range of spiritual themes (Table 1).
TABLE 1
SELECTED SPIRITUAL QUESTIONS OF PATIENTS AND PHYSICIANS
| Questions PATIENTS’ QUESTIONS | Spiritual Dimension* |
|---|---|
| How do others cope with this? | Coping with illness |
| What do you think death is like? | Death and dying |
| I just wonder what my life is supposed to be about now. | Life’s meaning and purpose |
| What did I do to deserve this? God must be angry with me. | Role of God in illness |
| PHYSICIANS’ SCREENING QUESTIONS | |
| Have you had stress or changes in your life recently? | Screening |
| What is important to you? | Belief system |
| Has faith been important to you? | Beliefs |
| How have you dealt with difficult times in the past? | |
| From what do you draw your strength? | Resources |
| Do you hold any spiritual beliefs that might help you at this time? | |
| *With the exception of “screening” and “resources,” items under the Spiritual Dimension heading are found in Kuhn CC.9 | |
| For the complete table, see Table W1. | |
Manner of addressing spiritual health issues
The physicians in our study believed that in most circumstances, patients should initiate spiritual discussions. One said, “It’s one of those areas where you need a small amount of the patient’s permission to get started and a lot more of the patient’s permission to finish.”
Those who regularly address spiritual issues reported using a variety of techniques and approaches (Table 2). These physicians allow for an inclusive definition of spirituality; they try to normalize spiritual discussions and to integrate spiritual discussions into the ongoing doctor–patient relationship. One said that “bringing [spirituality] to the table” along with other potentially sensitive issues helps patients know “what you’re interested in and gives them the option of deciding to pursue it or not.”
The physicians who address spiritual issues follow principles of spiritual assessment (Table 2). All respondents affirmed that spiritual discussions should be approached with sensitivity and integrity to avoid imposing their own belief systems on their patients. One said, “I can’t even describe how negative it [would be] for me to impose my spiritual beliefs on [my] patients.” Another respondent agreed, but also described a tension between faith-based and profession-based thoughts: “[Discussing one’s faith with a patient risks being] an abuse of power; yet if a patient dies tonight and I haven’t shared the Good News that I have . . . I’m neglecting something that’s very important. . . . How do we do this . . . with both gentleness toward the patient and reverence toward God?”
Respondents expressed divergent viewpoints concerning routine spiritual history taking. Although some considered this to be an essential skill, those who seldom addressed spiritual issues found it less pressing and more time consuming than medical concerns. None reported the routine use of currently available spiritual assessment tools. A respondent opposed to initiating spiritual discussions noted a Judeo-Christian bias in these tools, calling their use “cultural imperialism.”
TABLE 2
PHYSICIANS’ APPROACHES TO ADDRESSING SPIRITUAL ISSUES
| Techniques |
| Spiritual discussion in context of broad issues |
| Asking spiritual questions at onset of relationship and again during crises |
| Assessing and affirming patients’ spiritual resources |
| Diagnostic Approach |
| Active attention to patient cues or questions |
| Consideration of questions in context of patient’s known spiritual background |
| Processing of questions to look for deeper spiritual questions or issues |
| Asking clarifying questions to assure accurate identification of spiritual issues |
| Offering therapies (answers, suggestions, or exercises) related to patient’s questions and appropriate to patient’s beliefs and values |
| Principles |
| Sitting and listening has value |
| Use patient-centered reflection rather than providing answers to spiritual questions |
| Approach spiritual discussions with gentleness and reverence |
| Do not impose spiritual or religious views on patients |
| For the complete table, see Table W2. |
Barriers to spiritual assessment
Our respondents noted significant barriers, including physician barriers, mutual physician–patient barriers, physician-perceived patient barriers, and situational barriers (Table 3). An example of a physician–patient barrier is the mutual feeling that neither wants to raise issues of spirituality for fear of alienating or causing discomfort in the other.
TABLE 3
SELECTED BARRIERS TO SPIRITUAL DISCUSSIONS AND FACILITATORS OF THEM
| Barriers |
Physician Barriers
|
Mutual Physician–Patient Barriers
|
Physician-Perceived Patient Barriers
|
Situational Barriers
|
| Facilitators |
Actions
|
Situational Factors
|
Resources
|
Physician Qualities
|
| For the complete table, see Table W3. |
Facilitators of spiritual discussions
Respondents noted that characteristics facilitating patients’ discussions of sexuality and other sensitive issues also facilitate conversations about spirituality. These characteristics include communicating a willingness to engage in (and having the time for) such discussions and assuring patients that spiritual confidences will be received in a nonjudgmental fashion.
Physicians who are more spiritually inclined may be more likely to address spiritual issues with patients. As one respondent stated, “When I have conversations about spiritual issues, it’s [sic] usually been at my initiation . . . because I’m more concerned about religious sorts of things than many physicians.”
A final theme expressed by respondents is that physicians who model a life characterized by balance and spiritual maturity can facilitate patients’ spiritual growth. One stated, “My patients perceive something about my balance and spiritual strength that makes them believe they can do anything. It allows me to move to the next level with them . . . [by showing them how to foster] that strength in themselves with the help of family, community, and God.” Other facilitators are listed in Table 3.
Discussion
The relationship between religiosity and positive health outcomes does much to justify spiritual assessment.1-3 Other justifications include enhanced coping in chronic illness states,23 providing patients with hope in illness-coping and recovery;24,25 the possibility that neglect of spiritual needs may drive patients away from medical treatment,24 and evidence that some patients desire physicians to raise spiritual issues.6,25,26
We sought to explore the context of spiritual assessment rather than to further justify such assessments. The context of spiritual assessment refers to the philosophical question of whether physicians should address spiritual questions and to practical questions of how spiritual matters arise, how physicians approach them, and what barriers and facilitators they perceive with regard to discussing spirituality. Our study adds to knowledge about this context in several important ways.
We found variance of opinion concerning the physician’s role in spiritual assessment. Respondents reporting infrequent spiritual assessment expressed the view that spiritual issues have lower priority than other medical concerns. Yet those who regularly address spiritual issues justified this with scientific evidence associating spirituality and health. They also proposed a justification not found in previous studies: that spirituality is central to life and therefore important for its own sake rather than simply as a means to a medical end. These findings support and augment previously cited justifications for physicians assisting patients with spiritual health issues.1-3,6,24-26
Our study results add to the list of categories that prompt discussions of spiritual issues. Respondents affirmed a role for physicians in discussing end-of-life issues and advanced care directives, as in previous studies.27-29 In addition, they observed that patients’ spiritual questions arise from their unique responses to chronic illness, terminal illness, and life stressors. They identified 2 new categories prompting spiritual discussions: unexplained symptoms and treatment failure.
All respondents affirmed a role for physicians in supporting patients who initiate spiritual discussions. As in a previous study,14 they viewed themselves as facilitators and encouragers of patients’ spiritual values and as resources rather than as spiritual counselors. The most reticent physicians believed in responding to patients’ questions rather than initiating discussions, an approach that may fail to identify spiritual issues. All respondents supported a patient-centered approach to spiritual assessment in which physicians act with integrity and take care not to abuse their position.
Many physicians saw value in spiritual history taking, though none reported routine use of spiritual assessment tools. The potential Judeo-Christian bias in assessment questions noted by one respondent highlights the need to use culturally sensitive, generic assessment tools30 and to work toward further development of such tools.
We identified new barriers to spiritual assessment, including a physician’s upbringing and culture, lack of spiritual inclination or awareness, resistance to exposing personal beliefs, and belief that spiritual discussions will not influence patients’ illnesses or lives. Respondents also postulated patient barriers, including fears that their physician might judge them for their spiritual views or consider their raising spiritual questions inappropriate.
We identified facilitators of spiritual discussions, such as communicating a willingness to have these discussions. One respondent noted that physicians whose lives are characterized by spiritual maturity might serve as agents of patients’ spiritual growth, consistent with a previous study’s themes of caregiver spirituality and physician vocation and mission.14
Limitations
Because qualitative research aims to uncover new perspectives rather than to make generalizable assessments, our findings may not apply to all physicians or to all family physicians. Although our respondents did not represent all major world religions, ethnic groups, and cultures, they did offer a diversity of spiritual and religious perspectives. Finally, our study gives only physicians’ perspectives. We are currently studying patients’ perspectives of situations that elicit spiritual questions and of potential barriers to spiritual assessment. We will use themes from our patient and physician qualitative studies to frame questions for a national patient questionnaire regarding physicians’ spiritual assessment.
Conclusions
Physicians differ in their comfort and practice of addressing spiritual issues with patients, but affirm a role for themselves in responding to patients’ spiritual concerns. Perceived barriers, physicians’ role definition, familiarity with factors likely to prompt spiritual questions, and the recognition of principles guiding spiritual discussions form the context for family physicians’ discussions of spiritual issues with patients. This context is important to consider when training medical students and residents in spiritual assessment. Careful attention to this context will also enhance the practicing physician’s skill in providing patient-centered assistance with spiritual health concerns.
Acknowledgments
The authors wish to acknowledge Arej Sawani, who assisted in data collection; Sheri Price, who assisted in manuscript preparation; and Richard Ellis, MD, MPH, Daniel Vinson, MD, MSPH, Steven Zweig, MD, MSPH, and Dale Smith, who reviewed the manuscript and offered editorial suggestions.
1. Matthews DA, McCullough ME, Larson DB, Koenig HG, Swyers JP, Milano MG. Religious commitment and health status: a review of the research and implications for family medicine. Arch Fam Med 1998;7:118-24.
2. McKee DD, Chappel N. Spirituality and medical practice. J Fam Pract 1992;35:201-8.
3. McBride JL, Arthur G, Brooks R, Pilkington L. The relationship between a patient’s spirituality and health experiences. Fam Med 1998;30:122-6.
4. King DE, Bushwick B. Beliefs and attitudes of hospital inpatients about faith healing and prayer. J Fam Pract 1994;39:349-52.
5. Koenig HG, Smiley M, Gonzales JAP. Religion, health and aging: a review and theoretical integration. Contributions to the study of aging, no. 10. New York, NY: Greenwood Press; 1988:129-40.
6. Ehman JW, Ott BB, Short TH, Ciampa RC, Hansen-Flaschen JH. Do patients want physicians to inquire about their spiritual or religious beliefs if they become gravely ill? Arch Intern Med 1999;159:1803-6.
7. Ellison CW. Spiritual well-being: conceptualization and measurement. J Psychol Theol 1983;11:330-40.
8. Fitchett G. Spiritual assessment in pastoral care: a guide to selected resources. Decatur, Ga: J Past Care Pub 1993: JPCP monograph no 4.
9. Kuhn CC. A spiritual inventory of the medically ill patient. Psychiatr Med 1988;6:87-100.
10. Maugans TA. The spiritual history. Arch Fam Med 1996;5:11-16.
11. Onarecker CD. Addressing your patients’ spiritual needs. Fam Pract Manage 1995;44-49.
12. Koenig HG, Bearon LB, Dayringer R. Physician perspectives on the role of religion in the physician-older patient relationship. J Fam Pract 1989;28:441-8.
13. Ellis MR, Vinson DC, Ewigman B. Addressing spiritual concerns of patients: family physicians’ attitudes and practices. J Fam Pract 1999;48:105-9.
14. Craigie FC, Hobbs RF. Spiritual perspectives and practices of family physicians with an expressed interest in spirituality. Fam Med 1999;31:578-85.
15. Crabtree BF, Miller WL. A qualitative approach to primary care research: the long interview. Fam Med 1991;23:145-51.
16. Crabtree BF, Miller WL, eds. Doing qualitative research. 2nd ed. Thousands Oaks, Calif: Sage Publications; 1999.
17. Kuzel AJ. Sampling in qualitative inquiry. In: Crabtree BF, Miller WL, eds. Doing qualitative research. Thousand Oaks, Calif: Sage Publications, 1992;31-44.
18. Gilchrist VJ. Key informant interviews. In: Crabtree BF, Miller WL, eds. Doing qualitative research. Thousand Oaks, Calif: Sage Publications, 1992;70-89.
19. The ethnograph. Version 4.0. Amherst, Mass: Qualis Research Associates; 1994.
20. Crabtree BF, Miller WL. A template approach to text analysis: developing and using codebooks. In: Crabtree BF, Miller WL, eds. Doing qualitative research. Newbury Park, Calif: Sage Publications; 1998.
21. Miles MB, Huberman AM. Qualitative data analysis: an expanded sourcebook. 2nd ed. Thousand Oaks, Calif: Sage Publications; 1994.
22. Boyatzis RE. Transforming qualitative information: thematic analysis and code development. Thousand Oaks, Calif: Sage Publications; 1992;93-109.
23. Dossey LD. Do religion and spirituality matter in health? A response to the recent article in The Lancet. Alternative Therapies 1999;5:16-18.
24. Post SG, Puchalski CM, Larson DB. Physicians and patient spirituality: professional boundaries, competency, and ethics. Ann Intern Med 2000;132:578-83.
25. Foglio JP, Brody H. Religion, faith, and family medicine. J Fam Pract 1988;27:473-4.
26. Maugans TA, Wadland WC. Religion and family medicine: a survey of physicians and patients. J Fam Pract 1991;32:210-3.
27. Oyama O, Koenig HG. Religious beliefs and practices in family medicine. Arch Fam Med 1998;7:431-5.
28. Pfeifer MP, Sidorov JE, Smith AC, Boero JF, Evans AT, Settle MB. EOL study group. The discussion of end of life medical care by primary care patients and physicians: a multicenter study using structured qualitative interviews. J Gen Intern Med 1994;9:82-8.
29. Farber SJ, Egnew TR, Herman-Bertsch JL. Issues in end-of-life care: family practice faculty perceptions. J Fam Pract 1999;49:525-30.
30. Hatch RL, Naberhaus DS, Helmich LK, Burg MA. Spiritual involvement and beliefs scale: development and testing of a new instrument. J Fam Pract 1999;46:476-86.
OBJECTIVES: To describe the context in which physicians address patients’ spiritual concerns, including their attitudes toward this task, cues to discussion, practice patterns, and barriers and facilitators.
STUDY DESIGN: This was a qualitative study using semistructured interviews of 13 family physicians.
POPULATION: We selected board-certified Missouri family physicians in a nonrandom fashion to represent a range of demographic factors (age, sex, religious background), practice types (academic/community practice; urban/rural), and opinions and practice regarding physicians’ roles in addressing patients’ spiritual issues.
OUTCOMES MEASURED: We coded and evaluated transcribed interviews for themes.
RESULTS: Physicians who reported regularly addressing spiritual issues do so because of the primacy of spirituality in their lives and because of the scientific evidence associating spirituality with health. Respondents noted that patients’ spiritual questions arise from their unique responses to chronic illness, terminal illness, and life stressors. Physicians reported varying approaches to spiritual assessment; affirmed that spiritual discussions should be approached with sensitivity and integrity; and reported physician, patient, mutual physician–patient, and situational barriers. Facilitators of spiritual discussions included physicians’ modeling a life that includes a spiritual focus.
CONCLUSIONS: These physicians differ in their comfort and practice of addressing spiritual issues with patients but affirm a role for family physicians in responding to patients’ spiritual concerns. Factors that form a context for discussions of spiritual issues with patients include perceived barriers, physicians’ role definition, familiarity with factors likely to prompt spiritual questions, and recognition of principles guiding spiritual discussions.
- Family physicians differ in their views regarding the appropriateness of addressing patients’ spiritual issues, but they widely support a patient-centered approach to any spiritual assessment that is performed.
- Physician barriers to spiritual assessment may include upbringing and culture, lack of spiritual inclination or awareness, resistance to exposing personal beliefs, and belief that spiritual discussions will not have an impact on patients’ illnesses or lives.
- Facilitators to spiritual assessment may include communicating a willingness to have these discussions and the physician’s modeling a life of balance and spiritual maturity.
An emerging body of research supports the inclusion of spiritual issues in healthcare. Studies have correlated religious commitment with health.1-3 Many patients affirm the importance of spiritual factors in their lives.4-5 Recent studies demonstrate that many patients wish to have spirituality considered in their health care, especially during grave illness or emotional crisis.4-6 How to accomplish this objective is less clear. Although physicians possess spiritual assessment tools,7-11 broader issues such as physician attitudes, roles, and varied ways of dealing with spirituality have not been widely studied. Understanding this context is crucial if physicians are to include spiritual assessment in patient care.
Two studies of Midwestern family physicians found strong support for addressing patients’ spiritual concerns. In one survey, family physicians in Illinois (n = 210) believed that strong religious convictions positively affect older patients’ mental health (68%) and physical health (42%).12 These doctors supported physicians’ pursuing spiritual issues at patients’ request (88%) and when patients faced bereavement or impending death (66%). Similarly, Missouri family physicians (n = 231) affirmed that spiritual well-being is an important health component (96%) and that hospitalized patients with spiritual concerns should be referred to chaplains (86%).13 A far smaller percentage of these physicians, however, felt they should personally address patients’ spiritual questions (58%).
Despite acknowledging the importance of spiritual issues, the Missouri physicians seldom engaged patients in conversations about death and dying, meditation or quiet reflection, prayer, forgiveness, giving and receiving love, the role of a deity in illness, and the meaning or purpose of illness. They reported such barriers to spiritual discussions as lack of time (71%), inadequate training for taking spiritual histories (59%), and difficulty in identifying patients who want to discuss spiritual issues (56%). The gulf between physicians’ attitudes and practice of spiritual assessment suggests an incomplete understanding of their role in spiritual health.
A study by Craigie and Hobbs14 of 12 family physicians who are themselves deeply spiritual represents early progress toward understanding this role. These physicians perceived that their spirituality enabled them to experience sacredness in patient encounters, to view medicine as a mission, to maintain centeredness, and to serve as instruments of healing. They described themselves as facilitators and encouragers of patients’ spiritual values and resources. We reasoned that unlike the deeply spiritual respondents in the Craigie and Hobbs study, family physicians in general are likely to have a broad range of attitudes and practices regarding spiritual assessment. We sought to better understand the spectrum of views about the physician’s role in spiritual encounters, to describe family physicians’ approaches to addressing spiritual issues, and to further explore barriers to spiritual discussions and facilitators of these discussions.
Methods
We conducted semistructured interviews15 with 13 family physicians. Participants assessed their frequency of addressing patients’ spiritual issues and provided demographic information and practice characteristics. Interview topics included spirituality in the doctor-patient relationship, the practice of addressing spiritual issues, and perceived facilitators and barriers to discussing spiritual issues. Interviews were conducted by one of the authors (either A.D.B. or D.H.) or by a research assistant trained in qualitative investigation techniques. Interviews averaged 45 minutes in duration.
To guard against bias in advocating a particular stance toward spiritual assessment, we stressed to respondents that we wanted their honest observations and confirmed their statements throughout the interview. Before analyzing the data, we noted our preconceptions toward spiritual assessment. We consciously sought to avoid these biases while reviewing the data.16 To further reduce the likelihood of bias, we selected a research team whose members represented multiple academic disciplines and religious backgrounds.
Qualitative research aims to uncover new information and perspectives rather than to draw definitive conclusions from a representative study sample.17 Study participants were deliberately selected18 to represent a range of demographic factors (sex, age, religious background), practice types (academic or community practice; urban and rural), and practice regarding physicians’ role in addressing patients’ spiritual issues.
All study participants were board-certified family physicians in Missouri. Three participants were white women; 10 were white men. They ranged in age from 37 to 63 years. Three were in full-time community practice; all others were medical school or residency faculty. All but 1 faculty member reported previous community practice experience. Two participants practice in rural locations; 2 in community health centers; 1 in a metropolitan community practice; 4 in metropolitan community-based residency clinics; and 4 in a metropolitan university-based residency clinic. Subjects’ religious affiliations were Jewish (1), Christian (6), “Unitarian Universalist with Muslim leanings” (1), “Unitarian Universalist with Buddhist leanings” (1), “Unitarian” (2), “none” (1), and agnostic (1).
Interviews took place in participants’ offices. We informed them of the use of audiotapes during the telephone recruitment and obtained verbal consent before audiotaping. An Institutional Review Board approved our study.
Study staff transcribed the interviews verbatim. Investigators verified interview content through comparison with interviewers’ notes and entered the text into Ethnograph,19 a computer database program designed to organize textual material. Investigators used an iterative process to make an initial template for organizing and coding data.20 Our multiple readings of interviews led to further code revisions until consensus was reached regarding salient issues or themes.21,22 We solicited respondents’ views of the validity of the final codes and themes and of the accuracy of illustrative quotations.
Results
Six respondents reported regularly addressing spiritual issues with patients. One respondent reported an intermediate level of involvement; 6 reported that they do not regularly address spiritual issues. One physician was opposed to physicians’ addressing spiritual issues with patients.
The themes that emerged from the coded interviews were associated with 5 issues: (1) the appropriate role for physicians in addressing spiritual concerns; (2) situations in which physicians focus on spiritual issues (the nature and setting of these discussions); (3) how physicians address spiritual issues; (4) barriers to addressing spiritual issues; and (5) facilitators of spiritual assessment.
Physician’s role
Physicians who regularly discussed spirituality believed that the scientific evidence linking spirituality and positive health outcomes justified their actions. One study participant stated, “Every physician ought to be dealing with [patients’] spiritual issues. [For example,] how can you justify not talking about spirituality to a patient with depression when you can prove scientifically that strengthening faith commitment helps them? It really comes down to a quality of care issue.”
Some respondents believed that the primacy of spirituality in life provided a justification for addressing spiritual issues with patients. As one stated, “These values . . . get at the core of who you are. I would hope that I would be respectful and supportive” [whether or not I was a physician].
The respondents universally viewed themselves as supportive resources for patients through listening, validating spiritual beliefs, and remaining with patients during times of need. One expressed that healing occurs as physicians and patients connect as people, stating, “I don’t have to be a spiritual master. I can be a human being, trying to connect with another human being. That is a healing experience.”
Although several participants seldom addressed spiritual matters, only one strongly opposed the initiation of such discussions, out of concern about role definition and invasion of patients’ privacy. This participant felt that spiritual matters were “no more in the physician’s domain than questions regarding patients’ finances or their most evil thoughts.”
Nature and setting of discussions
Respondents reported specific patient illnesses and stressors that are likely to prompt spiritual discussions. These included terminal illness; chronic illness; specific conditions, such as heart disease, cancer, or miscarriage; depression, anxiety, or other psychiatric illness; pregnancy; and life stressors, including traumatic illness in the family. Other patient situations associated with spiritual discussions included the presence of symptoms without an explanation (eg, pain, insomnia, anorexia), loss of a bodily function, role change within the family, or an illness that erodes one’s self-concept.
Physician respondents also reported factors that often prompt them to ask spiritual questions. These included intensive care unit admission, new diagnosis of terminal illness, treatment failures, patients’ dissatisfaction with progress of treatment, and discussion of advanced care directives. The respondents who regularly address spiritual issues use screening questions that they tend to ask in response to a patient’s cues or crisis (Table 1).
Some respondents asserted that patients’ spiritual questions arise from their unique reactions to life stress and illness. One physician stated that patients’ questions have “more to do with their view of their illness than what the illness really is.” Spiritual questions commonly asked by patients covered a wide range of spiritual themes (Table 1).
TABLE 1
SELECTED SPIRITUAL QUESTIONS OF PATIENTS AND PHYSICIANS
| Questions PATIENTS’ QUESTIONS | Spiritual Dimension* |
|---|---|
| How do others cope with this? | Coping with illness |
| What do you think death is like? | Death and dying |
| I just wonder what my life is supposed to be about now. | Life’s meaning and purpose |
| What did I do to deserve this? God must be angry with me. | Role of God in illness |
| PHYSICIANS’ SCREENING QUESTIONS | |
| Have you had stress or changes in your life recently? | Screening |
| What is important to you? | Belief system |
| Has faith been important to you? | Beliefs |
| How have you dealt with difficult times in the past? | |
| From what do you draw your strength? | Resources |
| Do you hold any spiritual beliefs that might help you at this time? | |
| *With the exception of “screening” and “resources,” items under the Spiritual Dimension heading are found in Kuhn CC.9 | |
| For the complete table, see Table W1. | |
Manner of addressing spiritual health issues
The physicians in our study believed that in most circumstances, patients should initiate spiritual discussions. One said, “It’s one of those areas where you need a small amount of the patient’s permission to get started and a lot more of the patient’s permission to finish.”
Those who regularly address spiritual issues reported using a variety of techniques and approaches (Table 2). These physicians allow for an inclusive definition of spirituality; they try to normalize spiritual discussions and to integrate spiritual discussions into the ongoing doctor–patient relationship. One said that “bringing [spirituality] to the table” along with other potentially sensitive issues helps patients know “what you’re interested in and gives them the option of deciding to pursue it or not.”
The physicians who address spiritual issues follow principles of spiritual assessment (Table 2). All respondents affirmed that spiritual discussions should be approached with sensitivity and integrity to avoid imposing their own belief systems on their patients. One said, “I can’t even describe how negative it [would be] for me to impose my spiritual beliefs on [my] patients.” Another respondent agreed, but also described a tension between faith-based and profession-based thoughts: “[Discussing one’s faith with a patient risks being] an abuse of power; yet if a patient dies tonight and I haven’t shared the Good News that I have . . . I’m neglecting something that’s very important. . . . How do we do this . . . with both gentleness toward the patient and reverence toward God?”
Respondents expressed divergent viewpoints concerning routine spiritual history taking. Although some considered this to be an essential skill, those who seldom addressed spiritual issues found it less pressing and more time consuming than medical concerns. None reported the routine use of currently available spiritual assessment tools. A respondent opposed to initiating spiritual discussions noted a Judeo-Christian bias in these tools, calling their use “cultural imperialism.”
TABLE 2
PHYSICIANS’ APPROACHES TO ADDRESSING SPIRITUAL ISSUES
| Techniques |
| Spiritual discussion in context of broad issues |
| Asking spiritual questions at onset of relationship and again during crises |
| Assessing and affirming patients’ spiritual resources |
| Diagnostic Approach |
| Active attention to patient cues or questions |
| Consideration of questions in context of patient’s known spiritual background |
| Processing of questions to look for deeper spiritual questions or issues |
| Asking clarifying questions to assure accurate identification of spiritual issues |
| Offering therapies (answers, suggestions, or exercises) related to patient’s questions and appropriate to patient’s beliefs and values |
| Principles |
| Sitting and listening has value |
| Use patient-centered reflection rather than providing answers to spiritual questions |
| Approach spiritual discussions with gentleness and reverence |
| Do not impose spiritual or religious views on patients |
| For the complete table, see Table W2. |
Barriers to spiritual assessment
Our respondents noted significant barriers, including physician barriers, mutual physician–patient barriers, physician-perceived patient barriers, and situational barriers (Table 3). An example of a physician–patient barrier is the mutual feeling that neither wants to raise issues of spirituality for fear of alienating or causing discomfort in the other.
TABLE 3
SELECTED BARRIERS TO SPIRITUAL DISCUSSIONS AND FACILITATORS OF THEM
| Barriers |
Physician Barriers
|
Mutual Physician–Patient Barriers
|
Physician-Perceived Patient Barriers
|
Situational Barriers
|
| Facilitators |
Actions
|
Situational Factors
|
Resources
|
Physician Qualities
|
| For the complete table, see Table W3. |
Facilitators of spiritual discussions
Respondents noted that characteristics facilitating patients’ discussions of sexuality and other sensitive issues also facilitate conversations about spirituality. These characteristics include communicating a willingness to engage in (and having the time for) such discussions and assuring patients that spiritual confidences will be received in a nonjudgmental fashion.
Physicians who are more spiritually inclined may be more likely to address spiritual issues with patients. As one respondent stated, “When I have conversations about spiritual issues, it’s [sic] usually been at my initiation . . . because I’m more concerned about religious sorts of things than many physicians.”
A final theme expressed by respondents is that physicians who model a life characterized by balance and spiritual maturity can facilitate patients’ spiritual growth. One stated, “My patients perceive something about my balance and spiritual strength that makes them believe they can do anything. It allows me to move to the next level with them . . . [by showing them how to foster] that strength in themselves with the help of family, community, and God.” Other facilitators are listed in Table 3.
Discussion
The relationship between religiosity and positive health outcomes does much to justify spiritual assessment.1-3 Other justifications include enhanced coping in chronic illness states,23 providing patients with hope in illness-coping and recovery;24,25 the possibility that neglect of spiritual needs may drive patients away from medical treatment,24 and evidence that some patients desire physicians to raise spiritual issues.6,25,26
We sought to explore the context of spiritual assessment rather than to further justify such assessments. The context of spiritual assessment refers to the philosophical question of whether physicians should address spiritual questions and to practical questions of how spiritual matters arise, how physicians approach them, and what barriers and facilitators they perceive with regard to discussing spirituality. Our study adds to knowledge about this context in several important ways.
We found variance of opinion concerning the physician’s role in spiritual assessment. Respondents reporting infrequent spiritual assessment expressed the view that spiritual issues have lower priority than other medical concerns. Yet those who regularly address spiritual issues justified this with scientific evidence associating spirituality and health. They also proposed a justification not found in previous studies: that spirituality is central to life and therefore important for its own sake rather than simply as a means to a medical end. These findings support and augment previously cited justifications for physicians assisting patients with spiritual health issues.1-3,6,24-26
Our study results add to the list of categories that prompt discussions of spiritual issues. Respondents affirmed a role for physicians in discussing end-of-life issues and advanced care directives, as in previous studies.27-29 In addition, they observed that patients’ spiritual questions arise from their unique responses to chronic illness, terminal illness, and life stressors. They identified 2 new categories prompting spiritual discussions: unexplained symptoms and treatment failure.
All respondents affirmed a role for physicians in supporting patients who initiate spiritual discussions. As in a previous study,14 they viewed themselves as facilitators and encouragers of patients’ spiritual values and as resources rather than as spiritual counselors. The most reticent physicians believed in responding to patients’ questions rather than initiating discussions, an approach that may fail to identify spiritual issues. All respondents supported a patient-centered approach to spiritual assessment in which physicians act with integrity and take care not to abuse their position.
Many physicians saw value in spiritual history taking, though none reported routine use of spiritual assessment tools. The potential Judeo-Christian bias in assessment questions noted by one respondent highlights the need to use culturally sensitive, generic assessment tools30 and to work toward further development of such tools.
We identified new barriers to spiritual assessment, including a physician’s upbringing and culture, lack of spiritual inclination or awareness, resistance to exposing personal beliefs, and belief that spiritual discussions will not influence patients’ illnesses or lives. Respondents also postulated patient barriers, including fears that their physician might judge them for their spiritual views or consider their raising spiritual questions inappropriate.
We identified facilitators of spiritual discussions, such as communicating a willingness to have these discussions. One respondent noted that physicians whose lives are characterized by spiritual maturity might serve as agents of patients’ spiritual growth, consistent with a previous study’s themes of caregiver spirituality and physician vocation and mission.14
Limitations
Because qualitative research aims to uncover new perspectives rather than to make generalizable assessments, our findings may not apply to all physicians or to all family physicians. Although our respondents did not represent all major world religions, ethnic groups, and cultures, they did offer a diversity of spiritual and religious perspectives. Finally, our study gives only physicians’ perspectives. We are currently studying patients’ perspectives of situations that elicit spiritual questions and of potential barriers to spiritual assessment. We will use themes from our patient and physician qualitative studies to frame questions for a national patient questionnaire regarding physicians’ spiritual assessment.
Conclusions
Physicians differ in their comfort and practice of addressing spiritual issues with patients, but affirm a role for themselves in responding to patients’ spiritual concerns. Perceived barriers, physicians’ role definition, familiarity with factors likely to prompt spiritual questions, and the recognition of principles guiding spiritual discussions form the context for family physicians’ discussions of spiritual issues with patients. This context is important to consider when training medical students and residents in spiritual assessment. Careful attention to this context will also enhance the practicing physician’s skill in providing patient-centered assistance with spiritual health concerns.
Acknowledgments
The authors wish to acknowledge Arej Sawani, who assisted in data collection; Sheri Price, who assisted in manuscript preparation; and Richard Ellis, MD, MPH, Daniel Vinson, MD, MSPH, Steven Zweig, MD, MSPH, and Dale Smith, who reviewed the manuscript and offered editorial suggestions.
1. Matthews DA, McCullough ME, Larson DB, Koenig HG, Swyers JP, Milano MG. Religious commitment and health status: a review of the research and implications for family medicine. Arch Fam Med 1998;7:118-24.
2. McKee DD, Chappel N. Spirituality and medical practice. J Fam Pract 1992;35:201-8.
3. McBride JL, Arthur G, Brooks R, Pilkington L. The relationship between a patient’s spirituality and health experiences. Fam Med 1998;30:122-6.
4. King DE, Bushwick B. Beliefs and attitudes of hospital inpatients about faith healing and prayer. J Fam Pract 1994;39:349-52.
5. Koenig HG, Smiley M, Gonzales JAP. Religion, health and aging: a review and theoretical integration. Contributions to the study of aging, no. 10. New York, NY: Greenwood Press; 1988:129-40.
6. Ehman JW, Ott BB, Short TH, Ciampa RC, Hansen-Flaschen JH. Do patients want physicians to inquire about their spiritual or religious beliefs if they become gravely ill? Arch Intern Med 1999;159:1803-6.
7. Ellison CW. Spiritual well-being: conceptualization and measurement. J Psychol Theol 1983;11:330-40.
8. Fitchett G. Spiritual assessment in pastoral care: a guide to selected resources. Decatur, Ga: J Past Care Pub 1993: JPCP monograph no 4.
9. Kuhn CC. A spiritual inventory of the medically ill patient. Psychiatr Med 1988;6:87-100.
10. Maugans TA. The spiritual history. Arch Fam Med 1996;5:11-16.
11. Onarecker CD. Addressing your patients’ spiritual needs. Fam Pract Manage 1995;44-49.
12. Koenig HG, Bearon LB, Dayringer R. Physician perspectives on the role of religion in the physician-older patient relationship. J Fam Pract 1989;28:441-8.
13. Ellis MR, Vinson DC, Ewigman B. Addressing spiritual concerns of patients: family physicians’ attitudes and practices. J Fam Pract 1999;48:105-9.
14. Craigie FC, Hobbs RF. Spiritual perspectives and practices of family physicians with an expressed interest in spirituality. Fam Med 1999;31:578-85.
15. Crabtree BF, Miller WL. A qualitative approach to primary care research: the long interview. Fam Med 1991;23:145-51.
16. Crabtree BF, Miller WL, eds. Doing qualitative research. 2nd ed. Thousands Oaks, Calif: Sage Publications; 1999.
17. Kuzel AJ. Sampling in qualitative inquiry. In: Crabtree BF, Miller WL, eds. Doing qualitative research. Thousand Oaks, Calif: Sage Publications, 1992;31-44.
18. Gilchrist VJ. Key informant interviews. In: Crabtree BF, Miller WL, eds. Doing qualitative research. Thousand Oaks, Calif: Sage Publications, 1992;70-89.
19. The ethnograph. Version 4.0. Amherst, Mass: Qualis Research Associates; 1994.
20. Crabtree BF, Miller WL. A template approach to text analysis: developing and using codebooks. In: Crabtree BF, Miller WL, eds. Doing qualitative research. Newbury Park, Calif: Sage Publications; 1998.
21. Miles MB, Huberman AM. Qualitative data analysis: an expanded sourcebook. 2nd ed. Thousand Oaks, Calif: Sage Publications; 1994.
22. Boyatzis RE. Transforming qualitative information: thematic analysis and code development. Thousand Oaks, Calif: Sage Publications; 1992;93-109.
23. Dossey LD. Do religion and spirituality matter in health? A response to the recent article in The Lancet. Alternative Therapies 1999;5:16-18.
24. Post SG, Puchalski CM, Larson DB. Physicians and patient spirituality: professional boundaries, competency, and ethics. Ann Intern Med 2000;132:578-83.
25. Foglio JP, Brody H. Religion, faith, and family medicine. J Fam Pract 1988;27:473-4.
26. Maugans TA, Wadland WC. Religion and family medicine: a survey of physicians and patients. J Fam Pract 1991;32:210-3.
27. Oyama O, Koenig HG. Religious beliefs and practices in family medicine. Arch Fam Med 1998;7:431-5.
28. Pfeifer MP, Sidorov JE, Smith AC, Boero JF, Evans AT, Settle MB. EOL study group. The discussion of end of life medical care by primary care patients and physicians: a multicenter study using structured qualitative interviews. J Gen Intern Med 1994;9:82-8.
29. Farber SJ, Egnew TR, Herman-Bertsch JL. Issues in end-of-life care: family practice faculty perceptions. J Fam Pract 1999;49:525-30.
30. Hatch RL, Naberhaus DS, Helmich LK, Burg MA. Spiritual involvement and beliefs scale: development and testing of a new instrument. J Fam Pract 1999;46:476-86.
The Relationship Between Insomnia and Health-Related Quality of Life in Patients With Chronic Illness
OBJECTIVES: To determine the association between insomnia and health-related quality of life (HRQOL) in patients with chronic illness after accounting for the effects of depression, anxiety, and medical comorbidities.
STUDY DESIGN: We used a cross-sectional analysis of Medical Outcomes Study (MOS) data.
POPULATION: The sample consisted of 3445 patients who completed a self-administered questionnaire and who were given a diagnosis of 1 or more of 5 chronic medical and psychiatric conditions by an MOS clinician. Patients were recruited from the offices of clinicians practicing family medicine, internal medicine, endocrinology, cardiology, and psychiatry in 3 US cities.
OUTCOMES MEASURED: Outcomes were sleep items, health-related quality of life as measured by the Medical Outcomes Study Short Form Health Survey (SF-36), chronic medical comorbidity, depression, and anxiety. Insomnia was defined as the complaint of difficulty initiating or maintaining sleep.
RESULTS: Insomnia was severe in 16% and mild in 34% of study patients. Patients with insomnia demonstrated significant global decrements in HRQOL. Differences between patients with mild insomnia versus no insomnia showed small to medium decrements across SF-36 subscales ranging from 4.1 to 9.3 points (on a scale of 0 to 100); the corresponding decrements for severe insomnia (versus no insomnia) ranged from 12.0 to 23.9 points.
CONCLUSIONS: Insomnia is independently associated with worsened HRQOL to almost the same extent as chronic conditions such as congestive heart failure and clinical depression.
- The prevalence of insomnia in patients with chronic medical or psychiatric conditions is high (50% in the current study sample).
- Insomnia is independently associated with worsened health-related quality of life across several domains, especially mental health, vitality, and general health perceptions, even after accounting for the presence of comorbidities.
- Clinicians should not ignore insomnia; identification and appropriate treatment of this disorder in primary care can significantly improve quality of life.
Insomnia, one of the most common complaints in primary care practice, affects more than 60 million Americans.1 Inadequate sleep has been associated with reduced physical health,2 subsequent decline in health status, and increased mortality.3,4 Patients with chronic insomnia are more likely to develop affective disorders.5,6 Insomnia may worsen somatic symptoms.7 Recent studies in health maintenance organization enrollees have demonstrated that insomnia is independently associated with significantly greater functional impairment, more days of disability related to health problems, and greater use of medical services.8,9
Patients often present to primary care physicians with chronic comorbidities that may adversely affect sleep quality and that may also compromise functional status. While previous investigations have consistently shown decreased functional status in subjects with insomnia, these studies have tended to focus on general population samples,10-12 health plan enrollees,8,9,13 or volunteers recruited by media advertisement.14 In addition, most of the studies either lacked detailed assessment of medical or psychiatric comorbidities or did not control for the presence of these comorbidities in the analysis. Thus, our study aims to (1) determine whether insomnia is independently associated with decreased health-related quality of life (HRQOL) in patients with chronic conditions, and (2) compare the decrease in quality of life associated with insomnia with that associated with other chronic conditions.
Methods
We conducted a cross-sectional analysis of data from the Medical Outcomes Study (MOS), an observational study of health outcomes for patients with chronic medical and psychiatric conditions.15-21
Sample and data collection
Study participants were English-speaking adults who had had an office visit with 1 of 523 clinicians trained in family practice, general internal medicine, cardiology, endocrinology, psychiatry, or clinical psychology during 9-day screening periods held from February to November 1986. Patients who were eligible for inclusion in the MOS baseline panel completed questionnaires addressing general health status (the Medical Outcomes Study Short Form Health Survey [SF-36]), alcohol use, exercise, and sleep.
Data from standardized physician-completed forms were used to identify patients with 5 index conditions: hypertension, diabetes, congestive heart failure, recent myocardial infarction, and depression.15-20 We identified patients with depression using a short form of the Center for Epidemiologic Studies—Depression (CES-D) Scale22 and then used the National Institute of Mental Health Diagnostic Interview Schedule (DIS) to assess its severity.18,22 The definition of current depressive disorder was based on Diagnostic and Statistical Manual, 3rd ed. (DSM-III ), criteria for lifetime major depression or dysthymia during the previous 12 months (DSM-IV was unavailable at the time of the MOS). Patients with depressive symptoms who did not satisfy this definition were considered to have subthreshold depression.23
Measures of HRQOL
The SF-36 is a 36-item generic quality-of-life measure that assesses 8 domains: (1) physical functioning; (2) role limitation due to physical health problems (role physical); (3) bodily pain; (4) general health perceptions; (5) vitality; (6) social functioning; (7) role limitations due to emotional health problems (role emotional); and (8) mental health.24-26 Physical function and role physical scales best distinguish between groups differing in severity of chronic medical conditions and have the purest interpretation with regard to physical health; mental health and role-emotional scales best distinguish between groups differing in severity of psychiatric disorders and have the purest interpretation with regard to mental health. Social function, vitality, and general health perception scales measure both physical and mental health status.24 All health measures were scored on scales of 0 to 100, with higher scores indicating better health.
Measures of sleep
Insomnia was defined as the complaint of initiating or maintaining sleep (CIMS) using a 6-point categorical scale, with responses ranging from “all of the time” to “never.”27 Mild insomnia was defined by responses to 2 of the MOS sleep items indicating difficulty in initiating or maintaining sleep over the prior 4 weeks “some” or “a good bit” of the time; severe insomnia was defined by difficulty “most” or “all” of the time. By inquiring about sleep over the prior 4 weeks, the 2-item measure of DSM-III captures key elements of the DSM-IV definition28 and is similar to definitions used in other epidemiologic investigations of insomnia.29,30
The measure provides a simple tool for the identification of chronic insomnia in busy primary care practice. In addition, the validity of this 2-item categorical measure is supported by excellent concordance between this measure and a continuous 5-item measure of insomnia (details available on request from the author). The 2-item measure, it is important to note, does not include the DSM-IV item pertaining to impairment of daytime functioning, as this item is closely related to the dependent variables of interest in this study.
Measures of potential confounders
We used an indicator of poverty by dichotomizing per capita household income (in 1985 dollars) at a cut-off point of 200% of the poverty level. Alcohol and smoking status were assessed with a 3-point scale: no history of use, past user, or current user. Frequency of exercise was assessed with the question, “How often do you exercise?” on a 6-point Likert-type scale, with responses ranging from “daily or almost daily” to “almost never or never.” Subjects were overweight if body mass index (BMI) exceeded 25 and obese if BMI exceeded 30.31,32
We identified 16 common medical conditions comorbid to the index conditions by using data from the MOS standardized health examination. Data on medications were excluded because they do not reflect contemporary patterns of medication use and because of collinearity between medication and comorbidity variables already in the model.
Statistical analysis
We used multiple linear regression to identify the association between insomnia and HRQOL. We adjusted for sociodemographic characteristics, health habits, index conditions, severity of index conditions,19 a count of the 16 medical comorbidities,34 and study location. To account for the potentially nonlinear relationship between age and HRQOL, we included 3 dummy variables for age: 40 to 55 years, 56 to 65 years, and older than 65 years (age younger than 40 years was the holdout category). Similarly, we included dummy variables for education (less than 12 years or exactly 12 years; more than 12 years was the holdout category) and exercise (at least 4 times a week or less than once a week; 1 to 3 times a week was the holdout category).
We report the average deviation in HRQOL values for mild and severe insomnia and for 2 comparison conditions: clinical depression and congestive heart failure (CHF). These conditions were selected because they are representative of conditions with predominant effects on physical functioning (CHF) and mental health (depression).17,24,25 The average deviation in HRQOL is represented by the regression coefficients corresponding to the terms for these conditions in each HRQOL model.17 Because all patients in the current study had at least 1 of the 5 physician-identified conditions, we used the subgroup of patients with mild hypertension19 and without insomnia as the reference group.
We also performed a subset analysis of 2197 patients who had completed a screening version of the DIS for anxiety disorders (generalized anxiety disorder, phobia, or panic disorder) at the baseline health evaluation. In this patient subset, we constructed a series of regression models and examined the change in average deviation in HRQOL associated with insomnia with the addition of groups of covariates (sociodemographics, health habits, medical conditions, depression, and anxiety) to a base model including only insomnia and study location variables.
We also examined whether our results were robust by using logistic regression. Because most of the dependent variables are highly skewed (and thus may not satisfy the distributional assumptions of linear regression), we dichotomized each dependent variable as categorical (lowest tertile versus middle and upper tertiles) and determined the odds ratios for mild and severe insomnia associated with the lowest tertile of each HRQOL measure. Because we assessed the significance of both mild and severe insomnia in 8 different HRQOL domains, we used the Bonferroni correction to adjust for multiple comparisons (only P values ≥.003 were considered statistically significant).
Finally, we checked for selected 2-way interaction terms to determine whether the association between insomnia and HRQOL differed significantly by age, gender, race, education, and burden of comorbidity.28,35,36
Results
Baesd on our definition of insomnia, 16% of study patients had severe insomnia and 34% had mild insomnia. Patients with mild and severe insomnia were more likely to be female, nonwhite, poor, unemployed, and unmarried. They were also more likely to have clinical (or subthreshold) depression, congestive heart failure, and a greater number of medical comorbidities (Table 1).
We found a significant independent association between insomnia and HRQOL, even after we had statistically controlled for sociodemographic characteristics, health habits, BMI, medical comorbidities, and the presence of clinical and subthreshold depression. All covariates were forced into each HRQOL model simultaneously. Insomnia showed the strongest associations with mental health, vitality, and social subscales (based on the Wald statistic).
Relative to patients without insomnia, increased severity of insomnia was associated with a progressively greater deviation in HRQOL (Table 2). The decreases in HRQOL observed for mild and severe insomnia were pervasive across all SF-36 domains and were similar when the sample was restricted to those patients seen by a primary care clinician (family physician or general internist, n = 2463). The magnitude of the average deviation in physical function for severe insomnia was comparable with that observed for CHF; similarly, the average deviation in the mental health domain for severe insomnia was about 60% that observed for clinical depression.
Mild and severe insomnia were associated with diminished HRQOL across all SF-36 domains using logistic regression (relative to patients without insomnia); however, the magnitude of associations for subscales differed somewhat. In these analyses, the adjusted odds ratios for mild and severe insomnia were greatest for mental health (3.5 and 10.2, respectively), vitality (2.4 and 7.4, respectively), and general health perceptions (2.0 and 5.1, respectively). Other subscale results are available on request from the author.
The incremental effect of controlling for chronic medical conditions, depression, and anxiety on the decrements in HRQOL associated with insomnia is demonstrated in Table 3 for selected domains. Addition of medical variables reduces the strength of association between insomnia and physical function by 28% and 28%, vitality by 17% and 18%, and mental health by 12% and 12% (for mild and severe insomnia, respectively). Subsequent addition of depression and anxiety variables reduces the strength of association between insomnia and mental health by 33% and 38%, vitality by 18% and 23%, and physical function by 11% and 10% (for mild and severe insomnia, respectively). Even after accounting for depression and anxiety, both mild and severe insomnia account for significantly decreased HRQOL in this subset analysis.
In tests of interactions, the association between insomnia and HRQOL was similar across age, gender, race, education, and comorbidity (≥3 versus <3 comorbid conditions). Of a total of 64 interaction terms across all SF-36 subscales, only 3 were statistically significant and no consistent pattern was observed; this is what would be expected by chance alone.
TABLE 1
PATIENT CHARACTERISTICS ACROSS INSOMNIA GROUPS
| Variable | No Insomnia (N = 1583) | Mild Insomnia (N = 1145) | Severe Insomnia (N = 540) |
|---|---|---|---|
| Demographics | |||
| Age, mean (SD) | 53.8 (15) | 54.8 (16) | 53.1 (17) |
| Gender (% male)* | 44 | 35 | 27 |
| Race (% nonwhite)* | 18 | 22 | 26 |
| Income, mean adjusted 1985 household dollars* | $24,649 | $22,376 | $19,506 |
| Education, years (mean)* | 13.7 | 13.2 | 12.7 |
| Employed (%)* | 59 | 49 | 43 |
| Married (%)* | 62 | 58 | 51 |
| Clinical conditions, % | |||
| Hypertension* | 66 | 59 | 49 |
| Congestive heart failure* | 4 | 7 | 9 |
| Myocardial infarction† | 3 | 4 | 2 |
| Diabetes mellitus (type 1 or 2)† | 20 | 16 | 17 |
| Clinical depression* | 9 | 15 | 32 |
| Subthreshold depression* | 17 | 27 | 29 |
| Mean number of comorbidities* | 1.2 | 1.5 | 1.8 |
| *P≤.001. | |||
| †P≤.05. | |||
| SD denotes standard deviation. | |||
TABLE 2
AVERAGE DEVIATION IN HEALTH-RELATED QUALITY OF LIFE (HRQOL) DOMAINS ASSOCIATED WITH INSOMNIA IN THE MEDICAL OUTCOMES STUDY CROSS-SECTIONAL SAMPLE (N=3445)
| Average Deviation From Reference Group* | |||||
|---|---|---|---|---|---|
| HRQOL Domain | Average Score of Reference Group | Mild Insomnia | Severe Insomnia | Congestive Heart Failure | Clinical Depression |
| Physical function | 80.8 | -4.1 (0.8)† | -12.0 (1.1)† | -14.8 (1.7)† | -4.8 (1.3)† |
| Role, physical | 69.5 | -8.9 (1.4)† | -23.9 (1.9)† | -13.1 (2.8)† | -16.0 (2.2)† |
| Pain | 76.1 | -4.9 (0.9)† | -15.2 (1.1)† | 1.8 (1.7) | -8.9 (1.3)† |
| General health perception | 65.1 | -5.6 (0.8)† | -12.6 (1.0)† | -11.2 (1.5)† | -8.7 (1.2)† |
| Vitality | 64.0 | -7.2 (0.7)† | -16.0 (1.0)† | -7.5 (1.5)† | -13.0 (1.2)† |
| Social | 90.3 | -5.6 (0.8)† | -15.7 (1.1)† | -6.4 (1.6)† | -22.6 (1.3)† |
| Role, emotional | 80.8 | -9.3 (1.4)† | -18.7 (1.9)† | -3.5 (2.8) | -31.6 (2.2)† |
| Mental health | 80.0 | -6.6 (0.6)† | -14.6 (0.8)† | 0.5 (1.2) | -24.6 (1.0)† |
| NOTE: Average deviations in HRQOL for a chronic medical condition (congestive heart failure) and a chronic psychiatric condition (clinical depression) are provided for comparison. | |||||
| *These values correspond to the coefficients for insomnia and comparison conditions in HRQOL regression models, which are statistically controlled for demographic factors, health habits, obesity, other chronic conditions, disease severity, and study location; standard errors are in parentheses. All HRQOL values are scored on a scale of 0 to 100. The reference group (N = 1073) is defined as patients with mild hypertension (and no other tracer conditions) and no insomnia. For example, patients with severe insomnia at baseline experienced a 12.0-point decrement in physical functioning (on average) compared with the reference group | |||||
| †P ≤ .001. | |||||
TABLE 3
THE EFFECT OF ADDING SPECIFIC VARIABLE GROUPS ON THE AVERAGE DEVIATION IN HEALTH-RELATED QUALITY OF LIFE (HRQOL) DOMAINS ASSOCIATED WITH INSOMNIA AT BASELINE
| Physical Function | Vitality | Mental Health | ||||
|---|---|---|---|---|---|---|
| Model | Mild Insomnia | Severe Insomnia | Mild Insomnia | Severe Insomnia | Mild Insomnia | Severe Insomnia |
| (1) Insomnia only* | -9.6 | -18.5 | -11.5 | -23.8 | -10.2 | -23.7 |
| (2) Insomnia + sociodemographics† | -8.0 | -16.3 | -10.7 | -22.0 | -9.9 | -21.9 |
| (3) Insomnia + sociodemographics + health habits‡ | -7.5 | -15.1 | -10.3 | -21.1 | -9.7 | -21.5 |
| (4) Insomnia + sociodemographics + health habits + medical§ | -5.4 | -10.9 | -8.5 | -17.3 | -8.5 | -19.0 |
| (5) Insomnia + sociodemographics + health habits + medical + depression║ | -4.9 | 10.1 | -7.4 | -14.7 | -6.3 | -13.7 |
| (6) Model 5 + anxiety¶ | -4.8 | -9.8 | -7.0 | -13.4 | -5.7 | -11.7 |
| Adjusted R2 (model 5) | 0.37 | 0.31 | 0.49 | |||
| NOTE: Analysis sample is limited to those patients who completed a screening evaluation for anxiety disorders (n = 2197). | ||||||
| * Includes mild and severe insomnia. Average deviations are statistically significant at the P < .001 level for all models. Note that in the main analysis (Table 2), all variables, including terms for insomnia and potential confounders, were forced into each HRQOL model simultaneously. | ||||||
| †Sociodemographic variables include age, sex, race, education, income, and marital status. | ||||||
| ‡Health habits include alcohol use, smoking status, and exercise frequency. | ||||||
| §Medical variables include medical tracer conditions (hypertension, myocardial infarction, congestive heart failure, diabetes mellitus), including severity status, number of comorbid medical conditions (see text), and obesity. | ||||||
| ║Depression variables include current depressive disorder and subthreshold depression. | ||||||
| ¶Anxiety variable is defined as any anxiety disorder (generalized anxiety disorder, phobia, or panic disorder) over the previous 12 months. | ||||||
Discussion
Physicians often ignore sleep disorders such as insomnia in clinical practice, in part because of increasing time constraints and because of poor preparation to deal with sleep disorders.37,38 The National Commission on Sleep Disorders Research (NCSDR) reviewed 10,000 medical records from 9 family practice clinics, finding only 123 records that contained a note about the patient’s sleep; not a single record suggested an effective response to the patient’s sleep complaint.1 Ignoring insomnia can have major implications for public health, however. Insomnia increases the risk of occupational injury and traffic accidents; a recent study concluded that driving while sleepy was at least as dangerous as the risk of driving under the influence of alcohol.39 Similarly, a 1991 national survey showed that respondents with chronic insomnia are more likely to feel sleepy when driving, to have impaired concentration, and to have problems in accomplishing daily tasks.10
Our results extend the results of previous investigations by demonstrating that insomnia is independently associated with a significant decrease in overall quality of life for patients with chronic illness. The magnitude of this decrease for severe insomnia is comparable with that observed for chronic conditions such as CHF and clinical depression. We found that such decrements worsened with increased levels of sleep disturbance and that these decreased values persisted even after accounting for medical comorbidity, depression, and anxiety. These findings are similar to the results of a recent population-based investigation, in which insomnia was associated with global decreases in HRQOL, even after excluding subjects who met DSM-IV criteria for depression or anxiety.12
Another possible explanation for the negative association between insomnia and HRQOL is that patients with insomnia overreport functional impairment in a systematic fashion. This phenomenon has been described in depressed patients as “negative thinking bias,”40 and it is possible that insomnia also leads to biased reporting. While it is difficult to rule this out, analyses of the health care behavior of patients with insomnia provides indirect evidence of the functional impairment of these patients, as measured by their increased use of medical and mental health services.8,9,13
Limitations
The limitations of our study deserve comment. First, the MOS included a select group of physicians and their patients who agreed to participate in a comprehensive study of medical care. That the MOS sampled only patients with 5 chronic conditions who were insured and had a continuous relationship with a provider in 3 large urban areas limits the ability to generalize. Noteworthy, however, is that the prevalence of mild or severe insomnia in the MOS sample (50%) was comparable with that reported in a recent study of managed-care enrollees (46%).9
Second, this analysis is based on cross-sectional data. We cannot rule out the possibility that decreased quality of life leads to insomnia (ie, reverse causality). The causal relation of insomnia to diminished HRQOL is supported by longitudinal data suggesting that insomnia is an important precursor of depression.5,41 Alternatively, insomnia may partially mediate the effect of chronic conditions such as CHF on HRQOL. Indeed, prior work has shown that worsening of chronic conditions tends to be associated with worsening of insomnia during follow-up, and vice versa.42
Third, sleep problems were assessed by self-report. No attempt was made to validate our findings with polysomnographic measurements. Polysomnography has limited value in the evaluation of insomnia; many self-identified insomniacs do not show objective sleep abnormalities on polysomnography43 and tend to have high night-to-night variability in the quality of their sleep.44 Indeed, some discrepancies may exist between self-reported sleep and laboratory data.45,46 Data obtained from MOS patients regarding other measures of sleep (including total sleep time, sleep latency, and adequacy of sleep) appear to verify the existence of sleep problems.42
Fourth, the definition of depression was based on DSM-III criteria, which differ somewhat from those of DSM-IV. We note, however, that the primary emphasis in revising the DSM-III criteria for these conditions was to improve discrimination between major depression and dysthymia,47 for both of which our analysis controlled. In addition, the diagnostic criteria for major depression and dysthymia incorporate sleep disturbance; thus, adjustment for depression would tend to reduce the estimated association between insomnia and HRQOL (as confirmed in Table 3).
Interpretation of the above findings should account for the nature of the study sample. Because all patients in the study sample had chronic conditions, average deviations in HRQOL scores were computed relative to the group with mild hypertension and without insomnia (reference group). Because even mild hypertension and its treatment may have an impact on several HRQOL domains,48 the associations between insomnia and HRQOL in the current study would probably have been even stronger if the reference group comprised patients with no chronic conditions.
While depression and insomnia (one of the diagnostic criteria for depression) overlap considerably, pharmacologic and behavioral approaches, including light therapy49-52 and exercise,53 have potential to significantly lessen the burden of chronic insomnia and its effect on HRQOL.54 In addition, clinicians should identify (and treat, if possible) predisposing conditions associated with insomnia.28,36,42 Finally, future clinical trials involving treatment of insomnia should incorporate measures, such as the SF-36, that can detect clinically meaningful effects of insomnia on HRQOL in addition to standard laboratory and self-reported measures of sleep disturbance.
Conclusions
Even after accounting for the presence of chronic medical comorbidities, depression, and anxiety, insomnia is associated with significantly worsened HRQOL, particularly in the domains of mental health, vitality, and general health perceptions. By identifying and treating chronic insomnia, including any predisposing conditions that may perpetuate insomnia, clinicians can significantly improve the quality of life of patients with chronic illness.
Acknowledgments
Dr Katz’s work on this study was supported by institutional funds from the University of Wisconsin Medical School, Graduate School, and Department of Medicine. Dr McHorney’s work on this study was supported by the Department of Veterans Affairs (HSR&D HFP #96-001; RR&D C-2016; HSR&D IIR #95-033). Dr Katz is a Robert Wood Johnson Generalist Physician Faculty Scholar.
1. National Commission on Sleep Disorders Research. Wake Up, America: A National Sleep Alert. Washington, DC; 1993.
2. Reed W. Physical health status as a consequence of health practices. J Community Health 1983;8:217-28.
3. Belloc N. Relationships of health practices and mortality. Prev Med 1973;2:67-81.
4. Wiley J, Camacho T. Lifestyle and future health: evidence from the Alameda County Study. Prev Med 1980;9:1-21.
5. Ford D, Kamerow D. Epidemiologic study of sleep disturbances and psychiatric disorders: an opportunity for prevention? JAMA 1989;262:1479-84.
6. Eaton W, Badawi M, Melton B. Prodromes and precursors: epidemiologic data for primary prevention of disorders with slow onset. Am J Psychiatry 1995;152:967-72.
7. Regestein Q. Sleep disorders in the medically ill. In: Stoudemire A, Fogel BS, eds. Principles of Medical Psychiatry. 1st ed. Orlando, Fla: Grune & Stratton 1987;271-302.
8. Simon G, VonKorff M. Prevalence, burden, and treatment of insomnia in primary care. Am J Psychiatry 1997;154:1417-23.
9. Hatoum H, Kong S, Kania C, Wong J, Mendelson W. Insomnia, health-related quality of life and healthcare resource consumption: a study of managed-care organization enrollees. Pharmacoeconomics 1998;14:629-37.
10. Roth T, Ancoli-Israel S. Daytime consequences and correlates of insomnia in the United States: results of the 1991 National Sleep Foundation Survey. II. Sleep 1999;22(suppl 2):S354-S358.
11. Chevalier H, Los F, Boichut D, et al. Evaluation of severe insomnia in the general population: results of a European multinational survey. J Psychopharmacology 1999;13:S21-4.
12. Leger D, Scheuermaier K, Philip P, Paillard M, Guilleminault C. SF36: evaluation of quality of life in severe and mild insomniacs compared with good sleepers. Psychosom Med 2001;63:49-55.
13. Kuppermann M, Lubeck D, Mazonson P, et al. Sleep problems and their correlates in a working population. J Gen Intern Med 1995;10:25-32.
14. Zammit G, Weiner J, Damato N, Sillup G, McMillan C. Quality of life in people with insomnia. Sleep 1999;22(suppl 2):S379-S385.
15. Stewart A, Ware J. Measuring functioning and well-being. Durham, NC: Duke University Press, 1992.
16. Tarlov A, Ware J, Greenfield S, Nelson E, Perrin E, Zubkoff M. The Medical Outcomes Study: an application of methods for monitoring the results of medical care. JAMA 1989;262:925-30.
17. Stewart A, Greenfield S, Hays R, et al. Functional status and well-being of patients with chronic conditions: results from the Medical Outcomes Study. JAMA 1989;262:907-13.
18. Wells K, Stewart A, Hays R, et al. The functioning and well-being of depressed patients: results from the Medical Outcomes Study. JAMA 1989;262:914-9.
19. Kravitz R, Greenfield S, Rogers W, Manning W, Zubkoff M. Differences in the mix of patients among medical specialties and systems of care: results from the Medical Outcomes Study. JAMA 1992;267:1617-23.
20. Wells K, Hays R, Burnam M, et al. Detection of depressive disorder for patients receiving prepaid or fee-for-service care: results from the Medical Outcomes Study. JAMA 1989;262:3298-302.
21. Nelson E, Manning W, Rogers W. A longitudinal study of hospitalization rates for patients with chronic disease: results from the Medical Outcomes Study. Health Serv Res 1998;32:759-74.
22. Burnam M, Wells K, Leake B, Landsverk J. Development of a brief screening instrument for detecting depressive disorders. Med Care 1988;26:775-89.
23. Wells K, Burnam M, Rogers W, Hays R, Camp P. The course of depression in adult outpatients: results from the Medical Outcomes Study. Arch Gen Psychiatry 1992;49:788-94.
24. McHorney C, Ware J, Raczek A. The MOS 36-item short-form health survey (SF-36): II. Psychometric and clinical tests of validity in measuring physical and mental health constructs. Med Care 1993;31:247-63.
25. McHorney C, Ware J, Rogers W, Raczek A. The validity and relative precision of MOS Short- and Long-Form health status scales and Dartmouth COOP Charts: results from the Medical Outcomes Study. Med Care 1992;30:MS253-65.
26. McHorney C, Ware J, Lu J, Sherbourne C. The MOS 36-item short-form health survey (SF-36): III. Tests of data quality, scaling assumptions, and reliability across diverse patient groups. Med Care 1994;32:40-66.
27. Hays R, Stewart A. Sleep measures. In: Stewart A, Ware J, eds. Measuring functioning and well-being: the Medical Outcomes Study Approach. Durham, NC: Duke University Press, 1992.
28. Diagnostic and statistical manual of mental disorders. 4th ed. Washington, DC: American Psychiatric Association, 1994.
29. Bixler E, Kales A, Soldatos C. Prevalence of sleep disorders in the Los Angeles metropolitan area. Am J Psychiatry 1979;136:1257-62.
30. Klink M, Quan S, Kaltenborn W, Lebowitz M. Risk factors associated with complaints of insomnia in a general adult population. Arch Intern Med 1992;152:1634-7.
31. National Institutes of Health. Clinical guidelines on the identification, evaluation and treatment of overweight and obesity in adults: the evidence report. Washington, DC: National Institutes of Health, 1998.
32. Katz D, McHorney C, Atkinson R. The impact of obesity on health-related quality of life (HRQOL) in patients with chronic illness. J Gen Intern Med 2000;15:789-96.
33. Sherbourne C, Jackson C, Meredith L, Camp P, Wells K. Prevalence of comorbid anxiety disorders in primary care outpatients. Arch Fam Med 1996;5:27-34.
34. Hays R, Wells K, Sherbourne C, Rogers W, Spritzer K. Functioning and well-being outcomes of patients with depression compared with chronic general medical illness. Arch Gen Psychiatry 1995;52:11-19.
35. Middelkoop H, Smilde-vandenDoel D, Knuistingh N, Kamphuisen H, Springer C. Subjective sleep characteristics of 1,485 males and females aged 50-93: effects of sex and age, and factors related to self-evaluated quality of sleep. J Gerontol 1996;51A:M108-15.
36. Foley D, Monjan A, Brown S, Simonsick E, Wallace R, Blazer D. Sleep complaints among elderly persons: an epidemiologic study of three communities. Sleep 1995;18:425-32.
37. Haponik E, Frye A, Richards B, Wymer A, Hinds A. Sleep history is neglected diagnostic information. J Gen Intern Med 1996;11:759-61.
38. Everitt D, Avorn J. Clinical decision-making in the evaluation and treatment of insomnia. Am J Med 1990;89:357-62.
39. Powell NB, Schechtman KB, Riley RW, Li K, Troell R, Guilleminault C. The road to danger: the comparative risks of driving while sleepy. Laryngoscope 2001;111:887-93.
40. Mercado A, Smith M, Lecrubier Y, Widlocher D. Depressed subjects unwittingly overreport poor social adjustment which they reappraise when recovered. J Nerv Ment Dis 1991;179:614-9.
41. Chang P, Ford D, Mead L, Cooper-Patrick L, Klag M. Insomnia in young men and subsequent depression: the Johns Hopkins Precursors Study. Am J Epidemiol 1997;146:105-14.
42. Katz D, McHorney C. Clinical correlates of insomnia in patients with chronic illness. Arch Intern Med 1998;158:1099-107.
43. Reite M, Buysse D, Reynolds C, Mendelson W. The use of polysomnography in the evaluation of insomnia. Sleep 1995;18:58-70.
44. Roth T, Kramer M, Lutz T. The nature of insomnia: a descriptive summary of a sleep clinic population. Compr Psychiatry 1976;17:217-20.
45. Carskadon M, Dement W, Mitler M, Guilleminault C, Zarcone V, Spiegel R. Self-reports versus sleep laboratory findings in 122 drug-free subjects with complaints of chronic insomnia. Am J Psychiatry 1976;133:1382-8.
46. Baekeland F, Hoy P. Reported vs recorded sleep characteristics. Arch Gen Psychiatry 1971;24:548-51.
47. Widiger T, Frances A, Pincus H, et al. DSM-IV Sourcebook. Vol. 4. Washington, DC, 1998;717-32.
48. Lawrence W, Fryback DG, Martin PA, Klein R, Klein BE. Health status and hypertension: a population-based study. J Clin Epidemiol 1996;49:1239-45.
49. Kupfer D, Reynolds C. Management of insomnia. N Engl J Med 1997;336:341-6.
50. Guilleminault C, Clerk A, Black J, Labanowski M, Pelayo R, Claman D. Nondrug treatment trials in psychophysiologic insomnia. Arch Intern Med 1995;155:838-44.
51. Ancoli-Israel S. Insomnia in the elderly: a review for the primary care practitioner. Sleep 2000;23(suppl 1):S23-30.
52. Benca RM. Consequences of insomnia and its therapies. J Clin Psychiatry 2001;62:33-8.
53. King A, Oman R, Brassington G, Bliwise D, Haskell W. Moderate-intensity exercise and self-rated quality of sleep in older adults. JAMA 1997;277:32-7.
54. National Heart Lung and Blood Institute Working Group on Insomnia. Insomnia: assessment and management in primary care. Am Fam Physician 1999;59:3029-38.
OBJECTIVES: To determine the association between insomnia and health-related quality of life (HRQOL) in patients with chronic illness after accounting for the effects of depression, anxiety, and medical comorbidities.
STUDY DESIGN: We used a cross-sectional analysis of Medical Outcomes Study (MOS) data.
POPULATION: The sample consisted of 3445 patients who completed a self-administered questionnaire and who were given a diagnosis of 1 or more of 5 chronic medical and psychiatric conditions by an MOS clinician. Patients were recruited from the offices of clinicians practicing family medicine, internal medicine, endocrinology, cardiology, and psychiatry in 3 US cities.
OUTCOMES MEASURED: Outcomes were sleep items, health-related quality of life as measured by the Medical Outcomes Study Short Form Health Survey (SF-36), chronic medical comorbidity, depression, and anxiety. Insomnia was defined as the complaint of difficulty initiating or maintaining sleep.
RESULTS: Insomnia was severe in 16% and mild in 34% of study patients. Patients with insomnia demonstrated significant global decrements in HRQOL. Differences between patients with mild insomnia versus no insomnia showed small to medium decrements across SF-36 subscales ranging from 4.1 to 9.3 points (on a scale of 0 to 100); the corresponding decrements for severe insomnia (versus no insomnia) ranged from 12.0 to 23.9 points.
CONCLUSIONS: Insomnia is independently associated with worsened HRQOL to almost the same extent as chronic conditions such as congestive heart failure and clinical depression.
- The prevalence of insomnia in patients with chronic medical or psychiatric conditions is high (50% in the current study sample).
- Insomnia is independently associated with worsened health-related quality of life across several domains, especially mental health, vitality, and general health perceptions, even after accounting for the presence of comorbidities.
- Clinicians should not ignore insomnia; identification and appropriate treatment of this disorder in primary care can significantly improve quality of life.
Insomnia, one of the most common complaints in primary care practice, affects more than 60 million Americans.1 Inadequate sleep has been associated with reduced physical health,2 subsequent decline in health status, and increased mortality.3,4 Patients with chronic insomnia are more likely to develop affective disorders.5,6 Insomnia may worsen somatic symptoms.7 Recent studies in health maintenance organization enrollees have demonstrated that insomnia is independently associated with significantly greater functional impairment, more days of disability related to health problems, and greater use of medical services.8,9
Patients often present to primary care physicians with chronic comorbidities that may adversely affect sleep quality and that may also compromise functional status. While previous investigations have consistently shown decreased functional status in subjects with insomnia, these studies have tended to focus on general population samples,10-12 health plan enrollees,8,9,13 or volunteers recruited by media advertisement.14 In addition, most of the studies either lacked detailed assessment of medical or psychiatric comorbidities or did not control for the presence of these comorbidities in the analysis. Thus, our study aims to (1) determine whether insomnia is independently associated with decreased health-related quality of life (HRQOL) in patients with chronic conditions, and (2) compare the decrease in quality of life associated with insomnia with that associated with other chronic conditions.
Methods
We conducted a cross-sectional analysis of data from the Medical Outcomes Study (MOS), an observational study of health outcomes for patients with chronic medical and psychiatric conditions.15-21
Sample and data collection
Study participants were English-speaking adults who had had an office visit with 1 of 523 clinicians trained in family practice, general internal medicine, cardiology, endocrinology, psychiatry, or clinical psychology during 9-day screening periods held from February to November 1986. Patients who were eligible for inclusion in the MOS baseline panel completed questionnaires addressing general health status (the Medical Outcomes Study Short Form Health Survey [SF-36]), alcohol use, exercise, and sleep.
Data from standardized physician-completed forms were used to identify patients with 5 index conditions: hypertension, diabetes, congestive heart failure, recent myocardial infarction, and depression.15-20 We identified patients with depression using a short form of the Center for Epidemiologic Studies—Depression (CES-D) Scale22 and then used the National Institute of Mental Health Diagnostic Interview Schedule (DIS) to assess its severity.18,22 The definition of current depressive disorder was based on Diagnostic and Statistical Manual, 3rd ed. (DSM-III ), criteria for lifetime major depression or dysthymia during the previous 12 months (DSM-IV was unavailable at the time of the MOS). Patients with depressive symptoms who did not satisfy this definition were considered to have subthreshold depression.23
Measures of HRQOL
The SF-36 is a 36-item generic quality-of-life measure that assesses 8 domains: (1) physical functioning; (2) role limitation due to physical health problems (role physical); (3) bodily pain; (4) general health perceptions; (5) vitality; (6) social functioning; (7) role limitations due to emotional health problems (role emotional); and (8) mental health.24-26 Physical function and role physical scales best distinguish between groups differing in severity of chronic medical conditions and have the purest interpretation with regard to physical health; mental health and role-emotional scales best distinguish between groups differing in severity of psychiatric disorders and have the purest interpretation with regard to mental health. Social function, vitality, and general health perception scales measure both physical and mental health status.24 All health measures were scored on scales of 0 to 100, with higher scores indicating better health.
Measures of sleep
Insomnia was defined as the complaint of initiating or maintaining sleep (CIMS) using a 6-point categorical scale, with responses ranging from “all of the time” to “never.”27 Mild insomnia was defined by responses to 2 of the MOS sleep items indicating difficulty in initiating or maintaining sleep over the prior 4 weeks “some” or “a good bit” of the time; severe insomnia was defined by difficulty “most” or “all” of the time. By inquiring about sleep over the prior 4 weeks, the 2-item measure of DSM-III captures key elements of the DSM-IV definition28 and is similar to definitions used in other epidemiologic investigations of insomnia.29,30
The measure provides a simple tool for the identification of chronic insomnia in busy primary care practice. In addition, the validity of this 2-item categorical measure is supported by excellent concordance between this measure and a continuous 5-item measure of insomnia (details available on request from the author). The 2-item measure, it is important to note, does not include the DSM-IV item pertaining to impairment of daytime functioning, as this item is closely related to the dependent variables of interest in this study.
Measures of potential confounders
We used an indicator of poverty by dichotomizing per capita household income (in 1985 dollars) at a cut-off point of 200% of the poverty level. Alcohol and smoking status were assessed with a 3-point scale: no history of use, past user, or current user. Frequency of exercise was assessed with the question, “How often do you exercise?” on a 6-point Likert-type scale, with responses ranging from “daily or almost daily” to “almost never or never.” Subjects were overweight if body mass index (BMI) exceeded 25 and obese if BMI exceeded 30.31,32
We identified 16 common medical conditions comorbid to the index conditions by using data from the MOS standardized health examination. Data on medications were excluded because they do not reflect contemporary patterns of medication use and because of collinearity between medication and comorbidity variables already in the model.
Statistical analysis
We used multiple linear regression to identify the association between insomnia and HRQOL. We adjusted for sociodemographic characteristics, health habits, index conditions, severity of index conditions,19 a count of the 16 medical comorbidities,34 and study location. To account for the potentially nonlinear relationship between age and HRQOL, we included 3 dummy variables for age: 40 to 55 years, 56 to 65 years, and older than 65 years (age younger than 40 years was the holdout category). Similarly, we included dummy variables for education (less than 12 years or exactly 12 years; more than 12 years was the holdout category) and exercise (at least 4 times a week or less than once a week; 1 to 3 times a week was the holdout category).
We report the average deviation in HRQOL values for mild and severe insomnia and for 2 comparison conditions: clinical depression and congestive heart failure (CHF). These conditions were selected because they are representative of conditions with predominant effects on physical functioning (CHF) and mental health (depression).17,24,25 The average deviation in HRQOL is represented by the regression coefficients corresponding to the terms for these conditions in each HRQOL model.17 Because all patients in the current study had at least 1 of the 5 physician-identified conditions, we used the subgroup of patients with mild hypertension19 and without insomnia as the reference group.
We also performed a subset analysis of 2197 patients who had completed a screening version of the DIS for anxiety disorders (generalized anxiety disorder, phobia, or panic disorder) at the baseline health evaluation. In this patient subset, we constructed a series of regression models and examined the change in average deviation in HRQOL associated with insomnia with the addition of groups of covariates (sociodemographics, health habits, medical conditions, depression, and anxiety) to a base model including only insomnia and study location variables.
We also examined whether our results were robust by using logistic regression. Because most of the dependent variables are highly skewed (and thus may not satisfy the distributional assumptions of linear regression), we dichotomized each dependent variable as categorical (lowest tertile versus middle and upper tertiles) and determined the odds ratios for mild and severe insomnia associated with the lowest tertile of each HRQOL measure. Because we assessed the significance of both mild and severe insomnia in 8 different HRQOL domains, we used the Bonferroni correction to adjust for multiple comparisons (only P values ≥.003 were considered statistically significant).
Finally, we checked for selected 2-way interaction terms to determine whether the association between insomnia and HRQOL differed significantly by age, gender, race, education, and burden of comorbidity.28,35,36
Results
Baesd on our definition of insomnia, 16% of study patients had severe insomnia and 34% had mild insomnia. Patients with mild and severe insomnia were more likely to be female, nonwhite, poor, unemployed, and unmarried. They were also more likely to have clinical (or subthreshold) depression, congestive heart failure, and a greater number of medical comorbidities (Table 1).
We found a significant independent association between insomnia and HRQOL, even after we had statistically controlled for sociodemographic characteristics, health habits, BMI, medical comorbidities, and the presence of clinical and subthreshold depression. All covariates were forced into each HRQOL model simultaneously. Insomnia showed the strongest associations with mental health, vitality, and social subscales (based on the Wald statistic).
Relative to patients without insomnia, increased severity of insomnia was associated with a progressively greater deviation in HRQOL (Table 2). The decreases in HRQOL observed for mild and severe insomnia were pervasive across all SF-36 domains and were similar when the sample was restricted to those patients seen by a primary care clinician (family physician or general internist, n = 2463). The magnitude of the average deviation in physical function for severe insomnia was comparable with that observed for CHF; similarly, the average deviation in the mental health domain for severe insomnia was about 60% that observed for clinical depression.
Mild and severe insomnia were associated with diminished HRQOL across all SF-36 domains using logistic regression (relative to patients without insomnia); however, the magnitude of associations for subscales differed somewhat. In these analyses, the adjusted odds ratios for mild and severe insomnia were greatest for mental health (3.5 and 10.2, respectively), vitality (2.4 and 7.4, respectively), and general health perceptions (2.0 and 5.1, respectively). Other subscale results are available on request from the author.
The incremental effect of controlling for chronic medical conditions, depression, and anxiety on the decrements in HRQOL associated with insomnia is demonstrated in Table 3 for selected domains. Addition of medical variables reduces the strength of association between insomnia and physical function by 28% and 28%, vitality by 17% and 18%, and mental health by 12% and 12% (for mild and severe insomnia, respectively). Subsequent addition of depression and anxiety variables reduces the strength of association between insomnia and mental health by 33% and 38%, vitality by 18% and 23%, and physical function by 11% and 10% (for mild and severe insomnia, respectively). Even after accounting for depression and anxiety, both mild and severe insomnia account for significantly decreased HRQOL in this subset analysis.
In tests of interactions, the association between insomnia and HRQOL was similar across age, gender, race, education, and comorbidity (≥3 versus <3 comorbid conditions). Of a total of 64 interaction terms across all SF-36 subscales, only 3 were statistically significant and no consistent pattern was observed; this is what would be expected by chance alone.
TABLE 1
PATIENT CHARACTERISTICS ACROSS INSOMNIA GROUPS
| Variable | No Insomnia (N = 1583) | Mild Insomnia (N = 1145) | Severe Insomnia (N = 540) |
|---|---|---|---|
| Demographics | |||
| Age, mean (SD) | 53.8 (15) | 54.8 (16) | 53.1 (17) |
| Gender (% male)* | 44 | 35 | 27 |
| Race (% nonwhite)* | 18 | 22 | 26 |
| Income, mean adjusted 1985 household dollars* | $24,649 | $22,376 | $19,506 |
| Education, years (mean)* | 13.7 | 13.2 | 12.7 |
| Employed (%)* | 59 | 49 | 43 |
| Married (%)* | 62 | 58 | 51 |
| Clinical conditions, % | |||
| Hypertension* | 66 | 59 | 49 |
| Congestive heart failure* | 4 | 7 | 9 |
| Myocardial infarction† | 3 | 4 | 2 |
| Diabetes mellitus (type 1 or 2)† | 20 | 16 | 17 |
| Clinical depression* | 9 | 15 | 32 |
| Subthreshold depression* | 17 | 27 | 29 |
| Mean number of comorbidities* | 1.2 | 1.5 | 1.8 |
| *P≤.001. | |||
| †P≤.05. | |||
| SD denotes standard deviation. | |||
TABLE 2
AVERAGE DEVIATION IN HEALTH-RELATED QUALITY OF LIFE (HRQOL) DOMAINS ASSOCIATED WITH INSOMNIA IN THE MEDICAL OUTCOMES STUDY CROSS-SECTIONAL SAMPLE (N=3445)
| Average Deviation From Reference Group* | |||||
|---|---|---|---|---|---|
| HRQOL Domain | Average Score of Reference Group | Mild Insomnia | Severe Insomnia | Congestive Heart Failure | Clinical Depression |
| Physical function | 80.8 | -4.1 (0.8)† | -12.0 (1.1)† | -14.8 (1.7)† | -4.8 (1.3)† |
| Role, physical | 69.5 | -8.9 (1.4)† | -23.9 (1.9)† | -13.1 (2.8)† | -16.0 (2.2)† |
| Pain | 76.1 | -4.9 (0.9)† | -15.2 (1.1)† | 1.8 (1.7) | -8.9 (1.3)† |
| General health perception | 65.1 | -5.6 (0.8)† | -12.6 (1.0)† | -11.2 (1.5)† | -8.7 (1.2)† |
| Vitality | 64.0 | -7.2 (0.7)† | -16.0 (1.0)† | -7.5 (1.5)† | -13.0 (1.2)† |
| Social | 90.3 | -5.6 (0.8)† | -15.7 (1.1)† | -6.4 (1.6)† | -22.6 (1.3)† |
| Role, emotional | 80.8 | -9.3 (1.4)† | -18.7 (1.9)† | -3.5 (2.8) | -31.6 (2.2)† |
| Mental health | 80.0 | -6.6 (0.6)† | -14.6 (0.8)† | 0.5 (1.2) | -24.6 (1.0)† |
| NOTE: Average deviations in HRQOL for a chronic medical condition (congestive heart failure) and a chronic psychiatric condition (clinical depression) are provided for comparison. | |||||
| *These values correspond to the coefficients for insomnia and comparison conditions in HRQOL regression models, which are statistically controlled for demographic factors, health habits, obesity, other chronic conditions, disease severity, and study location; standard errors are in parentheses. All HRQOL values are scored on a scale of 0 to 100. The reference group (N = 1073) is defined as patients with mild hypertension (and no other tracer conditions) and no insomnia. For example, patients with severe insomnia at baseline experienced a 12.0-point decrement in physical functioning (on average) compared with the reference group | |||||
| †P ≤ .001. | |||||
TABLE 3
THE EFFECT OF ADDING SPECIFIC VARIABLE GROUPS ON THE AVERAGE DEVIATION IN HEALTH-RELATED QUALITY OF LIFE (HRQOL) DOMAINS ASSOCIATED WITH INSOMNIA AT BASELINE
| Physical Function | Vitality | Mental Health | ||||
|---|---|---|---|---|---|---|
| Model | Mild Insomnia | Severe Insomnia | Mild Insomnia | Severe Insomnia | Mild Insomnia | Severe Insomnia |
| (1) Insomnia only* | -9.6 | -18.5 | -11.5 | -23.8 | -10.2 | -23.7 |
| (2) Insomnia + sociodemographics† | -8.0 | -16.3 | -10.7 | -22.0 | -9.9 | -21.9 |
| (3) Insomnia + sociodemographics + health habits‡ | -7.5 | -15.1 | -10.3 | -21.1 | -9.7 | -21.5 |
| (4) Insomnia + sociodemographics + health habits + medical§ | -5.4 | -10.9 | -8.5 | -17.3 | -8.5 | -19.0 |
| (5) Insomnia + sociodemographics + health habits + medical + depression║ | -4.9 | 10.1 | -7.4 | -14.7 | -6.3 | -13.7 |
| (6) Model 5 + anxiety¶ | -4.8 | -9.8 | -7.0 | -13.4 | -5.7 | -11.7 |
| Adjusted R2 (model 5) | 0.37 | 0.31 | 0.49 | |||
| NOTE: Analysis sample is limited to those patients who completed a screening evaluation for anxiety disorders (n = 2197). | ||||||
| * Includes mild and severe insomnia. Average deviations are statistically significant at the P < .001 level for all models. Note that in the main analysis (Table 2), all variables, including terms for insomnia and potential confounders, were forced into each HRQOL model simultaneously. | ||||||
| †Sociodemographic variables include age, sex, race, education, income, and marital status. | ||||||
| ‡Health habits include alcohol use, smoking status, and exercise frequency. | ||||||
| §Medical variables include medical tracer conditions (hypertension, myocardial infarction, congestive heart failure, diabetes mellitus), including severity status, number of comorbid medical conditions (see text), and obesity. | ||||||
| ║Depression variables include current depressive disorder and subthreshold depression. | ||||||
| ¶Anxiety variable is defined as any anxiety disorder (generalized anxiety disorder, phobia, or panic disorder) over the previous 12 months. | ||||||
Discussion
Physicians often ignore sleep disorders such as insomnia in clinical practice, in part because of increasing time constraints and because of poor preparation to deal with sleep disorders.37,38 The National Commission on Sleep Disorders Research (NCSDR) reviewed 10,000 medical records from 9 family practice clinics, finding only 123 records that contained a note about the patient’s sleep; not a single record suggested an effective response to the patient’s sleep complaint.1 Ignoring insomnia can have major implications for public health, however. Insomnia increases the risk of occupational injury and traffic accidents; a recent study concluded that driving while sleepy was at least as dangerous as the risk of driving under the influence of alcohol.39 Similarly, a 1991 national survey showed that respondents with chronic insomnia are more likely to feel sleepy when driving, to have impaired concentration, and to have problems in accomplishing daily tasks.10
Our results extend the results of previous investigations by demonstrating that insomnia is independently associated with a significant decrease in overall quality of life for patients with chronic illness. The magnitude of this decrease for severe insomnia is comparable with that observed for chronic conditions such as CHF and clinical depression. We found that such decrements worsened with increased levels of sleep disturbance and that these decreased values persisted even after accounting for medical comorbidity, depression, and anxiety. These findings are similar to the results of a recent population-based investigation, in which insomnia was associated with global decreases in HRQOL, even after excluding subjects who met DSM-IV criteria for depression or anxiety.12
Another possible explanation for the negative association between insomnia and HRQOL is that patients with insomnia overreport functional impairment in a systematic fashion. This phenomenon has been described in depressed patients as “negative thinking bias,”40 and it is possible that insomnia also leads to biased reporting. While it is difficult to rule this out, analyses of the health care behavior of patients with insomnia provides indirect evidence of the functional impairment of these patients, as measured by their increased use of medical and mental health services.8,9,13
Limitations
The limitations of our study deserve comment. First, the MOS included a select group of physicians and their patients who agreed to participate in a comprehensive study of medical care. That the MOS sampled only patients with 5 chronic conditions who were insured and had a continuous relationship with a provider in 3 large urban areas limits the ability to generalize. Noteworthy, however, is that the prevalence of mild or severe insomnia in the MOS sample (50%) was comparable with that reported in a recent study of managed-care enrollees (46%).9
Second, this analysis is based on cross-sectional data. We cannot rule out the possibility that decreased quality of life leads to insomnia (ie, reverse causality). The causal relation of insomnia to diminished HRQOL is supported by longitudinal data suggesting that insomnia is an important precursor of depression.5,41 Alternatively, insomnia may partially mediate the effect of chronic conditions such as CHF on HRQOL. Indeed, prior work has shown that worsening of chronic conditions tends to be associated with worsening of insomnia during follow-up, and vice versa.42
Third, sleep problems were assessed by self-report. No attempt was made to validate our findings with polysomnographic measurements. Polysomnography has limited value in the evaluation of insomnia; many self-identified insomniacs do not show objective sleep abnormalities on polysomnography43 and tend to have high night-to-night variability in the quality of their sleep.44 Indeed, some discrepancies may exist between self-reported sleep and laboratory data.45,46 Data obtained from MOS patients regarding other measures of sleep (including total sleep time, sleep latency, and adequacy of sleep) appear to verify the existence of sleep problems.42
Fourth, the definition of depression was based on DSM-III criteria, which differ somewhat from those of DSM-IV. We note, however, that the primary emphasis in revising the DSM-III criteria for these conditions was to improve discrimination between major depression and dysthymia,47 for both of which our analysis controlled. In addition, the diagnostic criteria for major depression and dysthymia incorporate sleep disturbance; thus, adjustment for depression would tend to reduce the estimated association between insomnia and HRQOL (as confirmed in Table 3).
Interpretation of the above findings should account for the nature of the study sample. Because all patients in the study sample had chronic conditions, average deviations in HRQOL scores were computed relative to the group with mild hypertension and without insomnia (reference group). Because even mild hypertension and its treatment may have an impact on several HRQOL domains,48 the associations between insomnia and HRQOL in the current study would probably have been even stronger if the reference group comprised patients with no chronic conditions.
While depression and insomnia (one of the diagnostic criteria for depression) overlap considerably, pharmacologic and behavioral approaches, including light therapy49-52 and exercise,53 have potential to significantly lessen the burden of chronic insomnia and its effect on HRQOL.54 In addition, clinicians should identify (and treat, if possible) predisposing conditions associated with insomnia.28,36,42 Finally, future clinical trials involving treatment of insomnia should incorporate measures, such as the SF-36, that can detect clinically meaningful effects of insomnia on HRQOL in addition to standard laboratory and self-reported measures of sleep disturbance.
Conclusions
Even after accounting for the presence of chronic medical comorbidities, depression, and anxiety, insomnia is associated with significantly worsened HRQOL, particularly in the domains of mental health, vitality, and general health perceptions. By identifying and treating chronic insomnia, including any predisposing conditions that may perpetuate insomnia, clinicians can significantly improve the quality of life of patients with chronic illness.
Acknowledgments
Dr Katz’s work on this study was supported by institutional funds from the University of Wisconsin Medical School, Graduate School, and Department of Medicine. Dr McHorney’s work on this study was supported by the Department of Veterans Affairs (HSR&D HFP #96-001; RR&D C-2016; HSR&D IIR #95-033). Dr Katz is a Robert Wood Johnson Generalist Physician Faculty Scholar.
1. National Commission on Sleep Disorders Research. Wake Up, America: A National Sleep Alert. Washington, DC; 1993.
2. Reed W. Physical health status as a consequence of health practices. J Community Health 1983;8:217-28.
3. Belloc N. Relationships of health practices and mortality. Prev Med 1973;2:67-81.
4. Wiley J, Camacho T. Lifestyle and future health: evidence from the Alameda County Study. Prev Med 1980;9:1-21.
5. Ford D, Kamerow D. Epidemiologic study of sleep disturbances and psychiatric disorders: an opportunity for prevention? JAMA 1989;262:1479-84.
6. Eaton W, Badawi M, Melton B. Prodromes and precursors: epidemiologic data for primary prevention of disorders with slow onset. Am J Psychiatry 1995;152:967-72.
7. Regestein Q. Sleep disorders in the medically ill. In: Stoudemire A, Fogel BS, eds. Principles of Medical Psychiatry. 1st ed. Orlando, Fla: Grune & Stratton 1987;271-302.
8. Simon G, VonKorff M. Prevalence, burden, and treatment of insomnia in primary care. Am J Psychiatry 1997;154:1417-23.
9. Hatoum H, Kong S, Kania C, Wong J, Mendelson W. Insomnia, health-related quality of life and healthcare resource consumption: a study of managed-care organization enrollees. Pharmacoeconomics 1998;14:629-37.
10. Roth T, Ancoli-Israel S. Daytime consequences and correlates of insomnia in the United States: results of the 1991 National Sleep Foundation Survey. II. Sleep 1999;22(suppl 2):S354-S358.
11. Chevalier H, Los F, Boichut D, et al. Evaluation of severe insomnia in the general population: results of a European multinational survey. J Psychopharmacology 1999;13:S21-4.
12. Leger D, Scheuermaier K, Philip P, Paillard M, Guilleminault C. SF36: evaluation of quality of life in severe and mild insomniacs compared with good sleepers. Psychosom Med 2001;63:49-55.
13. Kuppermann M, Lubeck D, Mazonson P, et al. Sleep problems and their correlates in a working population. J Gen Intern Med 1995;10:25-32.
14. Zammit G, Weiner J, Damato N, Sillup G, McMillan C. Quality of life in people with insomnia. Sleep 1999;22(suppl 2):S379-S385.
15. Stewart A, Ware J. Measuring functioning and well-being. Durham, NC: Duke University Press, 1992.
16. Tarlov A, Ware J, Greenfield S, Nelson E, Perrin E, Zubkoff M. The Medical Outcomes Study: an application of methods for monitoring the results of medical care. JAMA 1989;262:925-30.
17. Stewart A, Greenfield S, Hays R, et al. Functional status and well-being of patients with chronic conditions: results from the Medical Outcomes Study. JAMA 1989;262:907-13.
18. Wells K, Stewart A, Hays R, et al. The functioning and well-being of depressed patients: results from the Medical Outcomes Study. JAMA 1989;262:914-9.
19. Kravitz R, Greenfield S, Rogers W, Manning W, Zubkoff M. Differences in the mix of patients among medical specialties and systems of care: results from the Medical Outcomes Study. JAMA 1992;267:1617-23.
20. Wells K, Hays R, Burnam M, et al. Detection of depressive disorder for patients receiving prepaid or fee-for-service care: results from the Medical Outcomes Study. JAMA 1989;262:3298-302.
21. Nelson E, Manning W, Rogers W. A longitudinal study of hospitalization rates for patients with chronic disease: results from the Medical Outcomes Study. Health Serv Res 1998;32:759-74.
22. Burnam M, Wells K, Leake B, Landsverk J. Development of a brief screening instrument for detecting depressive disorders. Med Care 1988;26:775-89.
23. Wells K, Burnam M, Rogers W, Hays R, Camp P. The course of depression in adult outpatients: results from the Medical Outcomes Study. Arch Gen Psychiatry 1992;49:788-94.
24. McHorney C, Ware J, Raczek A. The MOS 36-item short-form health survey (SF-36): II. Psychometric and clinical tests of validity in measuring physical and mental health constructs. Med Care 1993;31:247-63.
25. McHorney C, Ware J, Rogers W, Raczek A. The validity and relative precision of MOS Short- and Long-Form health status scales and Dartmouth COOP Charts: results from the Medical Outcomes Study. Med Care 1992;30:MS253-65.
26. McHorney C, Ware J, Lu J, Sherbourne C. The MOS 36-item short-form health survey (SF-36): III. Tests of data quality, scaling assumptions, and reliability across diverse patient groups. Med Care 1994;32:40-66.
27. Hays R, Stewart A. Sleep measures. In: Stewart A, Ware J, eds. Measuring functioning and well-being: the Medical Outcomes Study Approach. Durham, NC: Duke University Press, 1992.
28. Diagnostic and statistical manual of mental disorders. 4th ed. Washington, DC: American Psychiatric Association, 1994.
29. Bixler E, Kales A, Soldatos C. Prevalence of sleep disorders in the Los Angeles metropolitan area. Am J Psychiatry 1979;136:1257-62.
30. Klink M, Quan S, Kaltenborn W, Lebowitz M. Risk factors associated with complaints of insomnia in a general adult population. Arch Intern Med 1992;152:1634-7.
31. National Institutes of Health. Clinical guidelines on the identification, evaluation and treatment of overweight and obesity in adults: the evidence report. Washington, DC: National Institutes of Health, 1998.
32. Katz D, McHorney C, Atkinson R. The impact of obesity on health-related quality of life (HRQOL) in patients with chronic illness. J Gen Intern Med 2000;15:789-96.
33. Sherbourne C, Jackson C, Meredith L, Camp P, Wells K. Prevalence of comorbid anxiety disorders in primary care outpatients. Arch Fam Med 1996;5:27-34.
34. Hays R, Wells K, Sherbourne C, Rogers W, Spritzer K. Functioning and well-being outcomes of patients with depression compared with chronic general medical illness. Arch Gen Psychiatry 1995;52:11-19.
35. Middelkoop H, Smilde-vandenDoel D, Knuistingh N, Kamphuisen H, Springer C. Subjective sleep characteristics of 1,485 males and females aged 50-93: effects of sex and age, and factors related to self-evaluated quality of sleep. J Gerontol 1996;51A:M108-15.
36. Foley D, Monjan A, Brown S, Simonsick E, Wallace R, Blazer D. Sleep complaints among elderly persons: an epidemiologic study of three communities. Sleep 1995;18:425-32.
37. Haponik E, Frye A, Richards B, Wymer A, Hinds A. Sleep history is neglected diagnostic information. J Gen Intern Med 1996;11:759-61.
38. Everitt D, Avorn J. Clinical decision-making in the evaluation and treatment of insomnia. Am J Med 1990;89:357-62.
39. Powell NB, Schechtman KB, Riley RW, Li K, Troell R, Guilleminault C. The road to danger: the comparative risks of driving while sleepy. Laryngoscope 2001;111:887-93.
40. Mercado A, Smith M, Lecrubier Y, Widlocher D. Depressed subjects unwittingly overreport poor social adjustment which they reappraise when recovered. J Nerv Ment Dis 1991;179:614-9.
41. Chang P, Ford D, Mead L, Cooper-Patrick L, Klag M. Insomnia in young men and subsequent depression: the Johns Hopkins Precursors Study. Am J Epidemiol 1997;146:105-14.
42. Katz D, McHorney C. Clinical correlates of insomnia in patients with chronic illness. Arch Intern Med 1998;158:1099-107.
43. Reite M, Buysse D, Reynolds C, Mendelson W. The use of polysomnography in the evaluation of insomnia. Sleep 1995;18:58-70.
44. Roth T, Kramer M, Lutz T. The nature of insomnia: a descriptive summary of a sleep clinic population. Compr Psychiatry 1976;17:217-20.
45. Carskadon M, Dement W, Mitler M, Guilleminault C, Zarcone V, Spiegel R. Self-reports versus sleep laboratory findings in 122 drug-free subjects with complaints of chronic insomnia. Am J Psychiatry 1976;133:1382-8.
46. Baekeland F, Hoy P. Reported vs recorded sleep characteristics. Arch Gen Psychiatry 1971;24:548-51.
47. Widiger T, Frances A, Pincus H, et al. DSM-IV Sourcebook. Vol. 4. Washington, DC, 1998;717-32.
48. Lawrence W, Fryback DG, Martin PA, Klein R, Klein BE. Health status and hypertension: a population-based study. J Clin Epidemiol 1996;49:1239-45.
49. Kupfer D, Reynolds C. Management of insomnia. N Engl J Med 1997;336:341-6.
50. Guilleminault C, Clerk A, Black J, Labanowski M, Pelayo R, Claman D. Nondrug treatment trials in psychophysiologic insomnia. Arch Intern Med 1995;155:838-44.
51. Ancoli-Israel S. Insomnia in the elderly: a review for the primary care practitioner. Sleep 2000;23(suppl 1):S23-30.
52. Benca RM. Consequences of insomnia and its therapies. J Clin Psychiatry 2001;62:33-8.
53. King A, Oman R, Brassington G, Bliwise D, Haskell W. Moderate-intensity exercise and self-rated quality of sleep in older adults. JAMA 1997;277:32-7.
54. National Heart Lung and Blood Institute Working Group on Insomnia. Insomnia: assessment and management in primary care. Am Fam Physician 1999;59:3029-38.
The Wisconsin Upper Respiratory Symptom Survey (WURSS)
OBJECTIVE: To develop a sensitive, reliable, responsive, and easy-to-use instrument for assessing the severity and functional impact of the common cold.
STUDY DESIGN: We created an illness-specific health-related quality-of-life outcomes instrument using previous scales, expert opinion, and common knowledge. This original questionnaire was used in a 1999 randomized trial of echinacea for the common cold. In 2000 we employed cognitive interview and focus group qualitative methods to further develop the instrument. Semistructured interviews used open-ended questions to elicit symptoms, terminology, and perceived functional impact. Responses were used to improve the instrument.
POPULATION: The randomized trial watched 142 University of Wisconsin students for a total of 953 days of illness. The subsequent qualitative instrument development project recruited 74 adults with self-diagnosed colds for 56 in-person interviews and 3 focus groups.
OUTCOMES MEASURED: We measured specific symptoms, symptom clusters (dimensions), functional impact, and global severity.
RESULTS: The original questionnaire included 20 questions: a global severity indicator, 15 symptom-severity items using 9-point severity scales, and 4 yes/no functional assessments. Data from the trial provided evidence of 4 underlying dimensions: nasal, throat, cough, and fever and aches, with reliability coefficients of 0.663, 0.668, 0.794, and 0.753, respectively. Qualitative assessments from the interviews and focus groups led us to expand from 15 to 32 symptom-specific items and from 4 to 10 functional impairment items. The original 9-point severity scale was revised to 7 points. Two global severity questions bring the item count to 44. The instrument fits comfortably on the front and back of a single sheet of paper and takes 5 to 10 minutes to complete.
CONCLUSIONS: The Wisconsin Upper Respiratory Symptom Survey (WURSS) is now ready for formal validity testing or practical use in common cold research.
The common cold, usually caused by viral infection of the upper respiratory tract, is a very prevalent illness. On average, US adults suffer from 1 to 4 episodes per year.1-3 This high incidence, along with significant symptomatic and functional impairment, combine to make this syndrome an important health problem. Hundreds of trials have attempted to demonstrate effective treatments.4,5 Unfortunately, few efforts have been made to develop and validate instruments to measure the symptomatic and functional impact of the common cold.
The term “upper respiratory infection” (URI) is a nosologic category constructed by physicians and other health professionals to reflect an upper airway, mucus-producing, inflammatory reaction to infection, usually viral. It is a disease category. The terms rhinitis, rhinosinusitis, pharyngitis, and bronchitis are often used to indicate the anatomic area most affected. The term “common cold” is an illness term constructed and used by the general populace. This distinction between professional (disease) and popular (illness) conceptions6 provides the reasoning for participant-based, patient-oriented qualitative development of measurement tools. While many medical professionals may choose to measure URI disease by physical examination, viral culture, or laboratory analysis of blood or nasal discharge, we believe that most people are more interested in how they can reduce the severity and duration of their symptoms and the functional impairments that result from their illness.
George Gee Jackson and colleagues7 began experimental work in the 1950s, observing and recording the cold symptoms produced by challenging more than 1,000 volunteers with filtered nasal secretions obtained from cold-sufferers. Eight symptoms–sneezing, headache, malaise, chilliness, nasal discharge, nasal obstruction, sore throat, and cough–were selected for evaluation and graded as absent (0), mild (1), moderate (2), or severe (3) every day for 6 days after inoculation. A score of 14 or higher was chosen as the cutoff value that best distinguished infected from noninfected participants. Thus, the original Jackson scale was apparently designed to discriminate between those with and without demonstrable viral infection, and not as a measure of severity. The tables and graphics in Jackson’s seminal works point toward reasonable internal consistency and discriminate validity.7-9 However, other important measurement properties, such as precision, reliability, responsiveness, and stability, were not reported. Despite these limitations, Jackson’s scale has been used for decades by most of the major common cold research groups.10-15
Using various modifications of the Jackson scale, researchers of the cold have characterized the frequency and severity of the 8 symptoms noted above in both natural colds and experimentally induced rhinovirus infections. Variability in symptom expression remains a hallmark of URI. Although specific pathogens are associated with the severity and distribution of symptoms at the population level, symptoms are poor predictors of etiology at the individual level. Infection itself is an imperfect predictor of symptom expression, as asymptomatic infections occur frequently, and as URI-like symptoms occur in people in whom it is not possible to demonstrate infections.16 Even among people with documented experimental infections of single strains of virus, variance outweighs central tendency in all symptom measurements.17,18
The search for objective disease measures with which to compare symptom scores has also progressed. To date, the following measures have been evaluated: detection of virus with culture or polymerase chain reaction,16,19 cytokine measurement,20-22 serologic markers,23 physical examination,9,24 radiologic imaging,25,26 rhinomanometry,27,28 mucus weight,29 mucus velocity, and number of tissues used.30 None have been shown to be superior to self-reported symptoms in terms of precision, reliability, or responsiveness or in their ability to predict functional impairment or subsequent illness. Perhaps more important, none have been shown to reflect the values of the people who experience colds. Although a number of quality-of-life instruments have been developed to assess allergic rhinitis,31-36 we have been unable to locate any specifically developed to assess URI.
We therefore decided to develop the Wisconsin Upper Respiratory Symptom Survey (WURSS) to provide a standardized measure for evaluating the negative consequences of the common cold. We were particularly interested in developing a health-related quality of life instrument that would represent the symptomatic and functional dimensions that are important to cold-sufferers.37-40 The instrument should be able to discriminate accurately between active intervention and placebo effects in randomized therapeutic trials and should balance brevity and ease of use with optimal precision, reliability, and responsiveness.41-43 It should be based on self-diagnosis and self-assessment because neither accepted criteria nor adequate tests are available to diagnose “upper respiratory infection” or “acute infectious rhinosinusitis”(with or without “pharyngitis”) and because the vast majority of cold treatments will be taken without professional input after self-diagnosis.
Methods
Phase 1: Initial development during a randomized trial
The development of this study began in 1998 during the design of a randomized controlled trial (RCT) of echinacea as a cold treatment. We created our first instrument by showing successive drafts to friends and colleagues (mostly family physicians), stopping once we were satisfied that the questionnaire had reasonable face validity. This initial instrument rated global severity of illness (“How sick do you feel today?”) and 15 individual symptoms on a 9-point Likert-type scale. The 15 symptom-measuring items were complemented by 4 dichotomous (yes/no) functional outcome questions, adapted with permission from the validated Medical Outcomes Study 36-item Short-Form Health Survey (SF-36).44
This initial instrument was used in the spring of 1999 in the echinacea RCT.45 This experience provided a good initial test of our instrument, as the participants were recruited within 36 hours of their first symptom and monitored each day until they had answered “No” to the question, “Do you think that you are still sick today?” for 2 days in a row. Each participant was asked to fill out the questionnaire both on paper and on a computerized data-collecting facsimile (available at http://www.fammed.wisc.edu/samplecold).
Phase 2: Further instrument development using qualitative methods
After the echinacea RCT was completed, our primary concern was that we might be overlooking or under-representing important illness domains. We also suspected that wording, question order, response range, and other formatting concerns could be improved. To achieve these goals, we used qualitative instrument-development methodologies, involving the people we wanted to measure–cold-sufferers–in the development process.40,46-50
After obtaining approval from the University of Wisconsin Medical School Human Subjects Committee, we began interviewing Madison-area adults who responded to community advertising asking for volunteers with colds. Inclusion criteria required answering “Yes” to the question, “Do you believe that you have a cold?” For an interview to be arranged, at least one cold symptom had to be present, and the research assistant had to be convinced that the caller was indeed suffering from a common cold. Prospective participants with itchy eyes, sneezing, or a history of allergy were excluded if either the participant or the interviewer felt that any current symptoms might have been caused by allergy. Interviews were held in a location of mutual convenience and with the aid of an interview guide developed by our research team. Interviewers were carefully trained in the research protocol and used interview guides for both the initial telephone screen and the in-person interviews. Interviewers included both clinicians and nonclinicians.
The semistructured interview guide used open-ended questions designed to elicit the participants’ own terminology for describing their colds (Table 1).51-53 We aimed for an understanding of how the experience of the cold influenced the lives of the participants. Participants were first asked to list all their symptoms, then to describe how each symptom bothered them. Next, we asked which symptom(s) appeared first and which one(s) followed. We then asked which symptoms were most bothersome and why. Participants were asked to describe what they did to relieve their cold symptoms, why, and whether the therapy provided any relief. Participants were then asked about how their cold affected their lifestyle with regard to work, relationships, activities, and so forth. Additionally, we asked about symptoms and effects of previous colds. This exploratory phase of the interview lasted approximately 20 to 30 minutes.
Once the interviewer had a thorough description and understanding of the participant’s cold, the participant was asked to complete the questionnaire-in-development. After marking answers on the questionnaire (which took 3 to 5 minutes), each participant was asked to comment on its ease of use, item wording, formatting, and response range as well as whether it accurately and comprehensively measured the symptoms and functional impact they were experiencing. The instrument development phase of the interview lasted for another 20 to 30 minutes.
We used focus group methods in the final month of the study as an additional window into participants’ experiences.54-56 The focus groups used the same inclusion criteria as the long interviews and followed the same general format, first using open-ended questions to elicit symptoms and their impact, then administrating the questionnaire and discussing item inclusion and formatting. However, we encouraged discussion rather than self-assessment, as the focus group methodology derives its strength from the interactive nature of conversation. For instance, a statement made by one participant would spark interest or recall in another, thereby generating a richer, fuller, and more representative description of symptoms and functional impact.
Individual interviews were held by 1 of 5 trained interviewers (B.B., L.L., R.M., E.S., J.S.). All 3 focus groups were run by the lead author, with at least 1 other research team member assisting. Interviews and focus groups were arranged as soon as possible after the initial telephone contact so that participants would still have cold symptoms while being interviewed. All interviews and focus groups were discussed in biweekly group meetings. Decisions on item inclusion, wording, and questionnaire format were made by research group consensus. Several versions of the questionnaire were brought back to cold-sufferers for further cognitive testing. The diversity of interviewers and respondents provided protection against personal bias in ascertaining and interpreting symptoms and impairments.
TABLE 1
QUESTIONS ASKED DURING INTERVIEW
| Current Symptom History and Evaluation |
|---|
| List and describe all symptoms you have with this cold. |
| How do these symptoms bother you? |
| What is the first symptom you noticed when getting this cold? The Next? |
| The next? |
| Which cold symptom bothers you the most? How and why? |
| Are there other symptoms that bother you? How and why? |
| Interventions |
| What do you do to relieve cold symptoms? Why? |
| What over-the-counter medicines would you use? Why? Did it help? |
| What herbal medicines would you use? Why? Did it help? |
| Do you do anything else to relieve symptoms or treat your cold? Why? |
| Did it help? |
| When would you see a doctor or other health care provider? Why? |
| Lifestyle |
| Has this cold interfered with your normal activities? How? |
| When does a cold keep you from doing what you want or need to do? How? |
| Describe what things are harder to do? |
| Previous Symptom History and Evaluation |
| How many colds did you have this past year? |
| How long did they usually last? |
| List and describe what symptoms you usually get with your colds? |
| How do these symptoms bother you? |
| Survey Evaluation (After Participant Has Completed the Questionnaire) |
| Is this form easy to read? |
| Are there any other symptoms that should be on this questionnaire? |
| Are there any questions that shouldn’t be there? |
| Are there any questions that could be worded better? |
| Is the 7-point scale appropriate? Why or why not? |
Results
Phase 1
Of the 148 college students enrolled, 142 followed protocol and were included in the analysis. Of the 853 person-days documented, 546 (64%) were covered by both data systems; 287 (33.6%) came from paper surveys only; and 18 (2.1%) were filled out via computer only. Because only 2 (0.2%) questionnaires were missing any data, our data capture rate was 99.8%. Comparing data from the computerized and paper data sources provided evidence of consistency. Of the 546 days in which both paper and computer instruments provided data, 512 yielded identical responses (94% concordant) to the global severity of illness question. Of the 34 (6%) discrepancies, 29 were off by 1 point on the 9-point Likert-type scale and 5 discrepancies were off by 2 points. Comparing computer and paper responses with the 15 specific symptom questions also yielded high levels of concordance. Of 8190 item responses, 7777 (95%) were concordant, while 413 (5%) were classified as data discrepancies. Of these, 293 were off by 1 point on the 9-point scale; 68 were off by 2 points; 27, by 3 points; 17, by 4 points; 7, by 5 points; and 1 by 6 points.
Factor analysis of the data provided further evidence of internal validity. Structural equation modeling techniques57,58 were used to model symptom severities over time. A 4-dimensional symptom-recovery model (df = 71; P = .000025) provided a goodness of fit index of 0.88, a root mean square residual of .095, and a chi-squared/df ratio of 139/71 = 1.95. From the pool of 15 scaled symptom scores, 14 items contributed significantly to the model. (In this data set, loss of appetite was an infrequent symptom contributing insignificantly toward the model, and was dropped.) The 14 symptoms naturally aggregated into 4 underlying symptomatic dimensions: cough, throat, nasal, and fever and aches. Table 2 provides the reliability coefficients, standardized item loading coefficients, and standard errors of these loadings for the 4 dimensions. The reliability coefficients of the symptom dimensions were calculated using a procedure proposed by Dillon and Goldstein.59 Scale recovery curves, generated using a mixed modeling approach,60,61 were internally predictive, responsive,37,62 and consistent with what is known about the natural history of URI.
TABLE 2
RELIABILITY OF SYMPTOM DIMENSION MODELS
| Item Loading (SE)* | |
|---|---|
| Cough Dimension (Reliability = 0.794) | |
| Coughing | 2.01 (0.20) |
| Coughing stuff up | 1.75 (0.18) |
| Cough interfering with sleep | 1.16 (0.17) |
| Fever and Aches Dimension (Reliability = 0.753) | |
| Headache | 1.28 (0.23) |
| Fever | 1.07 (0.13) |
| Sweats | 1.25 (0.16) |
| Muscle aches | 1.76 (0.19) |
| Feeling run down | 1.17 (0.19) |
| Throat Dimension (Reliability = 0.668) | |
| Sore throat | 1.10 (0.22) |
| Scratchy throat | 1.73 (0.23) |
| Hoarseness | 1.68 (0.24) |
| Nasal Dimension (Reliability = 0.663) | |
| Runny nose | 1.93 (0.28) |
| Stuffy nose | 1.05 (0.23) |
| Sneezing | 1.63 (0.26) |
| *All significant at P < .05. | |
| SE denotes standard error. | |
Phase 2
Between July and December 2000, 108 persons from the general population responded to advertising by calling a telephone number listed on posted flyers and in the newspaper. Of these 108 callers, 27 were eligible but declined to participate; 7 did not meet inclusion criteria (were younger than 18 years of age, had current allergy symptoms, or did not have cold symptoms); and 74 met study criteria and elected to participate (Table 3). Those declining to participate usually did so because of inconvenience in arranging an immediate interview or because compensation ($10 for interview, $15 for focus group) was insufficient. Participants were met in person for semistructured individual interviews (n = 56) or focus groups (3 groups, 20 individuals total). Two people were interviewed both individually and in focus group.
Based on the information gained during interviews, the instrument-in-development underwent 6 revisions during 2000. Each modification was tested with additional interviews. A final version was created in December 2000. A few items from the initial instrument used in the echinacea trial were modified in response to participants’ descriptions and insights. Several other items were added to reflect symptoms and functional impairments described by participants in response to our open-ended questions. All items used wording provided by participants or tested during subsequent interviews and focus groups.
All symptoms spontaneously reported by at least 3 participants in either individual interview or focus group were included in the final version (Table 4). Figure 1 provides a frequency distribution of the symptoms described during the individual interviews.
On the basis of our participants’ comments, the distribution of severity data from the echinacea trial, and recommendations from published studies, we decided to decrease the response range from a 9-point to a 7-point Likert-type severity scale. The resulting severity range was marked at 1 (very mild), 3 (mild), 5 (moderate), and 7 (severe), following the majority opinion of our respondents. Unmarked (even-numbered) options were included, as most of the respondents felt they should have “in-between” choices. The functional outcome questions adapted from the SF-36 were replaced with participant-generated items, which were then scaled in a 7-point format similar to that used for the symptoms. A final question comparing today’s global severity with yesterday’s was added to provide a comparative measure of change over time (responsiveness). Figure 2 displays the final format of WURSS items.
The qualitative data provided by our informants improved our understanding of the symptomatic and functional impact of the common cold and assisted the development of the WURSS questionnaire. Although it is clear that people experience colds in different ways, several common threads emerged. For instance, we found that our original instrument (like the Jackson criteria) had overrated individual symptoms and had underrated functional impact, interference with social relationships, and general malaise. Informants often told us that it was not necessarily the individual symptoms that bothered them, but the general feelings, described as “sick feeling,” “loss of energy,” “run down,” “tired,” “fatigue,” “malaise,” “lousy,” “lazy,” “spacey," "blah," "yucky," "foggy," "lightheaded," "fuzzy brain,” “cloudy,” “disoriented,” “uncomfortable,” “distracted,” and “miserable.” Our informants also told us that they were bothered by the way their cold interfered with day-to-day activities and relationships. Colds affected physical activities such as breathing or walking, performance at work or in the home, and interactions with friends, family, and coworkers. Terms describing the most frequent and bothersome effects were incorporated into the final WURSS instrument.
TABLE 3
INTERVIEW AND FOCUS GROUP PARTICIPANT DEMOGRAPHICS
| Number | |
|---|---|
| Method of Data Collection | |
| Individual interviews | 56 |
| Focus groups | 20 |
| Total | 74* |
| Sex | |
| Women | 49 |
| Men | 25 |
| Ethnicity | |
| Native American | 2 |
| Black | 12 |
| Hispanic | 2 |
| White | 57 |
| No response | 1 |
| Annual Income | |
| < $10,000 | 28 |
| $10,000–19,999 | 17 |
| $20,000–29,999 | 13 |
| $30,000–49,999 | 9 |
| $50,000–75,000 | 3 |
| $75,000 | 2 |
| No response | 2 |
| Education | |
| Some high school | 13 |
| High school or equivalent | 11 |
| Some college | 11 |
| Associate or technical degree | 6 |
| Bachelor’s degree | 21 |
| Master’s degree | 6 |
| Professional degree | 4 |
| No response | 2 |
| Tobacco Use | |
| Current | 26 |
| Past | 19 |
| Never smoker | 28 |
| No response | 1 |
| *Two participants were used in both data collection methods. | |
| NOTE: Age range was 19 to 71 years, mean = 35.9 years (standard deviation, 11.9). | |
TABLE 4
SYMPTOMS AND FUNCTIONAL IMPAIRMENTS EVALUATED BY THE WISCONSIN UPPER RESPIRATORY SYMPTOM SURVEY
| Symptoms | Plugged ears |
| Cough | Ear discomfort |
| “Coughing stuff up” | Watery eyes |
| Cough interfering with sleep | Eye discomfort |
| Sore throat | Head congestion |
| Scratchy throat | Chest congestion |
| Hoarseness | Chest tightness |
| Runny nose | Heaviness in chest |
| Plugged nose | Lack of energy |
| Sneezing | Loss of appetite |
| Headache | |
| Body aches | Functional Impairments |
| Feeling “run down” | Think clearly |
| Sweats | Speak clearly |
| Chills | Sleep well |
| Feeling feverish | Breathe easily |
| Feeling dizzy | Walk, climb stairs, exercise |
| Feeling tired | Accomplish daily activities |
| Irritability | Work outside the home |
| Sinus pain | Work inside the home |
| Sinus pressure | Interact with others |
| Sinus drainage | Live your personal life |
| Swollen glands |
FIGURE 1
SYMPTOMS REPORTED IN INDIVIDUAL INTERVIEWS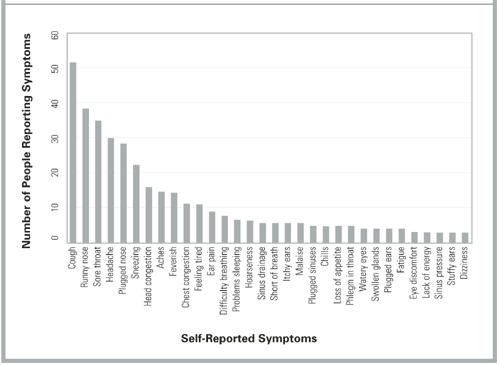
FIGURE 2
ITEM FORMAT FOR THE WISCONSIN UPPER RESPIRATORY SYMPTOM SURVEY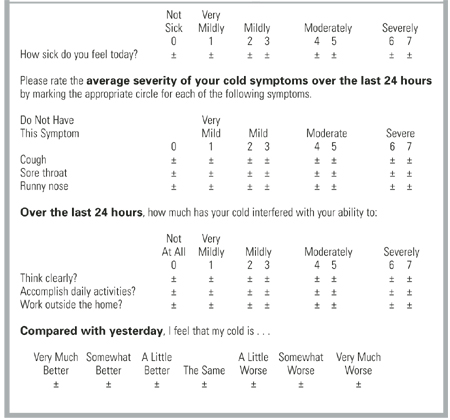
Discussion
Researchers of URIs and the common cold need a well-developed, standardized, validated outcomes instrument that reflects the experience and values of cold sufferers. While the Jackson scale and various modifications have been widely used, few data support the validity of these scales. Although correlations with external measures, such as physical examinations, mucus weight, and the ability to culture virus have been reported, the symptomatic and functional impact of colds has largely been neglected. Perhaps more important, the symptomatic measures used to date were apparently developed without significant input from the people whose illnesses were measured. Questionnaire development and cognitive testing methods have not been described, nor have adequate tests of psychometric properties been reported. Although the Jackson scale may demonstrate marginal face validity in terms of symptoms, it does not do so in terms of functional impact.
This article describes the first steps taken in the development and validation of a new illness-specific quality-of-life instrument for measuring the common cold. The WURSS instrument is more comprehensive than existing alternatives and better reflects cold-sufferers’ experiences and values. Therefore, it provides greater face validity. The length (44 items) reflects a compromise between ease of use and comprehensiveness.41 It is possible that a subset of the items will prove nearly as effective and that a short-form WURSS will eventually be available. Item reduction will need to be guided by both internal (factor analysis) and external (frequency and perceived value) considerations. The standardized 7-point severity scale used throughout the WURSS makes the instrument very easy to use.49 It also provides a severity range that our informants and previous researchers40,63,64 agree is optimal. The WURSS allows a cold-sufferer to swiftly and accurately assess his or her common cold. We hope that WURSS will prove worthy in terms of standard psychometric properties such as precision, reliability, and responsiveness.65-68 A large prospective study will be necessary for those assessments.
Limitations
The work described here has a number of limitations. The WURSS was developed in Madison, Wis., largely among people with self-diagnosed colds during the period from July to December 2000. The RCT occurred over several months in the spring of 1999 and was limited to college students. Our results are therefore limited by both population and etiologic agent, which in turn may influence the symptom and severity spectrums assessed. Although we aimed for and achieved a moderate degree of socioeconomic diversity (Table 3), our participants’ responses may not be representative of the larger universe of cold-sufferers. The symptom distribution in Figure 1, for example, is unlikely to represent global cold symptom frequency accurately. Previous research with both natural and induced colds suggests that nasal symptoms and sore throat are usually more frequent than cough.2,3,6-18 The comprehensiveness of the instrument is more important for instrument development than are the specific item frequencies. Here, we feel that we succeeded in representing a sufficient range of items.
Another important limitation is the inherent variability and subjectivity of information generated from qualitative research. A similar instrument development effort carried out by different researchers would inevitably yield a somewhat different questionnaire. Eliciting and formatting terminology that reflects symptomatic and functional impact presents a number of challenges. Future research could employ a quantitative importance scale for participants to use in assessing the value of symptoms and functional impacts. Such value scales could be used alongside factor analysis models of item and dimension frequency and severity. These could in turn be compared with external criteria such as physician assessment, tissue counts, and nasal mucus weights, measurements of inflammatory cytokines, and quantitative viral cultures. Because no gold standard exists, single-criterion validity assessment will not be sufficient. Instead, the concept of construct validity will need to be invoked for future attempts at validation. Construct validity has been defined as “validity assessed by comparing the results of several contrasting tests of validity (including concurrent, convergent, and divergent validation studies) with predictions from a theoretical model.”64 Our work so far has only begun to scratch the surface of such rigorous validity assessment.
Conclusions
We have developed an instrument that measures patient-oriented outcomes identified as important by people with self-diagnosed common colds. We expect that the WURSS will do well with physician-diagnosed “bronchitis,” “sinusitis,” or “pharyngitis,” but as yet have no data with which to evaluate that supposition. We hope that the development of the WURSS stimulates other researchers to undergo similar efforts at aimed at patient-oriented outcome measurement and that the efforts can be compared. We have made the WURSS available for general use by placing a printable facsimile online at http://www.fammed.wisc.edu/wurss/. University-based health care researchers and other nonprofit entities may use the WURSS freely, but we do ask to be notified of such use. For-profit entities should contact us before using this copyrighted instrument.
The next step will be for WURSS to undergo large-scale psychometric testing with the goal of assessing its internal and external validity properties more accurately. We welcome comments, consultation, and collaboration and hope to involve other researchers as we move further in the direction of an accurate and reliable method for assessing the impact of the common cold.
Acknowledgments
The authors would like to acknowledge the participants who contributed their time and energy while they were sick. We also thank the many physicians and coworkers who contributed their knowledge and opinions, especially Nora Cate Schaeffer, PhD; Mary Beth Plane, PhD; Jon Temte, MD, PhD; Donn D’Alessio, MD; and William Scheckler, MD, in Madison, Wis., and Jack Gwaltney, MD, in Charlottesville, Va. During most of this project, Dr Barrett has had support from the National Center for Complementary and Alter native Medicine at the National Institutes of Health, Grant #K23 AT00051-01.
1. Dingle JH, Badger GF, Jordan WS. Illness in the home: a study of 25,000 illnesses in a group of Cleveland families. Cleveland, Ohio: Western Reserve University Press; 1964.
2. Gwaltney JM, Hendley JO, Simon G, Jordan WS. Rhinovirus infections in an industrial population. JAMA 1967;202:158-64.
3. Monto AS, Ullman BM. Acute respiratory illness in an American community. JAMA 1974;227:164-9.
4. Smith MBH, Feldman W. Over-the-counter cold medications: a critical review of clinical trials between 1950 and 1991. JAMA 1993;269:2258-63.
5. Turner RB. The treatment of rhinovirus infections: progress and potential. Antiviral Res 2001;49:1-14.
6. Kleinman A. Culture, illness, and care: clinical lessons from anthropologic and cross-cultural research. Ann Intern Med 1978;88:251-8.
7. Jackson GG, Dowling HF, Spiesman IG, Boand AV. Transmission of the common cold to volunteers under controlled conditions. Arch Intern Med 1958;101:267-78.
8. Jackson GG, Dowling HF, Anderson TO, Riff L, Saporta J, Turck M. Susceptibility and immunity to common upper respiratory viral infections–the common cold. Ann Intern Med 1960;55:719-38.
9. Jackson GG, Dowling HF, Muldoon RL. Present concepts of the common cold. Am J Public Health 1962;52:940-5.
10. D’Alessio D, Peterson JA, Dick CR, Dick EC. Transmission of experimental rhinovirus colds in volunteer married couples. J Infect Dis 1976;133:28-36.
11. Dick EC, Jennings LC, Mink KA, Wartgrow CD, Inhorn SL. Aerosol transmission of rhinovirus colds. J Infect Dis 1987;156:442-8.
12. Gwaltney JM, Hendley JO. Transmission of experimental rhinovirus infection by contaminated surfaces. Am J Epidemiol 1982;116:828-33.
13. Hayden FG, Diamond L, Wood PB, Korts DC, Wecker MT. Effectiveness and safety of intranasal ipratropium bromide in common colds. Ann Intern Med 1996;125:89-97.
14. Cohen S, Frank E, Doyle WJ, Skoner DP, Rabin BS, Gwaltney JM. Types of stressors that increase susceptibility to the common cold in healthy adults. Health Psychol 1998;17:214-23.
15. Gern JE, Busse WW. Association of rhinovirus infections with asthma. Clin Microbiol Rev 1999;12:9-18.
16. Arruda E, Pitkäranta A, Witek TJ, Doyle CA, Hayden FG. Frequency and history of rhinovirus infections in adults during autumn. J Clin Microbiol 1997;35:2864-8.
17. Gwaltney JM, Buier RM, Rogers JL. The influence of signal variation, bias, noise and effect size on statistical significance in treatment studies of the common cold. Antiviral Res 1996;29:287-95.
18. Rao SS, Hendley JO, Hayden FG, Gwaltney JM. Symptom expression in natural and experimental rhinovirus colds. Am J Rhinol 1995;9:49-52.
19. Freymuth F, Vabret A, Brouard J, et al. Detection of viral, Chlamydia pneumoniae and Mycoplasma pneumoniae infections in exacerbations of asthma in children. J Clin Virol 1999;13:131-9.
20. Igarashi Y, Skoner DP, Doyle WJ, White MV, Fireman P, Kaliner MA. Analysis of nasal secretions during experimental rhinovirus upper respiratory infections. J Allergy Clin Immunol 1993;92:722-31.
21. Johnston SL, Papi A, Bates PJ, Mastronarde JG, Monick MM, Hunninghake GW. Low grade rhinovirus infection induces a prolonged release of IL-8 in pulmonary epithelium. J Immunol 1998;160:6172-81.
22. Teran LM, Johnston SL, Schroder JM, Church MK, Holgate ST. Role of nasal interleukin-8 in neutrophil recruitment and activation in children with virus induced asthma. Am J Respir Crit Care Med 1997;155:1362-6.
23. Korppi M, Kröger L. Laitinen. White blood cell and differential counts in acute respiratory viral and bacterial infections in children. Scand J Infect Dis 1993;25:435-40.
24. McBride TP, Doyle WJ, Hayden FG, Gwaltney JM. Alterations of the Eustachian tube, middle ear, and nose in rhinovirus infection. Arch Otolaryngol Head Neck Surg 1989;115:1054-9.
25. Gwaltney JM, Phillips CD, Miller RD, Riker DK. Computed tomographic study of the common cold. N Engl J Med 1994;330:25-30.
26. Turner BW, Cail WS, Hendley JO, et al. Physiologic abnormalities in the paranasal sinuses during experimental rhinovirus colds. J Allergy Clin Immunol 1992;90:474-8.
27. Dressler WE, Myers T, London SJ, Rankell AS, Poetsch CE. A system of rhinomanometry in the clinical evaluation of nasal decongestants. Ann Otol Rhinol Laryngol 1977;86:310-6.
28. Tomkinson A, Eccles R. Comparison of the relative abilities of acoustic rhinometry, rhinomanometry, and the visual analogue scale in detecting change in the nasal cavity in a healthy adult population. Am J Rhinol 1996;10:161-5.
29. Parekh HH, Cragun KT, Hayden FG, Hendley JO, Gwaltney JM. Nasal mucus weights in experimental rhinovirus infection. Am J Rhinol 1992;6:107-10.
30. Scaglione F, Lund B. Efficacy in the treatment of the common cold of a preparation containing an echinacea extract. Int J Immunopharmacol 1995;11:163-6.
31. Juniper EF, Guyatt GH, Griffith LE, Ferrie PJ. Interpretation of rhinoconjuctivitis quality of life questionnaire data. J Allergy Clin Immunol 1996;98:843-5.
32. Juniper EF. Measuring health-related quality of life in rhinitis. J Allergy Clin Immunol 1997;99:S742-9.
33. Kozma CM, Sadik MK, Watrous ML. Economic outcomes for the treatment of allergic rhinitis. PharmacoEconomics 1996;410:4-13.
34. Meltzer EO, Nathan RA, Selner JC, Storms W. The prevalence and medical and economic impact of allergic rhinitis in the United States. J Allergy Clin Immunol 1997;99:S807-28.
35. Meltzer EO, Nathan RA, Selner JC, Storms W. Quality of life and rhinitic symptoms: Result of a nationwide survey with the SF-36 and RQLQ questionnaires. J Allergy Clin Immunol 1997;99:815-9.
36. Piccirillo JF, Edwards D, Haiduk A, Yonan C, Thawley SE. Psychometric and clinimetric validity of the 31-item rhinosinusitis outcome measure (RSOM-31). Am J Rhinol 1995;9:297-306.
37. Deyo RA, Diehr P, Patrick DL. Reproducibility and responsiveness of health status measures. Controlled Clin Trials 1991;12(suppl 4):142S-158S.
38. Guyatt GH, Kirshner B, Jaeschke R. Measuring health status: What are the necessary measurement properties? J Clin Epidemiol 1992;45:1341-5.
39. Guyatt GH. Health status, quality of life, and the individual. JAMA 1994;272:630-1.
40. Juniper EF, Guyatt GH, Jaeschke R. How to develop and validate a new health-related quality of life instrument. In Spilker B, ed. Quality of life and pharmacoeconomics in clinical trials. Philadelphia, Pa: Lippincott-Raven; 1996;49-56.
41. Katz JN, Larson MG, Phillips CB. Comparative measurement sensitivity of short and longer health status instruments. Med Care 1992;30:917-25.
42. Schaeffer NC, Charng H-W. Two experiments in simplifying response categories: intensity and frequency categories. Sociol Perspect 1991;34:165-82.
43. Shrout PE, Yager TJ. Reliability and validity of screening scales: Effect of reducing scale length. J Clin Epidemiol 1989;42:69-78.
44. McHorney CA, Ware JE, Raczek AE. The MOS 36-item short-form health survey (SF-36): II. Psychometric and clinical tests of validity in measuring physical and mental health constructs. Med Care 1998;31:247-63.
45. Barrett B, Locken L, Maberry R, Brown RL, Bobula JA, D’Alessio D. A randomized double-blind trial of an unrefined mixture of Echinacea purpurea and E angustifolia used to treat the common cold: no benefit detected. Submitted for publication 2001.
46. Bullinger M, Anderson R, Cella D, Aaronson N. Developing and evaluating cross-cultural instruments from minimum requirements to optimal models. Qual Life Res 1993;2:451-9.
47. Fischer D, Stewart AL, Bloch DA, Lorig K, Laurent D, Holman H. Capturing the patient’s view of change as a clinical outcome measure. JAMA 1999;282:1157-62.
48. Harris-Kojetin LD, Fowler FJ, Brown JA, Schnaier JA, Sweeny SF. The use of cognitive testing to develop and evaluate CAHPS 1.0 core survey items. Consumer assessment of health plans study. Med Care 1999;37:MS10-21.
49. Mullin PA, Lohr KN, Bresnahan BW, McNulty P. Applying cognitive design principles to formatting HRQOL instruments. Qual Life Res 2000;9:13-27.
50. Schaeffer NC. Conversation with a purpose or conversation? Interaction in the standardized interview. In: Biemer P, Groves RM, Lyberg LE, Mathiowitz NA, Sudman S, eds. Measurement errors in surveys. New York, NY: Wiley; 1991;367-91.
51. Britten N. Qualitative interviews in medical research. BMJ 1995;311:251-3.
52. Crabtree BF, Miller WL. Qualitative approach to primary care research: the long interview. Fam Med 1991;23:145-51.
53. McCracken G. The long interview. Thousand Oaks, Calif: Sage Publications; 1988.
54. Hughes D, DuMont K. Using focus groups to facilitate culturally anchored research. Am J Community Psychol 1993;21:775-807.
55. Kitzinger J. Qualitative research: Introducing focus groups. BMJ 1995;311:299-302.
56. Morgan D. Focus groups and qualitative research. Thousand Oaks, Calif: Sage Publications; 1988.
57. Bolan KA. Structural equations with latent variables. New York, NY: John Wiley & Sons; 1989.
58. Joreskog KG, Sorbom D. LISREL 8 User’s Reference Guide. Chicago, Ill: Scientific Software International, Inc; 1993.
59. Dillon WR, Goldstein M. Multivariate analysis: methods and applications. New York, NY: John Wiley & Sons; 1984.
60. Davis CS. Semi-parametric and non-parametric methods for the analysis of repeated measurements with applications to clinical trials. Stat Med 1991;1:1959-80.
61. Goldstein H. Multilevel statistical models. New York: Halsted, 1995.
62. Hays RD, Hadom D. Responsiveness to change: an aspect of validity, not a separate dimension. Qual Life Res 1992;1:73-5.
63. Jaeschke R, Singer J, Guyatt GH. Measurement of health status: ascertaining the minimal clinically important difference. Control Clin Trials 1989;10:407-15.
64. McDowell I, Newell C. Measuring health: a guide to rating scales and questionnaires. Oxford, England: Oxford University Press; 1996.
65. Deyo RA, Centor RM. Assessing the responsiveness of functional scales to clinical change: an analogy to diagnostic test performance. J Chronic Dis 1986;39:897-906.
66. Guyatt GH, Walter S, Norman G. Measuring change over time: assessing the usefulness of evaluative instruments. J Chronic Dis 1987;40:171-8.
67. Hays RD, Anderson R, Revicki D. Psychometric considerations in evaluating health-related quality of life measures. Qual Life Res 1993;2:441-9.
68. Wright JG, Feinstein AR. A comparative contrast of clinimetric and psychometric methods for constructing indexes and rating scales. J Clin Epidemiol 1992;45:1201-18.
OBJECTIVE: To develop a sensitive, reliable, responsive, and easy-to-use instrument for assessing the severity and functional impact of the common cold.
STUDY DESIGN: We created an illness-specific health-related quality-of-life outcomes instrument using previous scales, expert opinion, and common knowledge. This original questionnaire was used in a 1999 randomized trial of echinacea for the common cold. In 2000 we employed cognitive interview and focus group qualitative methods to further develop the instrument. Semistructured interviews used open-ended questions to elicit symptoms, terminology, and perceived functional impact. Responses were used to improve the instrument.
POPULATION: The randomized trial watched 142 University of Wisconsin students for a total of 953 days of illness. The subsequent qualitative instrument development project recruited 74 adults with self-diagnosed colds for 56 in-person interviews and 3 focus groups.
OUTCOMES MEASURED: We measured specific symptoms, symptom clusters (dimensions), functional impact, and global severity.
RESULTS: The original questionnaire included 20 questions: a global severity indicator, 15 symptom-severity items using 9-point severity scales, and 4 yes/no functional assessments. Data from the trial provided evidence of 4 underlying dimensions: nasal, throat, cough, and fever and aches, with reliability coefficients of 0.663, 0.668, 0.794, and 0.753, respectively. Qualitative assessments from the interviews and focus groups led us to expand from 15 to 32 symptom-specific items and from 4 to 10 functional impairment items. The original 9-point severity scale was revised to 7 points. Two global severity questions bring the item count to 44. The instrument fits comfortably on the front and back of a single sheet of paper and takes 5 to 10 minutes to complete.
CONCLUSIONS: The Wisconsin Upper Respiratory Symptom Survey (WURSS) is now ready for formal validity testing or practical use in common cold research.
The common cold, usually caused by viral infection of the upper respiratory tract, is a very prevalent illness. On average, US adults suffer from 1 to 4 episodes per year.1-3 This high incidence, along with significant symptomatic and functional impairment, combine to make this syndrome an important health problem. Hundreds of trials have attempted to demonstrate effective treatments.4,5 Unfortunately, few efforts have been made to develop and validate instruments to measure the symptomatic and functional impact of the common cold.
The term “upper respiratory infection” (URI) is a nosologic category constructed by physicians and other health professionals to reflect an upper airway, mucus-producing, inflammatory reaction to infection, usually viral. It is a disease category. The terms rhinitis, rhinosinusitis, pharyngitis, and bronchitis are often used to indicate the anatomic area most affected. The term “common cold” is an illness term constructed and used by the general populace. This distinction between professional (disease) and popular (illness) conceptions6 provides the reasoning for participant-based, patient-oriented qualitative development of measurement tools. While many medical professionals may choose to measure URI disease by physical examination, viral culture, or laboratory analysis of blood or nasal discharge, we believe that most people are more interested in how they can reduce the severity and duration of their symptoms and the functional impairments that result from their illness.
George Gee Jackson and colleagues7 began experimental work in the 1950s, observing and recording the cold symptoms produced by challenging more than 1,000 volunteers with filtered nasal secretions obtained from cold-sufferers. Eight symptoms–sneezing, headache, malaise, chilliness, nasal discharge, nasal obstruction, sore throat, and cough–were selected for evaluation and graded as absent (0), mild (1), moderate (2), or severe (3) every day for 6 days after inoculation. A score of 14 or higher was chosen as the cutoff value that best distinguished infected from noninfected participants. Thus, the original Jackson scale was apparently designed to discriminate between those with and without demonstrable viral infection, and not as a measure of severity. The tables and graphics in Jackson’s seminal works point toward reasonable internal consistency and discriminate validity.7-9 However, other important measurement properties, such as precision, reliability, responsiveness, and stability, were not reported. Despite these limitations, Jackson’s scale has been used for decades by most of the major common cold research groups.10-15
Using various modifications of the Jackson scale, researchers of the cold have characterized the frequency and severity of the 8 symptoms noted above in both natural colds and experimentally induced rhinovirus infections. Variability in symptom expression remains a hallmark of URI. Although specific pathogens are associated with the severity and distribution of symptoms at the population level, symptoms are poor predictors of etiology at the individual level. Infection itself is an imperfect predictor of symptom expression, as asymptomatic infections occur frequently, and as URI-like symptoms occur in people in whom it is not possible to demonstrate infections.16 Even among people with documented experimental infections of single strains of virus, variance outweighs central tendency in all symptom measurements.17,18
The search for objective disease measures with which to compare symptom scores has also progressed. To date, the following measures have been evaluated: detection of virus with culture or polymerase chain reaction,16,19 cytokine measurement,20-22 serologic markers,23 physical examination,9,24 radiologic imaging,25,26 rhinomanometry,27,28 mucus weight,29 mucus velocity, and number of tissues used.30 None have been shown to be superior to self-reported symptoms in terms of precision, reliability, or responsiveness or in their ability to predict functional impairment or subsequent illness. Perhaps more important, none have been shown to reflect the values of the people who experience colds. Although a number of quality-of-life instruments have been developed to assess allergic rhinitis,31-36 we have been unable to locate any specifically developed to assess URI.
We therefore decided to develop the Wisconsin Upper Respiratory Symptom Survey (WURSS) to provide a standardized measure for evaluating the negative consequences of the common cold. We were particularly interested in developing a health-related quality of life instrument that would represent the symptomatic and functional dimensions that are important to cold-sufferers.37-40 The instrument should be able to discriminate accurately between active intervention and placebo effects in randomized therapeutic trials and should balance brevity and ease of use with optimal precision, reliability, and responsiveness.41-43 It should be based on self-diagnosis and self-assessment because neither accepted criteria nor adequate tests are available to diagnose “upper respiratory infection” or “acute infectious rhinosinusitis”(with or without “pharyngitis”) and because the vast majority of cold treatments will be taken without professional input after self-diagnosis.
Methods
Phase 1: Initial development during a randomized trial
The development of this study began in 1998 during the design of a randomized controlled trial (RCT) of echinacea as a cold treatment. We created our first instrument by showing successive drafts to friends and colleagues (mostly family physicians), stopping once we were satisfied that the questionnaire had reasonable face validity. This initial instrument rated global severity of illness (“How sick do you feel today?”) and 15 individual symptoms on a 9-point Likert-type scale. The 15 symptom-measuring items were complemented by 4 dichotomous (yes/no) functional outcome questions, adapted with permission from the validated Medical Outcomes Study 36-item Short-Form Health Survey (SF-36).44
This initial instrument was used in the spring of 1999 in the echinacea RCT.45 This experience provided a good initial test of our instrument, as the participants were recruited within 36 hours of their first symptom and monitored each day until they had answered “No” to the question, “Do you think that you are still sick today?” for 2 days in a row. Each participant was asked to fill out the questionnaire both on paper and on a computerized data-collecting facsimile (available at http://www.fammed.wisc.edu/samplecold).
Phase 2: Further instrument development using qualitative methods
After the echinacea RCT was completed, our primary concern was that we might be overlooking or under-representing important illness domains. We also suspected that wording, question order, response range, and other formatting concerns could be improved. To achieve these goals, we used qualitative instrument-development methodologies, involving the people we wanted to measure–cold-sufferers–in the development process.40,46-50
After obtaining approval from the University of Wisconsin Medical School Human Subjects Committee, we began interviewing Madison-area adults who responded to community advertising asking for volunteers with colds. Inclusion criteria required answering “Yes” to the question, “Do you believe that you have a cold?” For an interview to be arranged, at least one cold symptom had to be present, and the research assistant had to be convinced that the caller was indeed suffering from a common cold. Prospective participants with itchy eyes, sneezing, or a history of allergy were excluded if either the participant or the interviewer felt that any current symptoms might have been caused by allergy. Interviews were held in a location of mutual convenience and with the aid of an interview guide developed by our research team. Interviewers were carefully trained in the research protocol and used interview guides for both the initial telephone screen and the in-person interviews. Interviewers included both clinicians and nonclinicians.
The semistructured interview guide used open-ended questions designed to elicit the participants’ own terminology for describing their colds (Table 1).51-53 We aimed for an understanding of how the experience of the cold influenced the lives of the participants. Participants were first asked to list all their symptoms, then to describe how each symptom bothered them. Next, we asked which symptom(s) appeared first and which one(s) followed. We then asked which symptoms were most bothersome and why. Participants were asked to describe what they did to relieve their cold symptoms, why, and whether the therapy provided any relief. Participants were then asked about how their cold affected their lifestyle with regard to work, relationships, activities, and so forth. Additionally, we asked about symptoms and effects of previous colds. This exploratory phase of the interview lasted approximately 20 to 30 minutes.
Once the interviewer had a thorough description and understanding of the participant’s cold, the participant was asked to complete the questionnaire-in-development. After marking answers on the questionnaire (which took 3 to 5 minutes), each participant was asked to comment on its ease of use, item wording, formatting, and response range as well as whether it accurately and comprehensively measured the symptoms and functional impact they were experiencing. The instrument development phase of the interview lasted for another 20 to 30 minutes.
We used focus group methods in the final month of the study as an additional window into participants’ experiences.54-56 The focus groups used the same inclusion criteria as the long interviews and followed the same general format, first using open-ended questions to elicit symptoms and their impact, then administrating the questionnaire and discussing item inclusion and formatting. However, we encouraged discussion rather than self-assessment, as the focus group methodology derives its strength from the interactive nature of conversation. For instance, a statement made by one participant would spark interest or recall in another, thereby generating a richer, fuller, and more representative description of symptoms and functional impact.
Individual interviews were held by 1 of 5 trained interviewers (B.B., L.L., R.M., E.S., J.S.). All 3 focus groups were run by the lead author, with at least 1 other research team member assisting. Interviews and focus groups were arranged as soon as possible after the initial telephone contact so that participants would still have cold symptoms while being interviewed. All interviews and focus groups were discussed in biweekly group meetings. Decisions on item inclusion, wording, and questionnaire format were made by research group consensus. Several versions of the questionnaire were brought back to cold-sufferers for further cognitive testing. The diversity of interviewers and respondents provided protection against personal bias in ascertaining and interpreting symptoms and impairments.
TABLE 1
QUESTIONS ASKED DURING INTERVIEW
| Current Symptom History and Evaluation |
|---|
| List and describe all symptoms you have with this cold. |
| How do these symptoms bother you? |
| What is the first symptom you noticed when getting this cold? The Next? |
| The next? |
| Which cold symptom bothers you the most? How and why? |
| Are there other symptoms that bother you? How and why? |
| Interventions |
| What do you do to relieve cold symptoms? Why? |
| What over-the-counter medicines would you use? Why? Did it help? |
| What herbal medicines would you use? Why? Did it help? |
| Do you do anything else to relieve symptoms or treat your cold? Why? |
| Did it help? |
| When would you see a doctor or other health care provider? Why? |
| Lifestyle |
| Has this cold interfered with your normal activities? How? |
| When does a cold keep you from doing what you want or need to do? How? |
| Describe what things are harder to do? |
| Previous Symptom History and Evaluation |
| How many colds did you have this past year? |
| How long did they usually last? |
| List and describe what symptoms you usually get with your colds? |
| How do these symptoms bother you? |
| Survey Evaluation (After Participant Has Completed the Questionnaire) |
| Is this form easy to read? |
| Are there any other symptoms that should be on this questionnaire? |
| Are there any questions that shouldn’t be there? |
| Are there any questions that could be worded better? |
| Is the 7-point scale appropriate? Why or why not? |
Results
Phase 1
Of the 148 college students enrolled, 142 followed protocol and were included in the analysis. Of the 853 person-days documented, 546 (64%) were covered by both data systems; 287 (33.6%) came from paper surveys only; and 18 (2.1%) were filled out via computer only. Because only 2 (0.2%) questionnaires were missing any data, our data capture rate was 99.8%. Comparing data from the computerized and paper data sources provided evidence of consistency. Of the 546 days in which both paper and computer instruments provided data, 512 yielded identical responses (94% concordant) to the global severity of illness question. Of the 34 (6%) discrepancies, 29 were off by 1 point on the 9-point Likert-type scale and 5 discrepancies were off by 2 points. Comparing computer and paper responses with the 15 specific symptom questions also yielded high levels of concordance. Of 8190 item responses, 7777 (95%) were concordant, while 413 (5%) were classified as data discrepancies. Of these, 293 were off by 1 point on the 9-point scale; 68 were off by 2 points; 27, by 3 points; 17, by 4 points; 7, by 5 points; and 1 by 6 points.
Factor analysis of the data provided further evidence of internal validity. Structural equation modeling techniques57,58 were used to model symptom severities over time. A 4-dimensional symptom-recovery model (df = 71; P = .000025) provided a goodness of fit index of 0.88, a root mean square residual of .095, and a chi-squared/df ratio of 139/71 = 1.95. From the pool of 15 scaled symptom scores, 14 items contributed significantly to the model. (In this data set, loss of appetite was an infrequent symptom contributing insignificantly toward the model, and was dropped.) The 14 symptoms naturally aggregated into 4 underlying symptomatic dimensions: cough, throat, nasal, and fever and aches. Table 2 provides the reliability coefficients, standardized item loading coefficients, and standard errors of these loadings for the 4 dimensions. The reliability coefficients of the symptom dimensions were calculated using a procedure proposed by Dillon and Goldstein.59 Scale recovery curves, generated using a mixed modeling approach,60,61 were internally predictive, responsive,37,62 and consistent with what is known about the natural history of URI.
TABLE 2
RELIABILITY OF SYMPTOM DIMENSION MODELS
| Item Loading (SE)* | |
|---|---|
| Cough Dimension (Reliability = 0.794) | |
| Coughing | 2.01 (0.20) |
| Coughing stuff up | 1.75 (0.18) |
| Cough interfering with sleep | 1.16 (0.17) |
| Fever and Aches Dimension (Reliability = 0.753) | |
| Headache | 1.28 (0.23) |
| Fever | 1.07 (0.13) |
| Sweats | 1.25 (0.16) |
| Muscle aches | 1.76 (0.19) |
| Feeling run down | 1.17 (0.19) |
| Throat Dimension (Reliability = 0.668) | |
| Sore throat | 1.10 (0.22) |
| Scratchy throat | 1.73 (0.23) |
| Hoarseness | 1.68 (0.24) |
| Nasal Dimension (Reliability = 0.663) | |
| Runny nose | 1.93 (0.28) |
| Stuffy nose | 1.05 (0.23) |
| Sneezing | 1.63 (0.26) |
| *All significant at P < .05. | |
| SE denotes standard error. | |
Phase 2
Between July and December 2000, 108 persons from the general population responded to advertising by calling a telephone number listed on posted flyers and in the newspaper. Of these 108 callers, 27 were eligible but declined to participate; 7 did not meet inclusion criteria (were younger than 18 years of age, had current allergy symptoms, or did not have cold symptoms); and 74 met study criteria and elected to participate (Table 3). Those declining to participate usually did so because of inconvenience in arranging an immediate interview or because compensation ($10 for interview, $15 for focus group) was insufficient. Participants were met in person for semistructured individual interviews (n = 56) or focus groups (3 groups, 20 individuals total). Two people were interviewed both individually and in focus group.
Based on the information gained during interviews, the instrument-in-development underwent 6 revisions during 2000. Each modification was tested with additional interviews. A final version was created in December 2000. A few items from the initial instrument used in the echinacea trial were modified in response to participants’ descriptions and insights. Several other items were added to reflect symptoms and functional impairments described by participants in response to our open-ended questions. All items used wording provided by participants or tested during subsequent interviews and focus groups.
All symptoms spontaneously reported by at least 3 participants in either individual interview or focus group were included in the final version (Table 4). Figure 1 provides a frequency distribution of the symptoms described during the individual interviews.
On the basis of our participants’ comments, the distribution of severity data from the echinacea trial, and recommendations from published studies, we decided to decrease the response range from a 9-point to a 7-point Likert-type severity scale. The resulting severity range was marked at 1 (very mild), 3 (mild), 5 (moderate), and 7 (severe), following the majority opinion of our respondents. Unmarked (even-numbered) options were included, as most of the respondents felt they should have “in-between” choices. The functional outcome questions adapted from the SF-36 were replaced with participant-generated items, which were then scaled in a 7-point format similar to that used for the symptoms. A final question comparing today’s global severity with yesterday’s was added to provide a comparative measure of change over time (responsiveness). Figure 2 displays the final format of WURSS items.
The qualitative data provided by our informants improved our understanding of the symptomatic and functional impact of the common cold and assisted the development of the WURSS questionnaire. Although it is clear that people experience colds in different ways, several common threads emerged. For instance, we found that our original instrument (like the Jackson criteria) had overrated individual symptoms and had underrated functional impact, interference with social relationships, and general malaise. Informants often told us that it was not necessarily the individual symptoms that bothered them, but the general feelings, described as “sick feeling,” “loss of energy,” “run down,” “tired,” “fatigue,” “malaise,” “lousy,” “lazy,” “spacey," "blah," "yucky," "foggy," "lightheaded," "fuzzy brain,” “cloudy,” “disoriented,” “uncomfortable,” “distracted,” and “miserable.” Our informants also told us that they were bothered by the way their cold interfered with day-to-day activities and relationships. Colds affected physical activities such as breathing or walking, performance at work or in the home, and interactions with friends, family, and coworkers. Terms describing the most frequent and bothersome effects were incorporated into the final WURSS instrument.
TABLE 3
INTERVIEW AND FOCUS GROUP PARTICIPANT DEMOGRAPHICS
| Number | |
|---|---|
| Method of Data Collection | |
| Individual interviews | 56 |
| Focus groups | 20 |
| Total | 74* |
| Sex | |
| Women | 49 |
| Men | 25 |
| Ethnicity | |
| Native American | 2 |
| Black | 12 |
| Hispanic | 2 |
| White | 57 |
| No response | 1 |
| Annual Income | |
| < $10,000 | 28 |
| $10,000–19,999 | 17 |
| $20,000–29,999 | 13 |
| $30,000–49,999 | 9 |
| $50,000–75,000 | 3 |
| $75,000 | 2 |
| No response | 2 |
| Education | |
| Some high school | 13 |
| High school or equivalent | 11 |
| Some college | 11 |
| Associate or technical degree | 6 |
| Bachelor’s degree | 21 |
| Master’s degree | 6 |
| Professional degree | 4 |
| No response | 2 |
| Tobacco Use | |
| Current | 26 |
| Past | 19 |
| Never smoker | 28 |
| No response | 1 |
| *Two participants were used in both data collection methods. | |
| NOTE: Age range was 19 to 71 years, mean = 35.9 years (standard deviation, 11.9). | |
TABLE 4
SYMPTOMS AND FUNCTIONAL IMPAIRMENTS EVALUATED BY THE WISCONSIN UPPER RESPIRATORY SYMPTOM SURVEY
| Symptoms | Plugged ears |
| Cough | Ear discomfort |
| “Coughing stuff up” | Watery eyes |
| Cough interfering with sleep | Eye discomfort |
| Sore throat | Head congestion |
| Scratchy throat | Chest congestion |
| Hoarseness | Chest tightness |
| Runny nose | Heaviness in chest |
| Plugged nose | Lack of energy |
| Sneezing | Loss of appetite |
| Headache | |
| Body aches | Functional Impairments |
| Feeling “run down” | Think clearly |
| Sweats | Speak clearly |
| Chills | Sleep well |
| Feeling feverish | Breathe easily |
| Feeling dizzy | Walk, climb stairs, exercise |
| Feeling tired | Accomplish daily activities |
| Irritability | Work outside the home |
| Sinus pain | Work inside the home |
| Sinus pressure | Interact with others |
| Sinus drainage | Live your personal life |
| Swollen glands |
FIGURE 1
SYMPTOMS REPORTED IN INDIVIDUAL INTERVIEWS
FIGURE 2
ITEM FORMAT FOR THE WISCONSIN UPPER RESPIRATORY SYMPTOM SURVEY
Discussion
Researchers of URIs and the common cold need a well-developed, standardized, validated outcomes instrument that reflects the experience and values of cold sufferers. While the Jackson scale and various modifications have been widely used, few data support the validity of these scales. Although correlations with external measures, such as physical examinations, mucus weight, and the ability to culture virus have been reported, the symptomatic and functional impact of colds has largely been neglected. Perhaps more important, the symptomatic measures used to date were apparently developed without significant input from the people whose illnesses were measured. Questionnaire development and cognitive testing methods have not been described, nor have adequate tests of psychometric properties been reported. Although the Jackson scale may demonstrate marginal face validity in terms of symptoms, it does not do so in terms of functional impact.
This article describes the first steps taken in the development and validation of a new illness-specific quality-of-life instrument for measuring the common cold. The WURSS instrument is more comprehensive than existing alternatives and better reflects cold-sufferers’ experiences and values. Therefore, it provides greater face validity. The length (44 items) reflects a compromise between ease of use and comprehensiveness.41 It is possible that a subset of the items will prove nearly as effective and that a short-form WURSS will eventually be available. Item reduction will need to be guided by both internal (factor analysis) and external (frequency and perceived value) considerations. The standardized 7-point severity scale used throughout the WURSS makes the instrument very easy to use.49 It also provides a severity range that our informants and previous researchers40,63,64 agree is optimal. The WURSS allows a cold-sufferer to swiftly and accurately assess his or her common cold. We hope that WURSS will prove worthy in terms of standard psychometric properties such as precision, reliability, and responsiveness.65-68 A large prospective study will be necessary for those assessments.
Limitations
The work described here has a number of limitations. The WURSS was developed in Madison, Wis., largely among people with self-diagnosed colds during the period from July to December 2000. The RCT occurred over several months in the spring of 1999 and was limited to college students. Our results are therefore limited by both population and etiologic agent, which in turn may influence the symptom and severity spectrums assessed. Although we aimed for and achieved a moderate degree of socioeconomic diversity (Table 3), our participants’ responses may not be representative of the larger universe of cold-sufferers. The symptom distribution in Figure 1, for example, is unlikely to represent global cold symptom frequency accurately. Previous research with both natural and induced colds suggests that nasal symptoms and sore throat are usually more frequent than cough.2,3,6-18 The comprehensiveness of the instrument is more important for instrument development than are the specific item frequencies. Here, we feel that we succeeded in representing a sufficient range of items.
Another important limitation is the inherent variability and subjectivity of information generated from qualitative research. A similar instrument development effort carried out by different researchers would inevitably yield a somewhat different questionnaire. Eliciting and formatting terminology that reflects symptomatic and functional impact presents a number of challenges. Future research could employ a quantitative importance scale for participants to use in assessing the value of symptoms and functional impacts. Such value scales could be used alongside factor analysis models of item and dimension frequency and severity. These could in turn be compared with external criteria such as physician assessment, tissue counts, and nasal mucus weights, measurements of inflammatory cytokines, and quantitative viral cultures. Because no gold standard exists, single-criterion validity assessment will not be sufficient. Instead, the concept of construct validity will need to be invoked for future attempts at validation. Construct validity has been defined as “validity assessed by comparing the results of several contrasting tests of validity (including concurrent, convergent, and divergent validation studies) with predictions from a theoretical model.”64 Our work so far has only begun to scratch the surface of such rigorous validity assessment.
Conclusions
We have developed an instrument that measures patient-oriented outcomes identified as important by people with self-diagnosed common colds. We expect that the WURSS will do well with physician-diagnosed “bronchitis,” “sinusitis,” or “pharyngitis,” but as yet have no data with which to evaluate that supposition. We hope that the development of the WURSS stimulates other researchers to undergo similar efforts at aimed at patient-oriented outcome measurement and that the efforts can be compared. We have made the WURSS available for general use by placing a printable facsimile online at http://www.fammed.wisc.edu/wurss/. University-based health care researchers and other nonprofit entities may use the WURSS freely, but we do ask to be notified of such use. For-profit entities should contact us before using this copyrighted instrument.
The next step will be for WURSS to undergo large-scale psychometric testing with the goal of assessing its internal and external validity properties more accurately. We welcome comments, consultation, and collaboration and hope to involve other researchers as we move further in the direction of an accurate and reliable method for assessing the impact of the common cold.
Acknowledgments
The authors would like to acknowledge the participants who contributed their time and energy while they were sick. We also thank the many physicians and coworkers who contributed their knowledge and opinions, especially Nora Cate Schaeffer, PhD; Mary Beth Plane, PhD; Jon Temte, MD, PhD; Donn D’Alessio, MD; and William Scheckler, MD, in Madison, Wis., and Jack Gwaltney, MD, in Charlottesville, Va. During most of this project, Dr Barrett has had support from the National Center for Complementary and Alter native Medicine at the National Institutes of Health, Grant #K23 AT00051-01.
1. Dingle JH, Badger GF, Jordan WS. Illness in the home: a study of 25,000 illnesses in a group of Cleveland families. Cleveland, Ohio: Western Reserve University Press; 1964.
2. Gwaltney JM, Hendley JO, Simon G, Jordan WS. Rhinovirus infections in an industrial population. JAMA 1967;202:158-64.
3. Monto AS, Ullman BM. Acute respiratory illness in an American community. JAMA 1974;227:164-9.
4. Smith MBH, Feldman W. Over-the-counter cold medications: a critical review of clinical trials between 1950 and 1991. JAMA 1993;269:2258-63.
5. Turner RB. The treatment of rhinovirus infections: progress and potential. Antiviral Res 2001;49:1-14.
6. Kleinman A. Culture, illness, and care: clinical lessons from anthropologic and cross-cultural research. Ann Intern Med 1978;88:251-8.
7. Jackson GG, Dowling HF, Spiesman IG, Boand AV. Transmission of the common cold to volunteers under controlled conditions. Arch Intern Med 1958;101:267-78.
8. Jackson GG, Dowling HF, Anderson TO, Riff L, Saporta J, Turck M. Susceptibility and immunity to common upper respiratory viral infections–the common cold. Ann Intern Med 1960;55:719-38.
9. Jackson GG, Dowling HF, Muldoon RL. Present concepts of the common cold. Am J Public Health 1962;52:940-5.
10. D’Alessio D, Peterson JA, Dick CR, Dick EC. Transmission of experimental rhinovirus colds in volunteer married couples. J Infect Dis 1976;133:28-36.
11. Dick EC, Jennings LC, Mink KA, Wartgrow CD, Inhorn SL. Aerosol transmission of rhinovirus colds. J Infect Dis 1987;156:442-8.
12. Gwaltney JM, Hendley JO. Transmission of experimental rhinovirus infection by contaminated surfaces. Am J Epidemiol 1982;116:828-33.
13. Hayden FG, Diamond L, Wood PB, Korts DC, Wecker MT. Effectiveness and safety of intranasal ipratropium bromide in common colds. Ann Intern Med 1996;125:89-97.
14. Cohen S, Frank E, Doyle WJ, Skoner DP, Rabin BS, Gwaltney JM. Types of stressors that increase susceptibility to the common cold in healthy adults. Health Psychol 1998;17:214-23.
15. Gern JE, Busse WW. Association of rhinovirus infections with asthma. Clin Microbiol Rev 1999;12:9-18.
16. Arruda E, Pitkäranta A, Witek TJ, Doyle CA, Hayden FG. Frequency and history of rhinovirus infections in adults during autumn. J Clin Microbiol 1997;35:2864-8.
17. Gwaltney JM, Buier RM, Rogers JL. The influence of signal variation, bias, noise and effect size on statistical significance in treatment studies of the common cold. Antiviral Res 1996;29:287-95.
18. Rao SS, Hendley JO, Hayden FG, Gwaltney JM. Symptom expression in natural and experimental rhinovirus colds. Am J Rhinol 1995;9:49-52.
19. Freymuth F, Vabret A, Brouard J, et al. Detection of viral, Chlamydia pneumoniae and Mycoplasma pneumoniae infections in exacerbations of asthma in children. J Clin Virol 1999;13:131-9.
20. Igarashi Y, Skoner DP, Doyle WJ, White MV, Fireman P, Kaliner MA. Analysis of nasal secretions during experimental rhinovirus upper respiratory infections. J Allergy Clin Immunol 1993;92:722-31.
21. Johnston SL, Papi A, Bates PJ, Mastronarde JG, Monick MM, Hunninghake GW. Low grade rhinovirus infection induces a prolonged release of IL-8 in pulmonary epithelium. J Immunol 1998;160:6172-81.
22. Teran LM, Johnston SL, Schroder JM, Church MK, Holgate ST. Role of nasal interleukin-8 in neutrophil recruitment and activation in children with virus induced asthma. Am J Respir Crit Care Med 1997;155:1362-6.
23. Korppi M, Kröger L. Laitinen. White blood cell and differential counts in acute respiratory viral and bacterial infections in children. Scand J Infect Dis 1993;25:435-40.
24. McBride TP, Doyle WJ, Hayden FG, Gwaltney JM. Alterations of the Eustachian tube, middle ear, and nose in rhinovirus infection. Arch Otolaryngol Head Neck Surg 1989;115:1054-9.
25. Gwaltney JM, Phillips CD, Miller RD, Riker DK. Computed tomographic study of the common cold. N Engl J Med 1994;330:25-30.
26. Turner BW, Cail WS, Hendley JO, et al. Physiologic abnormalities in the paranasal sinuses during experimental rhinovirus colds. J Allergy Clin Immunol 1992;90:474-8.
27. Dressler WE, Myers T, London SJ, Rankell AS, Poetsch CE. A system of rhinomanometry in the clinical evaluation of nasal decongestants. Ann Otol Rhinol Laryngol 1977;86:310-6.
28. Tomkinson A, Eccles R. Comparison of the relative abilities of acoustic rhinometry, rhinomanometry, and the visual analogue scale in detecting change in the nasal cavity in a healthy adult population. Am J Rhinol 1996;10:161-5.
29. Parekh HH, Cragun KT, Hayden FG, Hendley JO, Gwaltney JM. Nasal mucus weights in experimental rhinovirus infection. Am J Rhinol 1992;6:107-10.
30. Scaglione F, Lund B. Efficacy in the treatment of the common cold of a preparation containing an echinacea extract. Int J Immunopharmacol 1995;11:163-6.
31. Juniper EF, Guyatt GH, Griffith LE, Ferrie PJ. Interpretation of rhinoconjuctivitis quality of life questionnaire data. J Allergy Clin Immunol 1996;98:843-5.
32. Juniper EF. Measuring health-related quality of life in rhinitis. J Allergy Clin Immunol 1997;99:S742-9.
33. Kozma CM, Sadik MK, Watrous ML. Economic outcomes for the treatment of allergic rhinitis. PharmacoEconomics 1996;410:4-13.
34. Meltzer EO, Nathan RA, Selner JC, Storms W. The prevalence and medical and economic impact of allergic rhinitis in the United States. J Allergy Clin Immunol 1997;99:S807-28.
35. Meltzer EO, Nathan RA, Selner JC, Storms W. Quality of life and rhinitic symptoms: Result of a nationwide survey with the SF-36 and RQLQ questionnaires. J Allergy Clin Immunol 1997;99:815-9.
36. Piccirillo JF, Edwards D, Haiduk A, Yonan C, Thawley SE. Psychometric and clinimetric validity of the 31-item rhinosinusitis outcome measure (RSOM-31). Am J Rhinol 1995;9:297-306.
37. Deyo RA, Diehr P, Patrick DL. Reproducibility and responsiveness of health status measures. Controlled Clin Trials 1991;12(suppl 4):142S-158S.
38. Guyatt GH, Kirshner B, Jaeschke R. Measuring health status: What are the necessary measurement properties? J Clin Epidemiol 1992;45:1341-5.
39. Guyatt GH. Health status, quality of life, and the individual. JAMA 1994;272:630-1.
40. Juniper EF, Guyatt GH, Jaeschke R. How to develop and validate a new health-related quality of life instrument. In Spilker B, ed. Quality of life and pharmacoeconomics in clinical trials. Philadelphia, Pa: Lippincott-Raven; 1996;49-56.
41. Katz JN, Larson MG, Phillips CB. Comparative measurement sensitivity of short and longer health status instruments. Med Care 1992;30:917-25.
42. Schaeffer NC, Charng H-W. Two experiments in simplifying response categories: intensity and frequency categories. Sociol Perspect 1991;34:165-82.
43. Shrout PE, Yager TJ. Reliability and validity of screening scales: Effect of reducing scale length. J Clin Epidemiol 1989;42:69-78.
44. McHorney CA, Ware JE, Raczek AE. The MOS 36-item short-form health survey (SF-36): II. Psychometric and clinical tests of validity in measuring physical and mental health constructs. Med Care 1998;31:247-63.
45. Barrett B, Locken L, Maberry R, Brown RL, Bobula JA, D’Alessio D. A randomized double-blind trial of an unrefined mixture of Echinacea purpurea and E angustifolia used to treat the common cold: no benefit detected. Submitted for publication 2001.
46. Bullinger M, Anderson R, Cella D, Aaronson N. Developing and evaluating cross-cultural instruments from minimum requirements to optimal models. Qual Life Res 1993;2:451-9.
47. Fischer D, Stewart AL, Bloch DA, Lorig K, Laurent D, Holman H. Capturing the patient’s view of change as a clinical outcome measure. JAMA 1999;282:1157-62.
48. Harris-Kojetin LD, Fowler FJ, Brown JA, Schnaier JA, Sweeny SF. The use of cognitive testing to develop and evaluate CAHPS 1.0 core survey items. Consumer assessment of health plans study. Med Care 1999;37:MS10-21.
49. Mullin PA, Lohr KN, Bresnahan BW, McNulty P. Applying cognitive design principles to formatting HRQOL instruments. Qual Life Res 2000;9:13-27.
50. Schaeffer NC. Conversation with a purpose or conversation? Interaction in the standardized interview. In: Biemer P, Groves RM, Lyberg LE, Mathiowitz NA, Sudman S, eds. Measurement errors in surveys. New York, NY: Wiley; 1991;367-91.
51. Britten N. Qualitative interviews in medical research. BMJ 1995;311:251-3.
52. Crabtree BF, Miller WL. Qualitative approach to primary care research: the long interview. Fam Med 1991;23:145-51.
53. McCracken G. The long interview. Thousand Oaks, Calif: Sage Publications; 1988.
54. Hughes D, DuMont K. Using focus groups to facilitate culturally anchored research. Am J Community Psychol 1993;21:775-807.
55. Kitzinger J. Qualitative research: Introducing focus groups. BMJ 1995;311:299-302.
56. Morgan D. Focus groups and qualitative research. Thousand Oaks, Calif: Sage Publications; 1988.
57. Bolan KA. Structural equations with latent variables. New York, NY: John Wiley & Sons; 1989.
58. Joreskog KG, Sorbom D. LISREL 8 User’s Reference Guide. Chicago, Ill: Scientific Software International, Inc; 1993.
59. Dillon WR, Goldstein M. Multivariate analysis: methods and applications. New York, NY: John Wiley & Sons; 1984.
60. Davis CS. Semi-parametric and non-parametric methods for the analysis of repeated measurements with applications to clinical trials. Stat Med 1991;1:1959-80.
61. Goldstein H. Multilevel statistical models. New York: Halsted, 1995.
62. Hays RD, Hadom D. Responsiveness to change: an aspect of validity, not a separate dimension. Qual Life Res 1992;1:73-5.
63. Jaeschke R, Singer J, Guyatt GH. Measurement of health status: ascertaining the minimal clinically important difference. Control Clin Trials 1989;10:407-15.
64. McDowell I, Newell C. Measuring health: a guide to rating scales and questionnaires. Oxford, England: Oxford University Press; 1996.
65. Deyo RA, Centor RM. Assessing the responsiveness of functional scales to clinical change: an analogy to diagnostic test performance. J Chronic Dis 1986;39:897-906.
66. Guyatt GH, Walter S, Norman G. Measuring change over time: assessing the usefulness of evaluative instruments. J Chronic Dis 1987;40:171-8.
67. Hays RD, Anderson R, Revicki D. Psychometric considerations in evaluating health-related quality of life measures. Qual Life Res 1993;2:441-9.
68. Wright JG, Feinstein AR. A comparative contrast of clinimetric and psychometric methods for constructing indexes and rating scales. J Clin Epidemiol 1992;45:1201-18.
Defining Effective Clinician Roles in End-of-Life Care
OBJECTIVE: Our goal was to determine primary care clinician perceptions of what is important to the provision of quality end-of-life care.
STUDY DESIGN: We used ethnography, a qualitative research method involving the use of open-ended semistructured interviews.
POPULATION: We included 38 family practice residency faculty from 9 community residency programs of the Affiliated Family Practice Residency Network, Department of Family Medicine, University of Washington School of Medicine.
OUTCOMES MEASURED: The roles described by interviewees when discussing their best practices while delivering end-of-life care were compiled.
RESULTS: Primary care clinicians organize their delivery of quality end-of-life care predominantly through their relationships with patients and families. They play 3 roles when providing end-of-life care. As consultants, clinicians provide expert medical advice and treatment. As collaborators, they seek to understand the patient and family experience. Seasoned clinicians act as guides, using their personal intuitive knowledge of patient and family to facilitate everyone’s growth when providing end-of-life care.
CONCLUSIONS: Shifting clinician focus from skills and knowledge toward relationship, meaning, and roles provides new opportunities to improve end-of-life care for patients, families, and clinicians.
- Exemplary end-of-life care is organized around relationships, meaning, and roles.
- Knowledge and skills are essential but are not how exemplary end-of-life care is organized.
- Clinicians providing end-of-life care play 3 roles: consultant, collaborator, and guide.
- Shifting clinician focus from skills and knowledge toward relationship, meaning, and roles provides new opportunities to improve care.
Modern medicine has dramatically improved the length and quality of life for countless persons but has also created problems in integrating these advances with end-of-life care. Although 70% of Americans want to die in their own home supported by family, 74% of Americans currently die in institutions.1,2 Clearly, there is a disparity between patient preferences and the end-of-life services provided in America.
Most recommendations for the provision of quality end-of-life care are based on unresearched expert opinion that identifies problems and offers solutions.3-5 Studies have explored communication strategies,6 satisfaction levels with care,7 perceptions of management issues,8 and attitudes toward both death and dying patients.9 Yet little research addresses how practicing community clinicians develop the appropriate relationships and integrate the requisite knowledge, skills, and attitudes to provide quality end-of-life care.
The relationship between clinician, patient, and family and the personal meaning of events for each participant greatly influence end-of-life care.10 Although most commentary on physician roles and relationships in end-of-life care also reflects unresearched expert opinion,11-13 Steinmetz and Gabel14,15 theorized a model that was later validated against the experience of practicing family physicians. The role of the clinician in the successful provision of quality care has not been systematically researched and remains a major challenge to improving end-of-life care. We describe an exploratory qualitative study to determine the perceptions of practicing clinicians regarding quality end-of-life care.
Methods
With approval from the Human Subjects Committee of the University of Washington School of Medicine, faculty were recruited from 9 community programs in the Affiliated Family Practice Residency Network of the Department of Family Medicine. Twenty semistructured long interviews were conducted from a convenience sample at 3 residency sites.16 An additional 8 semistructured interviews and 2 focus groups (10 participants) further explored the data. Thus, a total of 38 clinicians participated in the study. Demographic characteristics of the study cohort have been published previously.10
We conducted the initial 20 interviews using open-ended questions designed to uncover faculty perceptions of quality end-of-life care. The questions explored may be found in the Table. Nonspecific prompts such as “tell me more” were used to enrich data and avoid interviewer bias. The interview was rehearsed with a medical school faculty expert in ethnographic research, field tested, and adjusted before final use. The interviews were audio-recorded and transcribed into qualitative research software.17
Throughout the interview process, the investigators met weekly to compare findings, discuss emerging categories, and jointly code the transcripts for model development using the process of grounded theory described by Glaser and Strauss.18 Common themes, communication and educational issues, and roles and relationships were identified. Data were constantly compared and winnowed to facilitate manageability; data collection and analysis occurred simultaneously.19,20 Common themes are published elsewhere.10 We report and discuss the analysis of the data pertaining to clinician roles and relationships.
We employed the following 3 strategies to assess the methodologic validity of the study and face validity of the themes and models emerging from the data analysis.
TABLE
INTERVIEW QUESTIONS
Remember a case in which you provided care for a patient and family facing a chronic, progressive, terminal illness:
|
Methodologic validation
The themes, models, and 2 interview transcripts were reviewed by 2 expert consultants with experience in qualitative research on end-of-life care and chronic debilitating disease. They assessed the validity of the research process and model development.21,22 These experts confirmed the methodologic approach, affirmed that the transcripts supported the coded model, and noted that the results were consistent with their own past research experience.
Face validity faculty interviews
Long interviews were conducted with a convenience sample of 8 faculty at 2 other residency sites. Researchers described the previous interview process and presented a written summary of the roles and relationship model coded from the data. Dialogue was encouraged with nonspecific prompts to enrich the data and avoid interviewer bias. Interviews were recorded, transcribed, and coded by the researchers to assess face validity and further develop the roles and relationship model using a grounded theory approach.
Face validity focus groups
Two focus groups were conducted with a total of 10 faculty at 2 additional sites. The entire model (themes, communication, roles, and relationships) was presented, and dialogue was encouraged. The researchers recorded, transcribed, and reviewed the focus groups to further assess face validity and refine the model.
Content validity
In a manner identical to that of the focus groups, the researchers presented the entire model at 2 of the 3 sites where faculty provided the initial 20 interviews. These sessions were audiotaped, transcribed, and reviewed by the researchers. The model presented was considered a valid, clinically plausible summary of the content of the initial interviews.
Results
Content analysis of the roles and relationships described by the study cohort revealed 3 distinct clinician roles in the provision of end-of-life care that we termed “consultant,” “collaborator,” and “guide.” All roles were viewed as important; none was more valuable than another; and the roles appeared to build on each other, often merging. Roles were implemented fluidly, with clinicians moving from one role to another as circumstances dictated. Although clinicians tended to describe successful cases, they freely discussed the challenges of end-of-life care, noting that less-than-ideal results were frequent. Thus, the models were described as “best practice” rather than routine care.
Consultant
The consultant provides expert medical information to the patient and family based on the biomedical model and the disease process. The power of the consultant role emanates from the clinician’s medical authority and special knowledge. The consultant presents information to help the patient and family understand the diagnosis, prognosis, and treatment. Once this knowledge is understood, the patient and family determine its meaning to them and decide on treatment. If the patient or family cannot decide or understand the medical implications of their particular situation, the consultant decides based on the medical facts.
A pediatrician illustrated the application of the consultant role in 2 situations involving newborns with severe heart anomalies. Here the physician describes the difficulty of using only medical facts to assist the family in deciding whether to discontinue the ventilator: “I remember saying: ‘The only thing that’s keeping the baby alive at this point is the ventilator. How do you feel about making the decision to turn that off?’ I remember it was a very cruel thing to have them make the decision.”
The physician continued: “Next time I said: ‘We have to sit down and talk about how your baby is doing because he died, and I’m going to turn off the machines now.’ I don’t think we should put them in the position of having to make this decision. We should make this decision and tell them what we’re going to do.” In this situation the clinician employed biomedical expertise to determine the appropriate medical care and outcome for the patient and family. In both cases the decision centered on continuing or discontinuing a medical intervention (respirator) and avoided discussion of the parents’ affective experience. Hallmarks of the consultant role include a biomedical focus, disease-centered decision-making processes, and the clinician’s assumption of authority based on biomedical expertise.
Collaborator
The collaborator exchanges information with the patient and family to promote a common understanding of the diagnosis and illness experience, working with them to choose a treatment path. The collaborator incorporates all components of the consultant role and additionally requires the clinician to understand the patient/family experience. The collaborator considers patient and family issues that need to be addressed to understand the medical facts, appreciates their past experiences with serious illness, determines what information would be difficult for them to accept but would benefit them if they were challenged to confront it, and recognizes that the patient and family hold ultimate responsibility for making treatment decisions.
The following quotes exemplify collaborative clinical care. In the first example, the physician steps outside his comfort zone to provide medical care based on the expressed wishes of a 30-year-old man dying of an advanced brain tumor: “The issue for me was letting go of control. He was going 4 hours away to a fishing cabin and going on a boat. I was really nervous…what if he all of a sudden crashed there? It took me a while to get used to the idea that he needs to be able to do what he enjoys doing, and everybody knows that there’s a risk.”
In a second example, the physician describes collaborating with the family of an 85-year-old woman suffering a massive stroke: “Having heard from the family that they understand that Grandma has had a big stroke and isn’t going to survive…then what wishes do Grandma and the family have? Have they ever discussed this sort of situation?”
In both these examples an understanding of the patient/family experience directs the clinician toward appropriate end-of-life care and is a major source of the collaborator’s power.
Guide
As a guide, the clinician actively and personally seeks solutions for the patient based not only on the medical facts (consultant) and the patient’s values and preferences (collaborator) but also on the guide’s greater understanding of the medical context. In essence, the guide not only knows why and where the patient and family prefer to go but also how to get there.
The following quote demonstrates a clinical application of the guide role. The physician first collaborates to understand the resistance of a terminally ill patient to hospice care:
“They had been very resistant to hospice for reasons that I wasn’t quite clear on. It wasn’t until I was in the home and listened to them talk that I realized they viewed hospice as ‘people are giving up on him.’ I think nobody really was talking to the patient about whether he was willing to give up or if he was ready to die.
“Once patient and family concerns were understood, the guide role was employed: I told the wife and family, ‘We’ve maxed out our medical therapies. There’s not much more we can do for him physically, but perhaps there’s something we can do for him spiritually and emotionally.’ When it was presented to them that way, they were much more understanding. We talked about hospice philosophy and looking at death as a part of life, saying: ‘That we’re not going to resuscitate does not mean do not treat.’ That’s where I came in more as the guide and said: ‘This is what I think is reasonable. What are your expectations? What do you want, Billy? And what do you want, as far as [his] wife and kids?”
The guide role requires that the clinician interpret the patient’s experience, integrate this interpretation with the clinician’s understanding of the clinical situation, and make a recommendation based on the guide’s personal and professional understanding of the situation. The power of the guide role emanates from the clinician’s understanding of how to use the medical system to see that the goals of patient and family are realized.
Discussion
The results of our study are consistent with reports over the past 3 decades by researchers, educators, and social critics who have explored how health professionals provide end-of-life care.23-29 Despite their varying perspectives, all reflect a common theme: the need to provide care based on the unique illness experience and values of the patient and family. The majority of clinicians in our study spoke of the importance of their relationships with patients and families. More than 50% of all interview commentary addressed clinician issues of relationship and personal meaning when providing end-of-life care.
The descriptions of consultant,30 collaborator,31,32 and guide33 confirm previous theoretical discussions regarding the nature of roles and relationships between patients and physicians. The guide is the most complex of the roles described by our study cohort and lends itself to ambivalence on the part of clinicians, in light of its potential to be misunderstood as paternalism. Yet, given the vulnerability and dependence of many patients who are terminally ill, the guide provides these patients with structure, safety, support, and care—based on the patients’ values and goals—reminiscent of the role of a nurturing parent.34
The personal nature of the decisions the guide facilitates reflects the reality of medicine as a moral enterprise.34,35 Having generally witnessed many more deaths than the patient, the guide has knowledge regarding the processes of dying and medical systems that is instrumental in assuring that the desires of the patient and family are realized. A knowledge of patient and family, an appreciation of the futility of the medical situation, and an insight into the process and systems of dying afford the clinician an opportunity to shape the death experience; as Nuland36 described: “Each of us needs a guide who knows us as well as he knows the pathways by which we can approach death.”
Facility with these roles may be a function of personal talent, introspection, and experience. The physicians studied reported that competence with these roles grew over time through delivering endof-life care and learning from patients, families, and other caregivers. Less experienced clinicians tended to describe the consultant and collaborator roles only. Clinicians describing the guide role had been in practice at least a decade and thus were at least 17 years into their training and practice in medicine. Apparently, expertise in all 3 roles requires not only excellent technical diagnostic and treatment skills but also the complex integrated skills of relational knowledge and caring gained through experience.
Our data indicate that relationship, meaning, and roles are primary moderators of the organization of exemplary end-of-life care. Yet, it appears to take nearly 2 decades for physicians to gain the confidence in their knowledge, skills, and attitudes necessary to comfortably guide patients and families through the nuances of end-of-life care. How to successfully educate clinicians to use such a model earlier is beyond our scope but appears crucial to improving training efforts. Current attempts to teach end-of-life care do not develop and explore the complex integrative domains of relational knowledge37-40 described in our study. Studies of educational interventions that stress the importance of the relational aspects of end-of-life care appear warranted.
To facilitate skill acquisition, the authors propose the steps diagrammed in the Figure to assist clinicians in providing quality end-of-life care. We believe the time spent determining patient-centered goals and the roles and relationships required by the clinician should at least equal the time spent determining which tests and treatments to provide. At the end of life, when tests and treatments result in fewer benefits and greater risks and burdens, determining patient and family needs and goals becomes increasingly important as management changes from cure to care.
FIGURE
FLOW DIAGRAM FOR CLINICIAN ROLES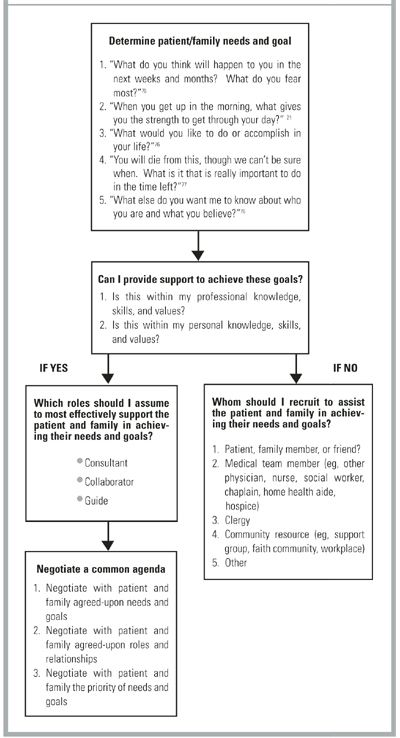
Limitations
This study is limited by a study sample of primary care, family practice faculty who geographically represent all practice in the Pacific Northwest and are predominantly Euro-American in ethnicity. The majority are family physicians, with the remainder pediatricians, internists, and a small number of nurse practitioners and physician assistants. Although no significant differences in terms of roles, relationships, and personal meanings between professional groups were noted, whether these findings are transferable to other primary care clinicians in community practice is unknown. Whether non–primary care specialists and clinicians of differing ethnicity or geographic region would respond differently is unknown. Generalizing these findings to non–primary care clinicians and clinicians of color requires further research.
Conclusions
Given the enormity of social and cultural values that make death a taboo topic, it is unclear how any single reform can easily overcome the multiple barriers to improved end-of-life care. Whether it is possible to teach attitudes and values, such as empathy and self-reflection, is uncertain, though promising curricula and research exist.41-42 If primary care physicians and other professionals improve their knowledge, skills, and attitudes in the delivery of such care, the ultimate effect on improving the experience of patients and families will require further study.
Acknowledgments
We wish to thank the Emily Davie and Joseph S. Kornfeld Foundation and The Nathan Cummings Foundation, New York, which provided generous grants that made our study and article possible. Additionally, we thank Phyllis Silverman, PhD, Harvard University, for her early counsel and advice; Tom Taylor, MD, PhD, University of Washington School of Medicine, for his thoughtful input into the study design, his sage guidance, and his review of the manuscript; Jeanne Quint Benoliel, DNS, Professor Emeritus, University of Washington School of Nursing, for her inspiration and review of the study design and results; and Greg Guldin, PhD, Pacific Lutheran University, for his thoughtful review of the manuscript.
1. The George Gallup International Institute. Spiritual beliefs and the dying process: a report on a national survey. Princeton, NJ: George Gallup International Institute;1997.
2. Field MJ, Cassel CK, eds. Approaching death: improving care at the end of life: Committee on Care at the End of Life, Division of Health Care Services, Institute of Medicine. Washington, DC: National Academy Press; 1997.
3. Schonwetter RS, Hawke W, Knight CF, eds. Hospice and palliative medicine core curriculum and review syllabus: American Academy of Hospice and Palliative Medicine. Dubuque, Iowa: Kendall/Hunt; 1999.
4. Emanuel LL, von Gunten CF, Ferris FD. The education for physicians on end-of-life care (EPEC) curriculum. Chicago, Ill: American Medical Association; 1999.
5. Lo B, Quill T, Tulsky J. Discussing palliative care with patients. Ann Intern Med 1999;130:744-49.
6. Todd C, Still A. General practitioners’ strategies and tactics of communication with the terminally ill. Fam Pract 1993;10:268-76.
7. Blyth AC. Audit of terminal care in a general practice. BMJ 1990;300:983-86.
8. Goodlin SJ, Jette AM, Lynn J, Wasson JH. Community physicians describe management issues for patients expected to live less than twelve months. J Palliat Care 1998;14:30-35.
9. Durand RP, Dickinson GE, Sumner DE, Lancaster CG. Family physicians’ attitudes toward death and the terminally-ill patient. Fam Pract Res J 1990;9:123-29.
10. Farber SJ, Egnew TR, Herman-Bertsch JL. Issues in end-of-life care: family practice faculty perceptions. J Fam Pract 1999;49:525-30.
11. Brewin TB. Not TLC but FPI. J R Soc Med 1990;83:172-75.
12. Mitchell G. The role of the general practitioner in palliative care. Aust Fam Physician 1994;23:1233-39.
13. Ogle KS, Plum JD. The role of the primary care physician in the care of the terminally ill. Clin Geriatr Med 1996;12:267-77.
14. Steinmetz D, Gabel LL. The family physician’s role in caring for the dying patient and family: a comprehensive theoretical model. Fam Pract 1992;9:433-36.
15. Steinmetz D, Walsh M, Gabel LL, Williams PT. Family physicians’ involvement with dying patients and their families. Arch Fam Med 1993;2:753-61.
16. Crabtree BF, Miller WL. A qualitative approach to primary care research: the long interview. Fam Med 1991;23:145-51.
17. Seidel J, Friese S, Leonard DC. The Ethnograph version 4.0 . Amherst, Mass: Qualis Research Associates; 1995.
18. Glaser B, Strauss A. The discovery of grounded theory. New York, NY: Aldine; 1967.
19. Strauss A, Corbin C. Basics of qualitative research. Newbury Park, Calif: Sage; 1990.
20. Wolcott HF. Writing up qualitative research. Newbury Park, Calif: Sage; 1990.
21. Benoliel JQ. Advancing nursing science: qualitative approaches. West J Nurs Res 1984;6:1-8.
22. Taylor TR, Gordon MJ, Ashworth CD. A systems perspective on clinical management. Behav Sci 1984;29:233-47.
23. Glaser BG, Strauss AL. Awareness of dying. Chicago, Ill: Aldine; 1965.
24. Kubler-Ross E. On death and dying. New York, NY: MacMillan; 1969.
25. Weisman A. On dying and denying: a psychiatric study on terminality. New York, NY: Behavioral Publications; 1972.
26. Saunders C, Baines M. Living with dying. New York, NY: Oxford University Press; 1983.
27. Corbin JM, Strauss AL. Unending work and care: managing chronic illness at home. San Francisco, Calif: Jossey-Bass; 1988.
28. Broyard A. Intoxicated by my illness. New York, NY: Potter; 1992.
29. Callahan D. Troubled dream of life. New York, NY: Simon & Schuster; 1993.
30. Balint J, Shelton W. Regaining the initiative: forging a new model of the patient-physician relationship. JAMA 1996;275:887-91.
31. Quill TE. Partnerships in patient care: a contractual approach. Ann Intern Med 1983;98:228-34.
32. Stewart M, Brown JB, Weston WW, McWhinney IR, Freeman TR. Patient centered medicine: transforming the clinical method. Thousand Oaks, Calif: Sage; 1995.
33. Emanuel EJ, Emanuel LL. Four models of the physician-patient relationship. JAMA 1992;267:2221-26.
34. Cassell EJ. The nature of suffering and the goals of medicine. New York, NY: Oxford University Press; 1991.
35. Veatch RM. Contemporary bioethics and the demise of modern medicine. In Ormiston G, Sassower R, eds. Prescriptions: the dissemination of medical authority. New York, NY: Greenwood Press; 1990;23-39.
36. Nuland S. How we die. New York, NY: Knopf; 1994.
37. Rogers CR. Client-centered therapy: its current practice, implications, and theory. Boston, Mass: Houghton Mifflin; 1951.
38. Buber M. I and thou. New York, NY: MacMillan; 1974.
39. Mayeroff M. On caring. New York, NY: HarperPerennial; 1990.
40. Kleinman A, Kleinman J. Suffering and its professional transformation: toward an ethnography of interpersonal experience. Cult Med Psychiatry 1991;15:275-301.
41. Novack DH, Suchman AL, Clark W, Epstein RM, Najberg E, Kaplan C. Calibrating the physician: personal awareness and effective patient care. JAMA 1997;278:502-09.
42. Epstein RM. Mindful practice. JAMA 1999;282:833-39.
OBJECTIVE: Our goal was to determine primary care clinician perceptions of what is important to the provision of quality end-of-life care.
STUDY DESIGN: We used ethnography, a qualitative research method involving the use of open-ended semistructured interviews.
POPULATION: We included 38 family practice residency faculty from 9 community residency programs of the Affiliated Family Practice Residency Network, Department of Family Medicine, University of Washington School of Medicine.
OUTCOMES MEASURED: The roles described by interviewees when discussing their best practices while delivering end-of-life care were compiled.
RESULTS: Primary care clinicians organize their delivery of quality end-of-life care predominantly through their relationships with patients and families. They play 3 roles when providing end-of-life care. As consultants, clinicians provide expert medical advice and treatment. As collaborators, they seek to understand the patient and family experience. Seasoned clinicians act as guides, using their personal intuitive knowledge of patient and family to facilitate everyone’s growth when providing end-of-life care.
CONCLUSIONS: Shifting clinician focus from skills and knowledge toward relationship, meaning, and roles provides new opportunities to improve end-of-life care for patients, families, and clinicians.
- Exemplary end-of-life care is organized around relationships, meaning, and roles.
- Knowledge and skills are essential but are not how exemplary end-of-life care is organized.
- Clinicians providing end-of-life care play 3 roles: consultant, collaborator, and guide.
- Shifting clinician focus from skills and knowledge toward relationship, meaning, and roles provides new opportunities to improve care.
Modern medicine has dramatically improved the length and quality of life for countless persons but has also created problems in integrating these advances with end-of-life care. Although 70% of Americans want to die in their own home supported by family, 74% of Americans currently die in institutions.1,2 Clearly, there is a disparity between patient preferences and the end-of-life services provided in America.
Most recommendations for the provision of quality end-of-life care are based on unresearched expert opinion that identifies problems and offers solutions.3-5 Studies have explored communication strategies,6 satisfaction levels with care,7 perceptions of management issues,8 and attitudes toward both death and dying patients.9 Yet little research addresses how practicing community clinicians develop the appropriate relationships and integrate the requisite knowledge, skills, and attitudes to provide quality end-of-life care.
The relationship between clinician, patient, and family and the personal meaning of events for each participant greatly influence end-of-life care.10 Although most commentary on physician roles and relationships in end-of-life care also reflects unresearched expert opinion,11-13 Steinmetz and Gabel14,15 theorized a model that was later validated against the experience of practicing family physicians. The role of the clinician in the successful provision of quality care has not been systematically researched and remains a major challenge to improving end-of-life care. We describe an exploratory qualitative study to determine the perceptions of practicing clinicians regarding quality end-of-life care.
Methods
With approval from the Human Subjects Committee of the University of Washington School of Medicine, faculty were recruited from 9 community programs in the Affiliated Family Practice Residency Network of the Department of Family Medicine. Twenty semistructured long interviews were conducted from a convenience sample at 3 residency sites.16 An additional 8 semistructured interviews and 2 focus groups (10 participants) further explored the data. Thus, a total of 38 clinicians participated in the study. Demographic characteristics of the study cohort have been published previously.10
We conducted the initial 20 interviews using open-ended questions designed to uncover faculty perceptions of quality end-of-life care. The questions explored may be found in the Table. Nonspecific prompts such as “tell me more” were used to enrich data and avoid interviewer bias. The interview was rehearsed with a medical school faculty expert in ethnographic research, field tested, and adjusted before final use. The interviews were audio-recorded and transcribed into qualitative research software.17
Throughout the interview process, the investigators met weekly to compare findings, discuss emerging categories, and jointly code the transcripts for model development using the process of grounded theory described by Glaser and Strauss.18 Common themes, communication and educational issues, and roles and relationships were identified. Data were constantly compared and winnowed to facilitate manageability; data collection and analysis occurred simultaneously.19,20 Common themes are published elsewhere.10 We report and discuss the analysis of the data pertaining to clinician roles and relationships.
We employed the following 3 strategies to assess the methodologic validity of the study and face validity of the themes and models emerging from the data analysis.
TABLE
INTERVIEW QUESTIONS
Remember a case in which you provided care for a patient and family facing a chronic, progressive, terminal illness:
|
Methodologic validation
The themes, models, and 2 interview transcripts were reviewed by 2 expert consultants with experience in qualitative research on end-of-life care and chronic debilitating disease. They assessed the validity of the research process and model development.21,22 These experts confirmed the methodologic approach, affirmed that the transcripts supported the coded model, and noted that the results were consistent with their own past research experience.
Face validity faculty interviews
Long interviews were conducted with a convenience sample of 8 faculty at 2 other residency sites. Researchers described the previous interview process and presented a written summary of the roles and relationship model coded from the data. Dialogue was encouraged with nonspecific prompts to enrich the data and avoid interviewer bias. Interviews were recorded, transcribed, and coded by the researchers to assess face validity and further develop the roles and relationship model using a grounded theory approach.
Face validity focus groups
Two focus groups were conducted with a total of 10 faculty at 2 additional sites. The entire model (themes, communication, roles, and relationships) was presented, and dialogue was encouraged. The researchers recorded, transcribed, and reviewed the focus groups to further assess face validity and refine the model.
Content validity
In a manner identical to that of the focus groups, the researchers presented the entire model at 2 of the 3 sites where faculty provided the initial 20 interviews. These sessions were audiotaped, transcribed, and reviewed by the researchers. The model presented was considered a valid, clinically plausible summary of the content of the initial interviews.
Results
Content analysis of the roles and relationships described by the study cohort revealed 3 distinct clinician roles in the provision of end-of-life care that we termed “consultant,” “collaborator,” and “guide.” All roles were viewed as important; none was more valuable than another; and the roles appeared to build on each other, often merging. Roles were implemented fluidly, with clinicians moving from one role to another as circumstances dictated. Although clinicians tended to describe successful cases, they freely discussed the challenges of end-of-life care, noting that less-than-ideal results were frequent. Thus, the models were described as “best practice” rather than routine care.
Consultant
The consultant provides expert medical information to the patient and family based on the biomedical model and the disease process. The power of the consultant role emanates from the clinician’s medical authority and special knowledge. The consultant presents information to help the patient and family understand the diagnosis, prognosis, and treatment. Once this knowledge is understood, the patient and family determine its meaning to them and decide on treatment. If the patient or family cannot decide or understand the medical implications of their particular situation, the consultant decides based on the medical facts.
A pediatrician illustrated the application of the consultant role in 2 situations involving newborns with severe heart anomalies. Here the physician describes the difficulty of using only medical facts to assist the family in deciding whether to discontinue the ventilator: “I remember saying: ‘The only thing that’s keeping the baby alive at this point is the ventilator. How do you feel about making the decision to turn that off?’ I remember it was a very cruel thing to have them make the decision.”
The physician continued: “Next time I said: ‘We have to sit down and talk about how your baby is doing because he died, and I’m going to turn off the machines now.’ I don’t think we should put them in the position of having to make this decision. We should make this decision and tell them what we’re going to do.” In this situation the clinician employed biomedical expertise to determine the appropriate medical care and outcome for the patient and family. In both cases the decision centered on continuing or discontinuing a medical intervention (respirator) and avoided discussion of the parents’ affective experience. Hallmarks of the consultant role include a biomedical focus, disease-centered decision-making processes, and the clinician’s assumption of authority based on biomedical expertise.
Collaborator
The collaborator exchanges information with the patient and family to promote a common understanding of the diagnosis and illness experience, working with them to choose a treatment path. The collaborator incorporates all components of the consultant role and additionally requires the clinician to understand the patient/family experience. The collaborator considers patient and family issues that need to be addressed to understand the medical facts, appreciates their past experiences with serious illness, determines what information would be difficult for them to accept but would benefit them if they were challenged to confront it, and recognizes that the patient and family hold ultimate responsibility for making treatment decisions.
The following quotes exemplify collaborative clinical care. In the first example, the physician steps outside his comfort zone to provide medical care based on the expressed wishes of a 30-year-old man dying of an advanced brain tumor: “The issue for me was letting go of control. He was going 4 hours away to a fishing cabin and going on a boat. I was really nervous…what if he all of a sudden crashed there? It took me a while to get used to the idea that he needs to be able to do what he enjoys doing, and everybody knows that there’s a risk.”
In a second example, the physician describes collaborating with the family of an 85-year-old woman suffering a massive stroke: “Having heard from the family that they understand that Grandma has had a big stroke and isn’t going to survive…then what wishes do Grandma and the family have? Have they ever discussed this sort of situation?”
In both these examples an understanding of the patient/family experience directs the clinician toward appropriate end-of-life care and is a major source of the collaborator’s power.
Guide
As a guide, the clinician actively and personally seeks solutions for the patient based not only on the medical facts (consultant) and the patient’s values and preferences (collaborator) but also on the guide’s greater understanding of the medical context. In essence, the guide not only knows why and where the patient and family prefer to go but also how to get there.
The following quote demonstrates a clinical application of the guide role. The physician first collaborates to understand the resistance of a terminally ill patient to hospice care:
“They had been very resistant to hospice for reasons that I wasn’t quite clear on. It wasn’t until I was in the home and listened to them talk that I realized they viewed hospice as ‘people are giving up on him.’ I think nobody really was talking to the patient about whether he was willing to give up or if he was ready to die.
“Once patient and family concerns were understood, the guide role was employed: I told the wife and family, ‘We’ve maxed out our medical therapies. There’s not much more we can do for him physically, but perhaps there’s something we can do for him spiritually and emotionally.’ When it was presented to them that way, they were much more understanding. We talked about hospice philosophy and looking at death as a part of life, saying: ‘That we’re not going to resuscitate does not mean do not treat.’ That’s where I came in more as the guide and said: ‘This is what I think is reasonable. What are your expectations? What do you want, Billy? And what do you want, as far as [his] wife and kids?”
The guide role requires that the clinician interpret the patient’s experience, integrate this interpretation with the clinician’s understanding of the clinical situation, and make a recommendation based on the guide’s personal and professional understanding of the situation. The power of the guide role emanates from the clinician’s understanding of how to use the medical system to see that the goals of patient and family are realized.
Discussion
The results of our study are consistent with reports over the past 3 decades by researchers, educators, and social critics who have explored how health professionals provide end-of-life care.23-29 Despite their varying perspectives, all reflect a common theme: the need to provide care based on the unique illness experience and values of the patient and family. The majority of clinicians in our study spoke of the importance of their relationships with patients and families. More than 50% of all interview commentary addressed clinician issues of relationship and personal meaning when providing end-of-life care.
The descriptions of consultant,30 collaborator,31,32 and guide33 confirm previous theoretical discussions regarding the nature of roles and relationships between patients and physicians. The guide is the most complex of the roles described by our study cohort and lends itself to ambivalence on the part of clinicians, in light of its potential to be misunderstood as paternalism. Yet, given the vulnerability and dependence of many patients who are terminally ill, the guide provides these patients with structure, safety, support, and care—based on the patients’ values and goals—reminiscent of the role of a nurturing parent.34
The personal nature of the decisions the guide facilitates reflects the reality of medicine as a moral enterprise.34,35 Having generally witnessed many more deaths than the patient, the guide has knowledge regarding the processes of dying and medical systems that is instrumental in assuring that the desires of the patient and family are realized. A knowledge of patient and family, an appreciation of the futility of the medical situation, and an insight into the process and systems of dying afford the clinician an opportunity to shape the death experience; as Nuland36 described: “Each of us needs a guide who knows us as well as he knows the pathways by which we can approach death.”
Facility with these roles may be a function of personal talent, introspection, and experience. The physicians studied reported that competence with these roles grew over time through delivering endof-life care and learning from patients, families, and other caregivers. Less experienced clinicians tended to describe the consultant and collaborator roles only. Clinicians describing the guide role had been in practice at least a decade and thus were at least 17 years into their training and practice in medicine. Apparently, expertise in all 3 roles requires not only excellent technical diagnostic and treatment skills but also the complex integrated skills of relational knowledge and caring gained through experience.
Our data indicate that relationship, meaning, and roles are primary moderators of the organization of exemplary end-of-life care. Yet, it appears to take nearly 2 decades for physicians to gain the confidence in their knowledge, skills, and attitudes necessary to comfortably guide patients and families through the nuances of end-of-life care. How to successfully educate clinicians to use such a model earlier is beyond our scope but appears crucial to improving training efforts. Current attempts to teach end-of-life care do not develop and explore the complex integrative domains of relational knowledge37-40 described in our study. Studies of educational interventions that stress the importance of the relational aspects of end-of-life care appear warranted.
To facilitate skill acquisition, the authors propose the steps diagrammed in the Figure to assist clinicians in providing quality end-of-life care. We believe the time spent determining patient-centered goals and the roles and relationships required by the clinician should at least equal the time spent determining which tests and treatments to provide. At the end of life, when tests and treatments result in fewer benefits and greater risks and burdens, determining patient and family needs and goals becomes increasingly important as management changes from cure to care.
FIGURE
FLOW DIAGRAM FOR CLINICIAN ROLES
Limitations
This study is limited by a study sample of primary care, family practice faculty who geographically represent all practice in the Pacific Northwest and are predominantly Euro-American in ethnicity. The majority are family physicians, with the remainder pediatricians, internists, and a small number of nurse practitioners and physician assistants. Although no significant differences in terms of roles, relationships, and personal meanings between professional groups were noted, whether these findings are transferable to other primary care clinicians in community practice is unknown. Whether non–primary care specialists and clinicians of differing ethnicity or geographic region would respond differently is unknown. Generalizing these findings to non–primary care clinicians and clinicians of color requires further research.
Conclusions
Given the enormity of social and cultural values that make death a taboo topic, it is unclear how any single reform can easily overcome the multiple barriers to improved end-of-life care. Whether it is possible to teach attitudes and values, such as empathy and self-reflection, is uncertain, though promising curricula and research exist.41-42 If primary care physicians and other professionals improve their knowledge, skills, and attitudes in the delivery of such care, the ultimate effect on improving the experience of patients and families will require further study.
Acknowledgments
We wish to thank the Emily Davie and Joseph S. Kornfeld Foundation and The Nathan Cummings Foundation, New York, which provided generous grants that made our study and article possible. Additionally, we thank Phyllis Silverman, PhD, Harvard University, for her early counsel and advice; Tom Taylor, MD, PhD, University of Washington School of Medicine, for his thoughtful input into the study design, his sage guidance, and his review of the manuscript; Jeanne Quint Benoliel, DNS, Professor Emeritus, University of Washington School of Nursing, for her inspiration and review of the study design and results; and Greg Guldin, PhD, Pacific Lutheran University, for his thoughtful review of the manuscript.
1. The George Gallup International Institute. Spiritual beliefs and the dying process: a report on a national survey. Princeton, NJ: George Gallup International Institute;1997.
2. Field MJ, Cassel CK, eds. Approaching death: improving care at the end of life: Committee on Care at the End of Life, Division of Health Care Services, Institute of Medicine. Washington, DC: National Academy Press; 1997.
3. Schonwetter RS, Hawke W, Knight CF, eds. Hospice and palliative medicine core curriculum and review syllabus: American Academy of Hospice and Palliative Medicine. Dubuque, Iowa: Kendall/Hunt; 1999.
4. Emanuel LL, von Gunten CF, Ferris FD. The education for physicians on end-of-life care (EPEC) curriculum. Chicago, Ill: American Medical Association; 1999.
5. Lo B, Quill T, Tulsky J. Discussing palliative care with patients. Ann Intern Med 1999;130:744-49.
6. Todd C, Still A. General practitioners’ strategies and tactics of communication with the terminally ill. Fam Pract 1993;10:268-76.
7. Blyth AC. Audit of terminal care in a general practice. BMJ 1990;300:983-86.
8. Goodlin SJ, Jette AM, Lynn J, Wasson JH. Community physicians describe management issues for patients expected to live less than twelve months. J Palliat Care 1998;14:30-35.
9. Durand RP, Dickinson GE, Sumner DE, Lancaster CG. Family physicians’ attitudes toward death and the terminally-ill patient. Fam Pract Res J 1990;9:123-29.
10. Farber SJ, Egnew TR, Herman-Bertsch JL. Issues in end-of-life care: family practice faculty perceptions. J Fam Pract 1999;49:525-30.
11. Brewin TB. Not TLC but FPI. J R Soc Med 1990;83:172-75.
12. Mitchell G. The role of the general practitioner in palliative care. Aust Fam Physician 1994;23:1233-39.
13. Ogle KS, Plum JD. The role of the primary care physician in the care of the terminally ill. Clin Geriatr Med 1996;12:267-77.
14. Steinmetz D, Gabel LL. The family physician’s role in caring for the dying patient and family: a comprehensive theoretical model. Fam Pract 1992;9:433-36.
15. Steinmetz D, Walsh M, Gabel LL, Williams PT. Family physicians’ involvement with dying patients and their families. Arch Fam Med 1993;2:753-61.
16. Crabtree BF, Miller WL. A qualitative approach to primary care research: the long interview. Fam Med 1991;23:145-51.
17. Seidel J, Friese S, Leonard DC. The Ethnograph version 4.0 . Amherst, Mass: Qualis Research Associates; 1995.
18. Glaser B, Strauss A. The discovery of grounded theory. New York, NY: Aldine; 1967.
19. Strauss A, Corbin C. Basics of qualitative research. Newbury Park, Calif: Sage; 1990.
20. Wolcott HF. Writing up qualitative research. Newbury Park, Calif: Sage; 1990.
21. Benoliel JQ. Advancing nursing science: qualitative approaches. West J Nurs Res 1984;6:1-8.
22. Taylor TR, Gordon MJ, Ashworth CD. A systems perspective on clinical management. Behav Sci 1984;29:233-47.
23. Glaser BG, Strauss AL. Awareness of dying. Chicago, Ill: Aldine; 1965.
24. Kubler-Ross E. On death and dying. New York, NY: MacMillan; 1969.
25. Weisman A. On dying and denying: a psychiatric study on terminality. New York, NY: Behavioral Publications; 1972.
26. Saunders C, Baines M. Living with dying. New York, NY: Oxford University Press; 1983.
27. Corbin JM, Strauss AL. Unending work and care: managing chronic illness at home. San Francisco, Calif: Jossey-Bass; 1988.
28. Broyard A. Intoxicated by my illness. New York, NY: Potter; 1992.
29. Callahan D. Troubled dream of life. New York, NY: Simon & Schuster; 1993.
30. Balint J, Shelton W. Regaining the initiative: forging a new model of the patient-physician relationship. JAMA 1996;275:887-91.
31. Quill TE. Partnerships in patient care: a contractual approach. Ann Intern Med 1983;98:228-34.
32. Stewart M, Brown JB, Weston WW, McWhinney IR, Freeman TR. Patient centered medicine: transforming the clinical method. Thousand Oaks, Calif: Sage; 1995.
33. Emanuel EJ, Emanuel LL. Four models of the physician-patient relationship. JAMA 1992;267:2221-26.
34. Cassell EJ. The nature of suffering and the goals of medicine. New York, NY: Oxford University Press; 1991.
35. Veatch RM. Contemporary bioethics and the demise of modern medicine. In Ormiston G, Sassower R, eds. Prescriptions: the dissemination of medical authority. New York, NY: Greenwood Press; 1990;23-39.
36. Nuland S. How we die. New York, NY: Knopf; 1994.
37. Rogers CR. Client-centered therapy: its current practice, implications, and theory. Boston, Mass: Houghton Mifflin; 1951.
38. Buber M. I and thou. New York, NY: MacMillan; 1974.
39. Mayeroff M. On caring. New York, NY: HarperPerennial; 1990.
40. Kleinman A, Kleinman J. Suffering and its professional transformation: toward an ethnography of interpersonal experience. Cult Med Psychiatry 1991;15:275-301.
41. Novack DH, Suchman AL, Clark W, Epstein RM, Najberg E, Kaplan C. Calibrating the physician: personal awareness and effective patient care. JAMA 1997;278:502-09.
42. Epstein RM. Mindful practice. JAMA 1999;282:833-39.
What Do We Know About Socioeconomic Status And Congestive Heart Failure? A Review of the Literature
OBJECTIVE: To examine and assess the available literature concerning the effects of socioeconomic status (SES) and congestive heart failure (CHF).
STUDY DESIGN: We examined electronic databases, including: MEDLINE, EMBASE, Social Science Citation Index, Science citation index, the Cochrane Database, and Bandolier. We hand searched recent copies of appropriate journals and scrutinized lists of identified papers. The search terms we used included “heart failure,” “cardiac failure,” “ventricular dysfunction,” “social class,” “socioeconomic,” “poverty,” and “deprivation.” Two reviewers independently examined and selected papers for inclusion. A standardized data collection form was used for data extraction.
OUTCOMES MEASURED: We measured (1) prevalence; (2) differences in care (eg, use of diagnostic tests); (3) morbidity (eg, health care use); and (4) mortality.
DATA SOURCES: We examined all English-language abstracts or papers concerning human research related to the subject of SES and CHF, including all clinical trials, reviews, discussion papers, and editorials.
RESULTS: Only 8 clinical studies were identified that specifically examined aspects of the relationship between socioeconomic status and CHF. Key themes included increased hospitalization rates with increasing social deprivation; lower income inversely associated with being placed on a waiting list for transplantation; and that those of lower socioeconomic status had a greater severity of illness on admission.
CONCLUSIONS: There is a paucity of generalizable high-quality research in this subject area. Crucial issues not addressed include the effects, if any, of socioeconomic status on the behaviors of health care providers. Further investigation, with a more holistic approach, is necessary to inform future intervention strategies aimed at reducing excess mortality from CHF.
Congestive heart failure (CHF) is a significant health problem resulting in spiraling health care costs in the United States. The annual cost of inpatient treatment for CHF was close to $8.9 billion in 19851; in 1991, it was estimated to generate 2.3 million hospital stays and 11 million outpatient visits that resulted in an annual cost of more than $38 billion. This represents an estimated 5% of the total national expenditure for health care in the United States.2 Current statistics indicate that 4.9 million US citizens are afflicted with this syndrome,3 and the impact on the individual patient cannot be underestimated with its approximate 60%, 5-year mortality rate.4
Social deprivation is associated with an increased burden of disease5 and with health inequalities.68 The link between socioeconomic inequalities and cardiovascular disease mortality is well-documented and forms a major public health problem in industrialized countries.9 However, much less is understood about the impact of socioeconomic status, specifically on CHF. Even if the risk-factor pattern for CHF is similar to that of coronary artery disease (CAD), a recent study has suggested that only one half of excess coronary mortality in the socially deprived is attributed to such uncorrected risk factors as smoking.10 Thus, at least 50% of the excess mortality associated with lower socioeconomic status in heart failure may not be explained by such comparisons. This figure may be even greater as CHF is secondary to CAD in less than 50% of cases.11
The prevalence of CHF and mortality from the disease are reportedly higher in those with a lower socioeconomic status (SES).12 However, little evidence exists to explain this observation. A greater comprehension of the influence of socioeconomic variables is crucial when developing effective and equitable primary prevention, detection, and treatment strategies for this major public health problem. In this study, we examined the existing evidence spotlighting SES and CHF and potential relevant inequalities in health care use or provision. In particular, we have focused on variables that have the potential to contribute to an SES bias and highlight priorities for future investigation.
Methods
We searched the following electronic databases: MEDLINE, EMBASE, Social Science Citation Index, Science Citation Index, the Cochrane Database, and Bandolier, covering 1966 through 2000. The most recent copies of appropriate journals were also hand searched: JAMA, American Journal of Cardiology, Journal of the American College of Cardiology, British Medical Journal, New England Journal of Medicine, Annals of Internal Medicine, The Lancet, Circulation, Heart, European Heart Journal, and Cardiovascular Research. Search terms used were: “heart failure,” “cardiac failure,” “ventricular dysfunction,” “social class,” “socioeconomic,” “poverty,” and “deprivation.”
Inclusion criteria were all English-language abstracts/papers concerning human research relating to the subject of both SES and CHF. All clinical trials, reviews, discussion papers, and editorials were examined. Excluded were papers discussing CHF in conjunction with “pediatrics,” “protein energy malnutrition,” “cellular and animal models,” “thiamine” plus other vitamin deficiencies, “pregnancy,” or “costs of heart transplantation.” Two reviewers independently examined the reference list attained by these search methods and applied the aforementioned criteria to select papers for inclusion in this review. Both reviewers then independently studied the identified papers. We devised our own form of data collection to extract information from the identified papers. Information recorded included basic bibliographic details, type of paper (eg, a report of original research or review article), aims, study population, setting, subject selection criteria, outcome measures, and the study findings and conclusions. Where applicable, we also recorded the methodologic approaches used, as well as other factors that could affect the validity of the results, including effect modifiers. In view of the heterogeneity of the identified studies, a formal meta-analysis was deemed inappropriate. Instead, we have provided a narrative synthesis of the studies that summarizes their findings and highlights limitations, if any. We used the Oxford Centre for Evidence-Based Medicine Levels of Evidence13 to grade the studies.
Results
We identified 91 papers, of which 27 met the previously defined inclusion criteria. Of these 27, 5 were review articles,4,16-19 2 were reports,20,21 1 was an editorial,22 and 19 were clinical studies.10,12,14,15,23-37 From these clinical studies, we identified only 8 that specifically identified aspects of the relationship between SES and CHF.
Of the 8 relevant clinical studies, 2 were abstracts12,14 and 6 were papers.10,15,34-37Table 1 summarizes the demographic and design characteristics of these studies. Table 2 summarizes their outcome measures and key findings. Given the relative paucity of clinical trials, the results of the abstracts are included here. The first abstract, by Sharma and colleagues,12 used the US Survey (NHANES-11) database to determine the prevalence and mortality of CHF in a noninstitutionalized population. This involved 20,322 individuals in a population-based survey conducted between 1975 and 1980 and showed an increased relative risk (RR) for CHF in the low SES population (RR=2.33; P=.001).
The second abstract, by Philbin and associates,14 determined the relationship between SES and the risk of hospital readmission for CHF by conducting a retrospective review of 42,731 patients discharged alive with a primary diagnosis of CHF during 1995 from New York State Hospitals. They found that patients with readmissions had lower mean incomes than those who did not ($32,902 vs $33,757, P=.001). Although statistically significant, this difference is of questionable clinical or economic significance.
Some common themes emerged from the clinical studies. There was a focus on the frequency of admission and the relationship with SES. Philbin and colleagues’ findings14 were echoed by Struthers10 and MacIntyre35 and colleagues. The former found that the number of cardiac hospitalizations per patient varied from 0.71 in deprivation category 1 to 2 (most affluent) to 0.91 in category 5 to 6 (most deprived) (P =.007). In addition, the risk ratio for cardiac hospitalizations (for an increase of 1 category of social deprivation) was 1.11 (95% CI, 1.002-1.224). MacIntyre35 found that the admission rate was 56% higher in the most deprived quintile compared with the most affluent quintile (P <.001) and deprivation increased the short-term case fatality rate (by 26% in men and 11% in women).
Another common theme was barriers to care suffered by those with lower SES. Coughlin and colleagues34 showed that older age, lower income, and lack of private health insurance were inversely associated with having been placed on a waiting list for transplantation (P <.05). Factors significantly associated with not being put on the waiting list included old age, lower income, and a lack of private health insurance. Auerbach and associates36 also showed that patients with a lower income were less likely to receive care from a cardiologist (adjusted odds ratio [AOR] = 0.65; 95% CI, 0.45-0.93) and were more likely to receive a cardiologist’s care if they had a college education (AOR = 189; 95% CI, 1.02-3.51).
Severity of illness was another issue highlighted. Latour-Perez and colleagues15 found that those from a lower SES had higher simplified acute physiology scores (SAPS) on admission, indicating a higher severity of illness, SAPS 9 ± 5 compared with 7 ± 4 (P =.0052). However, their therapeutic intervention scores (TISS) were similar to the nondeprived population, 18±11 compared with 18 ± 9 (P =.666). The TISS assigns values ranging from 1 to 4 for 57 medical and surgical interventions to measure the intensity of care during a 24-hour period. Similarly, Romm and associates37 studied whether the CHF patient’s initial status is the most significant relationship to outcome, as measured by activity and symptomatology. He found that those from a lower SES had greater symptom and lower activity scores (correlation coefficients -0.181 and 0.185, respectively, P >.05).
The validity and reliability of the findings for the 6 clinical trials10,15,34-37 are subject to a number of conditions, including their definition of CHF, the study design, the representativeness of the study population, patients being at a similar stage of CHF, the dropout rate, and potential sources of bias and confounding. The limitations of each study in relation to these factors are summarized in Table 3. The applied gradings, based on the Oxford Centre for Evidence-Based Medicine Levels of Evidence,13 indicate that current evidence is suboptimal. There are 2 points that merit emphasis because of their relevance to future research work—the lack of a definition of CHF and the exclusive focus on SES and hospitalized CHF patients.
None of the studies explicitly defined the category of CHF patients included in the study, with only 1 study (MacIntyre and colleagues35) acknowledging their inability to define CHF because of a lack of information from discharge coding. Subsequently, as shown in some of the studies,15,35,37 it is difficult to establish the stage of CHF experienced by studied patients, therefore limiting the generalizability of findings.
Given that the majority of CHF patients are managed within the community,11 the focus on SES and hospitalized CHF patients in all the reported clinical trials may indicate a relationship between SES and CHF; however, this may not be generalizable to the majority of CHF patients.
Discussion
Much remains unclear about the influence of socioeconomic status on CHF. Linking this review with the wider SES and chronic disease literature indicates a number of ways in which socioeconomic deprivation may contribute to excess mortality in CHF and inequalities in health care. Six issues merit particular investigation.
Health care provider inequalities
There is some evidence that SES may influence individual health care providers’ clinical management of CHF. Struthers and colleagues10 demonstrated an increased rate of re-hospitalization in those with lower SES that was independent of disease severity. Given that the subsequent length of stay was not influenced by social deprivation, the researchers suggested that an explanation of the re-admission rates purely in terms of co-morbidity and poor social support is flawed. Alternative explanations could include:
Primary care providers dealing with CHF in deprived areas have less time for intensive management within the community.
Primary care providers working in deprived areas may perceive that their patients have less capacity to understand and manage their own condition.
Patients within a deprived area may perceive that community medical resources are insufficient to manage them safely at home and “push” for admission.
These hypotheses are unproven, but merit investigation; they could potentially influence the day-to-day management of patients with CHF.
Risk factor inequalities
Half of the excess coronary mortality in the socially deprived may be attributed to uncorrected risk factors such as smoking.10 The risk factor pattern for CHF is similar to coronary heart disease38 and includes clearly identified etiologies, such as hypertension, coronary artery disease, diabetes mellitus, valvular heart disease, and cardiomyopathies.11,19
Several of these factors have a well–documented SES bias.39,40 Consequently, it seems plausible to assume that a proportion of the excess mortality in CHF in lower socioeconomic groups will be because of these SES-driven risk factors, but no definitive evidence for this exists.
Medication inequalities
Nonconcordance is viewed as contributory factor in a large number of CHF admissions.41,42 Nonconcordance has been at times assumed to be greater in the socially deprived and may contribute to morbidity. However, Struthers and colleagues10 found that at least regarding the impact of SES and acute admissions, nonconcordance with diuretics was independent of the association demonstrated.
The prescription of angiotensin-converting enzyme inhibitors for CHF is demonstrably lower in elderly patients admitted with this condition.43 If there is a significant age bias regarding the prescription of drugs of specific benefit in CHF44 it may well be that a SES bias also exists, reflecting a perpetuation of the inverse care law.45 Further exploration of this subject is needed.
Access inequalities
An age-related bias in follow-up for patients admitted with CHF to a geriatric ward has been demonstrated, with more receiving follow-up by primary care rather than cardiology outpatients, compared with younger patients admitted to medical wards.44,46 A similar association may exist regarding SES and might partly explain the excess mortality in this group. A SES bias has been demonstrated in studies looking at re-vascularization rates for angina.47,48 Socioeconomically deprived patients with coronary heart disease are less likely to be investigated or offered surgery despite their increased risk.49 Only 2 CHF studies are directly comparable.34,36 The former looked at barriers to cardiac transplantation in end-stage CHF caused by idiopathic dilated cardiomyopathy. The latter examined factors associated with obtaining cardiologist care among patients with acute exacerbation of CHF.
In an acute situation, those from lower SES groups may access care differently from their more affluent peers. This has been demonstrated in asthma admissions where such patient groups are more likely to visit an emergency department than their primary care provider.50 Other studies considering emergency admissions across all diseases23,51 demonstrated that those with a lower SES had an increased probability of being admitted via the emergency department. If the same effect is replicated for CHF, as seems probable, this could result in significant differences in the long-term management of these groups. Patients who primarily access emergency physicians when unwell will, by implication, be less exposed and responsive to long-term disease monitoring in primary care.
Social stress
There is an independent association between social deprivation and the prevalence of neurotic and psychiatric conditions.52 Thus, individuals and families with low incomes may have a reduced ability to cope with stressful events.53 This could influence patient behavior in sufferers of CHF, perhaps explaining the readmission rates because of a reduced capacity in the individual to cope mentally with the illness. Further exploration of this variable in initial presentation and subsequent management is required.
Environmental factors
In exploring the relationship between cardiovascular disease and SES, the impact in utero of direct maternal deprivation53 and adverse child and adolescent living conditions have been explored as potential etiologies. Similarly occupational risks,55 educational bias, and genetic predisposition or selection have been examined. None of these effects have to date been examined specifically in relation to CHF.
Conclusions
Examining the remaining, as yet unproven contributions to the excess SES mortality in CHF is crucial. Risk factors are important, but to isolate these from a more global approach to coronary heart disease prevention seems futile. Key areas for future research in primary care should include:
Observing the effects of SES on health care providers’ behavior regarding diagnostic thresholds, treatments offered, and referral patterns (both elective and acutely) toward patients with CHF.
Examination of the equity of access to secondary care and to relevant investigations, such as echocardiography in communities from different socioeconomic groups.
Exploration of the behavior of patients with CHF in terms of consulting patterns and triggers, compliance, and the role of social stress.
Examination of the support available in the community to patients with CHF and perceptions of this support.
A more holistic approach to the problems of social deprivation and CHF, as outlined above, is necessary to inform future intervention strategies aimed at reducing the excess mortality from CHF. Simply pursuing the traditional approach of targeting risk factors, though important, will miss significant opportunities for intervention.
Acknowledgments
The authors would like to thank Professor Simon Capewell for his constructive advice during the writing of this paper.
1. Love MP, McMurray JJV. Paying the price of treating heart failure: the cost effectiveness of ACE inhibition. Br J Cardiol 1994;202-6.
2. O’Connell JB, Bristow MR. Economic impact of heart failure in the United States: time for a different approach. J Heart Lung Transplant 1993;13:S107-12.
3. Adams KF, Jr. New epidemiologic perspectives concerning mild-to-moderate heart failure. Am J Med 2001;110:6S-13S.
4. McMurray JJ, Stewart S. Heart failure: epidemiology, etiology and prognosis of heart failure. Heart 2000;83:596-602.
5. Blaxter M. Evidence on inequality in health from a national survey. Lancet 1987;2:30-3.
6. Acheson D. Independent inquiry into inequalities in health. 1998. London: The Stationery Office.
7. Whitehead M. Diffusion of ideas on social inequalities in health: a European perspective. Milbank Q 1998;76:469-92.
8. Department of Health and Social Security Inequalities in health: a report of a research working group (The Black report) 1980. HMSO London.
9. Mackenbach JP, Cavelaars AEJ, Kunst AE, et al. Socioeconomic inequalities in cardiovascular disease mortality an international study. Eur Heart J 2000;21:1141-51.
10. Struthers AD, Anderson G, Donnan PT, Macdonald T. Social deprivation increases cardiac hospitalizations in chronic heart failure independent of disease severity and diuretic non adherence. Heart 2000;83:12-6.
11. Mair FS, Crowley TS, Bundred PE. Prevalence, etiology and management of heart failure in general practice. Br J Gen Pract 1996;46:77-9.
12. Sharma K, Schwartz S, Schocken D. Congestive heart failure and poverty–Data from the NHANES-11 United states survey and follow up. Circulation 2000;101-725.
13. Phillips B, Ball C, Sackett D, et al. Oxford Centre for Evidence-Based Medicine Levels of Evidence (April 2001; first produced 1998); http://cebm.jr2.ox.ac.uk/docs/levels4.html.
14. Philbin EF, DiSalvo TG, Dec GW. Lower Socioeconomic status is an independent risk factor for hospital readmission for heart failure. Circulation 1999;100:I-528.
15. Latour-Perez J, Gutierrez-Vicen T, Lopez-Camps V, et al. Socioeconomic status and severity of illness on admission in acute myocardial infarction patients. Soc Sci Med 1996;43:1025-9.
16. Kleber FX. Socioeconomic aspects of ACE inhibition in the secondary prevention in cardiovascular diseases: Am J Hypertens 1994;7(9 pt 2):112S-116S.
17. Wilhelmsen L. Synergistic effects of risk factors. Clinical and experimental hypertension-theory and practice. Clin Exp Hypertens 1990;12:845-63.
18. Killip T. Epidemiology of congestive heart failure. Am J Cardiol 1985;56:2A-6A.
19. Petrie MC, Dawson NF, Murdoch DR, Davie AP, McMurray JJ. Failure of women’s hearts. Circulation. 1999;99:2334-41.
20. Perry HM, Roccella EJ. Conference report on stroke mortality in the southeastern United States. Hypertension 1998;31:1206-15.
21. Hypertension control. Report of a WHO Expert Committee: WHO Technical Series Reports. 1996;862:1-83.
22. Jay N. Prognostic factors in heart failure: poverty amidst a wealth of variables. J Am Coll Cardiol 1989;14:571-2.
23. Blatchford O, Capewell S, Murray S, Blatchford M. Emergency medical admissions in Glasgow: general practices vary despite adjustments for age, sex and deprivation. Br J Gen Pract 1999;49:551-4.
24. Capewell S, Morrison CE, McMurray JJ. Contribution of modern cardiovascular treatment and risk factor changes to the decline in coronary heart disease mortality in Scotland between 1975 and 1994. Heart 1999;81:380-6.
25. Dries DL, Exner DV, Gersh BJ, Cooper HA, Carson PE. Racial differences in the outcome of left ventricular dysfunction. N Engl J Med 1999;340:609-16.
26. Chin MH, Goldman L. Gender differences in 1-year survival and quality of life among patients admitted with congestive heart failure. Med Care 1998;36:1033-46.
27. Bennett SJ, Huster GA, Baker SL, et al. Characterization of the precipitants of hospitalization for heart failure decompensation. Am J Crit Care 1998;7:168-74.
28. Fried LP, Kronmal RA, Newman AB, et al. Risk factors for a 5-year mortality in older adults: the Cardiovascular Health Study. JAMA 1998;279:585-92.
29. Ware JE, Jr, Baylis MS, Rogers WH, Kosinski M, Tarlov AR. Differences in 4-year health outcomes for elderly and poor chronically ill patients treated in HMO and fee-for-service systems. JAMA 1996;276:1039-47.
30. Kahn KL, Pearson ML, Harrison ER, et al. Health care for black and poor hospitalized Medicare patients. JAMA 1994;271:1169-74.
31. Mark DB, Lam LC, Lee KL, Clapp-Channing NE. Identification of patients with coronary disease at high risk for loss of employment. A prospective validation study. Circulation 1992;86:1485-94.
32. Watkins LO, Neaton JD, Kuller LH. Racial differences in high density lipoprotein cholesterol and coronary heart disease incidence in the usual-care group of the Multiple Risk Factor Intervention Trial. Am J Cardiol 1986;57:538-45.
33. Ayanian JZ, Weissman JS, Chasan-Taber, et al. Quality of care by race and gender for congestive cardiac failure and pneumonia. Med Care 1999;37:1260-69.
34. Coughlin SS, Halabi S, Metayer C. Barriers to cardiac transplantation in idiopathic dilated cardiomyopathy: the Washington DC Dilated Cardiomyopathy Study. J Nat Med Assoc 1998;90:342-8.
35. MacIntyre K, Capewell S, Stewart S, et al. Evidence of improving prognosis in heart failure: trends in case fatality in 66,547 patients hospitalized between 1986 and 1995. Circulation 2000;102:1126-31.
36. Auerbach AD, Hamel MB, Califf RM, et al. Patient characteristics associated with care by a cardiologist among adults hospitalized with severe congestive heart failure. J Am Coll Cardiol 2000;36:2119-25.
37. Romm FJ, Hulka BS, Mayo F. Correlates of outcomes in patients with congestive heart failure. Med Care 1976;14:765-76.
38. Eriksson H, Svardsudd K, Larsson B, et al. Risk factors for heart failure in the general population: the study of men born in 1913. Eur Heart J 1989;10:647-56.
39. Connolly V, Urwin N, Sherriff P, Bilous R, Kelly W. Diabetes prevalence and socioeconomic status: a population based study showing increased prevalence of type 2 diabetes mellitus in deprived areas. J Epidemiol Community Health 2000;54:173-7.
40. Osler M, Gerdes LU, Davidson M, et al. Socioeconomic status and trends in risk factors for cardiovascular diseases in the Danish MONICA population. J Epidemiol Community Health 2000;54:108-13.
41. Pentimone F, Del Corso L. Congestive heart failure with frequent hospital readmissions in the elderly. Clin Ter 1993;142:207-10.
42. Wagdi P, Vuilliomenet A, Kaufmann U, Richter M, Bertel O. Inadequate treatment compliance, patient information and drug prescription as causes for emergency hospitalization of patients with chronic heart failure. Schweiz-Med Wochenschr 1993;123:108-12.
43. Cohen-Solal A, Desnos M, Delahaye F, Emeriau JP, Hanania G. A national survey of heart failure in French Hospitals. Eur Heart J 2000;21:763-9.
44. AIRE Study Investigators. Effect of ramipril on mortality and morbidity of survivors of acute myocardial infarction with clinical evidence of heart failure. Lancet 1993;342:821-8.
45. Tudor-Hart J. The inverse care law. Lancet 1971;1:405-12.
46. Baker DW, Hayes RP, Massie BM, Craig CA. Variations in family physicians’ and cardiologists’ care for patients with heart failure. Am Heart J 1999;138(5 pt 1):826-34.
47. Hippisley-Cox J, Pringle M. Inequalities in access to coronary angiography and revascularisation: the association of deprivation and location of primary care. Br J Gen Pract 2000;50:449-54.
48. Payne N, Saul C. Variation in use of cardiological services in a health authority: comparison of coronary artery revascularisation rates with prevalence of angina and mortality. BMJ 1997;314:257-61.
49. Pell JP, Pell ACH, Norrie J, Ford I, Cobbe SM. Effect of socioeconomic deprivation on waiting time for cardiac surgery: retrospective cohort study. BMJ 2000;320:15-9.
50. Watson JP, Cowen P, Lewis RA. The relationship between asthma admission rates, routes of admission and socioeconomic deprivation. Eur Respir J 1996;9:2087-93.
51. Ciccine G. Social class, mode of admission, severity of illness and hospital mortality: an analysis with “all patient refined DRG” of discharges from Molinette hospitals in Turin. Epidemiologia e Prevanzione 1999;23:188-96.
52. Lewis G, Bebbington P, Brugha T, et al. Socioeconomic status, standard of living and neurotic disorder. Lancet 1998;352:605-9.
53. Brown GW, Harris TO. Social origins of depression. London: The Free Press; 1978.
54. Nilsson PM, Moller L, Ostergren P. Social class and cardiovascular disease—an update. Scand J Soc Med 1995;23:3-8.
55. Kaplan GA, Keil JE. Socioeconomic factors and cardiovascular disease: a review of the literature. Circulation 1993;88(pt 1):1973-95.
To submit a letter to the editor on this topic, click here: [email protected].
OBJECTIVE: To examine and assess the available literature concerning the effects of socioeconomic status (SES) and congestive heart failure (CHF).
STUDY DESIGN: We examined electronic databases, including: MEDLINE, EMBASE, Social Science Citation Index, Science citation index, the Cochrane Database, and Bandolier. We hand searched recent copies of appropriate journals and scrutinized lists of identified papers. The search terms we used included “heart failure,” “cardiac failure,” “ventricular dysfunction,” “social class,” “socioeconomic,” “poverty,” and “deprivation.” Two reviewers independently examined and selected papers for inclusion. A standardized data collection form was used for data extraction.
OUTCOMES MEASURED: We measured (1) prevalence; (2) differences in care (eg, use of diagnostic tests); (3) morbidity (eg, health care use); and (4) mortality.
DATA SOURCES: We examined all English-language abstracts or papers concerning human research related to the subject of SES and CHF, including all clinical trials, reviews, discussion papers, and editorials.
RESULTS: Only 8 clinical studies were identified that specifically examined aspects of the relationship between socioeconomic status and CHF. Key themes included increased hospitalization rates with increasing social deprivation; lower income inversely associated with being placed on a waiting list for transplantation; and that those of lower socioeconomic status had a greater severity of illness on admission.
CONCLUSIONS: There is a paucity of generalizable high-quality research in this subject area. Crucial issues not addressed include the effects, if any, of socioeconomic status on the behaviors of health care providers. Further investigation, with a more holistic approach, is necessary to inform future intervention strategies aimed at reducing excess mortality from CHF.
Congestive heart failure (CHF) is a significant health problem resulting in spiraling health care costs in the United States. The annual cost of inpatient treatment for CHF was close to $8.9 billion in 19851; in 1991, it was estimated to generate 2.3 million hospital stays and 11 million outpatient visits that resulted in an annual cost of more than $38 billion. This represents an estimated 5% of the total national expenditure for health care in the United States.2 Current statistics indicate that 4.9 million US citizens are afflicted with this syndrome,3 and the impact on the individual patient cannot be underestimated with its approximate 60%, 5-year mortality rate.4
Social deprivation is associated with an increased burden of disease5 and with health inequalities.68 The link between socioeconomic inequalities and cardiovascular disease mortality is well-documented and forms a major public health problem in industrialized countries.9 However, much less is understood about the impact of socioeconomic status, specifically on CHF. Even if the risk-factor pattern for CHF is similar to that of coronary artery disease (CAD), a recent study has suggested that only one half of excess coronary mortality in the socially deprived is attributed to such uncorrected risk factors as smoking.10 Thus, at least 50% of the excess mortality associated with lower socioeconomic status in heart failure may not be explained by such comparisons. This figure may be even greater as CHF is secondary to CAD in less than 50% of cases.11
The prevalence of CHF and mortality from the disease are reportedly higher in those with a lower socioeconomic status (SES).12 However, little evidence exists to explain this observation. A greater comprehension of the influence of socioeconomic variables is crucial when developing effective and equitable primary prevention, detection, and treatment strategies for this major public health problem. In this study, we examined the existing evidence spotlighting SES and CHF and potential relevant inequalities in health care use or provision. In particular, we have focused on variables that have the potential to contribute to an SES bias and highlight priorities for future investigation.
Methods
We searched the following electronic databases: MEDLINE, EMBASE, Social Science Citation Index, Science Citation Index, the Cochrane Database, and Bandolier, covering 1966 through 2000. The most recent copies of appropriate journals were also hand searched: JAMA, American Journal of Cardiology, Journal of the American College of Cardiology, British Medical Journal, New England Journal of Medicine, Annals of Internal Medicine, The Lancet, Circulation, Heart, European Heart Journal, and Cardiovascular Research. Search terms used were: “heart failure,” “cardiac failure,” “ventricular dysfunction,” “social class,” “socioeconomic,” “poverty,” and “deprivation.”
Inclusion criteria were all English-language abstracts/papers concerning human research relating to the subject of both SES and CHF. All clinical trials, reviews, discussion papers, and editorials were examined. Excluded were papers discussing CHF in conjunction with “pediatrics,” “protein energy malnutrition,” “cellular and animal models,” “thiamine” plus other vitamin deficiencies, “pregnancy,” or “costs of heart transplantation.” Two reviewers independently examined the reference list attained by these search methods and applied the aforementioned criteria to select papers for inclusion in this review. Both reviewers then independently studied the identified papers. We devised our own form of data collection to extract information from the identified papers. Information recorded included basic bibliographic details, type of paper (eg, a report of original research or review article), aims, study population, setting, subject selection criteria, outcome measures, and the study findings and conclusions. Where applicable, we also recorded the methodologic approaches used, as well as other factors that could affect the validity of the results, including effect modifiers. In view of the heterogeneity of the identified studies, a formal meta-analysis was deemed inappropriate. Instead, we have provided a narrative synthesis of the studies that summarizes their findings and highlights limitations, if any. We used the Oxford Centre for Evidence-Based Medicine Levels of Evidence13 to grade the studies.
Results
We identified 91 papers, of which 27 met the previously defined inclusion criteria. Of these 27, 5 were review articles,4,16-19 2 were reports,20,21 1 was an editorial,22 and 19 were clinical studies.10,12,14,15,23-37 From these clinical studies, we identified only 8 that specifically identified aspects of the relationship between SES and CHF.
Of the 8 relevant clinical studies, 2 were abstracts12,14 and 6 were papers.10,15,34-37Table 1 summarizes the demographic and design characteristics of these studies. Table 2 summarizes their outcome measures and key findings. Given the relative paucity of clinical trials, the results of the abstracts are included here. The first abstract, by Sharma and colleagues,12 used the US Survey (NHANES-11) database to determine the prevalence and mortality of CHF in a noninstitutionalized population. This involved 20,322 individuals in a population-based survey conducted between 1975 and 1980 and showed an increased relative risk (RR) for CHF in the low SES population (RR=2.33; P=.001).
The second abstract, by Philbin and associates,14 determined the relationship between SES and the risk of hospital readmission for CHF by conducting a retrospective review of 42,731 patients discharged alive with a primary diagnosis of CHF during 1995 from New York State Hospitals. They found that patients with readmissions had lower mean incomes than those who did not ($32,902 vs $33,757, P=.001). Although statistically significant, this difference is of questionable clinical or economic significance.
Some common themes emerged from the clinical studies. There was a focus on the frequency of admission and the relationship with SES. Philbin and colleagues’ findings14 were echoed by Struthers10 and MacIntyre35 and colleagues. The former found that the number of cardiac hospitalizations per patient varied from 0.71 in deprivation category 1 to 2 (most affluent) to 0.91 in category 5 to 6 (most deprived) (P =.007). In addition, the risk ratio for cardiac hospitalizations (for an increase of 1 category of social deprivation) was 1.11 (95% CI, 1.002-1.224). MacIntyre35 found that the admission rate was 56% higher in the most deprived quintile compared with the most affluent quintile (P <.001) and deprivation increased the short-term case fatality rate (by 26% in men and 11% in women).
Another common theme was barriers to care suffered by those with lower SES. Coughlin and colleagues34 showed that older age, lower income, and lack of private health insurance were inversely associated with having been placed on a waiting list for transplantation (P <.05). Factors significantly associated with not being put on the waiting list included old age, lower income, and a lack of private health insurance. Auerbach and associates36 also showed that patients with a lower income were less likely to receive care from a cardiologist (adjusted odds ratio [AOR] = 0.65; 95% CI, 0.45-0.93) and were more likely to receive a cardiologist’s care if they had a college education (AOR = 189; 95% CI, 1.02-3.51).
Severity of illness was another issue highlighted. Latour-Perez and colleagues15 found that those from a lower SES had higher simplified acute physiology scores (SAPS) on admission, indicating a higher severity of illness, SAPS 9 ± 5 compared with 7 ± 4 (P =.0052). However, their therapeutic intervention scores (TISS) were similar to the nondeprived population, 18±11 compared with 18 ± 9 (P =.666). The TISS assigns values ranging from 1 to 4 for 57 medical and surgical interventions to measure the intensity of care during a 24-hour period. Similarly, Romm and associates37 studied whether the CHF patient’s initial status is the most significant relationship to outcome, as measured by activity and symptomatology. He found that those from a lower SES had greater symptom and lower activity scores (correlation coefficients -0.181 and 0.185, respectively, P >.05).
The validity and reliability of the findings for the 6 clinical trials10,15,34-37 are subject to a number of conditions, including their definition of CHF, the study design, the representativeness of the study population, patients being at a similar stage of CHF, the dropout rate, and potential sources of bias and confounding. The limitations of each study in relation to these factors are summarized in Table 3. The applied gradings, based on the Oxford Centre for Evidence-Based Medicine Levels of Evidence,13 indicate that current evidence is suboptimal. There are 2 points that merit emphasis because of their relevance to future research work—the lack of a definition of CHF and the exclusive focus on SES and hospitalized CHF patients.
None of the studies explicitly defined the category of CHF patients included in the study, with only 1 study (MacIntyre and colleagues35) acknowledging their inability to define CHF because of a lack of information from discharge coding. Subsequently, as shown in some of the studies,15,35,37 it is difficult to establish the stage of CHF experienced by studied patients, therefore limiting the generalizability of findings.
Given that the majority of CHF patients are managed within the community,11 the focus on SES and hospitalized CHF patients in all the reported clinical trials may indicate a relationship between SES and CHF; however, this may not be generalizable to the majority of CHF patients.
Discussion
Much remains unclear about the influence of socioeconomic status on CHF. Linking this review with the wider SES and chronic disease literature indicates a number of ways in which socioeconomic deprivation may contribute to excess mortality in CHF and inequalities in health care. Six issues merit particular investigation.
Health care provider inequalities
There is some evidence that SES may influence individual health care providers’ clinical management of CHF. Struthers and colleagues10 demonstrated an increased rate of re-hospitalization in those with lower SES that was independent of disease severity. Given that the subsequent length of stay was not influenced by social deprivation, the researchers suggested that an explanation of the re-admission rates purely in terms of co-morbidity and poor social support is flawed. Alternative explanations could include:
Primary care providers dealing with CHF in deprived areas have less time for intensive management within the community.
Primary care providers working in deprived areas may perceive that their patients have less capacity to understand and manage their own condition.
Patients within a deprived area may perceive that community medical resources are insufficient to manage them safely at home and “push” for admission.
These hypotheses are unproven, but merit investigation; they could potentially influence the day-to-day management of patients with CHF.
Risk factor inequalities
Half of the excess coronary mortality in the socially deprived may be attributed to uncorrected risk factors such as smoking.10 The risk factor pattern for CHF is similar to coronary heart disease38 and includes clearly identified etiologies, such as hypertension, coronary artery disease, diabetes mellitus, valvular heart disease, and cardiomyopathies.11,19
Several of these factors have a well–documented SES bias.39,40 Consequently, it seems plausible to assume that a proportion of the excess mortality in CHF in lower socioeconomic groups will be because of these SES-driven risk factors, but no definitive evidence for this exists.
Medication inequalities
Nonconcordance is viewed as contributory factor in a large number of CHF admissions.41,42 Nonconcordance has been at times assumed to be greater in the socially deprived and may contribute to morbidity. However, Struthers and colleagues10 found that at least regarding the impact of SES and acute admissions, nonconcordance with diuretics was independent of the association demonstrated.
The prescription of angiotensin-converting enzyme inhibitors for CHF is demonstrably lower in elderly patients admitted with this condition.43 If there is a significant age bias regarding the prescription of drugs of specific benefit in CHF44 it may well be that a SES bias also exists, reflecting a perpetuation of the inverse care law.45 Further exploration of this subject is needed.
Access inequalities
An age-related bias in follow-up for patients admitted with CHF to a geriatric ward has been demonstrated, with more receiving follow-up by primary care rather than cardiology outpatients, compared with younger patients admitted to medical wards.44,46 A similar association may exist regarding SES and might partly explain the excess mortality in this group. A SES bias has been demonstrated in studies looking at re-vascularization rates for angina.47,48 Socioeconomically deprived patients with coronary heart disease are less likely to be investigated or offered surgery despite their increased risk.49 Only 2 CHF studies are directly comparable.34,36 The former looked at barriers to cardiac transplantation in end-stage CHF caused by idiopathic dilated cardiomyopathy. The latter examined factors associated with obtaining cardiologist care among patients with acute exacerbation of CHF.
In an acute situation, those from lower SES groups may access care differently from their more affluent peers. This has been demonstrated in asthma admissions where such patient groups are more likely to visit an emergency department than their primary care provider.50 Other studies considering emergency admissions across all diseases23,51 demonstrated that those with a lower SES had an increased probability of being admitted via the emergency department. If the same effect is replicated for CHF, as seems probable, this could result in significant differences in the long-term management of these groups. Patients who primarily access emergency physicians when unwell will, by implication, be less exposed and responsive to long-term disease monitoring in primary care.
Social stress
There is an independent association between social deprivation and the prevalence of neurotic and psychiatric conditions.52 Thus, individuals and families with low incomes may have a reduced ability to cope with stressful events.53 This could influence patient behavior in sufferers of CHF, perhaps explaining the readmission rates because of a reduced capacity in the individual to cope mentally with the illness. Further exploration of this variable in initial presentation and subsequent management is required.
Environmental factors
In exploring the relationship between cardiovascular disease and SES, the impact in utero of direct maternal deprivation53 and adverse child and adolescent living conditions have been explored as potential etiologies. Similarly occupational risks,55 educational bias, and genetic predisposition or selection have been examined. None of these effects have to date been examined specifically in relation to CHF.
Conclusions
Examining the remaining, as yet unproven contributions to the excess SES mortality in CHF is crucial. Risk factors are important, but to isolate these from a more global approach to coronary heart disease prevention seems futile. Key areas for future research in primary care should include:
Observing the effects of SES on health care providers’ behavior regarding diagnostic thresholds, treatments offered, and referral patterns (both elective and acutely) toward patients with CHF.
Examination of the equity of access to secondary care and to relevant investigations, such as echocardiography in communities from different socioeconomic groups.
Exploration of the behavior of patients with CHF in terms of consulting patterns and triggers, compliance, and the role of social stress.
Examination of the support available in the community to patients with CHF and perceptions of this support.
A more holistic approach to the problems of social deprivation and CHF, as outlined above, is necessary to inform future intervention strategies aimed at reducing the excess mortality from CHF. Simply pursuing the traditional approach of targeting risk factors, though important, will miss significant opportunities for intervention.
Acknowledgments
The authors would like to thank Professor Simon Capewell for his constructive advice during the writing of this paper.
1. Love MP, McMurray JJV. Paying the price of treating heart failure: the cost effectiveness of ACE inhibition. Br J Cardiol 1994;202-6.
2. O’Connell JB, Bristow MR. Economic impact of heart failure in the United States: time for a different approach. J Heart Lung Transplant 1993;13:S107-12.
3. Adams KF, Jr. New epidemiologic perspectives concerning mild-to-moderate heart failure. Am J Med 2001;110:6S-13S.
4. McMurray JJ, Stewart S. Heart failure: epidemiology, etiology and prognosis of heart failure. Heart 2000;83:596-602.
5. Blaxter M. Evidence on inequality in health from a national survey. Lancet 1987;2:30-3.
6. Acheson D. Independent inquiry into inequalities in health. 1998. London: The Stationery Office.
7. Whitehead M. Diffusion of ideas on social inequalities in health: a European perspective. Milbank Q 1998;76:469-92.
8. Department of Health and Social Security Inequalities in health: a report of a research working group (The Black report) 1980. HMSO London.
9. Mackenbach JP, Cavelaars AEJ, Kunst AE, et al. Socioeconomic inequalities in cardiovascular disease mortality an international study. Eur Heart J 2000;21:1141-51.
10. Struthers AD, Anderson G, Donnan PT, Macdonald T. Social deprivation increases cardiac hospitalizations in chronic heart failure independent of disease severity and diuretic non adherence. Heart 2000;83:12-6.
11. Mair FS, Crowley TS, Bundred PE. Prevalence, etiology and management of heart failure in general practice. Br J Gen Pract 1996;46:77-9.
12. Sharma K, Schwartz S, Schocken D. Congestive heart failure and poverty–Data from the NHANES-11 United states survey and follow up. Circulation 2000;101-725.
13. Phillips B, Ball C, Sackett D, et al. Oxford Centre for Evidence-Based Medicine Levels of Evidence (April 2001; first produced 1998); http://cebm.jr2.ox.ac.uk/docs/levels4.html.
14. Philbin EF, DiSalvo TG, Dec GW. Lower Socioeconomic status is an independent risk factor for hospital readmission for heart failure. Circulation 1999;100:I-528.
15. Latour-Perez J, Gutierrez-Vicen T, Lopez-Camps V, et al. Socioeconomic status and severity of illness on admission in acute myocardial infarction patients. Soc Sci Med 1996;43:1025-9.
16. Kleber FX. Socioeconomic aspects of ACE inhibition in the secondary prevention in cardiovascular diseases: Am J Hypertens 1994;7(9 pt 2):112S-116S.
17. Wilhelmsen L. Synergistic effects of risk factors. Clinical and experimental hypertension-theory and practice. Clin Exp Hypertens 1990;12:845-63.
18. Killip T. Epidemiology of congestive heart failure. Am J Cardiol 1985;56:2A-6A.
19. Petrie MC, Dawson NF, Murdoch DR, Davie AP, McMurray JJ. Failure of women’s hearts. Circulation. 1999;99:2334-41.
20. Perry HM, Roccella EJ. Conference report on stroke mortality in the southeastern United States. Hypertension 1998;31:1206-15.
21. Hypertension control. Report of a WHO Expert Committee: WHO Technical Series Reports. 1996;862:1-83.
22. Jay N. Prognostic factors in heart failure: poverty amidst a wealth of variables. J Am Coll Cardiol 1989;14:571-2.
23. Blatchford O, Capewell S, Murray S, Blatchford M. Emergency medical admissions in Glasgow: general practices vary despite adjustments for age, sex and deprivation. Br J Gen Pract 1999;49:551-4.
24. Capewell S, Morrison CE, McMurray JJ. Contribution of modern cardiovascular treatment and risk factor changes to the decline in coronary heart disease mortality in Scotland between 1975 and 1994. Heart 1999;81:380-6.
25. Dries DL, Exner DV, Gersh BJ, Cooper HA, Carson PE. Racial differences in the outcome of left ventricular dysfunction. N Engl J Med 1999;340:609-16.
26. Chin MH, Goldman L. Gender differences in 1-year survival and quality of life among patients admitted with congestive heart failure. Med Care 1998;36:1033-46.
27. Bennett SJ, Huster GA, Baker SL, et al. Characterization of the precipitants of hospitalization for heart failure decompensation. Am J Crit Care 1998;7:168-74.
28. Fried LP, Kronmal RA, Newman AB, et al. Risk factors for a 5-year mortality in older adults: the Cardiovascular Health Study. JAMA 1998;279:585-92.
29. Ware JE, Jr, Baylis MS, Rogers WH, Kosinski M, Tarlov AR. Differences in 4-year health outcomes for elderly and poor chronically ill patients treated in HMO and fee-for-service systems. JAMA 1996;276:1039-47.
30. Kahn KL, Pearson ML, Harrison ER, et al. Health care for black and poor hospitalized Medicare patients. JAMA 1994;271:1169-74.
31. Mark DB, Lam LC, Lee KL, Clapp-Channing NE. Identification of patients with coronary disease at high risk for loss of employment. A prospective validation study. Circulation 1992;86:1485-94.
32. Watkins LO, Neaton JD, Kuller LH. Racial differences in high density lipoprotein cholesterol and coronary heart disease incidence in the usual-care group of the Multiple Risk Factor Intervention Trial. Am J Cardiol 1986;57:538-45.
33. Ayanian JZ, Weissman JS, Chasan-Taber, et al. Quality of care by race and gender for congestive cardiac failure and pneumonia. Med Care 1999;37:1260-69.
34. Coughlin SS, Halabi S, Metayer C. Barriers to cardiac transplantation in idiopathic dilated cardiomyopathy: the Washington DC Dilated Cardiomyopathy Study. J Nat Med Assoc 1998;90:342-8.
35. MacIntyre K, Capewell S, Stewart S, et al. Evidence of improving prognosis in heart failure: trends in case fatality in 66,547 patients hospitalized between 1986 and 1995. Circulation 2000;102:1126-31.
36. Auerbach AD, Hamel MB, Califf RM, et al. Patient characteristics associated with care by a cardiologist among adults hospitalized with severe congestive heart failure. J Am Coll Cardiol 2000;36:2119-25.
37. Romm FJ, Hulka BS, Mayo F. Correlates of outcomes in patients with congestive heart failure. Med Care 1976;14:765-76.
38. Eriksson H, Svardsudd K, Larsson B, et al. Risk factors for heart failure in the general population: the study of men born in 1913. Eur Heart J 1989;10:647-56.
39. Connolly V, Urwin N, Sherriff P, Bilous R, Kelly W. Diabetes prevalence and socioeconomic status: a population based study showing increased prevalence of type 2 diabetes mellitus in deprived areas. J Epidemiol Community Health 2000;54:173-7.
40. Osler M, Gerdes LU, Davidson M, et al. Socioeconomic status and trends in risk factors for cardiovascular diseases in the Danish MONICA population. J Epidemiol Community Health 2000;54:108-13.
41. Pentimone F, Del Corso L. Congestive heart failure with frequent hospital readmissions in the elderly. Clin Ter 1993;142:207-10.
42. Wagdi P, Vuilliomenet A, Kaufmann U, Richter M, Bertel O. Inadequate treatment compliance, patient information and drug prescription as causes for emergency hospitalization of patients with chronic heart failure. Schweiz-Med Wochenschr 1993;123:108-12.
43. Cohen-Solal A, Desnos M, Delahaye F, Emeriau JP, Hanania G. A national survey of heart failure in French Hospitals. Eur Heart J 2000;21:763-9.
44. AIRE Study Investigators. Effect of ramipril on mortality and morbidity of survivors of acute myocardial infarction with clinical evidence of heart failure. Lancet 1993;342:821-8.
45. Tudor-Hart J. The inverse care law. Lancet 1971;1:405-12.
46. Baker DW, Hayes RP, Massie BM, Craig CA. Variations in family physicians’ and cardiologists’ care for patients with heart failure. Am Heart J 1999;138(5 pt 1):826-34.
47. Hippisley-Cox J, Pringle M. Inequalities in access to coronary angiography and revascularisation: the association of deprivation and location of primary care. Br J Gen Pract 2000;50:449-54.
48. Payne N, Saul C. Variation in use of cardiological services in a health authority: comparison of coronary artery revascularisation rates with prevalence of angina and mortality. BMJ 1997;314:257-61.
49. Pell JP, Pell ACH, Norrie J, Ford I, Cobbe SM. Effect of socioeconomic deprivation on waiting time for cardiac surgery: retrospective cohort study. BMJ 2000;320:15-9.
50. Watson JP, Cowen P, Lewis RA. The relationship between asthma admission rates, routes of admission and socioeconomic deprivation. Eur Respir J 1996;9:2087-93.
51. Ciccine G. Social class, mode of admission, severity of illness and hospital mortality: an analysis with “all patient refined DRG” of discharges from Molinette hospitals in Turin. Epidemiologia e Prevanzione 1999;23:188-96.
52. Lewis G, Bebbington P, Brugha T, et al. Socioeconomic status, standard of living and neurotic disorder. Lancet 1998;352:605-9.
53. Brown GW, Harris TO. Social origins of depression. London: The Free Press; 1978.
54. Nilsson PM, Moller L, Ostergren P. Social class and cardiovascular disease—an update. Scand J Soc Med 1995;23:3-8.
55. Kaplan GA, Keil JE. Socioeconomic factors and cardiovascular disease: a review of the literature. Circulation 1993;88(pt 1):1973-95.
To submit a letter to the editor on this topic, click here: [email protected].
Experience, Expertise, or Specialty? Uses and Misuses of a Reference
OBJECTIVES: We wanted to analyze systematically the manner in which the results of a published study are presented in subsequent publications that refer to it.
STUDY DESIGN: We identified a convenience sample of 121 scientific papers that referred to an often-cited 1996 study by Kitahata and colleagues. This study reported that greater primary care physician experience with AIDS was associated with lower mortality among their patients with AIDS.
OUTCOMES MEASURED: We determined the manner in which the results of the Kitahata and coworkers study were presented, the type of article, and whether its focus was on HIV care.
RESULTS: Most of the articles reviewed (78%) appropriately referred to the study as evidence of improved outcomes with increasing provider experience. However, 8% of the articles reviewed referred to the study as evidence of improved outcomes with specialty care and 3% referred to it as evidence of the benefits of expert care. Articles that referred to the study as evidence of improved outcomes with specialty care were more likely to be review articles and articles with a non-HIV focus.
CONCLUSIONS: This study demonstrates that misrepresentation of the findings of published studies is not uncommon. More needs to be done to ensure the accuracy of references in scientific publications.
References provide the foundation for scientific publications, particularly for review articles and editorials. Readers must rely on the honesty and integrity of the authors or go through the painstaking work of finding and verifying the references themselves. Previous research indicates that errors in references are common but usually minor and do not necessarily detract from the authors’ argument or conclusions.1,2 More serious errors have been found, however, in the form of misleading or erroneous quotations.3,4
In 1996, Kitahata and colleagues published a study “to determine whether more experience with the management of AIDS on the part of primary care physicians is associated with increased survival among their patients with AIDS.”5 They found that patients with AIDS cared for by physicians who had the least experience with AIDS survived for significantly less time than did those cared for by physicians with the most experience. The least-experienced physicians were defined as those who had only 1 patient with AIDS and a low level of residency experience with AIDS. The most-experienced physicians had either 6 or more patients with AIDS or 2 to 5 such patients and a high level of residency experience. This study was not a comparison of generalists with specialists; most of the physicians (85%) were general or family practitioners and the remainder were internists.
Since then, the study has been frequently cited in a variety of contexts, from discussions of HIV and AIDS care to more general discussions on the relationship between physician experience and patient outcomes. We undertook the current study after observing that some articles referred to the Kitahata study as evidence of the benefits of specialty care. The goal of this study was to review systematically the articles that refer to this publication and to analyze the conclusions that authors draw from the paper.
Methods
We identified articles that referred to the Kitahata et al study through the Scientific Citation Index (maintained by the Institute for Scientific Information). We reviewed a convenience sample of articles-those in journals available in 1 of 2 major local health sciences libraries (including online links). Letters to the editor were excluded. Each article was reviewed by the authors and the following information collected: (1) type of article (original research, review, editorial, or other); (2) whether the focus of the article was on HIV care or another topic; and (3) the passage in which the Kitahata et al article was first mentioned. Each passage was independently assessed by the authors and classified by the assertion made; namely, whether patient outcomes are related to experience, expertise, specialty, or none of the above. If there was initial disagreement on the classification of the passage, the final decision was made by consensus. The relationship between the type and focus of the article and the assertion made was investigated using Fisher’s exact test.
Results
As of July 31, 2000, 142 articles were listed on the Scientific Citation Index that had referred to the paper by Kitahata and coworkers. Twelve (8%) were in journals not accessible through either of 2 major local health sciences libraries. Nine letters were excluded from the analysis. A total of 121 articles were reviewed (85% of total); the results are summarized in Table 1. Ninety-four of the articles reviewed (78%) were focused on HIV-related topics. Sixty-three (52%) of the articles were original research papers; 35 (29%) were review articles; 15 (12%) were editorials; and 8 (7%) were other types (4 program descriptions, 1 program proposal, 1 conference report, and 2 commentaries).
Ninety-four of the papers reviewed (78%) referred to the Kitahata et al study as evidence of the association between experience and patient outcomes (“experience articles”). Ten of the papers (8%) referred to the study as evidence of the benefits of specialty or specialized care (“specialty articles”); quotations from those papers are shown in Table 2.6-15 Four of the papers reviewed (3%) referred to the study as evidence of the benefits of expertise or expert care (“expert articles”); these quotations are shown in Table 3.16-19 Thirteen of the articles reviewed (11%) listed the study as a general reference or cited it for reasons other than making an assertion about the relationship between health care provider characteristics and patient outcomes. On the initial review, the authors’ classification of the passage differed for only 5 (4%) of the 121 articles reviewed; all of these were ultimately classified as “experience” or “other” articles.
“Specialty articles” were more likely to be non-HIV related (80%) than HIV related, while “experience articles” were more likely to be HIV related (81%); this difference was statistically significant (P <.001). “Specialty articles” were also more likely to be reviews or editorials (80%); most of the “experience articles” were original research (59%); the P value for this difference was 0.02 by Fisher’s exact test.
Discussion
This study illustrates the various ways in which the results of a single study are interpreted and conveyed to readers of scientific papers. The study by Kitahata and colleagues was a comparison of generalists with varying levels of experience. It was not a study of specialists or specialized care; nevertheless, it was presented as such in 8% of the articles reviewed. Another 3% cited the study as evidence of the benefits of “expert care”; this is perhaps justifiable, but the study did not measure expertise, and the leap from experience to expertise is questionable, at best.
There are a few possible explanations for the authors’ misrepresentation of the article by Kitahata et al. The most obvious explanation is that the authors in these situations were willing to manipulate the results of the study to bolster their argument. Most of the articles that referred to this study as evidence of the benefits of specialized care (8 of 10) were review articles on the topic of specialized care815 and half of those were focused on hospitalism9,11-13; these are settings in which the authors may have had an incentive to present the study in this manner. It is possible, however, that the authors felt free to extrapolate from the results of this study and argue that since a relatively modest increase in experience improves outcomes, an even greater increase (ie, specialization) would improve outcomes even more. However, this argument was never explicitly made in these examples. A few of the articles reviewed did make this type of argument, but we classified these as “experience” articles. A final possible explanation is that the authors used a previous author’s reference without reviewing the study themselves; however, this seems less likely, since the title of the study clearly states that physician experience was the variable studied.
Limitations
Our study has a number of limitations. The source article was not chosen randomly, but was based on an observation of misrepresentation, so the frequency of misuse may be higher than with other articles. However, the misquotation rate found in this study is consistent with previous studies. One analysis of 6 journals reported a misquotation rate of 15%; 8% of these were felt to be major errors.3 A second study found 37 major quotation errors in 150 randomly selected references from 137 different articles.4 Another limitation of this study is that not all the articles that cited the study were analyzed; however, the number of unanalyzed studies is fairly small (8%) and unlikely to affect the overall conclusions.
Conclusions
Authors of scientific papers have a responsibility to convey accurately the information they have gathered to their readers. This study suggests that some authors are willing to bend or break this rule. It is unlikely that reminders about adherence to the responsibilities of authorship will alter this habit. Increased scrutiny of references in the peer-review process, although difficult, is most likely the only way to guard against these types of manipulations and misrepresentations.
1. McLellan MF, Case D, Barnett MC. Trust, but verify. The accuracy of in four anesthesia journals. Anesthesiology 1992;77:185-8.
2. Orlin W, Pehling J, Pogrell MA. Do authors check their ? A survey of 500 from the Journal of Oral and Maxillofacial Surgery. J Oral Maxillofac Surg 1996;54:200-2.
3. DeLacey G, Record C, Wade J. How accurate are quotations and in medical journals? BMJ 1985;291:884-6.
4. Evans JT, Nadjari HI, Burchell SA. Quotational and reference accuracy in surgical journals. JAMA 1990;263:1353-4.
5. Kitahata MM, Koepsell TD, Deyo RA, Maxwell CL, Dodge WT, Wagner EH. Physicians’ experience with the acquired immunodeficiency syndrome as a factor in patient’s survival. N Engl J Med 1996;334:701-6.
6. Crystal S, Sambamoorthi U. Functional impairment trajectories among persons with HIV disease: a hierarchical linear models approach. Health Serv Res 1996;31:469-88.
7. Lange JMA. Current problems and the future of antiretroviral drug trials. Science 1997;276:548-50.
8. Pollack S. A role for academic medical centers in the era of managed care: immediate, interactive, free information. Acad Med 1998;73:357-9.
9. Saver BG, Doescher MP. The rising tide of hospitalism: evidence-based or anecdote-based medicine? J Fam Pract 1998;46:465-8.
10. Donohoe MT. Comparing generalist and specialty care-discrepancies, deficiencies, and excesses. Arch Intern Med 1998;158:1596-608.
11. Schroeder SA, Schapiro R. The hospitalist: new boon for internal medicine or retreat from primary care? Ann Intern Med 1999;130:382-7.
12. Goldman L. The impact of hospitalists on medical education and the academic health system. Ann Intern Med 1999;130:364-7.
13. Wachter RM. An introduction to the hospitalist model. Ann Intern Med 1999;130:338-42.
14. Go AS, Rao RK, Dauterman KW, Massie BM. A systematic review of the effects of physician specialty on the treatment of coronary disease and heart failure in the United States. Am J Med 2000;108:216-26.
15. Golomb BA, Pyne JM, Wright B, Lohr JB, Bozette SA. The role of psychiatrists in primary care of patients with severe mental illness. Psychiatr Serv 2000;51:766-73.
16. Kitahata MM, Holmes EK, Wagner EH, Gooding TD. Caring for persons with HIV infection in a managed care environment. Am J Med 1998;104:511-5.
17. Grace CJ, Richardson K, Kutzko D, Alston WK, Ramundo M. Service delivery for patients with HIV in a rural state: the Vermont model. AIDS Patient Care Stds 1999;13:659-66.
18. Turner BJ, Newschaffer CJ, Cocroft J, Fanning TR, Marcus S, Hauck WW. Improved birth outcomes among HIV-infected women with enhanced medicaid prenatal care. Am J Public Health 2000;90:85-91.
19. Gallant JE. Strategies for long-term success in the treatment of HIV infection. JAMA 2000;283:1329-34.
OBJECTIVES: We wanted to analyze systematically the manner in which the results of a published study are presented in subsequent publications that refer to it.
STUDY DESIGN: We identified a convenience sample of 121 scientific papers that referred to an often-cited 1996 study by Kitahata and colleagues. This study reported that greater primary care physician experience with AIDS was associated with lower mortality among their patients with AIDS.
OUTCOMES MEASURED: We determined the manner in which the results of the Kitahata and coworkers study were presented, the type of article, and whether its focus was on HIV care.
RESULTS: Most of the articles reviewed (78%) appropriately referred to the study as evidence of improved outcomes with increasing provider experience. However, 8% of the articles reviewed referred to the study as evidence of improved outcomes with specialty care and 3% referred to it as evidence of the benefits of expert care. Articles that referred to the study as evidence of improved outcomes with specialty care were more likely to be review articles and articles with a non-HIV focus.
CONCLUSIONS: This study demonstrates that misrepresentation of the findings of published studies is not uncommon. More needs to be done to ensure the accuracy of references in scientific publications.
References provide the foundation for scientific publications, particularly for review articles and editorials. Readers must rely on the honesty and integrity of the authors or go through the painstaking work of finding and verifying the references themselves. Previous research indicates that errors in references are common but usually minor and do not necessarily detract from the authors’ argument or conclusions.1,2 More serious errors have been found, however, in the form of misleading or erroneous quotations.3,4
In 1996, Kitahata and colleagues published a study “to determine whether more experience with the management of AIDS on the part of primary care physicians is associated with increased survival among their patients with AIDS.”5 They found that patients with AIDS cared for by physicians who had the least experience with AIDS survived for significantly less time than did those cared for by physicians with the most experience. The least-experienced physicians were defined as those who had only 1 patient with AIDS and a low level of residency experience with AIDS. The most-experienced physicians had either 6 or more patients with AIDS or 2 to 5 such patients and a high level of residency experience. This study was not a comparison of generalists with specialists; most of the physicians (85%) were general or family practitioners and the remainder were internists.
Since then, the study has been frequently cited in a variety of contexts, from discussions of HIV and AIDS care to more general discussions on the relationship between physician experience and patient outcomes. We undertook the current study after observing that some articles referred to the Kitahata study as evidence of the benefits of specialty care. The goal of this study was to review systematically the articles that refer to this publication and to analyze the conclusions that authors draw from the paper.
Methods
We identified articles that referred to the Kitahata et al study through the Scientific Citation Index (maintained by the Institute for Scientific Information). We reviewed a convenience sample of articles-those in journals available in 1 of 2 major local health sciences libraries (including online links). Letters to the editor were excluded. Each article was reviewed by the authors and the following information collected: (1) type of article (original research, review, editorial, or other); (2) whether the focus of the article was on HIV care or another topic; and (3) the passage in which the Kitahata et al article was first mentioned. Each passage was independently assessed by the authors and classified by the assertion made; namely, whether patient outcomes are related to experience, expertise, specialty, or none of the above. If there was initial disagreement on the classification of the passage, the final decision was made by consensus. The relationship between the type and focus of the article and the assertion made was investigated using Fisher’s exact test.
Results
As of July 31, 2000, 142 articles were listed on the Scientific Citation Index that had referred to the paper by Kitahata and coworkers. Twelve (8%) were in journals not accessible through either of 2 major local health sciences libraries. Nine letters were excluded from the analysis. A total of 121 articles were reviewed (85% of total); the results are summarized in Table 1. Ninety-four of the articles reviewed (78%) were focused on HIV-related topics. Sixty-three (52%) of the articles were original research papers; 35 (29%) were review articles; 15 (12%) were editorials; and 8 (7%) were other types (4 program descriptions, 1 program proposal, 1 conference report, and 2 commentaries).
Ninety-four of the papers reviewed (78%) referred to the Kitahata et al study as evidence of the association between experience and patient outcomes (“experience articles”). Ten of the papers (8%) referred to the study as evidence of the benefits of specialty or specialized care (“specialty articles”); quotations from those papers are shown in Table 2.6-15 Four of the papers reviewed (3%) referred to the study as evidence of the benefits of expertise or expert care (“expert articles”); these quotations are shown in Table 3.16-19 Thirteen of the articles reviewed (11%) listed the study as a general reference or cited it for reasons other than making an assertion about the relationship between health care provider characteristics and patient outcomes. On the initial review, the authors’ classification of the passage differed for only 5 (4%) of the 121 articles reviewed; all of these were ultimately classified as “experience” or “other” articles.
“Specialty articles” were more likely to be non-HIV related (80%) than HIV related, while “experience articles” were more likely to be HIV related (81%); this difference was statistically significant (P <.001). “Specialty articles” were also more likely to be reviews or editorials (80%); most of the “experience articles” were original research (59%); the P value for this difference was 0.02 by Fisher’s exact test.
Discussion
This study illustrates the various ways in which the results of a single study are interpreted and conveyed to readers of scientific papers. The study by Kitahata and colleagues was a comparison of generalists with varying levels of experience. It was not a study of specialists or specialized care; nevertheless, it was presented as such in 8% of the articles reviewed. Another 3% cited the study as evidence of the benefits of “expert care”; this is perhaps justifiable, but the study did not measure expertise, and the leap from experience to expertise is questionable, at best.
There are a few possible explanations for the authors’ misrepresentation of the article by Kitahata et al. The most obvious explanation is that the authors in these situations were willing to manipulate the results of the study to bolster their argument. Most of the articles that referred to this study as evidence of the benefits of specialized care (8 of 10) were review articles on the topic of specialized care815 and half of those were focused on hospitalism9,11-13; these are settings in which the authors may have had an incentive to present the study in this manner. It is possible, however, that the authors felt free to extrapolate from the results of this study and argue that since a relatively modest increase in experience improves outcomes, an even greater increase (ie, specialization) would improve outcomes even more. However, this argument was never explicitly made in these examples. A few of the articles reviewed did make this type of argument, but we classified these as “experience” articles. A final possible explanation is that the authors used a previous author’s reference without reviewing the study themselves; however, this seems less likely, since the title of the study clearly states that physician experience was the variable studied.
Limitations
Our study has a number of limitations. The source article was not chosen randomly, but was based on an observation of misrepresentation, so the frequency of misuse may be higher than with other articles. However, the misquotation rate found in this study is consistent with previous studies. One analysis of 6 journals reported a misquotation rate of 15%; 8% of these were felt to be major errors.3 A second study found 37 major quotation errors in 150 randomly selected references from 137 different articles.4 Another limitation of this study is that not all the articles that cited the study were analyzed; however, the number of unanalyzed studies is fairly small (8%) and unlikely to affect the overall conclusions.
Conclusions
Authors of scientific papers have a responsibility to convey accurately the information they have gathered to their readers. This study suggests that some authors are willing to bend or break this rule. It is unlikely that reminders about adherence to the responsibilities of authorship will alter this habit. Increased scrutiny of references in the peer-review process, although difficult, is most likely the only way to guard against these types of manipulations and misrepresentations.
1. McLellan MF, Case D, Barnett MC. Trust, but verify. The accuracy of in four anesthesia journals. Anesthesiology 1992;77:185-8.
2. Orlin W, Pehling J, Pogrell MA. Do authors check their ? A survey of 500 from the Journal of Oral and Maxillofacial Surgery. J Oral Maxillofac Surg 1996;54:200-2.
3. DeLacey G, Record C, Wade J. How accurate are quotations and in medical journals? BMJ 1985;291:884-6.
4. Evans JT, Nadjari HI, Burchell SA. Quotational and reference accuracy in surgical journals. JAMA 1990;263:1353-4.
5. Kitahata MM, Koepsell TD, Deyo RA, Maxwell CL, Dodge WT, Wagner EH. Physicians’ experience with the acquired immunodeficiency syndrome as a factor in patient’s survival. N Engl J Med 1996;334:701-6.
6. Crystal S, Sambamoorthi U. Functional impairment trajectories among persons with HIV disease: a hierarchical linear models approach. Health Serv Res 1996;31:469-88.
7. Lange JMA. Current problems and the future of antiretroviral drug trials. Science 1997;276:548-50.
8. Pollack S. A role for academic medical centers in the era of managed care: immediate, interactive, free information. Acad Med 1998;73:357-9.
9. Saver BG, Doescher MP. The rising tide of hospitalism: evidence-based or anecdote-based medicine? J Fam Pract 1998;46:465-8.
10. Donohoe MT. Comparing generalist and specialty care-discrepancies, deficiencies, and excesses. Arch Intern Med 1998;158:1596-608.
11. Schroeder SA, Schapiro R. The hospitalist: new boon for internal medicine or retreat from primary care? Ann Intern Med 1999;130:382-7.
12. Goldman L. The impact of hospitalists on medical education and the academic health system. Ann Intern Med 1999;130:364-7.
13. Wachter RM. An introduction to the hospitalist model. Ann Intern Med 1999;130:338-42.
14. Go AS, Rao RK, Dauterman KW, Massie BM. A systematic review of the effects of physician specialty on the treatment of coronary disease and heart failure in the United States. Am J Med 2000;108:216-26.
15. Golomb BA, Pyne JM, Wright B, Lohr JB, Bozette SA. The role of psychiatrists in primary care of patients with severe mental illness. Psychiatr Serv 2000;51:766-73.
16. Kitahata MM, Holmes EK, Wagner EH, Gooding TD. Caring for persons with HIV infection in a managed care environment. Am J Med 1998;104:511-5.
17. Grace CJ, Richardson K, Kutzko D, Alston WK, Ramundo M. Service delivery for patients with HIV in a rural state: the Vermont model. AIDS Patient Care Stds 1999;13:659-66.
18. Turner BJ, Newschaffer CJ, Cocroft J, Fanning TR, Marcus S, Hauck WW. Improved birth outcomes among HIV-infected women with enhanced medicaid prenatal care. Am J Public Health 2000;90:85-91.
19. Gallant JE. Strategies for long-term success in the treatment of HIV infection. JAMA 2000;283:1329-34.
Perceptions and Needs of Patients With Migraine
OBJECTIVE: This study’s purpose was to identify the areas that people find most difficult in living with migraines and, in that regard, what kinds of assistance would be most helpful to them and to other people who have migraine headaches.
STUDY DESIGN: Four focus groups, each consisting of 4 to 8 participants, were held. Discussions, which were recorded and organized according to category and theme, focused on problems in living with migraines and effective treatment of migraines.
POPULATION: Participants were 24 people who had been experiencing 1 to 2 migraines a month, each lasting 1 to 2 days, for at least 6 months.
RESULTS: Five themes emerged: (1) impact on family, (2) misunderstanding by others, (3) effect on work, (4) physician care issues, and (5) issues related to medical insurance and drug companies. A majority of participants identified early treatment as the most important consideration for new migraine sufferers. Many participants preferred to have a relationship with their physicians in which they developed a treatment plan together rather than receiving generic educational materials.
CONCLUSIONS: Results suggest that patients are interested in understanding their migraines and securing relevant information in addition to obtaining pain relief. Patients desired collaborative relationships with their physicians and a team approach to treatment. Suggestions for physicians who treat patients who have migraines are reviewed.
- Migraine sufferers said they would prefer a collaborative relationship with their physician and a team approach to therapy.
- Patients reported that they often felt dismissed by their physicians, frustrated by insurance and drug companies, and misunderstood by their loved ones.
- Participants said early treatment of migraine headaches should be emphasized for new migraine patients.
Twenty-five to 30 million people in the United States have migraine headaches. Of these, approximately 11 million are moderately to severely disabled by their attacks,1-4 resulting in significant lost labor costs,5 substantial health care expenses,6 and a pervasive negative impact on overall quality of life.
Although migraine is a highly treatable disorder, almost one half of people who have migraines are not currently under the care of a physician for that condition.7 Further, data from the American Migraine Study II, sponsored by the National Headache Foundation, show that those who have received a diagnosis suffer at a level similar to that of those who have not. This finding suggests that effective migraine management depends not only on diagnosis but also on ongoing treatment. The opportunity exists to reduce the indirect costs, disability, and impairment associated with this disorder. However, the primary care physician has a pivotal role in the management of migraine.
The aim of this study was to identify: (1) the areas that people who have migraines consider most problematic in living with their headaches and (2) the types of physician assistance they believe would be most helpful in managing this disorder.
Methods
This exploratory study used a focus group format to identify topics of concern to people with migraine. Although this format has inherent limitations, its use in health science research has gained considerable acceptance in recent years.8-10 Focus groups are recognized for their ability to identify issues of the greatest importance to individuals.11
The Institutional Review Board of Ohio University, Athens, Ohio, approved all procedures used in this study. Names of potential participants were obtained from a list of people who had responded to community-wide advertisements recruiting subjects for a separate headache study conducted by 2 of the authors (K.A.H. and F.J.O.). Telephone screenings were reviewed to identify those with 2 to 8 migraine days per month by self-report. Of the 59 patients contacted, 24 attended a focus group. (The remainder did not meet criteria, were uninterested, or had transportation or scheduling difficulties.) Two thirds of the sample had 1 to 3 migraines per month. The remainder of the sample experienced more frequent migraines. Every participant met International Headache Society criteria for migraine with or without aura and had migraine as the primary headache diagnosis. Only 2 patients indicated a history of occasional tension-type headaches. All had consulted a physician about their headaches, with 60% presenting to their primary care physician exclusively and the remaining 40% consulting a neurologist at some point. Attendees were given a $30 incentive for their participation.
The groups were conducted by a moderator (C.K.C.) and an assistant (S.E.W.) using an interview guide. Eight questions were addressed during each meeting: (1) What is the biggest problem you have encountered in trying to manage your migraines? (2) What is the most important lesson that you have learned in trying to manage your migraines? (3) Where did you get your ideas regarding how to manage your migraine headaches? (4) Where and how do you think would be the best way to get information? (5) What types of information or skills do you think would be most useful to you and others for managing migraines? (6) (Of the information gathered) what topics do you think are most important? (7) If topics had to be eliminated, which ones could go? and (8) What other advice do you have for us?
The moderator elicited comments from quieter participants by specifically inviting their views on discussion topics. To prevent the opinions of especially verbal participants from receiving undue attention, the moderator probed for differing experiences from other group members. Each discussion took approximately 2 hours.
All sessions were audiotaped and transcribed. Transcripts were read independently by 2 of the authors (C.K.C. and S.E.W.), who arranged comments into categories and themes. Disagreements were resolved by mutual agreement and validated by 2 other authors (K.A.H. and F.J.O.). Typical statements were selected for inclusion in this report.
Results
Participants’ comments on migraine management fell into 6 primary categories. Representative comments are provided in Table 1.
TABLE 1
IMPACT ON DAILY LIFE
| Impact on family |
| “I’m not the mom I wanted to be. I’m short-tempered, and I don’t like that. They [family members] all try to leave the house [when I have a migraine].” |
| “Being at home, I pretty much run the show. So if I’m not up and going, the show’s not going. The show shuts down.” |
| Impact on social activities |
| “Gradually, things are taken away from you. Like you can’t even walk down the street on a sunny day because the sun will give you a headache.” |
| Impact on relationships |
| “I think people look at you like, ‘Yeah, right, everybody has headaches. They’re not that bad; just get a grip and keep going.’” |
| Impact on work |
| “I always stay at work [when I have a migraine]. I try to look productive, but I’m only doing half. You get a reaction if you tell [coworkers]. After about the fourth headache in 2 months, they just don’t buy it.” |
Effect on Social Functioning
Group discussions indicated that all aspects of social and recreational activities were hampered by migraines. In particular, avoiding food triggers was reported to be difficult because in some situations, there was no way to determine whether the food had been prepared with additives that might trigger a headache. This was an especially difficult barrier because food often plays a central role in social activities.
Effect on family functioning
Although participants regretted, and sometimes resented, being unable to participate in social activities because of their migraines, the effect on family, particularly children, was especially troublesome. Many participants felt they were less available and less understanding as parents as a result of migraine-induced irritability, feeling emotionally and physically drained for days after a migraine, and feeling “drugged” from taking medications.
Further, being forced to place restrictions on their children’s activities left many parents feeling that they and their children had been “cheated” by the migraines. Many participants expressed guilt about their inability to prepare meals, help with homework, or complete other routine household chores. Finally, some were frightened at the possibility that they might have a migraine when away from home but still retain responsibility for caring for the children. Both the migraine itself and the medication used to treat it left many feeling they should not drive, even when they had no alternative.
Effect on work
The predominant emotions evident during discussions of job functioning were fear and guilt. Most participants expressed apprehension about the possibility of losing their jobs if they missed work because of their migraines. Those who went home with a migraine reported lost pay or fewer vacation or personal days to enjoy when feeling well. Thus, participants reported often trying to “just keep going” in spite of the headaches. These efforts contributed to lost productivity, feelings of guilt for not carrying a fair share of the workload, and, in some cases, decreased pay because of failure to meet job quotas.
Effect on relationships
Participants’ comments suggest that others’ reactions to migraines are associated with shame, anger, and frustration. Most participants verbalized an unwillingness to tell others when they were experiencing a migraine, reporting that people were unsympathetic. The consensus was that most people dismissed migraines as insignificant and “think you’re embellishing it.”
Issues related to physician care
Some group members were happy with the medical care they received. Identified as important behaviors were a physician’s willingness to consider alternative treatments, to “sit down and listen,” and to “pull out a book and look it up.” However, significant frustration related to medical care was evident as well (Table 2). The most emotionally laden issue in this category was the feeling of being “dismissed” by physicians who did not appear to take complaints of headache pain seriously. Some participants reported that they had endured years of frequent migraines since allegedly being told to “live with it” by a physician.
The majority of group members perceived that they had to take responsibility for researching new treatment options, including medications and alternative therapies, and to take suggestions to their physicians. Some, especially women considering pregnancy, were dissatisfied with a perceived emphasis on drug therapy. Many participants were concerned about possible long-term complications from taking potent medications and believed that their health care providers addressed their concerns inadequately.
TABLE 2
ISSUES RELATED TO CARE
| Physicians’ failure to take migraines seriously |
| “I remember the first doctor I went to. He said, ‘Oh, just take a couple of Tylenol and go on with it.’” |
| Desire for referral |
| “When you go to a clinic and they can’t help you, it’s like you’ve fallen off the face of the earth. Where do you go from there?” |
| Undesirable focus on medications |
| “I don’t want to be on a bunch of drugs. But they’re not willing to do anything else. If you can’t treat it with a chemical, you can’t treat it. Forget it!” |
| “I worry about getting pregnant. I’d like to make sure I have a healthy baby, so I don’t want to pollute myself. What if I’m already pregnant? Should I take a pregnancy test before I take my [name of drug]?” |
| Issues with drug companies |
| “I can’t afford to pay $75 to treat a headache, so sometimes I go without the medication. I only use it if it’s a severe one with the nausea and the vomiting.” |
Problems with insurance and drug companies
A great number of participants expressed anger with insurance and drug companies, viewing them as barriers to effective treatment. They were frustrated by “the bureaucrats” in managed care companies who mandated their choices of physicians and medications. This situation was particularly infuriating for those who had spent significant time and effort finding a physician with whom they felt comfortable or a medication that worked for them, only to be told that because of a change in insurance coverage, they had to change physicians, medications, or both. The primary complaint about pharmaceutical companies was the steep cost of medication.
Discussion
It is important to note this study’s limitations. The focus group format is an effective method for soliciting issues of greatest importance to the individuals in attendance, but does not provide information on the prevalence of those opinions in the population. Because patients experiencing up to 8 migraine days per month were included in the study, our sample may have included those who had obtained insufficient relief from treatment and were, therefore, dissatisfied with that treatment. The information provided in the discussions may have been influenced by the fact that individuals who volunteer to participate are likely to have different views from those who do not participate in such groups. The small sample size limits the authors’ ability to generalize about these findings. Thus, the experiences and views reported here cannot be considered representative of all migraine sufferers. Finally, patients report interactions with physicians as they remember them. In some cases, their recollections may not reflect the true nature of the interactions.
Nonetheless, these participants resemble the migraine sufferers most likely to seek headache treatment. The typical participant in this study, a white female aged 25 to 49 years who experiences 1 to 2 migraines per month, each lasting 1 to 2 days, is a counterpart to the migraine patient seen in the primary care setting. In fact, 60% of participants had consulted only in the primary care setting. Thus, the experiences and opinions reported here might be typical of migraine patients who present management difficulties for primary care physicians. Being aware of these patients’ concerns may help physicians provide more effective treatment and improve patient satisfaction.
Focus group members reported migraine-related concerns across a range of life experiences. These concerns can be divided into 2 primary categories: (1) impact of migraines on daily functioning and (2) perceived barriers to effective care.
The impact of migraines on quality of life has been well documented.2,5,12-20 Previous studies have shown that the bodily pain, nausea, and vomiting that occur during attacks result in impairments in job and role functioning.20 Migraines have also been shown to interfere with family and with social and recreational activities5—resulting in less pleasure in life and less energy between attacks—and to disturb sleep.18
Many of the problems of daily life that are encountered in experiencing frequent migraines, as reported by study participants, result from perceived barriers to treatment. Lipton and colleagues7 described 3 levels on which barriers occur: the failure of migraine sufferers to consult physicians, failure to receive correct diagnoses in those who do consult physicians, and failure of correctly diagnosed patients to receive effective therapy.
Participants’ comments reveal a fourth level on which barriers to effective migraine management can occur: correctly diagnosed consulters for whom effective treatment has been prescribed but who are unable or unwilling to implement the prescribed treatment. Among focus group participants were individuals who had consulted a physician, received the correct diagnosis, and obtained what is generally accepted as effective treatment. Yet some experienced difficulty in implementing that treatment.
Comments by group members indicate several factors that can interfere with a patient’s ability to follow treatment recommendations. For example, avoiding known dietary triggers by consistently identifying preservatives and additives used in food preparation can be arduous. In addition, the high cost of abortive medications may make it difficult, and in some cases impossible, for patients to buy such medications, especially if they do not have prescription insurance coverage. Insurance companies’ limits on the types and amount of medication covered and on which physicians a subscriber may see can also interfere with effective migraine management. In addition, behavior patterns among migraine sufferers may interfere with obtaining effective therapy. Examples included patients’ reports of their reluctance to “accept that the migraine is coming” and take the necessary steps to ward it off.
Finally, participants indicated that dissatisfaction with the perceived attitude of their physicians had contributed to their lack of treatment follow-through. Attendees reported a perception that some physicians do not understand their problem or take it seriously. These findings are consistent with those of a previous study with migraine patients,21 as well as studies with other health care consumers, both healthy and ill.22,23
Recurring themes of fear, anger, and frustration were associated with both the impairments in quality of life and perceived barriers to effective care. However, while participants were eager to discuss the pain, functional disability, and management problems associated with migraines, they denied emotional distress. This denial is surprising, considering the emotional charge obvious in many of their statements (eg, “I’m not the mom I wanted to be,” “I feel like I’m letting everybody down”) and the important role that emotional distress plays in chronic tension-type headaches.24 Possibly participants did not differentiate emotional distress from the physical disability caused by migraines or were inclined to emphasize pain and disability but minimize emotional reactions in an effort to legitimize frequent migraines as a serious medical problem.
Participants’ comments suggest interventions that could be taken by physicians to improve their understanding of patients’ headaches and needs and to develop the collaborative relationship that people who have migraines appear to desire.
First, physician behavior in response to migraine concerns is important. Patients want their physicians to indicate that they are listening and taking their concerns seriously before offering treatment. One means of indicating understanding is to reflect the concerns that the patient has expressed (eg, “It sounds as if these headaches are really interfering with your daily life, your work, and taking care of your children”) and to ask the patient what he or she expects treatment to achieve. Such an exchange could initiate a mutually beneficial collaborative relationship: The patient feels understood and heard while the physician gains a better understanding of what the patient desires in treatment. Ultimately, the result may be greater success with therapy.
Physicians should listen for clues related to the severity and impact of headaches on patients’ lives. A patient’s complaint of “headaches” might inadvertently be dismissed unless the physician determines whether the headaches are actually migraines and the extent to which they interfere with daily life.
Consistent with other findings,25,26 the patients in this study seemed to be as interested in being offered the time to ask questions about headaches and medications as they were in obtaining pain relief. Some people who have migraines need general information about migraines and migraine management. Maintaining brochures from the National Headache Foundation, the American Council for Headache Education, or the American Headache Society in waiting rooms and directing patients to these resources may be helpful. However, generic information is merely a first step in meeting patients’ needs. Periodically reviewing the patient’s headache diary with an eye for patterns, possible triggers, and responses to treatment can provide the basis for a specific, individualized migraine management plan.
Providing abortive drug samples so that patients can determine whether a medication is effective and tolerable before paying the high cost of a prescription is extremely helpful for many people, especially those without prescription insurance coverage. Participants in this study and others21,22,27 also want physicians to maintain an open mind with regard to complementary and alternative treatments for migraine. This is especially the case for women in their reproductive or child-rearing years, who may be concerned about the side effects and risks of medications.
Time constraints may make these ideas difficult to implement. Migraine patients may require a longer appointment or may need a second appointment if the complaint is voiced as an afterthought during an unrelated visit. Working as a team, however, the physician and patient can do a great deal to reduce the disability and cost associated with migraines.
The understanding of migraines and the availability of tools to aid in their treatment have increased considerably in recent years, particularly with the advent of the Internet (Table 3). This information is useful only when both physician and patient are involved. Future studies should focus on developing a greater understanding of barriers to effective migraine management and efforts to eliminate them.
TABLE 3
SELECTED INTERNET RESOURCES FOR MIGRAINE MANAGEMENT
| Evidence-based guidelines for migraine headache, American Academy of Neurology Web site |
| http://www.aan.com/public/practiceguidelines/01.pdf |
| American Council for Headache Education (ACHE) |
| www.achenet.org |
| National Headache Foundation (NHF) |
| www.headaches.org |
Conclusions
Results of this focus group study suggest that people are interested in understanding their migraines and securing relevant information about it as well as in obtaining pain relief. Participants desired collaborative relationships with their physicians and wanted a team approach to treatment that involved both physician and patient.
1. Lipton RB, Stewart WF. Epidemiology and comorbidity of migraine. In: Goadsby PJ, Silberstein SD, eds. Headache. Boston, Mass: Butterworth-Heinemann; 1997;75-96
2. Osterhaus JT, Townsend RJ, Gandek B, Ware JE, Jr. Measuring the functional status and well-being of patients with migraine headache. Headache 1994;34:337-43.
3. Stewart WF, Lipton RB. Migraine headache: epidemiology and health care utilization. Cephalalgia 1993;13(suppl 12):41-6.
4. Stewart WF, Shechter A, Rasmussen BK. Migraine prevalence: a review of population-based studies. Neurology 1994;44(suppl 4):S17-S23.
5. Stewart WF, Lipton RB, Simon D. Work-related disability: results from the American Migraine Study. Cephalalgia 1996;16:231-8.
6. Osterhaus JT, Gutterman DL, Plachetka JR. Healthcare resource and lost labour costs of migraine headache in the US. Pharmacoeconomics 1992;2:67-76.
7. Lipton RB, Amatniek JC, Ferrari MD, Gross M. Migraine: identifying and removing barriers to care. Neurology 1994;44(6 suppl 4):S63-8.
8. Devers KJ. How will we know “good” qualitative research when we see it? Health Serv Res 1999;34(5 pt 2):1153-88.
9. Hurley RE. Qualitative research and the profound grasp of the obvious. Health Serv Res 1999;34(5 pt 2):1119-36.
10. Sofaer S. Qualitative methods: what are they and why use them? Health Serv Res 1999;34(5 pt 2):1101-18.
11. Murphy B, Murphy M. Focus groups in health research. HP J Aust 1992;2:37-40.
12. Solomon GD, Slobieranda FG, Gregg L. Quality of life and wellbeing of headache patients: measurement by the Medical Outcomes Study Instrument. Headache 1993;33:351-8.
13. Smith R. Impact of migraine on the family. Headache 1998;38:423-26.
14. Osterhaus JT, Townsend RJ. The quality of life of migraineurs: a cross-sectional profile. Cephalalgia 1991;11(suppl):103-4.
15. Lipton RB, Stewart WF, Von Korff M. Migraine impact and functional disability. Cephalalgia 1995;15:4-9.
16. Stang PE, Osterhaus JT. Impact of migraine in the United States: data from the National Health Interview Survey. Headache 1993;33:29-35.
17. Essink-Bot ML, van Royen L, Krabbe P, Bonsel GJ, Rutten FF. The impact of migraine on health status. Headache 1995;35:200-6.
18. Dahlof C, Dimenais E. Migraine patients experience poorer subjective well-being/quality of life even between attacks. Cephalalgia 1995;15:31-6.
19. Dahlof C. Assessment of health-related quality of life in migraine. Cephalalgia 1993;13:233-7.
20. Kryst S, Scherl E. A population-based survey of the social and personal impact of headache. Headache 1994;34:344-50.
21. MacGregor EA. The doctor and the migraine patient: improving compliance. Neurology 1997;48(suppl 3):S16-S20.
22. Taylor D, Dower C. Toward a women-centered health care system: Women’s experiences, women’s voices, women’s needs. Health Care Women Int 1997;18:407-22.
23. Byles JE, Hanrahan PF, Schofield MJ. “It would be good to know you’re not alone”: the health care needs of women with menstrual symptoms. Fam Pract 1997;14:249-54.
24. Holroyd KA, Stensland M, Lipchik GL, Hill KR, O’Donnell FJ, Cordingley G. Psychosocial correlates and impact of chronic tension-type headaches. Headache 2000;40:3-16.
25. Blau J, MacGregor EA. Migraine consultations: a triangle of viewpoints. Headache 1995;35:104-6.
26. Packard R. What does the headache patient want? Headache 1979;19:370-4.
27. Gauthier JG, Carrier S. Long-term effects of biofeedback on migraine headache: a prospective follow-up study. Headache 1991;31:605-12.
OBJECTIVE: This study’s purpose was to identify the areas that people find most difficult in living with migraines and, in that regard, what kinds of assistance would be most helpful to them and to other people who have migraine headaches.
STUDY DESIGN: Four focus groups, each consisting of 4 to 8 participants, were held. Discussions, which were recorded and organized according to category and theme, focused on problems in living with migraines and effective treatment of migraines.
POPULATION: Participants were 24 people who had been experiencing 1 to 2 migraines a month, each lasting 1 to 2 days, for at least 6 months.
RESULTS: Five themes emerged: (1) impact on family, (2) misunderstanding by others, (3) effect on work, (4) physician care issues, and (5) issues related to medical insurance and drug companies. A majority of participants identified early treatment as the most important consideration for new migraine sufferers. Many participants preferred to have a relationship with their physicians in which they developed a treatment plan together rather than receiving generic educational materials.
CONCLUSIONS: Results suggest that patients are interested in understanding their migraines and securing relevant information in addition to obtaining pain relief. Patients desired collaborative relationships with their physicians and a team approach to treatment. Suggestions for physicians who treat patients who have migraines are reviewed.
- Migraine sufferers said they would prefer a collaborative relationship with their physician and a team approach to therapy.
- Patients reported that they often felt dismissed by their physicians, frustrated by insurance and drug companies, and misunderstood by their loved ones.
- Participants said early treatment of migraine headaches should be emphasized for new migraine patients.
Twenty-five to 30 million people in the United States have migraine headaches. Of these, approximately 11 million are moderately to severely disabled by their attacks,1-4 resulting in significant lost labor costs,5 substantial health care expenses,6 and a pervasive negative impact on overall quality of life.
Although migraine is a highly treatable disorder, almost one half of people who have migraines are not currently under the care of a physician for that condition.7 Further, data from the American Migraine Study II, sponsored by the National Headache Foundation, show that those who have received a diagnosis suffer at a level similar to that of those who have not. This finding suggests that effective migraine management depends not only on diagnosis but also on ongoing treatment. The opportunity exists to reduce the indirect costs, disability, and impairment associated with this disorder. However, the primary care physician has a pivotal role in the management of migraine.
The aim of this study was to identify: (1) the areas that people who have migraines consider most problematic in living with their headaches and (2) the types of physician assistance they believe would be most helpful in managing this disorder.
Methods
This exploratory study used a focus group format to identify topics of concern to people with migraine. Although this format has inherent limitations, its use in health science research has gained considerable acceptance in recent years.8-10 Focus groups are recognized for their ability to identify issues of the greatest importance to individuals.11
The Institutional Review Board of Ohio University, Athens, Ohio, approved all procedures used in this study. Names of potential participants were obtained from a list of people who had responded to community-wide advertisements recruiting subjects for a separate headache study conducted by 2 of the authors (K.A.H. and F.J.O.). Telephone screenings were reviewed to identify those with 2 to 8 migraine days per month by self-report. Of the 59 patients contacted, 24 attended a focus group. (The remainder did not meet criteria, were uninterested, or had transportation or scheduling difficulties.) Two thirds of the sample had 1 to 3 migraines per month. The remainder of the sample experienced more frequent migraines. Every participant met International Headache Society criteria for migraine with or without aura and had migraine as the primary headache diagnosis. Only 2 patients indicated a history of occasional tension-type headaches. All had consulted a physician about their headaches, with 60% presenting to their primary care physician exclusively and the remaining 40% consulting a neurologist at some point. Attendees were given a $30 incentive for their participation.
The groups were conducted by a moderator (C.K.C.) and an assistant (S.E.W.) using an interview guide. Eight questions were addressed during each meeting: (1) What is the biggest problem you have encountered in trying to manage your migraines? (2) What is the most important lesson that you have learned in trying to manage your migraines? (3) Where did you get your ideas regarding how to manage your migraine headaches? (4) Where and how do you think would be the best way to get information? (5) What types of information or skills do you think would be most useful to you and others for managing migraines? (6) (Of the information gathered) what topics do you think are most important? (7) If topics had to be eliminated, which ones could go? and (8) What other advice do you have for us?
The moderator elicited comments from quieter participants by specifically inviting their views on discussion topics. To prevent the opinions of especially verbal participants from receiving undue attention, the moderator probed for differing experiences from other group members. Each discussion took approximately 2 hours.
All sessions were audiotaped and transcribed. Transcripts were read independently by 2 of the authors (C.K.C. and S.E.W.), who arranged comments into categories and themes. Disagreements were resolved by mutual agreement and validated by 2 other authors (K.A.H. and F.J.O.). Typical statements were selected for inclusion in this report.
Results
Participants’ comments on migraine management fell into 6 primary categories. Representative comments are provided in Table 1.
TABLE 1
IMPACT ON DAILY LIFE
| Impact on family |
| “I’m not the mom I wanted to be. I’m short-tempered, and I don’t like that. They [family members] all try to leave the house [when I have a migraine].” |
| “Being at home, I pretty much run the show. So if I’m not up and going, the show’s not going. The show shuts down.” |
| Impact on social activities |
| “Gradually, things are taken away from you. Like you can’t even walk down the street on a sunny day because the sun will give you a headache.” |
| Impact on relationships |
| “I think people look at you like, ‘Yeah, right, everybody has headaches. They’re not that bad; just get a grip and keep going.’” |
| Impact on work |
| “I always stay at work [when I have a migraine]. I try to look productive, but I’m only doing half. You get a reaction if you tell [coworkers]. After about the fourth headache in 2 months, they just don’t buy it.” |
Effect on Social Functioning
Group discussions indicated that all aspects of social and recreational activities were hampered by migraines. In particular, avoiding food triggers was reported to be difficult because in some situations, there was no way to determine whether the food had been prepared with additives that might trigger a headache. This was an especially difficult barrier because food often plays a central role in social activities.
Effect on family functioning
Although participants regretted, and sometimes resented, being unable to participate in social activities because of their migraines, the effect on family, particularly children, was especially troublesome. Many participants felt they were less available and less understanding as parents as a result of migraine-induced irritability, feeling emotionally and physically drained for days after a migraine, and feeling “drugged” from taking medications.
Further, being forced to place restrictions on their children’s activities left many parents feeling that they and their children had been “cheated” by the migraines. Many participants expressed guilt about their inability to prepare meals, help with homework, or complete other routine household chores. Finally, some were frightened at the possibility that they might have a migraine when away from home but still retain responsibility for caring for the children. Both the migraine itself and the medication used to treat it left many feeling they should not drive, even when they had no alternative.
Effect on work
The predominant emotions evident during discussions of job functioning were fear and guilt. Most participants expressed apprehension about the possibility of losing their jobs if they missed work because of their migraines. Those who went home with a migraine reported lost pay or fewer vacation or personal days to enjoy when feeling well. Thus, participants reported often trying to “just keep going” in spite of the headaches. These efforts contributed to lost productivity, feelings of guilt for not carrying a fair share of the workload, and, in some cases, decreased pay because of failure to meet job quotas.
Effect on relationships
Participants’ comments suggest that others’ reactions to migraines are associated with shame, anger, and frustration. Most participants verbalized an unwillingness to tell others when they were experiencing a migraine, reporting that people were unsympathetic. The consensus was that most people dismissed migraines as insignificant and “think you’re embellishing it.”
Issues related to physician care
Some group members were happy with the medical care they received. Identified as important behaviors were a physician’s willingness to consider alternative treatments, to “sit down and listen,” and to “pull out a book and look it up.” However, significant frustration related to medical care was evident as well (Table 2). The most emotionally laden issue in this category was the feeling of being “dismissed” by physicians who did not appear to take complaints of headache pain seriously. Some participants reported that they had endured years of frequent migraines since allegedly being told to “live with it” by a physician.
The majority of group members perceived that they had to take responsibility for researching new treatment options, including medications and alternative therapies, and to take suggestions to their physicians. Some, especially women considering pregnancy, were dissatisfied with a perceived emphasis on drug therapy. Many participants were concerned about possible long-term complications from taking potent medications and believed that their health care providers addressed their concerns inadequately.
TABLE 2
ISSUES RELATED TO CARE
| Physicians’ failure to take migraines seriously |
| “I remember the first doctor I went to. He said, ‘Oh, just take a couple of Tylenol and go on with it.’” |
| Desire for referral |
| “When you go to a clinic and they can’t help you, it’s like you’ve fallen off the face of the earth. Where do you go from there?” |
| Undesirable focus on medications |
| “I don’t want to be on a bunch of drugs. But they’re not willing to do anything else. If you can’t treat it with a chemical, you can’t treat it. Forget it!” |
| “I worry about getting pregnant. I’d like to make sure I have a healthy baby, so I don’t want to pollute myself. What if I’m already pregnant? Should I take a pregnancy test before I take my [name of drug]?” |
| Issues with drug companies |
| “I can’t afford to pay $75 to treat a headache, so sometimes I go without the medication. I only use it if it’s a severe one with the nausea and the vomiting.” |
Problems with insurance and drug companies
A great number of participants expressed anger with insurance and drug companies, viewing them as barriers to effective treatment. They were frustrated by “the bureaucrats” in managed care companies who mandated their choices of physicians and medications. This situation was particularly infuriating for those who had spent significant time and effort finding a physician with whom they felt comfortable or a medication that worked for them, only to be told that because of a change in insurance coverage, they had to change physicians, medications, or both. The primary complaint about pharmaceutical companies was the steep cost of medication.
Discussion
It is important to note this study’s limitations. The focus group format is an effective method for soliciting issues of greatest importance to the individuals in attendance, but does not provide information on the prevalence of those opinions in the population. Because patients experiencing up to 8 migraine days per month were included in the study, our sample may have included those who had obtained insufficient relief from treatment and were, therefore, dissatisfied with that treatment. The information provided in the discussions may have been influenced by the fact that individuals who volunteer to participate are likely to have different views from those who do not participate in such groups. The small sample size limits the authors’ ability to generalize about these findings. Thus, the experiences and views reported here cannot be considered representative of all migraine sufferers. Finally, patients report interactions with physicians as they remember them. In some cases, their recollections may not reflect the true nature of the interactions.
Nonetheless, these participants resemble the migraine sufferers most likely to seek headache treatment. The typical participant in this study, a white female aged 25 to 49 years who experiences 1 to 2 migraines per month, each lasting 1 to 2 days, is a counterpart to the migraine patient seen in the primary care setting. In fact, 60% of participants had consulted only in the primary care setting. Thus, the experiences and opinions reported here might be typical of migraine patients who present management difficulties for primary care physicians. Being aware of these patients’ concerns may help physicians provide more effective treatment and improve patient satisfaction.
Focus group members reported migraine-related concerns across a range of life experiences. These concerns can be divided into 2 primary categories: (1) impact of migraines on daily functioning and (2) perceived barriers to effective care.
The impact of migraines on quality of life has been well documented.2,5,12-20 Previous studies have shown that the bodily pain, nausea, and vomiting that occur during attacks result in impairments in job and role functioning.20 Migraines have also been shown to interfere with family and with social and recreational activities5—resulting in less pleasure in life and less energy between attacks—and to disturb sleep.18
Many of the problems of daily life that are encountered in experiencing frequent migraines, as reported by study participants, result from perceived barriers to treatment. Lipton and colleagues7 described 3 levels on which barriers occur: the failure of migraine sufferers to consult physicians, failure to receive correct diagnoses in those who do consult physicians, and failure of correctly diagnosed patients to receive effective therapy.
Participants’ comments reveal a fourth level on which barriers to effective migraine management can occur: correctly diagnosed consulters for whom effective treatment has been prescribed but who are unable or unwilling to implement the prescribed treatment. Among focus group participants were individuals who had consulted a physician, received the correct diagnosis, and obtained what is generally accepted as effective treatment. Yet some experienced difficulty in implementing that treatment.
Comments by group members indicate several factors that can interfere with a patient’s ability to follow treatment recommendations. For example, avoiding known dietary triggers by consistently identifying preservatives and additives used in food preparation can be arduous. In addition, the high cost of abortive medications may make it difficult, and in some cases impossible, for patients to buy such medications, especially if they do not have prescription insurance coverage. Insurance companies’ limits on the types and amount of medication covered and on which physicians a subscriber may see can also interfere with effective migraine management. In addition, behavior patterns among migraine sufferers may interfere with obtaining effective therapy. Examples included patients’ reports of their reluctance to “accept that the migraine is coming” and take the necessary steps to ward it off.
Finally, participants indicated that dissatisfaction with the perceived attitude of their physicians had contributed to their lack of treatment follow-through. Attendees reported a perception that some physicians do not understand their problem or take it seriously. These findings are consistent with those of a previous study with migraine patients,21 as well as studies with other health care consumers, both healthy and ill.22,23
Recurring themes of fear, anger, and frustration were associated with both the impairments in quality of life and perceived barriers to effective care. However, while participants were eager to discuss the pain, functional disability, and management problems associated with migraines, they denied emotional distress. This denial is surprising, considering the emotional charge obvious in many of their statements (eg, “I’m not the mom I wanted to be,” “I feel like I’m letting everybody down”) and the important role that emotional distress plays in chronic tension-type headaches.24 Possibly participants did not differentiate emotional distress from the physical disability caused by migraines or were inclined to emphasize pain and disability but minimize emotional reactions in an effort to legitimize frequent migraines as a serious medical problem.
Participants’ comments suggest interventions that could be taken by physicians to improve their understanding of patients’ headaches and needs and to develop the collaborative relationship that people who have migraines appear to desire.
First, physician behavior in response to migraine concerns is important. Patients want their physicians to indicate that they are listening and taking their concerns seriously before offering treatment. One means of indicating understanding is to reflect the concerns that the patient has expressed (eg, “It sounds as if these headaches are really interfering with your daily life, your work, and taking care of your children”) and to ask the patient what he or she expects treatment to achieve. Such an exchange could initiate a mutually beneficial collaborative relationship: The patient feels understood and heard while the physician gains a better understanding of what the patient desires in treatment. Ultimately, the result may be greater success with therapy.
Physicians should listen for clues related to the severity and impact of headaches on patients’ lives. A patient’s complaint of “headaches” might inadvertently be dismissed unless the physician determines whether the headaches are actually migraines and the extent to which they interfere with daily life.
Consistent with other findings,25,26 the patients in this study seemed to be as interested in being offered the time to ask questions about headaches and medications as they were in obtaining pain relief. Some people who have migraines need general information about migraines and migraine management. Maintaining brochures from the National Headache Foundation, the American Council for Headache Education, or the American Headache Society in waiting rooms and directing patients to these resources may be helpful. However, generic information is merely a first step in meeting patients’ needs. Periodically reviewing the patient’s headache diary with an eye for patterns, possible triggers, and responses to treatment can provide the basis for a specific, individualized migraine management plan.
Providing abortive drug samples so that patients can determine whether a medication is effective and tolerable before paying the high cost of a prescription is extremely helpful for many people, especially those without prescription insurance coverage. Participants in this study and others21,22,27 also want physicians to maintain an open mind with regard to complementary and alternative treatments for migraine. This is especially the case for women in their reproductive or child-rearing years, who may be concerned about the side effects and risks of medications.
Time constraints may make these ideas difficult to implement. Migraine patients may require a longer appointment or may need a second appointment if the complaint is voiced as an afterthought during an unrelated visit. Working as a team, however, the physician and patient can do a great deal to reduce the disability and cost associated with migraines.
The understanding of migraines and the availability of tools to aid in their treatment have increased considerably in recent years, particularly with the advent of the Internet (Table 3). This information is useful only when both physician and patient are involved. Future studies should focus on developing a greater understanding of barriers to effective migraine management and efforts to eliminate them.
TABLE 3
SELECTED INTERNET RESOURCES FOR MIGRAINE MANAGEMENT
| Evidence-based guidelines for migraine headache, American Academy of Neurology Web site |
| http://www.aan.com/public/practiceguidelines/01.pdf |
| American Council for Headache Education (ACHE) |
| www.achenet.org |
| National Headache Foundation (NHF) |
| www.headaches.org |
Conclusions
Results of this focus group study suggest that people are interested in understanding their migraines and securing relevant information about it as well as in obtaining pain relief. Participants desired collaborative relationships with their physicians and wanted a team approach to treatment that involved both physician and patient.
1. Lipton RB, Stewart WF. Epidemiology and comorbidity of migraine. In: Goadsby PJ, Silberstein SD, eds. Headache. Boston, Mass: Butterworth-Heinemann; 1997;75-96
2. Osterhaus JT, Townsend RJ, Gandek B, Ware JE, Jr. Measuring the functional status and well-being of patients with migraine headache. Headache 1994;34:337-43.
3. Stewart WF, Lipton RB. Migraine headache: epidemiology and health care utilization. Cephalalgia 1993;13(suppl 12):41-6.
4. Stewart WF, Shechter A, Rasmussen BK. Migraine prevalence: a review of population-based studies. Neurology 1994;44(suppl 4):S17-S23.
5. Stewart WF, Lipton RB, Simon D. Work-related disability: results from the American Migraine Study. Cephalalgia 1996;16:231-8.
6. Osterhaus JT, Gutterman DL, Plachetka JR. Healthcare resource and lost labour costs of migraine headache in the US. Pharmacoeconomics 1992;2:67-76.
7. Lipton RB, Amatniek JC, Ferrari MD, Gross M. Migraine: identifying and removing barriers to care. Neurology 1994;44(6 suppl 4):S63-8.
8. Devers KJ. How will we know “good” qualitative research when we see it? Health Serv Res 1999;34(5 pt 2):1153-88.
9. Hurley RE. Qualitative research and the profound grasp of the obvious. Health Serv Res 1999;34(5 pt 2):1119-36.
10. Sofaer S. Qualitative methods: what are they and why use them? Health Serv Res 1999;34(5 pt 2):1101-18.
11. Murphy B, Murphy M. Focus groups in health research. HP J Aust 1992;2:37-40.
12. Solomon GD, Slobieranda FG, Gregg L. Quality of life and wellbeing of headache patients: measurement by the Medical Outcomes Study Instrument. Headache 1993;33:351-8.
13. Smith R. Impact of migraine on the family. Headache 1998;38:423-26.
14. Osterhaus JT, Townsend RJ. The quality of life of migraineurs: a cross-sectional profile. Cephalalgia 1991;11(suppl):103-4.
15. Lipton RB, Stewart WF, Von Korff M. Migraine impact and functional disability. Cephalalgia 1995;15:4-9.
16. Stang PE, Osterhaus JT. Impact of migraine in the United States: data from the National Health Interview Survey. Headache 1993;33:29-35.
17. Essink-Bot ML, van Royen L, Krabbe P, Bonsel GJ, Rutten FF. The impact of migraine on health status. Headache 1995;35:200-6.
18. Dahlof C, Dimenais E. Migraine patients experience poorer subjective well-being/quality of life even between attacks. Cephalalgia 1995;15:31-6.
19. Dahlof C. Assessment of health-related quality of life in migraine. Cephalalgia 1993;13:233-7.
20. Kryst S, Scherl E. A population-based survey of the social and personal impact of headache. Headache 1994;34:344-50.
21. MacGregor EA. The doctor and the migraine patient: improving compliance. Neurology 1997;48(suppl 3):S16-S20.
22. Taylor D, Dower C. Toward a women-centered health care system: Women’s experiences, women’s voices, women’s needs. Health Care Women Int 1997;18:407-22.
23. Byles JE, Hanrahan PF, Schofield MJ. “It would be good to know you’re not alone”: the health care needs of women with menstrual symptoms. Fam Pract 1997;14:249-54.
24. Holroyd KA, Stensland M, Lipchik GL, Hill KR, O’Donnell FJ, Cordingley G. Psychosocial correlates and impact of chronic tension-type headaches. Headache 2000;40:3-16.
25. Blau J, MacGregor EA. Migraine consultations: a triangle of viewpoints. Headache 1995;35:104-6.
26. Packard R. What does the headache patient want? Headache 1979;19:370-4.
27. Gauthier JG, Carrier S. Long-term effects of biofeedback on migraine headache: a prospective follow-up study. Headache 1991;31:605-12.
Diagnosis and 10-Year Follow-Up Of a Community-Based Hepatitis C Cohort
OBJECTIVE: To determine the health care follow-up and treatment associated with physician-diagnosed hepatitis C (HCV) in a community-based population.
STUDY DESIGN: We conducted a retrospective medical record review using records from all providers in Olmsted County, Minnesota.
POPULATION: The study incorporated all Olmsted County residents with physician-diagnosed hepatitis C from 1990 through 1999.
OUTCOMES MEASURED: We assessed demographic and health status information as well as health services use in subjects with physician-diagnosed HCV.
RESULTS: Physicians diagnosed hepatitis C in 355 subjects (219 men [62%], 136 women [38%]), mean age 43 years, in the 10-year period studied. About half of diagnoses (45%, n = 159) were confirmed with polymerase chain reaction or liver biopsies. Identified risk factors included IV drug use (50%), multiple sex partners (36%), and blood transfusion (30%). Follow-up assessment with aspartate aminotransferase/amino alanine transferase (AST/ALT) tests occurred in about half (49%) of subjects, while 202 subjects (60%) were referred for gastrointestinal (GI) specialist evaluation and 49 patients (14% of all, 25% of those referred to a GI specialist) had specific treatment for hepatitis C. Although well over half of patients (60%) had possible contraindications to HCV treatment, including heavy alcohol use, few were referred for chemical dependency therapy.
CONCLUSIONS: In this community, follow-up and treatment related to HCV were limited. Attention to prevention of disease-accelerating coinfections was only modest. Referral or documented recommendations for treatment of alcoholism or heavy chronic alcohol ingestion were minimal.
- Risk factors associated with acquiring hepatitis C in this small city are similar to those in urban areas: intravenous drug use, frequent sexual exposure, and blood transfusion before 1992.
- No follow-up of liver testing in people with known hepatitis C occurred in half of cases.
- Less than 15% of prevalent cases received hepatitis C–specific treatment; many people appeared to have contraindications for hepatitis C therapy.
- Preventive care measures appropriate for people with hepatitis C (eg, hepatitis B immunization, referral for treatment of known chemical dependency, and screening for HIV) were not universal in this population.
Hepatitis C is reportedly the most common chronic bloodborne infectious disease in the United States.1-3 Prevalence data based on modeling studies and extrapolation from studies such as the National Health and Nutrition Examination Survey (NHANES) and county surveillance projects3,4 report that 3.9 million Americans (1.8%) have been infected with the hepatitis C virus (HCV) and 2.7 million (1.2%) have chronic HCV infection.5 While the natural history of HCV infections is poorly understood,6-9 researchers and clinicians agree that most people with chronic HCV infection remain asymptomatic for many years while seeking medical care, often primary care, for problems other than their silent hepatitis C infections.8,9
Much of the hepatitis C literature is derived from studies of subspecialty clinic patient populations or other special populations such as those with blood transfusion or RhoGAM-acquired hepatitis C.9-12 The former data tend to concentrate on the more severe, symptomatic patients referred to specialty care, whereas the latter special-exposure groups provide little information about a large segment of the population with other risk factors and comorbidity. Neither of these sources provides data on the community population or community practice.1,9,11 Our study describes the people that have been diagnosed with HCV in a geographically defined community, including their physician-directed hepatitis C follow-up evaluations and HCV treatment. In addition, we report on testing and vaccination efforts for hepatitis A and B and on the recognition and treatment of alcoholism and chronic heavy alcohol ingestion (accelerating comorbidities). The ability to follow the patient across all types of care from ambulatory to inpatient and from primary to tertiary care provides a very broad overview of these population-based cases.
Methods
Study setting and instrument
This is a descriptive study of a geographically defined, population-based cohort of all persons living in Olmsted County, Minnesota, who received a physician or laboratory diagnosis of hepatitis C from January 1, 1990, through December 31, 1999. All physician diagnoses were captured using a communitywide diagnostic database, the Rochester Epidemiology Project.13,14 Olmsted County is a metropolitan statistical area that includes the city of Rochester and is served primarily by more than 200 primary care physicians employed by 2 medical facilities, the Olmsted Medical Center and the Mayo Clinic.
All patients with a physician diagnosis of hepatitis C were included, whether the diagnosis had been confirmed by liver biopsy or polymerase chain reaction (PCR) testing or by either positive recombinant immunoblast assay (RIBA) testing or indeterminate RIBA testing and the presence of 1 or more risk factors. Risk factors included blood transfusion before July 1,1992, a diagnosis of hemophilia before 1990, a history of intravenous drug use (IDU), selling sex or trading sex for drugs, having more than 10 sex partners, sexual exposure to a person infected with HCV, intranasal cocaine use, and work in a health care facility with exposure to blood products (eg, phlebotomists) or health care workers with a history of needlesticks. The immigration status of people from Africa or Southeast Asia, where hepatitis C is endemic, is reported when the medical record listed immigration as an HCV risk factor. Patients with acute hepatitis C, defined as those with acute symptoms at the time of diagnosis (N = 4), were included.
Only people who were residents of Olmsted County for at least 1 year before being diagnosed with hepatitis C are included. This step was necessary to ensure that all subjects were community members. Besides its large liver transplantation service, Olmsted County has several inpatient and outpatient chemical dependency treatment programs and halfway houses that may bring patients with hepatitis C to the community for short periods of time. Inclusion of these people would have skewed the community-based focus of the study. Prisoners incarcerated in local facilities were excluded as well.
Measures
For each subject in the cohort, we reviewed all medical records from the Mayo Clinic and hospitals, the Olmsted Medical Center and hospital, and all other care providers in the county. Data collected included information on the initial diagnostic process as well as on HCV-related follow-up; specifically, all aspartate aminotransferase/amino alanine transferase (AST/ALT) testing and all HCV treatment given. All diagnoses of cirrhosis, ascites, gastrointestinal (GI) bleeding, encephalopathy, jaundice, and hepatocellular carcinoma were recorded. Data on risk factors as well as on comorbid conditions believed to influence the progression of HCV-related liver disease (eg, alcoholism, chronic heavy alcohol ingestion, hepatitis B, and HIV disease) were noted.
Data analysis
We summarized demographic information and data on risk factors, comorbid conditions, the pattern of laboratory test follow-up, and HCV treatment and, when appropriate, stratified these data by date of diagnosis. We used logistic regression models to look for associations among personal, demographic, and clinical factors associated with continued AST/ALT follow-up 1 or more years after initial HCV diagnosis.
Results
Of the 355 subjects with a diagnosis of hepatitis C between January 1, 1990, and December 31, 1999, 136 (38%) were women and 219 (62%) were men. The mean age at diagnosis was 42.6 years (Figure 1). The rate of new diagnoses of hepatitis C varied only slightly by year (Figure 2). After the period 1990–92, when HCV testing first became available, the difference in rates of new diagnoses is not statistically significant.
Complete follow-up data from the date of diagnosis until December 31, 1999, or the subject’s death were available in 78% of subjects with mean follow-up of 3.6 years, median 3.0 years, and range 0 to 9.8 years. Other subjects were lost to follow-up after they moved from the community; however, vital status (dead or alive) was obtained in 85% of all subjects as of January 1, 2000.
IDU was documented in 177 cases (50% of subjects) (Table 1) with the mean duration of 9.6 years (SD 7.9 years, range single use to 34 years). A single risk factor was recorded for 89 subjects (69 who had had a blood transfusion before 1992 and 20 health care workers with possible exposure to blood products or body fluids, including 5 with documented needlesticks). Sexual exposure and IDU were frequent coexisting risk factors.
All subjects had a positive anti-hepatitis C antibody test; 304 (86%) had a positive RIBA; 13 (4%) had an indeterminate RIBA with risk factors; 14 (3.9%) had PCR tests used in the diagnostic process; and the rest (n = 24) had only positive serology plus risk factors. Overall, 202 people (60%) were seen by a GI or hepatology specialist at least once after the diagnosis of HCV had been made. Confirmatory liver biopsies or PCR tests were used at some time in the follow-up of 157 subjects (44%), usually before the consideration of treatment or after referral to a hepatologist.
Among subjects, 21 (no gender differences) had hepatic decompensation, defined as cirrhosis with ascites, encephalopathy, or jaundice, or hepatocellular carcinoma identified either before or within 1 month of the hepatitis C diagnosis. These findings suggest that HCV evaluation was based on the presence of advanced liver disease. Thirty-seven (10%) of the patients, including 5 who died within days to weeks of the initial HCV diagnosis, died during the observation period.
At or around the time (±1 month) of diagnosis, serum albumin (n = 215, 61%), bilirubin (n = 265, 75%), and ALT or AST (n = 308, 87%) tests were commonly done. Albumin and bilirubin levels were normal in almost all cases (99% and 85%, respectively). The majority of the initial serum ALT/AST levels were elevated (262/308, 85%). Although the elevation was often modest, levels of 119 of the 246 initial tests (48%) were less than 2 times the upper limit of normal.
Follow-up of initial AST/ALT testing was not universal. Among subjects, 51% had one or more rechecks of liver function tests (LFTs) during the first year after diagnosis; 55%, 1 to 2 years after diagnosis; 56%, 2 to 3 years after diagnosis; and 45%, 3 to 4 years after diagnosis, based on the number of subjects not lost to follow-up for 1 to 4 years. Some subjects lost to hepatitis C follow-up had periods of active alcohol or drug abuse that appeared to disrupt hepatitis C care. Variations in rates of continued monitoring of AST/ALT, however, were not associated with risk factors such as IDU or transfusion nor with demographic factors such as age. Long-term follow-up (3 to 4 years after diagnosis) was associated with AST/ALT levels more than 2 times normal at diagnosis (P = .03) and a diagnosis of cirrhosis (P= .03). Women were more likely to have a repeat evaluation in the first year, but no gender differences were seen after that.
During the period of observation, which ended December 31, 1999, 49 subjects (14%) received interferon treatment specifically for their hepatitis C. Half of subjects (n = 25) received that treatment during clinical trials. Twenty people (12 in clinical trials) received ribavirin in addition to interferon; 1 received interferon and interleukin.
Many of the other 306 subjects had 1 or more documented contraindications to HCV therapy (Table 2). The 53 instances of chemical dependency may underestimate the effect of chronic alcohol ingestion on decisions not to treat, since among the 355 subjects, documentation of chronic heavy alcohol consumption (>6 drinks/day) was listed in the medical records of 182 (51%). The total number of subjects with one or more conditions that might be considered contraindications to therapy was 225 (63%). Although only a few of these contraindications were permanent conditions (eg, vegetative state) (Table 2), no subjects had a repeat reference to treatment after the documented condition (eg, depression) had resolved or improved.
Information on potentially accelerating comorbid conditions was available in many charts (ie, those of 11 subjects with known HIV infection). No HIV testing was documented, however, in 55 people who had HCV risk factors other than blood transfusion. Five people had documented chronic HBV infections (surface antigen positive). HBV screening was almost universal. Yet 159 subjects were not immune (including no documented HBV immunizations), and of these, 108 had HCV risk factors other than transfusion before 1992 and were therefore eligible for HBV immunization. Hepatitis A vaccination is now recommended for all nonimmune HCV patients,5 but immunization for hepatitis A was documented for only 25 subjects.
TABLE 1
RISK FACTORS NOTED AT DIAGNOSTIC VISIT
| Risk Factor | No. of Patients (%) (N=355) |
|---|---|
| History of intravenous drug use | 177 (50%) |
| Sexual exposure | 128 (36%) |
| Immigrant | 47 (13%) |
| Tattoos | 60 (17%) |
| History of blood transfusion | 107 (30%) |
| Occupational risks | 44 (12%) |
TABLE 2
REASONS DOCUMENTED FOR NOT RECEIVING TREATMENT
| Reason | No. of Patients (%) (N=306) |
|---|---|
| No reason stated | 81 (26%) |
| Chemical dependency | 53 (17%) |
| Comorbid condition | 28 (9%) |
| Refused/noncompliant | 44 (14%) |
| Age | 13 (4%) |
| Ineligible | 22 (7%)* |
| Depression | 25 (8%) |
| Psychiatric condition | 4 (1%) |
| Desired pregnancy | 5 (2%) |
| Cirrhosis | 6 (2%) |
| Hepatocellular carcinoma | 8 (3%) |
| HIV treatment | 7 (2%) |
| No insurance | 6 (1%) |
| No trial available | 4 (1%) |
| *Ineligible because of advanced liver disease or other terminal illness. | |
FIGURE 1
AGE AT DIAGNOSIS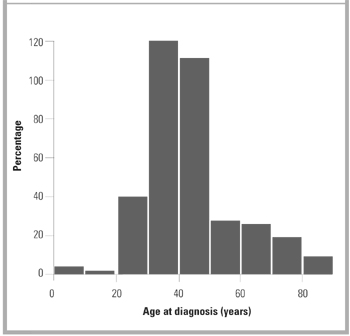
FIGURE 2
NUMBER OF NEW DIAGNOSES PER YEAR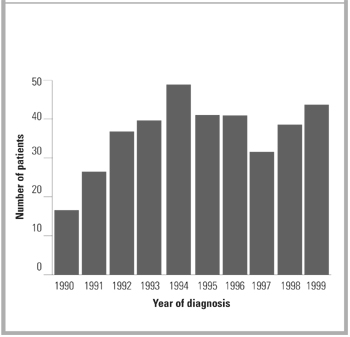
Discussion
Hepatitis C was an uncommon new diagnosis in Olmsted County and therefore not a frequent occurrence in the practice of any of the 200 primary care physicians in the community. Although the overall prevalence of hepatitis C was only about 25% of that reported for the Midwestern United States (1.3%),3,4 the ratio of men and women diagnosed with HCV and the distribution of recorded risk factors in our cohort are similar to those reported from the NHANES conducted in 1988 to 19944 and to those in other population-based studies.5,15-17
In this cohort, primary care physicians’ response to known HCV varied from occasional monitoring of AST/ALT tests to referral for specialty evaluation and HCV treatment. In a significant group of patients, no visits for HCV follow-up could be identified. The only other published data on primary care physicians’ follow-up care of patients with known HCV was self-report survey data.18 In response to a survey, primary care physicians reported they ordered yearly AST/ALT tests in all HCV patients and referred over 80% of people with known HCV to hepatologists. Self-reported care often overestimates the amount of care provided. This difference in reported and observed care emphasizes the importance of data on actual practice.
The community physicians’ lack of a uniform or aggressive approach to HCV infections may not be surprising in view of the wide disparity of available information on chronic HCV infection and its progression to symptomatic or progressive liver dis-ease.18 For example, published rates of progression to “chronic infection” after exposure vary from 85% of people receiving HCV-infected blood transfusions to 20% of women given HCV-contaminated RhoGAM.9 Even rates of progression in people with persistent viremia (+PCR) vary from 69 % to 88%.19 Unfortunately, progression to chronic HCV infection cannot be predicted from initial clinical or laboratory factors.20 In addition, the meaning of “chronic infection” is unclear.19 Reported rates of progression from chronic infection to cirrhosis are widely divergent and appear related to the type of group used to make predictions. Data from meta-analyses of clinical trial patients21 suggest progression rates of up to 69% in 30 years. Yet only 2.4% to 6% of community-based hepatitis C patients may develop cirrhosis after 17 to 40 years of follow-up.22,23
Wide variations in the progression of cirrhosis to decompensated cirrhosis have been reported.24 Studies of AST levels in people with known HCV show fluctuations over time, dispelling the idea that once elevated, AST or ALT will remain elevated or that AST levels are directly predictive of progression or resolution of liver injury or viral loads.25,26 Chronically elevated AST/ALT levels, however, have been shown to predict progression,27 making monitoring of AST/ALT important in all subjects.5,28
That HCV treatment was uncommon in this population may reflect the limited efficacy of single-agent therapy before 1998, as well as the large proportion of subjects with contraindications to therapy, primary care physician confusion regarding who should be treated, and current limited knowledge of the long-term outcomes of treatment.29 Cure rates are unknown and measures of cure are unclear, since clearing the virus from the bloodstream (negative PCR) may not confirm clearing of the virus from the liver.29 All these data together provide little experimental evidence for a standard set of recommendations for follow-up, nor do they support a clear rationale for the use of those follow-up data in determining HCV progression. The existing data have been used to develop consensus (expert opinion–based) guidelines published by NIH (1997)28 and CDC (1998,30 with an update in the summer of 2001). The substance of those consensus statements has changed over time5,28 as experts’ experience has increased and newer observations have become available. Recent changes in available treatments31-33 and FDA approval of a pegylated inferferon34,35 are likely to keep recommendations in flux for the near future.
The limited attention given to the identification, prevention, or treatment of comorbid accelerating conditions (HIV, HBV, HAV, and heavy alcohol intake)5,19,27,36-38 in this cohort is less understandable, since the literature is more consistent on these issues. Documented HIV testing was not universal even in those with a history of IDU or promiscuous sexual exposure. While testing for HBV was almost universal, HBV prevention in the form of vaccination was documented in only about one fourth (23%) of eligible subjects. Immunization for hepatitis A was documented in less than one tenth of subjects. Treatment or documented physician recommendations for treatment of ongoing alcohol abuse or heavy alccohol ingestion occurred in the minority of patients. Studies of combined chemical dependency and HCV therapy might be appropriate in this population.
The Olmsted County population from which the subjects were identified is more than 90% white. Therefore, community-based prevalence rates of physician diagnoses may not be representative of other racial or ethnic groups. The high frequency of drug use and sexual exposure suggests that our community’s problems associated with HCV are similar to those identified in other communities with greater economic, ethnic, and racial diversity. We did not perform PCR, liver biopsy, or yearly liver function tests on all subjects. One aim of our study, however, was to understand community practice and the resulting variations in information and testing completed for each subject. The existence of a large medical education program and the local availability of hepatologists may affect the care provided. Yet even in this setting, additional attention to follow-up of liver disease and comorbid conditions appeared indicated.
Conclusions
Primary care physicians make most diagnoses and perform most initial management of hepatitis C. However, primary care directed long term follow-up care is inconsistent and management of accelerating comorbidities is incomplete. Family physicians can offer important additional services to their patients who have hepatitis C.
1. Centers for Disease Control. Recommendations for prevention and control of hepatitis C virus (HCV) infection and HCV-related chronic disease. Centers for Disease Control and Prevention. MMWR Morb Mortal Wkly Rep 1998;47(No RR-19):1-39.
2. McQuillan G, Alter M, Moyer L, Lambert S, Margolis H. A population-based serologic study of hepatitis C virus infection in the United States. Am J Epidemiol 1996;143(suppl):S32.-
3. Armstrong GL, Alter MJ, McQuillan GM, Margolis HS. The past incidence of hepatitis C virus infection: implications for the future burden of chronic liver disease in the United States. Hepatology 2000;31:777-82.
4. Alter M, Kruszon-Moran D, Nainan OV, et al. The prevalence of hepatitis C virus infection in the United States, 1988 through 1994. N Engl J Med 1999;341:556-62.
5. Management of hepatitis C. NIH Consens Statement Online 1997 Mar 24-26 [cited 2001, July 23]; 15(3):1-41.
6. Takahashi M, Yamada G, Miyamoto R, Doi T, Endo H, Tsuji T. Natural course of chronic hepatitis C. Am J Gastroenterol 1993;88:240-3.
7. Kiyosawa K, Tanaka E, Sodeyama T, Furuta S. Natural history of hepatitis C. Intervirology 1994;37:101-7.
8. Muller R. The natural history of hepatitis C: clinical experiences. J Hepatology 1996;24(suppl 2):52-4.
9. Kenny-Walsh E. Clinical outcomes after hepatitis C infection from contaminated anti-D immune globulin. N Engl J Med 1999;340:1228-33.
10. Tong MJ, El-Farra NS, Reikes AR, Co RL. Clinical outcomes after transfusion-associated hepatitis C. N Engl J Med 1995;332:1463-6.
11. Kaur S, Rybicki L, Bacon BR, Gollan JL, Rustgi VK, Carey WD, and the National Hepatitis Surveillance Group. Performance characteristics and results of a large-scale screening program for viral hepatitis and risk factors associated with exposure to viral hepatitis B and C: results of the National Hepatitis Screening Survey. Hepatology 1996;24:979-86.
12. Makris M, Preston FE, Rosendaal FR, Underwood JCE, Rice KM, Triger DR. The natural history of chronic hepatitis C in haemophiliacs. Br J Haematol 1996;94:746-52.
13. Melton LJ, III. History of the Rochester Epidemiology Project. Mayo Clin Proc 1996;71:266-74.
14. Kurland LT, Molgaard CA. The patient record in epidemiology. Sci Am 1981;245:54-63.
15. Alter MJ. Epidemiology of hepatitis C in the West. Semin Liver Dis 1995;15:5-14.
16. Tillman HL, Manns MP. Mode of hepatitis C virus infection, epidemiology, and chronicity rate in the general population and risk groups. Dig Dis Sci 1996;41(12 suppl):27S-40S.
17. Murphy EL, Bryzman SM, Glynn SA, et al. Risk factors for hepatitis C virus infection in United States blood donors. Hepatology 2000;31:756-62.
18. Shehab TM, Sonnad SS, Jeffries M, Gunaratnum N, Lok ASF. Current practice patterns of primary care physicians in the management of patients with hepatitis C. Hepatology 1999;30:794-800.
19. Muir AJ. The natural history of hepatitis C viral infection. Semin Gastrointest Dis 2000;11:54-61.
20. Villano SA, Vlahov D, Nelson K, et al. Persistence of viremia and the importance of long-term follow-up after acute hepatitis C infection. Hepatology 1999;29:908-14.
21. Poynard T, Bedossa P, Opolon P, et al. Natural history of liver fibro-sis progression in patients with chronic hepatitis C. Lancet 1997;346:825-32.
22. Crowe J, Doyle C, Fielding JF, et al. Presentation of hepatitis C in a unique uniform cohort 17 years from inoculation. Gastroenterology 1995;108:A1054. Abstract.-
23. Seeff LB, Miller RN, Rabkin CS, et al. 45-year follow-up of hepatitis C virus infection in healthy young adults. Ann Intern Med 2000;132:105-11.
24. Lionis C, Vlachonikolis IG, Skliros S, Symeonidis A, Merjiyrus BP, Kouroumalis E. Do undefined sources of hepatitis C transmission exist? The Greek study in general practice. J Viral Hepatitis 2000;7:218-24.
25. Bellentani S, Pozzato G, Saccoccio G, et al. Clinical course and risk factors of HCV related liver disease in the general population: report from the Dionysos study. Gut 1999;44:874-80.
26. Inglesby TV, Rai R, Astemborski J, et al. A prospective, community-based evaluation of liver enzymes in individuals with hepatitis C after drug use. Hepatology 1999;29:590-6.
27. Liang TJ (moderator), Rehermann B, Seef LB, Hofnagle JH (disscussants). Pathogenesis, natural history, treatment, and prevention of hepatitis C. Ann Intern Med 2000;132:296-305.
28. Management of Hepatitis C. NIH Consens Statement Online 1997 Mar 24-26 [cited 2001, July 23]; 15(3):-41.
29. Recommendations for prevention and control of hepatitis C virus (HCV) infection and HCV-related chronic disease. MMWR Morb Mortal Wkly Rep 1998;47(RR-19):1-39 [158 ].
30. Haydon GH, Jarvis LM, Blair CS, et al. Clinical significance of intra-hepatic hepatitis C virus levels in patients with chronic HCV infection. Gut 1998;42:570-5.
31. Wong JB, Bennett WG, Koff RS, Pauker SG. Pretreatment evaluation of chronic hepatitis C. JAMA 1998;280:2088-2093.
32. McHutchison JG, Gordon SC, Schiff ER, et al. Interferon alfa-2b alone or in combination with ribavirin as initial treatment for chronic hepatitis C. N Engl J Med 1998;339:1485-92.
33. Poynard T, Marcellin P, Lee SS, et al. Randomised trial of interferon alpha-2b plus ribavirin for 48 weeks or for 24 weeks versus inter-feron alpha-2b plus placebo for 48 weeks for treatment of chronic infection with hepatitis C virus. Lancet 1998;352:1426-32.
34. Zeuzem S, Feinman SV, Rasenack J, et al. Peginterferon alfa-2a in patients with chronic hepatitis C. N Engl J Med 2000;343:1666-72.
35. Manns MP, McHutchison JG, Gordon SC, et al. Peginterferon alfa-2b in combination with ribavirin compared with interferon alfa-2a plus ribavirin for initial treatment of chronic hepatitis C: Results of a randomised trial. Lancet 2001;358:958-65.
36. Xiaowei F. Hepatitis C infection: a review. Lippincott Prim Care Pract 1999;3:345-53.
37. Serfaty L, Chazouilleres O, Poujol-Robert A, et al. Risk factors for cirrhosis in patients with chronic HCV infection: results of a case-control study. Hepatology 1997;26:776-9.
38. Jenkins PJ, Cromie SL, Roberts SK, et al. Chronic hepatitis C, alcohol and hepatic fibrosis. Hepatology 1996;24:153A. Abstract.
OBJECTIVE: To determine the health care follow-up and treatment associated with physician-diagnosed hepatitis C (HCV) in a community-based population.
STUDY DESIGN: We conducted a retrospective medical record review using records from all providers in Olmsted County, Minnesota.
POPULATION: The study incorporated all Olmsted County residents with physician-diagnosed hepatitis C from 1990 through 1999.
OUTCOMES MEASURED: We assessed demographic and health status information as well as health services use in subjects with physician-diagnosed HCV.
RESULTS: Physicians diagnosed hepatitis C in 355 subjects (219 men [62%], 136 women [38%]), mean age 43 years, in the 10-year period studied. About half of diagnoses (45%, n = 159) were confirmed with polymerase chain reaction or liver biopsies. Identified risk factors included IV drug use (50%), multiple sex partners (36%), and blood transfusion (30%). Follow-up assessment with aspartate aminotransferase/amino alanine transferase (AST/ALT) tests occurred in about half (49%) of subjects, while 202 subjects (60%) were referred for gastrointestinal (GI) specialist evaluation and 49 patients (14% of all, 25% of those referred to a GI specialist) had specific treatment for hepatitis C. Although well over half of patients (60%) had possible contraindications to HCV treatment, including heavy alcohol use, few were referred for chemical dependency therapy.
CONCLUSIONS: In this community, follow-up and treatment related to HCV were limited. Attention to prevention of disease-accelerating coinfections was only modest. Referral or documented recommendations for treatment of alcoholism or heavy chronic alcohol ingestion were minimal.
- Risk factors associated with acquiring hepatitis C in this small city are similar to those in urban areas: intravenous drug use, frequent sexual exposure, and blood transfusion before 1992.
- No follow-up of liver testing in people with known hepatitis C occurred in half of cases.
- Less than 15% of prevalent cases received hepatitis C–specific treatment; many people appeared to have contraindications for hepatitis C therapy.
- Preventive care measures appropriate for people with hepatitis C (eg, hepatitis B immunization, referral for treatment of known chemical dependency, and screening for HIV) were not universal in this population.
Hepatitis C is reportedly the most common chronic bloodborne infectious disease in the United States.1-3 Prevalence data based on modeling studies and extrapolation from studies such as the National Health and Nutrition Examination Survey (NHANES) and county surveillance projects3,4 report that 3.9 million Americans (1.8%) have been infected with the hepatitis C virus (HCV) and 2.7 million (1.2%) have chronic HCV infection.5 While the natural history of HCV infections is poorly understood,6-9 researchers and clinicians agree that most people with chronic HCV infection remain asymptomatic for many years while seeking medical care, often primary care, for problems other than their silent hepatitis C infections.8,9
Much of the hepatitis C literature is derived from studies of subspecialty clinic patient populations or other special populations such as those with blood transfusion or RhoGAM-acquired hepatitis C.9-12 The former data tend to concentrate on the more severe, symptomatic patients referred to specialty care, whereas the latter special-exposure groups provide little information about a large segment of the population with other risk factors and comorbidity. Neither of these sources provides data on the community population or community practice.1,9,11 Our study describes the people that have been diagnosed with HCV in a geographically defined community, including their physician-directed hepatitis C follow-up evaluations and HCV treatment. In addition, we report on testing and vaccination efforts for hepatitis A and B and on the recognition and treatment of alcoholism and chronic heavy alcohol ingestion (accelerating comorbidities). The ability to follow the patient across all types of care from ambulatory to inpatient and from primary to tertiary care provides a very broad overview of these population-based cases.
Methods
Study setting and instrument
This is a descriptive study of a geographically defined, population-based cohort of all persons living in Olmsted County, Minnesota, who received a physician or laboratory diagnosis of hepatitis C from January 1, 1990, through December 31, 1999. All physician diagnoses were captured using a communitywide diagnostic database, the Rochester Epidemiology Project.13,14 Olmsted County is a metropolitan statistical area that includes the city of Rochester and is served primarily by more than 200 primary care physicians employed by 2 medical facilities, the Olmsted Medical Center and the Mayo Clinic.
All patients with a physician diagnosis of hepatitis C were included, whether the diagnosis had been confirmed by liver biopsy or polymerase chain reaction (PCR) testing or by either positive recombinant immunoblast assay (RIBA) testing or indeterminate RIBA testing and the presence of 1 or more risk factors. Risk factors included blood transfusion before July 1,1992, a diagnosis of hemophilia before 1990, a history of intravenous drug use (IDU), selling sex or trading sex for drugs, having more than 10 sex partners, sexual exposure to a person infected with HCV, intranasal cocaine use, and work in a health care facility with exposure to blood products (eg, phlebotomists) or health care workers with a history of needlesticks. The immigration status of people from Africa or Southeast Asia, where hepatitis C is endemic, is reported when the medical record listed immigration as an HCV risk factor. Patients with acute hepatitis C, defined as those with acute symptoms at the time of diagnosis (N = 4), were included.
Only people who were residents of Olmsted County for at least 1 year before being diagnosed with hepatitis C are included. This step was necessary to ensure that all subjects were community members. Besides its large liver transplantation service, Olmsted County has several inpatient and outpatient chemical dependency treatment programs and halfway houses that may bring patients with hepatitis C to the community for short periods of time. Inclusion of these people would have skewed the community-based focus of the study. Prisoners incarcerated in local facilities were excluded as well.
Measures
For each subject in the cohort, we reviewed all medical records from the Mayo Clinic and hospitals, the Olmsted Medical Center and hospital, and all other care providers in the county. Data collected included information on the initial diagnostic process as well as on HCV-related follow-up; specifically, all aspartate aminotransferase/amino alanine transferase (AST/ALT) testing and all HCV treatment given. All diagnoses of cirrhosis, ascites, gastrointestinal (GI) bleeding, encephalopathy, jaundice, and hepatocellular carcinoma were recorded. Data on risk factors as well as on comorbid conditions believed to influence the progression of HCV-related liver disease (eg, alcoholism, chronic heavy alcohol ingestion, hepatitis B, and HIV disease) were noted.
Data analysis
We summarized demographic information and data on risk factors, comorbid conditions, the pattern of laboratory test follow-up, and HCV treatment and, when appropriate, stratified these data by date of diagnosis. We used logistic regression models to look for associations among personal, demographic, and clinical factors associated with continued AST/ALT follow-up 1 or more years after initial HCV diagnosis.
Results
Of the 355 subjects with a diagnosis of hepatitis C between January 1, 1990, and December 31, 1999, 136 (38%) were women and 219 (62%) were men. The mean age at diagnosis was 42.6 years (Figure 1). The rate of new diagnoses of hepatitis C varied only slightly by year (Figure 2). After the period 1990–92, when HCV testing first became available, the difference in rates of new diagnoses is not statistically significant.
Complete follow-up data from the date of diagnosis until December 31, 1999, or the subject’s death were available in 78% of subjects with mean follow-up of 3.6 years, median 3.0 years, and range 0 to 9.8 years. Other subjects were lost to follow-up after they moved from the community; however, vital status (dead or alive) was obtained in 85% of all subjects as of January 1, 2000.
IDU was documented in 177 cases (50% of subjects) (Table 1) with the mean duration of 9.6 years (SD 7.9 years, range single use to 34 years). A single risk factor was recorded for 89 subjects (69 who had had a blood transfusion before 1992 and 20 health care workers with possible exposure to blood products or body fluids, including 5 with documented needlesticks). Sexual exposure and IDU were frequent coexisting risk factors.
All subjects had a positive anti-hepatitis C antibody test; 304 (86%) had a positive RIBA; 13 (4%) had an indeterminate RIBA with risk factors; 14 (3.9%) had PCR tests used in the diagnostic process; and the rest (n = 24) had only positive serology plus risk factors. Overall, 202 people (60%) were seen by a GI or hepatology specialist at least once after the diagnosis of HCV had been made. Confirmatory liver biopsies or PCR tests were used at some time in the follow-up of 157 subjects (44%), usually before the consideration of treatment or after referral to a hepatologist.
Among subjects, 21 (no gender differences) had hepatic decompensation, defined as cirrhosis with ascites, encephalopathy, or jaundice, or hepatocellular carcinoma identified either before or within 1 month of the hepatitis C diagnosis. These findings suggest that HCV evaluation was based on the presence of advanced liver disease. Thirty-seven (10%) of the patients, including 5 who died within days to weeks of the initial HCV diagnosis, died during the observation period.
At or around the time (±1 month) of diagnosis, serum albumin (n = 215, 61%), bilirubin (n = 265, 75%), and ALT or AST (n = 308, 87%) tests were commonly done. Albumin and bilirubin levels were normal in almost all cases (99% and 85%, respectively). The majority of the initial serum ALT/AST levels were elevated (262/308, 85%). Although the elevation was often modest, levels of 119 of the 246 initial tests (48%) were less than 2 times the upper limit of normal.
Follow-up of initial AST/ALT testing was not universal. Among subjects, 51% had one or more rechecks of liver function tests (LFTs) during the first year after diagnosis; 55%, 1 to 2 years after diagnosis; 56%, 2 to 3 years after diagnosis; and 45%, 3 to 4 years after diagnosis, based on the number of subjects not lost to follow-up for 1 to 4 years. Some subjects lost to hepatitis C follow-up had periods of active alcohol or drug abuse that appeared to disrupt hepatitis C care. Variations in rates of continued monitoring of AST/ALT, however, were not associated with risk factors such as IDU or transfusion nor with demographic factors such as age. Long-term follow-up (3 to 4 years after diagnosis) was associated with AST/ALT levels more than 2 times normal at diagnosis (P = .03) and a diagnosis of cirrhosis (P= .03). Women were more likely to have a repeat evaluation in the first year, but no gender differences were seen after that.
During the period of observation, which ended December 31, 1999, 49 subjects (14%) received interferon treatment specifically for their hepatitis C. Half of subjects (n = 25) received that treatment during clinical trials. Twenty people (12 in clinical trials) received ribavirin in addition to interferon; 1 received interferon and interleukin.
Many of the other 306 subjects had 1 or more documented contraindications to HCV therapy (Table 2). The 53 instances of chemical dependency may underestimate the effect of chronic alcohol ingestion on decisions not to treat, since among the 355 subjects, documentation of chronic heavy alcohol consumption (>6 drinks/day) was listed in the medical records of 182 (51%). The total number of subjects with one or more conditions that might be considered contraindications to therapy was 225 (63%). Although only a few of these contraindications were permanent conditions (eg, vegetative state) (Table 2), no subjects had a repeat reference to treatment after the documented condition (eg, depression) had resolved or improved.
Information on potentially accelerating comorbid conditions was available in many charts (ie, those of 11 subjects with known HIV infection). No HIV testing was documented, however, in 55 people who had HCV risk factors other than blood transfusion. Five people had documented chronic HBV infections (surface antigen positive). HBV screening was almost universal. Yet 159 subjects were not immune (including no documented HBV immunizations), and of these, 108 had HCV risk factors other than transfusion before 1992 and were therefore eligible for HBV immunization. Hepatitis A vaccination is now recommended for all nonimmune HCV patients,5 but immunization for hepatitis A was documented for only 25 subjects.
TABLE 1
RISK FACTORS NOTED AT DIAGNOSTIC VISIT
| Risk Factor | No. of Patients (%) (N=355) |
|---|---|
| History of intravenous drug use | 177 (50%) |
| Sexual exposure | 128 (36%) |
| Immigrant | 47 (13%) |
| Tattoos | 60 (17%) |
| History of blood transfusion | 107 (30%) |
| Occupational risks | 44 (12%) |
TABLE 2
REASONS DOCUMENTED FOR NOT RECEIVING TREATMENT
| Reason | No. of Patients (%) (N=306) |
|---|---|
| No reason stated | 81 (26%) |
| Chemical dependency | 53 (17%) |
| Comorbid condition | 28 (9%) |
| Refused/noncompliant | 44 (14%) |
| Age | 13 (4%) |
| Ineligible | 22 (7%)* |
| Depression | 25 (8%) |
| Psychiatric condition | 4 (1%) |
| Desired pregnancy | 5 (2%) |
| Cirrhosis | 6 (2%) |
| Hepatocellular carcinoma | 8 (3%) |
| HIV treatment | 7 (2%) |
| No insurance | 6 (1%) |
| No trial available | 4 (1%) |
| *Ineligible because of advanced liver disease or other terminal illness. | |
FIGURE 1
AGE AT DIAGNOSIS
FIGURE 2
NUMBER OF NEW DIAGNOSES PER YEAR
Discussion
Hepatitis C was an uncommon new diagnosis in Olmsted County and therefore not a frequent occurrence in the practice of any of the 200 primary care physicians in the community. Although the overall prevalence of hepatitis C was only about 25% of that reported for the Midwestern United States (1.3%),3,4 the ratio of men and women diagnosed with HCV and the distribution of recorded risk factors in our cohort are similar to those reported from the NHANES conducted in 1988 to 19944 and to those in other population-based studies.5,15-17
In this cohort, primary care physicians’ response to known HCV varied from occasional monitoring of AST/ALT tests to referral for specialty evaluation and HCV treatment. In a significant group of patients, no visits for HCV follow-up could be identified. The only other published data on primary care physicians’ follow-up care of patients with known HCV was self-report survey data.18 In response to a survey, primary care physicians reported they ordered yearly AST/ALT tests in all HCV patients and referred over 80% of people with known HCV to hepatologists. Self-reported care often overestimates the amount of care provided. This difference in reported and observed care emphasizes the importance of data on actual practice.
The community physicians’ lack of a uniform or aggressive approach to HCV infections may not be surprising in view of the wide disparity of available information on chronic HCV infection and its progression to symptomatic or progressive liver dis-ease.18 For example, published rates of progression to “chronic infection” after exposure vary from 85% of people receiving HCV-infected blood transfusions to 20% of women given HCV-contaminated RhoGAM.9 Even rates of progression in people with persistent viremia (+PCR) vary from 69 % to 88%.19 Unfortunately, progression to chronic HCV infection cannot be predicted from initial clinical or laboratory factors.20 In addition, the meaning of “chronic infection” is unclear.19 Reported rates of progression from chronic infection to cirrhosis are widely divergent and appear related to the type of group used to make predictions. Data from meta-analyses of clinical trial patients21 suggest progression rates of up to 69% in 30 years. Yet only 2.4% to 6% of community-based hepatitis C patients may develop cirrhosis after 17 to 40 years of follow-up.22,23
Wide variations in the progression of cirrhosis to decompensated cirrhosis have been reported.24 Studies of AST levels in people with known HCV show fluctuations over time, dispelling the idea that once elevated, AST or ALT will remain elevated or that AST levels are directly predictive of progression or resolution of liver injury or viral loads.25,26 Chronically elevated AST/ALT levels, however, have been shown to predict progression,27 making monitoring of AST/ALT important in all subjects.5,28
That HCV treatment was uncommon in this population may reflect the limited efficacy of single-agent therapy before 1998, as well as the large proportion of subjects with contraindications to therapy, primary care physician confusion regarding who should be treated, and current limited knowledge of the long-term outcomes of treatment.29 Cure rates are unknown and measures of cure are unclear, since clearing the virus from the bloodstream (negative PCR) may not confirm clearing of the virus from the liver.29 All these data together provide little experimental evidence for a standard set of recommendations for follow-up, nor do they support a clear rationale for the use of those follow-up data in determining HCV progression. The existing data have been used to develop consensus (expert opinion–based) guidelines published by NIH (1997)28 and CDC (1998,30 with an update in the summer of 2001). The substance of those consensus statements has changed over time5,28 as experts’ experience has increased and newer observations have become available. Recent changes in available treatments31-33 and FDA approval of a pegylated inferferon34,35 are likely to keep recommendations in flux for the near future.
The limited attention given to the identification, prevention, or treatment of comorbid accelerating conditions (HIV, HBV, HAV, and heavy alcohol intake)5,19,27,36-38 in this cohort is less understandable, since the literature is more consistent on these issues. Documented HIV testing was not universal even in those with a history of IDU or promiscuous sexual exposure. While testing for HBV was almost universal, HBV prevention in the form of vaccination was documented in only about one fourth (23%) of eligible subjects. Immunization for hepatitis A was documented in less than one tenth of subjects. Treatment or documented physician recommendations for treatment of ongoing alcohol abuse or heavy alccohol ingestion occurred in the minority of patients. Studies of combined chemical dependency and HCV therapy might be appropriate in this population.
The Olmsted County population from which the subjects were identified is more than 90% white. Therefore, community-based prevalence rates of physician diagnoses may not be representative of other racial or ethnic groups. The high frequency of drug use and sexual exposure suggests that our community’s problems associated with HCV are similar to those identified in other communities with greater economic, ethnic, and racial diversity. We did not perform PCR, liver biopsy, or yearly liver function tests on all subjects. One aim of our study, however, was to understand community practice and the resulting variations in information and testing completed for each subject. The existence of a large medical education program and the local availability of hepatologists may affect the care provided. Yet even in this setting, additional attention to follow-up of liver disease and comorbid conditions appeared indicated.
Conclusions
Primary care physicians make most diagnoses and perform most initial management of hepatitis C. However, primary care directed long term follow-up care is inconsistent and management of accelerating comorbidities is incomplete. Family physicians can offer important additional services to their patients who have hepatitis C.
1. Centers for Disease Control. Recommendations for prevention and control of hepatitis C virus (HCV) infection and HCV-related chronic disease. Centers for Disease Control and Prevention. MMWR Morb Mortal Wkly Rep 1998;47(No RR-19):1-39.
2. McQuillan G, Alter M, Moyer L, Lambert S, Margolis H. A population-based serologic study of hepatitis C virus infection in the United States. Am J Epidemiol 1996;143(suppl):S32.-
3. Armstrong GL, Alter MJ, McQuillan GM, Margolis HS. The past incidence of hepatitis C virus infection: implications for the future burden of chronic liver disease in the United States. Hepatology 2000;31:777-82.
4. Alter M, Kruszon-Moran D, Nainan OV, et al. The prevalence of hepatitis C virus infection in the United States, 1988 through 1994. N Engl J Med 1999;341:556-62.
5. Management of hepatitis C. NIH Consens Statement Online 1997 Mar 24-26 [cited 2001, July 23]; 15(3):1-41.
6. Takahashi M, Yamada G, Miyamoto R, Doi T, Endo H, Tsuji T. Natural course of chronic hepatitis C. Am J Gastroenterol 1993;88:240-3.
7. Kiyosawa K, Tanaka E, Sodeyama T, Furuta S. Natural history of hepatitis C. Intervirology 1994;37:101-7.
8. Muller R. The natural history of hepatitis C: clinical experiences. J Hepatology 1996;24(suppl 2):52-4.
9. Kenny-Walsh E. Clinical outcomes after hepatitis C infection from contaminated anti-D immune globulin. N Engl J Med 1999;340:1228-33.
10. Tong MJ, El-Farra NS, Reikes AR, Co RL. Clinical outcomes after transfusion-associated hepatitis C. N Engl J Med 1995;332:1463-6.
11. Kaur S, Rybicki L, Bacon BR, Gollan JL, Rustgi VK, Carey WD, and the National Hepatitis Surveillance Group. Performance characteristics and results of a large-scale screening program for viral hepatitis and risk factors associated with exposure to viral hepatitis B and C: results of the National Hepatitis Screening Survey. Hepatology 1996;24:979-86.
12. Makris M, Preston FE, Rosendaal FR, Underwood JCE, Rice KM, Triger DR. The natural history of chronic hepatitis C in haemophiliacs. Br J Haematol 1996;94:746-52.
13. Melton LJ, III. History of the Rochester Epidemiology Project. Mayo Clin Proc 1996;71:266-74.
14. Kurland LT, Molgaard CA. The patient record in epidemiology. Sci Am 1981;245:54-63.
15. Alter MJ. Epidemiology of hepatitis C in the West. Semin Liver Dis 1995;15:5-14.
16. Tillman HL, Manns MP. Mode of hepatitis C virus infection, epidemiology, and chronicity rate in the general population and risk groups. Dig Dis Sci 1996;41(12 suppl):27S-40S.
17. Murphy EL, Bryzman SM, Glynn SA, et al. Risk factors for hepatitis C virus infection in United States blood donors. Hepatology 2000;31:756-62.
18. Shehab TM, Sonnad SS, Jeffries M, Gunaratnum N, Lok ASF. Current practice patterns of primary care physicians in the management of patients with hepatitis C. Hepatology 1999;30:794-800.
19. Muir AJ. The natural history of hepatitis C viral infection. Semin Gastrointest Dis 2000;11:54-61.
20. Villano SA, Vlahov D, Nelson K, et al. Persistence of viremia and the importance of long-term follow-up after acute hepatitis C infection. Hepatology 1999;29:908-14.
21. Poynard T, Bedossa P, Opolon P, et al. Natural history of liver fibro-sis progression in patients with chronic hepatitis C. Lancet 1997;346:825-32.
22. Crowe J, Doyle C, Fielding JF, et al. Presentation of hepatitis C in a unique uniform cohort 17 years from inoculation. Gastroenterology 1995;108:A1054. Abstract.-
23. Seeff LB, Miller RN, Rabkin CS, et al. 45-year follow-up of hepatitis C virus infection in healthy young adults. Ann Intern Med 2000;132:105-11.
24. Lionis C, Vlachonikolis IG, Skliros S, Symeonidis A, Merjiyrus BP, Kouroumalis E. Do undefined sources of hepatitis C transmission exist? The Greek study in general practice. J Viral Hepatitis 2000;7:218-24.
25. Bellentani S, Pozzato G, Saccoccio G, et al. Clinical course and risk factors of HCV related liver disease in the general population: report from the Dionysos study. Gut 1999;44:874-80.
26. Inglesby TV, Rai R, Astemborski J, et al. A prospective, community-based evaluation of liver enzymes in individuals with hepatitis C after drug use. Hepatology 1999;29:590-6.
27. Liang TJ (moderator), Rehermann B, Seef LB, Hofnagle JH (disscussants). Pathogenesis, natural history, treatment, and prevention of hepatitis C. Ann Intern Med 2000;132:296-305.
28. Management of Hepatitis C. NIH Consens Statement Online 1997 Mar 24-26 [cited 2001, July 23]; 15(3):-41.
29. Recommendations for prevention and control of hepatitis C virus (HCV) infection and HCV-related chronic disease. MMWR Morb Mortal Wkly Rep 1998;47(RR-19):1-39 [158 ].
30. Haydon GH, Jarvis LM, Blair CS, et al. Clinical significance of intra-hepatic hepatitis C virus levels in patients with chronic HCV infection. Gut 1998;42:570-5.
31. Wong JB, Bennett WG, Koff RS, Pauker SG. Pretreatment evaluation of chronic hepatitis C. JAMA 1998;280:2088-2093.
32. McHutchison JG, Gordon SC, Schiff ER, et al. Interferon alfa-2b alone or in combination with ribavirin as initial treatment for chronic hepatitis C. N Engl J Med 1998;339:1485-92.
33. Poynard T, Marcellin P, Lee SS, et al. Randomised trial of interferon alpha-2b plus ribavirin for 48 weeks or for 24 weeks versus inter-feron alpha-2b plus placebo for 48 weeks for treatment of chronic infection with hepatitis C virus. Lancet 1998;352:1426-32.
34. Zeuzem S, Feinman SV, Rasenack J, et al. Peginterferon alfa-2a in patients with chronic hepatitis C. N Engl J Med 2000;343:1666-72.
35. Manns MP, McHutchison JG, Gordon SC, et al. Peginterferon alfa-2b in combination with ribavirin compared with interferon alfa-2a plus ribavirin for initial treatment of chronic hepatitis C: Results of a randomised trial. Lancet 2001;358:958-65.
36. Xiaowei F. Hepatitis C infection: a review. Lippincott Prim Care Pract 1999;3:345-53.
37. Serfaty L, Chazouilleres O, Poujol-Robert A, et al. Risk factors for cirrhosis in patients with chronic HCV infection: results of a case-control study. Hepatology 1997;26:776-9.
38. Jenkins PJ, Cromie SL, Roberts SK, et al. Chronic hepatitis C, alcohol and hepatic fibrosis. Hepatology 1996;24:153A. Abstract.