User login
Using Artificial Intelligence for COVID-19 Chest X-ray Diagnosis
The novel coronavirus severe acute respiratory syndrome coronavirus 2 (SARSCoV- 2), which causes the respiratory disease coronavirus disease-19 (COVID- 19), was first identified as a cluster of cases of pneumonia in Wuhan, Hubei Province of China on December 31, 2019.1 Within a month, the disease had spread significantly, leading the World Health Organization (WHO) to designate COVID-19 a public health emergency of international concern. On March 11, 2020, the WHO declared COVID-19 a global pandemic.2 As of August 18, 2020, the virus has infected > 21 million people, with > 750,000 deaths worldwide.3 The spread of COVID-19 has had a dramatic impact on social, economic, and health care issues throughout the world, which has been discussed elsewhere.4
Prior to the this century, members of the coronavirus family had minimal impact on human health.5 However, in the past 20 years, outbreaks have highlighted an emerging importance of coronaviruses in morbidity and mortality on a global scale. Although less prevalent than COVID-19, severe acute respiratory syndrome (SARS) in 2002 to 2003 and Middle East respiratory syndrome (MERS) in 2012 likely had higher mortality rates than the current pandemic.5 Based on this recent history, it is reasonable to assume that we will continue to see novel diseases with similar significant health and societal implications. The challenges presented to health care providers (HCPs) by such novel viral pathogens are numerous, including methods for rapid diagnosis, prevention, and treatment. In the current study, we focus on diagnosis issues, which were evident with COVID-19 with the time required to develop rapid and effective diagnostic modalities.
We have previously reported the utility of using artificial intelligence (AI) in the histopathologic diagnosis of cancer.6-8 AI was first described in 1956 and involves the field of computer science in which machines are trained to learn from experience.9 Machine learning (ML) is a subset of AI and is achieved by using mathematic models to compute sample datasets.10 Current ML employs deep learning with neural network algorithms, which can recognize patterns and achieve complex computational tasks often far quicker and with increased precision than can humans.11-13 In addition to applications in pathology, ML algorithms have both prognostic and diagnostic applications in multiple medical specialties, such as radiology, dermatology, ophthalmology, and cardiology.6 It is predicted that AI will impact almost every aspect of health care in the future.14
In this article, we examine the potential for AI to diagnose patients with COVID-19 pneumonia using chest radiographs (CXR) alone. This is done using Microsoft CustomVision (www.customvision.ai), a readily available, automated ML platform. Employing AI to both screen and diagnose emerging health emergencies such as COVID-19 has the potential to dramatically change how we approach medical care in the future. In addition, we describe the creation of a publicly available website (interknowlogy-covid-19 .azurewebsites.net) that could augment COVID-19 pneumonia CXR diagnosis.
Methods
For the training dataset, 103 CXR images of COVID-19 were downloaded from GitHub covid-chest-xray dataset.15 Five hundred images of non-COVID-19 pneumonia and 500 images of the normal lung were downloaded from the Kaggle RSNA Pneumonia Detection Challenge dataset.16 To balance the dataset, we expanded the COVID-19 dataset to 500 images by slight rotation (probability = 1, max rotation = 5) and zooming (probability = 0.5, percentage area = 0.9) of the original images using the Augmentor Python package.17
Validation Dataset
For the validation dataset 30 random CXR images were obtained from the US Department of Veterans Affairs (VA) PACS (picture archiving and communication system). This dataset included 10 CXR images from hospitalized patients with COVID-19, 10 CXR pneumonia images from patients without COVID-19, and 10 normal CXRs. COVID-19 diagnoses were confirmed with a positive test result from the Xpert Xpress SARS-CoV-2 polymerase chain reaction (PCR) platform.18
Microsoft Custom
Vision Microsoft CustomVision is an automated image classification and object detection system that is a part of Microsoft Azure Cognitive Services (azure.microsoft.com). It has a pay-as-you-go model with fees depending on the computing needs and usage. It offers a free trial to users for 2 initial projects. The service is online with an easy-to-follow graphical user interface. No coding skills are necessary.
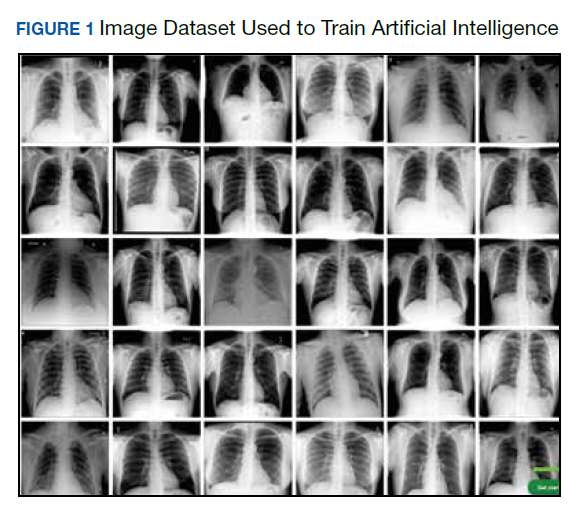
We created a new classification project in CustomVision and chose a compact general domain for small size and easy export to TensorFlow. js model format. TensorFlow.js is a JavaScript library that enables dynamic download and execution of ML models. After the project was created, we proceeded to upload our image dataset. Each class was uploaded separately and tagged with the appropriate label (covid pneumonia, non-covid pneumonia, or normal lung). The system rejected 16 COVID-19 images as duplicates. The final CustomVision training dataset consisted of 484 images of COVID-19 pneumonia, 500 images of non-COVID-19 pneumonia, and 500 images of normal lungs. Once uploaded, CustomVision self-trains using the dataset upon initiating the program (Figure 1).
Website Creation
CustomVision was used to train the model. It can be used to execute the model continuously, or the model can be compacted and decoupled from CustomVision. In this case, the model was compacted and decoupled for use in an online application. An Angular online application was created with TensorFlow.js. Within a user’s web browser, the model is executed when an image of a CXR is submitted. Confidence values for each classification are returned. In this design, after the initial webpage and model is downloaded, the webpage no longer needs to access any server components and performs all operations in the browser. Although the solution works well on mobile phone browsers and in low bandwidth situations, the quality of predictions may depend on the browser and device used. At no time does an image get submitted to the cloud.
Result
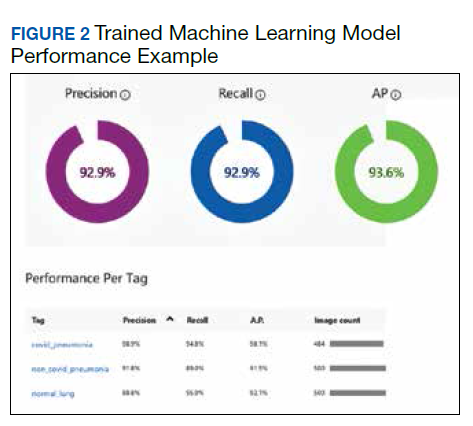
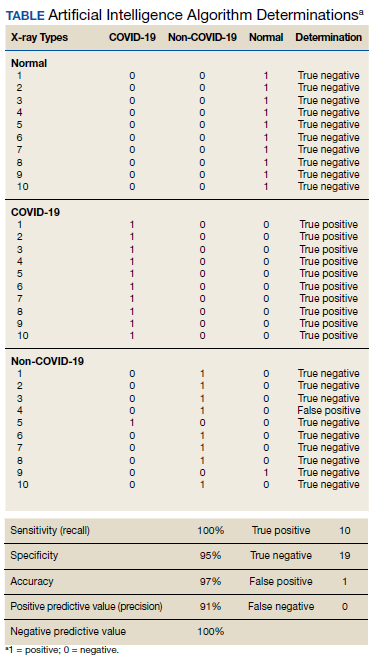
Overall, our trained model showed 92.9% precision and recall. Precision and recall results for each label were 98.9% and 94.8%, respectively for COVID-19 pneumonia; 91.8% and 89%, respectively, for non- COVID-19 pneumonia; and 88.8% and 95%, respectively, for normal lung (Figure 2). Next, we proceeded to validate the training model on the VA data by making individual predictions on 30 images from the VA dataset. Our model performed well with 100% sensitivity (recall), 95% specificity, 97% accuracy, 91% positive predictive value (precision), and 100% negative predictive value (Table).
Discussion
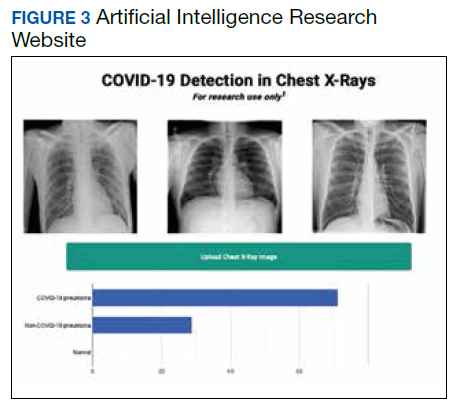
We successfully demonstrated the potential of using AI algorithms in assessing CXRs for COVID-19. We first trained the CustomVision automated image classification and object detection system to differentiate cases of COVID-19 from pneumonia from other etiologies as well as normal lung CXRs. We then tested our model against known patients from the James A. Haley Veterans’ Hospital in Tampa, Florida. The program achieved 100% sensitivity (recall), 95% specificity, 97% accuracy, 91% positive predictive value (precision), and 100% negative predictive value in differentiating the 3 scenarios. Using the trained ML model, we proceeded to create a website that could augment COVID-19 CXR diagnosis.19 The website works on mobile as well as desktop platforms. A health care provider can take a CXR photo with a mobile phone or upload the image file. The ML algorithm would provide the probability of COVID-19 pneumonia, non-COVID-19 pneumonia, or normal lung diagnosis (Figure 3).
Emerging diseases such as COVID-19 present numerous challenges to HCPs, governments, and businesses, as well as to individual members of society. As evidenced with COVID-19, the time from first recognition of an emerging pathogen to the development of methods for reliable diagnosis and treatment can be months, even with a concerted international effort. The gold standard for diagnosis of COVID-19 is by reverse transcriptase PCR (RT-PCR) technologies; however, early RT-PCR testing produced less than optimal results.20-22 Even after the development of reliable tests for detection, making test kits readily available to health care providers on an adequate scale presents an additional challenge as evident with COVID-19.
Use of X-ray vs Computed Tomography
The lack of availability of diagnostic RTPCR with COVID-19 initially placed increased reliability on presumptive diagnoses via imaging in some situations.23 Most of the literature evaluating radiographs of patients with COVID-19 focuses on chest computed tomography (CT) findings, with initial results suggesting CT was more accurate than early RT-PCR methodologies.21,22,24 The Radiological Society of North America Expert consensus statement on chest CT for COVID-19 states that CT findings can even precede positivity on RT-PCR in some cases.22 However, currently it does not recommend the use of CT scanning as a screening tool. Furthermore, the actual sensitivity and specificity of CT interpretation by radiologists for COVID-19 are unknown.22
Characteristic CT findings include ground-glass opacities (GGOs) and consolidation most commonly in the lung periphery, though a diffuse distribution was found in a minority of patients.21,23,25-27 Lomoro and colleagues recently summarized the CT findings from several reports that described abnormalities as most often bilateral and peripheral, subpleural, and affecting the lower lobes.26 Not surprisingly, CT appears more sensitive at detecting changes with COVID-19 than does CXR, with reports that a minority of patients exhibited CT changes before changes were visible on CXR.23,26
We focused our study on the potential of AI in the examination of CXRs in patients with COVID-19, as there are several limitations to the routine use of CT scans with conditions such as COVID-19. Aside from the more considerable time required to obtain CTs, there are issues with contamination of CT suites, sometimes requiring a dedicated COVID-19 CT scanner.23,28 The time constraints of decontamination or limited utilization of CT suites can delay or disrupt services for patients with and without COVID-19. Because of these factors, CXR may be a better resource to minimize the risk of infection to other patients. Also, accurate assessment of abnormalities on CXR for COVID-19 may identify patients in whom the CXR was performed for other purposes.23 CXR is more readily available than CT, especially in more remote or underdeveloped areas.28 Finally, as with CT, CXR abnormalities are reported to have appeared before RT-PCR tests became positive for a minority of patients.23
CXR findings described in patients with COVID-19 are similar to those of CT and include GGOs, consolidation, and hazy increased opacities.23,25,26,28,29 Like CT, the majority of patients who received CXR demonstrated greater involvement in the lower zones and peripherally.23,25,26,28,29 Most patients showed bilateral involvement. However, while these findings are common in patients with COVID-19, they are not specific and can be seen in other conditions, such as other viral pneumonia, bacterial pneumonia, injury from drug toxicity, inhalation injury, connective tissue disease, and idiopathic conditions.
Application of AI for COVID-19
Applications of AI in interpreting radiographs of various types are numerous, and extensive literature has been written on the topic.30 Using deep learning algorithms, AI has multiple possible roles to augment traditional radiograph interpretation. These include the potential for screening, triaging, and increasing the speed to render diagnoses. It also can provide a rapid “second opinion” to the radiologist to support the final interpretation. In areas with critical shortages of radiologists, AI potentially can be used to render the definitive diagnosis. In COVID- 19, imaging studies have been shown to correlate with disease severity and mortality, and AI could assist in monitoring the course of the disease as it progresses and potentially identify patients at greatest risk.27 Furthermore, early results from PCR have been considered suboptimal, and it is known that patients with COVID-19 can test negative initially even by reliable testing methodologies. As AI technology progresses, interpretation can detect and guide triage and treatment of patients with high suspicions of COVID-19 but negative initial PCR results, or in situations where test availability is limited or results are delayed. There are numerous potential benefits should a rapid diagnostic test as simple as a CXR be able to reliably impact containment and prevention of the spread of contagions such as COVID- 19 early in its course.
Few studies have assessed using AI in the radiologic diagnosis of COVID-19, most of which use CT scanning. Bai and colleagues demonstrated increased accuracy, sensitivity, and specificity in distinguishing chest CTs of COVID-19 patients from other types of pneumonia.21,31 A separate study demonstrated the utility of using AI to differentiate COVID-19 from community-acquired pneumonia with CT.32 However, the effective utility of AI for CXR interpretation also has been demonstrated.14,33 Implementation of convolutional neural network layers has allowed for reliable differentiation of viral and bacterial pneumonia with CXR imaging.34 Evidence suggests that there is great potential in the application of AI in the interpretation of radiographs of all types.
Finally, we have developed a publicly available website based on our studies.18 This website is for research use only as it is based on data from our preliminary investigation. To appear within the website, images must have protected health information removed before uploading. The information on the website, including text, graphics, images, or other material, is for research and may not be appropriate for all circumstances. The website does not provide medical, professional, or licensed advice and is not a substitute for consultation with a HCP. Medical advice should be sought from a qualified HCP for any questions, and the website should not be used for medical diagnosis or treatment.
Limitations
In our preliminary study, we have demonstrated the potential impact AI can have in multiple aspects of patient care for emerging pathogens such as COVID-19 using a test as readily available as a CXR. However, several limitations to this investigation should be mentioned. The study is retrospective in nature with limited sample size and with X-rays from patients with various stages of COVID-19 pneumonia. Also, cases of non-COVID-19 pneumonia are not stratified into different types or etiologies. We intend to demonstrate the potential of AI in differentiating COVID-19 pneumonia from non-COVID-19 pneumonia of any etiology, though future studies should address comparison of COVID-19 cases to more specific types of pneumonias, such as of bacterial or viral origin. Furthermore, the present study does not address any potential effects of additional radiographic findings from coexistent conditions, such as pulmonary edema as seen in congestive heart failure, pleural effusions (which can be seen with COVID-19 pneumonia, though rarely), interstitial lung disease, etc. Future studies are required to address these issues. Ultimately, prospective studies to assess AI-assisted radiographic interpretation in conditions such as COVID-19 are required to demonstrate the impact on diagnosis, treatment, outcome, and patient safety as these technologies are implemented.
Conclusions
We have used a readily available, commercial platform to demonstrate the potential of AI to assist in the successful diagnosis of COVID-19 pneumonia on CXR images. While this technology has numerous applications in radiology, we have focused on the potential impact on future world health crises such as COVID-19. The findings have implications for screening and triage, initial diagnosis, monitoring disease progression, and identifying patients at increased risk of morbidity and mortality. Based on the data, a website was created to demonstrate how such technologies could be shared and distributed to others to combat entities such as COVID-19 moving forward. Our study offers a small window into the potential for how AI will likely dramatically change the practice of medicine in the future.
1. World Health Organization. Coronavirus disease (COVID- 19) pandemic. https://www.who.int/emergencies/diseases /novel-coronavirus2019. Updated August 23, 2020. Accessed August 24, 2020.
2. World Health Organization. WHO Director-General’s opening remarks at the media briefing on COVID-19 - 11 March 2020. https://www.who.int/dg/speeches/detail/who -director-general-sopening-remarks-at-the-media-briefing -on-covid-19---11-march2020. Published March 11, 2020. Accessed August 24, 2020.
3. World Health Organization. Coronavirus disease (COVID- 19): situation report--209. https://www.who.int/docs /default-source/coronaviruse/situation-reports/20200816 -covid-19-sitrep-209.pdf. Updated August 16, 2020. Accessed August 24, 2020.
4. Nicola M, Alsafi Z, Sohrabi C, et al. The socio-economic implications of the coronavirus pandemic (COVID-19): a review. Int J Surg. 2020;78:185-193. doi:10.1016/j.ijsu.2020.04.018
5. da Costa VG, Moreli ML, Saivish MV. The emergence of SARS, MERS and novel SARS-2 coronaviruses in the 21st century. Arch Virol. 2020;165(7):1517-1526. doi:10.1007/s00705-020-04628-0
6. Borkowski AA, Wilson CP, Borkowski SA, et al. Comparing artificial intelligence platforms for histopathologic cancer diagnosis. Fed Pract. 2019;36(10):456-463.
7. Borkowski AA, Wilson CP, Borkowski SA, Thomas LB, Deland LA, Mastorides SM. Apple machine learning algorithms successfully detect colon cancer but fail to predict KRAS mutation status. http://arxiv.org/abs/1812.04660. Updated January 15, 2019. Accessed August 24, 2020.
8. Borkowski AA, Wilson CP, Borkowski SA, Deland LA, Mastorides SM. Using Apple machine learning algorithms to detect and subclassify non-small cell lung cancer. http:// arxiv.org/abs/1808.08230. Updated January 15, 2019. Accessed August 24, 2020.
9. Moor J. The Dartmouth College artificial intelligence conference: the next fifty years. AI Mag. 2006;27(4):87. doi:10.1609/AIMAG.V27I4.1911
10. Samuel AL. Some studies in machine learning using the game of checkers. IBM J Res Dev. 1959;3(3):210-229. doi:10.1147/rd.33.0210
11. Sarle WS. Neural networks and statistical models https:// people.orie.cornell.edu/davidr/or474/nn_sas.pdf. Published April 1994. Accessed August 24, 2020.
12. Schmidhuber J. Deep learning in neural networks: an overview. Neural Netw. 2015;61:85-117. doi:10.1016/j.neunet.2014.09.003
13. 13. LeCun Y, Bengio Y, Hinton G. Deep learning. Nature. 2015;521(7553):436-444. doi:10.1038/nature14539
14. Topol EJ. High-performance medicine: the convergence of human and artificial intelligence. Nat Med. 2019;25(1):44- 56. doi:10.1038/s41591-018-0300-7
15. Cohen JP, Morrison P, Dao L. COVID-19 Image Data Collection. Published online March 25, 2020. Accessed May 13, 2020. http://arxiv.org/abs/2003.11597
16. Radiological Society of America. RSNA pneumonia detection challenge. https://www.kaggle.com/c/rsnapneumonia- detectionchallenge. Accessed August 24, 2020.
17. Bloice MD, Roth PM, Holzinger A. Biomedical image augmentation using Augmentor. Bioinformatics. 2019;35(21):4522-4524. doi:10.1093/bioinformatics/btz259
18. Cepheid. Xpert Xpress SARS-CoV-2. https://www.cepheid .com/coronavirus. Accessed August 24, 2020.
19. Interknowlogy. COVID-19 detection in chest X-rays. https://interknowlogy-covid-19.azurewebsites.net. Accessed August 27, 2020.
20. Bernheim A, Mei X, Huang M, et al. Chest CT Findings in Coronavirus Disease-19 (COVID-19): Relationship to Duration of Infection. Radiology. 2020;295(3):200463. doi:10.1148/radiol.2020200463
21. Ai T, Yang Z, Hou H, et al. Correlation of Chest CT and RTPCR Testing for Coronavirus Disease 2019 (COVID-19) in China: a report of 1014 cases. Radiology. 2020;296(2):E32- E40. doi:10.1148/radiol.2020200642
22. Simpson S, Kay FU, Abbara S, et al. Radiological Society of North America Expert Consensus Statement on Reporting Chest CT Findings Related to COVID-19. Endorsed by the Society of Thoracic Radiology, the American College of Radiology, and RSNA - Secondary Publication. J Thorac Imaging. 2020;35(4):219-227. doi:10.1097/RTI.0000000000000524
23. Wong HYF, Lam HYS, Fong AH, et al. Frequency and distribution of chest radiographic findings in patients positive for COVID-19. Radiology. 2020;296(2):E72-E78. doi:10.1148/radiol.2020201160
24. Fang Y, Zhang H, Xie J, et al. Sensitivity of chest CT for COVID-19: comparison to RT-PCR. Radiology. 2020;296(2):E115-E117. doi:10.1148/radiol.2020200432
25. Chen N, Zhou M, Dong X, et al. Epidemiological and clinical characteristics of 99 cases of 2019 novel coronavirus pneumonia in Wuhan, China: a descriptive study. Lancet. 2020;395(10223):507-513. doi:10.1016/S0140-6736(20)30211-7
26. Lomoro P, Verde F, Zerboni F, et al. COVID-19 pneumonia manifestations at the admission on chest ultrasound, radiographs, and CT: single-center study and comprehensive radiologic literature review. Eur J Radiol Open. 2020;7:100231. doi:10.1016/j.ejro.2020.100231
27. Salehi S, Abedi A, Balakrishnan S, Gholamrezanezhad A. Coronavirus disease 2019 (COVID-19) imaging reporting and data system (COVID-RADS) and common lexicon: a proposal based on the imaging data of 37 studies. Eur Radiol. 2020;30(9):4930-4942. doi:10.1007/s00330-020-06863-0
28. Jacobi A, Chung M, Bernheim A, Eber C. Portable chest X-ray in coronavirus disease-19 (COVID- 19): a pictorial review. Clin Imaging. 2020;64:35-42. doi:10.1016/j.clinimag.2020.04.001
29. Bhat R, Hamid A, Kunin JR, et al. Chest imaging in patients hospitalized With COVID-19 infection - a case series. Curr Probl Diagn Radiol. 2020;49(4):294-301. doi:10.1067/j.cpradiol.2020.04.001
30. Liu X, Faes L, Kale AU, et al. A comparison of deep learning performance against health-care professionals in detecting diseases from medical imaging: a systematic review and meta-analysis. Lancet Digit Heal. 2019;1(6):E271- E297. doi:10.1016/S2589-7500(19)30123-2
31. Bai HX, Wang R, Xiong Z, et al. Artificial intelligence augmentation of radiologist performance in distinguishing COVID-19 from pneumonia of other origin at chest CT. Radiology. 2020;296(3):E156-E165. doi:10.1148/radiol.2020201491
32. Li L, Qin L, Xu Z, et al. Using artificial intelligence to detect COVID-19 and community-acquired pneumonia based on pulmonary CT: evaluation of the diagnostic accuracy. Radiology. 2020;296(2):E65-E71. doi:10.1148/radiol.2020200905
33. Rajpurkar P, Joshi A, Pareek A, et al. CheXpedition: investigating generalization challenges for translation of chest x-ray algorithms to the clinical setting. http://arxiv.org /abs/2002.11379. Updated March 11, 2020. Accessed August 24, 2020.
34. Kermany DS, Goldbaum M, Cai W, et al. Identifying medical diagnoses and treatable diseases by imagebased deep learning. Cell. 2018;172(5):1122-1131.e9. doi:10.1016/j.cell.2018.02.010
The novel coronavirus severe acute respiratory syndrome coronavirus 2 (SARSCoV- 2), which causes the respiratory disease coronavirus disease-19 (COVID- 19), was first identified as a cluster of cases of pneumonia in Wuhan, Hubei Province of China on December 31, 2019.1 Within a month, the disease had spread significantly, leading the World Health Organization (WHO) to designate COVID-19 a public health emergency of international concern. On March 11, 2020, the WHO declared COVID-19 a global pandemic.2 As of August 18, 2020, the virus has infected > 21 million people, with > 750,000 deaths worldwide.3 The spread of COVID-19 has had a dramatic impact on social, economic, and health care issues throughout the world, which has been discussed elsewhere.4
Prior to the this century, members of the coronavirus family had minimal impact on human health.5 However, in the past 20 years, outbreaks have highlighted an emerging importance of coronaviruses in morbidity and mortality on a global scale. Although less prevalent than COVID-19, severe acute respiratory syndrome (SARS) in 2002 to 2003 and Middle East respiratory syndrome (MERS) in 2012 likely had higher mortality rates than the current pandemic.5 Based on this recent history, it is reasonable to assume that we will continue to see novel diseases with similar significant health and societal implications. The challenges presented to health care providers (HCPs) by such novel viral pathogens are numerous, including methods for rapid diagnosis, prevention, and treatment. In the current study, we focus on diagnosis issues, which were evident with COVID-19 with the time required to develop rapid and effective diagnostic modalities.
We have previously reported the utility of using artificial intelligence (AI) in the histopathologic diagnosis of cancer.6-8 AI was first described in 1956 and involves the field of computer science in which machines are trained to learn from experience.9 Machine learning (ML) is a subset of AI and is achieved by using mathematic models to compute sample datasets.10 Current ML employs deep learning with neural network algorithms, which can recognize patterns and achieve complex computational tasks often far quicker and with increased precision than can humans.11-13 In addition to applications in pathology, ML algorithms have both prognostic and diagnostic applications in multiple medical specialties, such as radiology, dermatology, ophthalmology, and cardiology.6 It is predicted that AI will impact almost every aspect of health care in the future.14
In this article, we examine the potential for AI to diagnose patients with COVID-19 pneumonia using chest radiographs (CXR) alone. This is done using Microsoft CustomVision (www.customvision.ai), a readily available, automated ML platform. Employing AI to both screen and diagnose emerging health emergencies such as COVID-19 has the potential to dramatically change how we approach medical care in the future. In addition, we describe the creation of a publicly available website (interknowlogy-covid-19 .azurewebsites.net) that could augment COVID-19 pneumonia CXR diagnosis.
Methods
For the training dataset, 103 CXR images of COVID-19 were downloaded from GitHub covid-chest-xray dataset.15 Five hundred images of non-COVID-19 pneumonia and 500 images of the normal lung were downloaded from the Kaggle RSNA Pneumonia Detection Challenge dataset.16 To balance the dataset, we expanded the COVID-19 dataset to 500 images by slight rotation (probability = 1, max rotation = 5) and zooming (probability = 0.5, percentage area = 0.9) of the original images using the Augmentor Python package.17
Validation Dataset
For the validation dataset 30 random CXR images were obtained from the US Department of Veterans Affairs (VA) PACS (picture archiving and communication system). This dataset included 10 CXR images from hospitalized patients with COVID-19, 10 CXR pneumonia images from patients without COVID-19, and 10 normal CXRs. COVID-19 diagnoses were confirmed with a positive test result from the Xpert Xpress SARS-CoV-2 polymerase chain reaction (PCR) platform.18
Microsoft Custom
Vision Microsoft CustomVision is an automated image classification and object detection system that is a part of Microsoft Azure Cognitive Services (azure.microsoft.com). It has a pay-as-you-go model with fees depending on the computing needs and usage. It offers a free trial to users for 2 initial projects. The service is online with an easy-to-follow graphical user interface. No coding skills are necessary.
We created a new classification project in CustomVision and chose a compact general domain for small size and easy export to TensorFlow. js model format. TensorFlow.js is a JavaScript library that enables dynamic download and execution of ML models. After the project was created, we proceeded to upload our image dataset. Each class was uploaded separately and tagged with the appropriate label (covid pneumonia, non-covid pneumonia, or normal lung). The system rejected 16 COVID-19 images as duplicates. The final CustomVision training dataset consisted of 484 images of COVID-19 pneumonia, 500 images of non-COVID-19 pneumonia, and 500 images of normal lungs. Once uploaded, CustomVision self-trains using the dataset upon initiating the program (Figure 1).
Website Creation
CustomVision was used to train the model. It can be used to execute the model continuously, or the model can be compacted and decoupled from CustomVision. In this case, the model was compacted and decoupled for use in an online application. An Angular online application was created with TensorFlow.js. Within a user’s web browser, the model is executed when an image of a CXR is submitted. Confidence values for each classification are returned. In this design, after the initial webpage and model is downloaded, the webpage no longer needs to access any server components and performs all operations in the browser. Although the solution works well on mobile phone browsers and in low bandwidth situations, the quality of predictions may depend on the browser and device used. At no time does an image get submitted to the cloud.
Result
Overall, our trained model showed 92.9% precision and recall. Precision and recall results for each label were 98.9% and 94.8%, respectively for COVID-19 pneumonia; 91.8% and 89%, respectively, for non- COVID-19 pneumonia; and 88.8% and 95%, respectively, for normal lung (Figure 2). Next, we proceeded to validate the training model on the VA data by making individual predictions on 30 images from the VA dataset. Our model performed well with 100% sensitivity (recall), 95% specificity, 97% accuracy, 91% positive predictive value (precision), and 100% negative predictive value (Table).
Discussion
We successfully demonstrated the potential of using AI algorithms in assessing CXRs for COVID-19. We first trained the CustomVision automated image classification and object detection system to differentiate cases of COVID-19 from pneumonia from other etiologies as well as normal lung CXRs. We then tested our model against known patients from the James A. Haley Veterans’ Hospital in Tampa, Florida. The program achieved 100% sensitivity (recall), 95% specificity, 97% accuracy, 91% positive predictive value (precision), and 100% negative predictive value in differentiating the 3 scenarios. Using the trained ML model, we proceeded to create a website that could augment COVID-19 CXR diagnosis.19 The website works on mobile as well as desktop platforms. A health care provider can take a CXR photo with a mobile phone or upload the image file. The ML algorithm would provide the probability of COVID-19 pneumonia, non-COVID-19 pneumonia, or normal lung diagnosis (Figure 3).
Emerging diseases such as COVID-19 present numerous challenges to HCPs, governments, and businesses, as well as to individual members of society. As evidenced with COVID-19, the time from first recognition of an emerging pathogen to the development of methods for reliable diagnosis and treatment can be months, even with a concerted international effort. The gold standard for diagnosis of COVID-19 is by reverse transcriptase PCR (RT-PCR) technologies; however, early RT-PCR testing produced less than optimal results.20-22 Even after the development of reliable tests for detection, making test kits readily available to health care providers on an adequate scale presents an additional challenge as evident with COVID-19.
Use of X-ray vs Computed Tomography
The lack of availability of diagnostic RTPCR with COVID-19 initially placed increased reliability on presumptive diagnoses via imaging in some situations.23 Most of the literature evaluating radiographs of patients with COVID-19 focuses on chest computed tomography (CT) findings, with initial results suggesting CT was more accurate than early RT-PCR methodologies.21,22,24 The Radiological Society of North America Expert consensus statement on chest CT for COVID-19 states that CT findings can even precede positivity on RT-PCR in some cases.22 However, currently it does not recommend the use of CT scanning as a screening tool. Furthermore, the actual sensitivity and specificity of CT interpretation by radiologists for COVID-19 are unknown.22
Characteristic CT findings include ground-glass opacities (GGOs) and consolidation most commonly in the lung periphery, though a diffuse distribution was found in a minority of patients.21,23,25-27 Lomoro and colleagues recently summarized the CT findings from several reports that described abnormalities as most often bilateral and peripheral, subpleural, and affecting the lower lobes.26 Not surprisingly, CT appears more sensitive at detecting changes with COVID-19 than does CXR, with reports that a minority of patients exhibited CT changes before changes were visible on CXR.23,26
We focused our study on the potential of AI in the examination of CXRs in patients with COVID-19, as there are several limitations to the routine use of CT scans with conditions such as COVID-19. Aside from the more considerable time required to obtain CTs, there are issues with contamination of CT suites, sometimes requiring a dedicated COVID-19 CT scanner.23,28 The time constraints of decontamination or limited utilization of CT suites can delay or disrupt services for patients with and without COVID-19. Because of these factors, CXR may be a better resource to minimize the risk of infection to other patients. Also, accurate assessment of abnormalities on CXR for COVID-19 may identify patients in whom the CXR was performed for other purposes.23 CXR is more readily available than CT, especially in more remote or underdeveloped areas.28 Finally, as with CT, CXR abnormalities are reported to have appeared before RT-PCR tests became positive for a minority of patients.23
CXR findings described in patients with COVID-19 are similar to those of CT and include GGOs, consolidation, and hazy increased opacities.23,25,26,28,29 Like CT, the majority of patients who received CXR demonstrated greater involvement in the lower zones and peripherally.23,25,26,28,29 Most patients showed bilateral involvement. However, while these findings are common in patients with COVID-19, they are not specific and can be seen in other conditions, such as other viral pneumonia, bacterial pneumonia, injury from drug toxicity, inhalation injury, connective tissue disease, and idiopathic conditions.
Application of AI for COVID-19
Applications of AI in interpreting radiographs of various types are numerous, and extensive literature has been written on the topic.30 Using deep learning algorithms, AI has multiple possible roles to augment traditional radiograph interpretation. These include the potential for screening, triaging, and increasing the speed to render diagnoses. It also can provide a rapid “second opinion” to the radiologist to support the final interpretation. In areas with critical shortages of radiologists, AI potentially can be used to render the definitive diagnosis. In COVID- 19, imaging studies have been shown to correlate with disease severity and mortality, and AI could assist in monitoring the course of the disease as it progresses and potentially identify patients at greatest risk.27 Furthermore, early results from PCR have been considered suboptimal, and it is known that patients with COVID-19 can test negative initially even by reliable testing methodologies. As AI technology progresses, interpretation can detect and guide triage and treatment of patients with high suspicions of COVID-19 but negative initial PCR results, or in situations where test availability is limited or results are delayed. There are numerous potential benefits should a rapid diagnostic test as simple as a CXR be able to reliably impact containment and prevention of the spread of contagions such as COVID- 19 early in its course.
Few studies have assessed using AI in the radiologic diagnosis of COVID-19, most of which use CT scanning. Bai and colleagues demonstrated increased accuracy, sensitivity, and specificity in distinguishing chest CTs of COVID-19 patients from other types of pneumonia.21,31 A separate study demonstrated the utility of using AI to differentiate COVID-19 from community-acquired pneumonia with CT.32 However, the effective utility of AI for CXR interpretation also has been demonstrated.14,33 Implementation of convolutional neural network layers has allowed for reliable differentiation of viral and bacterial pneumonia with CXR imaging.34 Evidence suggests that there is great potential in the application of AI in the interpretation of radiographs of all types.
Finally, we have developed a publicly available website based on our studies.18 This website is for research use only as it is based on data from our preliminary investigation. To appear within the website, images must have protected health information removed before uploading. The information on the website, including text, graphics, images, or other material, is for research and may not be appropriate for all circumstances. The website does not provide medical, professional, or licensed advice and is not a substitute for consultation with a HCP. Medical advice should be sought from a qualified HCP for any questions, and the website should not be used for medical diagnosis or treatment.
Limitations
In our preliminary study, we have demonstrated the potential impact AI can have in multiple aspects of patient care for emerging pathogens such as COVID-19 using a test as readily available as a CXR. However, several limitations to this investigation should be mentioned. The study is retrospective in nature with limited sample size and with X-rays from patients with various stages of COVID-19 pneumonia. Also, cases of non-COVID-19 pneumonia are not stratified into different types or etiologies. We intend to demonstrate the potential of AI in differentiating COVID-19 pneumonia from non-COVID-19 pneumonia of any etiology, though future studies should address comparison of COVID-19 cases to more specific types of pneumonias, such as of bacterial or viral origin. Furthermore, the present study does not address any potential effects of additional radiographic findings from coexistent conditions, such as pulmonary edema as seen in congestive heart failure, pleural effusions (which can be seen with COVID-19 pneumonia, though rarely), interstitial lung disease, etc. Future studies are required to address these issues. Ultimately, prospective studies to assess AI-assisted radiographic interpretation in conditions such as COVID-19 are required to demonstrate the impact on diagnosis, treatment, outcome, and patient safety as these technologies are implemented.
Conclusions
We have used a readily available, commercial platform to demonstrate the potential of AI to assist in the successful diagnosis of COVID-19 pneumonia on CXR images. While this technology has numerous applications in radiology, we have focused on the potential impact on future world health crises such as COVID-19. The findings have implications for screening and triage, initial diagnosis, monitoring disease progression, and identifying patients at increased risk of morbidity and mortality. Based on the data, a website was created to demonstrate how such technologies could be shared and distributed to others to combat entities such as COVID-19 moving forward. Our study offers a small window into the potential for how AI will likely dramatically change the practice of medicine in the future.
1. World Health Organization. Coronavirus disease (COVID- 19) pandemic. https://www.who.int/emergencies/diseases /novel-coronavirus2019. Updated August 23, 2020. Accessed August 24, 2020.
2. World Health Organization. WHO Director-General’s opening remarks at the media briefing on COVID-19 - 11 March 2020. https://www.who.int/dg/speeches/detail/who -director-general-sopening-remarks-at-the-media-briefing -on-covid-19---11-march2020. Published March 11, 2020. Accessed August 24, 2020.
3. World Health Organization. Coronavirus disease (COVID- 19): situation report--209. https://www.who.int/docs /default-source/coronaviruse/situation-reports/20200816 -covid-19-sitrep-209.pdf. Updated August 16, 2020. Accessed August 24, 2020.
4. Nicola M, Alsafi Z, Sohrabi C, et al. The socio-economic implications of the coronavirus pandemic (COVID-19): a review. Int J Surg. 2020;78:185-193. doi:10.1016/j.ijsu.2020.04.018
5. da Costa VG, Moreli ML, Saivish MV. The emergence of SARS, MERS and novel SARS-2 coronaviruses in the 21st century. Arch Virol. 2020;165(7):1517-1526. doi:10.1007/s00705-020-04628-0
6. Borkowski AA, Wilson CP, Borkowski SA, et al. Comparing artificial intelligence platforms for histopathologic cancer diagnosis. Fed Pract. 2019;36(10):456-463.
7. Borkowski AA, Wilson CP, Borkowski SA, Thomas LB, Deland LA, Mastorides SM. Apple machine learning algorithms successfully detect colon cancer but fail to predict KRAS mutation status. http://arxiv.org/abs/1812.04660. Updated January 15, 2019. Accessed August 24, 2020.
8. Borkowski AA, Wilson CP, Borkowski SA, Deland LA, Mastorides SM. Using Apple machine learning algorithms to detect and subclassify non-small cell lung cancer. http:// arxiv.org/abs/1808.08230. Updated January 15, 2019. Accessed August 24, 2020.
9. Moor J. The Dartmouth College artificial intelligence conference: the next fifty years. AI Mag. 2006;27(4):87. doi:10.1609/AIMAG.V27I4.1911
10. Samuel AL. Some studies in machine learning using the game of checkers. IBM J Res Dev. 1959;3(3):210-229. doi:10.1147/rd.33.0210
11. Sarle WS. Neural networks and statistical models https:// people.orie.cornell.edu/davidr/or474/nn_sas.pdf. Published April 1994. Accessed August 24, 2020.
12. Schmidhuber J. Deep learning in neural networks: an overview. Neural Netw. 2015;61:85-117. doi:10.1016/j.neunet.2014.09.003
13. 13. LeCun Y, Bengio Y, Hinton G. Deep learning. Nature. 2015;521(7553):436-444. doi:10.1038/nature14539
14. Topol EJ. High-performance medicine: the convergence of human and artificial intelligence. Nat Med. 2019;25(1):44- 56. doi:10.1038/s41591-018-0300-7
15. Cohen JP, Morrison P, Dao L. COVID-19 Image Data Collection. Published online March 25, 2020. Accessed May 13, 2020. http://arxiv.org/abs/2003.11597
16. Radiological Society of America. RSNA pneumonia detection challenge. https://www.kaggle.com/c/rsnapneumonia- detectionchallenge. Accessed August 24, 2020.
17. Bloice MD, Roth PM, Holzinger A. Biomedical image augmentation using Augmentor. Bioinformatics. 2019;35(21):4522-4524. doi:10.1093/bioinformatics/btz259
18. Cepheid. Xpert Xpress SARS-CoV-2. https://www.cepheid .com/coronavirus. Accessed August 24, 2020.
19. Interknowlogy. COVID-19 detection in chest X-rays. https://interknowlogy-covid-19.azurewebsites.net. Accessed August 27, 2020.
20. Bernheim A, Mei X, Huang M, et al. Chest CT Findings in Coronavirus Disease-19 (COVID-19): Relationship to Duration of Infection. Radiology. 2020;295(3):200463. doi:10.1148/radiol.2020200463
21. Ai T, Yang Z, Hou H, et al. Correlation of Chest CT and RTPCR Testing for Coronavirus Disease 2019 (COVID-19) in China: a report of 1014 cases. Radiology. 2020;296(2):E32- E40. doi:10.1148/radiol.2020200642
22. Simpson S, Kay FU, Abbara S, et al. Radiological Society of North America Expert Consensus Statement on Reporting Chest CT Findings Related to COVID-19. Endorsed by the Society of Thoracic Radiology, the American College of Radiology, and RSNA - Secondary Publication. J Thorac Imaging. 2020;35(4):219-227. doi:10.1097/RTI.0000000000000524
23. Wong HYF, Lam HYS, Fong AH, et al. Frequency and distribution of chest radiographic findings in patients positive for COVID-19. Radiology. 2020;296(2):E72-E78. doi:10.1148/radiol.2020201160
24. Fang Y, Zhang H, Xie J, et al. Sensitivity of chest CT for COVID-19: comparison to RT-PCR. Radiology. 2020;296(2):E115-E117. doi:10.1148/radiol.2020200432
25. Chen N, Zhou M, Dong X, et al. Epidemiological and clinical characteristics of 99 cases of 2019 novel coronavirus pneumonia in Wuhan, China: a descriptive study. Lancet. 2020;395(10223):507-513. doi:10.1016/S0140-6736(20)30211-7
26. Lomoro P, Verde F, Zerboni F, et al. COVID-19 pneumonia manifestations at the admission on chest ultrasound, radiographs, and CT: single-center study and comprehensive radiologic literature review. Eur J Radiol Open. 2020;7:100231. doi:10.1016/j.ejro.2020.100231
27. Salehi S, Abedi A, Balakrishnan S, Gholamrezanezhad A. Coronavirus disease 2019 (COVID-19) imaging reporting and data system (COVID-RADS) and common lexicon: a proposal based on the imaging data of 37 studies. Eur Radiol. 2020;30(9):4930-4942. doi:10.1007/s00330-020-06863-0
28. Jacobi A, Chung M, Bernheim A, Eber C. Portable chest X-ray in coronavirus disease-19 (COVID- 19): a pictorial review. Clin Imaging. 2020;64:35-42. doi:10.1016/j.clinimag.2020.04.001
29. Bhat R, Hamid A, Kunin JR, et al. Chest imaging in patients hospitalized With COVID-19 infection - a case series. Curr Probl Diagn Radiol. 2020;49(4):294-301. doi:10.1067/j.cpradiol.2020.04.001
30. Liu X, Faes L, Kale AU, et al. A comparison of deep learning performance against health-care professionals in detecting diseases from medical imaging: a systematic review and meta-analysis. Lancet Digit Heal. 2019;1(6):E271- E297. doi:10.1016/S2589-7500(19)30123-2
31. Bai HX, Wang R, Xiong Z, et al. Artificial intelligence augmentation of radiologist performance in distinguishing COVID-19 from pneumonia of other origin at chest CT. Radiology. 2020;296(3):E156-E165. doi:10.1148/radiol.2020201491
32. Li L, Qin L, Xu Z, et al. Using artificial intelligence to detect COVID-19 and community-acquired pneumonia based on pulmonary CT: evaluation of the diagnostic accuracy. Radiology. 2020;296(2):E65-E71. doi:10.1148/radiol.2020200905
33. Rajpurkar P, Joshi A, Pareek A, et al. CheXpedition: investigating generalization challenges for translation of chest x-ray algorithms to the clinical setting. http://arxiv.org /abs/2002.11379. Updated March 11, 2020. Accessed August 24, 2020.
34. Kermany DS, Goldbaum M, Cai W, et al. Identifying medical diagnoses and treatable diseases by imagebased deep learning. Cell. 2018;172(5):1122-1131.e9. doi:10.1016/j.cell.2018.02.010
Mild TBI/Concussion Clinical Tools for Providers Used Within the Department of Defense and Defense Health Agency
Traumatic brain injury (TBI) is a major health concern that can cause significant disability as well as economic and social burden. The Centers for Disease Control and Prevention (CDC) reported a 58% increase in the number of TBI-related emergency department visits, hospitalizations, and deaths from 2006 to 2014.1 In the CDC report, falls and motor vehicle accidents accounted for 52.3% and 20.4%, respectively, of all civilian TBI-related hospitalizations. In 2014, 56,800 TBIs in the US resulted in death. A large proportion of severe TBI survivors continue to experience long-term physical, cognitive, and psychologic disorders and require extensive rehabilitation, which may disrupt relationships and prevent return to work.2 About 37% of people with mild TBI (mTBI) cases and 51% of severe cases were unable to return to previous jobs. A study examining psychosocial burden found that people with a history of TBI reported greater feelings of loneliness compared with individuals without TBI.3
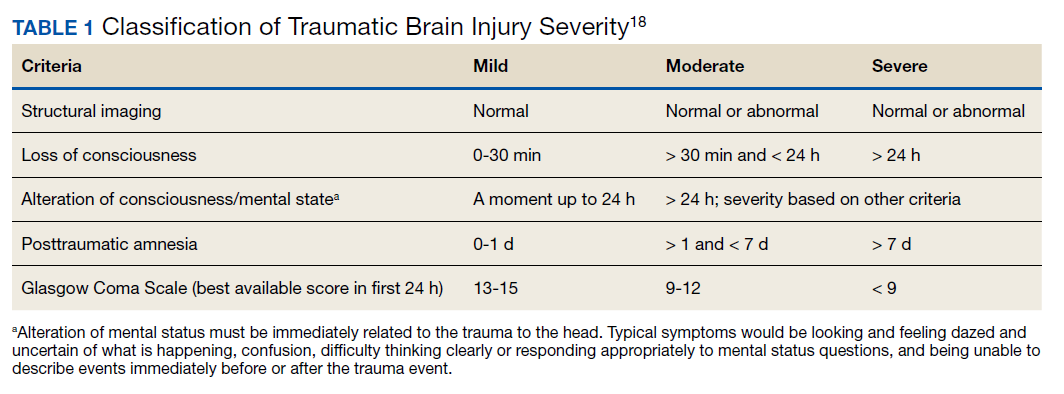
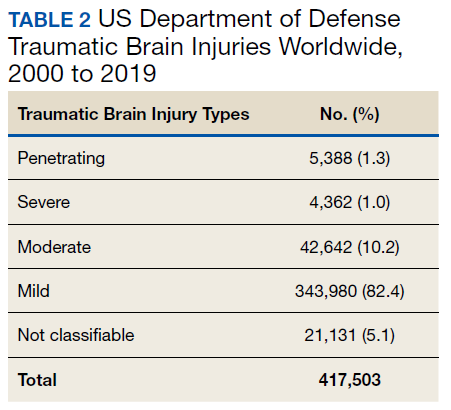
Within the US military, the Defense and Veterans Brain Injury Center (DVBIC) indicates that > 417,503 service members (SMs) have been diagnosed with TBI since November 2000.4 Of these, 82.4% were classified as having a mTBI, or concussion (Tables 1 and 2). The nature of combat and military training to which SMs are routinely exposed may increase the risk for sustaining a TBI. Specifically, the increased use of improvised explosives devices by enemy combatants in the recent military conflicts (ie, Operation Enduring Freedom, Operation Iraqi Freedom and Operation New Dawn) resulted in TBI being recognized as the signature injury of these conflicts and brought attention to the prevalence of concussion within the US military.5,6 In the military, the effects of concussion can decrease individual and unit effectiveness, emphasizing the importance of prompt diagnosis and proper management.7
Typically, patients recover from concussion within a few weeks of injury; however, some individuals experience symptoms that persist for months or years. Studies found that early intervention after concussion may aid in expediting recovery, stressing the importance of identifying concussion as promptly as possible.8,9 Active treatment is centered on patient education and symptom management, in addition to a progressive return to activities, as tolerated. Patient education may help validate the symptoms of some patients, as well as help to reattribute the symptoms to benign causes, leading to better outcomes.10 Since TBI is such a relevant health concern within the DoD, it is paramount for practitioners to understand what resources are available in order to identify and initiate treatment expeditiously.
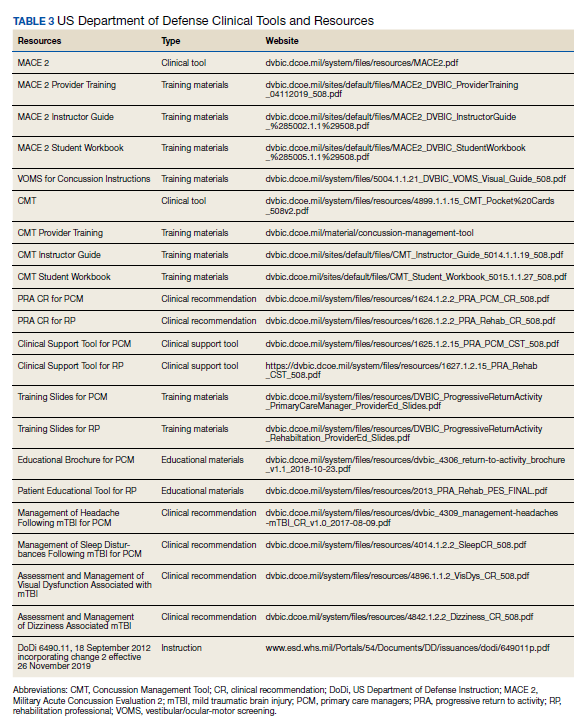
This article focuses on the clinical tools used in evaluating and treating concussion, and best practices treatment guidelines for health care providers (HCPs) who are required to evaluate and treat military populations. While these resources are used for military SMs, they can also be used in veteran and civilian populations. This article showcases 3 DoD clinical tools that assist HCPs in evaluating and treating patients with TBI: (1) the Military Acute Concussion Evaluation 2 (MACE 2); (2) the Progressive Return to Activity (PRA) Clinical Recommendation (CR); and (3) the Concussion Management Tool (CMT). Additional DoD clinical tools and resources are discussed, and resources and links for the practitioner are provided for easy access and reference.
Military Acute Concussion Evaluation 2
Early concussion identification and evaluation are important steps in the treatment process to ensure timely recovery and return to duty for SMs. As such, DVBIC assembled a working group of military and civilian brain injury experts to create an evidence-based clinical practice guideline for the assessment and management of concussion in a military operational setting that could be learned and effectively used by corpsmen and combat medics in the battlefield to screen for a possible concussion.7 This team created the first version of the MACE, a clinical tool that prompted a systematic assessment of concussion related symptoms, neurologic signs, and cognitive deficits. The cognitive assessment portion was based on the standardized assessment of concussion (SAC) that had been reported by McCrea and colleagues in 1998.11 Soon after its creation, field utilization of the MACE for screening of concussion was mandated by the Army through an All Army Action (ALARACT 178/2008) and for all of the Services through the DoD Instruction (DoDI) 6490.11 published in 2014.12
The MACE has been updated several times since the original version. Most recently, the MACE was revised in 2018 to include a vestibular oculomotor assessment section, and red flags that immediately alert the HCP to the need for immediate triage referral and treatment of the patient possibly at a higher echelon of care or with more emergent evaluation.13-15 Additionally, the neurologic examination was expanded to increase clarity and comprehensiveness, including speech and balance testing. Updates made to the tool were intended to provide a more thorough and informative evaluation of the SM with suspected concussion.
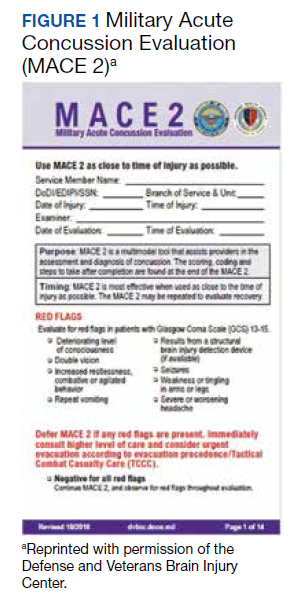
This latest version, MACE 2, is designed to be used by any HCP who is treating SMs with a suspected or potential TBI, not just corpsmen and combat medics in theater. The MACE 2 is a comprehensive evaluation within a set of portable pocket cards designed to assist end-users in the proper triage of potentially concussed individuals. The DoD has specified 4 events that require a MACE 2 evaluation: (1) SM was in a vehicle associated with a blast event, collision, or roll over; (2) SM was within 50 meters of a blast; (3) anyone who sustained a direct blow to the head; or (4) when command provides direction (eg, repeated exposures to the events above or in accordance with protocols).12 Sleep deprivation, medications, and pain may affect MACE 2 results, in addition to deployment related stress, chronic stress, high adrenaline sustained over time, and additional comorbidities. This tool is most effective when used as close to the time of injury as possible but also may be used later (after 24 hours of rest) to reevaluate symptoms. The MACE 2 Instructor Guide, a student workbook, HCP training, and Vestibular/Ocular-Motor Screening (VOMS) for Concussion instructions can be found on the DVBIC website (Table 3).
Description
The MACE 2 is a brief multimodal screening tool that assists medics, corpsman, and primary care managers (PCMs) in the assessment and identification of a potential concussion (Figure 1). Embedded in the MACE 2 is the Standardized Assessment of Concussion (SAC), a well-validated sports concussion tool, and the VOMS tool as portions of the 2-part cognitive examination. The entirety of the tool has 5 sections: (1) red flags; (2) acute concussion screening; (3) cognitive examination, part 1; (4) neurologic examination; and (5) cognitive examination, part 2. The end of the MACE 2 includes sections on the scoring, instructions for International Classification of Diseases, Tenth Revision, TBI coding, and next steps following completion of the MACE 2. The latest version of this screening tool impacts TBI care in several noteworthy ways. First, it broadens the scope of users by expanding use to all medically trained personnel, allowing any provider to treat SMs in the field. Second, it combines state-of-the-science advances from the research field and reflects feedback from end-users collected during the development. Last, the MACE 2 is updated as changes in the field occur, and is currently undergoing research to better identify end-user utility and usability.
Screening Tools
• Red Flags. The red flags section aids in identifying potentially serious underlying conditions in patients presenting with Glasgow Coma Scale (GCS) between 13 and 15. A positive red flag prompts the practitioner to stop administering the MACE 2 and immediately consult a higher level of care and consider urgent evacuation. While the red flags are completed first, and advancement to later sections of the MACE 2 is dependent upon the absence of red flags, the red flags should be monitored throughout the completion of the MACE 2. Upon completion of patient demographics and red flags, the remaining sections of the MACE 2 are dedicated to acute concussion screening.
• Acute Concussion Screening. The acute concussion screening portion consists of 4 sections: description of the incident; alteration of consciousness or memory; a “check all that apply” symptom inventory; and a patient history that includes concussions within the past 12 months, headache disorders, and/or behavioral health concerns. The final portion of the acute concussion screening section provides an algorithm to identify a positive or negative concussion screen. When a negative screen is identified, the user is prompted to prescribe a 24-hour rest period and follow up with the SM based on the guidance in the CMT. A positive screen warrants the user to continue administration of the MACE 2.
Neurologic and CognitiveExaminations
• Cognitive Exam Part 1. The initial cognitive examination is designed to assess orientation to time (eg, What is the day of the week, day of the month, the month, the year, and the timeof day?) as well as immediate recall of a short list of concrete words (5 words total, repeated for 3 trials). These tests are based on other neuropsychological measures designed to assess cognitive/mental status and short-term memory.
• The Neurological Exam. The neurological exam section of the MACE 2 includes brief neuropsychologic tests such as speech fluency and word finding. Other sections within the neurological exam assess the
following: grip strength, vestibular function/balance (eg, tandem gait and single leg stance), as well as motor function (eg, pronator drift), autonomic nervous system function (eg, pupil response), and vestibular function (eye-tracking).
• Cognitive Exam Part 2. After completion of the first cognitive examination and the neurologic examination, the second part of the cognitive examination is initiated. Part 2 includes measures of short-term and working memory (eg, digits-reverse tasks, listing the months in reverse order, and a delayed recall task of the short list of concrete words presented in the first part). The final assessment is the administration of the VOMS, a tool developed from the sports concussion field and designed to measure vestibular-ocular function.13 It is critical to note that the VOMS is contraindicated if there is concern of an unstable cervical spine or absence of a trained HCP. An examination summary provides guidance on test scoring and yields a positive or negative indication for concussive injury. A positive test refers users to guidelines listed in the Concussion Management Tool for recommendations. The final page provides coding instructions for entering the results into the patient’s electronic medical record for documentation and future reference.
Progressive Return To Activities Clinical Recommendation
The Progressive Return to Activities Clinical Recommendation (PRA CR) also was developed by DVBIC for the DoD to assist military HCPs in managing SMs with concussion by providing systematic and evidence-based guidance to both prevent extended rest and promote return to full duty as quickly and safely as clinically indicated. The general guidance is to monitor the SM at each of the 6 stages in the process and safely and gradually increase activity to the next stage as tolerated. Daily symptoms are measured using the Neurobehavioral Symptom Inventory (NSI), which SMs self-administer every morning at each stage within the process.
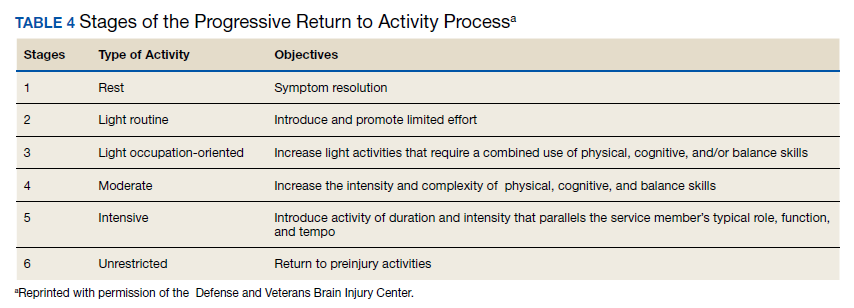
Prior to initiation of the progressive return to activity, SM education using the educational brochure is strongly encouraged, as previous evidence suggests that it is an effective intervention during the acute stages of injury.10,11 Return to activity follows a 6 stage process, from stage 1 (rest) through stage 6 (unrestricted activity) (Table 4). Referral to rehabilitation providers (RPs) or higher care is left to the discretion of the PCM when (1) recovery is not progressing as anticipated; (2) progression is not being made within a 7-day period; or (3) symptoms worsen with time. The guidance outlined in the PRA CR is consistent with current policies and medical literature, and undergoes reviews as updates in the field emerge. The PRA for PCM, PRA for RP, Clinical Support Tool for PCM, Clinical Support Tool for RP, Training Slides for PCM, Training Slides for RP, Educational Brochure for PCM, and Patient Educational Tool for RP can be found on the DVBIC website (dvbic.dcoe.mil).
Description
To improve the clinical utility, 2 separate PRA CRs were developed specifically for PCMs (Figure 2) and RPs (Figure 3). The PRA CR for PCMs provides the initial framework to monitor SMs during recovery and gradually increase physical, cognitive, and vestibular/balance activities as symptoms improve in order to return to preinjury activities. The PRA CR for RPs outlines the approach for treating SMs who meet 1 of the following criteria: recovery is not progressing as anticipated, there is no progression in 7 days, symptoms are worsening, the SM is symptomatic after exertional testing following stage 5, or referral made per PCM judgment. Following the mandatory 24-hour rest period after a diagnosis of a concussion, progression through the PRA algorithm is based on history of concussion within the past 12 months (ie, 1, 2, or ≥ 3 concussions) and symptomatology, with varying treatment pathways depending on the SM’s responses to history and symptomology.
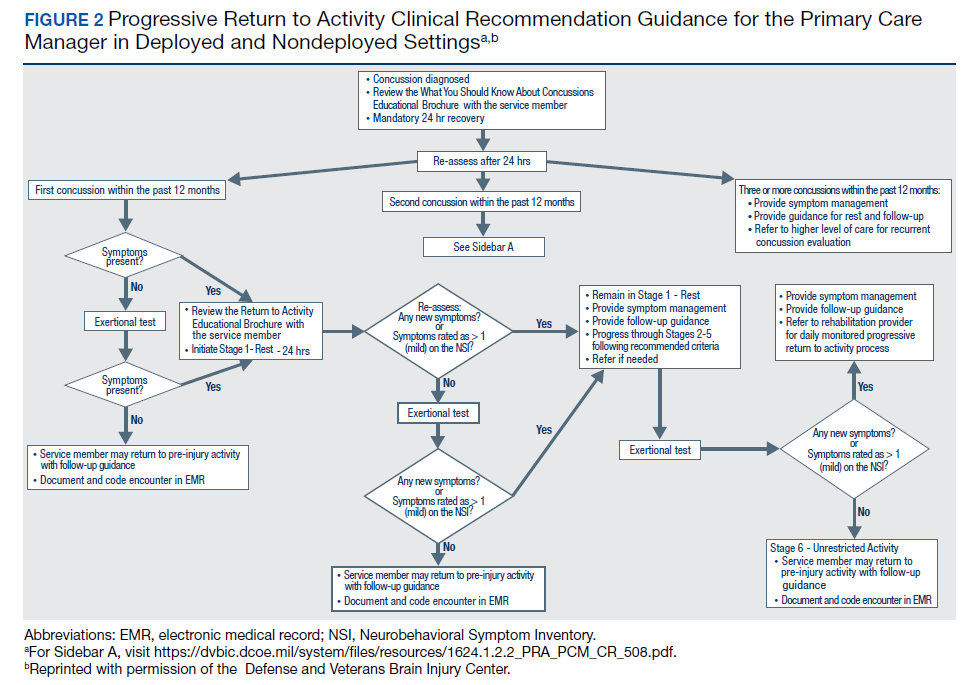
Guidelines
• One Concussion within Past 12 Months. Following the mandatory 24-hour rest period, if the SM is asymptomatic, then exertional testing (eg, activities such as push-ups, sit-ups, running in place, step aerobics, stationary bike, treadmill and/or hand crank) is performed at 65 to 85% of target heart rate for 2 minutes and symptoms are reassessed. If still asymptomatic, the SM may return to preinjury activity; however, if exertional testing provokes symptoms > 1 (mild) on the NSI, the SM should return to stage 1 with an additional 24 hours of rest. A second exertional test can be performed after stage 1, and if symptoms are provoked, progression through the remaining stages 2 to 5 is encouraged. Symptoms are continually monitored throughout each stage to determine whether the SM is recovered sufficiently to proceed to the next stage.
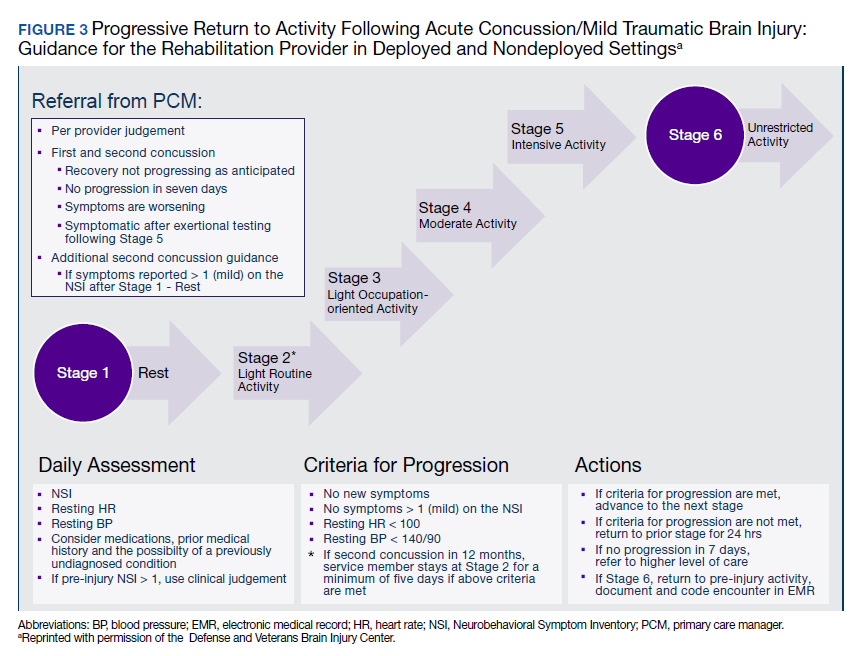
• Two Concussion Within Past 12 Months. Following the mandatory 24-hour rest period, no exertional testing is performed, and SMs move directly into stage 1 and remain at stage 1 or stage 2 for 7 consecutive days with no symptoms > 1 on the NSI before advancing through the remaining stages. Some defining features are longer rest periods (eg, 5 additional days of rest at stage 2) and additional patient education, symptom management, and follow-up.
• Three or more Concussions Within Past 12 Months. Following the 24 hour mandatory rest period, in cases where ≥ 3 concussions have occurred within a 12 month period, the recommendation is to provide guidance for symptom management rest and refer the SM to a higher level of care.
Concussion Management Tool
Beyond the initial assessment and concussion evaluation and the promotion of SMs’ timely return to duty, the DoD developed a tool to help endpoint users manage concussion, to include those with more protracted symptoms (Figure 4). The CMT assists HCPs and the SMs they treat in the management of symptoms before and after they return to duty. Specifically, the CMT is designed to be given in combination with guidelines issued by the DoD in the PRA CR but extends management of concussion to include those symptoms experienced more long-term, or symptoms that are not solely addressed during the timeline of the PRA CR. Together, the MACE 2, PRA CR, and the CMT provide endpoint users with a set of tools to comprehensively evaluate, treat, and manage concussions in SMs.
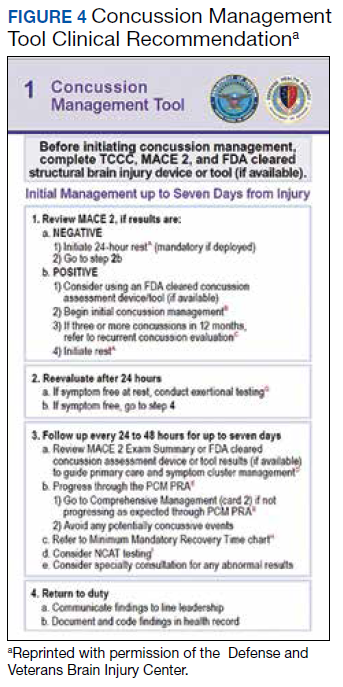
Description
The CMT provides step-by-step guidance for the initial and comprehensive management of concussion, once a diagnosis is made using assessments in the MACE 2. All types of HCPs, particularly those with limited training, such as Navy Hospital Corpsman and Army Combat Medics, are the intended clinical audience for the CMT. This tool was revised in 2019 to better align with the MACE 2, PRA CR, and other DVBIC CRs, and replaces the 2012 Concussion Management Algorithm and the 2014 Army Concussion Management in Garrison Setting Algorithm. The first 2 sections of the CMT are action cards, which provide management guidelines for acute injuries up to 7 days following injury and for comprehensive management beyond 1 week. Guidelines within the CMT partially overlap with those in the PRA CR; however, the PRA is designed for a more acute timeline, whereas the CMT focuses on symptom management following a more protracted recovery. The CMT clinical tool, provider training, instructor guide, and student workbook all can be found on the DVBIC website (Table 3).
Discussion
It is important for HCPs to have the skills and clinically relevant tools to optimize accurate TBI assessment. Early and accurate assessment and effective symptom management allows SMs to receive timely treatment based on clinical recommendations, and prevent and/or minimize secondary injury and prolonged recovery. Several longitudinal studies emphasize the benefits of early diagnosis and systematic follow-up.16-18 Prompt diagnosis, patient education, and early initiation to treatment may help optimize triage to care, mitigate prolonged symptoms by educating the patient on what to expect, and target specific symptoms early.8,10 Beyond the health outcomes of an individual SM, TBI recovery impacts unit readiness and consequently force readiness. As such, health outcomes and medical readiness are a priority of the Defense Health Agency (DHA).
The DHA priorities are, in part, based on DoD policy guidance for the management of concussion in the deployed setting. According to DoD instruction, “Medically documented mTBI/concussion in service members shall be clinically evaluated, treated, and managed according to the most current DoD clinical practice guidance for the deployed environment found in the Defense and Veterans Brain Injury Center (DVBIC) guidance, ‘Medical Providers: Clinical Tools.’”12 In 2018, the Deputy Secretary of Defense issued a memorandum regarding the comprehensive strategy and action plan for warfighter brain health.12 Therein, the memorandum acknowledges the enduring responsibility of the DoD to promote and protect the health and well-being of members of the nation’s armed forces. Particular emphasis was placed on issuing a response to the effects caused by concussive impacts and exposure to blast waves. This response resulted in a commitment by the DoD to understanding, preventing, diagnosing, and treating TBI in all forms. Taken together, the message from the secretary of defense and instruction from the DoD is clear and makes imperative the use of DoD clinical tools to accomplish this commitment.
Conclusion
This article showcases 3 of the DoD’s TBI clinical tools (MACE 2, PRA CR, and CMT) that assist HCPs in identifying and treating concussion. Over time, these tools undergo revisions according to the state of the science, and are adapted to meet the needs of clinicians and the SMs they treat. Studies are currently ongoing to better understand the effectiveness of these tools as well as to assist clinicians in making return-to-duty and/or medical separation decisions. These tools assist clinicians throughout the recovery process; from initial assessment and treatment (acute phase), as well as with symptom management (acute and protracted symptoms).
Concussion is not a homogenous condition and the experiences of the SM, including events that may cause emotional distress, other injuries and/or other factors, may further complicate the injury. Accordingly, there is no single clinical tool that can conclusively determine return-to-duty status; rather, these tools can help characterize injury, validate, and treat symptoms, which have been suggested to improve outcomes. More research and data are needed confirm the effectiveness of these tools to improve outcomes.
It is beyond the scope of this article to provide a more in-depth discussion on TBI prevention or longer term effects/care. However, there are additional, personalized tools for specific symptoms, deficits, or dysfunctions following concussion. These tools include the Management of Headache Following mTBI for PCM CR, Management of Sleep Disturbances Following mTBI for PCM CR, Assessment and Management of Visual Dysfunction Associated with mTBI CR, and Assessment and Management of Dizziness Associated mTBI CR. These tools enable endpoint users to evaluate and treat SMs as well as know when to elevate to higher levels of care.
The DoD commitment toward treating TBI influenced the development of the clinical tools highlighted in this article. They are the result of collective efforts among military and civilian TBI subject matter experts, data from medical literature and state-of-the-science research, and feedback from endpoint users to create the most effective, evidence-based tools. These tools undergo continuous review and revision to ensure alignment with the most up-to-date science within the field, to meet the needs of SMs and to continue the commitment to DoD concussion care.
Acknowledgments
This work was prepared under Contract (HT0014-19-C-0004) General Dynamics Information Technology and (W81XWH-16-F-0330) Credence Management Solutions, and is defined as U.S. Government work under Title 17 U.S.C.§101. Per Title 17 U.S.C.§105, copyright protection is not available for any work of the U.S. Government. For more information, please contact [email protected].
1. Centers for Disease Control and Prevention. Surveillance report of traumatic brain injury-related emergency department visits, hospitalizations, and deaths. https://www.cdc.gov/traumaticbraininjury/pdf/TBI-Surveillance-Report-FINAL_508.pdf. Published 2014. Accessed August 18, 2020.
2. Stocchetti N, Zanier ER. Chronic impact of traumatic brain injury on outcome and quality of life: a narrative review. Crit Care. 2016;20(1):148. Published 2016 Jun 21. doi:10.1186/s13054-016-1318-1
3. Kumar RG, Ornstein KA, Bollens-Lund E, et al. Lifetime history of traumatic brain injury is associated with increased loneliness in adults: A US nationally representative study. Int J Geriatr Psychiatry. 2020;35(5):553-563. doi:10.1002/gps.5271
4. Defense and Veterans Brain Injury Center. Worldwide DoD numbers for traumatic brain injury. 2020; https://dvbic.dcoe.mil/sites/default/files/tbi-numbers/DVBIC_WorldwideTotal_2000-2019.pdf. Updated March 10, 2020. Accessed August 18, 2020.
5. Kennedy JE, Lu LH, Reid MW, Leal FO, Cooper DB. Correlates of depression in U.S. military service members with a history of mild traumatic brain injury. Mil Med. 2019;184(suppl 1):148-154. doi:10.1093/milmed/usy321
6. Marshall KR, Holland SL, Meyer KS, Martin EM, Wilmore M, Grimes JB. Mild traumatic brain injury screening, diagnosis, and treatment. Mil Med. 2012;177(suppl 8):67-75. doi:10.7205/milmed-d-12-00110
7. French L, McCrea M., Baggett M. The Military Acute Concussion Evaluation. J Spec Oper Med. 2008;8(1):68-77. https://www.jsomonline.org/Publications/2008168French.pdf. Accessed August 18, 2020.
8. Kontos AP, Jorgensen-Wagers K, Trbovich AM, et al. Association of time since injury to the first clinic visit with recovery following concussion. JAMA Neurol. 2020;77(4):435-440. doi:10.1001/jamaneurol.2019.4552
9. Ponsford J, Willmott C, Rothwell A, et al. Impact of early intervention on outcome following mild head injury in adults. J Neurol Neurosurg Psychiatry. 2002;73(3):330-332. doi:10.1136/jnnp.73.3.33010.
10. Mittenberg W, Canyock EM, Condit D, Patton C. Treatment of post-concussion syndrome following mild head injury. J Clin Exp Neuropsychol. 2001;23(6):829-836. doi:10.1076/jcen.23.6.829.1022
11. McCrea M, Kelly JP, Randolph C, et al. Standardized assessment of concussion (SAC): on-site mental status evaluation of the athlete. J Head Trauma Rehabil. 1998;13(2):27-35. doi:10.1097/00001199-199804000-00005
12. US Department of Defense. Department of Defense Instruction, Number 6490.11. Policy guidance for management of mild traumatic brain injury/concussion in the deployed setting. https://www.esd.whs.mil/Portals/54/Documents/DD/issuances/dodi/649011p.pdf. Updated November 26, 2019. Accessed August 18, 2020.
13. Mucha A, Collins MW, Elbin RJ, et al. A brief Vestibular/Ocular Motor Screening (VOMS) assessment to evaluate concussions: preliminary findings. Am J Sports Med. 2014;42(10):2479-2486. doi:10.1177/0363546514543775
14. Defense and Veterans Brain Injury Center. Military Acute Concussion Evaluation 2 (MACE 2). https://dvbic.dcoe.mil/material/military-acute-concussion-evaluation-2-mace-2. Updated August 18, 2020. Accessed August 18, 2020.
15. US Department of Defense, Defense Health Agency. Defense and Veterans Brain Injury Center releases new concussion screening tool. https://www.health.mil/News/Articles/2019/03/15/Defense-and-Veterans-Brain-Injury-Center-releases-new-concussion-screening-tool. Published March 15, 2019. Accessed August 18, 2020.
16. Schwab K, Terrio HP, Brenner LA, et al. Epidemiology and prognosis of mild traumatic brain injury in returning soldiers: a cohort study. Neurology. 2017;88(16):1571-1579. doi:10.1212/WNL.0000000000003839
17. Mac Donald CL, Johnson AM, Wierzechowski L, et al. Outcome trends after US military concussive traumatic brain injury. J Neurotrauma. 2017;34(14):2206-2219. doi:10.1089/neu.2016.4434
18. Andelic N, Howe EI, Hellstrøm T, et al. Disability and quality of life 20 years after traumatic brain injury. Brain Behav. 2018;8(7):e01018. doi:10.1002/brb3.1018
Traumatic brain injury (TBI) is a major health concern that can cause significant disability as well as economic and social burden. The Centers for Disease Control and Prevention (CDC) reported a 58% increase in the number of TBI-related emergency department visits, hospitalizations, and deaths from 2006 to 2014.1 In the CDC report, falls and motor vehicle accidents accounted for 52.3% and 20.4%, respectively, of all civilian TBI-related hospitalizations. In 2014, 56,800 TBIs in the US resulted in death. A large proportion of severe TBI survivors continue to experience long-term physical, cognitive, and psychologic disorders and require extensive rehabilitation, which may disrupt relationships and prevent return to work.2 About 37% of people with mild TBI (mTBI) cases and 51% of severe cases were unable to return to previous jobs. A study examining psychosocial burden found that people with a history of TBI reported greater feelings of loneliness compared with individuals without TBI.3
Within the US military, the Defense and Veterans Brain Injury Center (DVBIC) indicates that > 417,503 service members (SMs) have been diagnosed with TBI since November 2000.4 Of these, 82.4% were classified as having a mTBI, or concussion (Tables 1 and 2). The nature of combat and military training to which SMs are routinely exposed may increase the risk for sustaining a TBI. Specifically, the increased use of improvised explosives devices by enemy combatants in the recent military conflicts (ie, Operation Enduring Freedom, Operation Iraqi Freedom and Operation New Dawn) resulted in TBI being recognized as the signature injury of these conflicts and brought attention to the prevalence of concussion within the US military.5,6 In the military, the effects of concussion can decrease individual and unit effectiveness, emphasizing the importance of prompt diagnosis and proper management.7
Typically, patients recover from concussion within a few weeks of injury; however, some individuals experience symptoms that persist for months or years. Studies found that early intervention after concussion may aid in expediting recovery, stressing the importance of identifying concussion as promptly as possible.8,9 Active treatment is centered on patient education and symptom management, in addition to a progressive return to activities, as tolerated. Patient education may help validate the symptoms of some patients, as well as help to reattribute the symptoms to benign causes, leading to better outcomes.10 Since TBI is such a relevant health concern within the DoD, it is paramount for practitioners to understand what resources are available in order to identify and initiate treatment expeditiously.
This article focuses on the clinical tools used in evaluating and treating concussion, and best practices treatment guidelines for health care providers (HCPs) who are required to evaluate and treat military populations. While these resources are used for military SMs, they can also be used in veteran and civilian populations. This article showcases 3 DoD clinical tools that assist HCPs in evaluating and treating patients with TBI: (1) the Military Acute Concussion Evaluation 2 (MACE 2); (2) the Progressive Return to Activity (PRA) Clinical Recommendation (CR); and (3) the Concussion Management Tool (CMT). Additional DoD clinical tools and resources are discussed, and resources and links for the practitioner are provided for easy access and reference.
Military Acute Concussion Evaluation 2
Early concussion identification and evaluation are important steps in the treatment process to ensure timely recovery and return to duty for SMs. As such, DVBIC assembled a working group of military and civilian brain injury experts to create an evidence-based clinical practice guideline for the assessment and management of concussion in a military operational setting that could be learned and effectively used by corpsmen and combat medics in the battlefield to screen for a possible concussion.7 This team created the first version of the MACE, a clinical tool that prompted a systematic assessment of concussion related symptoms, neurologic signs, and cognitive deficits. The cognitive assessment portion was based on the standardized assessment of concussion (SAC) that had been reported by McCrea and colleagues in 1998.11 Soon after its creation, field utilization of the MACE for screening of concussion was mandated by the Army through an All Army Action (ALARACT 178/2008) and for all of the Services through the DoD Instruction (DoDI) 6490.11 published in 2014.12
The MACE has been updated several times since the original version. Most recently, the MACE was revised in 2018 to include a vestibular oculomotor assessment section, and red flags that immediately alert the HCP to the need for immediate triage referral and treatment of the patient possibly at a higher echelon of care or with more emergent evaluation.13-15 Additionally, the neurologic examination was expanded to increase clarity and comprehensiveness, including speech and balance testing. Updates made to the tool were intended to provide a more thorough and informative evaluation of the SM with suspected concussion.
This latest version, MACE 2, is designed to be used by any HCP who is treating SMs with a suspected or potential TBI, not just corpsmen and combat medics in theater. The MACE 2 is a comprehensive evaluation within a set of portable pocket cards designed to assist end-users in the proper triage of potentially concussed individuals. The DoD has specified 4 events that require a MACE 2 evaluation: (1) SM was in a vehicle associated with a blast event, collision, or roll over; (2) SM was within 50 meters of a blast; (3) anyone who sustained a direct blow to the head; or (4) when command provides direction (eg, repeated exposures to the events above or in accordance with protocols).12 Sleep deprivation, medications, and pain may affect MACE 2 results, in addition to deployment related stress, chronic stress, high adrenaline sustained over time, and additional comorbidities. This tool is most effective when used as close to the time of injury as possible but also may be used later (after 24 hours of rest) to reevaluate symptoms. The MACE 2 Instructor Guide, a student workbook, HCP training, and Vestibular/Ocular-Motor Screening (VOMS) for Concussion instructions can be found on the DVBIC website (Table 3).
Description
The MACE 2 is a brief multimodal screening tool that assists medics, corpsman, and primary care managers (PCMs) in the assessment and identification of a potential concussion (Figure 1). Embedded in the MACE 2 is the Standardized Assessment of Concussion (SAC), a well-validated sports concussion tool, and the VOMS tool as portions of the 2-part cognitive examination. The entirety of the tool has 5 sections: (1) red flags; (2) acute concussion screening; (3) cognitive examination, part 1; (4) neurologic examination; and (5) cognitive examination, part 2. The end of the MACE 2 includes sections on the scoring, instructions for International Classification of Diseases, Tenth Revision, TBI coding, and next steps following completion of the MACE 2. The latest version of this screening tool impacts TBI care in several noteworthy ways. First, it broadens the scope of users by expanding use to all medically trained personnel, allowing any provider to treat SMs in the field. Second, it combines state-of-the-science advances from the research field and reflects feedback from end-users collected during the development. Last, the MACE 2 is updated as changes in the field occur, and is currently undergoing research to better identify end-user utility and usability.
Screening Tools
• Red Flags. The red flags section aids in identifying potentially serious underlying conditions in patients presenting with Glasgow Coma Scale (GCS) between 13 and 15. A positive red flag prompts the practitioner to stop administering the MACE 2 and immediately consult a higher level of care and consider urgent evacuation. While the red flags are completed first, and advancement to later sections of the MACE 2 is dependent upon the absence of red flags, the red flags should be monitored throughout the completion of the MACE 2. Upon completion of patient demographics and red flags, the remaining sections of the MACE 2 are dedicated to acute concussion screening.
• Acute Concussion Screening. The acute concussion screening portion consists of 4 sections: description of the incident; alteration of consciousness or memory; a “check all that apply” symptom inventory; and a patient history that includes concussions within the past 12 months, headache disorders, and/or behavioral health concerns. The final portion of the acute concussion screening section provides an algorithm to identify a positive or negative concussion screen. When a negative screen is identified, the user is prompted to prescribe a 24-hour rest period and follow up with the SM based on the guidance in the CMT. A positive screen warrants the user to continue administration of the MACE 2.
Neurologic and CognitiveExaminations
• Cognitive Exam Part 1. The initial cognitive examination is designed to assess orientation to time (eg, What is the day of the week, day of the month, the month, the year, and the timeof day?) as well as immediate recall of a short list of concrete words (5 words total, repeated for 3 trials). These tests are based on other neuropsychological measures designed to assess cognitive/mental status and short-term memory.
• The Neurological Exam. The neurological exam section of the MACE 2 includes brief neuropsychologic tests such as speech fluency and word finding. Other sections within the neurological exam assess the
following: grip strength, vestibular function/balance (eg, tandem gait and single leg stance), as well as motor function (eg, pronator drift), autonomic nervous system function (eg, pupil response), and vestibular function (eye-tracking).
• Cognitive Exam Part 2. After completion of the first cognitive examination and the neurologic examination, the second part of the cognitive examination is initiated. Part 2 includes measures of short-term and working memory (eg, digits-reverse tasks, listing the months in reverse order, and a delayed recall task of the short list of concrete words presented in the first part). The final assessment is the administration of the VOMS, a tool developed from the sports concussion field and designed to measure vestibular-ocular function.13 It is critical to note that the VOMS is contraindicated if there is concern of an unstable cervical spine or absence of a trained HCP. An examination summary provides guidance on test scoring and yields a positive or negative indication for concussive injury. A positive test refers users to guidelines listed in the Concussion Management Tool for recommendations. The final page provides coding instructions for entering the results into the patient’s electronic medical record for documentation and future reference.
Progressive Return To Activities Clinical Recommendation
The Progressive Return to Activities Clinical Recommendation (PRA CR) also was developed by DVBIC for the DoD to assist military HCPs in managing SMs with concussion by providing systematic and evidence-based guidance to both prevent extended rest and promote return to full duty as quickly and safely as clinically indicated. The general guidance is to monitor the SM at each of the 6 stages in the process and safely and gradually increase activity to the next stage as tolerated. Daily symptoms are measured using the Neurobehavioral Symptom Inventory (NSI), which SMs self-administer every morning at each stage within the process.
Prior to initiation of the progressive return to activity, SM education using the educational brochure is strongly encouraged, as previous evidence suggests that it is an effective intervention during the acute stages of injury.10,11 Return to activity follows a 6 stage process, from stage 1 (rest) through stage 6 (unrestricted activity) (Table 4). Referral to rehabilitation providers (RPs) or higher care is left to the discretion of the PCM when (1) recovery is not progressing as anticipated; (2) progression is not being made within a 7-day period; or (3) symptoms worsen with time. The guidance outlined in the PRA CR is consistent with current policies and medical literature, and undergoes reviews as updates in the field emerge. The PRA for PCM, PRA for RP, Clinical Support Tool for PCM, Clinical Support Tool for RP, Training Slides for PCM, Training Slides for RP, Educational Brochure for PCM, and Patient Educational Tool for RP can be found on the DVBIC website (dvbic.dcoe.mil).
Description
To improve the clinical utility, 2 separate PRA CRs were developed specifically for PCMs (Figure 2) and RPs (Figure 3). The PRA CR for PCMs provides the initial framework to monitor SMs during recovery and gradually increase physical, cognitive, and vestibular/balance activities as symptoms improve in order to return to preinjury activities. The PRA CR for RPs outlines the approach for treating SMs who meet 1 of the following criteria: recovery is not progressing as anticipated, there is no progression in 7 days, symptoms are worsening, the SM is symptomatic after exertional testing following stage 5, or referral made per PCM judgment. Following the mandatory 24-hour rest period after a diagnosis of a concussion, progression through the PRA algorithm is based on history of concussion within the past 12 months (ie, 1, 2, or ≥ 3 concussions) and symptomatology, with varying treatment pathways depending on the SM’s responses to history and symptomology.
Guidelines
• One Concussion within Past 12 Months. Following the mandatory 24-hour rest period, if the SM is asymptomatic, then exertional testing (eg, activities such as push-ups, sit-ups, running in place, step aerobics, stationary bike, treadmill and/or hand crank) is performed at 65 to 85% of target heart rate for 2 minutes and symptoms are reassessed. If still asymptomatic, the SM may return to preinjury activity; however, if exertional testing provokes symptoms > 1 (mild) on the NSI, the SM should return to stage 1 with an additional 24 hours of rest. A second exertional test can be performed after stage 1, and if symptoms are provoked, progression through the remaining stages 2 to 5 is encouraged. Symptoms are continually monitored throughout each stage to determine whether the SM is recovered sufficiently to proceed to the next stage.
• Two Concussion Within Past 12 Months. Following the mandatory 24-hour rest period, no exertional testing is performed, and SMs move directly into stage 1 and remain at stage 1 or stage 2 for 7 consecutive days with no symptoms > 1 on the NSI before advancing through the remaining stages. Some defining features are longer rest periods (eg, 5 additional days of rest at stage 2) and additional patient education, symptom management, and follow-up.
• Three or more Concussions Within Past 12 Months. Following the 24 hour mandatory rest period, in cases where ≥ 3 concussions have occurred within a 12 month period, the recommendation is to provide guidance for symptom management rest and refer the SM to a higher level of care.
Concussion Management Tool
Beyond the initial assessment and concussion evaluation and the promotion of SMs’ timely return to duty, the DoD developed a tool to help endpoint users manage concussion, to include those with more protracted symptoms (Figure 4). The CMT assists HCPs and the SMs they treat in the management of symptoms before and after they return to duty. Specifically, the CMT is designed to be given in combination with guidelines issued by the DoD in the PRA CR but extends management of concussion to include those symptoms experienced more long-term, or symptoms that are not solely addressed during the timeline of the PRA CR. Together, the MACE 2, PRA CR, and the CMT provide endpoint users with a set of tools to comprehensively evaluate, treat, and manage concussions in SMs.
Description
The CMT provides step-by-step guidance for the initial and comprehensive management of concussion, once a diagnosis is made using assessments in the MACE 2. All types of HCPs, particularly those with limited training, such as Navy Hospital Corpsman and Army Combat Medics, are the intended clinical audience for the CMT. This tool was revised in 2019 to better align with the MACE 2, PRA CR, and other DVBIC CRs, and replaces the 2012 Concussion Management Algorithm and the 2014 Army Concussion Management in Garrison Setting Algorithm. The first 2 sections of the CMT are action cards, which provide management guidelines for acute injuries up to 7 days following injury and for comprehensive management beyond 1 week. Guidelines within the CMT partially overlap with those in the PRA CR; however, the PRA is designed for a more acute timeline, whereas the CMT focuses on symptom management following a more protracted recovery. The CMT clinical tool, provider training, instructor guide, and student workbook all can be found on the DVBIC website (Table 3).
Discussion
It is important for HCPs to have the skills and clinically relevant tools to optimize accurate TBI assessment. Early and accurate assessment and effective symptom management allows SMs to receive timely treatment based on clinical recommendations, and prevent and/or minimize secondary injury and prolonged recovery. Several longitudinal studies emphasize the benefits of early diagnosis and systematic follow-up.16-18 Prompt diagnosis, patient education, and early initiation to treatment may help optimize triage to care, mitigate prolonged symptoms by educating the patient on what to expect, and target specific symptoms early.8,10 Beyond the health outcomes of an individual SM, TBI recovery impacts unit readiness and consequently force readiness. As such, health outcomes and medical readiness are a priority of the Defense Health Agency (DHA).
The DHA priorities are, in part, based on DoD policy guidance for the management of concussion in the deployed setting. According to DoD instruction, “Medically documented mTBI/concussion in service members shall be clinically evaluated, treated, and managed according to the most current DoD clinical practice guidance for the deployed environment found in the Defense and Veterans Brain Injury Center (DVBIC) guidance, ‘Medical Providers: Clinical Tools.’”12 In 2018, the Deputy Secretary of Defense issued a memorandum regarding the comprehensive strategy and action plan for warfighter brain health.12 Therein, the memorandum acknowledges the enduring responsibility of the DoD to promote and protect the health and well-being of members of the nation’s armed forces. Particular emphasis was placed on issuing a response to the effects caused by concussive impacts and exposure to blast waves. This response resulted in a commitment by the DoD to understanding, preventing, diagnosing, and treating TBI in all forms. Taken together, the message from the secretary of defense and instruction from the DoD is clear and makes imperative the use of DoD clinical tools to accomplish this commitment.
Conclusion
This article showcases 3 of the DoD’s TBI clinical tools (MACE 2, PRA CR, and CMT) that assist HCPs in identifying and treating concussion. Over time, these tools undergo revisions according to the state of the science, and are adapted to meet the needs of clinicians and the SMs they treat. Studies are currently ongoing to better understand the effectiveness of these tools as well as to assist clinicians in making return-to-duty and/or medical separation decisions. These tools assist clinicians throughout the recovery process; from initial assessment and treatment (acute phase), as well as with symptom management (acute and protracted symptoms).
Concussion is not a homogenous condition and the experiences of the SM, including events that may cause emotional distress, other injuries and/or other factors, may further complicate the injury. Accordingly, there is no single clinical tool that can conclusively determine return-to-duty status; rather, these tools can help characterize injury, validate, and treat symptoms, which have been suggested to improve outcomes. More research and data are needed confirm the effectiveness of these tools to improve outcomes.
It is beyond the scope of this article to provide a more in-depth discussion on TBI prevention or longer term effects/care. However, there are additional, personalized tools for specific symptoms, deficits, or dysfunctions following concussion. These tools include the Management of Headache Following mTBI for PCM CR, Management of Sleep Disturbances Following mTBI for PCM CR, Assessment and Management of Visual Dysfunction Associated with mTBI CR, and Assessment and Management of Dizziness Associated mTBI CR. These tools enable endpoint users to evaluate and treat SMs as well as know when to elevate to higher levels of care.
The DoD commitment toward treating TBI influenced the development of the clinical tools highlighted in this article. They are the result of collective efforts among military and civilian TBI subject matter experts, data from medical literature and state-of-the-science research, and feedback from endpoint users to create the most effective, evidence-based tools. These tools undergo continuous review and revision to ensure alignment with the most up-to-date science within the field, to meet the needs of SMs and to continue the commitment to DoD concussion care.
Acknowledgments
This work was prepared under Contract (HT0014-19-C-0004) General Dynamics Information Technology and (W81XWH-16-F-0330) Credence Management Solutions, and is defined as U.S. Government work under Title 17 U.S.C.§101. Per Title 17 U.S.C.§105, copyright protection is not available for any work of the U.S. Government. For more information, please contact [email protected].
1. Centers for Disease Control and Prevention. Surveillance report of traumatic brain injury-related emergency department visits, hospitalizations, and deaths. https://www.cdc.gov/traumaticbraininjury/pdf/TBI-Surveillance-Report-FINAL_508.pdf. Published 2014. Accessed August 18, 2020.
2. Stocchetti N, Zanier ER. Chronic impact of traumatic brain injury on outcome and quality of life: a narrative review. Crit Care. 2016;20(1):148. Published 2016 Jun 21. doi:10.1186/s13054-016-1318-1
3. Kumar RG, Ornstein KA, Bollens-Lund E, et al. Lifetime history of traumatic brain injury is associated with increased loneliness in adults: A US nationally representative study. Int J Geriatr Psychiatry. 2020;35(5):553-563. doi:10.1002/gps.5271
4. Defense and Veterans Brain Injury Center. Worldwide DoD numbers for traumatic brain injury. 2020; https://dvbic.dcoe.mil/sites/default/files/tbi-numbers/DVBIC_WorldwideTotal_2000-2019.pdf. Updated March 10, 2020. Accessed August 18, 2020.
5. Kennedy JE, Lu LH, Reid MW, Leal FO, Cooper DB. Correlates of depression in U.S. military service members with a history of mild traumatic brain injury. Mil Med. 2019;184(suppl 1):148-154. doi:10.1093/milmed/usy321
6. Marshall KR, Holland SL, Meyer KS, Martin EM, Wilmore M, Grimes JB. Mild traumatic brain injury screening, diagnosis, and treatment. Mil Med. 2012;177(suppl 8):67-75. doi:10.7205/milmed-d-12-00110
7. French L, McCrea M., Baggett M. The Military Acute Concussion Evaluation. J Spec Oper Med. 2008;8(1):68-77. https://www.jsomonline.org/Publications/2008168French.pdf. Accessed August 18, 2020.
8. Kontos AP, Jorgensen-Wagers K, Trbovich AM, et al. Association of time since injury to the first clinic visit with recovery following concussion. JAMA Neurol. 2020;77(4):435-440. doi:10.1001/jamaneurol.2019.4552
9. Ponsford J, Willmott C, Rothwell A, et al. Impact of early intervention on outcome following mild head injury in adults. J Neurol Neurosurg Psychiatry. 2002;73(3):330-332. doi:10.1136/jnnp.73.3.33010.
10. Mittenberg W, Canyock EM, Condit D, Patton C. Treatment of post-concussion syndrome following mild head injury. J Clin Exp Neuropsychol. 2001;23(6):829-836. doi:10.1076/jcen.23.6.829.1022
11. McCrea M, Kelly JP, Randolph C, et al. Standardized assessment of concussion (SAC): on-site mental status evaluation of the athlete. J Head Trauma Rehabil. 1998;13(2):27-35. doi:10.1097/00001199-199804000-00005
12. US Department of Defense. Department of Defense Instruction, Number 6490.11. Policy guidance for management of mild traumatic brain injury/concussion in the deployed setting. https://www.esd.whs.mil/Portals/54/Documents/DD/issuances/dodi/649011p.pdf. Updated November 26, 2019. Accessed August 18, 2020.
13. Mucha A, Collins MW, Elbin RJ, et al. A brief Vestibular/Ocular Motor Screening (VOMS) assessment to evaluate concussions: preliminary findings. Am J Sports Med. 2014;42(10):2479-2486. doi:10.1177/0363546514543775
14. Defense and Veterans Brain Injury Center. Military Acute Concussion Evaluation 2 (MACE 2). https://dvbic.dcoe.mil/material/military-acute-concussion-evaluation-2-mace-2. Updated August 18, 2020. Accessed August 18, 2020.
15. US Department of Defense, Defense Health Agency. Defense and Veterans Brain Injury Center releases new concussion screening tool. https://www.health.mil/News/Articles/2019/03/15/Defense-and-Veterans-Brain-Injury-Center-releases-new-concussion-screening-tool. Published March 15, 2019. Accessed August 18, 2020.
16. Schwab K, Terrio HP, Brenner LA, et al. Epidemiology and prognosis of mild traumatic brain injury in returning soldiers: a cohort study. Neurology. 2017;88(16):1571-1579. doi:10.1212/WNL.0000000000003839
17. Mac Donald CL, Johnson AM, Wierzechowski L, et al. Outcome trends after US military concussive traumatic brain injury. J Neurotrauma. 2017;34(14):2206-2219. doi:10.1089/neu.2016.4434
18. Andelic N, Howe EI, Hellstrøm T, et al. Disability and quality of life 20 years after traumatic brain injury. Brain Behav. 2018;8(7):e01018. doi:10.1002/brb3.1018
Drug Overdose and Suicide Among Veteran Enrollees in the VHA: Comparison Among Local, Regional, and National Data
Suicide is the 10th leading cause of death in the US. In 2017, there were 47,173 deaths by suicide (14 deaths per 100,000 people), representing a 33% increase from 1999.1 In 2017 veterans accounted for 13.5% of all suicide deaths among US adults, although veterans comprised only 7.9% of the adult population; the age- and sex-adjusted suicide rate was 1.5 times higher for veterans than that of nonveteran adults.2,3
Among veteran users of Veterans Health Administration (VHA) services, mental health and substance use disorders, chronic medical conditions, and chronic pain are associated with an increased risk for suicide.3 About one-half of VHA veterans have been diagnosed with chronic pain.4 A chronic pain diagnosis (eg, back pain, migraine, and psychogenic pain) increased the risk of death by suicide even after adjusting for comorbid psychiatric diagnoses, according to a study on pain and suicide among US veterans.5
One-quarter of veterans received an opioid prescription during VHA outpatient care in 2012.4 Increased prescribing of opioid medications has been associated with opioid overdose and suicides.6-10 Opioids are the most common drugs found in suicide by overdose.11 The rate of opioid-related suicide deaths is 13 times higher among individuals with opioid use disorder (OUD) than it is for those without OUD.12 The rate of OUD diagnosis among VHA users was 7 times higher than that for non-VHA users.13
In the US the age-adjusted rate of drug overdose deaths increased from 6 per 100,000 persons in 1999 to 22 per 100,000 in 2017.14 Drug overdoses accounted for 52,404 US deaths in 2015; 33,091 (63.1%) were from opioids.15 In 2017, there were 70,237 drug overdose deaths; 67.8% involved opioids (ie, 5 per 100,000 population represent prescription opioids).16
The VHA is committed to reducing opioid use and veteran suicide prevention. In 2013 the VHA launched the Opioid Safety Initiative employing 4 strategies: education, pain management, risk management, and addiction treatment.17 To address the opioid epidemic, the North Florida/South Georgia Veteran Health System (NF/SGVHS) developed and implemented a multispecialty Opioid Risk Reduction Program that is fully integrated with mental health and addiction services. The purpose of the NF/SGVHS one-stop pain addiction clinic is to provide a treatment program for chronic pain and addiction. The program includes elements of a whole health approach to pain care, including battlefield and traditional acupuncture. The focus went beyond replacing pharmacologic treatments with a complementary integrative health approach to helping veterans regain control of their lives through empowerment, skill building, shared goal setting, and reinforcing self-management.
The self-management programs include a pain school for patient education, a pain psychology program, and a yoga program, all stressing self-management offered onsite and via telehealth. Special effort was directed to identify patients with OUD and opioid dependence. Many of these patients were transitioned to buprenorphine, a potent analgesic that suppresses opioid cravings and withdrawal symptoms associated with stopping opioids. The clinic was structured so that patients could be seen often for follow-up and support. In addition, open lines of communication and referral were set up between this clinic, the interventional pain clinic, and the physical medicine and rehabilitation service. A detailed description of this program has been published elsewhere.18
The number of veterans receiving opioid prescription across the VHA system decreased by 172,000 prescriptions quarterly between 2012 and 2016.19 Fewer veterans were prescribed high doses of opioids or concomitant interacting medicines and more veterans were receiving nonopioid therapies.19 The prescription reduction across the VHA has varied. For example, from 2012 to 2017 the NF/SGVHS reported an 87% reduction of opioid prescriptions (≥ 100 mg morphine equivalents/d), compared with the VHA national average reduction of 49%.18
Vigorous opioid reduction is controversial. In a systematic review on opioid reduction, Frank and colleagues reported some beneficial effects of opioid reduction, such as increased health-related quality of life.20 However, another study suggested a risk of increased pain with opioid tapering.21 The literature findings on the association between prescription opioid use and suicide are mixed. The VHA Office of Mental Health and Suicide Prevention literature review reported that veterans were at increased risk of committing suicide within the first 6 months of discontinuing opioid therapy.22 Another study reported that veterans who discontinued long-term opioid treatment had an increased risk for suicidal ideation.23 However, higher doses of opioids were associated with an increased risk for suicide among individuals with chronic pain.10 The link between opioid tapering and the risk of suicide or overdose is uncertain.
Bohnert and Ilgen suggested that discontinuing prescription opioids leads to suicide without examining the risk factors that influenced discontinuation is ill-informed.7 Strong evidence about the association or relationship among opioid use, overdose, and suicide is needed. To increase our understanding of that association, Bohnert and Ilgen argued for multifaceted interventions that simultaneously address the shared causes and risk factors for OUD,7 such as the multispecialty Opioid Risk Reduction Program at NF/SGVHS.
Because of the reported association between robust integrated mental health and addiction, primary care pain clinic intervention, and the higher rate of opioid tapering in NF/SGVHS,18 this study aims to describe the pattern of overdose diagnosis (opioid overdose and nonopioid overdose) and pattern of suicide rates among veterans enrolled in NF/SGVHS, Veterans Integrated Service Network (VISN) 8, and the entire VA health care system during 2012 to 2016.The study reviewed and compared overdose diagnosis and suicide rates among veterans across NF/SGVHS and 2 other levels of the VA health care system to determine whether there were variances in the pattern of overdose/suicide rates and to explore these differences.
Methods
In this retrospective study, aggregate data were obtained from several sources. First, the drug overdose data were extracted from the VA Support Service Center (VSSC) medical diagnosis cube. We reviewed the literature for opioid codes reported in the literature and compared these reported opioid International Classification of Diseases, Ninth Revision (ICD-9) and International Classification of Diseases, 10th Revision (ICD-10) codes with the local facility patient-level comprehensive overdose diagnosis codes. Based on the comparison, we found 98 ICD-9 and ICD-10 overdose diagnosis codes and ran the modified codes against the VSSC national database. Overdose data were aggregated by facility and fiscal year, and the overdose rates (per 1,000) were calculated for unique veteran users at the 3 levels (NF/SGVHS, VISN 8, and VA national) as the denominator.
Each of the 18 VISNs comprise multiple VAMCs and clinics within a geographic region. VISN 8 encompasses most of Florida and portions of southern Georgia and the Caribbean (Puerto Rico, US Virgin Islands), including NF/SGVHS.
In this study, drug overdose refers to the overdose or poisoning from all drugs (ie, opioids, cocaine, amphetamines, sedatives, etc) and defined as any unintentional (accidental), deliberate, or intent undetermined drug poisoning.24 The suicide data for this study were drawn from the VA Suicide Prevention Program at 3 different levels: NF/SGVHS, VISN 8, and VHA national. Suicide is death caused by an intentional act of injuring oneself with the intent to die.25
This descriptive study compared the rate of annual drug overdoses (per 1,000 enrollees) between NF/SGVHS, VISN 8, and VHA national from 2012 to 2016. It also compared the annual rate of suicide per 100,000 enrollees across these 3 levels of the VHA. The overdose and suicide rates and numbers are mutually exclusive, meaning the VISN 8 data do not include the NF/SGVHS information, and the national data excluded data from VISN 8 and NF/SGVHS. This approach helped improve the quality of multiple level comparisons for different levels of the VHA system.
Results
Figure 1 shows the pattern of overdose diagnosis by rates (per 1,000) across the study period (2012 to 2016) and compares patterns at 3 levels of VHA (NF/SGVHS, VISN 8, and VHA national). The average annual rate of overdose diagnoses for NF/SGVHS during the study was slightly higher (16.8 per 1,000) than that of VISN 8 (16 per 1,000) and VHA national (15.3 per 1,000), but by the end of the study period the NF/SGVHS rate (18.6 per 1,000) nearly matched the national rate (18.2 per 1,000) and was lower than the VISN 8 rate (20.4 per 1,000). Additionally, NF/SGVHS had less variability (SD, 1.34) in yearly average overdose rates compared with VISN 8 (SD, 2.96), and VHA national (SD, 1.69).
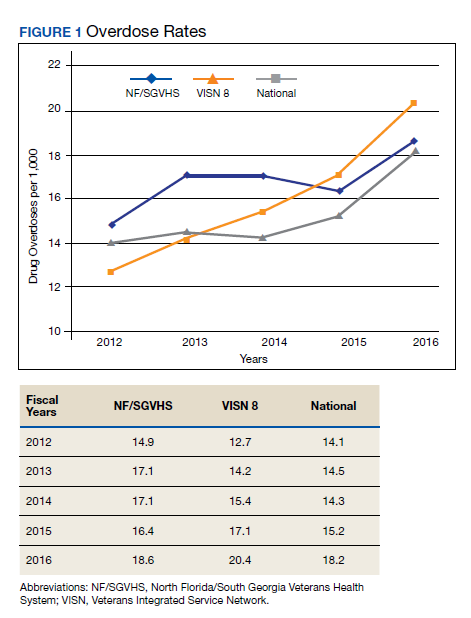
From 2013 to 2014 the overdose diagnosis rate for NF/SGVHS remained the same (17.1 per 1,000). A similar pattern was observed for the VHA national data, whereas the VISN 8 data showed a steady increase during the same period. In 2015, the NF/SGVHS had 0.7 per 1,000 decrease in overdose diagnosis rate, whereas VISN 8 and VHA national data showed 1.7 per 1,000 and 0.9 per 1,000 increases, respectively. During the last year of the study (2016), there was a dramatic increase in overdose diagnosis for all the health care systems, ranging from 2.2 per 1,000 for NF/SGVHS to 3.3 per 1,000 for VISN 8.
Figure 2 shows the annual rates (per 100,000 individuals) of suicide for NF/SGVHS, VISN 8, and VHA national. The suicide pattern for VISN 8 shows a cyclical acceleration and deceleration trend across the study period. From 2012 to 2014, the VHA national data show a steady increase of about 1 per 100,000 from year to year. On the contrary, NF/SGVHS shows a low suicide rate from year to year within the same period with a rate of 10 per 100,000 in 2013 compared with the previous year. Although the NF/SGVHS suicide rate increased in 2016 (10.4 per 100,000), it remained lower than that of VISN 8 (10.7 per 100,00) and VHA national (38.2 per 100,000).
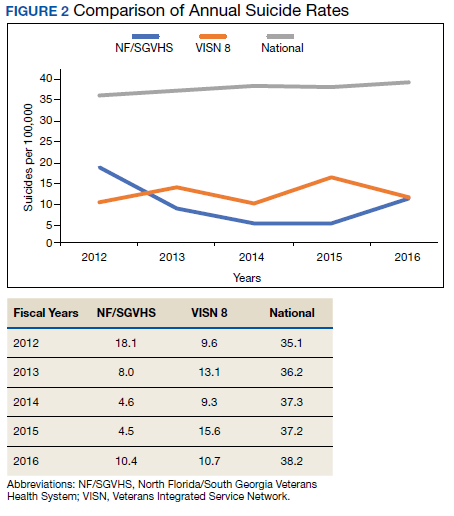
This study shows that NF/SGVHS had the lowest average annual rate of suicide (9.1 per 100,000) during the study period, which was 4 times lower than that of VHA national and 2.6 times lower than VISN 8.
Discussion
This study described and compared the distribution pattern of overdose (nonopioid and opioid) and suicide rates at different levels of the VHA system. Although VHA implemented systemwide opioid tapering in 2013, little is known about the association between opioid tapering and overdose and suicide. We believe a retrospective examination regarding overdose and suicide among VHA users at 3 different levels of the system from 2012 to 2016 could contribute to the discussion regarding the potential risks and benefits of discontinuing opioids.
First, the average annual rate of overdose diagnosis for NF/SGVHS during the study period was slightly higher (16.8 per 1,000) compared with those of VISN 8 (16.0 per 1,000) and VHA national (15.3 per 1,000) with a general pattern of increase and minimum variations in the rates observed during the study period among the 3 levels of the system. These increased overdose patterns are consistent with other reports in the literature.14 By the end of the study period, the NF/SGVHS rate (18.6 per 1,000) nearly matched the national rate (18.2 per 1,000) and was lower than VISN 8 (20.4 per 1,000). During the last year of the study period (2016), there was a dramatic increase in overdose diagnosis for all health care systems ranging from 2.2 per 1,000 for NF/SGVHS to 3.3 per 1,000 for VISN 8, which might be because of the VHA systemwide change of diagnosis code from ICD-9 to ICD-10, which includes more detailed diagnosis codes.
Second, our results showed that NF/SGVHS had the lowest average annual suicide rate (9.1 per 100,000) during the study period, which is one-fourth the VHA national rate and 2.6 per 100,000 lower than the VISN 8 rate. According to Bohnert and Ilgen,programs that improve the quality of pain care, expand access to psychotherapy, and increase access to medication-assisted treatment for OUDs could reduce suicide by drug overdose.7 We suggest that the low suicide rate at NF/SGVHS and the difference in the suicide rates between the NF/SGVHS and VISN 8 and VHA national data might be associated with the practice-based biopsychosocial interventions implemented at NF/SGVHS.
Our data showed a rise in the incidence of suicide at the NF/SGVHS in 2016. We are not aware of a local change in conditions, policy, and practice that would account for this increase. Suicide is variable, and data are likely to show spikes and valleys. Based on the available data, although the incidence of suicides at the NF/SGVHS in 2016 was higher, it remained below the VISN 8 and national VHA rate. This study seems to support the practice of tapering or stopping opioids within the context of a multidisciplinary approach that offers frequent follow-up, nonopioid options, and treatment of opioid addiction/dependence.
Limitations
The research findings of this study are limited by the retrospective and descriptive nature of its design. However, the findings might provide important information for understanding variations of overdose and suicide among VHA enrollees. Studies that use more robust methodologies are warranted to clinically investigate the impact of a multispecialty opioid risk reduction program targeting chronic pain and addiction management and identify best practices of opioid reduction and any unintended consequences that might arise from opioid tapering.26 Further, we did not have access to the VA national overdose and suicide data after 2016. Similar to most retrospective data studies, ours might be limited by availability of national overdose and suicide data after 2016. It is important for future studies to cross-validate our study findings.
Conclusions
The NF/SGVHS developed and implemented a biopsychosocial model of pain treatment that includes multicomponent primary care integrated with mental health and addiction services as well as the interventional pain and physical medicine and rehabilitation services. The presence of this program, during a period when the facility was tapering opioids is likely to account for at least part of the relative reduction in suicide.
1. American Foundation for Suicide Prevention. Suicide statistics. https://afsp.org/about-suicide/suicide-statistics. Updated 2019. Accessed September 2, 2020.
2. Shane L 3rd. New veteran suicide numbers raise concerns among experts hoping for positive news. https://www.militarytimes.com/news/pentagon-congress/2019/10/09/new-veteran-suicide-numbers-raise-concerns-among-experts-hoping-for-positive-news. Published October 9, 2019. Accessed July 23, 2020.
3. Veterans Health Administration, Office of Mental Health and Suicide Prevention. Veteran suicide data report, 2005–2017. https://www.mentalhealth.va.gov/docs/data-sheets/2019/2019_National_Veteran_Suicide_Prevention_Annual_Report_508.pdf. Published September 2019. Accessed July 20, 2020.
4. Gallagher RM. Advancing the pain agenda in the veteran population. Anesthesiol Clin. 2016;34(2):357-378. doi:10.1016/j.anclin.2016.01.003
5. Ilgen MA, Kleinberg F, Ignacio RV, et al. Noncancer pain conditions and risk of suicide. JAMA Psychiatry. 2013;70(7):692-697. doi:10.1001/jamapsychiatry.2013.908
6. Frenk SM, Porter KS, Paulozzi LJ. Prescription opioid analgesic use among adults: United States, 1999-2012. National Center for Health Statistics data brief. https://www.cdc.gov/nchs/products/databriefs/db189.htm. Published February 25, 2015. Accessed July 20, 2020.
7. Bohnert ASB, Ilgen MA. Understanding links among opioid use, overdose, and suicide. N Engl J Med. 2019;380(14):71-79. doi:10.1056/NEJMc1901540
8. Dunn KM, Saunders KW, Rutter CM, et al. Opioid prescriptions for chronic pain and overdose: a cohort study. Ann Intern Med. 2010;152(2):85-92. doi:10.7326/0003-4819-152-2-201001190-00006
9. Gomes T, Mamdani MM, Dhalla IA, Paterson JM, Juurlink DN. Opioid dose and drug-related mortality in patients with nonmalignant pain. Arch Intern Med. 2011;171(7):686-691. doi:10.1001/archinternmed.2011.117
10. Ilgen MA, Bohnert AS, Ganoczy D, Bair MJ, McCarthy JF, Blow FC. Opioid dose and risk of suicide. Pain. 2016;157(5):1079-1084. doi:10.1097/j.pain.0000000000000484
11. Sinyor M, Howlett A, Cheung AH, Schaffer A. Substances used in completed suicide by overdose in Toronto: an observational study of coroner’s data. Can J Psychiatry. 2012;57(3):184-191. doi:10.1177/070674371205700308
12. Wilcox HC, Conner KR, Caine ED. Association of alcohol and drug use disorders and completed suicide: an empirical review of cohort studies. Drug Alcohol Depend. 2004;76(suppl):S11-S19 doi:10.1016/j.drugalcdep.2004.08.003.
13. Baser OL, Mardekian XJ, Schaaf D, Wang L, Joshi AV. Prevalence of diagnosed opioid abuse and its economic burden in the Veterans Health Administration. Pain Pract. 2014;14(5):437-445. doi:10.1111/papr.12097
14. Hedegaard H, Warner M, Miniño AM. Drug overdose deaths in the united states, 1999-2015. National Center for Health Statistics data brief. https://www.cdc.gov/nchs/data/databriefs/db273.pdf. Published February 2017. Accessed July 20, 2020.
15. Rudd RA, Seth P, David F, Scholl L. Increases in drug and opioid-involved overdose deaths—United States, 2010-2015. MMWR Morb Mortal Wkly Rep. 2016;65(50-51):1445-1452. doi:10.15585/mmwr.mm655051e1
16. Scholl L, Seth P, Kariisa M, Wilson N, Baldwin G. Drug and opioid-involved overdose deaths—United States, 2013-2017. MMWR Morb Mortal Wkly Rep. 2019,67(5152):1419-1427. doi:10.15585/mmwr.mm675152e1
17. US Department of Veterans Affairs and Department of Defense. VA/DOD clinical practice guideline for opioid therapy for chronic pain version 3.0. https://www.healthquality.va.gov/guidelines/pain/cot. Updated March 1, 2018. Accessed July 20, 2020.
18. Vaughn IA, Beyth RJ, Ayers ML, et al. Multispecialty opioid risk reduction program targeting chronic pain and addiction management in veterans. Fed Pract. 2019;36(9):406-411.
19. Gellad WF, Good CB, Shulkin DJ. Addressing the opioid epidemic in the United States: lessons from the Department of Veterans Affairs. JAMA Intern Med. 2017;177(5):611-612. doi:10.1001/jamainternmed.2017.0147
20. Frank JW, Lovejoy TI, Becker WC, et al. Patient outcomes in dose reduction or discontinuation of long-term opioid therapy: a systematic review. Ann Intern Med. 2017;167(3):181-191. doi:10.7326/M17-0598
21. Berna C, Kulich RJ, Rathmell JP. Tapering long-term opioid therapy in chronic noncancer pain: evidence and recommendations for everyday practice. Mayo Clin Proc. 2015;90(6):828-842. doi:10.1016/j.mayocp.2015.04.003
22. Veterans Health Administration, Office of Mental Health and Suicide Prevention. Opioid use and suicide risk. https://www.mentalhealth.va.gov/suicide_prevention/docs/Literature_Review_Opioid_Use_and_Suicide_Risk_508_FINAL_04-26-2019.pdf. Published April 26, 2019. Accessed July 20, 2020.
23. Demidenko MI, Dobscha SK, Morasco BJ, Meath THA, Ilgen MA, Lovejoy TI. Suicidal ideation and suicidal self-directed violence following clinician-initiated prescription opioid discontinuation among long-term opioid users. Gen Hosp Psychiatry. 2017;47:29-35. doi:10.1016/j.genhosppsych.2017.04.011
24. National Institute on Drug Abuse. Intentional versus unintentional overdose deaths. https://www.drugabuse.gov/related-topics/treatment/intentional-vs-unintentional-overdose-deaths. Updated February 13, 2017. Accessed July 20, 2020.
25. Centers for Disease Control and Prevention. Preventing suicide. https://www.cdc.gov/violenceprevention/pdf/suicide-factsheet.pdf. Published 2018. Accessed July 20, 2020.
26. Webster LR. Pain and suicide: the other side of the opioid story. Pain Med. 2014;15(3):345-346. doi:10.1111/pme.12398
Suicide is the 10th leading cause of death in the US. In 2017, there were 47,173 deaths by suicide (14 deaths per 100,000 people), representing a 33% increase from 1999.1 In 2017 veterans accounted for 13.5% of all suicide deaths among US adults, although veterans comprised only 7.9% of the adult population; the age- and sex-adjusted suicide rate was 1.5 times higher for veterans than that of nonveteran adults.2,3
Among veteran users of Veterans Health Administration (VHA) services, mental health and substance use disorders, chronic medical conditions, and chronic pain are associated with an increased risk for suicide.3 About one-half of VHA veterans have been diagnosed with chronic pain.4 A chronic pain diagnosis (eg, back pain, migraine, and psychogenic pain) increased the risk of death by suicide even after adjusting for comorbid psychiatric diagnoses, according to a study on pain and suicide among US veterans.5
One-quarter of veterans received an opioid prescription during VHA outpatient care in 2012.4 Increased prescribing of opioid medications has been associated with opioid overdose and suicides.6-10 Opioids are the most common drugs found in suicide by overdose.11 The rate of opioid-related suicide deaths is 13 times higher among individuals with opioid use disorder (OUD) than it is for those without OUD.12 The rate of OUD diagnosis among VHA users was 7 times higher than that for non-VHA users.13
In the US the age-adjusted rate of drug overdose deaths increased from 6 per 100,000 persons in 1999 to 22 per 100,000 in 2017.14 Drug overdoses accounted for 52,404 US deaths in 2015; 33,091 (63.1%) were from opioids.15 In 2017, there were 70,237 drug overdose deaths; 67.8% involved opioids (ie, 5 per 100,000 population represent prescription opioids).16
The VHA is committed to reducing opioid use and veteran suicide prevention. In 2013 the VHA launched the Opioid Safety Initiative employing 4 strategies: education, pain management, risk management, and addiction treatment.17 To address the opioid epidemic, the North Florida/South Georgia Veteran Health System (NF/SGVHS) developed and implemented a multispecialty Opioid Risk Reduction Program that is fully integrated with mental health and addiction services. The purpose of the NF/SGVHS one-stop pain addiction clinic is to provide a treatment program for chronic pain and addiction. The program includes elements of a whole health approach to pain care, including battlefield and traditional acupuncture. The focus went beyond replacing pharmacologic treatments with a complementary integrative health approach to helping veterans regain control of their lives through empowerment, skill building, shared goal setting, and reinforcing self-management.
The self-management programs include a pain school for patient education, a pain psychology program, and a yoga program, all stressing self-management offered onsite and via telehealth. Special effort was directed to identify patients with OUD and opioid dependence. Many of these patients were transitioned to buprenorphine, a potent analgesic that suppresses opioid cravings and withdrawal symptoms associated with stopping opioids. The clinic was structured so that patients could be seen often for follow-up and support. In addition, open lines of communication and referral were set up between this clinic, the interventional pain clinic, and the physical medicine and rehabilitation service. A detailed description of this program has been published elsewhere.18
The number of veterans receiving opioid prescription across the VHA system decreased by 172,000 prescriptions quarterly between 2012 and 2016.19 Fewer veterans were prescribed high doses of opioids or concomitant interacting medicines and more veterans were receiving nonopioid therapies.19 The prescription reduction across the VHA has varied. For example, from 2012 to 2017 the NF/SGVHS reported an 87% reduction of opioid prescriptions (≥ 100 mg morphine equivalents/d), compared with the VHA national average reduction of 49%.18
Vigorous opioid reduction is controversial. In a systematic review on opioid reduction, Frank and colleagues reported some beneficial effects of opioid reduction, such as increased health-related quality of life.20 However, another study suggested a risk of increased pain with opioid tapering.21 The literature findings on the association between prescription opioid use and suicide are mixed. The VHA Office of Mental Health and Suicide Prevention literature review reported that veterans were at increased risk of committing suicide within the first 6 months of discontinuing opioid therapy.22 Another study reported that veterans who discontinued long-term opioid treatment had an increased risk for suicidal ideation.23 However, higher doses of opioids were associated with an increased risk for suicide among individuals with chronic pain.10 The link between opioid tapering and the risk of suicide or overdose is uncertain.
Bohnert and Ilgen suggested that discontinuing prescription opioids leads to suicide without examining the risk factors that influenced discontinuation is ill-informed.7 Strong evidence about the association or relationship among opioid use, overdose, and suicide is needed. To increase our understanding of that association, Bohnert and Ilgen argued for multifaceted interventions that simultaneously address the shared causes and risk factors for OUD,7 such as the multispecialty Opioid Risk Reduction Program at NF/SGVHS.
Because of the reported association between robust integrated mental health and addiction, primary care pain clinic intervention, and the higher rate of opioid tapering in NF/SGVHS,18 this study aims to describe the pattern of overdose diagnosis (opioid overdose and nonopioid overdose) and pattern of suicide rates among veterans enrolled in NF/SGVHS, Veterans Integrated Service Network (VISN) 8, and the entire VA health care system during 2012 to 2016.The study reviewed and compared overdose diagnosis and suicide rates among veterans across NF/SGVHS and 2 other levels of the VA health care system to determine whether there were variances in the pattern of overdose/suicide rates and to explore these differences.
Methods
In this retrospective study, aggregate data were obtained from several sources. First, the drug overdose data were extracted from the VA Support Service Center (VSSC) medical diagnosis cube. We reviewed the literature for opioid codes reported in the literature and compared these reported opioid International Classification of Diseases, Ninth Revision (ICD-9) and International Classification of Diseases, 10th Revision (ICD-10) codes with the local facility patient-level comprehensive overdose diagnosis codes. Based on the comparison, we found 98 ICD-9 and ICD-10 overdose diagnosis codes and ran the modified codes against the VSSC national database. Overdose data were aggregated by facility and fiscal year, and the overdose rates (per 1,000) were calculated for unique veteran users at the 3 levels (NF/SGVHS, VISN 8, and VA national) as the denominator.
Each of the 18 VISNs comprise multiple VAMCs and clinics within a geographic region. VISN 8 encompasses most of Florida and portions of southern Georgia and the Caribbean (Puerto Rico, US Virgin Islands), including NF/SGVHS.
In this study, drug overdose refers to the overdose or poisoning from all drugs (ie, opioids, cocaine, amphetamines, sedatives, etc) and defined as any unintentional (accidental), deliberate, or intent undetermined drug poisoning.24 The suicide data for this study were drawn from the VA Suicide Prevention Program at 3 different levels: NF/SGVHS, VISN 8, and VHA national. Suicide is death caused by an intentional act of injuring oneself with the intent to die.25
This descriptive study compared the rate of annual drug overdoses (per 1,000 enrollees) between NF/SGVHS, VISN 8, and VHA national from 2012 to 2016. It also compared the annual rate of suicide per 100,000 enrollees across these 3 levels of the VHA. The overdose and suicide rates and numbers are mutually exclusive, meaning the VISN 8 data do not include the NF/SGVHS information, and the national data excluded data from VISN 8 and NF/SGVHS. This approach helped improve the quality of multiple level comparisons for different levels of the VHA system.
Results
Figure 1 shows the pattern of overdose diagnosis by rates (per 1,000) across the study period (2012 to 2016) and compares patterns at 3 levels of VHA (NF/SGVHS, VISN 8, and VHA national). The average annual rate of overdose diagnoses for NF/SGVHS during the study was slightly higher (16.8 per 1,000) than that of VISN 8 (16 per 1,000) and VHA national (15.3 per 1,000), but by the end of the study period the NF/SGVHS rate (18.6 per 1,000) nearly matched the national rate (18.2 per 1,000) and was lower than the VISN 8 rate (20.4 per 1,000). Additionally, NF/SGVHS had less variability (SD, 1.34) in yearly average overdose rates compared with VISN 8 (SD, 2.96), and VHA national (SD, 1.69).
From 2013 to 2014 the overdose diagnosis rate for NF/SGVHS remained the same (17.1 per 1,000). A similar pattern was observed for the VHA national data, whereas the VISN 8 data showed a steady increase during the same period. In 2015, the NF/SGVHS had 0.7 per 1,000 decrease in overdose diagnosis rate, whereas VISN 8 and VHA national data showed 1.7 per 1,000 and 0.9 per 1,000 increases, respectively. During the last year of the study (2016), there was a dramatic increase in overdose diagnosis for all the health care systems, ranging from 2.2 per 1,000 for NF/SGVHS to 3.3 per 1,000 for VISN 8.
Figure 2 shows the annual rates (per 100,000 individuals) of suicide for NF/SGVHS, VISN 8, and VHA national. The suicide pattern for VISN 8 shows a cyclical acceleration and deceleration trend across the study period. From 2012 to 2014, the VHA national data show a steady increase of about 1 per 100,000 from year to year. On the contrary, NF/SGVHS shows a low suicide rate from year to year within the same period with a rate of 10 per 100,000 in 2013 compared with the previous year. Although the NF/SGVHS suicide rate increased in 2016 (10.4 per 100,000), it remained lower than that of VISN 8 (10.7 per 100,00) and VHA national (38.2 per 100,000).
This study shows that NF/SGVHS had the lowest average annual rate of suicide (9.1 per 100,000) during the study period, which was 4 times lower than that of VHA national and 2.6 times lower than VISN 8.
Discussion
This study described and compared the distribution pattern of overdose (nonopioid and opioid) and suicide rates at different levels of the VHA system. Although VHA implemented systemwide opioid tapering in 2013, little is known about the association between opioid tapering and overdose and suicide. We believe a retrospective examination regarding overdose and suicide among VHA users at 3 different levels of the system from 2012 to 2016 could contribute to the discussion regarding the potential risks and benefits of discontinuing opioids.
First, the average annual rate of overdose diagnosis for NF/SGVHS during the study period was slightly higher (16.8 per 1,000) compared with those of VISN 8 (16.0 per 1,000) and VHA national (15.3 per 1,000) with a general pattern of increase and minimum variations in the rates observed during the study period among the 3 levels of the system. These increased overdose patterns are consistent with other reports in the literature.14 By the end of the study period, the NF/SGVHS rate (18.6 per 1,000) nearly matched the national rate (18.2 per 1,000) and was lower than VISN 8 (20.4 per 1,000). During the last year of the study period (2016), there was a dramatic increase in overdose diagnosis for all health care systems ranging from 2.2 per 1,000 for NF/SGVHS to 3.3 per 1,000 for VISN 8, which might be because of the VHA systemwide change of diagnosis code from ICD-9 to ICD-10, which includes more detailed diagnosis codes.
Second, our results showed that NF/SGVHS had the lowest average annual suicide rate (9.1 per 100,000) during the study period, which is one-fourth the VHA national rate and 2.6 per 100,000 lower than the VISN 8 rate. According to Bohnert and Ilgen,programs that improve the quality of pain care, expand access to psychotherapy, and increase access to medication-assisted treatment for OUDs could reduce suicide by drug overdose.7 We suggest that the low suicide rate at NF/SGVHS and the difference in the suicide rates between the NF/SGVHS and VISN 8 and VHA national data might be associated with the practice-based biopsychosocial interventions implemented at NF/SGVHS.
Our data showed a rise in the incidence of suicide at the NF/SGVHS in 2016. We are not aware of a local change in conditions, policy, and practice that would account for this increase. Suicide is variable, and data are likely to show spikes and valleys. Based on the available data, although the incidence of suicides at the NF/SGVHS in 2016 was higher, it remained below the VISN 8 and national VHA rate. This study seems to support the practice of tapering or stopping opioids within the context of a multidisciplinary approach that offers frequent follow-up, nonopioid options, and treatment of opioid addiction/dependence.
Limitations
The research findings of this study are limited by the retrospective and descriptive nature of its design. However, the findings might provide important information for understanding variations of overdose and suicide among VHA enrollees. Studies that use more robust methodologies are warranted to clinically investigate the impact of a multispecialty opioid risk reduction program targeting chronic pain and addiction management and identify best practices of opioid reduction and any unintended consequences that might arise from opioid tapering.26 Further, we did not have access to the VA national overdose and suicide data after 2016. Similar to most retrospective data studies, ours might be limited by availability of national overdose and suicide data after 2016. It is important for future studies to cross-validate our study findings.
Conclusions
The NF/SGVHS developed and implemented a biopsychosocial model of pain treatment that includes multicomponent primary care integrated with mental health and addiction services as well as the interventional pain and physical medicine and rehabilitation services. The presence of this program, during a period when the facility was tapering opioids is likely to account for at least part of the relative reduction in suicide.
1. American Foundation for Suicide Prevention. Suicide statistics. https://afsp.org/about-suicide/suicide-statistics. Updated 2019. Accessed September 2, 2020.
2. Shane L 3rd. New veteran suicide numbers raise concerns among experts hoping for positive news. https://www.militarytimes.com/news/pentagon-congress/2019/10/09/new-veteran-suicide-numbers-raise-concerns-among-experts-hoping-for-positive-news. Published October 9, 2019. Accessed July 23, 2020.
3. Veterans Health Administration, Office of Mental Health and Suicide Prevention. Veteran suicide data report, 2005–2017. https://www.mentalhealth.va.gov/docs/data-sheets/2019/2019_National_Veteran_Suicide_Prevention_Annual_Report_508.pdf. Published September 2019. Accessed July 20, 2020.
4. Gallagher RM. Advancing the pain agenda in the veteran population. Anesthesiol Clin. 2016;34(2):357-378. doi:10.1016/j.anclin.2016.01.003
5. Ilgen MA, Kleinberg F, Ignacio RV, et al. Noncancer pain conditions and risk of suicide. JAMA Psychiatry. 2013;70(7):692-697. doi:10.1001/jamapsychiatry.2013.908
6. Frenk SM, Porter KS, Paulozzi LJ. Prescription opioid analgesic use among adults: United States, 1999-2012. National Center for Health Statistics data brief. https://www.cdc.gov/nchs/products/databriefs/db189.htm. Published February 25, 2015. Accessed July 20, 2020.
7. Bohnert ASB, Ilgen MA. Understanding links among opioid use, overdose, and suicide. N Engl J Med. 2019;380(14):71-79. doi:10.1056/NEJMc1901540
8. Dunn KM, Saunders KW, Rutter CM, et al. Opioid prescriptions for chronic pain and overdose: a cohort study. Ann Intern Med. 2010;152(2):85-92. doi:10.7326/0003-4819-152-2-201001190-00006
9. Gomes T, Mamdani MM, Dhalla IA, Paterson JM, Juurlink DN. Opioid dose and drug-related mortality in patients with nonmalignant pain. Arch Intern Med. 2011;171(7):686-691. doi:10.1001/archinternmed.2011.117
10. Ilgen MA, Bohnert AS, Ganoczy D, Bair MJ, McCarthy JF, Blow FC. Opioid dose and risk of suicide. Pain. 2016;157(5):1079-1084. doi:10.1097/j.pain.0000000000000484
11. Sinyor M, Howlett A, Cheung AH, Schaffer A. Substances used in completed suicide by overdose in Toronto: an observational study of coroner’s data. Can J Psychiatry. 2012;57(3):184-191. doi:10.1177/070674371205700308
12. Wilcox HC, Conner KR, Caine ED. Association of alcohol and drug use disorders and completed suicide: an empirical review of cohort studies. Drug Alcohol Depend. 2004;76(suppl):S11-S19 doi:10.1016/j.drugalcdep.2004.08.003.
13. Baser OL, Mardekian XJ, Schaaf D, Wang L, Joshi AV. Prevalence of diagnosed opioid abuse and its economic burden in the Veterans Health Administration. Pain Pract. 2014;14(5):437-445. doi:10.1111/papr.12097
14. Hedegaard H, Warner M, Miniño AM. Drug overdose deaths in the united states, 1999-2015. National Center for Health Statistics data brief. https://www.cdc.gov/nchs/data/databriefs/db273.pdf. Published February 2017. Accessed July 20, 2020.
15. Rudd RA, Seth P, David F, Scholl L. Increases in drug and opioid-involved overdose deaths—United States, 2010-2015. MMWR Morb Mortal Wkly Rep. 2016;65(50-51):1445-1452. doi:10.15585/mmwr.mm655051e1
16. Scholl L, Seth P, Kariisa M, Wilson N, Baldwin G. Drug and opioid-involved overdose deaths—United States, 2013-2017. MMWR Morb Mortal Wkly Rep. 2019,67(5152):1419-1427. doi:10.15585/mmwr.mm675152e1
17. US Department of Veterans Affairs and Department of Defense. VA/DOD clinical practice guideline for opioid therapy for chronic pain version 3.0. https://www.healthquality.va.gov/guidelines/pain/cot. Updated March 1, 2018. Accessed July 20, 2020.
18. Vaughn IA, Beyth RJ, Ayers ML, et al. Multispecialty opioid risk reduction program targeting chronic pain and addiction management in veterans. Fed Pract. 2019;36(9):406-411.
19. Gellad WF, Good CB, Shulkin DJ. Addressing the opioid epidemic in the United States: lessons from the Department of Veterans Affairs. JAMA Intern Med. 2017;177(5):611-612. doi:10.1001/jamainternmed.2017.0147
20. Frank JW, Lovejoy TI, Becker WC, et al. Patient outcomes in dose reduction or discontinuation of long-term opioid therapy: a systematic review. Ann Intern Med. 2017;167(3):181-191. doi:10.7326/M17-0598
21. Berna C, Kulich RJ, Rathmell JP. Tapering long-term opioid therapy in chronic noncancer pain: evidence and recommendations for everyday practice. Mayo Clin Proc. 2015;90(6):828-842. doi:10.1016/j.mayocp.2015.04.003
22. Veterans Health Administration, Office of Mental Health and Suicide Prevention. Opioid use and suicide risk. https://www.mentalhealth.va.gov/suicide_prevention/docs/Literature_Review_Opioid_Use_and_Suicide_Risk_508_FINAL_04-26-2019.pdf. Published April 26, 2019. Accessed July 20, 2020.
23. Demidenko MI, Dobscha SK, Morasco BJ, Meath THA, Ilgen MA, Lovejoy TI. Suicidal ideation and suicidal self-directed violence following clinician-initiated prescription opioid discontinuation among long-term opioid users. Gen Hosp Psychiatry. 2017;47:29-35. doi:10.1016/j.genhosppsych.2017.04.011
24. National Institute on Drug Abuse. Intentional versus unintentional overdose deaths. https://www.drugabuse.gov/related-topics/treatment/intentional-vs-unintentional-overdose-deaths. Updated February 13, 2017. Accessed July 20, 2020.
25. Centers for Disease Control and Prevention. Preventing suicide. https://www.cdc.gov/violenceprevention/pdf/suicide-factsheet.pdf. Published 2018. Accessed July 20, 2020.
26. Webster LR. Pain and suicide: the other side of the opioid story. Pain Med. 2014;15(3):345-346. doi:10.1111/pme.12398
Understanding De-Implementation of Low Value Castration for Men With Prostate Cancer
RESEARCH OBJECTIVE: Men with prostate cancer are often treated with androgen deprivation therapy (ADT). While ADT monotherapy is not appropriate treatment for most localized prostate cancer, it continues to be used raising questions of low-value care. Guided by the Theoretical Domains Framework (TDF) and the Behavior Change Wheel’s Capability, Opportunity, Motivation Model (COM-B), we conducted a qualitative study to identify determinants of low value ADT use and opportunities for de-implementation strategy development.
STUDY DESIGN: We used VA national cancer registry and administrative data from 2016-2017 to select facilities with the highest and lowest rates of ADT monotherapy as localized prostate cancer treatment. We used purposive sampling to select high and low performing sites and complete and code 20 provider interviews from 14 facilities across the nation (17 high and 3 low ADT use sites). Next, we mapped TDF domains to the COM-B Model to generate a conceptual framework of provider approaches to low value ADT.
PRINCIPAL FINDINGS: Based on emerging behavioral themes, our conceptual model characterized 3 groups of providers based on low value ADT use: (1) never prescribe; (2) willing, under some circumstances, to prescribe; and (3) routinely prescribe as an acceptable treatment option. Providers in all groups demonstrated strengths in the Capability domain, such as knowledge of appropriate localized prostate cancer treatment options (knowledge), coupled with interpersonal skills to engage patients in educational discussion (skills). Motivation to prescribe low value ADT depended on goals of care, including patient preferences (goals), view of their role (beliefs in capabilities/professional role and identity), and beliefs about benefits and harms ADT would afford patients (beliefs about consequences). In the Opportunity domain, access to resources, such as guidelines and interdisciplinary colleagues (environmental resources) and advice of peers (social influences) were influential factors in providers’ decision- making about low value ADT prescribing.
CONCLUSIONS: Behavioral theory-based characterization of provider practices helps clarify determinants implicated in provider decisions to prescribe low value ADT.
IMPLICATIONS: Identifying behavioral determinants impacting provider decisions to prescribe low value ADT informs theory-based de-implementation strategy development, and serves as a model to decrease low-value care more broadly.
Trends in Colorectal Cancer Survival by Sidedness and Age in the Veterans Health Administration 2000 – 2017
BACKGROUND: Colorectal cancer (CRC) accounts for about 10% of all cancers in the VA. Three-year survival is associated with both age at diagnosis and CRC stage. Yet, the minority of cases are detected at an early stage and the overall incidence of cancer in the VA patient population is forecast to rise. CRC survival and pathogenesis differ by tumor location Increases in CRC cases in individuals younger than fifty-years-of age and at more advanced stages have been reported in large, U.S. population-based cohorts (Meester et al., 2019). Here, we present a preliminary investigation of these trends amongst CRC patients in the VA.
METHODS: Briefly, a cohort of veteran patients (n = 40,951) was identified from 2000 – 2017 using the VA Central Cancer Registry (VACCR). We required all included patients to have a histologically-confirmed case of CRC as consistent with previous studies (Zullig et al., 2016) and only one registry entry. We constructed Kaplan- Meier curves and created a Cox-Proportional Hazards model to examine survival. Additional filtering by age at the date of diagnosis was used to identify patients between ages 40 and 49 and tumor location as abstracted in the VACCR. Regression analysis was used to examine trends in stage at diagnosis and in those between aged 40 and 49.
RESULTS: Our findings indicate that proximal (rightsided) colon cancer is associated with poorer survival than distal (left-sided), consistent with previous findings. During this time period, 3% of the cohort or 1,249 cases were diagnosed amongst individuals of ages 40 – 49. Regression analysis indicated differences in trends amongst VHA patients younger than fifty years of age and in stage at diagnosis. Though, the time period of this study was shorter than those previously published.
CONCLUSION: Further work is underway to identify the sources of these differences in survivorship in VHA patients, including the analysis of therapeutic regimens. This work was performed under R&D and IRB protocols reviewed approved by the VA Boston Healthcare System.
Thromboembolic Events in Lung Cancer Patients Treated With Conventional Chemotherapy Alone Compared With Immunotherapy
PURPOSE: This retrospective analysis was designed to determine the incidence of venous and arterial thromboembolic events (TEEs) in lung cancer patients treated with either conventional chemotherapy (CC) alone, immunotherapy (IT) alone, or a combination of the two (C+I).
BACKGROUND: TEEs are a serious complication in cancer patients. Lung cancer is among the more thrombogenic malignancies and platinum-based chemotherapy used commonly in this setting is among the more thrombogenic CC regimens. IT and C+I have an increasing role among frontline management options for advanced stage lung cancers. However, the incidence of TEEs associated with IT agents has not been well characterized.
METHODS: Veterans with lung cancer were retrospectively identified in a VINCI CDW research database by ICD code. Treatment with CC and/or IT, and incidence of and time to TEEs (defined as deep vein thrombosis, pulmonary embolism, stroke, or myocardial infarction) were retrieved from the database using custom queries. Time to TEE was assessed relative to treatment start date, with censoring at a maximum of 180 days.
DATA ANALYSIS: We performed chi-squared tests and Kaplan-Meier time-to-event analyses among CC, C+I, and IT cohorts, controlling for platinum-containing v. non-platinum regimens. RESULTS: We identified 77,472 Veterans (97.7 % male, average age 66) with lung cancer treated between 1992-2019, 93.6% of whom received CC, while 4.5% and 1.9% received C+I or IT, respectively. We observed the highest rate of TEE in the IT cohort (13% v. 7.3% and 5.4% in the CC and C+I cohorts), and found that platinum-based chemotherapy decreased the likelihood of TEE (r = -3.13 and -4.06 for platinum-only and platinum-based with immunotherapy regimens), whereas IT strongly increased the likelihood of TEE (r = 8.05) (p<0.001). Finally, we confirm a decrease in time to TEE between the IT compared with CC and C+I cohorts (average 41 v. 57 and 65 days, respectively; <0.0001).
IMPLICATIONS: We found increased TEEs among lung cancer patients who received frontline IT compared with CC or C+I. With uncertainty in use of prophylactic anticoagulation for ambulatory cancer patients being treated with systemic therapy, cancer-associated TEE incidence and prevention in the IT setting warrants further evaluation.
The Importance of Adjuvant Treatment and Primary Anatomical Site in Head and Neck Basaloid Squamous Cell Carcinoma Survival: An Analysis of the National Cancer Database
BACKGROUND: Basaloid squamous cell carcinoma (BSCC) of the head and neck is an aggressive and highly malignant variant of squamous cell carcinoma that account for 2% of head and neck cancers. Previous studies have not analyzed the significance of adjuvant chemoradiation and anatomical site within basaloid squamous cell carcinoma subtype and its impact on survival.
METHODS: A cohort of 1,999 patients with BSCC of the head and neck was formed from the National Cancer Database and analyzed with descriptive studies, median survival and 5- and 10-year survival. A multivariable Cox hazard regression was performed to determine the prognostic significance of anatomical site and adjuvant therapy.
RESULTS: In this cohort, 82% were male with a median age of 59 years. The most common primary anatomical site was the oropharynx (71.9%) followed by oral cavity (11.5%), larynx (10.1%), hypopharynx (3.5%), esophagus (1.9%), and nasopharynx (1.1%). The majority of the cohort had stage IV disease, while 3.9% had metastases. The presence of metastasis increased probability of mortality (HR=2.14; 95% CI: 1.40-3.26). Tumors localized to the oropharynx demonstrated better survival compared to all sites except nasopharynx, including the oral cavity (HR=2.45; 95% CI: 1.83-3.29), hypopharynx (HR=2.58; 95% CI: 1.64-4.05), and larynx (HR=2.89; 95% CI: 2.25-3.73). Adjuvant chemoradiation (HR=0.36; 95% CI: 0.23-0.58) and adjuvant radiation (HR=0.38; 95% CI: 0.23-0.64) had better survival outcomes compared to adjuvant chemotherapy alone. Patients with microscopic tumor margins had better survival outcomes when compared to no surgery (HR=0.38, 98% Cl: 0.23-0.64) while there was no better survival outcomes of patients with macroscopic margins compared to no surgery.
CONCLUSION: This study illustrated that tumors in the oropharynx, lower age, adjuvant chemoradiation and radiation, microscopic margins or residual tumor were associated with greater survival. This study demonstrates the importance of these factors as independent prognostic factors when considering survival of patients diagnosed with BSCC of the head and neck.
The Impact of Sequencing of Abiraterone and Enzalutamide in Veterans With Metastatic Castration- Resistant Prostate Cancer
PURPOSE: To evaluate outcomes of disease progression based on the sequence of abiraterone and enzalutamide in veterans diagnosed with metastatic castration-resistant prostate cancer (mCRPC). BACKGROUND: Two of the current options for mCRPC treatment are the novel oral hormonal agents abiraterone and enzalutamide. After progression on one of these agents, one option is to switch to the other agent not previously used. Previously published retrospective studies and one prospective study have shown a difference in outcomes favoring abiraterone followed by enzalutamide, while others have shown no difference based on sequence. The optimal sequence of abiraterone and enzalutamide is still unclear.
METHODS: This was a retrospective chart review of patients who received abiraterone and enzalutamide in sequence for the treatment of mCRPC within our healthcare system from April 28, 2011 through October 31, 2019. Baseline demographic information such as age, race, Gleason score, and prior treatments were collected. The primary outcome was combined prostate-specific antigen progression-free survival (cPSA-PFS). Secondary outcomes included radiographic PFS (rPFS), overall survival (OS), adverse events causing treatment discontinuation, and medication adherence. Between-group survival differences were estimated by the Kaplan-Meier method and an unadjusted Cox regression model.
RESULTS: A total of 77 patients met criteria for study inclusion, with 51 in the abiraterone-to-enzalutamide group (ABI-ENZ) and 26 in the enzalutamide-to-abiraterone group (ENZ-ABI). For the primary outcome of cPSA-PFS, the median survival of the ABI-ENZ and ENZ-ABI groups was 17.3 months (95% CI, 10.3-24.3 months) and 10.2 months (95% CI, 8.5-11.8 months), respectively, which was significantly different (log-rank P=0.009) in favor of the ABI-ENZ sequence (HR 0.46; 95% CI, 0.26-0.83). Secondary outcomes of rPFS and OS were not significantly different between groups.
CONCLUSION: This study adds to the evidence supporting the sequence of abiraterone before enzalutamide for improving PSA-PFS. It is thought this might be related to differences in mechanisms of resistance between the two drugs. This benefit has not yet translated to an improvement in rPFS and OS. Based on the results of this study in conjunction with previously published studies, use of abiraterone before enzalutamide should be considered over the alternate sequence.
The Impact of Sequencing of Abiraterone and Enzalutamide in Veterans With Metastatic Castration- Resistant Prostate Cancer
PURPOSE: To evaluate outcomes of disease progression based on the sequence of abiraterone and enzalutamide in veterans diagnosed with metastatic castration-resistant prostate cancer (mCRPC).
BACKGROUND: Two of the current options for mCRPC treatment are the novel oral hormonal agents abiraterone and enzalutamide. After progression on one of these agents, one option is to switch to the other agent not previously used. Previously published retrospective studies and one prospective study have shown a difference in outcomes favoring abiraterone followed by enzalutamide, while others have shown no difference based on sequence. The optimal sequence of abiraterone and enzalutamide is still unclear.
METHODS: This was a retrospective chart review of patients who received abiraterone and enzalutamide in sequence for the treatment of mCRPC within our healthcare system from April 28, 2011 through October 31, 2019. Baseline demographic information such as age, race, Gleason score, and prior treatments were collected. The primary outcome was combined prostate-specific antigen progression-free survival (cPSA-PFS). Secondary outcomes included radiographic PFS (rPFS), overall survival (OS), adverse events causing treatment discontinuation, and medication adherence. Between-group survival differences were estimated by the Kaplan-Meier method and an unadjusted Cox regression model.
RESULTS: A total of 77 patients met criteria for study inclusion, with 51 in the abiraterone-to-enzalutamide group (ABI-ENZ) and 26 in the enzalutamide-to-abiraterone group (ENZ-ABI). For the primary outcome of cPSA-PFS, the median survival of the ABI-ENZ and ENZ-ABI groups was 17.3 months (95% CI, 10.3-24.3 months) and 10.2 months (95% CI, 8.5-11.8 months), respectively, which was significantly different (log-rank P=0.009) in favor of the ABI-ENZ sequence (HR 0.46; 95% CI, 0.26-0.83). Secondary outcomes of rPFS and OS were not significantly different between groups.
CONCLUSION: This study adds to the evidence supporting the sequence of abiraterone before enzalutamide for improving PSA-PFS. It is thought this might be related to differences in mechanisms of resistance between the two drugs. This benefit has not yet translated to an improvement in rPFS and OS. Based on the results of this study in conjunction with previously published studies, use of abiraterone before enzalutamide should be considered over the alternate sequence.
The Effect of Treatment Facility and Race on Survival for Signet Ring Cell Carcinoma of the Esophagus: An Analysis of the National Cancer Database
BACKGROUND: Signet ring cell carcinoma of the esophagus (SRCCE) is an aggressive tumor that represents approximately 3.5-5.0% of all esophageal cancers. Prior studies have shown a strong correlation between treating facility and survival for different cancers, but this has not been studied in SRCCE. The goal of this study is to assess differences in survival based on the type of treatment facility.
METHODS: There were 1,442 patients with SRCCE identified using the histology 8490 and topography codes C15.0-C15.9 in the National Cancer Database (NCDB). Descriptive analysis, Kaplan-Meier curves, and a multivariable Cox hazard regression analysis were all utilized to determine the significance and impact of treatment facility type, race, age, sex, tumor stage, use of adjuvant or neoadjuvant radiation, and surgical margins on survival.
RESULTS: The cohort was mostly male (86.6%) and Non-Hispanic Caucasian (96.3%) with 52.7% receiving treatment at academic centers followed by 35.9% at community programs and 11.4% at integrated cancer programs. As age increased, mortality also increased (HR = 1.02; 95% CI: 1.01-1.02, p < 0.001). Both Hispanic Caucasians (HR = 2.09; 95% CI: 1.21-3.62, = 0.009) and Africans Americans (HR = 1.69; 95% CI: 1.04-2.75, = 0.036) had an increased risk of mortality when compared to Non-Hispanic Caucasians. Patients at academic facilities demonstrated a decreased risk of mortality when compared to community programs (HR = 0.73; 95% CI: 0.63-0.86, p < 0.001) and integrated cancer programs (HR = 0.74; 95% CI: 0.60- 0.93, = 0.008).
CONCLUSION: For patients diagnosed with SRCCE, receiving treatment at academic centers resulted in better survival probabilities compared to nonacademic facilities. Older patients, African Americans and Hispanic Caucasians, increasing tumor stage, positive surgical margins, and comorbidities with Charlson- Deyo scores of 1 and 2+ were all associated with an increased risk of mortality from SRCCE.