User login
Survey insights: Unwrapping the compensation package
When approached for advice regarding the evaluation of job offers after completion of training, specific day-to-day duties (for example, shift length, teaching time, ICU coverage, and so on), and the overall gestalt of the interview experience, I find that location, lifestyle, and pay are the most consistent and common themes.
People often assume that pay is relatively straightforward, since it can be summarized in a number in the offer, whereas the other factors are harder to evaluate. However, it turns out pay is more complex. As a result, the last several State of Hospital Medicine reports have sought to evaluate compensation packages more thoroughly.
In 2016, the survey started including pay increases by years of experience, as well as CME dollars allotted per year per hospitalist. The goal was to gain deeper insight into the entire financial package, which is tied to a particular hospitalist job.
When looking at the 2014 and 2016 SHM survey results, there are several interesting findings. Base pay makes up the majority of earnings for all types of hospitalists (those seeing adults only, children only, and a mix of adults and children). In academic hospitalist groups, more of the total package of compensation comes from base pay, compared with nonacademic groups, where production and performance pay play a bigger role.
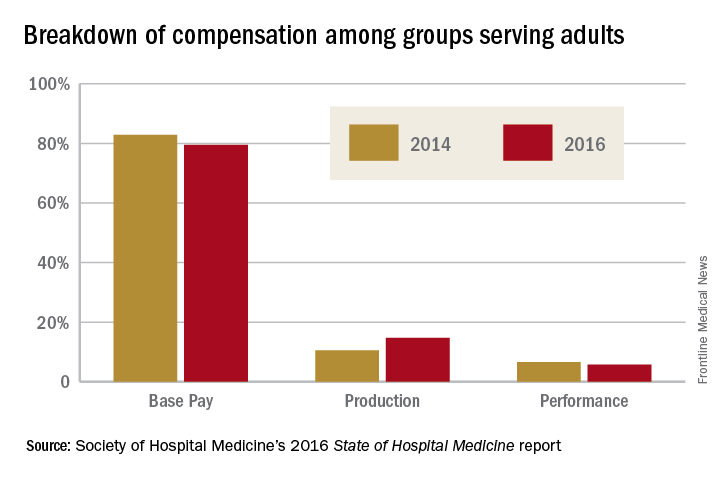
Of interest, despite the increased national attention on quality of care, productivity-based pay increased again (10.5%-14.7%), while performance-based pay (usually tied to quality and safety metrics) decreased (6.6%-5.7%) among groups serving adults. Consistent with prior trends for adults-only hospitalists, the Southern region of the country had the highest percentage of pay derived from productivity (18.8%), as well as of overall compensation in the 2016 report.
For hospitalists serving both adults and children, there was a smaller increase in pay derived from production (12.4%-13.2%), while pay derived from performance dropped more dramatically (8.9%-3.9%).
For hospitalists serving only children, the opposite occurred: Pay derived from production fell from 10.7% to 2.8%. While it is not yet clear why compensation, overall, is moving into closer alignment with productivity, rather than performance on quality and safety metrics, one hypothesis is that work relative value units used for calculating productivity are easier to tie to an individual hospitalist than are quality and safety outcomes.

Employee benefits, as previously defined, increased among hospitalists caring for adults only and those caring for adults and children, with a mean increase in both groups of $5,000. The most generous benefits were typically seen at university-based academic medical centers. Amongst adult-only hospitalists, academic groups offer benefits worth $8,000-$9,000 more per year than in nonacademic groups. Lower benefits were common among practices in the Eastern region and in groups with four or fewer full-time hospitalists. The 2016 survey data on CME dollars revealed a median of $3,000-$4,000 per year, with higher amounts provided in nonacademic groups.
Paid time off (PTO) from work is an ongoing topic of interest on venues such as HMX forum, and, in the surveys, PTO remained fairly consistent among groups caring for adults only and those caring for adults and children, with only 30%-40% of groups offering PTO. The number of PTO hours offered vary substantially, however, ranging from a mean of 126 hours up to 216.4 hours annually. Future analysis of PTO will benefit from a deeper understanding of how many hours equate to a shift (the practical definition of a “day off” for most hospitalists).
Finally, the 2016 survey asked about automatic pay increases based strictly on overall experience or length of employment with the group. Roughly one-fifth to one-third of groups provided some sort of salary increase based on experience in 2015. This practice was more common in the Southern region and in nonteaching hospitals. These data raise the complex topic of seniority among hospitalists and how to define it: years since completing training, years with a particular hospital or group, academic rank, leadership roles, other? Further, if seniority is not recognized in pay, how commonly are groups recognizing it in other ways, such as in preferences related to time on certain services, shift type, or vacation requests?
The expanded survey on hospitalist pay, in addition to the biannual comparison of prior data, will likely continue to add value in assessing and exploring the entire package of compensation. Additional topics of interest moving forward might include better understanding of parental leave, sick time, and the comparison between compensation packages for physician hospitalists and those for inpatient Nurse Practitioners and Physician Assistants. Stay tuned for the next report.
Dr. Anoff is associate professor of clinical practice, division of hospital medicine, department of medicine, University of Colorado at Denver, Aurora.
References
1. (2014). The State of Hospital Medicine Report. Philadelphia: Society of Hospital Medicine. Retrieved from www.hospitalmedicine.org/Survey2014.
2. (2016). The State of Hospital Medicine Report. Philadelphia: Society of Hospital Medicine. Retrieved from www.hospitalmedicine.org/Survey2016.
When approached for advice regarding the evaluation of job offers after completion of training, specific day-to-day duties (for example, shift length, teaching time, ICU coverage, and so on), and the overall gestalt of the interview experience, I find that location, lifestyle, and pay are the most consistent and common themes.
People often assume that pay is relatively straightforward, since it can be summarized in a number in the offer, whereas the other factors are harder to evaluate. However, it turns out pay is more complex. As a result, the last several State of Hospital Medicine reports have sought to evaluate compensation packages more thoroughly.
In 2016, the survey started including pay increases by years of experience, as well as CME dollars allotted per year per hospitalist. The goal was to gain deeper insight into the entire financial package, which is tied to a particular hospitalist job.
When looking at the 2014 and 2016 SHM survey results, there are several interesting findings. Base pay makes up the majority of earnings for all types of hospitalists (those seeing adults only, children only, and a mix of adults and children). In academic hospitalist groups, more of the total package of compensation comes from base pay, compared with nonacademic groups, where production and performance pay play a bigger role.
Of interest, despite the increased national attention on quality of care, productivity-based pay increased again (10.5%-14.7%), while performance-based pay (usually tied to quality and safety metrics) decreased (6.6%-5.7%) among groups serving adults. Consistent with prior trends for adults-only hospitalists, the Southern region of the country had the highest percentage of pay derived from productivity (18.8%), as well as of overall compensation in the 2016 report.
For hospitalists serving both adults and children, there was a smaller increase in pay derived from production (12.4%-13.2%), while pay derived from performance dropped more dramatically (8.9%-3.9%).
For hospitalists serving only children, the opposite occurred: Pay derived from production fell from 10.7% to 2.8%. While it is not yet clear why compensation, overall, is moving into closer alignment with productivity, rather than performance on quality and safety metrics, one hypothesis is that work relative value units used for calculating productivity are easier to tie to an individual hospitalist than are quality and safety outcomes.

Employee benefits, as previously defined, increased among hospitalists caring for adults only and those caring for adults and children, with a mean increase in both groups of $5,000. The most generous benefits were typically seen at university-based academic medical centers. Amongst adult-only hospitalists, academic groups offer benefits worth $8,000-$9,000 more per year than in nonacademic groups. Lower benefits were common among practices in the Eastern region and in groups with four or fewer full-time hospitalists. The 2016 survey data on CME dollars revealed a median of $3,000-$4,000 per year, with higher amounts provided in nonacademic groups.
Paid time off (PTO) from work is an ongoing topic of interest on venues such as HMX forum, and, in the surveys, PTO remained fairly consistent among groups caring for adults only and those caring for adults and children, with only 30%-40% of groups offering PTO. The number of PTO hours offered vary substantially, however, ranging from a mean of 126 hours up to 216.4 hours annually. Future analysis of PTO will benefit from a deeper understanding of how many hours equate to a shift (the practical definition of a “day off” for most hospitalists).
Finally, the 2016 survey asked about automatic pay increases based strictly on overall experience or length of employment with the group. Roughly one-fifth to one-third of groups provided some sort of salary increase based on experience in 2015. This practice was more common in the Southern region and in nonteaching hospitals. These data raise the complex topic of seniority among hospitalists and how to define it: years since completing training, years with a particular hospital or group, academic rank, leadership roles, other? Further, if seniority is not recognized in pay, how commonly are groups recognizing it in other ways, such as in preferences related to time on certain services, shift type, or vacation requests?
The expanded survey on hospitalist pay, in addition to the biannual comparison of prior data, will likely continue to add value in assessing and exploring the entire package of compensation. Additional topics of interest moving forward might include better understanding of parental leave, sick time, and the comparison between compensation packages for physician hospitalists and those for inpatient Nurse Practitioners and Physician Assistants. Stay tuned for the next report.
Dr. Anoff is associate professor of clinical practice, division of hospital medicine, department of medicine, University of Colorado at Denver, Aurora.
References
1. (2014). The State of Hospital Medicine Report. Philadelphia: Society of Hospital Medicine. Retrieved from www.hospitalmedicine.org/Survey2014.
2. (2016). The State of Hospital Medicine Report. Philadelphia: Society of Hospital Medicine. Retrieved from www.hospitalmedicine.org/Survey2016.
When approached for advice regarding the evaluation of job offers after completion of training, specific day-to-day duties (for example, shift length, teaching time, ICU coverage, and so on), and the overall gestalt of the interview experience, I find that location, lifestyle, and pay are the most consistent and common themes.
People often assume that pay is relatively straightforward, since it can be summarized in a number in the offer, whereas the other factors are harder to evaluate. However, it turns out pay is more complex. As a result, the last several State of Hospital Medicine reports have sought to evaluate compensation packages more thoroughly.
In 2016, the survey started including pay increases by years of experience, as well as CME dollars allotted per year per hospitalist. The goal was to gain deeper insight into the entire financial package, which is tied to a particular hospitalist job.
When looking at the 2014 and 2016 SHM survey results, there are several interesting findings. Base pay makes up the majority of earnings for all types of hospitalists (those seeing adults only, children only, and a mix of adults and children). In academic hospitalist groups, more of the total package of compensation comes from base pay, compared with nonacademic groups, where production and performance pay play a bigger role.
Of interest, despite the increased national attention on quality of care, productivity-based pay increased again (10.5%-14.7%), while performance-based pay (usually tied to quality and safety metrics) decreased (6.6%-5.7%) among groups serving adults. Consistent with prior trends for adults-only hospitalists, the Southern region of the country had the highest percentage of pay derived from productivity (18.8%), as well as of overall compensation in the 2016 report.
For hospitalists serving both adults and children, there was a smaller increase in pay derived from production (12.4%-13.2%), while pay derived from performance dropped more dramatically (8.9%-3.9%).
For hospitalists serving only children, the opposite occurred: Pay derived from production fell from 10.7% to 2.8%. While it is not yet clear why compensation, overall, is moving into closer alignment with productivity, rather than performance on quality and safety metrics, one hypothesis is that work relative value units used for calculating productivity are easier to tie to an individual hospitalist than are quality and safety outcomes.

Employee benefits, as previously defined, increased among hospitalists caring for adults only and those caring for adults and children, with a mean increase in both groups of $5,000. The most generous benefits were typically seen at university-based academic medical centers. Amongst adult-only hospitalists, academic groups offer benefits worth $8,000-$9,000 more per year than in nonacademic groups. Lower benefits were common among practices in the Eastern region and in groups with four or fewer full-time hospitalists. The 2016 survey data on CME dollars revealed a median of $3,000-$4,000 per year, with higher amounts provided in nonacademic groups.
Paid time off (PTO) from work is an ongoing topic of interest on venues such as HMX forum, and, in the surveys, PTO remained fairly consistent among groups caring for adults only and those caring for adults and children, with only 30%-40% of groups offering PTO. The number of PTO hours offered vary substantially, however, ranging from a mean of 126 hours up to 216.4 hours annually. Future analysis of PTO will benefit from a deeper understanding of how many hours equate to a shift (the practical definition of a “day off” for most hospitalists).
Finally, the 2016 survey asked about automatic pay increases based strictly on overall experience or length of employment with the group. Roughly one-fifth to one-third of groups provided some sort of salary increase based on experience in 2015. This practice was more common in the Southern region and in nonteaching hospitals. These data raise the complex topic of seniority among hospitalists and how to define it: years since completing training, years with a particular hospital or group, academic rank, leadership roles, other? Further, if seniority is not recognized in pay, how commonly are groups recognizing it in other ways, such as in preferences related to time on certain services, shift type, or vacation requests?
The expanded survey on hospitalist pay, in addition to the biannual comparison of prior data, will likely continue to add value in assessing and exploring the entire package of compensation. Additional topics of interest moving forward might include better understanding of parental leave, sick time, and the comparison between compensation packages for physician hospitalists and those for inpatient Nurse Practitioners and Physician Assistants. Stay tuned for the next report.
Dr. Anoff is associate professor of clinical practice, division of hospital medicine, department of medicine, University of Colorado at Denver, Aurora.
References
1. (2014). The State of Hospital Medicine Report. Philadelphia: Society of Hospital Medicine. Retrieved from www.hospitalmedicine.org/Survey2014.
2. (2016). The State of Hospital Medicine Report. Philadelphia: Society of Hospital Medicine. Retrieved from www.hospitalmedicine.org/Survey2016.

