User login
Bringing you the latest news, research and reviews, exclusive interviews, podcasts, quizzes, and more.
Powered by CHEST Physician, Clinician Reviews, MDedge Family Medicine, Internal Medicine News, and The Journal of Clinical Outcomes Management.
Daily aspirin associated with lower risk of COPD flareup
Daily aspirin use could reduce the risk of acute exacerbations of chronic obstructive pulmonary disease, new data suggest.

Researchers reported the outcomes of an observational cohort study of 1,698 individuals with COPD, 45% of whom said they were taking daily aspirin at baseline. Their findings were published in Chest.
After a median follow up of 2.7 years, aspirin users had an overall 22% lower incidence of acute COPD exacerbations compared with nonusers. This was largely accounted for by a 25% reduction in moderate exacerbations, but there was no significant difference between aspirin users and nonusers in severe exacerbations.
A similar pattern was seen after just 1 year of follow-up, with an overall 30% reduction in the incidence of exacerbations, a 37% reduction in moderate exacerbations, but no significant reduction in severe exacerbations.
“Though aspirin use has previously been linked with reduced mortality risk in patients with COPD, to our knowledge, this is the first study to investigate the association of daily aspirin use with respiratory morbidity in COPD,” wrote Ashraf Fawzy, MD, of the division of pulmonary and critical care medicine at Johns Hopkins University, Baltimore, and his coauthors.
The association between aspirin use and reduced incidence of exacerbations was stronger among individuals with chronic bronchitis, which prompted the authors to suggest that future studies of aspirin in COPD should focus on participants with chronic bronchitis.
However, the association was not affected by COPD severity, emphysema presence or severity, or cardiometabolic phenotype.
Aspirin users reported better respiratory-specific quality of life than that of nonusers, including 34% lower odds of reporting moderate to severe dyspnea, and better baseline COPD health status.
“Findings of this study add to the existing literature by highlighting that aspirin use is also associated with reduced respiratory morbidity across several domains – including exacerbation risk, quality of life, and dyspnea – factors related to patient well-being and healthcare utilization,” the authors wrote.
Aspirin users were more likely to be white, male, and obese, and less likely to be smokers. They had better lung function but more cardiovascular comorbidities at baseline, although the aspirin users and nonusers were matched on baseline characteristics.
Speculating on the mechanisms by which aspirin might impact COPD exacerbations, the authors noted that the drug has both systemic and local pulmonary mechanisms of action.
For example, a pathway that results in elevated levels of a urinary metabolite in patients with COPD is irreversibly blocked by aspirin. Aspirin also attenuates the elevation of inflammatory markers interleukin-6 and C-reactive protein, which are part of the inflammatory phenotype of COPD. Aspirin has been shown to reduce proinflammatory cytokines in the lung.
The authors did note that aspirin use was self-reported, so they did not have data on dosage or duration of use.
The National Institutes of Health funded the study. Six authors declared advisory board positions, research support, and other funding from the pharmaceutical sector. One author was also a founder of a company commercializing lung image analysis software. No other conflicts of interest were declared.
SOURCE: Fawzy A et al. Chest. 2019 Mar;155(3): 519-27. doi: 10.1016/j.chest.2018.11.028.
Daily aspirin use could reduce the risk of acute exacerbations of chronic obstructive pulmonary disease, new data suggest.
Researchers reported the outcomes of an observational cohort study of 1,698 individuals with COPD, 45% of whom said they were taking daily aspirin at baseline. Their findings were published in Chest.
After a median follow up of 2.7 years, aspirin users had an overall 22% lower incidence of acute COPD exacerbations compared with nonusers. This was largely accounted for by a 25% reduction in moderate exacerbations, but there was no significant difference between aspirin users and nonusers in severe exacerbations.
A similar pattern was seen after just 1 year of follow-up, with an overall 30% reduction in the incidence of exacerbations, a 37% reduction in moderate exacerbations, but no significant reduction in severe exacerbations.
“Though aspirin use has previously been linked with reduced mortality risk in patients with COPD, to our knowledge, this is the first study to investigate the association of daily aspirin use with respiratory morbidity in COPD,” wrote Ashraf Fawzy, MD, of the division of pulmonary and critical care medicine at Johns Hopkins University, Baltimore, and his coauthors.
The association between aspirin use and reduced incidence of exacerbations was stronger among individuals with chronic bronchitis, which prompted the authors to suggest that future studies of aspirin in COPD should focus on participants with chronic bronchitis.
However, the association was not affected by COPD severity, emphysema presence or severity, or cardiometabolic phenotype.
Aspirin users reported better respiratory-specific quality of life than that of nonusers, including 34% lower odds of reporting moderate to severe dyspnea, and better baseline COPD health status.
“Findings of this study add to the existing literature by highlighting that aspirin use is also associated with reduced respiratory morbidity across several domains – including exacerbation risk, quality of life, and dyspnea – factors related to patient well-being and healthcare utilization,” the authors wrote.
Aspirin users were more likely to be white, male, and obese, and less likely to be smokers. They had better lung function but more cardiovascular comorbidities at baseline, although the aspirin users and nonusers were matched on baseline characteristics.
Speculating on the mechanisms by which aspirin might impact COPD exacerbations, the authors noted that the drug has both systemic and local pulmonary mechanisms of action.
For example, a pathway that results in elevated levels of a urinary metabolite in patients with COPD is irreversibly blocked by aspirin. Aspirin also attenuates the elevation of inflammatory markers interleukin-6 and C-reactive protein, which are part of the inflammatory phenotype of COPD. Aspirin has been shown to reduce proinflammatory cytokines in the lung.
The authors did note that aspirin use was self-reported, so they did not have data on dosage or duration of use.
The National Institutes of Health funded the study. Six authors declared advisory board positions, research support, and other funding from the pharmaceutical sector. One author was also a founder of a company commercializing lung image analysis software. No other conflicts of interest were declared.
SOURCE: Fawzy A et al. Chest. 2019 Mar;155(3): 519-27. doi: 10.1016/j.chest.2018.11.028.
FROM CHEST
Dupilumab to undergo FDA Priority Review for CRSwNP treatment
The Food and Drug Administration will conduct a Priority Review on the supplemental Biologics License Application (sBLA) for dupilumab (Dupixent) as an add-on treatment for adults with inadequately controlled severe chronic rhinosinusitis with nasal polyps (CRSwNP).

CRSwNP is a chronic disease of the upper airway in which patients can experience severe nasal obstruction with breathing difficulties, nasal discharge, reduction or loss of sense of smell and taste, and facial pain or pressure. There are currently no FDA-approved treatments for the disease, Regeneron said in the press release.
The sBLA is based on results from a pair of phase 3 trials in which patients with CRSwNP received either dupilumab plus a standard-of-care corticosteroid nasal spray or the standard-of-care spray alone. In results presented at the 2019 annual meeting of the American Academy of Allergy, Asthma, and Immunology, dupilumab plus the spray improved nasal polyp size, nasal congestion severity, chronic sinus disease, sense of smell, and comorbid asthma outcomes while reducing the need for corticosteroid use and nasal/sinus surgery.
Dupilumab is currently approved in the United States to treat moderate to severe atopic dermatitis in adults whose disease is poorly controlled with topical agents and as a maintenance treatment in combination with other asthma medications in patients aged 12 years and older whose disease is not controlled with their current prescription. The most common adverse events include injection-site reactions, oropharyngeal pain, and cold sores.
The target action date for the FDA decision is June 26, 2019, Regeneron said.
Find the full press release on the Regeneron website.
The Food and Drug Administration will conduct a Priority Review on the supplemental Biologics License Application (sBLA) for dupilumab (Dupixent) as an add-on treatment for adults with inadequately controlled severe chronic rhinosinusitis with nasal polyps (CRSwNP).
CRSwNP is a chronic disease of the upper airway in which patients can experience severe nasal obstruction with breathing difficulties, nasal discharge, reduction or loss of sense of smell and taste, and facial pain or pressure. There are currently no FDA-approved treatments for the disease, Regeneron said in the press release.
The sBLA is based on results from a pair of phase 3 trials in which patients with CRSwNP received either dupilumab plus a standard-of-care corticosteroid nasal spray or the standard-of-care spray alone. In results presented at the 2019 annual meeting of the American Academy of Allergy, Asthma, and Immunology, dupilumab plus the spray improved nasal polyp size, nasal congestion severity, chronic sinus disease, sense of smell, and comorbid asthma outcomes while reducing the need for corticosteroid use and nasal/sinus surgery.
Dupilumab is currently approved in the United States to treat moderate to severe atopic dermatitis in adults whose disease is poorly controlled with topical agents and as a maintenance treatment in combination with other asthma medications in patients aged 12 years and older whose disease is not controlled with their current prescription. The most common adverse events include injection-site reactions, oropharyngeal pain, and cold sores.
The target action date for the FDA decision is June 26, 2019, Regeneron said.
Find the full press release on the Regeneron website.
Flu activity down for a second straight week
A second straight week of reduced influenza activity suggests that the 2018-2019 flu season is on the decline, according to the most recent data from the Centers for Disease Control and Prevention.
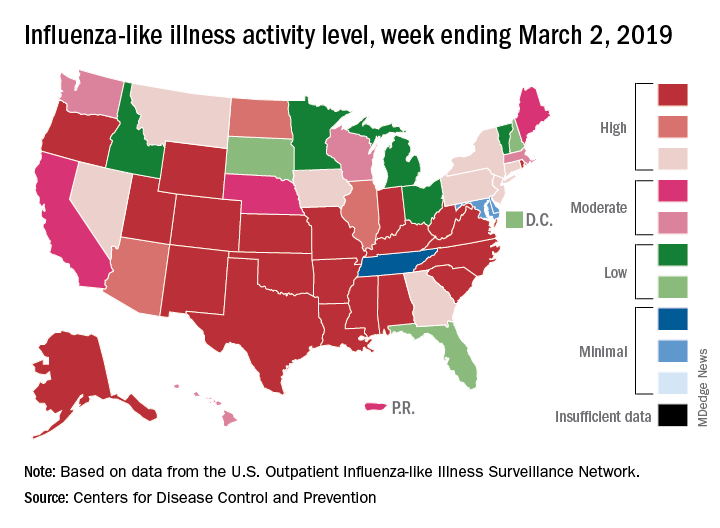
The proportion of outpatient visits for influenza-like illness (ILI) was 4.7% during the week ending March 2, which means that, thanks to a revision of the number for the previous week (Feb. 23) from 5.0% down to 4.9%, there have been two straight weeks of declines since outpatient visits reached a season-high 5.0% for the week ending Feb. 16, the CDC’s influenza division said March 8. The national baseline level is 2.2%.
This marks the second 2-week drop in ILI visits for the 2018-2019 season, as there was similar dip in the beginning of January before activity started rising again.
This compares with 24 the week before; 32 states were in the high range of 8-10, compared with the 33 reported last week, based on data from the Outpatient ILI Surveillance Network.
There were nine flu-related pediatric deaths reported during the week, with three occurring in the week ending March 2. To underscore the preliminary nature of these data, one of the deaths reported this week occurred in 2016. A total of 64 deaths in children have been associated with influenza so far for the 2018-2019 season, and the total for the 2015-2016 season is now 95, the CDC said.
A second straight week of reduced influenza activity suggests that the 2018-2019 flu season is on the decline, according to the most recent data from the Centers for Disease Control and Prevention.
The proportion of outpatient visits for influenza-like illness (ILI) was 4.7% during the week ending March 2, which means that, thanks to a revision of the number for the previous week (Feb. 23) from 5.0% down to 4.9%, there have been two straight weeks of declines since outpatient visits reached a season-high 5.0% for the week ending Feb. 16, the CDC’s influenza division said March 8. The national baseline level is 2.2%.
This marks the second 2-week drop in ILI visits for the 2018-2019 season, as there was similar dip in the beginning of January before activity started rising again.
This compares with 24 the week before; 32 states were in the high range of 8-10, compared with the 33 reported last week, based on data from the Outpatient ILI Surveillance Network.
There were nine flu-related pediatric deaths reported during the week, with three occurring in the week ending March 2. To underscore the preliminary nature of these data, one of the deaths reported this week occurred in 2016. A total of 64 deaths in children have been associated with influenza so far for the 2018-2019 season, and the total for the 2015-2016 season is now 95, the CDC said.
Heart-harming toxins may hurt hookah smokers
Smoking a water pipe, or hookah, can result in significant inhalation of toxins and an increased risk for short- and long-term cardiovascular health problems, according to a scientific statement issued by the American Heart Association on March 8.

In the statement, published in the journal Circulation, Aruni Bhatnagar, PhD, of the University of Louisville (Ky.) and his colleagues reviewed the potential dangers of water pipe use and offered strategies for prevention.
Data from the 2016 National Youth Tobacco Survey showed that current use (defined as use within the past 30 days) of water pipes by high school students increased in a nonlinear trend from 4.1% in 2011 to 4.8% in 2016, with a peak of 9.4% in 2014. Water pipe tobacco is sold in flavors such as cherry, chocolate, and coffee that appeal to younger consumers, and epidemiology data suggest that youth view water pipes as safer than conventional cigarettes because the water “filters out toxins” according to the statement.
Findings from the National Adult Tobacco Survey showed an increase as well, from 1.5% during 2009-2010 to 3.2% during 2013-2014. Adults cite cultural and social influences, as well as psychological benefits of reduced stress and anger and improved concentration, which may be attributable to nicotine, the researchers noted.
Water pipe smoking involves placing charcoal briquettes on top of a tobacco-filled bowl with a stem immersed in water such that the smoke is pulled through and bubbles up through the water into a mouthpiece. and include tar, phenanthrene, carbon monoxide, heavy metals, and arsenic, as well as nicotine.
The patterns of exposure to toxins during water pipe smoking are unclear, the authors noted.
However, the risks for both short-term and long-term health effects are similar to those associated with cigarettes. “Overall, the short-term cardiovascular effects are consistent with the sympathomimetic effects of nicotine,” according to the statement.
Data on the long-term effects of water pipe smoking on cardiovascular health are limited, but “lifetime exposures exceeding 40 water pipe–years (2 water pipes per day for a total of 20 years or 1 water pipe for 40 years) are associated with a threefold increase in the odds of angiographically diagnosed coronary artery stenosis,” according to the statement. Additional research on long-term health effects may help guide regulation of water pipe products, the authors suggested.
The AHA statement encourages health care providers to take a proactive approach in addressing hookah use by asking patients about it, by advising those who use water pipes to quit, by assisting those who want to quit by providing counseling and social support, and by referring water pipe smokers to legitimate resources for information on the potential for addiction and health risks.
Dr. Bhatnagar received funding from the National Institutes of Health, but he had no other financial conflicts to disclose.
SOURCE: Bhatnagar A et al. Circulation. 2019 Mar 8. doi: 10.1161/CIR.0000000000000671.
Smoking a water pipe, or hookah, can result in significant inhalation of toxins and an increased risk for short- and long-term cardiovascular health problems, according to a scientific statement issued by the American Heart Association on March 8.
In the statement, published in the journal Circulation, Aruni Bhatnagar, PhD, of the University of Louisville (Ky.) and his colleagues reviewed the potential dangers of water pipe use and offered strategies for prevention.
Data from the 2016 National Youth Tobacco Survey showed that current use (defined as use within the past 30 days) of water pipes by high school students increased in a nonlinear trend from 4.1% in 2011 to 4.8% in 2016, with a peak of 9.4% in 2014. Water pipe tobacco is sold in flavors such as cherry, chocolate, and coffee that appeal to younger consumers, and epidemiology data suggest that youth view water pipes as safer than conventional cigarettes because the water “filters out toxins” according to the statement.
Findings from the National Adult Tobacco Survey showed an increase as well, from 1.5% during 2009-2010 to 3.2% during 2013-2014. Adults cite cultural and social influences, as well as psychological benefits of reduced stress and anger and improved concentration, which may be attributable to nicotine, the researchers noted.
Water pipe smoking involves placing charcoal briquettes on top of a tobacco-filled bowl with a stem immersed in water such that the smoke is pulled through and bubbles up through the water into a mouthpiece. and include tar, phenanthrene, carbon monoxide, heavy metals, and arsenic, as well as nicotine.
The patterns of exposure to toxins during water pipe smoking are unclear, the authors noted.
However, the risks for both short-term and long-term health effects are similar to those associated with cigarettes. “Overall, the short-term cardiovascular effects are consistent with the sympathomimetic effects of nicotine,” according to the statement.
Data on the long-term effects of water pipe smoking on cardiovascular health are limited, but “lifetime exposures exceeding 40 water pipe–years (2 water pipes per day for a total of 20 years or 1 water pipe for 40 years) are associated with a threefold increase in the odds of angiographically diagnosed coronary artery stenosis,” according to the statement. Additional research on long-term health effects may help guide regulation of water pipe products, the authors suggested.
The AHA statement encourages health care providers to take a proactive approach in addressing hookah use by asking patients about it, by advising those who use water pipes to quit, by assisting those who want to quit by providing counseling and social support, and by referring water pipe smokers to legitimate resources for information on the potential for addiction and health risks.
Dr. Bhatnagar received funding from the National Institutes of Health, but he had no other financial conflicts to disclose.
SOURCE: Bhatnagar A et al. Circulation. 2019 Mar 8. doi: 10.1161/CIR.0000000000000671.
FROM CIRCULATION
Poor COPD management might increase MI risk in HIV
SEATTLE – Chronic obstructive pulmonary disease is independently associated with an increased risk of myocardial infarction in people with HIV, according to a report at the Conference on Retroviruses and Opportunistic Infections.

Chronic obstructive pulmonary disease (COPD) is known to increase the risk of myocardial infarction (MI) in the general population, but hadn’t been shown until now to do the same in HIV. The study raises the question of whether COPD is being managed adequately in patients with the virus, according to study lead Kristina Crothers, MD, associate professor in the division of pulmonary, critical care & sleep medicine at the University of Washington, Seattle.
The investigators reviewed 25,509 HIV patients in the Center for AIDS Research Network of Integrated Clinical Systems cohort, a large electronic database of HIV-infected people. They defined COPD by diagnostic codes and inhaler prescriptions. MIs were adjudicated by review.
The team identified 423 subjects with moderate to severe COPD, and 698 who had MIs, including 339 type 1 MIs (T1MI) from a ruptured plaque (54%), and 294 (46%) type 2 heart attacks (T2MI) from a supply-demand mismatch due to sepsis or some other problem. In general, T2MIs are far more common in people with HIV.
COPD was associated with a greater than twofold increased risk of MI after adjustment for age, sex, viral load, nadir CD4 count, hypertension, and other confounders. The risk dropped slightly when smoking – both current smoking and pack years – was added to the model (adjusted hazard ratio 1.88, 95% confidence interval, 1.34-2.63).
The association was particularly strong for T2MI, especially in the setting of bacteremia and sepsis, and unlike T1MI, it remained significant after adjustment for smoking.
The study establishes a link between COPD and MI in HIV, but it could not answer what’s going on. Chronic inflammation from the virus could be at play, but the team also found hints of inadequate COPD management.
“About 60% of patients were on inhalers ... but only about 25% of them were on long-acting inhalers. 75% were only on short-acting.” That’s a problem because long-acting inhalers are needed to control exacerbations, Dr. Crothers said.
The study didn’t capture exacerbation rates, but increased rates could help explain the MI risk. Increased rates of pneumonia could as well, since pneumonia is a common cause of sepsis.
“We need to better manage complications of COPD in this population. I think optimizing long-term COPD management could have many beneficial effects,” Dr. Crothers said.
The National Institutes of Health funded the work. Dr. Crothers had no disclosures.
SOURCE: Crothers K et al. CROI 2019, Abstract 31.
SEATTLE – Chronic obstructive pulmonary disease is independently associated with an increased risk of myocardial infarction in people with HIV, according to a report at the Conference on Retroviruses and Opportunistic Infections.
Chronic obstructive pulmonary disease (COPD) is known to increase the risk of myocardial infarction (MI) in the general population, but hadn’t been shown until now to do the same in HIV. The study raises the question of whether COPD is being managed adequately in patients with the virus, according to study lead Kristina Crothers, MD, associate professor in the division of pulmonary, critical care & sleep medicine at the University of Washington, Seattle.
The investigators reviewed 25,509 HIV patients in the Center for AIDS Research Network of Integrated Clinical Systems cohort, a large electronic database of HIV-infected people. They defined COPD by diagnostic codes and inhaler prescriptions. MIs were adjudicated by review.
The team identified 423 subjects with moderate to severe COPD, and 698 who had MIs, including 339 type 1 MIs (T1MI) from a ruptured plaque (54%), and 294 (46%) type 2 heart attacks (T2MI) from a supply-demand mismatch due to sepsis or some other problem. In general, T2MIs are far more common in people with HIV.
COPD was associated with a greater than twofold increased risk of MI after adjustment for age, sex, viral load, nadir CD4 count, hypertension, and other confounders. The risk dropped slightly when smoking – both current smoking and pack years – was added to the model (adjusted hazard ratio 1.88, 95% confidence interval, 1.34-2.63).
The association was particularly strong for T2MI, especially in the setting of bacteremia and sepsis, and unlike T1MI, it remained significant after adjustment for smoking.
The study establishes a link between COPD and MI in HIV, but it could not answer what’s going on. Chronic inflammation from the virus could be at play, but the team also found hints of inadequate COPD management.
“About 60% of patients were on inhalers ... but only about 25% of them were on long-acting inhalers. 75% were only on short-acting.” That’s a problem because long-acting inhalers are needed to control exacerbations, Dr. Crothers said.
The study didn’t capture exacerbation rates, but increased rates could help explain the MI risk. Increased rates of pneumonia could as well, since pneumonia is a common cause of sepsis.
“We need to better manage complications of COPD in this population. I think optimizing long-term COPD management could have many beneficial effects,” Dr. Crothers said.
The National Institutes of Health funded the work. Dr. Crothers had no disclosures.
SOURCE: Crothers K et al. CROI 2019, Abstract 31.
REPORTING FROM CROI 2019
Poor asthma control during pregnancy trims live birth rate
SAN FRANCISCO – and among the live births had a significantly increased rate of both preterm delivery and neonatal intensive care admissions, according to a review of insurance claims data for more than 1 million American women during 2011-2015.

On the other hand, asthma severity, which the researchers inferred based on the type and amount of treatment patients received, showed essentially no link with the live birth rate, Jennifer Yland said at the annual meeting of the American Academy of Allergy, Asthma, and Immunology.
“The findings add to the body of evidence that relate poor asthma control to an increased risk for pregnancy complications.” explained Michael X. Schatz, MD, an allergist at Kaiser Permanente of Southern California, in San Diego, and a coauthor of the study.
Results from several prior studies had shown links between asthma and an increased rate of preterm birth, “but the larger, more generalizable population is a strength of the current findings. Results from prior studies have less frequently shown a link between asthma during pregnancy and neonatal ICU admissions,” he added.“The findings strengthen the case for good asthma control during pregnancy.”
For their review, Ms. Yland and her coauthors used insurance claims data from privately-insured American women aged 12-55 years who were pregnant and had drug prescription records during the study period. The database included 996,861 women without an asthma diagnosis and 29,882 women diagnosed with asthma. The analysis excluded women diagnosed with chronic obstructive pulmonary disease at least twice during pregnancy.
To analyze the pregnancy outcomes by asthma severity Ms. Yland and her associates divided the asthma patients into five subgroups based on the drug regimens they were on during pregnancy as a surrogate marker of disease severity. This analysis showed no relationship between disease severity and live birth rate.
The researchers also ran an analysis that divided patients into the quality of their management during pregnancy – either good or poor – based on either of two markers of poor control: filling five or more prescriptions for a short-acting beta-antagonist, or at least one exacerbation episode defined as an asthma-related emergency department visit, hospitalization, or need for oral corticosteroid treatment. By these criteria 7,135 (24%) of the pregnant women with asthma were poorly controlled. The live birth rate was 74% among women without asthma, 71% among those with well-controlled asthma, and 68% among women with poorly-controlled asthma, reported Ms. Yland, a researcher at the Harvard T.H. Chan School of Public Health in Boston.
In a multivariate analysis that adjusted for demographic differences and comorbidities, women with poorly-controlled asthma had preterm delivery a statistically significant 30% more often than did women with well-controlled asthma, and the rate of neonatal ICU admissions was a significant 24% higher in women with poorly-controlled asthma, compared with women who had well-controlled asthma. However, the rates of small-for-gestational-age infants and infants with congenital malformations was not significantly different between the well-controlled and poorly-controlled subgroups.
The finding that almost a quarter of the pregnant women in the study were poorly controlled wasn’t surprising, Dr. Schatz said in an interview. In some studies as many as half the asthma patients have poor control.
The 24% rate of poor asthma control during pregnancy in the studied women is “most likely an underestimate of poor control in the general population” because the study used data from women with commercial health insurance, noted Sonia Hernandez-Diaz, MD, lead investigator for the study and professor of epidemiology at Harvard T.H. Chan School of Public Health. “More disadvantaged populations, such as pregnant women on Medicaid, tend to have worse control.”
Barriers to good asthma control during pregnancy include smoking, weight gain, undertreatment, poor adherence, and viral infection. The overall approach to managing asthma during pregnancy is the same as when women are not pregnant, although certain asthma medications have a better safety record during pregnancy. “The most reassuring data exist for albuterol and inhaled steroids, particularly budesonide and fluticasone. Reassuring data also exist for the long-acting beta agonists salmeterol and formoterol, which are combined with inhaled steroids, and for montelukast,” Dr. Schatz said.
This is the first study to assess the impact of asthma management on pregnancy outcome in such a large population. The large number of women included provided a lot of statistical power and allowed the analyses to control for several potential confounders, Ms. Yland noted in an interview. She plans to expand the analysis with Medicaid data to try to further increase the generalizability and precision of the findings.
The study was funded by GlaxoSmithKline, and a coauthor of the study is a company employee. Ms. Yland had no disclosures. Dr. Schatz has received research funding from ALK, AstraZeneca, Medimmune, GlaxoSmithKline, and Merck. Dr. Hernandez-Diaz has been a consultant to Boehringer Ingelheim, Roche, and UCB, and has received research funding from GlaxoSmithKline, Lilly, and Pfizer.
SOURCE: Yland J et al. J Allergy Clin Immunol. 2019 Feb;143[2]:AB422.
SAN FRANCISCO – and among the live births had a significantly increased rate of both preterm delivery and neonatal intensive care admissions, according to a review of insurance claims data for more than 1 million American women during 2011-2015.
On the other hand, asthma severity, which the researchers inferred based on the type and amount of treatment patients received, showed essentially no link with the live birth rate, Jennifer Yland said at the annual meeting of the American Academy of Allergy, Asthma, and Immunology.
“The findings add to the body of evidence that relate poor asthma control to an increased risk for pregnancy complications.” explained Michael X. Schatz, MD, an allergist at Kaiser Permanente of Southern California, in San Diego, and a coauthor of the study.
Results from several prior studies had shown links between asthma and an increased rate of preterm birth, “but the larger, more generalizable population is a strength of the current findings. Results from prior studies have less frequently shown a link between asthma during pregnancy and neonatal ICU admissions,” he added.“The findings strengthen the case for good asthma control during pregnancy.”
For their review, Ms. Yland and her coauthors used insurance claims data from privately-insured American women aged 12-55 years who were pregnant and had drug prescription records during the study period. The database included 996,861 women without an asthma diagnosis and 29,882 women diagnosed with asthma. The analysis excluded women diagnosed with chronic obstructive pulmonary disease at least twice during pregnancy.
To analyze the pregnancy outcomes by asthma severity Ms. Yland and her associates divided the asthma patients into five subgroups based on the drug regimens they were on during pregnancy as a surrogate marker of disease severity. This analysis showed no relationship between disease severity and live birth rate.
The researchers also ran an analysis that divided patients into the quality of their management during pregnancy – either good or poor – based on either of two markers of poor control: filling five or more prescriptions for a short-acting beta-antagonist, or at least one exacerbation episode defined as an asthma-related emergency department visit, hospitalization, or need for oral corticosteroid treatment. By these criteria 7,135 (24%) of the pregnant women with asthma were poorly controlled. The live birth rate was 74% among women without asthma, 71% among those with well-controlled asthma, and 68% among women with poorly-controlled asthma, reported Ms. Yland, a researcher at the Harvard T.H. Chan School of Public Health in Boston.
In a multivariate analysis that adjusted for demographic differences and comorbidities, women with poorly-controlled asthma had preterm delivery a statistically significant 30% more often than did women with well-controlled asthma, and the rate of neonatal ICU admissions was a significant 24% higher in women with poorly-controlled asthma, compared with women who had well-controlled asthma. However, the rates of small-for-gestational-age infants and infants with congenital malformations was not significantly different between the well-controlled and poorly-controlled subgroups.
The finding that almost a quarter of the pregnant women in the study were poorly controlled wasn’t surprising, Dr. Schatz said in an interview. In some studies as many as half the asthma patients have poor control.
The 24% rate of poor asthma control during pregnancy in the studied women is “most likely an underestimate of poor control in the general population” because the study used data from women with commercial health insurance, noted Sonia Hernandez-Diaz, MD, lead investigator for the study and professor of epidemiology at Harvard T.H. Chan School of Public Health. “More disadvantaged populations, such as pregnant women on Medicaid, tend to have worse control.”
Barriers to good asthma control during pregnancy include smoking, weight gain, undertreatment, poor adherence, and viral infection. The overall approach to managing asthma during pregnancy is the same as when women are not pregnant, although certain asthma medications have a better safety record during pregnancy. “The most reassuring data exist for albuterol and inhaled steroids, particularly budesonide and fluticasone. Reassuring data also exist for the long-acting beta agonists salmeterol and formoterol, which are combined with inhaled steroids, and for montelukast,” Dr. Schatz said.
This is the first study to assess the impact of asthma management on pregnancy outcome in such a large population. The large number of women included provided a lot of statistical power and allowed the analyses to control for several potential confounders, Ms. Yland noted in an interview. She plans to expand the analysis with Medicaid data to try to further increase the generalizability and precision of the findings.
The study was funded by GlaxoSmithKline, and a coauthor of the study is a company employee. Ms. Yland had no disclosures. Dr. Schatz has received research funding from ALK, AstraZeneca, Medimmune, GlaxoSmithKline, and Merck. Dr. Hernandez-Diaz has been a consultant to Boehringer Ingelheim, Roche, and UCB, and has received research funding from GlaxoSmithKline, Lilly, and Pfizer.
SOURCE: Yland J et al. J Allergy Clin Immunol. 2019 Feb;143[2]:AB422.
REPORTING FROM AAAAI 2019
COPD and asthma: Diagnostic accuracy requires spirometry
A study of diagnostic accuracy in the primary care setting showed that among patients receiving inhaled therapies, most had not received an accurate diagnosis of chronic obstructive pulmonary disease (COPD) or asthma according to international guidelines.1,2 Other studies have shown that up to one-third of patients with a diagnosis of asthma3 or COPD4 may not actually have disease based on subsequent lung function testing.
Diagnostic error in medicine leads to numerous lost opportunities including the opportunity to: identify chronic conditions that are the true sources of patients’ symptoms, prevent morbidity and mortality, reduce unnecessary costs to patients and health systems, and deliver high-quality care.5-7 The reasons for diagnostic error in COPD and asthma are multifactorial, stemming from insufficient knowledge of clinical practice guidelines and underutilization of spirometry testing. Spirometry is recommended as part of the workup for suspected COPD and is the preferred test for diagnosing asthma. Spirometry, combined with clinical findings, can help differentiate between these diseases.

In this article, we review the definitions and characteristics of COPD and asthma, address the potential causes for diagnostic error, and explain how current clinical practice guidelines can steer examinations to the right diagnosis, improve clinical management, and contribute to better patient outcomes and quality of life.8,9
COPD and asthma characteristics
COPD. The Global Initiative for Chronic Obstructive Lung Disease (GOLD) defines COPD as a common lung disease characterized by persistent respiratory symptoms and airflow obstruction caused by airway or alveolar abnormalities secondary to significant exposure to noxious particles or gases.10 The most common COPD-risk exposure in the United States is tobacco smoke, chiefly from cigarettes. Risk is also heightened with use of other types of tobacco (pipe, cigar, water pipe), indoor and outdoor air pollution (including second-hand tobacco smoke exposure), and occupational exposures. (Consider testing for alpha-1 antitrypsin deficiency—a known genetic risk factor for COPD—especially when an individual with COPD is younger and has a limited smoking history.)
The most common symptom of COPD is chronic, progressive dyspnea — an increased effort to breathe, with chest heaviness, air hunger, or gasping. About one-third of people with COPD have a chronic cough with sputum production.10 There may be wheezing and chest tightness. Fatigue, weight loss, and anorexia can be seen in severe COPD. Consider this disorder in any individual older than 40 years of age who has dyspnea and chronic cough with sputum production, as well as a history of risk factors. If COPD is suspected, perform spirometry to determine the presence of fixed airflow limitation and confirm the diagnosis.
Asthma is usually characterized by variable airway hyperresponsiveness and chronic inflammation. A typical clinical presentation is an individual with a history of wheezing, shortness of breath, chest tightness, and cough that vary in intensity over time and are coupled with variable expiratory flow limitation. Asthma symptoms are often triggered by allergen or irritant exposure, exercise, weather changes, or viral respiratory infections.2 Symptoms may also be worse at night or first thing in the morning. Once asthma is suspected, document the presence of airflow variability with spirometry to confirm the diagnosis.
[polldaddy:10261486]
Diagnostic error in suspected COPD and asthma
Numerous studies have demonstrated the prevalence of diagnostic error when testing of lung function is neglected.11-14 Using spirometry to confirm a prior clinical diagnosis of COPD, researchers found that:
- 35% to 50% of patients did not have objective evidence of COPD12,13;
- 37% with an asthma-only diagnosis had persistent obstruction, which may indicate COPD or chronic obstructive asthma12; and
- 31% of patients thought to have asthma-COPD overlap did not have a COPD component.12
Continue to: In 2 longitudinal studies...
In 2 longitudinal studies, patients with a diagnosis of asthma were recruited to undergo medication reduction and serial lung function testing. Asthma was excluded in approximately 30% of patients.15,16 Diagnostic error has also been seen in patients hospitalized with exacerbations of COPD and asthma. One study found that only 31% of patients admitted with a diagnosis of COPD exacerbation had undergone a spirometry test prior to hospitalization.17 And of those patients with a diagnosis of COPD who underwent spirometry, 30% had results inconsistent with COPD.17
In another study, 22% of adults hospitalized for COPD or asthma exacerbations had no evidence of obstruction on spirometry at the time of hospitalization.18 This finding refutes a diagnosis of COPD and, in the midst of an exacerbation, challenges an asthma diagnosis as well. Increased awareness of clinical practice guidelines, coupled with the use and accurate interpretation of spirometry are needed for optimal management and treatment of COPD and asthma.
Clinical practice guidelines recommend spirometry for the diagnosis of COPD and asthma and have been issued by GOLD10; the American College of Physicians, American College of Chest Physicians, American Thoracic Society, and the European Respiratory Society19; the Global Initiative for Asthma (GINA)2; and the National Heart, Lung, and Blood Institute.20
When a patient’s symptoms and risk factors suggest COPD, spirometry is needed to show persistent post-bronchodilator airflow obstruction and thereby confirm the diagnosis. However, in the United States, confirmatory spirometry is used only in about one third of patients newly diagnosed with COPD.21,22 Similarly for asthma, in the presence of suggestive symptoms, spirometry is the preferred and most reliable and reproducible test to detect the variable expiratory airflow limitation consistent with this diagnosis.
An alternative to spirometry for the diagnosis of asthma (if needed) is a peak flow meter, a simple tool to measure peak expiratory flow. When compared with spirometry, peak flow measurements are less time consuming, less costly, and not dependent on trained staff to perform.23 However, this option does require that patients perform and document multiple measurements over several days without an objective assessment of their efforts. Unlike spirometry, the peak flow meter has no reference values or reliability and reproducibility standards, and measurements can differ from one peak flow meter to another. Thus, a peak flow meter is less reliable than spirometry for diagnosing asthma. But it can be useful for monitoring asthma control at home and in the clinic setting,24 or for diagnosis if spirometry is unavailable.23
Continue to: Barriers to the use of spirometry...
Barriers to the use of spirometry in the primary care setting exist on several levels. Providers may lack knowledge of clinical practice guidelines that recommend spirometry in the diagnosis of COPD, and they may lack general awareness of the utility of spirometry.25-29 In 2 studies of primary care practices that offered office spirometry, lack of knowledge in conducting and interpreting the test was a barrier to its use.28,30 Primary care physicians also struggle with logistical challenges when clinical visits last just 10 to 15 minutes for patients with multiple comorbidities,27 and maintenance of an office spirometry program may not always be feasible.
Getting to the right diagnosis
Likewise, nonpharmacologic interventions may be misused or go unused when needed if the diagnosis is inaccurate. For patients with COPD, outcomes are improved with pulmonary rehabilitation and supplemental oxygen in the setting of resting hypoxemia, but these resources will not be considered if patients are misdiagnosed as having asthma. A patient with undetected heart failure or obstructive sleep apnea who has been misdiagnosed with COPD or asthma may not receive appropriate diagnostic testing or treatment until asthma or COPD has been ruled out with lung function testing.
Objectively documenting the right diagnosis helps ensure guideline-based management of COPD or asthma. Ruling out these 2 disorders prompts further investigation into other conditions (eg, coronary artery disease, heart failure, gastroesophageal reflux disease, pulmonary hypertension, interstitial lung diseases) that can cause symptoms such as shortness of breath, wheezing, or cough.
The TABLE2,10,34 summarizes some of the more common clinical and spirometric features of COPD and asthma. Onset of COPD usually occurs in those over age 40. Asthma can present in younger individuals, including children. Tobacco use or exposure to noxious substances is more often associated with COPD. Patients with asthma are more likely to have atopy. Symptoms in COPD usually progress with increasing activity or exertion. Symptoms in asthma may vary with certain activities, such as exercise, and with various triggers. These features represent “typical” cases of COPD or asthma, but some patients may have clinical characteristics

Continue to: The utility of spirometry in measuring lung function
The utility of spirometry in measuring lung function. Spirometry is the most reproducible and objective measurement of airflow limitation,10 and it should precede any treatment decisions. This technique—in which the patient performs maximal inhalation followed by forced exhalation—measures airflow over time and determines the lung volume exhaled at any time point. Because this respiratory exercise is patient dependent, a well-trained technician is needed to ensure reproducibility and reliability of results based on technical standards.
Spirometry measures forced vital capacity (FVC) and forced expiratory volume in one second (FEV1), from which the FEV1/FVC ratio is calculated. FVC is the total amount of air from total lung volume that can be exhaled in one breath. FEV1 is the total amount of air exhaled in the first second after initiation of exhalation. Thus, the FEV1/FVC ratio is the percentage of the total amount of air in a single breath that is exhaled in the first second. On average, an individual with normal lungs can exhale approximately 80% of their FVC in the first second, thereby resulting in a FEV1/FVC ratio of 80%.
Spirometry findings with COPD. A post-bronchodilator FEV1/FVC ratio of less than 70% confirms airflow obstruction and is consistent with COPD according to GOLD criteria.10 Post-bronchodilator spirometry is performed after the patient has received a specified dose of an inhaled bronchodilator per lab protocols. In patients with COPD, the FEV1/FVC ratio is persistently low even after administration of a bronchodilator.
Another means of using spirometry to diagnose COPD is referring to age-dependent cutoff values below the lower fifth percentile of the FEV1/FVC ratio (ie, lower limit of normal [LLN]), which differs from the GOLD strategy but is consistent with the American Thoracic Society/European Respiratory Society guidelines.35 Because the FEV1/FVC ratio declines with age, older adults may have a normal post-bronchodilator ratio less than 70%. Admittedly, applying GOLD criteria to older adults could result in overdiagnosis, while using the LLN could lead to underdiagnosis. Although there is no consensus on which method to use, the best approach may be the one that most strongly correlates with pretest probability of disease. In a large Canadian study, the approach that most strongly predicted poor patient outcomes was using a FEV1/FVC based on fixed (70%) and/or LLN criteria, and a low FEV134
Spirometry findings with asthma. According to the American Thoracic Society, a post-bronchodilator response is defined as an increase in FEV1 (or FVC) of 12% if that volume is also ≥200 mL. In patients with suspected asthma, an increase in FEV1 ≥12% and 200 mL is consistent with variable airflow limitation2 and supports the diagnosis. Of note, lung function in patients with asthma may be normal when patients are not symptomatic or when they are receiving therapy. Spirometry is therefore ideally performed before initiating therapy and when maintenance therapy is being considered due to symptoms. If therapy is clinically indicated, a short-acting bronchodilator may be prescribed alone and then held 6 to 8 hours before conducting spirometry. If a trial of a maintenance medication is prescribed before spirometry, consider de-escalation of therapy once the patient is more stable and then perform spirometry to confirm the presence of airflow variability consistent with asthma. (In COPD, there can be a positive bronchodilator response; however, the post-bronchodilator FEV1/FVC ratio remains low.)
Continue to: Don't use in isolation
Don’t use in isolation. Use spirometry to support a clinical suspicion of asthma36 or COPD after a thorough history and physical exam, and not in isolation.
Special consideration: Asthma-COPD overlap syndrome
Some patients have features characteristic of both asthma and COPD and are said to have asthma-COPD overlap syndrome (ACOS). Between 15% and 20% of patients with COPD may in fact have ACOS.36 While there is no specific definition of ACOS, GOLD and GINA describe ACOS as persistent airflow limitation with several features usually associated with asthma and several features usually associated with COPD.2,10,37 ACOS becomes more prevalent with advancing age.
In ACOS, patients with COPD present with increased reversibility or patients with asthma and smoking history develop non-fully reversible airway obstruction at an older age.38 Patients with ACOS have worse lung function, more respiratory symptoms, and lower health-related quality of life than individuals with asthma or COPD alone,39,40 leading to more consumption of medical resources.41 In patients with ACOS, the FEV1/FVC ratio is low and consistent with the diagnosis of COPD. The post-bronchodilator response may be variable, depending on the stage of disease and predominant clinical features. It is still unclear whether ACOS is a separate disease entity, a representation of severe asthma that has morphed into COPD, or not a syndrome but simply 2 separate comorbid disease states.
CORRESPONDENCE
Christina D. Wells, MD, University of Illinois Mile Square Health Center, 1220 S. Wood Street, Chicago, IL 60612; [email protected].
1. Izquierdo JL, Martìn A, de Lucas P, et al. Misdiagnosis of patients receiving inhaled therapies in primary care. Int J Chron Obstruct Pulmon Dis. 2010;5:241-249.
2. Global Initiative for Asthma. Global Strategy for Asthma Management and Prevention. 2018. https://ginasthma.org/wp-content/uploads/2018/04/wms-GINA-2018-report-V1.3-002.pdf. Accessed January 11, 2019.
3. Aaron SD, Vandemheen KL, FitzGerald JM. Reevaluation of diagnosis in adults with physician-diagnosed asthma. JAMA. 2017; 317:269-279.
4. Spero K, Bayasi G, Beaudry L, et al. Overdiagnosis of COPD in hospitalized patients. Int J Chron Obstruct Pulmon Dis. 2017;12:2417-2423.
5. Singh H, Graber ML. Improving diagnosis in health care—the next imperative for patient safety. N Engl J Med. 2015;373:2493-2495.
6. Ball JR, Balogh E. Improving diagnosis in health care: highlights of a report from the National Academies of Sciences, Engineering, and Medicine. Ann Intern Med. 2016;164:59-61.
7. Khullar D, Jha AK, Jena AB. Reducing diagnostic errors—why now? N Engl J Med. 2015;373:2491-2493.
8. Lamprecht B, Soriano JB, Studnicka M, et al. Determinants of underdiagnosis of COPD in national and international surveys. Chest. 2015;148:971-985.
9. Yang CL, Simons E, Foty RG, et al. Misdiagnosis of asthma in schoolchildren. Pediatr Pulmonol. 2017;52:293-302.
10. Global Initiative for Chronic Obstructive Lung Disease. Global Strategy for the Diagnosis, Management, and Prevention of Chronic Obstructive Pulmonary Disease. 2019. https://goldcopd.org/wp-content/uploads/2018/11/GOLD-2019-v1.7-FINAL-14Nov2018-WMS.pdf. Accessed January 12, 2019.
11. Tinkelman DG, Price DB, Nordyke RJ, et al. Misdiagnosis of COPD and asthma in primary care patients 40 years of age and over. J Asthma. 2006;43:75-80.
12. Abramson MJ, Schattner RL, Sulaiman ND, et al. Accuracy of asthma and COPD diagnosis in Australian general practice: a mixed methods study. Prim Care Respir J. 2012;21:167-173.
13. Sichletidis L, Chloros D, Spyratos D, et al. The validity of the diagnosis of chronic obstructive pulmonary disease in general practice. Prim Care Respir J. 2007;16:82-88.
14. Marklund B, Tunsäter A, Bengtsson C. How often is the diagnosis bronchial asthma correct? Fam Pract. 1999;16:112-116.
15. Aaron SD, Vandemheen KL, Boulet LP, et al. Overdiagnosis of asthma in obese and nonobese adults. CMAJ. 2008;179:1121-1131.
16. Aaron SD, Vandemheen KL, FitzGerald JM, et al. Reevaluation of diagnosis in adults with physician-diagnosed asthma. JAMA. 2017;317:269-279.
17. Damarla M, Celli BR, Mullerova HX, et al. Discrepancy in the use of confirmatory tests in patients hospitalized with the diagnosis of chronic obstructive pulmonary disease or congestive heart failure. Respir Care. 2006;51:1120-1124.
18. Prieto Centurion V, Huang F, Naureckus ET, et al. Confirmatory spirometry for adults hospitalized with a diagnosis of asthma or chronic obstructive pulmonary disease exacerbation. BMC Pulm Med. 2012;12:73.
19. Qaseem A, Wilt TJ, Weinberger SE, et al. Diagnosis and management of stable chronic obstructive pulmonary disease: a clinical practice guideline update from the American College of Physicians, American College of Chest Physicians, American Thoracic Society, and European Respiratory Society. Ann Intern Med. 2011;155:179-191.
20. Expert Panel Report 3 (EPR-3): Guidelines for the Diagnosis and Management of Asthma-Summary Report 2007. J Allergy Clin Immunol. 2007. 120(Suppl):S94-S138.
21. Han MK, Kim MG, Mardon R, et al. Spirometry utilization for COPD: how do we measure up? Chest. 2007;132:403-409.
22. Joo MJ, Lee TA, Weiss KB. Geographic variation of spirometry use in newly diagnosed COPD. Chest. 2008;134:38-45.
23. Thorat YT, Salvi SS, Kodgule RR. Peak flow meter with a questionnaire and mini-spirometer to help detect asthma and COPD in real-life clinical practice: a cross-sectional study. NPJ Prim Care Respir Med. 2017;27:32.
24. Kennedy DT, Chang Z, Small RE. Selection of peak flowmeters in ambulatory asthma patients: a review of the literature. Chest. 1998;114:587-592.
25. Walters JA, Hanson E, Mudge P, et al. Barriers to the use of spirometry in general practice. Aust Fam Physician. 2005;34:201-203.
26. Barr RG, Celli BR, Martinez FJ, et al. Physician and patient perceptions in COPD: the COPD Resource Network Needs Assessment Survey. Am J Med. 2005;118:1415.
27. Caramori G, Bettoncelli G, Tosatto R, et al. Underuse of spirometry by general practitioners for the diagnosis of COPD in Italy. Monaldi Arch Chest Dis. 2005;63:6-12.
28. Kaminsky DA, Marcy TW, Bachand F, et al. Knowledge and use of office spirometry for the detection of chronic obstructive pulmonary disease by primary care physicians. Respir Care. 2005;50:1639-1648.
29. Foster JA, Yawn BP, Maziar A, et al. Enhancing COPD management in primary care settings. MedGenMed. 2007;9:24.
30. Bolton CE, Ionescu AA, Edwards PH, et al. Attaining a correct diagnosis of COPD in general practice. Respir Med. 2005:99:493-500.
31. Drummond MB, Dasenbrook EC, Pitz MW, et al. Inhaled corticosteroids in patients with stable chronic obstructive pulmonary disease: a systematic review and meta-analysis. JAMA. 2008;300:2407-2416.
32. Morales DR. LABA monotherapy in asthma: an avoidable problem. Br J Gen Pract. 2013;63:627-628.
33. Nelson HS, Weiss ST, Bleecker ER, et al. The Salmeterol Multicenter Asthma Research Trial: a comparison of usual pharmacotherapy for asthma or usual pharmacotherapy plus salmeterol. Chest. 2006;129:15-26.
34. van Dijk W, Tan W, Li P, et al. Clinical relevance of fixed ratio vs lower limit of normal of FEV1/FVC in COPD: patient-reported outcomes from the CanCOLD cohort. Ann Fam Med. 2015;13:41-48.
35. Miller MR, Hankinson J, Brusasco V, et al. Standardisation of spirometry. Eur Respir J. 2005;26:319-338.
36. Rogliani P, Ora J, Puxeddu E, et al. Airflow obstruction: is it asthma or is it COPD? Int J Chron Obstruct Pulmon Dis. 2016;11:3007-3013.
37. Global Initiative for Asthma. Diagnosis and initial treatment of asthma, COPD and asthma-COPD overlap syndrome. 2017. https://ginasthma.org/. Accessed January 12, 2019.
38. Barrecheguren M, Esquinas C, Miravitlles M. The asthma-chronic obstructive pulmonary disease overlap syndrome (ACOS): opportunities and challenges. Curr Opin Pulm Med. 2015;21:74-79.
39. Kauppi P, Kupiainen H, Lindqvist A, et al. Overlap syndrome of asthma and COPD predicts low quality of life. J Asthma. 2011;48:279-285.
40. Mannino DM, Gagnon RC, Petty TL, et al. Obstructive lung disease and low lung function in adults in the United States: data from the National Health and Nutrition Examination Survey, 1988-1994. Arch Intern Med. 2000;160:1683-1689.
41. Shaya FT, Dongyi D, Akazawa MO, et al. Burden of concomitant asthma and COPD in a Medicaid population. Chest. 2008;134:14-19.
A study of diagnostic accuracy in the primary care setting showed that among patients receiving inhaled therapies, most had not received an accurate diagnosis of chronic obstructive pulmonary disease (COPD) or asthma according to international guidelines.1,2 Other studies have shown that up to one-third of patients with a diagnosis of asthma3 or COPD4 may not actually have disease based on subsequent lung function testing.
Diagnostic error in medicine leads to numerous lost opportunities including the opportunity to: identify chronic conditions that are the true sources of patients’ symptoms, prevent morbidity and mortality, reduce unnecessary costs to patients and health systems, and deliver high-quality care.5-7 The reasons for diagnostic error in COPD and asthma are multifactorial, stemming from insufficient knowledge of clinical practice guidelines and underutilization of spirometry testing. Spirometry is recommended as part of the workup for suspected COPD and is the preferred test for diagnosing asthma. Spirometry, combined with clinical findings, can help differentiate between these diseases.
In this article, we review the definitions and characteristics of COPD and asthma, address the potential causes for diagnostic error, and explain how current clinical practice guidelines can steer examinations to the right diagnosis, improve clinical management, and contribute to better patient outcomes and quality of life.8,9
COPD and asthma characteristics
COPD. The Global Initiative for Chronic Obstructive Lung Disease (GOLD) defines COPD as a common lung disease characterized by persistent respiratory symptoms and airflow obstruction caused by airway or alveolar abnormalities secondary to significant exposure to noxious particles or gases.10 The most common COPD-risk exposure in the United States is tobacco smoke, chiefly from cigarettes. Risk is also heightened with use of other types of tobacco (pipe, cigar, water pipe), indoor and outdoor air pollution (including second-hand tobacco smoke exposure), and occupational exposures. (Consider testing for alpha-1 antitrypsin deficiency—a known genetic risk factor for COPD—especially when an individual with COPD is younger and has a limited smoking history.)
The most common symptom of COPD is chronic, progressive dyspnea — an increased effort to breathe, with chest heaviness, air hunger, or gasping. About one-third of people with COPD have a chronic cough with sputum production.10 There may be wheezing and chest tightness. Fatigue, weight loss, and anorexia can be seen in severe COPD. Consider this disorder in any individual older than 40 years of age who has dyspnea and chronic cough with sputum production, as well as a history of risk factors. If COPD is suspected, perform spirometry to determine the presence of fixed airflow limitation and confirm the diagnosis.
Asthma is usually characterized by variable airway hyperresponsiveness and chronic inflammation. A typical clinical presentation is an individual with a history of wheezing, shortness of breath, chest tightness, and cough that vary in intensity over time and are coupled with variable expiratory flow limitation. Asthma symptoms are often triggered by allergen or irritant exposure, exercise, weather changes, or viral respiratory infections.2 Symptoms may also be worse at night or first thing in the morning. Once asthma is suspected, document the presence of airflow variability with spirometry to confirm the diagnosis.
[polldaddy:10261486]
Diagnostic error in suspected COPD and asthma
Numerous studies have demonstrated the prevalence of diagnostic error when testing of lung function is neglected.11-14 Using spirometry to confirm a prior clinical diagnosis of COPD, researchers found that:
- 35% to 50% of patients did not have objective evidence of COPD12,13;
- 37% with an asthma-only diagnosis had persistent obstruction, which may indicate COPD or chronic obstructive asthma12; and
- 31% of patients thought to have asthma-COPD overlap did not have a COPD component.12
Continue to: In 2 longitudinal studies...
In 2 longitudinal studies, patients with a diagnosis of asthma were recruited to undergo medication reduction and serial lung function testing. Asthma was excluded in approximately 30% of patients.15,16 Diagnostic error has also been seen in patients hospitalized with exacerbations of COPD and asthma. One study found that only 31% of patients admitted with a diagnosis of COPD exacerbation had undergone a spirometry test prior to hospitalization.17 And of those patients with a diagnosis of COPD who underwent spirometry, 30% had results inconsistent with COPD.17
In another study, 22% of adults hospitalized for COPD or asthma exacerbations had no evidence of obstruction on spirometry at the time of hospitalization.18 This finding refutes a diagnosis of COPD and, in the midst of an exacerbation, challenges an asthma diagnosis as well. Increased awareness of clinical practice guidelines, coupled with the use and accurate interpretation of spirometry are needed for optimal management and treatment of COPD and asthma.
Clinical practice guidelines recommend spirometry for the diagnosis of COPD and asthma and have been issued by GOLD10; the American College of Physicians, American College of Chest Physicians, American Thoracic Society, and the European Respiratory Society19; the Global Initiative for Asthma (GINA)2; and the National Heart, Lung, and Blood Institute.20
When a patient’s symptoms and risk factors suggest COPD, spirometry is needed to show persistent post-bronchodilator airflow obstruction and thereby confirm the diagnosis. However, in the United States, confirmatory spirometry is used only in about one third of patients newly diagnosed with COPD.21,22 Similarly for asthma, in the presence of suggestive symptoms, spirometry is the preferred and most reliable and reproducible test to detect the variable expiratory airflow limitation consistent with this diagnosis.
An alternative to spirometry for the diagnosis of asthma (if needed) is a peak flow meter, a simple tool to measure peak expiratory flow. When compared with spirometry, peak flow measurements are less time consuming, less costly, and not dependent on trained staff to perform.23 However, this option does require that patients perform and document multiple measurements over several days without an objective assessment of their efforts. Unlike spirometry, the peak flow meter has no reference values or reliability and reproducibility standards, and measurements can differ from one peak flow meter to another. Thus, a peak flow meter is less reliable than spirometry for diagnosing asthma. But it can be useful for monitoring asthma control at home and in the clinic setting,24 or for diagnosis if spirometry is unavailable.23
Continue to: Barriers to the use of spirometry...
Barriers to the use of spirometry in the primary care setting exist on several levels. Providers may lack knowledge of clinical practice guidelines that recommend spirometry in the diagnosis of COPD, and they may lack general awareness of the utility of spirometry.25-29 In 2 studies of primary care practices that offered office spirometry, lack of knowledge in conducting and interpreting the test was a barrier to its use.28,30 Primary care physicians also struggle with logistical challenges when clinical visits last just 10 to 15 minutes for patients with multiple comorbidities,27 and maintenance of an office spirometry program may not always be feasible.
Getting to the right diagnosis
Likewise, nonpharmacologic interventions may be misused or go unused when needed if the diagnosis is inaccurate. For patients with COPD, outcomes are improved with pulmonary rehabilitation and supplemental oxygen in the setting of resting hypoxemia, but these resources will not be considered if patients are misdiagnosed as having asthma. A patient with undetected heart failure or obstructive sleep apnea who has been misdiagnosed with COPD or asthma may not receive appropriate diagnostic testing or treatment until asthma or COPD has been ruled out with lung function testing.
Objectively documenting the right diagnosis helps ensure guideline-based management of COPD or asthma. Ruling out these 2 disorders prompts further investigation into other conditions (eg, coronary artery disease, heart failure, gastroesophageal reflux disease, pulmonary hypertension, interstitial lung diseases) that can cause symptoms such as shortness of breath, wheezing, or cough.
The TABLE2,10,34 summarizes some of the more common clinical and spirometric features of COPD and asthma. Onset of COPD usually occurs in those over age 40. Asthma can present in younger individuals, including children. Tobacco use or exposure to noxious substances is more often associated with COPD. Patients with asthma are more likely to have atopy. Symptoms in COPD usually progress with increasing activity or exertion. Symptoms in asthma may vary with certain activities, such as exercise, and with various triggers. These features represent “typical” cases of COPD or asthma, but some patients may have clinical characteristics
Continue to: The utility of spirometry in measuring lung function
The utility of spirometry in measuring lung function. Spirometry is the most reproducible and objective measurement of airflow limitation,10 and it should precede any treatment decisions. This technique—in which the patient performs maximal inhalation followed by forced exhalation—measures airflow over time and determines the lung volume exhaled at any time point. Because this respiratory exercise is patient dependent, a well-trained technician is needed to ensure reproducibility and reliability of results based on technical standards.
Spirometry measures forced vital capacity (FVC) and forced expiratory volume in one second (FEV1), from which the FEV1/FVC ratio is calculated. FVC is the total amount of air from total lung volume that can be exhaled in one breath. FEV1 is the total amount of air exhaled in the first second after initiation of exhalation. Thus, the FEV1/FVC ratio is the percentage of the total amount of air in a single breath that is exhaled in the first second. On average, an individual with normal lungs can exhale approximately 80% of their FVC in the first second, thereby resulting in a FEV1/FVC ratio of 80%.
Spirometry findings with COPD. A post-bronchodilator FEV1/FVC ratio of less than 70% confirms airflow obstruction and is consistent with COPD according to GOLD criteria.10 Post-bronchodilator spirometry is performed after the patient has received a specified dose of an inhaled bronchodilator per lab protocols. In patients with COPD, the FEV1/FVC ratio is persistently low even after administration of a bronchodilator.
Another means of using spirometry to diagnose COPD is referring to age-dependent cutoff values below the lower fifth percentile of the FEV1/FVC ratio (ie, lower limit of normal [LLN]), which differs from the GOLD strategy but is consistent with the American Thoracic Society/European Respiratory Society guidelines.35 Because the FEV1/FVC ratio declines with age, older adults may have a normal post-bronchodilator ratio less than 70%. Admittedly, applying GOLD criteria to older adults could result in overdiagnosis, while using the LLN could lead to underdiagnosis. Although there is no consensus on which method to use, the best approach may be the one that most strongly correlates with pretest probability of disease. In a large Canadian study, the approach that most strongly predicted poor patient outcomes was using a FEV1/FVC based on fixed (70%) and/or LLN criteria, and a low FEV134
Spirometry findings with asthma. According to the American Thoracic Society, a post-bronchodilator response is defined as an increase in FEV1 (or FVC) of 12% if that volume is also ≥200 mL. In patients with suspected asthma, an increase in FEV1 ≥12% and 200 mL is consistent with variable airflow limitation2 and supports the diagnosis. Of note, lung function in patients with asthma may be normal when patients are not symptomatic or when they are receiving therapy. Spirometry is therefore ideally performed before initiating therapy and when maintenance therapy is being considered due to symptoms. If therapy is clinically indicated, a short-acting bronchodilator may be prescribed alone and then held 6 to 8 hours before conducting spirometry. If a trial of a maintenance medication is prescribed before spirometry, consider de-escalation of therapy once the patient is more stable and then perform spirometry to confirm the presence of airflow variability consistent with asthma. (In COPD, there can be a positive bronchodilator response; however, the post-bronchodilator FEV1/FVC ratio remains low.)
Continue to: Don't use in isolation
Don’t use in isolation. Use spirometry to support a clinical suspicion of asthma36 or COPD after a thorough history and physical exam, and not in isolation.
Special consideration: Asthma-COPD overlap syndrome
Some patients have features characteristic of both asthma and COPD and are said to have asthma-COPD overlap syndrome (ACOS). Between 15% and 20% of patients with COPD may in fact have ACOS.36 While there is no specific definition of ACOS, GOLD and GINA describe ACOS as persistent airflow limitation with several features usually associated with asthma and several features usually associated with COPD.2,10,37 ACOS becomes more prevalent with advancing age.
In ACOS, patients with COPD present with increased reversibility or patients with asthma and smoking history develop non-fully reversible airway obstruction at an older age.38 Patients with ACOS have worse lung function, more respiratory symptoms, and lower health-related quality of life than individuals with asthma or COPD alone,39,40 leading to more consumption of medical resources.41 In patients with ACOS, the FEV1/FVC ratio is low and consistent with the diagnosis of COPD. The post-bronchodilator response may be variable, depending on the stage of disease and predominant clinical features. It is still unclear whether ACOS is a separate disease entity, a representation of severe asthma that has morphed into COPD, or not a syndrome but simply 2 separate comorbid disease states.
CORRESPONDENCE
Christina D. Wells, MD, University of Illinois Mile Square Health Center, 1220 S. Wood Street, Chicago, IL 60612; [email protected].
1. Izquierdo JL, Martìn A, de Lucas P, et al. Misdiagnosis of patients receiving inhaled therapies in primary care. Int J Chron Obstruct Pulmon Dis. 2010;5:241-249.
2. Global Initiative for Asthma. Global Strategy for Asthma Management and Prevention. 2018. https://ginasthma.org/wp-content/uploads/2018/04/wms-GINA-2018-report-V1.3-002.pdf. Accessed January 11, 2019.
3. Aaron SD, Vandemheen KL, FitzGerald JM. Reevaluation of diagnosis in adults with physician-diagnosed asthma. JAMA. 2017; 317:269-279.
4. Spero K, Bayasi G, Beaudry L, et al. Overdiagnosis of COPD in hospitalized patients. Int J Chron Obstruct Pulmon Dis. 2017;12:2417-2423.
5. Singh H, Graber ML. Improving diagnosis in health care—the next imperative for patient safety. N Engl J Med. 2015;373:2493-2495.
6. Ball JR, Balogh E. Improving diagnosis in health care: highlights of a report from the National Academies of Sciences, Engineering, and Medicine. Ann Intern Med. 2016;164:59-61.
7. Khullar D, Jha AK, Jena AB. Reducing diagnostic errors—why now? N Engl J Med. 2015;373:2491-2493.
8. Lamprecht B, Soriano JB, Studnicka M, et al. Determinants of underdiagnosis of COPD in national and international surveys. Chest. 2015;148:971-985.
9. Yang CL, Simons E, Foty RG, et al. Misdiagnosis of asthma in schoolchildren. Pediatr Pulmonol. 2017;52:293-302.
10. Global Initiative for Chronic Obstructive Lung Disease. Global Strategy for the Diagnosis, Management, and Prevention of Chronic Obstructive Pulmonary Disease. 2019. https://goldcopd.org/wp-content/uploads/2018/11/GOLD-2019-v1.7-FINAL-14Nov2018-WMS.pdf. Accessed January 12, 2019.
11. Tinkelman DG, Price DB, Nordyke RJ, et al. Misdiagnosis of COPD and asthma in primary care patients 40 years of age and over. J Asthma. 2006;43:75-80.
12. Abramson MJ, Schattner RL, Sulaiman ND, et al. Accuracy of asthma and COPD diagnosis in Australian general practice: a mixed methods study. Prim Care Respir J. 2012;21:167-173.
13. Sichletidis L, Chloros D, Spyratos D, et al. The validity of the diagnosis of chronic obstructive pulmonary disease in general practice. Prim Care Respir J. 2007;16:82-88.
14. Marklund B, Tunsäter A, Bengtsson C. How often is the diagnosis bronchial asthma correct? Fam Pract. 1999;16:112-116.
15. Aaron SD, Vandemheen KL, Boulet LP, et al. Overdiagnosis of asthma in obese and nonobese adults. CMAJ. 2008;179:1121-1131.
16. Aaron SD, Vandemheen KL, FitzGerald JM, et al. Reevaluation of diagnosis in adults with physician-diagnosed asthma. JAMA. 2017;317:269-279.
17. Damarla M, Celli BR, Mullerova HX, et al. Discrepancy in the use of confirmatory tests in patients hospitalized with the diagnosis of chronic obstructive pulmonary disease or congestive heart failure. Respir Care. 2006;51:1120-1124.
18. Prieto Centurion V, Huang F, Naureckus ET, et al. Confirmatory spirometry for adults hospitalized with a diagnosis of asthma or chronic obstructive pulmonary disease exacerbation. BMC Pulm Med. 2012;12:73.
19. Qaseem A, Wilt TJ, Weinberger SE, et al. Diagnosis and management of stable chronic obstructive pulmonary disease: a clinical practice guideline update from the American College of Physicians, American College of Chest Physicians, American Thoracic Society, and European Respiratory Society. Ann Intern Med. 2011;155:179-191.
20. Expert Panel Report 3 (EPR-3): Guidelines for the Diagnosis and Management of Asthma-Summary Report 2007. J Allergy Clin Immunol. 2007. 120(Suppl):S94-S138.
21. Han MK, Kim MG, Mardon R, et al. Spirometry utilization for COPD: how do we measure up? Chest. 2007;132:403-409.
22. Joo MJ, Lee TA, Weiss KB. Geographic variation of spirometry use in newly diagnosed COPD. Chest. 2008;134:38-45.
23. Thorat YT, Salvi SS, Kodgule RR. Peak flow meter with a questionnaire and mini-spirometer to help detect asthma and COPD in real-life clinical practice: a cross-sectional study. NPJ Prim Care Respir Med. 2017;27:32.
24. Kennedy DT, Chang Z, Small RE. Selection of peak flowmeters in ambulatory asthma patients: a review of the literature. Chest. 1998;114:587-592.
25. Walters JA, Hanson E, Mudge P, et al. Barriers to the use of spirometry in general practice. Aust Fam Physician. 2005;34:201-203.
26. Barr RG, Celli BR, Martinez FJ, et al. Physician and patient perceptions in COPD: the COPD Resource Network Needs Assessment Survey. Am J Med. 2005;118:1415.
27. Caramori G, Bettoncelli G, Tosatto R, et al. Underuse of spirometry by general practitioners for the diagnosis of COPD in Italy. Monaldi Arch Chest Dis. 2005;63:6-12.
28. Kaminsky DA, Marcy TW, Bachand F, et al. Knowledge and use of office spirometry for the detection of chronic obstructive pulmonary disease by primary care physicians. Respir Care. 2005;50:1639-1648.
29. Foster JA, Yawn BP, Maziar A, et al. Enhancing COPD management in primary care settings. MedGenMed. 2007;9:24.
30. Bolton CE, Ionescu AA, Edwards PH, et al. Attaining a correct diagnosis of COPD in general practice. Respir Med. 2005:99:493-500.
31. Drummond MB, Dasenbrook EC, Pitz MW, et al. Inhaled corticosteroids in patients with stable chronic obstructive pulmonary disease: a systematic review and meta-analysis. JAMA. 2008;300:2407-2416.
32. Morales DR. LABA monotherapy in asthma: an avoidable problem. Br J Gen Pract. 2013;63:627-628.
33. Nelson HS, Weiss ST, Bleecker ER, et al. The Salmeterol Multicenter Asthma Research Trial: a comparison of usual pharmacotherapy for asthma or usual pharmacotherapy plus salmeterol. Chest. 2006;129:15-26.
34. van Dijk W, Tan W, Li P, et al. Clinical relevance of fixed ratio vs lower limit of normal of FEV1/FVC in COPD: patient-reported outcomes from the CanCOLD cohort. Ann Fam Med. 2015;13:41-48.
35. Miller MR, Hankinson J, Brusasco V, et al. Standardisation of spirometry. Eur Respir J. 2005;26:319-338.
36. Rogliani P, Ora J, Puxeddu E, et al. Airflow obstruction: is it asthma or is it COPD? Int J Chron Obstruct Pulmon Dis. 2016;11:3007-3013.
37. Global Initiative for Asthma. Diagnosis and initial treatment of asthma, COPD and asthma-COPD overlap syndrome. 2017. https://ginasthma.org/. Accessed January 12, 2019.
38. Barrecheguren M, Esquinas C, Miravitlles M. The asthma-chronic obstructive pulmonary disease overlap syndrome (ACOS): opportunities and challenges. Curr Opin Pulm Med. 2015;21:74-79.
39. Kauppi P, Kupiainen H, Lindqvist A, et al. Overlap syndrome of asthma and COPD predicts low quality of life. J Asthma. 2011;48:279-285.
40. Mannino DM, Gagnon RC, Petty TL, et al. Obstructive lung disease and low lung function in adults in the United States: data from the National Health and Nutrition Examination Survey, 1988-1994. Arch Intern Med. 2000;160:1683-1689.
41. Shaya FT, Dongyi D, Akazawa MO, et al. Burden of concomitant asthma and COPD in a Medicaid population. Chest. 2008;134:14-19.
PRACTICE RECOMMENDATIONS
› Perform spirometry in all patients with symptoms and risk factors suggestive of chronic obstructive pulmonary disease (COPD) or asthma. B
› Consider having a patient use a peak flow meter to support a diagnosis of asthma if spirometry is unavailable. B
› Consider the possibility of a diagnostic error if COPD or asthma is unresponsive to treatment and the initial diagnosis was made without spirometry. B
Strength of recommendation (SOR)
A Good-quality patient-oriented evidence
B Inconsistent or limited-quality patient-oriented evidence
C Consensus, usual practice, opinion, disease-oriented evidence, case series

Second extubation attempts should be judged on their own merits
SAN DIEGO – When attempting a second extubation, improvements in weaning parameters, compared with the first extubation attempt, do not predict success. Instead, the best predictors were the values of the parameters immediately before the second attempt.
“We hypothesized that the change in parameter values was more important than the actual values right before we tried to re-extubate, and that didn’t turn out to be the case. Because it was a smaller study, we can’t say [change in values] is not useful at all, but we didn’t find a strong association. We showed that the magnitude of the effect with the number measured right before the re-extubation is probably your best bet, but you should obviously evaluate the whole clinical scenario,” commented senior author Michael David Maile, MD, assistant professor of anesthesiology at the University of Michigan, Ann Arbor.
The study was presented at the Critical Care Congress sponsored by the Society of Critical Care Medicine by Suraj Trivedi, MD, who is currently an anesthesiology fellow at Stanford (Calif.) Medicine.
Factors such as rapid shallow breathing index (RSBI), negative inspiratory force (NIF), vital capacity (VC), and partial pressure of arterial carbon dioxide (PaCO2) have been shown to predict success or failure of an initial extubation attempt.
There is currently little available guidance on how to proceed when a first extubation attempt fails. The researchers had anticipated that RSBI, NIF, VC, and PaCO2 levels matching the first attempt would be associated with success the second time around.
But their retrospective study of adult patients at the University of Michigan critical care units found that only the change in RSBI values predicted success on a univariate analysis, and that association became statistically insignificant once they corrected for baseline RSBI previous to the re-extubation attempt.
“I think the biggest take-home message is that we have to figure out each attempt to extubate on its own merits. If you’re trying to extubate a patient in the ICU who has potentially been intubated and extubated multiple times, the clinical gut feeling is always that [the patient has] to be better off than the previous attempt. What we are pointing out is that it really doesn’t matter. If the parameters are all within the overall guidelines, it’s still okay to extubate, even if the absolute change in the variables is not better [than the previous attempt],” Dr. Trivedi said in an interview.
“People put a lot of emphasis on the improvement from the first to the second attempt, and this should temper that enthusiasm to put a lot of weight on the change. But I don’t think our data support that the change means nothing,” added Dr. Maile.
The study included 525 patients (42% female). Comorbidities were common: 72% had cardiac arrhythmias, 58% had hypertension, 33% had renal failure, 39% had a pulmonary disorder, and 25% had liver disease.
Univariate analyses showed associations between values of parameters immediately before the second extubation attempt and success in the second extubation attempt, including RSBI (re-extubation success, mean 53.1 vs failure, mean 68.8; P =.0002) and NIF (success, mean –41.2 vs. failure, mean –38.4; P =.036), and VC (success, mean 1009.8 vs. failure, mean 906.8; P =.017).
When the researchers examined changes in parameters between the first and second attempt, only a change in RSBI predicted success (success, value change of 7.1 vs. failure, value change of 0.05; P less than .031). But when they corrected for the RSBI value immediately before the second attempt, the difference was not statistically significant (P = .892).
The study was not funded. Dr. Maile and Dr. Trivedi have no relevant financial disclosures.
SOURCE: Trivedi S et al. CCC48 2019, Abstract 27.
REPORTING FROM CCC48
Key clinical point: Patient readiness for a second extubation should be judged by current parameters alone.
Major finding: The change in parameter values between first and second extubation attempts was not predictive of success.
Study details: A retrospective analysis of 525 patients.
Disclosures: The study was not funded. Dr. Maile and Dr. Trivedi have no relevant financial disclosures.
Source: Trivedi S et al. CCC48 2019, Abstract 27.
Flu season shows signs of peaking
The 2018-2019 flu season may have peaked as the major nationwide measure of influenza activity held steady for the week ending Feb. 23, according to the Centers for Disease Control and Prevention. The proportion of outpatient visits for influenza-like illness (ILI) was 5.0% for the most recent reporting week, the CDC’s influenza division said in its March 1 report. The previous week’s outpatient visit rate, originally reported as 5.1%, was revised this week to 5.0% as well, suggesting that flu activity is no longer increasing.
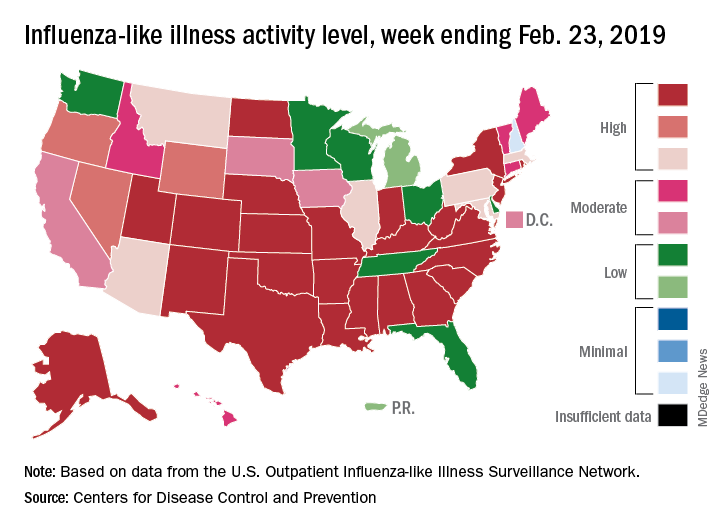
Activity at the state level was more mixed. The number of states at level 10 on the CDC’s 1-10 scale of ILI activity stayed at 24 as Indiana and North Dakota replaced Tennessee and Wyoming, but the number of states in the high range (8-10) of the activity scale increased from 30 to 33, CDC data show.
The signs of plateauing ILI activity did not, however, extend to flu-related deaths, with 15 reported among children – the highest weekly number for the 2018-2019 season, although 11 actually occurred in previous weeks – during the week ending Feb. 23 and 289 deaths among all ages for the week ending Feb. 16, which is already more than the 268 listed the week before despite less complete reporting (82% vs. 97%), the CDC reported. Total flu-related deaths in children are now up to 56, compared with 138 at the corresponding point in the 2017-2018 season.
The 2018-2019 flu season may have peaked as the major nationwide measure of influenza activity held steady for the week ending Feb. 23, according to the Centers for Disease Control and Prevention. The proportion of outpatient visits for influenza-like illness (ILI) was 5.0% for the most recent reporting week, the CDC’s influenza division said in its March 1 report. The previous week’s outpatient visit rate, originally reported as 5.1%, was revised this week to 5.0% as well, suggesting that flu activity is no longer increasing.
Activity at the state level was more mixed. The number of states at level 10 on the CDC’s 1-10 scale of ILI activity stayed at 24 as Indiana and North Dakota replaced Tennessee and Wyoming, but the number of states in the high range (8-10) of the activity scale increased from 30 to 33, CDC data show.
The signs of plateauing ILI activity did not, however, extend to flu-related deaths, with 15 reported among children – the highest weekly number for the 2018-2019 season, although 11 actually occurred in previous weeks – during the week ending Feb. 23 and 289 deaths among all ages for the week ending Feb. 16, which is already more than the 268 listed the week before despite less complete reporting (82% vs. 97%), the CDC reported. Total flu-related deaths in children are now up to 56, compared with 138 at the corresponding point in the 2017-2018 season.
U.S. sesame allergy prevalence estimated at 750,000
SAN FRANCISCO – The estimated roughly about 750,000 people, according to a recent, representative survey of more than 78,000 Americans, which shows sesame allergy apparently is common enough to prompt the Food and Drug Administration to require food labels that identify sesame as an ingredient or possible contaminant.
The sesame-allergy data also showed that sesame reactions were rated as having been severe by about a third of respondents, they caused about two-thirds of people who responded to sesame to go to an emergency department at least once (the highest rate for this outcome among all food allergies), and reactions had led to use of an epinephrine automated injector by about a quarter of people who responded to it, Christopher M. Warren said at the annual meeting of the American Academy of Allergy, Asthma, and Immunology.
These findings document the public health importance of sesame allergy, which seems widespread and often severe enough to warrant making sesame the ninth allergen to require specific food labeling, said Ruchi S. Gupta, MD, senior author of the study and a professor of pediatrics and medicine at Northwestern University in Chicago.
“It seems to rank up with other food allergens regarding reaction severity,” Dr. Gupta said in a video interview. In October 2018, the FDA requested information on sesame allergy so that its staff could consider adding sesame to its list of major food allergens. The eight current major food allergens that require specific labeling are: peanut, tree nuts, eggs, milk, fish, shellfish, wheat, and soy. The 0.23% prevalence of sesame among U.S. residents makes it more common than certain tree nuts, and so the prevalence numbers also seem to justify adding sesame to the FDA’s labeling list because 750,000 is “a lot of people,” she noted.
An established surveying group based at the University of Chicago ran the data collection, which received responses from 53,575 U.S. household including 40,443 adults and 38,408 children. Dr. Gupta and her associates recently published information on the methods of the survey and other findings it made about U.S. food allergy rates (JAMA Network Open. 2019 Jan 4. doi: 10.1001/jamanetworkopen.2018.5630). The descriptions people provided about their food allergy diagnoses, and the effects these allergies had, underwent detailed review by a panel of experts who decide whether or not the evidence for an allergy was “convincing.” The 0.23% prevalence rate reported for sesame represented people for whom this allergy was convincingly demonstrated, reflected a confirmed physician diagnosis, or both, and hence it was a conservative estimate, Dr. Gupta said.

Mr. Warren had no disclosures. Dr. Gupta has been a consultant to Aimmune, Before Brands, DBV Technologies, Kaleo, Mylan, and Pfizer, and she has received research funding from Aimmune, Mylan, the National Confectioners Association, Rho, and Thermo Fisher.
SOURCE: Chadha AS et al. AAAAI 2019, Abstract 615.
SAN FRANCISCO – The estimated roughly about 750,000 people, according to a recent, representative survey of more than 78,000 Americans, which shows sesame allergy apparently is common enough to prompt the Food and Drug Administration to require food labels that identify sesame as an ingredient or possible contaminant.
The sesame-allergy data also showed that sesame reactions were rated as having been severe by about a third of respondents, they caused about two-thirds of people who responded to sesame to go to an emergency department at least once (the highest rate for this outcome among all food allergies), and reactions had led to use of an epinephrine automated injector by about a quarter of people who responded to it, Christopher M. Warren said at the annual meeting of the American Academy of Allergy, Asthma, and Immunology.
These findings document the public health importance of sesame allergy, which seems widespread and often severe enough to warrant making sesame the ninth allergen to require specific food labeling, said Ruchi S. Gupta, MD, senior author of the study and a professor of pediatrics and medicine at Northwestern University in Chicago.
“It seems to rank up with other food allergens regarding reaction severity,” Dr. Gupta said in a video interview. In October 2018, the FDA requested information on sesame allergy so that its staff could consider adding sesame to its list of major food allergens. The eight current major food allergens that require specific labeling are: peanut, tree nuts, eggs, milk, fish, shellfish, wheat, and soy. The 0.23% prevalence of sesame among U.S. residents makes it more common than certain tree nuts, and so the prevalence numbers also seem to justify adding sesame to the FDA’s labeling list because 750,000 is “a lot of people,” she noted.
An established surveying group based at the University of Chicago ran the data collection, which received responses from 53,575 U.S. household including 40,443 adults and 38,408 children. Dr. Gupta and her associates recently published information on the methods of the survey and other findings it made about U.S. food allergy rates (JAMA Network Open. 2019 Jan 4. doi: 10.1001/jamanetworkopen.2018.5630). The descriptions people provided about their food allergy diagnoses, and the effects these allergies had, underwent detailed review by a panel of experts who decide whether or not the evidence for an allergy was “convincing.” The 0.23% prevalence rate reported for sesame represented people for whom this allergy was convincingly demonstrated, reflected a confirmed physician diagnosis, or both, and hence it was a conservative estimate, Dr. Gupta said.
Mr. Warren had no disclosures. Dr. Gupta has been a consultant to Aimmune, Before Brands, DBV Technologies, Kaleo, Mylan, and Pfizer, and she has received research funding from Aimmune, Mylan, the National Confectioners Association, Rho, and Thermo Fisher.
SOURCE: Chadha AS et al. AAAAI 2019, Abstract 615.
REPORTING FROM AAAAI 2019
Key clinical point: The U.S. prevalence of allergy to sesame is roughly similar to other foods that require food labeling.
Major finding: The prevalence of sesame allergy was 0.23% of U.S. adults and children.
Study details: A detailed survey of food allergies completed for 53,575 U.S. households that included 78,851 people.
Disclosures: Mr. Warren had no disclosures. Dr. Gupta had been a consultant to Aimmune, Before Brands, DBV Technologies, Kaleo, Mylan, and Pfizer, and she had received research funding from Aimmune, Mylan, the National Confectioners Association, Rho, and Thermo Fisher.
Source: Chadha AS et al. AAAAI 2019, Abstract 615.