User login
Bringing you the latest news, research and reviews, exclusive interviews, podcasts, quizzes, and more.
Powered by CHEST Physician, Clinician Reviews, MDedge Family Medicine, Internal Medicine News, and The Journal of Clinical Outcomes Management.
Severe, uncontrolled asthma patients must avoid subcutaneous immunotherapy
SAN FRANCISCO – appears to be the “major factor” causing higher-grade systemic reactions or death from this treatment, David I. Bernstein, MD, said at the annual meeting of the American Academy of Allergy, Asthma, and Immunology.

While that was Dr. Bernstein’s top take-home message on how to optimize tolerability of subcutaneous immunotherapy (SCIT), a few other empiric rules have also emerged from his ongoing analysis of survey results from the AAAAI/American College of Allergy, Asthma, and Immunology SCIT surveillance study. The study began tracking the safety of SCIT in 2008 through annual surveys sent to members of either of these two allergy societies. By early 2019, the surveys had gathered data from more than 55 million office visits for SCIT, with responses from roughly 200-500 allergy practices annually, said Dr. Bernstein, professor of medicine at the University of Cincinnati.
The survey results identified seven SCIT-related fatalities over about a decade of surveillance. The most common risk factor among these cases was severe, uncontrolled asthma, prompting Dr. Bernstein to conclude that these patients should not receive SCIT. “If the asthma is well controlled, then SCIT is fine,” even if it had been severe before treatment, he said in an interview.
Other factors affecting SCIT safety based on the survey results included:
- Screening patients with an asthma history for current asthma symptoms and lung function before each injection. Survey results showed that while 86% of respondents screened for symptoms, only a third also checked lung function.
- Modifying the dose or stopping SCIT injections after a severe systemic reaction. Survey results showed that more than a quarter of all systemic reactions and more than a third of grade 3 systemic reactions (severe anaphylaxis) happened following a prior systemic reaction. Dr. Bernstein called this “an important, modifiable risk factor.”
- Administering SCIT only in a setting staffed to manage a possible anaphylaxis episode, and adhere to at least a 30-minute observation period. “A key step is observing for at least 30 minutes, and giving epinephrine promptly when needed; the sooner the better,” Dr. Bernstein said. Although the percentage of practices that observe patients for at least 30 minutes has steadily improved during the decade that the survey has run, in 2016 a quarter of responding practices continued to not observe patients for at least 30 minutes.
- Modifying the SCIT dose in high-risk patients during the peak season for aeroallergens like pollen. Survey results showed that practices that did not adjust their SCIT dosages during peak pollen seasons had about double the rate of grade 3 or 4 systemic reactions, compared with practices that dialed down their dosages.
- Reducing SCIT dosages during an accelerated cluster buildup, a treatment approach that in general increases the risk for systemic reactions.
Survey results also showed that sublingual immunotherapy, available in U.S. practice since 2014, has been very safe, with no reported associated deaths and only rare reports of anaphylactic episodes, Dr. Bernstein said. The most recent published report from the surveillance study appeared online a few days before Dr. Bernstein spoke (J Allergy Clin Immunol Pract. 2019 Feb 15. doi: 10.1016/j.jaip.2019.01.058).
Dr. Bernstein had no relevant disclosures.
SAN FRANCISCO – appears to be the “major factor” causing higher-grade systemic reactions or death from this treatment, David I. Bernstein, MD, said at the annual meeting of the American Academy of Allergy, Asthma, and Immunology.
While that was Dr. Bernstein’s top take-home message on how to optimize tolerability of subcutaneous immunotherapy (SCIT), a few other empiric rules have also emerged from his ongoing analysis of survey results from the AAAAI/American College of Allergy, Asthma, and Immunology SCIT surveillance study. The study began tracking the safety of SCIT in 2008 through annual surveys sent to members of either of these two allergy societies. By early 2019, the surveys had gathered data from more than 55 million office visits for SCIT, with responses from roughly 200-500 allergy practices annually, said Dr. Bernstein, professor of medicine at the University of Cincinnati.
The survey results identified seven SCIT-related fatalities over about a decade of surveillance. The most common risk factor among these cases was severe, uncontrolled asthma, prompting Dr. Bernstein to conclude that these patients should not receive SCIT. “If the asthma is well controlled, then SCIT is fine,” even if it had been severe before treatment, he said in an interview.
Other factors affecting SCIT safety based on the survey results included:
- Screening patients with an asthma history for current asthma symptoms and lung function before each injection. Survey results showed that while 86% of respondents screened for symptoms, only a third also checked lung function.
- Modifying the dose or stopping SCIT injections after a severe systemic reaction. Survey results showed that more than a quarter of all systemic reactions and more than a third of grade 3 systemic reactions (severe anaphylaxis) happened following a prior systemic reaction. Dr. Bernstein called this “an important, modifiable risk factor.”
- Administering SCIT only in a setting staffed to manage a possible anaphylaxis episode, and adhere to at least a 30-minute observation period. “A key step is observing for at least 30 minutes, and giving epinephrine promptly when needed; the sooner the better,” Dr. Bernstein said. Although the percentage of practices that observe patients for at least 30 minutes has steadily improved during the decade that the survey has run, in 2016 a quarter of responding practices continued to not observe patients for at least 30 minutes.
- Modifying the SCIT dose in high-risk patients during the peak season for aeroallergens like pollen. Survey results showed that practices that did not adjust their SCIT dosages during peak pollen seasons had about double the rate of grade 3 or 4 systemic reactions, compared with practices that dialed down their dosages.
- Reducing SCIT dosages during an accelerated cluster buildup, a treatment approach that in general increases the risk for systemic reactions.
Survey results also showed that sublingual immunotherapy, available in U.S. practice since 2014, has been very safe, with no reported associated deaths and only rare reports of anaphylactic episodes, Dr. Bernstein said. The most recent published report from the surveillance study appeared online a few days before Dr. Bernstein spoke (J Allergy Clin Immunol Pract. 2019 Feb 15. doi: 10.1016/j.jaip.2019.01.058).
Dr. Bernstein had no relevant disclosures.
REPORTING FROM AAAAI
Influenza activity continues to increase
The 2018-2019 flu season is showing no signs of decline as activity measures continued to increase into mid-February, according to the Centers for Disease Control and Prevention.
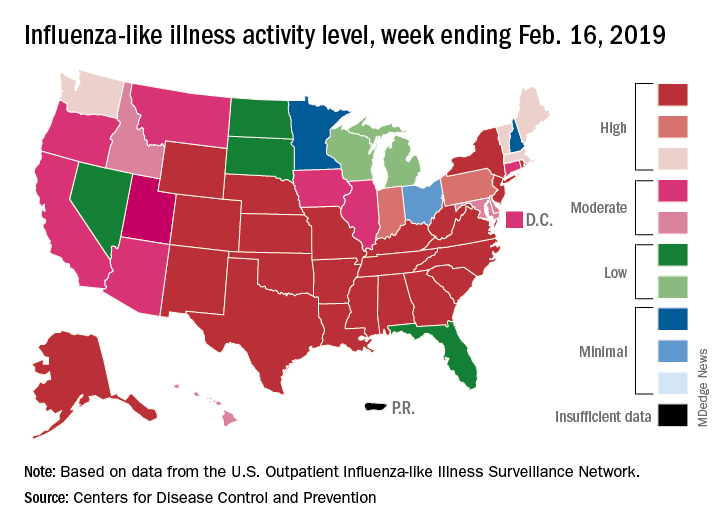
Eight of the last 10 flu seasons had already reached their peak before mid-February, but another rise brought the proportion of outpatient visits for influenza-like illness (ILI) to 5.1% for the week ending Feb. 16, compared with 4.8% the week before, the CDC’s influenza division reported Feb. 22. ILI is defined as fever (temperature of 100°F [37.8°C] or greater) and cough and/or sore throat.
The week also brought more ILI to more states, as the number reporting an activity level of 10 on the CDC’s 1-10 scale rose from 21 to 24 and the number in the high range of 8-10 increased from 26 to 30. Another seven states – including California, which was at level 5 the previous week – and the District of Columbia were at level 7 for the current reporting week, the CDC said.
Two flu-related pediatric deaths occurred during the week ending Feb. 16 and another five were reported from previous weeks, which brings the total to 41 for the 2018-2019 season. Data for influenza deaths at all ages, which are reported a week later, show that 205 occurred in the week ending Feb. 9, with reporting 75% complete. There were 236 total deaths for the week ending Feb. 2 (94% reporting) and 218 deaths during the week ending Jan. 26 (99% reporting), the CDC said.
The 2018-2019 flu season is showing no signs of decline as activity measures continued to increase into mid-February, according to the Centers for Disease Control and Prevention.
Eight of the last 10 flu seasons had already reached their peak before mid-February, but another rise brought the proportion of outpatient visits for influenza-like illness (ILI) to 5.1% for the week ending Feb. 16, compared with 4.8% the week before, the CDC’s influenza division reported Feb. 22. ILI is defined as fever (temperature of 100°F [37.8°C] or greater) and cough and/or sore throat.
The week also brought more ILI to more states, as the number reporting an activity level of 10 on the CDC’s 1-10 scale rose from 21 to 24 and the number in the high range of 8-10 increased from 26 to 30. Another seven states – including California, which was at level 5 the previous week – and the District of Columbia were at level 7 for the current reporting week, the CDC said.
Two flu-related pediatric deaths occurred during the week ending Feb. 16 and another five were reported from previous weeks, which brings the total to 41 for the 2018-2019 season. Data for influenza deaths at all ages, which are reported a week later, show that 205 occurred in the week ending Feb. 9, with reporting 75% complete. There were 236 total deaths for the week ending Feb. 2 (94% reporting) and 218 deaths during the week ending Jan. 26 (99% reporting), the CDC said.
Bag-mask ventilation during intubation reduces severe hypoxemia
, according to data presented at the Critical Care Congress, sponsored by the Society of Critical Care Medicine.
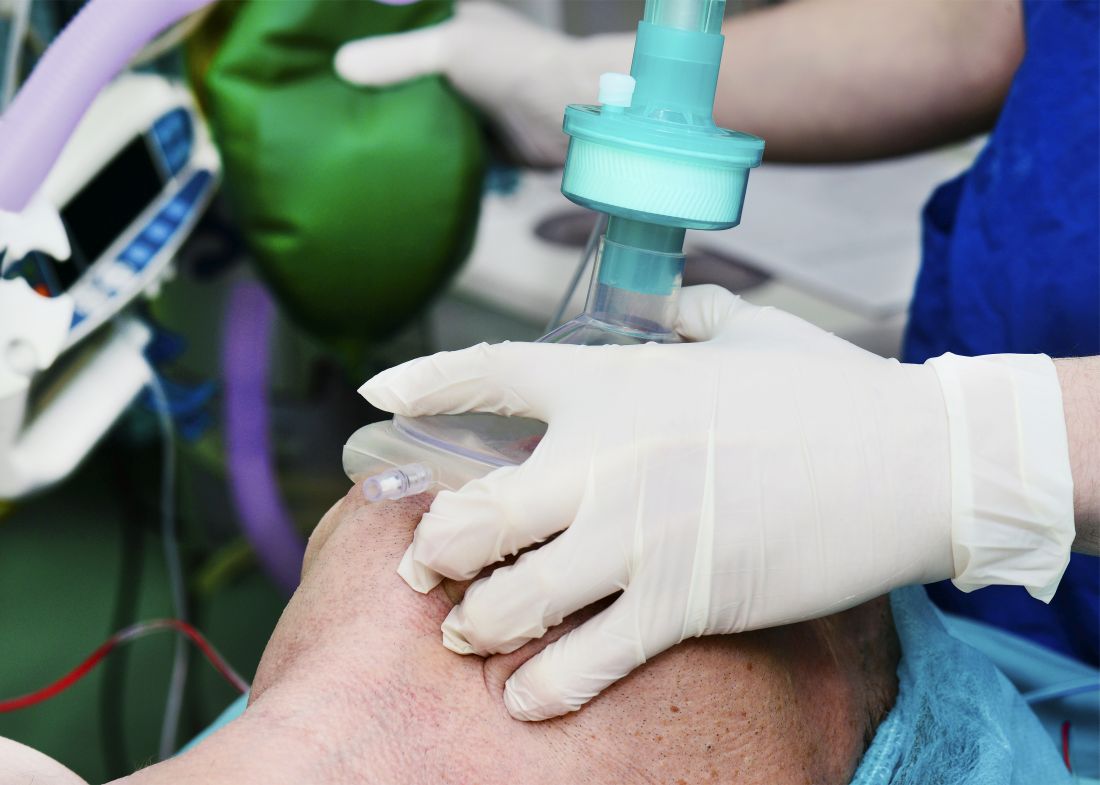
A multicenter study, published simultaneously in the Feb. 18 issue of the New England Journal of Medicine, randomized 401 critically-ill patients in the ICU who were undergoing tracheal intubation to receive either ventilation with a bag-mask device during induction for intubation or no ventilation.
The median lowest oxygen saturation between induction and 2 minutes after intubation was 96% in the bag-mask ventilated patients and 93% in the no-ventilation group, representing a 4.7% difference after adjusting for prespecified covariates (P = .01).
In a post-hoc analysis that adjusted for other factors such as the provision of preoxygenation, the preoxygenation device, pneumonia, and gastrointestinal bleeding, there was a 5.2% difference between the two groups in median lowest oxygen saturation, favoring the bag-mask group.
Bag-mask ventilation was also associated with almost a halving in the incidence of severe hypoxemia – defined as an oxygen saturation below 80% – compared with no-ventilation (10.9% vs. 22.8%; relative risk = 0.48). There was also a lower incidence of patients with an oxygen saturation below 90% and below 70% in the bag-mask ventilation group, compared with the no-ventilation group.
Overall, the median decrease in oxygen saturation from induction to the lowest point was 1% in the bag-mask group, and 5% in the no-ventilation group.
The study saw no effects of factors such as body-mass index, operator experience, or Acute Physiology and Chronic Health Evaluation (APACHE II) score. The patients had a median age of 60 years, about half had sepsis or septic shock, and close to 60% had hypoxemic respiratory failure as an indication for tracheal intubation.
Jonathan D. Casey, MD, of Vanderbilt University, Nashville, Tenn., and his coauthors wrote that their results suggested for every nine critically ill patients undergoing tracheal intubation, bag-mask ventilation would prevent severe hypoxemia in one patient.
“These findings are important because oxygen saturation is an established endpoint in airway management trials and is a contributing factor to periprocedural cardiac arrest and death,” they wrote.
They noted that there are conflicting guidelines on the use of bag-mask ventilation during tracheal intubation, with some recommending its use for all patients – even those who are not hypoxemic – and others advising their use only for patients with hypoxemia. This study excluded patients who were identified as hypoxemic or in whom bag-mask ventilation was contraindicated.
Despite concerns about bag-mask ventilation increasing the risk the aspiration, the study showed no significant difference between the two groups in the incidence of operator-reported aspiration or the presence of a new opacity on chest radiograph in the 48 hours after intubation.
The authors acknowledged that, given the low incidence of operator-reported aspiration during tracheal intubation, a much larger study would be needed to show whether bag-mask ventilation did increase the risk of aspiration.
“However, our trial provides some reassurance, since the incidence of operator-reported aspiration was numerically lower in the bag-mask ventilation group than in the no-ventilation group,” they wrote.
There were also no significant differences between the two groups in oxygen saturation, fraction of inspired oxygen or positive end-expiratory pressure in the 24 hours after intubation. Bag-mask ventilation was also associated with similar rates of in-hospital mortality, number of ventilator-free days, and days out of the ICU as no-ventilation.
The authors noted that their trial focused on critically-ill patients in the ICU, so the results may not be generalizable to patients in the emergency department or in a prehospital setting.
The study and some authors were supported by the National Institutes of Health. Two authors declared personal fees from the pharmaceutical industry unrelated to the study, and no other conflicts of interest were declared.
SOURCE: Casey J et al. N Engl J Med. 2019 Feb 18. doi: 10.1056/NEJMoa1812405
Debate around the question of whether to use bag-mask ventilation in critically-ill patients has been limited by the lack of high-quality evidence on the risk of aspiration or on the benefits of this approach. This study found no evidence of an increase in the incidence of aspiration, despite using multiple measures to detect it, which provide some reassurance that manual ventilation during tracheal intubation is not likely to cause significant harm.
One significant limitation of this trial, however, is that it did not standardize the preoxygenation strategy across the two groups, so significantly more patients in the bag-mask group received bag-mask ventilation before induction. Median oxygen saturation before induction was the same in the two groups, but this does not rule out the possibility of differences in the arterial pressure of oxygen.
This study may not settle the question of whether to use bag-mask ventilation during tracheal intubation, but it provides strong suggestion that the practice is not harmful.
Patricia A. Kritek, MD, and Andrew M. Luks, MD, are with the division of pulmonary, critical care, and sleep medicine at the University of Washington in Seattle. These comments are adapted from their editorial accompanying the paper by Casey et al. (N Engl J Med. 2019 Feb 18. doi: 10.1056/NEJMe1900708). Dr. Luks declared personal fees from private industry outside the submitted work. Dr. Kritek reported having nothing to disclose.
, according to data presented at the Critical Care Congress, sponsored by the Society of Critical Care Medicine.
A multicenter study, published simultaneously in the Feb. 18 issue of the New England Journal of Medicine, randomized 401 critically-ill patients in the ICU who were undergoing tracheal intubation to receive either ventilation with a bag-mask device during induction for intubation or no ventilation.
The median lowest oxygen saturation between induction and 2 minutes after intubation was 96% in the bag-mask ventilated patients and 93% in the no-ventilation group, representing a 4.7% difference after adjusting for prespecified covariates (P = .01).
In a post-hoc analysis that adjusted for other factors such as the provision of preoxygenation, the preoxygenation device, pneumonia, and gastrointestinal bleeding, there was a 5.2% difference between the two groups in median lowest oxygen saturation, favoring the bag-mask group.
Bag-mask ventilation was also associated with almost a halving in the incidence of severe hypoxemia – defined as an oxygen saturation below 80% – compared with no-ventilation (10.9% vs. 22.8%; relative risk = 0.48). There was also a lower incidence of patients with an oxygen saturation below 90% and below 70% in the bag-mask ventilation group, compared with the no-ventilation group.
Overall, the median decrease in oxygen saturation from induction to the lowest point was 1% in the bag-mask group, and 5% in the no-ventilation group.
The study saw no effects of factors such as body-mass index, operator experience, or Acute Physiology and Chronic Health Evaluation (APACHE II) score. The patients had a median age of 60 years, about half had sepsis or septic shock, and close to 60% had hypoxemic respiratory failure as an indication for tracheal intubation.
Jonathan D. Casey, MD, of Vanderbilt University, Nashville, Tenn., and his coauthors wrote that their results suggested for every nine critically ill patients undergoing tracheal intubation, bag-mask ventilation would prevent severe hypoxemia in one patient.
“These findings are important because oxygen saturation is an established endpoint in airway management trials and is a contributing factor to periprocedural cardiac arrest and death,” they wrote.
They noted that there are conflicting guidelines on the use of bag-mask ventilation during tracheal intubation, with some recommending its use for all patients – even those who are not hypoxemic – and others advising their use only for patients with hypoxemia. This study excluded patients who were identified as hypoxemic or in whom bag-mask ventilation was contraindicated.
Despite concerns about bag-mask ventilation increasing the risk the aspiration, the study showed no significant difference between the two groups in the incidence of operator-reported aspiration or the presence of a new opacity on chest radiograph in the 48 hours after intubation.
The authors acknowledged that, given the low incidence of operator-reported aspiration during tracheal intubation, a much larger study would be needed to show whether bag-mask ventilation did increase the risk of aspiration.
“However, our trial provides some reassurance, since the incidence of operator-reported aspiration was numerically lower in the bag-mask ventilation group than in the no-ventilation group,” they wrote.
There were also no significant differences between the two groups in oxygen saturation, fraction of inspired oxygen or positive end-expiratory pressure in the 24 hours after intubation. Bag-mask ventilation was also associated with similar rates of in-hospital mortality, number of ventilator-free days, and days out of the ICU as no-ventilation.
The authors noted that their trial focused on critically-ill patients in the ICU, so the results may not be generalizable to patients in the emergency department or in a prehospital setting.
The study and some authors were supported by the National Institutes of Health. Two authors declared personal fees from the pharmaceutical industry unrelated to the study, and no other conflicts of interest were declared.
SOURCE: Casey J et al. N Engl J Med. 2019 Feb 18. doi: 10.1056/NEJMoa1812405
FROM CCC48
Key clinical point: Bag-mask ventilation during tracheal intubation reduces the risk of severe hypoxemia.
Major finding: For every nine patients who receive bag-mask ventilation during tracheal intubation, one case of severe hypoxemia is avoided.
Study details: Randomized, controlled trial in 401 critically-ill patients undergoing tracheal intubation.
Disclosures: The study and some authors were supported by the National Institutes of Health. Two authors declared personal fees from the pharmaceutical industry unrelated to the study.
Source: Casey J et al. N Engl J Med. 2019 Feb 18. doi: 10.1056/NEJMoa1812405
Flu season showing its staying power
Like an unwelcome guest, the 2018-2019 flu season seems to be settling in for a lengthy stay as three more states have reached the highest level of influenza-like illness (ILI) activity, according to the Centers for Disease Control and Prevention.
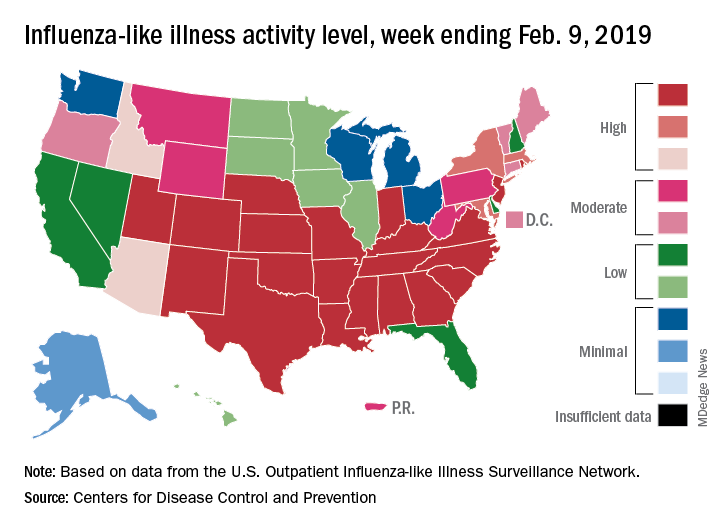
There are now 21 states at level 10 on the CDC’s 1-10 scale, with the South showing up almost solidly red on the flu activity map for the week ending Feb. 9. Another five states are at levels 8 and 9, bringing the total in the high range to 26 for the week, compared with 24 the previous week, the CDC’s influenza division reported Feb. 15.
National activity, reflected in the proportion of outpatient visits involving ILI, took a step up from 4.3% the week before to 4.8% for the week ending Feb. 9. The national baseline rate is 2.2% for ILI, which the CDC defines “as fever (temperature of 100°F [37.8°C] or greater) and cough and/or sore throat.”
Two flu-related pediatric deaths occurred during the week ending Feb. 9, and another four were reported from earlier weeks, which brings the total for the 2018-2019 season to 34, the CDC said. At the same point in last year’s flu season, there had been 84 flu-related deaths in children.
In a separate report, the CDC said that, based on data collected from Nov. 23, 2018 to Feb. 2, 2019, “the influenza vaccine has been 47% effective in preventing medically attended acute respiratory virus infection across all age groups and specifically was 46% effective in preventing medical visits associated with influenza A(H1N1)pdm09.” The effectiveness of the vaccine was 61% for children aged 6 months to 17 years, the CDC said (MMWR. 2019 Feb 15;68[6];135-9).
Flu vaccination during the 2017-2018 season prevented 7.1 million illnesses, 3.7 million medical visits, 109,000 hospitalizations, and 8,000 flu-related deaths, the CDC said, adding that “vaccination has been found to reduce deaths, intensive care unit admissions and length of stay, and overall duration of hospitalization among hospitalized influenza patients.”
Forecasts for the rest of the 2018-2019 season “predict that elevated influenza activity in parts of the United States will continue for several more weeks,” the CDC said.
Like an unwelcome guest, the 2018-2019 flu season seems to be settling in for a lengthy stay as three more states have reached the highest level of influenza-like illness (ILI) activity, according to the Centers for Disease Control and Prevention.
There are now 21 states at level 10 on the CDC’s 1-10 scale, with the South showing up almost solidly red on the flu activity map for the week ending Feb. 9. Another five states are at levels 8 and 9, bringing the total in the high range to 26 for the week, compared with 24 the previous week, the CDC’s influenza division reported Feb. 15.
National activity, reflected in the proportion of outpatient visits involving ILI, took a step up from 4.3% the week before to 4.8% for the week ending Feb. 9. The national baseline rate is 2.2% for ILI, which the CDC defines “as fever (temperature of 100°F [37.8°C] or greater) and cough and/or sore throat.”
Two flu-related pediatric deaths occurred during the week ending Feb. 9, and another four were reported from earlier weeks, which brings the total for the 2018-2019 season to 34, the CDC said. At the same point in last year’s flu season, there had been 84 flu-related deaths in children.
In a separate report, the CDC said that, based on data collected from Nov. 23, 2018 to Feb. 2, 2019, “the influenza vaccine has been 47% effective in preventing medically attended acute respiratory virus infection across all age groups and specifically was 46% effective in preventing medical visits associated with influenza A(H1N1)pdm09.” The effectiveness of the vaccine was 61% for children aged 6 months to 17 years, the CDC said (MMWR. 2019 Feb 15;68[6];135-9).
Flu vaccination during the 2017-2018 season prevented 7.1 million illnesses, 3.7 million medical visits, 109,000 hospitalizations, and 8,000 flu-related deaths, the CDC said, adding that “vaccination has been found to reduce deaths, intensive care unit admissions and length of stay, and overall duration of hospitalization among hospitalized influenza patients.”
Forecasts for the rest of the 2018-2019 season “predict that elevated influenza activity in parts of the United States will continue for several more weeks,” the CDC said.
Venous thromboembolism risk elevated in ankylosing spondylitis patients
Newly diagnosed ankylosing spondylitis (AS) patients are at increased risk for venous thromboembolism (VTE), especially during the first year after diagnosis, according to a population-based study of 7,190 cases.

In a study published in Annals of the Rheumatic Diseases, the researchers identified 7,190 incident cases of AS among adults using a health care database of residents of British Columbia and matched them for age, sex, and entry time into the cohort with 71,900 healthy individuals from the general population over a mean follow-up time of 6.2 years.
The incidence rate of VTE overall per 1,000 person-years was 1.56 among AS patients, compared with 0.77 in a control cohort from the general population. The incidence rates for DVT were 1.06 in AS patients and 0.50 in controls; incidence rates for PE were 0.79 in AS patients and 0.40 in controls.
The adjusted hazard ratios for VTE overall and DVT were similar and statistically significant in AS patients at 1.53 and 1.62, respectively, versus controls. But the adjusted hazard ratio of 1.36 for PE did not reach statistical significance. The adjusted risks of VTE overall, PE, and DVT were highest in the first year of diagnosis, reaching twofold greater risk for all, but none of the risks were statistically significant.
More research is needed to better identify subsets of AS patients at increased risk for VTE, and to assess whether treatment of inflammation can mitigate this risk, but in the meantime clinicians should be alert to the possibility of life-threatening complications from DVT and PE in their AS patients, especially soon after diagnosis, the researchers said.
The findings are supported by the study’s large sample size but are also limited by several factors, including the observational nature of the study and an inability to account for use of NSAIDs, the researchers noted.
“These results call for awareness of this complication, increased vigilance, and preventive intervention by controlling the inflammatory process or by anticoagulation in a high-risk AS population,” they concluded.
The study was supported in part by grants from the Canadian Arthritis Network, the Arthritis Society of Canada, the British Columbia Lupus Society, and the Canadian Institutes for Health Research. The researchers had no financial conflicts to disclose.
SOURCE: Aviña-Zubieta JA et al. Ann Rheum Dis. 2019 Feb 8. doi: 10.1136/annrheumdis-2018-214388.
Newly diagnosed ankylosing spondylitis (AS) patients are at increased risk for venous thromboembolism (VTE), especially during the first year after diagnosis, according to a population-based study of 7,190 cases.
In a study published in Annals of the Rheumatic Diseases, the researchers identified 7,190 incident cases of AS among adults using a health care database of residents of British Columbia and matched them for age, sex, and entry time into the cohort with 71,900 healthy individuals from the general population over a mean follow-up time of 6.2 years.
The incidence rate of VTE overall per 1,000 person-years was 1.56 among AS patients, compared with 0.77 in a control cohort from the general population. The incidence rates for DVT were 1.06 in AS patients and 0.50 in controls; incidence rates for PE were 0.79 in AS patients and 0.40 in controls.
The adjusted hazard ratios for VTE overall and DVT were similar and statistically significant in AS patients at 1.53 and 1.62, respectively, versus controls. But the adjusted hazard ratio of 1.36 for PE did not reach statistical significance. The adjusted risks of VTE overall, PE, and DVT were highest in the first year of diagnosis, reaching twofold greater risk for all, but none of the risks were statistically significant.
More research is needed to better identify subsets of AS patients at increased risk for VTE, and to assess whether treatment of inflammation can mitigate this risk, but in the meantime clinicians should be alert to the possibility of life-threatening complications from DVT and PE in their AS patients, especially soon after diagnosis, the researchers said.
The findings are supported by the study’s large sample size but are also limited by several factors, including the observational nature of the study and an inability to account for use of NSAIDs, the researchers noted.
“These results call for awareness of this complication, increased vigilance, and preventive intervention by controlling the inflammatory process or by anticoagulation in a high-risk AS population,” they concluded.
The study was supported in part by grants from the Canadian Arthritis Network, the Arthritis Society of Canada, the British Columbia Lupus Society, and the Canadian Institutes for Health Research. The researchers had no financial conflicts to disclose.
SOURCE: Aviña-Zubieta JA et al. Ann Rheum Dis. 2019 Feb 8. doi: 10.1136/annrheumdis-2018-214388.
FROM ANNALS OF THE RHEUMATIC DISEASES
Key clinical point: Newly diagnosed AS patients demonstrated increased risk of venous thromboembolism, including deep vein thrombosis and pulmonary embolism, compared with controls.
Major finding: The relative risk for deep vein thrombosis was 63% higher for AS patients versus controls, but a 39% higher risk of pulmonary embolism did not reach statistical significance.
Study details: A population-based study including 7,190 incident AS cases and 71,900 matched controls from a health care database of residents of British Columbia.
Disclosures: The study was supported in part by grants from the Canadian Arthritis Network, the Arthritis Society of Canada, the British Columbia Lupus Society, and the Canadian Institutes for Health Research. The researchers had no financial conflicts to disclose.
Source: Aviña-Zubieta JA et al. Ann Rheum Dis. 2019 Feb 8. doi: 10.1136/annrheumdis-2018-214388.
Adult HIV patients should receive standard vaccinations, with caveats
Patients infected with HIV have an increased risk of mortality and morbidity from diseases that are preventable with vaccines. Undervaccination of these patients poses a major concern, according to a literature review of the vaccine response in the adult patient with HIV published in The American Journal of Medicine.

Despite the fact that data are limited, patients infected with HIV are advised to receive their age-specific and risk group−based vaccines, according to Firas El Chaer, MD, of the University of Maryland, Baltimore, and his colleague.
HIV patients are of particular concern regarding vaccination, because, despite the use of retroviral therapy, CD4+ T-lymphocytes in individuals infected with HIV remain lower than in those without HIV. In addition, HIV causes an inappropriate response to B-cell stimulation, which results in suboptimal primary and secondary response to vaccination, according to Dr. El Chaer and his colleague. Despite this and initial concerns about vaccine safety in this population, it is now recommended that adult patients infected with HIV receive their age-specific and risk group−based vaccines, they stated.
Inactivated or subunit vaccines
Haemophilus influenzae type b vaccine is not recommended under current guidelines for individuals older than age 18 with HIV infection, unless they have a clinical indication.
Vaccination against hepatitis A virus is recommended for HIV-infected patients who are hepatitis A virus seronegative and have chronic liver disease, men who have sex with men, intravenous drug users, and travelers to endemic regions. However, research has shown that the immunogenicity of the vaccine is lower in patients with HIV than in uninfected individuals. It was found that the CD4 count at the time of vaccination, not the CD4 low point, was the major predictor of the immune response.
Patients coinfected with HIV and hepatitis B virus have an 8-fold and 19-fold increase in mortality, respectively, compared with either virus monoinfection. Although vaccination is recommended, the optimal hepatitis B virus vaccination schedule in patients with HIV remains controversial, according to the authors. They indicated that new strategies to improve hepatitis B virus vaccine immunogenicity for those infected with HIV are needed.
Individuals infected with HIV have been found to have a higher risk of human papillomavirus (HPV) infection. The safety and immunogenicity results and prospect of benefits has led to a consensus on the benefit of vaccinating HIV-infected patients who meet the HPV vaccine age criteria, the authors indicated.
With regard to standard flu vaccinations: “An annual inactivated influenza vaccine is recommended during the influenza season for all adult individuals with HIV; however, a live attenuated influenza vaccine is contraindicated in this population,” according to the review.
Patients with HIV have a more than 10-fold increased risk of invasive meningococcal disease, compared with the general population, with the risk being particularly higher in those individuals with CD4 counts less than 200 cells/mm3 and in men who have sex with men in cities with meningococcal outbreaks. For these reasons, the “quadrivalent meningococcal vaccine is recommended for all patients with HIV regardless of their CD4 count, with 2-dose primary series at least 2 months apart and with a booster every 5 years.”
Pneumonia is known to be especially dangerous in the HIV-infected population. With regard to pneumonia vaccination, the 13-valent pneumococcal conjugate vaccine is recommended for all patients with HIV, regardless of their CD4 cell counts. According to Dr. El Chaer and his colleague, it should be followed by the 23-valent pneumococcal polysaccharide vaccine at least 8 weeks later as a prime-boost regimen, preferably when CD4 counts are greater than 200 cells/mm3 and in patients receiving ART.
“Tetanus toxoid, diphtheria toxoid, and acellular pertussis vaccines are recommended once for all individuals infected with HIV, regardless of the CD4 count, with a tetanus toxoid and diphtheria toxoid booster every 10 years,” according to the review.
Live vaccines
Live vaccines are a concerning issue for HIV-infected adults and recommendations for use are generally tied to the CD4 T-cell count. The measles, mumps, and rubella vaccine seems to be safe in patients infected with HIV with a CD4 count greater than 200 cells/mm3, according to Dr. El Chaer and his colleague. Similarly, patients with HIV with CD4 counts greater than 200 cells/mm3 and no evidence of documented immunity to varicella should receive the varicella vaccine.
In contrast, the live, attenuated varicella zoster virus vaccine is not recommended for patients infected with HIV, and it is contraindicated if CD4 count is less than 200 cells/mm3. Recently, a herpes zoster subunit vaccine (HZ/su) was tested in a phase 1/2a randomized, placebo-controlled study and was found to be safe and immunogenic regardless of CD4 count, although it has not yet been given a specific recommendation for immunocompromised patients.
“With the widespread use of ART resulting in better HIV control, ,” the authors concluded.
The study was not sponsored. Dr. El Chaer and his colleague reported that they had no conflicts.
SOURCE: El Chaer F et al. Am J Med. 2019. doi: 10.1016/j.amjmed.2018.12.011.
Patients infected with HIV have an increased risk of mortality and morbidity from diseases that are preventable with vaccines. Undervaccination of these patients poses a major concern, according to a literature review of the vaccine response in the adult patient with HIV published in The American Journal of Medicine.
Despite the fact that data are limited, patients infected with HIV are advised to receive their age-specific and risk group−based vaccines, according to Firas El Chaer, MD, of the University of Maryland, Baltimore, and his colleague.
HIV patients are of particular concern regarding vaccination, because, despite the use of retroviral therapy, CD4+ T-lymphocytes in individuals infected with HIV remain lower than in those without HIV. In addition, HIV causes an inappropriate response to B-cell stimulation, which results in suboptimal primary and secondary response to vaccination, according to Dr. El Chaer and his colleague. Despite this and initial concerns about vaccine safety in this population, it is now recommended that adult patients infected with HIV receive their age-specific and risk group−based vaccines, they stated.
Inactivated or subunit vaccines
Haemophilus influenzae type b vaccine is not recommended under current guidelines for individuals older than age 18 with HIV infection, unless they have a clinical indication.
Vaccination against hepatitis A virus is recommended for HIV-infected patients who are hepatitis A virus seronegative and have chronic liver disease, men who have sex with men, intravenous drug users, and travelers to endemic regions. However, research has shown that the immunogenicity of the vaccine is lower in patients with HIV than in uninfected individuals. It was found that the CD4 count at the time of vaccination, not the CD4 low point, was the major predictor of the immune response.
Patients coinfected with HIV and hepatitis B virus have an 8-fold and 19-fold increase in mortality, respectively, compared with either virus monoinfection. Although vaccination is recommended, the optimal hepatitis B virus vaccination schedule in patients with HIV remains controversial, according to the authors. They indicated that new strategies to improve hepatitis B virus vaccine immunogenicity for those infected with HIV are needed.
Individuals infected with HIV have been found to have a higher risk of human papillomavirus (HPV) infection. The safety and immunogenicity results and prospect of benefits has led to a consensus on the benefit of vaccinating HIV-infected patients who meet the HPV vaccine age criteria, the authors indicated.
With regard to standard flu vaccinations: “An annual inactivated influenza vaccine is recommended during the influenza season for all adult individuals with HIV; however, a live attenuated influenza vaccine is contraindicated in this population,” according to the review.
Patients with HIV have a more than 10-fold increased risk of invasive meningococcal disease, compared with the general population, with the risk being particularly higher in those individuals with CD4 counts less than 200 cells/mm3 and in men who have sex with men in cities with meningococcal outbreaks. For these reasons, the “quadrivalent meningococcal vaccine is recommended for all patients with HIV regardless of their CD4 count, with 2-dose primary series at least 2 months apart and with a booster every 5 years.”
Pneumonia is known to be especially dangerous in the HIV-infected population. With regard to pneumonia vaccination, the 13-valent pneumococcal conjugate vaccine is recommended for all patients with HIV, regardless of their CD4 cell counts. According to Dr. El Chaer and his colleague, it should be followed by the 23-valent pneumococcal polysaccharide vaccine at least 8 weeks later as a prime-boost regimen, preferably when CD4 counts are greater than 200 cells/mm3 and in patients receiving ART.
“Tetanus toxoid, diphtheria toxoid, and acellular pertussis vaccines are recommended once for all individuals infected with HIV, regardless of the CD4 count, with a tetanus toxoid and diphtheria toxoid booster every 10 years,” according to the review.
Live vaccines
Live vaccines are a concerning issue for HIV-infected adults and recommendations for use are generally tied to the CD4 T-cell count. The measles, mumps, and rubella vaccine seems to be safe in patients infected with HIV with a CD4 count greater than 200 cells/mm3, according to Dr. El Chaer and his colleague. Similarly, patients with HIV with CD4 counts greater than 200 cells/mm3 and no evidence of documented immunity to varicella should receive the varicella vaccine.
In contrast, the live, attenuated varicella zoster virus vaccine is not recommended for patients infected with HIV, and it is contraindicated if CD4 count is less than 200 cells/mm3. Recently, a herpes zoster subunit vaccine (HZ/su) was tested in a phase 1/2a randomized, placebo-controlled study and was found to be safe and immunogenic regardless of CD4 count, although it has not yet been given a specific recommendation for immunocompromised patients.
“With the widespread use of ART resulting in better HIV control, ,” the authors concluded.
The study was not sponsored. Dr. El Chaer and his colleague reported that they had no conflicts.
SOURCE: El Chaer F et al. Am J Med. 2019. doi: 10.1016/j.amjmed.2018.12.011.
FROM THE AMERICAN JOURNAL OF MEDICINE
Key clinical point: Undervaccination is too common among HIV-infected patients.
Major finding: Data on vaccine effectiveness in HIV patients are limited, but do not contraindicate the need for vaccination.
Study details: Literature review of immunogenicity and vaccine efficacy in HIV-infected adults.
Disclosures: The study was unsponsored and the authors reported they had no conflicts.
Source: El Chaer F et al. Am J Med. 2019. doi: 10.1016/j.amjmed.2018.12.011.
E-cig use reverses progress in reducing tobacco use in teens
A significant increase during 2017-2018 in e-cigarette use among U.S. youths has erased recent progress in reducing overall tobacco product use in this age group, a study from the Centers for Disease Control and Prevention has found.
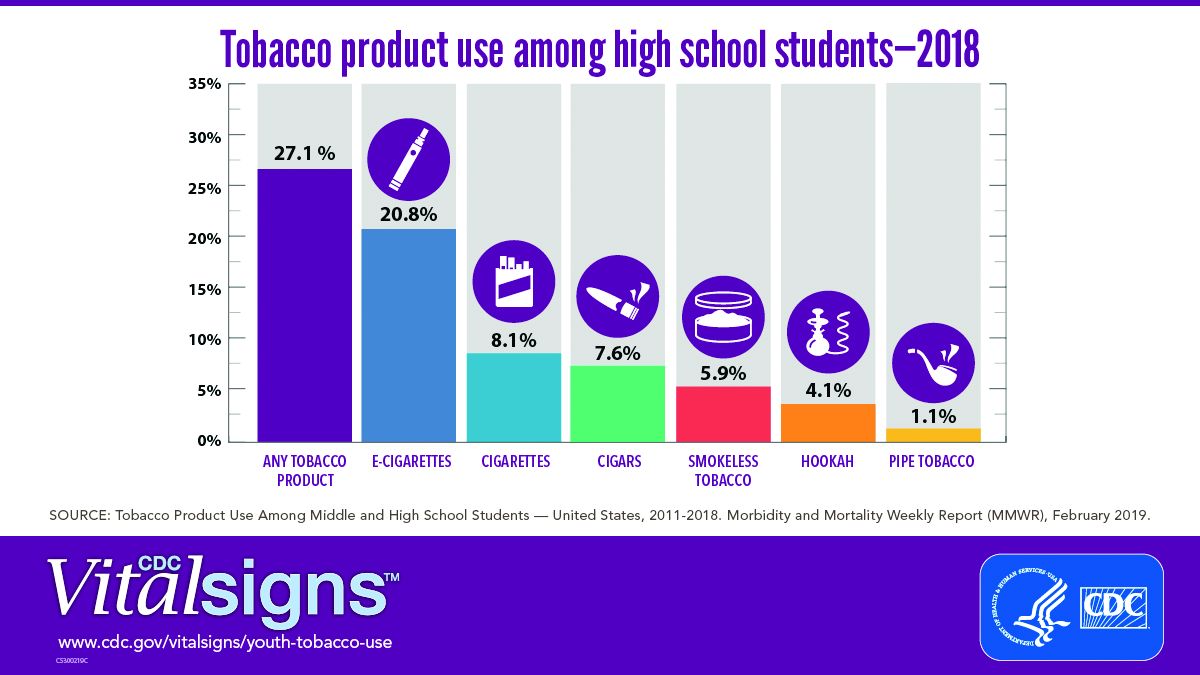
E-cigarettes are driving the trend. About 4 million high school students in the United States reported using any tobacco product in the last 30 days, and 3 million of them reported using e-cigarettes, according to a Vital Signs document published by the CDC on Feb. 11 in its Morbidity and Mortality Weekly Report.*
In addition, many high school students who use e-cigarettes use them often; 28% reported using the products at least 20 times in the past 28 days, up from 20% in 2017.
“Any use of any tobacco product is unsafe for teens,” Anne Schuchat, MD, principal deputy director of the CDC, said in a teleconference to present the findings. Nicotine is highly addictive and can harm brain development in youth, including capacity for learning, memory, and attention, she said.
The rise in e-cigarette use corresponds with the rise in marketing and availability of e-cigarette devices such as JUUL, which dispense nicotine via liquid refill pods available in flavors including strawberry and cotton candy, said Brian King, MPH, PhD, deputy director for research translation at the CDC’s Office on Smoking and Health.
“The advertising will lead a horse to water, the flavors will make them drink, and the nicotine will keep them coming back for more,” said Dr. King.
Approximately 27.1% of high school students and 7.2% of middle school students used a tobacco product in 2018, a significant increase from 2017 data, and with a major increase in e-cigarette use.
No change was noted in the use of other tobacco products, including cigarettes, from 2017 to 2018, according to the report. However, conventional cigarettes remained the most common companion product to e-cigarettes for youth who use two or more tobacco products (two in five high school students and one in three middle school students in 2018). From a demographic standpoint, e-cigarette use was highest among males, whites, and high school students.
Tobacco use in teens is trending in the direction of wiping out the progress made in recent years to reduce exposure to youths. The report noted, “The prevalence of e-cigarette use by U.S. high school students had peaked in 2015 before declining by 29% during 2015-2016 (from 16% to 11.3%); this decline was the first ever recorded for e-cigarette use among youths in the NYTS since monitoring began, and it was subsequently sustained during 2016-2017). However, current e-cigarette use increased by 77.8% among high school students and 48.5% among middle school students during 2017-2018, erasing the progress in reducing e-cigarette use, as well as any tobacco product use, that had occurred in prior years.”
The CDC and the Food and Drug Administration are taking action to curb the rise in e-cigarette use in youth in particular by seeking regulations to make the products less accessible, raising prices, and banning most flavorings, said Dr. Schuchat.
“We have targeted companies engaged in kid friendly marketing,” said Mitch Zeller, JD, director of the Center for Tobacco Products for the FDA.
In a statement published simultaneously with the Vital Signs study, FDA Commissioner Scott Gottlieb, MD, emphasized the link between e-cigarette use in teens and the potential for future tobacco use. “The kids using e-cigarettes are children who rejected conventional cigarettes, but don’t see the same stigma associated with the use of e-cigarettes. But now, having become exposed to nicotine through e-cigs, they will be more likely to smoke.” Dr. Gottlieb declared, “I will not allow a generation of children to become addicted to nicotine through e-cigarettes. We must stop the trends of youth e-cigarette use from continuing to build and will take whatever action is necessary to ensure these kids don’t become future smokers.” He reviewed steps taken in the past year by the FDA to counter tobacco use in teens but he warned of future actions that may need to be taken: “If these youth use trends continue, we’ll be forced to consider regulatory steps that could constrain or even foreclose the opportunities for currently addicted adult smokers to have the same level of access to these products that they now enjoy. I recognize that such a move could come with significant impacts to adult smokers.”
In the meantime, however, parents, teachers, community leaders, and health care providers are on the front lines and can make a difference in protecting youth and curbing nicotine use, Dr. King said.
One of the most important things clinicians can do is to ask young patients specifically about e-cigarette use, he emphasized. Learn and use the terminology the kids are using; ask, “Do you use JUUL?” If they are using these products, “make sure they know they are dangerous,” and can harm the developing brain, he said.
Although there are no currently approved medications to treat nicotine addiction in youth, research suggests that behavioral counseling, as well as reinforcement of the danger of nicotine from parents and other people of influence, can help, Dr. King said.
The Vital Signs report is based on data from the 2011-2018 National Youth Tobacco Survey, which assesses current use of cigarettes, cigars, smokeless tobacco, e-cigarettes, hookahs, pipe tobacco, and bidis among a nationally representative sample of middle and high school students in the United States. The findings were analyzed by the CDC, FDA, and the National Cancer Institute.
SOURCE: Gentzke AS et al. MMWR 2019 Feb 11. doi: 10.15585/mmwr.mm6806e1.
*Correction 2/13/2019 An earlier version of this article misstated the number of students using e-cigarettes as a proportion of all teen tobacco users.
A significant increase during 2017-2018 in e-cigarette use among U.S. youths has erased recent progress in reducing overall tobacco product use in this age group, a study from the Centers for Disease Control and Prevention has found.
E-cigarettes are driving the trend. About 4 million high school students in the United States reported using any tobacco product in the last 30 days, and 3 million of them reported using e-cigarettes, according to a Vital Signs document published by the CDC on Feb. 11 in its Morbidity and Mortality Weekly Report.*
In addition, many high school students who use e-cigarettes use them often; 28% reported using the products at least 20 times in the past 28 days, up from 20% in 2017.
“Any use of any tobacco product is unsafe for teens,” Anne Schuchat, MD, principal deputy director of the CDC, said in a teleconference to present the findings. Nicotine is highly addictive and can harm brain development in youth, including capacity for learning, memory, and attention, she said.
The rise in e-cigarette use corresponds with the rise in marketing and availability of e-cigarette devices such as JUUL, which dispense nicotine via liquid refill pods available in flavors including strawberry and cotton candy, said Brian King, MPH, PhD, deputy director for research translation at the CDC’s Office on Smoking and Health.
“The advertising will lead a horse to water, the flavors will make them drink, and the nicotine will keep them coming back for more,” said Dr. King.
Approximately 27.1% of high school students and 7.2% of middle school students used a tobacco product in 2018, a significant increase from 2017 data, and with a major increase in e-cigarette use.
No change was noted in the use of other tobacco products, including cigarettes, from 2017 to 2018, according to the report. However, conventional cigarettes remained the most common companion product to e-cigarettes for youth who use two or more tobacco products (two in five high school students and one in three middle school students in 2018). From a demographic standpoint, e-cigarette use was highest among males, whites, and high school students.
Tobacco use in teens is trending in the direction of wiping out the progress made in recent years to reduce exposure to youths. The report noted, “The prevalence of e-cigarette use by U.S. high school students had peaked in 2015 before declining by 29% during 2015-2016 (from 16% to 11.3%); this decline was the first ever recorded for e-cigarette use among youths in the NYTS since monitoring began, and it was subsequently sustained during 2016-2017). However, current e-cigarette use increased by 77.8% among high school students and 48.5% among middle school students during 2017-2018, erasing the progress in reducing e-cigarette use, as well as any tobacco product use, that had occurred in prior years.”
The CDC and the Food and Drug Administration are taking action to curb the rise in e-cigarette use in youth in particular by seeking regulations to make the products less accessible, raising prices, and banning most flavorings, said Dr. Schuchat.
“We have targeted companies engaged in kid friendly marketing,” said Mitch Zeller, JD, director of the Center for Tobacco Products for the FDA.
In a statement published simultaneously with the Vital Signs study, FDA Commissioner Scott Gottlieb, MD, emphasized the link between e-cigarette use in teens and the potential for future tobacco use. “The kids using e-cigarettes are children who rejected conventional cigarettes, but don’t see the same stigma associated with the use of e-cigarettes. But now, having become exposed to nicotine through e-cigs, they will be more likely to smoke.” Dr. Gottlieb declared, “I will not allow a generation of children to become addicted to nicotine through e-cigarettes. We must stop the trends of youth e-cigarette use from continuing to build and will take whatever action is necessary to ensure these kids don’t become future smokers.” He reviewed steps taken in the past year by the FDA to counter tobacco use in teens but he warned of future actions that may need to be taken: “If these youth use trends continue, we’ll be forced to consider regulatory steps that could constrain or even foreclose the opportunities for currently addicted adult smokers to have the same level of access to these products that they now enjoy. I recognize that such a move could come with significant impacts to adult smokers.”
In the meantime, however, parents, teachers, community leaders, and health care providers are on the front lines and can make a difference in protecting youth and curbing nicotine use, Dr. King said.
One of the most important things clinicians can do is to ask young patients specifically about e-cigarette use, he emphasized. Learn and use the terminology the kids are using; ask, “Do you use JUUL?” If they are using these products, “make sure they know they are dangerous,” and can harm the developing brain, he said.
Although there are no currently approved medications to treat nicotine addiction in youth, research suggests that behavioral counseling, as well as reinforcement of the danger of nicotine from parents and other people of influence, can help, Dr. King said.
The Vital Signs report is based on data from the 2011-2018 National Youth Tobacco Survey, which assesses current use of cigarettes, cigars, smokeless tobacco, e-cigarettes, hookahs, pipe tobacco, and bidis among a nationally representative sample of middle and high school students in the United States. The findings were analyzed by the CDC, FDA, and the National Cancer Institute.
SOURCE: Gentzke AS et al. MMWR 2019 Feb 11. doi: 10.15585/mmwr.mm6806e1.
*Correction 2/13/2019 An earlier version of this article misstated the number of students using e-cigarettes as a proportion of all teen tobacco users.
FROM CDC VITAL SIGNS REPORT
ALA report: Federal and state actions to limit tobacco use fall short
Tobacco use is currently at an all-time low thanks to public and private efforts, but more aggressive action from federal, state, and local governments is needed to protect the public, according to a review of tobacco control trends in the United States.
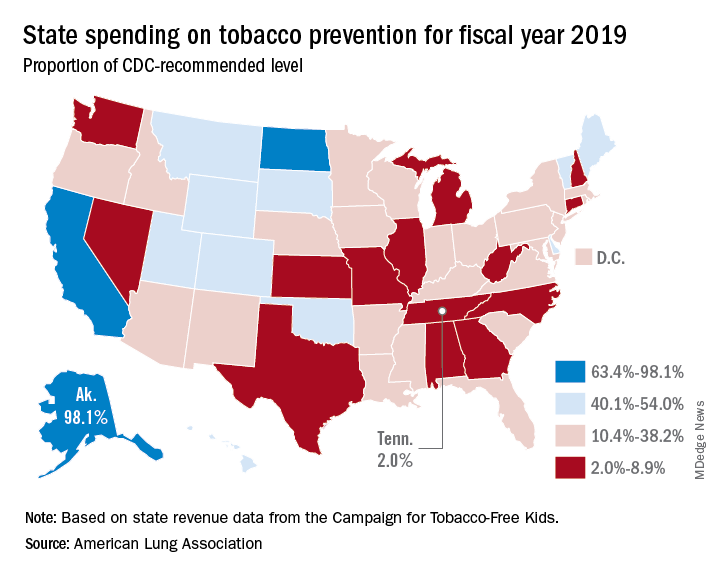
The American Lung Association (ALA) released “State of Tobacco Control” 2019, its 17th annual state-by-state analysis and list of recommended policy priorities to limit tobacco use. Although the report notes some positive steps taken by the federal and state governments, shortfalls in policy and legislation also are highlighted. The report states, “We know how and are ready to save more lives, but we need our elected officials to do much more. To many, solving America’s tobacco crisis might seem like a complex puzzle with no solution. And yet we have known for years what pieces are needed to reduce the disease and death caused by tobacco use.”
In this report, the federal government and each state are graded on a scale, A through F, for policy actions and laws to limit tobacco use. The grading methodology is based on a detailed point system cataloging the implementation and strength of specific actions and policies to limit tobacco use.
Areas of Impact
The report focused on six areas of public policy that affect exposure to and use of tobacco:
- Smoke-free air: Protecting the public from secondhand smoke should be a priority for policymakers, according the report, but 22 states have no smoke-free workplace laws in place. Laws restricting e-cigarettes in workplaces and public buildings have lagged behind tobacco laws in many states.
- Tobacco prevention funding: Dedicated funds to prevent tobacco addiction before it starts is a key element of a public health attack on tobacco use, but no U.S. state currently spends what the Centers for Disease Control and Prevention has recommended. Twenty years ago, the Master Settlement Agreement between the tobacco industry and 46 states and the District of Columbia guaranteed ongoing payments to the states to be used for tobacco prevention and control. Although those funds have been collected in the states to the tune of $27 billion since 1998, overall only 2.4% of those funds have been spent for this purpose, and the rest has been budgeted for other purposes.
- Tobacco taxes: Sales taxes on tobacco products have been highly effective in preventing young people from taking up tobacco use, but those taxation rates have remained unchanged in 2018 in all but the District of Columbia and Oklahoma. The tobacco industry spent $22 million in a successful effort to defeat ballot measures to increase sales taxes on tobacco in Montana and South Dakota.
- Tobacco 21: “Increasing the legal age of sale for tobacco products to 21 would decrease tobacco use by 12% and could prevent 223,000 deaths among those born between 2000 and 2019,” the report noted, citing a 2015 report by the Institute of Medicine. So far, the this restriction has been legislated in six states, the District of Columbia, and numerous local governments. The ALA considers increasing the age for tobacco sales to 21 to be a public health priority.
- Helping smokers quit: The addictive qualities of tobacco mean that many smokers struggle unsuccessfully to quit, and medical intervention is needed to help them. The report notes that current law requires that Medicaid expansion health plans and private insurance plans cover comprehensive smoking cessation treatment. However, not all states have the expanded Medicaid program, and many of those with Medicaid expansion don’t offer coverage of all Food and Drug–approved cessation treatments. Despite laws requiring smoking cessation coverage, many private insurance plans still do not include this coverage. The ALA recommends enforcement of the current law with regard to tobacco cessation insurance coverage.
- FDA regulation of tobacco products: The FDA has announced plans to make a major effort to reduce tobacco use in young people, decrease nicotine in cigarettes, and to restrict flavored tobacco products. But these plans fall short of the aggressive action needed to curb the tobacco “epidemic,” according to the report. Delayed action and timid policy have “resulted in tobacco companies becoming more emboldened to devise new and egregious ways to addict youth and sustain addiction among current users.” The ALA report points to the steep rise in e-cigarette use among youth with a 20.8% rise in high school students using these products in 2018, a rise from 11.7% in 2017. This trend is not likely to be reversed by the FDA proposals to date, which rely on voluntary action by the industry to curb youth use, sales restrictions to youth, and restrictions on some flavored tobacco products.
The report card
Federal government efforts in regulation of tobacco products, taxation, and health insurance coverage of cessation all received an F in this report, while mass media campaigns were given an A.
The states didn’t fare much better. They were graded on prevention and control funding, smoke-free air, taxation, access to cessation services, and minimum age for sales. A total of 19 states received a grade of F in four or five of these areas.
Funding for prevention and control was evaluated as the percentage of the amount recommended by the CDC, adjusted for a variety of state-specific factors such as prevalence of tobacco use, cost and complexity of conducting mass media campaigns, and proportion of the audience below 200% of the federal poverty level. A limitation of this methodology of grading funding is that it doesn’t evaluate effectiveness of the spending or the level of spending in different program categories. The higher spenders on prevention and control were Alaska at 98.1% and California at 74.5% of the CDC recommended level. The lowest spenders were Georgia at 2.8% and Missouri at 3.0%.
All but eight states received an F on minimum age for tobacco sales because most have an age limit 18 instead of the ALA and CDC recommendation of age 21.
Harold Wimmer, the CEO of the American Lung Association, wrote, “Aggressive action by our country’s federal and state policymakers is urgently required. However, ‘State of Tobacco Control’ 2019 has found a disturbing failure by federal and state governments to take action to put in place meaningful and proven-effective policies that would have prevented, and reduced tobacco use during 2018. This failure to act places the lung health and lives of Americans at risk. We have also found that this lack of action has emboldened tobacco companies to be even more brazen in producing and marketing products squarely aimed at kids, such as the JUUL e-cigarettes that look like an easily concealed USB drive, which now dominate the market driven by youth use.”
The full report is available for download at the ALA website.
SOURCE: American Lung Association, “State of Tobacco Control 2019”.
Tobacco use is currently at an all-time low thanks to public and private efforts, but more aggressive action from federal, state, and local governments is needed to protect the public, according to a review of tobacco control trends in the United States.
The American Lung Association (ALA) released “State of Tobacco Control” 2019, its 17th annual state-by-state analysis and list of recommended policy priorities to limit tobacco use. Although the report notes some positive steps taken by the federal and state governments, shortfalls in policy and legislation also are highlighted. The report states, “We know how and are ready to save more lives, but we need our elected officials to do much more. To many, solving America’s tobacco crisis might seem like a complex puzzle with no solution. And yet we have known for years what pieces are needed to reduce the disease and death caused by tobacco use.”
In this report, the federal government and each state are graded on a scale, A through F, for policy actions and laws to limit tobacco use. The grading methodology is based on a detailed point system cataloging the implementation and strength of specific actions and policies to limit tobacco use.
Areas of Impact
The report focused on six areas of public policy that affect exposure to and use of tobacco:
- Smoke-free air: Protecting the public from secondhand smoke should be a priority for policymakers, according the report, but 22 states have no smoke-free workplace laws in place. Laws restricting e-cigarettes in workplaces and public buildings have lagged behind tobacco laws in many states.
- Tobacco prevention funding: Dedicated funds to prevent tobacco addiction before it starts is a key element of a public health attack on tobacco use, but no U.S. state currently spends what the Centers for Disease Control and Prevention has recommended. Twenty years ago, the Master Settlement Agreement between the tobacco industry and 46 states and the District of Columbia guaranteed ongoing payments to the states to be used for tobacco prevention and control. Although those funds have been collected in the states to the tune of $27 billion since 1998, overall only 2.4% of those funds have been spent for this purpose, and the rest has been budgeted for other purposes.
- Tobacco taxes: Sales taxes on tobacco products have been highly effective in preventing young people from taking up tobacco use, but those taxation rates have remained unchanged in 2018 in all but the District of Columbia and Oklahoma. The tobacco industry spent $22 million in a successful effort to defeat ballot measures to increase sales taxes on tobacco in Montana and South Dakota.
- Tobacco 21: “Increasing the legal age of sale for tobacco products to 21 would decrease tobacco use by 12% and could prevent 223,000 deaths among those born between 2000 and 2019,” the report noted, citing a 2015 report by the Institute of Medicine. So far, the this restriction has been legislated in six states, the District of Columbia, and numerous local governments. The ALA considers increasing the age for tobacco sales to 21 to be a public health priority.
- Helping smokers quit: The addictive qualities of tobacco mean that many smokers struggle unsuccessfully to quit, and medical intervention is needed to help them. The report notes that current law requires that Medicaid expansion health plans and private insurance plans cover comprehensive smoking cessation treatment. However, not all states have the expanded Medicaid program, and many of those with Medicaid expansion don’t offer coverage of all Food and Drug–approved cessation treatments. Despite laws requiring smoking cessation coverage, many private insurance plans still do not include this coverage. The ALA recommends enforcement of the current law with regard to tobacco cessation insurance coverage.
- FDA regulation of tobacco products: The FDA has announced plans to make a major effort to reduce tobacco use in young people, decrease nicotine in cigarettes, and to restrict flavored tobacco products. But these plans fall short of the aggressive action needed to curb the tobacco “epidemic,” according to the report. Delayed action and timid policy have “resulted in tobacco companies becoming more emboldened to devise new and egregious ways to addict youth and sustain addiction among current users.” The ALA report points to the steep rise in e-cigarette use among youth with a 20.8% rise in high school students using these products in 2018, a rise from 11.7% in 2017. This trend is not likely to be reversed by the FDA proposals to date, which rely on voluntary action by the industry to curb youth use, sales restrictions to youth, and restrictions on some flavored tobacco products.
The report card
Federal government efforts in regulation of tobacco products, taxation, and health insurance coverage of cessation all received an F in this report, while mass media campaigns were given an A.
The states didn’t fare much better. They were graded on prevention and control funding, smoke-free air, taxation, access to cessation services, and minimum age for sales. A total of 19 states received a grade of F in four or five of these areas.
Funding for prevention and control was evaluated as the percentage of the amount recommended by the CDC, adjusted for a variety of state-specific factors such as prevalence of tobacco use, cost and complexity of conducting mass media campaigns, and proportion of the audience below 200% of the federal poverty level. A limitation of this methodology of grading funding is that it doesn’t evaluate effectiveness of the spending or the level of spending in different program categories. The higher spenders on prevention and control were Alaska at 98.1% and California at 74.5% of the CDC recommended level. The lowest spenders were Georgia at 2.8% and Missouri at 3.0%.
All but eight states received an F on minimum age for tobacco sales because most have an age limit 18 instead of the ALA and CDC recommendation of age 21.
Harold Wimmer, the CEO of the American Lung Association, wrote, “Aggressive action by our country’s federal and state policymakers is urgently required. However, ‘State of Tobacco Control’ 2019 has found a disturbing failure by federal and state governments to take action to put in place meaningful and proven-effective policies that would have prevented, and reduced tobacco use during 2018. This failure to act places the lung health and lives of Americans at risk. We have also found that this lack of action has emboldened tobacco companies to be even more brazen in producing and marketing products squarely aimed at kids, such as the JUUL e-cigarettes that look like an easily concealed USB drive, which now dominate the market driven by youth use.”
The full report is available for download at the ALA website.
SOURCE: American Lung Association, “State of Tobacco Control 2019”.
Flu activity hits seasonal high
Influenza activity increased for the third consecutive week and has now reached its highest point for the 2018-2019 flu season, according to the Centers for Disease Control and Prevention.
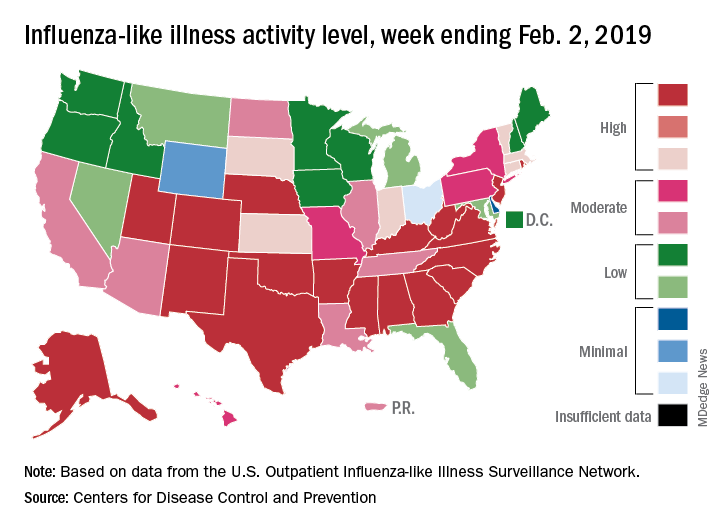
The proportion of outpatient visits for influenza-like illness (ILI) hit 4.3% for the week ending Feb. 2, which topped the previous high of 4.0% that was reached in late December (the national baseline rate is 2.2%). Outpatient ILI visits then dipped down to 3.1% after 2 weeks of decreases before rising again in mid-January, the CDC’s influenza division reported Feb. 8.
Season-high activity also was seen at the state level for the week ending Feb. 2. There were 18 states at level 10 on the CDC’s 1-10 scale of ILI activity, which was up from 16 the week before, and a total of 24 states were in the high range from 8-10, compared with 23 for the previous week. The geographic spread of influenza was reported as widespread in 47 states and Puerto Rico, the CDC said.
Four flu-related pediatric deaths were reported during the week ending Feb. 2, two of which occurred the previous week, which brings the total for the 2018-2019 season to 28, the CDC said.
There were 158 flu-related deaths among all ages during the week ending Jan. 26 – the latest for which such data are available – with reporting almost 75% complete. The previous week saw 177 overall flu deaths, with reporting for that week over 90% complete. During the corresponding weeks of the very severe 2017-2018 flu season, the overall death totals were 1,448 and 1,626, CDC data show.
Influenza activity increased for the third consecutive week and has now reached its highest point for the 2018-2019 flu season, according to the Centers for Disease Control and Prevention.
The proportion of outpatient visits for influenza-like illness (ILI) hit 4.3% for the week ending Feb. 2, which topped the previous high of 4.0% that was reached in late December (the national baseline rate is 2.2%). Outpatient ILI visits then dipped down to 3.1% after 2 weeks of decreases before rising again in mid-January, the CDC’s influenza division reported Feb. 8.
Season-high activity also was seen at the state level for the week ending Feb. 2. There were 18 states at level 10 on the CDC’s 1-10 scale of ILI activity, which was up from 16 the week before, and a total of 24 states were in the high range from 8-10, compared with 23 for the previous week. The geographic spread of influenza was reported as widespread in 47 states and Puerto Rico, the CDC said.
Four flu-related pediatric deaths were reported during the week ending Feb. 2, two of which occurred the previous week, which brings the total for the 2018-2019 season to 28, the CDC said.
There were 158 flu-related deaths among all ages during the week ending Jan. 26 – the latest for which such data are available – with reporting almost 75% complete. The previous week saw 177 overall flu deaths, with reporting for that week over 90% complete. During the corresponding weeks of the very severe 2017-2018 flu season, the overall death totals were 1,448 and 1,626, CDC data show.
Marijuana smoking is an independent risk factor for lung disease in HIV+
Long-term marijuana smoking was associated with lung disease in HIV-infected (HIV+) but not HIV uninfected (HIV–) men who have sex with men (MSM), according to the results of a large, prospective cohort study.

“There were no significant interactions between marijuana and tobacco smoking in any multivariable model tested for HIV+ participants, indicating independent effects of these factors,” wrote David R. Lorenz, PhD, of the Dana-Farber Cancer Institute, Boston, and his colleagues.
These findings are especially important given that the proportion of HIV+ individuals who frequently smoke marijuana is higher than in the general population in the United States, and has increased in recent years, according to the report, published online in EClinicalMedicine.
The study examined 2,704 MSM who met eligibility criteria (1,352 HIV+ and 1,352 HIV− individuals), with a median age of 44 years at baseline and a median follow-up of 10.5 years. A total of 27% of HIV+ participants reported daily or weekly marijuana smoking for 1 year or more during follow-up, compared with 18% of the HIV− participants.
HIV+ participants who smoked marijuana were more likely to report one or more pulmonary diagnoses, versus nonsmoking HIV+ individuals during follow-up (41.0% vs. 30.0% infectious, and 24.8% vs. 19.0% noninfectious), according to the authors. In contrast, there was no association between marijuana smoking and either an infectious or noninfectious pulmonary diagnosis among HIV− participants (24.2% vs. 20.9%, and 14.8% vs. 17.7%, respectively).
For HIV+ individuals, each 10 days/month increase in marijuana smoking in the prior 2-year period was found to be associated with a 6% increased risk of infectious pulmonary diagnosis (hazard risk 1.06 [95% confidence interval 1.00-1.11]; P = .041). Overall, they found that from the 53,000 person-visits in the study, marijuana smoking was associated with increased risk of both infectious and noninfectious pulmonary diagnoses among the 1,352 HIV-infected participants independent of CD4 count, antiretroviral therapy (ART) adherence, and demographic factors as well.
In particular, viral suppression did not seem to interfere with this association between marijuana smoking and infectious pulmonary diagnoses, as it remained significant in models restricted to those person-visits with suppressed HIV viral load (HR 1.41 [1.03-1.91], P = .029).
The authors suggested that HIV-specific factors such as lung immune cell depletion and dysfunction, persistent immune cell activation, systemic inflammation, respiratory microbiome alterations, and oxidative stress, or a combination of these effects, may interact with the alveolar macrophage dysfunction seen in both humans and mouse models exposed to marijuana smoke. Thus, “a potential additive risk of marijuana smoking and HIV disease may explain the increased prevalence of infectious pulmonary diagnoses in our adjusted analyses,” Dr. Lorenz and his colleagues stated.
“These findings suggest that marijuana smoking is a modifiable risk factor that healthcare providers should consider when seeking to prevent or treat lung disease in people infected with HIV, particularly those with other known risk factors including heavy tobacco smoking, and low CD4 T cell count or advanced HIV disease,” they concluded.
The National Institutes of Health funded the study. The authors reported that they had no relevant disclosures.
SOURCE: Lorenz DR et al. EClinicalMedicine. 2019 Jan 24. doi: 10.1016/j.eclinm.2019.01.003.
Long-term marijuana smoking was associated with lung disease in HIV-infected (HIV+) but not HIV uninfected (HIV–) men who have sex with men (MSM), according to the results of a large, prospective cohort study.
“There were no significant interactions between marijuana and tobacco smoking in any multivariable model tested for HIV+ participants, indicating independent effects of these factors,” wrote David R. Lorenz, PhD, of the Dana-Farber Cancer Institute, Boston, and his colleagues.
These findings are especially important given that the proportion of HIV+ individuals who frequently smoke marijuana is higher than in the general population in the United States, and has increased in recent years, according to the report, published online in EClinicalMedicine.
The study examined 2,704 MSM who met eligibility criteria (1,352 HIV+ and 1,352 HIV− individuals), with a median age of 44 years at baseline and a median follow-up of 10.5 years. A total of 27% of HIV+ participants reported daily or weekly marijuana smoking for 1 year or more during follow-up, compared with 18% of the HIV− participants.
HIV+ participants who smoked marijuana were more likely to report one or more pulmonary diagnoses, versus nonsmoking HIV+ individuals during follow-up (41.0% vs. 30.0% infectious, and 24.8% vs. 19.0% noninfectious), according to the authors. In contrast, there was no association between marijuana smoking and either an infectious or noninfectious pulmonary diagnosis among HIV− participants (24.2% vs. 20.9%, and 14.8% vs. 17.7%, respectively).
For HIV+ individuals, each 10 days/month increase in marijuana smoking in the prior 2-year period was found to be associated with a 6% increased risk of infectious pulmonary diagnosis (hazard risk 1.06 [95% confidence interval 1.00-1.11]; P = .041). Overall, they found that from the 53,000 person-visits in the study, marijuana smoking was associated with increased risk of both infectious and noninfectious pulmonary diagnoses among the 1,352 HIV-infected participants independent of CD4 count, antiretroviral therapy (ART) adherence, and demographic factors as well.
In particular, viral suppression did not seem to interfere with this association between marijuana smoking and infectious pulmonary diagnoses, as it remained significant in models restricted to those person-visits with suppressed HIV viral load (HR 1.41 [1.03-1.91], P = .029).
The authors suggested that HIV-specific factors such as lung immune cell depletion and dysfunction, persistent immune cell activation, systemic inflammation, respiratory microbiome alterations, and oxidative stress, or a combination of these effects, may interact with the alveolar macrophage dysfunction seen in both humans and mouse models exposed to marijuana smoke. Thus, “a potential additive risk of marijuana smoking and HIV disease may explain the increased prevalence of infectious pulmonary diagnoses in our adjusted analyses,” Dr. Lorenz and his colleagues stated.
“These findings suggest that marijuana smoking is a modifiable risk factor that healthcare providers should consider when seeking to prevent or treat lung disease in people infected with HIV, particularly those with other known risk factors including heavy tobacco smoking, and low CD4 T cell count or advanced HIV disease,” they concluded.
The National Institutes of Health funded the study. The authors reported that they had no relevant disclosures.
SOURCE: Lorenz DR et al. EClinicalMedicine. 2019 Jan 24. doi: 10.1016/j.eclinm.2019.01.003.
FROM ECLINICALMEDICINE
Key clinical point: HIV+ but not HIV– marijuana smokers had an increased rate of pulmonary diagnoses.
Major finding: HIV+ marijuana smokers were more likely to report one or more infectious or noninfectious pulmonary diagnoses, compared with nonsmoking HIV+ individuals (41.0% vs. 30.0%, and 24.8% vs. 19.0%, respectively).
Study details: A prospective cohort study of 1,352 HIV+ vs. 1,352 HIV– men who have sex with men.
Disclosures: The National Institutes of Health funded the study. The authors reported that they had no relevant disclosures.
Source: Lorenz DR et al. EClinicalMedicine. 2019 Jan 24. doi: 10.1016/j.eclinm.2019.01.003.