User login
Key trends in hospitalist compensation from the 2020 SoHM Report
In a time of tremendous uncertainty, there is one trend that seems consistent year over year – the undisputed value of hospitalists. In the 2020 State of Hospital Medicine (SoHM) Report, the Society of Hospital Medicine partnered with the Medical Group Management Association (MGMA) to provide data on hospitalist compensation and productivity. The Report provides resounding evidence that hospitalists continue to be compensated at rising rates. This may be driven by both the continued demand-supply mismatch and a recognition of the overall value they generate rather than strictly the volume of their productivity.

In 2020, the median total compensation nationally for adult hospitalists (internal medicine and family medicine) was $307,633, representing an increase of over 6% from the 2018 Survey (see Figure 1). 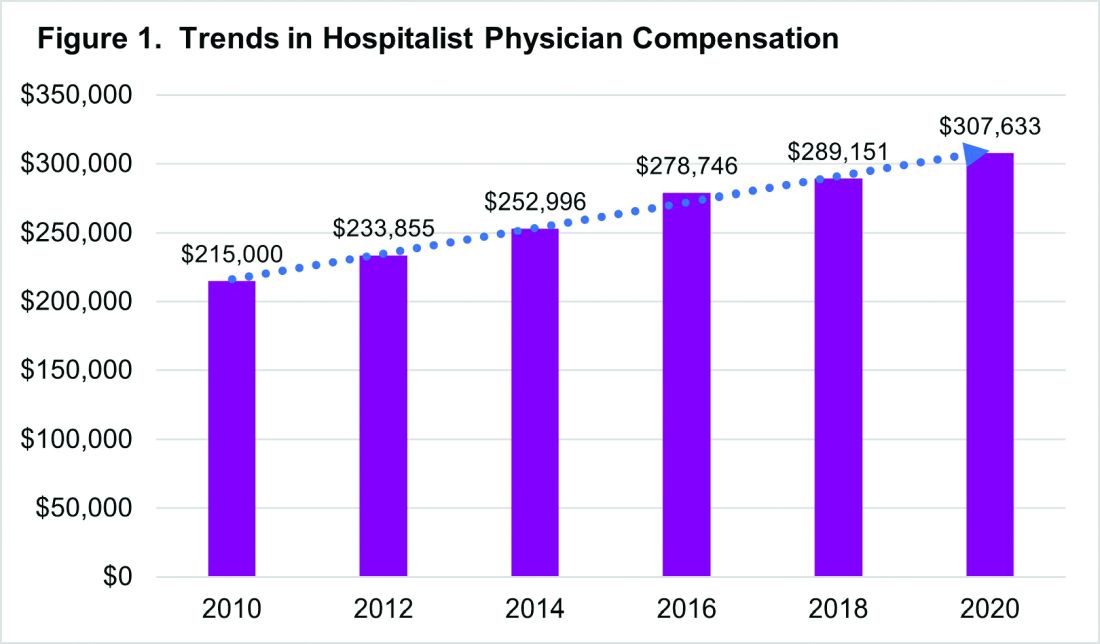
With significant regional variability in compensation across the country, hospitalists in the South continue to earn more than their colleagues in the East – a median compensation difference of about $33,000. However, absolute wage comparisons can be misleading without also considering regional variations in productivity as well.
Reviewing compensation per work relative value unit (wRVU) and per encounter offer additional insight for a more comprehensive assessment. When comparing regional compensation per wRVU, the 2020 Survey continues to show a trend toward hospitalists in the Midwest and West earning more per wRVU than their colleagues in other parts of the country ($78.13 per RVU in the Midwest, $78.95 per RVU in the West). More striking is how hospital medicine groups (HMGs) in the South garner lower compensation per RVU ($57.77) than those in the East ($67.54), even though their total compensation was much higher. This could reflect the gradual decline in compensation per wRVU that’s observed at higher productivity levels. While it’s typical for compensation to increase as productivity does, the rate of increase is generally to a lesser degree.
Like past SoHM Surveys, the 2020 Report revealed that academic and non-academic hospitalists are compensated similarly per wRVU (see Figure 2). 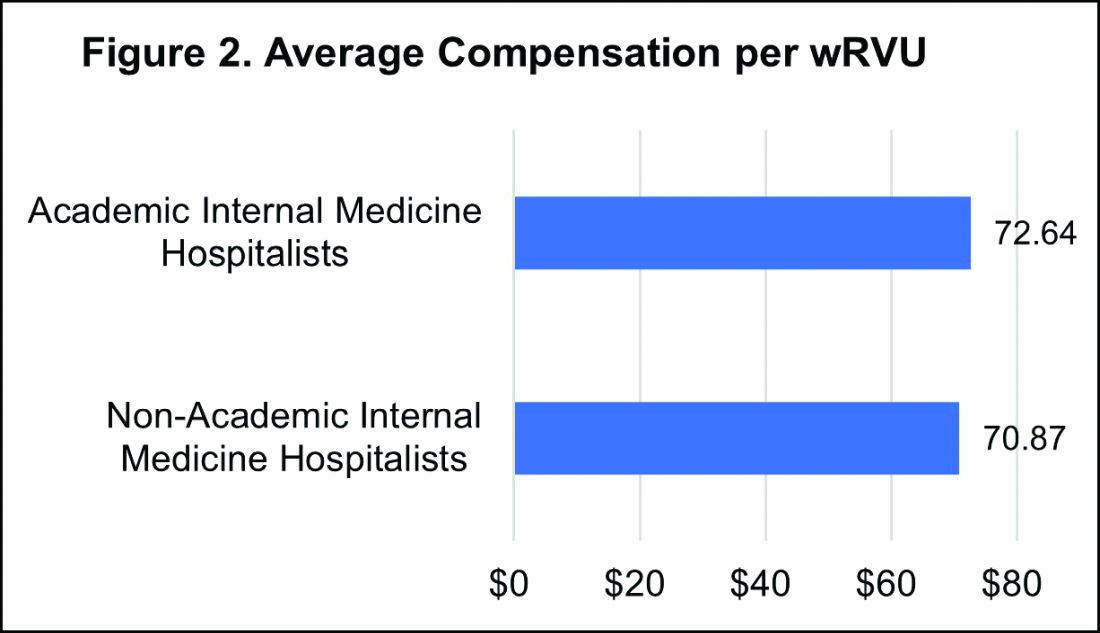
However, the total compensation continues to be lower for academic hospitalists, with a median compensation difference of approximately $70,000 compared to their non-academic colleagues. Some of this sizable variance is offset by the fact that academic HMGs receive more in employee benefits packages than non-academic groups – a difference in median value of $10,500. Ideally, academic hospitalist compensation models should appropriately reflect and value their work efforts toward the tripartite academic mission of clinical care, education, and research. It would be valuable for future surveys to define and measure academic production in order to develop national standards for compensation models that recognize these non-billable forms of productivity.
While it’s important to review compensation benchmarks to remain competitive, it’s difficult to put a price on some factors that many may consider more valuable – group culture, opportunities for professional growth, and schedules that afford better work-life integration. Indirect measures of such benefits include paid time off, paid sick days, CME allowances and time, and retirement benefits programs. In 2020, the median employer contribution to retirement plans was reported to be $13,955, with respondents in the Midwest receiving the highest retirement benefit of $33,771.
It’s encouraging to see that hospitalist compensation continues to rise compared to previous years, despite relatively flat trends in wRVUs and total patient encounters. Another continued trend over the past years is the rising amount of financial support per physician that hospitals or other organizations provide HMGs (see Figure 3). 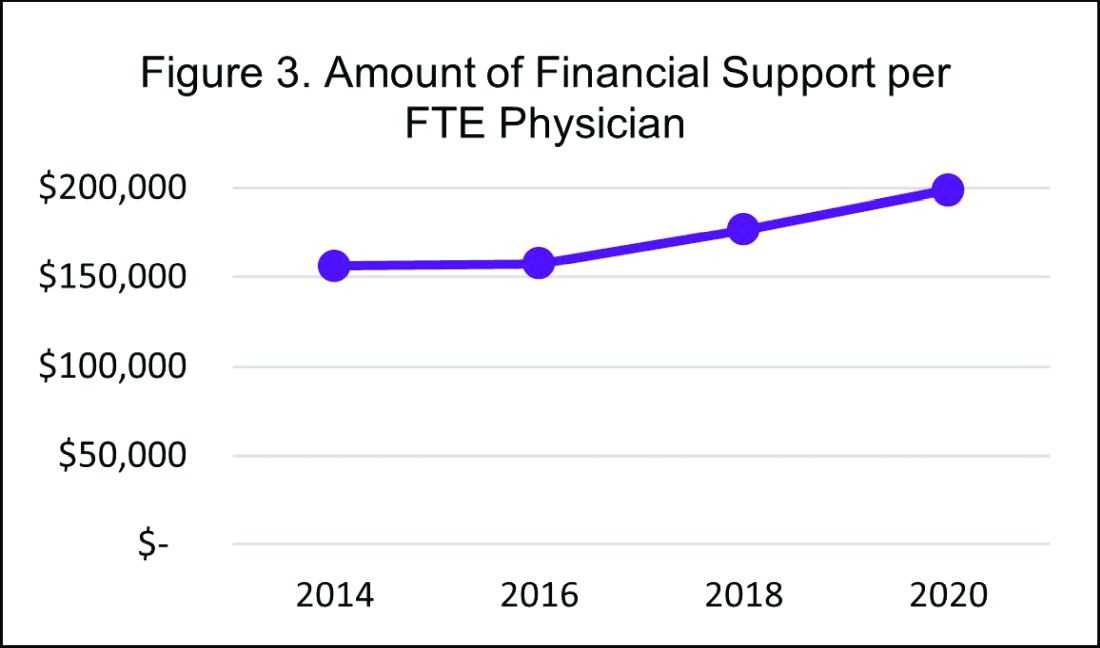
In 2020, the median financial support per FTE (full time equivalent) physician serving adult patients increased by 12% over 2018, to $198,750. Collectively these trends indicate hospitals are willing to compensate hospitalists for more than just their clinical volume.
There’s no doubt that the COVID-19 pandemic had some financial impact on hospital medicine groups in 2020. To assess this impact, SHM conducted a follow-up survey and compiled a COVID-19 Addendum to the SoHM Report. While 20.5% of HMG group respondents from the East reported providing hazard pay to clinicians caring for COVID-19 patients, nationally only 9.8% of groups said they offered this benefit. Of the 121 HMGs responding from across the country, 42% reported reductions in compensation, which included measures such as reductions in pay level and elimination or delays to bonus payments. The degree of reductions was not quantified, but fortunately the vast majority of these groups reported that these changes were likely to be temporary. To access all data in the 2020 SoHM Report and COVID-19 Addendum, visit hospitalmedicine.org/sohm to purchase your copy.
It’s certainly unclear what the future holds, but despite any transient changes observed during the COVID-19 pandemic, I believe that historical trends in hospitalist compensation will continue. If 2020 has taught us anything, it’s that hospitalists are essential, not only during an acute care crisis but for daily operations of any hospital.
Dr. Kurian is chief of the Division of Hospital Medicine at Northwell Health in New York. She is a member of SHM’s Practice Analysis Committee.
In a time of tremendous uncertainty, there is one trend that seems consistent year over year – the undisputed value of hospitalists. In the 2020 State of Hospital Medicine (SoHM) Report, the Society of Hospital Medicine partnered with the Medical Group Management Association (MGMA) to provide data on hospitalist compensation and productivity. The Report provides resounding evidence that hospitalists continue to be compensated at rising rates. This may be driven by both the continued demand-supply mismatch and a recognition of the overall value they generate rather than strictly the volume of their productivity.
In 2020, the median total compensation nationally for adult hospitalists (internal medicine and family medicine) was $307,633, representing an increase of over 6% from the 2018 Survey (see Figure 1).
With significant regional variability in compensation across the country, hospitalists in the South continue to earn more than their colleagues in the East – a median compensation difference of about $33,000. However, absolute wage comparisons can be misleading without also considering regional variations in productivity as well.
Reviewing compensation per work relative value unit (wRVU) and per encounter offer additional insight for a more comprehensive assessment. When comparing regional compensation per wRVU, the 2020 Survey continues to show a trend toward hospitalists in the Midwest and West earning more per wRVU than their colleagues in other parts of the country ($78.13 per RVU in the Midwest, $78.95 per RVU in the West). More striking is how hospital medicine groups (HMGs) in the South garner lower compensation per RVU ($57.77) than those in the East ($67.54), even though their total compensation was much higher. This could reflect the gradual decline in compensation per wRVU that’s observed at higher productivity levels. While it’s typical for compensation to increase as productivity does, the rate of increase is generally to a lesser degree.
Like past SoHM Surveys, the 2020 Report revealed that academic and non-academic hospitalists are compensated similarly per wRVU (see Figure 2).
However, the total compensation continues to be lower for academic hospitalists, with a median compensation difference of approximately $70,000 compared to their non-academic colleagues. Some of this sizable variance is offset by the fact that academic HMGs receive more in employee benefits packages than non-academic groups – a difference in median value of $10,500. Ideally, academic hospitalist compensation models should appropriately reflect and value their work efforts toward the tripartite academic mission of clinical care, education, and research. It would be valuable for future surveys to define and measure academic production in order to develop national standards for compensation models that recognize these non-billable forms of productivity.
While it’s important to review compensation benchmarks to remain competitive, it’s difficult to put a price on some factors that many may consider more valuable – group culture, opportunities for professional growth, and schedules that afford better work-life integration. Indirect measures of such benefits include paid time off, paid sick days, CME allowances and time, and retirement benefits programs. In 2020, the median employer contribution to retirement plans was reported to be $13,955, with respondents in the Midwest receiving the highest retirement benefit of $33,771.
It’s encouraging to see that hospitalist compensation continues to rise compared to previous years, despite relatively flat trends in wRVUs and total patient encounters. Another continued trend over the past years is the rising amount of financial support per physician that hospitals or other organizations provide HMGs (see Figure 3).
In 2020, the median financial support per FTE (full time equivalent) physician serving adult patients increased by 12% over 2018, to $198,750. Collectively these trends indicate hospitals are willing to compensate hospitalists for more than just their clinical volume.
There’s no doubt that the COVID-19 pandemic had some financial impact on hospital medicine groups in 2020. To assess this impact, SHM conducted a follow-up survey and compiled a COVID-19 Addendum to the SoHM Report. While 20.5% of HMG group respondents from the East reported providing hazard pay to clinicians caring for COVID-19 patients, nationally only 9.8% of groups said they offered this benefit. Of the 121 HMGs responding from across the country, 42% reported reductions in compensation, which included measures such as reductions in pay level and elimination or delays to bonus payments. The degree of reductions was not quantified, but fortunately the vast majority of these groups reported that these changes were likely to be temporary. To access all data in the 2020 SoHM Report and COVID-19 Addendum, visit hospitalmedicine.org/sohm to purchase your copy.
It’s certainly unclear what the future holds, but despite any transient changes observed during the COVID-19 pandemic, I believe that historical trends in hospitalist compensation will continue. If 2020 has taught us anything, it’s that hospitalists are essential, not only during an acute care crisis but for daily operations of any hospital.
Dr. Kurian is chief of the Division of Hospital Medicine at Northwell Health in New York. She is a member of SHM’s Practice Analysis Committee.
What’s in your wallet? Trends in hospitalist compensation
Ever wonder how your hospitalist group’s compensation stacks up? Whether you’re a practicing hospitalist curious about how competitive your compensation package is or a hospital medicine group leader performing an appraisal of your group’s salary structure, chances are you’re looking to fair market benchmarks for hospitalist compensation. In the 2018 State of Hospital Medicine (SoHM) report, the Society of Hospital Medicine partners with the Medical Group Management Association to provide data on hospitalist compensation and productivity.
In 2018, the median compensation for adult hospitalist respondents was $289,151, an increase of over $10,000 from 2016. When comparing compensation across different regions, there appear to be remarkable differences across the nation. Not surprisingly, hospitalists in the South fare better than their colleagues in the East, with a reported median compensation difference of nearly $33,000. Does that make you want to move to Texas? What about the even more striking difference between adult hospitalists and pediatric hospitalists, whose median compensation was reported to be $205,342 in 2018?
A common pitfall in compensation analysis is comparing wages across regions and specialties without considering productivity. Reviewing compensation per work relative value units (wRVU) and compensation per encounter offer additional insight for a more comprehensive assessment of compensation.
A regional comparison of compensation per wRVU reveals that hospitalists in the West earn more per wRVU than their colleagues in other parts of the country, including the South. Specifically, compensation per wRVU in the West is $86.57; in the South, $59.38; in the East, $65.74; and in the Midwest, $73.08. A similar comparison of compensation per wRVU (see Figure 1) suggests that academic adult, academic pediatric, and nonacademic adult hospitalists are fairly evenly compensated when considering productivity, but nonacademic pediatric hospitalist respondents earned significantly more per wRVU. From this perspective, pediatric hospitalists appear to be similarly compensated, if not better, than their adult hospitalist colleagues.
While differences in compensation per wRVU may be minimal between nonacademic and academic hospitalists, there remains a significant difference in total compensation. Median compensation for nonacademic internal medicine hospitalists was approximately $63,000 more than that reported for academic internal medicine hospitalists. This doesn’t come as a surprise since compensation tends to be lower in academic settings across all specialties. It could be valuable for future compensation and productivity assessments to define and measure academic and other forms of nonbillable hospitalist productivity. Development of national standards for nonbillable productivity units could help create a more comprehensive model for structuring hospitalist compensation.
While it’s important to understand compensation benchmarks in order to remain competitive as an hospital medicine group, money isn’t everything. Group culture, professional development and growth opportunities, and schedules that afford better work-life integration are important factors that contribute to hospitalist “compensation” valuations. Arguably these factors are more valuable than any compensation package, but it’s not easy to quantify their weight. Some indirect forms of compensation include paid time off, paid sick days, and support for professional development through allowances and protected time off for CME. Other indirect compensation includes tuition benefits for hospitalists and their family, retirement benefits programs, and the unicorn of benefits – pension plans. In the 2018 SoHM survey, the median employer contribution to retirement plans was reported to be $19,875, with respondents in the Midwest receiving the highest retirement benefit of $28,340.
The good news is that hospitalist physician compensation has continued to rise, compared with previous years (see Figure 2), despite the relative flat trends in wRVUs and encounters. Among other reasons, this may reflect a shift from compensating hospitalists for volume towards compensation for their value.
The not-so-good news? In contrast to prior SoHM Surveys reporting compensation differences that increased at a rate of 8%-10% every 2 years, the difference in median compensation between 2016 and 2018 was 3.7%. Several factors could play into the slower acceleration rate, including differences in respondent groups between 2016 and 2018. It will be more intriguing to know whether we’re starting to see hospitalist compensation leveling off.
As the 2020 SoHM surveying period just concluded, it remains to be seen how compensation has changed in the past 2 years and whether hospitalist compensation is starting to plateau. Stay tuned for the 2020 SoHM Report available later this year, which will offer invaluable insights into hospitalist compensation trends. You can sign up to be notified when it becomes available at www.hospitalmedicine.org/SoHM.
Dr. Kurian is chief of the academic division of hospital medicine at Northwell Health in New York. She is a member of the SHM Practice Analysis Committee.