User login
Bedside calculation of early warning system (EWS) scores is standard practice in many hospitals to predict clinical deterioration. These systems were designed for periodic hand‐scoring, typically using a half‐dozen variables dominated by vital signs. Most derive from the Modified Early Warning Score (MEWS).[1, 2] Despite years of modification, EWSs have had only modest impact on outcomes.[3, 4] Major improvement is possible only by adding more information than is contained in vital signs. Thus, the next generation of EWSs must analyze electronic medical records (EMRs). Analysis would be performed by computer, displayed automatically, and updated whenever new data are entered into the EMR. Such systems could deliver timely, accurate, longitudinally trended acuity information that could aid in earlier detection of declining patient condition as well as improving sensitivity and specificity of EWS alarms.
Advancing this endeavor along with others,[5, 6] we previously published a patient acuity metric, the Rothman Index (RI), which automatically updates when asynchronous vital signs, laboratory test results, Braden Scale,[7] cardiac rhythm, and nursing assessments are entered into the EMR.[8] Our goal was to enable clinicians to visualize changes in acuity by simple line graphs personalized to each patient at any point in time across the trajectory of care. In our model validation studies,[8] we made no attempt to identify generalizable thresholds, though others[9] have defined decision cut points for RI in a nonemergent context. To examine decision support feasibility in an emergent context, and to compare RI with a general EWS standard, we compare the accuracy of the RI with the MEWS in predicting hospital death within 24 hours.
METHODS
Site Description and Ethics
The institutional review board of Abington Memorial Hospital (Abington, PA) approved collection of retrospective data obtained from their 665‐bed, regional referral center and teaching hospital. Handling of patient information complied with the Health Insurance Portability and Accountability Act of 1996 regulations.
Patient Inclusion
The analysis included all patients, aged 18 years or older, admitted from July 2009 through June 2010, when there were sufficient data in the EMR to compute the RI. Obstetric and psychiatric patients were excluded because nursing documentation is insufficient in this dataset.
Data Collection/Data Sources
Clinical variables were extracted from the EMR (AllScripts Sunrise Clinical Manager, Chicago, IL) by SQL query and placed into a database. RI[8] and MEWS[1] were computed according to published methods. Table 1 shows definitions of standards for each nursing assessment,[8] and Table 2 identifies all clinical variables employed for each system. Briefly, RI utilizes 26 variables related to clinical care and routinely available in the EMR. These include vital signs, laboratory results, cardiac rhythms, and nursing assessments. Excess risk associated with any value of a variable is defined as percent absolute increase in 1‐year mortality relative to minimum 1‐year mortality identified for that variable. Excess risk is summed on a linear scale to reflect cumulative risk for individual patients at any given time. RI was computed at every new observation during a patient visit, when input values were available. Laboratory results are included when measured, but after 24 hours their weighting is reduced by 50%, and after 48 hours they are excluded. Data input intervals were a function of institutional patient care protocols and physician orders. All observations during a patient's stay were included in the analysis, per the method of Prytherch et al.[4] Because data did not contain the simplified alert/voice/pain/unresponsive (A/V/P/U) score, computation of MEWS used appropriate mapping of the Glasgow Coma Scale.[10] A corresponding MEWS was calculated for each RI. The relationship between RI and MEWS is inverse. RI ranges from 91 to 100, with lower scores indicating increasing acuity. MEWS ranges from 0 to 14, with higher scores indicating increasing acuity.
| |
| Cardiac | Pulse regular, rate 60100 bpm, skin warm and dry. Blood pressure 140/90 and no symptoms of hypotension. |
| Food/nutrition | No difficulty with chewing, swallowing, or manual dexterity. Patient consuming >50% of daily diet ordered as observed or stated. |
| Gastrointestinal | Abdomen soft and nontender. Bowel sounds present. No nausea or vomiting. Continent. Bowel pattern normal as observed or stated. |
| Genitourinary | Voids without difficulty. Continent. Urine clear, yellow to amber as observed or stated. Urinary catheter patent if present. |
| Musculoskeletal | Independently able to move all extremities and perform functional activities as observed or stated (includes assistive devices). |
| Neurological | Alert and oriented to person, place, time, situation. Speech is coherent. |
| Peripheral‐vascular | Extremities are normal or pink and warm. Peripheral pulses palpable. Capillary refill 3 seconds. No edema, numbness or tingling. |
| Psychosocial | Behavior appropriate to situation. Expressed concerns and fears being addressed. Adequate support system. |
| Respiratory | Respiration 1224/minute at rest, quiet and regular. Bilateral breath sounds clear. Nail beds and mucous membranes pink. Sputum clear, if present. |
| Safety/fall risk | Safety/fall risk factors not present. Not a risk to self or others. |
| Skin/tissue | Skin clean, dry, and intact with no reddened areas. Patient is alert, cooperative and able to reposition self independently. Braden Scale >15. |
| Input Variable | A: Alive in 24 Hours, Mean (SD) | B: Dead Within 24 Hours, Mean (SD) | P Value |
|---|---|---|---|
| |||
| Diastolic blood pressure, mm Hg | 66.8 (13.5) | 56.6 (16.8) | 0.0001 |
| Systolic blood pressure, mm Hga | 127.3 (23.8) | 105.2 (29.4) | 0.0001 |
| Temperature, Fa | 98.2 (1.1) | 98.2 (2.0) | 0.1165 |
| Respiration, breaths per minutea | 20.1 (4.7) | 23.6 (9.1) | 0.0001 |
| Heart rate, bpma | 81.1 (16.5) | 96.9 (22.2) | 0.0001 |
| Pulse oximetry, % O2 saturation | 96.3 (3.3) | 93.8 (10.1) | 0.0001 |
| Creatinine, mg/dL | 1.2 (1.2) | 1.8 (1.5) | 0.0001 |
| Blood urea nitrogen, mg/dL | 23.9 (17.9) | 42.1 (26.4) | 0.0001 |
| Serum chloride, mmol/L | 104.3 (5.4) | 106.9 (9.7) | 0.0001 |
| Serum potassium, mmol/L | 4.2 (0.5) | 4.4 (0.8) | 0.0001 |
| Serum sodium, mmol/L | 139.0 (4.1) | 140.7 (8.5) | 0.0001 |
| Hemoglobin, gm/dL | 11.2 (2.1) | 10.6 (2.1) | 0.0001 |
| White blood cell count, 103 cell/L | 9.9 (6.3) | 15.0 (10.9) | 0.0001 |
| Braden Scale, total points | 17.7 (3.4) | 12.2 (3.1) | 0.0001 |
| NURSING ASSESSMENTS | A: Alive in 24 Hours and Failed Standard | B: Dead Within 24 Hours and Failed Standard | P Value |
| Neurological | 38.7% | 91.4% | 0.0001 |
| Genitourinary | 46.6% | 90.0% | 0.0001 |
| Respiratory | 55.6% | 89.0% | 0.0001 |
| Peripheral vascular | 54.1% | 86.9% | 0.0001 |
| Food | 28.3% | 80.6% | 0.0001 |
| Skin | 56.3% | 75.0% | 0.0001 |
| Gastrointestinal | 49.3% | 75.0% | 0.0001 |
| Musculoskeletal | 50.3% | 72.4% | 0.0001 |
| Cardiac | 30.4% | 59.8% | 0.0001 |
| Psychosocial | 24.6% | 40.9% | 0.0001 |
| Safety | 25.5% | 29.0% | 0.0001 |
| A/V/P/U scorea | 96.3/2.1/1.4/0.2% | 88.6/21.6/4.6/5.3% | 0.0001 |
| Sinus rhythm (absent)b | 34.9% | 53.3% | 0.0001 |
Outcome Ascertainment
In‐hospital death was determined by merging the date and time of discharge with clinical inputs from the hospital's EMR. Data points were judged to be within 24 hours of death if the timestamp of the data point collection was within 24 hours of the discharge time with expired as the discharge disposition.
Statistical Methods
Demographics and input variables from the 2 groups of observations, those who were within 24 hours of death and those who were not, were compared using a t test with a Cochran and Cox[11] approximation of the probability level of the approximate t statistic for unequal variances. Mean, standard deviation, and P values are reported. Discrimination of RI and MEWS to predict 24‐hour mortality was estimated using area under the receiver operating characteristic (ROC) curve (AUC), and null hypothesis was tested using 2. Sensitivity, specificity, positive predictive value (PPV), negative predictive value (NPV), positive and negative likelihood ratios (LR+, LR) were computed. Analyses were performed with SAS 9.3 (procedures ttest, freq, logistic, nlmixed; SAS Institute, Cary, NC). Typically MEWS=4 triggers a protocol to increase level of assessment and/or care, often a transfer to the intensive care unit (ICU). We denoted the point on ROC curve where MEWS=4 and identified an RI point of similar LR and sensitivity to compare false alarm rate. Then we identified an RI point of similar LR+ for comparison of LR and sensitivity.
RESULTS
A total of 1,794,910 observations during 32,472 patient visits were included; 617 patients died (1.9%). Physiological characteristics for all input variables used by RI or MEWS are shown in Table 2, comparing observations taken within 24 hours of death to all other observations.
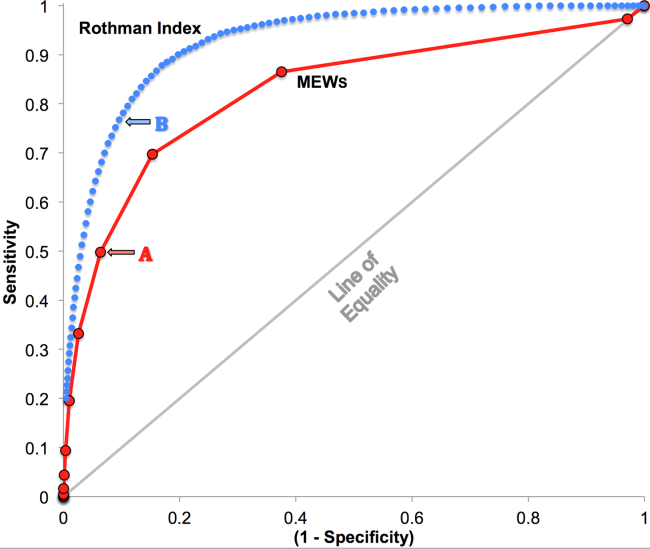
RI versus MEWS demonstrated superior discrimination of 24‐hour mortality (AUC was 0.93 [95% confidence interval {CI}: 0.92‐0.93] vs 0.82 [95% CI: 0.82‐0.83]; difference, 0.11 [95% CI: 0.10‐0.11]; P0.0001). ROC curves for RI and MEWS are shown in Figure 1; the MEWS is subsumed by RI across the entire range. Further, paired comparisons at points of clinical importance are presented in Table 3 for LR+, LR, sensitivity, specificity, PPV, and NPV. In the first pair of columns, MEWS=4 (typical trigger point for alarms) is matched to RI using sensitivity or LR; the corresponding point is RI=16, which generates twice the LR+ and reduces false alarms by 53%. In the second pair of columns, MEWS=4 is matched to RI using PPV or LR+; the corresponding point is RI=30, which captures 54% more of those patients who will die within 24 hours.
| Cut Points | MEWS=4 | RI=16a | MEWS=4 | RI=30b |
|---|---|---|---|---|
| ||||
| Likelihood ratio, positive | 7.8 | 16.9 | 7.8c | 7.9c |
| Likelihood ratio, negative | 0.54c | 0.53c | 0.54 | 0.26 |
| Sensitivity | 49.8% | 48.9% | 49.8% | 76.8% |
| Specificity | 93.6% | 97.1% | 93.6% | 90.4% |
| Positive predictive value | 5.2% | 10.6% | 5.2% | 5.3% |
| Negative predictive value | 99.6% | 99.6% | 99.6% | 99.8% |
DISCUSSION
We have shown that a general acuity metric (RI) computed using data routinely entered into an EMR outperforms MEWS in identifying hospitalized patients likely to die within 24 hours. At similar sensitivity, RI yields an LR+ more than 2‐fold greater, at a value often considered conclusive. MEWS is derived using 4 vital signs and a neurologic assessment. Such a focus on vital signs may limit responsiveness to changes in acuity, especially during early clinical deterioration. Indeed, threshold breach tools may inadvertently induce a false sense of an individual patient's condition and safety.[12] The present findings suggest the performance of RI over MEWS may be due to inclusion of nursing assessments, laboratory test results, and heart rhythm. Relative contributions of each category are: vital signs (35%), nursing assessments (34%), and laboratory test results (31%). We found in previous work that failed nursing assessments strongly correlate with mortality,[13] as illustrated in Table 2 by sharp differences between patients dying within 24 hours and those who did not.
Sensitivity to detect early deterioration, especially when not evidenced by compromised vital signs, is crucial for acuity vigilance and preemptive interventions. Others[14] have demonstrated that our approach to longitudinal modeling of the acuity continuum is well positioned to investigate clinical pathophysiology preceding adverse events and to identify actionable trends in patients at high risk of complications and sepsis after colorectal operations. Future research may reveal both clinical and administrative advantages to having this real‐time acuity measure available for all patients during the entire hospital visit, with efficacy in applications beyond use as a trigger for EWS alarms.
Study limitations include retrospective design, single‐center cohort, no exclusion of expected hospital deaths, and EMR requirement. For MEWS, the Glasgow Coma Scale was mapped to A/V/P/U, which does not appear to affect results, as our c‐statistic is identical to the literature.[4] Any hospital with an EMR collects the data necessary for computation of RI values. The RI algorithms are available in software compatible with systems from numerous EMR manufacturers (eg, Epic, Cerner, McKesson, Siemens, AllScripts, Phillips).
The advent of the EMR in hospitals marries well with an EWS that leverages from additional data more information than is contained in vital signs, permitting complex numeric computations of acuity scores, a process simply not possible with paper systems. Further, the automatic recalculation of the score reduces the burden on clinicians, and broadens potential use over a wide range, from minute‐by‐minute recalculations when attached to sensors in the ICU, to comparative metrics of hospital performance, to nonclinical financial resource applications. This new information technology is guiding methods to achieve a significant performance increment over current EWS and may assist earlier detection of deterioration, providing a chance to avoid medical crises.[15]
Acknowledgements
The authors express their appreciation to Abington Memorial Hospital. Particular thanks are extended to Steven I. Rothman, MSEM, for extensive discussions and technical support. The authors thank Alan Solinger, PhD, for his assistance in reviewing the manuscript.
Disclosures: One author (RAS) declares no conflict of interest. Two authors (GDF, MJR) are employees and shareholders in PeraHealth, Inc. of Charlotte, North Carolina, a health information technology company that offers products utilizing the Rothman Index. All of the original research defining the Rothman Index was performed prior to the formation of the company and is now published in peer‐reviewed journals. The index is freely available to all qualified researchers and is currently installed at several major medical research centers and hospital systems. This present work is under the auspices and partly funded by an independent foundation, F.A.R. Institute of Sarasota, Florida. Early research defining the Rothman Index was funded by grants from Sarasota Memorial Healthcare Foundation and the Goldsmith Fund of Greenfield Foundation. Continuing research has been funded by the F.A.R. Institute.
- , , , . Validation of a modified Early Warning Score in medical admissions. QJM Mon J Assoc Physicians. 2001;94:521–526.
- , , . Monitoring vital signs using early warning scoring systems: a review of the literature. J Nurs Manag. 2011;19:311–330.
- , , , et al. A clinical deterioration prediction tool for internal medicine patients. Am J Med Qual. 2013;28:135–142.
- , , , . ViEWS—towards a national early warning score for detecting adult inpatient deterioration. Resuscitation. 2010;81:932–937.
- , , , , , . Early detection of impending physiologic deterioration among patients who are not in intensive care: development of predictive models using data from an automated electronic medical record. J Hosp Med. 2012;7:388–395.
- , , , et al. Predicting out of intensive care unit cardiopulmonary arrest or death using electronic medical record data. BMC Med Inform Decis Mak. 2013;13:28.
- , , , The Braden Scale for predicting pressure sore risk. Nurs Res. 1987;36:205–210.
- , , . Development and validation of a continuous measure of patient condition using the electronic medical record. J Biomed Inform. 2013;46:837–848.
- , , , , . Identifying patients at increased risk for unplanned readmission. Med Care. 2013;51:761–766.
- , , . Comparison of consciousness level assessment in the poisoned patient using the alert/verbal/painful/unresponsive scale and the Glasgow Coma Scale. Ann Emerg Med. 2004;44:108–113.
- , . Experimental Design. New York, NY: John Wiley 1950.
- , . Patterns of unexpected in‐hospital deaths: a root cause analysis. Patient Saf Surg. 2011;5:3.
- , , , . Clinical implications and validity of nursing assessments: a longitudinal measure of patient condition from analysis of the Electronic Medical Record. BMJ Open. 2012;2(4):pii: e000646.
- , , , . Automated analysis of electronic medical record data reflects the pathophysiology of operative complications. Surgery. 2013;154:918–926.
- , , Not getting better means getting worse—trends in Early Warning Scores suggest that there might only be a short time span to rescue those threatening to fall off a “physiological” cliff? Resuscitation. 2013;84:409–410.
Bedside calculation of early warning system (EWS) scores is standard practice in many hospitals to predict clinical deterioration. These systems were designed for periodic hand‐scoring, typically using a half‐dozen variables dominated by vital signs. Most derive from the Modified Early Warning Score (MEWS).[1, 2] Despite years of modification, EWSs have had only modest impact on outcomes.[3, 4] Major improvement is possible only by adding more information than is contained in vital signs. Thus, the next generation of EWSs must analyze electronic medical records (EMRs). Analysis would be performed by computer, displayed automatically, and updated whenever new data are entered into the EMR. Such systems could deliver timely, accurate, longitudinally trended acuity information that could aid in earlier detection of declining patient condition as well as improving sensitivity and specificity of EWS alarms.
Advancing this endeavor along with others,[5, 6] we previously published a patient acuity metric, the Rothman Index (RI), which automatically updates when asynchronous vital signs, laboratory test results, Braden Scale,[7] cardiac rhythm, and nursing assessments are entered into the EMR.[8] Our goal was to enable clinicians to visualize changes in acuity by simple line graphs personalized to each patient at any point in time across the trajectory of care. In our model validation studies,[8] we made no attempt to identify generalizable thresholds, though others[9] have defined decision cut points for RI in a nonemergent context. To examine decision support feasibility in an emergent context, and to compare RI with a general EWS standard, we compare the accuracy of the RI with the MEWS in predicting hospital death within 24 hours.
METHODS
Site Description and Ethics
The institutional review board of Abington Memorial Hospital (Abington, PA) approved collection of retrospective data obtained from their 665‐bed, regional referral center and teaching hospital. Handling of patient information complied with the Health Insurance Portability and Accountability Act of 1996 regulations.
Patient Inclusion
The analysis included all patients, aged 18 years or older, admitted from July 2009 through June 2010, when there were sufficient data in the EMR to compute the RI. Obstetric and psychiatric patients were excluded because nursing documentation is insufficient in this dataset.
Data Collection/Data Sources
Clinical variables were extracted from the EMR (AllScripts Sunrise Clinical Manager, Chicago, IL) by SQL query and placed into a database. RI[8] and MEWS[1] were computed according to published methods. Table 1 shows definitions of standards for each nursing assessment,[8] and Table 2 identifies all clinical variables employed for each system. Briefly, RI utilizes 26 variables related to clinical care and routinely available in the EMR. These include vital signs, laboratory results, cardiac rhythms, and nursing assessments. Excess risk associated with any value of a variable is defined as percent absolute increase in 1‐year mortality relative to minimum 1‐year mortality identified for that variable. Excess risk is summed on a linear scale to reflect cumulative risk for individual patients at any given time. RI was computed at every new observation during a patient visit, when input values were available. Laboratory results are included when measured, but after 24 hours their weighting is reduced by 50%, and after 48 hours they are excluded. Data input intervals were a function of institutional patient care protocols and physician orders. All observations during a patient's stay were included in the analysis, per the method of Prytherch et al.[4] Because data did not contain the simplified alert/voice/pain/unresponsive (A/V/P/U) score, computation of MEWS used appropriate mapping of the Glasgow Coma Scale.[10] A corresponding MEWS was calculated for each RI. The relationship between RI and MEWS is inverse. RI ranges from 91 to 100, with lower scores indicating increasing acuity. MEWS ranges from 0 to 14, with higher scores indicating increasing acuity.
| |
| Cardiac | Pulse regular, rate 60100 bpm, skin warm and dry. Blood pressure 140/90 and no symptoms of hypotension. |
| Food/nutrition | No difficulty with chewing, swallowing, or manual dexterity. Patient consuming >50% of daily diet ordered as observed or stated. |
| Gastrointestinal | Abdomen soft and nontender. Bowel sounds present. No nausea or vomiting. Continent. Bowel pattern normal as observed or stated. |
| Genitourinary | Voids without difficulty. Continent. Urine clear, yellow to amber as observed or stated. Urinary catheter patent if present. |
| Musculoskeletal | Independently able to move all extremities and perform functional activities as observed or stated (includes assistive devices). |
| Neurological | Alert and oriented to person, place, time, situation. Speech is coherent. |
| Peripheral‐vascular | Extremities are normal or pink and warm. Peripheral pulses palpable. Capillary refill 3 seconds. No edema, numbness or tingling. |
| Psychosocial | Behavior appropriate to situation. Expressed concerns and fears being addressed. Adequate support system. |
| Respiratory | Respiration 1224/minute at rest, quiet and regular. Bilateral breath sounds clear. Nail beds and mucous membranes pink. Sputum clear, if present. |
| Safety/fall risk | Safety/fall risk factors not present. Not a risk to self or others. |
| Skin/tissue | Skin clean, dry, and intact with no reddened areas. Patient is alert, cooperative and able to reposition self independently. Braden Scale >15. |
| Input Variable | A: Alive in 24 Hours, Mean (SD) | B: Dead Within 24 Hours, Mean (SD) | P Value |
|---|---|---|---|
| |||
| Diastolic blood pressure, mm Hg | 66.8 (13.5) | 56.6 (16.8) | 0.0001 |
| Systolic blood pressure, mm Hga | 127.3 (23.8) | 105.2 (29.4) | 0.0001 |
| Temperature, Fa | 98.2 (1.1) | 98.2 (2.0) | 0.1165 |
| Respiration, breaths per minutea | 20.1 (4.7) | 23.6 (9.1) | 0.0001 |
| Heart rate, bpma | 81.1 (16.5) | 96.9 (22.2) | 0.0001 |
| Pulse oximetry, % O2 saturation | 96.3 (3.3) | 93.8 (10.1) | 0.0001 |
| Creatinine, mg/dL | 1.2 (1.2) | 1.8 (1.5) | 0.0001 |
| Blood urea nitrogen, mg/dL | 23.9 (17.9) | 42.1 (26.4) | 0.0001 |
| Serum chloride, mmol/L | 104.3 (5.4) | 106.9 (9.7) | 0.0001 |
| Serum potassium, mmol/L | 4.2 (0.5) | 4.4 (0.8) | 0.0001 |
| Serum sodium, mmol/L | 139.0 (4.1) | 140.7 (8.5) | 0.0001 |
| Hemoglobin, gm/dL | 11.2 (2.1) | 10.6 (2.1) | 0.0001 |
| White blood cell count, 103 cell/L | 9.9 (6.3) | 15.0 (10.9) | 0.0001 |
| Braden Scale, total points | 17.7 (3.4) | 12.2 (3.1) | 0.0001 |
| NURSING ASSESSMENTS | A: Alive in 24 Hours and Failed Standard | B: Dead Within 24 Hours and Failed Standard | P Value |
| Neurological | 38.7% | 91.4% | 0.0001 |
| Genitourinary | 46.6% | 90.0% | 0.0001 |
| Respiratory | 55.6% | 89.0% | 0.0001 |
| Peripheral vascular | 54.1% | 86.9% | 0.0001 |
| Food | 28.3% | 80.6% | 0.0001 |
| Skin | 56.3% | 75.0% | 0.0001 |
| Gastrointestinal | 49.3% | 75.0% | 0.0001 |
| Musculoskeletal | 50.3% | 72.4% | 0.0001 |
| Cardiac | 30.4% | 59.8% | 0.0001 |
| Psychosocial | 24.6% | 40.9% | 0.0001 |
| Safety | 25.5% | 29.0% | 0.0001 |
| A/V/P/U scorea | 96.3/2.1/1.4/0.2% | 88.6/21.6/4.6/5.3% | 0.0001 |
| Sinus rhythm (absent)b | 34.9% | 53.3% | 0.0001 |
Outcome Ascertainment
In‐hospital death was determined by merging the date and time of discharge with clinical inputs from the hospital's EMR. Data points were judged to be within 24 hours of death if the timestamp of the data point collection was within 24 hours of the discharge time with expired as the discharge disposition.
Statistical Methods
Demographics and input variables from the 2 groups of observations, those who were within 24 hours of death and those who were not, were compared using a t test with a Cochran and Cox[11] approximation of the probability level of the approximate t statistic for unequal variances. Mean, standard deviation, and P values are reported. Discrimination of RI and MEWS to predict 24‐hour mortality was estimated using area under the receiver operating characteristic (ROC) curve (AUC), and null hypothesis was tested using 2. Sensitivity, specificity, positive predictive value (PPV), negative predictive value (NPV), positive and negative likelihood ratios (LR+, LR) were computed. Analyses were performed with SAS 9.3 (procedures ttest, freq, logistic, nlmixed; SAS Institute, Cary, NC). Typically MEWS=4 triggers a protocol to increase level of assessment and/or care, often a transfer to the intensive care unit (ICU). We denoted the point on ROC curve where MEWS=4 and identified an RI point of similar LR and sensitivity to compare false alarm rate. Then we identified an RI point of similar LR+ for comparison of LR and sensitivity.
RESULTS
A total of 1,794,910 observations during 32,472 patient visits were included; 617 patients died (1.9%). Physiological characteristics for all input variables used by RI or MEWS are shown in Table 2, comparing observations taken within 24 hours of death to all other observations.
RI versus MEWS demonstrated superior discrimination of 24‐hour mortality (AUC was 0.93 [95% confidence interval {CI}: 0.92‐0.93] vs 0.82 [95% CI: 0.82‐0.83]; difference, 0.11 [95% CI: 0.10‐0.11]; P0.0001). ROC curves for RI and MEWS are shown in Figure 1; the MEWS is subsumed by RI across the entire range. Further, paired comparisons at points of clinical importance are presented in Table 3 for LR+, LR, sensitivity, specificity, PPV, and NPV. In the first pair of columns, MEWS=4 (typical trigger point for alarms) is matched to RI using sensitivity or LR; the corresponding point is RI=16, which generates twice the LR+ and reduces false alarms by 53%. In the second pair of columns, MEWS=4 is matched to RI using PPV or LR+; the corresponding point is RI=30, which captures 54% more of those patients who will die within 24 hours.
| Cut Points | MEWS=4 | RI=16a | MEWS=4 | RI=30b |
|---|---|---|---|---|
| ||||
| Likelihood ratio, positive | 7.8 | 16.9 | 7.8c | 7.9c |
| Likelihood ratio, negative | 0.54c | 0.53c | 0.54 | 0.26 |
| Sensitivity | 49.8% | 48.9% | 49.8% | 76.8% |
| Specificity | 93.6% | 97.1% | 93.6% | 90.4% |
| Positive predictive value | 5.2% | 10.6% | 5.2% | 5.3% |
| Negative predictive value | 99.6% | 99.6% | 99.6% | 99.8% |
DISCUSSION
We have shown that a general acuity metric (RI) computed using data routinely entered into an EMR outperforms MEWS in identifying hospitalized patients likely to die within 24 hours. At similar sensitivity, RI yields an LR+ more than 2‐fold greater, at a value often considered conclusive. MEWS is derived using 4 vital signs and a neurologic assessment. Such a focus on vital signs may limit responsiveness to changes in acuity, especially during early clinical deterioration. Indeed, threshold breach tools may inadvertently induce a false sense of an individual patient's condition and safety.[12] The present findings suggest the performance of RI over MEWS may be due to inclusion of nursing assessments, laboratory test results, and heart rhythm. Relative contributions of each category are: vital signs (35%), nursing assessments (34%), and laboratory test results (31%). We found in previous work that failed nursing assessments strongly correlate with mortality,[13] as illustrated in Table 2 by sharp differences between patients dying within 24 hours and those who did not.
Sensitivity to detect early deterioration, especially when not evidenced by compromised vital signs, is crucial for acuity vigilance and preemptive interventions. Others[14] have demonstrated that our approach to longitudinal modeling of the acuity continuum is well positioned to investigate clinical pathophysiology preceding adverse events and to identify actionable trends in patients at high risk of complications and sepsis after colorectal operations. Future research may reveal both clinical and administrative advantages to having this real‐time acuity measure available for all patients during the entire hospital visit, with efficacy in applications beyond use as a trigger for EWS alarms.
Study limitations include retrospective design, single‐center cohort, no exclusion of expected hospital deaths, and EMR requirement. For MEWS, the Glasgow Coma Scale was mapped to A/V/P/U, which does not appear to affect results, as our c‐statistic is identical to the literature.[4] Any hospital with an EMR collects the data necessary for computation of RI values. The RI algorithms are available in software compatible with systems from numerous EMR manufacturers (eg, Epic, Cerner, McKesson, Siemens, AllScripts, Phillips).
The advent of the EMR in hospitals marries well with an EWS that leverages from additional data more information than is contained in vital signs, permitting complex numeric computations of acuity scores, a process simply not possible with paper systems. Further, the automatic recalculation of the score reduces the burden on clinicians, and broadens potential use over a wide range, from minute‐by‐minute recalculations when attached to sensors in the ICU, to comparative metrics of hospital performance, to nonclinical financial resource applications. This new information technology is guiding methods to achieve a significant performance increment over current EWS and may assist earlier detection of deterioration, providing a chance to avoid medical crises.[15]
Acknowledgements
The authors express their appreciation to Abington Memorial Hospital. Particular thanks are extended to Steven I. Rothman, MSEM, for extensive discussions and technical support. The authors thank Alan Solinger, PhD, for his assistance in reviewing the manuscript.
Disclosures: One author (RAS) declares no conflict of interest. Two authors (GDF, MJR) are employees and shareholders in PeraHealth, Inc. of Charlotte, North Carolina, a health information technology company that offers products utilizing the Rothman Index. All of the original research defining the Rothman Index was performed prior to the formation of the company and is now published in peer‐reviewed journals. The index is freely available to all qualified researchers and is currently installed at several major medical research centers and hospital systems. This present work is under the auspices and partly funded by an independent foundation, F.A.R. Institute of Sarasota, Florida. Early research defining the Rothman Index was funded by grants from Sarasota Memorial Healthcare Foundation and the Goldsmith Fund of Greenfield Foundation. Continuing research has been funded by the F.A.R. Institute.
- , , , . Validation of a modified Early Warning Score in medical admissions. QJM Mon J Assoc Physicians. 2001;94:521–526.
- , , . Monitoring vital signs using early warning scoring systems: a review of the literature. J Nurs Manag. 2011;19:311–330.
- , , , et al. A clinical deterioration prediction tool for internal medicine patients. Am J Med Qual. 2013;28:135–142.
- , , , . ViEWS—towards a national early warning score for detecting adult inpatient deterioration. Resuscitation. 2010;81:932–937.
- , , , , , . Early detection of impending physiologic deterioration among patients who are not in intensive care: development of predictive models using data from an automated electronic medical record. J Hosp Med. 2012;7:388–395.
- , , , et al. Predicting out of intensive care unit cardiopulmonary arrest or death using electronic medical record data. BMC Med Inform Decis Mak. 2013;13:28.
- , , , The Braden Scale for predicting pressure sore risk. Nurs Res. 1987;36:205–210.
- , , . Development and validation of a continuous measure of patient condition using the electronic medical record. J Biomed Inform. 2013;46:837–848.
- , , , , . Identifying patients at increased risk for unplanned readmission. Med Care. 2013;51:761–766.
- , , . Comparison of consciousness level assessment in the poisoned patient using the alert/verbal/painful/unresponsive scale and the Glasgow Coma Scale. Ann Emerg Med. 2004;44:108–113.
- , . Experimental Design. New York, NY: John Wiley 1950.
- , . Patterns of unexpected in‐hospital deaths: a root cause analysis. Patient Saf Surg. 2011;5:3.
- , , , . Clinical implications and validity of nursing assessments: a longitudinal measure of patient condition from analysis of the Electronic Medical Record. BMJ Open. 2012;2(4):pii: e000646.
- , , , . Automated analysis of electronic medical record data reflects the pathophysiology of operative complications. Surgery. 2013;154:918–926.
- , , Not getting better means getting worse—trends in Early Warning Scores suggest that there might only be a short time span to rescue those threatening to fall off a “physiological” cliff? Resuscitation. 2013;84:409–410.
