User login
- Consider adding bedtime NPH insulin to maximal oral therapy—a simple, safe, and well-tolerated regimen that lowers HbA1c on average by 1 percentage point.
- Expect this regimen to fail for about 25% of patients within 1 year.
Objective: To evaluate the effects of insulin 30/70 twice daily or bedtime isophane (NPH) insulin plus continued sulfonylurea and metformin in patients with type 2 diabetes in primary care.
Study Design: Open-label, randomized trial.
Population: Persons younger than 76 years with type 2 diabetes whose disease had not been controlled with oral hypoglycemic agents alone. A total of 64 insulinnaïve patients treated with maximal feasible dosages of sulfonylurea and metformin (baseline glycosylated hemoglobin [HbA1c]=8.5%) were randomly assigned to insulin monotherapy (IM group; n=31) or insulin in addition to unchanged oral hypoglycemic medication (IC group; n=33) for 12 months. Insulin doses were adjusted to obtain fasting glucose <7.0 mmol/L and postprandial glucose <10.0 mmol/L.
Outcomes Measured: Outcome measures included HbA1c, treatment failure, weight, hypoglycemic events and symptoms, satisfaction with treatment, general well-being, and fear of injecting insulin and testing.
Results: HbA1c improved from 8.3% to 7.6% in the IC group, and from 8.8% to 7.6% in the IM group (P=NS). The IC group had 24% treatment failures, compared with 2% in the IM group (P=.09). Patients in the IC group had less weight gain than those in the IM group (1.3 vs 4.2 kg; P=.01), and they reported fewer hypoglycemic events (2.7 vs 4.3; P=.02). Increased satisfaction with treatment was equal in the 2 groups, and general well-being improved by 3.0 points more in the IC group (P=.05). Fear of self-injecting and self-testing did not differ.
Conclusions: Bedtime NPH insulin added to maximal therapy with sulfonylurea and metformin is an effective, simple, well-tolerated approach for patients with uncontrolled type 2 diabetes.
The goal for glycemic control in current guidelines on type 2 diabetes is a glycosylated hemoglobin (HbA1c) value of <7.0%.1 If this target is not achieved or maintained with sulfonylurea and metformin at maximally tolerated dosages, insulin therapy is recommended as the next step for patients without advanced diabetes complications and with a reasonably long life expectancy.2
There is little doubt that exogenous insulin aids in glycemic control at this stage of disease. It is still debated, though, whether insulin should be used as monotherapy or be added to a regimen of 1 or 2 oral agents (combination therapy).3, 4
Guidelines on type 2 diabetes conflict with one another about indications for treatment and preferred regimens, and most recommendations are based on less-than-sufficient evidence.1 For example, it is unclear in the case of combination therapy whether sulfonylurea or metformin or both should be continued. Moreover, the Dutch guideline on type 2 diabetes recommends that in combination therapy, the dose of isophane (neutral protamine Hagedorn or NPH) insulin be taken to a maximum of 40 IU, after which one should switch to a regimen of twice-daily insulin only. This recommendation is not based on published evidence.5
A number of randomized controlled trials have investigated the efficacy of different insulin regimens in patients whose diabetes was not controlled with oral agents. Few studies, though, have included patients using both sulfonylurea and metformin.6 In addition, studies that have measured treatment satisfaction, general wellbeing, fear of injections, and hypoglycemic complaints are sparse. Although we know from observational studies that insulin therapy is usually well accepted,7,8 little is known as to what extent patient satisfaction and quality of life are influenced by either treatment schemes.
The purpose of this study was to compare insulin monotherapy with insulin combination therapy in patients whose diabetes was inadequately controlled (HbA1c ≥7.0%) despite maximally tolerated dosages of sulfonylurea and metformin. Endpoints included glycemic control, insulin dosage, body weight, number of treatment failures, number of hypoglycemic events and symptoms, treatment satisfaction, general well-being, and fear of injections and self testing.
Methods
Design
This was an open-label, parallel group trial of 12 months duration. Patients were randomly assigned to receive NPH insulin at bedtime (Insulatard; Novo Nordisk, Copenhagen, Denmark) in addition to current treatment with sulfonylurea and metformin (insulin combination [IC] group) or to receive a mixture of 30% soluble and 70% NPH insulin (Mixtard 30/70; Novo Nordisk, Copenhagen, Denmark), twice daily before breakfast and dinner (insulin monotherapy [IM] group). Randomization was performed by a telephone call to an independent trial center that used a computer-generated random assignment.
The medical ethics committee of the University Medical Centre of Utrecht approved the study. All patients gave written informed consent.
Patients
Patients were recruited from family practices in and around the city of Utrecht, the Netherlands. Patients were asked to participate if they were younger than 76 years, had HbA1c ≥7.0% despite treatment with both sulfonylurea and metformin in maximally tolerated dosages, were willing to start insulin therapy, and were deemed by their family physician to be candidates for more tight glycemic control.
Exclusion criteria were severe comorbidity (ie, an illness that surpasses the impact of diabetes or was associated with a short life expectancy) and insufficient understanding of spoken Dutch to follow instructions. The final study population was 64 patients.
Study protocol
After randomization, patients were referred to the diabetes nurse of their family practice to receive usual education for patients starting on insulin therapy. This included information on diabetes (eg, symptoms of hypoglycemia) and dietary counseling as well as instructions on how to inject insulin and how to monitor blood glucose levels before breakfast, after meals, and before bedtime twice weekly.
Patients were also instructed to register any symptomatic hypoglycemic event, along with accompanying measurement of the blood glucose value if possible, and to report whether assistance from a third party was required. Blood glucose values and hypoglycemic events were to be recorded in a personal diabetes diary.
Insulin therapy was initiated with 8 IU before bedtime in the IC group, and with 12 and 6 IU before breakfast and dinner in the IM group, respectively. Insulin dosages were adjusted twice weekly by telephone contact with the diabetes nurse (adjusting phase), aiming for a target fasting blood glucose of 4.0–7.0 mmol/L and a target postprandial glucose of 4.0–10.0 mmol/L. When these targets were achieved and had proved stable, the insulin dose was fixed and telephone contacts were decreased to once monthly (stable phase).
Treatment failure was declared for patients in the IC group if glucose targets were not reached with a maximum daily dose of 40 IU NPH insulin. In the IM group, no ceiling was set for the insulin dose, but treatment was declared a failure when patients were switched to other treatment regimens due to unsatisfactory diurnal blood glucose profiles. Practice visits with the diabetes nurse or the family physician (according to local policy) were scheduled for 3, 6, 9, and 12 months after start of treatment.
Outcome measures
HbA1c —measured by turbidimetric inhibition immunoassay (Hitachi 917; Roche Diagnostics, Basel, Switzerland; normal range 4%–6%)—and body weight were documented at randomization and at 3, 6, 9, and 12 months.
Frequency and severity of hypoglycemic events were monitored during telephone contacts and by checking patients’ diaries. At 3 and 12 months, patients completed a hypoglycemic symptoms checklist—including 18 autonomic, neuroglycopenic, and malaise symptoms—the severity of which was scored on a 7-point scale, ranging from 0 (not at all) to 6 (very intense), providing a potential range of 0 to 108.
Treatment satisfaction was measured at baseline and at 3 and 12 months, using the Dutch version of the Diabetes Treatment Satisfaction Questionnaire (DTSQ).9 The DTSQ is a validated self-report questionnaire; it consists of 8 questions, 6 of which refer to satisfaction with treatment. The answers were scored on a 0-to-6 Likert scale and added to produce a measure of satisfaction with diabetes treatment, providing a potential range of 0 (very dissatisfied) to 36 (very satisfied).
Well-being was measured at baseline and at 3 and 12 months with the Dutch version of the 12-item Well-Being Questionnaire (WBQ-12).10 The WBQ-12 consists of 12 assertions about the patients’ feelings, and is divided into 3 subscales from which a General Well-Being score is calculated, providing a potential range of 0 (low) to 36 (high).
Fear of self-injecting with insulin (FSI) and fear of self-testing for blood glucose levels (FST) was assessed at 3 and 12 months by the short version of the Diabetes Fear of Injecting and Self-Testing Questionnaire (D-FISQ), which has proved useful for research in insulin-treated diabetes patients.11 This self-report questionnaire consists of a 6-item subscale for FSI, and a 9-item subscale for FST. The items were scored on a 4-point Likert scale, ranging from 0 (almost never) to 3 (almost always), referring to the past month.
Statistical methods
The primary outcome of the study was the difference in HbA1c between the interventions. To detect a difference of at least 0.8%, 32 patients were needed in each group (standard deviation [SD]=1.1, α=0.05, power=80%). Data were expressed as means ± SD unless indicated otherwise. Analyses were based on intention to treat, and missing data were fitted by the last-observation-carried-forward principle. Last available measurements were used for patients reaching a study end point before 12 months of follow-up. Outcome measurements were compared between the 2 intervention groups by either analyses of covariance (ANCOVA) adjusting for baseline values,12 unpaired t tests, or Mann-Whitney U test. The probability of treatment success was analyzed using Kaplan-Meier plots with the log-rank test. P<.05 was considered statistically significant. Data analyses were performed with SPSS release 11 (SPSS Inc, Chicago, Ill, USA).
Results
In total, 69 patients were randomized, 5 of whom did not initiate the intervention. Baseline characteristics of included patients are summarized in Table 1. Except for weight and body mass index, no significant differences were found between the groups.
TABLE 1
Characteristics at baseline (n=64)
| IC | IM | |
|---|---|---|
| Number of patients | 33 | 31 |
| Age, years | 58.6 (8.6) | 58.3 (11.3) |
| Sex, % male/female | 54 / 46 | 42 / 58 |
| Duration of diabetes, years | 7.2 (3.9) | 7.7 (4.8) |
| Body weight, kg | 96.3 (19.4) | 81.0 (14.3) |
| Body mass index, kg/m2 | 33.2 (6.4) | 28.5 (3.8)* |
| HbA1c,% | 8.3 (0.9) | 8.8 (1.5) |
| Satisfaction with treatment | 28.0 (8.2) | 26.1 (8.1) |
| General well-being | 21.7 (8.1) | 22.7 (6.9) |
| Results are means (SD), numbers, or percentages; * P<.01. IC, insulin combination therapy; IM, insulin monotherapy. | ||
Glycemic control and insulin dosage
In both groups, HbA1c improved, mainly during the first months (Figure 1). In the IC group, mean decrease was 0.8 ± 1.3%, vs 1.2 ± 1.2 in the IM group. Adjusted for baseline values, HbA1c for IM fell by 0.14% more than for IC (95% confidential interval [CI], –0.72 to 0.44; P=NS). In the IC group, 36% of the patients reached HbA1c levels <7.0%, compared with 42% in the IM group (P = NS).
When treatment failures (see below) were omitted, mean decrease of Hb A1c for IC was 1.0 ± 1.2% (Figure 2). Mean daily insulin dosages at endpoint were 25.8 ± 12.2 IU for IC vs 68.3 ± 27.5 for IM. Mean daily dosages adjusted for body weight were 0.27 ± 0.13 IU/kg for IC vs 0.86 ± 0.37 for IM.
FIGURE 1
Course of HbA1c values (SD)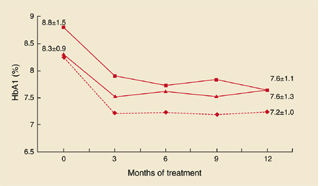
HbA1c values and standard deviations during the study. Squares: IM group; triangles: IC group; diamonds: IC group without treatment failures.
FIGURE 2
Combination vs monotherapy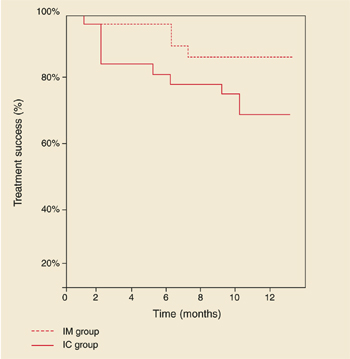
Kaplan-Meier curves showing treatment success of insulin combination therapy (IC) and insulin monotherapy (IM).
Treatment failures
In the IC group, 8 patients (24%) experienced a treatment failure because glucose targets were not reached with a daily dose of 40 IU NPH insulin. The mean time for reaching this study endpoint was 4.6 months (range, 1–10). HbA1c deteriorated in this period from 8.5 ± 1.3 % to 8.6 ± 1.5%.
Age, sex, duration of diabetes, and baseline values for HbA1c, body mass index, treatment satisfaction, and general well-being of these patients did not significantly differ from those who completed the study on IC therapy (data not shown). Mean daily insulin dosages at endpoint, adjusted for body weight, were 0.41 ± 0.13 IU/kg for treatment failures vs 0.23 ± 0.11 for non-treatment failures (95 % CI, 0.10 to 0.28; P<.001). In the IM group, 2 patients (6%) were switched to another insulin regimen due to unsatisfactory diurnal glucose profiles. Figure 2 shows the Kaplan-Meier curves of probability of treatment success. Log-rank test showed a borderline significant difference between the groups (P=.09).
Weight gain
In the IC group, body weight increased with 1.3 ± 3.9 kg, compared with 4.2 ± 4.3 kg in the IM group. Adjusted for baseline values, body weight in the IM group increased by 3.0 kg more than in the IC group (95% CI, 0.68 to 5.25; P=.01).
Hypoglycemic events and symptoms
The average number of hypoglycemic events per patient was 2.7 ± 5.2 in the IC group, and 4.3 ± 4.3 for the IM group (P=.02). For events accompanied by documented blood glucose values <4.0 mmol/L, the results were 2.4 ± 5.2 and 2.7 ± 3.5, respectively (P=.1). All events were mild, expect for 1 patient in the IM group who experienced 2 severe events (unconsciousness and support needed from a third party). At 3 and 12 months, hypoglycemic symptoms scores were 17.2 ± 13.3 and 16.3 ± 16.0 for IC, vs 19.1 ± 15.6 and 22.4 ± 15.7 for IM (P=NS).
Diabetes treatment satisfaction and general well-being
Satisfaction with treatment improved in the IC group from 28.0 ± 8.2 to 30.9 ± 5.1, and in the IM group from 26.1 ± 8.1 to 28.4 ± 7.4. Adjusted for baseline values, the difference between the mean change scores was not significant (95% CI, –5.0 to 1.0; P=NS). Well-being scores increased from 21.7 ± 8.1 to 25.1 ± 6.8 in the IC group, vs 22.7 ± 6.9 to 22.8 ± 7.6 in the IM group. Adjusted for baseline scores, wellbeing for IC improved by 3.0 points more than for IM (95 % CI, 0.02 to 5.8; P=.05).
Fear of self-injecting and self-testing
At 3 and 12 months, FSI scores were 0.6 ± 1.3 and 0.5 ± 1.1 in the IC group, vs 2.1 ± 4.1 and 1.0 ± 2.1 in the IM group. For FST, these scores were 0.6 ± 1.9 and 2.3 ± 4.8 in the IC group, and 2.5 ± 4.4 and 1.7 ± 3.6 in the IM group. At neither 3 nor 12 months were statistical differences found between the groups. Approximately 70% of the patients in both groups had scores of 0 (no fear at all) on both subscales.
Discussion
In this practice-based study of insulin-naïve patients, HbA1c improved ~1 percentage point with both insulin combination therapy and insulin monotherapy. However, with both strategies, around 40% of patients reached HbA1c levels <7%, which forces us to be realistic regarding the glycemic target that can be achieved in the current family practice setting. Despite systematic titration of the insulin dosage, 24% of the patients in the IC group did not reach the titration targets. In addition, HbA1c levels for those patients did not change from baseline, in contrast with patients in the IC group who did reach the targets (Figure 1). So it is doubtful if lower HbA1c levels could have been achieved if the study design had allowed for increasing the daily insulin dose over 40 IU.
Treatment failure rate in this study was considerably lower compared with 66% failures reported in another trial in which insulin NPH or glargine was added to oral therapy.13 However, this difference could probably be explained by a difference in target for fasting blood glucose: ≤5.6 mmol/L vs ≤7.0 in our study. So it might be relevant in future research to seek factors that could predict failure on oral agent/insulin combinations.14
With insulin monotherapy, body weight increased significantly, and patients experienced more hypoglycemic events. Treatment satisfaction did not differ, whereas general well-being improved more with combination therapy. For most patients, the injection- and test-activities appeared to be well tolerated, with no differences between treatment groups.
Though several trials have been conducted to compare insulin combination therapies with insulin monotherapy in insulin-naïve patients,6,15-17 studies with follow-up >6 months, and including patients taking maximum dosages of two oral agents, are sparse. Moreover, no studies have been conducted in a primary care setting. Chow et al compared a regimen of bedtime NPH insulin and 1 or 2 oral agents with a regimen of premixed insulin 30/70 in 53 mostly lean patients during 6 months.18 The effects on HbA1c, body weight, and number of hypoglycemic events were comparable to our results, and a similar treatment failure rate in the combination group was found.
Yki-Järvinen et al studied the effects of 4 insulin regimens including the addition of bedtime NPH insulin to either morning NPH, glyburide, metformin, or glyburide plus metformin in patients previously treated with maximal dosage sulfonylurea.19 The greatest decrease in HbA1c accompanied by the lowest number of hypoglycemic events was observed in the insulin/metformin group.
However, the impact of these results might be limited, since current guidelines recommend treatment with maximum doses of both sulfonylurea and metformin before introducing insulin therapy.2,8 Nevertheless, the results underline the favorable influence on relevant outcomes of insulin combination therapy compared with insulin monotherapy, provided that at least metformin is used.
Patients in our study were recruited during regular appointments with their own care provider, and insulin treatment was established under “usual care” conditions. So it is likely that this study group represents the type 2 diabetes patients in primary care that, sooner or later, should start insulin therapy, and that the results of this study are highly applicable to them.
Our results suggest that an evening injection with NPH insulin in addition to an existing maximal therapy with sulfonylurea and metformin can be recommended as an effective, simple, and well-tolerated first-choice approach with patients who are willing to continue oral medication. Since both family physicians and patients are inclined to delay starting insulin,20 such a strategy might encourage the timely use of insulin.14
Acknowledgments
We thank Rianne Maillé for her expert contribution concerning the questionnaires. In particular we would like to thank the patients, diabetes nurses, and family physicians for their participation.
Corresponding author
Alex N. Goudswaard, Koperslagersgilde 5, 3994 CH Houten, Netherlands. E-mail: [email protected].
1. Burgers JS, Bailey JV, Klazinga NS, Van der Bij AK, Grol R, Feder G. Inside guidelines: comparative analysis of recommendations and evidence in diabetes guidelines from 13 countries. Diabetes Care 2002;25:1933-1939.
2. American Diabetes Association. Standards of medical care for patients with diabetes mellitus. Diabetes Care 2002;25:S33-S49.
3. Garber AJ. Benefits of combination therapy of insulin and oral hypoglycemic agents. Arch Intern Med 2003;163:1781-1782.
4. Westphal SA, Palumbo PJ. Insulin and oral hypoglycemic agents should not be used in combination in the treatment of type 2 diabetes. Arch Intern Med 2003;163:1783-1785.
5. Rutten GEHM, Verhoeven S, Heine RJ, et al. Diabetes mellitus type 2. NHG-standaard (eerste herziening) (in Dutch). Huisarts Wet 1999;42:67-84.
6. Yki-Järvinen H. Combination therapies with insulin in type 2 diabetes. Diabetes Care 2001;24:758-767.
7. De Sonnaville JJ, Snoek FJ, Colly LP, Deville W, Wijkel D, Heine RJ. Well-being and symptoms in relation to insulin therapy in type 2 diabetes. Diabetes Care 1998;21:919-924.
8. De Grauw WJ, Van de Lisdonk EH, Van Gerwen WH, Van Den Hoogen HJ, Van Weel C. Insulin therapy in poorly controlled type 2 diabetic patients: does it affect quality of life? Br J Gen Pract 2001;51:527-532.
9. Bradley C. Handbook of Psychology and Diabetes. A Guide to Psychological Measurement in Diabetes Research and Practice. Amsterdam: Harwood Academic Publishers; 1994.
10. Pouwer F, Snoek FJ, Van der Ploeg HM, Ader HJ, Heine RJ. The well-being questionnaire: evidence for a three-factor structure with 12 items (W-BQ12). Psychol Med 2000;30:455-462.
11. Mollema ED, Snoek FJ, Pouwer F, Heine RJ, Van der Ploeg HM. Diabetes Fear of Injecting and Self-Testing Questionnaire: a psychometric evaluation. Diabetes Care 2000;23:765-769.
12. Vickers AJ, Altman DG. Statistics notes: Analysing controlled trials with baseline and follow up measurements. BMJ 2001;323:1123-1124.
13. Riddle MC, Rosenstock J, Gerich JL. The treat-to-target trial. Diabetes Care 2003;26:3080-086.
14. Riddle MC. Timely addition of insulin to oral therapy for type 2 diabetes. Diabetes Care 2002;25:395-396.
15. Peters AL, Davidson MB. Insulin plus a sulfonylurea agent for treating type 2 diabetes. Ann Intern Med 1991;115:45-53.
16. Pugh JA, Wagner ML, Sawyer J, Ramirez G, Tuley M, Friedberg SJ. Is combination sulfonylurea and insulin therapy useful in NIDDM patients? A meta-analysis. Diabetes Care 1992;15:953-959.
17. Johnson JL, Wolf SL, Kabadi UM. Efficacy of insulin and sulfonylurea combination therapy in type II diabetes. A meta-analysis of the randomized placebo-controlled trials. Arch Intern Med 1996;156:259-264.
18. Chow CC, Tsang LW, Sorensen JP, Cockram CS. Comparison of insulin with or without continuation of oral hypoglycemic agents in the treatment of secondary failure in NIDDM patients. Diabetes Care 1995;18:307-314.
19. Yki-Jarvinen H, Ryysy L, Nikkila K, Tulokas T, Vanamo R, Heikkila M. Comparison of bedtime insulin regimens in patients with type 2 diabetes mellitus. A randomized, controlled trial. Ann Intern Med 1999;130:389-396.
20. Veltmaat LJ, Miedema K, Reenders K. Overschakeling op insuline bij NIADM-patiënten. Een literatuurstudie naar criteria, voorkomen en belemmerende factoren (in Dutch). Huisarts Wet 1995;38:608-613.
- Consider adding bedtime NPH insulin to maximal oral therapy—a simple, safe, and well-tolerated regimen that lowers HbA1c on average by 1 percentage point.
- Expect this regimen to fail for about 25% of patients within 1 year.
Objective: To evaluate the effects of insulin 30/70 twice daily or bedtime isophane (NPH) insulin plus continued sulfonylurea and metformin in patients with type 2 diabetes in primary care.
Study Design: Open-label, randomized trial.
Population: Persons younger than 76 years with type 2 diabetes whose disease had not been controlled with oral hypoglycemic agents alone. A total of 64 insulinnaïve patients treated with maximal feasible dosages of sulfonylurea and metformin (baseline glycosylated hemoglobin [HbA1c]=8.5%) were randomly assigned to insulin monotherapy (IM group; n=31) or insulin in addition to unchanged oral hypoglycemic medication (IC group; n=33) for 12 months. Insulin doses were adjusted to obtain fasting glucose <7.0 mmol/L and postprandial glucose <10.0 mmol/L.
Outcomes Measured: Outcome measures included HbA1c, treatment failure, weight, hypoglycemic events and symptoms, satisfaction with treatment, general well-being, and fear of injecting insulin and testing.
Results: HbA1c improved from 8.3% to 7.6% in the IC group, and from 8.8% to 7.6% in the IM group (P=NS). The IC group had 24% treatment failures, compared with 2% in the IM group (P=.09). Patients in the IC group had less weight gain than those in the IM group (1.3 vs 4.2 kg; P=.01), and they reported fewer hypoglycemic events (2.7 vs 4.3; P=.02). Increased satisfaction with treatment was equal in the 2 groups, and general well-being improved by 3.0 points more in the IC group (P=.05). Fear of self-injecting and self-testing did not differ.
Conclusions: Bedtime NPH insulin added to maximal therapy with sulfonylurea and metformin is an effective, simple, well-tolerated approach for patients with uncontrolled type 2 diabetes.
The goal for glycemic control in current guidelines on type 2 diabetes is a glycosylated hemoglobin (HbA1c) value of <7.0%.1 If this target is not achieved or maintained with sulfonylurea and metformin at maximally tolerated dosages, insulin therapy is recommended as the next step for patients without advanced diabetes complications and with a reasonably long life expectancy.2
There is little doubt that exogenous insulin aids in glycemic control at this stage of disease. It is still debated, though, whether insulin should be used as monotherapy or be added to a regimen of 1 or 2 oral agents (combination therapy).3, 4
Guidelines on type 2 diabetes conflict with one another about indications for treatment and preferred regimens, and most recommendations are based on less-than-sufficient evidence.1 For example, it is unclear in the case of combination therapy whether sulfonylurea or metformin or both should be continued. Moreover, the Dutch guideline on type 2 diabetes recommends that in combination therapy, the dose of isophane (neutral protamine Hagedorn or NPH) insulin be taken to a maximum of 40 IU, after which one should switch to a regimen of twice-daily insulin only. This recommendation is not based on published evidence.5
A number of randomized controlled trials have investigated the efficacy of different insulin regimens in patients whose diabetes was not controlled with oral agents. Few studies, though, have included patients using both sulfonylurea and metformin.6 In addition, studies that have measured treatment satisfaction, general wellbeing, fear of injections, and hypoglycemic complaints are sparse. Although we know from observational studies that insulin therapy is usually well accepted,7,8 little is known as to what extent patient satisfaction and quality of life are influenced by either treatment schemes.
The purpose of this study was to compare insulin monotherapy with insulin combination therapy in patients whose diabetes was inadequately controlled (HbA1c ≥7.0%) despite maximally tolerated dosages of sulfonylurea and metformin. Endpoints included glycemic control, insulin dosage, body weight, number of treatment failures, number of hypoglycemic events and symptoms, treatment satisfaction, general well-being, and fear of injections and self testing.
Methods
Design
This was an open-label, parallel group trial of 12 months duration. Patients were randomly assigned to receive NPH insulin at bedtime (Insulatard; Novo Nordisk, Copenhagen, Denmark) in addition to current treatment with sulfonylurea and metformin (insulin combination [IC] group) or to receive a mixture of 30% soluble and 70% NPH insulin (Mixtard 30/70; Novo Nordisk, Copenhagen, Denmark), twice daily before breakfast and dinner (insulin monotherapy [IM] group). Randomization was performed by a telephone call to an independent trial center that used a computer-generated random assignment.
The medical ethics committee of the University Medical Centre of Utrecht approved the study. All patients gave written informed consent.
Patients
Patients were recruited from family practices in and around the city of Utrecht, the Netherlands. Patients were asked to participate if they were younger than 76 years, had HbA1c ≥7.0% despite treatment with both sulfonylurea and metformin in maximally tolerated dosages, were willing to start insulin therapy, and were deemed by their family physician to be candidates for more tight glycemic control.
Exclusion criteria were severe comorbidity (ie, an illness that surpasses the impact of diabetes or was associated with a short life expectancy) and insufficient understanding of spoken Dutch to follow instructions. The final study population was 64 patients.
Study protocol
After randomization, patients were referred to the diabetes nurse of their family practice to receive usual education for patients starting on insulin therapy. This included information on diabetes (eg, symptoms of hypoglycemia) and dietary counseling as well as instructions on how to inject insulin and how to monitor blood glucose levels before breakfast, after meals, and before bedtime twice weekly.
Patients were also instructed to register any symptomatic hypoglycemic event, along with accompanying measurement of the blood glucose value if possible, and to report whether assistance from a third party was required. Blood glucose values and hypoglycemic events were to be recorded in a personal diabetes diary.
Insulin therapy was initiated with 8 IU before bedtime in the IC group, and with 12 and 6 IU before breakfast and dinner in the IM group, respectively. Insulin dosages were adjusted twice weekly by telephone contact with the diabetes nurse (adjusting phase), aiming for a target fasting blood glucose of 4.0–7.0 mmol/L and a target postprandial glucose of 4.0–10.0 mmol/L. When these targets were achieved and had proved stable, the insulin dose was fixed and telephone contacts were decreased to once monthly (stable phase).
Treatment failure was declared for patients in the IC group if glucose targets were not reached with a maximum daily dose of 40 IU NPH insulin. In the IM group, no ceiling was set for the insulin dose, but treatment was declared a failure when patients were switched to other treatment regimens due to unsatisfactory diurnal blood glucose profiles. Practice visits with the diabetes nurse or the family physician (according to local policy) were scheduled for 3, 6, 9, and 12 months after start of treatment.
Outcome measures
HbA1c —measured by turbidimetric inhibition immunoassay (Hitachi 917; Roche Diagnostics, Basel, Switzerland; normal range 4%–6%)—and body weight were documented at randomization and at 3, 6, 9, and 12 months.
Frequency and severity of hypoglycemic events were monitored during telephone contacts and by checking patients’ diaries. At 3 and 12 months, patients completed a hypoglycemic symptoms checklist—including 18 autonomic, neuroglycopenic, and malaise symptoms—the severity of which was scored on a 7-point scale, ranging from 0 (not at all) to 6 (very intense), providing a potential range of 0 to 108.
Treatment satisfaction was measured at baseline and at 3 and 12 months, using the Dutch version of the Diabetes Treatment Satisfaction Questionnaire (DTSQ).9 The DTSQ is a validated self-report questionnaire; it consists of 8 questions, 6 of which refer to satisfaction with treatment. The answers were scored on a 0-to-6 Likert scale and added to produce a measure of satisfaction with diabetes treatment, providing a potential range of 0 (very dissatisfied) to 36 (very satisfied).
Well-being was measured at baseline and at 3 and 12 months with the Dutch version of the 12-item Well-Being Questionnaire (WBQ-12).10 The WBQ-12 consists of 12 assertions about the patients’ feelings, and is divided into 3 subscales from which a General Well-Being score is calculated, providing a potential range of 0 (low) to 36 (high).
Fear of self-injecting with insulin (FSI) and fear of self-testing for blood glucose levels (FST) was assessed at 3 and 12 months by the short version of the Diabetes Fear of Injecting and Self-Testing Questionnaire (D-FISQ), which has proved useful for research in insulin-treated diabetes patients.11 This self-report questionnaire consists of a 6-item subscale for FSI, and a 9-item subscale for FST. The items were scored on a 4-point Likert scale, ranging from 0 (almost never) to 3 (almost always), referring to the past month.
Statistical methods
The primary outcome of the study was the difference in HbA1c between the interventions. To detect a difference of at least 0.8%, 32 patients were needed in each group (standard deviation [SD]=1.1, α=0.05, power=80%). Data were expressed as means ± SD unless indicated otherwise. Analyses were based on intention to treat, and missing data were fitted by the last-observation-carried-forward principle. Last available measurements were used for patients reaching a study end point before 12 months of follow-up. Outcome measurements were compared between the 2 intervention groups by either analyses of covariance (ANCOVA) adjusting for baseline values,12 unpaired t tests, or Mann-Whitney U test. The probability of treatment success was analyzed using Kaplan-Meier plots with the log-rank test. P<.05 was considered statistically significant. Data analyses were performed with SPSS release 11 (SPSS Inc, Chicago, Ill, USA).
Results
In total, 69 patients were randomized, 5 of whom did not initiate the intervention. Baseline characteristics of included patients are summarized in Table 1. Except for weight and body mass index, no significant differences were found between the groups.
TABLE 1
Characteristics at baseline (n=64)
| IC | IM | |
|---|---|---|
| Number of patients | 33 | 31 |
| Age, years | 58.6 (8.6) | 58.3 (11.3) |
| Sex, % male/female | 54 / 46 | 42 / 58 |
| Duration of diabetes, years | 7.2 (3.9) | 7.7 (4.8) |
| Body weight, kg | 96.3 (19.4) | 81.0 (14.3) |
| Body mass index, kg/m2 | 33.2 (6.4) | 28.5 (3.8)* |
| HbA1c,% | 8.3 (0.9) | 8.8 (1.5) |
| Satisfaction with treatment | 28.0 (8.2) | 26.1 (8.1) |
| General well-being | 21.7 (8.1) | 22.7 (6.9) |
| Results are means (SD), numbers, or percentages; * P<.01. IC, insulin combination therapy; IM, insulin monotherapy. | ||
Glycemic control and insulin dosage
In both groups, HbA1c improved, mainly during the first months (Figure 1). In the IC group, mean decrease was 0.8 ± 1.3%, vs 1.2 ± 1.2 in the IM group. Adjusted for baseline values, HbA1c for IM fell by 0.14% more than for IC (95% confidential interval [CI], –0.72 to 0.44; P=NS). In the IC group, 36% of the patients reached HbA1c levels <7.0%, compared with 42% in the IM group (P = NS).
When treatment failures (see below) were omitted, mean decrease of Hb A1c for IC was 1.0 ± 1.2% (Figure 2). Mean daily insulin dosages at endpoint were 25.8 ± 12.2 IU for IC vs 68.3 ± 27.5 for IM. Mean daily dosages adjusted for body weight were 0.27 ± 0.13 IU/kg for IC vs 0.86 ± 0.37 for IM.
FIGURE 1
Course of HbA1c values (SD)
HbA1c values and standard deviations during the study. Squares: IM group; triangles: IC group; diamonds: IC group without treatment failures.
FIGURE 2
Combination vs monotherapy
Kaplan-Meier curves showing treatment success of insulin combination therapy (IC) and insulin monotherapy (IM).
Treatment failures
In the IC group, 8 patients (24%) experienced a treatment failure because glucose targets were not reached with a daily dose of 40 IU NPH insulin. The mean time for reaching this study endpoint was 4.6 months (range, 1–10). HbA1c deteriorated in this period from 8.5 ± 1.3 % to 8.6 ± 1.5%.
Age, sex, duration of diabetes, and baseline values for HbA1c, body mass index, treatment satisfaction, and general well-being of these patients did not significantly differ from those who completed the study on IC therapy (data not shown). Mean daily insulin dosages at endpoint, adjusted for body weight, were 0.41 ± 0.13 IU/kg for treatment failures vs 0.23 ± 0.11 for non-treatment failures (95 % CI, 0.10 to 0.28; P<.001). In the IM group, 2 patients (6%) were switched to another insulin regimen due to unsatisfactory diurnal glucose profiles. Figure 2 shows the Kaplan-Meier curves of probability of treatment success. Log-rank test showed a borderline significant difference between the groups (P=.09).
Weight gain
In the IC group, body weight increased with 1.3 ± 3.9 kg, compared with 4.2 ± 4.3 kg in the IM group. Adjusted for baseline values, body weight in the IM group increased by 3.0 kg more than in the IC group (95% CI, 0.68 to 5.25; P=.01).
Hypoglycemic events and symptoms
The average number of hypoglycemic events per patient was 2.7 ± 5.2 in the IC group, and 4.3 ± 4.3 for the IM group (P=.02). For events accompanied by documented blood glucose values <4.0 mmol/L, the results were 2.4 ± 5.2 and 2.7 ± 3.5, respectively (P=.1). All events were mild, expect for 1 patient in the IM group who experienced 2 severe events (unconsciousness and support needed from a third party). At 3 and 12 months, hypoglycemic symptoms scores were 17.2 ± 13.3 and 16.3 ± 16.0 for IC, vs 19.1 ± 15.6 and 22.4 ± 15.7 for IM (P=NS).
Diabetes treatment satisfaction and general well-being
Satisfaction with treatment improved in the IC group from 28.0 ± 8.2 to 30.9 ± 5.1, and in the IM group from 26.1 ± 8.1 to 28.4 ± 7.4. Adjusted for baseline values, the difference between the mean change scores was not significant (95% CI, –5.0 to 1.0; P=NS). Well-being scores increased from 21.7 ± 8.1 to 25.1 ± 6.8 in the IC group, vs 22.7 ± 6.9 to 22.8 ± 7.6 in the IM group. Adjusted for baseline scores, wellbeing for IC improved by 3.0 points more than for IM (95 % CI, 0.02 to 5.8; P=.05).
Fear of self-injecting and self-testing
At 3 and 12 months, FSI scores were 0.6 ± 1.3 and 0.5 ± 1.1 in the IC group, vs 2.1 ± 4.1 and 1.0 ± 2.1 in the IM group. For FST, these scores were 0.6 ± 1.9 and 2.3 ± 4.8 in the IC group, and 2.5 ± 4.4 and 1.7 ± 3.6 in the IM group. At neither 3 nor 12 months were statistical differences found between the groups. Approximately 70% of the patients in both groups had scores of 0 (no fear at all) on both subscales.
Discussion
In this practice-based study of insulin-naïve patients, HbA1c improved ~1 percentage point with both insulin combination therapy and insulin monotherapy. However, with both strategies, around 40% of patients reached HbA1c levels <7%, which forces us to be realistic regarding the glycemic target that can be achieved in the current family practice setting. Despite systematic titration of the insulin dosage, 24% of the patients in the IC group did not reach the titration targets. In addition, HbA1c levels for those patients did not change from baseline, in contrast with patients in the IC group who did reach the targets (Figure 1). So it is doubtful if lower HbA1c levels could have been achieved if the study design had allowed for increasing the daily insulin dose over 40 IU.
Treatment failure rate in this study was considerably lower compared with 66% failures reported in another trial in which insulin NPH or glargine was added to oral therapy.13 However, this difference could probably be explained by a difference in target for fasting blood glucose: ≤5.6 mmol/L vs ≤7.0 in our study. So it might be relevant in future research to seek factors that could predict failure on oral agent/insulin combinations.14
With insulin monotherapy, body weight increased significantly, and patients experienced more hypoglycemic events. Treatment satisfaction did not differ, whereas general well-being improved more with combination therapy. For most patients, the injection- and test-activities appeared to be well tolerated, with no differences between treatment groups.
Though several trials have been conducted to compare insulin combination therapies with insulin monotherapy in insulin-naïve patients,6,15-17 studies with follow-up >6 months, and including patients taking maximum dosages of two oral agents, are sparse. Moreover, no studies have been conducted in a primary care setting. Chow et al compared a regimen of bedtime NPH insulin and 1 or 2 oral agents with a regimen of premixed insulin 30/70 in 53 mostly lean patients during 6 months.18 The effects on HbA1c, body weight, and number of hypoglycemic events were comparable to our results, and a similar treatment failure rate in the combination group was found.
Yki-Järvinen et al studied the effects of 4 insulin regimens including the addition of bedtime NPH insulin to either morning NPH, glyburide, metformin, or glyburide plus metformin in patients previously treated with maximal dosage sulfonylurea.19 The greatest decrease in HbA1c accompanied by the lowest number of hypoglycemic events was observed in the insulin/metformin group.
However, the impact of these results might be limited, since current guidelines recommend treatment with maximum doses of both sulfonylurea and metformin before introducing insulin therapy.2,8 Nevertheless, the results underline the favorable influence on relevant outcomes of insulin combination therapy compared with insulin monotherapy, provided that at least metformin is used.
Patients in our study were recruited during regular appointments with their own care provider, and insulin treatment was established under “usual care” conditions. So it is likely that this study group represents the type 2 diabetes patients in primary care that, sooner or later, should start insulin therapy, and that the results of this study are highly applicable to them.
Our results suggest that an evening injection with NPH insulin in addition to an existing maximal therapy with sulfonylurea and metformin can be recommended as an effective, simple, and well-tolerated first-choice approach with patients who are willing to continue oral medication. Since both family physicians and patients are inclined to delay starting insulin,20 such a strategy might encourage the timely use of insulin.14
Acknowledgments
We thank Rianne Maillé for her expert contribution concerning the questionnaires. In particular we would like to thank the patients, diabetes nurses, and family physicians for their participation.
Corresponding author
Alex N. Goudswaard, Koperslagersgilde 5, 3994 CH Houten, Netherlands. E-mail: [email protected].
1. Burgers JS, Bailey JV, Klazinga NS, Van der Bij AK, Grol R, Feder G. Inside guidelines: comparative analysis of recommendations and evidence in diabetes guidelines from 13 countries. Diabetes Care 2002;25:1933-1939.
2. American Diabetes Association. Standards of medical care for patients with diabetes mellitus. Diabetes Care 2002;25:S33-S49.
3. Garber AJ. Benefits of combination therapy of insulin and oral hypoglycemic agents. Arch Intern Med 2003;163:1781-1782.
4. Westphal SA, Palumbo PJ. Insulin and oral hypoglycemic agents should not be used in combination in the treatment of type 2 diabetes. Arch Intern Med 2003;163:1783-1785.
5. Rutten GEHM, Verhoeven S, Heine RJ, et al. Diabetes mellitus type 2. NHG-standaard (eerste herziening) (in Dutch). Huisarts Wet 1999;42:67-84.
6. Yki-Järvinen H. Combination therapies with insulin in type 2 diabetes. Diabetes Care 2001;24:758-767.
7. De Sonnaville JJ, Snoek FJ, Colly LP, Deville W, Wijkel D, Heine RJ. Well-being and symptoms in relation to insulin therapy in type 2 diabetes. Diabetes Care 1998;21:919-924.
8. De Grauw WJ, Van de Lisdonk EH, Van Gerwen WH, Van Den Hoogen HJ, Van Weel C. Insulin therapy in poorly controlled type 2 diabetic patients: does it affect quality of life? Br J Gen Pract 2001;51:527-532.
9. Bradley C. Handbook of Psychology and Diabetes. A Guide to Psychological Measurement in Diabetes Research and Practice. Amsterdam: Harwood Academic Publishers; 1994.
10. Pouwer F, Snoek FJ, Van der Ploeg HM, Ader HJ, Heine RJ. The well-being questionnaire: evidence for a three-factor structure with 12 items (W-BQ12). Psychol Med 2000;30:455-462.
11. Mollema ED, Snoek FJ, Pouwer F, Heine RJ, Van der Ploeg HM. Diabetes Fear of Injecting and Self-Testing Questionnaire: a psychometric evaluation. Diabetes Care 2000;23:765-769.
12. Vickers AJ, Altman DG. Statistics notes: Analysing controlled trials with baseline and follow up measurements. BMJ 2001;323:1123-1124.
13. Riddle MC, Rosenstock J, Gerich JL. The treat-to-target trial. Diabetes Care 2003;26:3080-086.
14. Riddle MC. Timely addition of insulin to oral therapy for type 2 diabetes. Diabetes Care 2002;25:395-396.
15. Peters AL, Davidson MB. Insulin plus a sulfonylurea agent for treating type 2 diabetes. Ann Intern Med 1991;115:45-53.
16. Pugh JA, Wagner ML, Sawyer J, Ramirez G, Tuley M, Friedberg SJ. Is combination sulfonylurea and insulin therapy useful in NIDDM patients? A meta-analysis. Diabetes Care 1992;15:953-959.
17. Johnson JL, Wolf SL, Kabadi UM. Efficacy of insulin and sulfonylurea combination therapy in type II diabetes. A meta-analysis of the randomized placebo-controlled trials. Arch Intern Med 1996;156:259-264.
18. Chow CC, Tsang LW, Sorensen JP, Cockram CS. Comparison of insulin with or without continuation of oral hypoglycemic agents in the treatment of secondary failure in NIDDM patients. Diabetes Care 1995;18:307-314.
19. Yki-Jarvinen H, Ryysy L, Nikkila K, Tulokas T, Vanamo R, Heikkila M. Comparison of bedtime insulin regimens in patients with type 2 diabetes mellitus. A randomized, controlled trial. Ann Intern Med 1999;130:389-396.
20. Veltmaat LJ, Miedema K, Reenders K. Overschakeling op insuline bij NIADM-patiënten. Een literatuurstudie naar criteria, voorkomen en belemmerende factoren (in Dutch). Huisarts Wet 1995;38:608-613.