User login
Bringing you the latest news, research and reviews, exclusive interviews, podcasts, quizzes, and more.
Powered by CHEST Physician, Clinician Reviews, MDedge Family Medicine, Internal Medicine News, and The Journal of Clinical Outcomes Management.
Socioeconomic status, race found to impact CPAP compliance
SAN DIEGO –
“CPAP is the gold standard treatment for OSA [obstructive sleep apnea] and is very effective, especially for those with severe disease,” researchers led by Philip S. LoSavio, MD, wrote in an abstract presented at the Triological Society’s Combined Sections Meeting. “However, CPAP is a significant challenge for patients for various reasons, with reports of only 46%-80% of OSA patients using CPAP for more than 4 consecutive hours on two out of three nights.”
In an effort to identify and define different factors associated with CPAP compliance, Dr. LoSavio and his colleagues collected data on 578 patients with OSA on CPAP who were treated at Rush University Medical Center, Chicago. The mean patient age was 58 years, 52% were female, 43% were African American, 40% were white, their mean body mass index was 36.91 kg/m2, and their mean apnea-hypopnea index was 37.25 events per hour. The researchers recorded CPAP use at office visits via CPAP module or card, and patients were considered CPAP compliant if their machines logged 4 consecutive hours of use for 70% or more of nights. During the office visits, patients completed a questionnaire asking if they were suffering from different otolaryngology-related diseases, including sinus headaches, gastroesophageal reflex, and enlarged tonsils. Dr. LoSavio, who heads the section of sleep surgery in the department of otorhinolaryngology at Rush University Medical Center, and his colleagues performed logistic regression to ascertain the effects of race and socioeconomic status on CPAP compliance while adjusting for OSA severity. They also analyzed the adjusted association of median income and self-reported symptoms of sinus headaches, GERD, and enlarged tonsils, on CPAP compliance.
They found that African American patients were less compliant with CPAP, compared with their white counterparts (OR 0.42; P less than .01). In addition, patients with mild OSA were less likely to be compliant compared with those who had severe disease (OR 0.57; P less than .03). Self-reported symptoms of sinus headaches, GERD, and enlarged tonsils were associated with significantly lower levels of compliance, while higher median income was positively associated with higher levels of compliance. When the researchers grouped incomes based on the 2018 federal tax classification brackets, they observed a significant association between compliance and median income (P less than .001), with a likelihood ratio of 20.4.
“Previous studies have shown that with increases in OSA disease severity, defined by higher [apnea-hypopnea index], comes increases in CPAP compliance, while other studies have alluded to the fact that lower socioeconomic status can affect CPAP compliance,” Dr. LoSavio and his associates wrote in their abstract. “A novel aspect of our study hoped to shed light on different otolaryngology-related diseases and how they might affect compliance. The patients with comorbid GERD, sinus headaches, and enlarged tonsils were less CPAP compliant in our study. These conditions are relatively easily treated and could therefore provide an avenue to increase CPAP compliance if addressed.” They acknowledged certain limitations of the study, including its single-center design and the self-reported nature of the patient questionnaire.
The researchers reported having no financial disclosures. The meeting was jointly sponsored by the Triological Society and the American College of Surgeons.
SOURCE: LoSavio P et al. Triological CSM 2019, Abstracts.
REPORTING FROM THE TRIOLOGICAL CSM
Key clinical point: Compliance with continuous positive airway pressure is affected by patient socioeconomic status and race.
Major finding: African American patients were less compliant with CPAP, compared with their white counterparts (OR 0.42; P less than .01).
Study details: A retrospective study of 578 obstructive sleep apnea patients on CPAP.
Disclosures: The researchers reported having no financial disclosures.
Source: LoSavio P et al. Triological CSM 2019, Abstracts.
Asthma, obesity, and the risk for severe sleep apnea in children
CORONADO, CALIF. –

“We have a good idea that obesity and asthma independently increase the risk of OSA, but a lot of the time in the pediatric population, these risk factors are found comorbid,” Ajay Narayanan at the Triological Society’s Combined Sections Meeting. “For this study we asked, how does the presence of asthma change the likelihood of having severe OSA in a cohort of obese patients? Knowing that both asthma and obesity independently increase the risk for OSA, we hypothesized that when they were comorbid, asthma would have a synergistic effect with obesity, causing severe OSA.”
Mr. Narayanan, a third-year student at the University of Texas Southwestern Medical Center, Dallas, and his colleagues performed a retrospective chart review of 367 children aged 9-17 years referred for a full-night polysomnography (PSG) for suspicion of having OSA. Demographic variables recorded included race, body mass index, rhinitis, gastroesophageal reflux disease, and tonsillar hypertrophy. Sleep variables recorded included apnea hypopnea index (AHI), sleep efficiency, rapid eye movement, and the peripheral capillary oxygen saturation (SpO2) nadir. The primary outcome was severe OSA defined as an AHI of 10 or greater on the PSG. They used logistic modeling to determine the association between asthma, obesity, and severe OSA.
The mean age of the study population was 14 years, 56% were male, and 43% were Hispanic. Of the 367 patients, 77 were neither obese nor asthmatic, 93 were nonobese but were asthmatic, 102 were obese but were nonasthmatic, and 95 were both obese and asthmatic. PSG results confirmed that obesity was associated with more signs of sleep apnea. For example, the nonobese, nonasthmatic group had a mean AHI of 11 events per hour, while the obese, nonasthmatic group had a mean AHI of 19 events per hour. “We observed a similar trend amongst our asthmatic population,” Mr. Narayanan said. “We observed an increase in the mean AHI amongst our asthmatic kids when we added obesity to the picture. Surprisingly, we found that asthma was associated with having fewer signs of sleep apnea.” Specifically, while the nonobese, nonasthmatic group had a mean AHI of 11 events per hour, those in the nonobese, asthmatic group had a mean of 5.6 events per hour (P = .005). “The finding was similar amongst our obese kids,” he said. “We saw a decrease in the mean AHI of our obese kids when we added asthma to the picture.”
On logistic regression analysis using obesity and asthma as independent variables, the researchers found that obesity increased the risk of severe OSA by 2.4-fold, but asthma decreased the odds of having severe OSA by about half (0.55). On multiple logistic regression controlling for commonly associated factors such as tonsillar hypertrophy, black race, and Hispanic ethnicity, obesity increased the risk of severe OSA by 2.2-fold, while asthma decreased the odds of having severe OSA by about half (0.51).
“In trying to explain this finding, we can turn to how these diseases are treated,” Mr. Narayanan said. “I say this because of the proven association between preexisting asthma and new onset OSA. Some of the reasons for this association include the tendency for airway collapsibility and systemwide inflammation seen in asthma, which then might contribute to the development of OSA. If we treat asthma symptoms early on, it might prevent the progression to sleep apnea down the line.”
Considering how prevalent comorbid asthma and OSA is, he continued, “we need to confirm that it is in fact well-controlled asthma that is associated with lowering the risk of severe OSA. Once we do this, we can ask the question: Can we use asthma pharmacotherapy to treat OSA? Some studies have shown that inhaled corticosteroids and montelukast (Singulair) may be effective treatment options for kids with OSA, but there’s definitely room for more research in this field, [such as determining] which patients would most benefit from this pharmacotherapy.” The researchers reported having no financial disclosures.
SOURCE: Narayanan A et al. Triological CSM, Abstracts.
CORONADO, CALIF. –
“We have a good idea that obesity and asthma independently increase the risk of OSA, but a lot of the time in the pediatric population, these risk factors are found comorbid,” Ajay Narayanan at the Triological Society’s Combined Sections Meeting. “For this study we asked, how does the presence of asthma change the likelihood of having severe OSA in a cohort of obese patients? Knowing that both asthma and obesity independently increase the risk for OSA, we hypothesized that when they were comorbid, asthma would have a synergistic effect with obesity, causing severe OSA.”
Mr. Narayanan, a third-year student at the University of Texas Southwestern Medical Center, Dallas, and his colleagues performed a retrospective chart review of 367 children aged 9-17 years referred for a full-night polysomnography (PSG) for suspicion of having OSA. Demographic variables recorded included race, body mass index, rhinitis, gastroesophageal reflux disease, and tonsillar hypertrophy. Sleep variables recorded included apnea hypopnea index (AHI), sleep efficiency, rapid eye movement, and the peripheral capillary oxygen saturation (SpO2) nadir. The primary outcome was severe OSA defined as an AHI of 10 or greater on the PSG. They used logistic modeling to determine the association between asthma, obesity, and severe OSA.
The mean age of the study population was 14 years, 56% were male, and 43% were Hispanic. Of the 367 patients, 77 were neither obese nor asthmatic, 93 were nonobese but were asthmatic, 102 were obese but were nonasthmatic, and 95 were both obese and asthmatic. PSG results confirmed that obesity was associated with more signs of sleep apnea. For example, the nonobese, nonasthmatic group had a mean AHI of 11 events per hour, while the obese, nonasthmatic group had a mean AHI of 19 events per hour. “We observed a similar trend amongst our asthmatic population,” Mr. Narayanan said. “We observed an increase in the mean AHI amongst our asthmatic kids when we added obesity to the picture. Surprisingly, we found that asthma was associated with having fewer signs of sleep apnea.” Specifically, while the nonobese, nonasthmatic group had a mean AHI of 11 events per hour, those in the nonobese, asthmatic group had a mean of 5.6 events per hour (P = .005). “The finding was similar amongst our obese kids,” he said. “We saw a decrease in the mean AHI of our obese kids when we added asthma to the picture.”
On logistic regression analysis using obesity and asthma as independent variables, the researchers found that obesity increased the risk of severe OSA by 2.4-fold, but asthma decreased the odds of having severe OSA by about half (0.55). On multiple logistic regression controlling for commonly associated factors such as tonsillar hypertrophy, black race, and Hispanic ethnicity, obesity increased the risk of severe OSA by 2.2-fold, while asthma decreased the odds of having severe OSA by about half (0.51).
“In trying to explain this finding, we can turn to how these diseases are treated,” Mr. Narayanan said. “I say this because of the proven association between preexisting asthma and new onset OSA. Some of the reasons for this association include the tendency for airway collapsibility and systemwide inflammation seen in asthma, which then might contribute to the development of OSA. If we treat asthma symptoms early on, it might prevent the progression to sleep apnea down the line.”
Considering how prevalent comorbid asthma and OSA is, he continued, “we need to confirm that it is in fact well-controlled asthma that is associated with lowering the risk of severe OSA. Once we do this, we can ask the question: Can we use asthma pharmacotherapy to treat OSA? Some studies have shown that inhaled corticosteroids and montelukast (Singulair) may be effective treatment options for kids with OSA, but there’s definitely room for more research in this field, [such as determining] which patients would most benefit from this pharmacotherapy.” The researchers reported having no financial disclosures.
SOURCE: Narayanan A et al. Triological CSM, Abstracts.
REPORTING FROM THE TRIOLOGICAL CSM
Key clinical point: In children, having asthma could decrease the risk of having severe obstructive sleep apnea, regardless of their obesity status.
Major finding: On multiple logistic regression, obesity increased the risk of severe OSA by 2.2-fold, while asthma decreased the odds of having severe OSA by about half.
Study details: A retrospective review of 367 children referred for a full-night polysomnography for suspicion of having OSA.
Disclosures: The researchers reported having no financial disclosures.
Source: Narayanan A et al. Triological CSM, Abstracts.
No increase in severe community-acquired pneumonia after PCV13
Despite concern about the rise of nonvaccine serotypes following widespread PCV13 immunization, cases of community-acquired pneumonia (CAP) remain nearly as low as after initial implementation of the vaccine and severe cases have not risen at all.

This was the finding of a prospective time-series analysis study from eight French pediatric emergency departments between June 2009 and May 2017.
The 12,587 children with CAP enrolled in the study between June 2009 and May 2017 were all aged 15 years or younger and came from one of eight French pediatric EDs.
Pediatric pneumonia cases per 1,000 ED visits dropped 44% after PCV13 was implemented, a decrease from 6.3 to 3.5 cases of CAP per 1,000 pediatric visits from June 2011 to May 2014, with a slight but statistically significant increase to 3.8 cases of CAP per 1,000 pediatric visits from June 2014 to May 2017. However, there was no statistically significant increase in cases with pleural effusion, hospitalization, or high inflammatory biomarkers.
“These results contrast with the recent increase in frequency of invasive pneumococcal disease observed in several countries during the same period linked to serotype replacement beyond 5 years after PCV13 implementation,” reported Naïm Ouldali, MD, of the Association Clinique et Thérapeutique Infantile du Val-de-Marne in France, and associates. The report is in JAMA Pediatrics.
“This difference in the trends suggests different consequences of serotype replacement on pneumococcal CAP vs invasive pneumococcal disease,” they wrote. “The recent slight increase in the number of all CAP cases and virus involvement may reflect changes in the epidemiology of other pathogens and/or serotype replacement with less pathogenic serotypes.”
This latter point arose from discovering no dominant serotype during the study period. Of the 11 serotypes not covered by PCV13, none appeared in more than four cases.
“The implementation of PCV13 has led to the quasi-disappearance of the more invasive serotypes and increase in others in nasopharyngeal flora, which greatly reduces the frequency of the more severe forms of CAP, but could also play a role in the slight increase in frequency of the more benign forms,” the authors reported.
Among the study’s limitations was lack of a control group, precluding the ability to attribute findings to any changes in case reporting. And “participating physicians were encouraged to not change their practice, including test use, and no other potential interfering intervention.”
Funding sources for this study included the Pediatric Infectious Diseases Group of the French Pediatrics Society, Association Clinique et Thérapeutique Infantile du Val-de-Marne, the Foundation for Medical Research and a Pfizer Investigator Initiated Research grant.
Dr Ouldali has received grants from GlaxoSmithKline, and many of the authors have financial ties and/or have received non-financial support from AstraZeneca, Biocodex, GlaxoSmithKline, Merck, Novartis, Pfizer and/or Sanofi Pasteur.
SOURCE: Ouldali N et al. JAMA Pediatrics. 2019 Feb 4. doi: 10.1001/jamapediatrics.2018.5273.
Despite concern about the rise of nonvaccine serotypes following widespread PCV13 immunization, cases of community-acquired pneumonia (CAP) remain nearly as low as after initial implementation of the vaccine and severe cases have not risen at all.
This was the finding of a prospective time-series analysis study from eight French pediatric emergency departments between June 2009 and May 2017.
The 12,587 children with CAP enrolled in the study between June 2009 and May 2017 were all aged 15 years or younger and came from one of eight French pediatric EDs.
Pediatric pneumonia cases per 1,000 ED visits dropped 44% after PCV13 was implemented, a decrease from 6.3 to 3.5 cases of CAP per 1,000 pediatric visits from June 2011 to May 2014, with a slight but statistically significant increase to 3.8 cases of CAP per 1,000 pediatric visits from June 2014 to May 2017. However, there was no statistically significant increase in cases with pleural effusion, hospitalization, or high inflammatory biomarkers.
“These results contrast with the recent increase in frequency of invasive pneumococcal disease observed in several countries during the same period linked to serotype replacement beyond 5 years after PCV13 implementation,” reported Naïm Ouldali, MD, of the Association Clinique et Thérapeutique Infantile du Val-de-Marne in France, and associates. The report is in JAMA Pediatrics.
“This difference in the trends suggests different consequences of serotype replacement on pneumococcal CAP vs invasive pneumococcal disease,” they wrote. “The recent slight increase in the number of all CAP cases and virus involvement may reflect changes in the epidemiology of other pathogens and/or serotype replacement with less pathogenic serotypes.”
This latter point arose from discovering no dominant serotype during the study period. Of the 11 serotypes not covered by PCV13, none appeared in more than four cases.
“The implementation of PCV13 has led to the quasi-disappearance of the more invasive serotypes and increase in others in nasopharyngeal flora, which greatly reduces the frequency of the more severe forms of CAP, but could also play a role in the slight increase in frequency of the more benign forms,” the authors reported.
Among the study’s limitations was lack of a control group, precluding the ability to attribute findings to any changes in case reporting. And “participating physicians were encouraged to not change their practice, including test use, and no other potential interfering intervention.”
Funding sources for this study included the Pediatric Infectious Diseases Group of the French Pediatrics Society, Association Clinique et Thérapeutique Infantile du Val-de-Marne, the Foundation for Medical Research and a Pfizer Investigator Initiated Research grant.
Dr Ouldali has received grants from GlaxoSmithKline, and many of the authors have financial ties and/or have received non-financial support from AstraZeneca, Biocodex, GlaxoSmithKline, Merck, Novartis, Pfizer and/or Sanofi Pasteur.
SOURCE: Ouldali N et al. JAMA Pediatrics. 2019 Feb 4. doi: 10.1001/jamapediatrics.2018.5273.
FROM JAMA PEDIATRICS
Key clinical point:
Major finding: Pediatric community-acquired pneumonia cases dropped from 6.3 to 3.5 cases per 1,000 visits from 2010 to 2014 and increased to 3.8 cases per 1,000 visits in May 2017.
Study details: The findings are based on a prospective time series analysis of 12,587 pediatric pneumonia cases (under 15 years old) in eight French emergency departments from June 2009 to May 2017.
Disclosures: Funding sources for this study included the Pediatric Infectious Diseases Group of the French Pediatrics Society, Association Clinique et Thérapeutique Infantile du Val-de-Marne, the Foundation for Medical Research, and a Pfizer Investigator Initiated Research grant. Dr. Ouldali has received grants from GlaxoSmithKline, and many of the authors have financial ties and/or have received nonfinancial support from AstraZeneca, Biocodex, GlaxoSmithKline, Merck, Novartis, Pfizer, and/or Sanofi Pasteur.
Source: Ouldali N et al. JAMA Pediatrics. 2019 Feb 4. doi: 10.1001/jamapediatrics.2018.5273.
FDA approves generic Advair Diskus
The Food and Drug Administration has approved a generic version of the Advair Diskus, a complex device-drug combination containing fluticasone propionate and salmeterol inhalation powder.
The generic device will be available in three strengths: fluticasone propionate 100 mcg/ salmeterol 50 mcg, fluticasone propionate 250 mcg/ salmeterol 50 mcg and fluticasone propionate 500 mcg/ salmeterol 50 mcg, according to the FDA announcement. It will be marketed by Mylan as Wixela Inhub and will launch in late February, according to a statement from Mylan.
Advair Diskus is among the most commonly used treatments for asthma and for chronic obstructive pulmonary disease (COPD), so it’s hoped this approval will increase access to the therapy, FDA officials said in a statement.
This approval is part of the FDA’s “longstanding commitment to advance access to lower cost, high quality generic alternatives,” Janet Woodcock, MD, director of the FDA’s Center for Drug Evaluation and Research, said in a statement. “People living with asthma and COPD know too well the critical importance of having access to the treatment they need to feel better. Today’s approval will bring more competition to the market which will ultimately benefit the patients who rely on this drug.”
Wixela Inhub is indicated for twice-daily treatment of asthma in patients aged 4 years and older who are not adequately controlled by long-term asthma control treatments or whose disease warrants treatment with a combination of inhaled corticosteroids and long-acting beta agonists. It also is indicated for maintenance of COPD and reduction of COPD exacerbations.
AHA report highlights CVD burden, declines in smoking, sleep importance
Almost half of U.S. adults now have some form of cardiovascular disease, according to the latest annual statistical update from the American Heart Association.
The prevalence is driven in part by the recently changed definition of hypertension, from 140/90 to 130/80 mm Hg, said authors of the American Heart Association Heart Disease and Stroke Statistics–2019 Update.
Cardiovascular disease (CVD) deaths are up, though smoking rates continue to decline, and adults are getting more exercise (Circulation. 2019;139. doi: 10.1161/CIR.0000000000000659).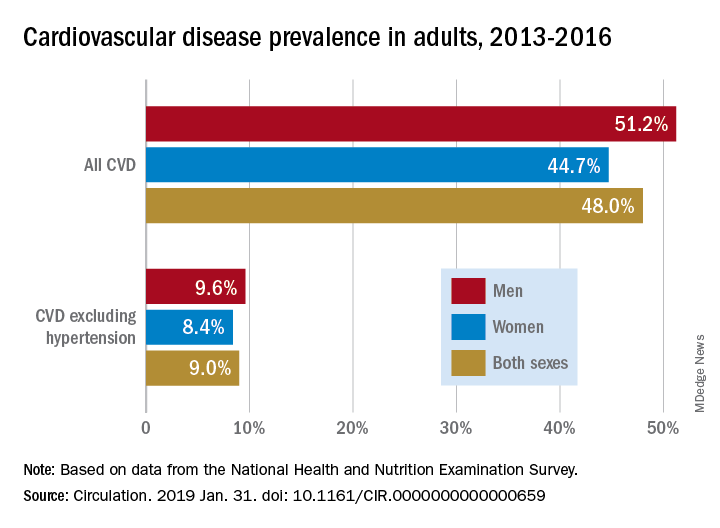
The update includes a new section on sleep and cardiovascular health, an enhanced focus on social determinants of health, and further evidence-based approaches to behavior change, according to the update’s authors, led by chair Emelia J. Benjamin, MD, professor of medicine and epidemiology at Boston University, and vice chair Paul Muntner, PhD, professor of epidemiology at the University of Alabama, Birmingham.
High blood pressure is an “overwhelming presence” that drives heart disease and stroke and can’t be dismissed in the fight against cardiovascular disease, AHA President Ivor J. Benjamin, MD, said in a statement. “Eliminating high blood pressure could have a larger impact on CVD deaths than the elimination of all other risk factors among women, and all except smoking among men.”
Using data from 2013 to 2016, 46% of adults in the United States had hypertension, and in 2016 there were 82,735 deaths attributable primarily to high blood pressure, according to the update.
Total direct costs of hypertension could approach $221 billion by 2035, according to projections in the report.
After decades of decline, U.S. cardiovascular disease deaths increased to 840,678 in 2016, up from 836,546 in 2015, the report says.
Smoking rate declines represent some of the most significant improvements outlined in the report, according to an AHA news release.
Ninety-four percent of adolescents were nonsmokers in the 2015-2016 period, which is up from 76% in 1999-2000, according to the report. The proportion of adult nonsmokers increased to 79% in 2015-2016, up from 73% in 1999-2000.
The new chapter on the importance of sleep cites data from the Centers for Disease Control and Prevention that only 65.2% of Americans have a healthy sleep duration (at least 7 hours), with even lower rates among non-Hispanic blacks, native Hawaiians and Pacific Islanders, and multiracial non-Hispanic individuals.
Short sleep duration is associated with a higher risk of all-cause mortality, total CVD, and coronary heart disease, according to a meta-analysis cited in the report. Long sleep duration, defined as greater than 8 hours, also was associated with higher risk of all-cause mortality, total CVD, coronary heart disease, and stroke.
Members of the statistical update writing group reported disclosures related to the American Heart Association, National Institutes of Health, Amgen, Sanofi, Roche, Abbott, Biogen, Medtronic, and others.
SOURCE: Benjamin EJ et al. Circulation. 2019 Jan 31.
The latest statistics on heart disease and stroke include some metrics that indicate progress, and others that suggest opportunities for improvement.
Tobacco use continues to decline; however, among high school students, e-cigarette use is up to 11.3%, which is concerning.
One bright spot is that the proportion of inactive adults has dropped to 30% in 2016, down from 40% in 2007. Despite that improvement, however, the prevalence of obesity increased significantly over the decade, to the point where nearly 40% of adults are obese and 7.7% are severely obese.

Although 48% of U.S. adults now have cardiovascular disease, according to this latest update, the number drops to just 9% when hypertension is excluded. Even so, 9% represents more than 24.3 million Americans who have coronary artery disease, stroke, or heart failure.
The cost of cardiovascular disease is astronomical, exceeding $351 billion in 2014-1205, with costs projected to increase sharply for older adults over the next few decades.
Starting in 2020, the AHA will begin charting progress in CVD using a metric called health-adjusted life expectancy (HALE), which relies on morbidity and mortality patterns to reflect the number of years a person can expect to live. Patients and the general public may find this metric more understandable than statistics about death rates and cardiovascular risk factors.
Mariell Jessup, MD, is chief science and medical officer for the American Heart Association. Her view on the latest statistical update was derived from a commentary that accompanied the update.
The latest statistics on heart disease and stroke include some metrics that indicate progress, and others that suggest opportunities for improvement.
Tobacco use continues to decline; however, among high school students, e-cigarette use is up to 11.3%, which is concerning.
One bright spot is that the proportion of inactive adults has dropped to 30% in 2016, down from 40% in 2007. Despite that improvement, however, the prevalence of obesity increased significantly over the decade, to the point where nearly 40% of adults are obese and 7.7% are severely obese.
Although 48% of U.S. adults now have cardiovascular disease, according to this latest update, the number drops to just 9% when hypertension is excluded. Even so, 9% represents more than 24.3 million Americans who have coronary artery disease, stroke, or heart failure.
The cost of cardiovascular disease is astronomical, exceeding $351 billion in 2014-1205, with costs projected to increase sharply for older adults over the next few decades.
Starting in 2020, the AHA will begin charting progress in CVD using a metric called health-adjusted life expectancy (HALE), which relies on morbidity and mortality patterns to reflect the number of years a person can expect to live. Patients and the general public may find this metric more understandable than statistics about death rates and cardiovascular risk factors.
Mariell Jessup, MD, is chief science and medical officer for the American Heart Association. Her view on the latest statistical update was derived from a commentary that accompanied the update.
Almost half of U.S. adults now have some form of cardiovascular disease, according to the latest annual statistical update from the American Heart Association.
The prevalence is driven in part by the recently changed definition of hypertension, from 140/90 to 130/80 mm Hg, said authors of the American Heart Association Heart Disease and Stroke Statistics–2019 Update.
Cardiovascular disease (CVD) deaths are up, though smoking rates continue to decline, and adults are getting more exercise (Circulation. 2019;139. doi: 10.1161/CIR.0000000000000659).
The update includes a new section on sleep and cardiovascular health, an enhanced focus on social determinants of health, and further evidence-based approaches to behavior change, according to the update’s authors, led by chair Emelia J. Benjamin, MD, professor of medicine and epidemiology at Boston University, and vice chair Paul Muntner, PhD, professor of epidemiology at the University of Alabama, Birmingham.
High blood pressure is an “overwhelming presence” that drives heart disease and stroke and can’t be dismissed in the fight against cardiovascular disease, AHA President Ivor J. Benjamin, MD, said in a statement. “Eliminating high blood pressure could have a larger impact on CVD deaths than the elimination of all other risk factors among women, and all except smoking among men.”
Using data from 2013 to 2016, 46% of adults in the United States had hypertension, and in 2016 there were 82,735 deaths attributable primarily to high blood pressure, according to the update.
Total direct costs of hypertension could approach $221 billion by 2035, according to projections in the report.
After decades of decline, U.S. cardiovascular disease deaths increased to 840,678 in 2016, up from 836,546 in 2015, the report says.
Smoking rate declines represent some of the most significant improvements outlined in the report, according to an AHA news release.
Ninety-four percent of adolescents were nonsmokers in the 2015-2016 period, which is up from 76% in 1999-2000, according to the report. The proportion of adult nonsmokers increased to 79% in 2015-2016, up from 73% in 1999-2000.
The new chapter on the importance of sleep cites data from the Centers for Disease Control and Prevention that only 65.2% of Americans have a healthy sleep duration (at least 7 hours), with even lower rates among non-Hispanic blacks, native Hawaiians and Pacific Islanders, and multiracial non-Hispanic individuals.
Short sleep duration is associated with a higher risk of all-cause mortality, total CVD, and coronary heart disease, according to a meta-analysis cited in the report. Long sleep duration, defined as greater than 8 hours, also was associated with higher risk of all-cause mortality, total CVD, coronary heart disease, and stroke.
Members of the statistical update writing group reported disclosures related to the American Heart Association, National Institutes of Health, Amgen, Sanofi, Roche, Abbott, Biogen, Medtronic, and others.
SOURCE: Benjamin EJ et al. Circulation. 2019 Jan 31.
FROM CIRCULATION
Flu activity ticks up for second week in a row
Influenza activity increased for a second straight week after a 2-week drop and by one measure has topped the high reached in late December, according to the Centers for Disease Control and Prevention.
For the week ending Jan. 26, 2019, there were 16 states at level 10 on the CDC’s 1-10 scale of influenza-like illness (ILI) activity, compared with 12 states during the week ending Dec. 29. With another seven states at levels 8 and 9, that makes 23 in the high range for the week ending Jan. 26, again putting it above the 19 reported for Dec. 29, the CDC’s influenza division reported Feb. 1.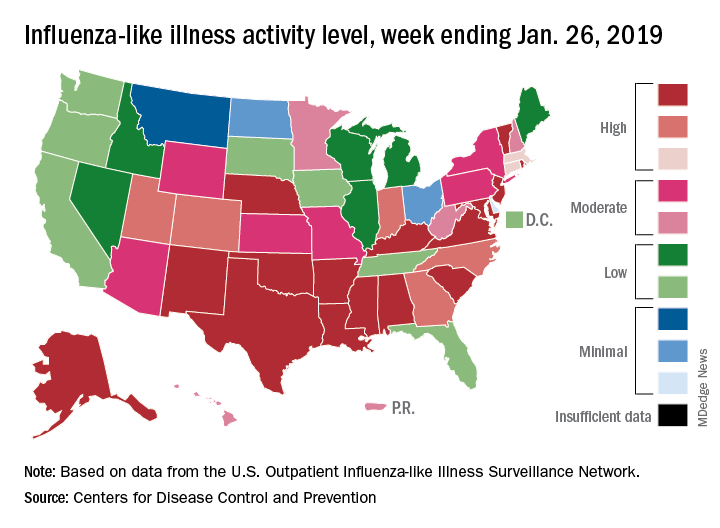
By another measure, however, that December peak in activity remains the seasonal high. The proportion of outpatient visits for ILI that week was 4.0%, compared with the 3.8% reported for Jan. 26. That’s up from 3.3% the week before and 3.1% the week before that, which in turn was the second week of a 2-week decline in activity in early January, CDC data show.
Two flu-related pediatric deaths were reported during the week ending Jan. 26, but both occurred the previous week. For the 2018-2019 flu season so far, a total of 24 pediatric flu deaths have been reported, the CDC said. At the same point in the 2017-2018 flu season, there had been 84 such deaths, according to the CDC’s Influenza-Associated Pediatric Mortality Surveillance System.
There were 143 overall flu-related deaths during the week of Jan. 19, which is the most recent week available. That is down from 189 the week before, but the Jan. 19 reporting is only 75% complete, data from the National Center for Health Statistics show.
Lifetime cost of tobacco use tops $1.9 million per smoker
according to the personal financial website WalletHub.
Economic and societal losses related to 37.8 million U.S. tobacco users – including out-of-pocket spending for cigarettes, health care expenses, and lost income – top $300 billion annually, but those costs vary considerably by state, WalletHub said in a recent report.
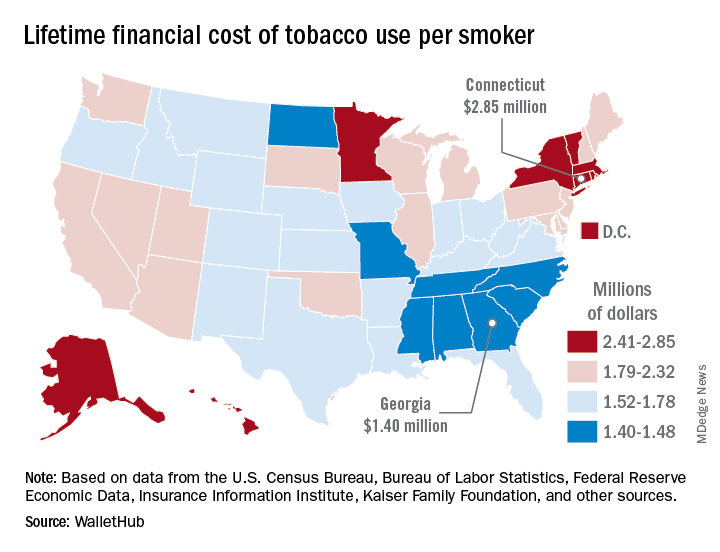
The state with the highest lifetime cost per smoker is Connecticut, with an estimated total of $2.85 million. That works out to just under $56,000 a year for 51 years because lifetime use was defined as one pack a day starting at age 18 years and continuing until age 69 years. New York has the second-highest lifetime cost, which also rounds off to $2.85 million, followed by the District of Columbia ($2.81 million), Massachusetts ($2.76 million), and Rhode Island ($2.68 million), WalletHub said.
Georgia has the lowest lifetime cost of any state – $1.40 million per smoker – followed by Missouri at $1.41 million, North Carolina at $1.42 million, Mississippi at $1.43 million, and South Carolina at $1.44 million, according to the report.
WalletHub’s formula for total lifetime cost has five components: out-of-pocket cost (one pack of cigarettes per day for 51 years), financial opportunity cost (defined as “the amount of return a person would have earned by instead investing that money in the stock market”), health care cost (spending on treatment for smoking-related health complications), income loss (an average 8% decrease caused by absenteeism and lost productivity), and other costs (loss of a homeowner’s insurance credit and costs of secondhand exposure).
The analysis was based on data from the U.S. Census Bureau, Bureau of Labor Statistics, Centers for Disease Control and Prevention, Insurance Information Institute, Campaign for Tobacco-Free Kids, NYsmokefree.com, Federal Reserve Economic Data, Kaiser Family Foundation, and the Independent Insurance Agents & Brokers of America.
according to the personal financial website WalletHub.
Economic and societal losses related to 37.8 million U.S. tobacco users – including out-of-pocket spending for cigarettes, health care expenses, and lost income – top $300 billion annually, but those costs vary considerably by state, WalletHub said in a recent report.
The state with the highest lifetime cost per smoker is Connecticut, with an estimated total of $2.85 million. That works out to just under $56,000 a year for 51 years because lifetime use was defined as one pack a day starting at age 18 years and continuing until age 69 years. New York has the second-highest lifetime cost, which also rounds off to $2.85 million, followed by the District of Columbia ($2.81 million), Massachusetts ($2.76 million), and Rhode Island ($2.68 million), WalletHub said.
Georgia has the lowest lifetime cost of any state – $1.40 million per smoker – followed by Missouri at $1.41 million, North Carolina at $1.42 million, Mississippi at $1.43 million, and South Carolina at $1.44 million, according to the report.
WalletHub’s formula for total lifetime cost has five components: out-of-pocket cost (one pack of cigarettes per day for 51 years), financial opportunity cost (defined as “the amount of return a person would have earned by instead investing that money in the stock market”), health care cost (spending on treatment for smoking-related health complications), income loss (an average 8% decrease caused by absenteeism and lost productivity), and other costs (loss of a homeowner’s insurance credit and costs of secondhand exposure).
The analysis was based on data from the U.S. Census Bureau, Bureau of Labor Statistics, Centers for Disease Control and Prevention, Insurance Information Institute, Campaign for Tobacco-Free Kids, NYsmokefree.com, Federal Reserve Economic Data, Kaiser Family Foundation, and the Independent Insurance Agents & Brokers of America.
Mild OSA spontaneously resolves in about one-third of young children
CORONADO, CALIF. – results from a single-center study showed.

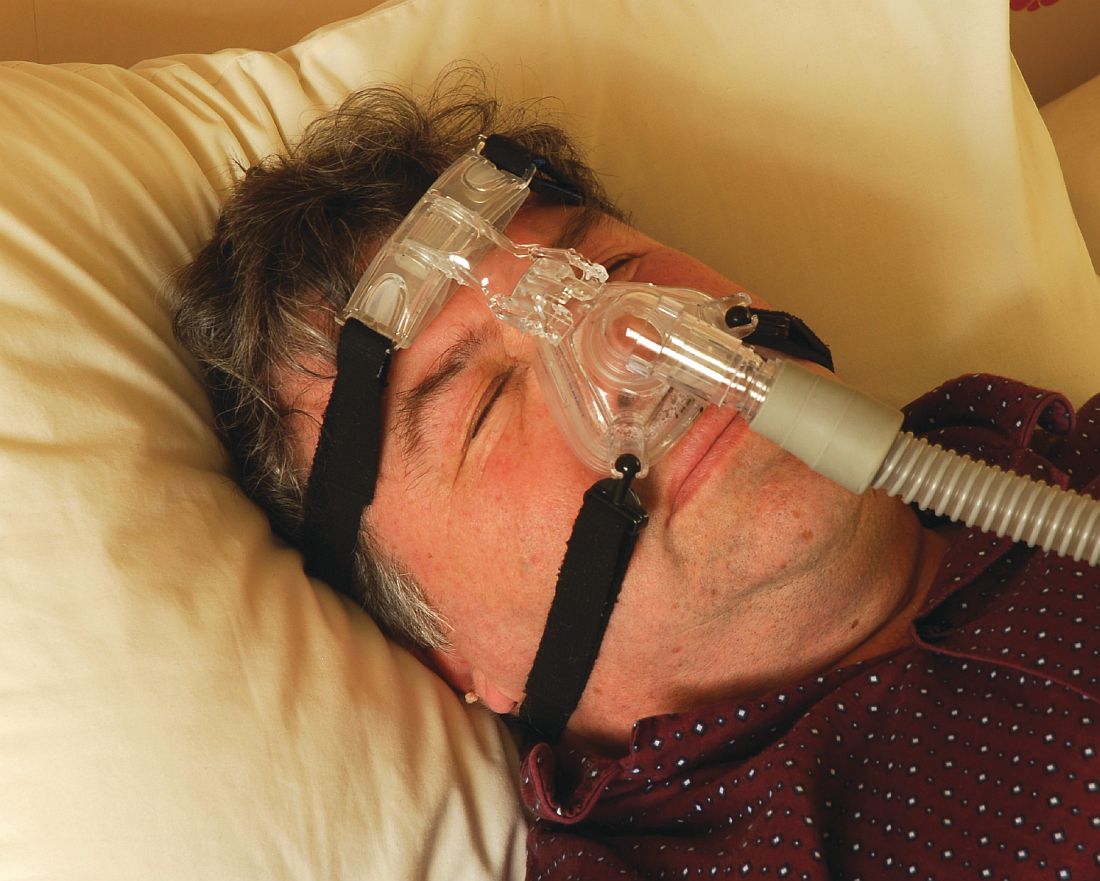
“OSA affects up to 6% of the pediatric population, and diagnosis of young children can be particularly challenging due to the heterogeneity of presenting symptoms,” Douglas C. von Allmen, MD, said at the Triological Society’s Combined Sections Meeting. “While school-age children may present with snoring, that’s less common in the younger population. Up to one-quarter of infants may have noisy breathing, which may mimic obstructive events throughout the first 3 years of life. Additionally, long-term clinical implications of mild sleep apnea in very young children is unclear.”
According to Dr. von Allmen, a fifth-year otolaryngology resident at the University of Cincinnati, management strategies of children with OSA can include a period of observation, particularly when there’s an absence of concerning findings on polysomnography (PSG), such as hypoventilation or significant hypoxia, or when the primary etiology of the OSA is unknown. “Additionally, few studies at this point have attempted to characterize the natural history of mild OSA in pediatric patients under 3 years of age,” he said.
In an effort to assess the effects of observation on the PSG outcomes of children under 3 years with mild OSA, Dr. Von Allmen and his colleagues performed a retrospective review of 26 children who had an overnight PSG with a follow-up PSG performed 3-12 months later. They excluded patients with neuromuscular disease, tracheostomy, or interstitial lung disease. All PSGs were performed at the Cincinnati Children’s Hospital Medical Center between 2012 and 2017 and were scored by a board-certified sleep physician. The researchers defined mild OSA as at least one, but fewer than five, events per hour. The mean age of the 26 patients was 7 months, 65% were male, 92% were white, and their median body mass index was in the 39th percentile. Comorbidities include laryngomalacia (40%), cardiac disease (40%), allergies (34%), asthma (23%), and Down syndrome (11%).
Between baseline and follow-up, the apnea-hypoapnea index (AHI) trended downward from 4.3 to 3.4 events per hour (P = .19), the obstructive AHI decreased significantly from 2.7 to 1.3 events per hour (P = .013), while the central apnea index also trended downward from 1.4 to 1.2 events per hour (P = .60). The oxyhemoglobin nadir and sleep efficiency did not change significantly, but there was a decrease in the arousal index (from 14.7 to 13 events per hour; P = .027) and in the percentage of REM sleep (from 33% to 30%; P = .008).
As for postobservation OSA severity outcomes, eight patients (31%) resolved spontaneously, one patient progressed from mild to moderate OSA, and the rest remained in their mild OSA state. Subanalysis revealed that OSA resolution rate was 36% in patients with laryngomalacia, compared with 27% in those with no laryngomalacia, a difference that did not reach statistical significance (P = .98).
Dr. von Allmen pointed out that the study cohort had comorbidities which may have contributed to the persistence of OSA. He also acknowledged certain limitations of the study, including its retrospective nature, the potential for selection bias, the small sample size, and the fact that it did not include a control sample of normal children. “The presence of laryngomalacia did not affect the resolution rate in our cohort, but we’ll need larger studies to better elucidate the factors that do affect persistent disease and to identify the optimal timing of intervention in children with mild OSA,” he said.
Dr. von Allmen reported having no financial disclosures. The study received a resident research award at the meeting, which was jointly sponsored by the Triological Society and the American College of Surgeons.
SOURCE: von Allmen DC et al. Triological CSM, Abstracts.
CORONADO, CALIF. – results from a single-center study showed.
“OSA affects up to 6% of the pediatric population, and diagnosis of young children can be particularly challenging due to the heterogeneity of presenting symptoms,” Douglas C. von Allmen, MD, said at the Triological Society’s Combined Sections Meeting. “While school-age children may present with snoring, that’s less common in the younger population. Up to one-quarter of infants may have noisy breathing, which may mimic obstructive events throughout the first 3 years of life. Additionally, long-term clinical implications of mild sleep apnea in very young children is unclear.”
According to Dr. von Allmen, a fifth-year otolaryngology resident at the University of Cincinnati, management strategies of children with OSA can include a period of observation, particularly when there’s an absence of concerning findings on polysomnography (PSG), such as hypoventilation or significant hypoxia, or when the primary etiology of the OSA is unknown. “Additionally, few studies at this point have attempted to characterize the natural history of mild OSA in pediatric patients under 3 years of age,” he said.
In an effort to assess the effects of observation on the PSG outcomes of children under 3 years with mild OSA, Dr. Von Allmen and his colleagues performed a retrospective review of 26 children who had an overnight PSG with a follow-up PSG performed 3-12 months later. They excluded patients with neuromuscular disease, tracheostomy, or interstitial lung disease. All PSGs were performed at the Cincinnati Children’s Hospital Medical Center between 2012 and 2017 and were scored by a board-certified sleep physician. The researchers defined mild OSA as at least one, but fewer than five, events per hour. The mean age of the 26 patients was 7 months, 65% were male, 92% were white, and their median body mass index was in the 39th percentile. Comorbidities include laryngomalacia (40%), cardiac disease (40%), allergies (34%), asthma (23%), and Down syndrome (11%).
Between baseline and follow-up, the apnea-hypoapnea index (AHI) trended downward from 4.3 to 3.4 events per hour (P = .19), the obstructive AHI decreased significantly from 2.7 to 1.3 events per hour (P = .013), while the central apnea index also trended downward from 1.4 to 1.2 events per hour (P = .60). The oxyhemoglobin nadir and sleep efficiency did not change significantly, but there was a decrease in the arousal index (from 14.7 to 13 events per hour; P = .027) and in the percentage of REM sleep (from 33% to 30%; P = .008).
As for postobservation OSA severity outcomes, eight patients (31%) resolved spontaneously, one patient progressed from mild to moderate OSA, and the rest remained in their mild OSA state. Subanalysis revealed that OSA resolution rate was 36% in patients with laryngomalacia, compared with 27% in those with no laryngomalacia, a difference that did not reach statistical significance (P = .98).
Dr. von Allmen pointed out that the study cohort had comorbidities which may have contributed to the persistence of OSA. He also acknowledged certain limitations of the study, including its retrospective nature, the potential for selection bias, the small sample size, and the fact that it did not include a control sample of normal children. “The presence of laryngomalacia did not affect the resolution rate in our cohort, but we’ll need larger studies to better elucidate the factors that do affect persistent disease and to identify the optimal timing of intervention in children with mild OSA,” he said.
Dr. von Allmen reported having no financial disclosures. The study received a resident research award at the meeting, which was jointly sponsored by the Triological Society and the American College of Surgeons.
SOURCE: von Allmen DC et al. Triological CSM, Abstracts.
REPORTING FROM THE TRIOLOGICAL CSM
Key clinical point: Comorbidities may contribute to the persistence of OSA in young children.
Major finding: OSA spontaneously resolved in 31% of patients.
Study details: A retrospective analysis of 26 children under age 3 years.
Disclosures: The researchers reported having no financial disclosures.
Source: Von Allmen et al. Triological CSM, Abstracts.
Another look at overdiagnosis/remission of asthma
I appreciated the PURL, “Should you reassess your patient’s asthma diagnosis?” (J Fam Pract. 2018;67:704-707) that reminded clinicians to taper asthma controller medications in asymptomatic patients. The articles cited1,2 by Drs. Stevermer and Hayes documented that one-third of the adults enrolled in the respective study with physician-diagnosed asthma did not have objective evidence for asthma and were either over-diagnosed or had remitted. These articles also contained evidence that: 1) over-diagnosis was likely much more common than remission,1 and 2) there was a significant temporal trend towards increasing over-diagnosis/remission during the last several decades. The authors of the cited article1 suggested that the temporal trend could be explained by increased public awareness of respiratory symptoms, more aggressive marketing of asthma medications, and a lack of objective measurement of reversible airway obstruction in primary care. These assertions deserve careful consideration as we strive to diagnose asthma appropriately.
Over-diagnosis/remission is almost certainly not as prevalent (33%) as the authors of the cited articles1,2 reported. The reason is simple selection bias: 1) the cited study2 excluded asthma patients who smoked >10 pack-years (it enrolled 701 asthma patients and excluded 812 asthma patients with a >10 pack-year smoking history), and 2) this study likely did not include asthma patients with the asthma-COPD overlap syndrome, which is treated as asthma and comprises an additional 30% of our patients with chronic airflow limitation (the asthma-COPD spectrum).3 Asthma patients who smoke and/or have the overlap syndrome are prone to severe asthma that is refractory to inhaled corticosteroids.3,4
In addition to making the correct diagnosis, it is equally important to be aware of efficacious therapies for severe refractory asthma that primary care clinicians can easily use. There is now good evidence that azithromycin is efficacious for severe refractory asthma5 and should be considered prior to referral for immunomodulatory asthma therapies.6
David L. Hahn, MD, MS
Madison, Wis
1. Aaron SD, Vandemheen KL, Boulet LP, et al; Canadian Respiratory Clinical Research Consortium. Overdiagnosis of asthma in obese and nonobese adults. CMAJ. 2008;179:1121-1131.
2. Aaron SD, Vandemheen KL, FitzGerald JM, et al; Canadian Respiratory Research Network. Reevaluation of diagnosis in adults with physician-diagnosed asthma. JAMA. 2017;317:269-279.
3. Gibson PG, Simpson JL. The overlap syndrome of asthma and COPD: what are its features and how important is it? Thorax. 2009;64:728-735.
4. Stapleton M, Howard-Thompson A, George C, et al. Smoking and asthma. J Am Board Fam Med. 2011;24;313-322.
5. Gibson PG, Yang IA, Upham JW, et al. Effect of azithromycin on asthma exacerbations and quality of life in adults with persistent uncontrolled asthma (AMAZES): a randomised, double-blind, placebo-controlled trial. Lancet. 2017:390659-668.
6. Hahn DL, Grasmick M, Hetzel S, et al; AZMATICS (AZithroMycin-Asthma Trial In Community Settings) Study Group. Azithromycin for bronchial asthma in adults: an effectiveness trial. J Am Board Fam Med. 2012;25:442-459.
Continue to: Authors' response...
Authors’ response:
We appreciate Dr. Hahn’s observations about the PURL1 on overdiagnosis of asthma. This article focused on the results of a prospective, multicenter cohort study2 that evaluated the feasibility of tapering, and in many patients, stopping asthma medications. We agree that if the study had included people diagnosed with asthma who also had smoked at least 10 pack-years or who also had COPD, the proportion of those who would eventually no longer meet diagnostic criteria for asthma would be lower than in this study. We are uncertain of the relative proportion of cases that were overdiagnosis, when compared with true remission of disease, as only 43% of those no longer meeting the diagnostic criteria for asthma had evidence of prior lung function testing, whether by formal spirometry, serial peak function testing, or bronchial challenge testing.
We agree that using efficacious therapies for severe refractory asthma is essential, but the selection of those therapies was outside the scope of this PURL.
James J. Stevermer, MD, MSPH; Alisa Hayes, MD
Columbia, Mo
1. Stevermer JJ, Hayes A. Should you reassess your patient’s asthma diagnosis? J Fam Pract. 2018;67:704-707.
2. Aaron SD, Vandemheen KL, FitzGerald JM, et al; Canadian Respiratory Research Network. Reevaluation of diagnosis in adults with physician-diagnosed asthma. JAMA. 2017;317:269-279.
Does left atrial appendage closure reduce stroke rates as well as oral anticoagulants and antiplatelet meds in A-fib patients?
EVIDENCE SUMMARY
A 2017 network meta-analysis included 19 RCTs and 87,831 patients receiving anticoagulation, antiplatelet therapy, or LAAC for NVAF.1 LAAC was superior to antiplatelet therapy (hazard ratio [HR]=0.44; 95% confidence interval [CI], 0.23-0.86; P<.05) and similar to NOACs (HR=1.01; 95% CI, 0.53-1.92; P=.969) for reducing risk of stroke.
LAAC and NOACs found “most effective”
A network meta-analysis of 21 RCTs, which included data from 96,017 patients, examined the effectiveness of 7 interventions to prevent stroke in patients with NVAF: 4 NOACs, VKA, aspirin, and LAAC; the analysis compared VKA with the other interventions.2 The 2 trials that investigated LAAC accounted for only 1114 patients.
When the 7 interventions were ranked simultaneously on 2 efficacy outcomes (stroke/systemic embolism and all-cause mortality), all 4 NOACs and LAAC clustered together as “the most effective and lifesaving.”
Fewer hemorrhagic strokes with LAAC than VKA
A 2016 meta-analysis of 6 RCTs compared risk of stroke for adults with NVAF who received LAAC, VKA, or NOACs.3 No significant differences were found between NOACs and VKA or LAAC and VKA. The LAAC group had a significantly smaller number of patients.
A 2015 meta-analysis of 2406 patients with NVAF found that patients who received LAAC had significantly fewer hemorrhagic strokes (HR=0.22; P<.05) than patients who received VKA.4 No differences in all-cause stroke were found between the 2 groups during an average follow-up of 2.69 years.
LAAC found superior to warfarin for stroke prevention in one trial
A 2014 multicenter, randomized study (PROTECT-AF) of 707 patients with NVAF plus 1 additional stroke risk factor compared LAAC with VKA (warfarin).5 LAAC met criteria at 3.8 years for both noninferiority and superiority in preventing stroke, based on 2.3 events per 100 patient-years compared with 3.8 events per 100 patient-years for VKA. The number needed to treat with LAAC was 67 to result in 1 less event per patient-year.
A 2014 RCT (PREVAIL) evaluated patients with NVAF plus 1 additional stroke risk factor. LAAC was noninferior to warfarin for ischemic stroke prevention.6
Continue to: RECOMMENDATIONS
RECOMMENDATIONS
The American College of Cardiology (ACC) recommends LAAC for patients with NVAF who are not candidates for long-term anticoagulation.7 Similarly, the 2016 European Society of Cardiology guidelines issued a Class IIb recommendation for LAAC for stroke prevention in those with contraindications for long-term anticoagulation.8 Lastly, in a 2014 guideline, the American Heart Association, ACC, and the Heart Rhythm Society issued a Class IIb recommendation for surgical excision of the left atrial appendage in patients with atrial fibrillation undergoing cardiac surgery, but did not provide recommendations regarding LAAC.9
1. Sahay S, Nombela-Franco L, Rodes-Cabau J, et al. Efficacy and safety of left atrial appendage closure versus medical treatment in atrial fibrillation: a network meta-analysis from randomised trials. Heart. 2017;103:139-147.
2. Tereshchenko LG, Henrikson CA, Cigarroa, J, et al. Comparative effectiveness of interventions for stroke prevention in atrial fibrillation: a network meta-analysis. J Am Heart Assoc. 2016; 5:e003206.
3. Bajaj NS, Kalra R, Patel N, et al. Comparison of approaches for stroke prophylaxis in patients with non-valvular atrial fibrillation: network meta-analyses of randomized clinical trials. PLoS One. 2016;11:e0163608.
4. Holmes DR Jr, Doshi SK, Kar S, et al. Left atrial appendage closure as an alternative to warfarin for stroke prevention in atrial fibrillation: a patient-level meta-analysis. J Am Coll Cardiol. 2015;65:2614-2623.
5. Reddy VY, Sievert H, Halperin J, et al. Percutaneous left atrial appendage closure vs warfarin for atrial fibrillation: a randomized clinical trial. JAMA. 2014;312:1988-1998.
6. Holmes DR Jr, Kar S, Price MJ, et al. Prospective randomized evaluation of the Watchman Left Atrial Appendage Closure device in patients with atrial fibrillation versus long-term warfarin therapy: the PREVAIL trial. J Am Coll Cardiol. 2014;64:1-12.
7. Panaich S, Holmes DR. Left atrial appendage occlusion: Expert analysis. http://www.acc.org/latest-in-cardiology/articles/2017/ 01/31/13/08/left-atrial-appendage-occlusion. Accessed April 5, 2018.
8. Kirchof P, Benussi S, Kotecha D, et al. 2016 ESC guidelines for management of atrial fibrillation developed in collaboration with EACTS. Europace. 2016;18:1609-1678.
9. January CT, Wann LS, Alpert LS, et al. 2014 AHA/ACC/HRS guideline for the management of patients with atrial fibrillation: executive summary. JACC. 2014;64:2246-2280.
EVIDENCE SUMMARY
A 2017 network meta-analysis included 19 RCTs and 87,831 patients receiving anticoagulation, antiplatelet therapy, or LAAC for NVAF.1 LAAC was superior to antiplatelet therapy (hazard ratio [HR]=0.44; 95% confidence interval [CI], 0.23-0.86; P<.05) and similar to NOACs (HR=1.01; 95% CI, 0.53-1.92; P=.969) for reducing risk of stroke.
LAAC and NOACs found “most effective”
A network meta-analysis of 21 RCTs, which included data from 96,017 patients, examined the effectiveness of 7 interventions to prevent stroke in patients with NVAF: 4 NOACs, VKA, aspirin, and LAAC; the analysis compared VKA with the other interventions.2 The 2 trials that investigated LAAC accounted for only 1114 patients.
When the 7 interventions were ranked simultaneously on 2 efficacy outcomes (stroke/systemic embolism and all-cause mortality), all 4 NOACs and LAAC clustered together as “the most effective and lifesaving.”
Fewer hemorrhagic strokes with LAAC than VKA
A 2016 meta-analysis of 6 RCTs compared risk of stroke for adults with NVAF who received LAAC, VKA, or NOACs.3 No significant differences were found between NOACs and VKA or LAAC and VKA. The LAAC group had a significantly smaller number of patients.
A 2015 meta-analysis of 2406 patients with NVAF found that patients who received LAAC had significantly fewer hemorrhagic strokes (HR=0.22; P<.05) than patients who received VKA.4 No differences in all-cause stroke were found between the 2 groups during an average follow-up of 2.69 years.
LAAC found superior to warfarin for stroke prevention in one trial
A 2014 multicenter, randomized study (PROTECT-AF) of 707 patients with NVAF plus 1 additional stroke risk factor compared LAAC with VKA (warfarin).5 LAAC met criteria at 3.8 years for both noninferiority and superiority in preventing stroke, based on 2.3 events per 100 patient-years compared with 3.8 events per 100 patient-years for VKA. The number needed to treat with LAAC was 67 to result in 1 less event per patient-year.
A 2014 RCT (PREVAIL) evaluated patients with NVAF plus 1 additional stroke risk factor. LAAC was noninferior to warfarin for ischemic stroke prevention.6
Continue to: RECOMMENDATIONS
RECOMMENDATIONS
The American College of Cardiology (ACC) recommends LAAC for patients with NVAF who are not candidates for long-term anticoagulation.7 Similarly, the 2016 European Society of Cardiology guidelines issued a Class IIb recommendation for LAAC for stroke prevention in those with contraindications for long-term anticoagulation.8 Lastly, in a 2014 guideline, the American Heart Association, ACC, and the Heart Rhythm Society issued a Class IIb recommendation for surgical excision of the left atrial appendage in patients with atrial fibrillation undergoing cardiac surgery, but did not provide recommendations regarding LAAC.9
1. Sahay S, Nombela-Franco L, Rodes-Cabau J, et al. Efficacy and safety of left atrial appendage closure versus medical treatment in atrial fibrillation: a network meta-analysis from randomised trials. Heart. 2017;103:139-147.
2. Tereshchenko LG, Henrikson CA, Cigarroa, J, et al. Comparative effectiveness of interventions for stroke prevention in atrial fibrillation: a network meta-analysis. J Am Heart Assoc. 2016; 5:e003206.
3. Bajaj NS, Kalra R, Patel N, et al. Comparison of approaches for stroke prophylaxis in patients with non-valvular atrial fibrillation: network meta-analyses of randomized clinical trials. PLoS One. 2016;11:e0163608.
4. Holmes DR Jr, Doshi SK, Kar S, et al. Left atrial appendage closure as an alternative to warfarin for stroke prevention in atrial fibrillation: a patient-level meta-analysis. J Am Coll Cardiol. 2015;65:2614-2623.
5. Reddy VY, Sievert H, Halperin J, et al. Percutaneous left atrial appendage closure vs warfarin for atrial fibrillation: a randomized clinical trial. JAMA. 2014;312:1988-1998.
6. Holmes DR Jr, Kar S, Price MJ, et al. Prospective randomized evaluation of the Watchman Left Atrial Appendage Closure device in patients with atrial fibrillation versus long-term warfarin therapy: the PREVAIL trial. J Am Coll Cardiol. 2014;64:1-12.
7. Panaich S, Holmes DR. Left atrial appendage occlusion: Expert analysis. http://www.acc.org/latest-in-cardiology/articles/2017/ 01/31/13/08/left-atrial-appendage-occlusion. Accessed April 5, 2018.
8. Kirchof P, Benussi S, Kotecha D, et al. 2016 ESC guidelines for management of atrial fibrillation developed in collaboration with EACTS. Europace. 2016;18:1609-1678.
9. January CT, Wann LS, Alpert LS, et al. 2014 AHA/ACC/HRS guideline for the management of patients with atrial fibrillation: executive summary. JACC. 2014;64:2246-2280.
EVIDENCE-BASED ANSWER:
Yes. Left atrial appendage closure (LAAC) with the Watchman device is noninferior to vitamin K antagonists (VKAs) and non-VKA oral anticoagulants (NOACs) for adults with nonvalvular atrial fibrillation (NVAF) and 1 additional stroke risk factor (strength of recommendation [SOR]: A, multiple meta-analyses).
LAAC has consistently been shown to be superior to antiplatelet therapy (SOR: A, single meta-analysis). One randomized controlled trial (RCT) demonstrated superiority of LAAC to VKA (SOR: B, single RCT).
