User login
How to reach LDL targets quickly in patients with diabetes or metabolic syndrome
- You can reduce elevated LDL-C levels in more patients with diabetes and metabolic syndrome using this study's algorithm.
- Choose a starting dose of a statin according to the gap between baseline and target LDL-C values.
- Using a tailored starting dose of atorvastatin, most patients with type 2 diabetes or metabolic syndrome can achieve LDL-C target levels safely within 6 to 12 weeks, without raising the initial dose or with a single titration step.
Purpose To investigate whether using an algorithm to select the starting dose of a statin according to baseline and target LDL-cholesterol (LDL-C) values would facilitate achieving lipid targets in patients with diabetes or the metabolic syndrome.
Methods Two 12-week, prospective, open-label trials enrolled 2717 high-risk subjects, of whom 1024 had diabetes and 1251 had metabolic syndrome. Subjects with LDL-C between 100 and 220 mg/dL (2.6-5.7 mmol/L) were assigned a starting dose of atorvastatin (10, 20, 40, or 80 mg/d) based on LDL-C level and status of statin use at baseline (statin-free [SF] or statin-treated [ST]), with a single uptitration at 6 weeks, if required.
Results Among patients with diabetes, 81% of SF subjects (82%, 84%, 82%, and 76% with 10, 20, 40, and 80 mg, respectively) and 60% of ST subjects (61%, 68%, and 47% with 20, 40, and 80 mg, respectively) achieved LDL-C target. Among patients with metabolic syndrome, 78% of SF subjects (81%, 84%, 82%, and 66% with 10, 20, 40, and 80 mg, respectively) and 57% of ST subjects (58%, 70%, and 47% with 20, 40, and 80 mg, respectively) achieved LDL-C target. Among ST subjects, we observed reductions in LDL-C with atorvastatin beyond those achieved with other statins used at baseline in patients with diabetes and patients with metabolic syndrome. Atorvastatin was well tolerated.
Conclusions The ACTFAST studies confirm that a targeted starting dose of atorvastatin allows most patients with type 2 diabetes or the metabolic syndrome to achieve their LDL-C target safely with the initial dose or just a single titration. This therapeutic strategy may help overcome the treatment gap still observed in the treatment of lipids in diabetes.
How many of your patients with type 2 diabetes or metabolic syndrome have a low-density lipoprotein cholesterol (LDL-C) level below the target of 100 mg/dL? Your answer, undoubtedly, is not enough of them. The good news we report in this article is that you can safely achieve the target more often, within 6 to 12 weeks, using a simple algorithm that helps you determine the optimal starting dose of a statin.
Good reason for concern. Individuals with coronary heart disease (CHD) or CHD risk equivalents such as diabetes have the highest cardiovascular risk and, according to the National Cholesterol Education Program (NCEP) III and other guidelines, must aim for the lowest target levels of LDL-C.1 As the number of cardiovascular risk factors increases in a population, the percentage of patients reaching targets decreases2,3 —to as low as 37% among those at highest risk.2 The international Analysis and Understanding of Diabetes and Dyslipidaemia: Improving Treatment (AUDIT) survey found that out of all patients with type 2 diabetes being treated, only 54% achieved target.4
Type 2 diabetes purportedly imparts a cardiovascular risk comparable to that of a prior cardiovascular event.1,5-7 Moreover, the outcome of such events in patients with diabetes is worse than in patients without diabetes, with approximately 7 out of 10 patients dying from the event or its complications.7-9
The metabolic syndrome (MetSyn) also increases risk of cardiovascular events and mortality, even in individuals without diabetes or CHD.10-13 In 1 study, the risks of all-cause and cardiovascular mortality in patients with MetSyn were 1.38 to 1.44 and 2.26 to 2.78, respectively, compared with those who did not have MetSyn.12
The algorithm we describe in this article was developed from results of the Achieve Cholesterol Targets Fast with Atorvastatin Stratified Titration (ACTFAST) trials. These trials were designed to assess whether, according to the degree of reduction required in LDL-C, an optimal starting dose of atorvastatin could be identified so that patients would achieve LDL-C targets quickly, with no change in the dose or with just one titration step, and regardless of statin use at baseline.
The main results of ACTFAST 1 and 2 have been published elsewhere.14,15 We report specifically on a prespecified analysis of pooled results in the subset of patients with diabetes or MetSyn.
Methods
Patient population
We extracted the study population from prespecified pooling of data from ACTFAST 1 and 2,14,15 which were 12-week, multicenter, prospective, open-label trials that used the same protocol. A full description of inclusion and exclusion criteria for ACTFAST has been published elsewhere.14,15
Briefly, subjects were either statin-free or statin-treated at baseline, had CHD or a CHD equivalent, had an LDL-C level between 100 and 220 mg/dL (2.6-5.7 mmol/L) and triglycerides =600 mg/dL (6.8 mmol/L), and were willing to follow a recommended diet.
We excluded patients if they had used other lipid-lowering therapy in the prior 2 months (except for statins in the statin-treated study arm) or if they were receiving >40 mg/d of any statin. Patients taking atorvastatin at screening were excluded because the study's goal was to assess the benefits of switching over to a flexible starting dose of atorvastatin. We defined diabetes and MetSyn according to the American Diabetes Association criteria16 and the NCEP 2001 criteria,1 respectively.
Doses reflected LDL-C baseline-target gap and prior statin use
If patients were statin free at baseline, we assigned them to 6 weeks of treatment with atorvastatin, at 10, 20, 40, or 80 mg/d, according to their baseline LDL-C level ( FIGURE 1 ). For patients who had been taking a statin at screening, starting doses of atorvastatin for each LDL-C increment were doubled.
If patients did not reach LDL-C targets at the end of 6 weeks, we titrated their regimen to the next higher dose for an additional 6 weeks. Patients initially allocated to receive atorvastatin at 80 mg who did not reach LDL-C targets continued at that dose, and we added a more intense therapeutic lifestyle intervention (NCEP II step 2 diet).1
We obtained blood samples at baseline screening, week 6, and week 12, to measure 12-hour fasting serum lipid profiles and to make routine safety assessments (hematology and chemistry). Patients received dietary counseling at all visits.
The ACTFAST protocol and amendments were approved by appropriately constituted central or local institutional review boards, and all patients gave written informed consent.
FIGURE 1
How treatment doses were determined
Statin-free patients received a specified dose of atorvastatin according to their baseline low-density lipoprotein cholesterol (LDL-C) level. Patients who had been treated with another statin at screening received atorvastatin at a dose double that given to statin-free patients with equivalent LDL-C levels, for a maximum dose of 80 mg.
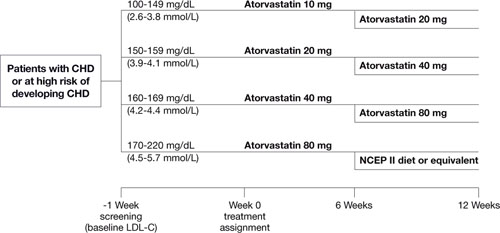
Reprinted from Atherosclerosis, vol. 191, Martineau P, Gaw A, de Teresa E, et al, Effect of individualizing starting doses of a statin according to baseline LDL-cholesterol levels on achieving cholesterol targets: The Achieve Cholesterol Targets Fast with Atorvastatin Stratified Titration (ACTFAST) study, 135-146, © 2006, with permission from Elsevier.
Primary efficacy outcome: LDL-C levels of <100 mg/dL
The primary efficacy outcome was the proportion of patients with either diabetes or MetSyn achieving NCEP Adult Treatment Panel-III target LDL-C levels of <100 mg/dL (<2.6 mmol/L) after 12 weeks of treatment.1 Secondary efficacy parameters were described in ACTFAST 1.14
We analyzed data according to intention-to-treat (ITT), using the last observation carried forward (LOCF) for missing data. The ITT population consisted of all patients who took at least 1 dose of study medication, and had at least 1 subsequent assessment.
Results
Between January 2003 and February 2004, 3634 subjects were screened for ACTFAST 1 and 2, and 2717 patients were enrolled from 12 countries (Canada, Greece, Hungary, Ireland, Italy, Poland, Portugal, Russia, Slovakia, Spain, Switzerland, and the United Kingdom). Ethnicity was recorded for about 80% of patients; more than 90% were Caucasian.
Diabetes
The ITT population included 1024 patients with diabetes, of whom 97% had type 2 diabetes and 73% were statin-free ( TABLE 1 ). Baseline laboratory parameters are available online, in TABLE W1 .
After 12 weeks of treatment, 81% (95% confidence interval [CI], 77.8%-83.5%) of statin-free and 60% (95% CI, 53.9%-65.4%) of statin-treated patients with diabetes achieved LDLC target of <100 mg/dL ( FIGURE 2 ). In contrast, among patients without diabetes (n=1693), 77% (95% CI, 73.9%-79.3%) of statin-free and 59% (95% CI, 55.4%-62.5%) of statin-treated patients achieved target.
For diabetes patients, mean percent reductions in total cholesterol, TC/HDL-C, LDL-C, triglycerides, non-HDL-C and apolipoprotein B (apo B) were significant vs baseline for all doses in both statin-free and statin-treated subjects ( TABLE 2 ). Significant increases in HDL-C were seen only with the 10- and 80-mg doses in statin-free patients.
FIGURE 2
Patients who achieved an LDL-C level of <100 mg/dL
after receiving 12 weeks of atorvastatin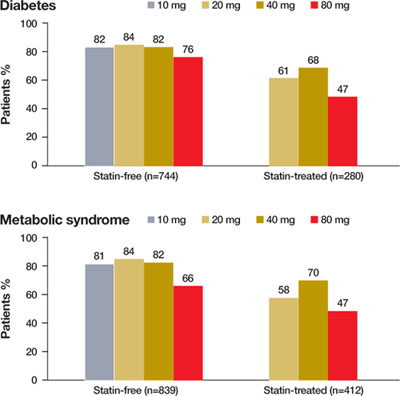
TABLE 1
Demographic profiles of patients with diabetes or metabolic syndrome
(This is an expanded version of the table that appeared in print.)
| DIABETES | STATIN-FREE (N=744) | STATIN-TREATED (N=280) | ALL (N=1024) |
|---|---|---|---|
| Men, n (%) | 410 (55.1) | 161 (57.5) | 571 (55.8) |
| Age, years | 60.9±10.9 | 62.2±10.1 | 61.3±10.7 |
| Weight, kg | 85.0±18.0 | 83.3±16.0 | 84.6±17.5 |
| Waist circumference, cm | 103.3±13.8 | 102.3±13.0 | 103.0±13.6 |
| Smokers, % | 16.5 | 12.5 | 15.4 |
| Type 2 diabetes, % (% treated with insulin) | 96.8 (16.3) | 96.8 (16.6) | 96.8 (16.3) |
| Blood pressure, mm Hg | 137.1±15.7/79.6±9.6 | 136.3±16.4/77.5±10.5 | 136.9±15.9/79.0±9.9 |
| CHD, % | 24.2 | 56.4 | 33.0 |
| PVD, % | 5.5 | 7.9 | 6.2 |
| CVD, % | 6.9 | 9.3 | 7.5 |
| METABOLIC SYNDROME | STATIN-FREE (N=839) | STATIN-TREATED (N=412) | ALL (N=1251) |
| Men, n (%) | 483 (57.6) | 248 (60.2) | 731 (58.4) |
| Age, years | 62.0±10.2 | 62.7±10.1 | 62.2±10.2 |
| Weight, kg | 87.4±17.2 | 85.7±15.1 | 86.9±16.6 |
| Waist circumference, cm | 106.2±12.3 | 104.8±12.6 | 105.7±12.4 |
| Smokers, % | 23.0 | 19.7 | 21.9 |
| Diabetes, % (% type 2 diabetes) (% treated with insulin) | 60.4 (98.6) (15.6) | 46.1 (98.9) (17.6) | 55.7 (98.7) (16.1) |
| Blood pressure, mm Hg | 140.1±14.8/81.4±9.3 | 139.7±14.6/79.4±10.0 | 140.0±14.7/80.7±9.6 |
| CHD, % | 41.8 | 75.5 | 52.9 |
| PVD, % | 6.4 | 9.0 | 7.3 |
| CVD, % | 9.8 | 10.0 | 9.8 |
| Mean±standard deviation for continuous variables. | |||
| CHD, coronary heart disease; PVD, peripheral vascular disease; CVD, cerebrovascular disease. | |||
TABLE 2
Mean percent change (95% CI) in lipid levels from baseline when patients with diabetes or metabolic syndrome took atorvastatin
(This is an expanded version of the table that appeared in print.)
| DIABETES | STATIN-FREE | STATIN-TREATED | |||||
|---|---|---|---|---|---|---|---|
| 10 MG (N=395) | 20 MG (N=98) | 40 MG (N=90) | 80 MG (N=161) | 20 MG (N=216) | 40 MG (N=28) | 80 MG (N=36) | |
| Total cholesterol* | -23.0 (-24.3 to -21.7) | -31.6 (-33.8 to -29.3) | -38.1 (-40.5 to -35.7) | -41.2 (-43.3 to -39.1) | -16.9 (-18.6 to -15.2) | -30.4 (-36.0 to -24.9) | -34.2 (-39.4 to -30.0) |
| LDL-C* | -33.9 (-35.6 to -32.2) | -43.4 (-46.0 to -40.7) | -51.0 (-54.1 to -48.0) | -53.0 (-55.6 to -50.4) | -23.9 (-26.3 to -21.6) | -40.3 (-47.2 to -33.5) | -42.1 (-50.2 to -33.9) |
| HDL-C | 2.9† (1.4 to 4.3) | 0.4 (-2.1 to 2.9) | -0.7 (-3.9 to 2.6) | -2.8† (-4.9 to -0.6) | -0.8 (-2.6 to 1.0) | 0.5 (-4.8 to 5.8) | -0.8 (-3.8 to 2.2) |
| TC/HDL-C* | -24.2 (-25.7 to -22.7) | -31.2 (-34.1 to -28.4) | -36.7 (-39.5 to -33.9) | -39.1 (-41.0 to -37.3) | -15.1 (-17.3 to -12.9) | -30.2 (-35.6 to -24.7) | -33.3 (-37.8 to -28.8) |
| Triglycerides* | -14.4 (-17.3 to -11.4) | -19.1 (-24.5 to -13.6) | -23.6 (-29.5 to -17.7) | -23.6 (-28.3 to -18.9) | -7.3 (-13.2 to -1.4) | -24.9 (-35.7 to -14.1) | -20.7 (-29.5 to -11.9) |
| Non-HDL-C* | -30.8 (-32.4 to -29.3) | -40.6 (-43.5 to -37.7) | -47.9 (-50.7 to -45.1) | -50.0 (-52.3 to -47.6) | -21.8 (-24.0 to -19.6) | -38.3 (-44.9 to -31.7) | -42.3 (-47.2 to -37.4) |
| Apo B* | -30.6 (-32.0 to -29.1) | -39.1 (-41.6 to -36.6) | -46.2 (-48.7 to -43.6) | -47.8 (-50.0 to -45.6) | -22.3 (-24.2 to -20.4) | -34.7 (-40.3 to -29.0) | -39.1 (-43.6 to -34.6) |
| METABOLIC SYNDROME | STATIN-FREE | STATIN-TREATED | |||||
| 10 MG (N=418) | 20 MG (N=103) | 40 MG (N=104) | 80 MG (N=214) | 20 MG (N=290) | 40 MG (N=47) | 80 MG (N=75) | |
| Total cholesterol* | -24.6 (-25.8 to -23.3) | -31.6 (-33.6 to -29.5) | -37.6 (-39.7 to -35.5) | -39.5 (-41.4 to -37.6) | -16.2 (-17.7 to -14.7) | -30.3 (-33.5 to -27.2) | -33.0 (-36.0 to -30.1) |
| LDL-C* | -34.6 (-36.1 to -33.0) | -43.4 (-46.1 to -40.6) | -49.3 (-51.9 to -46.7) | -50.3 (-52.7 to -47.9) | -21.8 (-23.7 to -19.9) | -40.4 (-44.1 to -36.7) | -41.3 (-45.9 to -36.8) |
| HDL-C | 4.4† (2.9 to 5.8) | 2.9† (0.3 to 5.5) | 2.3 (-0.6 to 5.3) | 2.0 (-0.1 to 4.2) | 1.3 (-0.3 to 2.9) | 4.1† (0.3 to 7.8) | -1.6 (-3.7 to 0.6) |
| TC/HDL-C* | -26.6 (-28.1 to -25.1) | -32.6 (-35.4 to -29.8) | -38.2 (-40.6 to -35.9) | -39.5 (-41.9 to -37.0) | -16.2 (-18.0 to -14.4) | -32.3 (-35.6 to -29.1) | -31.4 (-34.8 to -28.1) |
| Triglycerides* | -18.8 (-21.7 to -15.8) | -22.8 (-27.9 to -17.8) | -28.8 (-33.7 to -23.9) | -29.5 (-33.0 to -26.0) | -12.6 (-16.7 to -8.6) | -32.4 (-39.1 to -25.6) | -21.7 (-28.1 to -15.3) |
| Non-HDL-C* | -32.2 (-33.7 to -30.7) | -39.9 (-42.6 to -37.2) | -46.7 (-49.1 to -44.3) | -47.9 (-50.0 to -45.8) | -20.9 (-22.8 to -19.1) | -38.9 (-42.5 to -35.2) | -39.8 (-43.3 to -36.3) |
| Apo B* | -31.9 (-33.2, to -30.5) | -39.4 (-41.9 to -37.0) | -45.4 (-47.6 to -43.2) | -45.4 (-47.4 to -43.4) | -21.4 (-23.0 to -19.7) | -36.2 (-39.5 to -32.8) | -38.3 (-41.6 to -35.1) |
| CI, confidence interval; LDL-C, low-density lipoprotein cholesterol; HDL-C, high-density lipoprotein cholesterol; TC/HDL-C, total cholesterol/HDL-C ratio; Apo B, apolipoprotein B. | |||||||
| *P<.05 from baseline for all doses. | |||||||
| †P<.05 from baseline for a specific dose. | |||||||
Metabolic syndrome
The ITT population included 1251 patients with MetSyn, of whom 56% also had diabetes and 67% were statin-free ( TABLE 1 ). Baseline laboratory parameters are in TABLE W1 .
After 12 weeks of treatment, 78% (95% CI, 74.9%-80.5%) of statin-free and 57% (95% CI, 52.5%-62.1%) of statin-treated patients achieved LDL-C target of <100 mg/dL ( FIGURE 2 ). Among patients without MetSyn (n=1454), 79% (95% CI, 76.2%-81.7%) of statin-free and 61% (95% CI, 56.8%-64.6%) of statin-treated patients achieved target. (Because of missing data, the presence or absence of MetSyn could not be confirmed in 12 patients.)
Mean percent reductions for MetSyn patients in total cholesterol, TC/HDL-C, LDL-C, triglycerides, non-HDL-C, and apo B were significant vs baseline for all doses in both statin-free and statin-treated patients ( TABLE 2 ). HDL-C increased significantly in the 10- and 20-mg statin-free groups and in the 40-mg statin-treated group.
Treatment was well tolerated
The incidences of treatment-related adverse events were similar in all patient groups, at around 10%. Most events were mild to moderate, with severe events reported in only 0.5% and 0.8% of patients with diabetes and MetSyn, respectively. Incidences of treatment-related musculoskeletal adverse events were 1.9% and 2%, respectively, in patients with and without diabetes; and were 1.7% and 2.3% in patients with and without MetSyn.
The incidence of elevations in aspartate aminotransferase (AST) or alanine aminotransferase (ALT) >3 times and creatine kinase (CK) >10 times the upper limit of normal were 1.1% and 0.1%, respectively, for patients with diabetes, and 0.9% and 0.08% for those with MetSyn, which did not differ from those of patients without diabetes (1.2% and 0%, respectively) or MetSyn (1.3% and 0%, respectively).
TABLE W1
Baseline lipid values for patients with diabetes or metabolic syndrome (mean ± SD)
| DIABETES | STATIN-FREE (N=744) | STATIN-TREATED (N=280) | ALL (N=1024) |
|---|---|---|---|
| Total cholesterol, mg/dL | 225.8±32.7* | 210.8±29.9 | 221.7±32.6 |
| LDL-C, mg/dL | 149.4±26.8* | 133.8±24.3 | 145.1±27.0 |
| HDL-C, mg/dL | 50.0±12.5 | 50.2±12.0 | 50.1±12.4 |
| TC/HDL-C | 4.7±1.1* | 4.4±1.0 | 4.6±1.1 |
| Triglycerides, mg/dL | 173.8±85.1 | 179.4±80.4 | 175.3±83.8 |
| Apo B, g/L | 1.1±0.2 | 1.1±0.2 | 1.1±0.2 |
| HbA1C, % | 7.2±1.2 | 7.4±1.3 | 7.3±1.2 |
| FPG, mmol/L | 8.2±2.9 | 8.2±2.6 | 8.2±2.8 |
| METABOLIC SYNDROME | STATIN-FREE (N=839) | STATIN-TREATED (N=412) | ALL (N=1251) |
| Total cholesterol, mg/dL | 229.3±34.1* | 215.7±32.7 | 224.9±34.2 |
| LDL-C, mg/dL | 152.3±27.8* | 137.8±26.6 | 147.5±28.3 |
| HDL-C, mg/dL | 45.3±11.0 | 46.1±10.4 | 45.5±10.8 |
| TC/HDL-C | 5.3±1.3* | 4.9±1.1 | 5.2±1.2 |
| Triglycerides, mg/dL | 206.4±88.7 | 211.2±83.7 | 208.0±87.1 |
| Apo B, g/L | 1.2±0.2 | 1.1±0.2 | 1.2±0.2 |
| HbA1C, % | 6.7±1.2 | 6.6±1.2 | 6.7±1.2 |
| FPG, mmol/L | 7.4±2.5 | 7.1±2.3 | 7.3±2.4 |
| LDL-C, low-density lipoprotein cholesterol; HDL-C, high-density lipoprotein cholesterol; TC/HDL-C, total cholesterol/HDL-C ratio; Apo B, apolipoprotein B; HbA1C, hemoglobin A1C; FPG, fasting plasma glucose; SD, standard deviation. | |||
| *P<.05 statin-free vs statin-treated. | |||
Discussion
Despite their increased cardiovascular risk, patients with diabetes and MetSyn often do not reach lipid targets.17 In patients with diabetes, lowering LDL-C levels reduces the risk of a cardiovascular event by 25% to 50%.18-23 Atorvastatin has demonstrated its efficacy for the primary prevention of cardiovascular events among patients with diabetes.22,23
MetSyn also increases the risk of cardiovascular events and mortality.10-13 Atorvastatin has been used effectively to achieve LDL-C goals in hypercholesterolemic patients with MetSyn.24,25
Higher starting doses of statins are generally beneficial. This substudy of ACTFAST demonstrates that by initiating therapy at doses selected according to baseline LDL-C levels, 81% of statin-free and 60% of statin-treated subjects with diabetes and 78% of statin-free and 57% of statin-treated subjects with MetSyn achieved a target LDL-C of <100 mg/dL within 6 to 12 weeks. Among statin-treated patients, atorvastatin provided additional reduction in lipid parameters over what was achieved with the statin they had been using at baseline.
Other studies have also suggested that patients at high risk for cardiovascular events, such as those with diabetes or MetSyn, may benefit from starting therapy at a higher dose of atorvastatin.14,15,26,27 In the New Atorvastatin Starting Doses: A Comparison (NASDAC) study, patients were randomized to receive various starting doses of atorvastatin, regardless of their baseline LDL-C value.26 The proportion of patients with CHD or a CHD-equivalent (of whom 150 had diabetes) who achieved LDL-C target (<100 mg/dL) with 10, 20, 40, and 80 mg/d was 47%, 66%, 81% and 80%, respectively, demonstrating that a higher starting dose is required to achieve target.
However, lower doses may work depending on LDL-C levels. In contrast to NASDAC, statin-free patients with diabetes or MetSyn in ACTFAST showed better results on 10- and 20-mg doses, because baseline LDL-C was taken into account. The Atorvastatin Goal Achievement Across Risk Levels (ATGOAL) study used a design similar to ACTFAST, assigning patients with dyslipidemia to starting doses of atorvastatin for 8 weeks, at 10, 20, 40, or 80 mg, based on their CHD risk category and the magnitude of LDL-C reduction necessary to reach lipid targets.27 Of the 1298 patients, 705 were at high CHD risk (43.8% with diabetes), and 81.1% of these high-risk patients achieved an LDL-C <100 mg/dL.
No safety issues arose when initiating atorvastatin at higher doses in patients with diabetes or MetSyn. The incidence of clinically elevated AST, ALT, or CK levels in ACTFAST was low and comparable to that reported in meta-analyses (0.96%).28,29
Benefits of our dosing algorithm seem clear. Aggressive treatment with atorvastatin across the dose range improves LDL-C target achievement compared with usual care,30,31 and current NCEP-III recommendations support the use of a higher initial dose in patients requiring large LDL-C reductions.1 Atorva-statin is approved in many countries at starting doses ranging from 10 to 40 mg, with a titration to 80 mg, if needed, to achieve LDL-C target. ACTFAST suggests that, in patients with diabetes or MetSyn, initiation of atorvastatin at a dose appropriate for the required level of LDL-C reduction would facilitate achievement of LDL-C targets.
One meta-analysis of trials demonstrated that a 10-mg/dL reduction in LDL-C could result in a 5.4% reduction in major vascular events and a 3.1% reduction in all-cause mortality over 5 years.32 In our study, patients with diabetes or MetSyn experienced reductions in LDL-C of approximately 57 mg/dL, which, if maintained over 5 years, could be expected to translate into reductions of 30% in major vascular events and 17% in mortality. Therefore, a regimen that allows a larger number of high-risk patients to achieve substantial reductions in LDL-C levels quickly could significantly improve cardiovascular outcomes.
Limitations of our study include the fact that the trial was not blinded, the size of the dosing groups was unequal, and there was no control group. However, it is unlikely that reduction of LDL-C was due to chance. Also, this study was not designed to investigate the effect of lowering LDL-C on the incidence of cardiovascular events.
Correspondence
Lawrence A. Leiter, MD, University of Toronto, St. Michael's Hospital, 61 Queen St. E.,#6121Q, Toronto, Ontario, Canada. M5C 2T2; [email protected]
1. NCEP. Executive Summary of The Third Report of The National Cholesterol Education Program (NCEP) Expert Panel on Detection, Evaluation, And Treatment of High Blood Cholesterol In Adults (Adult Treatment Panel III). JAMA. 2001;285:2486-2497.
2. Olson K, Tsuyuki R. Patients' achievement of cholesterol targets: a cross-sectional evaluation. Am J Prev Med. 2003;25:339-342.
3. Pearson T, Laurora I, Chu H, et al. The lipid treatment assessment project (L-TAP): a multicenter survey to evaluate the percentages of dyslipidemic patients receiving lipid-lowering therapy and achieving low-density lipoprotein cholesterol goals. Arch Intern Med. 2000;160:459-467.
4. Leiter L, Betteridge D, Chacra A, et al. AUDIT study. Evidence of global undertreatment of dyslipidaemia in patients with type 2 diabetes mellitus. Br J Diabetes Vasc Dis. 2006;6:31-40.
5. Haffner S, Lehto S, Ronnemaa T, et al. Mortality from coronary heart disease in subjects with type 2 diabetes and in nondiabetic subjects with and without prior myocardial infarction. N Engl J Med. 1998;339:229-234.
6. Grundy S, Cleeman J, Merz C, et al. Implications of recent clinical trials for the National Cholesterol Education Program Adult Treatment Panel III guidelines. Circulation. 2004;110:227-239.
7. Grundy SM. Diabetes and coronary risk equivalency: what does it mean? Diabetes Care. 2006;29:457-460.
8. Miettinen H, Lehto S, Salomaa V, et al. Impact of diabetes on mortality after the first myocardial infarction. The FINMONICA Myocardial Infarction Register Study Group. Diabetes Care. 1998;21:69-75.
9. Hurst RT, Lee RW. Increased incidence of coronary atherosclerosis in type 2 diabetes mellitus: mechanisms and management. Ann Intern Med. 2003;139:824-834.
10. McNeill A, Rosamond W, Girman C, et al. The metabolic syndrome and 11-year risk of incident cardiovascular disease in the atherosclerosis risk in communities study. Diabetes Care. 2005;28:385-390.
11. Lakka H, Laaksonen D, Lakka T, et al. The metabolic syndrome and total and cardiovascular disease mortality in middle-aged men. JAMA. 2002;288:2709-2716.
12. Hu G, Qiao Q, Tuomilehto J, et al. Prevalence of the metabolic syndrome and its relation to all-cause and cardiovascular mortality in nondiabetic European men and women. Arch Intern Med. 2004;164:1066-1076.
13. Ford E. The metabolic syndrome and mortality from cardiovascular disease and all-causes: findings from the National Health and Nutrition Examination Survey II Mortality Study. Atherosclerosis. 2004;173:309-314.
14. Martineau P, Gaw A, de Teresa E, et al. Effect of individualizing starting doses of a statin according to baseline LDL-cholesterol levels on achieving cholesterol targets: The Achieve Cholesterol Targets Fast with Atorvastatin Stratified Titration (ACTFAST) study. Atherosclerosis. 2006;191:135-146.
15. Farsang C, Athyros V, Gaw A. A multicentre, open study to assess the effect of individualizing starting doses of atorvastatin according to baseline LDL-C levels on achieving cholesterol targets: the Achieve Cholesterol Targets Fast with Atorvastatin Stratified Titration (ACTFAST-2) study. Curr Med Res Opin. 2007;23:1945-1956.
16. Report of the expert committee on the diagnosis and classification of diabetes mellitus. Diabetes Care. 2002;25(suppl 1):S5-S20.
17. Saydah SH, Fradkin J, Cowie CC. Poor control of risk factors for vascular disease among adults with previously diagnosed diabetes. JAMA. 2004;291:335-342.
18. Haffner S, Alexander C, Cook T, et al. Reduced coronary events in simvastatin-treated patients with coronary heart disease and diabetes or impaired fasting glucose levels: subgroup analyses in the Scandinavian Simvastatin Survival Study. Arch Intern Med. 1999;159:2661-2667.
19. Goldberg RB, Mellies MJ, Sacks FM, et al. Cardiovascular events and their reduction with pravastatin in diabetic and glucose-intolerant myocardial infarction survivors with average cholesterol levels: subgroup analyses in the cholesterol and recurrent events (CARE) trial. The Care Investigators. Circulation. 1998;98:2513-2519.
20. American Diabetes Association: clinical practice recommendations 2002. Diabetes Care. 2002;25(suppl 1):S1-S147.
21. Sacks FM, Tonkin AM, Shepherd J, et al. Effect of pravastatin on coronary disease events in subgroups defined by coronary risk factors: the Prospective Pravastatin Pooling Project. Circulation. 2000;102:1893-1900.
22. Sever PS, Poulter NR, Dahlof B, et al. Reduction in cardiovascular events with atorvastatin in 2532 patients with type 2 diabetes: Anglo-Scandinavian Cardiac Outcomes Trial—lipid-lowering arm (ASCOT-LLA). Diabetes Care. 2005;28:1151-1157.
23. Colhoun HM, Betteridge DJ, Durrington PN, et al. Primary prevention of cardiovascular disease with atorvastatin in type 2 diabetes in the Collaborative Atorvastatin Diabetes Study (CARDS): multicentre randomised placebo-controlled trial. Lancet 2004;364:685-696.
24. Stender S, Schuster H, Barter P, et al. Comparison of rosuvastatin with atorvastatin, simvastatin and pravastatin in achieving cholesterol goals and improving plasma lipids in hypercholesterolaemic patients with or without the metabolic syndrome in the MERCURY I trial. Diabetes Obes Metab. 2005;7:430-438.
25. Hunninghake D, Ballantyne C, Maccubbin D, et al. Comparative effects of simvastatin and atorvastatin in hypercholesterolemic patients with characteristics of metabolic syndrome. Clin Ther. 2003;25:1670-1686.
26. Jones PH, McKenney JM, Karalis DG, et al. Comparison of the efficacy and safety of atorvastatin initiated at different starting doses in patients with dyslipidemia. Am Heart J. 2005;149(1):e1-e8.Available at: http://www.ahjonline.com/article/S0002-8703(04)00476-4/fulltext. Accessed September 10, 2008.
27. McKenney JM, Davidson MH, Saponaro J, et al. Use of a treatment algorithm to achieve NCEP ATP III goals with atorvastatin. J Cardiovasc Pharmacol. 2005;46:594-599.
28. Newman CB, Palmer G, Silbershatz H, et al. Safety of atorvastatin derived from analysis of 44 completed trials in 9416 patients. Am J Cardiol. 2003;92:670-676.
29. Newman C, Tsai J, Szarek M, et al. Comparative safety of atorvastatin 80 mg versus 10 mg derived from analysis of 49 completed trials in 14,236 patients. Am J Cardiol. 2006;97:61-67.
30. Athyros V, Papageorgiou A, Mercouris B, et al. Treatment with atorvastatin to the National Cholesterol Educational Program goal versus 'usual' care in secondary coronary heart disease prevention. The GREek Atorvastatin and Coronary-heart-disease Evaluation (GREACE) study. Curr Med Res Opin. 2002;18:220-228.
31. Koren MJ, Hunninghake DB. Clinical outcomes in managed-care patients with coronary heart disease treated aggressively in lipid-lowering disease management clinics: the alliance study. J Am Coll Cardiol. 2004;44:1772-1779.
32. Baigent C, Keech A, Kearney PM, et al. Efficacy and safety of cholesterol-lowering treatment: prospective meta-analysis of data from 90,056 participants in 14 randomised trials of statins. Lancet. 2005;366:1267-1278.
- You can reduce elevated LDL-C levels in more patients with diabetes and metabolic syndrome using this study's algorithm.
- Choose a starting dose of a statin according to the gap between baseline and target LDL-C values.
- Using a tailored starting dose of atorvastatin, most patients with type 2 diabetes or metabolic syndrome can achieve LDL-C target levels safely within 6 to 12 weeks, without raising the initial dose or with a single titration step.
Purpose To investigate whether using an algorithm to select the starting dose of a statin according to baseline and target LDL-cholesterol (LDL-C) values would facilitate achieving lipid targets in patients with diabetes or the metabolic syndrome.
Methods Two 12-week, prospective, open-label trials enrolled 2717 high-risk subjects, of whom 1024 had diabetes and 1251 had metabolic syndrome. Subjects with LDL-C between 100 and 220 mg/dL (2.6-5.7 mmol/L) were assigned a starting dose of atorvastatin (10, 20, 40, or 80 mg/d) based on LDL-C level and status of statin use at baseline (statin-free [SF] or statin-treated [ST]), with a single uptitration at 6 weeks, if required.
Results Among patients with diabetes, 81% of SF subjects (82%, 84%, 82%, and 76% with 10, 20, 40, and 80 mg, respectively) and 60% of ST subjects (61%, 68%, and 47% with 20, 40, and 80 mg, respectively) achieved LDL-C target. Among patients with metabolic syndrome, 78% of SF subjects (81%, 84%, 82%, and 66% with 10, 20, 40, and 80 mg, respectively) and 57% of ST subjects (58%, 70%, and 47% with 20, 40, and 80 mg, respectively) achieved LDL-C target. Among ST subjects, we observed reductions in LDL-C with atorvastatin beyond those achieved with other statins used at baseline in patients with diabetes and patients with metabolic syndrome. Atorvastatin was well tolerated.
Conclusions The ACTFAST studies confirm that a targeted starting dose of atorvastatin allows most patients with type 2 diabetes or the metabolic syndrome to achieve their LDL-C target safely with the initial dose or just a single titration. This therapeutic strategy may help overcome the treatment gap still observed in the treatment of lipids in diabetes.
How many of your patients with type 2 diabetes or metabolic syndrome have a low-density lipoprotein cholesterol (LDL-C) level below the target of 100 mg/dL? Your answer, undoubtedly, is not enough of them. The good news we report in this article is that you can safely achieve the target more often, within 6 to 12 weeks, using a simple algorithm that helps you determine the optimal starting dose of a statin.
Good reason for concern. Individuals with coronary heart disease (CHD) or CHD risk equivalents such as diabetes have the highest cardiovascular risk and, according to the National Cholesterol Education Program (NCEP) III and other guidelines, must aim for the lowest target levels of LDL-C.1 As the number of cardiovascular risk factors increases in a population, the percentage of patients reaching targets decreases2,3 —to as low as 37% among those at highest risk.2 The international Analysis and Understanding of Diabetes and Dyslipidaemia: Improving Treatment (AUDIT) survey found that out of all patients with type 2 diabetes being treated, only 54% achieved target.4
Type 2 diabetes purportedly imparts a cardiovascular risk comparable to that of a prior cardiovascular event.1,5-7 Moreover, the outcome of such events in patients with diabetes is worse than in patients without diabetes, with approximately 7 out of 10 patients dying from the event or its complications.7-9
The metabolic syndrome (MetSyn) also increases risk of cardiovascular events and mortality, even in individuals without diabetes or CHD.10-13 In 1 study, the risks of all-cause and cardiovascular mortality in patients with MetSyn were 1.38 to 1.44 and 2.26 to 2.78, respectively, compared with those who did not have MetSyn.12
The algorithm we describe in this article was developed from results of the Achieve Cholesterol Targets Fast with Atorvastatin Stratified Titration (ACTFAST) trials. These trials were designed to assess whether, according to the degree of reduction required in LDL-C, an optimal starting dose of atorvastatin could be identified so that patients would achieve LDL-C targets quickly, with no change in the dose or with just one titration step, and regardless of statin use at baseline.
The main results of ACTFAST 1 and 2 have been published elsewhere.14,15 We report specifically on a prespecified analysis of pooled results in the subset of patients with diabetes or MetSyn.
Methods
Patient population
We extracted the study population from prespecified pooling of data from ACTFAST 1 and 2,14,15 which were 12-week, multicenter, prospective, open-label trials that used the same protocol. A full description of inclusion and exclusion criteria for ACTFAST has been published elsewhere.14,15
Briefly, subjects were either statin-free or statin-treated at baseline, had CHD or a CHD equivalent, had an LDL-C level between 100 and 220 mg/dL (2.6-5.7 mmol/L) and triglycerides =600 mg/dL (6.8 mmol/L), and were willing to follow a recommended diet.
We excluded patients if they had used other lipid-lowering therapy in the prior 2 months (except for statins in the statin-treated study arm) or if they were receiving >40 mg/d of any statin. Patients taking atorvastatin at screening were excluded because the study's goal was to assess the benefits of switching over to a flexible starting dose of atorvastatin. We defined diabetes and MetSyn according to the American Diabetes Association criteria16 and the NCEP 2001 criteria,1 respectively.
Doses reflected LDL-C baseline-target gap and prior statin use
If patients were statin free at baseline, we assigned them to 6 weeks of treatment with atorvastatin, at 10, 20, 40, or 80 mg/d, according to their baseline LDL-C level ( FIGURE 1 ). For patients who had been taking a statin at screening, starting doses of atorvastatin for each LDL-C increment were doubled.
If patients did not reach LDL-C targets at the end of 6 weeks, we titrated their regimen to the next higher dose for an additional 6 weeks. Patients initially allocated to receive atorvastatin at 80 mg who did not reach LDL-C targets continued at that dose, and we added a more intense therapeutic lifestyle intervention (NCEP II step 2 diet).1
We obtained blood samples at baseline screening, week 6, and week 12, to measure 12-hour fasting serum lipid profiles and to make routine safety assessments (hematology and chemistry). Patients received dietary counseling at all visits.
The ACTFAST protocol and amendments were approved by appropriately constituted central or local institutional review boards, and all patients gave written informed consent.
FIGURE 1
How treatment doses were determined
Statin-free patients received a specified dose of atorvastatin according to their baseline low-density lipoprotein cholesterol (LDL-C) level. Patients who had been treated with another statin at screening received atorvastatin at a dose double that given to statin-free patients with equivalent LDL-C levels, for a maximum dose of 80 mg.
Reprinted from Atherosclerosis, vol. 191, Martineau P, Gaw A, de Teresa E, et al, Effect of individualizing starting doses of a statin according to baseline LDL-cholesterol levels on achieving cholesterol targets: The Achieve Cholesterol Targets Fast with Atorvastatin Stratified Titration (ACTFAST) study, 135-146, © 2006, with permission from Elsevier.
Primary efficacy outcome: LDL-C levels of <100 mg/dL
The primary efficacy outcome was the proportion of patients with either diabetes or MetSyn achieving NCEP Adult Treatment Panel-III target LDL-C levels of <100 mg/dL (<2.6 mmol/L) after 12 weeks of treatment.1 Secondary efficacy parameters were described in ACTFAST 1.14
We analyzed data according to intention-to-treat (ITT), using the last observation carried forward (LOCF) for missing data. The ITT population consisted of all patients who took at least 1 dose of study medication, and had at least 1 subsequent assessment.
Results
Between January 2003 and February 2004, 3634 subjects were screened for ACTFAST 1 and 2, and 2717 patients were enrolled from 12 countries (Canada, Greece, Hungary, Ireland, Italy, Poland, Portugal, Russia, Slovakia, Spain, Switzerland, and the United Kingdom). Ethnicity was recorded for about 80% of patients; more than 90% were Caucasian.
Diabetes
The ITT population included 1024 patients with diabetes, of whom 97% had type 2 diabetes and 73% were statin-free ( TABLE 1 ). Baseline laboratory parameters are available online, in TABLE W1 .
After 12 weeks of treatment, 81% (95% confidence interval [CI], 77.8%-83.5%) of statin-free and 60% (95% CI, 53.9%-65.4%) of statin-treated patients with diabetes achieved LDLC target of <100 mg/dL ( FIGURE 2 ). In contrast, among patients without diabetes (n=1693), 77% (95% CI, 73.9%-79.3%) of statin-free and 59% (95% CI, 55.4%-62.5%) of statin-treated patients achieved target.
For diabetes patients, mean percent reductions in total cholesterol, TC/HDL-C, LDL-C, triglycerides, non-HDL-C and apolipoprotein B (apo B) were significant vs baseline for all doses in both statin-free and statin-treated subjects ( TABLE 2 ). Significant increases in HDL-C were seen only with the 10- and 80-mg doses in statin-free patients.
FIGURE 2
Patients who achieved an LDL-C level of <100 mg/dL
after receiving 12 weeks of atorvastatin
TABLE 1
Demographic profiles of patients with diabetes or metabolic syndrome
(This is an expanded version of the table that appeared in print.)
| DIABETES | STATIN-FREE (N=744) | STATIN-TREATED (N=280) | ALL (N=1024) |
|---|---|---|---|
| Men, n (%) | 410 (55.1) | 161 (57.5) | 571 (55.8) |
| Age, years | 60.9±10.9 | 62.2±10.1 | 61.3±10.7 |
| Weight, kg | 85.0±18.0 | 83.3±16.0 | 84.6±17.5 |
| Waist circumference, cm | 103.3±13.8 | 102.3±13.0 | 103.0±13.6 |
| Smokers, % | 16.5 | 12.5 | 15.4 |
| Type 2 diabetes, % (% treated with insulin) | 96.8 (16.3) | 96.8 (16.6) | 96.8 (16.3) |
| Blood pressure, mm Hg | 137.1±15.7/79.6±9.6 | 136.3±16.4/77.5±10.5 | 136.9±15.9/79.0±9.9 |
| CHD, % | 24.2 | 56.4 | 33.0 |
| PVD, % | 5.5 | 7.9 | 6.2 |
| CVD, % | 6.9 | 9.3 | 7.5 |
| METABOLIC SYNDROME | STATIN-FREE (N=839) | STATIN-TREATED (N=412) | ALL (N=1251) |
| Men, n (%) | 483 (57.6) | 248 (60.2) | 731 (58.4) |
| Age, years | 62.0±10.2 | 62.7±10.1 | 62.2±10.2 |
| Weight, kg | 87.4±17.2 | 85.7±15.1 | 86.9±16.6 |
| Waist circumference, cm | 106.2±12.3 | 104.8±12.6 | 105.7±12.4 |
| Smokers, % | 23.0 | 19.7 | 21.9 |
| Diabetes, % (% type 2 diabetes) (% treated with insulin) | 60.4 (98.6) (15.6) | 46.1 (98.9) (17.6) | 55.7 (98.7) (16.1) |
| Blood pressure, mm Hg | 140.1±14.8/81.4±9.3 | 139.7±14.6/79.4±10.0 | 140.0±14.7/80.7±9.6 |
| CHD, % | 41.8 | 75.5 | 52.9 |
| PVD, % | 6.4 | 9.0 | 7.3 |
| CVD, % | 9.8 | 10.0 | 9.8 |
| Mean±standard deviation for continuous variables. | |||
| CHD, coronary heart disease; PVD, peripheral vascular disease; CVD, cerebrovascular disease. | |||
TABLE 2
Mean percent change (95% CI) in lipid levels from baseline when patients with diabetes or metabolic syndrome took atorvastatin
(This is an expanded version of the table that appeared in print.)
| DIABETES | STATIN-FREE | STATIN-TREATED | |||||
|---|---|---|---|---|---|---|---|
| 10 MG (N=395) | 20 MG (N=98) | 40 MG (N=90) | 80 MG (N=161) | 20 MG (N=216) | 40 MG (N=28) | 80 MG (N=36) | |
| Total cholesterol* | -23.0 (-24.3 to -21.7) | -31.6 (-33.8 to -29.3) | -38.1 (-40.5 to -35.7) | -41.2 (-43.3 to -39.1) | -16.9 (-18.6 to -15.2) | -30.4 (-36.0 to -24.9) | -34.2 (-39.4 to -30.0) |
| LDL-C* | -33.9 (-35.6 to -32.2) | -43.4 (-46.0 to -40.7) | -51.0 (-54.1 to -48.0) | -53.0 (-55.6 to -50.4) | -23.9 (-26.3 to -21.6) | -40.3 (-47.2 to -33.5) | -42.1 (-50.2 to -33.9) |
| HDL-C | 2.9† (1.4 to 4.3) | 0.4 (-2.1 to 2.9) | -0.7 (-3.9 to 2.6) | -2.8† (-4.9 to -0.6) | -0.8 (-2.6 to 1.0) | 0.5 (-4.8 to 5.8) | -0.8 (-3.8 to 2.2) |
| TC/HDL-C* | -24.2 (-25.7 to -22.7) | -31.2 (-34.1 to -28.4) | -36.7 (-39.5 to -33.9) | -39.1 (-41.0 to -37.3) | -15.1 (-17.3 to -12.9) | -30.2 (-35.6 to -24.7) | -33.3 (-37.8 to -28.8) |
| Triglycerides* | -14.4 (-17.3 to -11.4) | -19.1 (-24.5 to -13.6) | -23.6 (-29.5 to -17.7) | -23.6 (-28.3 to -18.9) | -7.3 (-13.2 to -1.4) | -24.9 (-35.7 to -14.1) | -20.7 (-29.5 to -11.9) |
| Non-HDL-C* | -30.8 (-32.4 to -29.3) | -40.6 (-43.5 to -37.7) | -47.9 (-50.7 to -45.1) | -50.0 (-52.3 to -47.6) | -21.8 (-24.0 to -19.6) | -38.3 (-44.9 to -31.7) | -42.3 (-47.2 to -37.4) |
| Apo B* | -30.6 (-32.0 to -29.1) | -39.1 (-41.6 to -36.6) | -46.2 (-48.7 to -43.6) | -47.8 (-50.0 to -45.6) | -22.3 (-24.2 to -20.4) | -34.7 (-40.3 to -29.0) | -39.1 (-43.6 to -34.6) |
| METABOLIC SYNDROME | STATIN-FREE | STATIN-TREATED | |||||
| 10 MG (N=418) | 20 MG (N=103) | 40 MG (N=104) | 80 MG (N=214) | 20 MG (N=290) | 40 MG (N=47) | 80 MG (N=75) | |
| Total cholesterol* | -24.6 (-25.8 to -23.3) | -31.6 (-33.6 to -29.5) | -37.6 (-39.7 to -35.5) | -39.5 (-41.4 to -37.6) | -16.2 (-17.7 to -14.7) | -30.3 (-33.5 to -27.2) | -33.0 (-36.0 to -30.1) |
| LDL-C* | -34.6 (-36.1 to -33.0) | -43.4 (-46.1 to -40.6) | -49.3 (-51.9 to -46.7) | -50.3 (-52.7 to -47.9) | -21.8 (-23.7 to -19.9) | -40.4 (-44.1 to -36.7) | -41.3 (-45.9 to -36.8) |
| HDL-C | 4.4† (2.9 to 5.8) | 2.9† (0.3 to 5.5) | 2.3 (-0.6 to 5.3) | 2.0 (-0.1 to 4.2) | 1.3 (-0.3 to 2.9) | 4.1† (0.3 to 7.8) | -1.6 (-3.7 to 0.6) |
| TC/HDL-C* | -26.6 (-28.1 to -25.1) | -32.6 (-35.4 to -29.8) | -38.2 (-40.6 to -35.9) | -39.5 (-41.9 to -37.0) | -16.2 (-18.0 to -14.4) | -32.3 (-35.6 to -29.1) | -31.4 (-34.8 to -28.1) |
| Triglycerides* | -18.8 (-21.7 to -15.8) | -22.8 (-27.9 to -17.8) | -28.8 (-33.7 to -23.9) | -29.5 (-33.0 to -26.0) | -12.6 (-16.7 to -8.6) | -32.4 (-39.1 to -25.6) | -21.7 (-28.1 to -15.3) |
| Non-HDL-C* | -32.2 (-33.7 to -30.7) | -39.9 (-42.6 to -37.2) | -46.7 (-49.1 to -44.3) | -47.9 (-50.0 to -45.8) | -20.9 (-22.8 to -19.1) | -38.9 (-42.5 to -35.2) | -39.8 (-43.3 to -36.3) |
| Apo B* | -31.9 (-33.2, to -30.5) | -39.4 (-41.9 to -37.0) | -45.4 (-47.6 to -43.2) | -45.4 (-47.4 to -43.4) | -21.4 (-23.0 to -19.7) | -36.2 (-39.5 to -32.8) | -38.3 (-41.6 to -35.1) |
| CI, confidence interval; LDL-C, low-density lipoprotein cholesterol; HDL-C, high-density lipoprotein cholesterol; TC/HDL-C, total cholesterol/HDL-C ratio; Apo B, apolipoprotein B. | |||||||
| *P<.05 from baseline for all doses. | |||||||
| †P<.05 from baseline for a specific dose. | |||||||
Metabolic syndrome
The ITT population included 1251 patients with MetSyn, of whom 56% also had diabetes and 67% were statin-free ( TABLE 1 ). Baseline laboratory parameters are in TABLE W1 .
After 12 weeks of treatment, 78% (95% CI, 74.9%-80.5%) of statin-free and 57% (95% CI, 52.5%-62.1%) of statin-treated patients achieved LDL-C target of <100 mg/dL ( FIGURE 2 ). Among patients without MetSyn (n=1454), 79% (95% CI, 76.2%-81.7%) of statin-free and 61% (95% CI, 56.8%-64.6%) of statin-treated patients achieved target. (Because of missing data, the presence or absence of MetSyn could not be confirmed in 12 patients.)
Mean percent reductions for MetSyn patients in total cholesterol, TC/HDL-C, LDL-C, triglycerides, non-HDL-C, and apo B were significant vs baseline for all doses in both statin-free and statin-treated patients ( TABLE 2 ). HDL-C increased significantly in the 10- and 20-mg statin-free groups and in the 40-mg statin-treated group.
Treatment was well tolerated
The incidences of treatment-related adverse events were similar in all patient groups, at around 10%. Most events were mild to moderate, with severe events reported in only 0.5% and 0.8% of patients with diabetes and MetSyn, respectively. Incidences of treatment-related musculoskeletal adverse events were 1.9% and 2%, respectively, in patients with and without diabetes; and were 1.7% and 2.3% in patients with and without MetSyn.
The incidence of elevations in aspartate aminotransferase (AST) or alanine aminotransferase (ALT) >3 times and creatine kinase (CK) >10 times the upper limit of normal were 1.1% and 0.1%, respectively, for patients with diabetes, and 0.9% and 0.08% for those with MetSyn, which did not differ from those of patients without diabetes (1.2% and 0%, respectively) or MetSyn (1.3% and 0%, respectively).
TABLE W1
Baseline lipid values for patients with diabetes or metabolic syndrome (mean ± SD)
| DIABETES | STATIN-FREE (N=744) | STATIN-TREATED (N=280) | ALL (N=1024) |
|---|---|---|---|
| Total cholesterol, mg/dL | 225.8±32.7* | 210.8±29.9 | 221.7±32.6 |
| LDL-C, mg/dL | 149.4±26.8* | 133.8±24.3 | 145.1±27.0 |
| HDL-C, mg/dL | 50.0±12.5 | 50.2±12.0 | 50.1±12.4 |
| TC/HDL-C | 4.7±1.1* | 4.4±1.0 | 4.6±1.1 |
| Triglycerides, mg/dL | 173.8±85.1 | 179.4±80.4 | 175.3±83.8 |
| Apo B, g/L | 1.1±0.2 | 1.1±0.2 | 1.1±0.2 |
| HbA1C, % | 7.2±1.2 | 7.4±1.3 | 7.3±1.2 |
| FPG, mmol/L | 8.2±2.9 | 8.2±2.6 | 8.2±2.8 |
| METABOLIC SYNDROME | STATIN-FREE (N=839) | STATIN-TREATED (N=412) | ALL (N=1251) |
| Total cholesterol, mg/dL | 229.3±34.1* | 215.7±32.7 | 224.9±34.2 |
| LDL-C, mg/dL | 152.3±27.8* | 137.8±26.6 | 147.5±28.3 |
| HDL-C, mg/dL | 45.3±11.0 | 46.1±10.4 | 45.5±10.8 |
| TC/HDL-C | 5.3±1.3* | 4.9±1.1 | 5.2±1.2 |
| Triglycerides, mg/dL | 206.4±88.7 | 211.2±83.7 | 208.0±87.1 |
| Apo B, g/L | 1.2±0.2 | 1.1±0.2 | 1.2±0.2 |
| HbA1C, % | 6.7±1.2 | 6.6±1.2 | 6.7±1.2 |
| FPG, mmol/L | 7.4±2.5 | 7.1±2.3 | 7.3±2.4 |
| LDL-C, low-density lipoprotein cholesterol; HDL-C, high-density lipoprotein cholesterol; TC/HDL-C, total cholesterol/HDL-C ratio; Apo B, apolipoprotein B; HbA1C, hemoglobin A1C; FPG, fasting plasma glucose; SD, standard deviation. | |||
| *P<.05 statin-free vs statin-treated. | |||
Discussion
Despite their increased cardiovascular risk, patients with diabetes and MetSyn often do not reach lipid targets.17 In patients with diabetes, lowering LDL-C levels reduces the risk of a cardiovascular event by 25% to 50%.18-23 Atorvastatin has demonstrated its efficacy for the primary prevention of cardiovascular events among patients with diabetes.22,23
MetSyn also increases the risk of cardiovascular events and mortality.10-13 Atorvastatin has been used effectively to achieve LDL-C goals in hypercholesterolemic patients with MetSyn.24,25
Higher starting doses of statins are generally beneficial. This substudy of ACTFAST demonstrates that by initiating therapy at doses selected according to baseline LDL-C levels, 81% of statin-free and 60% of statin-treated subjects with diabetes and 78% of statin-free and 57% of statin-treated subjects with MetSyn achieved a target LDL-C of <100 mg/dL within 6 to 12 weeks. Among statin-treated patients, atorvastatin provided additional reduction in lipid parameters over what was achieved with the statin they had been using at baseline.
Other studies have also suggested that patients at high risk for cardiovascular events, such as those with diabetes or MetSyn, may benefit from starting therapy at a higher dose of atorvastatin.14,15,26,27 In the New Atorvastatin Starting Doses: A Comparison (NASDAC) study, patients were randomized to receive various starting doses of atorvastatin, regardless of their baseline LDL-C value.26 The proportion of patients with CHD or a CHD-equivalent (of whom 150 had diabetes) who achieved LDL-C target (<100 mg/dL) with 10, 20, 40, and 80 mg/d was 47%, 66%, 81% and 80%, respectively, demonstrating that a higher starting dose is required to achieve target.
However, lower doses may work depending on LDL-C levels. In contrast to NASDAC, statin-free patients with diabetes or MetSyn in ACTFAST showed better results on 10- and 20-mg doses, because baseline LDL-C was taken into account. The Atorvastatin Goal Achievement Across Risk Levels (ATGOAL) study used a design similar to ACTFAST, assigning patients with dyslipidemia to starting doses of atorvastatin for 8 weeks, at 10, 20, 40, or 80 mg, based on their CHD risk category and the magnitude of LDL-C reduction necessary to reach lipid targets.27 Of the 1298 patients, 705 were at high CHD risk (43.8% with diabetes), and 81.1% of these high-risk patients achieved an LDL-C <100 mg/dL.
No safety issues arose when initiating atorvastatin at higher doses in patients with diabetes or MetSyn. The incidence of clinically elevated AST, ALT, or CK levels in ACTFAST was low and comparable to that reported in meta-analyses (0.96%).28,29
Benefits of our dosing algorithm seem clear. Aggressive treatment with atorvastatin across the dose range improves LDL-C target achievement compared with usual care,30,31 and current NCEP-III recommendations support the use of a higher initial dose in patients requiring large LDL-C reductions.1 Atorva-statin is approved in many countries at starting doses ranging from 10 to 40 mg, with a titration to 80 mg, if needed, to achieve LDL-C target. ACTFAST suggests that, in patients with diabetes or MetSyn, initiation of atorvastatin at a dose appropriate for the required level of LDL-C reduction would facilitate achievement of LDL-C targets.
One meta-analysis of trials demonstrated that a 10-mg/dL reduction in LDL-C could result in a 5.4% reduction in major vascular events and a 3.1% reduction in all-cause mortality over 5 years.32 In our study, patients with diabetes or MetSyn experienced reductions in LDL-C of approximately 57 mg/dL, which, if maintained over 5 years, could be expected to translate into reductions of 30% in major vascular events and 17% in mortality. Therefore, a regimen that allows a larger number of high-risk patients to achieve substantial reductions in LDL-C levels quickly could significantly improve cardiovascular outcomes.
Limitations of our study include the fact that the trial was not blinded, the size of the dosing groups was unequal, and there was no control group. However, it is unlikely that reduction of LDL-C was due to chance. Also, this study was not designed to investigate the effect of lowering LDL-C on the incidence of cardiovascular events.
Correspondence
Lawrence A. Leiter, MD, University of Toronto, St. Michael's Hospital, 61 Queen St. E.,#6121Q, Toronto, Ontario, Canada. M5C 2T2; [email protected]
1. NCEP. Executive Summary of The Third Report of The National Cholesterol Education Program (NCEP) Expert Panel on Detection, Evaluation, And Treatment of High Blood Cholesterol In Adults (Adult Treatment Panel III). JAMA. 2001;285:2486-2497.
2. Olson K, Tsuyuki R. Patients' achievement of cholesterol targets: a cross-sectional evaluation. Am J Prev Med. 2003;25:339-342.
3. Pearson T, Laurora I, Chu H, et al. The lipid treatment assessment project (L-TAP): a multicenter survey to evaluate the percentages of dyslipidemic patients receiving lipid-lowering therapy and achieving low-density lipoprotein cholesterol goals. Arch Intern Med. 2000;160:459-467.
4. Leiter L, Betteridge D, Chacra A, et al. AUDIT study. Evidence of global undertreatment of dyslipidaemia in patients with type 2 diabetes mellitus. Br J Diabetes Vasc Dis. 2006;6:31-40.
5. Haffner S, Lehto S, Ronnemaa T, et al. Mortality from coronary heart disease in subjects with type 2 diabetes and in nondiabetic subjects with and without prior myocardial infarction. N Engl J Med. 1998;339:229-234.
6. Grundy S, Cleeman J, Merz C, et al. Implications of recent clinical trials for the National Cholesterol Education Program Adult Treatment Panel III guidelines. Circulation. 2004;110:227-239.
7. Grundy SM. Diabetes and coronary risk equivalency: what does it mean? Diabetes Care. 2006;29:457-460.
8. Miettinen H, Lehto S, Salomaa V, et al. Impact of diabetes on mortality after the first myocardial infarction. The FINMONICA Myocardial Infarction Register Study Group. Diabetes Care. 1998;21:69-75.
9. Hurst RT, Lee RW. Increased incidence of coronary atherosclerosis in type 2 diabetes mellitus: mechanisms and management. Ann Intern Med. 2003;139:824-834.
10. McNeill A, Rosamond W, Girman C, et al. The metabolic syndrome and 11-year risk of incident cardiovascular disease in the atherosclerosis risk in communities study. Diabetes Care. 2005;28:385-390.
11. Lakka H, Laaksonen D, Lakka T, et al. The metabolic syndrome and total and cardiovascular disease mortality in middle-aged men. JAMA. 2002;288:2709-2716.
12. Hu G, Qiao Q, Tuomilehto J, et al. Prevalence of the metabolic syndrome and its relation to all-cause and cardiovascular mortality in nondiabetic European men and women. Arch Intern Med. 2004;164:1066-1076.
13. Ford E. The metabolic syndrome and mortality from cardiovascular disease and all-causes: findings from the National Health and Nutrition Examination Survey II Mortality Study. Atherosclerosis. 2004;173:309-314.
14. Martineau P, Gaw A, de Teresa E, et al. Effect of individualizing starting doses of a statin according to baseline LDL-cholesterol levels on achieving cholesterol targets: The Achieve Cholesterol Targets Fast with Atorvastatin Stratified Titration (ACTFAST) study. Atherosclerosis. 2006;191:135-146.
15. Farsang C, Athyros V, Gaw A. A multicentre, open study to assess the effect of individualizing starting doses of atorvastatin according to baseline LDL-C levels on achieving cholesterol targets: the Achieve Cholesterol Targets Fast with Atorvastatin Stratified Titration (ACTFAST-2) study. Curr Med Res Opin. 2007;23:1945-1956.
16. Report of the expert committee on the diagnosis and classification of diabetes mellitus. Diabetes Care. 2002;25(suppl 1):S5-S20.
17. Saydah SH, Fradkin J, Cowie CC. Poor control of risk factors for vascular disease among adults with previously diagnosed diabetes. JAMA. 2004;291:335-342.
18. Haffner S, Alexander C, Cook T, et al. Reduced coronary events in simvastatin-treated patients with coronary heart disease and diabetes or impaired fasting glucose levels: subgroup analyses in the Scandinavian Simvastatin Survival Study. Arch Intern Med. 1999;159:2661-2667.
19. Goldberg RB, Mellies MJ, Sacks FM, et al. Cardiovascular events and their reduction with pravastatin in diabetic and glucose-intolerant myocardial infarction survivors with average cholesterol levels: subgroup analyses in the cholesterol and recurrent events (CARE) trial. The Care Investigators. Circulation. 1998;98:2513-2519.
20. American Diabetes Association: clinical practice recommendations 2002. Diabetes Care. 2002;25(suppl 1):S1-S147.
21. Sacks FM, Tonkin AM, Shepherd J, et al. Effect of pravastatin on coronary disease events in subgroups defined by coronary risk factors: the Prospective Pravastatin Pooling Project. Circulation. 2000;102:1893-1900.
22. Sever PS, Poulter NR, Dahlof B, et al. Reduction in cardiovascular events with atorvastatin in 2532 patients with type 2 diabetes: Anglo-Scandinavian Cardiac Outcomes Trial—lipid-lowering arm (ASCOT-LLA). Diabetes Care. 2005;28:1151-1157.
23. Colhoun HM, Betteridge DJ, Durrington PN, et al. Primary prevention of cardiovascular disease with atorvastatin in type 2 diabetes in the Collaborative Atorvastatin Diabetes Study (CARDS): multicentre randomised placebo-controlled trial. Lancet 2004;364:685-696.
24. Stender S, Schuster H, Barter P, et al. Comparison of rosuvastatin with atorvastatin, simvastatin and pravastatin in achieving cholesterol goals and improving plasma lipids in hypercholesterolaemic patients with or without the metabolic syndrome in the MERCURY I trial. Diabetes Obes Metab. 2005;7:430-438.
25. Hunninghake D, Ballantyne C, Maccubbin D, et al. Comparative effects of simvastatin and atorvastatin in hypercholesterolemic patients with characteristics of metabolic syndrome. Clin Ther. 2003;25:1670-1686.
26. Jones PH, McKenney JM, Karalis DG, et al. Comparison of the efficacy and safety of atorvastatin initiated at different starting doses in patients with dyslipidemia. Am Heart J. 2005;149(1):e1-e8.Available at: http://www.ahjonline.com/article/S0002-8703(04)00476-4/fulltext. Accessed September 10, 2008.
27. McKenney JM, Davidson MH, Saponaro J, et al. Use of a treatment algorithm to achieve NCEP ATP III goals with atorvastatin. J Cardiovasc Pharmacol. 2005;46:594-599.
28. Newman CB, Palmer G, Silbershatz H, et al. Safety of atorvastatin derived from analysis of 44 completed trials in 9416 patients. Am J Cardiol. 2003;92:670-676.
29. Newman C, Tsai J, Szarek M, et al. Comparative safety of atorvastatin 80 mg versus 10 mg derived from analysis of 49 completed trials in 14,236 patients. Am J Cardiol. 2006;97:61-67.
30. Athyros V, Papageorgiou A, Mercouris B, et al. Treatment with atorvastatin to the National Cholesterol Educational Program goal versus 'usual' care in secondary coronary heart disease prevention. The GREek Atorvastatin and Coronary-heart-disease Evaluation (GREACE) study. Curr Med Res Opin. 2002;18:220-228.
31. Koren MJ, Hunninghake DB. Clinical outcomes in managed-care patients with coronary heart disease treated aggressively in lipid-lowering disease management clinics: the alliance study. J Am Coll Cardiol. 2004;44:1772-1779.
32. Baigent C, Keech A, Kearney PM, et al. Efficacy and safety of cholesterol-lowering treatment: prospective meta-analysis of data from 90,056 participants in 14 randomised trials of statins. Lancet. 2005;366:1267-1278.