User login
Hemoglobin Levels in Hospitalized Patients
Studies of the red blood cell mass performed in hospitalized patients were first done in the early 1970s.1 Thereafter, a decrease in the hemoglobin concentration ([Hb]) and its potential causes have been further reported, especially in critically ill patients.25 The decrease in [Hb] can occur as a result of blood draws for diagnostic testing; blood loss associated with invasive procedures and bleeding; occult gastrointestinal bleeding; hemolysis; shortening of red cell survival; iron, folic acid or cobalamine deficiencies; renal, liver or endocrine failure; hemodilution associated with fluid therapy; and the so‐called anemia of inflammation (AI).68 The latter would be a consequence of a blunted response of the bone marrow due to several factors such as inadequate secretion of erythropoietin, inhibition of the proliferation and differentiation of the erythroid precursors of the bone marrow and an hepcidin‐mediated functional iron deficiency.810
As mentioned, most studies were done in critically ill patients and scarce information is available about general ward admitted patients (GWAP) with less severe illnesses. In this scenario, some of the proposed mechanisms may have a less clear role. It is widely accepted that [Hb] may decrease without overt bleeding in GWAP. However, given the lack of information on this matter, laboratory controls and invasive procedures are undertaken to determine its potential causes.
The purpose of the present study is to describe [Hb] variation over time in nonbleeding GWAP, to estimate the proportion of patients with [Hb] decreases 1.5 g/dL, and to evaluate possible related variables.
Materials and Methods
A 16‐week (September 2004‐January 2005) prospective observational study was conducted in Internal Medicine GWAP at 2 Buenos Aires teaching hospitals.
All consecutive patients older than 16 years were evaluated. Patients admitted for the following reasons were excluded: bleeding, trauma, surgery, invasive procedures associated with blood loss (biopsies, biliary drainage, endovascular therapeutic procedures, and chest tubes), blood transfusions, anemia, chemotherapy, and acute renal failure.
Patients with a bleeding history, chemotherapy or radiation therapy within two months prior to admission, patients on dialysis and patients with current oncologic or hematologic disease were excluded, as well as those with length of stay less than 3 days, or with less than 2 [Hb] or hematocrit (HCT) measurements.
Patients were followed until discharge, death or transfer to a critical care unit. Patients were withdrawn from the study if they presented with bleeding or hemolysis, underwent red blood cell transfusion or therapy affecting hemoglobin levels (iron, chemotherapy or erythropoietin) or if either a surgical or invasive procedure associated with blood loss was performed.
Data were collected from patients' medical records and additional information was obtained from treating physicians and patients by the authors (AL, NC, SM, AN, MH). Standardized case report forms were completed during the hospitalization including: age, sex, admissions in the previous 3 months (readmissions) and whether or not the patient lived in a nursing home. Patients were categorized according to discharge diagnosis as reported by Nguyen et al.4 with modifications related to our general ward population. Upon admission Katz daily activity index (ADL),11, 12 APACHE II acute physiology score (APS),13, 14 and Charlson comorbidity score (Charlson)15, 16 were assessed. In all cases the [Hb] and HCT values were registered on admission and on days 3, 6, 10 and prior to discharge as well as any other determination required by the treating physician. Anemia was defined as [Hb] 13 g/dL for men and 12 g/dL for women.17 Based on previous reports a 1.5 g/dL decrease in [Hb] and of 4.5 points in HCT compared to admission values were considered a significant fall.1, 4 Acute renal failure was defined as an increase in creatinine level 0.5 mg/dL or a 50% increase from baseline.18, 19
Every procedure without significant blood loss (PWSBL) such as venous catheter placement, thoracentesis, lumbar punction, paracentesis, skin biopsy, arthrocentesis, and diagnostic angiogram was also recorded. The study was approved by the Hospital's ethical committee.
Data analysis and processing were performed with Excel 2000 and Stata version 8.0 (Stata Corp; USA). For continuous variables, results were expressed by the mean value its standard deviation (SD), and compared with Student's t‐test. The chi‐square test was used to compare categorical variables. A survival curve was developed with the Kaplan‐Meier method to analyze the time to a significant fall in [Hb]. Finally, Cox proportional hazard modeling was performed to assess the association between a significant fall in [Hb] and other variables. We accepted P < 0,05 as significant.
Results
A total of 338 patients were admitted to the Internal Medicine Inpatient Services in the study period. Thirty‐nine percent (131) of these patients were included. Exclusion criteria were: diagnosis at admission (n = 95, 45.9%), past medical history (n = 56, 27%) and length of stay less than 3 days, or less than 2 determinations of [Hb] or HCT (n = 56, 27%). Data collection was discontinued for the following reasons: discharge (81.7%), death (6.9%), surgery or procedures associated with blood loss (5.3%), transfer to a critical care unit (3%), transfusions (2.3%), and chemotherapy (0.8%). The baseline characteristics of the study patients are shown in Table 1.
| n | % | Mean (SD) | Median | Min/Max | |
|---|---|---|---|---|---|
| |||||
| Age, years | 71.9 (17.4) | 77 | 18/97 | ||
| 18‐40 | 11 | 8.4 | |||
| 41‐60 | 16 | 12.2 | |||
| 61‐80 | 52 | 39.7 | |||
| >80 | 52 | 39.7 | |||
| Gender | |||||
| Female | 75 | 57.2 | |||
| Lenght of stay (days) | 7 (4.8) | 6 | 3/28 | ||
| APS | 4.9 (4.2) | 4 | 0/22 | ||
| 0‐4 | 71 | 54.2 | |||
| 5‐8 | 36 | 27.5 | |||
| >8 | 24 | 18.3 | |||
| ADL | 4.5 (2.3) | 6 | 0/6 | ||
| 0‐2 | 33 | 25.2 | |||
| 3‐5 | 11 | 8.4 | |||
| 6 | 87 | 66.4 | |||
| CHARLSON | 2.2 (2.3) | 2 | 0/11 | ||
| 0 | 32 | 24.4 | |||
| 1 | 32 | 24.4 | |||
| 2 | 22 | 16.8 | |||
| 3 | 18 | 13.7 | |||
| >3 | 27 | 20.6 | |||
| Readmissions | 28 | 21.4 | |||
| PWSBL | 14 | 10.7 | |||
| Anemia at admission | 63 | 48.1 | |||
| [Hb] at admission | 12.5 (1.7) | 12.5 | 8.6/17 | ||
| [Hb] at admission males | 12.8 (1.9) | 12.6 | 8.7/17 | ||
| [Hb] at admission females | 12.3(1.5) | 12.3 | 8.6/15.5 | ||
Diagnoses at discharge were divided into the following categories: infections (25.2%), electrolyte disturbances (7.6%), cardiac diseases (9.9%), neurologic (19.1%), respiratory (16.8%), gastrointestinal (10.7%), and other diagnosis (10.7%).
No evidence of bleeding was found in the included patients. Bleeding was only observed in 4 of the initially evaluated patients who were excluded since they failed to meet the required number of [Hb] determinations before bleeding.
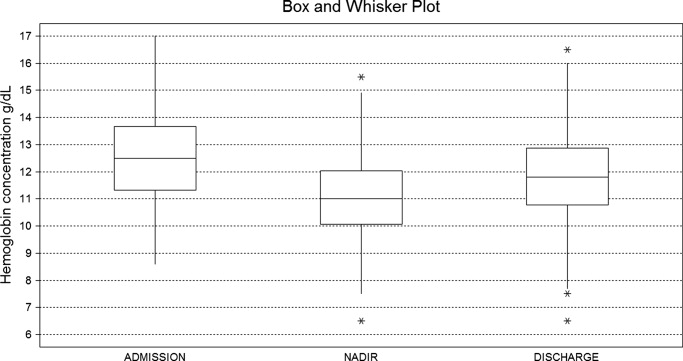
A mean decrease in [Hb] of 0.71 g/dL was found between admission and discharge day (P < 0.001; 95% CI, 0.47‐0.97). Mean nadir [Hb] was 1.45 g/dL lower than admission [Hb] (P < 0.001; 95% CI, 1.24‐1.67). Mean nadir day occurred between hospitalization days 3 and 4. Mean [Hb] at discharge was 11.8 1.8 g/dL. This value is higher than the mean concentration at nadir (0.74 g/dL P < 0.001; 95% CI, 0.60‐0.97) (Figure 1).

Table 2 shows the rate of patients with a decrease in the [Hb] for different cutoff levels. Forty‐five percent of the study population (59 patients) had a significant fall in [Hb] during hospitalization. This was observed on day 2 in 50% of the patients. Likewise, a significant fall in HCT value was found in 42.7% of patients. If [Hb] decrease during hospitalization is analyzed as a proportion of [Hb] at admission, 52.7% of patients had a 10% or greater [Hb] decrease during their hospital stay.
| [Hb] fall (g/dL) | 0.5 | 1 | 1.5 | 2 | 2.5 | 3 | 3.5 | 4 | 4.5 |
|---|---|---|---|---|---|---|---|---|---|
| % of patients | 80.9 | 60.3 | 45.0 | 28.2 | 17.6 | 9.9 | 5.3 | 3.8 | 2.3 |
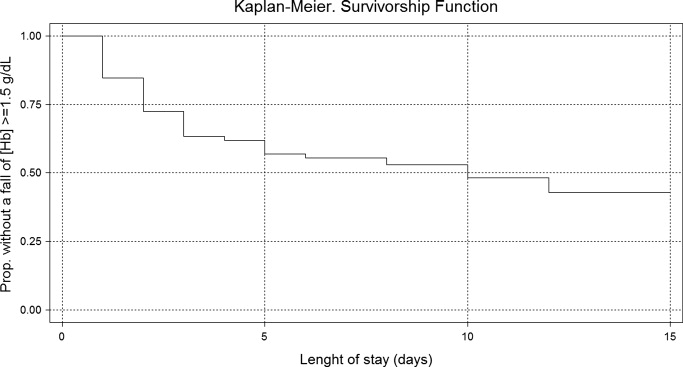
Using Kaplan‐Meier analysis, the estimated proportion showing no significant fall of [Hb] was 0.63 (95% CI, 0.55‐0.71) on day 3 and 0.48 (95% CI, 0.29‐0.67) on day 10. By day 15, only 3.8% of the initially included patients were still hospitalized and showed no decrease in [Hb] 1.5 g/dl. These patients maintained their [Hb] stable for the rest of the follow up period (Figure 2).
In the univariate analysis, comparing patients that experienced a decrease in [Hb] 1.5 g/dL with those who did not, significant differences were only found in the following variables: length of stay, APS, anemia at admission, [Hb] at admission, and infectious, gastrointestinal or cardiac diseases at discharge diagnosis (Table 3).
| Patients with a significant fall | Patients without a significant fall | P Value | |
|---|---|---|---|
| |||
| n | 59 (45%) | 72 (55%) | |
| Age, years | 73.15 (18.7) | 70.83 (16.2) | 0.448 |
| Gender, female | 32 (54.2%) | 43 (59.7%) | 0.527 |
| Length of stay (days) | 8.30 (5.6) | 5.91 (3.7) | <0.007 |
| APS | 6.13 (4.5) | 3.97 (3.7) | <0.004 |
| ADL | 4.33 (2.5) | 4.68 (2.1) | 0.410 |
| CHARLSON | 2.03 (1.8) | 2.37 (2.5) | 0.382 |
| Nurse home residents | 4 (6.8%) | 3 (4.2%) | 0.700 |
| Readmissions | 11 (18.6%) | 17 (23.6%) | 0.490 |
| PWSBL | 6 (10.2%) | 8 (11.1%) | 0.862 |
| Anemia at admission | 20 (33.9%) | 43 (59.7%) | <0.004 |
| [Hb] at admission | 13.09 (1.7) | 12.01 (1.5) | <0.001 |
| Diagnosis at discharge | |||
| Infectious | 20 (33.9%) | 13 (18.1%) | <0.05 |
| Respiratory | 8 (13.6%) | 14 (19.4%) | 0.370 |
| Neurologic | 9 (15.2%) | 16 (22.2%) | 0.312 |
| Gastrointestinal | 11 (18.6%) | 3 (4.2%) | <0.01 |
| Cardiac | 2 (3.4%) | 11(15.3%) | <0.05 |
| Electrolyte disturbances | 6 (10.2%) | 4 (5.6%) | 0.512 |
| Others | 3 (5.1%) | 11 (15.3%) | 0.087 |
In the Cox proportional hazard model adjusting for the variables shown in Table 4, a significant independent direct association was found between a significant fall in [Hb] during hospital stay and APS, [Hb] at admission, and either diagnosis of infectious or gastrointestinal disease at discharge. Similar results were found if a significant fall was redefined as a 12% decrease in [Hb] or as a 4.5 point decrease in HCT from baseline.
| Variable | HRR | P Value | 95% CI |
|---|---|---|---|
| |||
| APS | 1.07 | 0.007 | 1.02‐1.12 |
| ADL | 1.11 | 0.132 | 0.97‐1.27 |
| Charlson | 0.88 | 0.121 | 0.75‐1.03 |
| Nurse home resident | 1.52 | 0.361 | 0.62‐3.72 |
| PWSBL | 0.67 | 0.390 | 0.27‐1.66 |
| Readmission | 1.14 | 0.710 | 0.57‐2.29 |
| Female sex | 0.98 | 0.944 | 0.57‐1.69 |
| Age | 1.39 | 0.098 | 0.94‐2.07 |
| [Hb] at admission | 1.27 | 0.005 | 1.07‐1.51 |
| Diagnosis at discharge | |||
| Infectious | 2.70 | 0.015 | 1.21‐6.05 |
| Neurologic | 1.42 | 0.457 | 0.57‐3.55 |
| Gastrointestinal | 3.74 | 0.002 | 1.62‐8.64 |
| Cardiac | 0.41 | 0.289 | 0.08‐2.12 |
| Electrolyte dist. | 2.08 | 0.176 | 0.72‐6.05 |
| Others | 0.95 | 0.946 | 0.24‐3.81 |
Discussion
This study describes the variation of [Hb] and HCT values in GWAP without bleeding or other obvious medical conditions associated with a decrease in the red blood cell mass. As previously described,4, 20, 21 we found that [Hb] decreases during hospital stay are frequently observed. The mean [Hb] fall from admission was 1.45 g/dL, and was mainly recorded between hospitalization days 3 and 4. In approximately half of the study population, a 1.5 g/dL decrease in [Hb] was observed. In the survival analysis, 40% and 55% of patients are expected to present such a fall on day 4 and 12 respectively. In accordance with prior reports4, 21 a greater decrease in [Hb] occurred in the first days of hospitalization, and a high proportion of patients were already anemic at the time of admission.
The following variables were associated with a decrease in the [Hb] during hospitalization: higher APS score, higher [Hb] at admission, and diagnosis of infectious or gastrointestinal disease at discharge. Even though several mechanisms seem to contribute to the decrease in [Hb] during hospitalization our data suggest that 1 of these factors seems to be the severity of the disease, as previously proposed by Nguyen et al.4 This observation is supported by the association found in our study between [Hb] decrease and APS. No association was found with Charlson, ADL, and being a nursing home resident. These variables, which have not been previously analyzed, seem to indicate that patients with chronic illnesses are not more likely to have decreases in [Hb] during hospitalization.
Patients with higher [Hb] at admission had a greater [Hb] decrease during their hospital stay. This finding could suggest that the mechanism related to this decrease had less effect on patients with lower [Hb]. This is similar to that observed in the anemia of chronic diseases where [Hb] does not usually fall to extreme values. Our analysis reveals a greater decrease during the first days of hospitalization. Given the high rate of patients anemic at admission, it is possible that the decrease in [Hb] had begun prior to admission.
Previous papers describe a low prevalence of cyanocobalamine (2%), folic acid (2%), and iron (9%) deficiency in patients admitted to critical care units.3 In these patients an inadequate bone marrow response has been proposed as a mechanism for [Hb] decrease, a phenomenon that has been called AI or anemia of critical illness.8, 2228 Inflammatory response associated with acute disease causes this hypoproliferative anemia through 3 different pathways: relative erythropoietin deficit, a direct inhibition of the erythropoiesis in the bone marrow through different mediators (ie, interleukin [IL]‐1, IL‐6, tumor necrosis factor [TNF]) and a functional iron deficit. This relative iron deficiency is produced mainly by the IL‐6 induced overexpression of the hepcidin gene in hepatocytes. Hepcidin causes impaired intestinal iron absorption and an inadequate delivery of iron from the iron‐recycling macrophages to the erythroid precursors in the bone marrow.8, 9
AI could explain some of our findings, such as the greater decrease observed in the first hospital days when inflamatory mediators levels are expected to be higher. The association between APS and infectious disease diagnosis and a greater [Hb] decrease may also be explained by this mechanism. Nonetheless, the daily bone marrow production of red blood cells is small compared with the circulating red mass cell and therefore it is necessary to have a better explanation on how AI could be associated with this rapid decrease in the [Hb]. Rice et al.30, 31 have explored some mechanisms leading to a rapid decrease in the red mass cell related to acute variations in erytropoietin level. A role of this mechanism and other could be hypothesized.29
Overt bleeding was not found in our study population and procedures without significant blood loss (PWSBL) were infrequent, therefore it is unlikely that they could have had an impact on the decrease of [Hb]. The influence of other variables, such as blood volume drawn for diagnostic testing and occult blood losses (especially from the gastrointestinal tract) was not investigated. Parenteral hydration and hemodilution neither were evaluated in our study nor were extensively described in the literature. We think this last mentioned mechanism plays a role in the large [Hb] decrease during the first days of hospitalization. However a lack of association was mentioned in the only study that evaluated this issue in critically ill patients. Intravascular hemolysis has been cited as an infrequent event in these patients.2, 4
Only patients without a clear explanation for their [Hb] decrease were included because they represent a matter of concern for hospitalists and other treating physicians. Therefore 60% of the initially evaluated patients were excluded, since they were admitted for conditions likely to cause a decrease in [Hb]. Nevertheless, it seems likely that the mechanisms involved in the included patients may play a role in those with an obvious cause for [Hb] variation as well. Accordingly, the decrease of [Hb] expected in patients admitted with disorders known to cause a decrease in the red blood cell mass would be greater than the 1 observed in our study population.
This [Hb] drop during hospitalization may be clinically relevant in a number of ways: it could cause the attending physicians to order costly and invasive studies, it could have prognostic value as it occurs in patients admitted with myocardial infarction, and it could trigger an acute coronary syndrome.20 We observed an association between [Hb] drop and a higher APS in our patients. This score has been validated as a prognostic factor in previous studies. However, it is not possible to conclude that this [Hb] drop is associated with a worse prognosis.
Our study had several limitations. The sample's heterogeneity inherent to our general ward population could have altered our results and their generalization. To overcome this bias we used a categorization system based on discharge diagnosis. However, this particular system has several limitations. The small sample size and the absence of follow up data after discharge limited our capacity to detect any prognostic significance of [Hb] decrease. In the present study, the total decrease of [Hb] may have been underestimated because the onset of the acute illness precedes hospital admission by a variable time. Finally, a relatively small sample size limited our ability to detect other possible significant predictors of [Hb] decrease. However, this study was not designed to assess the mechanisms associated with the decrease of [Hb], but rather to establish its occurrence, measure it and explore related variables.
These results may be useful for further studies to evaluate [Hb] variation in admitted patients and its relation to other variables, such as bone marrow production, oxygen use, erythrocyte survival, nutritional deficiencies, and erythropoietin and inflammatory mediators levels.
In conclusion, our general medical inpatients had a mean 1.45 g/dL [Hb] decrease during hospitalization, which was greater in the first days of hospitalization, even though an evident cause was not present. These findings would help attending physicians in general wards make a rational and efficient approach when dealing with patients' decrease in [Hb].
Acknowledgements
The authors thank Jorge Lopez Camelo and Hugo Krupitzki for statistical advice and Valeria Melia for helping in the preparation of this manuscript.
- ,.Nosocomial anemia.JAMA.1973;223(1):73–74.
- ,,,,.Important role of nondiagnostic blood loss and blunted erythropoietic response in the anemia of medical intensive care patients.Crit Care Med.1999;27(12):2630–2639.
- ,,,,,.Nutritional deficiencies and blunted erythropoietin response as causes of the anemia of critical illness.J Crit Care.2001;16(1):36–41.
- ,,,.Time course of hemoglobin concentrations in nonbleeding intensive care unit patients.Crit Care Med.2003;31(2):406–410.
- ,,, et al.Erithropoietin response in critically ill patients.Crit Care Med.1997;25(Suppl1):a82.
- ,,.Acute event‐related anaemia.Br J Haematol.2001;115(4):739–743.
- ,,,,,.Response of erythropoiesis and iron metabolism to recombinant human erythropoietin in intensive care unit patients.Crit Care Med.2000;28(8):2773–2778.
- .The anemia of inflammation/malignancy: mechanisms and management.Hematology Am Soc Hematol Educ Program.2008:159–165.
- .The regulation of hepcidin and its effects on systemic and cellular iron metabolism.Hematology Am Soc Hematol Educ Program.2008:151–158.
- ,,, et al.,Erythropoietin response is blunted in critically ill patients.Intensive Care Med.1997;23:159–162.
- ,,,,.Studies of illness in the aged. The index of ADL: standardized measure of biological and psychosocial function.JAMA.1963;185:914–919.
- ,,,Progress in the development of the index of ADL.Gerontologist.1970;10:20–30.
- ,,,,.Measuring prognosis and case mix in hospitalized elders. The importance of functional status.J Gen Intern Med.1997;12:203–208.
- ,,,.APACHE II: A severity of disease classification system.Crit Care Med.1985;12(10):818–829.
- ,,,.A new method of classifying prognostic comorbidity in longitudinal studies: development and validation.J Chron Dis.1997;40:373–383.
- ,,,.How to measure comorbidity: a critical review of available methods.J Clin Epidemiol.2003;56:221–229.
- ,,, et al.Nutritional anaemias. Report of a WHO Scientific Group.World Health Organ Tech Rep Ser.1968;405:1–40.
- ,,,.Relationship between hematocrit and renal function in men and women.Kidney Int.2001;59(2):725–731.
- ,,.Epidemiology of anemia associated with chronic renal insufficiency among adults in the United States: results from the Third National Health and Nutrition Examination Survey.J Am Soc Nephrol.2002;13(2):504–510.
- ,,, et al.,Changes in haemoglobin levels during hospital course and long‐term outcome after myocardial infarction.Eur Heart J.2007;28(11):1289–1296.
- ,,,,.Do blood test cause anemia in hospitalized patients?J Gen Intern Med.2005;20:520–524.
- ,.Red blood cell physiology in critical illness.Crit Care Med.2003;31(12 Suppl)( ):S651–S657.
- .Anemia in the critically ill.Crit Care Clin.2004;20:159–178.
- ,.Anemia of the critically ill: acute anemia of chronic disease.Crit Care Med.2000;28(8):3098–3099.
- .Anemia and blood transfusion in the critically ill patient: role of erythropoietin.Crit Care.2004;8(Suppl 2):S42–S44.
- .Anemia of critical illness – implications for understanding and treating rHuEPO resistance.Nephrol Dial Transplant.2002;17(Suppl 5):S48–S55.
- ,,.Transfusion practice in the critically ill.Crit Care Med.2003;31(Suppl):S668–S671.
- .Anemia in critically ill patients.Eur J Inter Med.2004;15(8):481–486.
- ,,,.Neocytolysis: a physiologic down‐regulator of red blood cell mass.Lancet.1997;349:1389–1390.
- ,,,,,.Neocytolysis contributes to the anemia of renal disease.Am J Kidney Dis.1999;33:59–62.
- ,,, et al.Neocytolysis on descent from altitude: a newly recognized mechanism for the control of red cell mass.Ann Intern Med.2001;134:652–656.
- ,.Phlebotomy for diagnostic laboratory test in adults. Pattern of use and effect on transfusion requirements.N Engl J Med.1986;314:1233–1235.
Studies of the red blood cell mass performed in hospitalized patients were first done in the early 1970s.1 Thereafter, a decrease in the hemoglobin concentration ([Hb]) and its potential causes have been further reported, especially in critically ill patients.25 The decrease in [Hb] can occur as a result of blood draws for diagnostic testing; blood loss associated with invasive procedures and bleeding; occult gastrointestinal bleeding; hemolysis; shortening of red cell survival; iron, folic acid or cobalamine deficiencies; renal, liver or endocrine failure; hemodilution associated with fluid therapy; and the so‐called anemia of inflammation (AI).68 The latter would be a consequence of a blunted response of the bone marrow due to several factors such as inadequate secretion of erythropoietin, inhibition of the proliferation and differentiation of the erythroid precursors of the bone marrow and an hepcidin‐mediated functional iron deficiency.810
As mentioned, most studies were done in critically ill patients and scarce information is available about general ward admitted patients (GWAP) with less severe illnesses. In this scenario, some of the proposed mechanisms may have a less clear role. It is widely accepted that [Hb] may decrease without overt bleeding in GWAP. However, given the lack of information on this matter, laboratory controls and invasive procedures are undertaken to determine its potential causes.
The purpose of the present study is to describe [Hb] variation over time in nonbleeding GWAP, to estimate the proportion of patients with [Hb] decreases 1.5 g/dL, and to evaluate possible related variables.
Materials and Methods
A 16‐week (September 2004‐January 2005) prospective observational study was conducted in Internal Medicine GWAP at 2 Buenos Aires teaching hospitals.
All consecutive patients older than 16 years were evaluated. Patients admitted for the following reasons were excluded: bleeding, trauma, surgery, invasive procedures associated with blood loss (biopsies, biliary drainage, endovascular therapeutic procedures, and chest tubes), blood transfusions, anemia, chemotherapy, and acute renal failure.
Patients with a bleeding history, chemotherapy or radiation therapy within two months prior to admission, patients on dialysis and patients with current oncologic or hematologic disease were excluded, as well as those with length of stay less than 3 days, or with less than 2 [Hb] or hematocrit (HCT) measurements.
Patients were followed until discharge, death or transfer to a critical care unit. Patients were withdrawn from the study if they presented with bleeding or hemolysis, underwent red blood cell transfusion or therapy affecting hemoglobin levels (iron, chemotherapy or erythropoietin) or if either a surgical or invasive procedure associated with blood loss was performed.
Data were collected from patients' medical records and additional information was obtained from treating physicians and patients by the authors (AL, NC, SM, AN, MH). Standardized case report forms were completed during the hospitalization including: age, sex, admissions in the previous 3 months (readmissions) and whether or not the patient lived in a nursing home. Patients were categorized according to discharge diagnosis as reported by Nguyen et al.4 with modifications related to our general ward population. Upon admission Katz daily activity index (ADL),11, 12 APACHE II acute physiology score (APS),13, 14 and Charlson comorbidity score (Charlson)15, 16 were assessed. In all cases the [Hb] and HCT values were registered on admission and on days 3, 6, 10 and prior to discharge as well as any other determination required by the treating physician. Anemia was defined as [Hb] 13 g/dL for men and 12 g/dL for women.17 Based on previous reports a 1.5 g/dL decrease in [Hb] and of 4.5 points in HCT compared to admission values were considered a significant fall.1, 4 Acute renal failure was defined as an increase in creatinine level 0.5 mg/dL or a 50% increase from baseline.18, 19
Every procedure without significant blood loss (PWSBL) such as venous catheter placement, thoracentesis, lumbar punction, paracentesis, skin biopsy, arthrocentesis, and diagnostic angiogram was also recorded. The study was approved by the Hospital's ethical committee.
Data analysis and processing were performed with Excel 2000 and Stata version 8.0 (Stata Corp; USA). For continuous variables, results were expressed by the mean value its standard deviation (SD), and compared with Student's t‐test. The chi‐square test was used to compare categorical variables. A survival curve was developed with the Kaplan‐Meier method to analyze the time to a significant fall in [Hb]. Finally, Cox proportional hazard modeling was performed to assess the association between a significant fall in [Hb] and other variables. We accepted P < 0,05 as significant.
Results
A total of 338 patients were admitted to the Internal Medicine Inpatient Services in the study period. Thirty‐nine percent (131) of these patients were included. Exclusion criteria were: diagnosis at admission (n = 95, 45.9%), past medical history (n = 56, 27%) and length of stay less than 3 days, or less than 2 determinations of [Hb] or HCT (n = 56, 27%). Data collection was discontinued for the following reasons: discharge (81.7%), death (6.9%), surgery or procedures associated with blood loss (5.3%), transfer to a critical care unit (3%), transfusions (2.3%), and chemotherapy (0.8%). The baseline characteristics of the study patients are shown in Table 1.
| n | % | Mean (SD) | Median | Min/Max | |
|---|---|---|---|---|---|
| |||||
| Age, years | 71.9 (17.4) | 77 | 18/97 | ||
| 18‐40 | 11 | 8.4 | |||
| 41‐60 | 16 | 12.2 | |||
| 61‐80 | 52 | 39.7 | |||
| >80 | 52 | 39.7 | |||
| Gender | |||||
| Female | 75 | 57.2 | |||
| Lenght of stay (days) | 7 (4.8) | 6 | 3/28 | ||
| APS | 4.9 (4.2) | 4 | 0/22 | ||
| 0‐4 | 71 | 54.2 | |||
| 5‐8 | 36 | 27.5 | |||
| >8 | 24 | 18.3 | |||
| ADL | 4.5 (2.3) | 6 | 0/6 | ||
| 0‐2 | 33 | 25.2 | |||
| 3‐5 | 11 | 8.4 | |||
| 6 | 87 | 66.4 | |||
| CHARLSON | 2.2 (2.3) | 2 | 0/11 | ||
| 0 | 32 | 24.4 | |||
| 1 | 32 | 24.4 | |||
| 2 | 22 | 16.8 | |||
| 3 | 18 | 13.7 | |||
| >3 | 27 | 20.6 | |||
| Readmissions | 28 | 21.4 | |||
| PWSBL | 14 | 10.7 | |||
| Anemia at admission | 63 | 48.1 | |||
| [Hb] at admission | 12.5 (1.7) | 12.5 | 8.6/17 | ||
| [Hb] at admission males | 12.8 (1.9) | 12.6 | 8.7/17 | ||
| [Hb] at admission females | 12.3(1.5) | 12.3 | 8.6/15.5 | ||
Diagnoses at discharge were divided into the following categories: infections (25.2%), electrolyte disturbances (7.6%), cardiac diseases (9.9%), neurologic (19.1%), respiratory (16.8%), gastrointestinal (10.7%), and other diagnosis (10.7%).
No evidence of bleeding was found in the included patients. Bleeding was only observed in 4 of the initially evaluated patients who were excluded since they failed to meet the required number of [Hb] determinations before bleeding.
A mean decrease in [Hb] of 0.71 g/dL was found between admission and discharge day (P < 0.001; 95% CI, 0.47‐0.97). Mean nadir [Hb] was 1.45 g/dL lower than admission [Hb] (P < 0.001; 95% CI, 1.24‐1.67). Mean nadir day occurred between hospitalization days 3 and 4. Mean [Hb] at discharge was 11.8 1.8 g/dL. This value is higher than the mean concentration at nadir (0.74 g/dL P < 0.001; 95% CI, 0.60‐0.97) (Figure 1).
Table 2 shows the rate of patients with a decrease in the [Hb] for different cutoff levels. Forty‐five percent of the study population (59 patients) had a significant fall in [Hb] during hospitalization. This was observed on day 2 in 50% of the patients. Likewise, a significant fall in HCT value was found in 42.7% of patients. If [Hb] decrease during hospitalization is analyzed as a proportion of [Hb] at admission, 52.7% of patients had a 10% or greater [Hb] decrease during their hospital stay.
| [Hb] fall (g/dL) | 0.5 | 1 | 1.5 | 2 | 2.5 | 3 | 3.5 | 4 | 4.5 |
|---|---|---|---|---|---|---|---|---|---|
| % of patients | 80.9 | 60.3 | 45.0 | 28.2 | 17.6 | 9.9 | 5.3 | 3.8 | 2.3 |
Using Kaplan‐Meier analysis, the estimated proportion showing no significant fall of [Hb] was 0.63 (95% CI, 0.55‐0.71) on day 3 and 0.48 (95% CI, 0.29‐0.67) on day 10. By day 15, only 3.8% of the initially included patients were still hospitalized and showed no decrease in [Hb] 1.5 g/dl. These patients maintained their [Hb] stable for the rest of the follow up period (Figure 2).
In the univariate analysis, comparing patients that experienced a decrease in [Hb] 1.5 g/dL with those who did not, significant differences were only found in the following variables: length of stay, APS, anemia at admission, [Hb] at admission, and infectious, gastrointestinal or cardiac diseases at discharge diagnosis (Table 3).
| Patients with a significant fall | Patients without a significant fall | P Value | |
|---|---|---|---|
| |||
| n | 59 (45%) | 72 (55%) | |
| Age, years | 73.15 (18.7) | 70.83 (16.2) | 0.448 |
| Gender, female | 32 (54.2%) | 43 (59.7%) | 0.527 |
| Length of stay (days) | 8.30 (5.6) | 5.91 (3.7) | <0.007 |
| APS | 6.13 (4.5) | 3.97 (3.7) | <0.004 |
| ADL | 4.33 (2.5) | 4.68 (2.1) | 0.410 |
| CHARLSON | 2.03 (1.8) | 2.37 (2.5) | 0.382 |
| Nurse home residents | 4 (6.8%) | 3 (4.2%) | 0.700 |
| Readmissions | 11 (18.6%) | 17 (23.6%) | 0.490 |
| PWSBL | 6 (10.2%) | 8 (11.1%) | 0.862 |
| Anemia at admission | 20 (33.9%) | 43 (59.7%) | <0.004 |
| [Hb] at admission | 13.09 (1.7) | 12.01 (1.5) | <0.001 |
| Diagnosis at discharge | |||
| Infectious | 20 (33.9%) | 13 (18.1%) | <0.05 |
| Respiratory | 8 (13.6%) | 14 (19.4%) | 0.370 |
| Neurologic | 9 (15.2%) | 16 (22.2%) | 0.312 |
| Gastrointestinal | 11 (18.6%) | 3 (4.2%) | <0.01 |
| Cardiac | 2 (3.4%) | 11(15.3%) | <0.05 |
| Electrolyte disturbances | 6 (10.2%) | 4 (5.6%) | 0.512 |
| Others | 3 (5.1%) | 11 (15.3%) | 0.087 |
In the Cox proportional hazard model adjusting for the variables shown in Table 4, a significant independent direct association was found between a significant fall in [Hb] during hospital stay and APS, [Hb] at admission, and either diagnosis of infectious or gastrointestinal disease at discharge. Similar results were found if a significant fall was redefined as a 12% decrease in [Hb] or as a 4.5 point decrease in HCT from baseline.
| Variable | HRR | P Value | 95% CI |
|---|---|---|---|
| |||
| APS | 1.07 | 0.007 | 1.02‐1.12 |
| ADL | 1.11 | 0.132 | 0.97‐1.27 |
| Charlson | 0.88 | 0.121 | 0.75‐1.03 |
| Nurse home resident | 1.52 | 0.361 | 0.62‐3.72 |
| PWSBL | 0.67 | 0.390 | 0.27‐1.66 |
| Readmission | 1.14 | 0.710 | 0.57‐2.29 |
| Female sex | 0.98 | 0.944 | 0.57‐1.69 |
| Age | 1.39 | 0.098 | 0.94‐2.07 |
| [Hb] at admission | 1.27 | 0.005 | 1.07‐1.51 |
| Diagnosis at discharge | |||
| Infectious | 2.70 | 0.015 | 1.21‐6.05 |
| Neurologic | 1.42 | 0.457 | 0.57‐3.55 |
| Gastrointestinal | 3.74 | 0.002 | 1.62‐8.64 |
| Cardiac | 0.41 | 0.289 | 0.08‐2.12 |
| Electrolyte dist. | 2.08 | 0.176 | 0.72‐6.05 |
| Others | 0.95 | 0.946 | 0.24‐3.81 |
Discussion
This study describes the variation of [Hb] and HCT values in GWAP without bleeding or other obvious medical conditions associated with a decrease in the red blood cell mass. As previously described,4, 20, 21 we found that [Hb] decreases during hospital stay are frequently observed. The mean [Hb] fall from admission was 1.45 g/dL, and was mainly recorded between hospitalization days 3 and 4. In approximately half of the study population, a 1.5 g/dL decrease in [Hb] was observed. In the survival analysis, 40% and 55% of patients are expected to present such a fall on day 4 and 12 respectively. In accordance with prior reports4, 21 a greater decrease in [Hb] occurred in the first days of hospitalization, and a high proportion of patients were already anemic at the time of admission.
The following variables were associated with a decrease in the [Hb] during hospitalization: higher APS score, higher [Hb] at admission, and diagnosis of infectious or gastrointestinal disease at discharge. Even though several mechanisms seem to contribute to the decrease in [Hb] during hospitalization our data suggest that 1 of these factors seems to be the severity of the disease, as previously proposed by Nguyen et al.4 This observation is supported by the association found in our study between [Hb] decrease and APS. No association was found with Charlson, ADL, and being a nursing home resident. These variables, which have not been previously analyzed, seem to indicate that patients with chronic illnesses are not more likely to have decreases in [Hb] during hospitalization.
Patients with higher [Hb] at admission had a greater [Hb] decrease during their hospital stay. This finding could suggest that the mechanism related to this decrease had less effect on patients with lower [Hb]. This is similar to that observed in the anemia of chronic diseases where [Hb] does not usually fall to extreme values. Our analysis reveals a greater decrease during the first days of hospitalization. Given the high rate of patients anemic at admission, it is possible that the decrease in [Hb] had begun prior to admission.
Previous papers describe a low prevalence of cyanocobalamine (2%), folic acid (2%), and iron (9%) deficiency in patients admitted to critical care units.3 In these patients an inadequate bone marrow response has been proposed as a mechanism for [Hb] decrease, a phenomenon that has been called AI or anemia of critical illness.8, 2228 Inflammatory response associated with acute disease causes this hypoproliferative anemia through 3 different pathways: relative erythropoietin deficit, a direct inhibition of the erythropoiesis in the bone marrow through different mediators (ie, interleukin [IL]‐1, IL‐6, tumor necrosis factor [TNF]) and a functional iron deficit. This relative iron deficiency is produced mainly by the IL‐6 induced overexpression of the hepcidin gene in hepatocytes. Hepcidin causes impaired intestinal iron absorption and an inadequate delivery of iron from the iron‐recycling macrophages to the erythroid precursors in the bone marrow.8, 9
AI could explain some of our findings, such as the greater decrease observed in the first hospital days when inflamatory mediators levels are expected to be higher. The association between APS and infectious disease diagnosis and a greater [Hb] decrease may also be explained by this mechanism. Nonetheless, the daily bone marrow production of red blood cells is small compared with the circulating red mass cell and therefore it is necessary to have a better explanation on how AI could be associated with this rapid decrease in the [Hb]. Rice et al.30, 31 have explored some mechanisms leading to a rapid decrease in the red mass cell related to acute variations in erytropoietin level. A role of this mechanism and other could be hypothesized.29
Overt bleeding was not found in our study population and procedures without significant blood loss (PWSBL) were infrequent, therefore it is unlikely that they could have had an impact on the decrease of [Hb]. The influence of other variables, such as blood volume drawn for diagnostic testing and occult blood losses (especially from the gastrointestinal tract) was not investigated. Parenteral hydration and hemodilution neither were evaluated in our study nor were extensively described in the literature. We think this last mentioned mechanism plays a role in the large [Hb] decrease during the first days of hospitalization. However a lack of association was mentioned in the only study that evaluated this issue in critically ill patients. Intravascular hemolysis has been cited as an infrequent event in these patients.2, 4
Only patients without a clear explanation for their [Hb] decrease were included because they represent a matter of concern for hospitalists and other treating physicians. Therefore 60% of the initially evaluated patients were excluded, since they were admitted for conditions likely to cause a decrease in [Hb]. Nevertheless, it seems likely that the mechanisms involved in the included patients may play a role in those with an obvious cause for [Hb] variation as well. Accordingly, the decrease of [Hb] expected in patients admitted with disorders known to cause a decrease in the red blood cell mass would be greater than the 1 observed in our study population.
This [Hb] drop during hospitalization may be clinically relevant in a number of ways: it could cause the attending physicians to order costly and invasive studies, it could have prognostic value as it occurs in patients admitted with myocardial infarction, and it could trigger an acute coronary syndrome.20 We observed an association between [Hb] drop and a higher APS in our patients. This score has been validated as a prognostic factor in previous studies. However, it is not possible to conclude that this [Hb] drop is associated with a worse prognosis.
Our study had several limitations. The sample's heterogeneity inherent to our general ward population could have altered our results and their generalization. To overcome this bias we used a categorization system based on discharge diagnosis. However, this particular system has several limitations. The small sample size and the absence of follow up data after discharge limited our capacity to detect any prognostic significance of [Hb] decrease. In the present study, the total decrease of [Hb] may have been underestimated because the onset of the acute illness precedes hospital admission by a variable time. Finally, a relatively small sample size limited our ability to detect other possible significant predictors of [Hb] decrease. However, this study was not designed to assess the mechanisms associated with the decrease of [Hb], but rather to establish its occurrence, measure it and explore related variables.
These results may be useful for further studies to evaluate [Hb] variation in admitted patients and its relation to other variables, such as bone marrow production, oxygen use, erythrocyte survival, nutritional deficiencies, and erythropoietin and inflammatory mediators levels.
In conclusion, our general medical inpatients had a mean 1.45 g/dL [Hb] decrease during hospitalization, which was greater in the first days of hospitalization, even though an evident cause was not present. These findings would help attending physicians in general wards make a rational and efficient approach when dealing with patients' decrease in [Hb].
Acknowledgements
The authors thank Jorge Lopez Camelo and Hugo Krupitzki for statistical advice and Valeria Melia for helping in the preparation of this manuscript.
- ,.Nosocomial anemia.JAMA.1973;223(1):73–74.
- ,,,,.Important role of nondiagnostic blood loss and blunted erythropoietic response in the anemia of medical intensive care patients.Crit Care Med.1999;27(12):2630–2639.
- ,,,,,.Nutritional deficiencies and blunted erythropoietin response as causes of the anemia of critical illness.J Crit Care.2001;16(1):36–41.
- ,,,.Time course of hemoglobin concentrations in nonbleeding intensive care unit patients.Crit Care Med.2003;31(2):406–410.
- ,,, et al.Erithropoietin response in critically ill patients.Crit Care Med.1997;25(Suppl1):a82.
- ,,.Acute event‐related anaemia.Br J Haematol.2001;115(4):739–743.
- ,,,,,.Response of erythropoiesis and iron metabolism to recombinant human erythropoietin in intensive care unit patients.Crit Care Med.2000;28(8):2773–2778.
- .The anemia of inflammation/malignancy: mechanisms and management.Hematology Am Soc Hematol Educ Program.2008:159–165.
- .The regulation of hepcidin and its effects on systemic and cellular iron metabolism.Hematology Am Soc Hematol Educ Program.2008:151–158.
- ,,, et al.,Erythropoietin response is blunted in critically ill patients.Intensive Care Med.1997;23:159–162.
- ,,,,.Studies of illness in the aged. The index of ADL: standardized measure of biological and psychosocial function.JAMA.1963;185:914–919.
- ,,,Progress in the development of the index of ADL.Gerontologist.1970;10:20–30.
- ,,,,.Measuring prognosis and case mix in hospitalized elders. The importance of functional status.J Gen Intern Med.1997;12:203–208.
- ,,,.APACHE II: A severity of disease classification system.Crit Care Med.1985;12(10):818–829.
- ,,,.A new method of classifying prognostic comorbidity in longitudinal studies: development and validation.J Chron Dis.1997;40:373–383.
- ,,,.How to measure comorbidity: a critical review of available methods.J Clin Epidemiol.2003;56:221–229.
- ,,, et al.Nutritional anaemias. Report of a WHO Scientific Group.World Health Organ Tech Rep Ser.1968;405:1–40.
- ,,,.Relationship between hematocrit and renal function in men and women.Kidney Int.2001;59(2):725–731.
- ,,.Epidemiology of anemia associated with chronic renal insufficiency among adults in the United States: results from the Third National Health and Nutrition Examination Survey.J Am Soc Nephrol.2002;13(2):504–510.
- ,,, et al.,Changes in haemoglobin levels during hospital course and long‐term outcome after myocardial infarction.Eur Heart J.2007;28(11):1289–1296.
- ,,,,.Do blood test cause anemia in hospitalized patients?J Gen Intern Med.2005;20:520–524.
- ,.Red blood cell physiology in critical illness.Crit Care Med.2003;31(12 Suppl)( ):S651–S657.
- .Anemia in the critically ill.Crit Care Clin.2004;20:159–178.
- ,.Anemia of the critically ill: acute anemia of chronic disease.Crit Care Med.2000;28(8):3098–3099.
- .Anemia and blood transfusion in the critically ill patient: role of erythropoietin.Crit Care.2004;8(Suppl 2):S42–S44.
- .Anemia of critical illness – implications for understanding and treating rHuEPO resistance.Nephrol Dial Transplant.2002;17(Suppl 5):S48–S55.
- ,,.Transfusion practice in the critically ill.Crit Care Med.2003;31(Suppl):S668–S671.
- .Anemia in critically ill patients.Eur J Inter Med.2004;15(8):481–486.
- ,,,.Neocytolysis: a physiologic down‐regulator of red blood cell mass.Lancet.1997;349:1389–1390.
- ,,,,,.Neocytolysis contributes to the anemia of renal disease.Am J Kidney Dis.1999;33:59–62.
- ,,, et al.Neocytolysis on descent from altitude: a newly recognized mechanism for the control of red cell mass.Ann Intern Med.2001;134:652–656.
- ,.Phlebotomy for diagnostic laboratory test in adults. Pattern of use and effect on transfusion requirements.N Engl J Med.1986;314:1233–1235.
Copyright © 2010 Society of Hospital Medicine