User login
Accuracy of physical diagnostic tests for assessing ruptures of the anterior cruciate ligament: A meta-analysis
- Reliable data are scarce regarding the accuracy of physical diagnostic tests in diagnosing anterior cruciate ligament ruptures in primary care.
- The pivot shift test has a favorable positive predictive value, and the Lachman test has a good negative predictive value. The anterior drawer test is of unproven benefit in diagnosing rupture of the anterior cruciate ligament (ACL).
- Although of limited predictive value, the history and physical examination, coupled with patient preference and physical demands, should form the basis for further investigation of possible ACL rupture.
Objective: This systematic review summarizes the evidence on the accuracy of tests for assessing ACL ruptures of the knee.
Search strategy A computerized search of MEDLINE (1966–2003) and EMBASE (1980–2003) with additional reference tracking.
Selection criteria Articles included were written in English, French, German, or Dutch, and addressed the accuracy of at least 1 physical diagnostic test for ACL rupture, using arthrotomy, arthroscopy, or magnetic resonance imaging as the gold standard.
Data collection and analysis: Two reviewers independently selected studies, assessed the methodological quality, and abstracted data using a standardized protocol. We calculated sensitivity, specificity, and likelihood ratios for each test and summary estimates, when appropriate and possible.
Main results: Seventeen studies met the inclusion criteria. None assessed the index test and reference test independently (with blinding), and all but 2 displayed verification bias. Study results were heterogeneous. The pivot shift test seems to have favorable positive predictive value, and the Lachman test has good negative predictive value. The anterior drawer test is of unproven value.
Conclusions: Reliable data are rare regarding the accuracy of physical diagnostic tests for ACL ruptures, especially in a primary care setting. For the time being, history taking and physical examination, albeit of limited use, should be considered with individual patient demands to provide the basis for further evaluation.
To evaluate possible rupture of the anterior cruciate ligament (ACL), family physicians rely on the history and physical examination and primarily 3 diagnostic assessments: the anterior drawer test, the Lachman test, and the pivot shift test.1-3 Preliminary findings from these tests, coupled with patient preference and physical demands, help select those who may need further work-up with arthroscopy or magnetic resonance imaging (MRI).4
We summarize the evidence for the diagnostic accuracy of physical diagnostic tests in assessing ACL ruptures of the knee.
If a patient’s physical demands are low, one might proceed with a trial of conservative therapy (especially when Lachman’s test is negative), which has shown to be favorable for selected patients.5 However, when a patient has high demands (as is the case with athletes), more advanced diagnostic tests (eg, MRI) seem to be indicated, irrespective of the findings of physical examination.
Methods
Selection of studies
A computerized literature search of MEDLINE (from 1966 to February 14, 2003) and EMBASE (1980 to February 14, 2003) was conducted to identify articles written in English, French, German, or Dutch. Key words were the medical subject headings “knee injuries,”knee joint,” and “knee,” and the text word “knee.” This set was combined with a set consisting of the main headings “joint instability” and “anterior cruciate ligament,” and the text words “laxity,” “instability,” “cruciate,” and “effusion.”
Finally, the results of these strategies were combined with a validated search strategy for the identification of diagnostic studies using the subject headings “sensitivity and specificity” (exploded), “physical examination” and “not (animal not [human and animal])” and the text words “sensitivit$,” “specificit$,” “false positive,” “false negative,” “accuracy,” and “screening,”6 supplemented with the text words “physical examination” and “clinical examination.” Also, the cited references of included publications were examined.
Studies were selected by 2 reviewers independently. Studies were eligible for inclusion if they addressed the accuracy of at least 1 physical diagnostic test for the assessment of ACL ruptures of the knee, and used arthrotomy, arthroscopy, or MRI as the gold standard.
Assessment of methodological quality and data abstraction
The methodological quality of the selected studies was assessed and data were abstracted by 2 reviewers independently. Quality assessment was accomplished with a checklist adapted from Irwig and colleagues7 and the Cochrane Methods Group on Systematic Review of Screening and Diagnostic Tests.8 (Table W1 and Table W1 cont.).
Statistical analysis
Statistical analysis was performed9 with a strategy adapted from Midgette and colleagues.10 The method consists of estimating a summary receiver operating characteristic (SROC) curve by metaregression, and exploring heterogeneity by adding study characteristics and study validity items to the regression model (a full description of this strategy is available online as Appendix A).7-11
We performed an additional analysis according to a bivariate random effects model that accounts for heterogeneity of both sensitivity and specificity simultaneously, reflected in the width of the 95% confidence intervals.12,13
The summary estimates of sensitivity and specificity were used to calculate the predictive value of a positive (PV+) and negative test result (PV–) for circumstances with varying prevalences of ACL ruptures. When summary estimates of both sensitivity and specificity could not be calculated, the summary estimate of sensitivity and the accompanying specificity, estimated from the SROC curve, were used to calculate predictive values.
Results
Selection of studies
The literature search revealed a total of 1090 potentially eligible studies, 17 of which were selected.14-30 Two reports pertained to the same study,15,16 and 1 additional study was found by reference tracking.2 Thus, a total of 17 studies met the selection criteria.
Methodological quality and study characteristics
No study measured the index test (ie, the object of study) and reference standard independently (with blinding). Patients whose physical test results were abnormal were more likely to undergo the gold standard test—a factor that inflates sensitivity and decreases specificity. This verification bias was present in all but 2 studies.15,27 No study was performed in a primary care setting.
A detailed description of the characteristics and methodological quality of the 17 included studies is available online (Appendix B, Table W2-1, Table W2-2, Table W2-3, and Table W3).
Accuracy of ACL tests
Details of the process of selecting studies for further meta-analysis are presented online (Appendix C).
Diagnostic accuracy of the ACL tests is shown in Table 1. Significant heterogeneity of sensitivity and specificity was seen with all ACL tests, and no significant subgroups were detected for any of the tests. The power of metaregression analysis, however, was low due to the small number of available studies (4 to 6) and because some characteristics exhibited no variation.
Anterior drawer test. Correlation of sensitivity and specificity for the anterior drawer test was positive (6 studies); thus, no SROC curve was estimated. Sensitivity of the anterior drawer test was 0.18–0.92, and specificity 0.78–0.98. According to the bivariate random effects model, the pooled sensitivity was 0.62 (95% confidence interval [CI], 0.42–0.78) and the pooled specificity was 0.88 (95% CI, 0.83–0.92) ( Figure 1A ).
TABLE 1
Diagnostic accuracy of the anterior drawer sign, Lachman test, and pivot shift test
| First author | Type of ACL rupture | N | Prevalence | Sn | Sp | LR+ | LR– |
|---|---|---|---|---|---|---|---|
| Anterior drawer sign | |||||||
| Hardaker25 | Partial + complete | 132 | 0.77 | 0.18 | — | — | — |
| Tonino19*† | Partial + complete | 52 | 0.58 | 0.27 | 0.98 | 12.6 | 0.7 |
| Rubinstein28 | “ACL-deficient” | 39 | 0.23 | (0.76)§ | (0.86)§ | — | — |
| Boeree26* | Not specified | 203 | 0.29 | 0.56 | 0.92 | 6.7 | 0.5 |
| Lee21* | Not specified | 79 | 0.29 | 0.77 | 0.99 | 87.9 | 0.2 |
| Richter29* | Not specified | 74 | 0.78 | 0.67 | 0.88 | 5.4 | 0.4 |
| SteinbrÜck22* | Not specified | 300 | 0.17 | 0.92 | 0.91 | 10.4 | 0.1 |
| Sandberg18*‡ | Not specified | 182 | 0.68 | 0.39 | 0.78 | 1.7 | 0.8 |
| Lachman test | |||||||
| Hardaker25 | Partial + complete | 132 | 0.77 | 0.74 | — | — | — |
| Tonino19* | Partial + complete | 52 | 0.58 | 0.89 | 0.98 | 40.8 | 0.1 |
| Schwarz30*‡ | Partial + complete | 58 | 0.81 | 0.91 | 0.55 | 2.0 | 0.2 |
| Rubinstein28 | “ACL-deficient” | 39 | 0.23 | (0.96)§ | (1.00)§ | — | — |
| Boeree26* | Not specified | 203 | 0.29 | 0.63 | 0.90 | 6.5 | 0.4 |
| Lee21* | Not specified | 79 | 0.29 | 0.90 | 0.99 | 102.1 | 0.1 |
| Richter29*‡ | Not specified | 74 | 0.78 | 0.93 | 0.88 | 7.4 | 0.1 |
| SteinbrÜck22* | Not specified | 300 | 0.17 | 0.86 | 0.95 | 17.9 | 0.1 |
| Cooperman24 | Not specified | 32 | 0.41 | (0.65)║ | (0.42)║ | — | — |
| Pivot shift test | |||||||
| Hardaker25 | Partial + complete | 132 | 0.77 | 0.29 | — | — | — |
| Tonino19* | Partial + complete | 52 | 0.58 | 0.18 | 0.98 | 8.2 | 0.8 |
| Rubinstein28 | “ACL-deficient” | 39 | 0.23 | (0.93)§ | (0.89)§ | — | — |
| Boeree26* | Not specified | 203 | 0.29 | 0.31 | 0.97 | 8.8 | 0.7 |
| Richter29*†‡ | Not specified | 74 | 0.78 | 0.48 | 0.97 | 16.4 | 0.5 |
| SteinbrÜck22* | Not specified | 300 | 0.17 | 0.22 | 0.99 | 26.9 | 0.8 |
| * Study results used for meta-analysis | |||||||
| † 0.5 added to each cell of the 2x2 table | |||||||
| ‡ 2x2 table reconstructed | |||||||
| § Mean result of 5 orthopedic surgeons | |||||||
| ║ Sum of results of 2 physiotherapists | |||||||
| ACL, anterior cruciate ligament; Sn, sensitivity; Sp, specificity; LR+, positive likelihood ratio; LR–, negative likelihood ratio | |||||||
FIGURE 1
Sensitivity vs 1–specificity of the 3 tests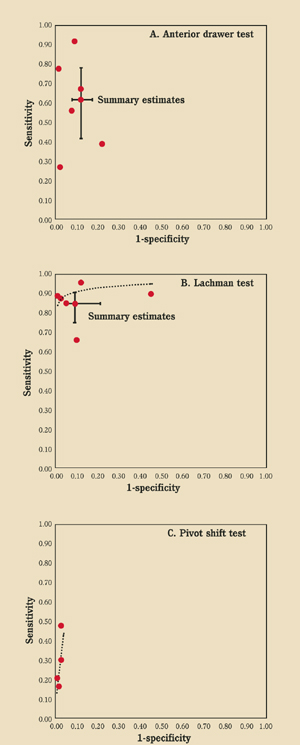
Scatterplots of sensitivity versus 1–specificity of A) the anterior drawer test (6 studies), B) the Lachman test (6 studies), and C) the pivot shift test (4 studies). Summary receiver operating characteristic curves and summary estimates of sensitivity and specificity (including 95% confidence intervals) are shown as appropriate.
Lachman test (Figure 2). The SROC curve of the Lachman test (6 studies) is shown in Figure 1B . Sensitivity ranged from 0.63 to 0.93, and specificity from 0.55 to 0.99. According to the bivariate random effects model the pooled sensitivity was 0.86 (95% CI, 0.76–0.92) and the pooled specificity was 0.91 (95% CI, 0.79–0.96).
Pivot shift test. The SROC curve of the pivot shift test (4 studies) is shown in Figure 1C . Sensitivity ranged from 0.18 to 0.48, and specificity from 0.97 to 0.99. Bivariate random effects pooling could not be performed; in this model 5 parameters must be estimated and only 4 studies were available.
Figure 3 shows the PV+ and PV– for all tests according to varying prevalences of ACL ruptures. The pivot shift test has the highest PV+ and the Lachman test the highest PV–. If the pivot shift test is positive, there is high probability of an ACL rupture, whereas a negative Lachman test rules out a rupture.
FIGURE 2
Lachman test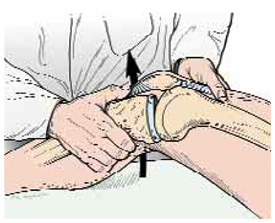
To perform the Lachman test, grasp the back of the proximal tibia posteriorly and place thumb over joint line anterolaterally. Pull the proximal tibia anteriorly and posteriorly, and compare sides for endpoint laxity.
FIGURE 3
Predictive value vs prevalence of positive and negative test results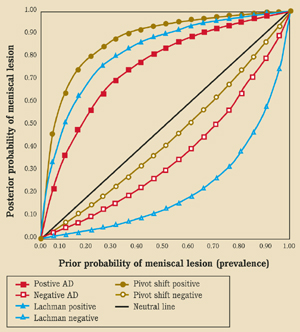
Predictive value (posttest probability of presence of ACL rupture) vs prevalence (prior probability of presence of ACL rupture) of positive and negative test results of the anterior drawer test (sensitivity=0.62, specificity=0.88), Lachman test (sensitivity=0.86, specificity=0.91), and the pivot shift test (sensitivity=0.32, specificity=0.98).
DISCUSSION
We reviewed 17 studies that examined the accuracy of physical diagnostic tests for assessing ACL ruptures of the knee. Of those tests, the pivot shift test seems to have favorable positive predictive value, and the Lachman test good negative predictive value. The anterior drawer test is of unproven diagnostic value in this setting. In view of the potential biases in the original studies, however, the accuracy of the various ACL tests might be overestimated and the poor quality of the studies impede sound conclusions about the usefulness of the tests for daily practice. In addition, no study has been performed in primary care.
Because test characteristics may be influenced substantially by referral filters leading to spectrum bias,31 and because primary care physicians will be less experienced in performing these tests, the tests will presumably be less accurate in a primary care setting. Furthermore, the pivot shift test is very difficult to perform, making it less attractive for the average primary care physician.
Future research
Useful answers would be derived from sound research on the diagnostic accuracy of the various tests (determined for each test separately and for all tests jointly) combined with patient characteristics (eg, age, physical fitness, and functional demands) and elements of the medical history (eg, type of trauma and nature of the complaints). The emergence of MRI will facilitate this research. Relevance to clinical practice would be enhanced by an assessment of the effect of a correct diagnosis on the functional outcome of patients.
Acknowledgments
The authors thank Afina Glas, MD, and Professor Koos Zwinderman, PhD, for their statistical advice. We are much obliged to 1 of the referees for his/her useful suggestions.
Corresponding author
Rob J.P.M. Scholten, MD, PhD, Dutch Cochrane Centre, Department of Clinical Epidemiology and Biostatistics, J2-273, Academic Medical Center, P.O. Box 22700, 1100 DE Amsterdam, The Netherlands. E-mail: [email protected].
1. Slocum DB, Larson RL. Rotatory instability of the knee. Its pathogenesis and a clinical test to demonstrate its presence. J Bone Joint Surg Am 1968;50:211-225.
2. Torg JS, Conrad W, Kalen V. Clinical diagnosis of anterior cruciate ligament instability in the athlete. Am J Sports Med 1976;4:84-93.
3. Galway HR, MacIntosh DL. The lateral pivot shift: a symptom and sign of anterior cruciate ligament insufficiency. Clin Orthop 1980;147:45-50.
4. Boeve BF, Davidson RA, Staab EV. Magnetic resonance imaging in the evaluation of knee injuries. South Med J 1991;84:1123-1127.
5. Buss DD, Min R, Skyhar M, Galinat B, Warren RF, Wickiewicz TL. Nonoperative treatment of acute anterior cruciate ligament injuries in a selected group of patients. Am J Sports Med 1995;23:160-165.
6. Devillè WLJM, Bezemer PD, Bouter LM. Publications on diagnostic test evaluation in family medicine journals: an optimal search strategy. J Clin Epidemiol 2000;53:65-69.
7. Irwig L, Macaskill P, Glasziou P, Fahey M. Meta-analytic methods for diagnostic test accuracy. J Clin Epidemiol 1995;48:119-130.
8. Cochrane Methods Group on Systematic Review of Screening and Diagnostic Tests: Recommended, Methods, updated 6 June 1996. Available at http://www.cochrane.de/cochrane/sadtdoc1.htm.
9. Scholten RJPM, Devillè WLJM, Opstelten W, Bijl D, van der Plas CG, Bouter LM. The accuracy of physical diagnostic tests for assessing meniscal lesions of the knee: a meta-analysis. J Fam Pract 2001;50:938-944.
10. Midgette AS, Stukel TA, Littenberg B. A meta-analytic method for summarizing diagnostic test performances: receiver-operating-characteristic-summary point estimates. Med Decis Making 1993;13:253-257.
11. Moses LE, Shapiro D, Littenberg B. Combining independent studies of a diagnostic test into a summary ROC curve: data-analytic approaches and some additional considerations. Stat Med 1993;12:1293-1316.
12. van Houwelingen JC, Zwinderman K, Stijnen T. A bivariate approach to meta-analysis. Stat Med. 1993;12:2272-2284.
13. van Houwelingen JC, Arends LR, Stijnen T. Advanced methods in meta-analysis: multivariate approach and meta-regression. Stat Med 2002;21:589-624.
14. Warren RF, Marshall JL. Injuries of the anterior cruciate and medial collateral ligaments of the knee. A retrospective analysis of clinical records—part I. Clin Orthop 1978;136:191-197.
15. Noyes FR, Bassett RW, Grood ES, Butler DL. Arthroscopy in acute traumatic hemarthrosis of the knee. Incidence of anterior cruciate tears and other injuries. J Bone Joint Surg 1980;62A:687-695.
16. Noyes FR, Paulos L, Mooar LA, Signer B. Knee sprains and acute knee hemarthrosis: misdiagnosis of anterior cruciate ligament tears. Phys Ther 1980;60:1596-1601.
17. Braunstein EM. Anterior cruciate ligament injuries: a comparison of arthrographic and physical diagnosis. AJR Am J Roentgenol 1982;138:423-425.
18. Sandberg R, Balkfors B, Henricson A, Westlin N. Stability tests in knee ligament injuries. Arch Orthop Trauma Surg 1986;106:5-7.
19. Tonino AJ, Huy J, Schaafsma J. The diagnostic accuracy of knee testing in the acutely injured knee. Initial examination versus examination under anaesthesia with arthroscopy. Acta Orthop Belg 1986;52:479-487.
20. Harilainen A. Evaluation of knee instability in acute liga-mentous injuries. Ann Chir Gynaecol 1987;76:269-273.
21. Lee JK, Yao L, Phelps CT, Wirth CR, Czajka J, Lozman J. Anterior cruciate ligament tears: MR imaging compared with arthroscopy and clinical tests. Radiology 1988;166:861-864.
22. SteinbrÜck K, Wiehmann JC. Examination of the knee joint. The value of clinical findings in arthroscopic control [in German]. Z Orthop Ihre Grenzgeb 1988;126:289-295.
23. Anderson AF, Lipscomb AB. Preoperative instrumented testing of anterior and posterior knee laxity. Am J Sports Med 1989;17:387-392.
24. Cooperman JM, Riddle DL, Rothstein JM. Reliability and validity of judgments of the integrity of the anterior cruci-ate ligament of the knee using the Lachman’s test. Phys Ther 1990;70:225-233.
25. Hardaker WT Jr, Garrett WE Jr, Bassett FH 3d. Evaluation of acute traumatic hemarthrosis of the knee joint. South Med J 1990;83:640-644.
26. Boeree NR, Ackroyd CE. Assessment of the menisci and cruciate ligaments: an audit of clinical practice. Injury 1991;22:291-294.
27. al-Duri Z. Relation of the fibular head sign to other signs of anterior cruciate ligament insufficiency. A follow-up letter to the editor. Clin Orthop 1992;275:220-225.
28. Rubinstein RA Jr, Shelbourne KD, McCarroll JR, VanMeter CD, Rettig AC. The accuracy of the clinical examination in the setting of posterior cruciate ligament injuries. Am J Sports Med 1994;22:550-557.
29. Richter J, David A, Pape HG, Ostermann PA, Muhr G. Diagnosis of acute rupture of the anterior cruciate liga-ment. Value of ultrasonic in addition to clinical examination [in German]. Unfallchirurg 1996;99:124-129.
30. Schwarz W, Hagelstein J, Minholz R, Schierlinger M, Danz B, Gerngross H. Manual ultrasound of the knee joint. A general practice method for diagnosis of fresh rupture of the anterior cruciate ligament [in German]. Unfallchirurg 1997;100:280-285.
31. Knottnerus JA, Leffers P. The influence of referral patterns on the characteristics of diagnostic tests. J Clin Epidemiol 1992;45:1143-1154.
- Reliable data are scarce regarding the accuracy of physical diagnostic tests in diagnosing anterior cruciate ligament ruptures in primary care.
- The pivot shift test has a favorable positive predictive value, and the Lachman test has a good negative predictive value. The anterior drawer test is of unproven benefit in diagnosing rupture of the anterior cruciate ligament (ACL).
- Although of limited predictive value, the history and physical examination, coupled with patient preference and physical demands, should form the basis for further investigation of possible ACL rupture.
Objective: This systematic review summarizes the evidence on the accuracy of tests for assessing ACL ruptures of the knee.
Search strategy A computerized search of MEDLINE (1966–2003) and EMBASE (1980–2003) with additional reference tracking.
Selection criteria Articles included were written in English, French, German, or Dutch, and addressed the accuracy of at least 1 physical diagnostic test for ACL rupture, using arthrotomy, arthroscopy, or magnetic resonance imaging as the gold standard.
Data collection and analysis: Two reviewers independently selected studies, assessed the methodological quality, and abstracted data using a standardized protocol. We calculated sensitivity, specificity, and likelihood ratios for each test and summary estimates, when appropriate and possible.
Main results: Seventeen studies met the inclusion criteria. None assessed the index test and reference test independently (with blinding), and all but 2 displayed verification bias. Study results were heterogeneous. The pivot shift test seems to have favorable positive predictive value, and the Lachman test has good negative predictive value. The anterior drawer test is of unproven value.
Conclusions: Reliable data are rare regarding the accuracy of physical diagnostic tests for ACL ruptures, especially in a primary care setting. For the time being, history taking and physical examination, albeit of limited use, should be considered with individual patient demands to provide the basis for further evaluation.
To evaluate possible rupture of the anterior cruciate ligament (ACL), family physicians rely on the history and physical examination and primarily 3 diagnostic assessments: the anterior drawer test, the Lachman test, and the pivot shift test.1-3 Preliminary findings from these tests, coupled with patient preference and physical demands, help select those who may need further work-up with arthroscopy or magnetic resonance imaging (MRI).4
We summarize the evidence for the diagnostic accuracy of physical diagnostic tests in assessing ACL ruptures of the knee.
If a patient’s physical demands are low, one might proceed with a trial of conservative therapy (especially when Lachman’s test is negative), which has shown to be favorable for selected patients.5 However, when a patient has high demands (as is the case with athletes), more advanced diagnostic tests (eg, MRI) seem to be indicated, irrespective of the findings of physical examination.
Methods
Selection of studies
A computerized literature search of MEDLINE (from 1966 to February 14, 2003) and EMBASE (1980 to February 14, 2003) was conducted to identify articles written in English, French, German, or Dutch. Key words were the medical subject headings “knee injuries,”knee joint,” and “knee,” and the text word “knee.” This set was combined with a set consisting of the main headings “joint instability” and “anterior cruciate ligament,” and the text words “laxity,” “instability,” “cruciate,” and “effusion.”
Finally, the results of these strategies were combined with a validated search strategy for the identification of diagnostic studies using the subject headings “sensitivity and specificity” (exploded), “physical examination” and “not (animal not [human and animal])” and the text words “sensitivit$,” “specificit$,” “false positive,” “false negative,” “accuracy,” and “screening,”6 supplemented with the text words “physical examination” and “clinical examination.” Also, the cited references of included publications were examined.
Studies were selected by 2 reviewers independently. Studies were eligible for inclusion if they addressed the accuracy of at least 1 physical diagnostic test for the assessment of ACL ruptures of the knee, and used arthrotomy, arthroscopy, or MRI as the gold standard.
Assessment of methodological quality and data abstraction
The methodological quality of the selected studies was assessed and data were abstracted by 2 reviewers independently. Quality assessment was accomplished with a checklist adapted from Irwig and colleagues7 and the Cochrane Methods Group on Systematic Review of Screening and Diagnostic Tests.8 (Table W1 and Table W1 cont.).
Statistical analysis
Statistical analysis was performed9 with a strategy adapted from Midgette and colleagues.10 The method consists of estimating a summary receiver operating characteristic (SROC) curve by metaregression, and exploring heterogeneity by adding study characteristics and study validity items to the regression model (a full description of this strategy is available online as Appendix A).7-11
We performed an additional analysis according to a bivariate random effects model that accounts for heterogeneity of both sensitivity and specificity simultaneously, reflected in the width of the 95% confidence intervals.12,13
The summary estimates of sensitivity and specificity were used to calculate the predictive value of a positive (PV+) and negative test result (PV–) for circumstances with varying prevalences of ACL ruptures. When summary estimates of both sensitivity and specificity could not be calculated, the summary estimate of sensitivity and the accompanying specificity, estimated from the SROC curve, were used to calculate predictive values.
Results
Selection of studies
The literature search revealed a total of 1090 potentially eligible studies, 17 of which were selected.14-30 Two reports pertained to the same study,15,16 and 1 additional study was found by reference tracking.2 Thus, a total of 17 studies met the selection criteria.
Methodological quality and study characteristics
No study measured the index test (ie, the object of study) and reference standard independently (with blinding). Patients whose physical test results were abnormal were more likely to undergo the gold standard test—a factor that inflates sensitivity and decreases specificity. This verification bias was present in all but 2 studies.15,27 No study was performed in a primary care setting.
A detailed description of the characteristics and methodological quality of the 17 included studies is available online (Appendix B, Table W2-1, Table W2-2, Table W2-3, and Table W3).
Accuracy of ACL tests
Details of the process of selecting studies for further meta-analysis are presented online (Appendix C).
Diagnostic accuracy of the ACL tests is shown in Table 1. Significant heterogeneity of sensitivity and specificity was seen with all ACL tests, and no significant subgroups were detected for any of the tests. The power of metaregression analysis, however, was low due to the small number of available studies (4 to 6) and because some characteristics exhibited no variation.
Anterior drawer test. Correlation of sensitivity and specificity for the anterior drawer test was positive (6 studies); thus, no SROC curve was estimated. Sensitivity of the anterior drawer test was 0.18–0.92, and specificity 0.78–0.98. According to the bivariate random effects model, the pooled sensitivity was 0.62 (95% confidence interval [CI], 0.42–0.78) and the pooled specificity was 0.88 (95% CI, 0.83–0.92) ( Figure 1A ).
TABLE 1
Diagnostic accuracy of the anterior drawer sign, Lachman test, and pivot shift test
| First author | Type of ACL rupture | N | Prevalence | Sn | Sp | LR+ | LR– |
|---|---|---|---|---|---|---|---|
| Anterior drawer sign | |||||||
| Hardaker25 | Partial + complete | 132 | 0.77 | 0.18 | — | — | — |
| Tonino19*† | Partial + complete | 52 | 0.58 | 0.27 | 0.98 | 12.6 | 0.7 |
| Rubinstein28 | “ACL-deficient” | 39 | 0.23 | (0.76)§ | (0.86)§ | — | — |
| Boeree26* | Not specified | 203 | 0.29 | 0.56 | 0.92 | 6.7 | 0.5 |
| Lee21* | Not specified | 79 | 0.29 | 0.77 | 0.99 | 87.9 | 0.2 |
| Richter29* | Not specified | 74 | 0.78 | 0.67 | 0.88 | 5.4 | 0.4 |
| SteinbrÜck22* | Not specified | 300 | 0.17 | 0.92 | 0.91 | 10.4 | 0.1 |
| Sandberg18*‡ | Not specified | 182 | 0.68 | 0.39 | 0.78 | 1.7 | 0.8 |
| Lachman test | |||||||
| Hardaker25 | Partial + complete | 132 | 0.77 | 0.74 | — | — | — |
| Tonino19* | Partial + complete | 52 | 0.58 | 0.89 | 0.98 | 40.8 | 0.1 |
| Schwarz30*‡ | Partial + complete | 58 | 0.81 | 0.91 | 0.55 | 2.0 | 0.2 |
| Rubinstein28 | “ACL-deficient” | 39 | 0.23 | (0.96)§ | (1.00)§ | — | — |
| Boeree26* | Not specified | 203 | 0.29 | 0.63 | 0.90 | 6.5 | 0.4 |
| Lee21* | Not specified | 79 | 0.29 | 0.90 | 0.99 | 102.1 | 0.1 |
| Richter29*‡ | Not specified | 74 | 0.78 | 0.93 | 0.88 | 7.4 | 0.1 |
| SteinbrÜck22* | Not specified | 300 | 0.17 | 0.86 | 0.95 | 17.9 | 0.1 |
| Cooperman24 | Not specified | 32 | 0.41 | (0.65)║ | (0.42)║ | — | — |
| Pivot shift test | |||||||
| Hardaker25 | Partial + complete | 132 | 0.77 | 0.29 | — | — | — |
| Tonino19* | Partial + complete | 52 | 0.58 | 0.18 | 0.98 | 8.2 | 0.8 |
| Rubinstein28 | “ACL-deficient” | 39 | 0.23 | (0.93)§ | (0.89)§ | — | — |
| Boeree26* | Not specified | 203 | 0.29 | 0.31 | 0.97 | 8.8 | 0.7 |
| Richter29*†‡ | Not specified | 74 | 0.78 | 0.48 | 0.97 | 16.4 | 0.5 |
| SteinbrÜck22* | Not specified | 300 | 0.17 | 0.22 | 0.99 | 26.9 | 0.8 |
| * Study results used for meta-analysis | |||||||
| † 0.5 added to each cell of the 2x2 table | |||||||
| ‡ 2x2 table reconstructed | |||||||
| § Mean result of 5 orthopedic surgeons | |||||||
| ║ Sum of results of 2 physiotherapists | |||||||
| ACL, anterior cruciate ligament; Sn, sensitivity; Sp, specificity; LR+, positive likelihood ratio; LR–, negative likelihood ratio | |||||||
FIGURE 1
Sensitivity vs 1–specificity of the 3 tests
Scatterplots of sensitivity versus 1–specificity of A) the anterior drawer test (6 studies), B) the Lachman test (6 studies), and C) the pivot shift test (4 studies). Summary receiver operating characteristic curves and summary estimates of sensitivity and specificity (including 95% confidence intervals) are shown as appropriate.
Lachman test (Figure 2). The SROC curve of the Lachman test (6 studies) is shown in Figure 1B . Sensitivity ranged from 0.63 to 0.93, and specificity from 0.55 to 0.99. According to the bivariate random effects model the pooled sensitivity was 0.86 (95% CI, 0.76–0.92) and the pooled specificity was 0.91 (95% CI, 0.79–0.96).
Pivot shift test. The SROC curve of the pivot shift test (4 studies) is shown in Figure 1C . Sensitivity ranged from 0.18 to 0.48, and specificity from 0.97 to 0.99. Bivariate random effects pooling could not be performed; in this model 5 parameters must be estimated and only 4 studies were available.
Figure 3 shows the PV+ and PV– for all tests according to varying prevalences of ACL ruptures. The pivot shift test has the highest PV+ and the Lachman test the highest PV–. If the pivot shift test is positive, there is high probability of an ACL rupture, whereas a negative Lachman test rules out a rupture.
FIGURE 2
Lachman test
To perform the Lachman test, grasp the back of the proximal tibia posteriorly and place thumb over joint line anterolaterally. Pull the proximal tibia anteriorly and posteriorly, and compare sides for endpoint laxity.
FIGURE 3
Predictive value vs prevalence of positive and negative test results
Predictive value (posttest probability of presence of ACL rupture) vs prevalence (prior probability of presence of ACL rupture) of positive and negative test results of the anterior drawer test (sensitivity=0.62, specificity=0.88), Lachman test (sensitivity=0.86, specificity=0.91), and the pivot shift test (sensitivity=0.32, specificity=0.98).
DISCUSSION
We reviewed 17 studies that examined the accuracy of physical diagnostic tests for assessing ACL ruptures of the knee. Of those tests, the pivot shift test seems to have favorable positive predictive value, and the Lachman test good negative predictive value. The anterior drawer test is of unproven diagnostic value in this setting. In view of the potential biases in the original studies, however, the accuracy of the various ACL tests might be overestimated and the poor quality of the studies impede sound conclusions about the usefulness of the tests for daily practice. In addition, no study has been performed in primary care.
Because test characteristics may be influenced substantially by referral filters leading to spectrum bias,31 and because primary care physicians will be less experienced in performing these tests, the tests will presumably be less accurate in a primary care setting. Furthermore, the pivot shift test is very difficult to perform, making it less attractive for the average primary care physician.
Future research
Useful answers would be derived from sound research on the diagnostic accuracy of the various tests (determined for each test separately and for all tests jointly) combined with patient characteristics (eg, age, physical fitness, and functional demands) and elements of the medical history (eg, type of trauma and nature of the complaints). The emergence of MRI will facilitate this research. Relevance to clinical practice would be enhanced by an assessment of the effect of a correct diagnosis on the functional outcome of patients.
Acknowledgments
The authors thank Afina Glas, MD, and Professor Koos Zwinderman, PhD, for their statistical advice. We are much obliged to 1 of the referees for his/her useful suggestions.
Corresponding author
Rob J.P.M. Scholten, MD, PhD, Dutch Cochrane Centre, Department of Clinical Epidemiology and Biostatistics, J2-273, Academic Medical Center, P.O. Box 22700, 1100 DE Amsterdam, The Netherlands. E-mail: [email protected].
1. Slocum DB, Larson RL. Rotatory instability of the knee. Its pathogenesis and a clinical test to demonstrate its presence. J Bone Joint Surg Am 1968;50:211-225.
2. Torg JS, Conrad W, Kalen V. Clinical diagnosis of anterior cruciate ligament instability in the athlete. Am J Sports Med 1976;4:84-93.
3. Galway HR, MacIntosh DL. The lateral pivot shift: a symptom and sign of anterior cruciate ligament insufficiency. Clin Orthop 1980;147:45-50.
4. Boeve BF, Davidson RA, Staab EV. Magnetic resonance imaging in the evaluation of knee injuries. South Med J 1991;84:1123-1127.
5. Buss DD, Min R, Skyhar M, Galinat B, Warren RF, Wickiewicz TL. Nonoperative treatment of acute anterior cruciate ligament injuries in a selected group of patients. Am J Sports Med 1995;23:160-165.
6. Devillè WLJM, Bezemer PD, Bouter LM. Publications on diagnostic test evaluation in family medicine journals: an optimal search strategy. J Clin Epidemiol 2000;53:65-69.
7. Irwig L, Macaskill P, Glasziou P, Fahey M. Meta-analytic methods for diagnostic test accuracy. J Clin Epidemiol 1995;48:119-130.
8. Cochrane Methods Group on Systematic Review of Screening and Diagnostic Tests: Recommended, Methods, updated 6 June 1996. Available at http://www.cochrane.de/cochrane/sadtdoc1.htm.
9. Scholten RJPM, Devillè WLJM, Opstelten W, Bijl D, van der Plas CG, Bouter LM. The accuracy of physical diagnostic tests for assessing meniscal lesions of the knee: a meta-analysis. J Fam Pract 2001;50:938-944.
10. Midgette AS, Stukel TA, Littenberg B. A meta-analytic method for summarizing diagnostic test performances: receiver-operating-characteristic-summary point estimates. Med Decis Making 1993;13:253-257.
11. Moses LE, Shapiro D, Littenberg B. Combining independent studies of a diagnostic test into a summary ROC curve: data-analytic approaches and some additional considerations. Stat Med 1993;12:1293-1316.
12. van Houwelingen JC, Zwinderman K, Stijnen T. A bivariate approach to meta-analysis. Stat Med. 1993;12:2272-2284.
13. van Houwelingen JC, Arends LR, Stijnen T. Advanced methods in meta-analysis: multivariate approach and meta-regression. Stat Med 2002;21:589-624.
14. Warren RF, Marshall JL. Injuries of the anterior cruciate and medial collateral ligaments of the knee. A retrospective analysis of clinical records—part I. Clin Orthop 1978;136:191-197.
15. Noyes FR, Bassett RW, Grood ES, Butler DL. Arthroscopy in acute traumatic hemarthrosis of the knee. Incidence of anterior cruciate tears and other injuries. J Bone Joint Surg 1980;62A:687-695.
16. Noyes FR, Paulos L, Mooar LA, Signer B. Knee sprains and acute knee hemarthrosis: misdiagnosis of anterior cruciate ligament tears. Phys Ther 1980;60:1596-1601.
17. Braunstein EM. Anterior cruciate ligament injuries: a comparison of arthrographic and physical diagnosis. AJR Am J Roentgenol 1982;138:423-425.
18. Sandberg R, Balkfors B, Henricson A, Westlin N. Stability tests in knee ligament injuries. Arch Orthop Trauma Surg 1986;106:5-7.
19. Tonino AJ, Huy J, Schaafsma J. The diagnostic accuracy of knee testing in the acutely injured knee. Initial examination versus examination under anaesthesia with arthroscopy. Acta Orthop Belg 1986;52:479-487.
20. Harilainen A. Evaluation of knee instability in acute liga-mentous injuries. Ann Chir Gynaecol 1987;76:269-273.
21. Lee JK, Yao L, Phelps CT, Wirth CR, Czajka J, Lozman J. Anterior cruciate ligament tears: MR imaging compared with arthroscopy and clinical tests. Radiology 1988;166:861-864.
22. SteinbrÜck K, Wiehmann JC. Examination of the knee joint. The value of clinical findings in arthroscopic control [in German]. Z Orthop Ihre Grenzgeb 1988;126:289-295.
23. Anderson AF, Lipscomb AB. Preoperative instrumented testing of anterior and posterior knee laxity. Am J Sports Med 1989;17:387-392.
24. Cooperman JM, Riddle DL, Rothstein JM. Reliability and validity of judgments of the integrity of the anterior cruci-ate ligament of the knee using the Lachman’s test. Phys Ther 1990;70:225-233.
25. Hardaker WT Jr, Garrett WE Jr, Bassett FH 3d. Evaluation of acute traumatic hemarthrosis of the knee joint. South Med J 1990;83:640-644.
26. Boeree NR, Ackroyd CE. Assessment of the menisci and cruciate ligaments: an audit of clinical practice. Injury 1991;22:291-294.
27. al-Duri Z. Relation of the fibular head sign to other signs of anterior cruciate ligament insufficiency. A follow-up letter to the editor. Clin Orthop 1992;275:220-225.
28. Rubinstein RA Jr, Shelbourne KD, McCarroll JR, VanMeter CD, Rettig AC. The accuracy of the clinical examination in the setting of posterior cruciate ligament injuries. Am J Sports Med 1994;22:550-557.
29. Richter J, David A, Pape HG, Ostermann PA, Muhr G. Diagnosis of acute rupture of the anterior cruciate liga-ment. Value of ultrasonic in addition to clinical examination [in German]. Unfallchirurg 1996;99:124-129.
30. Schwarz W, Hagelstein J, Minholz R, Schierlinger M, Danz B, Gerngross H. Manual ultrasound of the knee joint. A general practice method for diagnosis of fresh rupture of the anterior cruciate ligament [in German]. Unfallchirurg 1997;100:280-285.
31. Knottnerus JA, Leffers P. The influence of referral patterns on the characteristics of diagnostic tests. J Clin Epidemiol 1992;45:1143-1154.
The Accuracy of Physical Diagnostic Tests for Assessing Meniscal Lesions of the Knee: A Meta-Analysis
SEARCH STRATEGY: We performed a literature search of MEDLINE (1966-1999) and EMBASE (1988-1999) with additional reference tracking.
SELECTION CRITERIA: Articles written in English, French, German, or Dutch that addressed the accuracy of at least one physical diagnostic test for meniscus injury with arthrotomy, arthroscopy, or magnetic resonance imaging as the gold standard were included.
DATA COLLECTION and ANALYSIS: Two reviewers independently selected studies, assessed the methodologic quality, and abstracted data using a standardized protocol.
MAIN RESULTS: Thirteen studies (of 402) met the inclusion criteria. The results of the index and reference tests were assessed independently (blindly) of each other in only 2 studies, and in all studies verification bias seemed to be present. The study results were highly heterogeneous. The summary receiver operating characteristic curves of the assessment of joint effusion, the McMurray test, and joint line tenderness indicated little discriminative power for these tests. Only the predictive value of a positive McMurray test was favorable.
CONCLUSIONS: The methodologic quality of studies addressing the diagnostic accuracy of meniscal tests was poor, and the results were highly heterogeneous. The poor characteristics indicate that these tests are of little value for clinical practice.
Various physical diagnostic tests are available to assess meniscal lesions, such as assessment of joint effusion and joint line tenderness (JLT), the McMurray test, and the Apley compression test.1-4 Many meniscal tests, however, are not easy to perform and seem to be prone to errors.1,2,4 Also, the diagnostic accuracy of the various meniscal tests has been questioned,3-5 and conflicting results regarding that accuracy have been reported.6 Therefore, we systematically reviewed the medical literature to summarize the available evidence about the diagnostic accuracy of physical diagnostic tests for assessing meniscal lesions of the knee and to combine the results of individual studies when possible. We focused on the most common meniscal tests: the assessment of joint effusion, the McMurray test, JLT, and the Apley compression test.
Methods
Selection of Studies
We conducted a literature search of MEDLINE (1966-1999) and EMBASE (1988-1999) to identify articles written in English, French, German, or Dutch. The Medical Subject Headings (MeSH) terms “knee injuries,” “knee joint,” “knee,” and “menisci tibial,” and the text words “knee” and “effusion” were used. The results of this strategy were combined with a validated search strategy for the identification of diagnostic studies using the MeSH terms “sensitivity and specificity” (exploded), “physical examination” and “not (animal not (human and animal))” and the text words “sensitivity,” “specificity,” “false positive,” “false negative,” “accuracy,” and “screening,”7 supplemented with the text words “physical examination” and “clinical examination.” Also, the cited references of relevant publications were examined.
Studies were eligible for inclusion if they addressed the accuracy of at least one physical diagnostic test for the assessment of meniscal lesions of the knee and used arthrotomy, arthroscopy, or magnetic resonance imaging (MRI) as the gold standard. Studies were excluded if no reference group (nondiseased group or subjects with lesions other than the lesion of study) had been included, if only test-positives had been included, if the study pertained to cadavers only, or if only physical examination under anesthesia was considered.
The studies were selected by 2 reviewers independently. A preliminary selection of each study was made by checking the title, the abstract, or both. A definite selection was made by reading the complete article. During a consensus meeting disagreements regarding the selection of studies were discussed, and a definite selection was made. If disagreement persisted, a third reviewer made the final decision.
Assessment of Methodologic Quality and Data Abstraction
The methodologic quality of the selected studies was assessed, and data were abstracted by 2 reviewers independently. A checklist adapted from Irwig and colleagues8 and the Cochrane Methods Group on Systematic Review of Screening and Diagnostic Tests9 was used for quality assessment. This checklist consisted of 6 criteria for study validity, 5 criteria relevant to the clinical applicability of the results, and 5 items pertaining to the index Table w1, Table w1a test.* In a subsequent consensus meeting, both assessors discussed each criterion on which they initially disagreed. If disagreement persisted, a third reviewer made the final decision.
Statistical Analysis
Statistical analysis was performed according to a strategy adapted from Midgette and colleagues. Figure W1 10** For each study, the sensitivity and specificity of each index test were calculated. The c2 test was used to assess the homogeneity of the sensitivity and the specificity among studies. If homogeneity of both sensitivity and specificity was not rejected (P >.10), summary estimates of sensitivity and specificity were calculated.10 Heterogeneity of sensitivity and specificity might be caused by differences between studies in how clinicians define a positive test result.8 In that case, the pairs of sensitivity and specificity will be negatively correlated, as indicated by a negative Spearman rank correlation coefficient (Rs). When the pairs of sensitivity and specificity are negatively correlated, these pairs can be considered to be originating from a common receiver operating characteristic (ROC) curve, and a summary ROC (SROC) curve was estimated by meta-regression.8,10,11 The better the diagnostic accuracy of the test, the larger the area under the curve.
Differences between study characteristics are another potential source of heterogeneity of sensitivity and specificity.8 Those other sources of heterogeneity were assessed by adding the following characteristics to the meta-regression model: study validity items (most valid category of each item vs other categories), setting (primary care vs other), the spectrum of the diseased and the nondiseased (broad spectrum vs small spectrum), the prevalence of meniscal lesions, and the year of publication. When a significant subgroup was identified (P <.05), separate analyses were performed for each subgroup.
The summary estimates of sensitivity and specificity were used to calculate the predictive value of a positive (PV+) and negative (PV-) test result for circumstances with varying prevalences of meniscal lesions. When the sensitivities or specificities were heterogeneous between studies, however, the summary estimate of sensitivity was used for calculating predictive values with the accompanying specificity, estimated from the SROC curve.
Results
Selection of Studies
The literature search revealed a total of 402 potentially eligible studies, of which 10 were selected for inclusion.12-21 Three other studies were found by reference tracking.22-24 Thus, 13 studies met the selection criteria. The reply to a letter to the editor to one of the studies contained additional information and was also considered for analysis.17,25,26
Methodologic Quality and Study Characteristics
The index test and reference standard had been measured independently (blindly) of each other in only 2 studies.16,21 Verification bias seemed to be present in all studies (patients with an abnormal physical test result were more likely to undergo the gold standard test, inflating the sensitivity and decreasing the specificity). Nine studies applied arthroscopy as the gold standard,12-14,16,17,19-21,24 and 1 study used MRI.15 No study was performed in a primary care setting. In 7 studies a broad spectrum of knee lesions was reported,12-15,17,20,21 and in 4 studies the spectrum was not specified Table 1.18,19,22,23 A broad spectrum of conditions in the reference group (nondiseased) was present in 8 studies,12-15,17,20,22,23 while in 4 studies the spectrum was not specified.18,19,21,24 Details regarding the index tests were poorly reported, except in 2 studies.17,21 In all studies that addressed the McMurray test, the experience of a “thud” or “click” was used for designating a test as positive.12,13,15-19,22 Only 2 studies mentioned assessment of the index test independent of knowledge of other clinical information (including the results of other meniscal tests).17,21Table w2* The age and sex distribution of the patients and the duration of complaints are presented in Table 1.
Accuracy of Meniscal Tests
The accuracy of the assessment of joint effusion was determined in 4 studies, the McMurray test in 11, JLT in 10, the Apley compression test in 3, and 5 studies addressed various other tests. No data were presented in or could be derived from 1 study pertaining to joint effusion, 3 studies regarding the McMurray test,14,23,24 and 1 study on JLT,24 while from 1 study pertaining to both the McMurray test and JLT only the point estimates of the various test characteristics were reported without the original number of patients in the various categories.15 Of the study of Evans and coworkers,17,26 who presented data of an inexperienced and experienced researcher, only the latter results were used. Of the study of Abdon and colleagues,14 who made a distinction between tenderness of the medial and posterior part of the joint line, only the data of the medial part were considered. It should be noted that 2 studies incorporated a very small number of nondiseased subjects.23,24 Also, one of those studies presented results from individual knees instead of subjects.24 Part of their results pertained to both knees of the same subject, which violates the assumption of (statistical) independence of the observations. Therefore, this study was excluded from further analysis. Finally, some studies did not make a distinction between medial and lateral meniscal lesions,13,17,19,22,23 while others presented the results for medial and lateral meniscal lesions separately.12,14,15,18,20 Of the latter studies, only the results of medial meniscal tests were used for statistical analysis.
The diagnostic accuracy of assessment of joint effusion and the various meniscal tests is shown in Table 2. There was significant heterogeneity of sensitivity and specificity of all tests, except for specificity of the Apley compression test (P=.89).
Sensitivity and specificity were negatively correlated for joint effusion (Rs = -1.0), the McMurray test (Rs = -0.43), and JLT (Rs = -0.62). This means that as one increased, the other decreased, which is to be expected. The SROC curves Figure 1 indicate little discriminative power of those meniscal tests. No significant subgroups were detected for both tests. The power of meta-regression analysis, however, was low because of the small number of available studies.
Sensitivity and specificity of the Apley compression test were not correlated (Rs = 0.0) and no SROC curve was estimated. Sources of heterogeneity could not be identified. Only 3 studies, however, addressed this test.
Figure 2 shows the positive predictive value (PV+) and negative predictive value (PV-) for the assessment of joint effusion, the McMurray test, and JLT, according to varying prevalences of meniscal lesions. The summary estimate of sensitivity and accompanying specificity (derived from the SROC curve) were used for joint effusion (0.43 and 0.70), the McMurray test (0.48 and 0.86), and JLT (0.77 and 0.41). Only the McMurray test had a favorable estimated PV+. The PV+ of joint effusion and JLT exceeded the presumed prevalences only slightly, indicating poor additional diagnostic value. The PV- of all tests was poor.
Discussion
Our goal was to summarize the available evidence on the accuracy of various physical diagnostic tests for assessing meniscal lesions of the knee. The accuracy of those tests seems to be poor, and only a positive McMurray test result seems to be of some diagnostic significance.
However, because of the small number and poor quality of the studies found, we have significant concerns about the application of these results. Because of the methodologic flaws, the estimates of the various parameters of test accuracy probably will be biased, and the results of this meta-analysis should be interpreted with care. In view of the presence of review bias and verification bias in the various studies, the sensitivity of the various meniscal tests will be overestimated. The effect of those biases on specificity estimates, however, is less clear: Those specificities could be either overestimated or underestimated. Therefore, a rigorous conclusion regarding the diagnostic accuracy of the various meniscal tests cannot be made. Also, analysis of the influence of other potential sources of bias (like the type of gold standard, setting, and spectrum) was impeded by the low number of studies or the lack of information from studies.
The various physical diagnostic meniscal tests do not seem to be very helpful in guiding clinical decision making, and physicians should be aware of the very limited value of those tests. In the clinical determination of a meniscal lesion, however, meniscal tests are, of course, not applied in isolation. Combining the results of the various tests might improve accurate diagnosis of a meniscal lesion, and including other characteristics as well (eg, elements of history-taking) will further improve diagnosis setting. Those characteristics may even have more diagnostic power than the meniscal tests. Abdon and coworkers14 performed a discriminant analysis and addressed the McMurray test, JLT, and various other signs and symptoms jointly. Of the meniscal tests only, JLT resulted in some additional discriminative power (apart from various elements of history-taking). The results of their analysis, however, are not readily understandable, and the contribution of the individual items to improve the ability to diagnose meniscal lesions correctly remains obscure. Reanalysis of their results by multiple logistic regression might give results that are more directly applicable in clinical practice.
Because no study has been performed in primary care, and test characteristics are influenced by referral filters,27 one can only speculate what the effect will be of extrapolating the observed results to a primary care setting. If family physicians, who will be less experienced in performing those meniscal tests, apply as low a threshold for interpreting a test result as positive, the sensitivity of those tests will be higher, but the specificity will be lower. The predictive value of a negative test result will be affected only slightly, but the predictive value of a positive test result will decrease. On the other hand, when family physicians would apply a high threshold for test positivity, sensitivity decreases and specificity increases, resulting in an increased predictive value of a positive test result. Because of the case mix of patients with traumatic knee problems in primary care (ranging from vague minor knee disorders to clear-cut meniscal lesions), the prior probability (or prevalence) of having a meniscal lesion will be low in primary care, which means that the diagnostic gain will be low also Figure 2.
Recommendations For Future Research
Methodologically sound research on the diagnostic accuracy of the various physical diagnostic tests (determined both for each test separately and for all tests jointly) in combination with patient characteristics (eg, age, physical fitness, and functional demands) and elements of the medical history (eg, the type of trauma and the nature of the complaints) is needed. Such research will be more relevant to clinical practice and patient care if the effect of a correct early diagnosis on the functional outcome of the patient is assessed as well.
Recommendations For Clinical Practice
For the time being, there is little evidence that the diagnosis of meniscal lesions of the knee can be improved by applying the assessment of joint effusion, the McMurray test, JLT, or the Apley compression test. The need for applying more advanced diagnostic methods (eg, MRI) or referral for surgical treatment can be based only on the severity of the patient’s complaints.
1. McMurray TP. The semilunar cartilages. Br J Surg 1942;29:407-14.
2. Apley AG. The diagnosis of meniscus injuries. J Bone Joint Surg 1947;29:78-84.
3. Nicholas JA, Hershman EB, eds. The lower extremity and spine in sports medicine. Vol 1. 2nd ed. St. Louis, Mo: Mosby; 1995;814-15.
4. Resnick D, ed. Diagnosis of bone and joint disorders. Vol 5. 3rd ed. Philadelphia, Pa: Saunders; 1995;3076.-
5. Stratford PW, Binkley J. A review of the McMurray test: definition, interpretation, and clinical usefulness. J Orthop Sports Phys Ther 1995;22:116-20.
6. Plas CG van der, Dingjan RA, Hamel A, et al. [Dutch College of General Practitioners practice guidelines regarding traumatic knee problems]. [Dutch]. Huisarts en Wetenschap 1998;41:296-300.
7. Devillé WLJM, Bezemer PD, Bouter LM. Publications on diagnostic test evaluation in family medicine journals: an optimal search strategy. J Clin Epidemiol 2000;53:65-69.
8. Irwig L, Macaskill P, Glaziou P, Fahey M. Meta-analytic methods for diagnostic test accuracy. J Clin Epidemiol 1995;48:119-30.
9. Cochrane Methods Group on Systematic Review of Screening and Diagnostic Tests: recommended methods updated June 6, 1996 Available at som.flinders.edu.au/fusa/cochrane/.
10. Midgette AS, Stukel TA, Littenberg B. A meta-analytic method for summarizing diagnostic test performances: receiver-operating-characteristic-summary point estimates. Med Decis Making 1993;13:253-57.
11. Moses LE, Shapiro D, Littenberg B. Combining independent studies of a diagnostic test into a summary ROC curve: data-analytic approaches and some additional considerations. Stat Med 1993;12:1293-316.
12. Steinbruck K, Wiehmann JC. [Examination of the knee joint. The value of clinical findings in arthroscopic control]. [German]. Z Orthop Ihre Grenzgeb 1988;126:289-95.
13. Fowler PJ, Lubliner JA. The predictive value of five clinical signs in the evaluation of meniscal pathology. Arthroscopy 1989;5:184-86.
14. Abdon P, Lindstrand A, Thorngren KG. Statistical evaluation of the diagnostic criteria for meniscal tears. Int Orthop 1990;14:341-45.
15. Boeree NR, Ackroyd CE. Assessment of the menisci and cruciate ligaments: an audit of clinical practice. Injury 1991;22:291-94.
16. Saengnipanthkul S, Sirichativapee W, Kowsuwon W, Rojviroj S. The effects of medial patellar plica on clinical diagnosis of medial meniscal lesion. J Med Assoc Thai 1992;75:704-08.
17. Evans PJ, Bell GD, Frank C. Prospective evaluation of the McMurray test. Am J Sports Med 1993;21:604-08.
18. Corea JR, Moussa M, al Othman A. McMurray’s test tested. Knee Surg Sports Traumatol Arthroscop 1994;2:70-72.
19. Grifka J, Richter J, Gumtau M. [Clinical and sonographic meniscus diagnosis]. [German]. Orthopade 1994;23:102-11.
20. Shelbourne KD, Martini DJ, McCarroll JR, VanMeter CD. Correlation of joint line tenderness and meniscal lesions in patients with acute anterior cruciate ligament tears. Am J Sports Med 1995;23:166-69.
21. Mariani PP, Adriani E, Maresca G, Mazzola CG. A prospective evaluation of a test for lateral meniscus tears. Knee Surg Sports Traumatol Arthroscop 1996;4:22-26.
22. Noble J, Erat K. In defence of the meniscus: a prospective study of 200 meniscectomy patients. J Bone Joint Surg 1980;62-B:7-11.
23. Barry OCD, Smith H, McManus F, MacAuley P. Clinical assessment of suspected meniscal tears. Ir J Med Sci 1983;152:149-51.
24. Anderson AF, Lipscomb AB. Clinical diagnosis of meniscal tears: description of a new manipulative test. Am J Sports Med 1986;14:291-93.
25. Stratford PW. Prospective evaluation of the McMurray test. Am J Sports Med 1994;22:567-68.
26. Evans PJ. Authors’ response. Am J Sports Med 1994;22:568.-
27. Knottnerus JA, Leffers P. The influence of referral patterns on the characteristics of diagnostic tests. J Clin Epidemiol 1992;45:1143-54.
SEARCH STRATEGY: We performed a literature search of MEDLINE (1966-1999) and EMBASE (1988-1999) with additional reference tracking.
SELECTION CRITERIA: Articles written in English, French, German, or Dutch that addressed the accuracy of at least one physical diagnostic test for meniscus injury with arthrotomy, arthroscopy, or magnetic resonance imaging as the gold standard were included.
DATA COLLECTION and ANALYSIS: Two reviewers independently selected studies, assessed the methodologic quality, and abstracted data using a standardized protocol.
MAIN RESULTS: Thirteen studies (of 402) met the inclusion criteria. The results of the index and reference tests were assessed independently (blindly) of each other in only 2 studies, and in all studies verification bias seemed to be present. The study results were highly heterogeneous. The summary receiver operating characteristic curves of the assessment of joint effusion, the McMurray test, and joint line tenderness indicated little discriminative power for these tests. Only the predictive value of a positive McMurray test was favorable.
CONCLUSIONS: The methodologic quality of studies addressing the diagnostic accuracy of meniscal tests was poor, and the results were highly heterogeneous. The poor characteristics indicate that these tests are of little value for clinical practice.
Various physical diagnostic tests are available to assess meniscal lesions, such as assessment of joint effusion and joint line tenderness (JLT), the McMurray test, and the Apley compression test.1-4 Many meniscal tests, however, are not easy to perform and seem to be prone to errors.1,2,4 Also, the diagnostic accuracy of the various meniscal tests has been questioned,3-5 and conflicting results regarding that accuracy have been reported.6 Therefore, we systematically reviewed the medical literature to summarize the available evidence about the diagnostic accuracy of physical diagnostic tests for assessing meniscal lesions of the knee and to combine the results of individual studies when possible. We focused on the most common meniscal tests: the assessment of joint effusion, the McMurray test, JLT, and the Apley compression test.
Methods
Selection of Studies
We conducted a literature search of MEDLINE (1966-1999) and EMBASE (1988-1999) to identify articles written in English, French, German, or Dutch. The Medical Subject Headings (MeSH) terms “knee injuries,” “knee joint,” “knee,” and “menisci tibial,” and the text words “knee” and “effusion” were used. The results of this strategy were combined with a validated search strategy for the identification of diagnostic studies using the MeSH terms “sensitivity and specificity” (exploded), “physical examination” and “not (animal not (human and animal))” and the text words “sensitivity,” “specificity,” “false positive,” “false negative,” “accuracy,” and “screening,”7 supplemented with the text words “physical examination” and “clinical examination.” Also, the cited references of relevant publications were examined.
Studies were eligible for inclusion if they addressed the accuracy of at least one physical diagnostic test for the assessment of meniscal lesions of the knee and used arthrotomy, arthroscopy, or magnetic resonance imaging (MRI) as the gold standard. Studies were excluded if no reference group (nondiseased group or subjects with lesions other than the lesion of study) had been included, if only test-positives had been included, if the study pertained to cadavers only, or if only physical examination under anesthesia was considered.
The studies were selected by 2 reviewers independently. A preliminary selection of each study was made by checking the title, the abstract, or both. A definite selection was made by reading the complete article. During a consensus meeting disagreements regarding the selection of studies were discussed, and a definite selection was made. If disagreement persisted, a third reviewer made the final decision.
Assessment of Methodologic Quality and Data Abstraction
The methodologic quality of the selected studies was assessed, and data were abstracted by 2 reviewers independently. A checklist adapted from Irwig and colleagues8 and the Cochrane Methods Group on Systematic Review of Screening and Diagnostic Tests9 was used for quality assessment. This checklist consisted of 6 criteria for study validity, 5 criteria relevant to the clinical applicability of the results, and 5 items pertaining to the index Table w1, Table w1a test.* In a subsequent consensus meeting, both assessors discussed each criterion on which they initially disagreed. If disagreement persisted, a third reviewer made the final decision.
Statistical Analysis
Statistical analysis was performed according to a strategy adapted from Midgette and colleagues. Figure W1 10** For each study, the sensitivity and specificity of each index test were calculated. The c2 test was used to assess the homogeneity of the sensitivity and the specificity among studies. If homogeneity of both sensitivity and specificity was not rejected (P >.10), summary estimates of sensitivity and specificity were calculated.10 Heterogeneity of sensitivity and specificity might be caused by differences between studies in how clinicians define a positive test result.8 In that case, the pairs of sensitivity and specificity will be negatively correlated, as indicated by a negative Spearman rank correlation coefficient (Rs). When the pairs of sensitivity and specificity are negatively correlated, these pairs can be considered to be originating from a common receiver operating characteristic (ROC) curve, and a summary ROC (SROC) curve was estimated by meta-regression.8,10,11 The better the diagnostic accuracy of the test, the larger the area under the curve.
Differences between study characteristics are another potential source of heterogeneity of sensitivity and specificity.8 Those other sources of heterogeneity were assessed by adding the following characteristics to the meta-regression model: study validity items (most valid category of each item vs other categories), setting (primary care vs other), the spectrum of the diseased and the nondiseased (broad spectrum vs small spectrum), the prevalence of meniscal lesions, and the year of publication. When a significant subgroup was identified (P <.05), separate analyses were performed for each subgroup.
The summary estimates of sensitivity and specificity were used to calculate the predictive value of a positive (PV+) and negative (PV-) test result for circumstances with varying prevalences of meniscal lesions. When the sensitivities or specificities were heterogeneous between studies, however, the summary estimate of sensitivity was used for calculating predictive values with the accompanying specificity, estimated from the SROC curve.
Results
Selection of Studies
The literature search revealed a total of 402 potentially eligible studies, of which 10 were selected for inclusion.12-21 Three other studies were found by reference tracking.22-24 Thus, 13 studies met the selection criteria. The reply to a letter to the editor to one of the studies contained additional information and was also considered for analysis.17,25,26
Methodologic Quality and Study Characteristics
The index test and reference standard had been measured independently (blindly) of each other in only 2 studies.16,21 Verification bias seemed to be present in all studies (patients with an abnormal physical test result were more likely to undergo the gold standard test, inflating the sensitivity and decreasing the specificity). Nine studies applied arthroscopy as the gold standard,12-14,16,17,19-21,24 and 1 study used MRI.15 No study was performed in a primary care setting. In 7 studies a broad spectrum of knee lesions was reported,12-15,17,20,21 and in 4 studies the spectrum was not specified Table 1.18,19,22,23 A broad spectrum of conditions in the reference group (nondiseased) was present in 8 studies,12-15,17,20,22,23 while in 4 studies the spectrum was not specified.18,19,21,24 Details regarding the index tests were poorly reported, except in 2 studies.17,21 In all studies that addressed the McMurray test, the experience of a “thud” or “click” was used for designating a test as positive.12,13,15-19,22 Only 2 studies mentioned assessment of the index test independent of knowledge of other clinical information (including the results of other meniscal tests).17,21Table w2* The age and sex distribution of the patients and the duration of complaints are presented in Table 1.
Accuracy of Meniscal Tests
The accuracy of the assessment of joint effusion was determined in 4 studies, the McMurray test in 11, JLT in 10, the Apley compression test in 3, and 5 studies addressed various other tests. No data were presented in or could be derived from 1 study pertaining to joint effusion, 3 studies regarding the McMurray test,14,23,24 and 1 study on JLT,24 while from 1 study pertaining to both the McMurray test and JLT only the point estimates of the various test characteristics were reported without the original number of patients in the various categories.15 Of the study of Evans and coworkers,17,26 who presented data of an inexperienced and experienced researcher, only the latter results were used. Of the study of Abdon and colleagues,14 who made a distinction between tenderness of the medial and posterior part of the joint line, only the data of the medial part were considered. It should be noted that 2 studies incorporated a very small number of nondiseased subjects.23,24 Also, one of those studies presented results from individual knees instead of subjects.24 Part of their results pertained to both knees of the same subject, which violates the assumption of (statistical) independence of the observations. Therefore, this study was excluded from further analysis. Finally, some studies did not make a distinction between medial and lateral meniscal lesions,13,17,19,22,23 while others presented the results for medial and lateral meniscal lesions separately.12,14,15,18,20 Of the latter studies, only the results of medial meniscal tests were used for statistical analysis.
The diagnostic accuracy of assessment of joint effusion and the various meniscal tests is shown in Table 2. There was significant heterogeneity of sensitivity and specificity of all tests, except for specificity of the Apley compression test (P=.89).
Sensitivity and specificity were negatively correlated for joint effusion (Rs = -1.0), the McMurray test (Rs = -0.43), and JLT (Rs = -0.62). This means that as one increased, the other decreased, which is to be expected. The SROC curves Figure 1 indicate little discriminative power of those meniscal tests. No significant subgroups were detected for both tests. The power of meta-regression analysis, however, was low because of the small number of available studies.
Sensitivity and specificity of the Apley compression test were not correlated (Rs = 0.0) and no SROC curve was estimated. Sources of heterogeneity could not be identified. Only 3 studies, however, addressed this test.
Figure 2 shows the positive predictive value (PV+) and negative predictive value (PV-) for the assessment of joint effusion, the McMurray test, and JLT, according to varying prevalences of meniscal lesions. The summary estimate of sensitivity and accompanying specificity (derived from the SROC curve) were used for joint effusion (0.43 and 0.70), the McMurray test (0.48 and 0.86), and JLT (0.77 and 0.41). Only the McMurray test had a favorable estimated PV+. The PV+ of joint effusion and JLT exceeded the presumed prevalences only slightly, indicating poor additional diagnostic value. The PV- of all tests was poor.
Discussion
Our goal was to summarize the available evidence on the accuracy of various physical diagnostic tests for assessing meniscal lesions of the knee. The accuracy of those tests seems to be poor, and only a positive McMurray test result seems to be of some diagnostic significance.
However, because of the small number and poor quality of the studies found, we have significant concerns about the application of these results. Because of the methodologic flaws, the estimates of the various parameters of test accuracy probably will be biased, and the results of this meta-analysis should be interpreted with care. In view of the presence of review bias and verification bias in the various studies, the sensitivity of the various meniscal tests will be overestimated. The effect of those biases on specificity estimates, however, is less clear: Those specificities could be either overestimated or underestimated. Therefore, a rigorous conclusion regarding the diagnostic accuracy of the various meniscal tests cannot be made. Also, analysis of the influence of other potential sources of bias (like the type of gold standard, setting, and spectrum) was impeded by the low number of studies or the lack of information from studies.
The various physical diagnostic meniscal tests do not seem to be very helpful in guiding clinical decision making, and physicians should be aware of the very limited value of those tests. In the clinical determination of a meniscal lesion, however, meniscal tests are, of course, not applied in isolation. Combining the results of the various tests might improve accurate diagnosis of a meniscal lesion, and including other characteristics as well (eg, elements of history-taking) will further improve diagnosis setting. Those characteristics may even have more diagnostic power than the meniscal tests. Abdon and coworkers14 performed a discriminant analysis and addressed the McMurray test, JLT, and various other signs and symptoms jointly. Of the meniscal tests only, JLT resulted in some additional discriminative power (apart from various elements of history-taking). The results of their analysis, however, are not readily understandable, and the contribution of the individual items to improve the ability to diagnose meniscal lesions correctly remains obscure. Reanalysis of their results by multiple logistic regression might give results that are more directly applicable in clinical practice.
Because no study has been performed in primary care, and test characteristics are influenced by referral filters,27 one can only speculate what the effect will be of extrapolating the observed results to a primary care setting. If family physicians, who will be less experienced in performing those meniscal tests, apply as low a threshold for interpreting a test result as positive, the sensitivity of those tests will be higher, but the specificity will be lower. The predictive value of a negative test result will be affected only slightly, but the predictive value of a positive test result will decrease. On the other hand, when family physicians would apply a high threshold for test positivity, sensitivity decreases and specificity increases, resulting in an increased predictive value of a positive test result. Because of the case mix of patients with traumatic knee problems in primary care (ranging from vague minor knee disorders to clear-cut meniscal lesions), the prior probability (or prevalence) of having a meniscal lesion will be low in primary care, which means that the diagnostic gain will be low also Figure 2.
Recommendations For Future Research
Methodologically sound research on the diagnostic accuracy of the various physical diagnostic tests (determined both for each test separately and for all tests jointly) in combination with patient characteristics (eg, age, physical fitness, and functional demands) and elements of the medical history (eg, the type of trauma and the nature of the complaints) is needed. Such research will be more relevant to clinical practice and patient care if the effect of a correct early diagnosis on the functional outcome of the patient is assessed as well.
Recommendations For Clinical Practice
For the time being, there is little evidence that the diagnosis of meniscal lesions of the knee can be improved by applying the assessment of joint effusion, the McMurray test, JLT, or the Apley compression test. The need for applying more advanced diagnostic methods (eg, MRI) or referral for surgical treatment can be based only on the severity of the patient’s complaints.
1. McMurray TP. The semilunar cartilages. Br J Surg 1942;29:407-14.
2. Apley AG. The diagnosis of meniscus injuries. J Bone Joint Surg 1947;29:78-84.
3. Nicholas JA, Hershman EB, eds. The lower extremity and spine in sports medicine. Vol 1. 2nd ed. St. Louis, Mo: Mosby; 1995;814-15.
4. Resnick D, ed. Diagnosis of bone and joint disorders. Vol 5. 3rd ed. Philadelphia, Pa: Saunders; 1995;3076.-
5. Stratford PW, Binkley J. A review of the McMurray test: definition, interpretation, and clinical usefulness. J Orthop Sports Phys Ther 1995;22:116-20.
6. Plas CG van der, Dingjan RA, Hamel A, et al. [Dutch College of General Practitioners practice guidelines regarding traumatic knee problems]. [Dutch]. Huisarts en Wetenschap 1998;41:296-300.
7. Devillé WLJM, Bezemer PD, Bouter LM. Publications on diagnostic test evaluation in family medicine journals: an optimal search strategy. J Clin Epidemiol 2000;53:65-69.
8. Irwig L, Macaskill P, Glaziou P, Fahey M. Meta-analytic methods for diagnostic test accuracy. J Clin Epidemiol 1995;48:119-30.
9. Cochrane Methods Group on Systematic Review of Screening and Diagnostic Tests: recommended methods updated June 6, 1996 Available at som.flinders.edu.au/fusa/cochrane/.
10. Midgette AS, Stukel TA, Littenberg B. A meta-analytic method for summarizing diagnostic test performances: receiver-operating-characteristic-summary point estimates. Med Decis Making 1993;13:253-57.
11. Moses LE, Shapiro D, Littenberg B. Combining independent studies of a diagnostic test into a summary ROC curve: data-analytic approaches and some additional considerations. Stat Med 1993;12:1293-316.
12. Steinbruck K, Wiehmann JC. [Examination of the knee joint. The value of clinical findings in arthroscopic control]. [German]. Z Orthop Ihre Grenzgeb 1988;126:289-95.
13. Fowler PJ, Lubliner JA. The predictive value of five clinical signs in the evaluation of meniscal pathology. Arthroscopy 1989;5:184-86.
14. Abdon P, Lindstrand A, Thorngren KG. Statistical evaluation of the diagnostic criteria for meniscal tears. Int Orthop 1990;14:341-45.
15. Boeree NR, Ackroyd CE. Assessment of the menisci and cruciate ligaments: an audit of clinical practice. Injury 1991;22:291-94.
16. Saengnipanthkul S, Sirichativapee W, Kowsuwon W, Rojviroj S. The effects of medial patellar plica on clinical diagnosis of medial meniscal lesion. J Med Assoc Thai 1992;75:704-08.
17. Evans PJ, Bell GD, Frank C. Prospective evaluation of the McMurray test. Am J Sports Med 1993;21:604-08.
18. Corea JR, Moussa M, al Othman A. McMurray’s test tested. Knee Surg Sports Traumatol Arthroscop 1994;2:70-72.
19. Grifka J, Richter J, Gumtau M. [Clinical and sonographic meniscus diagnosis]. [German]. Orthopade 1994;23:102-11.
20. Shelbourne KD, Martini DJ, McCarroll JR, VanMeter CD. Correlation of joint line tenderness and meniscal lesions in patients with acute anterior cruciate ligament tears. Am J Sports Med 1995;23:166-69.
21. Mariani PP, Adriani E, Maresca G, Mazzola CG. A prospective evaluation of a test for lateral meniscus tears. Knee Surg Sports Traumatol Arthroscop 1996;4:22-26.
22. Noble J, Erat K. In defence of the meniscus: a prospective study of 200 meniscectomy patients. J Bone Joint Surg 1980;62-B:7-11.
23. Barry OCD, Smith H, McManus F, MacAuley P. Clinical assessment of suspected meniscal tears. Ir J Med Sci 1983;152:149-51.
24. Anderson AF, Lipscomb AB. Clinical diagnosis of meniscal tears: description of a new manipulative test. Am J Sports Med 1986;14:291-93.
25. Stratford PW. Prospective evaluation of the McMurray test. Am J Sports Med 1994;22:567-68.
26. Evans PJ. Authors’ response. Am J Sports Med 1994;22:568.-
27. Knottnerus JA, Leffers P. The influence of referral patterns on the characteristics of diagnostic tests. J Clin Epidemiol 1992;45:1143-54.