User login
Outcomes of audit-enhanced monitoring of patients with type 2 diabetes
OBJECTIVE: To assess the outcome of diabetes care in a practice-based research network after the introduction of an audit-enhanced monitoring system (AEMS).
STUDY DESIGN: An AEMS was introduced into family practices participating in the academic research network of Nijmegen University, Nijmegen, the Netherlands. One and 7 years later, a cross-sectional analysis was performed on the outcome of care in all type 2 diabetes patients under treatment by their family physicians.
POPULATION: Approximately 42,500 patients in 1993 and approximately 46,000 patients in 1999 at 10 family practices participating in the university’s academic research network.
OUTCOMES MEASURED: Targets of care were Hb A1c< 8.5% and blood pressure < 150/85 mm Hg. Targets for lipids depended on age, cardiovascular morbidity, and smoking status.
RESULTS: In 1993, 540 type 2 diabetes patients were included; in 1999, 851 such patients were included, representing a prevalence of 1.3% and 1.9%, respectively. Glycemic control improved statistically significantly by the percentage of patients with Hb A1c< 8.5% (87% vs 59%, P = .0001) and the mean Hb A1c (7.1% vs 8.2%, P = .0001) from the first to the second cohort. Mean blood pressure and the percentage of patients above the target blood pressure did not change. The mean cholesterol level (207 mg/dL vs 238 mg/dL [5.4 mmol/L vs 6.2 mmol/L], P = .0001) and the percentage of patients who met their target lipid levels (72% vs 52%, P = .001) also improved between 1993 and 1999. In addition, an increased percentage of patients attended an annual review in the past year (73% vs 84%).
CONCLUSIONS: Outcomes of diabetes care in a family practice research setting using an AEMS were comparable with those reported under randomized controlled trial conditions.
- Guidelines recommend tight metabolic control in combination with state-of-the-art management of other risk factors in order to prevent macrovascular and microvascular complications in patients with type 2 diabetes.
- The formulation of clinical guidelines alone, however, is insufficient to improve actual care.
- Monitoring and feedback with systematic follow-up of treatment targets of diabetes care in a family practice setting can produce outcomes comparable with those reported under randomized controlled trial conditions.
Recent studies have emphasized the importance of tight metabolic control in combination with state-of-the-art management of other risk factors to prevent macrovascular and microvascular complications in patients with type 2 diabetes mellitus.1-5 Guidelines for diabetes care recommend systematic monitoring of patients’ health status, including metabolic control, cardiovascular risk factors, and desired outcome of care.6-8
The formulation of clinical guidelines alone, however, is insufficient to improve actual care.9,10 Strategies to reinforce the guidelines in daily practice include monitoring the patient’s clinical condition over a given period of time, feedback to the clinician about the outcome, audit of clinical performance, academic detailing by peers, and evidence-based guidelines.10-12 Monitoring and feedback with systematic follow-up of relevant treatment targets enhanced a proactive approach to patients,13 which is a key factor for successful diabetes care.14 As large numbers of patients with type 2 diabetes are treated in family practice, it is important that target-specific monitoring fit into the overall primary care function of family practice and that it answer the needs, demands, and expectations of patients.
Since 1985, the Nijmegen University Department of Family Practice has been developing a computer-assisted practice network, the Nijmegen Academic Research Network CMR/NMP, to study chronic diseases.15,16 The objectives of this network are to support care for patients with chronic diseases and to create an optimal setting for clinical research under family practice conditions. This paper analyzes the outcome of diabetes care in the CMR/NMP 7 years after the introduction of an audit-enhanced monitoring system (AEMS).17
The aims were to assess (1) the outcome of care compared with external guideline criteria and the results of clinical trials, and (2) the relationship of outcome to process of care measures and to patient-related and practice-related factors.
Methods
Study population
Data were collected at the 10 family practices in the CMR/NMP, with 25 family physicians and a patient list of approximately 46,000 in 1999.16 All patients meeting World Health Organization criteria for the diagnosis of type 2 diabetes mellitus and under treatment by a family physician in 1993 and 1999 were included in the AEMS.15,18 Patients who were treated with insulin within 1 year of diagnosis and who continued to take it were considered to have type 1 diabetes mellitus. All other patients were regarded as type 2, regardless of current treatment. For this study we included all type 2 diabetes patients under treatment by their family physician in 1993 and 1999. Patients who had died or who had moved to another area or been admitted to a residential nursing home before the end of the year were excluded, as were those who had been newly diagnosed during the year.
Audit-enhanced monitoring system
Since 1989, data have been collected on all type 2 diabetes patients at the time of diagnosis and during all regular (quarterly) diabetes-related outpatient visits. In 1992, a structured annual review, based on guidelines from the Dutch College of Family Physicians,19 was added. Starting in 1992, monitoring has consisted of the assessment of (1) compliance with 3 monthly control visits and an annual review visit; (2) glycemic control (ie, fasting blood glucose and Hb A1c); (3) diabetes-related complications (ie, retinopathy, creatinine clearance, and foot problems); (4) cardiovascular risk factors (ie, smoking behavior, blood pressure, and lipid profile); (5) cardiovascular morbidity (ie, myocardial infarction, angina pectoris, heart failure, peripheral vascular disease, transient ischemic attack, or cerebrovascular accident). In addition, all reasons for dropping out, including cause of death, were recorded. Morbidity and causes of death were defined as in the International Classification of Health Problems in Primary Care.
To facilitate data collection, a computerized Research Registration System (RRS) was developed. The system was integrated into a standard Dutch electronic record system for family practice (Promedico, Euroned). The RRS generates templates for recording data at the quarterly or annual diabetes control visits into the patient’s electronic record. Templates guide the delivery of care and a reminder system is integrated into the RRS. Office assistants contact patients who do not come in for visits at regular intervals, both those (< 1%) who usually do not come in and those who are supposed to but fail to do so.
Family physicians sent the RRS data files to the University Department of Family Practice, where they were processed into a feedback report on process of care and outcome of care measures on 3 levels: (1) total study population; (2) practice population; (3) individual patient. Process and outcome measures were compared with external criteria based on guidelines from the Dutch College of Family Medicine and with average performance at the other practices. Feedback items were selected in consultation with the participating physicians. In this way, feedback corresponded with daily practice needs. During the project, the feedback was gradually extended from process to outcome measures. The feedback was standard to all practices.
Feedback was discussed at University Department of Family Medicine meetings, which maintained uniform registration and safeguarded the progress of the project. The feedback was also sent to every practice and participating GP. This report contained practice-level as well as physician-level data. The Figure demonstrates one way in which data are presented at the meetings and shows the percentage of patients who attended their annual diabetes control visit in the year studied.
Targets for care
Targets for care consisted of 2 elements: process and outcome measures. The key marker for process of care was compliance to the annual diabetes control visit. Key markers for desired outcome of care were (1) Hb A1c < 8.5%,19 (2) blood pressure less than 160/90 mm Hg (revised to 150/85 mm Hg in 1999),8,19 and (3) lipids in accordance with Dutch guidelines for general practice8: (a) cholesterol < 5 mmol (192 mg/dL) for patients with cardiovascular morbidity; (b) cholesterol/HDL ratio < 5.0 in smokers without cardiovascular morbidity; and (c) cholesterol/HDL < 6.0 in nonsmokers without cardiovascular morbidity. These guidelines for lipid-lowering therapy are based on sex, a life expectancy of at least 5 years, smoking status, presence of cardiovascular morbidity, total cholesterol levels, high-density lipoprotein (HDL) cholesterol levels, and triglyceride levels. If even 1 of these variables is absent, the potential value of lipid lowering cannot be determined.8
Analysis
Cross-sectional analysis was performed on the outcome of diabetes care in patients with type 2 diabetes who were treated by their family physicians in 1993 and 1999. The comparison was based on all patients who had been treated for the full calendar year in 1993 and 1999; therefore, it was based on a dynamic population. Process and outcome measures are compared using the chi-squared, unpaired t, or Mann–Whitney test, as appropriate. Results are expressed as means plus or minus standard deviations or as proportions. Multilevel analysis was performed to assess factors that contributed to the variance in compliance with the annual review and the desired glycemic level (Hb A1c < 8.5%).
Results
In 1993, 540 type 2 diabetes patients (prevalence 1.3%) were included in the AEMS. Of these, 51 had been newly diagnosed (incidence 1.2/1000); 37 had been treated by a specialist (7%); and 20 did not participate (4%). Excluding the 108 patients in the latter 3 categories left a total of 432 patients for analysis. In 1999, 851 patients were included (prevalence 1.9%). Of these, 138 had been newly diagnosed (incidence 3.0/1000); 88 had been treated by a specialist (10%); and 31 did not participate (4%). Excluding the 257 patients in those 3 categories left 594 for analysis. Table 1 shows the baseline characteristics of patients included in the analysis.
Annual review was attended by 73% of patients in 1993 and 84% of patients in 1999 (Table 2). Increased compliance was achieved at all the practices, although differences between practices remained in 1999 (Figure). Univariate analysis showed that compliance with the annual review in 1999 was related to the practice (P = .001) but not to patient factors such as sex, age, duration of diabetes, therapy regimen, or cardiovascular morbidity, even after adjusting for blood glucose levels. Patients who did not attend their annual diabetes control visit had statistically significantly higher fasting blood glucose levels than patients who did comply (8.9 mmol/L [160 mg/dL] vs 8.2 mmol [147 mg/dL], P = .03). In 1993, 59% of patients had visited an ophthalmologist in the previous 2 years versus 80% in 1999.
In 1993, Hb A1c was measured in 51% of patients with a mean of 8.2%. In 1999, compliance in measurement of Hb A1c improved to 82%, with a mean Hb A1c level of 7.1% (P = .0001, Table 3). The percentages of patients with an Hb A1c level of more than 8.5% decreased from 41% to 13% (P = .001). These outcomes were associated with changes in treatment (P = .001): a decrease in patients treated with diet only (22% in 1993 vs 13% in 1999) and with oral hypoglycemic monotherapy (45% in 1993 vs 37% in 1999); an increase in patients treated with combination therapy using 2 or more oral hypoglycemic agents (22% in 1993 vs 31% in 1999); and an increase in insulin therapy (11% in 1993 vs 19% in 1999). Univariate analysis showed that poor glycemic control (Hb A1c > 8.5%) in 1999 was related to the therapy regimen (P = .001) but not to sex, age, duration of diabetes, cardiovascular morbidity, or practice. The glycemic control in patients treated with combination therapy or insulin was poorer than in patients treated with diet only or oral hypoglycemic monotherapy, probably reflecting the fact that patients with less severe disease are managed with single agents and diet.
Compliance with measurement of blood pressure improved from 72% to 83% during the study period (Table 3). However, the percentage of patients with a systolic blood pressure below 150 mm Hg or a diastolic blood pressure below 85 mm Hg did not change between 1993 and 1999 whether patients were hypertensive or not. In hypertensive patients with type 2 diabetes, the mean diastolic blood pressure decreased from 88 mm Hg to 85 mm Hg (P = .004), but mean systolic blood pressure did not change.
The mean cholesterol level was lower in 1999 than in 1993 (6.2 vs 5.4 mmol/L; 238 mg/dL vs 207 mg/dL, P = .0001), as was the mean triglyceride level (2.54 mmol/L vs 2.07 mmol/L; 221 mg/dL vs 180 mg/dL, P = .0003). In both years, data regarding which patients could be considered for lipid-lowering therapy were available for 63% and 82%, respectively. In 1993, a far higher proportion of patients had failed to reach lipid target levels than was the case in 1999 (48% vs 28%, respectively, P = .001).
Multilevel analysis showed that paying an annual diabetes control visit (a process outcome) was related to the practice (intraclass correlation coefficient [ICC] = 0.29) but not to patient factors. Reaching the glycemic target level of Hb A1c < 8.5%, however, was not related to practice factors (ICC = 0.003).
TABLE 1
Chacteristics of type 2 diabetes patients under family physician care in 1993 and 1999
| Characteristic | 1993 (n = 432) | 1999 (n = 594) | P |
|---|---|---|---|
| Mean age (years) | 68 | 67 | .34 |
| Male, % | 38 | 44 | .06 |
| Mean duration of diabetes (years) | 6.2 | 6.7 | .08 |
| Cardiovascular morbidity,% | 31 | 27 | .08 |
| Hypertension,% | 36 | 39 | .51 |
| Mean body mass index (kg/m2) | 28.3 | 29.2 | .02 |
| NOTE: Table excludes those patients newly diagnosed during the previous year. | |||
TABLE 2
Process of care for type 2 diabetes patients under family physician care, 1993 vs 1999
| Process of care | Compliance to criterion, % (range between practices) | |
|---|---|---|
| 1993* | 1999† | |
| Any visit addressing diabetic control in past year | 97 (89–100) | 96 (91–100) |
| Annual review in past year | 73 (34–90) | 84 (64–100) |
| Visit to ophthalmologist in previous 2 years | 59 (40–79) | 80 (60–94) |
| *n = 432. | ||
| † n = 594. | ||
TABLE 3
Outcomes of care for type 2 diabetes patients under family physician care, 1993 vs 1999
| Outcome | 1993 (n = 432) | Missing* (%) | 1999 (n = 594) | Missing* (%) | P |
|---|---|---|---|---|---|
| Mean fasting glucose (mmol/L) | 8.6 (2.9) | 3 | 8.3 (2.6) | 4 | .07 |
| Mean Hb A1c (percentage) | 8.3 (2.2) | 50 | 7.1 (1.5) | 18 | .0001 |
| Hb A1c | |||||
| < 7% | 30% | 52% | ┐ | ||
| 7% to 8.5% | 29% | 35% | .001 | ||
| > 8.5% | 41% | 13% | ┘ | ||
| Blood pressure in patients with hypertension | n = 112 (36%) | 28 | n = 195(39%) | 17 | |
| •Mean systolic blood pressure (mm Hg) | 161 (19) | 158 (20) | .2 | ||
| •Mean diastolic blood pressure (mm Hg) | 88 (9) | 85 (9) | .004 | ||
| •Systolic blood pressure > 150 mm Hg | 68% | 62% | .3 | ||
| •Diastolic blood pressure > 85 mm Hg | 51% | 48% | .7 | ||
| Blood pressure in patients without hypertension | n = 197 (64%) | 28 | n = 299 (61%) | 17 | |
| •Mean systolic blood pressure (mm Hg) | 145 (18) | 145 (19) | .7 | ||
| •Mean diastolic blood pressure (mm Hg) | 80 (9) | 79 (9) | .5 | ||
| •Systolic blood pressure > 150 mm Hg | 34% | 35% | .6 | ||
| •Diastolic blood pressure > 85 mm Hg | 23% | 23% | .9 | ||
| Mean cholesterol (mmol/L /mg/dL) | 6.2 (1.3) / 238 (49) | 31 | 5.4 (1.1) / 207 (42) | 17 | .0001 |
| Mean HDL (mmol/L /mg/dL) | 1.2 (0.6) / 46.5 (23.2) | 62 | 1.2 (0.4) / 46.5 (15.5) | 23 | .59 |
| Mean triglycerides (mmol /mg/dL) | 2.6 (1.5) / 226 (130) | 58 | 2.1 (1.3) / 182 (113) | 23 | .0001 |
| Patients with cardiovascular morbidity > 5 mmol/L and cholesterol >192 mg/L | 31% | ┐ | 17% | ┐ | ┐ |
| Patients without cardiovascular morbidity, smokers, and those with cholesterol/HDL ratio > 5.0 | 4% | 37 | 5% | 18 | .001 |
| Patients without cardiovascular morbidity, nonsmokers, and those with cholesterol/HDL ratio > 6.0 | 13% | ┘ | 6% | ┘ | ┘ |
| *Refers to the percentage of patients with missing data for this variable. | |||||
FIGURE
Percentage of patients with annual review (target = 75%) in 1999 (n=594)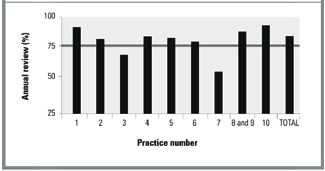
Discussion
During 7 years of structured audit-enhanced monitoring of patients with type 2 diabetes in an academic family practice research network, the intermediate measures of diabetes care improved. In particular, the mean Hb A1c of 7.1% can be seen as a measure of good quality of care. The number of patients treated according to Dutch family practice guidelines (a process of care outcome) also increased.8
While our data were collected during normal daily care (effectiveness), the findings come close to the outcome of care under ideal trial conditions (efficacy).21 In the UK Prospective Diabetes Study (UKPDS), the median Hb A1c level for all newly diagnosed patients in the group with intensive blood glucose control over 10 years reached a comparable level of 7.0%.1 Thus, the outcome of our study approaches that achieved under trial conditions. When we analyzed patients without outcome data as poorly controlled (worst-case scenario), Hb A1c was less than 8.5% in 28%.
The trend of improvement in glycemic control could have been a result of improved overall diabetes care in the Netherlands during the study period. Data about the outcome of diabetes care in the family medicine setting in the Netherlands during the study period are scarce and, when available, are derived from other research networks. In these networks a mean Hb A1c of 7.0% to 7.6% was reached.22 Yet indicators from other studies suggest that our results were far better than outcome from usual care. Recently published data on such outcomes in family medicine in the Netherlands showed that Hb A1c, blood pressure, and lipids were measured in less than 30% of patients.23,24 Outcomes from usual care as reported in research studies appear to be strongly biased by selection and probably cannot serve as a valid reference value.
The disappointing effect on the percentage of patients who reached the target blood pressure could have resulted from evaluating the data prematurely. When the study began, the primary objective was to improve glycemic control. Shortly after the publication of the Scandinavian Simvastatin Survival Study (4S)3 and the UKPDS,12 the guidelines of the Dutch College of Family Physicians were changed8 and more attention was paid to blood pressure and lipid control. This new approach was discussed with the participating family physicians. Consequently, the target for blood pressure was revised from 160/90 mm Hg to 150/85 mm Hg and lipid-lowering therapy was tailored to each patient’s cardiovascular risk profile. The 1999 outcome with respect to blood pressure and lipid control was measured only 1 year after these changes had been announced. Nevertheless, mean diastolic blood pressure in hypertensive patients and total cholesterol and triglyceride levels decreased significantly, and more patients reached target levels for lipids in 1999 than in 1993.
Our outcome was reached through enhanced compliance to guidelines. Therefore, the outcome in 1999 was based on a larger percentage of available patients. Because the AEMS studied a dynamic group of patients, the study groups in 1993 and 1999 were not identical. Theoretically, improvement in outcome could have been reached by including more easily manageable patients. However, no patient factors such as sex, age, duration of diabetes, treatment modality, or cardiovascular morbidity were related to compliance with annual review. The higher fasting blood glucose levels in patients who were noncompliant with annual review probably reflected under-treatment rather than more severe illness status. Therefore, we are confident that the findings reflect improved overall diabetes care.
The data on process measures in this study compare favorably with those of multipractice audits of diabetes care in the United Kingdom.25-29 The high prevalence rate of 2.0% (exclusively patients with type 2 diabetes) supports the validity of our data.25-27 Among our patients, 96% had been seen at least once during the previous year. In the large studies by Khunti and Bennett, only 85% had been seen during the previous year.25,26 The mean annual compliance rate of nearly 85% with Hb A1c and blood pressure measurements in our study was high. In particular, compliance with lipid control25,26,28 and funduscopy26,28 was better in our study. In 2 longitudinal studies that used an organized care system in which feedback was provided to the participating family physicians, compliance rates in process measures of up to 75% were reported.30,31
The outcomes of this study were achieved in an academic family practice research network, with specific facilities for the proactive supervision of patients with chronic diseases. These results cannot and should not be generalized to “routine” family practice. Monitoring and feedback in routine family practice are in themselves insufficient to improve the quality of care.10 Care assessment should preferably take a more comprehensive approach in which evidence-based goals for care are formulated, care is improved to reach those goals, and care is measured to see whether those goals have been achieved.11 Our academic network provides this comprehensive approach.
The electronic Research Registration System played an important role in the audit-enhanced monitoring. In the pilot phase of the project, paper records were used. Although using paper records had clear disadvantages, one could expect to achieve similar results using such records in combination with a central electronic data bank.
Conclusions
Outcomes of diabetes care in our family research setting were comparable with those reported in randomized controlled trials. Therefore, it is possible for the management of diabetes in family practice to be efficacious. This finding should encourage more efforts by physicians in family practice to bridge the gap between efficacy and effectiveness.
Important differences remained in achieved process measures between the academic family practices. While the outcome of diabetes care in the network was favorable, the outcome of treatment was unsatisfactory in a substantial number of patients. Further implementation strategies must be developed. The differences in achieved process measures were probably unrelated to socioeconomic differences between the practice populations, since the practice pairs 1/3 and 7/10 served comparable communities and had different levels of compliance.
Our study demonstrated that a high quality of diabetes care in family practice can be achieved. Audit-enhanced monitoring, which will provide the greatest benefit to the most patients with type 2 diabetes mellitus, should be implemented as part of a quality improvement system.
ACKNOWLEDGMENTS
The authors wish to thank the family physicians and practice nurses for their continuing support and data collection.
1. UK Prospective Diabetes Study Group. Intensive blood-glucose control with sulphonylureas or insulin compared with conventional treatment and risk of complications in patients with type 2 diabetes (UKPDS 33). Lancet 1998;352:837-53.
2. UK Prospective Diabetes Study Group. Tight blood pressure control and risk of macrovascular and microvascular complications in type 2 diabetes: UKPDS 38. BMJ 1998;327:703-13.
3. Pyörälä K, Pedersen T, Klekshus J, et al. Cholesterol lowering with simvastatin improves prognosis of diabetes patients with coronary heart disease: a subgroup analysis of the Scandinavian Simvastatin Survival Study (4S). Diabetes Care 1997;20:614-20.
4. Adler AI, Stratton IM, Niel HAW, et al. Association of glycaemia with macrovascular and microvascular complications of type 2 diabetes (UKPDS 35): prospective observational study. BMJ 2000;321:405-12.
5. Adler AI, Stratton IM, Niel HAW, et al. Association of systolic blood pressure glycaemia with macrovascular and microvascular complications of type 2 diabetes (UKPDS 36): prospective observational study. BMJ 2000;321:412-9.
6. American Diabetes Association. Standards of Medical Care for patients with diabetes mellitus (position statement). Diabetes Care 1999;22(suppl 1):S32-9.
7. European Diabetes Policy Group 1999. A desktop guide to type 2 diabetes mellitus. Diabet Med 1999;16:716-30.
8. Rutten GEHM, Verhoeven S, Heine RJ, et al. NHG-standaard diabetes mellitus type 2 (eerste herziening). Huisarts Wet 1999;42:67-84.Available in English at: http://www.diabetesinprimarycare.com.
9. Woolf SH, Grol R, Hutchinson A, Eccles M, Grimshaw J. Clinical guidelines: potential benefits, limitations, and harms of guidelines. BMJ 1999;318:527-30.
10. Grol R, Jones R. Twenty years of implementation research. Fam Pract 2000;17:S32-5.
11. Grol R. Between evidence-based practice and total quality management: the implementation of cost-effective care. Int J Qual Health Care 2000;12:297-304.
12. Thomson O’Brien MA, Oxman AD, Davis DA, Haynes RB, Freemantle N, Harvey EL. Audit and feedback: effects on professional practice and health care outcomes (Cochrane Review). In: The Cochrane Library, Issue 3, 2000. Oxford, England: Update Software.
13. Hart JT. Reactive and proactive care: a crisis. Br J Gen Pract 1990;40:4-9.
14. Greenhalgh PM. Shared care for diabetes: a systematic review. Occasional Paper 67. Royal College of General Practitioners; 1994.
15. Weel van C. Validating long-term morbidity recording. J Epidemiol Community Health 1995;49(suppl 1):29-32.
16. Weel van C, Smith H, Beasly JW. Family practice research networks: experience from three countries. J Fam Pract 2000;49:938-43.
17. Grauw de WJC, Lisdonk van de EH, Hoogen van den HJM, Weel van C. Monitoring of non-insulin dependent diabetes mellitus in general practice. Diabetes Nutr Metab 1991;4(suppl):67-71.
18. World Health Organization, Expert Committee on Diabetes Mellitus. WHO Technical Report No.727. Geneva, Switzerland: WHO; 1985.
19. Nederlands Huisartsen Genootschap. Standaard diabetes mellitus type II. Huisarts Wet 1989;32:15-8.
20. ICHPPC-2 Defined WONCA, 3rd ed. Oxford, England: Oxford University Press; 1983.
21. Weel van C, Knottnerus JA. Evidence-based interventions and comprehensive treatment. Lancet 1999;353:916-8.
22. Rutten G.H.E.M. Diabetiker-versorgung in den Nierderlanden. In: Lauterbach K, Ziegenhagen DJ. Diabetes mellitus—evidenz basierte diagnostik und therapie. Stuttgart, Germany: Schattauer; 2000;110-21.
23. Renders CM, Valk GD, Franse LV, Schellevis FG, Eijk van JThM, Wal van der G. Long-term effectiveness of a quality improvement program for patients with type 2 diabetes in general practice. Diabetes Care 2001;24:1365-70.
24. Dam van HA, Crebolder HFJM, Eijkelberg I, Nunen van M, Horst van der FG. Wegblijven van patienten met diabetes mellitus type 2—een echt probleem? Huisarts Wet 2000;43:380-4.
25. Khunti K, Baker R, Rumsey M, Lakhani M. Quality of care of patients with diabetes: collation of data from multi-practice audits of diabetes in primary care. Fam Pract 1999;16:54-9.
26. Benett IJ, Lambert C, Hinds G, Kirton C. Emerging standards for diabetes care from a city-wide primary care audit. Diabet Med 1994;11:489-92.
27. Howitt AJ, Cheales NA. Diabetes registers: a grassroots approach. BMJ 1993;307:1047-8.
28. Dunn NR, Bough P. Standards of care of diabetes patients in a typical English community. Br J Gen Pract 1996;46:401-5.
29. Turnbridge FKE, Millar JP, Schofield PJ, Spencer JA, Young G, Home PD. Diabetes care in general practice: an approach to audit of process and outcome. Br J Gen Pract 1993;34:291-5.
30. Butler CB, Smithers M, Stott N, Peters J. Audit-enhanced, districtwide primary care for people with diabetes mellitus. Eur J Gen Pract 1997;3:23-7.
31. Foulkes A, Kinmonth A, Frost S, Macdonald D. Organized personal care—an effective choice for managing diabetes in general practice. J R Coll Gen Pract 1989;39:444-7.
OBJECTIVE: To assess the outcome of diabetes care in a practice-based research network after the introduction of an audit-enhanced monitoring system (AEMS).
STUDY DESIGN: An AEMS was introduced into family practices participating in the academic research network of Nijmegen University, Nijmegen, the Netherlands. One and 7 years later, a cross-sectional analysis was performed on the outcome of care in all type 2 diabetes patients under treatment by their family physicians.
POPULATION: Approximately 42,500 patients in 1993 and approximately 46,000 patients in 1999 at 10 family practices participating in the university’s academic research network.
OUTCOMES MEASURED: Targets of care were Hb A1c< 8.5% and blood pressure < 150/85 mm Hg. Targets for lipids depended on age, cardiovascular morbidity, and smoking status.
RESULTS: In 1993, 540 type 2 diabetes patients were included; in 1999, 851 such patients were included, representing a prevalence of 1.3% and 1.9%, respectively. Glycemic control improved statistically significantly by the percentage of patients with Hb A1c< 8.5% (87% vs 59%, P = .0001) and the mean Hb A1c (7.1% vs 8.2%, P = .0001) from the first to the second cohort. Mean blood pressure and the percentage of patients above the target blood pressure did not change. The mean cholesterol level (207 mg/dL vs 238 mg/dL [5.4 mmol/L vs 6.2 mmol/L], P = .0001) and the percentage of patients who met their target lipid levels (72% vs 52%, P = .001) also improved between 1993 and 1999. In addition, an increased percentage of patients attended an annual review in the past year (73% vs 84%).
CONCLUSIONS: Outcomes of diabetes care in a family practice research setting using an AEMS were comparable with those reported under randomized controlled trial conditions.
- Guidelines recommend tight metabolic control in combination with state-of-the-art management of other risk factors in order to prevent macrovascular and microvascular complications in patients with type 2 diabetes.
- The formulation of clinical guidelines alone, however, is insufficient to improve actual care.
- Monitoring and feedback with systematic follow-up of treatment targets of diabetes care in a family practice setting can produce outcomes comparable with those reported under randomized controlled trial conditions.
Recent studies have emphasized the importance of tight metabolic control in combination with state-of-the-art management of other risk factors to prevent macrovascular and microvascular complications in patients with type 2 diabetes mellitus.1-5 Guidelines for diabetes care recommend systematic monitoring of patients’ health status, including metabolic control, cardiovascular risk factors, and desired outcome of care.6-8
The formulation of clinical guidelines alone, however, is insufficient to improve actual care.9,10 Strategies to reinforce the guidelines in daily practice include monitoring the patient’s clinical condition over a given period of time, feedback to the clinician about the outcome, audit of clinical performance, academic detailing by peers, and evidence-based guidelines.10-12 Monitoring and feedback with systematic follow-up of relevant treatment targets enhanced a proactive approach to patients,13 which is a key factor for successful diabetes care.14 As large numbers of patients with type 2 diabetes are treated in family practice, it is important that target-specific monitoring fit into the overall primary care function of family practice and that it answer the needs, demands, and expectations of patients.
Since 1985, the Nijmegen University Department of Family Practice has been developing a computer-assisted practice network, the Nijmegen Academic Research Network CMR/NMP, to study chronic diseases.15,16 The objectives of this network are to support care for patients with chronic diseases and to create an optimal setting for clinical research under family practice conditions. This paper analyzes the outcome of diabetes care in the CMR/NMP 7 years after the introduction of an audit-enhanced monitoring system (AEMS).17
The aims were to assess (1) the outcome of care compared with external guideline criteria and the results of clinical trials, and (2) the relationship of outcome to process of care measures and to patient-related and practice-related factors.
Methods
Study population
Data were collected at the 10 family practices in the CMR/NMP, with 25 family physicians and a patient list of approximately 46,000 in 1999.16 All patients meeting World Health Organization criteria for the diagnosis of type 2 diabetes mellitus and under treatment by a family physician in 1993 and 1999 were included in the AEMS.15,18 Patients who were treated with insulin within 1 year of diagnosis and who continued to take it were considered to have type 1 diabetes mellitus. All other patients were regarded as type 2, regardless of current treatment. For this study we included all type 2 diabetes patients under treatment by their family physician in 1993 and 1999. Patients who had died or who had moved to another area or been admitted to a residential nursing home before the end of the year were excluded, as were those who had been newly diagnosed during the year.
Audit-enhanced monitoring system
Since 1989, data have been collected on all type 2 diabetes patients at the time of diagnosis and during all regular (quarterly) diabetes-related outpatient visits. In 1992, a structured annual review, based on guidelines from the Dutch College of Family Physicians,19 was added. Starting in 1992, monitoring has consisted of the assessment of (1) compliance with 3 monthly control visits and an annual review visit; (2) glycemic control (ie, fasting blood glucose and Hb A1c); (3) diabetes-related complications (ie, retinopathy, creatinine clearance, and foot problems); (4) cardiovascular risk factors (ie, smoking behavior, blood pressure, and lipid profile); (5) cardiovascular morbidity (ie, myocardial infarction, angina pectoris, heart failure, peripheral vascular disease, transient ischemic attack, or cerebrovascular accident). In addition, all reasons for dropping out, including cause of death, were recorded. Morbidity and causes of death were defined as in the International Classification of Health Problems in Primary Care.
To facilitate data collection, a computerized Research Registration System (RRS) was developed. The system was integrated into a standard Dutch electronic record system for family practice (Promedico, Euroned). The RRS generates templates for recording data at the quarterly or annual diabetes control visits into the patient’s electronic record. Templates guide the delivery of care and a reminder system is integrated into the RRS. Office assistants contact patients who do not come in for visits at regular intervals, both those (< 1%) who usually do not come in and those who are supposed to but fail to do so.
Family physicians sent the RRS data files to the University Department of Family Practice, where they were processed into a feedback report on process of care and outcome of care measures on 3 levels: (1) total study population; (2) practice population; (3) individual patient. Process and outcome measures were compared with external criteria based on guidelines from the Dutch College of Family Medicine and with average performance at the other practices. Feedback items were selected in consultation with the participating physicians. In this way, feedback corresponded with daily practice needs. During the project, the feedback was gradually extended from process to outcome measures. The feedback was standard to all practices.
Feedback was discussed at University Department of Family Medicine meetings, which maintained uniform registration and safeguarded the progress of the project. The feedback was also sent to every practice and participating GP. This report contained practice-level as well as physician-level data. The Figure demonstrates one way in which data are presented at the meetings and shows the percentage of patients who attended their annual diabetes control visit in the year studied.
Targets for care
Targets for care consisted of 2 elements: process and outcome measures. The key marker for process of care was compliance to the annual diabetes control visit. Key markers for desired outcome of care were (1) Hb A1c < 8.5%,19 (2) blood pressure less than 160/90 mm Hg (revised to 150/85 mm Hg in 1999),8,19 and (3) lipids in accordance with Dutch guidelines for general practice8: (a) cholesterol < 5 mmol (192 mg/dL) for patients with cardiovascular morbidity; (b) cholesterol/HDL ratio < 5.0 in smokers without cardiovascular morbidity; and (c) cholesterol/HDL < 6.0 in nonsmokers without cardiovascular morbidity. These guidelines for lipid-lowering therapy are based on sex, a life expectancy of at least 5 years, smoking status, presence of cardiovascular morbidity, total cholesterol levels, high-density lipoprotein (HDL) cholesterol levels, and triglyceride levels. If even 1 of these variables is absent, the potential value of lipid lowering cannot be determined.8
Analysis
Cross-sectional analysis was performed on the outcome of diabetes care in patients with type 2 diabetes who were treated by their family physicians in 1993 and 1999. The comparison was based on all patients who had been treated for the full calendar year in 1993 and 1999; therefore, it was based on a dynamic population. Process and outcome measures are compared using the chi-squared, unpaired t, or Mann–Whitney test, as appropriate. Results are expressed as means plus or minus standard deviations or as proportions. Multilevel analysis was performed to assess factors that contributed to the variance in compliance with the annual review and the desired glycemic level (Hb A1c < 8.5%).
Results
In 1993, 540 type 2 diabetes patients (prevalence 1.3%) were included in the AEMS. Of these, 51 had been newly diagnosed (incidence 1.2/1000); 37 had been treated by a specialist (7%); and 20 did not participate (4%). Excluding the 108 patients in the latter 3 categories left a total of 432 patients for analysis. In 1999, 851 patients were included (prevalence 1.9%). Of these, 138 had been newly diagnosed (incidence 3.0/1000); 88 had been treated by a specialist (10%); and 31 did not participate (4%). Excluding the 257 patients in those 3 categories left 594 for analysis. Table 1 shows the baseline characteristics of patients included in the analysis.
Annual review was attended by 73% of patients in 1993 and 84% of patients in 1999 (Table 2). Increased compliance was achieved at all the practices, although differences between practices remained in 1999 (Figure). Univariate analysis showed that compliance with the annual review in 1999 was related to the practice (P = .001) but not to patient factors such as sex, age, duration of diabetes, therapy regimen, or cardiovascular morbidity, even after adjusting for blood glucose levels. Patients who did not attend their annual diabetes control visit had statistically significantly higher fasting blood glucose levels than patients who did comply (8.9 mmol/L [160 mg/dL] vs 8.2 mmol [147 mg/dL], P = .03). In 1993, 59% of patients had visited an ophthalmologist in the previous 2 years versus 80% in 1999.
In 1993, Hb A1c was measured in 51% of patients with a mean of 8.2%. In 1999, compliance in measurement of Hb A1c improved to 82%, with a mean Hb A1c level of 7.1% (P = .0001, Table 3). The percentages of patients with an Hb A1c level of more than 8.5% decreased from 41% to 13% (P = .001). These outcomes were associated with changes in treatment (P = .001): a decrease in patients treated with diet only (22% in 1993 vs 13% in 1999) and with oral hypoglycemic monotherapy (45% in 1993 vs 37% in 1999); an increase in patients treated with combination therapy using 2 or more oral hypoglycemic agents (22% in 1993 vs 31% in 1999); and an increase in insulin therapy (11% in 1993 vs 19% in 1999). Univariate analysis showed that poor glycemic control (Hb A1c > 8.5%) in 1999 was related to the therapy regimen (P = .001) but not to sex, age, duration of diabetes, cardiovascular morbidity, or practice. The glycemic control in patients treated with combination therapy or insulin was poorer than in patients treated with diet only or oral hypoglycemic monotherapy, probably reflecting the fact that patients with less severe disease are managed with single agents and diet.
Compliance with measurement of blood pressure improved from 72% to 83% during the study period (Table 3). However, the percentage of patients with a systolic blood pressure below 150 mm Hg or a diastolic blood pressure below 85 mm Hg did not change between 1993 and 1999 whether patients were hypertensive or not. In hypertensive patients with type 2 diabetes, the mean diastolic blood pressure decreased from 88 mm Hg to 85 mm Hg (P = .004), but mean systolic blood pressure did not change.
The mean cholesterol level was lower in 1999 than in 1993 (6.2 vs 5.4 mmol/L; 238 mg/dL vs 207 mg/dL, P = .0001), as was the mean triglyceride level (2.54 mmol/L vs 2.07 mmol/L; 221 mg/dL vs 180 mg/dL, P = .0003). In both years, data regarding which patients could be considered for lipid-lowering therapy were available for 63% and 82%, respectively. In 1993, a far higher proportion of patients had failed to reach lipid target levels than was the case in 1999 (48% vs 28%, respectively, P = .001).
Multilevel analysis showed that paying an annual diabetes control visit (a process outcome) was related to the practice (intraclass correlation coefficient [ICC] = 0.29) but not to patient factors. Reaching the glycemic target level of Hb A1c < 8.5%, however, was not related to practice factors (ICC = 0.003).
TABLE 1
Chacteristics of type 2 diabetes patients under family physician care in 1993 and 1999
| Characteristic | 1993 (n = 432) | 1999 (n = 594) | P |
|---|---|---|---|
| Mean age (years) | 68 | 67 | .34 |
| Male, % | 38 | 44 | .06 |
| Mean duration of diabetes (years) | 6.2 | 6.7 | .08 |
| Cardiovascular morbidity,% | 31 | 27 | .08 |
| Hypertension,% | 36 | 39 | .51 |
| Mean body mass index (kg/m2) | 28.3 | 29.2 | .02 |
| NOTE: Table excludes those patients newly diagnosed during the previous year. | |||
TABLE 2
Process of care for type 2 diabetes patients under family physician care, 1993 vs 1999
| Process of care | Compliance to criterion, % (range between practices) | |
|---|---|---|
| 1993* | 1999† | |
| Any visit addressing diabetic control in past year | 97 (89–100) | 96 (91–100) |
| Annual review in past year | 73 (34–90) | 84 (64–100) |
| Visit to ophthalmologist in previous 2 years | 59 (40–79) | 80 (60–94) |
| *n = 432. | ||
| † n = 594. | ||
TABLE 3
Outcomes of care for type 2 diabetes patients under family physician care, 1993 vs 1999
| Outcome | 1993 (n = 432) | Missing* (%) | 1999 (n = 594) | Missing* (%) | P |
|---|---|---|---|---|---|
| Mean fasting glucose (mmol/L) | 8.6 (2.9) | 3 | 8.3 (2.6) | 4 | .07 |
| Mean Hb A1c (percentage) | 8.3 (2.2) | 50 | 7.1 (1.5) | 18 | .0001 |
| Hb A1c | |||||
| < 7% | 30% | 52% | ┐ | ||
| 7% to 8.5% | 29% | 35% | .001 | ||
| > 8.5% | 41% | 13% | ┘ | ||
| Blood pressure in patients with hypertension | n = 112 (36%) | 28 | n = 195(39%) | 17 | |
| •Mean systolic blood pressure (mm Hg) | 161 (19) | 158 (20) | .2 | ||
| •Mean diastolic blood pressure (mm Hg) | 88 (9) | 85 (9) | .004 | ||
| •Systolic blood pressure > 150 mm Hg | 68% | 62% | .3 | ||
| •Diastolic blood pressure > 85 mm Hg | 51% | 48% | .7 | ||
| Blood pressure in patients without hypertension | n = 197 (64%) | 28 | n = 299 (61%) | 17 | |
| •Mean systolic blood pressure (mm Hg) | 145 (18) | 145 (19) | .7 | ||
| •Mean diastolic blood pressure (mm Hg) | 80 (9) | 79 (9) | .5 | ||
| •Systolic blood pressure > 150 mm Hg | 34% | 35% | .6 | ||
| •Diastolic blood pressure > 85 mm Hg | 23% | 23% | .9 | ||
| Mean cholesterol (mmol/L /mg/dL) | 6.2 (1.3) / 238 (49) | 31 | 5.4 (1.1) / 207 (42) | 17 | .0001 |
| Mean HDL (mmol/L /mg/dL) | 1.2 (0.6) / 46.5 (23.2) | 62 | 1.2 (0.4) / 46.5 (15.5) | 23 | .59 |
| Mean triglycerides (mmol /mg/dL) | 2.6 (1.5) / 226 (130) | 58 | 2.1 (1.3) / 182 (113) | 23 | .0001 |
| Patients with cardiovascular morbidity > 5 mmol/L and cholesterol >192 mg/L | 31% | ┐ | 17% | ┐ | ┐ |
| Patients without cardiovascular morbidity, smokers, and those with cholesterol/HDL ratio > 5.0 | 4% | 37 | 5% | 18 | .001 |
| Patients without cardiovascular morbidity, nonsmokers, and those with cholesterol/HDL ratio > 6.0 | 13% | ┘ | 6% | ┘ | ┘ |
| *Refers to the percentage of patients with missing data for this variable. | |||||
FIGURE
Percentage of patients with annual review (target = 75%) in 1999 (n=594)
Discussion
During 7 years of structured audit-enhanced monitoring of patients with type 2 diabetes in an academic family practice research network, the intermediate measures of diabetes care improved. In particular, the mean Hb A1c of 7.1% can be seen as a measure of good quality of care. The number of patients treated according to Dutch family practice guidelines (a process of care outcome) also increased.8
While our data were collected during normal daily care (effectiveness), the findings come close to the outcome of care under ideal trial conditions (efficacy).21 In the UK Prospective Diabetes Study (UKPDS), the median Hb A1c level for all newly diagnosed patients in the group with intensive blood glucose control over 10 years reached a comparable level of 7.0%.1 Thus, the outcome of our study approaches that achieved under trial conditions. When we analyzed patients without outcome data as poorly controlled (worst-case scenario), Hb A1c was less than 8.5% in 28%.
The trend of improvement in glycemic control could have been a result of improved overall diabetes care in the Netherlands during the study period. Data about the outcome of diabetes care in the family medicine setting in the Netherlands during the study period are scarce and, when available, are derived from other research networks. In these networks a mean Hb A1c of 7.0% to 7.6% was reached.22 Yet indicators from other studies suggest that our results were far better than outcome from usual care. Recently published data on such outcomes in family medicine in the Netherlands showed that Hb A1c, blood pressure, and lipids were measured in less than 30% of patients.23,24 Outcomes from usual care as reported in research studies appear to be strongly biased by selection and probably cannot serve as a valid reference value.
The disappointing effect on the percentage of patients who reached the target blood pressure could have resulted from evaluating the data prematurely. When the study began, the primary objective was to improve glycemic control. Shortly after the publication of the Scandinavian Simvastatin Survival Study (4S)3 and the UKPDS,12 the guidelines of the Dutch College of Family Physicians were changed8 and more attention was paid to blood pressure and lipid control. This new approach was discussed with the participating family physicians. Consequently, the target for blood pressure was revised from 160/90 mm Hg to 150/85 mm Hg and lipid-lowering therapy was tailored to each patient’s cardiovascular risk profile. The 1999 outcome with respect to blood pressure and lipid control was measured only 1 year after these changes had been announced. Nevertheless, mean diastolic blood pressure in hypertensive patients and total cholesterol and triglyceride levels decreased significantly, and more patients reached target levels for lipids in 1999 than in 1993.
Our outcome was reached through enhanced compliance to guidelines. Therefore, the outcome in 1999 was based on a larger percentage of available patients. Because the AEMS studied a dynamic group of patients, the study groups in 1993 and 1999 were not identical. Theoretically, improvement in outcome could have been reached by including more easily manageable patients. However, no patient factors such as sex, age, duration of diabetes, treatment modality, or cardiovascular morbidity were related to compliance with annual review. The higher fasting blood glucose levels in patients who were noncompliant with annual review probably reflected under-treatment rather than more severe illness status. Therefore, we are confident that the findings reflect improved overall diabetes care.
The data on process measures in this study compare favorably with those of multipractice audits of diabetes care in the United Kingdom.25-29 The high prevalence rate of 2.0% (exclusively patients with type 2 diabetes) supports the validity of our data.25-27 Among our patients, 96% had been seen at least once during the previous year. In the large studies by Khunti and Bennett, only 85% had been seen during the previous year.25,26 The mean annual compliance rate of nearly 85% with Hb A1c and blood pressure measurements in our study was high. In particular, compliance with lipid control25,26,28 and funduscopy26,28 was better in our study. In 2 longitudinal studies that used an organized care system in which feedback was provided to the participating family physicians, compliance rates in process measures of up to 75% were reported.30,31
The outcomes of this study were achieved in an academic family practice research network, with specific facilities for the proactive supervision of patients with chronic diseases. These results cannot and should not be generalized to “routine” family practice. Monitoring and feedback in routine family practice are in themselves insufficient to improve the quality of care.10 Care assessment should preferably take a more comprehensive approach in which evidence-based goals for care are formulated, care is improved to reach those goals, and care is measured to see whether those goals have been achieved.11 Our academic network provides this comprehensive approach.
The electronic Research Registration System played an important role in the audit-enhanced monitoring. In the pilot phase of the project, paper records were used. Although using paper records had clear disadvantages, one could expect to achieve similar results using such records in combination with a central electronic data bank.
Conclusions
Outcomes of diabetes care in our family research setting were comparable with those reported in randomized controlled trials. Therefore, it is possible for the management of diabetes in family practice to be efficacious. This finding should encourage more efforts by physicians in family practice to bridge the gap between efficacy and effectiveness.
Important differences remained in achieved process measures between the academic family practices. While the outcome of diabetes care in the network was favorable, the outcome of treatment was unsatisfactory in a substantial number of patients. Further implementation strategies must be developed. The differences in achieved process measures were probably unrelated to socioeconomic differences between the practice populations, since the practice pairs 1/3 and 7/10 served comparable communities and had different levels of compliance.
Our study demonstrated that a high quality of diabetes care in family practice can be achieved. Audit-enhanced monitoring, which will provide the greatest benefit to the most patients with type 2 diabetes mellitus, should be implemented as part of a quality improvement system.
ACKNOWLEDGMENTS
The authors wish to thank the family physicians and practice nurses for their continuing support and data collection.
1. UK Prospective Diabetes Study Group. Intensive blood-glucose control with sulphonylureas or insulin compared with conventional treatment and risk of complications in patients with type 2 diabetes (UKPDS 33). Lancet 1998;352:837-53.
2. UK Prospective Diabetes Study Group. Tight blood pressure control and risk of macrovascular and microvascular complications in type 2 diabetes: UKPDS 38. BMJ 1998;327:703-13.
3. Pyörälä K, Pedersen T, Klekshus J, et al. Cholesterol lowering with simvastatin improves prognosis of diabetes patients with coronary heart disease: a subgroup analysis of the Scandinavian Simvastatin Survival Study (4S). Diabetes Care 1997;20:614-20.
4. Adler AI, Stratton IM, Niel HAW, et al. Association of glycaemia with macrovascular and microvascular complications of type 2 diabetes (UKPDS 35): prospective observational study. BMJ 2000;321:405-12.
5. Adler AI, Stratton IM, Niel HAW, et al. Association of systolic blood pressure glycaemia with macrovascular and microvascular complications of type 2 diabetes (UKPDS 36): prospective observational study. BMJ 2000;321:412-9.
6. American Diabetes Association. Standards of Medical Care for patients with diabetes mellitus (position statement). Diabetes Care 1999;22(suppl 1):S32-9.
7. European Diabetes Policy Group 1999. A desktop guide to type 2 diabetes mellitus. Diabet Med 1999;16:716-30.
8. Rutten GEHM, Verhoeven S, Heine RJ, et al. NHG-standaard diabetes mellitus type 2 (eerste herziening). Huisarts Wet 1999;42:67-84.Available in English at: http://www.diabetesinprimarycare.com.
9. Woolf SH, Grol R, Hutchinson A, Eccles M, Grimshaw J. Clinical guidelines: potential benefits, limitations, and harms of guidelines. BMJ 1999;318:527-30.
10. Grol R, Jones R. Twenty years of implementation research. Fam Pract 2000;17:S32-5.
11. Grol R. Between evidence-based practice and total quality management: the implementation of cost-effective care. Int J Qual Health Care 2000;12:297-304.
12. Thomson O’Brien MA, Oxman AD, Davis DA, Haynes RB, Freemantle N, Harvey EL. Audit and feedback: effects on professional practice and health care outcomes (Cochrane Review). In: The Cochrane Library, Issue 3, 2000. Oxford, England: Update Software.
13. Hart JT. Reactive and proactive care: a crisis. Br J Gen Pract 1990;40:4-9.
14. Greenhalgh PM. Shared care for diabetes: a systematic review. Occasional Paper 67. Royal College of General Practitioners; 1994.
15. Weel van C. Validating long-term morbidity recording. J Epidemiol Community Health 1995;49(suppl 1):29-32.
16. Weel van C, Smith H, Beasly JW. Family practice research networks: experience from three countries. J Fam Pract 2000;49:938-43.
17. Grauw de WJC, Lisdonk van de EH, Hoogen van den HJM, Weel van C. Monitoring of non-insulin dependent diabetes mellitus in general practice. Diabetes Nutr Metab 1991;4(suppl):67-71.
18. World Health Organization, Expert Committee on Diabetes Mellitus. WHO Technical Report No.727. Geneva, Switzerland: WHO; 1985.
19. Nederlands Huisartsen Genootschap. Standaard diabetes mellitus type II. Huisarts Wet 1989;32:15-8.
20. ICHPPC-2 Defined WONCA, 3rd ed. Oxford, England: Oxford University Press; 1983.
21. Weel van C, Knottnerus JA. Evidence-based interventions and comprehensive treatment. Lancet 1999;353:916-8.
22. Rutten G.H.E.M. Diabetiker-versorgung in den Nierderlanden. In: Lauterbach K, Ziegenhagen DJ. Diabetes mellitus—evidenz basierte diagnostik und therapie. Stuttgart, Germany: Schattauer; 2000;110-21.
23. Renders CM, Valk GD, Franse LV, Schellevis FG, Eijk van JThM, Wal van der G. Long-term effectiveness of a quality improvement program for patients with type 2 diabetes in general practice. Diabetes Care 2001;24:1365-70.
24. Dam van HA, Crebolder HFJM, Eijkelberg I, Nunen van M, Horst van der FG. Wegblijven van patienten met diabetes mellitus type 2—een echt probleem? Huisarts Wet 2000;43:380-4.
25. Khunti K, Baker R, Rumsey M, Lakhani M. Quality of care of patients with diabetes: collation of data from multi-practice audits of diabetes in primary care. Fam Pract 1999;16:54-9.
26. Benett IJ, Lambert C, Hinds G, Kirton C. Emerging standards for diabetes care from a city-wide primary care audit. Diabet Med 1994;11:489-92.
27. Howitt AJ, Cheales NA. Diabetes registers: a grassroots approach. BMJ 1993;307:1047-8.
28. Dunn NR, Bough P. Standards of care of diabetes patients in a typical English community. Br J Gen Pract 1996;46:401-5.
29. Turnbridge FKE, Millar JP, Schofield PJ, Spencer JA, Young G, Home PD. Diabetes care in general practice: an approach to audit of process and outcome. Br J Gen Pract 1993;34:291-5.
30. Butler CB, Smithers M, Stott N, Peters J. Audit-enhanced, districtwide primary care for people with diabetes mellitus. Eur J Gen Pract 1997;3:23-7.
31. Foulkes A, Kinmonth A, Frost S, Macdonald D. Organized personal care—an effective choice for managing diabetes in general practice. J R Coll Gen Pract 1989;39:444-7.