User login
OBJECTIVE: To examine stage-matched nutrition counseling by family physicians and its effect on dietary intake, anthropometry, and serum lipid levels in patients at elevated risk for cardiovascular disease.
METHODS: In this controlled trial, patients randomized to intervention practices received nutrition information following the Stages-of-Change Model, and patients randomized to control practices received usual care.
RESULTS: At both 6 and 12 months after baseline, total fat intake and saturated fat intake declined significantly more in the intervention group than in the control group: -5.7% and -2.6% of energy, respectively, at 6 months, and -3.6% and -1.7% of energy, respectively, at 12 months. For energy intake, body weight, and BMI, there were significant differences between groups only at 6 months: -0.8 megajoules (MJ), -0.7 kg, and -0.3 kg/m2, respectively. None of the serum lipid values changed significantly between groups at 12 months.
CONCLUSIONS: Nutritional counseling based on stages of change led to reductions in dietary fat intake and weight loss in the short term. However, we found no corresponding changes in serum lipid concentrations.
- Family physicians can select patients for nutrition counseling by a dietician by using a simple questionnaire based on the Stages-of-Change Model.
- With dietary intervention, a decline in fat intake was sustained at 1 year in a population with a high percentage of poorly educated subjects.
- We found no changes in serum lipids after 1 year of dietary intervention.
Cholesterol-lowering diet therapy is an important part of cardiovascular disease prevention.1 Family physicians (FPs) are uniquely positioned to provide nutrition information to persons at risk because of their expertise as perceived by consumers, and because they reach into nearly all segments of the population.2 It is important to build nutrition guidance into a model that enables change, and, considering the number of contacts between FP and patient,3,4 that is linked to the FP’s continuity of care over time.5 FPs can raise patient consciousness about dietary behavior, motivate patients to change their behavior, and, when appropriate, refer patients to a dietician or patient associations.6
The Transtheoretical Model of Behavior Change is increasingly being used to examine health behavior change.7 According to this model, people are assigned to 1 of the following 5 stages on the basis of their behavior and current intention for future action: (i) precontemplation, not even considering changing one’s behavior; (ii) contemplation, thinking about it; (iii) preparation, making definite plans to change; (iv) action, initiating behavior change; and (v) maintenance, maintaining desired behaviors.8
Evidence available on dietary applications studied in cross-sectional and not stage-matched intervention studies is sufficiently encouraging to warrant the inclusion of Transtheoretical Model constructs in prospective studies.7 As far as we know, only 2 stage-matched dietary intervention studies have been published. Both studies were carried out in primary care settings and both studies showed that tailored nutrition information is effective in dietary fat reduction.9,10 However, in these studies the intervention was not managed by the FP. We think the FP is the most appropriate person to manage such intervention in the family practice. Therefore, we conducted a controlled dietary intervention, based on the Stages-of-Change Model and managed by the FP with selective referral to a dietician. We examined the effects of dietary counseling on changes in dietary intake, anthropometry, and serum lipid levels in patients at elevated cardiovascular risk.
Methods
Participants and design
In this randomized controlled trial, men and women at elevated risk for cardiovascular disease were recruited from the 9 family practices joining the Nijmegen Monitoring Project, the research network of the Department of Family Medicine, University Medical Centre St. Radboud.11 Selection and flow of participants are described in Figure 1. Seventy-one patients were initially included in the intervention group and 72 patients in the control group (Table 1). Consequently, we had enough power (0.90) to detect a difference in change between groups for total fat intake of 3% of energy and 11.6 mg% of serum total cholesterol.12
After selection and recruitment of participants, the family practices were randomly divided into intervention (4) and control (5) practices. The practices, and not the patients, were the units of randomization, to avoid contamination of the information between intervention and control groups. Patients in the control practices received usual care.13-15 Each patient in the intervention arm received nutrition information according to his or her stage of change. All participants signed an informed consent form before entering the study. The Medical Ethical Committee of the Department of Human Nutrition and Epidemiology, Wageningen University, approved the study protocol. The study lasted from August 1998 until April 2000.
TABLE 1
Baseline characteristics of patients in the intervention and control groups
| Intervention n=71 | Control n=72 | P1 | |
|---|---|---|---|
| Sex (%) | |||
| Male | 24 | 29 | 0.48 |
| Female | 76 | 71 | |
| Age (years) | 58.5±7.1 | 58.2±6.9 | 0.83 |
| Disorder (%) | |||
| Hypertension | 94 | 89 | 0.34 |
| Diabetes mellitus II | 6 | 7 | |
| Hypertension & diabetes mellitus II | 0 | 4 | |
| Marital status (%) | |||
| Single | 6 | 3 | 0.83 |
| Married/cohabiting | 82 | 86 | |
| Divorced | 1 | 1 | |
| Widowed | 11 | 10 | |
| Education (%)2 | |||
| Low | 68 | 68 | 0.91 |
| Intermediate | 20 | 18 | |
| High | 13 | 15 | |
| Family history of heart disease (%)3 | 27 | 22 | 0.81 |
| Smoking (%)4 | |||
| Not smoking | 79 | 78 | 0.70 |
| Light smoker | 13 | 10 | |
| Heavy smoker | 9 | 13 | |
| Exercise, more than 20 minutes | |||
| No exercise | 20 | 13 | 0.42 |
| Less than 3 times a week | 37 | 30 | |
| 3 times a week | 18 | 26 | |
| More than 3 times a week | 25 | 31 | |
| 1Two-sided P values for differences in baseline characteristics between intervention and control groups. | |||
| 2Low: primary school, lower level of secondary school, lower vocational training. Intermediate: higher level of secondary school, intermediate vocational training. High: higher vocational training, university. | |||
| 3First-degree relatives younger than 60 years. | |||
| 4Light smoker: 0-10 cigarettes a day, or smoking pipe or cigars. Heavy smoker: > 10 cigarettes a day. | |||
FIGURE 1
Selection and flow of participants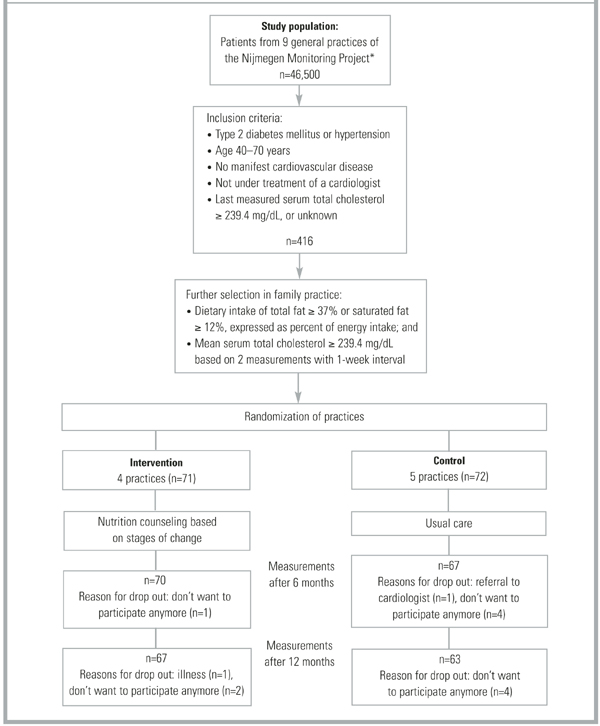
Measurements
Specially trained practice assistants measured anthropometry data, and presented patients with a self-administered questionnaire on demographics, medical history, food frequency, and a stages-of-change algorithm at baseline, 6 months, and 12 months. Blood samples were taken at baseline and at 12 months.
Physical assessment. Anthropometry consisted of body weight to the nearest 0.5 kg, height, and waist and hip circumferences to the nearest 0.5 cm. Patients wore no shoes and only light clothing when weighed. Fasting blood samples were taken twice per measurement period at a 1-week interval, with the patient in the sitting position. The samples were stored at -80°C. Lipids were analyzed enzymatically for total cholesterol,16 HDL cholesterol,17 LDL cholesterol, and triglycerides18 with the Cobas Intergra 700 (Roche Diagnostics, Switzerland), at the laboratory of the Canisius Wilhelmina Hospital (Nijmegen, The Netherlands). The coefficient of variation within runs was 2.3% for total cholesterol, 1.6% for HDL cholesterol, and 1.8% for triglycerides. The LDL cholesterol level was calculated using the equation of Friedewald et al.19
Questionnaires. The questionnaire asked for demographic data, family history of heart disease, smoking status, physical activity, drug use, and diet history at baseline. At follow-up we checked for changes in smoking status, physical activity, and drug use. Patients in the control group were asked if they had visited a dietician during the study period. The intake of energy, total fat, fatty acids, and cholesterol during the preceding 4 weeks was assessed by asking patients to fill out a food frequency questionnaire that included 104 food items. The questionnaire was validated20 and recently revised according to the Dutch National Food Survey 1992.21 Dieticians carried out nutrient calculations with a computerized version of the Dutch food composition tables22 phoned patients in cases of inconsistency.
Stages of change for reduction of fat intake were assessed with a 4-item algorithm based on measures used in previous studies23,23 in combination with the results of the food frequency questionnaire. According to the algorithm, participants were judged to be in precontemplation if they did not consider their diet to be low in fat, they were not in the process of cutting down on fat, and they had no intention of reducing their fat consumption. Participants were considered to be in the contemplation phase if they intended to decrease their fat intake within 6 months but not within 30 days, and to be in preparation when they intended to decrease their fat intake within 30 days. Participants who reported they were currently trying to eat less fat were classified as in action, and participants who reported they had been eating less fat for at least 6 months were classified in maintenance. If participants in maintenance consumed 37% total fat or 12% saturated fat expressed as percent of energy intake, they were reclassified in precontemplation.
After completing the study, all patients filled in an evaluation questionnaire. Patients in the control group were also asked about which nutrition information they had received during the last year.
Intervention
The intervention consisted of nutrition counseling based on stages of change, directed by the FP with selective referral to a dietician. FPs were supported by a protocol that included Prochaska’s8 processes of change. Preparation and action stages were considered 1 stage (action stage) in this study, given the required nutrition education. (Figure 2) summarizes the intervention procedure: 1) counseling aimed at raising consciousness about dietary behavior in the precontemplation stage, 2) motivation to change dietary behavior in the contemplation stage, and 3) if a patient decided to change (action stage), information about practical aspects of dietary change and discussion of referral to a dietician. The intervention was conducted by the patient’s own FP. All patients were referred to the same dietician. Protocols for the FPs and the dietician had been developed and tested prior to the study and were discussed by FPs and the dietician in pre-study group sessions.
FIGURE 2
Intervention scheme with clarification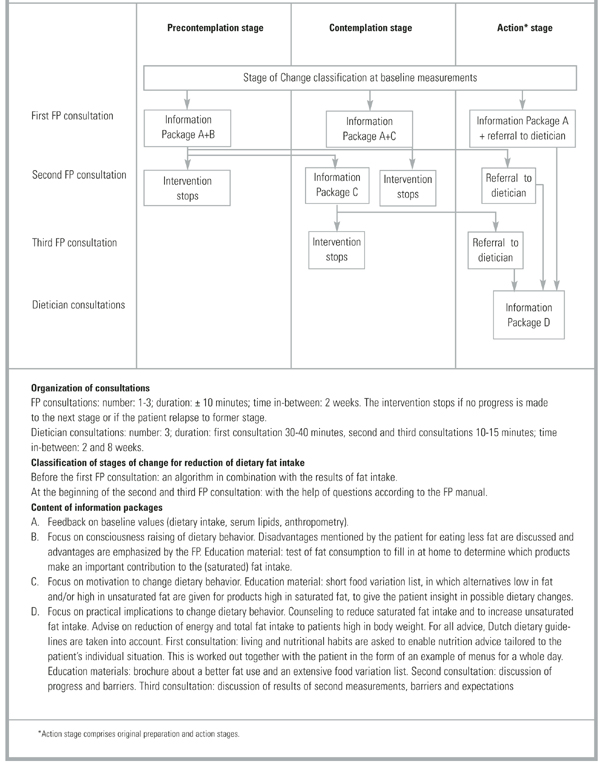
Data analyses
Differences between groups at baseline and follow-up were tested with unpaired t-tests for continuous variables and with chi-square tests for categorized variables. If the number of observations within 1 cell was less then 5, a Fisher’s exact test was used instead of a chi-square test. Differences within subjects were tested with a paired t-test. P values less than 0.05 were considered significant. Because of clustering of patients within practices, a multilevel analysis was also carried out (level 1 patient, level 2 practice). All analyses were performed on the basis of intention to treat. SAS version 6.12 was used for the statistical analyses (SAS Institute Inc., Cary, NC, USA).
Results
Study population
The study sample was predominantly female (73%), poorly educated (68%), with an average age of 58 years (see Table 1) for definitions of educational level). Of the cardiovascular risk factors, hypertension was present in 92% of participants, type 2 diabetes mellitus in 6%, both disorders in 2%, and a family history of heart disease in 25%. No significant differences were found between the intervention group (n=71) and the control group (n=72) (Table 1). Table 2 demonstrates that the 2 study groups also showed comparable baseline measures according to dietary intake, anthropometry, and serum lipid levels. The mean BMI of the total group of subjects was 28.7 kg/m 2 ; 83% had a BMI higher than 25 and the majority had high total cholesterol and dietary fat intake.
Intervention-related measures
At baseline, 51% of the patients in the intervention group were classified in the precontemplation stage, 24% in the contemplation stage, and 25% in the action stage. They had consulted their FP once (n=53) or twice (n=18) before they were referred to the study dietician (n=60). Eleven patients were not referred to the dietician because they did not reach the action stage. All of the referred patients but one received 3 consultations with the dietician. In the control group, 24% of the patients discussed nutrition issues with their FP, 57% read nutrition brochures related to cardiovascular topics, and 1% (7) were referred to a dietician.
Changes at follow-up measurements
After 6 months (Table 2) total energy intake was reduced by 1.4 and 0.6 MJ in the intervention and control groups, respectively; total fat intake by 7.9% and 2.2 % of total energy, and saturated fat intake by 3.4% and 0.8% of total energy. The reductions were significantly larger in the intervention group, except for unsaturated fat. This was also reflected in risk factors: body weight and BMI declined significantly more in the intervention group (1.5 kg body weight) than in the control group (0.6 kg body weight). We found no significant differences between groups for waist circumference and waist-hip ratio.
The reduced fat intake in the intervention group was maintained at 12 months, although the differences were smaller. Changes in energy intake and anthropometric values at this time no longer differed significantly with multilevel analysis. During the 12 months of the study, slight reductions were found for serum total cholesterol (intervention group: 2.3 mg/dL, controls: 6.2 mg/dL), LDL cholesterol (intervention group: 6.2 mg/dL, controls: 7.7 mg/dL), and triglycerides (intervention group: 0.8 mg/dL, controls: 3.1 mg/dL). HDL cholesterol increased slightly in both groups (3.9 mg/dL in the intervention group, 2.7 mg/dL in the control group). However, none of these differences were significant. There were no significant changes in smoking or physical activity (P values of chi-square tests per measurement moment were >0.85), and none of the patients was prescribed a cholesterol-lowering drug. The significance of the P values of the differences in variables between the first and last measurement moment did not change when multilevel analysis was performed, except for body weight (Table 2).
TABLE 2
Baseline measures and changes after 6 months and 12 months in dietary intake and anthropometry
| At Baseline | At 6 months | At 12 months | ||||||||
|---|---|---|---|---|---|---|---|---|---|---|
| Intervention | Control | P* | Intervention | Control | P** | Intervention | Control | P** | P*** | |
| n=71 Mean ± SD | n=72 Mean ± SD | n=70 Mean ± SD | n=67 Mean ± SD | n=67 Mean ± SD | n=63 Mean ± SD | |||||
| Dietary intake (per day) | ||||||||||
| Total energy (MJ/d)1 | 9.1 ± 2.7 | 9.6 ± 2.6 | 0.25 | -1.4 ± 1.9† | -0.6 ± 1.8† | 0.01 | -0.7 ± 3.0 | -0.9 ± 2.4† | 0.09 | 0.00 |
| Total fat (% of energy) | 42.1 ± 6.3 | 42.6 ± 5.2 | 0.64 | -7.9 ± 6.5† | -2.2 ± 4.9† | 0.00 | -5.6 ± 6.9† | -2.0 ± 6.7† | 0.00 | 0.00 |
| Saturated fat (% of energy) | 15.2 ± 2.6 | 15.5 ± 2.3 | 0.42 | -3.4 ± 2.7† | -0.8 ± 2.2† | 0.00 | -2.6 ± 2.7† | -0.9 ± 2.6† | 0.00 | 0.00 |
| Monounsaturated fat (% of energy) | 14.6 ± 3.3 | 14.9 ± 2.6 | 0.53 | -3.4 ± 3.3† | -0.7 ± 2.4† | 0.00 | -1.9 ± 4.1† | -0.3 ± 3.3 | 0.01 | 0.00 |
| Unsaturated fat (% of energy) | 9.4 ± 3.0 | 9.3 ± 3.0 | 0.79 | -1.0 ± 3.1† | 0.8 ± 3.0† | 0.37 | -1.0 ± 2.7† | -0.7 ± 3.7 | 0.73 | 0.73 |
| Cholesterol (mg) | 239.1 ± 91.5 | 254.8 ± 90.8 | 0.31 | -62.0 ± 68.9† | -22.8 ± 66.4† | 0.00 | -46.4 ± 77.1† | -33.4 ± 83.1† | 0.02 | 0.03 |
| Anthropometry | ||||||||||
| Body weight (kg) | 79.2 ± 14.9 | 80.3 ± 12.0 | 0.63 | -1.3 ± 1.8† | -0.6 ± 1.9† | 0.01 | 0.2 ± 3.0 | -0.6 ± 2.8† | 0.02 | 0.06 |
| Body Mass Index (kg/m2) | 28.1 ± 4.3 | 29.2 ± 4.8 | 0.15 | -0.5 ± 0.6† | -0.2 ± 0.7† | 0.01 | 0.0 ± 1.1 | -0.2 ± 1.0† | 0.03 | 0.08 |
| Waist circumference (cm) | 94.3 ± 12.1 | 97.7 ± 10.3 | 0.08 | -1.6 ± 4.9† | -1.7 ± 5.2† | 0.43 | -1.6 ± 6.6† | -1.8 ± 5.6† | 0.61 | 0.86 |
| Waist-hip circumference ratio | 0.89 ± 0.07 | 0.90 ± 0.09 | 0.36 | -0.0 ± 0.04 | -0.01 ± 0.05† | 0.13 | 0.01 ± 0.05† | -0.02 ± 0.05† | 0.15 | 0.15 |
| 1 Joule=0.24 cal | ||||||||||
| *Two-sided P values for differences in baseline measures between intervention and control group. | ||||||||||
| **One-sided P value for difference in change from baseline between intervention and control group. | ||||||||||
| ***P value with multilevel analysis | ||||||||||
| †Significant difference in changes after 6 and 12 months compared to baseline within group (one-sided P value<0.05). | ||||||||||
DISCUSSION
Nutrition counseling by an FP based on the Stages-of-Change Model, with referral to a dietician in the action stage, successfully changed dietary behavior after 6 months in patients at elevated risk for cardiovascular disease. This success was accompanied by reductions in body weight. Differences in fat intake were sustained at 12 months, but this was not reflected in lower serum lipid concentrations. Initial reductions in energy intake and anthropometric values did not persist after 1 year. Our findings are in line with other dietary intervention studies in family practice that report improved dietary habits but no significant effect on objective cardiovascular risk factors such as body weight and blood lipids.10,25-27 The uniqueness of our study is that it is the first randomized controlled trial in family practice based on the Stages-of-Change Model in which nutrition counseling is managed by the FP.
The reductions we found in total serum cholesterol concentrations (0.9% in the intervention group and 2.3% in the control group after 12 months) were smaller than the 3%-6% suggested by a systematic review of individualized nutrition counseling in free-living subjects.28 The observed reduction in our study is also less than predicted by the Keys equation.29 We do not have a clear explanation for this. It is possible that patients in the intervention group gave more socially desirable answers to the food frequency questionnaire than patients in the control group, due to the more extensive nutrition guidance in the intervention group.
The dropout rate in our study was low: 91% of the patients completed the trial, a notable strength of the study. This may be due to the fact that the participating patients were recruited and treated by their own FP, and may in part account for the small effect size as we avoided the selective participation of those patients who were most motivated for change. The education level of the study sample was low compared with the Dutch population at similar age,30 and this could also have resulted in smaller differences between intervention and control groups. In addition, it has been found that CHD patients who are obese and do not use lipid lowering drugs are less likely to follow recommended cholesterol-lowering diets.31 However, all of these factors make our study representative of the circumstances FPs can expect when managing nutritional intervention in routine care for patients at elevated risk for cardiovascular disease. Nutritional counseling on the basis of the Transtheoretical Model of stages of change7 is effective in the short term, but it is disappointing to have to conclude that this effect appears to be temporary, with eventual rebound to pre-intervention status. No sustained effects on the target outcomes such as body weight and serum lipids were found, possibly due to the relatively short (1-year) observation period. Improved effectiveness might be achieved with the development of patient protocols and education materials that are better aimed at poorly educated persons, and with more extensive use of modern forms of communications to implement lasting changes.
Conclusions
Nutritional counseling based on stages of change in patients at elevated risk for cardiovascular disease, provided by an FP with referral to a dietician in the action stage, led to reductions in dietary fat intake in the short and long term and to weight loss in the short term. In the absence of long-term effects on serum cholesterol levels, the emphasis remains on treating elevated lipids with drugs. However, research on effective and inexpensive dietary interventions remains important because of promising results for the short term and the important advantages of such intervention. The emphasis for future research should be testing new methods to maintain (dietary) behavioral changes and to investigate differences in susceptibility between individuals with unhealthy lifestyles. The model based on stages of change seems well suited for this sort of intervention, and the experience of this study is that it can easily be incorporated into the routines of family practice at low cost. As such, it is a simple instrument for selecting patients who are willing to change their food habits. Further, we reached a high percentage of poorly educated people, who are particularly vulnerable.32 We recommend examining whether education materials need to be better aimed at people with a low socio-economic status. Long-term nutrition counseling is needed for maintenance and further improvements.
Acknowledgments
This research was supported by the Netherlands Heart Foundation under grant no. 97.106 and by Bayer. We are grateful to the staff of the NMP family practices and their patients, without whom this study would not have been possible. We extend special thanks to the dieticians José Veen and Els Siebelink and to all the research assistants, especially to Marjolein Homs.
1. Pyorala K. CHD prevention in clinical practice Lancet 1996;348 Suppl 1:s26-s28.
2. Hiddink GJ, Hautvast JG, van-Woerkum CM, Fieren CJ, van-’t-Hof MA. Consumers’ expectations about nutrition guidance: the importance of primary care physicians Am J Clin Nutr 1997;65:1974S-1979S.
3. Gray DP. Dietary advice in British General Practice Eur J Clin Nutr 1999;53 Suppl 2:S3-S8.
4. De Bakker D., Abrahamse H., Van den Hoogen H., Braspenning J., Van Althuis T, Rutten R. Jaarrapport LINH 1998: contactfrequenties en verrichtingen in het landelijk informatie netwerk huisartsenzorg (LINH). Utrecht/Nijmegen, The Netherlands: NIVEL/WOK; 1999.
5. Van-Weel C. Nutritional guidance in general practice—a conceptual framework Eur J Clin Nutr 1999;53 Suppl 2:S108-S111.
6. Hiddink GJ, Hautvast JG, van-Woerkum CM, Fieren CJ, van-’t-Hof MA. Nutrition guidance by primary-care physicians: perceived barriers and low involvement. Eur J Clin Nutr 1995;49:842-851.
7. Horwath CC. Applying the transtheoretical model to eating behaviour change: challenges and opportunities Nutrition Research Reviews. 1999;12:281-317.
8. Prochaska JO, DiClemente CC. In search of how people change: applications to addictive behaviors American Psychologist 1992;47:1102-1114.
9. Cambell MK, DeVellis B, Strecher V, Ammerman A, DeVellis R, Sandler R. Improving dietary behaviour: the effectiveness of tailored messages in primary care settings Am J Public Health 1994;84:783-787.
10. Steptoe A, Doherty S, Rink E, Kerry S, Kendrick T, Hilton S. Behavioural counselling in general practice for the promotion of healthy behaviour among adults at increased risk of coronary heart disease: randomised trial. Br Med J 1999;319:943-947.
11. Van Weel C, Smith H, Beasley H. Family practice research networks. Experiences from 3 countries. J Fam Pract 2000;49:938-943.
12. Snedecor G, Cochran W. Statistical methods Iowa, USA: Iowa State University Press; 1991.
13. Rutten GEHM, Verhoeven S, Heine RJ, et al. NHG-Standaard Diabetes Mellitus Type 2 (eerste herziening) Huisarts Wet 1999;42:67-84.
14. Walma EP, Grundmeijer HGLM, Thomas S, Prins A, Van den Hoogen J, Van der laan JR. NHG-Standaard Hypertensie (eerste herziening) Huisarts Wet 1997;40:598-617.
15. Thomas S, Van der Weijden T, Van Drenth BB, Haverkort AFM, Hooi JD, Van der Laan JD. NHG-standaard Cholesterol Huisarts Wet 1999;42:406-417.
16. Allain CC, Poon LS, Chan CS, Richmond W, Fu PC. Enzymatic determination of total serum cholesterol Clin Chem 1974;20:470-475.
17. Burstein M, Scholnick HR, Morfin R. Rapid method for the isolation of lipoproteins from human serum by precipitation with polyan-ions. J Lipid Res 1970;11:583-595.
18. Fossati P, Prencipe L. Serum triglycerides determined colorimetrically with an enzyme that produces hydrogen peroxide Clin Chem 1982;28:2077-2080.
19. Friedewald WT, Levy RI, Fredrickson DS. Estimation of the concentration of low-density lipoprotein cholesterol in plasma without use of the preparative ultracentrifuge Clin Chem 1972;18:499-502.
20. Feunekes GI, van-Staveren WA, De-Vries JH, Burema J, Hautvast JG. Relative and biomarker-based validity of a food-frequency questionnaire estimating intake of fats and cholesterol Am J Clin Nutr 1993;58:489-496.
21. Voorlichtingsbureau voor de Voeding. Zo eet Nederland 1992: resultaten van de voedselconsumptiepeiling 1992 (results of the 1992 Dutch National Food Consumption Survey). The Hague, The Netherlands: Voorlichtingsbureau voor de Voeding (The Netherlands Nutrition Centre);1993.
22. Voorlichtingsbureau voor de Voeding. Nederlandse Voedings-middelentabel 1997 (Dutch nutrient data base). The Hague, The Netherlands: Voorlichtingsbureau voor de Voeding (The Netherlands Nutrition Centre); 1997.
23. Curry S, Kristal A, Bowen D. An application of the stage model of behavior change to dietary fat reduction Health Education Research 1992;1:97-105.
24. Sporny LA, Contento I. Stages of change in dietary fat reduction: social psychological correlates J Nutr Educ 1995;27:191-199.
25. Cupples ME, McKnight A. Randomised controlled trial of health promotion in general practice for patients at high cardiovascular risk Br Med J 1994;309:993-996.
26. Neil HA, Roe L, Godlee RJ, et al. Randomised trial of lipid lowering dietary advice in general practice: the effects on serum lipids, lipoproteins and antioxidants. Br Med J 1995;310:569-573.
27. Hellénius M-L, Krakau I, De Faire U. Favourable long-term effects from advice on diet and exercise given to healthy men with raised cardiovascular risk factors. Nutr Metab Cardiovasc Dis 1997;7:293-300.
28. Tang JL, Armitage JM, Lancaster T, Silagy CA, Fowler GH, Neil HAW. Systematic review of dietary intervention trials to lower blood total cholesterol in free-living subjects. Br Med J 1998;316:1213-1220.
29. Keys A, Anderson J, Grande F. Serum cholesterol response to changes in the diet IV: particularly saturated fatty acids in diet 2S-P. Metabolism 1965;14:776-787.
30. Dickman, A., Eijkhout, M. P., Loeve J.A. Werken en leren 1999-2000: feiten en cijfers over de arbeidsmarkt en het onderwijs in Nederland. Alphen a.d. Rijn, The Netherlands, Centraal Bureau voor de Statistiek (Statistics The Netherlands);2000.
31. Erkkila AT, Sarkkinen ES, Koukkunen H, et al. Concordance of diet with the recommended cholesterol lowering diet in patients with coronary heart disease. Eur J Clin Nutr 1998;52:279-285.
32. Lynch JW, Kaplan GA, Cohen RD, Tuomilehto J, Salonen JT. Do cardiovascular risk factors explain the relation between socioeconomic status, risk of all-cause mortality, cardiovascular mortality and acute myocardial infarction? Am J Epidemiol 1996;144:934-942.
OBJECTIVE: To examine stage-matched nutrition counseling by family physicians and its effect on dietary intake, anthropometry, and serum lipid levels in patients at elevated risk for cardiovascular disease.
METHODS: In this controlled trial, patients randomized to intervention practices received nutrition information following the Stages-of-Change Model, and patients randomized to control practices received usual care.
RESULTS: At both 6 and 12 months after baseline, total fat intake and saturated fat intake declined significantly more in the intervention group than in the control group: -5.7% and -2.6% of energy, respectively, at 6 months, and -3.6% and -1.7% of energy, respectively, at 12 months. For energy intake, body weight, and BMI, there were significant differences between groups only at 6 months: -0.8 megajoules (MJ), -0.7 kg, and -0.3 kg/m2, respectively. None of the serum lipid values changed significantly between groups at 12 months.
CONCLUSIONS: Nutritional counseling based on stages of change led to reductions in dietary fat intake and weight loss in the short term. However, we found no corresponding changes in serum lipid concentrations.
- Family physicians can select patients for nutrition counseling by a dietician by using a simple questionnaire based on the Stages-of-Change Model.
- With dietary intervention, a decline in fat intake was sustained at 1 year in a population with a high percentage of poorly educated subjects.
- We found no changes in serum lipids after 1 year of dietary intervention.
Cholesterol-lowering diet therapy is an important part of cardiovascular disease prevention.1 Family physicians (FPs) are uniquely positioned to provide nutrition information to persons at risk because of their expertise as perceived by consumers, and because they reach into nearly all segments of the population.2 It is important to build nutrition guidance into a model that enables change, and, considering the number of contacts between FP and patient,3,4 that is linked to the FP’s continuity of care over time.5 FPs can raise patient consciousness about dietary behavior, motivate patients to change their behavior, and, when appropriate, refer patients to a dietician or patient associations.6
The Transtheoretical Model of Behavior Change is increasingly being used to examine health behavior change.7 According to this model, people are assigned to 1 of the following 5 stages on the basis of their behavior and current intention for future action: (i) precontemplation, not even considering changing one’s behavior; (ii) contemplation, thinking about it; (iii) preparation, making definite plans to change; (iv) action, initiating behavior change; and (v) maintenance, maintaining desired behaviors.8
Evidence available on dietary applications studied in cross-sectional and not stage-matched intervention studies is sufficiently encouraging to warrant the inclusion of Transtheoretical Model constructs in prospective studies.7 As far as we know, only 2 stage-matched dietary intervention studies have been published. Both studies were carried out in primary care settings and both studies showed that tailored nutrition information is effective in dietary fat reduction.9,10 However, in these studies the intervention was not managed by the FP. We think the FP is the most appropriate person to manage such intervention in the family practice. Therefore, we conducted a controlled dietary intervention, based on the Stages-of-Change Model and managed by the FP with selective referral to a dietician. We examined the effects of dietary counseling on changes in dietary intake, anthropometry, and serum lipid levels in patients at elevated cardiovascular risk.
Methods
Participants and design
In this randomized controlled trial, men and women at elevated risk for cardiovascular disease were recruited from the 9 family practices joining the Nijmegen Monitoring Project, the research network of the Department of Family Medicine, University Medical Centre St. Radboud.11 Selection and flow of participants are described in Figure 1. Seventy-one patients were initially included in the intervention group and 72 patients in the control group (Table 1). Consequently, we had enough power (0.90) to detect a difference in change between groups for total fat intake of 3% of energy and 11.6 mg% of serum total cholesterol.12
After selection and recruitment of participants, the family practices were randomly divided into intervention (4) and control (5) practices. The practices, and not the patients, were the units of randomization, to avoid contamination of the information between intervention and control groups. Patients in the control practices received usual care.13-15 Each patient in the intervention arm received nutrition information according to his or her stage of change. All participants signed an informed consent form before entering the study. The Medical Ethical Committee of the Department of Human Nutrition and Epidemiology, Wageningen University, approved the study protocol. The study lasted from August 1998 until April 2000.
TABLE 1
Baseline characteristics of patients in the intervention and control groups
| Intervention n=71 | Control n=72 | P1 | |
|---|---|---|---|
| Sex (%) | |||
| Male | 24 | 29 | 0.48 |
| Female | 76 | 71 | |
| Age (years) | 58.5±7.1 | 58.2±6.9 | 0.83 |
| Disorder (%) | |||
| Hypertension | 94 | 89 | 0.34 |
| Diabetes mellitus II | 6 | 7 | |
| Hypertension & diabetes mellitus II | 0 | 4 | |
| Marital status (%) | |||
| Single | 6 | 3 | 0.83 |
| Married/cohabiting | 82 | 86 | |
| Divorced | 1 | 1 | |
| Widowed | 11 | 10 | |
| Education (%)2 | |||
| Low | 68 | 68 | 0.91 |
| Intermediate | 20 | 18 | |
| High | 13 | 15 | |
| Family history of heart disease (%)3 | 27 | 22 | 0.81 |
| Smoking (%)4 | |||
| Not smoking | 79 | 78 | 0.70 |
| Light smoker | 13 | 10 | |
| Heavy smoker | 9 | 13 | |
| Exercise, more than 20 minutes | |||
| No exercise | 20 | 13 | 0.42 |
| Less than 3 times a week | 37 | 30 | |
| 3 times a week | 18 | 26 | |
| More than 3 times a week | 25 | 31 | |
| 1Two-sided P values for differences in baseline characteristics between intervention and control groups. | |||
| 2Low: primary school, lower level of secondary school, lower vocational training. Intermediate: higher level of secondary school, intermediate vocational training. High: higher vocational training, university. | |||
| 3First-degree relatives younger than 60 years. | |||
| 4Light smoker: 0-10 cigarettes a day, or smoking pipe or cigars. Heavy smoker: > 10 cigarettes a day. | |||
FIGURE 1
Selection and flow of participants
Measurements
Specially trained practice assistants measured anthropometry data, and presented patients with a self-administered questionnaire on demographics, medical history, food frequency, and a stages-of-change algorithm at baseline, 6 months, and 12 months. Blood samples were taken at baseline and at 12 months.
Physical assessment. Anthropometry consisted of body weight to the nearest 0.5 kg, height, and waist and hip circumferences to the nearest 0.5 cm. Patients wore no shoes and only light clothing when weighed. Fasting blood samples were taken twice per measurement period at a 1-week interval, with the patient in the sitting position. The samples were stored at -80°C. Lipids were analyzed enzymatically for total cholesterol,16 HDL cholesterol,17 LDL cholesterol, and triglycerides18 with the Cobas Intergra 700 (Roche Diagnostics, Switzerland), at the laboratory of the Canisius Wilhelmina Hospital (Nijmegen, The Netherlands). The coefficient of variation within runs was 2.3% for total cholesterol, 1.6% for HDL cholesterol, and 1.8% for triglycerides. The LDL cholesterol level was calculated using the equation of Friedewald et al.19
Questionnaires. The questionnaire asked for demographic data, family history of heart disease, smoking status, physical activity, drug use, and diet history at baseline. At follow-up we checked for changes in smoking status, physical activity, and drug use. Patients in the control group were asked if they had visited a dietician during the study period. The intake of energy, total fat, fatty acids, and cholesterol during the preceding 4 weeks was assessed by asking patients to fill out a food frequency questionnaire that included 104 food items. The questionnaire was validated20 and recently revised according to the Dutch National Food Survey 1992.21 Dieticians carried out nutrient calculations with a computerized version of the Dutch food composition tables22 phoned patients in cases of inconsistency.
Stages of change for reduction of fat intake were assessed with a 4-item algorithm based on measures used in previous studies23,23 in combination with the results of the food frequency questionnaire. According to the algorithm, participants were judged to be in precontemplation if they did not consider their diet to be low in fat, they were not in the process of cutting down on fat, and they had no intention of reducing their fat consumption. Participants were considered to be in the contemplation phase if they intended to decrease their fat intake within 6 months but not within 30 days, and to be in preparation when they intended to decrease their fat intake within 30 days. Participants who reported they were currently trying to eat less fat were classified as in action, and participants who reported they had been eating less fat for at least 6 months were classified in maintenance. If participants in maintenance consumed 37% total fat or 12% saturated fat expressed as percent of energy intake, they were reclassified in precontemplation.
After completing the study, all patients filled in an evaluation questionnaire. Patients in the control group were also asked about which nutrition information they had received during the last year.
Intervention
The intervention consisted of nutrition counseling based on stages of change, directed by the FP with selective referral to a dietician. FPs were supported by a protocol that included Prochaska’s8 processes of change. Preparation and action stages were considered 1 stage (action stage) in this study, given the required nutrition education. (Figure 2) summarizes the intervention procedure: 1) counseling aimed at raising consciousness about dietary behavior in the precontemplation stage, 2) motivation to change dietary behavior in the contemplation stage, and 3) if a patient decided to change (action stage), information about practical aspects of dietary change and discussion of referral to a dietician. The intervention was conducted by the patient’s own FP. All patients were referred to the same dietician. Protocols for the FPs and the dietician had been developed and tested prior to the study and were discussed by FPs and the dietician in pre-study group sessions.
FIGURE 2
Intervention scheme with clarification
Data analyses
Differences between groups at baseline and follow-up were tested with unpaired t-tests for continuous variables and with chi-square tests for categorized variables. If the number of observations within 1 cell was less then 5, a Fisher’s exact test was used instead of a chi-square test. Differences within subjects were tested with a paired t-test. P values less than 0.05 were considered significant. Because of clustering of patients within practices, a multilevel analysis was also carried out (level 1 patient, level 2 practice). All analyses were performed on the basis of intention to treat. SAS version 6.12 was used for the statistical analyses (SAS Institute Inc., Cary, NC, USA).
Results
Study population
The study sample was predominantly female (73%), poorly educated (68%), with an average age of 58 years (see Table 1) for definitions of educational level). Of the cardiovascular risk factors, hypertension was present in 92% of participants, type 2 diabetes mellitus in 6%, both disorders in 2%, and a family history of heart disease in 25%. No significant differences were found between the intervention group (n=71) and the control group (n=72) (Table 1). Table 2 demonstrates that the 2 study groups also showed comparable baseline measures according to dietary intake, anthropometry, and serum lipid levels. The mean BMI of the total group of subjects was 28.7 kg/m 2 ; 83% had a BMI higher than 25 and the majority had high total cholesterol and dietary fat intake.
Intervention-related measures
At baseline, 51% of the patients in the intervention group were classified in the precontemplation stage, 24% in the contemplation stage, and 25% in the action stage. They had consulted their FP once (n=53) or twice (n=18) before they were referred to the study dietician (n=60). Eleven patients were not referred to the dietician because they did not reach the action stage. All of the referred patients but one received 3 consultations with the dietician. In the control group, 24% of the patients discussed nutrition issues with their FP, 57% read nutrition brochures related to cardiovascular topics, and 1% (7) were referred to a dietician.
Changes at follow-up measurements
After 6 months (Table 2) total energy intake was reduced by 1.4 and 0.6 MJ in the intervention and control groups, respectively; total fat intake by 7.9% and 2.2 % of total energy, and saturated fat intake by 3.4% and 0.8% of total energy. The reductions were significantly larger in the intervention group, except for unsaturated fat. This was also reflected in risk factors: body weight and BMI declined significantly more in the intervention group (1.5 kg body weight) than in the control group (0.6 kg body weight). We found no significant differences between groups for waist circumference and waist-hip ratio.
The reduced fat intake in the intervention group was maintained at 12 months, although the differences were smaller. Changes in energy intake and anthropometric values at this time no longer differed significantly with multilevel analysis. During the 12 months of the study, slight reductions were found for serum total cholesterol (intervention group: 2.3 mg/dL, controls: 6.2 mg/dL), LDL cholesterol (intervention group: 6.2 mg/dL, controls: 7.7 mg/dL), and triglycerides (intervention group: 0.8 mg/dL, controls: 3.1 mg/dL). HDL cholesterol increased slightly in both groups (3.9 mg/dL in the intervention group, 2.7 mg/dL in the control group). However, none of these differences were significant. There were no significant changes in smoking or physical activity (P values of chi-square tests per measurement moment were >0.85), and none of the patients was prescribed a cholesterol-lowering drug. The significance of the P values of the differences in variables between the first and last measurement moment did not change when multilevel analysis was performed, except for body weight (Table 2).
TABLE 2
Baseline measures and changes after 6 months and 12 months in dietary intake and anthropometry
| At Baseline | At 6 months | At 12 months | ||||||||
|---|---|---|---|---|---|---|---|---|---|---|
| Intervention | Control | P* | Intervention | Control | P** | Intervention | Control | P** | P*** | |
| n=71 Mean ± SD | n=72 Mean ± SD | n=70 Mean ± SD | n=67 Mean ± SD | n=67 Mean ± SD | n=63 Mean ± SD | |||||
| Dietary intake (per day) | ||||||||||
| Total energy (MJ/d)1 | 9.1 ± 2.7 | 9.6 ± 2.6 | 0.25 | -1.4 ± 1.9† | -0.6 ± 1.8† | 0.01 | -0.7 ± 3.0 | -0.9 ± 2.4† | 0.09 | 0.00 |
| Total fat (% of energy) | 42.1 ± 6.3 | 42.6 ± 5.2 | 0.64 | -7.9 ± 6.5† | -2.2 ± 4.9† | 0.00 | -5.6 ± 6.9† | -2.0 ± 6.7† | 0.00 | 0.00 |
| Saturated fat (% of energy) | 15.2 ± 2.6 | 15.5 ± 2.3 | 0.42 | -3.4 ± 2.7† | -0.8 ± 2.2† | 0.00 | -2.6 ± 2.7† | -0.9 ± 2.6† | 0.00 | 0.00 |
| Monounsaturated fat (% of energy) | 14.6 ± 3.3 | 14.9 ± 2.6 | 0.53 | -3.4 ± 3.3† | -0.7 ± 2.4† | 0.00 | -1.9 ± 4.1† | -0.3 ± 3.3 | 0.01 | 0.00 |
| Unsaturated fat (% of energy) | 9.4 ± 3.0 | 9.3 ± 3.0 | 0.79 | -1.0 ± 3.1† | 0.8 ± 3.0† | 0.37 | -1.0 ± 2.7† | -0.7 ± 3.7 | 0.73 | 0.73 |
| Cholesterol (mg) | 239.1 ± 91.5 | 254.8 ± 90.8 | 0.31 | -62.0 ± 68.9† | -22.8 ± 66.4† | 0.00 | -46.4 ± 77.1† | -33.4 ± 83.1† | 0.02 | 0.03 |
| Anthropometry | ||||||||||
| Body weight (kg) | 79.2 ± 14.9 | 80.3 ± 12.0 | 0.63 | -1.3 ± 1.8† | -0.6 ± 1.9† | 0.01 | 0.2 ± 3.0 | -0.6 ± 2.8† | 0.02 | 0.06 |
| Body Mass Index (kg/m2) | 28.1 ± 4.3 | 29.2 ± 4.8 | 0.15 | -0.5 ± 0.6† | -0.2 ± 0.7† | 0.01 | 0.0 ± 1.1 | -0.2 ± 1.0† | 0.03 | 0.08 |
| Waist circumference (cm) | 94.3 ± 12.1 | 97.7 ± 10.3 | 0.08 | -1.6 ± 4.9† | -1.7 ± 5.2† | 0.43 | -1.6 ± 6.6† | -1.8 ± 5.6† | 0.61 | 0.86 |
| Waist-hip circumference ratio | 0.89 ± 0.07 | 0.90 ± 0.09 | 0.36 | -0.0 ± 0.04 | -0.01 ± 0.05† | 0.13 | 0.01 ± 0.05† | -0.02 ± 0.05† | 0.15 | 0.15 |
| 1 Joule=0.24 cal | ||||||||||
| *Two-sided P values for differences in baseline measures between intervention and control group. | ||||||||||
| **One-sided P value for difference in change from baseline between intervention and control group. | ||||||||||
| ***P value with multilevel analysis | ||||||||||
| †Significant difference in changes after 6 and 12 months compared to baseline within group (one-sided P value<0.05). | ||||||||||
DISCUSSION
Nutrition counseling by an FP based on the Stages-of-Change Model, with referral to a dietician in the action stage, successfully changed dietary behavior after 6 months in patients at elevated risk for cardiovascular disease. This success was accompanied by reductions in body weight. Differences in fat intake were sustained at 12 months, but this was not reflected in lower serum lipid concentrations. Initial reductions in energy intake and anthropometric values did not persist after 1 year. Our findings are in line with other dietary intervention studies in family practice that report improved dietary habits but no significant effect on objective cardiovascular risk factors such as body weight and blood lipids.10,25-27 The uniqueness of our study is that it is the first randomized controlled trial in family practice based on the Stages-of-Change Model in which nutrition counseling is managed by the FP.
The reductions we found in total serum cholesterol concentrations (0.9% in the intervention group and 2.3% in the control group after 12 months) were smaller than the 3%-6% suggested by a systematic review of individualized nutrition counseling in free-living subjects.28 The observed reduction in our study is also less than predicted by the Keys equation.29 We do not have a clear explanation for this. It is possible that patients in the intervention group gave more socially desirable answers to the food frequency questionnaire than patients in the control group, due to the more extensive nutrition guidance in the intervention group.
The dropout rate in our study was low: 91% of the patients completed the trial, a notable strength of the study. This may be due to the fact that the participating patients were recruited and treated by their own FP, and may in part account for the small effect size as we avoided the selective participation of those patients who were most motivated for change. The education level of the study sample was low compared with the Dutch population at similar age,30 and this could also have resulted in smaller differences between intervention and control groups. In addition, it has been found that CHD patients who are obese and do not use lipid lowering drugs are less likely to follow recommended cholesterol-lowering diets.31 However, all of these factors make our study representative of the circumstances FPs can expect when managing nutritional intervention in routine care for patients at elevated risk for cardiovascular disease. Nutritional counseling on the basis of the Transtheoretical Model of stages of change7 is effective in the short term, but it is disappointing to have to conclude that this effect appears to be temporary, with eventual rebound to pre-intervention status. No sustained effects on the target outcomes such as body weight and serum lipids were found, possibly due to the relatively short (1-year) observation period. Improved effectiveness might be achieved with the development of patient protocols and education materials that are better aimed at poorly educated persons, and with more extensive use of modern forms of communications to implement lasting changes.
Conclusions
Nutritional counseling based on stages of change in patients at elevated risk for cardiovascular disease, provided by an FP with referral to a dietician in the action stage, led to reductions in dietary fat intake in the short and long term and to weight loss in the short term. In the absence of long-term effects on serum cholesterol levels, the emphasis remains on treating elevated lipids with drugs. However, research on effective and inexpensive dietary interventions remains important because of promising results for the short term and the important advantages of such intervention. The emphasis for future research should be testing new methods to maintain (dietary) behavioral changes and to investigate differences in susceptibility between individuals with unhealthy lifestyles. The model based on stages of change seems well suited for this sort of intervention, and the experience of this study is that it can easily be incorporated into the routines of family practice at low cost. As such, it is a simple instrument for selecting patients who are willing to change their food habits. Further, we reached a high percentage of poorly educated people, who are particularly vulnerable.32 We recommend examining whether education materials need to be better aimed at people with a low socio-economic status. Long-term nutrition counseling is needed for maintenance and further improvements.
Acknowledgments
This research was supported by the Netherlands Heart Foundation under grant no. 97.106 and by Bayer. We are grateful to the staff of the NMP family practices and their patients, without whom this study would not have been possible. We extend special thanks to the dieticians José Veen and Els Siebelink and to all the research assistants, especially to Marjolein Homs.
1. Pyorala K. CHD prevention in clinical practice Lancet 1996;348 Suppl 1:s26-s28.
2. Hiddink GJ, Hautvast JG, van-Woerkum CM, Fieren CJ, van-’t-Hof MA. Consumers’ expectations about nutrition guidance: the importance of primary care physicians Am J Clin Nutr 1997;65:1974S-1979S.
3. Gray DP. Dietary advice in British General Practice Eur J Clin Nutr 1999;53 Suppl 2:S3-S8.
4. De Bakker D., Abrahamse H., Van den Hoogen H., Braspenning J., Van Althuis T, Rutten R. Jaarrapport LINH 1998: contactfrequenties en verrichtingen in het landelijk informatie netwerk huisartsenzorg (LINH). Utrecht/Nijmegen, The Netherlands: NIVEL/WOK; 1999.
5. Van-Weel C. Nutritional guidance in general practice—a conceptual framework Eur J Clin Nutr 1999;53 Suppl 2:S108-S111.
6. Hiddink GJ, Hautvast JG, van-Woerkum CM, Fieren CJ, van-’t-Hof MA. Nutrition guidance by primary-care physicians: perceived barriers and low involvement. Eur J Clin Nutr 1995;49:842-851.
7. Horwath CC. Applying the transtheoretical model to eating behaviour change: challenges and opportunities Nutrition Research Reviews. 1999;12:281-317.
8. Prochaska JO, DiClemente CC. In search of how people change: applications to addictive behaviors American Psychologist 1992;47:1102-1114.
9. Cambell MK, DeVellis B, Strecher V, Ammerman A, DeVellis R, Sandler R. Improving dietary behaviour: the effectiveness of tailored messages in primary care settings Am J Public Health 1994;84:783-787.
10. Steptoe A, Doherty S, Rink E, Kerry S, Kendrick T, Hilton S. Behavioural counselling in general practice for the promotion of healthy behaviour among adults at increased risk of coronary heart disease: randomised trial. Br Med J 1999;319:943-947.
11. Van Weel C, Smith H, Beasley H. Family practice research networks. Experiences from 3 countries. J Fam Pract 2000;49:938-943.
12. Snedecor G, Cochran W. Statistical methods Iowa, USA: Iowa State University Press; 1991.
13. Rutten GEHM, Verhoeven S, Heine RJ, et al. NHG-Standaard Diabetes Mellitus Type 2 (eerste herziening) Huisarts Wet 1999;42:67-84.
14. Walma EP, Grundmeijer HGLM, Thomas S, Prins A, Van den Hoogen J, Van der laan JR. NHG-Standaard Hypertensie (eerste herziening) Huisarts Wet 1997;40:598-617.
15. Thomas S, Van der Weijden T, Van Drenth BB, Haverkort AFM, Hooi JD, Van der Laan JD. NHG-standaard Cholesterol Huisarts Wet 1999;42:406-417.
16. Allain CC, Poon LS, Chan CS, Richmond W, Fu PC. Enzymatic determination of total serum cholesterol Clin Chem 1974;20:470-475.
17. Burstein M, Scholnick HR, Morfin R. Rapid method for the isolation of lipoproteins from human serum by precipitation with polyan-ions. J Lipid Res 1970;11:583-595.
18. Fossati P, Prencipe L. Serum triglycerides determined colorimetrically with an enzyme that produces hydrogen peroxide Clin Chem 1982;28:2077-2080.
19. Friedewald WT, Levy RI, Fredrickson DS. Estimation of the concentration of low-density lipoprotein cholesterol in plasma without use of the preparative ultracentrifuge Clin Chem 1972;18:499-502.
20. Feunekes GI, van-Staveren WA, De-Vries JH, Burema J, Hautvast JG. Relative and biomarker-based validity of a food-frequency questionnaire estimating intake of fats and cholesterol Am J Clin Nutr 1993;58:489-496.
21. Voorlichtingsbureau voor de Voeding. Zo eet Nederland 1992: resultaten van de voedselconsumptiepeiling 1992 (results of the 1992 Dutch National Food Consumption Survey). The Hague, The Netherlands: Voorlichtingsbureau voor de Voeding (The Netherlands Nutrition Centre);1993.
22. Voorlichtingsbureau voor de Voeding. Nederlandse Voedings-middelentabel 1997 (Dutch nutrient data base). The Hague, The Netherlands: Voorlichtingsbureau voor de Voeding (The Netherlands Nutrition Centre); 1997.
23. Curry S, Kristal A, Bowen D. An application of the stage model of behavior change to dietary fat reduction Health Education Research 1992;1:97-105.
24. Sporny LA, Contento I. Stages of change in dietary fat reduction: social psychological correlates J Nutr Educ 1995;27:191-199.
25. Cupples ME, McKnight A. Randomised controlled trial of health promotion in general practice for patients at high cardiovascular risk Br Med J 1994;309:993-996.
26. Neil HA, Roe L, Godlee RJ, et al. Randomised trial of lipid lowering dietary advice in general practice: the effects on serum lipids, lipoproteins and antioxidants. Br Med J 1995;310:569-573.
27. Hellénius M-L, Krakau I, De Faire U. Favourable long-term effects from advice on diet and exercise given to healthy men with raised cardiovascular risk factors. Nutr Metab Cardiovasc Dis 1997;7:293-300.
28. Tang JL, Armitage JM, Lancaster T, Silagy CA, Fowler GH, Neil HAW. Systematic review of dietary intervention trials to lower blood total cholesterol in free-living subjects. Br Med J 1998;316:1213-1220.
29. Keys A, Anderson J, Grande F. Serum cholesterol response to changes in the diet IV: particularly saturated fatty acids in diet 2S-P. Metabolism 1965;14:776-787.
30. Dickman, A., Eijkhout, M. P., Loeve J.A. Werken en leren 1999-2000: feiten en cijfers over de arbeidsmarkt en het onderwijs in Nederland. Alphen a.d. Rijn, The Netherlands, Centraal Bureau voor de Statistiek (Statistics The Netherlands);2000.
31. Erkkila AT, Sarkkinen ES, Koukkunen H, et al. Concordance of diet with the recommended cholesterol lowering diet in patients with coronary heart disease. Eur J Clin Nutr 1998;52:279-285.
32. Lynch JW, Kaplan GA, Cohen RD, Tuomilehto J, Salonen JT. Do cardiovascular risk factors explain the relation between socioeconomic status, risk of all-cause mortality, cardiovascular mortality and acute myocardial infarction? Am J Epidemiol 1996;144:934-942.