User login
Treating GERD: Lifestyle Modifications vs Medication
Dear colleagues,
Gastroesophageal reflux disease (GERD) is a common reason for referral to gastroenterology. It affects a broad cross-section of our population and is often managed through a combination of lifestyle modifications and proton pump inhibitors (PPIs). However,
While PPIs are highly effective, concerns about their potential side effects frequently make headlines. Moreover, the financial burden of lifelong PPI use is a growing consideration. In this issue of Perspectives, Dr. Brijesh B. Patel and Dr. Juan D. Gomez Cifuentes explore these questions. Dr. Gomez Cifuentes highlights the benefits of lifestyle changes and identifies which strategies have proved most effective in his practice. Dr. Patel examines the ubiquitous use of PPIs and the challenges of sustaining adherence to lifestyle modifications. We hope these discussions will spark new ideas for managing GERD in your own practice.

We also welcome your thoughts on this topic — join the conversation on X at @AGA_GIHN.
Gyanprakash A. Ketwaroo, MD, MSc, is associate professor of medicine, Yale University, New Haven, and chief of endoscopy at West Haven VA Medical Center, both in Connecticut. He is an associate editor for GI & Hepatology News.
Do Lifestyle Changes Still Apply in the Treatment of GERD?
BY JUAN D. GOMEZ CIFUENTES, MD
Lifestyle changes are an essential part of managing gastroesophageal reflux disease (GERD). Increasingly, patients are asking about non-medication approaches to control their symptoms. These lifestyle modifications can be categorized into four main areas: 1) Weight loss, the cornerstone intervention, with significant symptom improvement observed after losing as little as 1.7 BMI points. 2) Dietary modifications, which includes both the traditional avoidance of trigger foods and the newer focus on a diet low in simple carbohydrates. 3) Bedtime adjustments, strategies that include elevating the head of the bed, sleeping on the left side, using anti-reflux pillows, and avoiding late-night meals. 4) Tobacco cessation, a key measure for reducing GERD symptoms and promoting overall health. I routinely discuss these changes with my patients, as they not only help manage GERD but also foster healthy habits and have a positive impact beyond the gastrointestinal tract.

Weight loss is the most impactful lifestyle intervention for GERD. Research shows a clear linear improvement in symptoms with weight reduction. Traditionally, losing 10% of body weight is a widely accepted goal, extrapolated from other obesity-associated conditions. A reduction in 3.5 points of BMI led to significant symptom improvement in landmark studies but also a modest reduction of 1.7 BMI points has been shown to provide symptom relief.1 Abdominal circumference is another key metric used to track progress, as central obesity rather than BMI alone is strongly linked with GERD. Goals are typically set at less than 40 inches for men and 35 inches for women. Patients using GLP-1 agonists should be informed that these medications may temporarily worsen GERD symptoms due to delayed gastric emptying, however in the long-term these symptoms are expected to improve once significant weight loss is achieved.
Food triggers vary among individuals, with common culprits including fatty meals, spicy foods, chocolate, tomato sauce, citrus fruits, and carbonated beverages. Patients tend to overemphasize diet elimination based on triggers and engage in strict diets. Patients are frequently afraid of these foods causing direct damage to the esophageal mucosa but the hypothesis is that these triggers worsen GERD by increasing transient relaxations of the lower esophageal sphincter. The evidence behind this and diet elimination based on triggers has always been weak. In my practice, I encourage patients to follow a diet low in simple carbohydrates. Simple carbohydrates are present in highly processed food, the average western diet contains ~140 g/day. In a trial, a diet low in simple sugars (monosaccharides and disaccharides < 62 g/day) without reducing total daily calories, objectively improved total acid exposure time in pH study.2
Thanks to gravity, nocturnal GERD symptoms are the culprit of many restless nights in these patients. I recommend avoiding food 3 hours before lying down. Since the stomach empties approximately 90% of its contents after 4 hours, waiting longer is not recommended and may result in hunger, making it harder to fall asleep. Sleeping on the left side, which takes advantage of the gastric anatomy, has proved to objectively decrease nocturnal acid exposure time, though some patients may find it challenging to maintain this position all night.3
Elevating the head of the bed is another effective intervention, but it must involve raising the upper body from the waist. Patients should avoid stacking ordinary pillows as this will only elevate the neck and place the body in an unnatural position for sleeping. The most effective strategies are putting blocks/bricks under the feet of the bed, using a bed wedge between the mattress and the box spring or using an adjustable bed frame. There are two types of pillows that have been shown to improve nocturnal GERD symptoms. The classic wedge pillows and the more expensive Medcline reflux relief system®. The Medcline pillow has a dual mechanism that elevates the upper body but also keeps the body on the left side position.4
Tobacco cessation is strongly recommended. Tobacco worsens GERD symptoms by reducing the lower esophageal sphincter pressure and decreasing saliva production which is one of the key components of the normal esophageal acid barrier. Moreover, it is a known risk factor for esophageal cancer. Alcohol has a variety of negative health impacts and decreasing alcohol intake is advised; however, the link between alcohol and GERD symptoms is less robust, especially in patients with low occasional consumption.
In summary, lifestyle modifications play a pivotal role in managing GERD symptoms, offering patients effective, non-pharmacologic strategies to complement medical treatments. Weight loss remains the cornerstone, with even modest reductions in BMI showing significant symptom relief. Dietary adjustments, particularly adopting a low-simple-carbohydrate diet, provide an evidence-based approach. Various bedtime interventions are available to improve nocturnal GERD symptoms. Finally, tobacco cessation is essential, not only for GERD symptom relief but also for overall health. By integrating these lifestyle changes into their routine, patients can improve GERD symptoms while building healthy habits.
Dr. Gomez Cifuentes is vice-chair in the section of gastroenterology at Presbyterian Healthcare Services, Albuquerque, New Mexico. He declares no conflicts of interest.
References
1. Ness-Jensen E et al. Lifestyle Intervention in Gastroesophageal Reflux Disease. Clin Gastroenterol Hepatol. 2016 Feb;14(2):175-82.e1-3. doi: 10.1016/j.cgh.2015.04.176.
2. Gu C et al. The Effects of Modifying Amount and Type of Dietary Carbohydrate on Esophageal Acid Exposure Time and Esophageal Reflux Symptoms: A Randomized Controlled Trial. Am J Gastroenterol. 2022 Oct 1;117(10):1655-1667. doi: 10.14309/ajg.0000000000001889.
3. Schuitenmaker JM et al. Associations Between Sleep Position and Nocturnal Gastroesophageal Reflux: A Study Using Concurrent Monitoring of Sleep Position and Esophageal pH and Impedance. Am J Gastroenterol. 2022 Feb 1;117(2):346-351. doi: 10.14309/ajg.0000000000001588.
4. Person E et al. A Novel Sleep Positioning Device Reduces Gastroesophageal Reflux: A Randomized Controlled Trial. J Clin Gastroenterol. 2015 Sep;49(8):655-9. doi: 10.1097/MCG.0000000000000359.
Medical Therapy Is the Cornerstone of Effective GERD Treatment
BY BRIJESH B. PATEL, MD
Today, I saw Mr. S in the office for gastroesophageal reflux disease (GERD). He has been on a trial of proton pump inhibitors (PPIs) and has implemented several lifestyle modifications to manage his reflux. He shared his frustrations, saying, “Doctor, I’ve tried changing my diet, sleeping in a recliner, and adjusting the timing of my meals. I’m practically not enjoying food anymore, and these lifestyle changes have affected my quality of life. Despite all this, I still wake up in the middle of the night with a ‘horrible taste’ in my mouth, and it’s ruining my sleep.”

Later that day, during a discussion with my trainees, one posed an important question: “What about lifestyle measures in the treatment of GERD?” This is a common query in both clinical and academic settings. GERD, with a prevalence estimated at ~20%, is often underreported as many patients begin self-medicating with over-the-counter acid suppressive therapies before seeking medical care. For gastroenterologists, PPIs, histamine-2 receptor antagonists (H2RAs), and now potassium-competitive acid blockers (PCABs) form the cornerstone of GERD management.
When I lecture medical students, residents, and fellows about GERD, I emphasize a standard approach: initiating an 8- to 12-week trial of PPIs followed by reassessment. I also stress the importance of combining medical therapy with lifestyle measures. However, the question remains: How adherent are our patients to these lifestyle changes? Similarly, how effectively are trainees integrating the value of lifestyle modifications into their practice? As an academic gastroenterologist, I can teach the theory, but is it being translated into real-world patient care?
The advent of PPIs has been a game changer for managing GERD symptoms and preventing disease progression. PPIs are the backbone of treatment in both gastroenterology and primary care, and they have profoundly improved patients’ quality of life. Most of my patients who present with GERD — whether due to uncontrolled reflux or acid exposure — have already been on a trial of PPIs before seeing me. My role often involves optimizing their timing of PPI administration, addressing incorrect usage, and reinforcing the importance of adherence. In some cases, I incorporate H2RAs as adjunctive therapy for patients who fail to respond adequately to PPIs, particularly when objective disease activity is confirmed through pH studies. These studies also highlight how challenging it is for many patients to maintain a refluxogenic-free lifestyle.
Lifestyle modifications should supplement and support GERD management. Regardless of medical specialty, lifestyle measures should be the first line of treatment. However, adherence and effectiveness vary widely. In reality, achieving sustained weight loss, meal timing adjustments, and dietary modifications (e.g., eliminating trigger foods like red wine, chocolate, coffee, and tomato-based sauces) is a significant challenge for patients. While these measures can reduce the need for PPIs in some cases, they are rarely sufficient as standalone treatments. Until lifestyle modifications are consistently and sustainably incorporated into daily routines, acid-suppressive therapy will remain the mainstay of GERD management.
Turning to newer therapies, PCABs are now FDA-approved for treating GERD. Early efficacy data suggest that PCABs are non-inferior to PPIs, with promising results in managing LA Class C and D esophagitis and maintaining symptom-free days. However, like PPIs, PCABs are associated with potential adverse effects, including C. difficile colitis, impacts on bone health, renal impairment, and mineral deficiencies. While these risks must be carefully discussed with patients, the benefits of medical therapy far outweigh the risks, especially for those with erosive esophagitis, Barrett’s esophagus, or a high-risk profile for esophageal cancer. In such cases, medical therapies provide superior disease control compared to lifestyle measures, supported by both subjective and objective data.
Managing GERD requires a multipronged approach. Relying solely on lifestyle measures rarely provides complete benefit, as restrictive dietary regimens are difficult to sustain long term. Like many, I can maintain a restrictive diet temporarily but find it unsustainable over time. Conversely, adherence to daily or twice-daily medications tends to be much higher than compliance with multi-level lifestyle changes (e.g., restrictive diets, weight loss, and trigger-food avoidance).
Our therapeutic arsenal for GERD continues to expand, enabling more effective management of patients with uncontrolled acid reflux. While I will continue to counsel patients and educate trainees on the value of lifestyle modifications, I emphasize the importance of adherence to timely medical therapy — whether with PPIs, H2RAs, or PCABs — as the cornerstone of effective GERD treatment.
Dr. Patel is associate program director in the division of digestive diseases & nutrition, at USF Health, Tampa, Fla. He declares no conflicts of interest.
Dear colleagues,
Gastroesophageal reflux disease (GERD) is a common reason for referral to gastroenterology. It affects a broad cross-section of our population and is often managed through a combination of lifestyle modifications and proton pump inhibitors (PPIs). However,
While PPIs are highly effective, concerns about their potential side effects frequently make headlines. Moreover, the financial burden of lifelong PPI use is a growing consideration. In this issue of Perspectives, Dr. Brijesh B. Patel and Dr. Juan D. Gomez Cifuentes explore these questions. Dr. Gomez Cifuentes highlights the benefits of lifestyle changes and identifies which strategies have proved most effective in his practice. Dr. Patel examines the ubiquitous use of PPIs and the challenges of sustaining adherence to lifestyle modifications. We hope these discussions will spark new ideas for managing GERD in your own practice.
We also welcome your thoughts on this topic — join the conversation on X at @AGA_GIHN.
Gyanprakash A. Ketwaroo, MD, MSc, is associate professor of medicine, Yale University, New Haven, and chief of endoscopy at West Haven VA Medical Center, both in Connecticut. He is an associate editor for GI & Hepatology News.
Do Lifestyle Changes Still Apply in the Treatment of GERD?
BY JUAN D. GOMEZ CIFUENTES, MD
Lifestyle changes are an essential part of managing gastroesophageal reflux disease (GERD). Increasingly, patients are asking about non-medication approaches to control their symptoms. These lifestyle modifications can be categorized into four main areas: 1) Weight loss, the cornerstone intervention, with significant symptom improvement observed after losing as little as 1.7 BMI points. 2) Dietary modifications, which includes both the traditional avoidance of trigger foods and the newer focus on a diet low in simple carbohydrates. 3) Bedtime adjustments, strategies that include elevating the head of the bed, sleeping on the left side, using anti-reflux pillows, and avoiding late-night meals. 4) Tobacco cessation, a key measure for reducing GERD symptoms and promoting overall health. I routinely discuss these changes with my patients, as they not only help manage GERD but also foster healthy habits and have a positive impact beyond the gastrointestinal tract.
Weight loss is the most impactful lifestyle intervention for GERD. Research shows a clear linear improvement in symptoms with weight reduction. Traditionally, losing 10% of body weight is a widely accepted goal, extrapolated from other obesity-associated conditions. A reduction in 3.5 points of BMI led to significant symptom improvement in landmark studies but also a modest reduction of 1.7 BMI points has been shown to provide symptom relief.1 Abdominal circumference is another key metric used to track progress, as central obesity rather than BMI alone is strongly linked with GERD. Goals are typically set at less than 40 inches for men and 35 inches for women. Patients using GLP-1 agonists should be informed that these medications may temporarily worsen GERD symptoms due to delayed gastric emptying, however in the long-term these symptoms are expected to improve once significant weight loss is achieved.
Food triggers vary among individuals, with common culprits including fatty meals, spicy foods, chocolate, tomato sauce, citrus fruits, and carbonated beverages. Patients tend to overemphasize diet elimination based on triggers and engage in strict diets. Patients are frequently afraid of these foods causing direct damage to the esophageal mucosa but the hypothesis is that these triggers worsen GERD by increasing transient relaxations of the lower esophageal sphincter. The evidence behind this and diet elimination based on triggers has always been weak. In my practice, I encourage patients to follow a diet low in simple carbohydrates. Simple carbohydrates are present in highly processed food, the average western diet contains ~140 g/day. In a trial, a diet low in simple sugars (monosaccharides and disaccharides < 62 g/day) without reducing total daily calories, objectively improved total acid exposure time in pH study.2
Thanks to gravity, nocturnal GERD symptoms are the culprit of many restless nights in these patients. I recommend avoiding food 3 hours before lying down. Since the stomach empties approximately 90% of its contents after 4 hours, waiting longer is not recommended and may result in hunger, making it harder to fall asleep. Sleeping on the left side, which takes advantage of the gastric anatomy, has proved to objectively decrease nocturnal acid exposure time, though some patients may find it challenging to maintain this position all night.3
Elevating the head of the bed is another effective intervention, but it must involve raising the upper body from the waist. Patients should avoid stacking ordinary pillows as this will only elevate the neck and place the body in an unnatural position for sleeping. The most effective strategies are putting blocks/bricks under the feet of the bed, using a bed wedge between the mattress and the box spring or using an adjustable bed frame. There are two types of pillows that have been shown to improve nocturnal GERD symptoms. The classic wedge pillows and the more expensive Medcline reflux relief system®. The Medcline pillow has a dual mechanism that elevates the upper body but also keeps the body on the left side position.4
Tobacco cessation is strongly recommended. Tobacco worsens GERD symptoms by reducing the lower esophageal sphincter pressure and decreasing saliva production which is one of the key components of the normal esophageal acid barrier. Moreover, it is a known risk factor for esophageal cancer. Alcohol has a variety of negative health impacts and decreasing alcohol intake is advised; however, the link between alcohol and GERD symptoms is less robust, especially in patients with low occasional consumption.
In summary, lifestyle modifications play a pivotal role in managing GERD symptoms, offering patients effective, non-pharmacologic strategies to complement medical treatments. Weight loss remains the cornerstone, with even modest reductions in BMI showing significant symptom relief. Dietary adjustments, particularly adopting a low-simple-carbohydrate diet, provide an evidence-based approach. Various bedtime interventions are available to improve nocturnal GERD symptoms. Finally, tobacco cessation is essential, not only for GERD symptom relief but also for overall health. By integrating these lifestyle changes into their routine, patients can improve GERD symptoms while building healthy habits.
Dr. Gomez Cifuentes is vice-chair in the section of gastroenterology at Presbyterian Healthcare Services, Albuquerque, New Mexico. He declares no conflicts of interest.
References
1. Ness-Jensen E et al. Lifestyle Intervention in Gastroesophageal Reflux Disease. Clin Gastroenterol Hepatol. 2016 Feb;14(2):175-82.e1-3. doi: 10.1016/j.cgh.2015.04.176.
2. Gu C et al. The Effects of Modifying Amount and Type of Dietary Carbohydrate on Esophageal Acid Exposure Time and Esophageal Reflux Symptoms: A Randomized Controlled Trial. Am J Gastroenterol. 2022 Oct 1;117(10):1655-1667. doi: 10.14309/ajg.0000000000001889.
3. Schuitenmaker JM et al. Associations Between Sleep Position and Nocturnal Gastroesophageal Reflux: A Study Using Concurrent Monitoring of Sleep Position and Esophageal pH and Impedance. Am J Gastroenterol. 2022 Feb 1;117(2):346-351. doi: 10.14309/ajg.0000000000001588.
4. Person E et al. A Novel Sleep Positioning Device Reduces Gastroesophageal Reflux: A Randomized Controlled Trial. J Clin Gastroenterol. 2015 Sep;49(8):655-9. doi: 10.1097/MCG.0000000000000359.
Medical Therapy Is the Cornerstone of Effective GERD Treatment
BY BRIJESH B. PATEL, MD
Today, I saw Mr. S in the office for gastroesophageal reflux disease (GERD). He has been on a trial of proton pump inhibitors (PPIs) and has implemented several lifestyle modifications to manage his reflux. He shared his frustrations, saying, “Doctor, I’ve tried changing my diet, sleeping in a recliner, and adjusting the timing of my meals. I’m practically not enjoying food anymore, and these lifestyle changes have affected my quality of life. Despite all this, I still wake up in the middle of the night with a ‘horrible taste’ in my mouth, and it’s ruining my sleep.”
Later that day, during a discussion with my trainees, one posed an important question: “What about lifestyle measures in the treatment of GERD?” This is a common query in both clinical and academic settings. GERD, with a prevalence estimated at ~20%, is often underreported as many patients begin self-medicating with over-the-counter acid suppressive therapies before seeking medical care. For gastroenterologists, PPIs, histamine-2 receptor antagonists (H2RAs), and now potassium-competitive acid blockers (PCABs) form the cornerstone of GERD management.
When I lecture medical students, residents, and fellows about GERD, I emphasize a standard approach: initiating an 8- to 12-week trial of PPIs followed by reassessment. I also stress the importance of combining medical therapy with lifestyle measures. However, the question remains: How adherent are our patients to these lifestyle changes? Similarly, how effectively are trainees integrating the value of lifestyle modifications into their practice? As an academic gastroenterologist, I can teach the theory, but is it being translated into real-world patient care?
The advent of PPIs has been a game changer for managing GERD symptoms and preventing disease progression. PPIs are the backbone of treatment in both gastroenterology and primary care, and they have profoundly improved patients’ quality of life. Most of my patients who present with GERD — whether due to uncontrolled reflux or acid exposure — have already been on a trial of PPIs before seeing me. My role often involves optimizing their timing of PPI administration, addressing incorrect usage, and reinforcing the importance of adherence. In some cases, I incorporate H2RAs as adjunctive therapy for patients who fail to respond adequately to PPIs, particularly when objective disease activity is confirmed through pH studies. These studies also highlight how challenging it is for many patients to maintain a refluxogenic-free lifestyle.
Lifestyle modifications should supplement and support GERD management. Regardless of medical specialty, lifestyle measures should be the first line of treatment. However, adherence and effectiveness vary widely. In reality, achieving sustained weight loss, meal timing adjustments, and dietary modifications (e.g., eliminating trigger foods like red wine, chocolate, coffee, and tomato-based sauces) is a significant challenge for patients. While these measures can reduce the need for PPIs in some cases, they are rarely sufficient as standalone treatments. Until lifestyle modifications are consistently and sustainably incorporated into daily routines, acid-suppressive therapy will remain the mainstay of GERD management.
Turning to newer therapies, PCABs are now FDA-approved for treating GERD. Early efficacy data suggest that PCABs are non-inferior to PPIs, with promising results in managing LA Class C and D esophagitis and maintaining symptom-free days. However, like PPIs, PCABs are associated with potential adverse effects, including C. difficile colitis, impacts on bone health, renal impairment, and mineral deficiencies. While these risks must be carefully discussed with patients, the benefits of medical therapy far outweigh the risks, especially for those with erosive esophagitis, Barrett’s esophagus, or a high-risk profile for esophageal cancer. In such cases, medical therapies provide superior disease control compared to lifestyle measures, supported by both subjective and objective data.
Managing GERD requires a multipronged approach. Relying solely on lifestyle measures rarely provides complete benefit, as restrictive dietary regimens are difficult to sustain long term. Like many, I can maintain a restrictive diet temporarily but find it unsustainable over time. Conversely, adherence to daily or twice-daily medications tends to be much higher than compliance with multi-level lifestyle changes (e.g., restrictive diets, weight loss, and trigger-food avoidance).
Our therapeutic arsenal for GERD continues to expand, enabling more effective management of patients with uncontrolled acid reflux. While I will continue to counsel patients and educate trainees on the value of lifestyle modifications, I emphasize the importance of adherence to timely medical therapy — whether with PPIs, H2RAs, or PCABs — as the cornerstone of effective GERD treatment.
Dr. Patel is associate program director in the division of digestive diseases & nutrition, at USF Health, Tampa, Fla. He declares no conflicts of interest.
An Exciting Time to Be a Gastroenterologist
Happy New Year, everyone! As we enter 2025, I’ve been reflecting on just how much has changed in the field of gastroenterology since I completed my fellowship a decade ago.
After developing and disseminating highly effective treatments for hepatitis C, the field of hepatology has shifted rapidly toward identifying and managing other significant causes of liver disease, particularly alcohol-associated liver disease and metabolic dysfunction–associated steatotic liver disease (MASLD). New disease nomenclatures have been developed that have changed the way we describe common diseases – most notably, NALFD is now MASLD and FGID are now DGBI.

There have been marked advances in obesity management, including not only innovations in endobariatric therapies such as intragastric balloons and endoscopic sleeve gastroplasty, but also the introduction of glucagon-like peptide 1 (GLP-1) agonists, which offer new hope in effectively tackling the obesity epidemic. Our growing understanding of the microbiome’s role in health has opened new avenues for treating GI diseases and introduced the potential for more personalized treatment approaches based on individual microbiome profiles. New inflammatory bowel disease (IBD) pharmacotherapeutics have been developed at a dizzying pace – our IBD patients have so many more treatment options today than they did just a decade ago, making treatment decisions much more complex.
Finally, we are just beginning to unleash the potential of artificial intelligence, which is likely to transform the field of medicine and GI clinical practice over the next decade. To be sure, it is an exciting time to be a gastroenterologist, and I can’t wait to see to what the next decade of innovation and discovery will bring.
From the recent AASLD meeting, we bring you exciting new data demonstrating the effectiveness of GLP-1 agonists (specifically, semaglutide) in treating MASH. In January’s Member Spotlight column, we introduce you to Drs. Mindy, Amy, and Kristen Engevik, who share their fascinating career journeys as GI researchers (and sisters!). In our quarterly Perspectives column, Dr. Brijesh Patel and Dr. Gomez Cifuentes share their experiences counseling patients regarding lifestyle modifications for gastroesophageal reflux disease and what strategies have proven to be the most effective adjuncts to pharmacotherapy. We hope you enjoy this and all the exciting content in our January issue.
Megan A. Adams, MD, JD, MSc
Editor in Chief
Happy New Year, everyone! As we enter 2025, I’ve been reflecting on just how much has changed in the field of gastroenterology since I completed my fellowship a decade ago.
After developing and disseminating highly effective treatments for hepatitis C, the field of hepatology has shifted rapidly toward identifying and managing other significant causes of liver disease, particularly alcohol-associated liver disease and metabolic dysfunction–associated steatotic liver disease (MASLD). New disease nomenclatures have been developed that have changed the way we describe common diseases – most notably, NALFD is now MASLD and FGID are now DGBI.
There have been marked advances in obesity management, including not only innovations in endobariatric therapies such as intragastric balloons and endoscopic sleeve gastroplasty, but also the introduction of glucagon-like peptide 1 (GLP-1) agonists, which offer new hope in effectively tackling the obesity epidemic. Our growing understanding of the microbiome’s role in health has opened new avenues for treating GI diseases and introduced the potential for more personalized treatment approaches based on individual microbiome profiles. New inflammatory bowel disease (IBD) pharmacotherapeutics have been developed at a dizzying pace – our IBD patients have so many more treatment options today than they did just a decade ago, making treatment decisions much more complex.
Finally, we are just beginning to unleash the potential of artificial intelligence, which is likely to transform the field of medicine and GI clinical practice over the next decade. To be sure, it is an exciting time to be a gastroenterologist, and I can’t wait to see to what the next decade of innovation and discovery will bring.
From the recent AASLD meeting, we bring you exciting new data demonstrating the effectiveness of GLP-1 agonists (specifically, semaglutide) in treating MASH. In January’s Member Spotlight column, we introduce you to Drs. Mindy, Amy, and Kristen Engevik, who share their fascinating career journeys as GI researchers (and sisters!). In our quarterly Perspectives column, Dr. Brijesh Patel and Dr. Gomez Cifuentes share their experiences counseling patients regarding lifestyle modifications for gastroesophageal reflux disease and what strategies have proven to be the most effective adjuncts to pharmacotherapy. We hope you enjoy this and all the exciting content in our January issue.
Megan A. Adams, MD, JD, MSc
Editor in Chief
Noninvasive Microbiome Test May Specifically Identify Crohn’s and Ulcerative Colitis
International researchers have uncovered potentially diagnostic gut microbiome signatures and metabolic pathways associated specifically with ulcerative colitis (UC) and Crohn’s disease (CD).
Targeted droplet digital polymerase chain reaction (ddPCR)‒based quantification of bacterial species led to convenient inflammatory bowel disease (IBD) diagnostic assays that “are sufficiently robust, sensitive and cost-effective for clinical application,” the investigators wrote in a recent study published in Nature Medicine.
“Although traditional modalities used for diagnosis of IBD, including colonoscopy and cross-sectional imaging, are well established, the inconvenience of bowel preparation and radiation represents relevant concerns,” senior author Siew C. Ng, MBBS, PhD, a professor in the Department of Medicine and Therapeutics at the Chinese University of Hong Kong, said in an interview. “Furthermore, existing serological and fecal markers indicate inflammation but lack specificity for IBD.”

Identifying reproducible bacterial biomarkers specific to CD and IBD should enable precise and personalized approaches to detection and management.
As a starting point, the researchers hypothesized that changes in the gut microbiome of IBD patients may reflect underlying functional associations, if not causes, of the disease, said Ng, who is also director of Hong Kong’s Microbiota I-Center (MagIC). “Unlike inflammation, which is a manifestation of the disease, the gut microbiome may serve as a more reliable biomarker less affected by the disease’s fluctuating cycle.”
The study findings showed that bacterial markers remain consistent even during the inactive disease phase. , she added. “With a better performance than the commonly used noninvasive test, fecal calprotectin, we believe the test will be a valuable addition to clinician’s toolbox and a strong option for first-line diagnostics.”
The Study
The group used metagenomic data from 5979 fecal samples from persons with and without IBD from different regions (including the United States) and of different ethnicities. Identifying several microbiota alterations in IBD, they selected bacterial species to construct diagnostic models for UC (n = 10) and CD (n = 9). Some species were deleted and some were enriched in IBD.
Metagenomic findings confirmed, for example, enrichments of Escherichia coli and Bacteroides fragilis in the guts of CD patients, with adherent invasive E coli present in more than half of these. This pathogen has been linked to mucosal dysbiosis and functional alteration, and has been associated with disease activity and endoscopic recurrence following surgery. B fragilis may induce intestinal inflammation through toxin production.
The researchers also identified a new oral bacterium, Actinomyces species oral taxon 181, which was significantly enriched in stool samples with both CD and UC.
The diagnostic models achieved areas under the curve of >.90 for distinguishing IBD patients from controls in the discovery cohort and maintained satisfactory performance in transethnic validation cohorts from eight populations.
Ng’s group further developed a multiplex droplet digital PCR test targeting selected IBD-associated bacterial species. Models based on this test showed numerically higher performance than fecal calprotectin in discriminating UC and CD samples from controls. These universally IBD-associated bacteria suggest the potential applicability of a biomarker panel for noninvasive diagnosis.
Commenting on the paper but not involved in it, Ashwin N. Ananthakrishnan, MBBS, MPH, AGAF, director of the Crohn’s and Colitis Center at Massachusetts General Hospital in Boston and associate professor of medicine at Harvard Medical School, called it “a very important study that highlights the potential role of a microbiome-based diagnostic for screening. It could have application in a wide variety of settings and is very promising.”

More work, however, is necessary to clarify such testing’s role. “The study’s validation in independent cohorts is an important strength, but the sizes of those cohorts are still quite small,” he said in an interview. “It’s important to understand its accuracy across a spectrum of IBD phenotypes and severity.”
Furthermore, endoscopic evaluation at diagnosis is important to establish severity and extent of disease. “It’s not clear this diagnostic biomarker can help supplant that role. But I see potential value to it for patients for whom we may not be considering endoscopy yet but who would like to risk-stratify.”
The Test’s Future
“We expect to see a real shift in clinical practice,” Ng said. “As a cost-effective test, it will help millions of people dealing with nonspecific gastrointestinal symptoms get the diagnoses they need.” Because the bacterial test can identify IBD at an inactive stage, it has the potential for early diagnosis. “This capability allows clinicians to initiate treatment sooner, helping to prevent progression from subclinical to clinical stages of the disease.”
The next research steps involve prospective studies with a larger and more diverse group of patients with various gastrointestinal symptoms. “This will enable a comprehensive evaluation of bacterial biomarkers in real-world populations,” she said. In vivo and in vitro experiments are expected to provide mechanistic insights into the causal role of these bacteria and metabolic dysregulations in the pathogenesis of IBD, as well as their future clinical utility in disease monitoring and predicting treatment response.
Her group plans to work with the biotech industry and regulatory agencies to transform these biomarkers into an approved test kit. “The rollout is likely to be gradual, but we’re optimistic that supportive international and national guidelines will be developed and will pave the way for widespread implementation.”
This study was supported by various academic, charitable, and governmental research-funding bodies, including the governments of Hong Kong and the People’s Republic of China. Ng has served as an advisory board member or speaker for Pfizer, Ferring, Janssen, AbbVie, Tillotts, Menarini, and Takeda. She has received research grants through her institutions from Olympus, Ferring, and AbbVie and is a founding member and shareholder of GenieBiome. She receives patent royalties through her institutions, including MagIC, which holds patents on the therapeutic and diagnostic use of the microbiome in IBD. Several co-authors reported various relationships, including patent holding, with private-sector companies. Ananthakrishnan had no relevant competing interests.
A version of this article first appeared on Medscape.com.
International researchers have uncovered potentially diagnostic gut microbiome signatures and metabolic pathways associated specifically with ulcerative colitis (UC) and Crohn’s disease (CD).
Targeted droplet digital polymerase chain reaction (ddPCR)‒based quantification of bacterial species led to convenient inflammatory bowel disease (IBD) diagnostic assays that “are sufficiently robust, sensitive and cost-effective for clinical application,” the investigators wrote in a recent study published in Nature Medicine.
“Although traditional modalities used for diagnosis of IBD, including colonoscopy and cross-sectional imaging, are well established, the inconvenience of bowel preparation and radiation represents relevant concerns,” senior author Siew C. Ng, MBBS, PhD, a professor in the Department of Medicine and Therapeutics at the Chinese University of Hong Kong, said in an interview. “Furthermore, existing serological and fecal markers indicate inflammation but lack specificity for IBD.”
Identifying reproducible bacterial biomarkers specific to CD and IBD should enable precise and personalized approaches to detection and management.
As a starting point, the researchers hypothesized that changes in the gut microbiome of IBD patients may reflect underlying functional associations, if not causes, of the disease, said Ng, who is also director of Hong Kong’s Microbiota I-Center (MagIC). “Unlike inflammation, which is a manifestation of the disease, the gut microbiome may serve as a more reliable biomarker less affected by the disease’s fluctuating cycle.”
The study findings showed that bacterial markers remain consistent even during the inactive disease phase. , she added. “With a better performance than the commonly used noninvasive test, fecal calprotectin, we believe the test will be a valuable addition to clinician’s toolbox and a strong option for first-line diagnostics.”
The Study
The group used metagenomic data from 5979 fecal samples from persons with and without IBD from different regions (including the United States) and of different ethnicities. Identifying several microbiota alterations in IBD, they selected bacterial species to construct diagnostic models for UC (n = 10) and CD (n = 9). Some species were deleted and some were enriched in IBD.
Metagenomic findings confirmed, for example, enrichments of Escherichia coli and Bacteroides fragilis in the guts of CD patients, with adherent invasive E coli present in more than half of these. This pathogen has been linked to mucosal dysbiosis and functional alteration, and has been associated with disease activity and endoscopic recurrence following surgery. B fragilis may induce intestinal inflammation through toxin production.
The researchers also identified a new oral bacterium, Actinomyces species oral taxon 181, which was significantly enriched in stool samples with both CD and UC.
The diagnostic models achieved areas under the curve of >.90 for distinguishing IBD patients from controls in the discovery cohort and maintained satisfactory performance in transethnic validation cohorts from eight populations.
Ng’s group further developed a multiplex droplet digital PCR test targeting selected IBD-associated bacterial species. Models based on this test showed numerically higher performance than fecal calprotectin in discriminating UC and CD samples from controls. These universally IBD-associated bacteria suggest the potential applicability of a biomarker panel for noninvasive diagnosis.
Commenting on the paper but not involved in it, Ashwin N. Ananthakrishnan, MBBS, MPH, AGAF, director of the Crohn’s and Colitis Center at Massachusetts General Hospital in Boston and associate professor of medicine at Harvard Medical School, called it “a very important study that highlights the potential role of a microbiome-based diagnostic for screening. It could have application in a wide variety of settings and is very promising.”
More work, however, is necessary to clarify such testing’s role. “The study’s validation in independent cohorts is an important strength, but the sizes of those cohorts are still quite small,” he said in an interview. “It’s important to understand its accuracy across a spectrum of IBD phenotypes and severity.”
Furthermore, endoscopic evaluation at diagnosis is important to establish severity and extent of disease. “It’s not clear this diagnostic biomarker can help supplant that role. But I see potential value to it for patients for whom we may not be considering endoscopy yet but who would like to risk-stratify.”
The Test’s Future
“We expect to see a real shift in clinical practice,” Ng said. “As a cost-effective test, it will help millions of people dealing with nonspecific gastrointestinal symptoms get the diagnoses they need.” Because the bacterial test can identify IBD at an inactive stage, it has the potential for early diagnosis. “This capability allows clinicians to initiate treatment sooner, helping to prevent progression from subclinical to clinical stages of the disease.”
The next research steps involve prospective studies with a larger and more diverse group of patients with various gastrointestinal symptoms. “This will enable a comprehensive evaluation of bacterial biomarkers in real-world populations,” she said. In vivo and in vitro experiments are expected to provide mechanistic insights into the causal role of these bacteria and metabolic dysregulations in the pathogenesis of IBD, as well as their future clinical utility in disease monitoring and predicting treatment response.
Her group plans to work with the biotech industry and regulatory agencies to transform these biomarkers into an approved test kit. “The rollout is likely to be gradual, but we’re optimistic that supportive international and national guidelines will be developed and will pave the way for widespread implementation.”
This study was supported by various academic, charitable, and governmental research-funding bodies, including the governments of Hong Kong and the People’s Republic of China. Ng has served as an advisory board member or speaker for Pfizer, Ferring, Janssen, AbbVie, Tillotts, Menarini, and Takeda. She has received research grants through her institutions from Olympus, Ferring, and AbbVie and is a founding member and shareholder of GenieBiome. She receives patent royalties through her institutions, including MagIC, which holds patents on the therapeutic and diagnostic use of the microbiome in IBD. Several co-authors reported various relationships, including patent holding, with private-sector companies. Ananthakrishnan had no relevant competing interests.
A version of this article first appeared on Medscape.com.
FROM NATURE MEDICINE
Impact of NSAID Use on Bleeding Rates for Patients Taking Rivaroxaban or Apixaban
Impact of NSAID Use on Bleeding Rates for Patients Taking Rivaroxaban or Apixaban
Clinical practice has shifted from vitamin K antagonists to direct oral anticoagulants (DOACs) for atrial fibrillation treatment due to their more favorable risk-benefit profile and less lifestyle modification required.1,2 However, the advantage of a lower bleeding risk with DOACs could be compromised by potentially problematic pharmacokinetic interactions like those conferred by antiplatelets or nonsteroidal anti-inflammatory drugs (NSAIDs).3,4 Treating a patient needing anticoagulation with a DOAC who has comorbidities may introduce unavoidable drug-drug interactions. This particularly happens with over-the-counter and prescription NSAIDs used for the management of pain and inflammatory conditions.5
NSAIDs primarily affect 2 cyclooxygenase (COX) enzyme isomers, COX-1 and COX-2.6 COX-1 helps maintain gastrointestinal (GI) mucosa integrity and platelet aggregation processes, whereas COX-2 is engaged in pain signaling and inflammation mediation. COX-1 inhibition is associated with more bleeding-related adverse events (AEs), especially in the GI tract. COX-2 inhibition is thought to provide analgesia and anti-inflammatory properties without elevating bleeding risk. This premise is responsible for the preferential use of celecoxib, a COX-2 selective NSAID, which should confer a lower bleeding risk compared to nonselective NSAIDs such as ibuprofen and naproxen.7 NSAIDs have been documented as independent risk factors for bleeding. NSAID users are about 3 times as likely to develop GI AEs compared to nonNSAID users.8
Many clinicians aim to further mitigate NSAID-associated bleeding risk by coprescribing a proton pump inhibitor (PPI). PPIs provide gastroprotection against NSAID-induced mucosal injury and sequential complication of GI bleeding. In a multicenter randomized control trial, patients who received concomitant PPI therapy while undergoing chronic NSAID therapy—including nonselective and COX-2 selective NSAIDs—had a significantly lower risk of GI ulcer development (placebo, 17.0%; 20 mg esomeprazole, 5.2%; 40 mg esomeprazole, 4.6%).9 Current clinical guidelines for preventing NSAIDassociated bleeding complications recommend using a COX-2 selective NSAID in combination with PPI therapy for patients at high risk for GI-related bleeding, including the concomitant use of anticoagulants.10
There is evidence suggesting an increased bleeding risk with NSAIDs when used in combination with vitamin K antagonists such as warfarin.11,12 A systematic review of warfarin and concomitant NSAID use found an increased risk of overall bleeding with NSAID use in combination with warfarin (odds ratio 1.58; 95% CI, 1.18-2.12), compared to warfarin alone.12
Posthoc analyses of randomized clinical trials have also demonstrated an increased bleeding risk with oral anticoagulation and concomitant NSAID use.13,14 In the RE-LY trial, NSAID users on warfarin or dabigatran had a statistically significant increased risk of major bleeding compared to non-NSAID users (hazard ratio [HR] 1.68; 95% CI, 1.40- 2.02; P < .001).13 In the ARISTOTLE trial, patients on warfarin or apixaban who were incident NSAID users were found to have an increased risk of major bleeding (HR 1.61; 95% CI, 1.11-2.33) and clinically relevant nonmajor bleeding (HR 1.70; 95% CI, 1.16- 2.48).14 These trials found a statistically significant increased bleeding risk associated with NSAID use, though the populations evaluated included patients taking warfarin and patients taking DOACs. These trials did not evaluate the bleeding risk of concomitant NSAID use among DOACs alone.
Evidence on NSAID-associated bleeding risk with DOACs is lacking in settings where the patient population, prescribing practices, and monitoring levels are variable. Within the Veterans Health Administration, clinical pharmacist practitioners (CPPs) in anticoagulation clinics oversee DOAC therapy management. CPPs monitor safety and efficacy of DOAC therapies through a population health management tool, the DOAC Dashboard.15 The DOAC Dashboard creates alerts for patients who may require an intervention based on certain clinical parameters, such as drug-drug interactions.16 Whenever a patient on a DOAC is prescribed an NSAID, an alert is generated on the DOAC Dashboard to flag the CPPs for the potential need for an intervention. If NSAID therapy remains clinically indicated, CPPs may recommend risk reduction strategies such as a COX-2 selective NSAID or coprescribing a PPI.10
The DOAC Dashboard provides an ideal setting for investigating the effects of NSAID use, NSAID selectivity, and PPI coprescribing on DOAC bleeding rates. With an increasing population of patients receiving anticoagulation therapy with a DOAC, more guidance regarding the bleeding risk of concomitant NSAID use with DOACs is needed. Studies evaluating the bleeding risk with concomitant NSAID use in patients on a DOAC alone are limited. This is the first study to date to compare bleeding risk with concomitant NSAID use between DOACs. This study provides information on bleeding risk with NSAID use among commonly prescribed DOACs, rivaroxaban and apixaban, and the potential impacts of current risk reduction strategies.
METHODS
This single-center retrospective cohort review was performed using the electronic health records (EHRs) of patients enrolled in the US Department of Veterans Affairs (VA) Mountain Home Healthcare System who received rivaroxaban or apixaban from December 2020 to December 2022. This study received approval from the East Tennessee State University/VA Institutional Review Board committee.
Patients were identified through the DOAC Dashboard, aged 21 to 100 years, and received rivaroxaban or apixaban at a therapeutic dose: rivaroxaban 10 to 20 mg daily or apixaban 2.5 to 5 mg twice daily. Patients were excluded if they were prescribed dual antiplatelet therapy, received rivaroxaban at dosing indicated for peripheral vascular disease, were undergoing dialysis, had evidence of moderate to severe hepatic impairment or any hepatic disease with coagulopathy, were undergoing chemotherapy or radiation, or had hematological conditions with predisposed bleeding risk. These patients were excluded to mitigate the potential confounding impact from nontherapeutic DOAC dosing strategies and conditions associated with an increased bleeding risk.
Eligible patients were stratified based on NSAID use. NSAID users were defined as patients prescribed an oral NSAID, including both acute and chronic courses, at any point during the study time frame while actively on a DOAC. Bleeding events were reviewed to evaluate rates between rivaroxaban and apixaban among NSAID and nonNSAID users. Identified NSAID users were further assessed for NSAID selectivity and PPI coprescribing as a subgroup analysis for the secondary assessment.
Data Collection
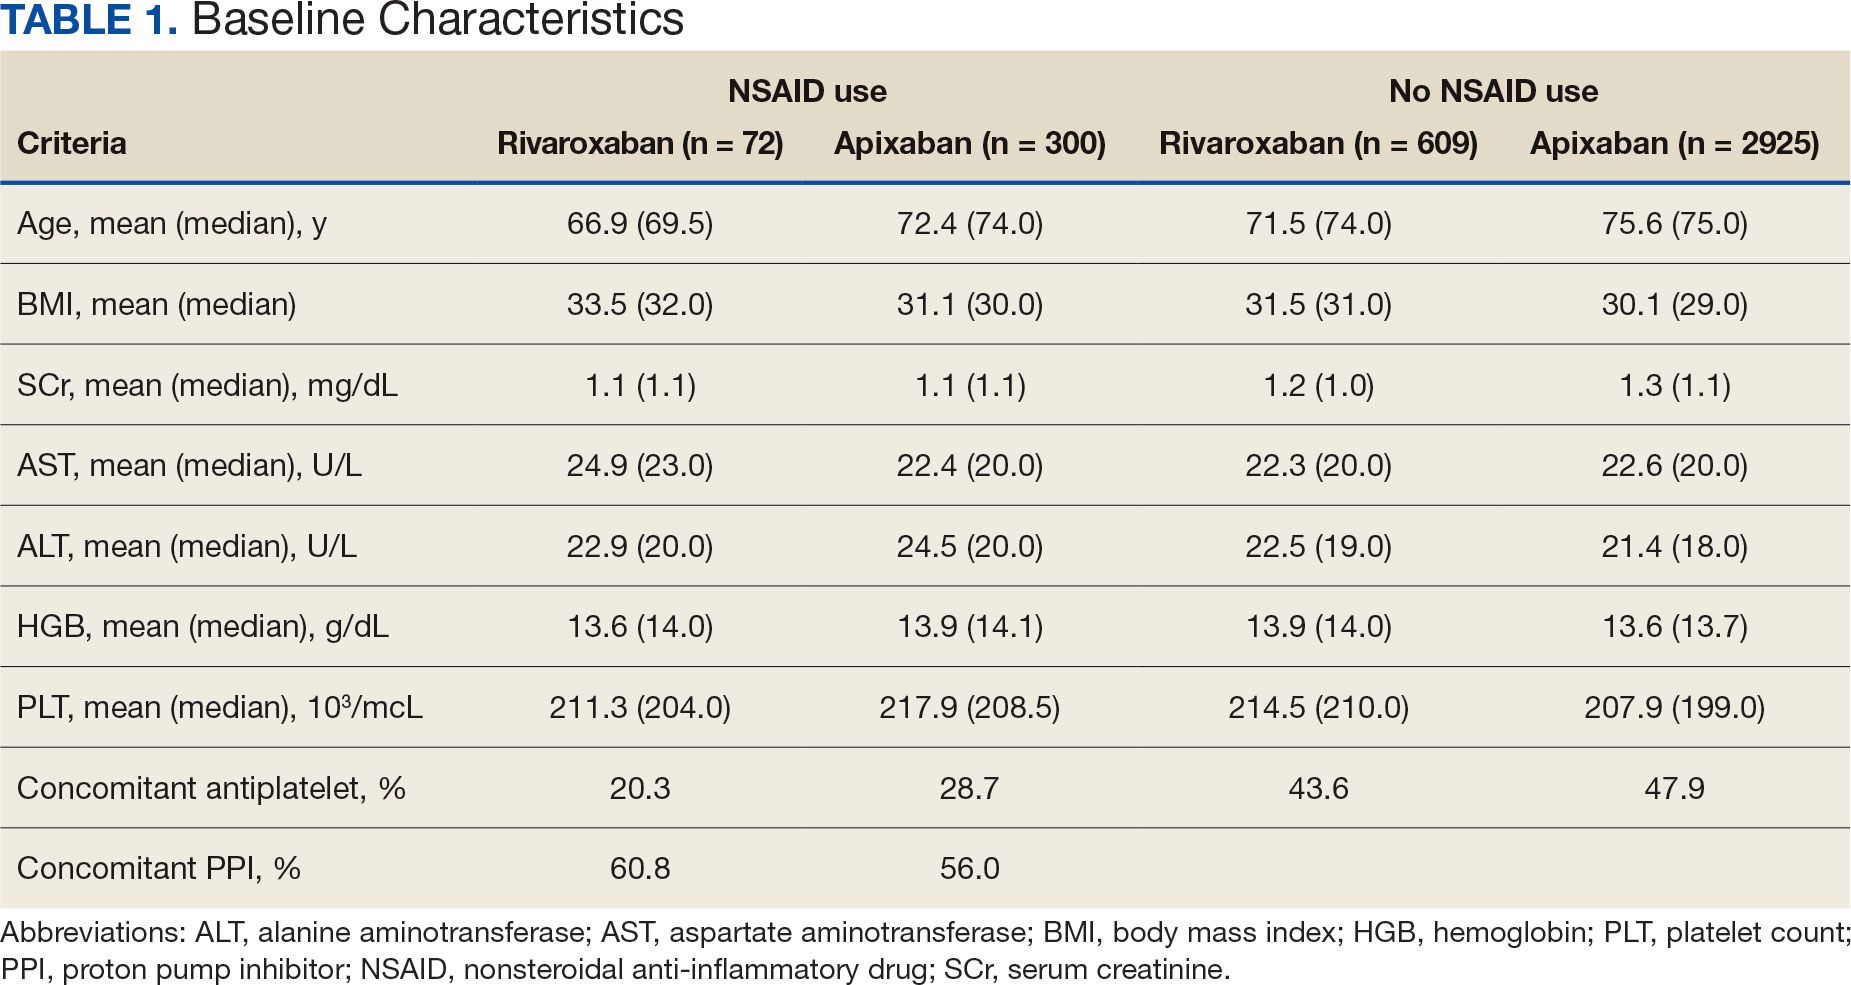
Baseline data were collected, including age, body mass index, anticoagulation indication, DOAC agent, DOAC dose, and DOAC total daily dose. Baseline serum creatinine levels, liver function tests, hemoglobin levels, and platelet counts were collected from the most recent data available immediately prior to the bleeding event, if applicable.
The DOAC Dashboard was reviewed for active and dismissed drug interaction alerts to identify patients taking rivaroxaban or apixaban who were prescribed an NSAID. Patients were categorized in the NSAID group if an interacting drug alert with an NSAID was reported during the study time frame. Data available through the interacting drug alerts on NSAID use were limited to the interacting drug name and date of the reported flag. Manual EHR review was required to confirm dates of NSAID therapy initiation and NSAID discontinuation, if applicable.
Data regarding concomitant antiplatelet use were obtained through review of the active and dismissed drug interaction alerts on the DOAC Dashboard. Concomitant antiplatelet use was defined as the prescribing of a single antiplatelet agent at any point while receiving DOAC therapy. Data on concomitant antiplatelets were collected regardless of NSAID status.
Data on coprescribed PPI therapy were obtained through manual EHR review of identified NSAID users. Coprescribed PPI therapy was defined as the prescribing of a PPI at any point during NSAID therapy. Data regarding PPI use among non-NSAID users were not collected because the secondary endpoint was designed to assess PPI use only among patients coprescribed a DOAC and NSAID.
Outcomes
Bleeding events were identified through an outcomes report generated by the DOAC Dashboard based on International Classification of Diseases, Tenth Revision diagnosis codes associated with a bleeding event. The outcomes report captures diagnoses from the outpatient and inpatient care settings. Reported bleeding events were limited to patients who received a DOAC at any point in the 6 months prior to the event and excluded patients with recent DOAC initiation within 7 days of the event, as these patients are not captured on the DOAC Dashboard.
All reported bleeding events were manually reviewed in the EHR and categorized as a major or clinically relevant nonmajor bleed, according to International Society of Thrombosis and Haemostasis criteria. Validated bleeding events were then crossreferenced with the interacting drug alerts report to identify events with potentially overlapping NSAID therapy at the time of the event. Overlapping NSAID therapy was defined as the prescribing of an NSAID at any point in the 6 months prior to the event. All events with potential overlapping NSAID therapies were manually reviewed for confirmation of NSAID status at the time of the event.
The primary endpoint was a composite of any bleeding event per International Society of Thrombosis and Haemostasis criteria. The secondary endpoint evaluated the potential impact of NSAID selectivity or PPI coprescribing on the bleeding rate among the NSAID user groups.
Statistical Analysis
Analyses were performed consistent with the methods used in the ARISTOTLE and RE-LY trials. It was determined that a sample size of 504 patients, with ≥ 168 patients in each group, would provide 80% power using a 2-sided a of 0.05. HRs with 95% CIs and respective P values were calculated using a SPSS-adapted online calculator.
RESULTS
The DOAC Dashboard identified 681 patients on rivaroxaban and 3225 patients on apixaban; 72 patients on rivaroxaban (10.6%) and 300 patients on apixaban (9.3%) were NSAID users. The mean age of NSAID users was 66.9 years in the rivaroxaban group and 72.4 years in the apixaban group. The mean age of non-NSAID users was 71.5 years in the rivaroxaban group and 75.6 years in the apixaban group. No appreciable differences were observed among subgroups in body mass index, renal function, hepatic function, hemoglobin, or platelet counts, and no statistically significant differences were identified (Table 1). Antiplatelet agents identified included aspirin, clopidogrel, prasugrel, and ticagrelor. Fifteen patients (20.3%) in the rivaroxaban group and 87 patients (28.7%) in the apixaban group had concomitant antiplatelet and NSAID use. Forty-five patients on rivaroxaban (60.8%) and 170 (55.9%) on apixaban were prescribed concomitant PPI and NSAID at baseline. Among non-NSAID users, there was concomitant antiplatelet use for 265 patients (43.6%) in the rivaroxaban group and 1401 patients (47.9%) in the apixaban group. Concomitant PPI use was identified among 63 patients (60.0%) taking selective NSAIDs and 182 (57.2%) taking nonselective NSAIDs.
A total of 423 courses of NSAIDs were identified: 85 NSAID courses in the rivaroxaban group and 338 NSAID courses in the apixaban group. Most NSAID courses involved a nonselective NSAID in the rivaroxaban and apixaban NSAID user groups: 75.2% (n = 318) aggregately compared to 71.8% (n = 61) and 76.0% (n = 257) in the rivaroxaban and apixaban groups, respectively. The most frequent NSAID courses identified were meloxicam (26.7%; n = 113), celecoxib (24.8%; n = 105), ibuprofen (19.1%; n = 81), and naproxen (13.5%; n = 57). Data regarding NSAID therapy initiation and discontinuation dates were not readily available. As a result, the duration of NSAID courses was not captured.
There was no statistically significant difference in bleeding rates between rivaroxaban and apixaban among NSAID users (HR 1.04; 95% CI, 0.98-1.12) or non-NSAID users (HR 1.15; 95% CI, 0.80-1.66) (Table 2). Apixaban non-NSAID users had a higher rate of major bleeds (HR 0.32; 95% CI, 0.17-0.61) while rivaroxaban non-NSAID users had a higher rate of clinically relevant nonmajor bleeds (HR 1.63; 95% CI, 1.10-2.54).
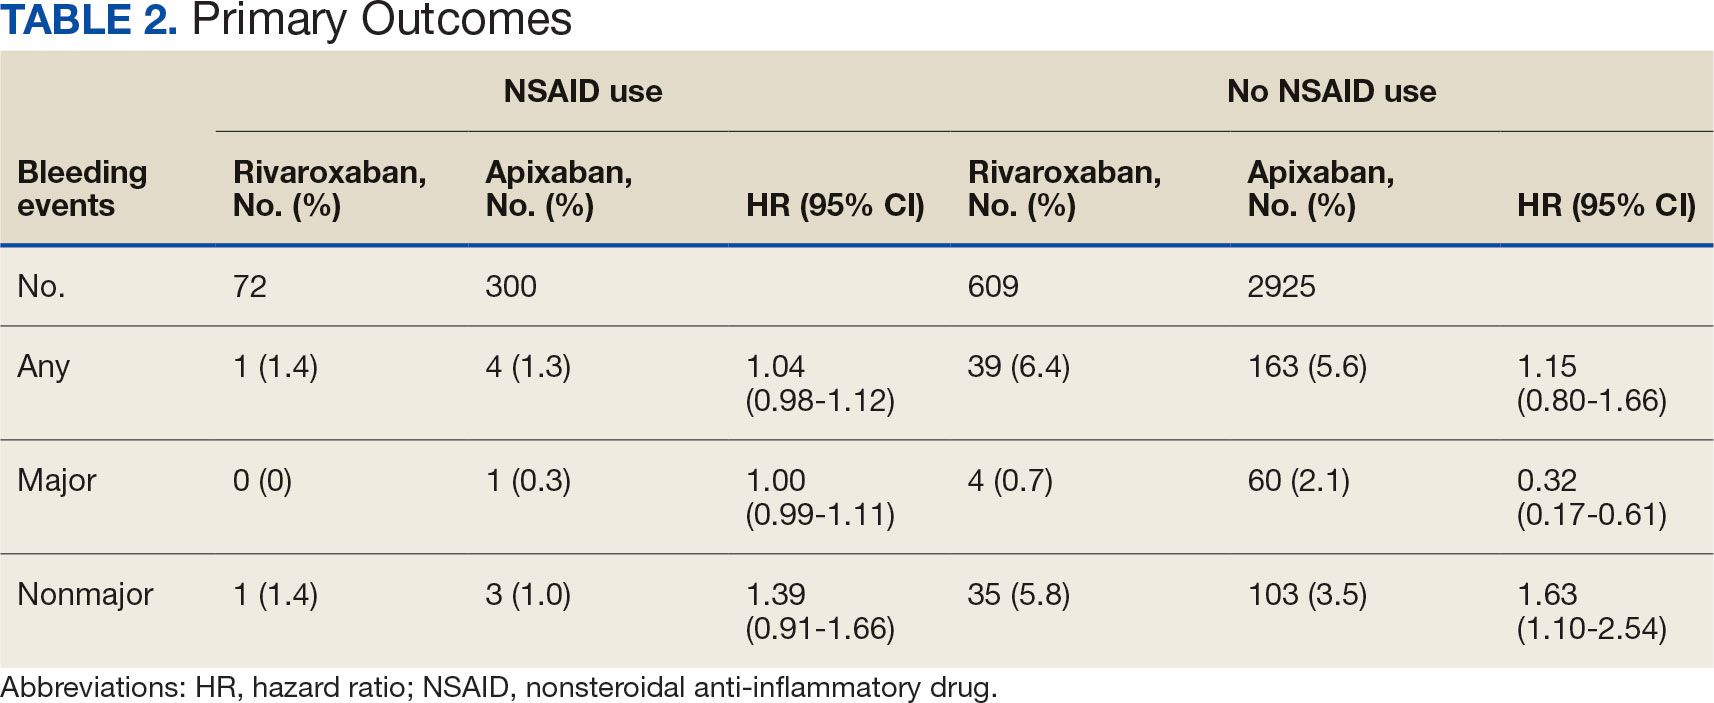
The sample size for the secondary endpoint consisted of bleeding events that were confirmed to have had an overlapping NSAID prescribed at the time of the event. For this secondary assessment, there was 1 rivaroxaban NSAID user bleeding event and 4 apixaban NSAID user bleeding events. For the rivaroxaban NSAID user bleeding event, the NSAID was nonselective and a PPI was not coprescribed. For the apixaban NSAID user bleeding events, 2 NSAIDs were nonselective and 2 were selective. All patients with apixaban and NSAID bleeding events had a coprescribed PPI. There was no clinically significant difference in the bleeding rates observed for NSAID selectivity or PPI coprescribing among the NSAID user subgroups.
DISCUSSION
This study found that there was no statistically significant difference for bleeding rates of major and nonmajor bleeding events between rivaroxaban and apixaban among NSAID users and non-NSAID users. This study did not identify a clinically significant impact on bleeding rates from NSAID selectivity or PPI coprescribing among the NSAID users.
There were notable but not statistically significant differences in baseline characteristics observed between the NSAID and non-NSAID user groups. On average, the rivaroxaban and apixaban NSAID users were younger compared with those not taking NSAIDs. NSAIDs, specifically nonselective NSAIDs, are recognized as potentially inappropriate medications for older adults given that this population is at an increased risk for GI ulcer development and/or GI bleeding.17 The non-NSAID user group likely consisted of older patients compared to the NSAID user group as clinicians may avoid prescribing NSAIDs to older adults regardless of concomitant DOAC therapy.
In addition to having an older patient population, non-NSAID users were more frequently prescribed a concomitant antiplatelet when compared with NSAID users. This prescribing pattern may be due to clinicians avoiding the use of NSAIDs in patients receiving DOAC therapy in combination with antiplatelet therapy, as these patients have been found to have an increased bleeding rate compared to DOAC therapy alone.18
Non-NSAID users had an overall higher bleeding rate for both major and nonmajor bleeding events. Based on this observation, it could be hypothesized that antiplatelet agents have a higher risk of bleeding in comparison to NSAIDs. In a subanalysis of the EXPAND study evaluating risk factors of major bleeding in patients receiving rivaroxaban, concomitant use of antiplatelet agents demonstrated a statistically significant increased risk of bleeding (HR 1.6; 95% CI, 1.2-2.3; P = .003) while concomitant use of NSAIDs did not (HR 0.8; 95% CI, 0.3-2.2; P = .67).19
In assessing PPI status at baseline, a majority of both rivaroxaban and apixaban NSAID users were coprescribed a PPI. This trend aligns with current clinical guideline recommendations for the prescribing of PPI therapy for GI protection in high-risk patients, such as those on DOAC therapy and concomitant NSAID therapy.10 Given the high proportion of NSAID users coprescribed a PPI at baseline, it may be possible that the true incidence of NSAID-associated bleeding events was higher than what this study found. This observation may reflect the impact from timely implementation of risk mitigation strategies by CPPs in the anticoagulation clinic. However, this study was not constructed to assess the efficacy of PPI use in this manner.
It is important to note the patients included in this study were followed by a pharmacist in an anticoagulation clinic using the DOAC Dashboard.15 This population management tool allows CPPs to make proactive interventions when a patient taking a DOAC receives an NSAID prescription, such as recommending the coprescribing of a PPI or use of a selective NSAID.10,16 These standards of care may have contributed to an overall reduced bleeding rate among the NSAID user group and may not be reflective of private practice.
The planned analysis of this study was modeled after the posthoc analysis of the RE-LY and ARISTOTLE trials. Both trials demonstrated an increased risk of bleeding with oral anticoagulation, including DOAC and warfarin, in combination with NSAID use. However, both trials found that NSAID use in patients treated with a DOAC was not independently associated with increased bleeding events compared with warfarin.13,14 The results of this study are comparable to the RE-LY and ARISTOTLE findings that NSAID use among patients treated with rivaroxaban or apixaban did not demonstrate a statistically significant increased bleeding risk.
Studies of NSAID use in combination with DOAC therapy have been limited to patient populations consisting of both DOAC and warfarin. Evidence from these trials outlines the increased bleeding risk associated with NSAID use in combination with oral anticoagulation; however, these patient populations include those on a DOAC and warfarin.13,14,19,20 Given the limited evidence on NSAID use among DOACs alone, it is assumed NSAID use in combination with DOACs has a similar risk of bleeding as warfarin use. This may cause clinicians to automatically exclude NSAID therapy as a treatment option for patients on a DOAC who are otherwise clinically appropriate candidates, such as those with underlying inflammatory conditions. Avoiding NSAID therapy in this patient population may lead to suboptimal pain management and increase the risk of patient harm from methods such as inappropriate opioid therapy prescribing.
DOAC therapy should not be a universal limitation to the use of NSAIDs. Although the risk of bleeding with NSAID therapy is always present, deliberate NSAID prescribing in addition to the timely implementation of risk mitigation strategies may provide an avenue for safe NSAID prescribing in patients receiving a DOAC. A population health-based approach to DOAC management, such as the DOAC Dashboard, appears to be effective at preventing patient harm when NSAIDs are prescribed in conjunction with DOACs.
Limitations
The DOAC Dashboard has been shown to be effective and efficient at monitoring DOAC therapy from a population-based approach.16 Reports generated through the DOAC Dashboard provide convenient access to patient data which allows for timely interventions; however, there are limits to its use for data collection. All the data elements necessary to properly assess bleeding risk with validated tools, such as HAS-BLED (hypertension, abnormal renal/liver function, stroke, bleeding history or predisposition, labile international normalized ratio, elderly, drugs/ alcohol concomitantly), are not available on DOAC Dashboard reports. Due to this constraint, bleeding risk assessments were not conducted at baseline and this study was unable to include risk modeling. Additionally, data elements like initiation and discontinuation dates and duration of therapies were not readily available. As a result, this study was unable to incorporate time as a data point.
This was a retrospective study that relied on manual review of chart documentation to verify bleeding events, but data obtained through the DOAC Dashboard were transferred directly from the EHR.15 Bleeding events available for evaluation were restricted to those that occurred at a VA facility. Additionally, the sample size within the rivaroxaban NSAID user group did not reach the predefined sample size required to reach power and may have been too small to detect a difference if one did exist. The secondary assessment had a low sample size of NSAID user bleeding events, making it difficult to fully assess its impact on NSAID selectivity and PPI coprescribing on bleeding rates. All courses of NSAIDs were equally valued regardless of the dose or therapy duration; however, this is consistent with how NSAID use was defined in the RE-LY and ARISTOTLE trials.
CONCLUSIONS
This retrospective cohort review found no statistically significant difference in the composite bleeding rates between rivaroxaban and apixaban among NSAID users and non-NSAID users. Moreover, there was no clinically significant impact observed for bleeding rates in regard to NSAID selectivity and PPI coprescribing among NSAID users. However, coprescribing of PPI therapy to patients on a DOAC who are clinically indicated for an NSAID may reduce the risk of bleeding. Population health management tools, such as the DOAC Dashboard, may also allow clinicians to safely prescribe NSAIDs to patients on a DOAC. Further large-scale observational studies are needed to quantify the real-world risk of bleeding with concomitant NSAID use among DOACs alone and to evaluate the impact from NSAID selectivity or PPI coprescribing.
- Ruff CT, Giugliano RP, Braunwald E, et al. Comparison of the efficacy and safety of new oral anticoagulants with warfarin in patients with atrial fibrillation: a meta-analysis of randomised trials. Lancet. 2014;383(9921):955-962. doi:10.1016/S0140-6736(13)62343-0
- Ageno W, Gallus AS, Wittkowsky A, Crowther M, Hylek EM, Palareti G. Oral anticoagulant therapy: antithrombotic therapy and prevention of thrombosis, 9th ed: American College of Chest Physicians Evidence-Based Clinical Practice Guidelines. Chest. 2012;141(2 Suppl):e44S-e88S. doi:10.1378/chest.11-2292
- Eikelboom J, Merli G. Bleeding with direct oral anticoagulants vs warfarin: clinical experience. Am J Med. 2016;129(11S):S33-S40. doi:10.1016/j.amjmed.2016.06.003
- Vranckx P, Valgimigli M, Heidbuchel H. The significance of drug-drug and drug-food interactions of oral anticoagulation. Arrhythm Electrophysiol Rev. 2018;7(1):55-61. doi:10.15420/aer.2017.50.1
- Davis JS, Lee HY, Kim J, et al. Use of non-steroidal antiinflammatory drugs in US adults: changes over time and by demographic. Open Heart. 2017;4(1):e000550. doi:10.1136/openhrt-2016-000550
- Schafer AI. Effects of nonsteroidal antiinflammatory drugs on platelet function and systemic hemostasis. J Clin Pharmacol. 1995;35(3):209-219. doi:10.1002/j.1552-4604.1995.tb04050.x
- Al-Saeed A. Gastrointestinal and cardiovascular risk of nonsteroidal anti-inflammatory drugs. Oman Med J. 2011;26(6):385-391. doi:10.5001/omj.2011.101
- Gabriel SE, Jaakkimainen L, Bombardier C. Risk for serious gastrointestinal complications related to use of nonsteroidal anti-inflammatory drugs. Ann Intern Med. 1991;115(10):787-796. doi:10.7326/0003-4819-115-10-787
- Scheiman JM, Yeomans ND, Talley NJ, et al. Prevention of ulcers by esomeprazole in at-risk patients using non-selective NSAIDs and COX-2 inhibitors. Am J Gastroenterol. 2006;101(4):701-710. doi:10.1111/j.1572-0241.2006.00499.x
- Freedberg DE, Kim LS, Yang YX. The risks and benefits of long-term use of proton pump inhibitors: expert review and best practice advice from the American Gastroenterological Association. Gastroenterology. 2017;152(4):706-715. doi:10.1053/j.gastro.2017.01.031
- Lamberts M, Lip GYH, Hansen ML, et al. Relation of nonsteroidal anti-inflammatory drugs to serious bleeding and thromboembolism risk in patients with atrial fibrillation receiving antithrombotic therapy: a nationwide cohort study. Ann Intern Med. 2014;161(10):690-698. doi:10.7326/M13-1581
- Villa Zapata L, Hansten PD, Panic J, et al. Risk of bleeding with exposure to warfarin and nonsteroidal anti-inflammatory drugs: a systematic review and metaanalysis. Thromb Haemost. 2020;120(7):1066-1074. doi:10.1055/s-0040-1710592
- Kent AP, Brueckmann M, Fraessdorf M, et al. Concomitant oral anticoagulant and nonsteroidal anti-inflammatory drug therapy in patients with atrial fibrillation. J Am Coll Cardiol. 2018;72(3):255-267. doi:10.1016/j.jacc.2018.04.063
- Dalgaard F, Mulder H, Wojdyla DM, et al. Patients with atrial fibrillation taking nonsteroidal antiinflammatory drugs and oral anticoagulants in the ARISTOTLE Trial. Circulation. 2020;141(1):10-20. doi:10.1161/CIRCULATIONAHA.119.041296
- Allen AL, Lucas J, Parra D, et al. Shifting the paradigm: a population health approach to the management of direct oral anticoagulants. J Am Heart Asssoc. 2021;10(24):e022758. doi:10.1161/JAHA.121.022758
- . Valencia D, Spoutz P, Stoppi J, et al. Impact of a direct oral anticoagulant population management tool on anticoagulation therapy monitoring in clinical practice. Ann Pharmacother. 2019;53(8):806-811. doi:10.1177/1060028019835843
- By the 2023 American Geriatrics Society Beers Criteria® Update Expert Panel. American Geriatrics Society 2023 Updated AGS Beers Criteria® for potentially inappropriate medication use in older adults. J Am Geriatr Soc. 2023;71(7):2052-2081. doi:10.1111/jgs.18372
- Kumar S, Danik SB, Altman RK, et al. Non-vitamin K antagonist oral anticoagulants and antiplatelet therapy for stroke prevention in patients with atrial fibrillation. Cardiol Rev. 2016;24(5):218-223. doi:10.1097/CRD.0000000000000088
- Sakuma I, Uchiyama S, Atarashi H, et al. Clinical risk factors of stroke and major bleeding in patients with nonvalvular atrial fibrillation under rivaroxaban: the EXPAND study sub-analysis. Heart Vessels. 2019;34(11):1839-1851. doi:10.1007/s00380-019-01425-x
- Davidson BL, Verheijen S, Lensing AWA, et al. Bleeding risk of patients with acute venous thromboembolism taking nonsteroidal anti-inflammatory drugs or aspirin. JAMA Intern Med. 2014;174(6):947-953. doi:10.1001/jamainternmed.2014.946
Clinical practice has shifted from vitamin K antagonists to direct oral anticoagulants (DOACs) for atrial fibrillation treatment due to their more favorable risk-benefit profile and less lifestyle modification required.1,2 However, the advantage of a lower bleeding risk with DOACs could be compromised by potentially problematic pharmacokinetic interactions like those conferred by antiplatelets or nonsteroidal anti-inflammatory drugs (NSAIDs).3,4 Treating a patient needing anticoagulation with a DOAC who has comorbidities may introduce unavoidable drug-drug interactions. This particularly happens with over-the-counter and prescription NSAIDs used for the management of pain and inflammatory conditions.5
NSAIDs primarily affect 2 cyclooxygenase (COX) enzyme isomers, COX-1 and COX-2.6 COX-1 helps maintain gastrointestinal (GI) mucosa integrity and platelet aggregation processes, whereas COX-2 is engaged in pain signaling and inflammation mediation. COX-1 inhibition is associated with more bleeding-related adverse events (AEs), especially in the GI tract. COX-2 inhibition is thought to provide analgesia and anti-inflammatory properties without elevating bleeding risk. This premise is responsible for the preferential use of celecoxib, a COX-2 selective NSAID, which should confer a lower bleeding risk compared to nonselective NSAIDs such as ibuprofen and naproxen.7 NSAIDs have been documented as independent risk factors for bleeding. NSAID users are about 3 times as likely to develop GI AEs compared to nonNSAID users.8
Many clinicians aim to further mitigate NSAID-associated bleeding risk by coprescribing a proton pump inhibitor (PPI). PPIs provide gastroprotection against NSAID-induced mucosal injury and sequential complication of GI bleeding. In a multicenter randomized control trial, patients who received concomitant PPI therapy while undergoing chronic NSAID therapy—including nonselective and COX-2 selective NSAIDs—had a significantly lower risk of GI ulcer development (placebo, 17.0%; 20 mg esomeprazole, 5.2%; 40 mg esomeprazole, 4.6%).9 Current clinical guidelines for preventing NSAIDassociated bleeding complications recommend using a COX-2 selective NSAID in combination with PPI therapy for patients at high risk for GI-related bleeding, including the concomitant use of anticoagulants.10
There is evidence suggesting an increased bleeding risk with NSAIDs when used in combination with vitamin K antagonists such as warfarin.11,12 A systematic review of warfarin and concomitant NSAID use found an increased risk of overall bleeding with NSAID use in combination with warfarin (odds ratio 1.58; 95% CI, 1.18-2.12), compared to warfarin alone.12
Posthoc analyses of randomized clinical trials have also demonstrated an increased bleeding risk with oral anticoagulation and concomitant NSAID use.13,14 In the RE-LY trial, NSAID users on warfarin or dabigatran had a statistically significant increased risk of major bleeding compared to non-NSAID users (hazard ratio [HR] 1.68; 95% CI, 1.40- 2.02; P < .001).13 In the ARISTOTLE trial, patients on warfarin or apixaban who were incident NSAID users were found to have an increased risk of major bleeding (HR 1.61; 95% CI, 1.11-2.33) and clinically relevant nonmajor bleeding (HR 1.70; 95% CI, 1.16- 2.48).14 These trials found a statistically significant increased bleeding risk associated with NSAID use, though the populations evaluated included patients taking warfarin and patients taking DOACs. These trials did not evaluate the bleeding risk of concomitant NSAID use among DOACs alone.
Evidence on NSAID-associated bleeding risk with DOACs is lacking in settings where the patient population, prescribing practices, and monitoring levels are variable. Within the Veterans Health Administration, clinical pharmacist practitioners (CPPs) in anticoagulation clinics oversee DOAC therapy management. CPPs monitor safety and efficacy of DOAC therapies through a population health management tool, the DOAC Dashboard.15 The DOAC Dashboard creates alerts for patients who may require an intervention based on certain clinical parameters, such as drug-drug interactions.16 Whenever a patient on a DOAC is prescribed an NSAID, an alert is generated on the DOAC Dashboard to flag the CPPs for the potential need for an intervention. If NSAID therapy remains clinically indicated, CPPs may recommend risk reduction strategies such as a COX-2 selective NSAID or coprescribing a PPI.10
The DOAC Dashboard provides an ideal setting for investigating the effects of NSAID use, NSAID selectivity, and PPI coprescribing on DOAC bleeding rates. With an increasing population of patients receiving anticoagulation therapy with a DOAC, more guidance regarding the bleeding risk of concomitant NSAID use with DOACs is needed. Studies evaluating the bleeding risk with concomitant NSAID use in patients on a DOAC alone are limited. This is the first study to date to compare bleeding risk with concomitant NSAID use between DOACs. This study provides information on bleeding risk with NSAID use among commonly prescribed DOACs, rivaroxaban and apixaban, and the potential impacts of current risk reduction strategies.
METHODS
This single-center retrospective cohort review was performed using the electronic health records (EHRs) of patients enrolled in the US Department of Veterans Affairs (VA) Mountain Home Healthcare System who received rivaroxaban or apixaban from December 2020 to December 2022. This study received approval from the East Tennessee State University/VA Institutional Review Board committee.
Patients were identified through the DOAC Dashboard, aged 21 to 100 years, and received rivaroxaban or apixaban at a therapeutic dose: rivaroxaban 10 to 20 mg daily or apixaban 2.5 to 5 mg twice daily. Patients were excluded if they were prescribed dual antiplatelet therapy, received rivaroxaban at dosing indicated for peripheral vascular disease, were undergoing dialysis, had evidence of moderate to severe hepatic impairment or any hepatic disease with coagulopathy, were undergoing chemotherapy or radiation, or had hematological conditions with predisposed bleeding risk. These patients were excluded to mitigate the potential confounding impact from nontherapeutic DOAC dosing strategies and conditions associated with an increased bleeding risk.
Eligible patients were stratified based on NSAID use. NSAID users were defined as patients prescribed an oral NSAID, including both acute and chronic courses, at any point during the study time frame while actively on a DOAC. Bleeding events were reviewed to evaluate rates between rivaroxaban and apixaban among NSAID and nonNSAID users. Identified NSAID users were further assessed for NSAID selectivity and PPI coprescribing as a subgroup analysis for the secondary assessment.
Data Collection
Baseline data were collected, including age, body mass index, anticoagulation indication, DOAC agent, DOAC dose, and DOAC total daily dose. Baseline serum creatinine levels, liver function tests, hemoglobin levels, and platelet counts were collected from the most recent data available immediately prior to the bleeding event, if applicable.
The DOAC Dashboard was reviewed for active and dismissed drug interaction alerts to identify patients taking rivaroxaban or apixaban who were prescribed an NSAID. Patients were categorized in the NSAID group if an interacting drug alert with an NSAID was reported during the study time frame. Data available through the interacting drug alerts on NSAID use were limited to the interacting drug name and date of the reported flag. Manual EHR review was required to confirm dates of NSAID therapy initiation and NSAID discontinuation, if applicable.
Data regarding concomitant antiplatelet use were obtained through review of the active and dismissed drug interaction alerts on the DOAC Dashboard. Concomitant antiplatelet use was defined as the prescribing of a single antiplatelet agent at any point while receiving DOAC therapy. Data on concomitant antiplatelets were collected regardless of NSAID status.
Data on coprescribed PPI therapy were obtained through manual EHR review of identified NSAID users. Coprescribed PPI therapy was defined as the prescribing of a PPI at any point during NSAID therapy. Data regarding PPI use among non-NSAID users were not collected because the secondary endpoint was designed to assess PPI use only among patients coprescribed a DOAC and NSAID.
Outcomes
Bleeding events were identified through an outcomes report generated by the DOAC Dashboard based on International Classification of Diseases, Tenth Revision diagnosis codes associated with a bleeding event. The outcomes report captures diagnoses from the outpatient and inpatient care settings. Reported bleeding events were limited to patients who received a DOAC at any point in the 6 months prior to the event and excluded patients with recent DOAC initiation within 7 days of the event, as these patients are not captured on the DOAC Dashboard.
All reported bleeding events were manually reviewed in the EHR and categorized as a major or clinically relevant nonmajor bleed, according to International Society of Thrombosis and Haemostasis criteria. Validated bleeding events were then crossreferenced with the interacting drug alerts report to identify events with potentially overlapping NSAID therapy at the time of the event. Overlapping NSAID therapy was defined as the prescribing of an NSAID at any point in the 6 months prior to the event. All events with potential overlapping NSAID therapies were manually reviewed for confirmation of NSAID status at the time of the event.
The primary endpoint was a composite of any bleeding event per International Society of Thrombosis and Haemostasis criteria. The secondary endpoint evaluated the potential impact of NSAID selectivity or PPI coprescribing on the bleeding rate among the NSAID user groups.
Statistical Analysis
Analyses were performed consistent with the methods used in the ARISTOTLE and RE-LY trials. It was determined that a sample size of 504 patients, with ≥ 168 patients in each group, would provide 80% power using a 2-sided a of 0.05. HRs with 95% CIs and respective P values were calculated using a SPSS-adapted online calculator.
RESULTS
The DOAC Dashboard identified 681 patients on rivaroxaban and 3225 patients on apixaban; 72 patients on rivaroxaban (10.6%) and 300 patients on apixaban (9.3%) were NSAID users. The mean age of NSAID users was 66.9 years in the rivaroxaban group and 72.4 years in the apixaban group. The mean age of non-NSAID users was 71.5 years in the rivaroxaban group and 75.6 years in the apixaban group. No appreciable differences were observed among subgroups in body mass index, renal function, hepatic function, hemoglobin, or platelet counts, and no statistically significant differences were identified (Table 1). Antiplatelet agents identified included aspirin, clopidogrel, prasugrel, and ticagrelor. Fifteen patients (20.3%) in the rivaroxaban group and 87 patients (28.7%) in the apixaban group had concomitant antiplatelet and NSAID use. Forty-five patients on rivaroxaban (60.8%) and 170 (55.9%) on apixaban were prescribed concomitant PPI and NSAID at baseline. Among non-NSAID users, there was concomitant antiplatelet use for 265 patients (43.6%) in the rivaroxaban group and 1401 patients (47.9%) in the apixaban group. Concomitant PPI use was identified among 63 patients (60.0%) taking selective NSAIDs and 182 (57.2%) taking nonselective NSAIDs.
A total of 423 courses of NSAIDs were identified: 85 NSAID courses in the rivaroxaban group and 338 NSAID courses in the apixaban group. Most NSAID courses involved a nonselective NSAID in the rivaroxaban and apixaban NSAID user groups: 75.2% (n = 318) aggregately compared to 71.8% (n = 61) and 76.0% (n = 257) in the rivaroxaban and apixaban groups, respectively. The most frequent NSAID courses identified were meloxicam (26.7%; n = 113), celecoxib (24.8%; n = 105), ibuprofen (19.1%; n = 81), and naproxen (13.5%; n = 57). Data regarding NSAID therapy initiation and discontinuation dates were not readily available. As a result, the duration of NSAID courses was not captured.
There was no statistically significant difference in bleeding rates between rivaroxaban and apixaban among NSAID users (HR 1.04; 95% CI, 0.98-1.12) or non-NSAID users (HR 1.15; 95% CI, 0.80-1.66) (Table 2). Apixaban non-NSAID users had a higher rate of major bleeds (HR 0.32; 95% CI, 0.17-0.61) while rivaroxaban non-NSAID users had a higher rate of clinically relevant nonmajor bleeds (HR 1.63; 95% CI, 1.10-2.54).
The sample size for the secondary endpoint consisted of bleeding events that were confirmed to have had an overlapping NSAID prescribed at the time of the event. For this secondary assessment, there was 1 rivaroxaban NSAID user bleeding event and 4 apixaban NSAID user bleeding events. For the rivaroxaban NSAID user bleeding event, the NSAID was nonselective and a PPI was not coprescribed. For the apixaban NSAID user bleeding events, 2 NSAIDs were nonselective and 2 were selective. All patients with apixaban and NSAID bleeding events had a coprescribed PPI. There was no clinically significant difference in the bleeding rates observed for NSAID selectivity or PPI coprescribing among the NSAID user subgroups.
DISCUSSION
This study found that there was no statistically significant difference for bleeding rates of major and nonmajor bleeding events between rivaroxaban and apixaban among NSAID users and non-NSAID users. This study did not identify a clinically significant impact on bleeding rates from NSAID selectivity or PPI coprescribing among the NSAID users.
There were notable but not statistically significant differences in baseline characteristics observed between the NSAID and non-NSAID user groups. On average, the rivaroxaban and apixaban NSAID users were younger compared with those not taking NSAIDs. NSAIDs, specifically nonselective NSAIDs, are recognized as potentially inappropriate medications for older adults given that this population is at an increased risk for GI ulcer development and/or GI bleeding.17 The non-NSAID user group likely consisted of older patients compared to the NSAID user group as clinicians may avoid prescribing NSAIDs to older adults regardless of concomitant DOAC therapy.
In addition to having an older patient population, non-NSAID users were more frequently prescribed a concomitant antiplatelet when compared with NSAID users. This prescribing pattern may be due to clinicians avoiding the use of NSAIDs in patients receiving DOAC therapy in combination with antiplatelet therapy, as these patients have been found to have an increased bleeding rate compared to DOAC therapy alone.18
Non-NSAID users had an overall higher bleeding rate for both major and nonmajor bleeding events. Based on this observation, it could be hypothesized that antiplatelet agents have a higher risk of bleeding in comparison to NSAIDs. In a subanalysis of the EXPAND study evaluating risk factors of major bleeding in patients receiving rivaroxaban, concomitant use of antiplatelet agents demonstrated a statistically significant increased risk of bleeding (HR 1.6; 95% CI, 1.2-2.3; P = .003) while concomitant use of NSAIDs did not (HR 0.8; 95% CI, 0.3-2.2; P = .67).19
In assessing PPI status at baseline, a majority of both rivaroxaban and apixaban NSAID users were coprescribed a PPI. This trend aligns with current clinical guideline recommendations for the prescribing of PPI therapy for GI protection in high-risk patients, such as those on DOAC therapy and concomitant NSAID therapy.10 Given the high proportion of NSAID users coprescribed a PPI at baseline, it may be possible that the true incidence of NSAID-associated bleeding events was higher than what this study found. This observation may reflect the impact from timely implementation of risk mitigation strategies by CPPs in the anticoagulation clinic. However, this study was not constructed to assess the efficacy of PPI use in this manner.
It is important to note the patients included in this study were followed by a pharmacist in an anticoagulation clinic using the DOAC Dashboard.15 This population management tool allows CPPs to make proactive interventions when a patient taking a DOAC receives an NSAID prescription, such as recommending the coprescribing of a PPI or use of a selective NSAID.10,16 These standards of care may have contributed to an overall reduced bleeding rate among the NSAID user group and may not be reflective of private practice.
The planned analysis of this study was modeled after the posthoc analysis of the RE-LY and ARISTOTLE trials. Both trials demonstrated an increased risk of bleeding with oral anticoagulation, including DOAC and warfarin, in combination with NSAID use. However, both trials found that NSAID use in patients treated with a DOAC was not independently associated with increased bleeding events compared with warfarin.13,14 The results of this study are comparable to the RE-LY and ARISTOTLE findings that NSAID use among patients treated with rivaroxaban or apixaban did not demonstrate a statistically significant increased bleeding risk.
Studies of NSAID use in combination with DOAC therapy have been limited to patient populations consisting of both DOAC and warfarin. Evidence from these trials outlines the increased bleeding risk associated with NSAID use in combination with oral anticoagulation; however, these patient populations include those on a DOAC and warfarin.13,14,19,20 Given the limited evidence on NSAID use among DOACs alone, it is assumed NSAID use in combination with DOACs has a similar risk of bleeding as warfarin use. This may cause clinicians to automatically exclude NSAID therapy as a treatment option for patients on a DOAC who are otherwise clinically appropriate candidates, such as those with underlying inflammatory conditions. Avoiding NSAID therapy in this patient population may lead to suboptimal pain management and increase the risk of patient harm from methods such as inappropriate opioid therapy prescribing.
DOAC therapy should not be a universal limitation to the use of NSAIDs. Although the risk of bleeding with NSAID therapy is always present, deliberate NSAID prescribing in addition to the timely implementation of risk mitigation strategies may provide an avenue for safe NSAID prescribing in patients receiving a DOAC. A population health-based approach to DOAC management, such as the DOAC Dashboard, appears to be effective at preventing patient harm when NSAIDs are prescribed in conjunction with DOACs.
Limitations
The DOAC Dashboard has been shown to be effective and efficient at monitoring DOAC therapy from a population-based approach.16 Reports generated through the DOAC Dashboard provide convenient access to patient data which allows for timely interventions; however, there are limits to its use for data collection. All the data elements necessary to properly assess bleeding risk with validated tools, such as HAS-BLED (hypertension, abnormal renal/liver function, stroke, bleeding history or predisposition, labile international normalized ratio, elderly, drugs/ alcohol concomitantly), are not available on DOAC Dashboard reports. Due to this constraint, bleeding risk assessments were not conducted at baseline and this study was unable to include risk modeling. Additionally, data elements like initiation and discontinuation dates and duration of therapies were not readily available. As a result, this study was unable to incorporate time as a data point.
This was a retrospective study that relied on manual review of chart documentation to verify bleeding events, but data obtained through the DOAC Dashboard were transferred directly from the EHR.15 Bleeding events available for evaluation were restricted to those that occurred at a VA facility. Additionally, the sample size within the rivaroxaban NSAID user group did not reach the predefined sample size required to reach power and may have been too small to detect a difference if one did exist. The secondary assessment had a low sample size of NSAID user bleeding events, making it difficult to fully assess its impact on NSAID selectivity and PPI coprescribing on bleeding rates. All courses of NSAIDs were equally valued regardless of the dose or therapy duration; however, this is consistent with how NSAID use was defined in the RE-LY and ARISTOTLE trials.
CONCLUSIONS
This retrospective cohort review found no statistically significant difference in the composite bleeding rates between rivaroxaban and apixaban among NSAID users and non-NSAID users. Moreover, there was no clinically significant impact observed for bleeding rates in regard to NSAID selectivity and PPI coprescribing among NSAID users. However, coprescribing of PPI therapy to patients on a DOAC who are clinically indicated for an NSAID may reduce the risk of bleeding. Population health management tools, such as the DOAC Dashboard, may also allow clinicians to safely prescribe NSAIDs to patients on a DOAC. Further large-scale observational studies are needed to quantify the real-world risk of bleeding with concomitant NSAID use among DOACs alone and to evaluate the impact from NSAID selectivity or PPI coprescribing.
- Ruff CT, Giugliano RP, Braunwald E, et al. Comparison of the efficacy and safety of new oral anticoagulants with warfarin in patients with atrial fibrillation: a meta-analysis of randomised trials. Lancet. 2014;383(9921):955-962. doi:10.1016/S0140-6736(13)62343-0
- Ageno W, Gallus AS, Wittkowsky A, Crowther M, Hylek EM, Palareti G. Oral anticoagulant therapy: antithrombotic therapy and prevention of thrombosis, 9th ed: American College of Chest Physicians Evidence-Based Clinical Practice Guidelines. Chest. 2012;141(2 Suppl):e44S-e88S. doi:10.1378/chest.11-2292
- Eikelboom J, Merli G. Bleeding with direct oral anticoagulants vs warfarin: clinical experience. Am J Med. 2016;129(11S):S33-S40. doi:10.1016/j.amjmed.2016.06.003
- Vranckx P, Valgimigli M, Heidbuchel H. The significance of drug-drug and drug-food interactions of oral anticoagulation. Arrhythm Electrophysiol Rev. 2018;7(1):55-61. doi:10.15420/aer.2017.50.1
- Davis JS, Lee HY, Kim J, et al. Use of non-steroidal antiinflammatory drugs in US adults: changes over time and by demographic. Open Heart. 2017;4(1):e000550. doi:10.1136/openhrt-2016-000550
- Schafer AI. Effects of nonsteroidal antiinflammatory drugs on platelet function and systemic hemostasis. J Clin Pharmacol. 1995;35(3):209-219. doi:10.1002/j.1552-4604.1995.tb04050.x
- Al-Saeed A. Gastrointestinal and cardiovascular risk of nonsteroidal anti-inflammatory drugs. Oman Med J. 2011;26(6):385-391. doi:10.5001/omj.2011.101
- Gabriel SE, Jaakkimainen L, Bombardier C. Risk for serious gastrointestinal complications related to use of nonsteroidal anti-inflammatory drugs. Ann Intern Med. 1991;115(10):787-796. doi:10.7326/0003-4819-115-10-787
- Scheiman JM, Yeomans ND, Talley NJ, et al. Prevention of ulcers by esomeprazole in at-risk patients using non-selective NSAIDs and COX-2 inhibitors. Am J Gastroenterol. 2006;101(4):701-710. doi:10.1111/j.1572-0241.2006.00499.x
- Freedberg DE, Kim LS, Yang YX. The risks and benefits of long-term use of proton pump inhibitors: expert review and best practice advice from the American Gastroenterological Association. Gastroenterology. 2017;152(4):706-715. doi:10.1053/j.gastro.2017.01.031
- Lamberts M, Lip GYH, Hansen ML, et al. Relation of nonsteroidal anti-inflammatory drugs to serious bleeding and thromboembolism risk in patients with atrial fibrillation receiving antithrombotic therapy: a nationwide cohort study. Ann Intern Med. 2014;161(10):690-698. doi:10.7326/M13-1581
- Villa Zapata L, Hansten PD, Panic J, et al. Risk of bleeding with exposure to warfarin and nonsteroidal anti-inflammatory drugs: a systematic review and metaanalysis. Thromb Haemost. 2020;120(7):1066-1074. doi:10.1055/s-0040-1710592
- Kent AP, Brueckmann M, Fraessdorf M, et al. Concomitant oral anticoagulant and nonsteroidal anti-inflammatory drug therapy in patients with atrial fibrillation. J Am Coll Cardiol. 2018;72(3):255-267. doi:10.1016/j.jacc.2018.04.063
- Dalgaard F, Mulder H, Wojdyla DM, et al. Patients with atrial fibrillation taking nonsteroidal antiinflammatory drugs and oral anticoagulants in the ARISTOTLE Trial. Circulation. 2020;141(1):10-20. doi:10.1161/CIRCULATIONAHA.119.041296
- Allen AL, Lucas J, Parra D, et al. Shifting the paradigm: a population health approach to the management of direct oral anticoagulants. J Am Heart Asssoc. 2021;10(24):e022758. doi:10.1161/JAHA.121.022758
- . Valencia D, Spoutz P, Stoppi J, et al. Impact of a direct oral anticoagulant population management tool on anticoagulation therapy monitoring in clinical practice. Ann Pharmacother. 2019;53(8):806-811. doi:10.1177/1060028019835843
- By the 2023 American Geriatrics Society Beers Criteria® Update Expert Panel. American Geriatrics Society 2023 Updated AGS Beers Criteria® for potentially inappropriate medication use in older adults. J Am Geriatr Soc. 2023;71(7):2052-2081. doi:10.1111/jgs.18372
- Kumar S, Danik SB, Altman RK, et al. Non-vitamin K antagonist oral anticoagulants and antiplatelet therapy for stroke prevention in patients with atrial fibrillation. Cardiol Rev. 2016;24(5):218-223. doi:10.1097/CRD.0000000000000088
- Sakuma I, Uchiyama S, Atarashi H, et al. Clinical risk factors of stroke and major bleeding in patients with nonvalvular atrial fibrillation under rivaroxaban: the EXPAND study sub-analysis. Heart Vessels. 2019;34(11):1839-1851. doi:10.1007/s00380-019-01425-x
- Davidson BL, Verheijen S, Lensing AWA, et al. Bleeding risk of patients with acute venous thromboembolism taking nonsteroidal anti-inflammatory drugs or aspirin. JAMA Intern Med. 2014;174(6):947-953. doi:10.1001/jamainternmed.2014.946
Impact of NSAID Use on Bleeding Rates for Patients Taking Rivaroxaban or Apixaban
Impact of NSAID Use on Bleeding Rates for Patients Taking Rivaroxaban or Apixaban
PPI-Responsive Disease a Subtype of EoE Rather Than GERD
, according to comparative proteomic analyses.
Notably, after PPI therapy, the protein profiles of responsive patients reverted and appeared similar to non-EoE patients, whereas the profiles of nonresponsive patients remained largely unchanged.
“Identifying protein biomarkers associated with PPI response may help distinguish EoE phenotypes and guide therapy selections,” said senior author Walter Chan, MD, AGAF, associate professor of medicine in the Division of Gastroenterology, Hepatology, and Endoscopy at Harvard Medical School and director of the center for gastrointestinal motility at Brigham and Women’s Hospital, Boston.
“These findings may provide the framework for developing protein biomarkers to assess response to therapy and monitor disease activity,” he added.
The study was published online in Gastroenterology.
Comparative Proteomic Analyses
Chan and colleagues conducted a prospective exploratory pilot study to identify the differences in esophageal protein profiles among PPI-responsive-EoE (PPI-R-EoE), PPI-nonresponsive-EoE (PPI-NR-EoE), and non-EoE controls using SOMAscan, a proteomics platform that allows simultaneous detection of 1305 human proteins.
The research team prospectively enrolled patients undergoing endoscopy for esophageal symptoms or for EoE follow-up, obtaining clinically indicated biopsies as well as extra samples from the midesophagus.
Patients who were diagnosed with EoE (at 15 or greater eosinophils per high-power field, or eos/hpf) were treated with 20 mg of omeprazole twice daily for 8 weeks, followed by repeat biopsies to assess treatment response.
Patients with histologic remission (fewer than 15 eos/hpf) were classified as PPI-R-EoE, whereas those with persistently active disease were classified as PPI-NR-EoE. Patients without EoE served as controls and were categorized as having erosive esophagitis (EE) or no esophagitis.
Overall, the study enrolled 32 patients, including 15 with PPI-R-EoE, eight with PPI-NR-EoE, three with EE, and six with no esophagitis. The demographics, symptoms, and endoscopic findings were similar between the PPI-R-EoE and PPI-NR-EoE patients.
At the index endoscopy, the PPI-R-EoE and PPI-NR-EoE patients had similar esophageal protein profiles, with only 20 proteins differentially expressed at a relaxed cutoff of P < .1. An analysis of the 20 proteins predicted lower expression of six proteins that may be associated with gastrointestinal inflammation in nonresponsive patients, including STAT1, STAT3, CFB, interleukin (IL)-17RA, TNFRSF1A, and SERPINA3.
In addition, 136 proteins — including 15 with corrected P < .05 — clearly discriminated PPI-R-EoE patients from non-EoE controls, and 255 proteins — including 249 with P < .05 — discriminated PPI-NR-EoE patients from controls. Both types of EoE patients had proteins associated with enhanced inflammation and vasculogenesis, as well as down-regulation of CRISP3 and DSG1 and upregulation of TNFAIP6.
The comparative analyses also showed that the follow-up biopsies of PPI-R-EoE patients had protein profiles that resembled non-EoE controls after PPI therapy.
“This further supports the hypothesis that despite the PPI response, PPI-R-EoE represents a subtype of EoE rather than gastroesophageal reflux disease (GERD),” Chan said.
Future EoE Considerations
Although most expressed proteins appeared similar between PPI-responsive and nonresponsive patients before treatment, a few proteins differed related to gastrointestinal inflammation, the study authors wrote, including some previously implicated in IL4 and IL13 inflammatory pathways.
“Further study of these proteins may provide insights into the EoE pathogenic pathway, explore their potential to predict PPI response at diagnosis, and identify possible therapeutic targets,” they wrote.
The authors pointed to the small study size as the primary limitation, noting that the pilot study was intended to explore the feasibility of using SomaScan to assess esophageal protein profiles in different EoE phenotypes. In the future, larger studies with more expansive candidate proteins could help characterize the differences and better identify specific proteins and pathways in EoE, they wrote.
“The takeaway is that PPI responsiveness does not distinguish EoE from GERD but rather PPI is a primary therapy for EoE independent of GERD,” said Marc Rothenberg, MD, director of allergy and immunology and director of the Cincinnati Center for Eosinophilic Disorders at Cincinnati Children’s Hospital Medical Center, Cincinnati, Ohio.
Rothenberg, who wasn’t involved with this study, has conducted transcriptome analyses of PPI-R-EoE, which showed PPI-reversible allergic inflammation.
“PPI-R-EoE and PPI-NR-EoE look the same at the molecular level,” he said. “After therapy, PPI-R-EoE normalizes, as per its definition.”
This study was supported by the Campaign Urging Research for Eosinophilic Disease Foundation Grant, the Kenneth and Louise Goldberg Junior Faculty Award, and a National Institutes of Health award. Chan declared advisory board positions with several pharmaceutical companies and Rothenberg reported no relevant disclosures.
A version of this article appeared on Medscape.com.
Tapering Corticosteroids in Severe Alcohol-Associated Hepatitis Appears Safe
SAN DIEGO — , according to new research.
“Although several drugs have been evaluated for severe alcohol-associated hepatitis, none have succeeded in practice. Corticosteroids remain the mainstay of treatment; however, infections remain a major concern in 25%-40% of cases,” said Anand Kulkarni, MD, senior consultant and director of critical care hepatology at the Asian Institute of Gastroenterology in Hyderabad, India.
“There are no standard society guidelines for steroid dosing, and our current practices stem from studies in the 1970s, so there’s a major knowledge gap around optimal dosing and if stepwise tapering helps,” said Kulkarni, who presented the findings at The Liver Meeting 2024: American Association for the Study of Liver Diseases (AASLD).
Assessing Tapered Doses
In a multicenter, open-label randomized controlled trial, 254 patients with SAH from four Indian centers and one Canadian center were randomized to receive either a fixed or tapering dose of 40 mg prednisolone daily for 4 weeks. The patients in the tapering group received a starting dose of 40 mg, which was reduced by 10 mg weekly over 4 weeks.
While taking corticosteroids, 66% of those in the fixed dose group and 55% of those in the tapering group also received prophylactic antibiotics.
The mean age of participants was 41.1 years, the median Model For End-Stage Liver Disease score was 25.6, and 98.4% were men.
The primary objective was to compare the incidence of drug-related adverse events, infections, hospitalization, and mortality through day 90.
The duration of corticosteroid therapy was 22 days in the fixed dose group and 23 days in the tapering dose group.
Overall, the proportion of steroid responders was similar in both groups, at 80.3% in the fixed dose group and 82.5% in the tapering dose group.
However, the incidence of drug-related adverse events was significantly higher in the fixed dose group (52%) than in the tapering dose group (36.2%). The most common adverse events in both groups were infection, hyperglycemia, and hematochezia.
At 90 days, the incidence of infection was significantly lower in the tapering group (19.7%) than in the fixed dose group (33.1%). In both groups, the most common infection sites were the lungs (28.3%) and urinary tract (22.4%).
In terms of liver-related outcomes, some patients developed hepatic encephalopathy (11.8% in fixed dose vs 6.3% in tapering dose) and acute variceal bleed (3.1% in each group), as well as acute kidney injury (26.8% in fixed dose vs 18.9% in tapering dose).
Hospitalization within 90 days was required in 44.1% of the fixed dose group and 33.1% of the tapering dose group.
Survival at day 90 was 83.5% in the fixed dose group and 86.6% in the tapering dose group. Four patients in the fixed dose group and three patients in the tapering dose group underwent living donor liver transplantation by day 90.
Relapse of alcohol use by day 90 occurred in 13.4% of the fixed dose group and 12.6% of the tapering dose group.
“Rapid tapering in severe alcohol-associated hepatitis reduces infections and hospitalizations but doesn’t have a significant impact on survival,” Kulkarni concluded.
Considering Alternative Therapies
Given the high risk for infection in patients with SAH and limited certainty around benefits, the data may also call into question whether to give steroids to these patients at all, said session co-moderator Aleksander Krag, MD, professor of clinical medicine at the University of Southern Denmark, Odense, Denmark, and secretary general of the European Association for the Study of Liver 2023-2025.
“Since there are no other treatments available as of now, we’ll still continue to give steroids,” Kulkarni noted. But “tapering the dose should be beneficial.”
Although steroid therapy has been considered the “mainstay treatment” for SAH for 50 years, it doesn’t always lead to long-term improvement in liver values or survival, said Prasun Jalal, MD, the Stan and Sue Partee Endowed Chair in Hepatology at Baylor College of Medicine, Houston, who wasn’t involved with the study.
Researchers are looking to other connections, such as the gut microbiome, to find treatments for advanced alcoholic liver disease, Jalal said in an interview. In a small pilot study, he and colleagues found that intestinal microbiota transplantation (IMT) appears to be safe and effective for these patients.
“Early analyses suggest that IMT has a favorable outcome on the prognosis of patients with severe alcohol-associated hepatitis and is safe,” Jalal said. “A longer follow-up study with a larger sample size is in progress.”
Kulkarni and Krag reported no relevant disclosures. Jalal has speaking and teaching relationships with AbbVie and Madrigal.
A version of this article appeared on Medscape.com.
FROM AASLD 2024
Whipple Disease With Central Nervous System Involvement
Whipple Disease With Central Nervous System Involvement
Whipple disease is a chronic, rare, infectious disease that manifests with systemic symptoms. This disease is caused by the gram-positive bacterium Tropheryma whipplei (T. whipplei). Common manifestations include gastrointestinal symptoms indicative of malabsorption, such as chronic diarrhea, unintentional weight loss (despite normal nutrient intake), and greasy, voluminous, foul-smelling stool. Other, less common manifestations include cardiovascular, endocrine, musculoskeletal, neurologic, and renal signs and symptoms. The prevalence of the disease is rare, affecting 3 in 1 million patients.1 This case highlights the importance of considering Whipple disease when treating patients with multiple symptoms and concurrent disease processes.
Case Presentation
A 53-year-old male with a medical history of hypertension, hyperlipidemia, hypothyroidism, and microcytic anemia presented with an 8-month history of persistent diarrhea associated with abdominal bloating, abdominal discomfort, and a 30-lb weight loss. He also reported fatigue, headaches, inability to concentrate, memory distortion, and visual disturbances involving flashes and floaters. The patient reported no fever, chills, nuchal rigidity, or prior neurologic symptoms. He reported intermittent bilateral hand and knee arthralgias. An autoimmune evaluation for arthralgia was negative, and a prior colonoscopy had been normal.
The patient’s hobbies included gardening, hiking, fishing, and deer hunting in Wyoming and Texas. He had spent time around cattle, dogs, and cats. He consumed alcohol twice weekly but reported no tobacco or illicit drug use or recent international travel. The patient’s family history was positive for rheumatoid arthritis, diabetes mellitus, and hypertension.
The patient’s vital signs were all within reference ranges, and lung auscultation revealed clear breathing sounds with no cardiac murmurs, gallops, or rubs. An abdominal examination revealed decreased bowel sounds, while the rest of the physical examination was otherwise normal.
Initial laboratory results showed that his sodium was 134 mEq/L (reference range, 136-145 mEq/L), hemoglobin was 9.3 g/dL (reference range for men, 14.0-18.0 g/dL), and hematocrit was 30.7% (reference range for men 42%-52%). His white blood cell (WBC) count and thyroid-stimulating hormone level were within normal limits. A cerebrospinal fluid (CSF) analysis revealed the following: WBCs 1.0/μL (0-5/μL), segmented neutrophils 10% (reference range, 7%), lymphocytes 80% (reference range, 40-80%), macrophages 10% (reference range, 2%), red blood cells 3 × 10⁶ /μL (reference range, 4.3- 5.9 × 10⁶ /µL), protein 23.5 mg/dL (reference range, 15-60 mg/dL), and glucose 44 mg/dL (reference range, 50-80 mg/dL).
Upper endoscopy with duodenal biopsy showed benign duodenal mucosa. Histopathologic evaluation revealed abundant foamy macrophages within lamina propria. Periodic acid–Schiff (PAS) stain was positive, diastase-resistant material was visualized within the macrophages (Figures 1 and 2). Polymerase chain reaction (PCR) testing of duodenal biopsy tissue was positive for T. whipplei. A lumbar puncture was performed, and PCR testing of CSF for T. whipplei was also positive. A stool PCR test was positive for Giardia. Transthoracic echocardiogram and brain magnetic resonance imaging were normal.
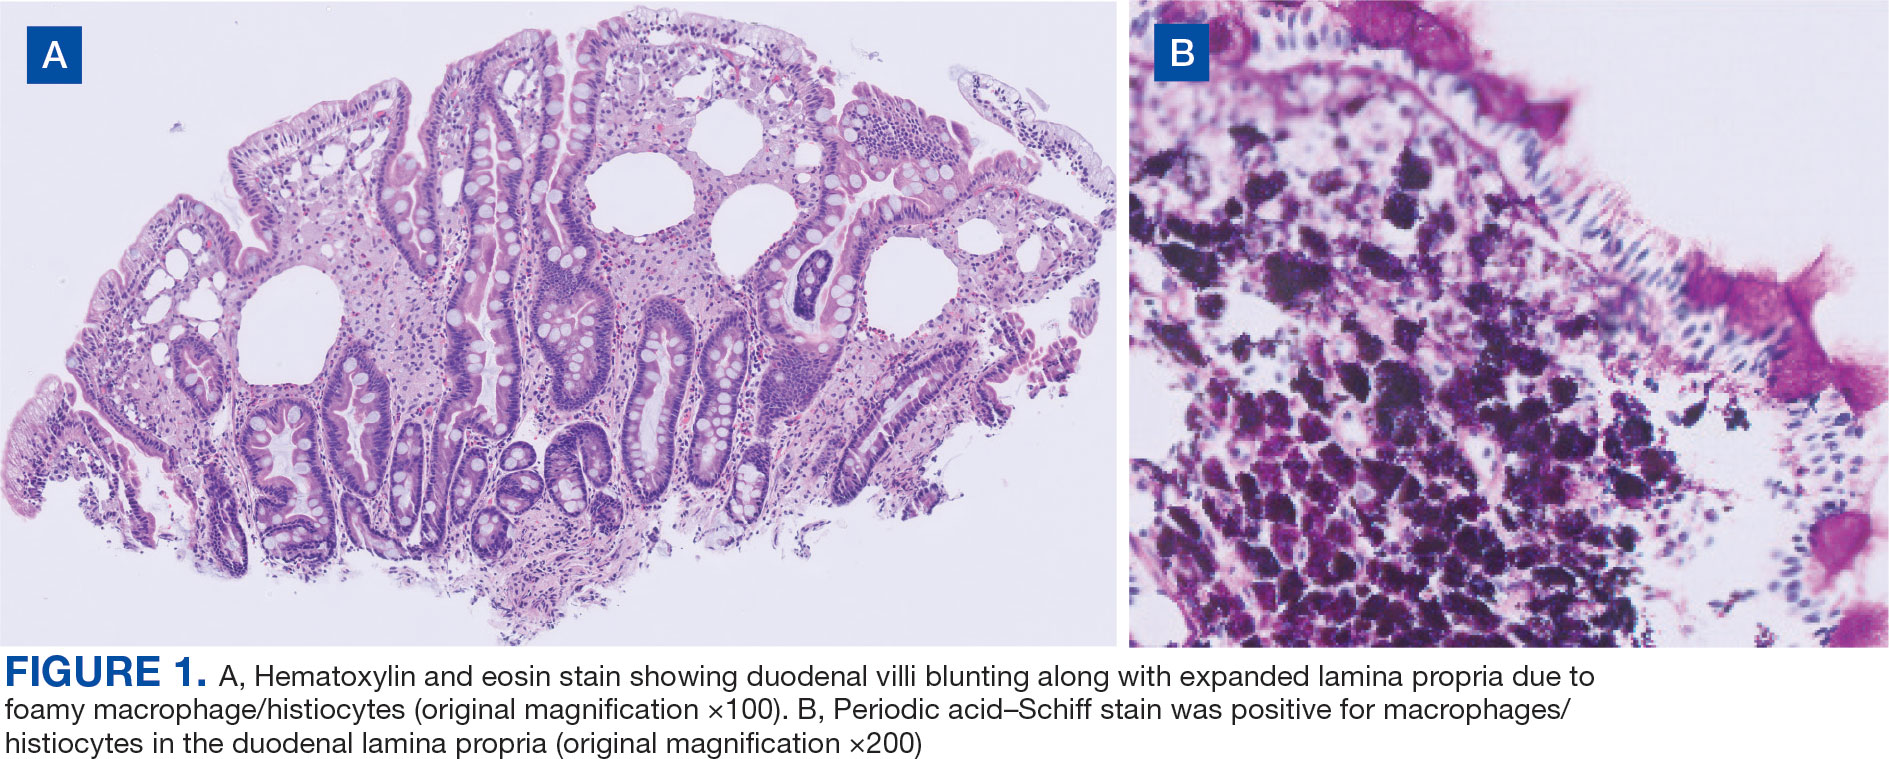
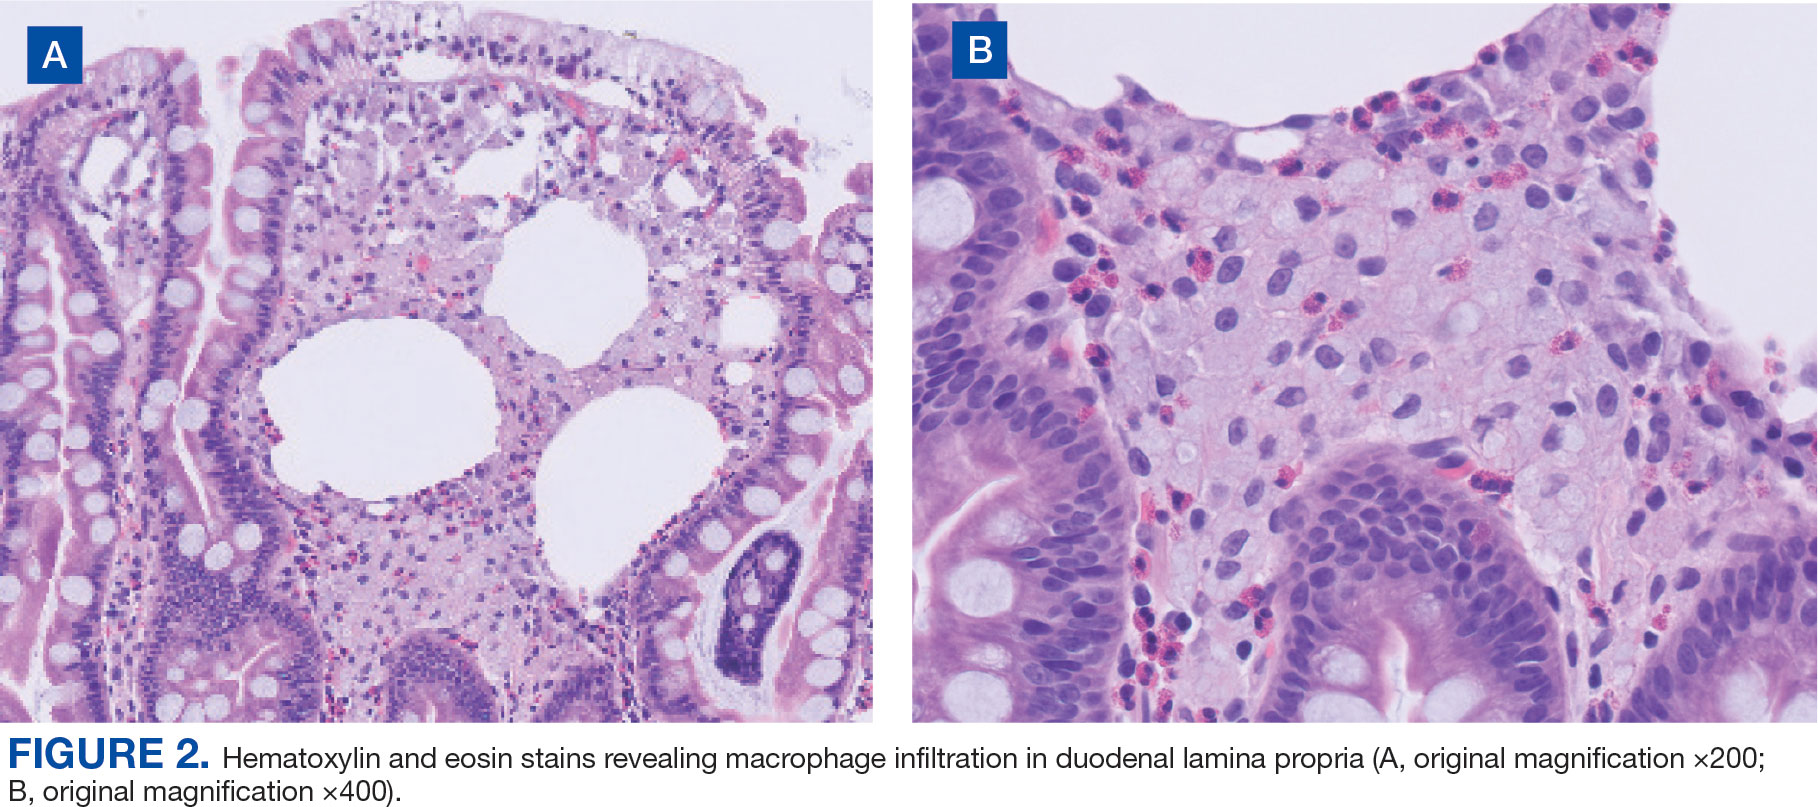
We treated the patient’s giardiasis with a single dose of oral tinidazole 2 g. To treat Whipple disease with central nervous system (CNS) involvement, we started the patient on ceftriaxone 2 g intravenous every 24 hours for 4 weeks, followed by oral trimethoprim and sulfamethoxazole (TMPSMX) 160/800 mg twice daily with an expected 1-year course.
Two months into TMP-SMX therapy, the patient developed an acute kidney injury with hyperkalemia (potassium, 5.5 mEq/L). We transitioned the therapy to doxycycline 100 mg twice daily and hydroxychloroquine 200 mg orally 3 times daily to complete 18 months of therapy. A lumbar puncture for CSF PCR and duodenal biopsy was planned for 6 months and 1 year after diagnosis.
Discussion
Whipple disease is often overlooked when making a diagnosis due to the nonspecific nature of its associated signs and symptoms. Classic Whipple disease has 2 stages: an initial prodromal stage marked by intermittent arthralgias, followed by a second gastrointestinal stage that involves chronic diarrhea, abdominal pain, and weight loss.1-3 Infection can sometimes be misdiagnosed as seronegative rheumatoid arthritis and a definite diagnosis can be missed for extended periods, with 1 case taking up to 8 years to diagnose after the first joint manifestations.2,4,5 Blood culture-negative endocarditis has also been well documented.1-5
The most common CNS clinical manifestations of Whipple disease include cognitive changes (eg, dementia), ocular movement disturbances (eg, oculomasticatory myorhythmia, which is pathognomonic for Whipple disease), involuntary movements, and hypothalamic dysfunction.1,6 Other neurologic symptoms include seizures, ataxia, meningitis, and myelopathy. Cerebrospinal fluid studies vary, with some results being normal and others revealing elevated protein counts.1
Disease Course
A retrospective study by Compain and colleagues reports that Whipple disease follows 3 patterns of clinical CNS involvement: classic Whipple disease with neurologic involvement, Whipple disease with isolated neurologic involvement, and neurologic relapse of previously treated Whipple disease.6 Isolated neurologic involvement is roughly 4% to 8%.6-8 Previous studies showed that the average delay from the presentation of neurologic symptoms to diagnosis is about 30 months.9
Diagnosis can be made with histologic evaluation of duodenal tissue using hematoxylin-eosin and PAS stains, which reveal foamy macrophages in expanded duodenal lamina propria, along with a positive tissue PCR.1,5 The slow replication rate of T. whipplei limits the effectiveness of bacterial cultures. After adequate treatment, relapses are still possible and regularly involve the CNS.1,4
Treatment typically involves blood-brain barrier-crossing agents, such as 2 weeks of meropenem 1 g every 24 hours or 2 to 4 weeks of ceftriaxone 2 g every 24 hours, followed by 1 year of TMP-SMX 160/800 mg twice daily. Doxycycline 100 mg twice daily and hydroxychloroquine 200 mg orally 3 times daily have also been shown to be effective, as seen in our patient.
Mortality rates vary for patients with Whipple disease and CNS involvement. One study reported poor overall prognosis in patients with CNS involvement, with mortality rates as high as 27%.10 However, rates of early detection and appropriate treatment may be improving, with 1 case series reporting 11% mortality in 18 patients with Whipple disease.6
Diagnosis
Because Whipple disease mimics many other diseases, misdiagnosis as infectious and noninfectious etiologies is common. PAS stain and tissue PCR helped uncover Whipple disease in a patient erroneously diagnosed with refractory Crohn disease.11
Weight loss, diarrhea, arthralgias, and cognitive impairment can also be seen in celiac disease. However, dermatologic manifestations, metabolic bone disease, and vitamin deficiencies are characteristics of celiac disease and can help distinguish it from T. whipplei infection.12
Whipple disease can also be mistaken for tropical sprue. Both can manifest with chronic diarrhea and duodenal villous atrophy; however, tropical sprue is more prevalent in specific geographic areas, and clinical manifestations are primarily gastrointestinal. Weight loss, diarrhea, steatorrhea, and folate deficiency are unique findings in tropical sprue that help differentiate it from Whipple disease.13 Likewise, other infectious diseases can be misdiagnosed as Whipple disease. Duodenal villi blunting and positive PAS staining have been reported in a Mycobacterium avium complex intestinal infection in a patient with AIDS, leading to a misdiagnosis of Whipple disease.14
Some parasitic infections have gastrointestinal symptoms similar to those of Whipple disease and others, such as giardiasis, are known to occur concurrently with Whipple disease.15-17 Giardiasis can also account for weight loss, malabsorptive symptoms, and greasy diarrhea. One case report hypothesized that 1 disease may predispose individuals to the other, as they both affect villous architecture.17 Additional research is needed to determine where the case reports have left off and to explore the connection between the 2 conditions.
Conclusions
The diagnosis of Whipple disease is challenging and frequently missed due to the rare and protean nature of the disease. This case highlights the importance of clinical suspicion for Whipple disease, especially in patients presenting with chronic seronegative arthritis, gastrointestinal abnormalities, and cognitive changes. Furthermore, this case points to the importance of additional testing for Whipple disease, even when a concurrent infection, such as giardiasis, has been identified.
- Biagi F, Balduzzi D, Delvino P, Schiepatti A, Klersy C, Corazza GR. Prevalence of Whipple’s disease in north-western Italy. Eur J Clin Microbiol Infect Dis. 2015;34(7):1347-1348. doi:10.1007/s10096-015-2357-2
- Fenollar F, Puéchal X, Raoult D. Whipple’s disease. N Engl J Med. 2007;356(1):55-66. doi:10.1056/NEJMra062477
- El-Abassi R, Soliman MY, Williams F, England JD. Whipple’s disease. J Neurol Sci. 2017;377:197-206. doi:10.1016/j.jns.2017.01.048
- Melas N, Amin R, Gyllemark P, Younes AH, Almer S. Whipple’s disease: the great masquerader-a high level of suspicion is the key to diagnosis. BMC Gastroenterol. 2021;21(1):128. doi:10.1186/s12876-021-01664-1
- Boumaza A, Azzouz EB, Arrindell J, Lepidi H, Mezouar S, Desnues B. Whipple’s disease and Tropheryma whipplei infections: from bench to bedside. Lancet Infect Dis. 2022;22(10):e280-e291. doi:10.1016/S1473-3099(22)00128-1
- Compain C, Sacre K, Puéchal X, et al. Central nervous system involvement in Whipple disease: clinical study of 18 patients and long-term follow-up. Medicine (Baltimore). 2013;92(6):324-330. doi:10.1097/MD.0000000000000010
- Anderson M. Neurology of Whipple’s disease. J Neurol Neurosurg Psychiatry. 2000;68(1):2-5. doi:10.1136/jnnp.68.1.2
- Gerard A, Sarrot-Reynauld F, Liozon E, et al. Neurologic presentation of Whipple disease: report of 12 cases and review of the literature. Medicine (Baltimore). 2002;81(6):443-457. doi:10.1097/00005792-200211000-00005
- Durand DV, Lecomte C, Cathébras P, Rousset H, Godeau P. Whipple disease. Clinical review of 52 cases. The SNFMI Research Group on Whipple Disease. Société Nationale Française de Médecine Interne. Medicine (Baltimore). 1997;76(3):170-184. doi:10.1097/00005792-199705000-00003
- Schnider PJ, Reisinger EC, Gerschlager W, et al. Long-term follow-up in cerebral Whipple’s disease. Eur J Gastroenterol Hepatol. 1996;8(9):899-903.
- Klochan C, Anderson TA, Rose D, Dimitrov RK, Johnson RM. Nearly fatal case of Whipple’s disease in a patient mistakenly on anti-TNF therapy. ACG Case Rep J. 2013;1(1):25-28. doi:10.14309/crj.2013.11
- . Therrien A, Kelly CP, Silvester JA. Celiac disease: extraintestinal manifestations and associated conditions. J Clin Gastroenterol. 2020;54(1):8-21. doi:10.1097/MCG.0000000000001267
- Murray JA, Rubio-Tapia A. Diarrhoea due to small bowel diseases. Best Pract Res Clin Gastroenterol. 2012;26(5):581-600. doi:10.1016/j.bpg.2012.11.013
- Chirayath S, Bin Liaquat H, Bahirwani J, Labeeb A, Chaput K, Kaza C. Mycobacterium avium complex infection imitating Whipple disease in an immunocompromised patient with newly diagnosed acquired immunodeficiency syn - drome. ACG Case Rep J. 2021;8(5):e00588. doi:10.14309/crj.0000000000000588
- Fenollar F, Lepidi H, Gérolami R, Drancourt M, Raoult D. Whipple disease associated with giardiasis. J Infect Dis. 2003;188(6):828-834. doi:10.1086/378093
- Ruiz JAG, Simón PG, Aparicio Duque R, Mayor Jerez JL. Association between Whipple’s disease and Giardia lamblia infection. Rev Esp Enferm Dig. 2005;97(7)521-526. doi:10.4321/s1130-01082005000700007
- Gisbertz IA, Bergmans DC, van Marion-Kievit JA, Haak HR. Concurrent Whipple’s disease and Giardia lamblia infection in a patient presenting with weight loss. Eur J Intern Med. 2001;12(6):525-528. doi:10.1016/s0953-6205(01)00165-0
Whipple disease is a chronic, rare, infectious disease that manifests with systemic symptoms. This disease is caused by the gram-positive bacterium Tropheryma whipplei (T. whipplei). Common manifestations include gastrointestinal symptoms indicative of malabsorption, such as chronic diarrhea, unintentional weight loss (despite normal nutrient intake), and greasy, voluminous, foul-smelling stool. Other, less common manifestations include cardiovascular, endocrine, musculoskeletal, neurologic, and renal signs and symptoms. The prevalence of the disease is rare, affecting 3 in 1 million patients.1 This case highlights the importance of considering Whipple disease when treating patients with multiple symptoms and concurrent disease processes.
Case Presentation
A 53-year-old male with a medical history of hypertension, hyperlipidemia, hypothyroidism, and microcytic anemia presented with an 8-month history of persistent diarrhea associated with abdominal bloating, abdominal discomfort, and a 30-lb weight loss. He also reported fatigue, headaches, inability to concentrate, memory distortion, and visual disturbances involving flashes and floaters. The patient reported no fever, chills, nuchal rigidity, or prior neurologic symptoms. He reported intermittent bilateral hand and knee arthralgias. An autoimmune evaluation for arthralgia was negative, and a prior colonoscopy had been normal.
The patient’s hobbies included gardening, hiking, fishing, and deer hunting in Wyoming and Texas. He had spent time around cattle, dogs, and cats. He consumed alcohol twice weekly but reported no tobacco or illicit drug use or recent international travel. The patient’s family history was positive for rheumatoid arthritis, diabetes mellitus, and hypertension.
The patient’s vital signs were all within reference ranges, and lung auscultation revealed clear breathing sounds with no cardiac murmurs, gallops, or rubs. An abdominal examination revealed decreased bowel sounds, while the rest of the physical examination was otherwise normal.
Initial laboratory results showed that his sodium was 134 mEq/L (reference range, 136-145 mEq/L), hemoglobin was 9.3 g/dL (reference range for men, 14.0-18.0 g/dL), and hematocrit was 30.7% (reference range for men 42%-52%). His white blood cell (WBC) count and thyroid-stimulating hormone level were within normal limits. A cerebrospinal fluid (CSF) analysis revealed the following: WBCs 1.0/μL (0-5/μL), segmented neutrophils 10% (reference range, 7%), lymphocytes 80% (reference range, 40-80%), macrophages 10% (reference range, 2%), red blood cells 3 × 10⁶ /μL (reference range, 4.3- 5.9 × 10⁶ /µL), protein 23.5 mg/dL (reference range, 15-60 mg/dL), and glucose 44 mg/dL (reference range, 50-80 mg/dL).
Upper endoscopy with duodenal biopsy showed benign duodenal mucosa. Histopathologic evaluation revealed abundant foamy macrophages within lamina propria. Periodic acid–Schiff (PAS) stain was positive, diastase-resistant material was visualized within the macrophages (Figures 1 and 2). Polymerase chain reaction (PCR) testing of duodenal biopsy tissue was positive for T. whipplei. A lumbar puncture was performed, and PCR testing of CSF for T. whipplei was also positive. A stool PCR test was positive for Giardia. Transthoracic echocardiogram and brain magnetic resonance imaging were normal.
We treated the patient’s giardiasis with a single dose of oral tinidazole 2 g. To treat Whipple disease with central nervous system (CNS) involvement, we started the patient on ceftriaxone 2 g intravenous every 24 hours for 4 weeks, followed by oral trimethoprim and sulfamethoxazole (TMPSMX) 160/800 mg twice daily with an expected 1-year course.
Two months into TMP-SMX therapy, the patient developed an acute kidney injury with hyperkalemia (potassium, 5.5 mEq/L). We transitioned the therapy to doxycycline 100 mg twice daily and hydroxychloroquine 200 mg orally 3 times daily to complete 18 months of therapy. A lumbar puncture for CSF PCR and duodenal biopsy was planned for 6 months and 1 year after diagnosis.
Discussion
Whipple disease is often overlooked when making a diagnosis due to the nonspecific nature of its associated signs and symptoms. Classic Whipple disease has 2 stages: an initial prodromal stage marked by intermittent arthralgias, followed by a second gastrointestinal stage that involves chronic diarrhea, abdominal pain, and weight loss.1-3 Infection can sometimes be misdiagnosed as seronegative rheumatoid arthritis and a definite diagnosis can be missed for extended periods, with 1 case taking up to 8 years to diagnose after the first joint manifestations.2,4,5 Blood culture-negative endocarditis has also been well documented.1-5
The most common CNS clinical manifestations of Whipple disease include cognitive changes (eg, dementia), ocular movement disturbances (eg, oculomasticatory myorhythmia, which is pathognomonic for Whipple disease), involuntary movements, and hypothalamic dysfunction.1,6 Other neurologic symptoms include seizures, ataxia, meningitis, and myelopathy. Cerebrospinal fluid studies vary, with some results being normal and others revealing elevated protein counts.1
Disease Course
A retrospective study by Compain and colleagues reports that Whipple disease follows 3 patterns of clinical CNS involvement: classic Whipple disease with neurologic involvement, Whipple disease with isolated neurologic involvement, and neurologic relapse of previously treated Whipple disease.6 Isolated neurologic involvement is roughly 4% to 8%.6-8 Previous studies showed that the average delay from the presentation of neurologic symptoms to diagnosis is about 30 months.9
Diagnosis can be made with histologic evaluation of duodenal tissue using hematoxylin-eosin and PAS stains, which reveal foamy macrophages in expanded duodenal lamina propria, along with a positive tissue PCR.1,5 The slow replication rate of T. whipplei limits the effectiveness of bacterial cultures. After adequate treatment, relapses are still possible and regularly involve the CNS.1,4
Treatment typically involves blood-brain barrier-crossing agents, such as 2 weeks of meropenem 1 g every 24 hours or 2 to 4 weeks of ceftriaxone 2 g every 24 hours, followed by 1 year of TMP-SMX 160/800 mg twice daily. Doxycycline 100 mg twice daily and hydroxychloroquine 200 mg orally 3 times daily have also been shown to be effective, as seen in our patient.
Mortality rates vary for patients with Whipple disease and CNS involvement. One study reported poor overall prognosis in patients with CNS involvement, with mortality rates as high as 27%.10 However, rates of early detection and appropriate treatment may be improving, with 1 case series reporting 11% mortality in 18 patients with Whipple disease.6
Diagnosis
Because Whipple disease mimics many other diseases, misdiagnosis as infectious and noninfectious etiologies is common. PAS stain and tissue PCR helped uncover Whipple disease in a patient erroneously diagnosed with refractory Crohn disease.11
Weight loss, diarrhea, arthralgias, and cognitive impairment can also be seen in celiac disease. However, dermatologic manifestations, metabolic bone disease, and vitamin deficiencies are characteristics of celiac disease and can help distinguish it from T. whipplei infection.12
Whipple disease can also be mistaken for tropical sprue. Both can manifest with chronic diarrhea and duodenal villous atrophy; however, tropical sprue is more prevalent in specific geographic areas, and clinical manifestations are primarily gastrointestinal. Weight loss, diarrhea, steatorrhea, and folate deficiency are unique findings in tropical sprue that help differentiate it from Whipple disease.13 Likewise, other infectious diseases can be misdiagnosed as Whipple disease. Duodenal villi blunting and positive PAS staining have been reported in a Mycobacterium avium complex intestinal infection in a patient with AIDS, leading to a misdiagnosis of Whipple disease.14
Some parasitic infections have gastrointestinal symptoms similar to those of Whipple disease and others, such as giardiasis, are known to occur concurrently with Whipple disease.15-17 Giardiasis can also account for weight loss, malabsorptive symptoms, and greasy diarrhea. One case report hypothesized that 1 disease may predispose individuals to the other, as they both affect villous architecture.17 Additional research is needed to determine where the case reports have left off and to explore the connection between the 2 conditions.
Conclusions
The diagnosis of Whipple disease is challenging and frequently missed due to the rare and protean nature of the disease. This case highlights the importance of clinical suspicion for Whipple disease, especially in patients presenting with chronic seronegative arthritis, gastrointestinal abnormalities, and cognitive changes. Furthermore, this case points to the importance of additional testing for Whipple disease, even when a concurrent infection, such as giardiasis, has been identified.
- Biagi F, Balduzzi D, Delvino P, Schiepatti A, Klersy C, Corazza GR. Prevalence of Whipple’s disease in north-western Italy. Eur J Clin Microbiol Infect Dis. 2015;34(7):1347-1348. doi:10.1007/s10096-015-2357-2
- Fenollar F, Puéchal X, Raoult D. Whipple’s disease. N Engl J Med. 2007;356(1):55-66. doi:10.1056/NEJMra062477
- El-Abassi R, Soliman MY, Williams F, England JD. Whipple’s disease. J Neurol Sci. 2017;377:197-206. doi:10.1016/j.jns.2017.01.048
- Melas N, Amin R, Gyllemark P, Younes AH, Almer S. Whipple’s disease: the great masquerader-a high level of suspicion is the key to diagnosis. BMC Gastroenterol. 2021;21(1):128. doi:10.1186/s12876-021-01664-1
- Boumaza A, Azzouz EB, Arrindell J, Lepidi H, Mezouar S, Desnues B. Whipple’s disease and Tropheryma whipplei infections: from bench to bedside. Lancet Infect Dis. 2022;22(10):e280-e291. doi:10.1016/S1473-3099(22)00128-1
- Compain C, Sacre K, Puéchal X, et al. Central nervous system involvement in Whipple disease: clinical study of 18 patients and long-term follow-up. Medicine (Baltimore). 2013;92(6):324-330. doi:10.1097/MD.0000000000000010
- Anderson M. Neurology of Whipple’s disease. J Neurol Neurosurg Psychiatry. 2000;68(1):2-5. doi:10.1136/jnnp.68.1.2
- Gerard A, Sarrot-Reynauld F, Liozon E, et al. Neurologic presentation of Whipple disease: report of 12 cases and review of the literature. Medicine (Baltimore). 2002;81(6):443-457. doi:10.1097/00005792-200211000-00005
- Durand DV, Lecomte C, Cathébras P, Rousset H, Godeau P. Whipple disease. Clinical review of 52 cases. The SNFMI Research Group on Whipple Disease. Société Nationale Française de Médecine Interne. Medicine (Baltimore). 1997;76(3):170-184. doi:10.1097/00005792-199705000-00003
- Schnider PJ, Reisinger EC, Gerschlager W, et al. Long-term follow-up in cerebral Whipple’s disease. Eur J Gastroenterol Hepatol. 1996;8(9):899-903.
- Klochan C, Anderson TA, Rose D, Dimitrov RK, Johnson RM. Nearly fatal case of Whipple’s disease in a patient mistakenly on anti-TNF therapy. ACG Case Rep J. 2013;1(1):25-28. doi:10.14309/crj.2013.11
- . Therrien A, Kelly CP, Silvester JA. Celiac disease: extraintestinal manifestations and associated conditions. J Clin Gastroenterol. 2020;54(1):8-21. doi:10.1097/MCG.0000000000001267
- Murray JA, Rubio-Tapia A. Diarrhoea due to small bowel diseases. Best Pract Res Clin Gastroenterol. 2012;26(5):581-600. doi:10.1016/j.bpg.2012.11.013
- Chirayath S, Bin Liaquat H, Bahirwani J, Labeeb A, Chaput K, Kaza C. Mycobacterium avium complex infection imitating Whipple disease in an immunocompromised patient with newly diagnosed acquired immunodeficiency syn - drome. ACG Case Rep J. 2021;8(5):e00588. doi:10.14309/crj.0000000000000588
- Fenollar F, Lepidi H, Gérolami R, Drancourt M, Raoult D. Whipple disease associated with giardiasis. J Infect Dis. 2003;188(6):828-834. doi:10.1086/378093
- Ruiz JAG, Simón PG, Aparicio Duque R, Mayor Jerez JL. Association between Whipple’s disease and Giardia lamblia infection. Rev Esp Enferm Dig. 2005;97(7)521-526. doi:10.4321/s1130-01082005000700007
- Gisbertz IA, Bergmans DC, van Marion-Kievit JA, Haak HR. Concurrent Whipple’s disease and Giardia lamblia infection in a patient presenting with weight loss. Eur J Intern Med. 2001;12(6):525-528. doi:10.1016/s0953-6205(01)00165-0
Whipple Disease With Central Nervous System Involvement
Whipple Disease With Central Nervous System Involvement

Pharmacist-Driven Deprescribing to Reduce Anticholinergic Burden in Veterans With Dementia
Pharmacist-Driven Deprescribing to Reduce Anticholinergic Burden in Veterans With Dementia
Anticholinergic medications block the activity of the neurotransmitter acetylcholine by binding to either muscarinic or nicotinic receptors in both the peripheral and central nervous system. Anticholinergic medications typically refer to antimuscarinic medications and have been prescribed to treat a variety of conditions common in older adults, including overactive bladder, allergies, muscle spasms, and sleep disorders.1,2 Since muscarinic receptors are present throughout the body, anticholinergic medications are associated with many adverse effects (AEs), including constipation, urinary retention, xerostomia, and delirium. Older adults are more sensitive to these AEs due to physiological changes associated with aging.1
The American Geriatric Society Beers Criteria for Potentially Inappropriate Medications Use in Older Adults identifies drugs with strong anticholinergic properties. The Beers Criteria strongly recommends avoiding these medications in patients with dementia or cognitive impairment due to the risk of central nervous system AEs. In the updated 2023 Beers Criteria, the rationale was expanded to recognize the risks of the cumulative anticholinergic burden associated with concurrent anticholinergic use.3,4
Given the prevalent use of anticholinergic medications in older adults, there has been significant research demonstrating their AEs, specifically delirium and cognitive impairment in geriatric patients. A systematic review of 14 articles conducted in 7 different countries of patients with median age of 76.4 to 86.1 years reviewed clinical outcomes of anticholinergic use in patients with dementia. Five studies found anticholinergics were associated with increased all-cause mortality in patients with dementia, and 3 studies found anticholinergics were associated with longer hospital stays. Other studies found that anticholinergics were associated with delirium and reduced health-related quality of life.5
About 35% of veterans with dementia have been prescribed a medication regimen with a high anticholinergic burden.6 In 2018, the US Department of Veterans Affairs (VA) Pharmacy Benfits Management Center for Medical Safety completed a centrally aggregated medication use evaluation (CAMUE) to assess the appropriateness of anticholinergic medication use in patients with dementia. The retrospective chart review included 1094 veterans from 19 sites. Overall, about 15% of the veterans experienced new falls, delirium, or worsening dementia within 30 days of starting an anticholinergic medication. Furthermore, < 40% had documentation of a nonanticholinergic alternative medication trial, and < 20% had documented nonpharmacologic therapy. The documentation of risk-benefit assessment acknowledging the risks of anticholinergic medication use in veterans with dementia occurred only about 13% of the time. The CAMUE concluded that the risks of initiating an anticholinergic medication in veterans with dementia are likely underdocumented and possibly under considered by prescribers.7
Developed within the Veterans Health Administration (VHA), VIONE (Vital, Important, Optional, Not Indicated, Every medication has an indication) is a medication management methodology that aims to reduce polypharmacy and improve patient safety consistent with high-reliability organizations. Since it launched in 2016, VIONE has gradually been implemented at many VHA facilities. The VIONE deprescribing dashboard had not been used at the VA Louisville Healthcare System prior to this quality improvement project.
This dashboard uses the Beers Criteria to identify potentially inappropriate anticholinergic medications. It uses the Anticholinergic Cognitive Burden (ACB) scale to calculate the cumulative anticholinergic risk for each patient. Medications with an ACB score of 2 or 3 have clinically relevant cognitive effects such as delirium and dementia (Table 1). For each point increase in total ACB score, a decline in mini-mental state examination score of 0.33 points over 2 years has been shown. Each point increase has also been correlated with a 26% increase in risk of death.8-10
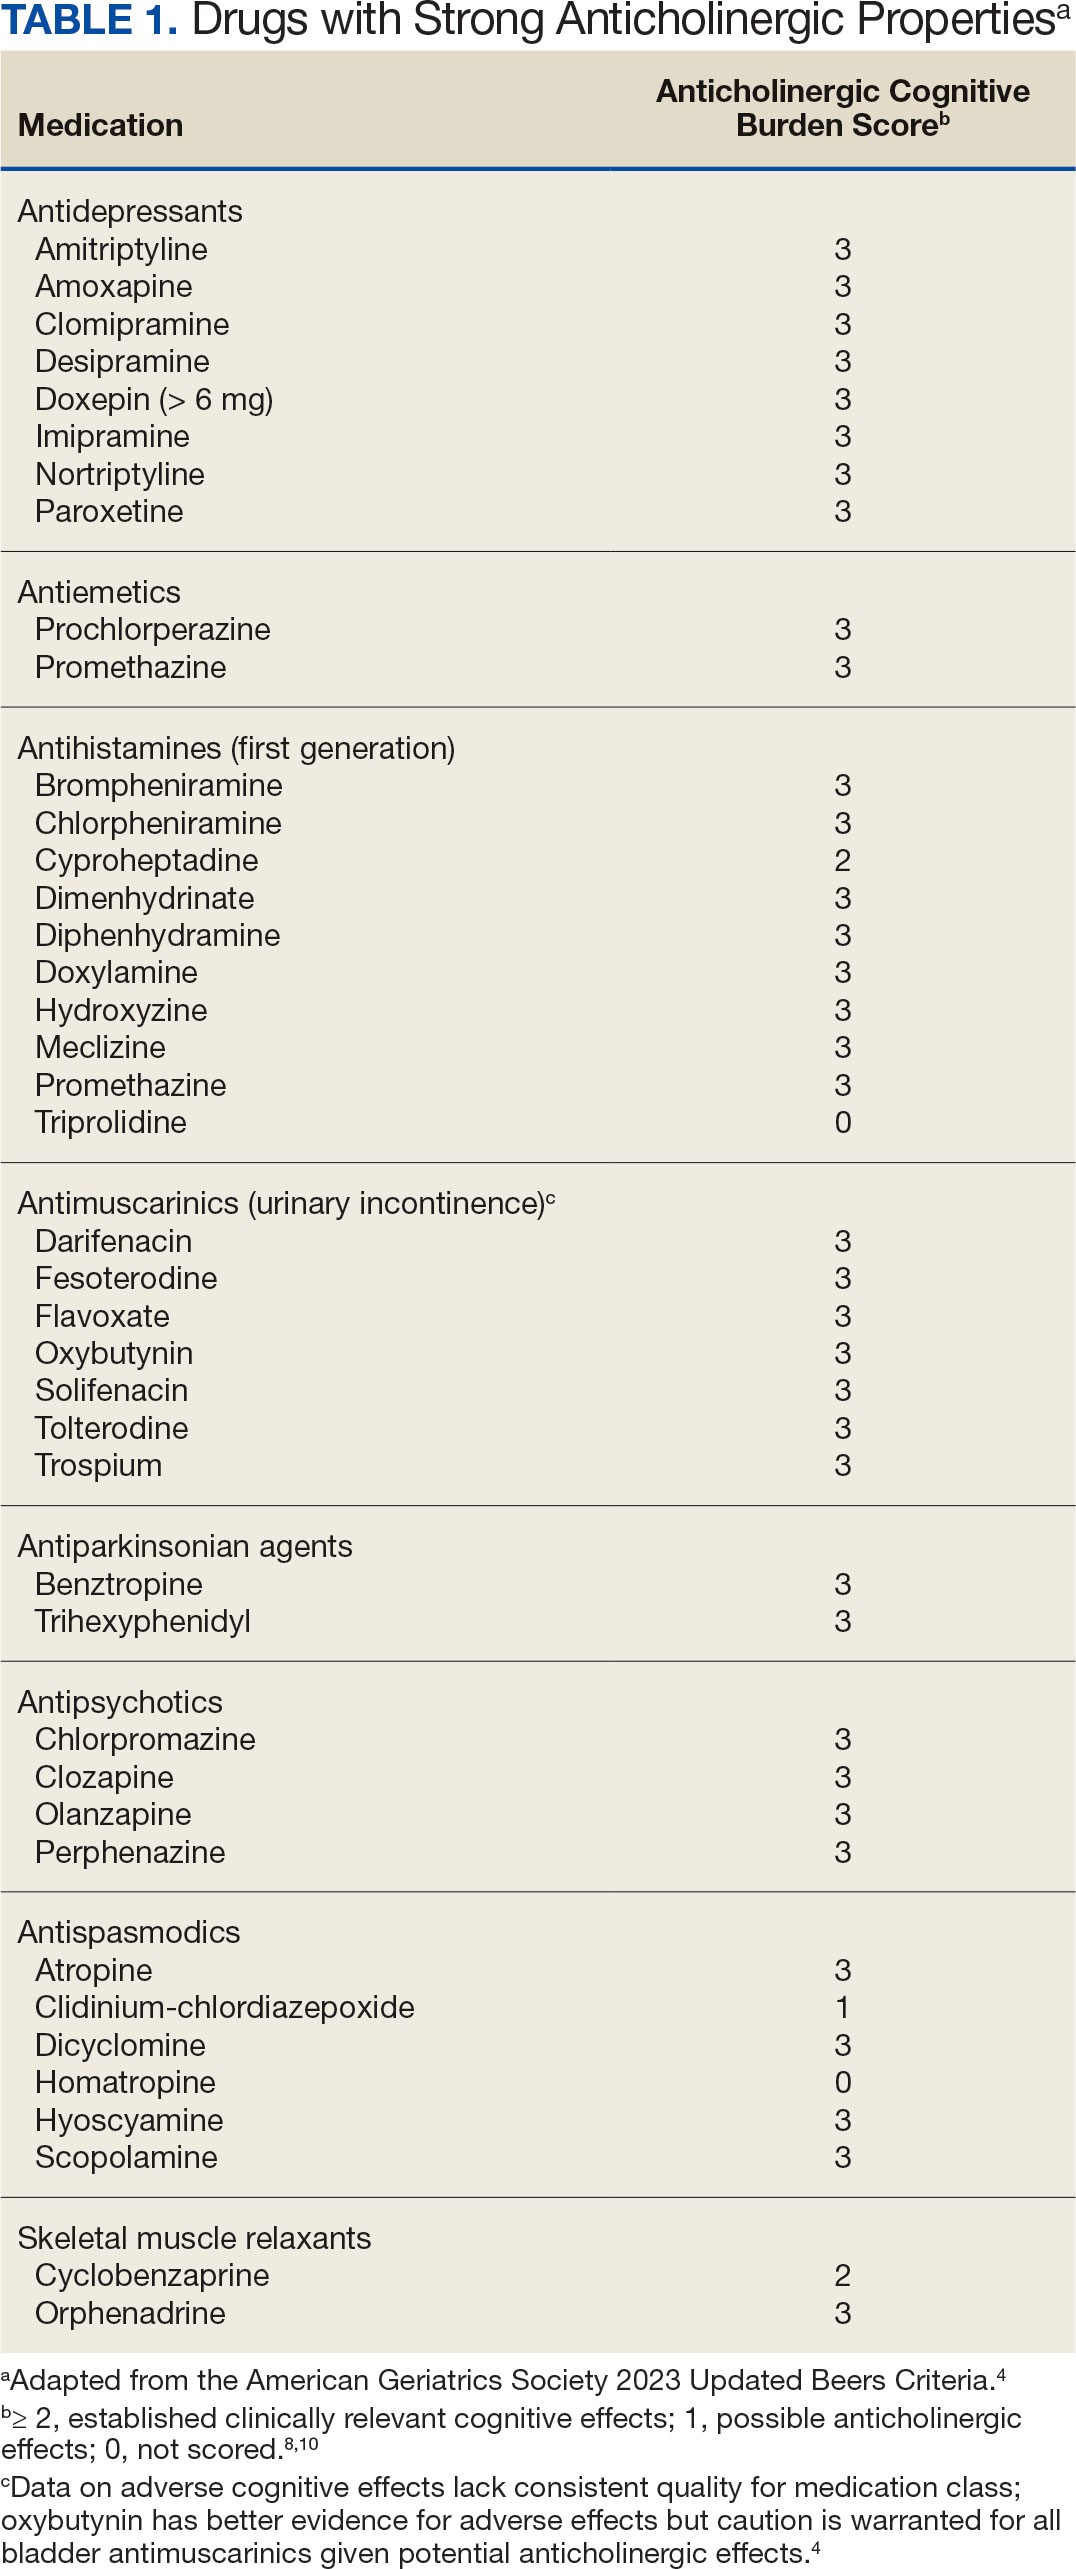
Methods
The purpose of this quality improvement project was to determine the impact of pharmacist-driven deprescribing on the anticholinergic burden in veterans with dementia at VA Louisville Healthcare System. Data were obtained through the Computerized Patient Record System (CPRS) and VIONE deprescribing dashboard and entered in a secure Microsoft Excel spreadsheet. Pharmacist deprescribing steps were entered as CPRS progress notes. A deprescribing note template was created, and 11 templates with indication-specific recommendations were created for each anticholinergic indication identified (contact authors for deprescribing note template examples). Usage of anticholinergic medications was reexamined 3 months after the deprescribing note was entered.
Eligible patients identified in the VIONE deprescribing dashboard had an outpatient order for a medication with strong anticholinergic properties as identified using the Beers Criteria and were aged ≥ 65 years. Patients also had to be diagnosed with dementia or cognitive impairment. Patients were excluded if they were receiving hospice care or if the anticholinergic medication was from a non-VA prescriber or filled at a non-VA pharmacy. The VIONE deprescribing dashboard also excluded skeletal muscle relaxants if the patient had a spinal cord-related visit in the previous 2 years, first-generation antihistamines if the patient had a vertigo diagnosis, hydroxyzine if the indication was for anxiety, trospium if the indication was for overactive bladder, and antipsychotics if the patient had been diagnosed with schizophrenia or bipolar disorder. The following were included in the deprescribing recommendations if the dashboard identified the patient due to receiving a second strongly anticholinergic medication: first generation antihistamines if the patient was diagnosed with vertigo and hydroxyzine if the indication is for anxiety.
Each eligible patient received a focused medication review by a pharmacist via electronic chart review and a templated CPRS progress note with patient-specific recommendations. The prescriber and the patient’s primary care practitioner were recommended to perform a patient-specific risk-benefit assessment, deprescribe potentially inappropriate anticholinergic medications, and consider nonanticholinergic alternatives (both pharmacologic and nonpharmacologic). Data collected included baseline age, sex, prespecified comorbidities (type of dementia, cognitive impairment, delirium, benign prostatic hyperplasia/lower urinary tract symptoms), duration of prescribed anticholinergic medication, indication and deprescribing rate for each anticholinergic agent, and concurrent dementia medications (acetylcholinesterase inhibitors, memantine, or both).
The primary outcome was the number of patients that had = 1 medication with strong anticholinergic properties deprescribed. Deprescribing was defined as medication discontinuation or reduction of total daily dose. Secondary outcomes were the mean change in ACB scale, the number of patients with dose tapering, documented patient-specific risk-benefit assessment, and initiated nonanticholinergic alternative per pharmacist recommendation.
Results
The VIONE deprescribing dashboard identified 121 patients; 45 were excluded for non-VA prescriber or pharmacy, and 8 patients were excluded for other reasons. Sixty-eight patients were included in the deprescribing initiative. The mean age was 73.4 years (range, 67-93), 65 (96%) were male, and 34 (50%) had unspecified dementia (Table 2). Thirty-one patients (46%) had concurrent cholinesterase inhibitor prescriptions for dementia. The median duration of use of a strong anticholinergic medication was 11 months.
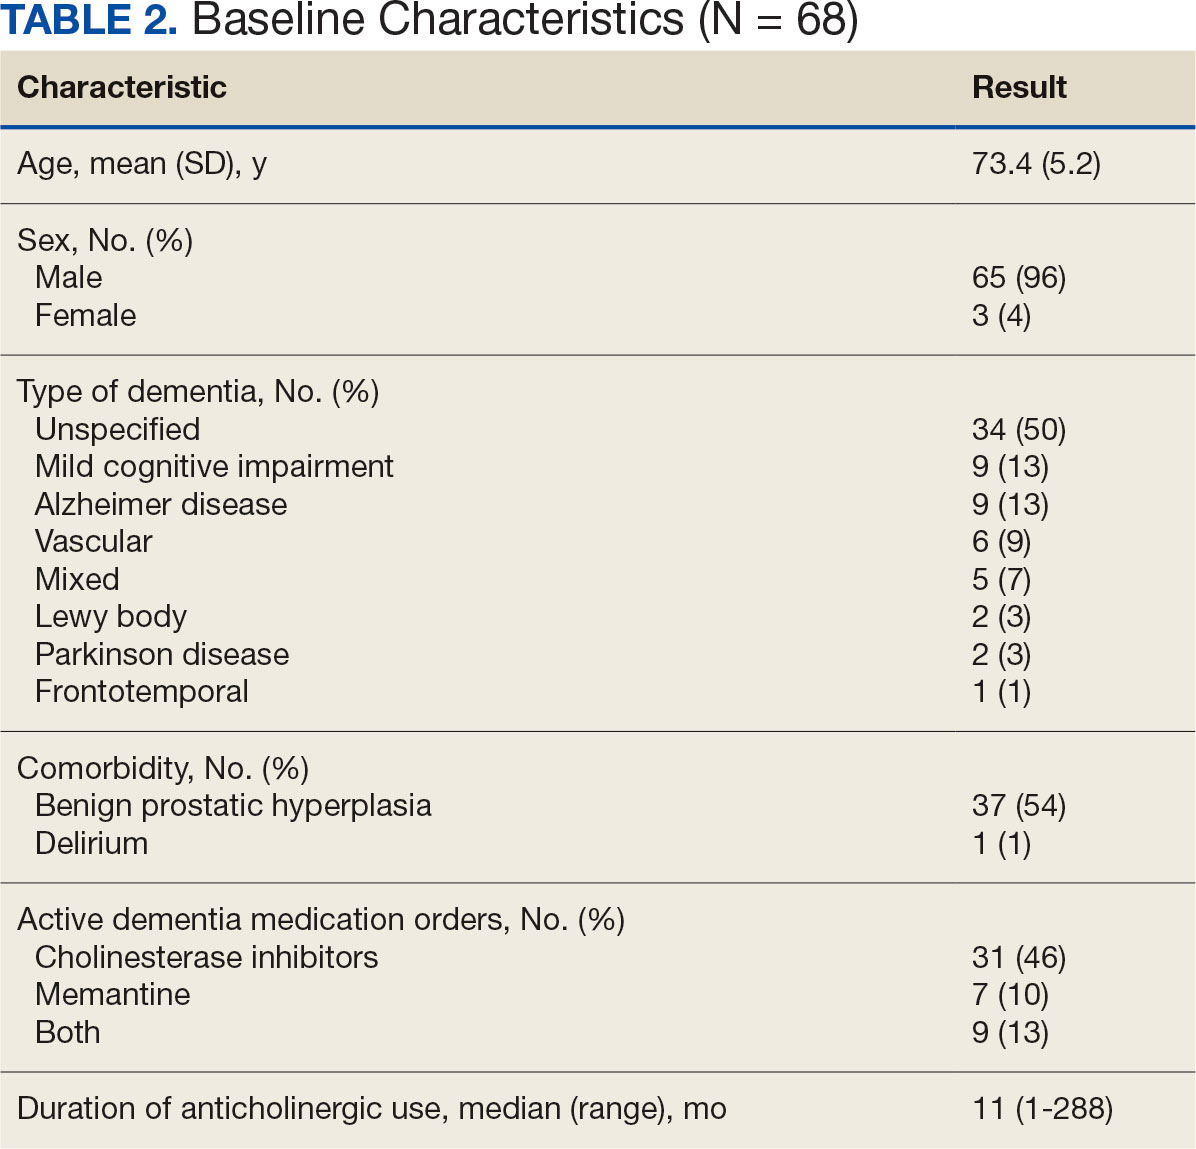
Twenty-nine patients (43%) had ≥ 1 medication with strong anticholinergic properties deprescribed. Anticholinergic medication was discontinued for 26 patients, and the dose was decreased for 3 patients. ACB score fell by a mean of 1.1 per patient. There was an increase in the documented risk-benefit assessment for anticholinergic medications from a baseline of 4 (6%) to 19 (28%) 3 months after the deprescribing note. Cyclobenzaprine, paroxetine, and oxybutynin were deprescribed the most, and amitriptyline had the lowest rate of deprescribing (Table 3). Thirty patients (44%) had a pharmacologic, nonanticholinergic alternative initiated per pharmacist recommendation, and 6 patients (9%) had a nonpharmacologic alternative initiated per pharmacist recommendation.
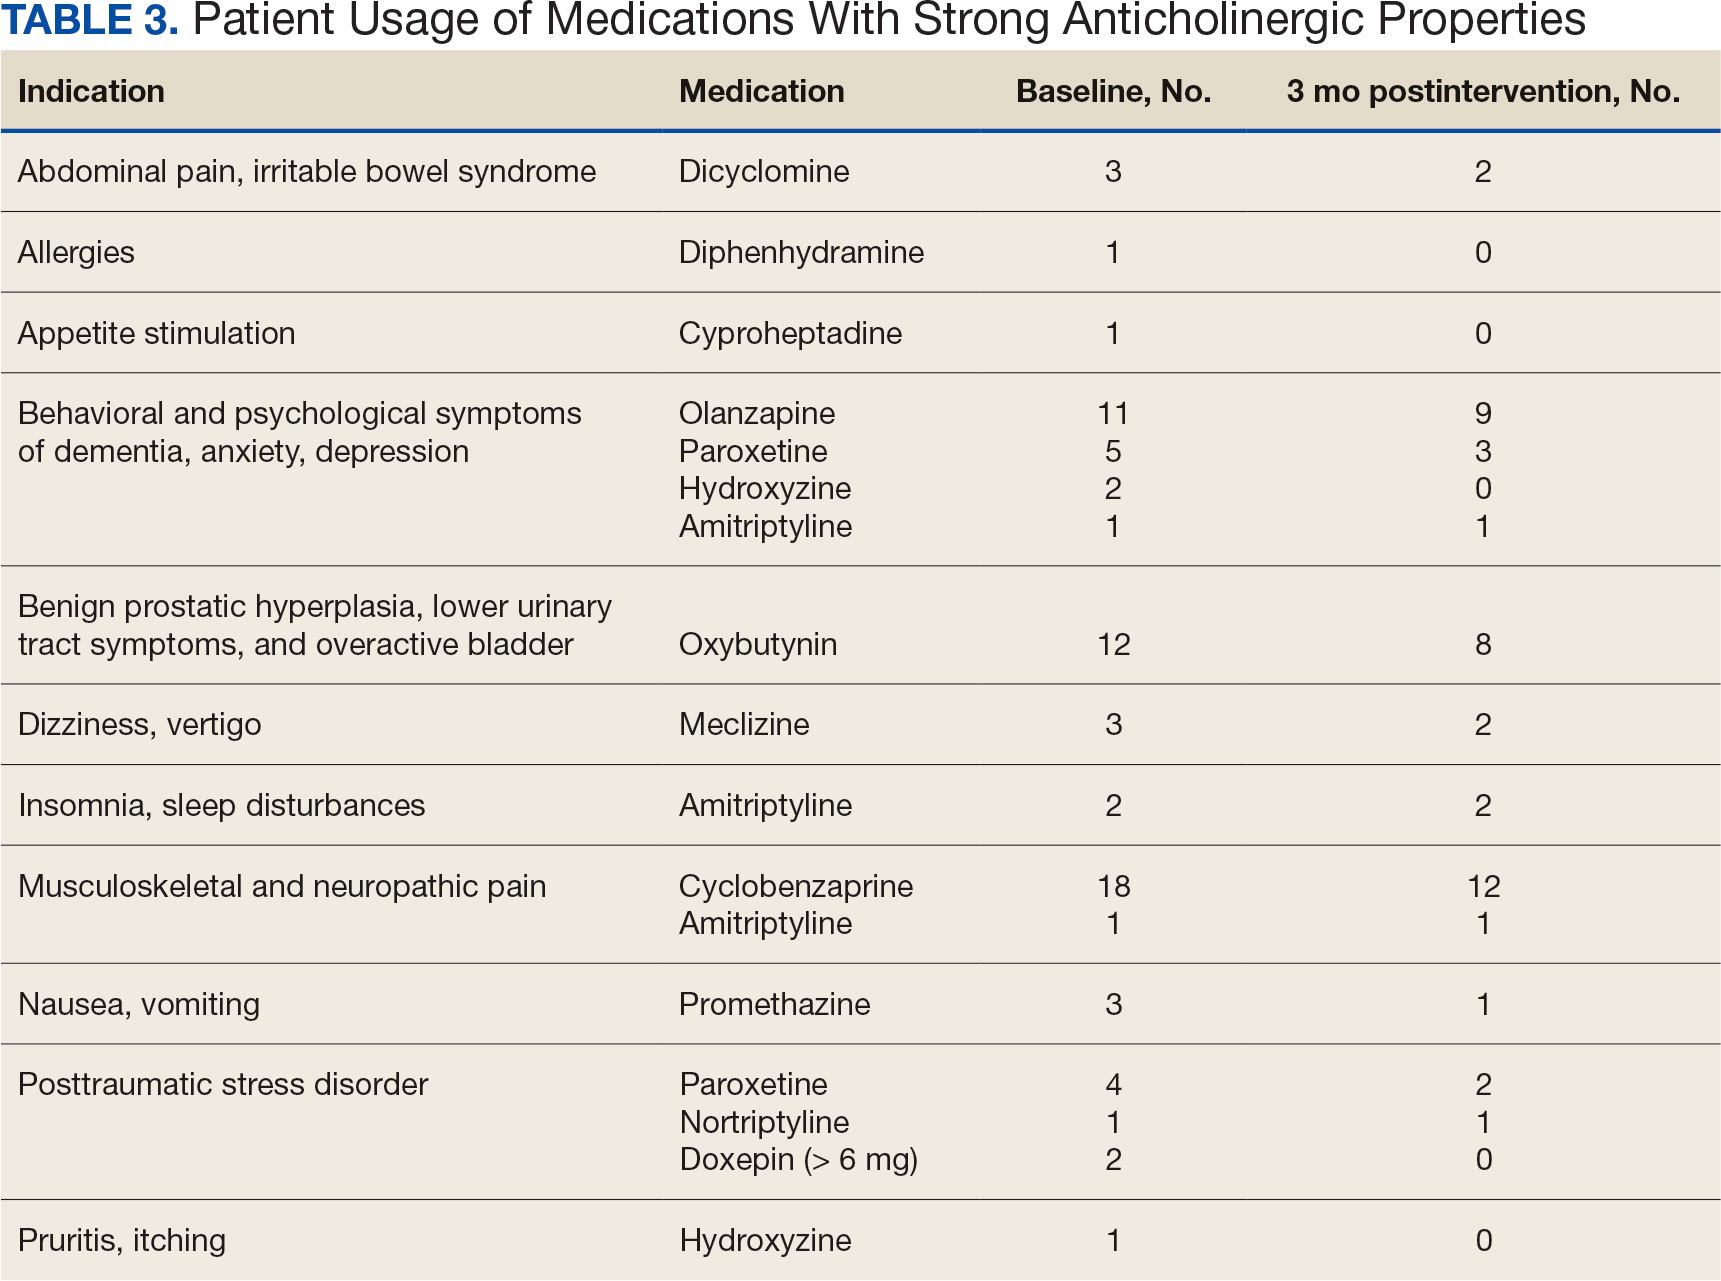
Discussion
This quality improvement project suggests that with the use of population health management tools such as the VIONE deprescribing dashboard, pharmacists can help identify and deprescribe strong anticholinergic medications in patients with cognitive impairment or dementia. Pharmacists can also aid in deprescribing through evidence-based recommendations to guide risk-benefit discussion and consider safer, nonanticholinergic alternatives. The authors were able to help reduce anticholinergic cognitive burden in 43% of patients in this sample. The mean 1.1 ACB score reduction was considered clinically significant based on prior studies that found that each 1-point increase in ACB score correlated with declined cognition and increased mortality.8,10 The VIONE deprescribing dashboard provided real-time patient data and helped target patients at the highest risk of anticholinergic AEs. The creation of the note templates based on the indication helped streamline recommendations. Typically, the prescriber addressed the recommendations at a routine follow-up appointment. The deprescribing method used in this project was time-efficient and could be easily replicated once the CPRS note templates were created. Future deprescribing projects could consider more direct pharmacist intervention and medication management.
Limitations
There was no direct assessment of clinical outcomes such as change in cognition using cognitive function tests. However, multiple studies have demonstrated AEs associated with strong anticholinergic medication use and additive anticholinergic burden in patients with dementia or cognitive impairment.1,5 Also, the 3-month follow-up period was relatively short. The pharmacist’s deprescribing recommendations may have been accepted after 3 months, or patients could have restarted their anticholinergic medications. Longer follow-up time could provide more robust results and conclusions. Thirdly, there was no formal definition of what constituted a risk-benefit assessment of anticholinergic medications. The risk-benefit assessment was determined at the discretion of the authors, which was subjective and allowed for bias. Finally, 6 patients died during the 3-month follow-up. The data for these patients were included in the baseline characteristics but not in the study outcomes. If these patients had been excluded from the results, a higher percentage of patients (47%) would have had ≥ 1 anticholinergic medication deprescribed.
Conclusions
In collaboration with the interdisciplinary team, pharmacist recommendations resulted in deprescribing of anticholinergic medications in veterans with dementia or cognitive impairment. The VIONE deprescribing dashboard, an easily accessible population health management tool, can identify patients prescribed potentially inappropriate medications and help target patients at the highest risk of anticholinergic AEs. To prevent worsening cognitive impairment, delirium, falls, and other AEs, this deprescribing initiative can be replicated at other VHA facilities. Future projects could have a longer follow-up period, incorporate more direct pharmacist intervention, and assess clinical outcomes of deprescribing.
- Gray SL, Hanlon JT. Anticholinergic medication use and dementia: latest evidence and clinical implications. Ther Adv Drug Saf. 2016;7(5):217-224. doi:10.1177/2042098616658399
- Kersten H, Wyller TB. Anticholinergic drug burden in older people’s brain - how well is it measured? Basic Clin Pharmacol Toxicol. 2014;114(2):151-159. doi:10.1111/bcpt.12140
- By the 2019 American Geriatrics Society Beers Criteria® Update Expert Panel. American Geriatrics Society 2019 updated AGS beers criteria® for potentially inappropriate medication use in older adults. J Am Geriatr Soc. 2019;67(4):674-694. doi:10.1111/jgs.15767
- By the 2023 American Geriatrics Society Beers Criteria® Update Expert Panel. American Geriatrics Society 2023 updated AGS Beers Criteria® for potentially inappropriate medication use in older adults J Am Geriatr Soc. 2023;71(7):2052-2081. doi:10.1111/jgs.18372
- Wang K, Alan J, Page AT, Dimopoulos E, Etherton-Beer C. Anticholinergics and clinical outcomes amongst people with pre-existing dementia: a systematic review. Maturitas. 2021;151:1-14. doi:10.1016/j.maturitas.2021.06.004
- Thorpe JM, Thorpe CT, Gellad WF, et al. Dual health care system use and high-risk prescribing in patients with dementia: a national cohort study. Ann Intern Med. 2017;166(3):157-163. doi:10.7326/M16-0551
- McCarren M, Burk M, Carico R, Glassman P, Good CB, Cunningham F. Design of a centrally aggregated medication use evaluation (CAMUE): anticholinergics in dementia. Presented at: 2019 HSR&D/QUERI National Conference; October 29-31, 2019; Washington, DC. https://www.hsrd.research.va.gov/meetings/2019/abstract-display.cfm?AbsNum=4027
- Boustani, M, Campbell, N, Munger S, et al. Impact of anticholinergics on the aging brain: a review and practical application. Aging Health. 2008;4(3):311-320. doi:10.2217/1745509.x
- Constantino-Corpuz JK, Alonso MTD. Assessment of a medication deprescribing tool on polypharmacy and cost avoidance. Fed Pract. 2021;38(7):332-336. doi:10.12788/fp.0146
- Fox C, Richardson K, Maidment ID, et al. Anticholinergic medication use and cognitive impairment in the older population: the medical research council cognitive function and ageing study. J Am Geriatr Soc. 2011;59(8):1477-1483. doi:10.1111/j.1532-5415.2011.03491.x
Anticholinergic medications block the activity of the neurotransmitter acetylcholine by binding to either muscarinic or nicotinic receptors in both the peripheral and central nervous system. Anticholinergic medications typically refer to antimuscarinic medications and have been prescribed to treat a variety of conditions common in older adults, including overactive bladder, allergies, muscle spasms, and sleep disorders.1,2 Since muscarinic receptors are present throughout the body, anticholinergic medications are associated with many adverse effects (AEs), including constipation, urinary retention, xerostomia, and delirium. Older adults are more sensitive to these AEs due to physiological changes associated with aging.1
The American Geriatric Society Beers Criteria for Potentially Inappropriate Medications Use in Older Adults identifies drugs with strong anticholinergic properties. The Beers Criteria strongly recommends avoiding these medications in patients with dementia or cognitive impairment due to the risk of central nervous system AEs. In the updated 2023 Beers Criteria, the rationale was expanded to recognize the risks of the cumulative anticholinergic burden associated with concurrent anticholinergic use.3,4
Given the prevalent use of anticholinergic medications in older adults, there has been significant research demonstrating their AEs, specifically delirium and cognitive impairment in geriatric patients. A systematic review of 14 articles conducted in 7 different countries of patients with median age of 76.4 to 86.1 years reviewed clinical outcomes of anticholinergic use in patients with dementia. Five studies found anticholinergics were associated with increased all-cause mortality in patients with dementia, and 3 studies found anticholinergics were associated with longer hospital stays. Other studies found that anticholinergics were associated with delirium and reduced health-related quality of life.5
About 35% of veterans with dementia have been prescribed a medication regimen with a high anticholinergic burden.6 In 2018, the US Department of Veterans Affairs (VA) Pharmacy Benfits Management Center for Medical Safety completed a centrally aggregated medication use evaluation (CAMUE) to assess the appropriateness of anticholinergic medication use in patients with dementia. The retrospective chart review included 1094 veterans from 19 sites. Overall, about 15% of the veterans experienced new falls, delirium, or worsening dementia within 30 days of starting an anticholinergic medication. Furthermore, < 40% had documentation of a nonanticholinergic alternative medication trial, and < 20% had documented nonpharmacologic therapy. The documentation of risk-benefit assessment acknowledging the risks of anticholinergic medication use in veterans with dementia occurred only about 13% of the time. The CAMUE concluded that the risks of initiating an anticholinergic medication in veterans with dementia are likely underdocumented and possibly under considered by prescribers.7
Developed within the Veterans Health Administration (VHA), VIONE (Vital, Important, Optional, Not Indicated, Every medication has an indication) is a medication management methodology that aims to reduce polypharmacy and improve patient safety consistent with high-reliability organizations. Since it launched in 2016, VIONE has gradually been implemented at many VHA facilities. The VIONE deprescribing dashboard had not been used at the VA Louisville Healthcare System prior to this quality improvement project.
This dashboard uses the Beers Criteria to identify potentially inappropriate anticholinergic medications. It uses the Anticholinergic Cognitive Burden (ACB) scale to calculate the cumulative anticholinergic risk for each patient. Medications with an ACB score of 2 or 3 have clinically relevant cognitive effects such as delirium and dementia (Table 1). For each point increase in total ACB score, a decline in mini-mental state examination score of 0.33 points over 2 years has been shown. Each point increase has also been correlated with a 26% increase in risk of death.8-10
Methods
The purpose of this quality improvement project was to determine the impact of pharmacist-driven deprescribing on the anticholinergic burden in veterans with dementia at VA Louisville Healthcare System. Data were obtained through the Computerized Patient Record System (CPRS) and VIONE deprescribing dashboard and entered in a secure Microsoft Excel spreadsheet. Pharmacist deprescribing steps were entered as CPRS progress notes. A deprescribing note template was created, and 11 templates with indication-specific recommendations were created for each anticholinergic indication identified (contact authors for deprescribing note template examples). Usage of anticholinergic medications was reexamined 3 months after the deprescribing note was entered.
Eligible patients identified in the VIONE deprescribing dashboard had an outpatient order for a medication with strong anticholinergic properties as identified using the Beers Criteria and were aged ≥ 65 years. Patients also had to be diagnosed with dementia or cognitive impairment. Patients were excluded if they were receiving hospice care or if the anticholinergic medication was from a non-VA prescriber or filled at a non-VA pharmacy. The VIONE deprescribing dashboard also excluded skeletal muscle relaxants if the patient had a spinal cord-related visit in the previous 2 years, first-generation antihistamines if the patient had a vertigo diagnosis, hydroxyzine if the indication was for anxiety, trospium if the indication was for overactive bladder, and antipsychotics if the patient had been diagnosed with schizophrenia or bipolar disorder. The following were included in the deprescribing recommendations if the dashboard identified the patient due to receiving a second strongly anticholinergic medication: first generation antihistamines if the patient was diagnosed with vertigo and hydroxyzine if the indication is for anxiety.
Each eligible patient received a focused medication review by a pharmacist via electronic chart review and a templated CPRS progress note with patient-specific recommendations. The prescriber and the patient’s primary care practitioner were recommended to perform a patient-specific risk-benefit assessment, deprescribe potentially inappropriate anticholinergic medications, and consider nonanticholinergic alternatives (both pharmacologic and nonpharmacologic). Data collected included baseline age, sex, prespecified comorbidities (type of dementia, cognitive impairment, delirium, benign prostatic hyperplasia/lower urinary tract symptoms), duration of prescribed anticholinergic medication, indication and deprescribing rate for each anticholinergic agent, and concurrent dementia medications (acetylcholinesterase inhibitors, memantine, or both).
The primary outcome was the number of patients that had = 1 medication with strong anticholinergic properties deprescribed. Deprescribing was defined as medication discontinuation or reduction of total daily dose. Secondary outcomes were the mean change in ACB scale, the number of patients with dose tapering, documented patient-specific risk-benefit assessment, and initiated nonanticholinergic alternative per pharmacist recommendation.
Results
The VIONE deprescribing dashboard identified 121 patients; 45 were excluded for non-VA prescriber or pharmacy, and 8 patients were excluded for other reasons. Sixty-eight patients were included in the deprescribing initiative. The mean age was 73.4 years (range, 67-93), 65 (96%) were male, and 34 (50%) had unspecified dementia (Table 2). Thirty-one patients (46%) had concurrent cholinesterase inhibitor prescriptions for dementia. The median duration of use of a strong anticholinergic medication was 11 months.
Twenty-nine patients (43%) had ≥ 1 medication with strong anticholinergic properties deprescribed. Anticholinergic medication was discontinued for 26 patients, and the dose was decreased for 3 patients. ACB score fell by a mean of 1.1 per patient. There was an increase in the documented risk-benefit assessment for anticholinergic medications from a baseline of 4 (6%) to 19 (28%) 3 months after the deprescribing note. Cyclobenzaprine, paroxetine, and oxybutynin were deprescribed the most, and amitriptyline had the lowest rate of deprescribing (Table 3). Thirty patients (44%) had a pharmacologic, nonanticholinergic alternative initiated per pharmacist recommendation, and 6 patients (9%) had a nonpharmacologic alternative initiated per pharmacist recommendation.
Discussion
This quality improvement project suggests that with the use of population health management tools such as the VIONE deprescribing dashboard, pharmacists can help identify and deprescribe strong anticholinergic medications in patients with cognitive impairment or dementia. Pharmacists can also aid in deprescribing through evidence-based recommendations to guide risk-benefit discussion and consider safer, nonanticholinergic alternatives. The authors were able to help reduce anticholinergic cognitive burden in 43% of patients in this sample. The mean 1.1 ACB score reduction was considered clinically significant based on prior studies that found that each 1-point increase in ACB score correlated with declined cognition and increased mortality.8,10 The VIONE deprescribing dashboard provided real-time patient data and helped target patients at the highest risk of anticholinergic AEs. The creation of the note templates based on the indication helped streamline recommendations. Typically, the prescriber addressed the recommendations at a routine follow-up appointment. The deprescribing method used in this project was time-efficient and could be easily replicated once the CPRS note templates were created. Future deprescribing projects could consider more direct pharmacist intervention and medication management.
Limitations
There was no direct assessment of clinical outcomes such as change in cognition using cognitive function tests. However, multiple studies have demonstrated AEs associated with strong anticholinergic medication use and additive anticholinergic burden in patients with dementia or cognitive impairment.1,5 Also, the 3-month follow-up period was relatively short. The pharmacist’s deprescribing recommendations may have been accepted after 3 months, or patients could have restarted their anticholinergic medications. Longer follow-up time could provide more robust results and conclusions. Thirdly, there was no formal definition of what constituted a risk-benefit assessment of anticholinergic medications. The risk-benefit assessment was determined at the discretion of the authors, which was subjective and allowed for bias. Finally, 6 patients died during the 3-month follow-up. The data for these patients were included in the baseline characteristics but not in the study outcomes. If these patients had been excluded from the results, a higher percentage of patients (47%) would have had ≥ 1 anticholinergic medication deprescribed.
Conclusions
In collaboration with the interdisciplinary team, pharmacist recommendations resulted in deprescribing of anticholinergic medications in veterans with dementia or cognitive impairment. The VIONE deprescribing dashboard, an easily accessible population health management tool, can identify patients prescribed potentially inappropriate medications and help target patients at the highest risk of anticholinergic AEs. To prevent worsening cognitive impairment, delirium, falls, and other AEs, this deprescribing initiative can be replicated at other VHA facilities. Future projects could have a longer follow-up period, incorporate more direct pharmacist intervention, and assess clinical outcomes of deprescribing.
- Gray SL, Hanlon JT. Anticholinergic medication use and dementia: latest evidence and clinical implications. Ther Adv Drug Saf. 2016;7(5):217-224. doi:10.1177/2042098616658399
- Kersten H, Wyller TB. Anticholinergic drug burden in older people’s brain - how well is it measured? Basic Clin Pharmacol Toxicol. 2014;114(2):151-159. doi:10.1111/bcpt.12140
- By the 2019 American Geriatrics Society Beers Criteria® Update Expert Panel. American Geriatrics Society 2019 updated AGS beers criteria® for potentially inappropriate medication use in older adults. J Am Geriatr Soc. 2019;67(4):674-694. doi:10.1111/jgs.15767
- By the 2023 American Geriatrics Society Beers Criteria® Update Expert Panel. American Geriatrics Society 2023 updated AGS Beers Criteria® for potentially inappropriate medication use in older adults J Am Geriatr Soc. 2023;71(7):2052-2081. doi:10.1111/jgs.18372
- Wang K, Alan J, Page AT, Dimopoulos E, Etherton-Beer C. Anticholinergics and clinical outcomes amongst people with pre-existing dementia: a systematic review. Maturitas. 2021;151:1-14. doi:10.1016/j.maturitas.2021.06.004
- Thorpe JM, Thorpe CT, Gellad WF, et al. Dual health care system use and high-risk prescribing in patients with dementia: a national cohort study. Ann Intern Med. 2017;166(3):157-163. doi:10.7326/M16-0551
- McCarren M, Burk M, Carico R, Glassman P, Good CB, Cunningham F. Design of a centrally aggregated medication use evaluation (CAMUE): anticholinergics in dementia. Presented at: 2019 HSR&D/QUERI National Conference; October 29-31, 2019; Washington, DC. https://www.hsrd.research.va.gov/meetings/2019/abstract-display.cfm?AbsNum=4027
- Boustani, M, Campbell, N, Munger S, et al. Impact of anticholinergics on the aging brain: a review and practical application. Aging Health. 2008;4(3):311-320. doi:10.2217/1745509.x
- Constantino-Corpuz JK, Alonso MTD. Assessment of a medication deprescribing tool on polypharmacy and cost avoidance. Fed Pract. 2021;38(7):332-336. doi:10.12788/fp.0146
- Fox C, Richardson K, Maidment ID, et al. Anticholinergic medication use and cognitive impairment in the older population: the medical research council cognitive function and ageing study. J Am Geriatr Soc. 2011;59(8):1477-1483. doi:10.1111/j.1532-5415.2011.03491.x
Pharmacist-Driven Deprescribing to Reduce Anticholinergic Burden in Veterans With Dementia
Pharmacist-Driven Deprescribing to Reduce Anticholinergic Burden in Veterans With Dementia

Biomarkers Predict Villous Atrophy in Potential Celiac Disease Patients
according to investigators.
Given that PCD patients present with positive serology and intact duodenal architecture, these findings may provide a much-needed tool for identifying patients who are more likely to benefit from early dietary interventions, lead author Renata Auricchio, MD, PhD, of the University of Naples Federico II, Italy, and colleagues reported.
“PCD offers the unique opportunity to observe the progression of gluten-induced tissue damage in celiac disease,” the investigators wrote in Gastroenterology. “These patients recognize gluten and produce specific autoantibodies, but have not developed intestinal damage.”
The study included 31 children with asymptomatic PCD who were eating a gluten-containing diet. Serum samples from each child were analyzed for the relative abundance of 92 inflammation-linked proteins using a proximity extension immunoassay. Statistical analyses, including partial least squares discriminant and linear discriminant analyses, were then applied to identify which proteins were associated with the development of VA.
After a mean follow-up period of 5.85 years, 14 participants developed VA (ie, celiac disease), while the remaining 17 remained asymptomatic.
Panel analysis revealed that specific inflammatory proteins, including interleukin (IL)–20, IL-2, sirtuin 2 (SIRT2), leukemia inhibitory factor (LIF), IL-22 receptor subunit a1, cystatin D (CST5), IL-17 receptor A, IL-15 receptor subunit a (RA), CUB domain–containing protein 1 (CDCP1), and IL-14, were 1.23- to 1.76-fold higher in children who developed VA. Among these, seven proteins — CDCP1, IL-2, LIF, IL10RA, SIRT2, CST5, and IL-4 — were able to significantly distinguish between symptomatic and asymptomatic cases in a linear discriminant model. This panel of seven proteins achieved a predictive accuracy of 96.8% in identifying children at risk of VA.
Additionally, bioinformatics pathway analysis confirmed that the broader set of proteins is involved in the positive regulation of JAK-STAT signaling (involving IL-22 receptor subunit a1, IL-4, IL-20, IL10RA, LIF, and IL-2), inflammatory responses (IL-4, IL-20, LIF, and IL-2), and processes such as tyrosine phosphorylation, leukocyte differentiation, IgG isotype switching, and protein phosphorylation regulation. These findings suggest that gluten-induced inflammation may already be active in early stages of the disease, including the initial phases of leukocyte differentiation, according to the investigators.
“Over a long follow-up on a gluten-containing diet, only 40% of these patients progressed to VA,” Dr. Auricchio and colleagues wrote. “Notably, 25%-30% of children with PCD even stop producing anti–tissue transglutaminase antibodies, and the others keep on producing autoantibodies but preserve a normal intestinal mucosa. Considering these data, the decision to address a patient with PCD on a gluten-free diet at time of diagnosis is quite critical.”
The researchers noted that this new model, with accuracy exceeding 95%, is well suited for routine use because of its practicality and reliability.
“Our previous model, based mainly on small intestinal mucosa features, moved a step toward the prediction of outcome but still required a mucosal biopsy, and the accuracy of prediction was not greater than 80%, which is somewhat uncertain for a lifelong clinical decision,” they wrote. In contrast, the present model “appears to be sufficient to immediately suggest a gluten-free diet in children with PCD, who are almost certainly committed to developing VA.”
The investigators called for long-term studies to validate their findings in other cohorts, including adult populations.This study was supported by the TIMID project and Inflammation in Human Early Life: Targeting Impacts on Life Course Health (INITIALISE) by the Horizon Europe Program of the European Union. The investigators disclosed no conflicts of interest.
Patients with positive celiac serologies but normal villous architecture on biopsy are considered to have potential celiac disease (PCD). While the prevalence of PCD is not well-established, it is estimated to be around 1%. This study by Auricchio and colleagues investigates seven serum proteomic biomarkers that could help predict whether asymptomatic patients with PCD are at risk of developing villous atrophy (VA).

The study also identifies specific inflammatory proteins present in PCD patients who are likely to develop VA. These biomarkers provide valuable insights into the pathogenesis of celiac disease and the development of VA in genetically predisposed individuals.
As celiac disease is increasingly diagnosed without biopsies, serum proteomic biomarkers could be crucial in identifying patients who may benefit from starting a gluten-free diet (GFD) earlier, potentially preventing complications. According to the European Society of Pediatric Gastroenterology, Hepatology, and Nutrition (ESPGHAN) guidelines, children can be diagnosed with celiac disease if their tissue transglutaminase IgA level is 10 times the upper limit of normal, confirmed by a positive endomysial antibody test. However, this approach may lead to many patients committing to a lifelong GFD despite having only PCD, as biopsies may not have been performed. In this study, 60% of patients with PCD did not progress to VA, suggesting that biomarkers could help prevent unnecessary long-term GFD commitments.
Stephanie M. Moleski, MD, is the director of the Jefferson Celiac Center and associate professor in the division of gastroenterology at Thomas Jefferson University Hospital in Philadelphia. She reported no conflicts of interest.
Patients with positive celiac serologies but normal villous architecture on biopsy are considered to have potential celiac disease (PCD). While the prevalence of PCD is not well-established, it is estimated to be around 1%. This study by Auricchio and colleagues investigates seven serum proteomic biomarkers that could help predict whether asymptomatic patients with PCD are at risk of developing villous atrophy (VA).
The study also identifies specific inflammatory proteins present in PCD patients who are likely to develop VA. These biomarkers provide valuable insights into the pathogenesis of celiac disease and the development of VA in genetically predisposed individuals.
As celiac disease is increasingly diagnosed without biopsies, serum proteomic biomarkers could be crucial in identifying patients who may benefit from starting a gluten-free diet (GFD) earlier, potentially preventing complications. According to the European Society of Pediatric Gastroenterology, Hepatology, and Nutrition (ESPGHAN) guidelines, children can be diagnosed with celiac disease if their tissue transglutaminase IgA level is 10 times the upper limit of normal, confirmed by a positive endomysial antibody test. However, this approach may lead to many patients committing to a lifelong GFD despite having only PCD, as biopsies may not have been performed. In this study, 60% of patients with PCD did not progress to VA, suggesting that biomarkers could help prevent unnecessary long-term GFD commitments.
Stephanie M. Moleski, MD, is the director of the Jefferson Celiac Center and associate professor in the division of gastroenterology at Thomas Jefferson University Hospital in Philadelphia. She reported no conflicts of interest.
according to investigators.
Given that PCD patients present with positive serology and intact duodenal architecture, these findings may provide a much-needed tool for identifying patients who are more likely to benefit from early dietary interventions, lead author Renata Auricchio, MD, PhD, of the University of Naples Federico II, Italy, and colleagues reported.
“PCD offers the unique opportunity to observe the progression of gluten-induced tissue damage in celiac disease,” the investigators wrote in Gastroenterology. “These patients recognize gluten and produce specific autoantibodies, but have not developed intestinal damage.”
The study included 31 children with asymptomatic PCD who were eating a gluten-containing diet. Serum samples from each child were analyzed for the relative abundance of 92 inflammation-linked proteins using a proximity extension immunoassay. Statistical analyses, including partial least squares discriminant and linear discriminant analyses, were then applied to identify which proteins were associated with the development of VA.
After a mean follow-up period of 5.85 years, 14 participants developed VA (ie, celiac disease), while the remaining 17 remained asymptomatic.
Panel analysis revealed that specific inflammatory proteins, including interleukin (IL)–20, IL-2, sirtuin 2 (SIRT2), leukemia inhibitory factor (LIF), IL-22 receptor subunit a1, cystatin D (CST5), IL-17 receptor A, IL-15 receptor subunit a (RA), CUB domain–containing protein 1 (CDCP1), and IL-14, were 1.23- to 1.76-fold higher in children who developed VA. Among these, seven proteins — CDCP1, IL-2, LIF, IL10RA, SIRT2, CST5, and IL-4 — were able to significantly distinguish between symptomatic and asymptomatic cases in a linear discriminant model. This panel of seven proteins achieved a predictive accuracy of 96.8% in identifying children at risk of VA.
Additionally, bioinformatics pathway analysis confirmed that the broader set of proteins is involved in the positive regulation of JAK-STAT signaling (involving IL-22 receptor subunit a1, IL-4, IL-20, IL10RA, LIF, and IL-2), inflammatory responses (IL-4, IL-20, LIF, and IL-2), and processes such as tyrosine phosphorylation, leukocyte differentiation, IgG isotype switching, and protein phosphorylation regulation. These findings suggest that gluten-induced inflammation may already be active in early stages of the disease, including the initial phases of leukocyte differentiation, according to the investigators.
“Over a long follow-up on a gluten-containing diet, only 40% of these patients progressed to VA,” Dr. Auricchio and colleagues wrote. “Notably, 25%-30% of children with PCD even stop producing anti–tissue transglutaminase antibodies, and the others keep on producing autoantibodies but preserve a normal intestinal mucosa. Considering these data, the decision to address a patient with PCD on a gluten-free diet at time of diagnosis is quite critical.”
The researchers noted that this new model, with accuracy exceeding 95%, is well suited for routine use because of its practicality and reliability.
“Our previous model, based mainly on small intestinal mucosa features, moved a step toward the prediction of outcome but still required a mucosal biopsy, and the accuracy of prediction was not greater than 80%, which is somewhat uncertain for a lifelong clinical decision,” they wrote. In contrast, the present model “appears to be sufficient to immediately suggest a gluten-free diet in children with PCD, who are almost certainly committed to developing VA.”
The investigators called for long-term studies to validate their findings in other cohorts, including adult populations.This study was supported by the TIMID project and Inflammation in Human Early Life: Targeting Impacts on Life Course Health (INITIALISE) by the Horizon Europe Program of the European Union. The investigators disclosed no conflicts of interest.
FROM GASTROENTEROLOGY