User login
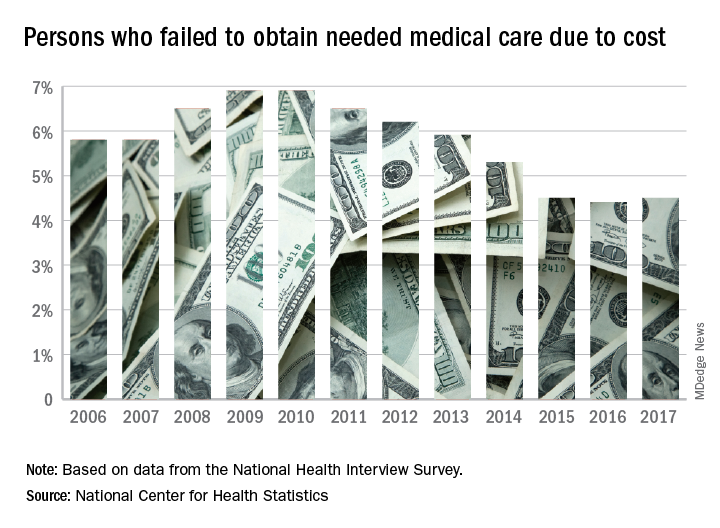
The percentage of Americans who went without medical care due to cost rose to 4.5% in 2017, reversing a 6-year trend, the National Center for Health Statistics reported.
The rate was 4.4% in 2016, which represented a slowdown in what had been steady decline over the previous 5 years, according to data from the National Health Interview Survey. Declining rates corresponded with the implementation of early provisions of the Affordable Care Act in 2010.
The 2017 rate varied considerably by age group. Not surprisingly, more working-age people – those aged 18-64 years – reported that they did not seek medical care at some point in the previous 12 months due to cost (6.1%). The rate was 1.2% for those under 18 years and 2.7% for the Medicare eligible – those aged 65 years and older.
For 2016, the rates were 6.2% for those aged 18-64 years, 1.2% for the under-18 group, and 2.1% for the 65+ group, the data show.
Among females of all ages in 2017, 4.8% failed to get needed care at some point in the previous year, compared with 4.1% of men. Those numbers were unchanged from 2016 but down from 4.9% for females in 2015 and up from 4.0% for males that year, the NCHS said.
In 2017, the rate also varied by race/ethnicity – 4.1% for whites, 5.3% for Hispanics, 6.1% for blacks – and by location – 4.1% for large metropolitan areas, 4.9% for small metro areas, and 5.5% for rural locales, according to the early release of survey data.
The percentage of Americans who went without medical care due to cost rose to 4.5% in 2017, reversing a 6-year trend, the National Center for Health Statistics reported.
The rate was 4.4% in 2016, which represented a slowdown in what had been steady decline over the previous 5 years, according to data from the National Health Interview Survey. Declining rates corresponded with the implementation of early provisions of the Affordable Care Act in 2010.
The 2017 rate varied considerably by age group. Not surprisingly, more working-age people – those aged 18-64 years – reported that they did not seek medical care at some point in the previous 12 months due to cost (6.1%). The rate was 1.2% for those under 18 years and 2.7% for the Medicare eligible – those aged 65 years and older.
For 2016, the rates were 6.2% for those aged 18-64 years, 1.2% for the under-18 group, and 2.1% for the 65+ group, the data show.
Among females of all ages in 2017, 4.8% failed to get needed care at some point in the previous year, compared with 4.1% of men. Those numbers were unchanged from 2016 but down from 4.9% for females in 2015 and up from 4.0% for males that year, the NCHS said.
In 2017, the rate also varied by race/ethnicity – 4.1% for whites, 5.3% for Hispanics, 6.1% for blacks – and by location – 4.1% for large metropolitan areas, 4.9% for small metro areas, and 5.5% for rural locales, according to the early release of survey data.
The percentage of Americans who went without medical care due to cost rose to 4.5% in 2017, reversing a 6-year trend, the National Center for Health Statistics reported.
The rate was 4.4% in 2016, which represented a slowdown in what had been steady decline over the previous 5 years, according to data from the National Health Interview Survey. Declining rates corresponded with the implementation of early provisions of the Affordable Care Act in 2010.
The 2017 rate varied considerably by age group. Not surprisingly, more working-age people – those aged 18-64 years – reported that they did not seek medical care at some point in the previous 12 months due to cost (6.1%). The rate was 1.2% for those under 18 years and 2.7% for the Medicare eligible – those aged 65 years and older.
For 2016, the rates were 6.2% for those aged 18-64 years, 1.2% for the under-18 group, and 2.1% for the 65+ group, the data show.
Among females of all ages in 2017, 4.8% failed to get needed care at some point in the previous year, compared with 4.1% of men. Those numbers were unchanged from 2016 but down from 4.9% for females in 2015 and up from 4.0% for males that year, the NCHS said.
In 2017, the rate also varied by race/ethnicity – 4.1% for whites, 5.3% for Hispanics, 6.1% for blacks – and by location – 4.1% for large metropolitan areas, 4.9% for small metro areas, and 5.5% for rural locales, according to the early release of survey data.