User login
As total health care costs reach almost $3 trillion per year—capturing more than 17% of the total US gross domestic product—payers are searching for more effective ways to limit health care spending.1,2 One increasingly discussed plan is payment bundling.3 This one-lump-sum payment model arose as a result of rapid year-on-year increases in total reimbursements under the current, fee-for-service model. The Centers for Medicare & Medicaid Services hypothesized that a single all-inclusive payment for a procedure or set of services would incentivize improvements in patient-centered care and disincentivize cost-shifting behaviors.4 Bundled reimbursement is becoming increasingly common in orthopedic practice. With the recent introduction of the Bundled Payment for Care Improvement Initiative, several orthopedic practices around the United States are already actively engaged in creating models for bundled payment for common elective procedures and for associated services provided up to 90 days after surgery.3,5
Bundled payment increases the burden on the provider to understand the cost of care provided during a care cycle. However, not only has the current system blinded physicians to the cost of care, but current antitrust legislation has made discussions of pricing with colleagues (so-called price collusion) illegal and subject to fines of up to $1 million per person and $100 million per organization,6 therefore limiting orthopedic physician involvement.
Given these legal constraints, instead of measuring direct costs of goods, we developed a “grocery list” approach in which direct comparisons are made of resources (goods and services) used and delivered during the entire 90-day cycle of care for patients who undergo anatomical total shoulder arthroplasty (TSA) or reverse shoulder arthroplasty (RSA). We used one surgeon’s practice experience as a model for measuring other orthopedic surgeons’ resource utilization, based on their electronic medical records (EMR) system data. By capturing the costs of the components of resource utilization rather than just the final cost of care, we can assess, compare, understand, endorse, and address these driving factors.
1. The significance of resource utilization
To maximize the efficiency of their practices, high-volume shoulder surgeons have introduced standardization to health care delivery.7 Identifying specific efficiencies makes uniform acceptance of beneficial practice patterns possible.
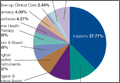
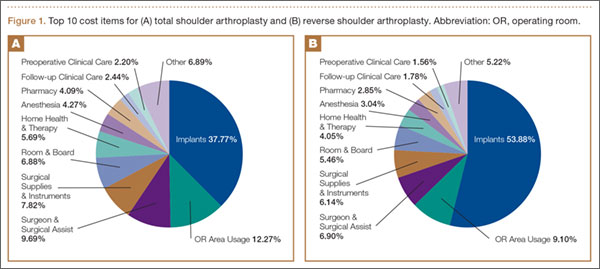
To facilitate comparison of goods and services used during an episode of surgical care, Virani and colleagues8,9 studied the costs of TSA and RSA and calculated the top 10 driving cost factors for these procedures (Figure 1). Their systematic analysis provided a framework for a common method of communication, allowing an orthopedic surgeon to gain a more complete understanding of the resources used during a particular operative procedure in his or her practice, and allowing several physicians to compare and contrast the resources collectively used for a single procedure, facilitating an understanding of different practice patterns within a local community. At a societal level, these data can be collected to help guide overall recommendations.
2. How we defined utilization
To define the resources used, we had to decide which procedure components cost the most. Virani and colleagues8,9 found that the top 10 cost drivers accounted for 93.11% and 94.77% of the total cost of the TSA and RSA care cycles, respectively (Figure 1). For each cost driver, information on resources used (goods, services, overhead) was collected on 2 forms, the Hospital Utilization Form (7 hospital-based items) and the Clinical Utilization Form (3 non-hospital-based items). To make hospital data easy to compile, we piloted use of a “smart form” in the EpicCare EMR system to isolate and auto-populate specific data fields.
3. EMR data collection
With EMR becoming mandatory for all public and private health care providers starting in 2014, utilization data are now included in a single unified system. Working with our in-house information technology department, we developed an algorithm to populate this information in a separate, easy-to-follow hospital utilization form. This form can be adopted by other institutions. Although EpicCare EMR is used by 52% of hospitals and at our institution, the data points required to make the same measurements are generalizable and exist in other EMRs.
Smartlinks, a tool in this EMR, allows utilization data to be quickly retrieved from different locations in a medical record and allows a form to be electronically completed in seconds. Data can be retrieved for any patient in the EMR system, regardless of when that patient’s hospital stay occurred. We populated data from surgeries performed 2 years before the start of this project.
4. What we can learn from these data
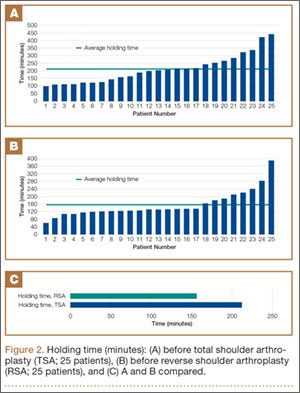
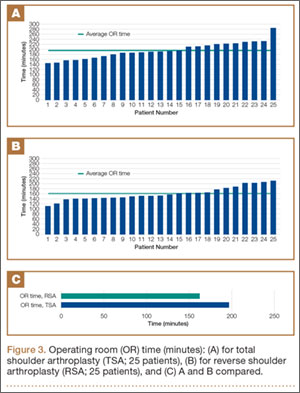
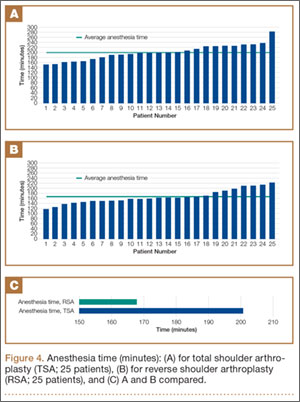
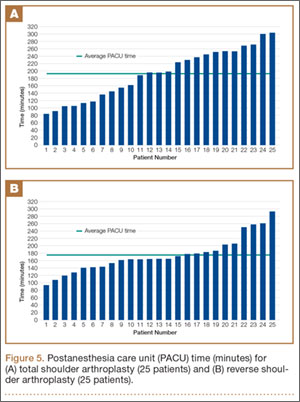
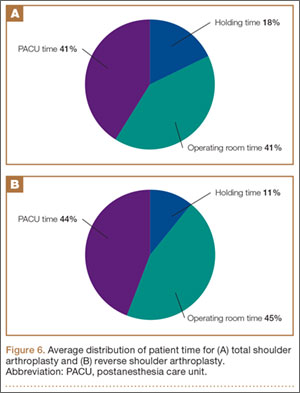
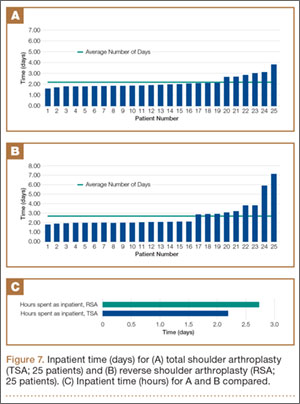
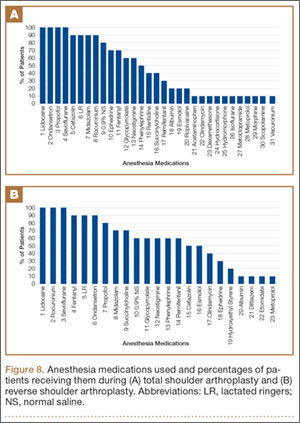
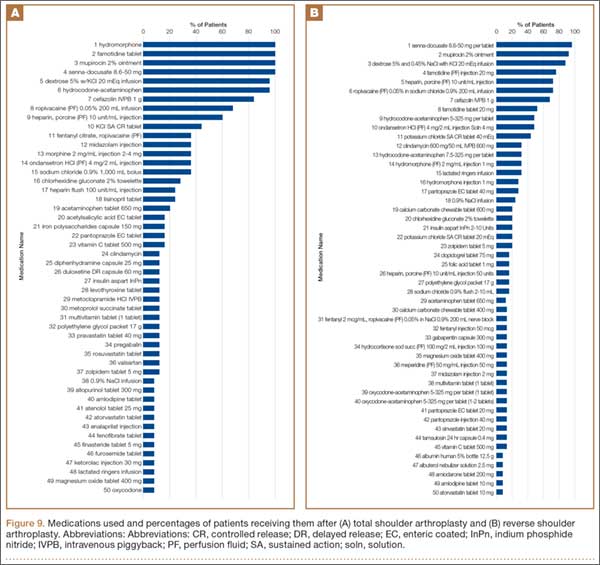
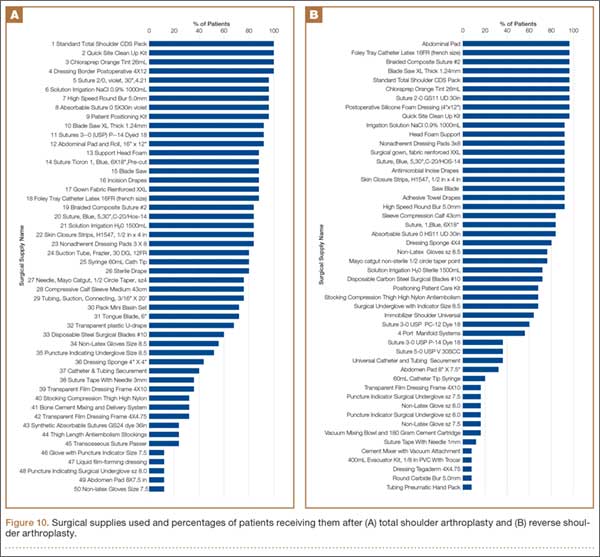
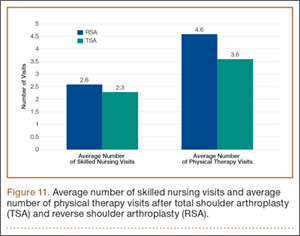
Data from a pilot study of 25 patients who underwent primary anatomical TSA for osteoarthritis and 25 patients who underwent primary RSA for massive rotator cuff tear allowed us to generate graphical representations of a single surgeon’s practice patterns that most affected the cost of care. Time in holding, time in the operating room, time in the postanesthesia care unit, and percentage of patients receiving different medications were recorded for each procedure (Figures 2–11). The study did not capture the wide variances in practice patterns in shoulder arthroplasty, and therefore other surgeons’ resource utilization may differ from ours. However, replicating this methodology at other institutions will produce a more robust data set from which conclusions about resource utilization and, indirectly, cost of care can be made.
5. Future possibilities
By using existing EMR tools to better understand resource utilization, orthopedic surgeons can play a constructive role in the dialogue on health care costs and new reimbursement models. The data presented here are not meant to be interpreted as hard and fast numbers on global resource utilization, but instead we intend to establish a model for collecting data on resource utilization. Resource utilization begins the dialogue that allows orthopedic surgeons and specialty societies to speak a common language without discussing actual cost numbers, which is discouraged under antitrust regulation. The data presented will allow comparisons to be made between surgeons in all practice settings to highlight areas of inconsistency in order to further improve patient care. Although this work involved only 50 patients undergoing only 2 types of surgeries, the resource-capturing methodology can be expanded to include more procedures and orthopedic practices. As all hospitals are now required to have EMRs, the metrics tracked in this work can be found on any patient medical record and auto-populated using our open-source utilization forms. Starting this data collection at your hospital may require no more than a conversation with the informatics department, as the metrics can for the most part be populated into a database on surgeon request.
As orthopedic surgeons return to the economic health care discussion, this information could prove essential in helping the individual surgeon and the orthopedic community justify the cost of care as well as fully understand the cost drivers for musculoskeletal care.
Click here to read the commentary on this article by Peter D. McCann, MD
1. National health expenditures 2013 highlights. Centers for Medicare & Medicaid Services website. http://www.cms.gov/Research-Statistics-Data-and-Systems/Statistics-Trends-and-Reports/NationalHealthExpendData/downloads/highlights.pdf. Accessed September 14, 2015.
2. Wilson KB. Health care costs 101: slow growth persists. California HealthCare Foundation website. http://www.chcf.org/publications/2014/07/health-care-costs-101. Published July 2014. Accessed August 24, 2015.
3. Froimson MI, Rana A, White RE Jr, et al. Bundled Payments for Care Improvement Initiative: the next evolution of payment formulations: AAHKS Bundled Payment Task Force. J Arthroplasty. 2013;28(8 suppl):157-165.
4. Morley M, Bogasky S, Gage B, Flood S, Ingber MJ. Medicare post-acute care episodes and payment bundling. Medicare Medicaid Res Rev. 2014;4(1).
5. Teusink MJ, Virani NA, Polikandriotis JA, Frankle MA. Cost analysis in shoulder arthroplasty surgery. Adv Orthop. 2012;2012:692869.
6. Fassbender E, Pandya S. Legislation focuses on AAOS priorities. American Academy of Orthopaedic Surgeons website. http://www.aaos.org/news/aaosnow/may14/advocacy2.asp. AAOS Now. Published May 2014. Accessed August 24, 2015.
7. Porter ME, Teisberg EO. Redefining Health Care: Creating Value-Based Competition on Results. Boston, MA: Harvard Business School Press; 2006.
8. Virani NA, Williams CD, Clark R, Polikandriotis J, Downes KL, Frankle MA. Preparing for the bundled-payment initiative: the cost and clinical outcomes of reverse shoulder arthroplasty for the surgical treatment of advanced rotator cuff deficiency at an average 4-year follow-up. J Shoulder Elbow Surg. 2013;22(12):1612-1622.
9. Virani NA, Williams CD, Clark R, Polikandriotis J, Downes KL, Frankle MA. Preparing for the bundled-payment initiative: the cost and clinical outcomes of total shoulder arthroplasty for the surgical treatment of glenohumeral arthritis at an average 4-year follow-up. J Shoulder Elbow Surg. 2013;22(12):1601-1611.
As total health care costs reach almost $3 trillion per year—capturing more than 17% of the total US gross domestic product—payers are searching for more effective ways to limit health care spending.1,2 One increasingly discussed plan is payment bundling.3 This one-lump-sum payment model arose as a result of rapid year-on-year increases in total reimbursements under the current, fee-for-service model. The Centers for Medicare & Medicaid Services hypothesized that a single all-inclusive payment for a procedure or set of services would incentivize improvements in patient-centered care and disincentivize cost-shifting behaviors.4 Bundled reimbursement is becoming increasingly common in orthopedic practice. With the recent introduction of the Bundled Payment for Care Improvement Initiative, several orthopedic practices around the United States are already actively engaged in creating models for bundled payment for common elective procedures and for associated services provided up to 90 days after surgery.3,5
Bundled payment increases the burden on the provider to understand the cost of care provided during a care cycle. However, not only has the current system blinded physicians to the cost of care, but current antitrust legislation has made discussions of pricing with colleagues (so-called price collusion) illegal and subject to fines of up to $1 million per person and $100 million per organization,6 therefore limiting orthopedic physician involvement.
Given these legal constraints, instead of measuring direct costs of goods, we developed a “grocery list” approach in which direct comparisons are made of resources (goods and services) used and delivered during the entire 90-day cycle of care for patients who undergo anatomical total shoulder arthroplasty (TSA) or reverse shoulder arthroplasty (RSA). We used one surgeon’s practice experience as a model for measuring other orthopedic surgeons’ resource utilization, based on their electronic medical records (EMR) system data. By capturing the costs of the components of resource utilization rather than just the final cost of care, we can assess, compare, understand, endorse, and address these driving factors.
1. The significance of resource utilization
To maximize the efficiency of their practices, high-volume shoulder surgeons have introduced standardization to health care delivery.7 Identifying specific efficiencies makes uniform acceptance of beneficial practice patterns possible.
To facilitate comparison of goods and services used during an episode of surgical care, Virani and colleagues8,9 studied the costs of TSA and RSA and calculated the top 10 driving cost factors for these procedures (Figure 1). Their systematic analysis provided a framework for a common method of communication, allowing an orthopedic surgeon to gain a more complete understanding of the resources used during a particular operative procedure in his or her practice, and allowing several physicians to compare and contrast the resources collectively used for a single procedure, facilitating an understanding of different practice patterns within a local community. At a societal level, these data can be collected to help guide overall recommendations.
2. How we defined utilization
To define the resources used, we had to decide which procedure components cost the most. Virani and colleagues8,9 found that the top 10 cost drivers accounted for 93.11% and 94.77% of the total cost of the TSA and RSA care cycles, respectively (Figure 1). For each cost driver, information on resources used (goods, services, overhead) was collected on 2 forms, the Hospital Utilization Form (7 hospital-based items) and the Clinical Utilization Form (3 non-hospital-based items). To make hospital data easy to compile, we piloted use of a “smart form” in the EpicCare EMR system to isolate and auto-populate specific data fields.
3. EMR data collection
With EMR becoming mandatory for all public and private health care providers starting in 2014, utilization data are now included in a single unified system. Working with our in-house information technology department, we developed an algorithm to populate this information in a separate, easy-to-follow hospital utilization form. This form can be adopted by other institutions. Although EpicCare EMR is used by 52% of hospitals and at our institution, the data points required to make the same measurements are generalizable and exist in other EMRs.
Smartlinks, a tool in this EMR, allows utilization data to be quickly retrieved from different locations in a medical record and allows a form to be electronically completed in seconds. Data can be retrieved for any patient in the EMR system, regardless of when that patient’s hospital stay occurred. We populated data from surgeries performed 2 years before the start of this project.
4. What we can learn from these data
Data from a pilot study of 25 patients who underwent primary anatomical TSA for osteoarthritis and 25 patients who underwent primary RSA for massive rotator cuff tear allowed us to generate graphical representations of a single surgeon’s practice patterns that most affected the cost of care. Time in holding, time in the operating room, time in the postanesthesia care unit, and percentage of patients receiving different medications were recorded for each procedure (Figures 2–11). The study did not capture the wide variances in practice patterns in shoulder arthroplasty, and therefore other surgeons’ resource utilization may differ from ours. However, replicating this methodology at other institutions will produce a more robust data set from which conclusions about resource utilization and, indirectly, cost of care can be made.
5. Future possibilities
By using existing EMR tools to better understand resource utilization, orthopedic surgeons can play a constructive role in the dialogue on health care costs and new reimbursement models. The data presented here are not meant to be interpreted as hard and fast numbers on global resource utilization, but instead we intend to establish a model for collecting data on resource utilization. Resource utilization begins the dialogue that allows orthopedic surgeons and specialty societies to speak a common language without discussing actual cost numbers, which is discouraged under antitrust regulation. The data presented will allow comparisons to be made between surgeons in all practice settings to highlight areas of inconsistency in order to further improve patient care. Although this work involved only 50 patients undergoing only 2 types of surgeries, the resource-capturing methodology can be expanded to include more procedures and orthopedic practices. As all hospitals are now required to have EMRs, the metrics tracked in this work can be found on any patient medical record and auto-populated using our open-source utilization forms. Starting this data collection at your hospital may require no more than a conversation with the informatics department, as the metrics can for the most part be populated into a database on surgeon request.
As orthopedic surgeons return to the economic health care discussion, this information could prove essential in helping the individual surgeon and the orthopedic community justify the cost of care as well as fully understand the cost drivers for musculoskeletal care.
Click here to read the commentary on this article by Peter D. McCann, MD
1. National health expenditures 2013 highlights. Centers for Medicare & Medicaid Services website. http://www.cms.gov/Research-Statistics-Data-and-Systems/Statistics-Trends-and-Reports/NationalHealthExpendData/downloads/highlights.pdf. Accessed September 14, 2015.
2. Wilson KB. Health care costs 101: slow growth persists. California HealthCare Foundation website. http://www.chcf.org/publications/2014/07/health-care-costs-101. Published July 2014. Accessed August 24, 2015.
3. Froimson MI, Rana A, White RE Jr, et al. Bundled Payments for Care Improvement Initiative: the next evolution of payment formulations: AAHKS Bundled Payment Task Force. J Arthroplasty. 2013;28(8 suppl):157-165.
4. Morley M, Bogasky S, Gage B, Flood S, Ingber MJ. Medicare post-acute care episodes and payment bundling. Medicare Medicaid Res Rev. 2014;4(1).
5. Teusink MJ, Virani NA, Polikandriotis JA, Frankle MA. Cost analysis in shoulder arthroplasty surgery. Adv Orthop. 2012;2012:692869.
6. Fassbender E, Pandya S. Legislation focuses on AAOS priorities. American Academy of Orthopaedic Surgeons website. http://www.aaos.org/news/aaosnow/may14/advocacy2.asp. AAOS Now. Published May 2014. Accessed August 24, 2015.
7. Porter ME, Teisberg EO. Redefining Health Care: Creating Value-Based Competition on Results. Boston, MA: Harvard Business School Press; 2006.
8. Virani NA, Williams CD, Clark R, Polikandriotis J, Downes KL, Frankle MA. Preparing for the bundled-payment initiative: the cost and clinical outcomes of reverse shoulder arthroplasty for the surgical treatment of advanced rotator cuff deficiency at an average 4-year follow-up. J Shoulder Elbow Surg. 2013;22(12):1612-1622.
9. Virani NA, Williams CD, Clark R, Polikandriotis J, Downes KL, Frankle MA. Preparing for the bundled-payment initiative: the cost and clinical outcomes of total shoulder arthroplasty for the surgical treatment of glenohumeral arthritis at an average 4-year follow-up. J Shoulder Elbow Surg. 2013;22(12):1601-1611.