User login
Factors Influencing Outcomes of a Telehealth-Based Physical Activity Program in Older Veterans Postdischarge
Factors Influencing Outcomes of a Telehealth-Based Physical Activity Program in Older Veterans Postdischarge
Deconditioning among hospitalized older adults contributes to significant decline in posthospitalization functional ability, physical performance, and physical activity.1-10 Previous hospital-to-home interventions have targeted improving function and physical activity, including recent programs leveraging home telehealth as a feasible and potentially effective mode of delivering in-home exercise and rehabilitation.11-14 However, pilot interventions have shown mixed effectiveness.11,12,14 This study expands on a previously published intervention describing a pilot home telehealth program for veterans posthospital discharge that demonstrated significant 6-month improvement in physical activity as well as trends in physical function improvement, including among those with cognitive impairment.15 Factors that contribute to improved outcomes are the focus of the present study.
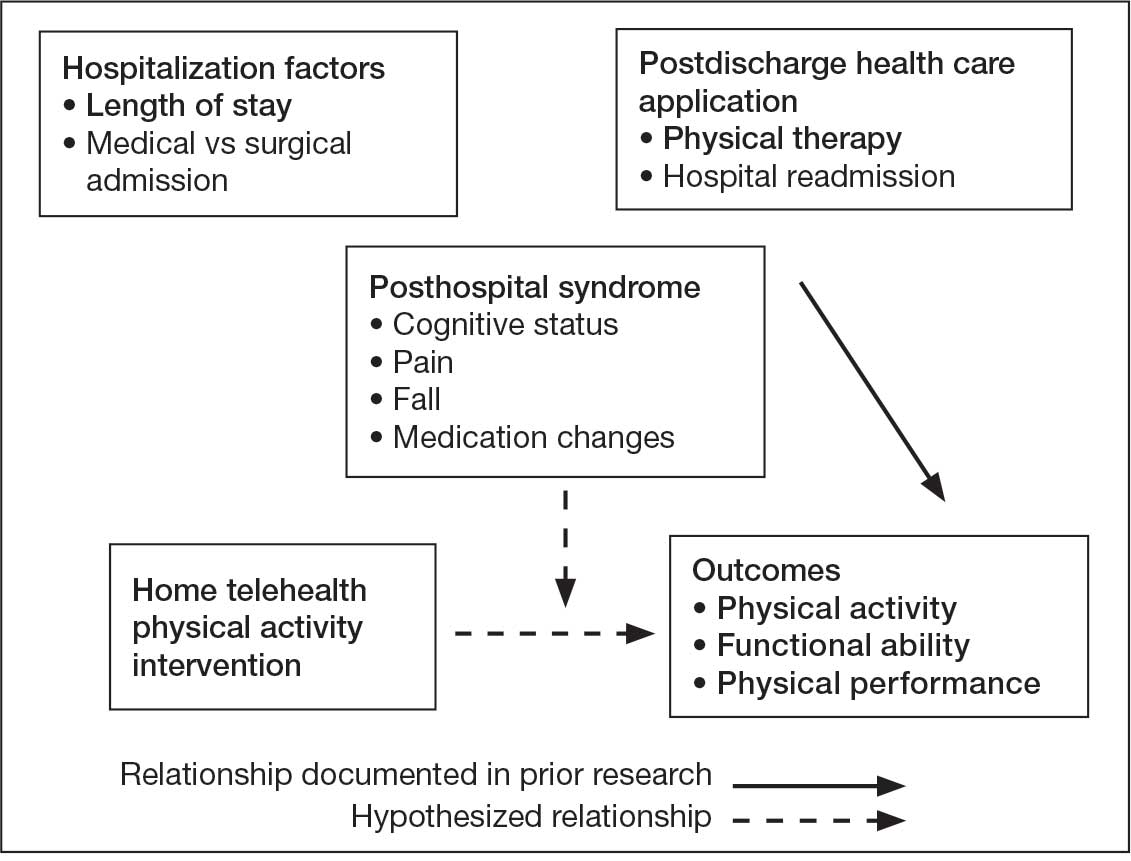
Key factors underlying the complexity of hospital-to-home transitions include hospitalization elements (ie, reason for admission and length of stay), associated posthospital syndromes (ie, postdischarge falls, medication changes, cognitive impairment, and pain), and postdischarge health care application (ie, physical therapy and hospital readmission).16-18 These factors may be associated with postdischarge functional ability, physical performance, and physical activity, but their direct influence on intervention outcomes is unclear (Figure 1).5,7,9,16-20 The objective of this study was to examine the influence of hospitalization, posthospital syndrome, and postdischarge health care application factors on outcomes of a US Department of Veterans Affairs (VA) Video Connect (VVC) intervention to enhance function and physical activity in older adults posthospital discharge.
health care application factors on physical activity, functional ability, and
physical performance intervention outcomes.
Methods
The previous analysis reported on patient characteristics, program feasibility, and preliminary outcomes.13,15 The current study reports on relationships between hospitalization, posthospital syndrome, and postdischarge health care application factors and change in key outcomes, namely postdischarge self-reported functional ability, physical performance, and physical activity from baseline to endpoint.
Participants provided written informed consent. The protocol and consent forms were approved by the VA Ann Arbor Healthcare System (VAAAHS) Research and Development Committee, and the project was registered on clinicaltrials.gov (NCT04045054).
Intervention
The pilot program targeted older adults following recent hospital discharge from VAAAHS. Participants were eligible if they were aged ≥ 50 years, had been discharged following an inpatient stay in the past 1 to 2 weeks, evaluated by physical therapy during hospitalization with stated rehabilitation goals on discharge, and followed by a VAAAHS primary care physician. Participants were either recruited during hospital admission or shortly after discharge.13
An experienced physical activity trainer (PAT) supported the progression of participants’ rehabilitation goals via a home exercise program and coached the patient and caregiver to optimize functional ability, physical performance, and physical activity. The PAT was a nonlicensed research assistant with extensive experience in applying standard physical activity enhancement protocols (eg, increased walking) to older adults with comorbidities. Participation in the program lasted about 6 months. Initiation of the PAT program was delayed if the patient was already receiving postdischarge home-based or outpatient physical therapy. The PAT contacted the patient weekly via VVC for the first 6 weeks, then monthly for a total of 6 months. Each contact included information on optimal walking form, injury prevention, program progression, and ways to incorporate sit-to-stand transitions, nonsitting behavior, and walking into daily routines. The initial VVC contact lasted about 60 minutes and subsequent sessions lasted about 30 minutes.13
Demographic characteristics were self-reported by participants and included age, sex, race, years of education, and marital status. Clinical characteristics were obtained from each participant’s electronic health record (EHR), including copay status, index hospitalization length of stay, admission diagnosis, and postsurgery status (postsurgery vs nonpostsurgery). Intervention adherence was tracked as the number of PAT sessions attended.
Posthospital Syndrome Factors
Participant falls (categorized as those who reported a fall vs those who did not) and medication changes (number of changes reported, including new medication, discontinued medication, dose changes, medication changes, or changes in medication schedule) were reported by participants or caregivers during each VVC contact. Participants completed the Montreal Cognitive Assessment (MoCA) at baseline, and were dichotomized into 2 groups: no cognitive impairment (MoCA score ≥ 26) and mild to moderate cognitive impairment (MoCA score 10-25).13,21
Participants rated how much pain interfered with their normal daily activities since the previous VVC session on a 5-point Likert scale (1, not at all; to 5, extremely).22 Similar to prior research, participants were placed into 2 groups based on their mean pain interference score (individuals with scores from 1.0 to 2.0 in 1 group, and individuals with > 2.0 in another).23-25 Participants were separated into a no or mild pain interference group and a moderate to severe pain interference group. Hospital readmissions (VA and non-VA) and postdischarge physical therapy outcomes were obtained from the participant’s EHR, including primary care visits.
Outcomes
Outcomes were collected at baseline (posthospital discharge) and 6 months postenrollment.
Self-Reported Functional Ability. This measure is provided by participants or caregivers and measured by the Katz Index of Independence in Activities of Daily Living (ADL), Lawton and Brody Instrumental ADL Scale (IADL), Nagi Disability Model, and Rosow-Breslau Scale. The Katz ADL assesses the ability to complete 6 self-care activities and awards 1 point for independence and 0 if the individual is dependent (total score range, 0-6).26 The Lawton and Brody IADL measures an individual’s independence in 8 instrumental ADLs; it awards 1 point for independence and 0 if the individual is dependent (total score range, 0-8).27 The Nagi Disability Model evaluates an individual’s difficulty performing 5 tasks (total score range, 0-5) and tallies the number of items with a response other than “no difficulty at all” (higher total score indicates greater difficulty). 28 The Rosow-Breslau Scale is a 3-item measure of mobility disability; individual responses are 0 (no help) and 1 (requires help or unable); higher total score (range, 0-3) indicates greater disability.29
Physical Performance. Measured using the Short Physical Performance Battery (SPPB), which evaluates standing balance, sit to stand, and walking performance. Scores range from 0 to 4 on the balance, gait speed, and chair stand tests, for a total composite score between 0 and 12 (higher score indicates better performance).30
Physical Activity. Measured using actigraphy, namely a physical activity monitor adherent to the thigh (activ-PAL3TM, PAL Technologies Ltd., Glasgow, UK).31 Participants were instructed to wear the activPal for ≥ 1 week. Participants with a minimum of 5 days of wear were included in this analysis.
Data Analyses
Analyses were performed using SPSS software version 29.0.32 Continuous variables were summarized using mean (SD) or median and IQR using the weighted average method; categorical variables were summarized using frequencies and percentages. Baseline scores on outcome variables were compared by categorical hospitalization, posthospital syndrome, and postdischarge health care application factor variables using Mann-Whitney U tests. The differences between outcome variables from baseline to endpoint were then calculated to produce change scores. Relationships between the number of PAT sessions attended and baseline outcomes and outcome change scores were estimated using Spearman correlations. Relationships between categorical factors (hospitalization, posthospital syndrome, and postdischarge health care application) and outcome variable change scores (which were normally distributed) were examined using Mann-Whitney U tests. Relationships with continuous hospitalization (length of stay) and posthospital syndrome factors (medication changes) were estimated using Spearman correlations. Effect sizes (ES) were estimated with Cohen d; small (d = 0.2), medium (d = 0.5), or large (d ≥ 0.8). Missing data were handled using pairwise deletion.33 Therefore, sample sizes were reported for each analysis. For all statistical tests, P < .05 was considered significant.
Results
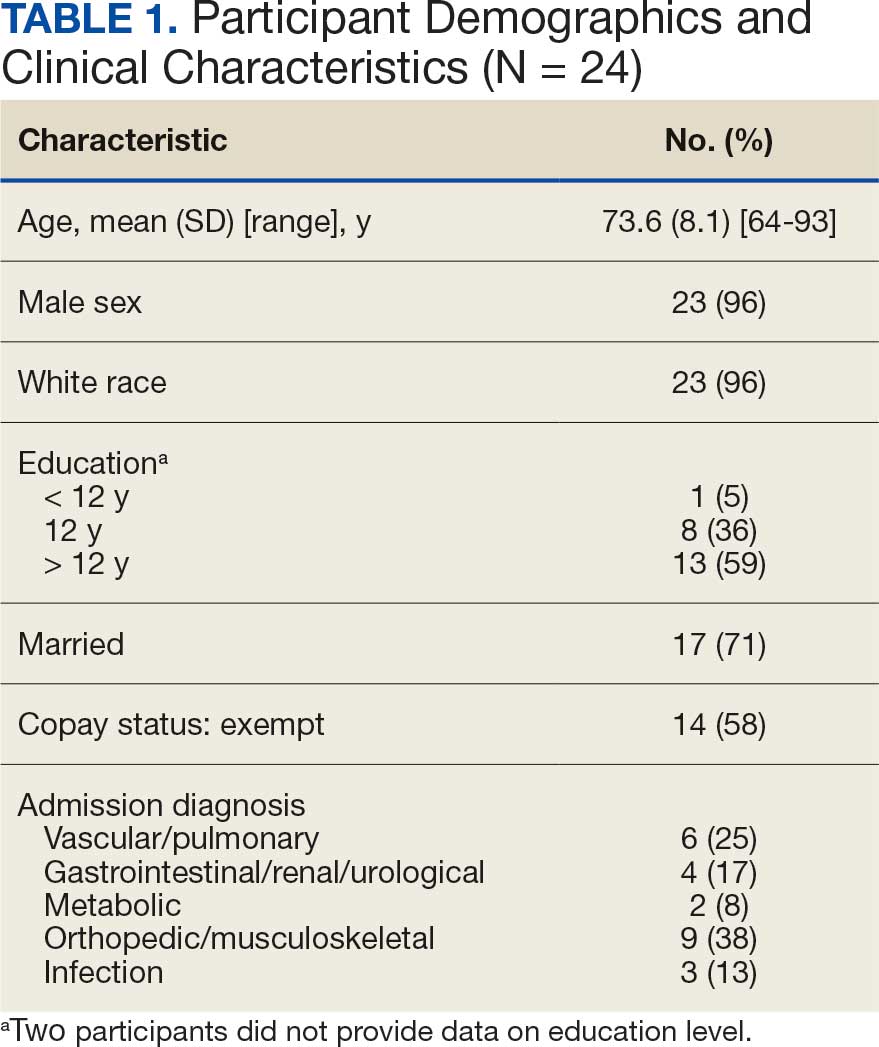
Twenty-four individuals completed the pilot intervention.15 Mean (SD) age was 73.6 (8.1) years (range, 64-93 years) and participants were predominantly White males (Table 1). Eight participants had a high school education only and 13 had more than a high school education. Diagnoses at admission included 9 patients with orthopedic/musculoskeletal conditions (6 were for joint replacement), 6 patients with vascular/pulmonary conditions, and 4 with gastrointestinal/renal/urological conditions. Of the 11 postsurgery participants, 7 were orthopedic, 4 were gastrointestinal, and 1 was peripheral vascular.
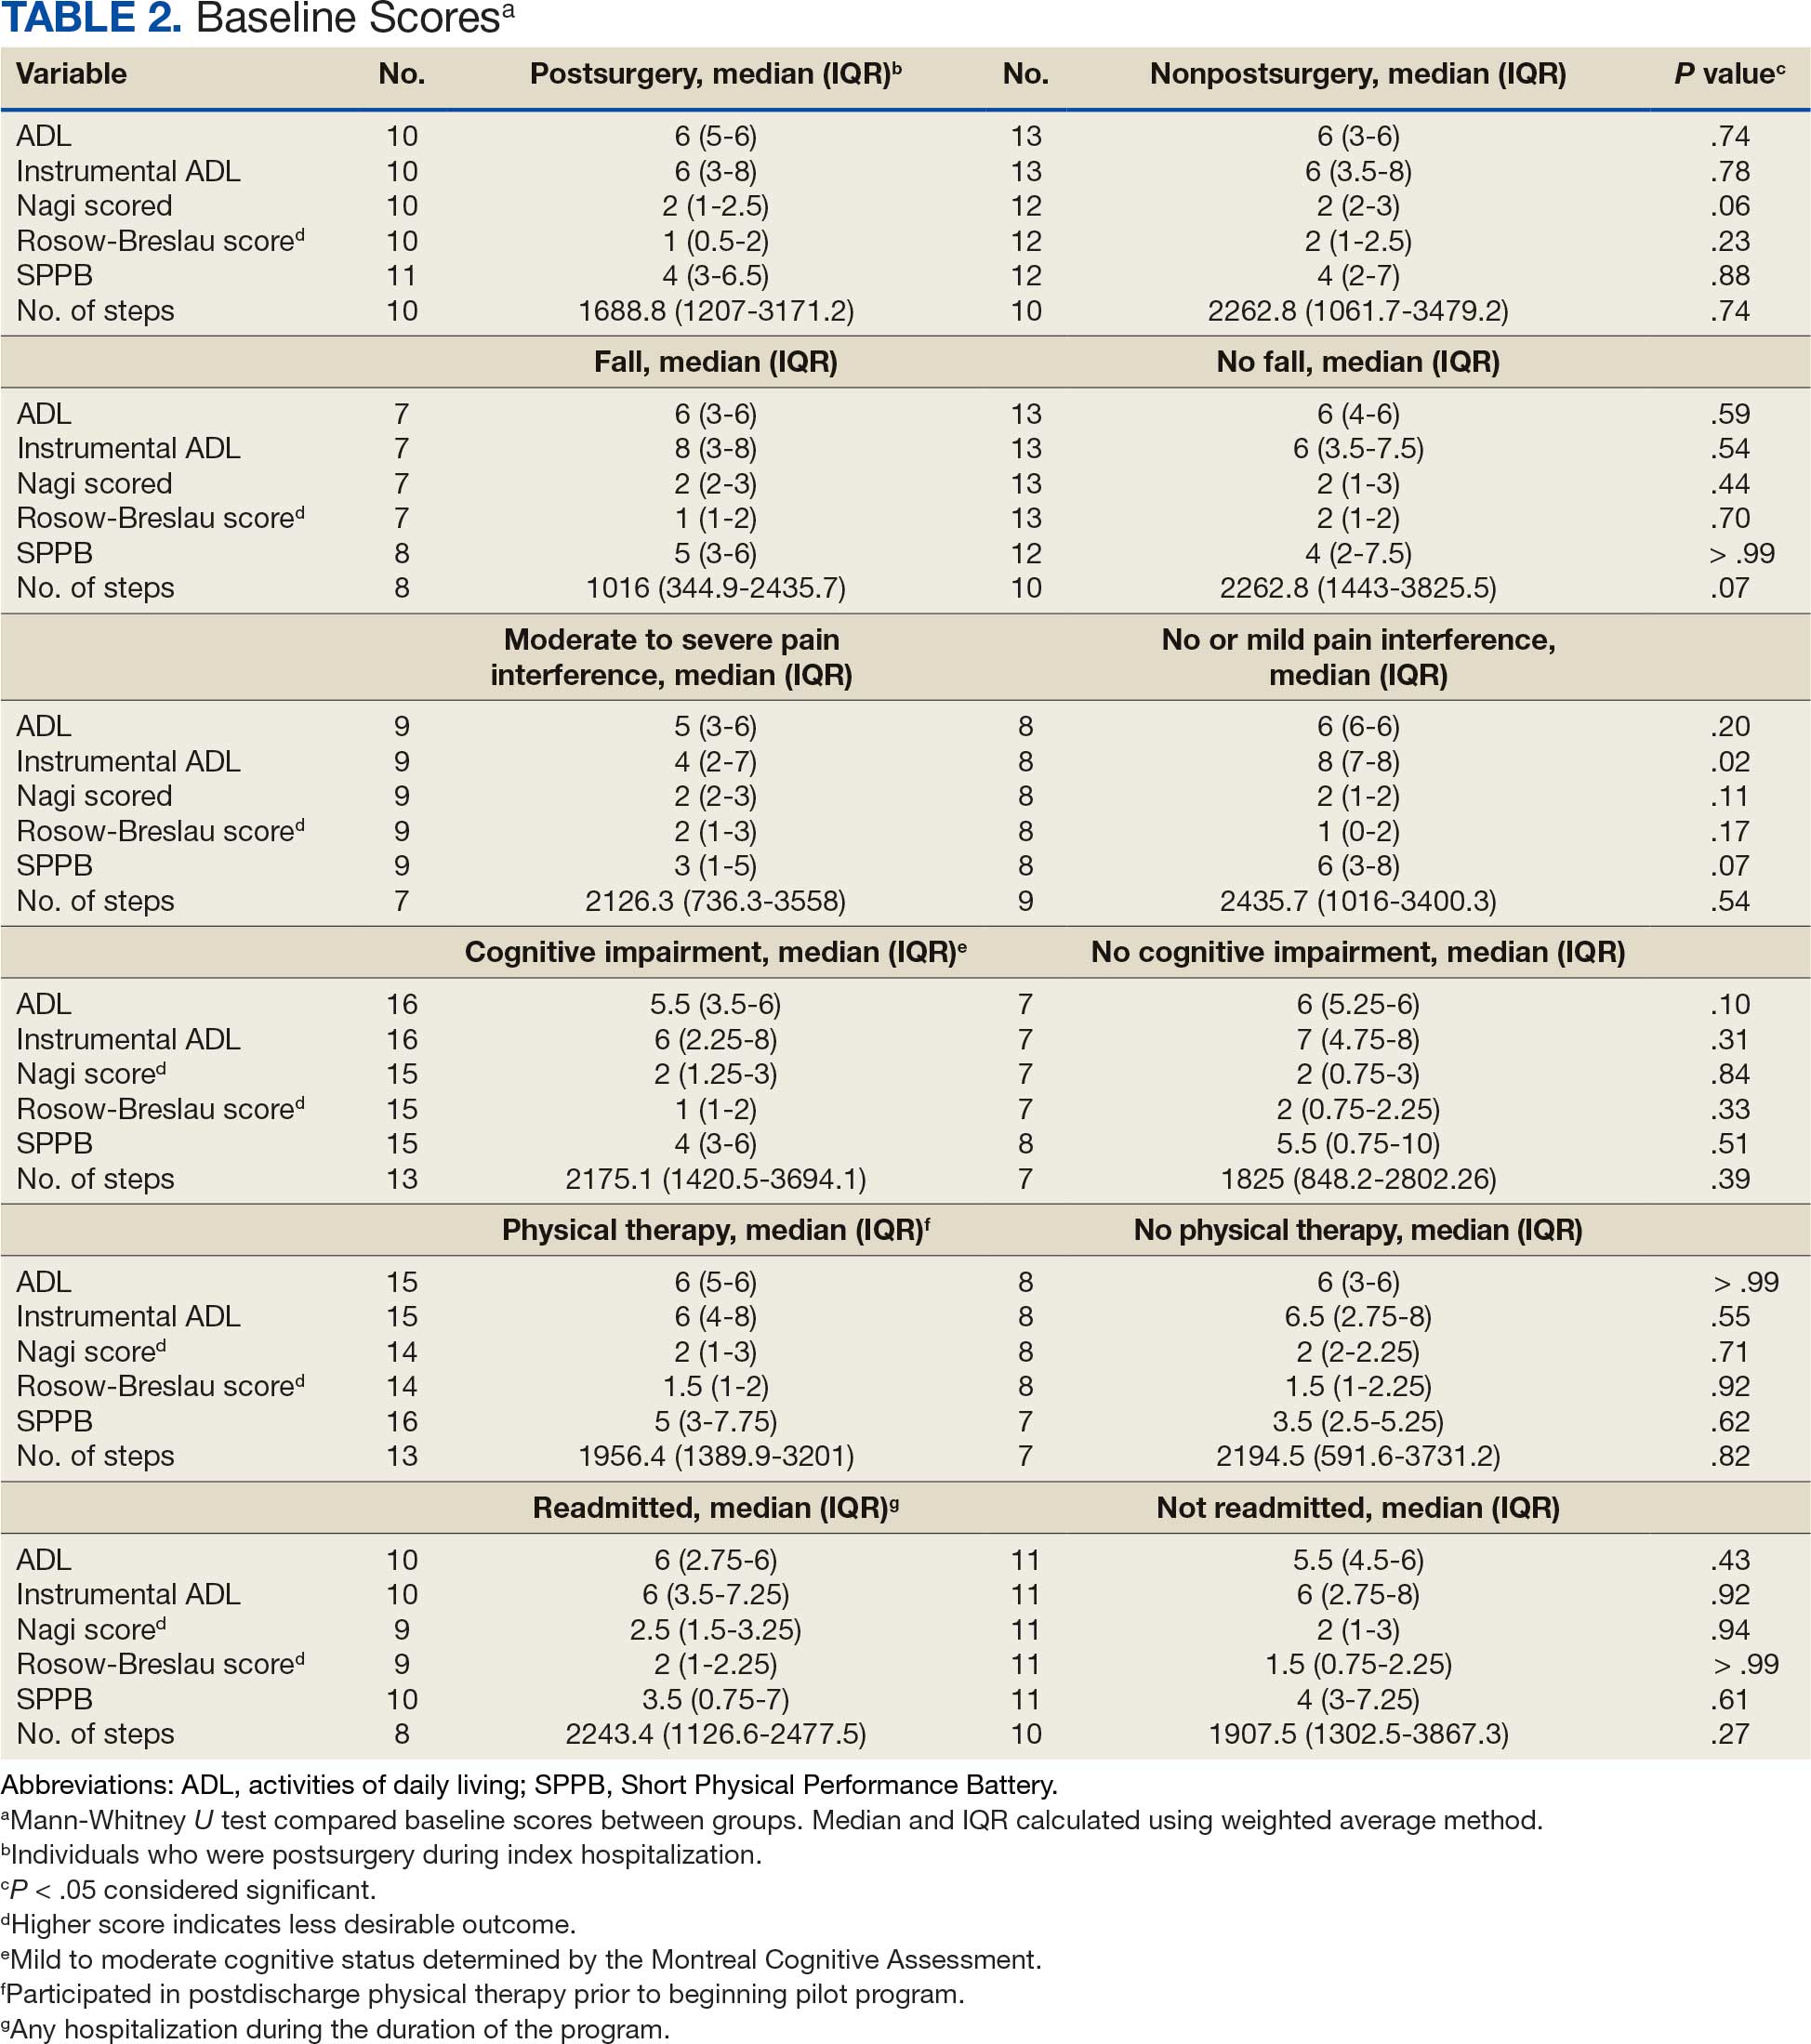
Baseline outcome scores did not differ significantly between groups, except individuals with moderate to severe pain interference reported a significantly lower IADL score (median [IQR] 4 [2-7]) than individuals with mild or moderate pain interference (median [IQR] 8 [7-8]; P = .02) (Table 2). The mean (SD) number of PAT sessions attended was 9.3 (3.7) (range, 3-19). There were no significant relationships between number of sessions attended and any baseline outcome variables or outcome change scores.
Hospitalization Factors
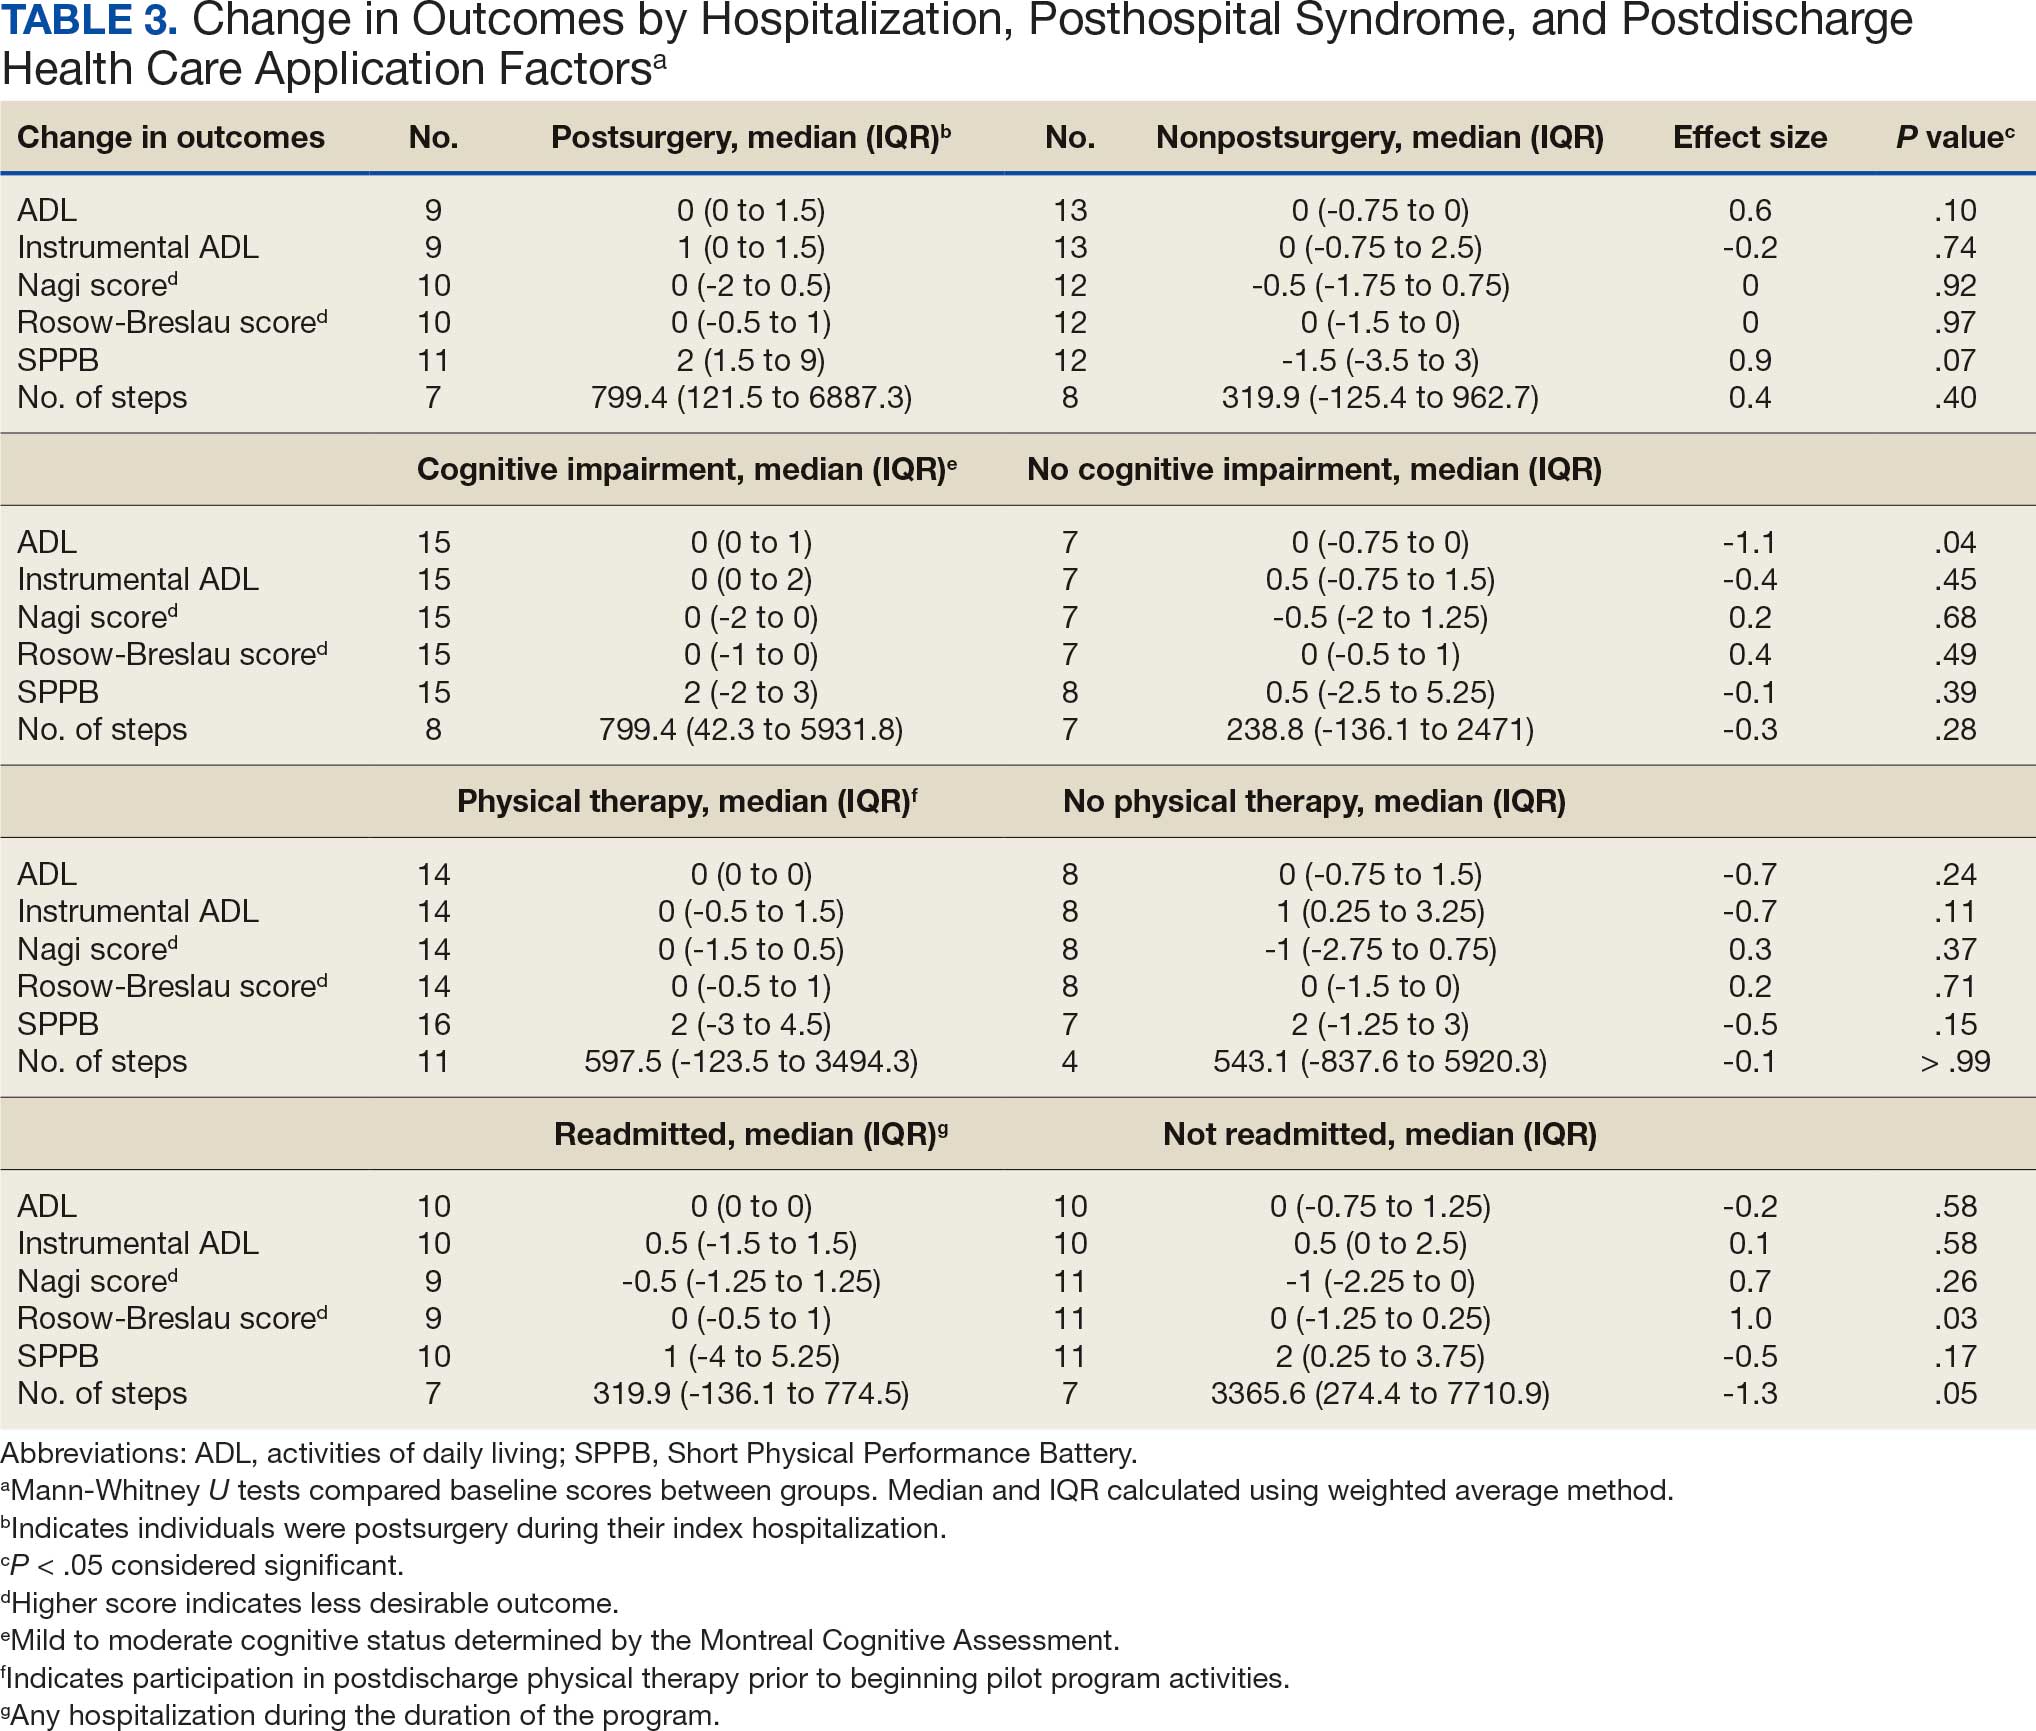
Participants who were postsurgery tended to have greater improvement than individuals who were nonpostsurgery in ADLs (median [IQR] 0 [0-1.5]; ES, 0.6; P = .10) and SPPB (median [IQR] 2 [1.5-9]; ES, 0.9; P = .07), but the improvements were not statistically significant (Table 3). Mean (SD) length of stay of the index hospitalization was 6.7 (6.1) days. Longer length of stay was significantly correlated with an increase in Nagi score (ρ, 0.45; 95% CI, 0.01-0.75). There were no other significant or trending relationships between length of stay and outcome variables.
Posthospital Syndrome Factors
The 16 participants with mild to moderate cognitive impairment had less improvement in ADLs (median [IQR] 0 [0-1]) than the 8 participants with no impairment (median [IQR] 0 [-0.75 to 0]; ES, -1.1; P = .04). Change in outcome variables from baseline to endpoint did not significantly differ between the 8 patients who reported a fall compared with the 13 who did not, nor were any trends observed. Change in outcome variables from baseline to endpoint also did not significantly differ between the 8 participants who reported no or mild pain interference compared with the 10 patients with moderate to severe pain interference, nor were any trends observed. Mean (SD) number of medication changes was 2.5 (1.6). Higher number of medication changes was significantly correlated with a decrease in Rosow-Breslau score (ρ, -0.47; 95% CI, -0.76 to -0.02). There were no other significant or trending relationships between number of medication changes and outcome variables.
Postdischarge Health Care Application Factors
The 16 participants who attended posthospital physical therapy trended towards less improvement in IADLs (median [IQR] 0 [-0.5 to 1.5]; ES, -0.7; P = .11) and SPPB (median [IQR] 2 [-3.0 to 4.5]; ES, -0.5; P = .15) than the 8 patients with no postdischarge physical therapy. Eleven participants were readmitted, while 13 had no readmissions in their medical records between baseline and endpoint. Participants with ≥ 1 readmission experienced a greater increase in Rosow-Breslau score (median [IQR] 0 [-0.5 to 1.0]) than those not readmitted (median [IQR] 0 [-1.25 to 0.25]; ES, 1.0; P = .03). Borderline greater improvement in number of steps was found in those not readmitted (median [IQR] 3365.6 [274.4-7710.9]) compared with those readmitted (median [IQR] 319.9 [-136.1 to 774.5]; ES, -1.3; P = .05). Patients who were readmitted also tended to have lower and not statistically significant improvements in SPPB (median [IQR] 1 [-4.0 to 5.3]) compared with those not readmitted (median [IQR] 2 [0.3-3.8]; ES, -0.5; P = .17) (Table 3).
Discussion
This study examined the association between hospitalization, posthospital syndrome, and postdischarge health care use in patients undergoing a VVC-based intervention following hospital discharge. Participants who had no or mild cognitive impairment, no readmissions, higher medication changes, and a shorter hospital length of stay tended to experience lower disability, including in mobility and ADLs. This suggests individuals who are less clinically complex may be more likely to benefit from this type of virtual rehabilitation program. These findings are consistent with clinical experiences; home-based programs to improve physical activity posthospital discharge can be challenging for those who were medically ill (and did not undergo a specific surgical procedure), cognitively impaired, and become acutely ill and trigger hospital readmission. 15 For example, the sample in this study had higher rates of falls, pain, and readmissions compared to previous research.2,3,34-39
The importance of posthospital syndrome in the context of recovery of function and health at home following hospitalization is well documented.16-18 The potential impact of posthospital syndrome on physical activity-focused interventions is less understood. In our analysis, participants with mild or moderate cognitive impairment tended to become more dependent in their ADLs, while those with no cognitive impairment tended to become more independent in their ADLs. This functional decline over time is perhaps expected in persons with cognitive impairment, but the significant difference with a large ES warrants further consideration on how to tailor interventions to better promote functional recovery in these individuals.40,41 While some cognitive decline may not be preventable, this finding supports the need to promote healthy cognitive aging, identify declines in cognition, and work to mitigate additional decline. Programs specifically designed to promote function and physical activity in older adults with cognitive impairment are needed, especially during care transitions.41-43
While participants reported that falls and pain interference did not have a significant impact on change in outcomes between baseline and endpoint, these areas need further investigation. Falls and pain have been associated with function and physical activity in older adults.42-46 Pain is common, yet underappreciated during older adult hospital-to-home transitions.11,12,45,46 There is a need for more comprehensive assessment of pain (including pain intensity) and qualitative research.
Hospitalization and postdischarge health care application factors may have a significant impact on home-telehealth physical activity intervention success. Individuals who were postsurgery tended to have greater improvements in ADLs and physical performance. Most postsurgery participants had joint replacement surgery. Postsurgery status may not be modifiable, but it is important to note expected differences in recovery between medical and surgical admissions and the need to tailor care based on admission diagnosis. Those with a longer length of hospital stay may be considered at higher risk of suboptimal outcomes postdischarge, which indicates an opportunity for targeting resources and support, in addition to efforts of reducing length of stay where possible.47
Readmissions were significantly related to a change in Rosow-Breslau mobility disability score. This may indicate the detrimental impact a readmission can have on increasing mobility and physical activity postdischarge, or the potential of this pilot program to impact readmissions by increasing mobility and physical activity, contrary to prior physical exercise interventions.5,7,9,48 With 5% to 79% of readmissions considered preventable, continued efforts and program dissemination and implementation to address preventable readmissions are warranted.49 Individuals with postdischarge physical therapy (prior to beginning the pilot program) tended to demonstrate less improvement in disability and physical performance. This relationship needs further investigation; the 2 groups did not appear to have significant differences at baseline, albeit with a small sample size. It is possible they experienced initial improvements with postdischarge physical therapy and plateaued or had little further reserve to improve upon entering the VVC program.
Strengths and Limitations
This pilot program provided evaluative data on the use of VVC to enhance function and physical activity in older adults posthospital discharge. It included individual (eg, fall, pain, cognitive impairment) and health service (eg, readmission, physical therapy) level factors as predictors of function and physical activity posthospitalization.5,7,9,15-19
The results of this pilot project stem from a small sample lacking diversity in terms of race, ethnicity, and sex. There was some variation in baseline and endpoints between participants, and when hospitalization, posthospital syndrome, and postdischarge health care application factors were collected. The majority of participants were recruited within a month postdischarge, and the program lasted about 6 months. Data collection was attempted at regular PAT contacts, but there was some variation in when visits occurred based on participant availability and preference. Some participants had missing data, which was handled using pairwise deletion.33 Larger studies are needed to confirm the findings of this study, particularly the trends that did not reach statistical significance. Home health services other than physical therapy (eg, nursing, occupational therapy) were not fully accounted for and should be considered in future research.
Conclusions
In patients undergoing a 6-month pilot VVC-based physical activity intervention posthospital discharge, improvements in mobility and disability were most likely in those who had no cognitive impairment and were not readmitted. Larger sample and qualitative investigations are necessary to optimize outcomes for patients who meet these clinical profiles.
- Liebzeit D, Bratzke L, Boltz M, Purvis S, King B. Getting back to normal: a grounded theory study of function in post-hospitalized older adults. Gerontologist. 2020;60:704-714. doi:10.1093/geront/gnz057
- Ponzetto M, Zanocchi M, Maero B, et al. Post-hospitalization mortality in the elderly. Arch Gerontol Geriatr. 2003;36:83-91. doi:10.1016/s0167-4943(02)00061-4
- Buurman BM, Hoogerduijn JG, de Haan RJ, et al. Geriatric conditions in acutely hospitalized older patients: prevalence and one-year survival and functional decline. PLoS One. 2011;6:e26951. doi:10.1371/journal.pone.0026951
- Ponzetto M, Maero B, Maina P, et al. Risk factors for early and late mortality in hospitalized older patients: the continuing importance of functional status. J Gerontol A Biol Sci Med Sci. 2003;58:1049-1054. doi:10.1093/gerona/58.11.m1049
- Huang HT, Chang CM, Liu LF, Lin HS, Chen CH. Trajectories and predictors of functional decline of hospitalised older patients. J Clin Nurs. 2013;22:1322-1331. doi:10.1111/jocn.12055
- Boyd CM, Landefeld CS, Counsell SR, et al. Recovery of activities of daily living in older adults after hospitalization for acute medical illness. J Am Geriatr Soc. 2008;56:2171- 2179. doi:10.1111/j.1532-5415.2008.02023.x
- Helvik AS, Selbæk G, Engedal K. Functional decline in older adults one year after hospitalization. Arch Gerontol Geriatr. 2013;57:305-310. doi:10.1016/j.archger.2013.05.008
- Zaslavsky O, Zisberg A, Shadmi E. Impact of functional change before and during hospitalization on functional recovery 1 month following hospitalization. J Gerontol Biol Sci Med Sci. 2015;70:381-386. doi:10.1093/gerona/glu168
- Chen CC, Wang C, Huang GH. Functional trajectory 6 months posthospitalization: a cohort study of older hospitalized patients in Taiwan. Nurs Res. 2008;57:93-100. doi:10.1097/01.NNR.0000313485.18670.e2
- Kleinpell RM, Fletcher K, Jennings BM. Reducing functional decline in hospitalized elderly. In: Hughes RG, ed. Patient Safety and Quality: An Evidence-Based Handbook for Nurses. Agency for Healthcare Research and Quality (US); 2008. Accessed September 3, 2025. http://www.ncbi.nlm.nih.gov/books/NBK2629/
- Liebzeit D, Rutkowski R, Arbaje AI, Fields B, Werner NE. A scoping review of interventions for older adults transitioning from hospital to home. J Am Geriatr Soc. 2021;69:2950-2962. doi:10.1111/jgs.17323
- Hladkowicz E, Dumitrascu F, Auais M, et al. Evaluations of postoperative transitions in care for older adults: a scoping review. BMC Geriatr. 2022;22:329. doi:10.1186/s12877-022-02989-6
- Alexander NB, Phillips K, Wagner-Felkey J, et al. Team VA Video Connect (VVC) to optimize mobility and physical activity in post-hospital discharge older veterans: baseline assessment. BMC Geriatr. 2021;21:502. doi:10.1186/s12877-021-02454-w
- Dawson R, Oliveira JS, Kwok WS, et al. Exercise interventions delivered through telehealth to improve physical functioning for older adults with frailty, cognitive, or mobility disability: a systematic review and meta-analysis. Telemed J E Health. 2024;30:940-950. doi:10.1089/tmj.2023.0177
- Liebzeit D, Phillips KK, Hogikyan RV, Cigolle CT, Alexander NB. A pilot home-telehealth program to enhance functional ability, physical performance, and physical activity in older adult veterans post-hospital discharge. Res Gerontol Nurs. 2024;17:271-279. doi:10.3928/19404921-20241105-01
- Krumholz HM. Post-hospital syndrome—an acquired, transient condition of generalized risk. N Engl J Med. 2013;368:100-102. doi:10.1056/NEJMp1212324
- Caraballo C, Dharmarajan K, Krumholz HM. Post hospital syndrome: is the stress of hospitalization causing harm? Rev Esp Cardiol (Engl Ed). 2019;72:896-898. doi:10.1016/j.rec.2019.04.010
- Rawal S, Kwan JL, Razak F, et al. Association of the trauma of hospitalization with 30-day readmission or emergency department visit. JAMA Intern Med. 2019;179:38- 45. doi:10.1001/jamainternmed.2018.5100
- Dutzi I, Schwenk M, Kirchner M, Jooss E, Bauer JM, Hauer K. Influence of cognitive impairment on rehabilitation received and its mediating effect on functional recovery. J Alzheimers Dis. 2021;84:745-756. doi:10.3233/JAD-210620
- Uriz-Otano F, Uriz-Otano JI, Malafarina V. Factors associated with short-term functional recovery in elderly people with a hip fracture. Influence ofcognitiveimpairment. JAmMedDirAssoc. 2015;16:215-220. doi:10.1016/j.jamda.2014.09.009
- Nasreddine ZS, Phillips NA, Bédirian V, et al. The Montreal Cognitive Assessment, MoCA: a brief screening tool for mild cognitive impairment. J Am Geriatr Soc. 2005;53:695-699. doi:10.1111/j.1532-5415.2005.53221.x
- Ware JE Jr, Sherbourne CD. The MOS 36-item short-form health survey (SF-36). I. Conceptual framework and item selection. Med Care. 1992;30:473-483.
- White RS, Jiang J, Hall CB, et al. Higher perceived stress scale scores are associated with higher pain intensity and pain interference levels in older adults. J Am Geriatr Soc. 2014;62:2350-2356. doi:10.1111/jgs.13135
- Blyth FM, March LM, Brnabic AJ, et al. Chronic pain in Australia: a prevalence study. Pain. 2001;89:127-134. doi:10.1016/s0304-3959(00)00355-9
- Thomas E, Peat G, Harris L, Wilkie R, Croft PR. The prevalence of pain and pain interference in a general population of older adults: cross-sectional findings from the North Staffordshire Osteoarthritis Project (NorStOP). Pain. 2004;110:361-368. doi:10.1016/j.pain.2004.04.017
- Katz S, Ford AB, Moskowitz RW, Jackson BA, Jaffe MW. Studies of illness in the aged. The index of ADL: a standardized measure of biological and psychosocial function. JAMA. 1963;185:914-919. doi:10.1001/jama.1963.03060120024016
- Lawton MP, Brody EM. Assessment of older people: self-maintaining and instrumental activities of daily living. Gerontologist. 1969;9:179-186.
- Alexander NB, Guire KE, Thelen DG, et al. Self-reported walking ability predicts functional mobility performance in frail older adults. J Am Geriatr Soc. 2000;48:1408-1413. doi:10.1111/j.1532-5415.2000.tb02630.x
- Rosow I, Breslau N. A Guttman health scale for the aged. J Gerontol. 1966;21:556-559. doi:10.1093/geronj/21.4.556
- Guralnik JM, Simonsick EM, Ferrucci L, et al. A short physical performance battery assessing lower extremity function: association with self-reported disability and prediction of mortality and nursing home admission. J Gerontol. 1994;49:M85-M94. doi:10.1093/geronj/49.2.m85
- Chan CS, Slaughter SE, Jones CA, Ickert C, Wagg AS. Measuring activity performance of older adults using the activPAL: a rapid review. Healthcare (Basel). 2017;5:94. doi:10.3390/healthcare5040094
- IBM SPSS software. IBM Corp; 2019. Accessed September 3, 2025. https://www.ibm.com/spss
- Kang H. The prevention and handling of the missing data. Korean J Anesthesiol. 2013;64:402-406. doi:10.4097/kjae.2013.64.5.402
- Epstein AM, Jha AK, Orav EJ. The relationship between hospital admission rates and rehospitalizations. N Engl J Med. 2011;365:2287-2295. doi:10.1056/NEJMsa1101942
- Bogaisky M, Dezieck L. Early hospital readmission of nursing home residents and community-dwelling elderly adults discharged from the geriatrics service of an urban teaching hospital: patterns and risk factors. J Am Geriatr Soc. 2015;63:548-552. doi:10.1111/jgs.13317
- Jencks SF, Williams MV, Coleman EA. Rehospitalizations among patients in the Medicare fee-for-service program. N Engl J Med. 2009;360:1418-1428. doi:10.1056/NEJMsa0803563
- Hoyer EH, Needham DM, Atanelov L, Knox B, Friedman M, Brotman DJ. Association of impaired functional status at hospital discharge and subsequent rehospitalization. J Hosp Med. 2014;9:277-282. doi:10.1002/jhm.2152
- Mahoney J, Sager M, Dunham NC, Johnson J. Risk of falls after hospital discharge. J Am Geriatr Soc. 1994;42:269- 274. doi:10.1111/j.1532-5415.1994.tb01750.x
- Hoffman GJ, Liu H, Alexander NB, Tinetti M, Braun TM, Min LC. Posthospital fall injuries and 30-day readmissions in adults 65 years and older. JAMA Netw Open. 2019;2:e194276. doi:10.1001/jamanetworkopen.2019.4276
- Gill DP, Hubbard RA, Koepsell TD, et al. Differences in rate of functional decline across three dementia types. Alzheimers Dement. 2013;9:S63-S71. doi:10.1016/j.jalz.2012.10.010
- Auyeung TW, Kwok T, Lee J, Leung PC, Leung J, Woo J. Functional decline in cognitive impairment–the relationship between physical and cognitive function. Neuroepidemiology. 2008;31:167-173. doi:10.1159/000154929
- Patti A, Zangla D, Sahin FN, et al. Physical exercise and prevention of falls. Effects of a Pilates training method compared with a general physical activity program. Medicine (Baltimore). 2021;100:e25289. doi:10.1097/MD.0000000000025289
- Nagarkar A, Kulkarni S. Association between daily activities and fall in older adults: an analysis of longitudinal ageing study in India (2017-18). BMC Geriatr. 2022;22:203. doi:10.1186/s12877-022-02879-x
- Ek S, Rizzuto D, Xu W, Calderón-Larrañaga A, Welmer AK. Predictors for functional decline after an injurious fall: a population-based cohort study. Aging Clin Exp Res. 2021;33:2183-2190. doi:10.1007/s40520-020-01747-1
- Dagnino APA, Campos MM. Chronic pain in the elderly: mechanisms and perspectives. Front Hum Neurosci. 2022;16:736688. doi:10.3389/fnhum.2022.736688
- Ritchie CS, Patel K, Boscardin J, et al. Impact of persistent pain on function, cognition, and well-being of older adults. J Am Geriatr Soc. 2023;71:26-35. doi:10.1111/jgs.18125
- Han TS, Murray P, Robin J, et al. Evaluation of the association of length of stay in hospital and outcomes. Int J Qual Health Care. 2022;34:mzab160. doi:10.1093/intqhc/ mzab160
- Lærum-Onsager E, Molin M, Olsen CF, et al. Effect of nutritional and physical exercise intervention on hospital readmission for patients aged 65 or older: a systematic review and meta-analysis of randomized controlled trials. Int J Behav Nutr Phys Act. 2021;18:62. doi:10.1186/s12966-021-01123-w
- Van Walraven C, Bennett C, Jennings A, Austin PC, Forster AJ. Proportion of hospital readmissions deemed avoidable: a systematic review. CMAJ. 2011;183:E391-E402. doi:10.1503/cmaj.101860
Deconditioning among hospitalized older adults contributes to significant decline in posthospitalization functional ability, physical performance, and physical activity.1-10 Previous hospital-to-home interventions have targeted improving function and physical activity, including recent programs leveraging home telehealth as a feasible and potentially effective mode of delivering in-home exercise and rehabilitation.11-14 However, pilot interventions have shown mixed effectiveness.11,12,14 This study expands on a previously published intervention describing a pilot home telehealth program for veterans posthospital discharge that demonstrated significant 6-month improvement in physical activity as well as trends in physical function improvement, including among those with cognitive impairment.15 Factors that contribute to improved outcomes are the focus of the present study.
Key factors underlying the complexity of hospital-to-home transitions include hospitalization elements (ie, reason for admission and length of stay), associated posthospital syndromes (ie, postdischarge falls, medication changes, cognitive impairment, and pain), and postdischarge health care application (ie, physical therapy and hospital readmission).16-18 These factors may be associated with postdischarge functional ability, physical performance, and physical activity, but their direct influence on intervention outcomes is unclear (Figure 1).5,7,9,16-20 The objective of this study was to examine the influence of hospitalization, posthospital syndrome, and postdischarge health care application factors on outcomes of a US Department of Veterans Affairs (VA) Video Connect (VVC) intervention to enhance function and physical activity in older adults posthospital discharge.
health care application factors on physical activity, functional ability, and
physical performance intervention outcomes.
Methods
The previous analysis reported on patient characteristics, program feasibility, and preliminary outcomes.13,15 The current study reports on relationships between hospitalization, posthospital syndrome, and postdischarge health care application factors and change in key outcomes, namely postdischarge self-reported functional ability, physical performance, and physical activity from baseline to endpoint.
Participants provided written informed consent. The protocol and consent forms were approved by the VA Ann Arbor Healthcare System (VAAAHS) Research and Development Committee, and the project was registered on clinicaltrials.gov (NCT04045054).
Intervention
The pilot program targeted older adults following recent hospital discharge from VAAAHS. Participants were eligible if they were aged ≥ 50 years, had been discharged following an inpatient stay in the past 1 to 2 weeks, evaluated by physical therapy during hospitalization with stated rehabilitation goals on discharge, and followed by a VAAAHS primary care physician. Participants were either recruited during hospital admission or shortly after discharge.13
An experienced physical activity trainer (PAT) supported the progression of participants’ rehabilitation goals via a home exercise program and coached the patient and caregiver to optimize functional ability, physical performance, and physical activity. The PAT was a nonlicensed research assistant with extensive experience in applying standard physical activity enhancement protocols (eg, increased walking) to older adults with comorbidities. Participation in the program lasted about 6 months. Initiation of the PAT program was delayed if the patient was already receiving postdischarge home-based or outpatient physical therapy. The PAT contacted the patient weekly via VVC for the first 6 weeks, then monthly for a total of 6 months. Each contact included information on optimal walking form, injury prevention, program progression, and ways to incorporate sit-to-stand transitions, nonsitting behavior, and walking into daily routines. The initial VVC contact lasted about 60 minutes and subsequent sessions lasted about 30 minutes.13
Demographic characteristics were self-reported by participants and included age, sex, race, years of education, and marital status. Clinical characteristics were obtained from each participant’s electronic health record (EHR), including copay status, index hospitalization length of stay, admission diagnosis, and postsurgery status (postsurgery vs nonpostsurgery). Intervention adherence was tracked as the number of PAT sessions attended.
Posthospital Syndrome Factors
Participant falls (categorized as those who reported a fall vs those who did not) and medication changes (number of changes reported, including new medication, discontinued medication, dose changes, medication changes, or changes in medication schedule) were reported by participants or caregivers during each VVC contact. Participants completed the Montreal Cognitive Assessment (MoCA) at baseline, and were dichotomized into 2 groups: no cognitive impairment (MoCA score ≥ 26) and mild to moderate cognitive impairment (MoCA score 10-25).13,21
Participants rated how much pain interfered with their normal daily activities since the previous VVC session on a 5-point Likert scale (1, not at all; to 5, extremely).22 Similar to prior research, participants were placed into 2 groups based on their mean pain interference score (individuals with scores from 1.0 to 2.0 in 1 group, and individuals with > 2.0 in another).23-25 Participants were separated into a no or mild pain interference group and a moderate to severe pain interference group. Hospital readmissions (VA and non-VA) and postdischarge physical therapy outcomes were obtained from the participant’s EHR, including primary care visits.
Outcomes
Outcomes were collected at baseline (posthospital discharge) and 6 months postenrollment.
Self-Reported Functional Ability. This measure is provided by participants or caregivers and measured by the Katz Index of Independence in Activities of Daily Living (ADL), Lawton and Brody Instrumental ADL Scale (IADL), Nagi Disability Model, and Rosow-Breslau Scale. The Katz ADL assesses the ability to complete 6 self-care activities and awards 1 point for independence and 0 if the individual is dependent (total score range, 0-6).26 The Lawton and Brody IADL measures an individual’s independence in 8 instrumental ADLs; it awards 1 point for independence and 0 if the individual is dependent (total score range, 0-8).27 The Nagi Disability Model evaluates an individual’s difficulty performing 5 tasks (total score range, 0-5) and tallies the number of items with a response other than “no difficulty at all” (higher total score indicates greater difficulty). 28 The Rosow-Breslau Scale is a 3-item measure of mobility disability; individual responses are 0 (no help) and 1 (requires help or unable); higher total score (range, 0-3) indicates greater disability.29
Physical Performance. Measured using the Short Physical Performance Battery (SPPB), which evaluates standing balance, sit to stand, and walking performance. Scores range from 0 to 4 on the balance, gait speed, and chair stand tests, for a total composite score between 0 and 12 (higher score indicates better performance).30
Physical Activity. Measured using actigraphy, namely a physical activity monitor adherent to the thigh (activ-PAL3TM, PAL Technologies Ltd., Glasgow, UK).31 Participants were instructed to wear the activPal for ≥ 1 week. Participants with a minimum of 5 days of wear were included in this analysis.
Data Analyses
Analyses were performed using SPSS software version 29.0.32 Continuous variables were summarized using mean (SD) or median and IQR using the weighted average method; categorical variables were summarized using frequencies and percentages. Baseline scores on outcome variables were compared by categorical hospitalization, posthospital syndrome, and postdischarge health care application factor variables using Mann-Whitney U tests. The differences between outcome variables from baseline to endpoint were then calculated to produce change scores. Relationships between the number of PAT sessions attended and baseline outcomes and outcome change scores were estimated using Spearman correlations. Relationships between categorical factors (hospitalization, posthospital syndrome, and postdischarge health care application) and outcome variable change scores (which were normally distributed) were examined using Mann-Whitney U tests. Relationships with continuous hospitalization (length of stay) and posthospital syndrome factors (medication changes) were estimated using Spearman correlations. Effect sizes (ES) were estimated with Cohen d; small (d = 0.2), medium (d = 0.5), or large (d ≥ 0.8). Missing data were handled using pairwise deletion.33 Therefore, sample sizes were reported for each analysis. For all statistical tests, P < .05 was considered significant.
Results
Twenty-four individuals completed the pilot intervention.15 Mean (SD) age was 73.6 (8.1) years (range, 64-93 years) and participants were predominantly White males (Table 1). Eight participants had a high school education only and 13 had more than a high school education. Diagnoses at admission included 9 patients with orthopedic/musculoskeletal conditions (6 were for joint replacement), 6 patients with vascular/pulmonary conditions, and 4 with gastrointestinal/renal/urological conditions. Of the 11 postsurgery participants, 7 were orthopedic, 4 were gastrointestinal, and 1 was peripheral vascular.
Baseline outcome scores did not differ significantly between groups, except individuals with moderate to severe pain interference reported a significantly lower IADL score (median [IQR] 4 [2-7]) than individuals with mild or moderate pain interference (median [IQR] 8 [7-8]; P = .02) (Table 2). The mean (SD) number of PAT sessions attended was 9.3 (3.7) (range, 3-19). There were no significant relationships between number of sessions attended and any baseline outcome variables or outcome change scores.
Hospitalization Factors
Participants who were postsurgery tended to have greater improvement than individuals who were nonpostsurgery in ADLs (median [IQR] 0 [0-1.5]; ES, 0.6; P = .10) and SPPB (median [IQR] 2 [1.5-9]; ES, 0.9; P = .07), but the improvements were not statistically significant (Table 3). Mean (SD) length of stay of the index hospitalization was 6.7 (6.1) days. Longer length of stay was significantly correlated with an increase in Nagi score (ρ, 0.45; 95% CI, 0.01-0.75). There were no other significant or trending relationships between length of stay and outcome variables.
Posthospital Syndrome Factors
The 16 participants with mild to moderate cognitive impairment had less improvement in ADLs (median [IQR] 0 [0-1]) than the 8 participants with no impairment (median [IQR] 0 [-0.75 to 0]; ES, -1.1; P = .04). Change in outcome variables from baseline to endpoint did not significantly differ between the 8 patients who reported a fall compared with the 13 who did not, nor were any trends observed. Change in outcome variables from baseline to endpoint also did not significantly differ between the 8 participants who reported no or mild pain interference compared with the 10 patients with moderate to severe pain interference, nor were any trends observed. Mean (SD) number of medication changes was 2.5 (1.6). Higher number of medication changes was significantly correlated with a decrease in Rosow-Breslau score (ρ, -0.47; 95% CI, -0.76 to -0.02). There were no other significant or trending relationships between number of medication changes and outcome variables.
Postdischarge Health Care Application Factors
The 16 participants who attended posthospital physical therapy trended towards less improvement in IADLs (median [IQR] 0 [-0.5 to 1.5]; ES, -0.7; P = .11) and SPPB (median [IQR] 2 [-3.0 to 4.5]; ES, -0.5; P = .15) than the 8 patients with no postdischarge physical therapy. Eleven participants were readmitted, while 13 had no readmissions in their medical records between baseline and endpoint. Participants with ≥ 1 readmission experienced a greater increase in Rosow-Breslau score (median [IQR] 0 [-0.5 to 1.0]) than those not readmitted (median [IQR] 0 [-1.25 to 0.25]; ES, 1.0; P = .03). Borderline greater improvement in number of steps was found in those not readmitted (median [IQR] 3365.6 [274.4-7710.9]) compared with those readmitted (median [IQR] 319.9 [-136.1 to 774.5]; ES, -1.3; P = .05). Patients who were readmitted also tended to have lower and not statistically significant improvements in SPPB (median [IQR] 1 [-4.0 to 5.3]) compared with those not readmitted (median [IQR] 2 [0.3-3.8]; ES, -0.5; P = .17) (Table 3).
Discussion
This study examined the association between hospitalization, posthospital syndrome, and postdischarge health care use in patients undergoing a VVC-based intervention following hospital discharge. Participants who had no or mild cognitive impairment, no readmissions, higher medication changes, and a shorter hospital length of stay tended to experience lower disability, including in mobility and ADLs. This suggests individuals who are less clinically complex may be more likely to benefit from this type of virtual rehabilitation program. These findings are consistent with clinical experiences; home-based programs to improve physical activity posthospital discharge can be challenging for those who were medically ill (and did not undergo a specific surgical procedure), cognitively impaired, and become acutely ill and trigger hospital readmission. 15 For example, the sample in this study had higher rates of falls, pain, and readmissions compared to previous research.2,3,34-39
The importance of posthospital syndrome in the context of recovery of function and health at home following hospitalization is well documented.16-18 The potential impact of posthospital syndrome on physical activity-focused interventions is less understood. In our analysis, participants with mild or moderate cognitive impairment tended to become more dependent in their ADLs, while those with no cognitive impairment tended to become more independent in their ADLs. This functional decline over time is perhaps expected in persons with cognitive impairment, but the significant difference with a large ES warrants further consideration on how to tailor interventions to better promote functional recovery in these individuals.40,41 While some cognitive decline may not be preventable, this finding supports the need to promote healthy cognitive aging, identify declines in cognition, and work to mitigate additional decline. Programs specifically designed to promote function and physical activity in older adults with cognitive impairment are needed, especially during care transitions.41-43
While participants reported that falls and pain interference did not have a significant impact on change in outcomes between baseline and endpoint, these areas need further investigation. Falls and pain have been associated with function and physical activity in older adults.42-46 Pain is common, yet underappreciated during older adult hospital-to-home transitions.11,12,45,46 There is a need for more comprehensive assessment of pain (including pain intensity) and qualitative research.
Hospitalization and postdischarge health care application factors may have a significant impact on home-telehealth physical activity intervention success. Individuals who were postsurgery tended to have greater improvements in ADLs and physical performance. Most postsurgery participants had joint replacement surgery. Postsurgery status may not be modifiable, but it is important to note expected differences in recovery between medical and surgical admissions and the need to tailor care based on admission diagnosis. Those with a longer length of hospital stay may be considered at higher risk of suboptimal outcomes postdischarge, which indicates an opportunity for targeting resources and support, in addition to efforts of reducing length of stay where possible.47
Readmissions were significantly related to a change in Rosow-Breslau mobility disability score. This may indicate the detrimental impact a readmission can have on increasing mobility and physical activity postdischarge, or the potential of this pilot program to impact readmissions by increasing mobility and physical activity, contrary to prior physical exercise interventions.5,7,9,48 With 5% to 79% of readmissions considered preventable, continued efforts and program dissemination and implementation to address preventable readmissions are warranted.49 Individuals with postdischarge physical therapy (prior to beginning the pilot program) tended to demonstrate less improvement in disability and physical performance. This relationship needs further investigation; the 2 groups did not appear to have significant differences at baseline, albeit with a small sample size. It is possible they experienced initial improvements with postdischarge physical therapy and plateaued or had little further reserve to improve upon entering the VVC program.
Strengths and Limitations
This pilot program provided evaluative data on the use of VVC to enhance function and physical activity in older adults posthospital discharge. It included individual (eg, fall, pain, cognitive impairment) and health service (eg, readmission, physical therapy) level factors as predictors of function and physical activity posthospitalization.5,7,9,15-19
The results of this pilot project stem from a small sample lacking diversity in terms of race, ethnicity, and sex. There was some variation in baseline and endpoints between participants, and when hospitalization, posthospital syndrome, and postdischarge health care application factors were collected. The majority of participants were recruited within a month postdischarge, and the program lasted about 6 months. Data collection was attempted at regular PAT contacts, but there was some variation in when visits occurred based on participant availability and preference. Some participants had missing data, which was handled using pairwise deletion.33 Larger studies are needed to confirm the findings of this study, particularly the trends that did not reach statistical significance. Home health services other than physical therapy (eg, nursing, occupational therapy) were not fully accounted for and should be considered in future research.
Conclusions
In patients undergoing a 6-month pilot VVC-based physical activity intervention posthospital discharge, improvements in mobility and disability were most likely in those who had no cognitive impairment and were not readmitted. Larger sample and qualitative investigations are necessary to optimize outcomes for patients who meet these clinical profiles.
- Liebzeit D, Bratzke L, Boltz M, Purvis S, King B. Getting back to normal: a grounded theory study of function in post-hospitalized older adults. Gerontologist. 2020;60:704-714. doi:10.1093/geront/gnz057
- Ponzetto M, Zanocchi M, Maero B, et al. Post-hospitalization mortality in the elderly. Arch Gerontol Geriatr. 2003;36:83-91. doi:10.1016/s0167-4943(02)00061-4
- Buurman BM, Hoogerduijn JG, de Haan RJ, et al. Geriatric conditions in acutely hospitalized older patients: prevalence and one-year survival and functional decline. PLoS One. 2011;6:e26951. doi:10.1371/journal.pone.0026951
- Ponzetto M, Maero B, Maina P, et al. Risk factors for early and late mortality in hospitalized older patients: the continuing importance of functional status. J Gerontol A Biol Sci Med Sci. 2003;58:1049-1054. doi:10.1093/gerona/58.11.m1049
- Huang HT, Chang CM, Liu LF, Lin HS, Chen CH. Trajectories and predictors of functional decline of hospitalised older patients. J Clin Nurs. 2013;22:1322-1331. doi:10.1111/jocn.12055
- Boyd CM, Landefeld CS, Counsell SR, et al. Recovery of activities of daily living in older adults after hospitalization for acute medical illness. J Am Geriatr Soc. 2008;56:2171- 2179. doi:10.1111/j.1532-5415.2008.02023.x
- Helvik AS, Selbæk G, Engedal K. Functional decline in older adults one year after hospitalization. Arch Gerontol Geriatr. 2013;57:305-310. doi:10.1016/j.archger.2013.05.008
- Zaslavsky O, Zisberg A, Shadmi E. Impact of functional change before and during hospitalization on functional recovery 1 month following hospitalization. J Gerontol Biol Sci Med Sci. 2015;70:381-386. doi:10.1093/gerona/glu168
- Chen CC, Wang C, Huang GH. Functional trajectory 6 months posthospitalization: a cohort study of older hospitalized patients in Taiwan. Nurs Res. 2008;57:93-100. doi:10.1097/01.NNR.0000313485.18670.e2
- Kleinpell RM, Fletcher K, Jennings BM. Reducing functional decline in hospitalized elderly. In: Hughes RG, ed. Patient Safety and Quality: An Evidence-Based Handbook for Nurses. Agency for Healthcare Research and Quality (US); 2008. Accessed September 3, 2025. http://www.ncbi.nlm.nih.gov/books/NBK2629/
- Liebzeit D, Rutkowski R, Arbaje AI, Fields B, Werner NE. A scoping review of interventions for older adults transitioning from hospital to home. J Am Geriatr Soc. 2021;69:2950-2962. doi:10.1111/jgs.17323
- Hladkowicz E, Dumitrascu F, Auais M, et al. Evaluations of postoperative transitions in care for older adults: a scoping review. BMC Geriatr. 2022;22:329. doi:10.1186/s12877-022-02989-6
- Alexander NB, Phillips K, Wagner-Felkey J, et al. Team VA Video Connect (VVC) to optimize mobility and physical activity in post-hospital discharge older veterans: baseline assessment. BMC Geriatr. 2021;21:502. doi:10.1186/s12877-021-02454-w
- Dawson R, Oliveira JS, Kwok WS, et al. Exercise interventions delivered through telehealth to improve physical functioning for older adults with frailty, cognitive, or mobility disability: a systematic review and meta-analysis. Telemed J E Health. 2024;30:940-950. doi:10.1089/tmj.2023.0177
- Liebzeit D, Phillips KK, Hogikyan RV, Cigolle CT, Alexander NB. A pilot home-telehealth program to enhance functional ability, physical performance, and physical activity in older adult veterans post-hospital discharge. Res Gerontol Nurs. 2024;17:271-279. doi:10.3928/19404921-20241105-01
- Krumholz HM. Post-hospital syndrome—an acquired, transient condition of generalized risk. N Engl J Med. 2013;368:100-102. doi:10.1056/NEJMp1212324
- Caraballo C, Dharmarajan K, Krumholz HM. Post hospital syndrome: is the stress of hospitalization causing harm? Rev Esp Cardiol (Engl Ed). 2019;72:896-898. doi:10.1016/j.rec.2019.04.010
- Rawal S, Kwan JL, Razak F, et al. Association of the trauma of hospitalization with 30-day readmission or emergency department visit. JAMA Intern Med. 2019;179:38- 45. doi:10.1001/jamainternmed.2018.5100
- Dutzi I, Schwenk M, Kirchner M, Jooss E, Bauer JM, Hauer K. Influence of cognitive impairment on rehabilitation received and its mediating effect on functional recovery. J Alzheimers Dis. 2021;84:745-756. doi:10.3233/JAD-210620
- Uriz-Otano F, Uriz-Otano JI, Malafarina V. Factors associated with short-term functional recovery in elderly people with a hip fracture. Influence ofcognitiveimpairment. JAmMedDirAssoc. 2015;16:215-220. doi:10.1016/j.jamda.2014.09.009
- Nasreddine ZS, Phillips NA, Bédirian V, et al. The Montreal Cognitive Assessment, MoCA: a brief screening tool for mild cognitive impairment. J Am Geriatr Soc. 2005;53:695-699. doi:10.1111/j.1532-5415.2005.53221.x
- Ware JE Jr, Sherbourne CD. The MOS 36-item short-form health survey (SF-36). I. Conceptual framework and item selection. Med Care. 1992;30:473-483.
- White RS, Jiang J, Hall CB, et al. Higher perceived stress scale scores are associated with higher pain intensity and pain interference levels in older adults. J Am Geriatr Soc. 2014;62:2350-2356. doi:10.1111/jgs.13135
- Blyth FM, March LM, Brnabic AJ, et al. Chronic pain in Australia: a prevalence study. Pain. 2001;89:127-134. doi:10.1016/s0304-3959(00)00355-9
- Thomas E, Peat G, Harris L, Wilkie R, Croft PR. The prevalence of pain and pain interference in a general population of older adults: cross-sectional findings from the North Staffordshire Osteoarthritis Project (NorStOP). Pain. 2004;110:361-368. doi:10.1016/j.pain.2004.04.017
- Katz S, Ford AB, Moskowitz RW, Jackson BA, Jaffe MW. Studies of illness in the aged. The index of ADL: a standardized measure of biological and psychosocial function. JAMA. 1963;185:914-919. doi:10.1001/jama.1963.03060120024016
- Lawton MP, Brody EM. Assessment of older people: self-maintaining and instrumental activities of daily living. Gerontologist. 1969;9:179-186.
- Alexander NB, Guire KE, Thelen DG, et al. Self-reported walking ability predicts functional mobility performance in frail older adults. J Am Geriatr Soc. 2000;48:1408-1413. doi:10.1111/j.1532-5415.2000.tb02630.x
- Rosow I, Breslau N. A Guttman health scale for the aged. J Gerontol. 1966;21:556-559. doi:10.1093/geronj/21.4.556
- Guralnik JM, Simonsick EM, Ferrucci L, et al. A short physical performance battery assessing lower extremity function: association with self-reported disability and prediction of mortality and nursing home admission. J Gerontol. 1994;49:M85-M94. doi:10.1093/geronj/49.2.m85
- Chan CS, Slaughter SE, Jones CA, Ickert C, Wagg AS. Measuring activity performance of older adults using the activPAL: a rapid review. Healthcare (Basel). 2017;5:94. doi:10.3390/healthcare5040094
- IBM SPSS software. IBM Corp; 2019. Accessed September 3, 2025. https://www.ibm.com/spss
- Kang H. The prevention and handling of the missing data. Korean J Anesthesiol. 2013;64:402-406. doi:10.4097/kjae.2013.64.5.402
- Epstein AM, Jha AK, Orav EJ. The relationship between hospital admission rates and rehospitalizations. N Engl J Med. 2011;365:2287-2295. doi:10.1056/NEJMsa1101942
- Bogaisky M, Dezieck L. Early hospital readmission of nursing home residents and community-dwelling elderly adults discharged from the geriatrics service of an urban teaching hospital: patterns and risk factors. J Am Geriatr Soc. 2015;63:548-552. doi:10.1111/jgs.13317
- Jencks SF, Williams MV, Coleman EA. Rehospitalizations among patients in the Medicare fee-for-service program. N Engl J Med. 2009;360:1418-1428. doi:10.1056/NEJMsa0803563
- Hoyer EH, Needham DM, Atanelov L, Knox B, Friedman M, Brotman DJ. Association of impaired functional status at hospital discharge and subsequent rehospitalization. J Hosp Med. 2014;9:277-282. doi:10.1002/jhm.2152
- Mahoney J, Sager M, Dunham NC, Johnson J. Risk of falls after hospital discharge. J Am Geriatr Soc. 1994;42:269- 274. doi:10.1111/j.1532-5415.1994.tb01750.x
- Hoffman GJ, Liu H, Alexander NB, Tinetti M, Braun TM, Min LC. Posthospital fall injuries and 30-day readmissions in adults 65 years and older. JAMA Netw Open. 2019;2:e194276. doi:10.1001/jamanetworkopen.2019.4276
- Gill DP, Hubbard RA, Koepsell TD, et al. Differences in rate of functional decline across three dementia types. Alzheimers Dement. 2013;9:S63-S71. doi:10.1016/j.jalz.2012.10.010
- Auyeung TW, Kwok T, Lee J, Leung PC, Leung J, Woo J. Functional decline in cognitive impairment–the relationship between physical and cognitive function. Neuroepidemiology. 2008;31:167-173. doi:10.1159/000154929
- Patti A, Zangla D, Sahin FN, et al. Physical exercise and prevention of falls. Effects of a Pilates training method compared with a general physical activity program. Medicine (Baltimore). 2021;100:e25289. doi:10.1097/MD.0000000000025289
- Nagarkar A, Kulkarni S. Association between daily activities and fall in older adults: an analysis of longitudinal ageing study in India (2017-18). BMC Geriatr. 2022;22:203. doi:10.1186/s12877-022-02879-x
- Ek S, Rizzuto D, Xu W, Calderón-Larrañaga A, Welmer AK. Predictors for functional decline after an injurious fall: a population-based cohort study. Aging Clin Exp Res. 2021;33:2183-2190. doi:10.1007/s40520-020-01747-1
- Dagnino APA, Campos MM. Chronic pain in the elderly: mechanisms and perspectives. Front Hum Neurosci. 2022;16:736688. doi:10.3389/fnhum.2022.736688
- Ritchie CS, Patel K, Boscardin J, et al. Impact of persistent pain on function, cognition, and well-being of older adults. J Am Geriatr Soc. 2023;71:26-35. doi:10.1111/jgs.18125
- Han TS, Murray P, Robin J, et al. Evaluation of the association of length of stay in hospital and outcomes. Int J Qual Health Care. 2022;34:mzab160. doi:10.1093/intqhc/ mzab160
- Lærum-Onsager E, Molin M, Olsen CF, et al. Effect of nutritional and physical exercise intervention on hospital readmission for patients aged 65 or older: a systematic review and meta-analysis of randomized controlled trials. Int J Behav Nutr Phys Act. 2021;18:62. doi:10.1186/s12966-021-01123-w
- Van Walraven C, Bennett C, Jennings A, Austin PC, Forster AJ. Proportion of hospital readmissions deemed avoidable: a systematic review. CMAJ. 2011;183:E391-E402. doi:10.1503/cmaj.101860
Factors Influencing Outcomes of a Telehealth-Based Physical Activity Program in Older Veterans Postdischarge
Factors Influencing Outcomes of a Telehealth-Based Physical Activity Program in Older Veterans Postdischarge
Characterizing Opioid Response in Older Veterans in the Post-Acute Setting
Older adults admitted to post-acute settings frequently have complex rehabilitation needs and multimorbidity, which predisposes them to pain management challenges.1,2 The prevalence of pain in post-acute and long-term care is as high as 65%, and opioid use is common among this population with 1 in 7 residents receiving long-term opioids.3,4
Opioids that do not adequately control pain represent a missed opportunity for deprescribing. There is limited evidence regarding efficacy of long-term opioid use (> 90 days) for improving pain and physical functioning.5 In addition, long-term opioid use carries significant risks, including overdose-related death, dependence, and increased emergency department visits.5 These risks are likely to be pronounced among veterans receiving post-acute care (PAC) who are older, have comorbid psychiatric disorders, are prescribed several centrally acting medications, and experience substance use disorder (SUD).6
Older adults are at increased risk for opioid toxicity because of reduced drug clearance and smaller therapeutic window.5 Centers for Disease Control and Prevention (CDC) guidelines recommend frequently assessing patients for benefit in terms of sustained improvement in pain as well as physical function.5 If pain and functional improvements are minimal, opioid use and nonopioid pain management strategies should be considered. Some patients will struggle with this approach. Directly asking patients about the effectiveness of opioids is challenging. Opioid users with chronic pain frequently report problems with opioids even as they describe them as indispensable for pain management.7,8
Earlier studies have assessed patient perspectives regarding opioid difficulties as well as their helpfulness, which could introduce recall bias. Patient-level factors that contribute to a global sense of distress, in addition to the presence of painful physical conditions, also could contribute to patients requesting opioids without experiencing adequate pain relief. One study in veterans residing in PAC facilities found that individuals with depression, posttraumatic stress disorder (PTSD), and SUD were more likely to report pain and receive scheduled analgesics; this effect persisted in individuals with PTSD even after adjusting for demographic and functional status variables.9 The study looked only at analgesics as a class and did not examine opioids specifically. It is possible that distressed individuals, such as those with uncontrolled depression, PTSD, and SUD, might be more likely to report high pain levels and receive opioids with inadequate benefit and increased risk. Identifying the primary condition causing distress and targeting treatment to that condition (ie, depression) is preferable to escalating opioids in an attempt to treat pain in the context of nonresponse. Assessing an individual’s aggregate response to opioids rather than relying on a single self-report is a useful addition to current pain management strategies.
The goal of this study was to pilot a method of identifying opioid-nonresponsive pain using administrative data, measure its prevalence in a PAC population of veterans, and explore clinical and demographic correlates with particular attention to variates that could indicate high levels of psychological and physical distress. Identifying pain that is poorly responsive to opioids would give clinicians the opportunity to avoid or minimize opioid use and prioritize treatments that are likely to improve the resident’s pain, quality of life, and physical function while minimizing recall bias. We hypothesized that pain that responds poorly to opioids would be prevalent among veterans residing in a PAC unit. We considered that veterans with pain poorly responsive to opioids would be more likely to have factors that would place them at increased risk of adverse effects, such as comorbid psychiatric conditions, history of SUD, and multimorbidity, providing further rationale for clinical equipoise in that population.6
Methods
This was a small, retrospective cross-sectional study using administrative data and chart review. The study included veterans who were administered opioids while residing in a single US Department of Veterans Affairs (VA) community living center PAC (CLC-PAC) unit during at least 1 of 4 nonconsecutive, random days in 2016 and 2017. The study was approved by the institutional review board of the Ann Arbor VA Health System (#2017-1034) as part of a larger project involving models of care in vulnerable older veterans.
Inclusion criteria were the presence of at least moderate pain (≥ 4 on a 0 to 10 scale); receiving ≥ 2 opioids ordered as needed over the prespecified 24-hour observation period; and having ≥ 2 pre-and postopioid administration pain scores during the observation period. Veterans who did not meet these criteria were excluded. At the time of initial sample selection, we did not capture information related to coprescribed analgesics, including a standing order of opioids. To obtain the sample, we initially characterized all veterans on the 4 days residing in the CLC-PAC unit as those reporting at least moderate pain (≥ 4) and those who reported no or mild pain (< 4). The cut point of 4 of 10 is consistent with moderate pain based on earlier work showing higher likelihood of pain that interferes with physical function.10 We then restricted the sample to veterans who received ≥ 2 opioids ordered as needed for pain and had ≥ 2 pre- and postopioid administration numeric pain rating scores during the 24-hour observation period. This methodology was chosen to enrich our sample for those who received opioids regularly for ongoing pain. Opioids were defined as full µ-opioid receptor agonists and included hydrocodone, oxycodone, morphine, hydromorphone, fentanyl, tramadol, and methadone.
Medication administration data were obtained from the VA corporate data warehouse, which houses all barcode medication administration data collected at the point of care. The dataset includes pain scores gathered by nursing staff before and after administering an as-needed analgesic. The corporate data warehouse records data/time of pain scores and the analgesic name, dosage, formulation, and date/time of administration. Using a standardized assessment form developed iteratively, we calculated opioid dosage in oral morphine equivalents (OME) for comparison.11,12 All abstracted data were reexamined for accuracy. Data initially were collected in an anonymized, blinded fashion. Participants were then unblinded for chart review. Initial data was captured in resident-days instead of unique residents because an individual resident might have been admitted on several observation days. We were primarily interested in how pain responded to opioids administered in response to resident request; therefore, we did not examine response to opioids that were continuously ordered (ie, scheduled). We did consider scheduled opioids when calculating total daily opioid dosage during the chart review.
Outcome of Interest
The primary outcome of interest was an individual’s response to as-needed opioids, which we defined as change in the pain score after opioid administration. The pre-opioid pain score was the score that immediately preceded administration of an as-needed opioid. The postopioid administration pain score was the first score after opioid administration if obtained within 3 hours of administration. Scores collected > 3 hours after opioid administration were excluded because they no longer accurately reflected the impact of the opioid due to the short half-lives. Observations were excluded if an opioid was administered without a recorded pain score; this occurred once for 6 individuals. Observations also were excluded if an opioid was administered but the data were captured on the following day (outside of the 24-hour window); this occurred once for 3 individuals.
We calculated a ∆ score by subtracting the postopioid pain rating score from the pre-opioid score. Individual ∆ scores were then averaged over the 24-hour period (range, 2-5 opioid doses). For example, if an individual reported a pre-opioid pain score of 10, and a postopioid pain score of 2, the ∆ was recorded as 8. If the individual’s next pre-opioid score was 10, and post-opioid score was 6, the ∆ was recorded as 4. ∆ scores over the 24-hour period were averaged together to determine that individual’s response to as-needed opioids. In the previous example, the mean ∆ score is 6. Lower mean ∆ scores reflect decreased responsiveness to opioids’ analgesic effect.
Demographic and clinical data were obtained from electronic health record review using a standardized assessment form. These data included information about medical and psychiatric comorbidities, specialist consultations, and CLC-PAC unit admission indications and diagnoses. Medications of interest were categorized as antidepressants, antipsychotics, benzodiazepines, muscle relaxants, hypnotics, stimulants, antiepileptic drugs/mood stabilizers (including gabapentin and pregabalin), and all adjuvant analgesics. Adjuvant analgesics were defined as medications administered for pain as documented by chart notes or those ordered as needed for pain, and analyzed as a composite variable. Antidepressants with analgesic properties (serotonin-norepinephrine reuptake inhibitors and tricyclic antidepressants) were considered adjuvant analgesics. Psychiatric information collected included presence of mood, anxiety, and psychotic disorders, and PTSD. SUD information was collected separately from other psychiatric disorders.
Analyses
The study population was described using tabulations for categorical data and means and standard deviations for continuous data. Responsiveness to opioids was analyzed as a continuous variable. Those with higher mean ∆ scores were considered to have pain relatively more responsive to opioids, while lower mean ∆ scores indicated pain less responsive to opioids. We constructed linear regression models controlling for average pre-opioid pain rating scores to explore associations between opioid responsiveness and variables of interest. All analyses were completed using Stata version 15. This study was not adequately powered to detect differences across the spectrum of opioid responsiveness, although the authors have reported differences in this article.
Results
Over the 4-day observational period there were 146 resident-days. Of these, 88 (60.3%) reported at least 1 pain score of ≥ 4. Of those, 61 (41.8%) received ≥ 1 as-needed opioid for pain. We identified 46 resident-days meeting study criteria of ≥ 2 pre- and postanalgesic scores. We identified 41 unique individuals (Figure 1). Two individuals were admitted to the CLC-PAC unit on 2 of the 4 observation days, and 1 individual was admitted to the CLC-PAC unit on 3 of the 4 observation days. For individuals admitted several days, we included data only from the initial observation day.
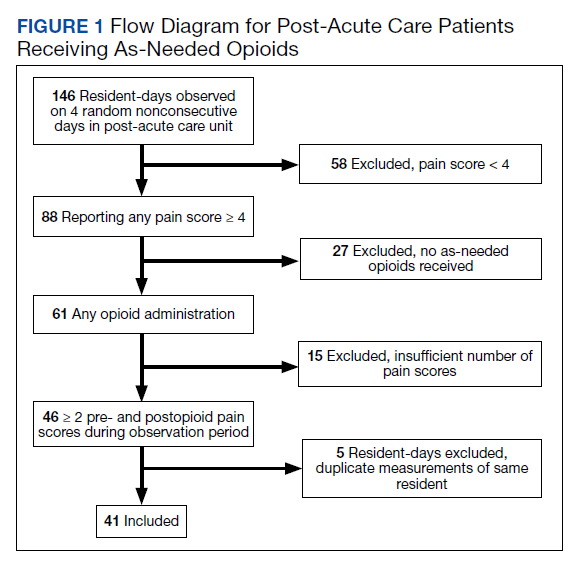
Response to opioids varied greatly in this sample. The mean (SD) ∆ pain score was 3.4 (1.6) and ranged from 0.5 to 6.3. Using linear regression, we found no relationship between admission indication, medical comorbidities (including active cancer), and opioid responsiveness (Table).
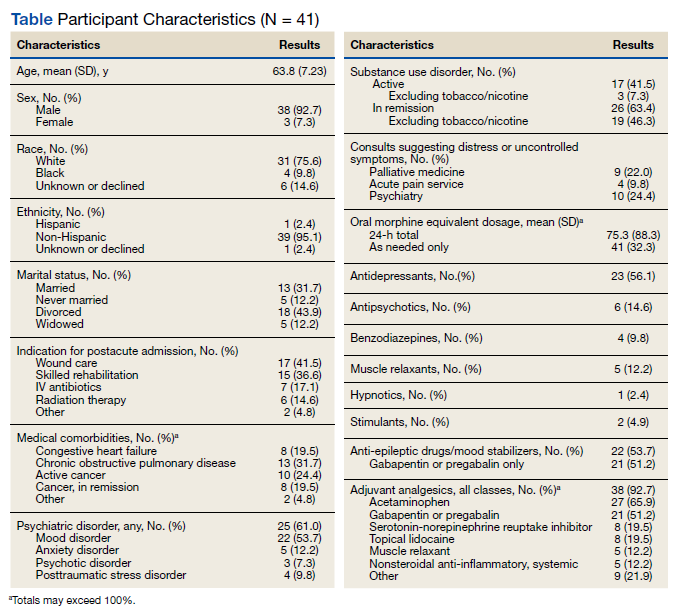
Psychiatric disorders were highly prevalent, with 25 individuals (61.0%) having ≥ 1 any psychiatric diagnosis identified on chart review. The presence of any psychiatric diagnosis was significantly associated with reduced responsiveness to opioids (β = −1.08; 95% CI, −2.04 to −0.13; P = .03). SUDs also were common, with 17 individuals (41.5%) having an active SUD; most were tobacco/nicotine. Twenty-six veterans (63.4%) had documentation of SUD in remission with 19 (46.3%) for substances other than tobacco/nicotine. There was no indication that any veteran in the sample was prescribed medication for opioid use disorder (OUD) at the time of observation. There was no relationship between opioid responsiveness and SUDs, neither active or in remission. Consults to other services that suggested distress or difficult-to-control symptoms also were frequent. Consults to the pain service were significantly associated with reduced responsiveness to opioids (β = −1.75; 95% CI, −3.33 to −0.17; P = .03). Association between psychiatry consultation and reduced opioid responsiveness trended toward significance (β = −0.95; 95% CI, −2.06 to 0.17; P = .09) (Figures 2 and 3). There was no significant association with palliative medicine consultation and opioid responsiveness.
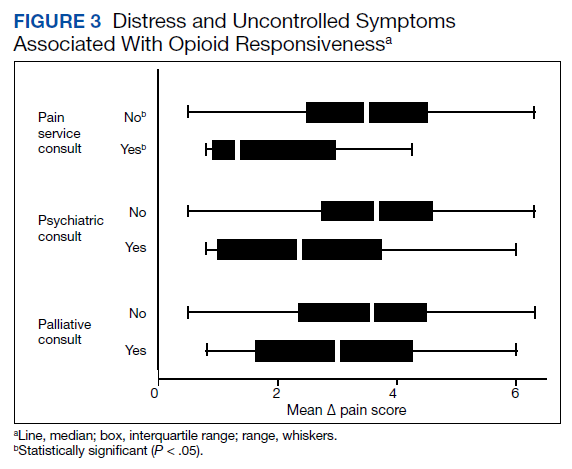
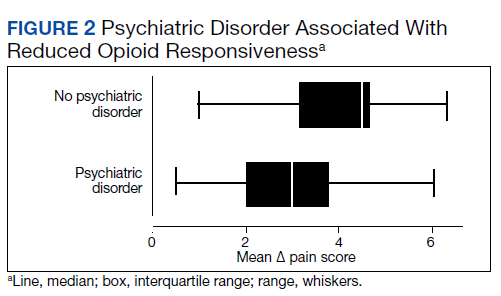
A poorer response to opioids was associated with a significantly higher as-needed opioid dosage (β = −0.02; 95% CI, −0.04 to −0.01; P = .002) as well as a trend toward higher total opioid dosage (β = −0.005; 95% CI, −0.01 to 0.0003; P = .06) (Figure 4). Thirty-eight (92.7%) participants received nonopioid adjuvant analgesics for pain. More than half (56.1%) received antidepressants or gabapentinoids (51.2%), although we did not assess whether they were prescribed for pain or another indication. We did not identify a relationship between any specific psychoactive drug class and opioid responsiveness in this sample.
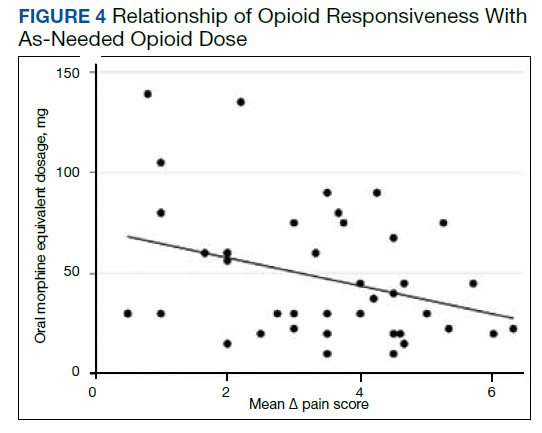
Discussion
This exploratory study used readily available administrative data in a CLC-PAC unit to assess responsiveness to opioids via a numeric mean ∆ score, with higher values indicating more pain relief in response to opioids. We then constructed linear regression models to characterize the relationship between the mean ∆ score and factors known to be associated with difficult-to-control pain and psychosocial distress. As expected, opioid responsiveness was highly variable among residents; some residents experienced essentially no reduction in pain, on average, despite receiving opioids. Psychiatric comorbidity, higher dosage in OMEs, and the presence of a pain service consult significantly correlated with poorer response to opioids. To our knowledge, this is the first study to quantify opioid responsiveness and describe the relationship with clinical correlates in the understudied PAC population.
Earlier research has demonstrated a relationship between the presence of psychiatric disorders and increased likelihood of receiving any analgesics among veterans residing in PAC.9 Our study adds to the literature by quantifying opioid response using readily available administrative data and examining associations with psychiatric diagnoses. These findings highlight the possibility that attempting to treat high levels of pain by escalating the opioid dosage in patients with a comorbid psychiatric diagnosis should be re-addressed, particularly if there is no meaningful pain reduction at lower opioid dosages. Our sample had a variety of admission diagnoses and medical comorbidities, however, we did not identify a relationship with opioid responsiveness, including an active cancer diagnosis. Although SUDs were highly prevalent in our sample, there was no relationship with opioid responsiveness. This suggests that lack of response to opioids is not merely a matter of drug tolerance or an indication of drug-seeking behavior.
Factors Impacting Response
Many factors could affect whether an individual obtains an adequate analgesic response to opioids or other pain medications, including variations in genes encoding opioid receptors and hepatic enzymes involved in drug metabolism and an individual’s opioid exposure history.13 The phenomenon of requiring more drug to produce the same relief after repeated exposures (ie, tolerance) is well known.14 Opioid-induced hyperalgesia is a phenomenon whereby a patient’s overall pain increases while receiving opioids, but each opioid dose might be perceived as beneficial.15 Increasingly, psychosocial distress is an important factor in opioid response. Adverse selection is the process culminating in those with psychosocial distress and/or SUDs being prescribed more opioids for longer durations.16 Our data suggests that this process could play a role in PAC settings. In addition, exaggerating pain to obtain additional opioids for nonmedical purposes, such as euphoria or relaxation, also is possible.17
When clinically assessing an individual whose pain is not well controlled despite escalating opioid dosages, prescribers must consider which of these factors likely is predominant. However, the first step of determining who has a poor opioid response is not straightforward. Directly asking patients is challenging; many individuals perceive opioids to be helpful while simultaneously reporting inadequately controlled pain.7,8 The primary value of this study is the possibility of providing prescribers a quick, simple method of assessing a patient’s response to opioids. Using this method, individuals who are responding poorly to opioids, including those who might exaggerate pain for secondary gain, could be identified. Health care professionals could consider revisiting pain management strategies, assess for the presence of OUD, or evaluate other contributors to inadequately controlled pain. Although we only collected data regarding response to opioids in this study, any pain medication administered as needed (ie, nonsteroidal anti-inflammatory drugs, acetaminophen) could be analyzed using this methodology, allowing identification of other helpful pain management strategies. We began the validation process with extensive chart review, but further validation is required before this method can be applied to routine clinical practice.
Patients who report uncontrolled pain despite receiving opioids are a clinically challenging population. The traditional strategy has been to escalate opioids, which is recommended by the World Health Organization stepladder approach for patients with cancer pain and limited life expectancy.18 Applying this approach to a general population of patients with chronic pain is ineffective and dangerous.19 The CDC and the VA/US Department of Defense (VA/DoD) guidelines both recommend carefully reassessing risks and benefits at total daily dosages > 50 OME and avoid increasing dosages to > 90 OME daily in most circumstances.5,20 Our finding that participants taking higher dosages of opioids were not more likely to have better control over their pain supports this recommendation.
Limitations
This study has several limitations, the most significant is its small sample size because of the exploratory nature of the project. Results are based on a small pilot sample enriched to include individuals with at least moderate pain who receive opioids frequently at 1 VA CLC-PAC unit; therefore, the results might not be representative of all veterans or a more general population. Our small sample size limits power to detect small differences. Data collected should be used to inform formal power calculations before subsequent larger studies to select adequate sample size. Validation studies, including samples from the same population using different dates, which reproduce findings are an important step. Moreover, we only had data on a single dimension of pain (intensity/severity), as measured by the pain scale, which nursing staff used to make a real-time clinical decision of whether to administer an as-needed opioid. Future studies should consider using pain measures that provide multidimensional assessment (ie, severity, functional interference) and/or were developed specifically for veterans, such as the Defense and Veterans Pain Rating Scale.21
Our study was cross-sectional in nature and addressed a single 24-hour period of data per participant. The years of data collection (2016 and 2017) followed a decline in overall opioid prescribing that has continued, likely influenced by CDC and VA/DoD guidelines.22 It is unclear whether our observations are an accurate reflection of individuals’ response over time or whether prescribing practices in PAC have shifted.
We did not consider the type of pain being treated or explore clinicians’ reasons for prescribing opioids, therefore limiting our ability to know whether opioids were indicated. Information regarding OUD and other SUDs was limited to what was documented in the chart during the CLC-PAC unit admission. We did not have information on length of exposure to opioids. It is possible that opioid tolerance could play a role in reducing opioid responsiveness. However, simple tolerance would not be expected to explain robust correlations with psychiatric comorbidities. Also, simple tolerance would be expected to be overcome with higher opioid dosages, whereas our study demonstrates less responsiveness. These data suggests that some individuals’ pain might be poorly opioid responsive, and psychiatric factors could increase this risk. We used a novel data source in combination with chart review; to our knowledge, barcode medication administration data have not been used in this manner previously. Future work needs to validate this method, using larger sample sizes and several clinical sites. Finally, we used regression models that controlled for average pre-opioid pain rating scores, which is only 1 covariate important for examining effects. Larger studies with adequate power should control for multiple covariates known to be associated with pain and opioid response.
Conclusions
Opioid responsiveness is important clinically yet challenging to assess. This pilot study identifies a way of classifying pain as relatively opioid nonresponsive using administrative data but requires further validation before considering scaling for more general use. The possibility that a substantial percentage of residents in a CLC-PAC unit could be receiving increasing dosages of opioids without adequate benefit justifies the need for more research and underscores the need for prescribers to assess individuals frequently for ongoing benefit of opioids regardless of diagnosis or mechanism of pain.
Acknowledgments
The authors thank Andrzej Galecki, Corey Powell, and the University of Michigan Consulting for Statistics, Computing and Analytics Research Center for assistance with statistical analysis.
1. Marshall TL, Reinhardt JP. Pain management in the last 6 months of life: predictors of opioid and non-opioid use. J Am Med Dir Assoc. 2019;20(6):789-790. doi:10.1016/j.jamda.2019.02.026
2. Tait RC, Chibnall JT. Pain in older subacute care patients: associations with clinical status and treatment. Pain Med. 2002;3(3):231-239. doi:10.1046/j.1526-4637.2002.02031.x
3. Pimentel CB, Briesacher BA, Gurwitz JH, Rosen AB, Pimentel MT, Lapane KL. Pain management in nursing home residents with cancer. J Am Geriatr Soc. 2015;63(4):633-641. doi:10.1111/jgs.13345
4. Hunnicutt JN, Tjia J, Lapane KL. Hospice use and pain management in elderly nursing home residents with cancer. J Pain Symptom Manage. 2017;53(3):561-570. doi:10.1016/j.jpainsymman.2016.10.369
5. Dowell D, Haegerich TM, Chou R. CDC guideline for prescribing opioids for chronic pain — United States, 2016. MMWR Recomm Rep. 2016;65(No. RR-1):1-49. doi:10.15585/mmwr.rr6501e1
6. Oliva EM, Bowe T, Tavakoli S, et al. Development and applications of the Veterans Health Administration’s Stratification Tool for Opioid Risk Mitigation (STORM) to improve opioid safety and prevent overdose and suicide. Psychol Serv. 2017;14(1):34-49. doi:10.1037/ser0000099
7. Goesling J, Moser SE, Lin LA, Hassett AL, Wasserman RA, Brummett CM. Discrepancies between perceived benefit of opioids and self-reported patient outcomes. Pain Med. 2018;19(2):297-306. doi:10.1093/pm/pnw263
8. Sullivan M, Von Korff M, Banta-Green C. Problems and concerns of patients receiving chronic opioid therapy for chronic non-cancer pain. Pain. 2010;149(2):345-353. doi:10.1016/j.pain.2010.02.037
9. Brennan PL, Greenbaum MA, Lemke S, Schutte KK. Mental health disorder, pain, and pain treatment among long-term care residents: evidence from the Minimum Data Set 3.0. Aging Ment Health. 2019;23(9):1146-1155. doi:10.1080/13607863.2018.1481922
10. Woo A, Lechner B, Fu T, et al. Cut points for mild, moderate, and severe pain among cancer and non-cancer patients: a literature review. Ann Palliat Med. 2015;4(4):176-183. doi:10.3978/j.issn.2224-5820.2015.09.04
11. Centers for Disease Control and Prevention. Calculating total daily dose of opioids for safer dosage. 2017. Accessed December 15, 2021. https://www.cdc.gov/drugoverdose/pdf/calculating_total_daily_dose-a.pdf
12. Nielsen S, Degenhardt L, Hoban B, Gisev N. Comparing opioids: a guide to estimating oral morphine equivalents (OME) in research. NDARC Technical Report No. 329. National Drug and Alcohol Research Centre; 2014. Accessed December 15, 2021. http://www.drugsandalcohol.ie/22703/1/NDARC Comparing opioids.pdf
13. Smith HS. Variations in opioid responsiveness. Pain Physician. 2008;11(2):237-248.
14. Collin E, Cesselin F. Neurobiological mechanisms of opioid tolerance and dependence. Clin Neuropharmacol. 1991;14(6):465-488. doi:10.1097/00002826-199112000-00001
15. Higgins C, Smith BH, Matthews K. Evidence of opioid-induced hyperalgesia in clinical populations after chronic opioid exposure: a systematic review and meta-analysis. Br J Anaesth. 2019;122(6):e114-e126. doi:10.1016/j.bja.2018.09.019
16. Howe CQ, Sullivan MD. The missing ‘P’ in pain management: how the current opioid epidemic highlights the need for psychiatric services in chronic pain care. Gen Hosp Psychiatry. 2014;36(1):99-104. doi:10.1016/j.genhosppsych.2013.10.003
17. Substance Abuse and Mental Health Services Administration. Key substance use and mental health indicators in the United States: results from the 2018 National Survey on Drug Use and Health. HHS Publ No PEP19-5068, NSDUH Ser H-54. 2019;170:51-58. Accessed December 15, 2021. https://www.samhsa.gov/data/sites/default/files/cbhsq-reports/NSDUHNationalFindingsReport2018/NSDUHNationalFindingsReport2018.pdf
18. World Health Organization. WHO’s cancer pain ladder for adults. Accessed September 21, 2018. www.who.int/ncds/management/palliative-care/Infographic-cancer-pain-lowres.pdf
19. Ballantyne JC, Kalso E, Stannard C. WHO analgesic ladder: a good concept gone astray. BMJ. 2016;352:i20. doi:10.1136/bmj.i20
20. The Opioid Therapy for Chronic Pain Work Group. VA/DoD clinical practice guideline for opioid therapy for chronic pain. US Dept of Veterans Affairs and Dept of Defense; 2017. Accessed December 15, 2021. https://www.healthquality.va.gov/guidelines/Pain/cot/VADoDOTCPG022717.pdf
21. Defense & Veterans Pain Rating Scale (DVPRS). Defense & Veterans Center for Integrative Pain Management. Accessed July 21, 2021. https://www.dvcipm.org/clinical-resources/defense-veterans-pain-rating-scale-dvprs/
22. Guy GP Jr, Zhang K, Bohm MK, et al. Vital signs: changes in opioid prescribing in the United States, 2006–2015. MMWR Morb Mortal Wkly Rep. 2017;66(26):697-704. doi:10.15585/mmwr.mm6626a4
Older adults admitted to post-acute settings frequently have complex rehabilitation needs and multimorbidity, which predisposes them to pain management challenges.1,2 The prevalence of pain in post-acute and long-term care is as high as 65%, and opioid use is common among this population with 1 in 7 residents receiving long-term opioids.3,4
Opioids that do not adequately control pain represent a missed opportunity for deprescribing. There is limited evidence regarding efficacy of long-term opioid use (> 90 days) for improving pain and physical functioning.5 In addition, long-term opioid use carries significant risks, including overdose-related death, dependence, and increased emergency department visits.5 These risks are likely to be pronounced among veterans receiving post-acute care (PAC) who are older, have comorbid psychiatric disorders, are prescribed several centrally acting medications, and experience substance use disorder (SUD).6
Older adults are at increased risk for opioid toxicity because of reduced drug clearance and smaller therapeutic window.5 Centers for Disease Control and Prevention (CDC) guidelines recommend frequently assessing patients for benefit in terms of sustained improvement in pain as well as physical function.5 If pain and functional improvements are minimal, opioid use and nonopioid pain management strategies should be considered. Some patients will struggle with this approach. Directly asking patients about the effectiveness of opioids is challenging. Opioid users with chronic pain frequently report problems with opioids even as they describe them as indispensable for pain management.7,8
Earlier studies have assessed patient perspectives regarding opioid difficulties as well as their helpfulness, which could introduce recall bias. Patient-level factors that contribute to a global sense of distress, in addition to the presence of painful physical conditions, also could contribute to patients requesting opioids without experiencing adequate pain relief. One study in veterans residing in PAC facilities found that individuals with depression, posttraumatic stress disorder (PTSD), and SUD were more likely to report pain and receive scheduled analgesics; this effect persisted in individuals with PTSD even after adjusting for demographic and functional status variables.9 The study looked only at analgesics as a class and did not examine opioids specifically. It is possible that distressed individuals, such as those with uncontrolled depression, PTSD, and SUD, might be more likely to report high pain levels and receive opioids with inadequate benefit and increased risk. Identifying the primary condition causing distress and targeting treatment to that condition (ie, depression) is preferable to escalating opioids in an attempt to treat pain in the context of nonresponse. Assessing an individual’s aggregate response to opioids rather than relying on a single self-report is a useful addition to current pain management strategies.
The goal of this study was to pilot a method of identifying opioid-nonresponsive pain using administrative data, measure its prevalence in a PAC population of veterans, and explore clinical and demographic correlates with particular attention to variates that could indicate high levels of psychological and physical distress. Identifying pain that is poorly responsive to opioids would give clinicians the opportunity to avoid or minimize opioid use and prioritize treatments that are likely to improve the resident’s pain, quality of life, and physical function while minimizing recall bias. We hypothesized that pain that responds poorly to opioids would be prevalent among veterans residing in a PAC unit. We considered that veterans with pain poorly responsive to opioids would be more likely to have factors that would place them at increased risk of adverse effects, such as comorbid psychiatric conditions, history of SUD, and multimorbidity, providing further rationale for clinical equipoise in that population.6
Methods
This was a small, retrospective cross-sectional study using administrative data and chart review. The study included veterans who were administered opioids while residing in a single US Department of Veterans Affairs (VA) community living center PAC (CLC-PAC) unit during at least 1 of 4 nonconsecutive, random days in 2016 and 2017. The study was approved by the institutional review board of the Ann Arbor VA Health System (#2017-1034) as part of a larger project involving models of care in vulnerable older veterans.
Inclusion criteria were the presence of at least moderate pain (≥ 4 on a 0 to 10 scale); receiving ≥ 2 opioids ordered as needed over the prespecified 24-hour observation period; and having ≥ 2 pre-and postopioid administration pain scores during the observation period. Veterans who did not meet these criteria were excluded. At the time of initial sample selection, we did not capture information related to coprescribed analgesics, including a standing order of opioids. To obtain the sample, we initially characterized all veterans on the 4 days residing in the CLC-PAC unit as those reporting at least moderate pain (≥ 4) and those who reported no or mild pain (< 4). The cut point of 4 of 10 is consistent with moderate pain based on earlier work showing higher likelihood of pain that interferes with physical function.10 We then restricted the sample to veterans who received ≥ 2 opioids ordered as needed for pain and had ≥ 2 pre- and postopioid administration numeric pain rating scores during the 24-hour observation period. This methodology was chosen to enrich our sample for those who received opioids regularly for ongoing pain. Opioids were defined as full µ-opioid receptor agonists and included hydrocodone, oxycodone, morphine, hydromorphone, fentanyl, tramadol, and methadone.
Medication administration data were obtained from the VA corporate data warehouse, which houses all barcode medication administration data collected at the point of care. The dataset includes pain scores gathered by nursing staff before and after administering an as-needed analgesic. The corporate data warehouse records data/time of pain scores and the analgesic name, dosage, formulation, and date/time of administration. Using a standardized assessment form developed iteratively, we calculated opioid dosage in oral morphine equivalents (OME) for comparison.11,12 All abstracted data were reexamined for accuracy. Data initially were collected in an anonymized, blinded fashion. Participants were then unblinded for chart review. Initial data was captured in resident-days instead of unique residents because an individual resident might have been admitted on several observation days. We were primarily interested in how pain responded to opioids administered in response to resident request; therefore, we did not examine response to opioids that were continuously ordered (ie, scheduled). We did consider scheduled opioids when calculating total daily opioid dosage during the chart review.
Outcome of Interest
The primary outcome of interest was an individual’s response to as-needed opioids, which we defined as change in the pain score after opioid administration. The pre-opioid pain score was the score that immediately preceded administration of an as-needed opioid. The postopioid administration pain score was the first score after opioid administration if obtained within 3 hours of administration. Scores collected > 3 hours after opioid administration were excluded because they no longer accurately reflected the impact of the opioid due to the short half-lives. Observations were excluded if an opioid was administered without a recorded pain score; this occurred once for 6 individuals. Observations also were excluded if an opioid was administered but the data were captured on the following day (outside of the 24-hour window); this occurred once for 3 individuals.
We calculated a ∆ score by subtracting the postopioid pain rating score from the pre-opioid score. Individual ∆ scores were then averaged over the 24-hour period (range, 2-5 opioid doses). For example, if an individual reported a pre-opioid pain score of 10, and a postopioid pain score of 2, the ∆ was recorded as 8. If the individual’s next pre-opioid score was 10, and post-opioid score was 6, the ∆ was recorded as 4. ∆ scores over the 24-hour period were averaged together to determine that individual’s response to as-needed opioids. In the previous example, the mean ∆ score is 6. Lower mean ∆ scores reflect decreased responsiveness to opioids’ analgesic effect.
Demographic and clinical data were obtained from electronic health record review using a standardized assessment form. These data included information about medical and psychiatric comorbidities, specialist consultations, and CLC-PAC unit admission indications and diagnoses. Medications of interest were categorized as antidepressants, antipsychotics, benzodiazepines, muscle relaxants, hypnotics, stimulants, antiepileptic drugs/mood stabilizers (including gabapentin and pregabalin), and all adjuvant analgesics. Adjuvant analgesics were defined as medications administered for pain as documented by chart notes or those ordered as needed for pain, and analyzed as a composite variable. Antidepressants with analgesic properties (serotonin-norepinephrine reuptake inhibitors and tricyclic antidepressants) were considered adjuvant analgesics. Psychiatric information collected included presence of mood, anxiety, and psychotic disorders, and PTSD. SUD information was collected separately from other psychiatric disorders.
Analyses
The study population was described using tabulations for categorical data and means and standard deviations for continuous data. Responsiveness to opioids was analyzed as a continuous variable. Those with higher mean ∆ scores were considered to have pain relatively more responsive to opioids, while lower mean ∆ scores indicated pain less responsive to opioids. We constructed linear regression models controlling for average pre-opioid pain rating scores to explore associations between opioid responsiveness and variables of interest. All analyses were completed using Stata version 15. This study was not adequately powered to detect differences across the spectrum of opioid responsiveness, although the authors have reported differences in this article.
Results
Over the 4-day observational period there were 146 resident-days. Of these, 88 (60.3%) reported at least 1 pain score of ≥ 4. Of those, 61 (41.8%) received ≥ 1 as-needed opioid for pain. We identified 46 resident-days meeting study criteria of ≥ 2 pre- and postanalgesic scores. We identified 41 unique individuals (Figure 1). Two individuals were admitted to the CLC-PAC unit on 2 of the 4 observation days, and 1 individual was admitted to the CLC-PAC unit on 3 of the 4 observation days. For individuals admitted several days, we included data only from the initial observation day.
Response to opioids varied greatly in this sample. The mean (SD) ∆ pain score was 3.4 (1.6) and ranged from 0.5 to 6.3. Using linear regression, we found no relationship between admission indication, medical comorbidities (including active cancer), and opioid responsiveness (Table).
Psychiatric disorders were highly prevalent, with 25 individuals (61.0%) having ≥ 1 any psychiatric diagnosis identified on chart review. The presence of any psychiatric diagnosis was significantly associated with reduced responsiveness to opioids (β = −1.08; 95% CI, −2.04 to −0.13; P = .03). SUDs also were common, with 17 individuals (41.5%) having an active SUD; most were tobacco/nicotine. Twenty-six veterans (63.4%) had documentation of SUD in remission with 19 (46.3%) for substances other than tobacco/nicotine. There was no indication that any veteran in the sample was prescribed medication for opioid use disorder (OUD) at the time of observation. There was no relationship between opioid responsiveness and SUDs, neither active or in remission. Consults to other services that suggested distress or difficult-to-control symptoms also were frequent. Consults to the pain service were significantly associated with reduced responsiveness to opioids (β = −1.75; 95% CI, −3.33 to −0.17; P = .03). Association between psychiatry consultation and reduced opioid responsiveness trended toward significance (β = −0.95; 95% CI, −2.06 to 0.17; P = .09) (Figures 2 and 3). There was no significant association with palliative medicine consultation and opioid responsiveness.
A poorer response to opioids was associated with a significantly higher as-needed opioid dosage (β = −0.02; 95% CI, −0.04 to −0.01; P = .002) as well as a trend toward higher total opioid dosage (β = −0.005; 95% CI, −0.01 to 0.0003; P = .06) (Figure 4). Thirty-eight (92.7%) participants received nonopioid adjuvant analgesics for pain. More than half (56.1%) received antidepressants or gabapentinoids (51.2%), although we did not assess whether they were prescribed for pain or another indication. We did not identify a relationship between any specific psychoactive drug class and opioid responsiveness in this sample.
Discussion
This exploratory study used readily available administrative data in a CLC-PAC unit to assess responsiveness to opioids via a numeric mean ∆ score, with higher values indicating more pain relief in response to opioids. We then constructed linear regression models to characterize the relationship between the mean ∆ score and factors known to be associated with difficult-to-control pain and psychosocial distress. As expected, opioid responsiveness was highly variable among residents; some residents experienced essentially no reduction in pain, on average, despite receiving opioids. Psychiatric comorbidity, higher dosage in OMEs, and the presence of a pain service consult significantly correlated with poorer response to opioids. To our knowledge, this is the first study to quantify opioid responsiveness and describe the relationship with clinical correlates in the understudied PAC population.
Earlier research has demonstrated a relationship between the presence of psychiatric disorders and increased likelihood of receiving any analgesics among veterans residing in PAC.9 Our study adds to the literature by quantifying opioid response using readily available administrative data and examining associations with psychiatric diagnoses. These findings highlight the possibility that attempting to treat high levels of pain by escalating the opioid dosage in patients with a comorbid psychiatric diagnosis should be re-addressed, particularly if there is no meaningful pain reduction at lower opioid dosages. Our sample had a variety of admission diagnoses and medical comorbidities, however, we did not identify a relationship with opioid responsiveness, including an active cancer diagnosis. Although SUDs were highly prevalent in our sample, there was no relationship with opioid responsiveness. This suggests that lack of response to opioids is not merely a matter of drug tolerance or an indication of drug-seeking behavior.
Factors Impacting Response
Many factors could affect whether an individual obtains an adequate analgesic response to opioids or other pain medications, including variations in genes encoding opioid receptors and hepatic enzymes involved in drug metabolism and an individual’s opioid exposure history.13 The phenomenon of requiring more drug to produce the same relief after repeated exposures (ie, tolerance) is well known.14 Opioid-induced hyperalgesia is a phenomenon whereby a patient’s overall pain increases while receiving opioids, but each opioid dose might be perceived as beneficial.15 Increasingly, psychosocial distress is an important factor in opioid response. Adverse selection is the process culminating in those with psychosocial distress and/or SUDs being prescribed more opioids for longer durations.16 Our data suggests that this process could play a role in PAC settings. In addition, exaggerating pain to obtain additional opioids for nonmedical purposes, such as euphoria or relaxation, also is possible.17
When clinically assessing an individual whose pain is not well controlled despite escalating opioid dosages, prescribers must consider which of these factors likely is predominant. However, the first step of determining who has a poor opioid response is not straightforward. Directly asking patients is challenging; many individuals perceive opioids to be helpful while simultaneously reporting inadequately controlled pain.7,8 The primary value of this study is the possibility of providing prescribers a quick, simple method of assessing a patient’s response to opioids. Using this method, individuals who are responding poorly to opioids, including those who might exaggerate pain for secondary gain, could be identified. Health care professionals could consider revisiting pain management strategies, assess for the presence of OUD, or evaluate other contributors to inadequately controlled pain. Although we only collected data regarding response to opioids in this study, any pain medication administered as needed (ie, nonsteroidal anti-inflammatory drugs, acetaminophen) could be analyzed using this methodology, allowing identification of other helpful pain management strategies. We began the validation process with extensive chart review, but further validation is required before this method can be applied to routine clinical practice.
Patients who report uncontrolled pain despite receiving opioids are a clinically challenging population. The traditional strategy has been to escalate opioids, which is recommended by the World Health Organization stepladder approach for patients with cancer pain and limited life expectancy.18 Applying this approach to a general population of patients with chronic pain is ineffective and dangerous.19 The CDC and the VA/US Department of Defense (VA/DoD) guidelines both recommend carefully reassessing risks and benefits at total daily dosages > 50 OME and avoid increasing dosages to > 90 OME daily in most circumstances.5,20 Our finding that participants taking higher dosages of opioids were not more likely to have better control over their pain supports this recommendation.
Limitations
This study has several limitations, the most significant is its small sample size because of the exploratory nature of the project. Results are based on a small pilot sample enriched to include individuals with at least moderate pain who receive opioids frequently at 1 VA CLC-PAC unit; therefore, the results might not be representative of all veterans or a more general population. Our small sample size limits power to detect small differences. Data collected should be used to inform formal power calculations before subsequent larger studies to select adequate sample size. Validation studies, including samples from the same population using different dates, which reproduce findings are an important step. Moreover, we only had data on a single dimension of pain (intensity/severity), as measured by the pain scale, which nursing staff used to make a real-time clinical decision of whether to administer an as-needed opioid. Future studies should consider using pain measures that provide multidimensional assessment (ie, severity, functional interference) and/or were developed specifically for veterans, such as the Defense and Veterans Pain Rating Scale.21
Our study was cross-sectional in nature and addressed a single 24-hour period of data per participant. The years of data collection (2016 and 2017) followed a decline in overall opioid prescribing that has continued, likely influenced by CDC and VA/DoD guidelines.22 It is unclear whether our observations are an accurate reflection of individuals’ response over time or whether prescribing practices in PAC have shifted.
We did not consider the type of pain being treated or explore clinicians’ reasons for prescribing opioids, therefore limiting our ability to know whether opioids were indicated. Information regarding OUD and other SUDs was limited to what was documented in the chart during the CLC-PAC unit admission. We did not have information on length of exposure to opioids. It is possible that opioid tolerance could play a role in reducing opioid responsiveness. However, simple tolerance would not be expected to explain robust correlations with psychiatric comorbidities. Also, simple tolerance would be expected to be overcome with higher opioid dosages, whereas our study demonstrates less responsiveness. These data suggests that some individuals’ pain might be poorly opioid responsive, and psychiatric factors could increase this risk. We used a novel data source in combination with chart review; to our knowledge, barcode medication administration data have not been used in this manner previously. Future work needs to validate this method, using larger sample sizes and several clinical sites. Finally, we used regression models that controlled for average pre-opioid pain rating scores, which is only 1 covariate important for examining effects. Larger studies with adequate power should control for multiple covariates known to be associated with pain and opioid response.
Conclusions
Opioid responsiveness is important clinically yet challenging to assess. This pilot study identifies a way of classifying pain as relatively opioid nonresponsive using administrative data but requires further validation before considering scaling for more general use. The possibility that a substantial percentage of residents in a CLC-PAC unit could be receiving increasing dosages of opioids without adequate benefit justifies the need for more research and underscores the need for prescribers to assess individuals frequently for ongoing benefit of opioids regardless of diagnosis or mechanism of pain.
Acknowledgments
The authors thank Andrzej Galecki, Corey Powell, and the University of Michigan Consulting for Statistics, Computing and Analytics Research Center for assistance with statistical analysis.
1. Marshall TL, Reinhardt JP. Pain management in the last 6 months of life: predictors of opioid and non-opioid use. J Am Med Dir Assoc. 2019;20(6):789-790. doi:10.1016/j.jamda.2019.02.026
2. Tait RC, Chibnall JT. Pain in older subacute care patients: associations with clinical status and treatment. Pain Med. 2002;3(3):231-239. doi:10.1046/j.1526-4637.2002.02031.x
3. Pimentel CB, Briesacher BA, Gurwitz JH, Rosen AB, Pimentel MT, Lapane KL. Pain management in nursing home residents with cancer. J Am Geriatr Soc. 2015;63(4):633-641. doi:10.1111/jgs.13345
4. Hunnicutt JN, Tjia J, Lapane KL. Hospice use and pain management in elderly nursing home residents with cancer. J Pain Symptom Manage. 2017;53(3):561-570. doi:10.1016/j.jpainsymman.2016.10.369
5. Dowell D, Haegerich TM, Chou R. CDC guideline for prescribing opioids for chronic pain — United States, 2016. MMWR Recomm Rep. 2016;65(No. RR-1):1-49. doi:10.15585/mmwr.rr6501e1
6. Oliva EM, Bowe T, Tavakoli S, et al. Development and applications of the Veterans Health Administration’s Stratification Tool for Opioid Risk Mitigation (STORM) to improve opioid safety and prevent overdose and suicide. Psychol Serv. 2017;14(1):34-49. doi:10.1037/ser0000099
7. Goesling J, Moser SE, Lin LA, Hassett AL, Wasserman RA, Brummett CM. Discrepancies between perceived benefit of opioids and self-reported patient outcomes. Pain Med. 2018;19(2):297-306. doi:10.1093/pm/pnw263
8. Sullivan M, Von Korff M, Banta-Green C. Problems and concerns of patients receiving chronic opioid therapy for chronic non-cancer pain. Pain. 2010;149(2):345-353. doi:10.1016/j.pain.2010.02.037
9. Brennan PL, Greenbaum MA, Lemke S, Schutte KK. Mental health disorder, pain, and pain treatment among long-term care residents: evidence from the Minimum Data Set 3.0. Aging Ment Health. 2019;23(9):1146-1155. doi:10.1080/13607863.2018.1481922
10. Woo A, Lechner B, Fu T, et al. Cut points for mild, moderate, and severe pain among cancer and non-cancer patients: a literature review. Ann Palliat Med. 2015;4(4):176-183. doi:10.3978/j.issn.2224-5820.2015.09.04
11. Centers for Disease Control and Prevention. Calculating total daily dose of opioids for safer dosage. 2017. Accessed December 15, 2021. https://www.cdc.gov/drugoverdose/pdf/calculating_total_daily_dose-a.pdf
12. Nielsen S, Degenhardt L, Hoban B, Gisev N. Comparing opioids: a guide to estimating oral morphine equivalents (OME) in research. NDARC Technical Report No. 329. National Drug and Alcohol Research Centre; 2014. Accessed December 15, 2021. http://www.drugsandalcohol.ie/22703/1/NDARC Comparing opioids.pdf
13. Smith HS. Variations in opioid responsiveness. Pain Physician. 2008;11(2):237-248.
14. Collin E, Cesselin F. Neurobiological mechanisms of opioid tolerance and dependence. Clin Neuropharmacol. 1991;14(6):465-488. doi:10.1097/00002826-199112000-00001
15. Higgins C, Smith BH, Matthews K. Evidence of opioid-induced hyperalgesia in clinical populations after chronic opioid exposure: a systematic review and meta-analysis. Br J Anaesth. 2019;122(6):e114-e126. doi:10.1016/j.bja.2018.09.019
16. Howe CQ, Sullivan MD. The missing ‘P’ in pain management: how the current opioid epidemic highlights the need for psychiatric services in chronic pain care. Gen Hosp Psychiatry. 2014;36(1):99-104. doi:10.1016/j.genhosppsych.2013.10.003
17. Substance Abuse and Mental Health Services Administration. Key substance use and mental health indicators in the United States: results from the 2018 National Survey on Drug Use and Health. HHS Publ No PEP19-5068, NSDUH Ser H-54. 2019;170:51-58. Accessed December 15, 2021. https://www.samhsa.gov/data/sites/default/files/cbhsq-reports/NSDUHNationalFindingsReport2018/NSDUHNationalFindingsReport2018.pdf
18. World Health Organization. WHO’s cancer pain ladder for adults. Accessed September 21, 2018. www.who.int/ncds/management/palliative-care/Infographic-cancer-pain-lowres.pdf
19. Ballantyne JC, Kalso E, Stannard C. WHO analgesic ladder: a good concept gone astray. BMJ. 2016;352:i20. doi:10.1136/bmj.i20
20. The Opioid Therapy for Chronic Pain Work Group. VA/DoD clinical practice guideline for opioid therapy for chronic pain. US Dept of Veterans Affairs and Dept of Defense; 2017. Accessed December 15, 2021. https://www.healthquality.va.gov/guidelines/Pain/cot/VADoDOTCPG022717.pdf
21. Defense & Veterans Pain Rating Scale (DVPRS). Defense & Veterans Center for Integrative Pain Management. Accessed July 21, 2021. https://www.dvcipm.org/clinical-resources/defense-veterans-pain-rating-scale-dvprs/
22. Guy GP Jr, Zhang K, Bohm MK, et al. Vital signs: changes in opioid prescribing in the United States, 2006–2015. MMWR Morb Mortal Wkly Rep. 2017;66(26):697-704. doi:10.15585/mmwr.mm6626a4