User login
Women with obesity need not boost calories during pregnancy
LAS VEGAS – Contrary to current U.S. dietary recommendations for pregnancy, women with obesity should not increase their energy intake during pregnancy to achieve the current recommended level of gestational weight gain, based on findings from an intensive assessment of 54 women with obesity during weeks 13-37 of pregnancy.
To achieve the gestational weight gain of 11-20 pounds (5-9.1 kg) recommended by the Institute of Medicine, women with obesity ‒ those with a body mass index of 30 kg/m2 or greater ‒ had an average energy intake during the second and third trimesters of 125 kcal/day less than their energy expenditure, Leanne M. Redman, PhD, said at a meeting presented by the Obesity Society and the American Society for Metabolic and Bariatric Surgery.
However, women in the study who had inadequate gestational weight gain had a daily calorie deficit that was only slightly larger, an average of 262 kcal/day below their energy expenditure. As a consequence, Dr. Redman believes the take-home message from her findings is that pregnant women with obesity should maintain their prepregnancy energy intake, though she also strongly recommended improvements in diet quality.
“Chasing a 100-kcal/day deficit in intake is extremely problematic,” Dr. Redman admitted, so she suggested that women with obesity be advised simply to not increase their calorie intake during pregnancy.
“The message is: Focus on improving diet quality rather than increasing calories,” she said in an interview. Pregnant women with obesity “do not need to increase calorie intake. They need to improve their diet quality,” with increased consumption of fruits and vegetables, said Dr. Redman, a professor and director of the Reproductive Endocrinology and Women’s Health Laboratory at Louisiana State University’s Pennington Biomedical Research Center in Baton Rouge.
The results she reported represent “the first time” researchers have examined energy expenditure and weight-gain trajectories in women with obesity throughout the second and third trimesters. Until now, dietary energy recommendations for women with obesity during pregnancy were based on observations made in women without obesity.
Those observations led the Institute of Medicine to call for a recommended pregnancy weight gain of 11-20 pounds in women with obesity, as well as gains of 25-35 pounds in women with a normal body mass index of 18.5-24.9 kg/m2 (Weight Gain During Pregnancy: Reexamining the Guidelines; May 2009). In that 2009 document, the IOM committee said that, in general, pregnant women should add 340 kcal/day to their prepregnancy intake during the second trimester and add 452 kcal/day during the third trimester without regard to their prepregnancy body mass index, a recommendation that clinicians continued to promote in subsequent years (Med Clin North Amer. 2016;100[6]:1199-215), and that was generally affirmed by the American College of Obstetricians and Gynecologists in 2013 and reaffirmed in 2018.*
The new evidence collected by Dr. Redman and associates “challenges current practice and argues that women with obesity should not be advised to consume additional energy during pregnancy as currently recommended,” they wrote in an article with their findings published a few days before Dr. Redman gave her talk (J Clin Invest. 2019;129[11]:4682-90).
The MomEE (Determinants of Gestational Weight Gain in Obese Pregnant Women) study enrolled 72 women with obesity during the first trimester of pregnancy and collected complete data through the end of the third trimester from 54 women. The researchers collected data on weight, body fat mass, and energy expenditure at multiple times during the second and third trimesters and calculated energy intake.
Based on body weights at the end of the third trimester, the researchers divided the 54 women into three subgroups: 10 women (19%) with inadequate weight gain by the IOM recommendations, 8 (15%) who had the IOM’s recommended weight gain of 11-20 pounds, and 36 women (67%; total is greater than 100% because of rounding) with excess weight gain, and within each group, they calculated the average level of energy intake relative to energy expenditure.
In addition to the daily calorie deficits associated with women who maintained recommended or inadequate weight, the researchers also found that women with excess weight gain averaged 186 more kcal/day than required to meet their daily energy expenditure.
The analyses showed that the increased energy demand of pregnancy and the fetus is compensated for by mobilization of the maternal fat mass in women with obesity, and that an imbalance between energy intake and expenditure is the main driver of weight gain during pregnancy. The results also highlighted how often pregnant women with obesity fail to follow a diet that results in the recommended weight gain of 11-20 pounds. In the MomEE cohort, two-thirds of enrolled women had excess weight gain.
The finding that women had the recommended weight gain on a diet that cut their daily calorie intake by about 100 kcal/day during the last two trimesters highlighted the nutritional challenge faced by women with obesity who are pregnant. “About three-quarters of women in the study had poor diet quality. There is an opportunity to improve diet with more fruits and vegetables to increase fullness, and [to reduce] energy-dense foods,” Dr. Redman said.
She is planning to collaborate on a study that will test the efficacy and safety of providing pregnant women with extreme obesity (class II-III) with defined meals to provide better control of energy intake and nutritional quality. Dr. Redman said she also hoped that the new findings she reported would be taken into account by the advisory committee assembled by the Department of Health & Human Services and the Department of Agriculture, which are currently preparing a revision of U.S. dietary guidelines for release in 2020.
The National Institutes of Health and the Clinical Research Cores at Pennington Biomedical Research Center funded the study. Dr. Redman had no disclosures.
SOURCE: Redman LM et al. Obesity Week 2019, Abstract T-OR-2079.
*This article was updated 2/7/2020.
The results reported by Dr. Redman from the MomEE study showed that women with obesity need not ingest surplus calories to gain weight during pregnancy. The findings indicate that pregnant women efficiently convert a portion of their accumulated fat mass to fat-free mass in the form of the fetus, uterus, blood volume, and other tissue. A deficit of about approximately 100 kcal/day effectively kept weight gain within the 11- to 20-pound target recommended by the Institute of Medicine in 2009.
But the weight gains recommended for women with obesity may be too high. The desire of the writers of the IOM recommendation to avoid negative perinatal outcomes for infants may instead lead to negative maternal outcomes, such as preeclampsia, gestational hypertension, and need for cesarean birth. Gestational weight gains below what the IOM recommended for women with obesity may be able to serve present-day standards and work better for these pregnant women by reducing their morbidity risk. Future studies should take into careful account overall nutrient values rather than just calorie intake, as well as physical activity.
The MomEE results showed that a striking two-thirds of women with obesity gained an excess of weight during pregnancy, beyond the 2009 recommendations. This finding highlights the need to identify strategies that can prevent excessive weight gain. Furthermore, results from several studies and systematic reviews suggest that the IOM recommendation for weight gain during pregnancy is too high for women with obesity, especially those with class II-III obesity, with a body mass index of 35 kg/m2 or greater. In my opinion, an appropriate weight-gain target to replace the current, blanket recommendation of 11-20 pounds gained for all women with obesity is a target of 5-15 pounds gained for women with class I obesity, less than 10 pounds for class II obesity, and no change in prepregnancy weight for women with class III obesity.
Sarah S. Comstock, PhD, is a nutrition researcher at Michigan State University, East Lansing. She is an inventor named on three patents that involve nutrition. She made these comments in an editorial that accompanied the MomEE report (J Clin Invest. 2019;129[11]:4567-9).
LAS VEGAS – Contrary to current U.S. dietary recommendations for pregnancy, women with obesity should not increase their energy intake during pregnancy to achieve the current recommended level of gestational weight gain, based on findings from an intensive assessment of 54 women with obesity during weeks 13-37 of pregnancy.
To achieve the gestational weight gain of 11-20 pounds (5-9.1 kg) recommended by the Institute of Medicine, women with obesity ‒ those with a body mass index of 30 kg/m2 or greater ‒ had an average energy intake during the second and third trimesters of 125 kcal/day less than their energy expenditure, Leanne M. Redman, PhD, said at a meeting presented by the Obesity Society and the American Society for Metabolic and Bariatric Surgery.
However, women in the study who had inadequate gestational weight gain had a daily calorie deficit that was only slightly larger, an average of 262 kcal/day below their energy expenditure. As a consequence, Dr. Redman believes the take-home message from her findings is that pregnant women with obesity should maintain their prepregnancy energy intake, though she also strongly recommended improvements in diet quality.
“Chasing a 100-kcal/day deficit in intake is extremely problematic,” Dr. Redman admitted, so she suggested that women with obesity be advised simply to not increase their calorie intake during pregnancy.
“The message is: Focus on improving diet quality rather than increasing calories,” she said in an interview. Pregnant women with obesity “do not need to increase calorie intake. They need to improve their diet quality,” with increased consumption of fruits and vegetables, said Dr. Redman, a professor and director of the Reproductive Endocrinology and Women’s Health Laboratory at Louisiana State University’s Pennington Biomedical Research Center in Baton Rouge.
The results she reported represent “the first time” researchers have examined energy expenditure and weight-gain trajectories in women with obesity throughout the second and third trimesters. Until now, dietary energy recommendations for women with obesity during pregnancy were based on observations made in women without obesity.
Those observations led the Institute of Medicine to call for a recommended pregnancy weight gain of 11-20 pounds in women with obesity, as well as gains of 25-35 pounds in women with a normal body mass index of 18.5-24.9 kg/m2 (Weight Gain During Pregnancy: Reexamining the Guidelines; May 2009). In that 2009 document, the IOM committee said that, in general, pregnant women should add 340 kcal/day to their prepregnancy intake during the second trimester and add 452 kcal/day during the third trimester without regard to their prepregnancy body mass index, a recommendation that clinicians continued to promote in subsequent years (Med Clin North Amer. 2016;100[6]:1199-215), and that was generally affirmed by the American College of Obstetricians and Gynecologists in 2013 and reaffirmed in 2018.*
The new evidence collected by Dr. Redman and associates “challenges current practice and argues that women with obesity should not be advised to consume additional energy during pregnancy as currently recommended,” they wrote in an article with their findings published a few days before Dr. Redman gave her talk (J Clin Invest. 2019;129[11]:4682-90).
The MomEE (Determinants of Gestational Weight Gain in Obese Pregnant Women) study enrolled 72 women with obesity during the first trimester of pregnancy and collected complete data through the end of the third trimester from 54 women. The researchers collected data on weight, body fat mass, and energy expenditure at multiple times during the second and third trimesters and calculated energy intake.
Based on body weights at the end of the third trimester, the researchers divided the 54 women into three subgroups: 10 women (19%) with inadequate weight gain by the IOM recommendations, 8 (15%) who had the IOM’s recommended weight gain of 11-20 pounds, and 36 women (67%; total is greater than 100% because of rounding) with excess weight gain, and within each group, they calculated the average level of energy intake relative to energy expenditure.
In addition to the daily calorie deficits associated with women who maintained recommended or inadequate weight, the researchers also found that women with excess weight gain averaged 186 more kcal/day than required to meet their daily energy expenditure.
The analyses showed that the increased energy demand of pregnancy and the fetus is compensated for by mobilization of the maternal fat mass in women with obesity, and that an imbalance between energy intake and expenditure is the main driver of weight gain during pregnancy. The results also highlighted how often pregnant women with obesity fail to follow a diet that results in the recommended weight gain of 11-20 pounds. In the MomEE cohort, two-thirds of enrolled women had excess weight gain.
The finding that women had the recommended weight gain on a diet that cut their daily calorie intake by about 100 kcal/day during the last two trimesters highlighted the nutritional challenge faced by women with obesity who are pregnant. “About three-quarters of women in the study had poor diet quality. There is an opportunity to improve diet with more fruits and vegetables to increase fullness, and [to reduce] energy-dense foods,” Dr. Redman said.
She is planning to collaborate on a study that will test the efficacy and safety of providing pregnant women with extreme obesity (class II-III) with defined meals to provide better control of energy intake and nutritional quality. Dr. Redman said she also hoped that the new findings she reported would be taken into account by the advisory committee assembled by the Department of Health & Human Services and the Department of Agriculture, which are currently preparing a revision of U.S. dietary guidelines for release in 2020.
The National Institutes of Health and the Clinical Research Cores at Pennington Biomedical Research Center funded the study. Dr. Redman had no disclosures.
SOURCE: Redman LM et al. Obesity Week 2019, Abstract T-OR-2079.
*This article was updated 2/7/2020.
REPORTING FROM OBESITY WEEK 2019
Skin barrier dysfunction mutations vary by race, disease persistence in children with AD
Among children with atopic dermatitis, genetic variants associated with skin barrier dysfunction vary significantly by race and by their influence on disease persistence, according to authors of a cohort study.
In the study, which was based on data from a pediatric eczema registry, The investigators remarked on “profound” differences by race in the study, which used a high-throughput sequencing method to identify FLG LoF variants, some of which were common in white children but not so frequently seen in black children.
Conversely, some variants common in black children were completely absent in the white children, according to the investigators, led by David J. Margolis, MD, PhD, professor of dermatology at the University of Pennsylvania, Philadelphia. The study was published in JAMA Dermatology.
These findings imply that any genetic tests developed for AD should be “inclusive,” they wrote, and shouldn’t simply rely on the most common variants associated with patients of European ancestry, namely p.R501*, c.2282del4[p.S761fs], p.S3247*, and p.R2447*.
“Relying on the classic 4 FLG LoF variants would result in approximately 8% of white children and 64% of black children with an FLG LoF variant being improperly classified,” Dr. Margolis and coinvestigators wrote.
Their comprehensive analysis of FLG LoF variants was based on a U.S. cohort of 741 children with mild to moderate AD in the Pediatric Eczema Elective Registry (PEER), enrolled from 2005 to 2017. The mean age of onset of AD among the children was almost 2 years. Using massively parallel sequencing, the investigators identified a total of 23 FLG LoF variants in 177 children, or 23.9% of the overall cohort.
White children had a higher frequency of FLG LoF variants, according to the investigators. The prevalence of variants was 31.5% in white and 15.3% in black participants, translating into an odds ratio of 2.44 for carrying any variant in a white versus black child (95% confidence interval, 1.76-3.39).
In previous studies, FLG LoF variants are seen in 25%-30% of people with AD who have European and Asian ancestry; by contrast, they are “uncommonly” exhibited in individuals of African ancestry, the investigators wrote.
Persistent AD was more likely among children with FLG LoF variants, with an odds ratio of 0.67 (95% CI, 0.56-0.80), according to Dr. Margolis and coauthors. However, the black children in this cohort had more persistent disease, compared with white children, regardless of whether they had FLG LoF variants or not.
Exon 3 FLG LoF are known to be the most common variants linked to skin barrier dysfunction, the investigators noted.
“However, all FLG LoF variants might not confer an increased risk of AD, and further, they may not all have the same effect on the persistence of AD over time,” they added in a discussion of their results.
The study was supported by a grant from the National Institute of Arthritis and Musculoskeletal and Skin Diseases. The PEER cohort is funded by Valeant Pharmaceuticals. Dr. Margolis reported receiving research funding as the principal investigator via the trustees of the University of Pennsylvania, and receiving funding from the National Institutes of Health and Valeant; disclosures not related to the study included consulting activities primarily as a member of a data monitoring or scientific advisory boards for several pharmaceutical companies.
SOURCE: Margolis DJ et al. JAMA Dermatol. 2019 Jul 31. doi: 10.1011/jamadermatol.2019.1946.
FROM JAMA DERMATOLOGY
Autoimmune liver disease: Karnofsky score predicts transplant survival
BOSTON – The Karnofsky Performance Status is predictive of 5-year survival among patients with autoimmune-related liver disease who undergo a transplant, based on a retrospective look at more than 6,500 patients.
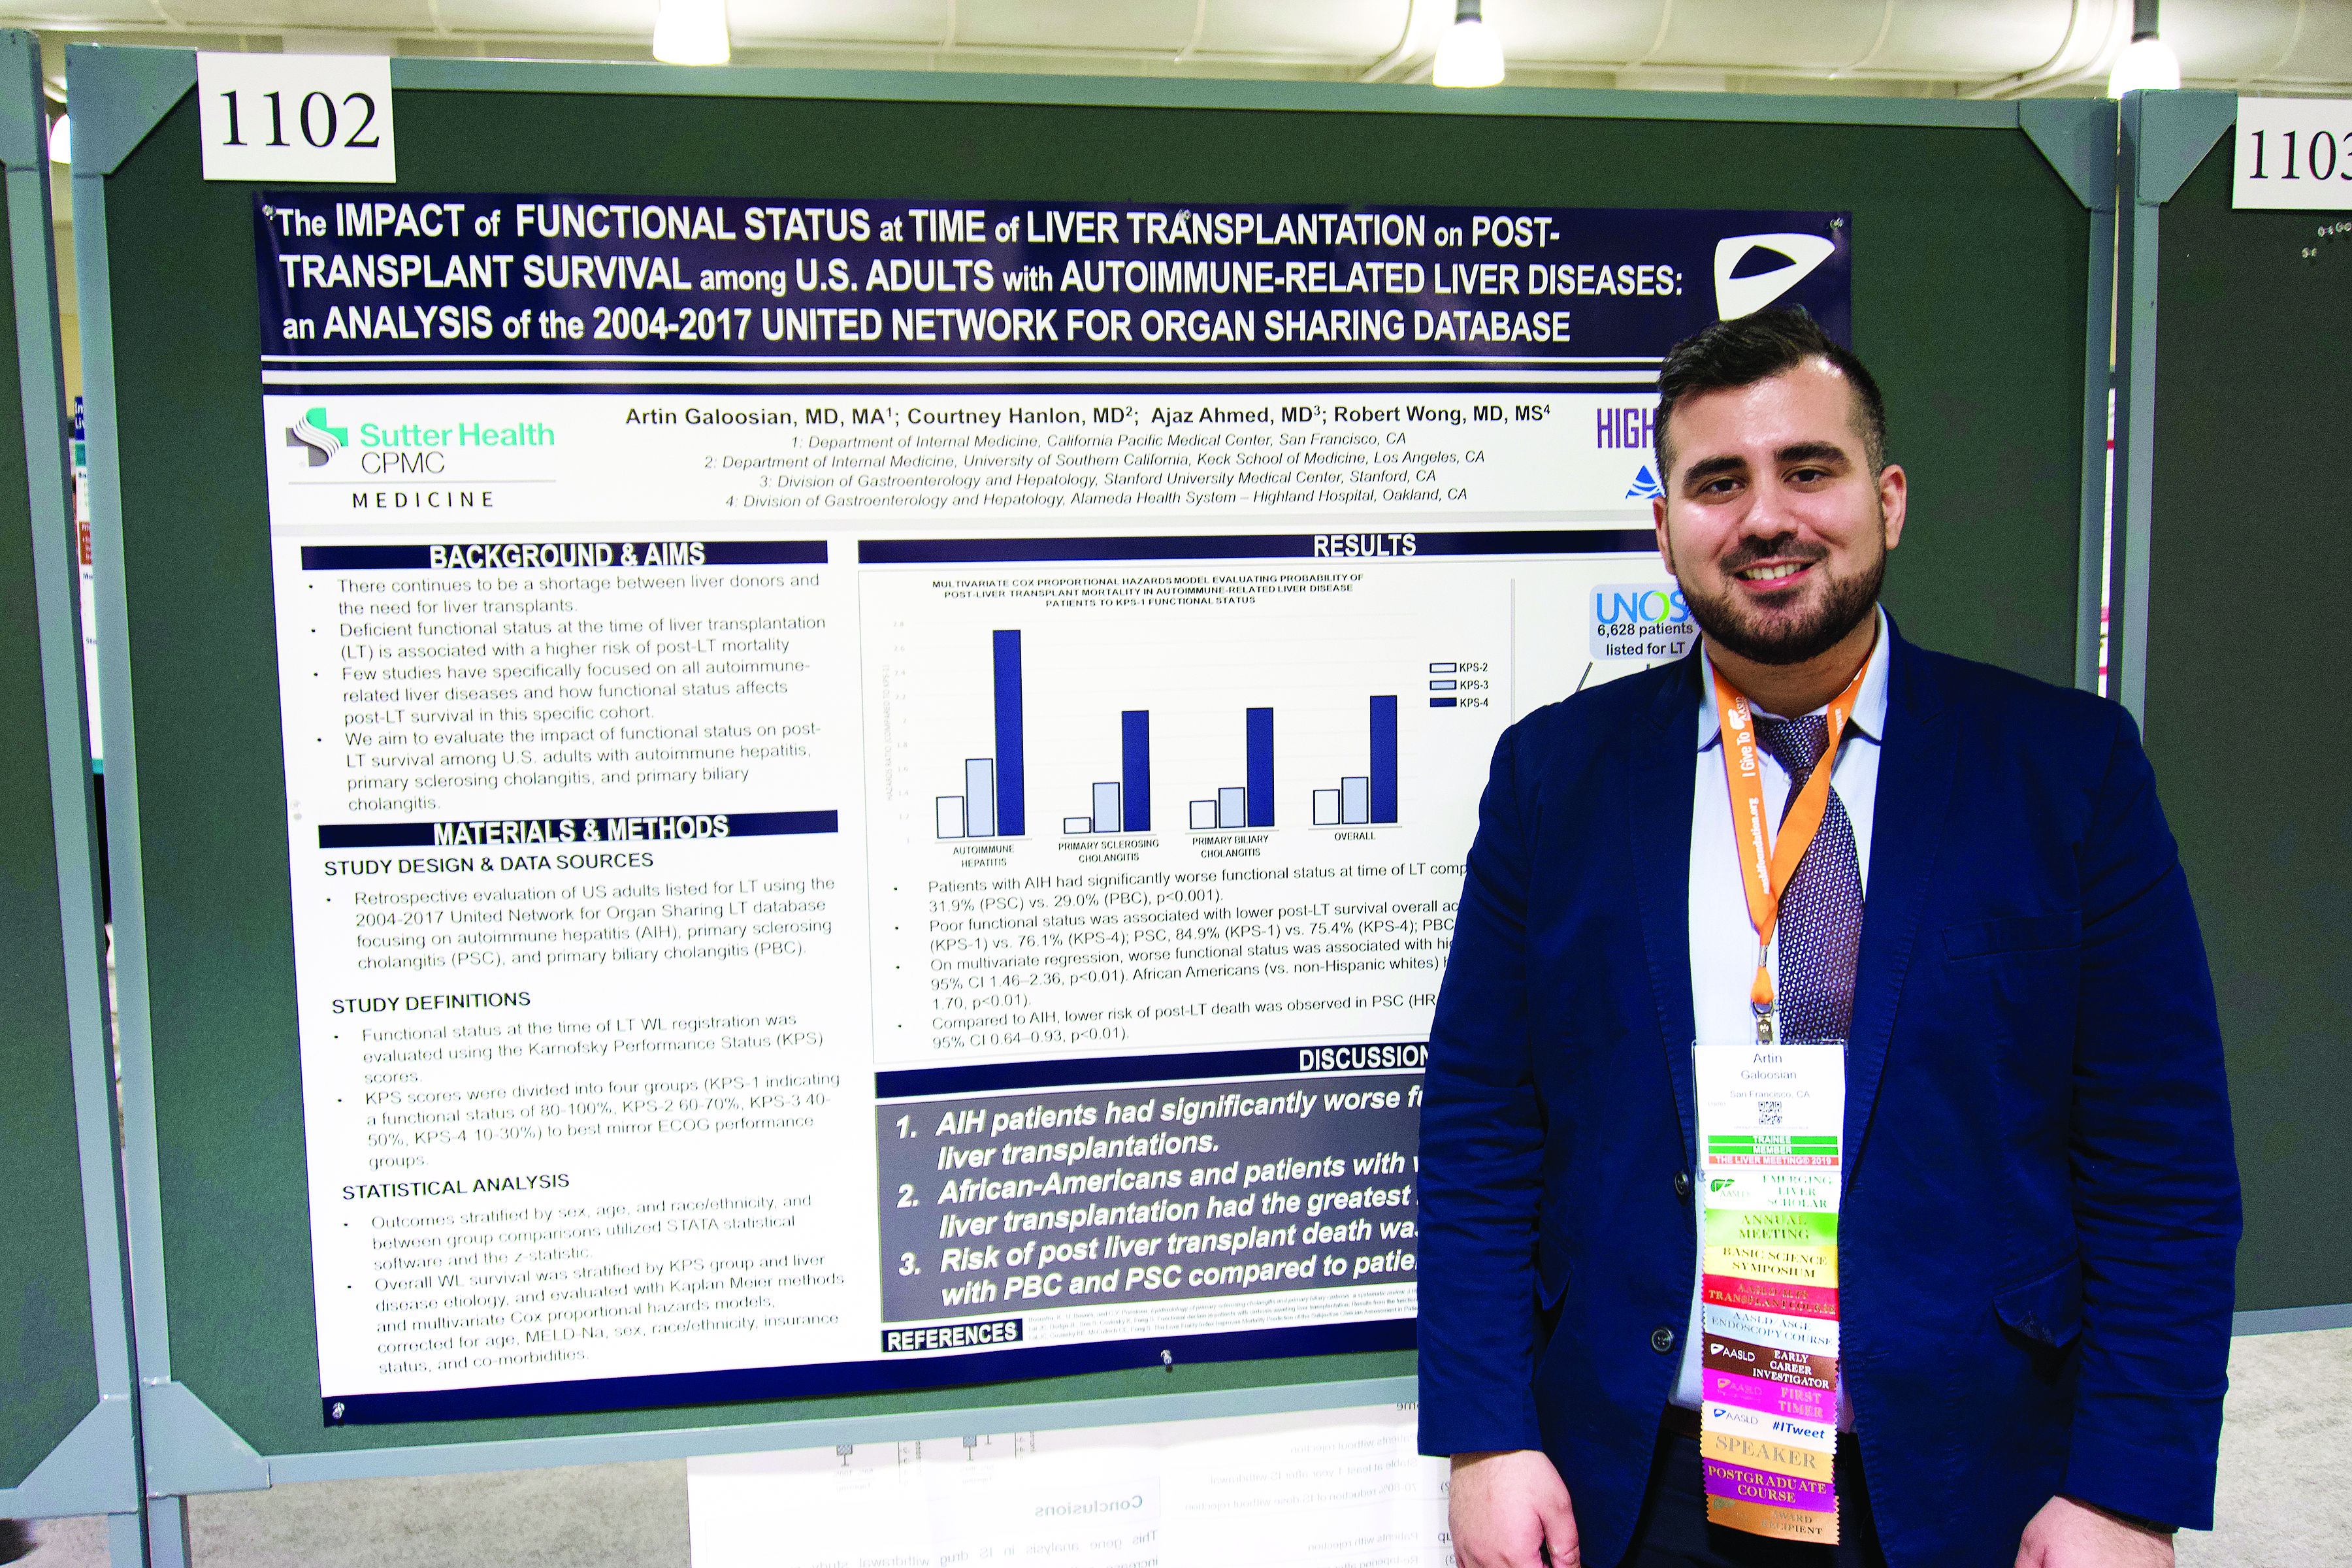
The analysis also showed that African American patients had a 33% higher mortality risk than non-Hispanic white patients, reported lead author Artin Galoosian, MD, of California Pacific Medical Center in San Francisco, who presented findings at the annual meeting of the American Association for the Study of Liver Diseases.
According to Dr. Galoosian, previous research has shown that Karnofsky scores are a quick and reliable means of predicting survival with liver transplant, but minimal research has evaluated this clinical tool specifically for patients with autoimmune-related liver diseases, which prompted the present study.
Drawing data from the United Network for Organ Sharing (UNOS; 2004-2017), the investigators evaluated performance status and survival in 6,628 patients who underwent liver transplant for one of three diseases: autoimmune hepatitis (AIH), primary sclerosing cholangitis (PSC), or primary biliary cholangitis (PBC). Karnofsky scores were divided into quartiles 1 through 4, from best to worst functional status. The investigators used Kaplan-Meier methods and multivariate Cox proportional hazard ratios to determine relationships between disease etiology, Karnofsky score, and survival; in addition, they evaluated the impact of demographic factors on outcomes.
The population was predominantly non-Hispanic white (73.0%) with smaller proportions of African American (13.4%) and Hispanic patients (11.5%). Of the three diseases, PBC was most common (38.2%), followed by PSC (32.1%), then AIH (29.7%).
Across all etiologies, Karnofsky status was significantly associated with survival; a score of 4 came with a 90% increased risk of posttransplant death, compared with a score of 1. Patients with AIH were most likely to have poor pretransplant functional status, as 39.1% of these patients had a Karnofsky score of 4, compared with 31.9% of patients with PSC and 29.0% of patients with PBC. AIH was also associated with a significantly higher risk of posttransplant death; relative risks for PSC and PBC were 20% and 17% lower, respectively.
Five years after surgery, 84.9% of AIH patients with a Karnofsky score of 1 were alive, compared with 76.1% of patients who had a score of 4. A similar association with functional status was found for PSC (84.9% vs. 75.4%), while PBC had a narrower survival margin (88.7% vs. 86.9%).
Analysis also revealed a wide survival gap between patients of different ethnic backgrounds. Compared with white patients, African American patients had a 33% higher risk of dying on the wait list or after transplant.
“[This gap] could reflect a multitude of issues, one being delayed referral to a hepatologist and being listed for transplant much later, so [patients] tend to be more sick,” Dr. Galoosian said.
He also offered some insight into clinical relevance.
“A broader implication of this research could be in the primary care setting,” Dr. Galoosian said. “[Clinicians need to be] aware that someone’s functional status has a broader impact on their health and be aware that ethnic minorities need to be more vigilantly up to date on their health care maintenance and more vigilantly connected to social workers if needed, in terms of getting the resources that they need to help break the [chain] of worse outcomes.”
The investigators disclosed relationships with Gilead, Salix, and AbbVie.
SOURCE: Galoosian A et al. The Liver Meeting 2019. Abstract 1102.
BOSTON – The Karnofsky Performance Status is predictive of 5-year survival among patients with autoimmune-related liver disease who undergo a transplant, based on a retrospective look at more than 6,500 patients.
The analysis also showed that African American patients had a 33% higher mortality risk than non-Hispanic white patients, reported lead author Artin Galoosian, MD, of California Pacific Medical Center in San Francisco, who presented findings at the annual meeting of the American Association for the Study of Liver Diseases.
According to Dr. Galoosian, previous research has shown that Karnofsky scores are a quick and reliable means of predicting survival with liver transplant, but minimal research has evaluated this clinical tool specifically for patients with autoimmune-related liver diseases, which prompted the present study.
Drawing data from the United Network for Organ Sharing (UNOS; 2004-2017), the investigators evaluated performance status and survival in 6,628 patients who underwent liver transplant for one of three diseases: autoimmune hepatitis (AIH), primary sclerosing cholangitis (PSC), or primary biliary cholangitis (PBC). Karnofsky scores were divided into quartiles 1 through 4, from best to worst functional status. The investigators used Kaplan-Meier methods and multivariate Cox proportional hazard ratios to determine relationships between disease etiology, Karnofsky score, and survival; in addition, they evaluated the impact of demographic factors on outcomes.
The population was predominantly non-Hispanic white (73.0%) with smaller proportions of African American (13.4%) and Hispanic patients (11.5%). Of the three diseases, PBC was most common (38.2%), followed by PSC (32.1%), then AIH (29.7%).
Across all etiologies, Karnofsky status was significantly associated with survival; a score of 4 came with a 90% increased risk of posttransplant death, compared with a score of 1. Patients with AIH were most likely to have poor pretransplant functional status, as 39.1% of these patients had a Karnofsky score of 4, compared with 31.9% of patients with PSC and 29.0% of patients with PBC. AIH was also associated with a significantly higher risk of posttransplant death; relative risks for PSC and PBC were 20% and 17% lower, respectively.
Five years after surgery, 84.9% of AIH patients with a Karnofsky score of 1 were alive, compared with 76.1% of patients who had a score of 4. A similar association with functional status was found for PSC (84.9% vs. 75.4%), while PBC had a narrower survival margin (88.7% vs. 86.9%).
Analysis also revealed a wide survival gap between patients of different ethnic backgrounds. Compared with white patients, African American patients had a 33% higher risk of dying on the wait list or after transplant.
“[This gap] could reflect a multitude of issues, one being delayed referral to a hepatologist and being listed for transplant much later, so [patients] tend to be more sick,” Dr. Galoosian said.
He also offered some insight into clinical relevance.
“A broader implication of this research could be in the primary care setting,” Dr. Galoosian said. “[Clinicians need to be] aware that someone’s functional status has a broader impact on their health and be aware that ethnic minorities need to be more vigilantly up to date on their health care maintenance and more vigilantly connected to social workers if needed, in terms of getting the resources that they need to help break the [chain] of worse outcomes.”
The investigators disclosed relationships with Gilead, Salix, and AbbVie.
SOURCE: Galoosian A et al. The Liver Meeting 2019. Abstract 1102.
REPORTING FROM THE LIVER MEETING 2019
Proximal venous outflow obstruction associated with chronic lower back pain
An unexpected prevalence of chronic lower back pain (CLBP) was found among patients with proximal venous outflow obstruction (PVOO), according to Windsor Ting, MD, of the Icahn School of Medicine at Mount Sinai, New York and colleagues.
On Friday morning, Dr. Ting will present a study they performed to assess 168 consecutive patients (59% women; mean age 63 years) with PVOO who underwent iliac vein stent placement. PVOO was confirmed with venography and/or IVUS. The patients were queried regarding preoperative and postoperative CLBP, defined as consistent low back pain of a minimum 3-month duration.
They collected data on demographics, venous-related symptomatology, pain scores (0-10) as determined by a visual analog scale (VAS), characteristics of the CLBP. In addition, details of the vein stent procedure were collected.
The mean postoperative duration among the patients was 526 days. Preoperative CLBP was present in 104 (62%) patients; 29 (28%) used analgesics and 38 (37%) had a prior visit with a CLBP specialist. Standing (44%) and sitting (43%) were the two most common factors associated with CLBP pain exacerbation.
Dr. Ting will discuss how CLBP was unexpectedly prevalent among patients with PVOO prior to their iliac vein stent placement, and how their pain was significantly improved after iliac vein stent placement, with 32% of the patients reporting complete symptom resolution. This study is the first to report these unexpected findings, according to the researchers, but the pathophysiology of CLBP in PVOO is unclear.
Apps for busy pediatric hospitalists 2.0
PHM19 session
Apps for busy pediatric hospitalists 2.0

Presenters
Tosin Adeyanju, MD, FAAP
Alexander Hogan, MD
Jane Im, MD, FAAP
Kim O’Hara, MD
Michael Tchou, MD, FAAP
Session summary
This presentation at Pediatric Hospital Medicine 2019 started with the sharing of learning tools to help physicians stay current and organized with the ever-expanding body of medical literature.
The instructors shared content aggregators, such as Read by QxMD, that allow the user to follow multiple journals and highlight new articles based on the user’s preferences and chosen keywords. They also shared reference managers, such as Mendeley, which allows users to organize, store, and access their literature library from anywhere and can even be used to simplify citations and bibliographies in articles.
The presenters shared resources and applications that can be used to quickly access information on mobile devices. Applications, such as MDCalc and the CDC STD Tx Guide, can allow users to reference clinical calculators and treatment courses for teaching at the bedside. The presenters also introduced pharmaceutical applications like GoodRx, an application that allows patients and physicians to compare drug prices at various pharmacies. They also introduced the audience to Formulary Search by MMIT that helps users determine which medications are covered by an insurance plan. They also shared some applications that can help users deal with emergencies, like Ped Guide and Pedi Crisis. These apps can help users review emergency algorithms, dose emergency medications, and determine the sizes of emergency equipment.
The presenters closed by sharing teaching applications that allow users to increase interactions with presentation audiences or learners. Teaching tools like Kahoot! and Poll Everywhere allow users to gauge their audiences’ understanding of material. Online software, such as Slack.com and Microsoft.com, allows for collaboration and file sharing across institutions and integrate with many other services.
Key takeaways
• Content aggregators and reference managers help users organize and access literature from anywhere.
• Teaching tools encourage audience participation, immediate assessment of learners.
• Online software tools allow for easy collaboration and file sharing across institutions and easily integrate with many other services.
Dr. Gupta is a pediatric hospitalist at Phoenix Children’s Hospital.
PHM19 session
Apps for busy pediatric hospitalists 2.0
Presenters
Tosin Adeyanju, MD, FAAP
Alexander Hogan, MD
Jane Im, MD, FAAP
Kim O’Hara, MD
Michael Tchou, MD, FAAP
Session summary
This presentation at Pediatric Hospital Medicine 2019 started with the sharing of learning tools to help physicians stay current and organized with the ever-expanding body of medical literature.
The instructors shared content aggregators, such as Read by QxMD, that allow the user to follow multiple journals and highlight new articles based on the user’s preferences and chosen keywords. They also shared reference managers, such as Mendeley, which allows users to organize, store, and access their literature library from anywhere and can even be used to simplify citations and bibliographies in articles.
The presenters shared resources and applications that can be used to quickly access information on mobile devices. Applications, such as MDCalc and the CDC STD Tx Guide, can allow users to reference clinical calculators and treatment courses for teaching at the bedside. The presenters also introduced pharmaceutical applications like GoodRx, an application that allows patients and physicians to compare drug prices at various pharmacies. They also introduced the audience to Formulary Search by MMIT that helps users determine which medications are covered by an insurance plan. They also shared some applications that can help users deal with emergencies, like Ped Guide and Pedi Crisis. These apps can help users review emergency algorithms, dose emergency medications, and determine the sizes of emergency equipment.
The presenters closed by sharing teaching applications that allow users to increase interactions with presentation audiences or learners. Teaching tools like Kahoot! and Poll Everywhere allow users to gauge their audiences’ understanding of material. Online software, such as Slack.com and Microsoft.com, allows for collaboration and file sharing across institutions and integrate with many other services.
Key takeaways
• Content aggregators and reference managers help users organize and access literature from anywhere.
• Teaching tools encourage audience participation, immediate assessment of learners.
• Online software tools allow for easy collaboration and file sharing across institutions and easily integrate with many other services.
Dr. Gupta is a pediatric hospitalist at Phoenix Children’s Hospital.
Findings confirm link between methimazole and risk for acute pancreatitis
CHICAGO –
After 6 months of methimazole use, the odds ratio for acute pancreatitis was 2.02, with a nonsignificant risk elevation for propylthiouracil use after a similar duration, Laszlo Hegedüs, MD, reported at the annual meeting of the American Thyroid Association.
“Ongoing methimazole, but not propylthiouracil, use is associated with an increased risk of acute pancreatitis,” he said.
Dr. Hegedüs, professor of endocrinology and metabolism at the University of Southern Denmark, Odense, said that the European Medicines Agency has noted a few postmarketing reports of acute pancreatitis in patients who received the antithyroid drug methimazole, as well as its prodrug, carbimazole. The agency has accordingly contraindicated antithyroid drug use for patients who previously experienced acute pancreatitis after receiving this drug, advising that methimazole should be “discontinued immediately” should a patient develop acute pancreatitis.
However, investigation of the antithyroid drug–pancreatitis association had been limited to aggregating those case reports, so Dr. Hegedüs and colleagues decided to use Danish medical record and registry data to investigate the association in a nationwide, controlled study that looked at both duration of therapy and total antithyroid drug use.
During the period from 1995-2018, a total of 118,649 patients who used antithyroid drugs were found in the 5.5 million individuals in the Statistics Denmark registry. Dr. Hegedüs and his colleagues also pulled in patient registry and national prescription registry data, as well as civil vital statistics data.
Of those who used antithyroid drugs, 103,825 patients used methimazole, and 14,824 used propylthiouracil. The researchers found 43,580 instances of hospitalization for first-time acute pancreatitis in the pooled antithyroid drug data. Of those, however, just 226 (0.5%) occurred in patients using methimazole, and 19 (0.04%) in those using propylthiouracil at the time of pancreatitis onset.
To ascertain the risk of acute pancreatitis in patients using antithyroid drugs for various durations, Dr. Hegedüs and his colleagues used a case-crossover study design. In the case-crossover technique, patients served as their own controls, because each patient was both exposed and not exposed to antithyroid drugs at some point during the study period. Antithyroid drugs are well suited to this study design, explained Dr. Hegedüs, because they are given for a limited time. A case-crossover design can be used with a small sample size and effectively controls for potentially confounding variables.
The odds ratio for acute pancreatitis in methimazole users after 3 months of exposure was 1.51, with a 95% confidence interval of 1.12-2.02. After 3 months of propylthiouracil exposure, the odds ratio for acute pancreatitis was 1.16 (95% CI 0.46-2.3). At 6 months, the odds ratio of 2.02 for methimazole was similarly statistically significant (95% CI, 1.50-2.78), whereas the odds ratio of 1.40 for propylthiouracil use was not significant (95% CI, 0.58-3.34).
The researchers also wanted to find out whether the cumulative drug dose affected the risk of acute pancreatitis, so they drew from the antithyroid drug population to conduct a case-control study. Here, the investigators matched data from four control patients to each case of acute pancreatitis. The researchers also controlled for sex, age, comorbidities, and prior use of drugs associated with pancreatitis.
Overall, 20% of the 692 methimazole users and their controls were men, as were 16% of the 108 propylthiouracil users, in the case-control study.
Just more than half of patients overall had a total dose exposure of 200 to 1,200 defined daily dose (DDD) – a measure developed by the World Health Organization to denote the assumed average adult dose per day of a medication – with about a quarter of patients receiving a total antithyroid drug dose more than 1,200 DDD and about 20% receiving a dose exposure of less than 200 DDD. The risk of acute pancreatitis did not increase with increased total exposure to antithyroid drugs.
“There is no evidence of a cumulative dose effect of either methimazole or propylthiouracil on the risk of acute pancreatitis,” said Dr. Hegedüs. However, “the warning of the European Medicines Agency seems justified,” he added. “The frequency of acute pancreatitis in acute methimazole users is of a similar magnitude [to that] reported for agranulocytosis,” a known, dire complication of antithyroid drug use. Patients should be advised of the potential complication and informed of signs and symptoms of acute pancreatitis, he said.
Dr. Hegedüs noted that the study had the advantage of using validated epidemiologic methods to look at drug exposure and outcomes at a nationwide scale. However, the registries from which the data were drawn also have limitations. The investigators could not determine the severity of hyperthyroidism, he said, and the relatively rare occurrence of acute pancreatitis meant that there was not sufficient statistical power to look at the subgroup of individuals who had Graves disease and to compare them with those with nodular toxic goiter.
He advised conducting a confirmatory study in an independent cohort, as well as further investigating the yet unknown mechanism of action for the link between the antithyroid drug and acute pancreatitis.
Dr. Hegedüs reported that he had no relevant conflicts of interest and reported no outside sources of funding.
SOURCE: Hegedüs, L. et al. ATA 2019, Short Call Oral Abstract 6 .
REPORTING FROM ATA 2019
Scalp Psoriasis Considerations
1. Blakely K, Gooderham M. Management of scalp psoriasis: current perspectives. Psoriasis (Auckl). 2016;6:33-40.
2. Krueger G, Koo J, Lebwohl M, et al. The impact of psoriasis on quality of life: results of a 1998 National Psoriasis Foundation patient-membership survey. Arch Dermatol. 2001;137:280-284.
3. Merola JF, Li T, Li WQ, et al. Prevalence of psoriasis phenotypes among men and women in the USA. Clin Exp Dermatol. 2016;41:486-489.
4. Frez ML, Asawanonda P, Gunasekara C, et al. Recommendations for a patient-centered approach to the assessment and treatment of scalp psoriasis: a consensus statement from the Asia Scalp Psoriasis Study Group. J Dermatol Treat. 2014;25:38-45.
5. van de Kerkhof PC, Franssen ME. Psoriasis of the scalp. diagnosis and management. Am J Clin Dermatol. 2001;2:159-165.
6. Chan CS, Van Voorhees AS, Lebwohl MG, et al. Treatment of severe scalp psoriasis: from the Medical Board of the National Psoriasis Foundation. J Am Acad Dermatol. 2009;60:962-971.
7. Aldredge LM, Higham RC. Manifestations and management of difficult-to-treat psoriasis. J Dermatol Nurses Assoc. 2018;10:189-197.
8. Dopytalska K, Sobolewski P, Blaszczak A, et al. Psoriasis in special localizations. Reumatologia. 2018;56:392-398.
9. Papp K, Berth-Jones J, Kragballe K, et al. Scalp psoriasis: a review of current topical treatment options. J Eur Acad Dermatol Venereol. 2007;21:1151-1160.
10. Kircik LH, Kumar S. Scalp psoriasis. J Drugs Dermatol. 2010;9(8 suppl):S101-S105.
11. Wozel G. Psoriasis treatment in difficult locations: scalp, nails, and intertriginous areas. Clin Dermatol. 2008;26:448-459.
12. Sampogna F, Linder D, Piaserico S, et al. Quality of life assessment of patients with scalp dermatitis using the Italian version of the Scalpdex. Acta Dermato-Venereologica. 2014;94:411-414.
13. Crowley J. Scalp psoriasis: an overview of the disease and available therapies. J Drugs Dermatol. 2010;9:912-918.
14. Shah VV, Lee EB, Reddy SP, et al. Scalp psoriasis with increased hair density. Cutis. 2018;102:63-64.
15. George SM, Taylor MR, Farrant PB. Psoriatic alopecia. Clin Exp Dermatol. 2015;40:717-721.
16. Shuster S. Psoriatic alopecia. Br J Dermatol. 1972;87:73-77.
17. Wyatt E, Bottoms E, Comaish S. Abnormal hair shafts in psoriasis on scanning electron microscopy. Br J Dermatol. 1972;87:368-373.
18. Schoorl WJ, van Baar HJ, van de Kerkhof PC. The hair root pattern in psoriasis of the scalp. Acta Derm Venereol. 1992;72:141-142.

Benefits of focused ultrasound thalamotomy for essential tremor persist for 3 years
, according to data published Nov. 20 in Neurology. Improvement from baseline remains significant at that time point, although the magnitude of effect may decrease. In addition, the treatment is not associated with progressive or delayed complications.
“For people who have disabling essential tremor that is not responding to medication, this treatment should be considered as a safe and effective option,” Casey H. Halpern, MD, assistant professor of neurosurgery at Stanford (Calif.) University, said in a press release.
Long-term follow-up of a prospective trial
Focused ultrasound thalamotomy is an emerging treatment for essential tremor. The procedure, which does not require an incision, is conducted with the guidance of magnetic resonance thermometry and patient feedback. A randomized controlled trial conducted by Elias and colleagues indicated that focused ultrasound ventral intermediate nucleus thalamotomy significantly suppressed tremor, reduced disability, and improved quality of life at 3 months, compared with sham treatment. This improvement was sustained at 12 months, and a follow-up study showed that improvements in tremor and functional disability were sustained at 24 months.
Dr. Halpern and colleagues sought to evaluate the continued safety and efficacy of focused ultrasound thalamotomy at 3 years’ follow-up in patients who participated in the original trial. Movement disorder specialists evaluated participants’ tremor severity and functional impairment using the Clinical Rating Scale for Tremor (CRST) at baseline and at 12, 24, and 36 months after treatment. Patients responded to the Quality of Life in Essential Tremor (QUEST) questionnaire, which assesses quality of life at baseline and at each follow-up visit. Neurologists evaluated and recorded all adverse events that occurred during the trial.
Postural tremor was eliminated
The original population included 75 patients who underwent focused ultrasound thalamotomy during the randomized, blinded phase or in an unblinded fashion during the crossover phase. The mean age of all treated patients was 71 years, and disease duration at treatment was 16.8 years. Fifty-two participants were observed at 36 months, and the 3-year attrition rate thus was 31%.
Dr. Halpern and colleagues found that the hand combined tremor–motor score, which was the trial’s primary endpoint, was significantly improved from baseline at 3 years. The median improvement from baseline was 56%. The median disability score decreased by 63% from baseline. Postural tremor was eliminated at 36 months, and QUEST score improved by 50%.
For patients who were missing at 3-year follow-up, data obtained at 3 months was used for comparison. These patients had less improvement in hand tremor–motor score, less reduction in disability, and less reduction in postural tremor, compared with patients who presented for 3-year follow-up. When the investigators reanalyzed their results to account for missing data, they found that the improvement from baseline remained significant.
Dr. Halpern and colleagues compared scores at 36 months and at 6 months to evaluate the durability of the treatment effect. Data were available for 49 patients at both time points, and their combined tremor–motor score had increased by a median of one point at 36 months. Disability score increased by a median of 2 points at 36 months. Posture and QUEST scores did not change significantly. About 58% of patients had at least 50% improvement in hand combined tremor–motor score at 36 months, compared with 64% at 24 months and 61% at 12 months.
The investigators described all adverse events as mild or moderate. No new procedure-related adverse events occurred between 24 and 36 months of follow-up, and none worsened during this period. Two adverse events, however, resolved between 24 and 36 months: one case of dysarthria and one of imbalance.
Reduction in improvement may have many causes
“A reduction in improvement is not unexpected, as essential tremor is a progressive disease,” wrote Dr. Halpern and colleagues. “In addition, diminishing performance of motor–functional tasks over time, particularly in this elderly population, may be multifactorial.” Decrease in tremor control has been reported after all surgical treatments for essential tremor (e.g., deep brain stimulation [DBS] and radiofrequency thalamotomy). Retreatment with invasive therapies or ionizing irradiation would be more problematic than retreatment with focused ultrasound thalamotomy, they added.
The researchers acknowledged that the main limitations of their study were the 31% dropout rate at 3 years and the fact that the cohort at 3-year follow-up differed from those at 2-year follow-up and in the original trial. The results nevertheless “demonstrate persistent, significant tremor reduction, as well as functional and quality of life improvement, with a positive safety profile,” they wrote.
Study funding was provided by the Focused Ultrasound Foundation, the Binational Industrial Research and Development Foundation of Israel, and InSightec, the maker of the focused ultrasound equipment that the researchers used. Dr. Halpern and other investigators received research funding from InSightec. One of the researchers is on the company’s medical advisory board, and another served as a consultant to the company.
Effect on axial tremor is unclear
The 50% improvement in hand tremor, disability, and quality of life that Halpern et al. report is similar to the improvement observed following DBS therapy, said Aparna Wagle Shukla, MD, director of the neurophysiology laboratory at the University of Florida in Gainesville, in an interview. Although the results are promising, neurologists should bear several points in mind, she added.
“DBS-induced side effects often are amenable to programming adjustments. However, similar to radiofrequency thalamotomy, focused ultrasound thalamotomy causes lesion effects. While the study discusses the nature of thalamotomy-induced adverse effects, the clinical practitioners also will benefit from learning about the severity of side effects and how they were individually addressed,” said Dr. Wagle Shukla. “The study acknowledges that there was a 30% dropout rate at 3 years’ follow-up. As the original plan included a 5-year follow-up, it would be beneficial to know why a large fraction of participants discontinued participation earlier than expected.”
Furthermore, the study by Halpern et al. leaves several questions unanswered. It does not indicate, for example, whether focused ultrasound thalamotomy can affect the control of axial tremor, including head and voice tremor, said Dr. Wagle Shukla. “Also, the potential of focused ultrasound thalamotomy to treat complex tremors with possible targeting of multiple brain regions such as ventralis oralis anterior and posterior and zona incerta stimulation is currently not known.
“There is no doubt that focused ultrasound thalamotomy is useful for the control of hand tremors in patients diagnosed with essential tremor, with long-term improvements in quality of life,” Dr. Wagle Shukla continued. “However, it is presently limited in its scope as a unilateral, single-target brain procedure.”
SOURCE: Halpern CH et al. Neurology. 2019 Nov 20 (Epub ahead of print).
FROM NEUROLOGY
AASLD debrief: Five drugs show promise in NAFLD (and two do not)
BOSTON – For treatment of nonalcoholic fatty liver disease, cotadutide, licogliflozin, tropifexor, saroglitazar, and PF-05221304 are just a few of the drugs with promising data, Kathleen E. Corey, MD, MPH, said at the annual meeting of the American Association for the Study of Liver Diseases.
By contrast, selonsertib and emricasan did not achieve their endpoints in studies described here at the meeting, “but we have a lot to learn from them,” said Dr. Corey, director of the Mass General Fatty Liver Clinic and assistant professor at Harvard Medical School, Boston.
“This is an exciting time,” Dr. Corey said in a special debriefing oral session held on the final day of the conference. “There are many novel mechanisms of action out there, as well as some known mechanisms of action, with a considerable amount of promise.”
Cotadutide (MEDI0382)
Narha and coauthors (Abstract 35) described the effects of cotadutide, a GLP-1/glucagon receptor dual agonist on biomarkers of nonalcoholic steatohepatitis (NASH) at 26 weeks in overweight or obese patients with type 2 diabetes mellitus. In the randomized, phase 2b study, cotadutide produced superior reductions versus liraglutide, the GLP-1 receptor agonist, in alanine aminotransferase (ALT) and aspartate aminotransferase (AST), and body weight, which investigators said supported prospective trials of the drug for a potential indication in NASH.
“The adverse events were fairly typical for what we see with the GLP-1s – GI side effects that usually over 8 weeks improve,” Dr. Corey told attendees at the debrief session.
Licogliflozin (LIK066)
Interim analysis of a 12-week, randomized, placebo-controlled, phase 2a study showed that this SGLT1/2 inhibitor produced “robust” decreases in ALT and improvements in markers of hepatic and metabolic health in patients with NASH, according to Zhang and coauthors (Abstract L07).
Some 67% of those who received licogliflozin had at least a 30% decrease in their liver fat, while decreases in weight and hemoglobin A1c were also reported, according to Dr. Corey. “It was associated with diarrhea in about 97%, but this was considered mild, and certainly, we’re seeing good metabolic effects overall,” she said.
Tropifexor
Treatment for 12 weeks with this potent FXR agonist resulted in robust, dose-dependent reductions in hepatic fat and serum ALT in patients with fibrotic NASH, according to investigators in a phase 2 randomized, placebo-controlled trial known as FLIGHT-FXR (Abstract L04).
A total of 65% of patients achieved a 30% or greater reduction in liver fat, and decreases in weight and insulin resistance were reported. “Similar to other FXRs, they did have this concerning although potentially manageable increase in low-density lipoprotein (LDL)-cholesterol, and the adverse event of pruritis,” said Dr. Corey.
Saroglitazar
Gawrieh and coauthors presented results from EVIDENCES IV, a phase 2, double-blind, randomized, placebo-controlled study of saroglitazar, a novel dual peroxisome proliferator activated receptor (PPAR) alpha/gamma agonist, in patients with NAFLD or NASH (Abstract LO10).
The investigators found that 41% of patients achieved a 30% or greater relative reduction in liver fat, as well as reductions in hemoglobin A1c and lipids, but the treatment was “weight neutral,” Dr. Corey said, adding that no serious adverse events were reported.
PF-05221304
This liver-targeted acetyl-CoA carboxylase inhibitor (ACCI) demonstrated robust reduction in liver fat and ALT in a 16-week phase 2a, dose-ranging study in adults with NAFLD, according to Amin and coinvestigators (Abstract 31).
There was a “dramatic” decrease in liver fat in this study, said Dr. Corey, with 90% of treated patients experiencing a 30% or greater decrease. Side effects included a “significant” increase in triglycerides, she added, as well as transient increases in ALT and AST.
Selonsertib and emricasan
One agent not meeting study endpoints was selonsertib, an apoptosis signal-regulating kinase 1 (ASK1) inhibitor. While safe and well tolerated, the drug was nevertheless not effective as monotherapy in phase 3 double-blind, placebo-controlled trials including patients with advanced fibrosis due to NASH, investigators said (Abstract 64). Currently, the agent is being evaluated in combination with firsocostat – an ACCI – in a phase 2 study called ATLAS, according to the authors.
Emricasan, an oral pan-caspase inhibitor that suppresses apoptosis, did not improve fibrosis or resolve NASH in a multicenter, double-blind, placebo-controlled randomized trial, and may have even worsened histology, according to Dr. Corey. Investigators said further evaluation of the mechanisms underlying findings could provide insights into the role of necro-apoptosis in NASH pathophysiology (Abstract 61).
Dr. Corey provided disclosures related to BMS, Novo Nordisk, Boehringer Ingelheim, and Gilead.
REPORTING FROM THE LIVER MEETING 2019
Rituximab tops azathioprine for relapsing ANCA-associated vasculitis remission maintenance
ATLANTA – Rituximab (Rituxan) is superior to azathioprine (Imuran) for preventing ANCA-associated vasculitis relapses in patients with histories of previous relapses, according to a randomized trial of 170 patients presented at the annual meeting of the American College of Rheumatology.
Rituximab has been previously shown to be the superior remission maintenance option in the French MAINRITSAN trial (N Engl J Med. 2014 Nov 6;371[19]:1771-80), but mostly in newly diagnosed patients after cyclophosphamide induction. The results expand the finding to those with relapsing disease who previously had remission induced with rituximab, said lead investigator Rona Smith, MD, a clinical lecturer at Cambridge (England) University.
Subjects in the RITAZAREM trial (rituximab versus azathioprine as therapy for maintenance of remission for antineutrophil cytoplasmic antibody [ANCA]–associated vasculitis) were enrolled during a relapse of either granulomatosis with polyangiitis or microscopic polyangiitis and underwent remission induction with rituximab 375 mg/m2 per week for 4 weeks coupled with prednisone, either 1 or 0.5 mg/kg per day at provider discretion.
After successful induction – defined as a Birmingham Vasculitis Activity Score for Wegener’s Granulomatosis of 1 point or less on no more than 10 mg/day prednisone – 85 patients were randomized to rituximab 1 g every 4 months for 20 months and 85 to azathioprine 2 mg/kg per day for 20 months, followed by a taper. Prednisone was tapered per protocol to discontinuation at 20 months.
Eleven rituximab patients (13%) relapsed during the 20-month maintenance phase; two relapses were major. There were 32 relapses (38%) in the azathioprine group, 12 of them (38%) major (hazard ratio for rituximab versus azathioprine, 0.3; 95% CI, 0.15-0.60; P less than .001). ANCA type, glucocorticoid induction regimen, and severity of the enrollment relapse did not affect the outcomes.
Also, “there was an increase in the proportion of patients who became ANCA negative” in the rituximab arm, while “there was really no change” with azathioprine. In short, “rituximab is superior to azathioprine for prevention of disease relapse,” Dr. Smith said.
Her audience had a few questions about the rituximab regimen. The French MAINRITSAN trial dosed rituximab every 6 months instead of every 4, for a cumulative dose of 2.5 g, not 5 g, which an audience member said is the standard approach.
Dr. Smith explained that she and her colleagues have seen relapses with rituximab maintenance at 5 and 6 months, so they wanted to move to a shorter schedule. As for the higher dose, they wanted to “achieve complete B-cell depletion for the duration of the treatment period” to see if it translates into longer lasting remissions. “We will hopefully be able to address that question” with further analysis, she said.
There were no new safety signals; 19 rituximab patients (22%) and 31 azathioprine subjects (36%) had at least one serious adverse event; an infection requiring hospitalization occurred in 7 rituximab patients (8%) and 11 azathioprine patients (13%). Twenty-five (29%) rituximab and 21 (25%) azathioprine subjects developed hypogammaglobulinemia (IgG less than 5 g/L), and about half of each group developed an infection that required antibiotics, but not hospitalization.
There was one death in the azathioprine arm from malignancy, and three in the rituximab group, one from infection and two as of yet unclassified.
The groups were well balanced. Subjects were a median of 59 years old, with a median disease duration of 5.3 years. Refractory patients – those who had not achieved remission during a previous relapse – were excluded, as were patients who had received a B cell–depleting treatment in the previous 6 months and those with eosinophilic granulomatosis with polyangiitis or a malignancy in the past 5 years. Among patients in the study, 72% had tested positive for anti–proteinase 3 ANCA, and 28% for myeloperoxidase ANCA.
The work was funded by Versus Arthritis (formerly Arthritis Research UK), the National Institutes of Health, and the makers of rituximab, Roche/Genentech. Dr. Smith reported ties to Roche, Sanofi, and MedImmune.
SOURCE: Smith R et al. Arthritis Rheumatol. 2019;71(suppl 10), Abstract 806.
REPORTING FROM ACR 2019