User login
When is a conservative approach best for proximal biceps tendon rupture?
CASE Mr. A, a 59-year-old high school science teacher, came into our medical clinic with severe pain (7/10) in his left shoulder and arm and weakness on flexion of his left elbow. A week earlier, he felt a “pop” and experienced sharp pain and immediate “swelling” of the left biceps after throwing a heavy trash bag away while at work. He went to the school nurse for evaluation and was referred to a physician.
Mr. A was healthy, had no chronic diseases, and reported no previous injuries or trauma. He denied smoking, drinking alcohol, using illegal drugs, or taking steroids or other medications. He had worked as a high school teacher for the last 10 years at the time of his clinic visit.
Imaging, physical exam tell the tale. The patient’s physical exam was normal, with one outstanding exception: a “Popeye” deformity in his left biceps (FIGURE), accompanied by severe pain and tenderness to palpation over the proximal aspect of the left biceps. Both active and passive range of motion of the elbow were full and symmetrical, but the patient had prominent pain and weakness on elbow flexion and supination. However, he had good rotator cuff strength without pain and no impingement signs or acromioclavicular joint pain. He had no atrophy or scapular dyskinesia. Similarly, a neurovascular exam of the distal aspect of the extremity was normal.
FIGURE
“Popeye” deformity in left biceps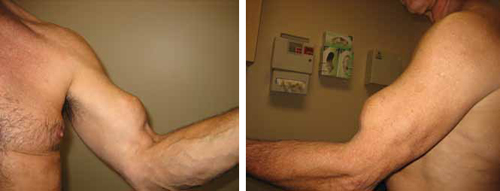
With long head tendon rupture, the muscle belly retracts, causing “Popeye” biceps. Since only the long head tendon—and not the short head tendon—is involved, the biceps still functions.
The magnetic resonance imaging report revealed a complete tendon rupture of the long head of the biceps brachii muscle. The long head muscle was intact and there was a posttraumatic hemorrhage in the region of the tear in the upper arm. The remaining muscle, ligaments, and tendon were intact. There was no evidence of a fracture.
A 3-pronged approach. Once the diagnosis of acute complete rupture of the left long head tendon biceps brachii was reached, we laid out a 3-pronged treatment approach:
- nonsteroidal anti-inflammatory agents and muscle relaxants such as cyclobenzaprine, tizanidine, or metaxalone
- physical therapy (2-3 times per week) and daily home exercise
- modified activities—specifically, no overhead work or lifting of anything >10 lb with the affected arm.
Before we proceeded with this plan, we referred the patient to a specialist for evaluation and a second opinion.
Biceps tendon rupture usually follows a traumatic event
Long head biceps tendon ruptures often involve people between 40 and 60 years of age, with men affected significantly more often than women.1,2 Tennis players and ballplayers are also affected, as a result of frequent swinging motions.3 As you might expect, a person’s dominant arm is more often affected.3
Excessive weightlifting or rapid stress upon the tendon can cause an acute tendon rupture. As a rule, biceps tendon ruptures are caused by a single traumatic event that typically involves lifting a heavy object while the elbow is bent at a 90-degree angle. Weight lifters who use anabolic steroids are at an increased risk of sustaining a rupture at the tendon, and clinicians may also see such ruptures among patients who have fallen forcefully onto an outstretched arm.2,3
Keep in mind, however, that rupture can also occur in the absence of a traumatic event. This usually happens in elderly individuals with advanced tendon degeneration.4 Smoking, rheumatoid arthritis, steroid medications,2,5 fluoroquinolones,6 and statin therapy7 can affect this tendon and increase the risk of spontaneous rupture, as well.
“Popeye” biceps—a telltale sign. Understanding the function of the biceps brachii helps explain at least one of the telltale signs of long head tendon rupture. The biceps muscle enables supination of the forearm and flexion of the elbow. With long head tendon rupture, however, the muscle belly retracts, causing prominent fullness and bulging of the upper arm—what’s called “Popeye” biceps. Because the rupture involves only the long head tendon of the biceps and not the short head tendon, the biceps still functions.8
Surgical repair vs conservative management
Whether to pursue surgery or conservative management when caring for a patient with a biceps rupture remains a subject of debate in the medical literature. There are no studies that demonstrate the superiority of one approach over the other.2,5,9,10
Surgery. The serious complications associated with surgery have led some experts to question whether the risks of surgery outweigh the benefits.11 Equally important is the patient’s individual circumstances. Clinicians need to consider each patient’s occupation, lifestyle, and age when recommending a course of action.
Published clinical guidelines usually recommend surgical repair for young athletes who require maximum supination strength in daily activities. Although the size of the Popeye deformity does diminish after conservative treatment, surgery is often recommended for patients who are unwilling to accept the cosmetic defect seen after the tendon ruptures. And finally, operative treatment is indicated for middle-aged carpenters and manual laborers whose occupations require full supination and arm strength.2,12-14
The surgical procedure, called tenodesis, involves reattaching the torn section of the tendon to the bone.5,15 A recent study involving 5 professional wrestlers injured while performing noted that tenodesis restored full biceps function, gave excellent cosmetic results, and allowed all of the young men to return to wrestling.15
Conservative treatment. A conservative approach is appropriate for older patients when their profession and lifestyle do not demand a high degree of supination and upper arm strength.5,8,13,14 In addition, the more conservative approach is very well tolerated, which reduces the risk of serious complications and the cost of surgery.11 Avoiding surgery also permits patients to return to work much sooner.
Patients may, however, lose up to 20% of their supination strength with conservative treatment.14 But this approach does not cause weakness in grip, pronation, or elbow extension. Nor does it affect patients’ activities of daily living,14 which may explain why more patients are treated conservatively than with surgery.5,11 Additionally, some experts recommend nonoperative treatment of distal biceps tendon ruptures for people who are wary of surgery or present late with the injury.11
CASE Two orthopedic surgeons examined our patient and both supported our recommendation to pursue conservative treatment for Mr. A.
Over the next 4 to 6 weeks, he received physical therapy 2 to 3 times per week. With the help of the physiotherapist, Mr. A performed joint mobilization and flexibility exercises to improve the range of motion in his shoulder. The therapist also helped him with strengthening and stretching exercises to restore the strength of his biceps and elbow muscle.
At home, our patient’s regimen included elbow bend and straighten movements, elbow supination and pronation movements, and static biceps contractions.
Over time, his pain diminished and the strength in his left arm improved. Mr. A was able to return to work with modified duty, 2 to 3 weeks after his injury. By Week 8, he had full range of motion in his left arm and normal strength. He was able to do his job as a high school science teacher without any restrictions, but continued to have the Popeye deformity.
Our experience treating Mr. A serves as a reminder to physicians that complete long head biceps tendon rupture can be successfully treated conservatively. Patients working in sedentary occupations usually do not need a high degree of supination or physical strength in their upper extremities, making this a worthwhile treatment option for them.
CORRESPONDENCE
Sofya Pugach, MD, PhD, MPH, Complete Med Care, 8989 Forest Lane, Dallas, TX 75243; [email protected]
1. Carter AN, Erikson SM. Proximal biceps tendon rupture: primarily an injury of middle age. Phys Sportsmed. 1999;27:95-101.
2. Miller R, Dlabach J. Sports medicine. In: Canale ST Beaty JH, eds. Campbell’s Operative Orthopaedics. 11th ed. Philadelphia, Pa: Mosby Elsevier; 2007: 2601–2775.
3. Brunelli MP, Gill TJ. Fractures and tendon injuries of the athletic shoulder. Orthop Clinic N Am. 2002;33:497-508.
4. Kannus P, Jozsa L. Histopathological changes preceding spontaneous rupture of the tendon. A controlled study of 891 patients. J Bone Joint Surg Am. 1991;73:1507-1525.
5. Branch GL, Wieting JM. Biceps rupture. Web MD web site. Updated 2012. Available at: http://emedicine.medscape.com/article/327119-overview. Accessed January 28 2013.
6. Gold L, Igra H. Levofloxacin-induced tendon rupture: a case report and review of the literature. J Am Board Fam Pract. 2003;16:458-460.
7. Pullatt RC, Gadarla MR, Karas RH, et al. Tendon rupture associated with simvastatin/ezetimibe therapy. Am J Cardiol. 2007;100:152-153.
8. Dvorkin ML. Office Orthopedics. Norwalk Conn: Appleton & Lange, 1993;1–35.
9. Gaskin CM, Anderson MW, Choudhri A, et al. Focal partial tears of the long head of the biceps brachii tendon at the entrance to the bicipital groove: MR imaging findings, surgical correction and clinical significance. Skeletal Radiol. 2009;38:959-965.
10. Busconi BB, DeAngelis N, Guerrero PE. The proximal biceps tendon: trick and pearls. Sports Med Arthrosc Rev. 2008;16:187-194.
11. Freeman CR, McCormick KR, Mahoney D, et al. Nonoperative treatment of distal biceps tendon ruptures compared with a historical control group. J Bone Joint Surg Am. 2009;91:2329-2334.
12. Roukoz S, Naccache N, Sleilaty G. The role of the musculocutaneous and radial nerves in elbow flexion and forearm supination: a biomechanical study. J Hand Surg Eur. 2008;33:201-204.
13. Curtis AS, Snyder SJ. Evaluation and treatment of biceps tendon pathology. Orthop Clin North Am. 1993;24:33-43.
14. Mariani EM, Cofield RH, Askew LJ, et al. Rupture of the tendon of the long head of the biceps brachii: Surgical versus nonsurgical treatment. Clin Orthop Relat Res. 1988;228:233-239.
15. Tangari M, Carbone S, Callo M, et al. Long head of the biceps tendon rupture in professional wrestlers: treatment with a mini-open tenodesis. J Shoulder Elbow Surg. 2011;20:409-413.
CASE Mr. A, a 59-year-old high school science teacher, came into our medical clinic with severe pain (7/10) in his left shoulder and arm and weakness on flexion of his left elbow. A week earlier, he felt a “pop” and experienced sharp pain and immediate “swelling” of the left biceps after throwing a heavy trash bag away while at work. He went to the school nurse for evaluation and was referred to a physician.
Mr. A was healthy, had no chronic diseases, and reported no previous injuries or trauma. He denied smoking, drinking alcohol, using illegal drugs, or taking steroids or other medications. He had worked as a high school teacher for the last 10 years at the time of his clinic visit.
Imaging, physical exam tell the tale. The patient’s physical exam was normal, with one outstanding exception: a “Popeye” deformity in his left biceps (FIGURE), accompanied by severe pain and tenderness to palpation over the proximal aspect of the left biceps. Both active and passive range of motion of the elbow were full and symmetrical, but the patient had prominent pain and weakness on elbow flexion and supination. However, he had good rotator cuff strength without pain and no impingement signs or acromioclavicular joint pain. He had no atrophy or scapular dyskinesia. Similarly, a neurovascular exam of the distal aspect of the extremity was normal.
FIGURE
“Popeye” deformity in left biceps
With long head tendon rupture, the muscle belly retracts, causing “Popeye” biceps. Since only the long head tendon—and not the short head tendon—is involved, the biceps still functions.
The magnetic resonance imaging report revealed a complete tendon rupture of the long head of the biceps brachii muscle. The long head muscle was intact and there was a posttraumatic hemorrhage in the region of the tear in the upper arm. The remaining muscle, ligaments, and tendon were intact. There was no evidence of a fracture.
A 3-pronged approach. Once the diagnosis of acute complete rupture of the left long head tendon biceps brachii was reached, we laid out a 3-pronged treatment approach:
- nonsteroidal anti-inflammatory agents and muscle relaxants such as cyclobenzaprine, tizanidine, or metaxalone
- physical therapy (2-3 times per week) and daily home exercise
- modified activities—specifically, no overhead work or lifting of anything >10 lb with the affected arm.
Before we proceeded with this plan, we referred the patient to a specialist for evaluation and a second opinion.
Biceps tendon rupture usually follows a traumatic event
Long head biceps tendon ruptures often involve people between 40 and 60 years of age, with men affected significantly more often than women.1,2 Tennis players and ballplayers are also affected, as a result of frequent swinging motions.3 As you might expect, a person’s dominant arm is more often affected.3
Excessive weightlifting or rapid stress upon the tendon can cause an acute tendon rupture. As a rule, biceps tendon ruptures are caused by a single traumatic event that typically involves lifting a heavy object while the elbow is bent at a 90-degree angle. Weight lifters who use anabolic steroids are at an increased risk of sustaining a rupture at the tendon, and clinicians may also see such ruptures among patients who have fallen forcefully onto an outstretched arm.2,3
Keep in mind, however, that rupture can also occur in the absence of a traumatic event. This usually happens in elderly individuals with advanced tendon degeneration.4 Smoking, rheumatoid arthritis, steroid medications,2,5 fluoroquinolones,6 and statin therapy7 can affect this tendon and increase the risk of spontaneous rupture, as well.
“Popeye” biceps—a telltale sign. Understanding the function of the biceps brachii helps explain at least one of the telltale signs of long head tendon rupture. The biceps muscle enables supination of the forearm and flexion of the elbow. With long head tendon rupture, however, the muscle belly retracts, causing prominent fullness and bulging of the upper arm—what’s called “Popeye” biceps. Because the rupture involves only the long head tendon of the biceps and not the short head tendon, the biceps still functions.8
Surgical repair vs conservative management
Whether to pursue surgery or conservative management when caring for a patient with a biceps rupture remains a subject of debate in the medical literature. There are no studies that demonstrate the superiority of one approach over the other.2,5,9,10
Surgery. The serious complications associated with surgery have led some experts to question whether the risks of surgery outweigh the benefits.11 Equally important is the patient’s individual circumstances. Clinicians need to consider each patient’s occupation, lifestyle, and age when recommending a course of action.
Published clinical guidelines usually recommend surgical repair for young athletes who require maximum supination strength in daily activities. Although the size of the Popeye deformity does diminish after conservative treatment, surgery is often recommended for patients who are unwilling to accept the cosmetic defect seen after the tendon ruptures. And finally, operative treatment is indicated for middle-aged carpenters and manual laborers whose occupations require full supination and arm strength.2,12-14
The surgical procedure, called tenodesis, involves reattaching the torn section of the tendon to the bone.5,15 A recent study involving 5 professional wrestlers injured while performing noted that tenodesis restored full biceps function, gave excellent cosmetic results, and allowed all of the young men to return to wrestling.15
Conservative treatment. A conservative approach is appropriate for older patients when their profession and lifestyle do not demand a high degree of supination and upper arm strength.5,8,13,14 In addition, the more conservative approach is very well tolerated, which reduces the risk of serious complications and the cost of surgery.11 Avoiding surgery also permits patients to return to work much sooner.
Patients may, however, lose up to 20% of their supination strength with conservative treatment.14 But this approach does not cause weakness in grip, pronation, or elbow extension. Nor does it affect patients’ activities of daily living,14 which may explain why more patients are treated conservatively than with surgery.5,11 Additionally, some experts recommend nonoperative treatment of distal biceps tendon ruptures for people who are wary of surgery or present late with the injury.11
CASE Two orthopedic surgeons examined our patient and both supported our recommendation to pursue conservative treatment for Mr. A.
Over the next 4 to 6 weeks, he received physical therapy 2 to 3 times per week. With the help of the physiotherapist, Mr. A performed joint mobilization and flexibility exercises to improve the range of motion in his shoulder. The therapist also helped him with strengthening and stretching exercises to restore the strength of his biceps and elbow muscle.
At home, our patient’s regimen included elbow bend and straighten movements, elbow supination and pronation movements, and static biceps contractions.
Over time, his pain diminished and the strength in his left arm improved. Mr. A was able to return to work with modified duty, 2 to 3 weeks after his injury. By Week 8, he had full range of motion in his left arm and normal strength. He was able to do his job as a high school science teacher without any restrictions, but continued to have the Popeye deformity.
Our experience treating Mr. A serves as a reminder to physicians that complete long head biceps tendon rupture can be successfully treated conservatively. Patients working in sedentary occupations usually do not need a high degree of supination or physical strength in their upper extremities, making this a worthwhile treatment option for them.
CORRESPONDENCE
Sofya Pugach, MD, PhD, MPH, Complete Med Care, 8989 Forest Lane, Dallas, TX 75243; [email protected]
1. Carter AN, Erikson SM. Proximal biceps tendon rupture: primarily an injury of middle age. Phys Sportsmed. 1999;27:95-101.
2. Miller R, Dlabach J. Sports medicine. In: Canale ST Beaty JH, eds. Campbell’s Operative Orthopaedics. 11th ed. Philadelphia, Pa: Mosby Elsevier; 2007: 2601–2775.
3. Brunelli MP, Gill TJ. Fractures and tendon injuries of the athletic shoulder. Orthop Clinic N Am. 2002;33:497-508.
4. Kannus P, Jozsa L. Histopathological changes preceding spontaneous rupture of the tendon. A controlled study of 891 patients. J Bone Joint Surg Am. 1991;73:1507-1525.
5. Branch GL, Wieting JM. Biceps rupture. Web MD web site. Updated 2012. Available at: http://emedicine.medscape.com/article/327119-overview. Accessed January 28 2013.
6. Gold L, Igra H. Levofloxacin-induced tendon rupture: a case report and review of the literature. J Am Board Fam Pract. 2003;16:458-460.
7. Pullatt RC, Gadarla MR, Karas RH, et al. Tendon rupture associated with simvastatin/ezetimibe therapy. Am J Cardiol. 2007;100:152-153.
8. Dvorkin ML. Office Orthopedics. Norwalk Conn: Appleton & Lange, 1993;1–35.
9. Gaskin CM, Anderson MW, Choudhri A, et al. Focal partial tears of the long head of the biceps brachii tendon at the entrance to the bicipital groove: MR imaging findings, surgical correction and clinical significance. Skeletal Radiol. 2009;38:959-965.
10. Busconi BB, DeAngelis N, Guerrero PE. The proximal biceps tendon: trick and pearls. Sports Med Arthrosc Rev. 2008;16:187-194.
11. Freeman CR, McCormick KR, Mahoney D, et al. Nonoperative treatment of distal biceps tendon ruptures compared with a historical control group. J Bone Joint Surg Am. 2009;91:2329-2334.
12. Roukoz S, Naccache N, Sleilaty G. The role of the musculocutaneous and radial nerves in elbow flexion and forearm supination: a biomechanical study. J Hand Surg Eur. 2008;33:201-204.
13. Curtis AS, Snyder SJ. Evaluation and treatment of biceps tendon pathology. Orthop Clin North Am. 1993;24:33-43.
14. Mariani EM, Cofield RH, Askew LJ, et al. Rupture of the tendon of the long head of the biceps brachii: Surgical versus nonsurgical treatment. Clin Orthop Relat Res. 1988;228:233-239.
15. Tangari M, Carbone S, Callo M, et al. Long head of the biceps tendon rupture in professional wrestlers: treatment with a mini-open tenodesis. J Shoulder Elbow Surg. 2011;20:409-413.
Victims of military sexual trauma—you see them, too
• Routinely question veterans about physical and sexual assault. C
• Suspect a history of military sexual trauma (MST) in veterans who present with multiple physical symptoms. B
• Screen patients with a history of MST for posttraumatic stress disorder and other psychiatric comorbidities. B
Strength of recommendation (SOR)
A Good-quality patient-oriented evidence
B Inconsistent or limited-quality patient-oriented evidence
C Consensus, usual practice, opinion, disease-oriented evidence, case series
CASE A 29-year-old veteran (whom we’ll call Jane Doe) served as a medical corpsman in Iraq and has been pursuing a nursing degree since her honorable discharge a year ago. She comes in for a visit and reports a 3-month history of depression without suicidal ideation. In addition, Ms. Doe says, she has had abdominal pain that waxes and wanes for the past month. The pain is diffuse and nonfocal and appears to be unaffected by eating or bowel movements. She is unable to identify a particular pattern.
The patient has no significant medical or psychiatric history, and a physical examination is unremarkable. You advise her to follow a simplified dietary regimen, avoiding spicy foods and limiting dairy intake, and schedule a follow-up visit in 2 weeks.
Since 2002, some 2.4 million US troops have served in Iraq and Afghanistan,1 creating a new generation of veterans who need broad-based support to recover from the physical and psychological wounds of war. All too often, those wounds include sexual assault or harassment, collectively known as military sexual trauma (MST).
MST is a growing concern for the Veterans Administration (VA) for a number of reasons—an increase in women on the front lines and greater media coverage of patterns of sexual assault in the military among them.2 The official lifting of the ban on women in combat announced by the Pentagon in January brought the issue to the forefront, as well.3
In fact, MST should be a concern not only for clinicians within the VA, but also for civilian physicians. There are nearly 22 million American veterans, and the vast majority (>95%) get at least some of their medical care outside of the VA system4—often in outpatient facilities like yours.5 Family physicians need to be aware of the problem and able to give veterans who have suffered from sexual trauma the sensitive care they require.
The scope of the problem? No one is sure
How widespread is MST? That question is not easily answered. The prevalence rate among female service members is 20% to 43%,6 according to internal reports, while studies outside the military have reported rates that range from 3% to as high as 71%.5 In a recent anonymous survey of women in combat zones, led by a VA researcher—widely reported but still undergoing final review—half of those surveyed reported sexual harassment and nearly one in 4 reported sexual assault.7
There are far less data on rates of MST among male service members. The documented prevalence rate for men is 1.1%, with a range of 0.03% to 12.4%, but these figures are based on internal reports of sexual harassment and assault.8
Military culture and personal history are key factors
While the rate at which MST is reported has increased over the past 30 years,8 many reasons for not reporting it—stigma, fear of blame, accusations of homosexuality or promiscuity, and the threat of charges of fraternization among them—still remain.8,9 Military culture is still male-dominated, with an emphasis on self-sufficiency that often leaves victims of MST feeling as though they have nowhere to turn.
There are also circumstances military members face that can aggravate the effects of sexual trauma. Soldiers on deployment are typically isolated from their normal support systems, under significant pressure, and unable to leave their post, which often means they have ongoing exposure to the abuser.
A history of childhood sexual abuse (CSA). As many as 50% of female service members (and about 17% of military men) have reported CSA,10 compared with 25% to 27% of women and 16% of men outside of the military.5,11 That finding may be partially explained by data showing that nearly half of women in the military cited escaping from their home environment as a primary reason for enlisting.12
Women in the military who have a history of CSA, however, face a significantly higher risk for MST than servicewomen who were not sexually assaulted as children.8 Among female Navy recruits, for example, those who reported CSA were 4.8 times more likely to be raped than those who had no history of CSA.13
Combat-related trauma further complicates the picture. Evidence suggests that exposure to childhood physical and sexual abuse was associated with increased risk for combat-related posttraumatic stress disorder (PTSD) among men who served in Vietnam14 and women who served in Operation Desert Storm.15
Broaching the subject should be routine
Primary care physicians can play an important role in helping veterans transition back to their civilian lives and local communities, starting with a holistic medical assessment. When you see a patient whose return is relatively recent, inquire about his or her experiences during deployment. It is important to ask specifically about traumatic experiences, and to routinely screen for MST.
CASE When Ms. Doe returns. you begin by asking about her mood, using open-ended, nondirective questions. She responds by admitting that she had left important information off of the intake form she filled out on her last visit—most notably, a history of CSA. You gently ask about her experiences in the military, particularly during the year she spent in Iraq—and whether anything happened there that you should know.
Haltingly and with much emotion, the patient tells of her experience with another soldier. She worked with him every day, she says, and had grown close to him. One evening things went further than she expected. At first, it was only kissing, but then he forced himself on her sexually. She has not told anyone else about this event, Ms. Doe confides, because she wasn’t sure whether she precipitated it and felt embarrassed and humiliated by her choice to trust this man.
She did not feel that her supervising officers would listen or understand, as romantic attachments are best avoided in a combat zone and daily injuries are the norm. She says that her role as a medic kept her focused on the pain of others and enabled her to avoid looking at her own situation.
Evidence has shown that, like Ms. Doe, most survivors of trauma do not volunteer such information, but will often respond to direct and empathic questions from their physician.16 Routine screening of all veterans for MST, which the VA recommends, has been shown to increase their use of mental health resources.17,18 This can be easily incorporated into a medical history or an intake questionnaire, using this simple 2-question tool:17,18
While you were in the military:
- Did you receive uninvited and unwanted sexual attention, such as touching, cornering, pressure for sexual favors, or verbal remarks?
- Did anyone ever use force or the threat of force to have sexual contact with you against your will?
Screen for PTSD, and consider other psychiatric disorders
MST has been found to confer a 9-fold risk for PTSD. Indeed, more than 4 in 10 (42%) women with a history of MST have a PTSD diagnosis.19 Thus, if the screen for MST is positive—as indicated by a Yes answer to either question—follow up with the 4-question Primary Care PTSD screen (TABLE 1) is recommended.20
Veterans with a history of MST are twice as likely as other veterans to receive a mental health diagnosis;17 they’re also more likely to have 3 or more comorbid psychiatric conditions.21 Women appear to be more likely than men to suffer from depression, eating disorders, substance abuse,22 anxiety disorders,21 dissociative disorders, and personality disorders.17
Research on the mental health consequences of sexual assault in men (in any setting) is limited, however, and data on male survivors of MST are particularly sparse. What is known is that men who have experienced sexual trauma have higher rates of alcohol abuse23 and self-harm24 than women with a history of sexual trauma, and that MST has a greater association with bipolar disorder, schizophrenia, and psychosis in men.17
TABLE 1
Primary care PTSD screen (PC-PTSD)
In your life, have you ever had any experience that was so frightening, horrible, or upsetting that, in the past month, you:
| |||||||||
| A Yes response to any 3 questions is a positive screen, indicating a need for further investigation and possible referral to a mental health professional. PTSD, posttraumatic stress disorder. Source: National Center for PTSD. http://www.ptsd.va.gov/professional/pages/assessments/pc-ptsd.asp. | |||||||||
Multiple physical symptoms are often trauma-related
Veterans with a history of MST are also more likely to report physical symptoms25 and to have a lower health-related quality of life,26 poorer health status, and more outpatient visits12 than vets who were not exposed to MST. And, while pelvic pain is widely believed to be associated with female sexual abuse, survivors often present with a wide range of physical problems. The most common symptoms, similar to those affecting civilian rape survivors, include headache, gastrointestinal (GI) problems, chronic fatigue, severe menopause symptoms, and urological problems, as well as pelvic pain and sexual problems.27 Cardiac and respiratory disorders are also common (TABLE 2).17,25
Compared with their unaffected counterparts, women with a history of MST are more likely to be obese and sedentary, to smoke and drink, and to have had a hysterectomy before the age of 40 years.28 They are also more than twice as likely as other female veterans to say that they were treated for a heart attack within the past year.25 Data on the physical symptoms of male survivors of MST are extremely limited, but one study found an association with pulmonary and liver disease and human immunodeficiency virus and acquired immune deficiency syndrome.17
TABLE 2
Common physical symptoms reported by female MST survivors*17,25
Reproductive/gynecological
| Pulmonary
|
GI
| Neurologic/rheumatologic
|
Other
| CVD/CVD risk factors
|
| *This is a selection of the symptoms and risk factors MST survivors present with; it is not an exhaustive list. CVD, cardiovascular disease; GI, gastrointestinal; HTN, hypertension; MST, military sexual trauma. | |
A cluster of nonspecific findings?
Patients with a history of MST often present with complex and nonspecific signs and symptoms, making it difficult for a primary care physician to arrive at a diagnosis. MST and combat-related trauma should be considered in such cases, as well as in veterans who present with complaints involving multiple organ systems.21,25
Refer, treat—or do both
Once you have evidence that a patient is a survivor of MST, you need to consider a mental health referral or consultation and address physical symptoms. All honorably discharged veterans are eligible to receive VA treatment for MST, regardless of their disability rating or eligibility for other services. If a veteran indicates that he or she would like to seek psychotherapy or see a specialist outside of the VA system, it will fall to you to help the patient find the most appropriate treatment. (You’ll find links to VA and nonmilitary resources in the box.) Either way, patient acuity is a guide to the optimal approach.
Department of Veterans Affairs
Military sexual trauma
www.mentalhealth.va.gov/msthome.asp
National Center for PTSD
www.ptsd.va.gov
Vet center
www.vetcenter.va.gov
Women Veterans Health Care
www.womenshealth.va.gov/womenshealth/trauma.asp
Other resources:
American Psychiatric Association
www.psych.org
American Psychological Association
www.apa.org
Give an Hour
www.giveanhour.org
National Alliance on Mental Illness Veterans Resource Center
www.nami.org/veterans
Inpatient treatment will likely be needed for a patient who reveals thoughts of self-harm or harming others. If the patient is safe and stable enough for outpatient treatment, a therapist or psychiatrist with experience in treating sexual trauma is a good first step. Cognitive behavioral therapy and trauma-focused therapy have both been shown to have good outcomes in patients with sexual trauma and PTSD.29 Depending on the individual’s key presenting issues, a consultation with a substance abuse specialist, gynecologist, or other specialist may be helpful, as well.
As a family physician, you are in a position to build a long-term, trusting relationship with such a patient, which may be therapeutic in itself.9 In building such a relationship, keep in mind that the experience of serving in the military could make a patient particularly sensitive, or resistant, to your advice; you’ll need to strive for a collaborative approach.
CASE You tell Ms. Doe that the incident she described was indeed sexual violence—and specifically known as military sexual trauma. Her feelings about it are likely surfacing now due to the time away from the military—and by the fact that she’s beginning to date. In addition to spending some time listening to her story, you advise Ms. Doe to start seeing a therapist. You suggest she consider VA treatment services, and direct her to its MST web site (www.mentalhealth.va.gov/msthome.asp). Before she leaves, you make it clear that you will continue to see and support her through this difficult time, and you schedule a follow-up visit.
CORRESPONDENCE
Niranjan S. Karnik, MD, PhD, FAPA, University of Chicago, Pritzker School of Medicine, 5841 South Maryland, MC 3077, Chicago, IL 60637; [email protected]
1. US Department of Veterans Affairs. Analysis of VA health care utilization among Operation Enduring Freedom (OEF) Operation Iraqi Freedom (OIF), and Operation New Dawn (OND) Veterans. Cumulative from 1st Qtr FY 2002 through 1st Qtr FY 2012 (October 1, 2001 – December 31, 2011). Released March 2012. Available at: http://www.publichealth.va.gov/docs/epidemiology/healthcare-utilization-report-fy2012-qtr1.pdf. Accessed February 14, 2013.
2. Kaplan S. Military sexual trauma: a little-known veteran Issue. National Public Radio Web site. May 13 2010. Available at: http://www.npr.org/templates/story/story.php?storyId=126783956. Accessed February 14, 2013.
3. Pellerin C. Dempsey: Allowing women in combat strengthens joint force. US Department of Defense Web site. January 24 2013. Available at: http://www.defense.gov/news/newsarticle.aspx?id=119100. Accessed February 14, 2013.
4. National Center for Veterans Analysis and Statistics. Profile of veterans: 2009 data from the American Community Survey. January 2011. Available at: http://www.va.gov/vetdata/docs/SpecialReports/Profile_of_Veterans_2009_FINAL.pdf. Accessed February 14 2013.
5. Zinzow HM, Grubaugh AL, Monnier J, et al. Trauma among female veterans: a critical review. Trauma Violence Abuse. 2007;8:384-400.
6. Suris A, Lind L. Military sexual trauma: a review of prevalence and associated health consequences in veterans. Trauma Violence Abuse. 2008;9:250-269.
7. Zoroya G. Study: sex assault more common than DoD says. Army Times. December 27 2012. Available at: http://www.armytimes.com/news/2012/12/gannett-va-study-says-sex-assault-more-common-than-pentagon-reports-122712. Accessed February 12, 2013.
8. Hoyt T, Klosterman Rielage J, Williams LF. Military sexual trauma in men: a review of reported rates. J Trauma Dissociation. 2011;12:244-260.
9. Bell ME, Reardon A. Experiences of sexual harassment and sexual assault in the military among OEF/OIF veterans: implications for health care providers. Social Work Health Care. 2011;50:34-50.
10. Rosen LN, Martin L. The measurement of childhood trauma among male and female soldiers in the US Army. Mil Med. 1996;161:342-345.
11. Perez-Fuentes G, Olfson M, Villegas L, et al. Prevalence and correlates of child sex abuse: a national study. Comprehensive Psychiatry. 2013;54:16-27.
12. Sadler AG, Booth BM, Mengeling MA, et al. Life span and repeated violence against women during military service: effects on health status and outpatient utilization. J Womens Health (Larchmt). 2004;13:799-811.
13. Merrill LL, Newell CE, Thomsen CJ, et al. Childhood abuse and sexual revictimization in a female Navy recruit sample. J Trauma Stress. 1999;12:211-225.
14. Bremner JD, Southwick SM, Johnson DR, et al. Childhood physical abuse and combat-related posttraumatic stress disorder in Vietnam veterans. Am J Psychiatry. 1993;150:235-239.
15. Engel CC, Jr, Engel AL, Campbell SJ, et al. Posttraumatic stress disorder symptoms and precombat sexual and physical abuse in Desert Storm veterans. J Nerv Ment Dis. 1993;181:683-688.
16. Friedman LS, Samet JH, Roberts MS, et al. Inquiry about victimization experiences. A survey of patient p and physician practices. Arch Intern Med. 1992;152:1186-1190.
17. Kimerling R, Gima K, Smith MW, et al. The Veterans Health Administration and military sexual trauma. Am J Public Health. 2007;97:2160-2166.
18. Kimerling R, Street AE, Gima K, et al. Evaluation of universal screening for military-related sexual trauma. Psychiatr Serv. 2008;59:635-640.
19. Surís A, Lind L, Kashner TM, et al. Sexual assault in women veterans: an examination of PTSD risk, health care utilization, and cost of care. Psychosom Med. 2004;66:749-756.
20. Ouimette P, Wade M, Prins A, et al. Identifying PTSD in primary care: comparison of the Primary Care-PTSD screen (PC-PTSD) and the General Health Questionnaire-12 (GHQ). J Anxiety Disord. 2008;22:337-343.
21. Maguen S, Cohen B, Ren L, et al. Gender differences in military sexual trauma and mental health diagnoses among Iraq and Afghanistan veterans with posttraumatic stress disorder. Womens Health Issues. 2012;22:e61-e66.
22. Skinner KM, Kressin N, Frayne S, et al. The prevalence of military sexual assault among female Veterans’ Administration outpatients. J Interpers Violence. 2000;15:291-310.
23. Cucciare MA, Ghaus S, Weingardt KR, et al. Sexual assault and substance use in male veterans receiving a brief alcohol intervention. J Stud Alcohol Drugs. 2011;72:693-700.
24. Coxell A, King M, Mezey G, et al. Lifetime prevalence, characteristics, and associated problems of non-consensual sex in men: cross sectional survey. BMJ. 1999;318:846-850.
25. Frayne SM, Skinner KM, Sullivan LM, Tripp TJ, Hankin CS, Kressin NR, Miller DR. Medical profile of women Veterans Administration outpatients who report a history of sexual assault occurring while in the military. J Womens Health Gend Based Med. 1999;8:835-845.
26. Sadler AG, Booth BM, Nielson D, et al. Health-related consequences of physical and sexual violence: women in the military. Obstet Gynecol. 2000;96:473-480.
27. Petter LM, Whitehill DL. Management of female sexual assault. Am Fam Physician. 1998;58:920-926, 929–930.
28. Frayne SM, Skinner KM, Sullivan LM, et al. Sexual assault while in the military: violence as a predictor of cardiac risk? Violence Vict 2003;18:219-225.
29. Nemeroff C, Heim C, Thas ME, et al. Differential responses to psychotherapy versus pharmacotherapy in patients with chronic forms of major depression and childhood trauma. P Natl Acad Sci Usa. 2003;100:14293-14296.
• Routinely question veterans about physical and sexual assault. C
• Suspect a history of military sexual trauma (MST) in veterans who present with multiple physical symptoms. B
• Screen patients with a history of MST for posttraumatic stress disorder and other psychiatric comorbidities. B
Strength of recommendation (SOR)
A Good-quality patient-oriented evidence
B Inconsistent or limited-quality patient-oriented evidence
C Consensus, usual practice, opinion, disease-oriented evidence, case series
CASE A 29-year-old veteran (whom we’ll call Jane Doe) served as a medical corpsman in Iraq and has been pursuing a nursing degree since her honorable discharge a year ago. She comes in for a visit and reports a 3-month history of depression without suicidal ideation. In addition, Ms. Doe says, she has had abdominal pain that waxes and wanes for the past month. The pain is diffuse and nonfocal and appears to be unaffected by eating or bowel movements. She is unable to identify a particular pattern.
The patient has no significant medical or psychiatric history, and a physical examination is unremarkable. You advise her to follow a simplified dietary regimen, avoiding spicy foods and limiting dairy intake, and schedule a follow-up visit in 2 weeks.
Since 2002, some 2.4 million US troops have served in Iraq and Afghanistan,1 creating a new generation of veterans who need broad-based support to recover from the physical and psychological wounds of war. All too often, those wounds include sexual assault or harassment, collectively known as military sexual trauma (MST).
MST is a growing concern for the Veterans Administration (VA) for a number of reasons—an increase in women on the front lines and greater media coverage of patterns of sexual assault in the military among them.2 The official lifting of the ban on women in combat announced by the Pentagon in January brought the issue to the forefront, as well.3
In fact, MST should be a concern not only for clinicians within the VA, but also for civilian physicians. There are nearly 22 million American veterans, and the vast majority (>95%) get at least some of their medical care outside of the VA system4—often in outpatient facilities like yours.5 Family physicians need to be aware of the problem and able to give veterans who have suffered from sexual trauma the sensitive care they require.
The scope of the problem? No one is sure
How widespread is MST? That question is not easily answered. The prevalence rate among female service members is 20% to 43%,6 according to internal reports, while studies outside the military have reported rates that range from 3% to as high as 71%.5 In a recent anonymous survey of women in combat zones, led by a VA researcher—widely reported but still undergoing final review—half of those surveyed reported sexual harassment and nearly one in 4 reported sexual assault.7
There are far less data on rates of MST among male service members. The documented prevalence rate for men is 1.1%, with a range of 0.03% to 12.4%, but these figures are based on internal reports of sexual harassment and assault.8
Military culture and personal history are key factors
While the rate at which MST is reported has increased over the past 30 years,8 many reasons for not reporting it—stigma, fear of blame, accusations of homosexuality or promiscuity, and the threat of charges of fraternization among them—still remain.8,9 Military culture is still male-dominated, with an emphasis on self-sufficiency that often leaves victims of MST feeling as though they have nowhere to turn.
There are also circumstances military members face that can aggravate the effects of sexual trauma. Soldiers on deployment are typically isolated from their normal support systems, under significant pressure, and unable to leave their post, which often means they have ongoing exposure to the abuser.
A history of childhood sexual abuse (CSA). As many as 50% of female service members (and about 17% of military men) have reported CSA,10 compared with 25% to 27% of women and 16% of men outside of the military.5,11 That finding may be partially explained by data showing that nearly half of women in the military cited escaping from their home environment as a primary reason for enlisting.12
Women in the military who have a history of CSA, however, face a significantly higher risk for MST than servicewomen who were not sexually assaulted as children.8 Among female Navy recruits, for example, those who reported CSA were 4.8 times more likely to be raped than those who had no history of CSA.13
Combat-related trauma further complicates the picture. Evidence suggests that exposure to childhood physical and sexual abuse was associated with increased risk for combat-related posttraumatic stress disorder (PTSD) among men who served in Vietnam14 and women who served in Operation Desert Storm.15
Broaching the subject should be routine
Primary care physicians can play an important role in helping veterans transition back to their civilian lives and local communities, starting with a holistic medical assessment. When you see a patient whose return is relatively recent, inquire about his or her experiences during deployment. It is important to ask specifically about traumatic experiences, and to routinely screen for MST.
CASE When Ms. Doe returns. you begin by asking about her mood, using open-ended, nondirective questions. She responds by admitting that she had left important information off of the intake form she filled out on her last visit—most notably, a history of CSA. You gently ask about her experiences in the military, particularly during the year she spent in Iraq—and whether anything happened there that you should know.
Haltingly and with much emotion, the patient tells of her experience with another soldier. She worked with him every day, she says, and had grown close to him. One evening things went further than she expected. At first, it was only kissing, but then he forced himself on her sexually. She has not told anyone else about this event, Ms. Doe confides, because she wasn’t sure whether she precipitated it and felt embarrassed and humiliated by her choice to trust this man.
She did not feel that her supervising officers would listen or understand, as romantic attachments are best avoided in a combat zone and daily injuries are the norm. She says that her role as a medic kept her focused on the pain of others and enabled her to avoid looking at her own situation.
Evidence has shown that, like Ms. Doe, most survivors of trauma do not volunteer such information, but will often respond to direct and empathic questions from their physician.16 Routine screening of all veterans for MST, which the VA recommends, has been shown to increase their use of mental health resources.17,18 This can be easily incorporated into a medical history or an intake questionnaire, using this simple 2-question tool:17,18
While you were in the military:
- Did you receive uninvited and unwanted sexual attention, such as touching, cornering, pressure for sexual favors, or verbal remarks?
- Did anyone ever use force or the threat of force to have sexual contact with you against your will?
Screen for PTSD, and consider other psychiatric disorders
MST has been found to confer a 9-fold risk for PTSD. Indeed, more than 4 in 10 (42%) women with a history of MST have a PTSD diagnosis.19 Thus, if the screen for MST is positive—as indicated by a Yes answer to either question—follow up with the 4-question Primary Care PTSD screen (TABLE 1) is recommended.20
Veterans with a history of MST are twice as likely as other veterans to receive a mental health diagnosis;17 they’re also more likely to have 3 or more comorbid psychiatric conditions.21 Women appear to be more likely than men to suffer from depression, eating disorders, substance abuse,22 anxiety disorders,21 dissociative disorders, and personality disorders.17
Research on the mental health consequences of sexual assault in men (in any setting) is limited, however, and data on male survivors of MST are particularly sparse. What is known is that men who have experienced sexual trauma have higher rates of alcohol abuse23 and self-harm24 than women with a history of sexual trauma, and that MST has a greater association with bipolar disorder, schizophrenia, and psychosis in men.17
TABLE 1
Primary care PTSD screen (PC-PTSD)
In your life, have you ever had any experience that was so frightening, horrible, or upsetting that, in the past month, you:
| |||||||||
| A Yes response to any 3 questions is a positive screen, indicating a need for further investigation and possible referral to a mental health professional. PTSD, posttraumatic stress disorder. Source: National Center for PTSD. http://www.ptsd.va.gov/professional/pages/assessments/pc-ptsd.asp. | |||||||||
Multiple physical symptoms are often trauma-related
Veterans with a history of MST are also more likely to report physical symptoms25 and to have a lower health-related quality of life,26 poorer health status, and more outpatient visits12 than vets who were not exposed to MST. And, while pelvic pain is widely believed to be associated with female sexual abuse, survivors often present with a wide range of physical problems. The most common symptoms, similar to those affecting civilian rape survivors, include headache, gastrointestinal (GI) problems, chronic fatigue, severe menopause symptoms, and urological problems, as well as pelvic pain and sexual problems.27 Cardiac and respiratory disorders are also common (TABLE 2).17,25
Compared with their unaffected counterparts, women with a history of MST are more likely to be obese and sedentary, to smoke and drink, and to have had a hysterectomy before the age of 40 years.28 They are also more than twice as likely as other female veterans to say that they were treated for a heart attack within the past year.25 Data on the physical symptoms of male survivors of MST are extremely limited, but one study found an association with pulmonary and liver disease and human immunodeficiency virus and acquired immune deficiency syndrome.17
TABLE 2
Common physical symptoms reported by female MST survivors*17,25
Reproductive/gynecological
| Pulmonary
|
GI
| Neurologic/rheumatologic
|
Other
| CVD/CVD risk factors
|
| *This is a selection of the symptoms and risk factors MST survivors present with; it is not an exhaustive list. CVD, cardiovascular disease; GI, gastrointestinal; HTN, hypertension; MST, military sexual trauma. | |
A cluster of nonspecific findings?
Patients with a history of MST often present with complex and nonspecific signs and symptoms, making it difficult for a primary care physician to arrive at a diagnosis. MST and combat-related trauma should be considered in such cases, as well as in veterans who present with complaints involving multiple organ systems.21,25
Refer, treat—or do both
Once you have evidence that a patient is a survivor of MST, you need to consider a mental health referral or consultation and address physical symptoms. All honorably discharged veterans are eligible to receive VA treatment for MST, regardless of their disability rating or eligibility for other services. If a veteran indicates that he or she would like to seek psychotherapy or see a specialist outside of the VA system, it will fall to you to help the patient find the most appropriate treatment. (You’ll find links to VA and nonmilitary resources in the box.) Either way, patient acuity is a guide to the optimal approach.
Department of Veterans Affairs
Military sexual trauma
www.mentalhealth.va.gov/msthome.asp
National Center for PTSD
www.ptsd.va.gov
Vet center
www.vetcenter.va.gov
Women Veterans Health Care
www.womenshealth.va.gov/womenshealth/trauma.asp
Other resources:
American Psychiatric Association
www.psych.org
American Psychological Association
www.apa.org
Give an Hour
www.giveanhour.org
National Alliance on Mental Illness Veterans Resource Center
www.nami.org/veterans
Inpatient treatment will likely be needed for a patient who reveals thoughts of self-harm or harming others. If the patient is safe and stable enough for outpatient treatment, a therapist or psychiatrist with experience in treating sexual trauma is a good first step. Cognitive behavioral therapy and trauma-focused therapy have both been shown to have good outcomes in patients with sexual trauma and PTSD.29 Depending on the individual’s key presenting issues, a consultation with a substance abuse specialist, gynecologist, or other specialist may be helpful, as well.
As a family physician, you are in a position to build a long-term, trusting relationship with such a patient, which may be therapeutic in itself.9 In building such a relationship, keep in mind that the experience of serving in the military could make a patient particularly sensitive, or resistant, to your advice; you’ll need to strive for a collaborative approach.
CASE You tell Ms. Doe that the incident she described was indeed sexual violence—and specifically known as military sexual trauma. Her feelings about it are likely surfacing now due to the time away from the military—and by the fact that she’s beginning to date. In addition to spending some time listening to her story, you advise Ms. Doe to start seeing a therapist. You suggest she consider VA treatment services, and direct her to its MST web site (www.mentalhealth.va.gov/msthome.asp). Before she leaves, you make it clear that you will continue to see and support her through this difficult time, and you schedule a follow-up visit.
CORRESPONDENCE
Niranjan S. Karnik, MD, PhD, FAPA, University of Chicago, Pritzker School of Medicine, 5841 South Maryland, MC 3077, Chicago, IL 60637; [email protected]
1. US Department of Veterans Affairs. Analysis of VA health care utilization among Operation Enduring Freedom (OEF) Operation Iraqi Freedom (OIF), and Operation New Dawn (OND) Veterans. Cumulative from 1st Qtr FY 2002 through 1st Qtr FY 2012 (October 1, 2001 – December 31, 2011). Released March 2012. Available at: http://www.publichealth.va.gov/docs/epidemiology/healthcare-utilization-report-fy2012-qtr1.pdf. Accessed February 14, 2013.
2. Kaplan S. Military sexual trauma: a little-known veteran Issue. National Public Radio Web site. May 13 2010. Available at: http://www.npr.org/templates/story/story.php?storyId=126783956. Accessed February 14, 2013.
3. Pellerin C. Dempsey: Allowing women in combat strengthens joint force. US Department of Defense Web site. January 24 2013. Available at: http://www.defense.gov/news/newsarticle.aspx?id=119100. Accessed February 14, 2013.
4. National Center for Veterans Analysis and Statistics. Profile of veterans: 2009 data from the American Community Survey. January 2011. Available at: http://www.va.gov/vetdata/docs/SpecialReports/Profile_of_Veterans_2009_FINAL.pdf. Accessed February 14 2013.
5. Zinzow HM, Grubaugh AL, Monnier J, et al. Trauma among female veterans: a critical review. Trauma Violence Abuse. 2007;8:384-400.
6. Suris A, Lind L. Military sexual trauma: a review of prevalence and associated health consequences in veterans. Trauma Violence Abuse. 2008;9:250-269.
7. Zoroya G. Study: sex assault more common than DoD says. Army Times. December 27 2012. Available at: http://www.armytimes.com/news/2012/12/gannett-va-study-says-sex-assault-more-common-than-pentagon-reports-122712. Accessed February 12, 2013.
8. Hoyt T, Klosterman Rielage J, Williams LF. Military sexual trauma in men: a review of reported rates. J Trauma Dissociation. 2011;12:244-260.
9. Bell ME, Reardon A. Experiences of sexual harassment and sexual assault in the military among OEF/OIF veterans: implications for health care providers. Social Work Health Care. 2011;50:34-50.
10. Rosen LN, Martin L. The measurement of childhood trauma among male and female soldiers in the US Army. Mil Med. 1996;161:342-345.
11. Perez-Fuentes G, Olfson M, Villegas L, et al. Prevalence and correlates of child sex abuse: a national study. Comprehensive Psychiatry. 2013;54:16-27.
12. Sadler AG, Booth BM, Mengeling MA, et al. Life span and repeated violence against women during military service: effects on health status and outpatient utilization. J Womens Health (Larchmt). 2004;13:799-811.
13. Merrill LL, Newell CE, Thomsen CJ, et al. Childhood abuse and sexual revictimization in a female Navy recruit sample. J Trauma Stress. 1999;12:211-225.
14. Bremner JD, Southwick SM, Johnson DR, et al. Childhood physical abuse and combat-related posttraumatic stress disorder in Vietnam veterans. Am J Psychiatry. 1993;150:235-239.
15. Engel CC, Jr, Engel AL, Campbell SJ, et al. Posttraumatic stress disorder symptoms and precombat sexual and physical abuse in Desert Storm veterans. J Nerv Ment Dis. 1993;181:683-688.
16. Friedman LS, Samet JH, Roberts MS, et al. Inquiry about victimization experiences. A survey of patient p and physician practices. Arch Intern Med. 1992;152:1186-1190.
17. Kimerling R, Gima K, Smith MW, et al. The Veterans Health Administration and military sexual trauma. Am J Public Health. 2007;97:2160-2166.
18. Kimerling R, Street AE, Gima K, et al. Evaluation of universal screening for military-related sexual trauma. Psychiatr Serv. 2008;59:635-640.
19. Surís A, Lind L, Kashner TM, et al. Sexual assault in women veterans: an examination of PTSD risk, health care utilization, and cost of care. Psychosom Med. 2004;66:749-756.
20. Ouimette P, Wade M, Prins A, et al. Identifying PTSD in primary care: comparison of the Primary Care-PTSD screen (PC-PTSD) and the General Health Questionnaire-12 (GHQ). J Anxiety Disord. 2008;22:337-343.
21. Maguen S, Cohen B, Ren L, et al. Gender differences in military sexual trauma and mental health diagnoses among Iraq and Afghanistan veterans with posttraumatic stress disorder. Womens Health Issues. 2012;22:e61-e66.
22. Skinner KM, Kressin N, Frayne S, et al. The prevalence of military sexual assault among female Veterans’ Administration outpatients. J Interpers Violence. 2000;15:291-310.
23. Cucciare MA, Ghaus S, Weingardt KR, et al. Sexual assault and substance use in male veterans receiving a brief alcohol intervention. J Stud Alcohol Drugs. 2011;72:693-700.
24. Coxell A, King M, Mezey G, et al. Lifetime prevalence, characteristics, and associated problems of non-consensual sex in men: cross sectional survey. BMJ. 1999;318:846-850.
25. Frayne SM, Skinner KM, Sullivan LM, Tripp TJ, Hankin CS, Kressin NR, Miller DR. Medical profile of women Veterans Administration outpatients who report a history of sexual assault occurring while in the military. J Womens Health Gend Based Med. 1999;8:835-845.
26. Sadler AG, Booth BM, Nielson D, et al. Health-related consequences of physical and sexual violence: women in the military. Obstet Gynecol. 2000;96:473-480.
27. Petter LM, Whitehill DL. Management of female sexual assault. Am Fam Physician. 1998;58:920-926, 929–930.
28. Frayne SM, Skinner KM, Sullivan LM, et al. Sexual assault while in the military: violence as a predictor of cardiac risk? Violence Vict 2003;18:219-225.
29. Nemeroff C, Heim C, Thas ME, et al. Differential responses to psychotherapy versus pharmacotherapy in patients with chronic forms of major depression and childhood trauma. P Natl Acad Sci Usa. 2003;100:14293-14296.
Obese mother gains another 60 lb before delivery … and more

AN OBESE WOMAN with a family history of diabetes had previously given birth to a large baby. Even though she expressed her concern that this fetus would also be macrosomic, the ObGyn planned for spontaneous vaginal delivery. At 39 weeks’ gestation, after gaining 60 lb, she went to the hospital requesting induction of labor; the ObGyn reluctantly agreed. Labor was lengthy, forceps-assisted delivery was performed, and a shoulder dystocia was encountered. The baby was born with respiratory distress, a brachial plexus injury, bruises on his right cheek and both ears, and multiple rib fractures. After transfer to a children’s hospital, surgical exploration revealed avulsion of the C6 root nerve from the spinal cord and damage to C5, C7, and C8 nerve roots. Several surgical repairs and physical therapy have led to some improvement, but the child is permanently injured. His right arm is shorter than the left, his right hand is smaller, and he has less strength and range of motion in the right arm. He also has excessive tearing in the right eye and his right eyelid droops.
PARENTS’ CLAIM The ObGyn failed to recognize the risk of delivering a macrosomic baby and did not consider cesarean delivery. The brachial plexus injury was due to downward traction applied during delivery.
PHYSICIAN’S DEFENSE There was no negligence. The brachial plexus injury was not caused by downward traction.
VERDICT A $4.1 million Indiana verdict was returned, but was reduced to the state cap of $1.25 million.
Failure to follow-up on mass: $1.97M verdict
AFTER STAGE II OVARIAN CANCER was found in 1999, a woman underwent surgery and chemotherapy, and was told she was cancer-free. She had regular visits between 2000 and 2008 with another surgical oncologist after her first surgeon moved. In 2004, the oncologist documented finding a round fullness during a pelvic exam. A CT scan confirmed a mass in the pelvic cul-de-sac.
In August 2008, the patient was treated for deep venous thrombosis in her leg. The attending physician saw the pelvic mass on imaging, and a biopsy indicated a recurrence of ovarian cancer. After chemotherapy, the patient underwent surgery, but the tumor was unresectable. In early 2011, testing revealed metastasis to the spine, sternum, pelvic bone, arm, and lung.
PATIENT’S CLAIM The surgeon did not properly investigate the mass resulting in a delayed diagnosis of cancer recurrence. The patient alleged that the surgical oncologist repeatedly stated that the mass had not changed and was most likely fluid; it was nothing to worry about. Radiology reports indicated a suspicion of cancer.
DEFENDANTS’ DEFENSE The oncologist repeatedly told the patient that the mass should be biopsied, but the patient refused because she was dealing with other medical issues. The radiologist argued that reports to the oncologist included everything needed to diagnose the cancer.
VERDICT A Pennsylvania jury found the surgical oncologist fully at fault and returned a $1,971,455 verdict.
Incomplete tubal ligation
BEFORE DELIVERY OF HER THIRD CHILD, a 26-year-old woman requested sterilization using tubal ligation. After delivery, the ObGyn performed a bilateral tubal ligation. The pathologist’s report indicated that the ligation was incomplete: the left fallopian tube had not been fully removed. The ObGyn failed to note the report’s results in the patient’s record, nor did he advise the patient. Two years later, the patient delivered a fourth child.
PATIENT’S CLAIM The patient alleged wrongful birth against both the ObGyn and pathologist. The ObGyn was negligent for not reacting to the pathologist’s report of incomplete tubal ligation, and for not informing the patient. The pathologist should have verbally confirmed receipt of the report with the ObGyn.
PHYSICIANS’ DEFENSE The ObGyn settled before trial. The pathologist claimed he had properly interpreted the specimen and reported the results.
VERDICT A Louisiana jury found the ObGyn fully at fault and assessed additional damages of $56,252 to the $100,000 settlement.

A WOMAN SUFFERED FROM PELVIC PAIN caused by adhesions following two cesarean deliveries and a hysterectomy. In January 2003, her ObGyn performed laparotomy to reduce adhesions from prior surgeries and place Gore-Tex mesh to prevent future adhesions. In October 2010, the patient reported epigastric pain, and went to a different surgeon (her insurance changed). A CT scan identified a foreign body encapsulated in scar tissue in the patient’s lower abdomen/pelvis. The surgeon removed the foreign body.
PATIENT’S CLAIM The ObGyn and hospital were negligent in conducting the 2003 procedure; the foreign object was a retained surgical sponge.
DEFENDANTS’ DEFENSE The foreign body removed in 2010 was the Gore-Tex mesh placed in 2003. The mesh became encapsulated in scar tissue due to the patient’s propensity to develop adhesions, and then moved within the patient’s body. Surgical sponges have embedded radiopaque tracers; CT scans in 2003 and 2010 did not detect any radiopaque tracers.
VERDICT A California defense verdict was returned.
Massive bleed during sacrocolpopexy
AFTER A 72-YEAR-OLD WOMAN developed pelvic organ prolapse, her urologist performed an abdominal sacrocolpopexy. As the urologist attempted to gain access to the sacral prominence, a tear in the median sacral vein expanded to involve the inferior vena cava and left iliac vein. Massive bleeding occurred and multiple units of blood were transfused. A general surgeon successfully repaired the vascular injuries. The patient was hospitalized for 16 days, received home healthcare, and fully recovered.
PATIENT’S CLAIM The urologist was negligent in overaggressive manipulation of the median sacral vein, causing it to avulse.
PHYSICIAN’S DEFENSE Bleeds of this type are a known complication of the procedure.
VERDICT A Michigan defense verdict was returned.
Was it hypoxia or autism?
AFTER SEVERAL HOURS IN LABOR, a fetal heart-rate monitor indicated decreasing fetal heart rate that led to terminal bradycardia. The ObGyn was called and performed an emergency cesarean delivery. The child was diagnosed with brain damage at 2 years of age.
PARENTS’ CLAIM A cesarean delivery should have been planned because of the fetal weight (8 lb 11 oz). A hypoxic event occurred during labor. Ultrasonography would have shown that the fetus was inverted and that the baby’s face was covered by one of its hands. Delivery was not properly managed, and fetal distress was not reported to the ObGyn in a timely manner.
DEFENDANTS’ DEFENSE The infant’s weight was not sufficient to warrant a cesarean delivery. The infant did not suffer hypoxia. The child’s abnormalities only emerged in the second year of life. An MRI at that time did not indicate brain damage. The child’s development with subsequent regression suggests autism.
VERDICT A New York defense verdict was returned.
Should mammography have been diagnostic?
A 46-YEAR-OLD WOMAN with a family history of breast cancer had regular annual screenings. In December 2006, the patient reported pain, hardness, and burning in her left breast to her gynecologist. A radiologist interpreted the mammography as normal. In May 2007, the patient found a lump in her left breast. Testing indicated she had stage IV breast cancer. She died 2 months after the trial concluded.
PATIENT’S CLAIM The 2006 mammogram was performed as a screening mammography, but should have been diagnostic, considering her family history and reported symptoms. The radiologist improperly interpreted the films.
DEFENDANTS’ DEFENSE The hospital staff testified that the patient did not report pain, hardness, and burning in her left breast when she presented for the 2006 mammography. The radiologist claimed his screening and interpretation were appropriate.
VERDICT The Louisiana court granted the patient’s motion for judgment, and awarded $558,000 in medical costs and $1.3 million in noneconomic damages, totalling $1.808 million. This was reduced to the $500,000 statutory cap.
These cases were selected by the editors of OBG Management from Medical Malpractice Verdicts, Settlements & Experts, with permission of the editor, Lewis Laska (www.verdictslaska.com). The information available to the editors about the cases presented here is sometimes incomplete. Moreover, the cases may or may not have merit. Nevertheless, these cases represent the types of clinical situations that typically result in litigation and are meant to illustrate nationwide variation in jury verdicts and awards.
We want to hear from you! Tell us what you think.
AN OBESE WOMAN with a family history of diabetes had previously given birth to a large baby. Even though she expressed her concern that this fetus would also be macrosomic, the ObGyn planned for spontaneous vaginal delivery. At 39 weeks’ gestation, after gaining 60 lb, she went to the hospital requesting induction of labor; the ObGyn reluctantly agreed. Labor was lengthy, forceps-assisted delivery was performed, and a shoulder dystocia was encountered. The baby was born with respiratory distress, a brachial plexus injury, bruises on his right cheek and both ears, and multiple rib fractures. After transfer to a children’s hospital, surgical exploration revealed avulsion of the C6 root nerve from the spinal cord and damage to C5, C7, and C8 nerve roots. Several surgical repairs and physical therapy have led to some improvement, but the child is permanently injured. His right arm is shorter than the left, his right hand is smaller, and he has less strength and range of motion in the right arm. He also has excessive tearing in the right eye and his right eyelid droops.
PARENTS’ CLAIM The ObGyn failed to recognize the risk of delivering a macrosomic baby and did not consider cesarean delivery. The brachial plexus injury was due to downward traction applied during delivery.
PHYSICIAN’S DEFENSE There was no negligence. The brachial plexus injury was not caused by downward traction.
VERDICT A $4.1 million Indiana verdict was returned, but was reduced to the state cap of $1.25 million.
Failure to follow-up on mass: $1.97M verdict
AFTER STAGE II OVARIAN CANCER was found in 1999, a woman underwent surgery and chemotherapy, and was told she was cancer-free. She had regular visits between 2000 and 2008 with another surgical oncologist after her first surgeon moved. In 2004, the oncologist documented finding a round fullness during a pelvic exam. A CT scan confirmed a mass in the pelvic cul-de-sac.
In August 2008, the patient was treated for deep venous thrombosis in her leg. The attending physician saw the pelvic mass on imaging, and a biopsy indicated a recurrence of ovarian cancer. After chemotherapy, the patient underwent surgery, but the tumor was unresectable. In early 2011, testing revealed metastasis to the spine, sternum, pelvic bone, arm, and lung.
PATIENT’S CLAIM The surgeon did not properly investigate the mass resulting in a delayed diagnosis of cancer recurrence. The patient alleged that the surgical oncologist repeatedly stated that the mass had not changed and was most likely fluid; it was nothing to worry about. Radiology reports indicated a suspicion of cancer.
DEFENDANTS’ DEFENSE The oncologist repeatedly told the patient that the mass should be biopsied, but the patient refused because she was dealing with other medical issues. The radiologist argued that reports to the oncologist included everything needed to diagnose the cancer.
VERDICT A Pennsylvania jury found the surgical oncologist fully at fault and returned a $1,971,455 verdict.
Incomplete tubal ligation
BEFORE DELIVERY OF HER THIRD CHILD, a 26-year-old woman requested sterilization using tubal ligation. After delivery, the ObGyn performed a bilateral tubal ligation. The pathologist’s report indicated that the ligation was incomplete: the left fallopian tube had not been fully removed. The ObGyn failed to note the report’s results in the patient’s record, nor did he advise the patient. Two years later, the patient delivered a fourth child.
PATIENT’S CLAIM The patient alleged wrongful birth against both the ObGyn and pathologist. The ObGyn was negligent for not reacting to the pathologist’s report of incomplete tubal ligation, and for not informing the patient. The pathologist should have verbally confirmed receipt of the report with the ObGyn.
PHYSICIANS’ DEFENSE The ObGyn settled before trial. The pathologist claimed he had properly interpreted the specimen and reported the results.
VERDICT A Louisiana jury found the ObGyn fully at fault and assessed additional damages of $56,252 to the $100,000 settlement.
A WOMAN SUFFERED FROM PELVIC PAIN caused by adhesions following two cesarean deliveries and a hysterectomy. In January 2003, her ObGyn performed laparotomy to reduce adhesions from prior surgeries and place Gore-Tex mesh to prevent future adhesions. In October 2010, the patient reported epigastric pain, and went to a different surgeon (her insurance changed). A CT scan identified a foreign body encapsulated in scar tissue in the patient’s lower abdomen/pelvis. The surgeon removed the foreign body.
PATIENT’S CLAIM The ObGyn and hospital were negligent in conducting the 2003 procedure; the foreign object was a retained surgical sponge.
DEFENDANTS’ DEFENSE The foreign body removed in 2010 was the Gore-Tex mesh placed in 2003. The mesh became encapsulated in scar tissue due to the patient’s propensity to develop adhesions, and then moved within the patient’s body. Surgical sponges have embedded radiopaque tracers; CT scans in 2003 and 2010 did not detect any radiopaque tracers.
VERDICT A California defense verdict was returned.
Massive bleed during sacrocolpopexy
AFTER A 72-YEAR-OLD WOMAN developed pelvic organ prolapse, her urologist performed an abdominal sacrocolpopexy. As the urologist attempted to gain access to the sacral prominence, a tear in the median sacral vein expanded to involve the inferior vena cava and left iliac vein. Massive bleeding occurred and multiple units of blood were transfused. A general surgeon successfully repaired the vascular injuries. The patient was hospitalized for 16 days, received home healthcare, and fully recovered.
PATIENT’S CLAIM The urologist was negligent in overaggressive manipulation of the median sacral vein, causing it to avulse.
PHYSICIAN’S DEFENSE Bleeds of this type are a known complication of the procedure.
VERDICT A Michigan defense verdict was returned.
Was it hypoxia or autism?
AFTER SEVERAL HOURS IN LABOR, a fetal heart-rate monitor indicated decreasing fetal heart rate that led to terminal bradycardia. The ObGyn was called and performed an emergency cesarean delivery. The child was diagnosed with brain damage at 2 years of age.
PARENTS’ CLAIM A cesarean delivery should have been planned because of the fetal weight (8 lb 11 oz). A hypoxic event occurred during labor. Ultrasonography would have shown that the fetus was inverted and that the baby’s face was covered by one of its hands. Delivery was not properly managed, and fetal distress was not reported to the ObGyn in a timely manner.
DEFENDANTS’ DEFENSE The infant’s weight was not sufficient to warrant a cesarean delivery. The infant did not suffer hypoxia. The child’s abnormalities only emerged in the second year of life. An MRI at that time did not indicate brain damage. The child’s development with subsequent regression suggests autism.
VERDICT A New York defense verdict was returned.
Should mammography have been diagnostic?
A 46-YEAR-OLD WOMAN with a family history of breast cancer had regular annual screenings. In December 2006, the patient reported pain, hardness, and burning in her left breast to her gynecologist. A radiologist interpreted the mammography as normal. In May 2007, the patient found a lump in her left breast. Testing indicated she had stage IV breast cancer. She died 2 months after the trial concluded.
PATIENT’S CLAIM The 2006 mammogram was performed as a screening mammography, but should have been diagnostic, considering her family history and reported symptoms. The radiologist improperly interpreted the films.
DEFENDANTS’ DEFENSE The hospital staff testified that the patient did not report pain, hardness, and burning in her left breast when she presented for the 2006 mammography. The radiologist claimed his screening and interpretation were appropriate.
VERDICT The Louisiana court granted the patient’s motion for judgment, and awarded $558,000 in medical costs and $1.3 million in noneconomic damages, totalling $1.808 million. This was reduced to the $500,000 statutory cap.
These cases were selected by the editors of OBG Management from Medical Malpractice Verdicts, Settlements & Experts, with permission of the editor, Lewis Laska (www.verdictslaska.com). The information available to the editors about the cases presented here is sometimes incomplete. Moreover, the cases may or may not have merit. Nevertheless, these cases represent the types of clinical situations that typically result in litigation and are meant to illustrate nationwide variation in jury verdicts and awards.
We want to hear from you! Tell us what you think.
When is her pelvic pressure and bulge due to Pouch of Douglas hernia?
CASE: Pelvic organ prolapse or Pouch of Douglas hernia?
A 42-year-old G3P2 woman is referred to you by her primary care provider for pelvic organ prolapse. Her medical history reveals that she has been bothered by a sense of pelvic pressure and bulge progressing over several years, and she has noticed that her symptoms are particularly worse during and after bowel movements. She reports some improved bowel evacuation with external splinting of her perineum. Upon closer questioning, the patient reports a history of chronic constipation since childhood associated with straining and a sense of incomplete emptying. She reports spending up to 30 minutes three to four times per day on the commode to completely empty her bowels.
Physical examination reveals an overweight woman with a soft, nontender abdomen remarkable for laparoscopic incision scars from a previous tubal ligation. Inspection of the external genitalia at rest is normal. Cough stress test is negative. At maximum Valsalva, however, there is significant perineal ballooning present.
Speculum examination demonstrates grade 1 uterine prolapse, grade 1 cystocele, and grade 2 rectocele. There is no evidence of pelvic floor tension myalgia. She has weak pelvic muscle strength. Visualization of the anus at maximum Valsalva reveals there is some asymmetric rectal prolapse of the anterior rectal wall. Digital rectal exam is unremarkable.
Are these patient’s symptoms due to pelvic organ prolapse or Pouch of Douglas hernia?
Pelvic organ prolapse: A common problem
Pelvic organ prolapse has an estimated prevalence of 55% in women aged 50 to 59 years.1 More than 200,000 pelvic organ prolapse surgeries are performed annually in the United States.2 Typically, patients report:
- vaginal bulge causing discomfort
- pelvic pressure or heaviness, or
- rubbing of the vaginal bulge on undergarments.
In more advanced pelvic organ prolapse, patients may report voiding dysfunction or stool trapping that requires manual splinting of the prolapse to assist in bladder and bowel evacuation.
Pouch of Douglas hernia: A lesser-known
(recognized) phenomenon
Similar to pelvic organ prolapse, Pouch of Douglas hernia also can present with symptoms of:
- pelvic pressure
- vague perineal aching
- defecatory dysfunction.
The phenomenon has been variably referred to in the literature as enterocele, descending perineum syndrome, peritoneocele, or Pouch of Douglas hernia. The concept was first introduced in 19663 and describes descent of the entire pelvic floor and small bowel through a hernia in the Pouch of Douglas (FIGURE 1).
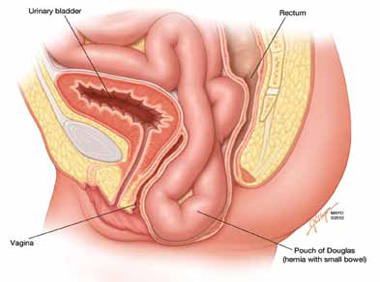
FIGURE 1: Pouch of Douglas hernia. The pelvic floor and small bowel descend into the Pouch of Douglas.
How does it occur? The pathophysiology is thought to be related to excessive abdominal straining in individuals with chronic constipation. This results in diminished pelvic floor muscle tone. Eventually, the whole pelvic floor descends, becoming funnel shaped due to stretching of the puborectalis muscle. Thus, stool is expelled by force, mostly through forces on the anterior rectal wall (which tends to prolapse after stool evacuation, with accompanied mucus secretion, soreness, and irritation).
Clinical pearl: Given the rectal wall prolapse that occurs after stool evacuation in Pouch of Douglas hernia, some patients will describe a rectal lump that bleeds after a bowel movement. The sensation of the rectal lump from the anterior rectal wall prolapse causes further straining.
Your patient reports pelvic pressure and bulge.
How do you proceed?
Physical examination
Look for perineal ballooning. Physical examination should start with inspection of the external genitalia. This inspection will identify any pelvic organ prolapse at or beyond the introitus. However, a Pouch of Douglas hernia will be missed if the patient is not examined during Valsalva or maximal strain. This maneuver will demonstrate the classic finding of perineal ballooning and is crucial to a final diagnosis of Pouch of Douglas hernia. Normally, the perineum will descend 1 cm to 2 cm during maximal strain; in Pouch of Douglas hernias, the perineum can descend up to 4 cm to 8 cm.4
Clinical pearl: It should be noted that, often, patients will not have a great deal of vaginal prolapse accompanying the perineal ballooning. In our opinion, this finding distinguishes Pouch of Douglas hernia from a vaginal vault prolapse caused by an enterocele.
Is rectal prolapse present? Beyond perineal ballooning, the presence of rectal prolapse should be evaluated. A rectocele of some degree is usually present. Asymmetric rectal prolapse affecting the anterior aspect of the rectal wall is consistent with a Pouch of Douglas hernia. This anatomic finding should be distinguished from true circumferential rectal prolapse, which remains in the differential diagnosis.
Basing the diagnosis of Pouch of Douglas hernia on physical examination alone can be difficult. Therefore, imaging studies are essential for accurate diagnosis.
Imaging investigations
Several imaging modalities can be used to diagnose such disorders of the pelvic floor as Pouch of Douglas hernia. These include:
- dynamic colpocystoproctography5
- defecography with oral barium6
- dynamic pelvic magnetic resonance imaging (MRI).7
In our experience, dynamic pelvic MRI has a high accuracy rate for diagnosing Pouch of Douglas hernia. FIGURE 2 illustrates the large Pouch of Douglas hernia filled with loops of small bowel. Perineal descent of the anorectal junction more than 3 cm below the pubococcygeal line during maximal straining is a diagnostic finding on imaging.7
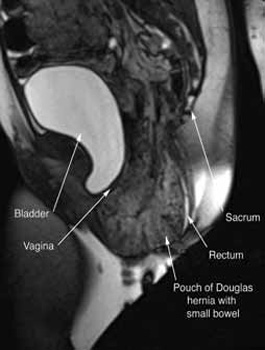
FIGURE 2: MRI
Sagittal MRI during maximal Valsalva straining, demonstrating Pouch of Douglas hernia filled with small bowel.
What are your patient’s treatment options?
Reduce straining during bowel movements. The primary goal of treatment for Pouch of Douglas hernia should be relief of bothersome symptoms. Therefore, further damage can be prevented by eliminating straining during defecation. This can be accomplished with a bowel regimen that combines an irritant suppository (glycerin or bisacodyl) with a fiber supplement (the latter to increase bulk of the stool). Oral laxatives have limited use as many patients have lax anal sphincters and liquid stool could cause fecal incontinence.
Pelvic floor strengthening. The importance of pelvic floor physical therapy should be stressed. Patients can benefit from the use of modalities such as biofeedback to learn appropriate pelvic floor muscle relaxation techniques during defecation.8 While there is limited published evidence supporting the use of pelvic floor physical therapy, our anecdotal experience suggests that patients can gain considerable benefit with such conservative therapy.
Surgical therapy
Surgical repair of Pouch of Douglas hernia requires obliteration of the deep cul-de-sac (to prevent the small bowel from filling this space) and simultaneous pelvic floor reconstruction of the vaginal apex and any other compartments that are prolapsing (if pelvic organ prolapse is present). In our experience, these patients typically have derived greatest benefit from an abdominal approach. This usually can be accomplished with a sacrocolpopexy (if vaginal vault prolapse exists) with a Moschowitz or Halban procedure,9 uterosacral ligament plication, or a modified sacrocolpopexy with mesh augmentation to the sidewalls of the pelvis.10 There are currently no studies supporting one particular approach over another, but the most important feature of a surgical intervention is obliteration of the cul-de-sac (FIGURES 3, 4, and 5).
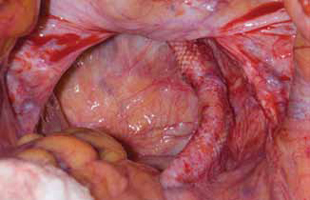
FIGURE 3: Open cul-de-sac. Open cul-de-sac after a prior abdominal sacrocolpopexy in a patient with a Pouch of Douglas hernia.

FIGURE 4: Obliterated cul-de-sac. Obliteration of the cul-de-sac with uterosacral ligament plication. Care is taken to prevent obstruction of the rectum at this level.
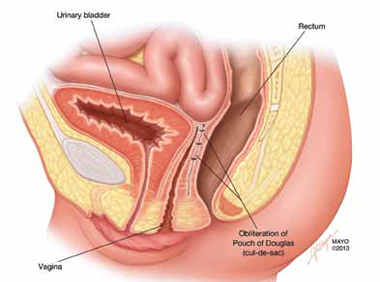
FIGURE 5: Cul-de-sac obliteration. Schematic diagram of obliteration of the cul-de-sac with uterosacral ligament plication sutures.
Final takeaways
Pouch of Douglas hernia is an important but often unrecognized cause of pelvic pressure and defecatory dysfunction. Perineal ballooning during maximal straining is highly suggestive of the diagnosis, with final diagnosis confirmed with various functional imaging studies of the pelvic floor. Management should include both conservative and surgical interventions to alleviate and prevent recurrence of symptoms.
ACKNOWLEDGMENT. The authors would like to thank Mr. John Hagen, Medical Illustrator, Mayo Clinic, for producing the illustrations in Figures 1 and 5.
We want to hear from you! Tell us what you think.
Urinary incontinence
Karen L. Noblett, MD, MAS, and Stephanie A. Jacobs, MD (Update, December 2012)
When and how to place an autologous rectus fascia
pubovaginal sling
Mickey Karram, MD, and Dani Zoorob, MD (Surgical Techniques, November 2012)
Pelvic floor dysfunction
Autumn L. Edenfield, MD, and Cindy L. Amundsen, MD (Update, October 2012)
Step by step: Obliterating the vaginal canal to correct pelvic organ prolapse
Mickey Karram, MD, and Janelle Evans, MD (Surgical Techniques, February 2012)
1. Samuelsson EC, Victor FT, Tibblin G, Svärdsudd KF. Signs of genital prolapse in a Swedish population of women 20 to 59 years of age and possible related factors. Am J Obstet Gynecol. 1999;180(2 Pt 1):299-305.
2. Boyles SH, Weber AM, Meyn L. Procedures for pelvic organ prolapse in the United States 1979-1997. Am J Obstet Gynecol. 2003;188(1):108-115.
3. Parks AG, Porter NH, Hardcastle J. The syndrome of the descending perineum. Proc R Soc Med. 1966;59(6):477-482.
4. Hardcastle JD. The descending perineum syndrome. Practitioner. 1969;203(217):612-619.
5. Maglinte DD, Bartram CI, Hale DA, et al. Functional imaging of the pelvic floor. Radiology. 2011;258(1):23-39.
6. Roos JE, Weishaupt D, Wildermuth S, Willmann JK, Marincek B, Hilfiker PR. Experience of 4 years with open MR defecography: pictorial review of anorectal anatomy and disease. Radiographics. 2002;22(4):817-832.
7. Fletcher JG, Busse RF, Riederer SJ, et al. Magnetic resonance imaging of anatomic and dynamic defects of the pelvic floor in defecatory disorders. Am J Gastroenterol. 2003;98(2):399-411.
8. Harewood GC, Coulie B, Camilleri M, Rath-Harvey D, Pemberton JH. Descending perineum syndrome: audit of clinical and laboratory features and outcome of pelvic floor retraining. Am J Gastroenterol. 1999;94(1):126-130.
9. Moschcowitz AV. The pathogenesis anatomy and cure of prolapse of the rectum. Surg Gyncol Obstetrics. 1912;15:7-21.
10. Gosselink MJ, van Dam JH, Huisman WM, Ginai AZ, Schouten WR. Treatment of enterocele by obliteration of the pelvic inlet. Dis Colon Rectum. 1999;42(7):940-944.

Shunaha Kim-Fine, MD
Dr. Kim-Fine is Fellow, Female Pelvic Medicine and Reconstructive Surgery, Division of Gynecologic Surgery, Mayo Clinic, Rochester, Minnesota.

John B. Gebhart, MD
Dr. Gebhart is Associate Professor and Fellowship Director, Female Pelvic Medicine and Reconstructive Surgery, Mayo Clinic.
The authors report no financial relationships relevant to this article.
Shunaha Kim-Fine, MD
Dr. Kim-Fine is Fellow, Female Pelvic Medicine and Reconstructive Surgery, Division of Gynecologic Surgery, Mayo Clinic, Rochester, Minnesota.
John B. Gebhart, MD
Dr. Gebhart is Associate Professor and Fellowship Director, Female Pelvic Medicine and Reconstructive Surgery, Mayo Clinic.
The authors report no financial relationships relevant to this article.
CASE: Pelvic organ prolapse or Pouch of Douglas hernia?
A 42-year-old G3P2 woman is referred to you by her primary care provider for pelvic organ prolapse. Her medical history reveals that she has been bothered by a sense of pelvic pressure and bulge progressing over several years, and she has noticed that her symptoms are particularly worse during and after bowel movements. She reports some improved bowel evacuation with external splinting of her perineum. Upon closer questioning, the patient reports a history of chronic constipation since childhood associated with straining and a sense of incomplete emptying. She reports spending up to 30 minutes three to four times per day on the commode to completely empty her bowels.
Physical examination reveals an overweight woman with a soft, nontender abdomen remarkable for laparoscopic incision scars from a previous tubal ligation. Inspection of the external genitalia at rest is normal. Cough stress test is negative. At maximum Valsalva, however, there is significant perineal ballooning present.
Speculum examination demonstrates grade 1 uterine prolapse, grade 1 cystocele, and grade 2 rectocele. There is no evidence of pelvic floor tension myalgia. She has weak pelvic muscle strength. Visualization of the anus at maximum Valsalva reveals there is some asymmetric rectal prolapse of the anterior rectal wall. Digital rectal exam is unremarkable.
Are these patient’s symptoms due to pelvic organ prolapse or Pouch of Douglas hernia?
Pelvic organ prolapse: A common problem
Pelvic organ prolapse has an estimated prevalence of 55% in women aged 50 to 59 years.1 More than 200,000 pelvic organ prolapse surgeries are performed annually in the United States.2 Typically, patients report:
- vaginal bulge causing discomfort
- pelvic pressure or heaviness, or
- rubbing of the vaginal bulge on undergarments.
In more advanced pelvic organ prolapse, patients may report voiding dysfunction or stool trapping that requires manual splinting of the prolapse to assist in bladder and bowel evacuation.
Pouch of Douglas hernia: A lesser-known
(recognized) phenomenon
Similar to pelvic organ prolapse, Pouch of Douglas hernia also can present with symptoms of:
- pelvic pressure
- vague perineal aching
- defecatory dysfunction.
The phenomenon has been variably referred to in the literature as enterocele, descending perineum syndrome, peritoneocele, or Pouch of Douglas hernia. The concept was first introduced in 19663 and describes descent of the entire pelvic floor and small bowel through a hernia in the Pouch of Douglas (FIGURE 1).
FIGURE 1: Pouch of Douglas hernia. The pelvic floor and small bowel descend into the Pouch of Douglas.
How does it occur? The pathophysiology is thought to be related to excessive abdominal straining in individuals with chronic constipation. This results in diminished pelvic floor muscle tone. Eventually, the whole pelvic floor descends, becoming funnel shaped due to stretching of the puborectalis muscle. Thus, stool is expelled by force, mostly through forces on the anterior rectal wall (which tends to prolapse after stool evacuation, with accompanied mucus secretion, soreness, and irritation).
Clinical pearl: Given the rectal wall prolapse that occurs after stool evacuation in Pouch of Douglas hernia, some patients will describe a rectal lump that bleeds after a bowel movement. The sensation of the rectal lump from the anterior rectal wall prolapse causes further straining.
Your patient reports pelvic pressure and bulge.
How do you proceed?
Physical examination
Look for perineal ballooning. Physical examination should start with inspection of the external genitalia. This inspection will identify any pelvic organ prolapse at or beyond the introitus. However, a Pouch of Douglas hernia will be missed if the patient is not examined during Valsalva or maximal strain. This maneuver will demonstrate the classic finding of perineal ballooning and is crucial to a final diagnosis of Pouch of Douglas hernia. Normally, the perineum will descend 1 cm to 2 cm during maximal strain; in Pouch of Douglas hernias, the perineum can descend up to 4 cm to 8 cm.4
Clinical pearl: It should be noted that, often, patients will not have a great deal of vaginal prolapse accompanying the perineal ballooning. In our opinion, this finding distinguishes Pouch of Douglas hernia from a vaginal vault prolapse caused by an enterocele.
Is rectal prolapse present? Beyond perineal ballooning, the presence of rectal prolapse should be evaluated. A rectocele of some degree is usually present. Asymmetric rectal prolapse affecting the anterior aspect of the rectal wall is consistent with a Pouch of Douglas hernia. This anatomic finding should be distinguished from true circumferential rectal prolapse, which remains in the differential diagnosis.
Basing the diagnosis of Pouch of Douglas hernia on physical examination alone can be difficult. Therefore, imaging studies are essential for accurate diagnosis.
Imaging investigations
Several imaging modalities can be used to diagnose such disorders of the pelvic floor as Pouch of Douglas hernia. These include:
- dynamic colpocystoproctography5
- defecography with oral barium6
- dynamic pelvic magnetic resonance imaging (MRI).7
In our experience, dynamic pelvic MRI has a high accuracy rate for diagnosing Pouch of Douglas hernia. FIGURE 2 illustrates the large Pouch of Douglas hernia filled with loops of small bowel. Perineal descent of the anorectal junction more than 3 cm below the pubococcygeal line during maximal straining is a diagnostic finding on imaging.7
FIGURE 2: MRI
Sagittal MRI during maximal Valsalva straining, demonstrating Pouch of Douglas hernia filled with small bowel.
What are your patient’s treatment options?
Reduce straining during bowel movements. The primary goal of treatment for Pouch of Douglas hernia should be relief of bothersome symptoms. Therefore, further damage can be prevented by eliminating straining during defecation. This can be accomplished with a bowel regimen that combines an irritant suppository (glycerin or bisacodyl) with a fiber supplement (the latter to increase bulk of the stool). Oral laxatives have limited use as many patients have lax anal sphincters and liquid stool could cause fecal incontinence.
Pelvic floor strengthening. The importance of pelvic floor physical therapy should be stressed. Patients can benefit from the use of modalities such as biofeedback to learn appropriate pelvic floor muscle relaxation techniques during defecation.8 While there is limited published evidence supporting the use of pelvic floor physical therapy, our anecdotal experience suggests that patients can gain considerable benefit with such conservative therapy.
Surgical therapy
Surgical repair of Pouch of Douglas hernia requires obliteration of the deep cul-de-sac (to prevent the small bowel from filling this space) and simultaneous pelvic floor reconstruction of the vaginal apex and any other compartments that are prolapsing (if pelvic organ prolapse is present). In our experience, these patients typically have derived greatest benefit from an abdominal approach. This usually can be accomplished with a sacrocolpopexy (if vaginal vault prolapse exists) with a Moschowitz or Halban procedure,9 uterosacral ligament plication, or a modified sacrocolpopexy with mesh augmentation to the sidewalls of the pelvis.10 There are currently no studies supporting one particular approach over another, but the most important feature of a surgical intervention is obliteration of the cul-de-sac (FIGURES 3, 4, and 5).
FIGURE 3: Open cul-de-sac. Open cul-de-sac after a prior abdominal sacrocolpopexy in a patient with a Pouch of Douglas hernia.
FIGURE 4: Obliterated cul-de-sac. Obliteration of the cul-de-sac with uterosacral ligament plication. Care is taken to prevent obstruction of the rectum at this level.
FIGURE 5: Cul-de-sac obliteration. Schematic diagram of obliteration of the cul-de-sac with uterosacral ligament plication sutures.
Final takeaways
Pouch of Douglas hernia is an important but often unrecognized cause of pelvic pressure and defecatory dysfunction. Perineal ballooning during maximal straining is highly suggestive of the diagnosis, with final diagnosis confirmed with various functional imaging studies of the pelvic floor. Management should include both conservative and surgical interventions to alleviate and prevent recurrence of symptoms.
ACKNOWLEDGMENT. The authors would like to thank Mr. John Hagen, Medical Illustrator, Mayo Clinic, for producing the illustrations in Figures 1 and 5.
We want to hear from you! Tell us what you think.
Urinary incontinence
Karen L. Noblett, MD, MAS, and Stephanie A. Jacobs, MD (Update, December 2012)
When and how to place an autologous rectus fascia
pubovaginal sling
Mickey Karram, MD, and Dani Zoorob, MD (Surgical Techniques, November 2012)
Pelvic floor dysfunction
Autumn L. Edenfield, MD, and Cindy L. Amundsen, MD (Update, October 2012)
Step by step: Obliterating the vaginal canal to correct pelvic organ prolapse
Mickey Karram, MD, and Janelle Evans, MD (Surgical Techniques, February 2012)
1. Samuelsson EC, Victor FT, Tibblin G, Svärdsudd KF. Signs of genital prolapse in a Swedish population of women 20 to 59 years of age and possible related factors. Am J Obstet Gynecol. 1999;180(2 Pt 1):299-305.
2. Boyles SH, Weber AM, Meyn L. Procedures for pelvic organ prolapse in the United States 1979-1997. Am J Obstet Gynecol. 2003;188(1):108-115.
3. Parks AG, Porter NH, Hardcastle J. The syndrome of the descending perineum. Proc R Soc Med. 1966;59(6):477-482.
4. Hardcastle JD. The descending perineum syndrome. Practitioner. 1969;203(217):612-619.
5. Maglinte DD, Bartram CI, Hale DA, et al. Functional imaging of the pelvic floor. Radiology. 2011;258(1):23-39.
6. Roos JE, Weishaupt D, Wildermuth S, Willmann JK, Marincek B, Hilfiker PR. Experience of 4 years with open MR defecography: pictorial review of anorectal anatomy and disease. Radiographics. 2002;22(4):817-832.
7. Fletcher JG, Busse RF, Riederer SJ, et al. Magnetic resonance imaging of anatomic and dynamic defects of the pelvic floor in defecatory disorders. Am J Gastroenterol. 2003;98(2):399-411.
8. Harewood GC, Coulie B, Camilleri M, Rath-Harvey D, Pemberton JH. Descending perineum syndrome: audit of clinical and laboratory features and outcome of pelvic floor retraining. Am J Gastroenterol. 1999;94(1):126-130.
9. Moschcowitz AV. The pathogenesis anatomy and cure of prolapse of the rectum. Surg Gyncol Obstetrics. 1912;15:7-21.
10. Gosselink MJ, van Dam JH, Huisman WM, Ginai AZ, Schouten WR. Treatment of enterocele by obliteration of the pelvic inlet. Dis Colon Rectum. 1999;42(7):940-944.
IN THIS ARTICLE
Clinical pearls at physical exam
Treatment options
Metabolic disturbance and dementia: A modifiable link
Discuss this article at www.facebook.com/CurrentPsychiatry
In addition to increasing patients’ risk for cardiovascular disease, stroke, and cancer, obesity and metabolic disturbance contribute to age-related cognitive decline and dementia. In particular, insulin resistance and hyperinsulinemia promote neurocognitive dysfunction and neurodegenerative changes during the extended, preclinical phase of Alzheimer’s disease (AD). However, with dietary modification it may be possible to resensitize insulin receptors, correct hyperinsulinemia, and improve memory function.
Metabolic disturbance and neurodegeneration
In the United States, 5.4 million people have AD, and there will be an estimated 16 million cases by 2050.1 Simultaneously we are experiencing an epidemic of metabolic disturbance and obesity. Approximately, 64% of adults in the United States are overweight (body mass index [BMI]: 25.0 to 29.9 kg/m2) and 34% are obese (BMI: ≥30 kg/m2).2 By 2030, 86% of adults will be overweight and 51% will be obese.3 This confluence of epidemics is not coincidental but instead reflects the fact that metabolic disturbance is a fundamental factor contributing to cognitive decline and neurodegeneration.4
Ninety-six percent of AD cases are classified as late onset, sporadic AD, occurring after age 64.1 Mild cognitive impairment (MCI) is a clinical construct that entails greater than expected memory impairment for the patient’s age and identifies older adults who are at increased risk for dementia. MCI represents the first clinical manifestation of neurodegeneration for a subset of patients who will progress to AD.5,6 MCI is distinguished from age-associated memory impairment (AAMI), which originally was conceptualized as normal or benign memory decline with aging.7,8 Recent data indicate that Alzheimer’s-type neuropathologic changes are the basis for subjective memory complaints and objectively assessed age-related cognitive decline,9 and early neurodegeneration is present in many patients with AAMI or MCI.10 This is consistent with the idea that an extended preclinical phase precedes AD onset. The preclinical phase can persist for a decade or more and precedes MCI and overt functional decline. However, neuropathologic changes accumulate during the preclinical phase of AD11 and during the preclinical phase of type 2 diabetes mellitus (T2DM).
Hyperinsulinemia and dementia
Insulin resistance and hyperinsulinemia occur in >40% of individuals age ≥60 and prevalence increases with age.4,12 Hyperinsulinemia develops to compensate for insulin resistance to overcome receptor insensitivity and maintain glucose homeostasis. Insulin receptors are densely expressed in brain regions vulnerable to neurodegeneration, including the medial temporal lobe and prefrontal cortex, which mediate long-term memory and working memory. However, insulin must be transported into the CNS from the periphery because little is synthesized in the brain. Paradoxically, peripheral compensatory hyperinsulinemia resulting from insulin resistance is associated with central (brain) hypoinsulinemia because of insensitivity and saturation of the receptor-mediated blood-brain barrier transport mechanism.13-15
Hyperinsulinemia is the precursor to T2DM. However, hyperinsulinemia is not well recognized in clinical contexts and generally is not a treatment target. Nonetheless, it contributes to several health problems, and insulin resistance in middle age is associated with age-related diseases such as hypertension, coronary artery disease, stroke, and cancer, while insulin sensitivity protects against such disorders.16
Chronic insulin resistance may contribute more to dementia development than T2DM because of the extended period of hyperinsulinemia that precedes T2DM onset. In population studies,17 insulin resistance syndrome increases risk for developing AD independent of apolipoprotein E (APOE e4) allele status, and in a longitudinal study,18 the risk for AD solely attributable to peripheral hyperinsulinemia was up to 39%. Being overweight in midlife increases risk for dementia in late life, and APOE e4 allele status does not contribute additional risk after accounting for BMI.19 Middle-aged individuals with hyperinsulinemia show memory decline, and obesity in middle age was associated with greater cognitive impairment after 6-year follow-up.20 Even in older adults who seem cognitively unimpaired, BMI and fasting insulin are positively correlated with atrophy in frontal, temporal, and subcortical brain regions, and obesity is an independent risk for atrophy in several brain regions, including the hippocampus.21
Compared with healthy older adults, individuals with AD have lower ratios of cerebrospinal fluid to plasma insulin.22 This lower ratio reflects the peripheral-to-central gradient of insulin levels in AD and suggests an etiological role for such metabolic disturbance. Insulin resistance has downstream effects that potentiate neurodegenerative factors, and central hypoinsulinemia can accelerate neurodegenerative processes and cognitive decline.4,23 Brain insulin plays a direct role in regulating proinflammatory cytokines and neurotrophic and neuroplastic factors essential for memory function. Insulin degrading enzyme, which varies with insulin levels,24 regulates the generation and clearance of amyloid β (Aβ) from the brain.25
Hyperinsulinemia typically is evident in increasing waist circumference and body weight.26 Waist circumference of ≥100 cm (39 inches) is a sensitive, specific, and independent predictor of hyperinsulinemia for men and women and a stronger predictor than BMI, waist-to-hip ratio, and other measures of body fat.27 Unpublished data derived from our clinical research with MCI subjects supports the association of metabolic disturbance with age-related cognitive decline. Our subjects are recruited from the community on the basis of mild memory decline and—other than excluding those with diabetes—weight and metabolic status are not considered in evaluating individuals for enrollment. The Table contains data on waist circumference and metabolic function in 122 older adults (age ≥68) with MCI. On average, these individuals exhibited fasting insulin values in the hyperinsulinemia range and elevated fasting glucose levels that indicated borderline diabetes. Waist circumference also was high, indicating excessive visceral fat deposition. We also observed a relationship between waist circumference and insulin, a consistent observation in older adults with memory decline. These data would not be surprising in any sample of older adults because of the population base rates for these conditions. However, we also found that waist circumference was a significant predictor of memory performance in patients with MCI. Abdominal adiposity is highly correlated with intrahepatic fat.28 Given this and recent indications that Alzheimer’s-type neuropathologic factors are generated in the liver,29,30 the predictive value of waist circumference to memory performance may reflect the fact that it is a proxy for downstream actions of liver fat.
Table
Waist circumference and metabolic factors in 122 older adults with MCIa
| Metabolic indicator | Value |
|---|---|
| Mean (SD) fasting glucose, mg/dL | 99.5 (11.2) |
| Mean (SD) fasting insulin, μIU/mL | 15.2 (8.1) |
| Mean (SD) waist, cm | 96.4 (13.3) |
| Waist-insulin correlation | r=0.51, P < .001 |
| aOlder adult patients (age ≥68) with subjective memory complaints were recruited from the community and screened with instruments assessing everyday functioning and objective memory performance to establish the presence of MCI MCI: mild cognitive impairment; SD: standard deviation | |
Dietary interventions
There is no cure for dementia, and it is not clear when effective therapy might be developed. Prevention and risk mitigation represent the best means of reducing the impact of this public health problem. Researchers have proposed that interventions initiated when individuals have predementia conditions such as AAMI and MCI might stall progression of cognitive decline, and MCI may be the last point when interventions might be effective because of the self-reinforcing neuropathologic cascades of AD.31 Because central hypoinsulinemia may promote central inflammation, Aβ generation, and reduced neuroplasticity, approaches aimed at improving metabolic function (and in particular correcting hyperinsulinemia) could influence fundamental neurodegenerative processes. Dietary approaches to preventing dementia are effective, low-risk, yet underutilized interventions. Reducing insulin by restricting calories32 or maintaining a ketogenic diet33 has been associated with improved memory function in middle-aged and older adults.
Carbohydrate consumption is the principal determinant of insulin secretion. Eliminating high-glycemic foods, including processed carbohydrates and sweets, would sensitize insulin receptors and correct hyperinsulinemia. In addition, replacing high glycemic foods with fruits and vegetables would increase polyphenol intake. Epidemiologic evidence supports the idea that greater consumption of polyphenol-containing vegetables and fruits mitigates risk for neurocognitive decline and dementia.34,35 Preclinical evidence suggests that such protection may be related to neuronal signaling effects and anti- inflammatory and antioxidant actions.36 In addition, certain polyphenol compounds, such as those found in berries, enhance metabolic function.37,38 In a 12-week pilot trial, older adults with early memory changes (N=9, mean age 76) who drank supplemental blueberry juice showed enhanced memory and improved metabolic parameters.39
Dietary changes that preserve insulin receptor sensitivity can help ensure general health with aging and substantially mitigate risk for neurodegeneration. The Western diet is particularly insulinogenic and dietary habits are difficult to change. However, the substantial benefits, absence of adverse effects, and low cost make dietary intervention the optimal means of protecting against neurodegeneration and other age-related diseases. Embarking on such a program early in life would be best, although late-life intervention can be effective.
Related Resources
- Craft S, Watson GS. Insulin and neurodegenerative disease: shared and specific mechanisms. Lancet Neurol. 2004;3(3):169-178.
- Luchsinger JA, Tang MX, Shea S, et al. Hyperinsulinemia and risk of Alzheimer’s disease. Neurology. 2004; 63(7):1187-1192.
- Krikorian R, Shidler MD, Dangelo K, et al. Dietary ketosis enhances memory in mild cognitive impairment. Neurbiol Aging. 2012;33(2):425.e19-e27.
Disclosure
Dr. Krikorian receives grant support from the National Institutes of Health, 1R01AG034617-01.
1. Alzheimer’s Association; Thies W, Bleiler L. 2011 Alzheimer’s disease facts and figures. Alzheimers Dement. 2011;7(2):208-244.
2. Flegal KM, Carroll MD, Ogden CL, et al. Prevalence and trends in obesity among US adults, 1999-2008. JAMA. 2010;303(3):235-241.
3. Wang Y, Beydoun MA, Liang L, et al. Will all Americans become overweight or obese? Estimating the progression and cost of the US obesity epidemic. Obesity (Silver Spring). 2008;16(10):2323-2330.
4. Craft S. Insulin resistance syndrome and Alzheimer’s disease: age- and obesity-related effect on memory amyloid, and inflammation. Neurobiol Aging. 2005;26(suppl 1):S65-S69.
5. Mitchell AJ, Shiri-Feshki M. Rate of progression of mild cognitive impairment to dementia – meta-analysis of 41 robust inception cohort studies. Acta Psychiat Scand. 2009;119(4):252-265.
6. Petersen RC. Mild cognitive impairment as a diagnostic entity. J Intern Med. 2004;256(3):183-194.
7. Crook TH, Bartus RT, Ferris SH, et al. Age-associated memory impairment: proposed diagnostic criteria and measures of clinical change—report of a National Institute of Mental Health work group. Dev Neuropsychol. 1986;2(4):261-276.
8. Neilsen H, Lolk A, Kragh-Sørensen P. Age-associated memory impairment–pathological memory decline or normal aging? Scand J Psychol. 1998;39(1):33-37.
9. Wilson RS, Leurgans SE, Boyle PA, et al. Neurodegenerative basis of age related cognitive decline. Neurology. 2010;75(12):1070-1078.
10. Saykin AJ, Wishart HA, Rabin LA, et al. Older adults with cognitive complaints show brain atrophy similar to that of amnestic MCI. Neurology. 2006;67(5):834-842.
11. Sperling RA, Aisen PS, Beckett LA, et al. Toward defining the preclinical stages of Alzheimer’s disease: recommendations from the National Institute on Aging-Alzheimer’s Association workgroups on diagnostic guidelines for Alzheimer’s disease. Alzheimers Dement. 2011;7(3):280-292.
12. Ford ES, Giles WH, Dietz WH. Prevalence of the metabolic syndrome among US adults: findings from the third National Health and Nutrition Examination Survey. JAMA. 2002;287(3):356-359.
13. Baura GD, Foster DM, Kaiyala K, et al. Insulin transport from plasma into the central nervous system is inhibited by dexamethasone in dogs. Diabetes. 1996;45(1):86-90.
14. Wallum BJ, Taborsky GJ, Jr, Porte D Jr, et al. Cerebrospinal fluid insulin levels increase during intravenous insulin infusions in man. J Clin Endocr Metab. 1987;64(1):190-194.
15. Woods SC, Seeley RJ, Baskin DG, et al. Insulin and the blood-brain barrier. Curr Pharm Des. 2003;9(10):795-800.
16. Facchini FS, Hua N, Abbasi F, et al. Insulin resistance as a predictor of age-related diseases. J Clin Endocrinol Metab. 2001;86(8):3574-3578.
17. Kuusisto J, Koivisto K, Mykkänen L, et al. Association between features of the insulin resistance syndrome and Alzheimer’s disease independently of apolipoprotein E4 phenotype. BMJ. 1997;315(7115):1045-1049.
18. Luchsinger JA, Tang MX, Shea S, et al. Hyperinsulinemia and risk of Alzheimer’s disease. Neurology. 2004;63(7):1187-1192.
19. Hassing LB, Dahl AK, Thorvaldsson V, et al. Overweight in midlife and risk of dementia: a 40-year follow up study. Int J Obesity (Lond). 2009;33(8):893-898.
20. Young SE, Mainous AG 3rd, Carnemolla M. Hyperinsulinemia and cognitive decline in a middle-aged cohort. Diabetes Care. 2006;29(12):2688-2693.
21. Raji CA, Ho AJ, Parikshak NN, et al. Brain structure and obesity. Hum Brain Mapp. 2009;31(3):353-364.
22. Craft S, Peskind E, Schwartz MW, et al. Cerebrospinal fluid and plasma insulin levels in Alzheimer’s disease. Neurology. 1998;50(1):164-168.
23. Craft S, Asthana S, Cook DG, et al. Insulin dose-response effects on memory and plasma amyloid precursor protein in Alzheimer’s disease: interactions with apolipoprotein E genotype. Psychoneuroendocrinology. 2003;28(6):809-822.
24. Zhao L, Teter B, Morihara T, et al. Insulin-degrading enzyme as a downstream target of insulin receptor signaling cascade: implications for Alzheimer’s disease intervention. J Neurosci. 2004;24(49):11120-11126.
25. Farris W, Mansourian S, Chang Y, et al. Insulin-degrading enzyme regulates the levels of insulin, amyloid β-protein, and the β-amyloid precursor protein intracellular domain in vivo. Proc Natl Acad Sci U S A. 2003;100(7):4162-4167.
26. Tabata S, Yoshimitsu S, Hamachi T, et al. Waist circumference and insulin resistance: a cross-sectional study of Japanese men. BMC Endocr Disord. 2009;9:1.-doi: 10.1186/1472-6823-9-1.
27. Wahrenberg H, Hertel K, Leijonhufvud B, et al. Use of waist circumference to predict insulin resistance: retrospective study. BMJ. 2005;330(7504):1363-1364.
28. Jang S, Lee CH, Choi KM, et al. Correlation of fatty liver and abdominal fat distribution using a simple fat computed tomography protocol. World J Gastroenterol. 2011;17(28):3335-3341.
29. Sutcliffe JG, Hedlund PB, Thomas EA, et al. Peripheral reduction of ß-amyloid is sufficient to reduce brain ß-amyloid: implications for Alzheimer’s disease. J Neurosci Res. 2011;89(6):808-814.
30. Marques MA, Kulstad JJ, Savard CE, et al. Peripheral amyloid-β levels regulate amyloid-β clearance from the central nervous system. J Alzheimers Dis. 2009;16(2):325-329.
31. Cotman CW. Homeostatic processes in brain aging: the role of apoptosis inflammation, and oxidative stress in regulating healthy neural circuitry in the aging brain. In: Stern P, Carstensen L, eds. The aging mind: opportunities in cognitive research. Washington, DC: National Academy Press; 2000:114–143.
32. Witte AV, Fobker M, Gellner R, et al. Caloric restriction improves memory in elderly humans. Proc Natl Acad Sci U S A. 2009;106(4):1255-1260.
33. Krikorian R, Shidler MD, Dangelo K, et al. Dietary ketosis enhances memory in mild cognitive impairment. Neurbiol Aging. 2012;33(2):425.e19-e27.
34. Letenneur L, Proust-Lima C, Le Gouge A, et al. Flavonoid intake and cognitive decline over a 10-year period. Am J Epidemiol. 2007;165(2):1364-1371.
35. Solfrizzi V, Panza F, Capurso A. The role of diet in cognitive decline. J Neural Transm. 2003;110(3):95-110.
36. Williams CM, El Mohsen MA, Vauzour D, et al. Blueberry-induced changes in spatial working memory correlate with changes in hippocampal CREB phosphorylation and brain-derived neurotrophic factor (BDNF) levels. Free Radical Bio Med. 2008;45(3):295-305.
37. Martineau LC, Couture A, Spoor D, et al. Anti-diabetic properties of the Canadian lowbush blueberry Vaccinium angustifolium Ait. Phytomedicine. 2006;13(9-10):612-623.
38. Tsuda T. Regulation of adipocyte function by anthocyanins; possibility of preventing the metabolic syndrome. J Agr Food Chem. 2008;56(3):642-646.
39. Krikorian R, Shidler MD, Nash TA, et al. Blueberry supplementation improves memory in older adults. J Agric Food Chem. 2010;58(7):3996-4000.

Robert Krikorian, PhD
Professor, Department of Psychiatry and Behavioral Neuroscience, University of Cincinnati Academic Health Center, Cincinnati, OH
Robert Krikorian, PhD
Professor, Department of Psychiatry and Behavioral Neuroscience, University of Cincinnati Academic Health Center, Cincinnati, OH
Robert Krikorian, PhD
Professor, Department of Psychiatry and Behavioral Neuroscience, University of Cincinnati Academic Health Center, Cincinnati, OH
Discuss this article at www.facebook.com/CurrentPsychiatry
In addition to increasing patients’ risk for cardiovascular disease, stroke, and cancer, obesity and metabolic disturbance contribute to age-related cognitive decline and dementia. In particular, insulin resistance and hyperinsulinemia promote neurocognitive dysfunction and neurodegenerative changes during the extended, preclinical phase of Alzheimer’s disease (AD). However, with dietary modification it may be possible to resensitize insulin receptors, correct hyperinsulinemia, and improve memory function.
Metabolic disturbance and neurodegeneration
In the United States, 5.4 million people have AD, and there will be an estimated 16 million cases by 2050.1 Simultaneously we are experiencing an epidemic of metabolic disturbance and obesity. Approximately, 64% of adults in the United States are overweight (body mass index [BMI]: 25.0 to 29.9 kg/m2) and 34% are obese (BMI: ≥30 kg/m2).2 By 2030, 86% of adults will be overweight and 51% will be obese.3 This confluence of epidemics is not coincidental but instead reflects the fact that metabolic disturbance is a fundamental factor contributing to cognitive decline and neurodegeneration.4
Ninety-six percent of AD cases are classified as late onset, sporadic AD, occurring after age 64.1 Mild cognitive impairment (MCI) is a clinical construct that entails greater than expected memory impairment for the patient’s age and identifies older adults who are at increased risk for dementia. MCI represents the first clinical manifestation of neurodegeneration for a subset of patients who will progress to AD.5,6 MCI is distinguished from age-associated memory impairment (AAMI), which originally was conceptualized as normal or benign memory decline with aging.7,8 Recent data indicate that Alzheimer’s-type neuropathologic changes are the basis for subjective memory complaints and objectively assessed age-related cognitive decline,9 and early neurodegeneration is present in many patients with AAMI or MCI.10 This is consistent with the idea that an extended preclinical phase precedes AD onset. The preclinical phase can persist for a decade or more and precedes MCI and overt functional decline. However, neuropathologic changes accumulate during the preclinical phase of AD11 and during the preclinical phase of type 2 diabetes mellitus (T2DM).
Hyperinsulinemia and dementia
Insulin resistance and hyperinsulinemia occur in >40% of individuals age ≥60 and prevalence increases with age.4,12 Hyperinsulinemia develops to compensate for insulin resistance to overcome receptor insensitivity and maintain glucose homeostasis. Insulin receptors are densely expressed in brain regions vulnerable to neurodegeneration, including the medial temporal lobe and prefrontal cortex, which mediate long-term memory and working memory. However, insulin must be transported into the CNS from the periphery because little is synthesized in the brain. Paradoxically, peripheral compensatory hyperinsulinemia resulting from insulin resistance is associated with central (brain) hypoinsulinemia because of insensitivity and saturation of the receptor-mediated blood-brain barrier transport mechanism.13-15
Hyperinsulinemia is the precursor to T2DM. However, hyperinsulinemia is not well recognized in clinical contexts and generally is not a treatment target. Nonetheless, it contributes to several health problems, and insulin resistance in middle age is associated with age-related diseases such as hypertension, coronary artery disease, stroke, and cancer, while insulin sensitivity protects against such disorders.16
Chronic insulin resistance may contribute more to dementia development than T2DM because of the extended period of hyperinsulinemia that precedes T2DM onset. In population studies,17 insulin resistance syndrome increases risk for developing AD independent of apolipoprotein E (APOE e4) allele status, and in a longitudinal study,18 the risk for AD solely attributable to peripheral hyperinsulinemia was up to 39%. Being overweight in midlife increases risk for dementia in late life, and APOE e4 allele status does not contribute additional risk after accounting for BMI.19 Middle-aged individuals with hyperinsulinemia show memory decline, and obesity in middle age was associated with greater cognitive impairment after 6-year follow-up.20 Even in older adults who seem cognitively unimpaired, BMI and fasting insulin are positively correlated with atrophy in frontal, temporal, and subcortical brain regions, and obesity is an independent risk for atrophy in several brain regions, including the hippocampus.21
Compared with healthy older adults, individuals with AD have lower ratios of cerebrospinal fluid to plasma insulin.22 This lower ratio reflects the peripheral-to-central gradient of insulin levels in AD and suggests an etiological role for such metabolic disturbance. Insulin resistance has downstream effects that potentiate neurodegenerative factors, and central hypoinsulinemia can accelerate neurodegenerative processes and cognitive decline.4,23 Brain insulin plays a direct role in regulating proinflammatory cytokines and neurotrophic and neuroplastic factors essential for memory function. Insulin degrading enzyme, which varies with insulin levels,24 regulates the generation and clearance of amyloid β (Aβ) from the brain.25
Hyperinsulinemia typically is evident in increasing waist circumference and body weight.26 Waist circumference of ≥100 cm (39 inches) is a sensitive, specific, and independent predictor of hyperinsulinemia for men and women and a stronger predictor than BMI, waist-to-hip ratio, and other measures of body fat.27 Unpublished data derived from our clinical research with MCI subjects supports the association of metabolic disturbance with age-related cognitive decline. Our subjects are recruited from the community on the basis of mild memory decline and—other than excluding those with diabetes—weight and metabolic status are not considered in evaluating individuals for enrollment. The Table contains data on waist circumference and metabolic function in 122 older adults (age ≥68) with MCI. On average, these individuals exhibited fasting insulin values in the hyperinsulinemia range and elevated fasting glucose levels that indicated borderline diabetes. Waist circumference also was high, indicating excessive visceral fat deposition. We also observed a relationship between waist circumference and insulin, a consistent observation in older adults with memory decline. These data would not be surprising in any sample of older adults because of the population base rates for these conditions. However, we also found that waist circumference was a significant predictor of memory performance in patients with MCI. Abdominal adiposity is highly correlated with intrahepatic fat.28 Given this and recent indications that Alzheimer’s-type neuropathologic factors are generated in the liver,29,30 the predictive value of waist circumference to memory performance may reflect the fact that it is a proxy for downstream actions of liver fat.
Table
Waist circumference and metabolic factors in 122 older adults with MCIa
| Metabolic indicator | Value |
|---|---|
| Mean (SD) fasting glucose, mg/dL | 99.5 (11.2) |
| Mean (SD) fasting insulin, μIU/mL | 15.2 (8.1) |
| Mean (SD) waist, cm | 96.4 (13.3) |
| Waist-insulin correlation | r=0.51, P < .001 |
| aOlder adult patients (age ≥68) with subjective memory complaints were recruited from the community and screened with instruments assessing everyday functioning and objective memory performance to establish the presence of MCI MCI: mild cognitive impairment; SD: standard deviation | |
Dietary interventions
There is no cure for dementia, and it is not clear when effective therapy might be developed. Prevention and risk mitigation represent the best means of reducing the impact of this public health problem. Researchers have proposed that interventions initiated when individuals have predementia conditions such as AAMI and MCI might stall progression of cognitive decline, and MCI may be the last point when interventions might be effective because of the self-reinforcing neuropathologic cascades of AD.31 Because central hypoinsulinemia may promote central inflammation, Aβ generation, and reduced neuroplasticity, approaches aimed at improving metabolic function (and in particular correcting hyperinsulinemia) could influence fundamental neurodegenerative processes. Dietary approaches to preventing dementia are effective, low-risk, yet underutilized interventions. Reducing insulin by restricting calories32 or maintaining a ketogenic diet33 has been associated with improved memory function in middle-aged and older adults.
Carbohydrate consumption is the principal determinant of insulin secretion. Eliminating high-glycemic foods, including processed carbohydrates and sweets, would sensitize insulin receptors and correct hyperinsulinemia. In addition, replacing high glycemic foods with fruits and vegetables would increase polyphenol intake. Epidemiologic evidence supports the idea that greater consumption of polyphenol-containing vegetables and fruits mitigates risk for neurocognitive decline and dementia.34,35 Preclinical evidence suggests that such protection may be related to neuronal signaling effects and anti- inflammatory and antioxidant actions.36 In addition, certain polyphenol compounds, such as those found in berries, enhance metabolic function.37,38 In a 12-week pilot trial, older adults with early memory changes (N=9, mean age 76) who drank supplemental blueberry juice showed enhanced memory and improved metabolic parameters.39
Dietary changes that preserve insulin receptor sensitivity can help ensure general health with aging and substantially mitigate risk for neurodegeneration. The Western diet is particularly insulinogenic and dietary habits are difficult to change. However, the substantial benefits, absence of adverse effects, and low cost make dietary intervention the optimal means of protecting against neurodegeneration and other age-related diseases. Embarking on such a program early in life would be best, although late-life intervention can be effective.
Related Resources
- Craft S, Watson GS. Insulin and neurodegenerative disease: shared and specific mechanisms. Lancet Neurol. 2004;3(3):169-178.
- Luchsinger JA, Tang MX, Shea S, et al. Hyperinsulinemia and risk of Alzheimer’s disease. Neurology. 2004; 63(7):1187-1192.
- Krikorian R, Shidler MD, Dangelo K, et al. Dietary ketosis enhances memory in mild cognitive impairment. Neurbiol Aging. 2012;33(2):425.e19-e27.
Disclosure
Dr. Krikorian receives grant support from the National Institutes of Health, 1R01AG034617-01.
1. Alzheimer’s Association; Thies W, Bleiler L. 2011 Alzheimer’s disease facts and figures. Alzheimers Dement. 2011;7(2):208-244.
2. Flegal KM, Carroll MD, Ogden CL, et al. Prevalence and trends in obesity among US adults, 1999-2008. JAMA. 2010;303(3):235-241.
3. Wang Y, Beydoun MA, Liang L, et al. Will all Americans become overweight or obese? Estimating the progression and cost of the US obesity epidemic. Obesity (Silver Spring). 2008;16(10):2323-2330.
4. Craft S. Insulin resistance syndrome and Alzheimer’s disease: age- and obesity-related effect on memory amyloid, and inflammation. Neurobiol Aging. 2005;26(suppl 1):S65-S69.
5. Mitchell AJ, Shiri-Feshki M. Rate of progression of mild cognitive impairment to dementia – meta-analysis of 41 robust inception cohort studies. Acta Psychiat Scand. 2009;119(4):252-265.
6. Petersen RC. Mild cognitive impairment as a diagnostic entity. J Intern Med. 2004;256(3):183-194.
7. Crook TH, Bartus RT, Ferris SH, et al. Age-associated memory impairment: proposed diagnostic criteria and measures of clinical change—report of a National Institute of Mental Health work group. Dev Neuropsychol. 1986;2(4):261-276.
8. Neilsen H, Lolk A, Kragh-Sørensen P. Age-associated memory impairment–pathological memory decline or normal aging? Scand J Psychol. 1998;39(1):33-37.
9. Wilson RS, Leurgans SE, Boyle PA, et al. Neurodegenerative basis of age related cognitive decline. Neurology. 2010;75(12):1070-1078.
10. Saykin AJ, Wishart HA, Rabin LA, et al. Older adults with cognitive complaints show brain atrophy similar to that of amnestic MCI. Neurology. 2006;67(5):834-842.
11. Sperling RA, Aisen PS, Beckett LA, et al. Toward defining the preclinical stages of Alzheimer’s disease: recommendations from the National Institute on Aging-Alzheimer’s Association workgroups on diagnostic guidelines for Alzheimer’s disease. Alzheimers Dement. 2011;7(3):280-292.
12. Ford ES, Giles WH, Dietz WH. Prevalence of the metabolic syndrome among US adults: findings from the third National Health and Nutrition Examination Survey. JAMA. 2002;287(3):356-359.
13. Baura GD, Foster DM, Kaiyala K, et al. Insulin transport from plasma into the central nervous system is inhibited by dexamethasone in dogs. Diabetes. 1996;45(1):86-90.
14. Wallum BJ, Taborsky GJ, Jr, Porte D Jr, et al. Cerebrospinal fluid insulin levels increase during intravenous insulin infusions in man. J Clin Endocr Metab. 1987;64(1):190-194.
15. Woods SC, Seeley RJ, Baskin DG, et al. Insulin and the blood-brain barrier. Curr Pharm Des. 2003;9(10):795-800.
16. Facchini FS, Hua N, Abbasi F, et al. Insulin resistance as a predictor of age-related diseases. J Clin Endocrinol Metab. 2001;86(8):3574-3578.
17. Kuusisto J, Koivisto K, Mykkänen L, et al. Association between features of the insulin resistance syndrome and Alzheimer’s disease independently of apolipoprotein E4 phenotype. BMJ. 1997;315(7115):1045-1049.
18. Luchsinger JA, Tang MX, Shea S, et al. Hyperinsulinemia and risk of Alzheimer’s disease. Neurology. 2004;63(7):1187-1192.
19. Hassing LB, Dahl AK, Thorvaldsson V, et al. Overweight in midlife and risk of dementia: a 40-year follow up study. Int J Obesity (Lond). 2009;33(8):893-898.
20. Young SE, Mainous AG 3rd, Carnemolla M. Hyperinsulinemia and cognitive decline in a middle-aged cohort. Diabetes Care. 2006;29(12):2688-2693.
21. Raji CA, Ho AJ, Parikshak NN, et al. Brain structure and obesity. Hum Brain Mapp. 2009;31(3):353-364.
22. Craft S, Peskind E, Schwartz MW, et al. Cerebrospinal fluid and plasma insulin levels in Alzheimer’s disease. Neurology. 1998;50(1):164-168.
23. Craft S, Asthana S, Cook DG, et al. Insulin dose-response effects on memory and plasma amyloid precursor protein in Alzheimer’s disease: interactions with apolipoprotein E genotype. Psychoneuroendocrinology. 2003;28(6):809-822.
24. Zhao L, Teter B, Morihara T, et al. Insulin-degrading enzyme as a downstream target of insulin receptor signaling cascade: implications for Alzheimer’s disease intervention. J Neurosci. 2004;24(49):11120-11126.
25. Farris W, Mansourian S, Chang Y, et al. Insulin-degrading enzyme regulates the levels of insulin, amyloid β-protein, and the β-amyloid precursor protein intracellular domain in vivo. Proc Natl Acad Sci U S A. 2003;100(7):4162-4167.
26. Tabata S, Yoshimitsu S, Hamachi T, et al. Waist circumference and insulin resistance: a cross-sectional study of Japanese men. BMC Endocr Disord. 2009;9:1.-doi: 10.1186/1472-6823-9-1.
27. Wahrenberg H, Hertel K, Leijonhufvud B, et al. Use of waist circumference to predict insulin resistance: retrospective study. BMJ. 2005;330(7504):1363-1364.
28. Jang S, Lee CH, Choi KM, et al. Correlation of fatty liver and abdominal fat distribution using a simple fat computed tomography protocol. World J Gastroenterol. 2011;17(28):3335-3341.
29. Sutcliffe JG, Hedlund PB, Thomas EA, et al. Peripheral reduction of ß-amyloid is sufficient to reduce brain ß-amyloid: implications for Alzheimer’s disease. J Neurosci Res. 2011;89(6):808-814.
30. Marques MA, Kulstad JJ, Savard CE, et al. Peripheral amyloid-β levels regulate amyloid-β clearance from the central nervous system. J Alzheimers Dis. 2009;16(2):325-329.
31. Cotman CW. Homeostatic processes in brain aging: the role of apoptosis inflammation, and oxidative stress in regulating healthy neural circuitry in the aging brain. In: Stern P, Carstensen L, eds. The aging mind: opportunities in cognitive research. Washington, DC: National Academy Press; 2000:114–143.
32. Witte AV, Fobker M, Gellner R, et al. Caloric restriction improves memory in elderly humans. Proc Natl Acad Sci U S A. 2009;106(4):1255-1260.
33. Krikorian R, Shidler MD, Dangelo K, et al. Dietary ketosis enhances memory in mild cognitive impairment. Neurbiol Aging. 2012;33(2):425.e19-e27.
34. Letenneur L, Proust-Lima C, Le Gouge A, et al. Flavonoid intake and cognitive decline over a 10-year period. Am J Epidemiol. 2007;165(2):1364-1371.
35. Solfrizzi V, Panza F, Capurso A. The role of diet in cognitive decline. J Neural Transm. 2003;110(3):95-110.
36. Williams CM, El Mohsen MA, Vauzour D, et al. Blueberry-induced changes in spatial working memory correlate with changes in hippocampal CREB phosphorylation and brain-derived neurotrophic factor (BDNF) levels. Free Radical Bio Med. 2008;45(3):295-305.
37. Martineau LC, Couture A, Spoor D, et al. Anti-diabetic properties of the Canadian lowbush blueberry Vaccinium angustifolium Ait. Phytomedicine. 2006;13(9-10):612-623.
38. Tsuda T. Regulation of adipocyte function by anthocyanins; possibility of preventing the metabolic syndrome. J Agr Food Chem. 2008;56(3):642-646.
39. Krikorian R, Shidler MD, Nash TA, et al. Blueberry supplementation improves memory in older adults. J Agric Food Chem. 2010;58(7):3996-4000.
Can topiramate reduce nightmares in posttraumatic stress disorder?
Re-experiencing a previous life-threatening stress through nightmares or recurrent memories is a hallmark of posttraumatic stress disorder (PTSD). In the United States, the lifetime risk of PTSD is 10.1% and the 12-month prevalence is 3.7%.1 The selective serotonin reuptake inhibitors (SSRIs) sertraline and paroxetine are FDA-approved for treating PTSD; clinicians commonly use any SSRI for this disorder. Although SSRIs can alleviate many PTSD symptoms, at times patients experience only a partial response, which necessitates other interventions.
Rationale for using topiramate
The anticonvulsant topiramate blocks voltage-sensitive sodium channels, augments γ-aminobutyric acid type A, antagonizes the glutamate receptor, and inhibits carbonic anhydrase. Researchers have hypothesized that limbic nuclei become sensitized and “kindled” after exposure to a traumatic event. Anticonvulsants such as topiramate may help mitigate stress-activated kindling in PTSD.2,3
What does the evidence say?
Although less compelling than double-blind, placebo-controlled trials, small open-label studies and some case reports indicate a potential role for topiramate in PTSD for specific populations.4,5 In an 8-week open- label study, Alderman et al6 found adjunctive topiramate led to a statistically significant reduction in Clinician-Administered PTSD Scale (CAPS) scores and nightmares in 43 male veterans with combat-related PTSD. There was a nonsignificant decrease in high-risk alcohol use.
In a 2002 retrospective case series, Berlant et al7 found topiramate as monotherapy or adjunctive therapy reduced nightmares in 35 patients with chronic, non-combat PTSD. Nightmares decreased in 79% of patients and flashbacks decreased in 86%, with symptom improvement in a median of 4 days. Limitations of this study included lack of placebo control, a low number of participants, and a high dropout rate (9/35).
Two years later, Berlant8 used the PTSD Checklist-Civilian version (PCL-C) to assess response to topiramate in an open-label study of 33 patients with chronic, non-hallucinatory PTSD. Twenty-eight patients used topiramate as add-on therapy. PCL-C scores decreased by ≥30% in 77% of patients in 4 weeks, with a median dose of 50 mg/d and a median response time of 9 days.
In a double-blind, placebo-controlled trial, Tucker et al9 assessed 38 civilian patients who took topiramate monotherapy for PTSD. Using the CAPS, researchers concluded that topiramate reduced re-experiencing symptoms, but the effect was not statistically significant.9
Lindley et al10 conducted a randomized, double-blind, placebo-controlled trial to study the effect of add-on topiramate in 40 patients with chronic, combat-related PTSD. Because many patients in this study had a history of depression and substance use disorders, topiramate was added to antidepressants; no anticonvulsants, antipsychotics, or benzodiazepines were used. Similar to previous studies, researchers found no statistically significant effect on PTSD symptom severity or global symptom improvement. However, the small number of participants and a high dropout rate limited this study.10
In a 12-week, double-blind, placebo-controlled study of 35 men and women age 18 to 62 with PTSD, Yeh et al11 found that topiramate (mean dose: 102.94 mg/d) lead to a statistically significant overall CAPS score reduction, with significant improvements in re-experiencing symptoms, such as nightmares.
Our opinion
FDA-approved treatments such as SSRIs should be the first pharmacologic intervention for PTSD. If a patient’s response is partial or inadequate, consider additional treatment options. For patients with persistent re-experiencing symptoms, evidence and experience with prazosin and trazodone are more robust than that for topiramate.12
Using topiramate to reduce re-experiencing symptoms such as nightmares in PTSD is not supported by statistically significant evidence from double-blind, placebo- controlled trials. However, numerous open-label studies and case reports suggest that there may be a role for topiramate in PTSD patients who do not respond to other treatments. Data indicate that topiramate may be helpful for PTSD patients who have high-risk alcohol use6 or migraine headaches.13 Because some patients who take topiramate lose weight, the medication may be useful for PTSD patients who are overweight.13
Disclosure
The authors report no financial relationship with any company whose products are mentioned in this article or with manufacturers of competing products.
Related Resource
- U.S. Department of Veterans Affairs. Nightmares and PTSD. www.ptsd.va.gov/public/pages/nightmares.asp.
Drug Brand Names
- Paroxetine • Paxil
- Sertraline • Zoloft
- Prazosin • Minipress
- Topiramate • Topamax
- Trazodone • Desyrel, Oleptro
1. Kessler RC, Petukhova M, Sampson NA, et al. Twelve-month and lifetime prevalence and lifetime morbid risk of anxiety and mood disorders in the United States. Int J Methods Psychiatr Res. 2012;21(3):169-184.
2. Berlin HA. Antiepileptic drugs for the treatment of post-traumatic stress disorder. Curr Psychiatry Rep. 2007;9(4):291-300.
3. Khan S, Liberzon I. Topiramate attenuates exaggerated acoustic startle in an animal model of PTSD. Psychopharmacology (Berl). 2004;172(2):225-229.
4. Berlant JL. Topiramate in posttraumatic stress disorder: preliminary clinical observations. J Clin Psychiatry. 2001;62(suppl 17):60-63.
5. Tucker P, Masters B, Nawar O. Topiramate in the treatment of comorbid night eating syndrome and PTSD: a case study. Eat Disord. 2004;12(1):75-78.
6. Alderman CP, McCarthy LC, Condon JT, et al. Topiramate in combat-related posttraumatic stress disorder. Ann Pharmacother. 2009;43(4):635-641.
7. Berlant J, van Kammen DP. Open-label topiramate as primary or adjunctive therapy in chronic civilian posttraumatic stress disorder: a preliminary report. J Clin Psychiatry. 2002;63(1):15-20.
8. Berlant JL. Prospective open-label study of add-on and monotherapy topiramate in civilians with chronic nonhallucinatory posttraumatic stress disorder. BMC Psychiatry. 2004;4:24.-
9. Tucker P, Trautman RP, Wyatt DB, et al. Efficacy and safety of topiramate monotherapy in civilian posttraumatic stress disorder: a randomized, double-blind, placebo-controlled study. J Clin Psychiatry. 2007;68(2):201-206.
10. Lindley SE, Carlson EB, Hill K. A randomized double-blind, placebo-controlled trial of augmentation topiramate for chronic combat-related posttraumatic stress disorder. J Clin Psychopharmacol. 2007;27(6):677-681.
11. Yeh MS, Mari JJ, Costa MC, et al. A double-blind randomized controlled trial to study the efficacy of topiramate in a civilian sample of PTSD. CNW Neurosci Ther. 2011;17(5):305-310.
12. Bajor LA, Ticlea AN, Osser DN. The Psychopharmacology Algorithm Project at the Harvard South Shore Program: an update on posttraumatic stress disorder. Harv Rev Psychiatry. 2011;19(5):240-258.
13. Topax [package insert]. Titusville NJ: Janssen Pharmaceuticals; 2009.
Re-experiencing a previous life-threatening stress through nightmares or recurrent memories is a hallmark of posttraumatic stress disorder (PTSD). In the United States, the lifetime risk of PTSD is 10.1% and the 12-month prevalence is 3.7%.1 The selective serotonin reuptake inhibitors (SSRIs) sertraline and paroxetine are FDA-approved for treating PTSD; clinicians commonly use any SSRI for this disorder. Although SSRIs can alleviate many PTSD symptoms, at times patients experience only a partial response, which necessitates other interventions.
Rationale for using topiramate
The anticonvulsant topiramate blocks voltage-sensitive sodium channels, augments γ-aminobutyric acid type A, antagonizes the glutamate receptor, and inhibits carbonic anhydrase. Researchers have hypothesized that limbic nuclei become sensitized and “kindled” after exposure to a traumatic event. Anticonvulsants such as topiramate may help mitigate stress-activated kindling in PTSD.2,3
What does the evidence say?
Although less compelling than double-blind, placebo-controlled trials, small open-label studies and some case reports indicate a potential role for topiramate in PTSD for specific populations.4,5 In an 8-week open- label study, Alderman et al6 found adjunctive topiramate led to a statistically significant reduction in Clinician-Administered PTSD Scale (CAPS) scores and nightmares in 43 male veterans with combat-related PTSD. There was a nonsignificant decrease in high-risk alcohol use.
In a 2002 retrospective case series, Berlant et al7 found topiramate as monotherapy or adjunctive therapy reduced nightmares in 35 patients with chronic, non-combat PTSD. Nightmares decreased in 79% of patients and flashbacks decreased in 86%, with symptom improvement in a median of 4 days. Limitations of this study included lack of placebo control, a low number of participants, and a high dropout rate (9/35).
Two years later, Berlant8 used the PTSD Checklist-Civilian version (PCL-C) to assess response to topiramate in an open-label study of 33 patients with chronic, non-hallucinatory PTSD. Twenty-eight patients used topiramate as add-on therapy. PCL-C scores decreased by ≥30% in 77% of patients in 4 weeks, with a median dose of 50 mg/d and a median response time of 9 days.
In a double-blind, placebo-controlled trial, Tucker et al9 assessed 38 civilian patients who took topiramate monotherapy for PTSD. Using the CAPS, researchers concluded that topiramate reduced re-experiencing symptoms, but the effect was not statistically significant.9
Lindley et al10 conducted a randomized, double-blind, placebo-controlled trial to study the effect of add-on topiramate in 40 patients with chronic, combat-related PTSD. Because many patients in this study had a history of depression and substance use disorders, topiramate was added to antidepressants; no anticonvulsants, antipsychotics, or benzodiazepines were used. Similar to previous studies, researchers found no statistically significant effect on PTSD symptom severity or global symptom improvement. However, the small number of participants and a high dropout rate limited this study.10
In a 12-week, double-blind, placebo-controlled study of 35 men and women age 18 to 62 with PTSD, Yeh et al11 found that topiramate (mean dose: 102.94 mg/d) lead to a statistically significant overall CAPS score reduction, with significant improvements in re-experiencing symptoms, such as nightmares.
Our opinion
FDA-approved treatments such as SSRIs should be the first pharmacologic intervention for PTSD. If a patient’s response is partial or inadequate, consider additional treatment options. For patients with persistent re-experiencing symptoms, evidence and experience with prazosin and trazodone are more robust than that for topiramate.12
Using topiramate to reduce re-experiencing symptoms such as nightmares in PTSD is not supported by statistically significant evidence from double-blind, placebo- controlled trials. However, numerous open-label studies and case reports suggest that there may be a role for topiramate in PTSD patients who do not respond to other treatments. Data indicate that topiramate may be helpful for PTSD patients who have high-risk alcohol use6 or migraine headaches.13 Because some patients who take topiramate lose weight, the medication may be useful for PTSD patients who are overweight.13
Disclosure
The authors report no financial relationship with any company whose products are mentioned in this article or with manufacturers of competing products.
Related Resource
- U.S. Department of Veterans Affairs. Nightmares and PTSD. www.ptsd.va.gov/public/pages/nightmares.asp.
Drug Brand Names
- Paroxetine • Paxil
- Sertraline • Zoloft
- Prazosin • Minipress
- Topiramate • Topamax
- Trazodone • Desyrel, Oleptro
1. Kessler RC, Petukhova M, Sampson NA, et al. Twelve-month and lifetime prevalence and lifetime morbid risk of anxiety and mood disorders in the United States. Int J Methods Psychiatr Res. 2012;21(3):169-184.
2. Berlin HA. Antiepileptic drugs for the treatment of post-traumatic stress disorder. Curr Psychiatry Rep. 2007;9(4):291-300.
3. Khan S, Liberzon I. Topiramate attenuates exaggerated acoustic startle in an animal model of PTSD. Psychopharmacology (Berl). 2004;172(2):225-229.
4. Berlant JL. Topiramate in posttraumatic stress disorder: preliminary clinical observations. J Clin Psychiatry. 2001;62(suppl 17):60-63.
5. Tucker P, Masters B, Nawar O. Topiramate in the treatment of comorbid night eating syndrome and PTSD: a case study. Eat Disord. 2004;12(1):75-78.
6. Alderman CP, McCarthy LC, Condon JT, et al. Topiramate in combat-related posttraumatic stress disorder. Ann Pharmacother. 2009;43(4):635-641.
7. Berlant J, van Kammen DP. Open-label topiramate as primary or adjunctive therapy in chronic civilian posttraumatic stress disorder: a preliminary report. J Clin Psychiatry. 2002;63(1):15-20.
8. Berlant JL. Prospective open-label study of add-on and monotherapy topiramate in civilians with chronic nonhallucinatory posttraumatic stress disorder. BMC Psychiatry. 2004;4:24.-
9. Tucker P, Trautman RP, Wyatt DB, et al. Efficacy and safety of topiramate monotherapy in civilian posttraumatic stress disorder: a randomized, double-blind, placebo-controlled study. J Clin Psychiatry. 2007;68(2):201-206.
10. Lindley SE, Carlson EB, Hill K. A randomized double-blind, placebo-controlled trial of augmentation topiramate for chronic combat-related posttraumatic stress disorder. J Clin Psychopharmacol. 2007;27(6):677-681.
11. Yeh MS, Mari JJ, Costa MC, et al. A double-blind randomized controlled trial to study the efficacy of topiramate in a civilian sample of PTSD. CNW Neurosci Ther. 2011;17(5):305-310.
12. Bajor LA, Ticlea AN, Osser DN. The Psychopharmacology Algorithm Project at the Harvard South Shore Program: an update on posttraumatic stress disorder. Harv Rev Psychiatry. 2011;19(5):240-258.
13. Topax [package insert]. Titusville NJ: Janssen Pharmaceuticals; 2009.
How to adapt cognitive-behavioral therapy for older adults
Some older patients with depression, anxiety, or insomnia may be reluctant to turn to pharmacotherapy and may prefer psychotherapeutic treatments.1 Evidence has established cognitive-behavioral therapy (CBT) as an effective intervention for several psychiatric disorders and CBT should be considered when treating geriatric patients (Table 1).2
Table 1
Indications for CBT
| Mild to moderate depression. In the case of severe depression, CBT can be combined with pharmacotherapy |
| Anxiety disorders, mixed anxiety states |
| Insomnia—both primary and comorbid with other medical and/or psychiatric conditions |
| CBT: cognitive-behavioral therapy |
Research evaluating the efficacy of CBT for depression in older adults was first published in the early 1980s. Since then, research and application of CBT with older adults has expanded to include other psychiatric disorders and researchers have suggested changes to increase the efficacy of CBT for these patients. This article provides:
- an overview of CBT’s efficacy for older adults with depression, anxiety, and insomnia
- modifications to employ when providing CBT to older patients.
The cognitive model of CBT
In the 1970s, Aaron T. Beck, MD, developed CBT while working with depressed patients. Beck’s patients reported thoughts characterized by inaccuracies and distortions in association with their depressed mood. He found these thoughts could be brought to the patient’s conscious attention and modified to improve the patient’s depression. This finding led to the development of CBT.
CBT is based on a cognitive model of the relationship among cognition, emotion, and behavior. Mood and behavior are viewed as determined by a person’s perception and interpretation of events, which manifest as a stream of automatically generated thoughts (Figure).3 These automatic thoughts have their origins in an underlying network of beliefs or schema. Patients with psychiatric disorders such as anxiety and depression typically have frequent automatic thoughts that characteristically lack validity because they arise from dysfunctional beliefs. The therapeutic process consists of helping the patient become aware of his or her internal stream of thoughts when distressed, and to identify and modify the dysfunctional thoughts. Behavioral techniques are used to bring about functional changes in behavior, regulate emotion, and help the cognitive restructuring process. Modifying the patient’s underlying dysfunctional beliefs leads to lasting improvements. In this structured therapy, the therapist and patient work collaboratively to use an approach that features reality testing and experimentation.4
Figure
The cognitive model of CBT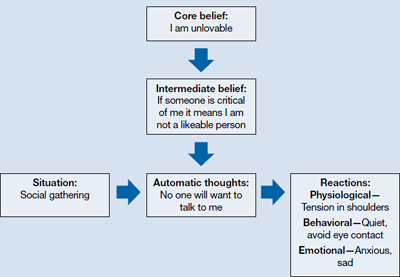
CBT: cognitive-behavioral therapy
Source: Adapted from reference 3
Indications for CBT in older adults
Depression. Among psychotherapies used in older adults, CBT has received the most research for late-life depression.5 Randomized controlled trials (RCTs) have found CBT is superior to treatment as usual in depressed adults age ≥60.6 It also has been found to be superior to wait-list control7 and talking as control.6,8 Meta-analyses have shown above-average effect sizes for CBT in treating late-life depression.9,10 A follow-up study found improvement was maintained up to 2 years after CBT, which suggests CBT’s impact is likely to be long lasting.11
Thompson et al12 compared 102 depressed patients age >60 who were treated with CBT alone, desipramine alone, or a combination of the 2. A combination of medication and CBT worked best for severely depressed patients; CBT alone or a combination of CBT and medication worked best for moderately depressed patients.
CBT is an option when treating depressed medically ill older adults. Research indicates that CBT could reduce depression in older patients with Parkinson’s disease13 and chronic obstructive pulmonary disease.14
As patients get older, cognitive impairment with comorbid depression can make treatment challenging. Limited research suggests CBT applied in a modified format that involves caregivers and uses problem solving and behavioral strategies can significantly reduce depression in patients with dementia.15
Anxiety. Researchers have examined the efficacy of variants of CBT in treating older adults with anxiety disorders—commonly, generalized anxiety disorder (GAD), panic disorder, agoraphobia, subjective anxiety, or a combination of these illnesses.16,17 Randomized trials have supported CBT’s efficacy for older patients with GAD and mixed anxiety states; gains made in CBT were maintained over a 1-year follow-up.18,19 In a meta-analysis of 15 studies using cognitive and behavioral methods of treating anxiety in older patients, Nordhus and Pallesen16 reported a significant effect size of 0.55. In a 2008 meta-analysis that included only RCTs, CBT was superior to wait-list conditions as well as active control conditions in treating anxious older patients.20
However, some research suggests that CBT for GAD may not be as effective for older adults as it is for younger adults. In a study of CBT for GAD in older adults, Stanley et al19 reported smaller effect sizes compared with CBT for younger adults. Researchers have found relatively few differences between CBT and comparison conditions—supportive psychotherapy or active control conditions—in treating GAD in older adults.21 Modified, more effective formats of CBT for GAD in older adults need to be established.22 Mohlman et al23 supplemented standard CBT for late-life GAD with memory and learning aids—weekly reading assignments, graphing exercises to chart mood ratings, reminder phone calls from therapists, and homework compliance requirement. This approach improved the response rate from 40% to 75%.23
Insomnia. Studies have found CBT to be an effective means of treating insomnia in geriatric patients. Although sleep problems occur more frequently among older patients, only 15% of chronic insomnia patients receive treatment; psychotherapy rarely is used.24 CBT for insomnia (CBT-I) should be considered for older adults because managing insomnia with medications may be problematic and these patients may prefer nonpharmacologic treatment.2 CBT-I typically incorporates cognitive strategies with established behavioral techniques, including sleep hygiene education, cognitive restructuring, relaxation training, stimulus control, and/or sleep restriction. The CBT-I multicomponent treatment package meets all criteria to be considered an evidence-based treatment for late-life insomnia.25
RCTs have reported significant improvements in late-life insomnia with CBT-I.26,27 Reviews and meta-analyses have also concluded that cognitive-behavioral treatments are effective for treating insomnia in older adults.25,28 Most insomnia cases in geriatric patients are reported to occur secondary to other medical or psychiatric conditions that are judged as causing the insomnia.25 In these cases, direct treatment of the insomnia usually is delayed or omitted.28 Studies evaluating the efficacy of CBT packages for treating insomnia occurring in conjunction with other medical or psychiatric illnesses have reported significant improvement of insomnia.28,29 Because insomnia frequently occurs in older patients with medical illnesses and psychiatric disorders, CBT-I could be beneficial for such patients.
Good candidates for CBT
Clinical experience indicates that older adults in relatively good health with no significant cognitive decline are good candidates for CBT. These patients tend to comply with their assignments, are interested in applying the learned strategies, and are motivated to read self-help books. CBT’s structured, goal-oriented approach makes it a short-term treatment, which makes it cost effective. Insomnia patients may improve after 6 to 8 CBT-I sessions and patients with anxiety or depression may need to undergo 15 to 20 CBT sessions. Patients age ≥65 have basic Medicare coverage that includes mental health care and psychotherapy.
There are no absolute contraindications for CBT, but the greater the cognitive impairment, the less the patient will benefit from CBT (Table 2). Similarly, severe depression and anxiety might make it difficult for patients to participate meaningfully, although CBT may be incorporated gradually as patients improve with medication. Severe medical illnesses and sensory losses such as visual and hearing loss would make it difficult to carry out CBT effectively.
Table 2
Contraindications for CBT
| High levels of cognitive impairment |
| Severe depression with psychotic features |
| Severe anxiety with high levels of agitation |
| Severe medical illness |
| Sensory losses |
| CBT: cognitive-behavioral therapy |
Adapting CBT for older patients
When using CBT with older patients, it is important to keep in mind characteristics that define the geriatric population. Laidlaw et al30 developed a model to help clinicians develop a more appropriate conceptualization of older patients that focuses on significant events and related cognitions associated with physical health, changes in role investments, and interactions with younger generations. It emphasizes the need to explore beliefs about aging viewed through each patient’s socio-cultural lens and examine cognitions in the context of the time period in which the individual has lived.
Losses and transitions. For many older patients, the latter years of life are characterized by losses and transitions.31 According to Thompson,31 these losses and transitions can trigger thoughts of missed opportunities or unresolved relationships and reflection on unachieved goals.31 CBT for older adults should focus on the meaning the patient gives to these losses and transitions. For example, depressed patients could view their retirement as a loss of self worth as they become less productive. CBT can help patients identify ways of thinking about the situation that will enable them to adapt to these losses and transitions.
Changes in cognition. Changes in cognitive functioning with aging are not universal and there’s considerable variability, but it’s important to make appropriate adaptations when needed. Patients may experience a decline in cognitive speed, working memory, selective attention, and fluid intelligence. This would require that information be presented slowly, with frequent repetitions and summaries. Also, it might be helpful to present information in alternate ways and to encourage patients to take notes during sessions. To accommodate for a decline in fluid intelligence, presenting new information in the context of previous experiences will help promote learning. Recordings of important information and conclusions from cognitive restructuring that patients can listen to between sessions could serve as helpful reminders that will help patients progress. Phone prompts or alarms can remind patients to carry out certain therapeutic measures, such as breathing exercises. Caretakers can attend sessions to become familiar with strategies performed during CBT and act as a co-therapist at home; however, their inclusion must be done with the consent of both parties and only if it’s viewed as necessary for the patient’s progress.
Additional strategies. For patients with substantial cognitive decline, cognitive restructuring might not be as effective as behavioral strategies—activity scheduling, graded task assignment, graded exposure, and rehearsals. Because older adults often have strengthened dysfunctional beliefs over a long time, modifying them takes longer, which is why the tapering process usually takes longer for older patients than for younger patients. The lengthier tapering ensures learning is well established and the process of modifying dysfunctional beliefs to functional beliefs continues. Collaborating with other professionals—physicians, social workers, and case managers—will help ensure a shared care process in which common goals are met.
The websites of the Academy of Cognitive Therapy, American Psychological Association, and Association for Behavioral and Cognitive Therapies can help clinicians who do not offer CBT to locate a qualified therapist for their patients (Related Resources).
- Academy of Cognitive Therapy. www.academyofct.org.
- American Psychological Association. www.apa.org.
- Association for Behavioral and Cognitive Therapies. www.abct.org.
- Laidlaw K, Thompson LW, Dick-Siskin L, et al. Cognitive behaviour therapy with older people. West Sussex, England: John Wiley & Sons, Ltd; 2003.
Drug Brand Name
- Desipramine • Norpramin
Disclosure
The authors report no financial relationship with any company whose products are mentioned in this article or with manufacturers of competing products.
1. Landreville P, Landry J, Baillargeon L, et al. Older adults’ acceptance of psychological and pharmacological treatments for depression. J Gerontol B Psychol Sci Soc Sci. 2001;56(5):P285-P291.
2. Chambless DL, Ollendick TH. Empirically supported psychological interventions: controversies and evidence. Annu Rev Psychol. 2001;52:685-716.
3. Beck JS. Cognitive conceptualization. In: Cognitive therapy: basics and beyond. 2nd ed. New York NY: The Guilford Press; 2011:29–45.
4. Beck AT, Rush AJ, Shaw BF, et al. Cognitive therapy of depression. New York, NY: The Guilford Press; 1979.
5. Areán PA, Cook BL. Psychotherapy and combined psychotherapy/pharmacotherapy for late-life depression. Biol Psychiatry. 2002;52(3):293-303.
6. Laidlaw K, Davidson K, Toner H, et al. A randomised controlled trial of cognitive behaviour therapy vs treatment as usual in the treatment of mild to moderate late-life depression. Int J Geriatr Psychiatry. 2008;23(8):843-850.
7. Floyd M, Scogin F, McKendree-Smith NL, et al. Cognitive therapy for depression: a comparison of individual psychotherapy and bibliotherapy for depressed older adults. Behavior Modification. 2004;28(2):297-318.
8. Serfaty MA, Haworth D, Blanchard M, et al. Clinical effectiveness of individual cognitive behavioral therapy for depressed older people in primary care: a randomized controlled trial. Arch Gen Psychiatry. 2009;66(12):1332-1340.
9. Pinquart M, Sörensen S. How effective are psychotherapeutic and other psychosocial interventions with older adults? A meta-analysis. J Ment Health Aging. 2001;7(2):207-243.
10. Pinquart M, Duberstein PR, Lyness JM. Effects of psychotherapy and other behavioral interventions on clinically depressed older adults: a meta-analysis. Aging Ment Health. 2007;11(6):645-657.
11. Gallagher-Thompson D, Hanley-Peterson P, Thompson LW. Maintenance of gains versus relapse following brief psychotherapy for depression. J Consult Clin Psychol. 1990;58(3):371-374.
12. Thompson LW, Coon DW, Gallagher-Thompson D, et al. Comparison of desipramine and cognitive/behavioral therapy in the treatment of elderly outpatients with mild-to-moderate depression. Am J Geriatr Psychiatry. 2001;9(3):225-240.
13. Dobkin RD, Menza M, Allen LA, et al. Cognitive-behavioral therapy for depression in Parkinson’s disease: a randomized, controlled trial. Am J Psychiatry. 2011;168(10):1066-1074.
14. Kunik ME, Braun U, Stanley MA, et al. One session cognitive behavioural therapy for elderly patients with chronic obstructive pulmonary disease. Psychol Med. 2001;31(4):717-723.
15. Teri L, Logsdon RG, Uomoto J, et al. Behavioral treatment of depression in dementia patients: a controlled clinical trial. J Gerontol B Psychol Sci Soc Sci. 1997;52(4):P159-P166.
16. Nordhus IH, Pallesen S. Psychological treatment of late-life anxiety: an empirical review. J Consult Clin Psychol. 2003;71(4):643-651.
17. Gorenstein EE, Papp LA. Cognitive-behavioral therapy for anxiety in the elderly. Curr Psychiatry Rep. 2007;9(1):20-25.
18. Barrowclough C, King P, Colville J, et al. A randomized trial of the effectiveness of cognitive-behavioral therapy and supportive counseling for anxiety symptoms in older adults. J Consult Clin Psychol. 2001;69(5):756-762.
19. Stanley MA, Beck JG, Novy DM, et al. Cognitive-behavioral treatment of late-life generalized anxiety disorder. J Consult Clin Psychol. 2003;71(2):309-319.
20. Hendriks GJ, Oude Voshaar RC, Keijsers GP, et al. Cognitive-behavioural therapy for late-life anxiety disorders: a systematic review and meta-analysis. Acta Psychiatr Scand. 2008;117(6):403-411.
21. Wetherell JL, Gatz M, Craske MG. Treatment of generalized anxiety disorder in older adults. J Consult Clin Psychol. 2003;71(1):31-40.
22. Dugas MJ, Brillon P, Savard P, et al. A randomized clinical trial of cognitive-behavioral therapy and applied relaxation for adults with generalized anxiety disorder. Behav Ther. 2010;41(1):46-58.
23. Mohlman J, Gorenstein EE, Kleber M, et al. Standard and enhanced cognitive-behavior therapy for late-life generalized anxiety disorder: two pilot investigations. Am J Geriatr Psychiatry. 2003;11(1):24-32.
24. Flint AJ. Epidemiology and comorbidity of anxiety disorders in the elderly. Am J Psychiatry. 1994;151(5):640-649.
25. McCurry SM, Logsdon RG, Teri L, et al. Evidence-based psychological treatments for insomnia in older adults. Psychol Aging. 2007;22(1):18-27.
26. Sivertsen B, Omvik S, Pallesen S, et al. Cognitive behavioral therapy vs zopiclone for treatment of chronic primary insomnia in older adults: a randomized controlled trial. JAMA. 2006;295(24):2851-2858.
27. Morgan K, Dixon S, Mathers N, et al. Psychological treatment for insomnia in the regulation of long-term hypnotic drug use. Health Technol Assess. 2004;8(8):iii iv, 1-68.
28. Nau SD, McCrae CS, Cook KG, et al. Treatment of insomnia in older adults. Clin Psychol Rev. 2005;25(5):645-672.
29. Rybarczyk B, Stepanski E, Fogg L, et al. A placebo-controlled test of cognitive-behavioral therapy for comorbid insomnia in older adults. J Consult Clin Psychol. 2005;73(6):1164-1174.
30. Laidlaw K, Thompson LW, Gallagher-Thompson D. Comprehensive conceptualization of cognitive behaviour therapy for late life depression. Behav Cogn Psychother. 2004;32(4):389-399.
31. Thompson LW. Cognitive-behavioral therapy and treatment for late-life depression. J Clin Psychiatry. 1996;57(suppl 5):29-37.
Some older patients with depression, anxiety, or insomnia may be reluctant to turn to pharmacotherapy and may prefer psychotherapeutic treatments.1 Evidence has established cognitive-behavioral therapy (CBT) as an effective intervention for several psychiatric disorders and CBT should be considered when treating geriatric patients (Table 1).2
Table 1
Indications for CBT
| Mild to moderate depression. In the case of severe depression, CBT can be combined with pharmacotherapy |
| Anxiety disorders, mixed anxiety states |
| Insomnia—both primary and comorbid with other medical and/or psychiatric conditions |
| CBT: cognitive-behavioral therapy |
Research evaluating the efficacy of CBT for depression in older adults was first published in the early 1980s. Since then, research and application of CBT with older adults has expanded to include other psychiatric disorders and researchers have suggested changes to increase the efficacy of CBT for these patients. This article provides:
- an overview of CBT’s efficacy for older adults with depression, anxiety, and insomnia
- modifications to employ when providing CBT to older patients.
The cognitive model of CBT
In the 1970s, Aaron T. Beck, MD, developed CBT while working with depressed patients. Beck’s patients reported thoughts characterized by inaccuracies and distortions in association with their depressed mood. He found these thoughts could be brought to the patient’s conscious attention and modified to improve the patient’s depression. This finding led to the development of CBT.
CBT is based on a cognitive model of the relationship among cognition, emotion, and behavior. Mood and behavior are viewed as determined by a person’s perception and interpretation of events, which manifest as a stream of automatically generated thoughts (Figure).3 These automatic thoughts have their origins in an underlying network of beliefs or schema. Patients with psychiatric disorders such as anxiety and depression typically have frequent automatic thoughts that characteristically lack validity because they arise from dysfunctional beliefs. The therapeutic process consists of helping the patient become aware of his or her internal stream of thoughts when distressed, and to identify and modify the dysfunctional thoughts. Behavioral techniques are used to bring about functional changes in behavior, regulate emotion, and help the cognitive restructuring process. Modifying the patient’s underlying dysfunctional beliefs leads to lasting improvements. In this structured therapy, the therapist and patient work collaboratively to use an approach that features reality testing and experimentation.4
Figure
The cognitive model of CBT
CBT: cognitive-behavioral therapy
Source: Adapted from reference 3
Indications for CBT in older adults
Depression. Among psychotherapies used in older adults, CBT has received the most research for late-life depression.5 Randomized controlled trials (RCTs) have found CBT is superior to treatment as usual in depressed adults age ≥60.6 It also has been found to be superior to wait-list control7 and talking as control.6,8 Meta-analyses have shown above-average effect sizes for CBT in treating late-life depression.9,10 A follow-up study found improvement was maintained up to 2 years after CBT, which suggests CBT’s impact is likely to be long lasting.11
Thompson et al12 compared 102 depressed patients age >60 who were treated with CBT alone, desipramine alone, or a combination of the 2. A combination of medication and CBT worked best for severely depressed patients; CBT alone or a combination of CBT and medication worked best for moderately depressed patients.
CBT is an option when treating depressed medically ill older adults. Research indicates that CBT could reduce depression in older patients with Parkinson’s disease13 and chronic obstructive pulmonary disease.14
As patients get older, cognitive impairment with comorbid depression can make treatment challenging. Limited research suggests CBT applied in a modified format that involves caregivers and uses problem solving and behavioral strategies can significantly reduce depression in patients with dementia.15
Anxiety. Researchers have examined the efficacy of variants of CBT in treating older adults with anxiety disorders—commonly, generalized anxiety disorder (GAD), panic disorder, agoraphobia, subjective anxiety, or a combination of these illnesses.16,17 Randomized trials have supported CBT’s efficacy for older patients with GAD and mixed anxiety states; gains made in CBT were maintained over a 1-year follow-up.18,19 In a meta-analysis of 15 studies using cognitive and behavioral methods of treating anxiety in older patients, Nordhus and Pallesen16 reported a significant effect size of 0.55. In a 2008 meta-analysis that included only RCTs, CBT was superior to wait-list conditions as well as active control conditions in treating anxious older patients.20
However, some research suggests that CBT for GAD may not be as effective for older adults as it is for younger adults. In a study of CBT for GAD in older adults, Stanley et al19 reported smaller effect sizes compared with CBT for younger adults. Researchers have found relatively few differences between CBT and comparison conditions—supportive psychotherapy or active control conditions—in treating GAD in older adults.21 Modified, more effective formats of CBT for GAD in older adults need to be established.22 Mohlman et al23 supplemented standard CBT for late-life GAD with memory and learning aids—weekly reading assignments, graphing exercises to chart mood ratings, reminder phone calls from therapists, and homework compliance requirement. This approach improved the response rate from 40% to 75%.23
Insomnia. Studies have found CBT to be an effective means of treating insomnia in geriatric patients. Although sleep problems occur more frequently among older patients, only 15% of chronic insomnia patients receive treatment; psychotherapy rarely is used.24 CBT for insomnia (CBT-I) should be considered for older adults because managing insomnia with medications may be problematic and these patients may prefer nonpharmacologic treatment.2 CBT-I typically incorporates cognitive strategies with established behavioral techniques, including sleep hygiene education, cognitive restructuring, relaxation training, stimulus control, and/or sleep restriction. The CBT-I multicomponent treatment package meets all criteria to be considered an evidence-based treatment for late-life insomnia.25
RCTs have reported significant improvements in late-life insomnia with CBT-I.26,27 Reviews and meta-analyses have also concluded that cognitive-behavioral treatments are effective for treating insomnia in older adults.25,28 Most insomnia cases in geriatric patients are reported to occur secondary to other medical or psychiatric conditions that are judged as causing the insomnia.25 In these cases, direct treatment of the insomnia usually is delayed or omitted.28 Studies evaluating the efficacy of CBT packages for treating insomnia occurring in conjunction with other medical or psychiatric illnesses have reported significant improvement of insomnia.28,29 Because insomnia frequently occurs in older patients with medical illnesses and psychiatric disorders, CBT-I could be beneficial for such patients.
Good candidates for CBT
Clinical experience indicates that older adults in relatively good health with no significant cognitive decline are good candidates for CBT. These patients tend to comply with their assignments, are interested in applying the learned strategies, and are motivated to read self-help books. CBT’s structured, goal-oriented approach makes it a short-term treatment, which makes it cost effective. Insomnia patients may improve after 6 to 8 CBT-I sessions and patients with anxiety or depression may need to undergo 15 to 20 CBT sessions. Patients age ≥65 have basic Medicare coverage that includes mental health care and psychotherapy.
There are no absolute contraindications for CBT, but the greater the cognitive impairment, the less the patient will benefit from CBT (Table 2). Similarly, severe depression and anxiety might make it difficult for patients to participate meaningfully, although CBT may be incorporated gradually as patients improve with medication. Severe medical illnesses and sensory losses such as visual and hearing loss would make it difficult to carry out CBT effectively.
Table 2
Contraindications for CBT
| High levels of cognitive impairment |
| Severe depression with psychotic features |
| Severe anxiety with high levels of agitation |
| Severe medical illness |
| Sensory losses |
| CBT: cognitive-behavioral therapy |
Adapting CBT for older patients
When using CBT with older patients, it is important to keep in mind characteristics that define the geriatric population. Laidlaw et al30 developed a model to help clinicians develop a more appropriate conceptualization of older patients that focuses on significant events and related cognitions associated with physical health, changes in role investments, and interactions with younger generations. It emphasizes the need to explore beliefs about aging viewed through each patient’s socio-cultural lens and examine cognitions in the context of the time period in which the individual has lived.
Losses and transitions. For many older patients, the latter years of life are characterized by losses and transitions.31 According to Thompson,31 these losses and transitions can trigger thoughts of missed opportunities or unresolved relationships and reflection on unachieved goals.31 CBT for older adults should focus on the meaning the patient gives to these losses and transitions. For example, depressed patients could view their retirement as a loss of self worth as they become less productive. CBT can help patients identify ways of thinking about the situation that will enable them to adapt to these losses and transitions.
Changes in cognition. Changes in cognitive functioning with aging are not universal and there’s considerable variability, but it’s important to make appropriate adaptations when needed. Patients may experience a decline in cognitive speed, working memory, selective attention, and fluid intelligence. This would require that information be presented slowly, with frequent repetitions and summaries. Also, it might be helpful to present information in alternate ways and to encourage patients to take notes during sessions. To accommodate for a decline in fluid intelligence, presenting new information in the context of previous experiences will help promote learning. Recordings of important information and conclusions from cognitive restructuring that patients can listen to between sessions could serve as helpful reminders that will help patients progress. Phone prompts or alarms can remind patients to carry out certain therapeutic measures, such as breathing exercises. Caretakers can attend sessions to become familiar with strategies performed during CBT and act as a co-therapist at home; however, their inclusion must be done with the consent of both parties and only if it’s viewed as necessary for the patient’s progress.
Additional strategies. For patients with substantial cognitive decline, cognitive restructuring might not be as effective as behavioral strategies—activity scheduling, graded task assignment, graded exposure, and rehearsals. Because older adults often have strengthened dysfunctional beliefs over a long time, modifying them takes longer, which is why the tapering process usually takes longer for older patients than for younger patients. The lengthier tapering ensures learning is well established and the process of modifying dysfunctional beliefs to functional beliefs continues. Collaborating with other professionals—physicians, social workers, and case managers—will help ensure a shared care process in which common goals are met.
The websites of the Academy of Cognitive Therapy, American Psychological Association, and Association for Behavioral and Cognitive Therapies can help clinicians who do not offer CBT to locate a qualified therapist for their patients (Related Resources).
- Academy of Cognitive Therapy. www.academyofct.org.
- American Psychological Association. www.apa.org.
- Association for Behavioral and Cognitive Therapies. www.abct.org.
- Laidlaw K, Thompson LW, Dick-Siskin L, et al. Cognitive behaviour therapy with older people. West Sussex, England: John Wiley & Sons, Ltd; 2003.
Drug Brand Name
- Desipramine • Norpramin
Disclosure
The authors report no financial relationship with any company whose products are mentioned in this article or with manufacturers of competing products.
1. Landreville P, Landry J, Baillargeon L, et al. Older adults’ acceptance of psychological and pharmacological treatments for depression. J Gerontol B Psychol Sci Soc Sci. 2001;56(5):P285-P291.
2. Chambless DL, Ollendick TH. Empirically supported psychological interventions: controversies and evidence. Annu Rev Psychol. 2001;52:685-716.
3. Beck JS. Cognitive conceptualization. In: Cognitive therapy: basics and beyond. 2nd ed. New York NY: The Guilford Press; 2011:29–45.
4. Beck AT, Rush AJ, Shaw BF, et al. Cognitive therapy of depression. New York, NY: The Guilford Press; 1979.
5. Areán PA, Cook BL. Psychotherapy and combined psychotherapy/pharmacotherapy for late-life depression. Biol Psychiatry. 2002;52(3):293-303.
6. Laidlaw K, Davidson K, Toner H, et al. A randomised controlled trial of cognitive behaviour therapy vs treatment as usual in the treatment of mild to moderate late-life depression. Int J Geriatr Psychiatry. 2008;23(8):843-850.
7. Floyd M, Scogin F, McKendree-Smith NL, et al. Cognitive therapy for depression: a comparison of individual psychotherapy and bibliotherapy for depressed older adults. Behavior Modification. 2004;28(2):297-318.
8. Serfaty MA, Haworth D, Blanchard M, et al. Clinical effectiveness of individual cognitive behavioral therapy for depressed older people in primary care: a randomized controlled trial. Arch Gen Psychiatry. 2009;66(12):1332-1340.
9. Pinquart M, Sörensen S. How effective are psychotherapeutic and other psychosocial interventions with older adults? A meta-analysis. J Ment Health Aging. 2001;7(2):207-243.
10. Pinquart M, Duberstein PR, Lyness JM. Effects of psychotherapy and other behavioral interventions on clinically depressed older adults: a meta-analysis. Aging Ment Health. 2007;11(6):645-657.
11. Gallagher-Thompson D, Hanley-Peterson P, Thompson LW. Maintenance of gains versus relapse following brief psychotherapy for depression. J Consult Clin Psychol. 1990;58(3):371-374.
12. Thompson LW, Coon DW, Gallagher-Thompson D, et al. Comparison of desipramine and cognitive/behavioral therapy in the treatment of elderly outpatients with mild-to-moderate depression. Am J Geriatr Psychiatry. 2001;9(3):225-240.
13. Dobkin RD, Menza M, Allen LA, et al. Cognitive-behavioral therapy for depression in Parkinson’s disease: a randomized, controlled trial. Am J Psychiatry. 2011;168(10):1066-1074.
14. Kunik ME, Braun U, Stanley MA, et al. One session cognitive behavioural therapy for elderly patients with chronic obstructive pulmonary disease. Psychol Med. 2001;31(4):717-723.
15. Teri L, Logsdon RG, Uomoto J, et al. Behavioral treatment of depression in dementia patients: a controlled clinical trial. J Gerontol B Psychol Sci Soc Sci. 1997;52(4):P159-P166.
16. Nordhus IH, Pallesen S. Psychological treatment of late-life anxiety: an empirical review. J Consult Clin Psychol. 2003;71(4):643-651.
17. Gorenstein EE, Papp LA. Cognitive-behavioral therapy for anxiety in the elderly. Curr Psychiatry Rep. 2007;9(1):20-25.
18. Barrowclough C, King P, Colville J, et al. A randomized trial of the effectiveness of cognitive-behavioral therapy and supportive counseling for anxiety symptoms in older adults. J Consult Clin Psychol. 2001;69(5):756-762.
19. Stanley MA, Beck JG, Novy DM, et al. Cognitive-behavioral treatment of late-life generalized anxiety disorder. J Consult Clin Psychol. 2003;71(2):309-319.
20. Hendriks GJ, Oude Voshaar RC, Keijsers GP, et al. Cognitive-behavioural therapy for late-life anxiety disorders: a systematic review and meta-analysis. Acta Psychiatr Scand. 2008;117(6):403-411.
21. Wetherell JL, Gatz M, Craske MG. Treatment of generalized anxiety disorder in older adults. J Consult Clin Psychol. 2003;71(1):31-40.
22. Dugas MJ, Brillon P, Savard P, et al. A randomized clinical trial of cognitive-behavioral therapy and applied relaxation for adults with generalized anxiety disorder. Behav Ther. 2010;41(1):46-58.
23. Mohlman J, Gorenstein EE, Kleber M, et al. Standard and enhanced cognitive-behavior therapy for late-life generalized anxiety disorder: two pilot investigations. Am J Geriatr Psychiatry. 2003;11(1):24-32.
24. Flint AJ. Epidemiology and comorbidity of anxiety disorders in the elderly. Am J Psychiatry. 1994;151(5):640-649.
25. McCurry SM, Logsdon RG, Teri L, et al. Evidence-based psychological treatments for insomnia in older adults. Psychol Aging. 2007;22(1):18-27.
26. Sivertsen B, Omvik S, Pallesen S, et al. Cognitive behavioral therapy vs zopiclone for treatment of chronic primary insomnia in older adults: a randomized controlled trial. JAMA. 2006;295(24):2851-2858.
27. Morgan K, Dixon S, Mathers N, et al. Psychological treatment for insomnia in the regulation of long-term hypnotic drug use. Health Technol Assess. 2004;8(8):iii iv, 1-68.
28. Nau SD, McCrae CS, Cook KG, et al. Treatment of insomnia in older adults. Clin Psychol Rev. 2005;25(5):645-672.
29. Rybarczyk B, Stepanski E, Fogg L, et al. A placebo-controlled test of cognitive-behavioral therapy for comorbid insomnia in older adults. J Consult Clin Psychol. 2005;73(6):1164-1174.
30. Laidlaw K, Thompson LW, Gallagher-Thompson D. Comprehensive conceptualization of cognitive behaviour therapy for late life depression. Behav Cogn Psychother. 2004;32(4):389-399.
31. Thompson LW. Cognitive-behavioral therapy and treatment for late-life depression. J Clin Psychiatry. 1996;57(suppl 5):29-37.
A taste for the unusual
Discuss this article at www.facebook.com/CurrentPsychiatry
CASE: Nauseous and full
Ms. O, age 48, presents to the emergency department reporting a 3-day history of vomiting approximately 5 minutes after consuming solids or liquids. She’s had 10 vomiting episodes, which were associated with “fullness” and an “aching” sensation she rates as 6 on a 10-point scale pain scale that is diffuse over the upper epigastric area, with no palliative factors. Ms. O has not had a bowel movement for 3 days and her last menstrual period was 8 days ago. She is taking lorazepam, 1 mg/d. Her medical and psychiatric history includes anxiety, depression, personality disorder symptoms of affective dysregulation, obesity (270 lbs; medium height), and pica. She was 352 lbs when she underwent a Roux-en-Y gastric bypass 2 years ago. One year earlier, she had a laparoscopic gastric bezoar removal and an incisional hernia repair. Ms. O had no pica-related surgeries before undergoing gastric bypass surgery.
Ms. O denies shortness of breath, chest pain, allergies, smoking, or alcohol abuse, but reports uncontrollable cravings for paper products, specifically cardboard, which she describes as “just so delicious.” This craving led her to consume large amounts of cardboard and newspaper in the days before she began vomiting.
What may be causing Ms. O’s pica symptoms?
- iron deficiency anemia
- complications from gastric bypass surgery
- personality disorder
- generalized anxiety disorder (GAD)
The authors’ observations
DSM-IV-TR diagnostic criteria for pica include the persistent eating of non-nutritive substances for ≥1 month that is inappropriate for the level of a person’s development and not an acceptable part of one’s culture.1 If pica occurs with other mental disorders, it must be severe enough to indicate further clinical assessment to receive a separate diagnosis. Often associated with pregnancy, iron deficiency anemia, early development, and mental retardation, pica has been observed in post-gastric bypass surgery patients, all of whom presented with pagophagia (compulsive ice eating), and in one case was associated with a bezoar causing obstruction of the GI tract.1,2 With the dramatic increase in gastric bypass surgery and the required presurgical mental health evaluation, the consequences of failing to screen patients for pica behaviors can be devastating.
EVALUATION: Low iron
Ms. O’s vital signs on admission are stable, and physical exam is notable for mild abdominal distention with no guarding, tenderness, rigidity, or masses. No rebound tenderness is elicited. CT scan shows evidence of post-surgical changes involving the small bowel consistent with gastric bypass surgery and a hiatal hernia, but no obstruction, focal inflammation, free fluids, or gas. Lab values for amylase, lipase, urinalysis, coagulation studies, cardiac enzymes, and complete metabolic profile are within normal limits. Although not anemic, Ms. O is iron deficient, with ferritin, 10 ng/mL (normal 10 to 120 ng/mL); B12, 299 pg/mL (normal 100 to 700 pg/mL); and iron, 25 μg/dL (normal 50 to 170 μg/dL).
A foreign body is removed endoscopically and the specimen is sent to pathology. It is determined to be a gastric bezoar, yellowish-green in color, measuring 2.5 cm × 1 cm × 0.8 cm. After bezoar removal, Ms. O tolerates food and is discharged home on vitamin B12, 1,000 mcg/d for 2 weeks; folate, 1 mg/d for 1 month; calcium with vitamin D, 1 g/d; and esomeprazole, 40 mg/d for frequent heartburn. She is referred to psychiatry for behavioral modification therapy and medication management.
How would you treat Ms. O?
- start a selective serotonin reuptake inhibitor (SSRI)
- prescribe an atypical antipsychotic
- continue lorazepam
- begin behavioral therapy
HISTORY: Pica during pregnancy
During psychiatric workup, Ms. O admits to having pica urges most of her life, but experienced an uncontrollable exacerbation after gastric bypass surgery. This led to intense, chaotic periods of pica, resulting in a previous bezoar removal. She is particularly attracted to cardboard and newspaper cartoons, but notes she also has felt the urge to eat charcoal, moist soil, clay, chalk, pencils, and new shoes, which she chews on. In the past, her extreme anxiety and preoccupation with these urges had lead to diagnoses of personality disorder not otherwise specified, GAD, and obsessive-compulsive disorder.
Her first experience with pica was during her first pregnancy at age 15, when she had an impulse to eat soil. The urges briefly stopped until she became pregnant again. During each of her 5 pregnancies her pica symptoms returned. At one point during her last pregnancy she reports having felt out of control, eating 2 to 3 pencils with the eraser per day, after which she would feel intense relaxation. Her mother also exhibited symptoms of pica toward charcoal and soil. Ms. O had been taking unknown dosages of lorazepam for anxiety and fluoxetine for depression, both of which she stopped because she feared side effects during her last pregnancy. However, she never experienced any side effects.
The authors’ observations
Although pica is most commonly observed in young children, it sometimes is seen in pregnant women.1 Pica frequently is associated with other mental disorders, such as pervasive developmental disorder and mental retardation,1 and can be associated with premorbid psychosis and anxiety disorders. Occasional vitamin and mineral deficiencies, such as iron or zinc, have been reported, but usually patients’ lab values are normal. Treatment usually is initiated in the context of medical complications, such as iron deficiency anemia. In Ms. O’s case, the precipitating event was mechanical bowel obstruction due to a bezoar.
Several theories about the origins of pica have been proposed, but none truly are explanatory or satisfactory. The nutritional theory—that patients eat non-nutritive substances to compensate for mineral deficiencies—is popular because of pica’s frequent association with mineral deficiencies, but it is unknown whether pica is the cause or the result of the deficiency. An example of this is anemia due to eating clay instead of foods that contain iron. Another theory is that because pica is normal in early childhood development, it may be a manifestation of delayed development or mental retardation. The cultural theory is attractive because pregnant women in several cultures eat starch or clay as a part of their native rituals, and the incidence of pica is relatively high among pregnant African American women who live in rural areas.3 In the Roux-en-Y procedure, bypass of the duodenum and proximal jejunum can significantly decrease a patient’s iron uptake, leading to iron deficiency anemia, and could trigger pica in a susceptible patient.4
Exacerbation after gastric bypass
Kushner et al4 describes re-emergent pica after bariatric surgery in 2 patients with pagophagia associated with concomitant iron deficiency anemia. A 41-year-old white woman presented with pagophagia and a history of childhood consumption of dirt, chalk, and clay. Another patient, a 34-year-old African American woman, suffered from a lifelong desire to eat dirt, which she was able to resist, but experienced pagophagia during pregnancy and later when she developed iron deficiency anemia.4 In another case series, Kushner et al5 describes a 35-year-old woman with iron deficiency anemia with pagophagia presenting 2 years after Roux-en-Y. Her history was significant for eating clay as a child, but this new-onset pagophagia was so intense she purchased 2 snow cone machines, one for home and one for work, to feed her urges. Another patient, a 45-year-old African American woman, had an irresistible craving for calcium carbonate antacids, eating 40 to 50 a day, as well as several 30-ounce cups of ice.5 A third case report details a 33-year-old woman with iron deficiency anemia who presented with nocturnal pagophagia after Roux-en-Y anastomosis. She repeatedly rose during the night to eat the frost off the ice maker in her refrigerator.6 Another case described a female patient who ate cardboard after having a Roux-en-Y.2
Common themes in these case reports are female sex, Roux-en-Y, and dramatic resurgence of previously noted pica behaviors after gastric bypass surgery. Several studies have shown that pagophagia and pica in patients who are iron deficient or have iron deficiency anemia can be rapidly curbed with iron supplements.5 Ms. O, who has low iron, is taking iron supplementation, yet continues to experience pica cravings, albeit less severely. Her pica could be psychiatric in origin, perhaps related to her history of anxiety.
OUTCOME: Combination therapy
We start Ms. O on ziprasidone, 80 mg twice a day, restart lorazepam, 1 mg/d, and schedule monthly follow-up appointments to monitor her pica symptoms. We prescribe ziprasidone because it could treat paranoia and preoccupations and is considered to be weight-neutral. She continues her supplements, including ferrous sulfate, 325 mg 3 times daily. Ms. O attends weekly behavioral therapy sessions, during which the therapist monitors her mood and cravings with response prevention, which entails purposely avoiding behaviors after initiating a distressing stimulus. Ms. O responds well to medication and psychotherapy 1 month after the gastric bezoar removal, and she reports a decreased urge to eat cardboard. She is able to increase the amount of time she can go without eating non-nutritive substances—once daily, rather than repeatedly throughout the day.
The authors’ observations
Each patient with pica likely needs customized care. Children need to be supervised to prevent ingestion of lead-containing substances such as paint chips. Iron supplements are recommended for iron deficiency anemia and prophylaxis for iron deficiency anemia in Roux-en-Y patients.3,4 Pica in pregnant patients should be addressed to maintain adequate nutrition and prevent accidental poisonings.7 Behavioral intervention strategies are based on positive reinforcement and punishment (Table).8 A report of 3 young children with pica noted successful treatment of one with automatic reinforcement, and the other 2 with a combination of social and automatic reinforcement.9 There are no FDA-approved medications for pica. Positive effects have been seen with SSRIs, bupropion, atypical antipsychotics, buprenorphine, and chlorimipramine.10 Olanzapine has shown positive results as a treatment for pica.11 Most pica patients need concurrent psychotherapy.10
Table
Behavioral interventions for pica
| Intervention | Comments |
|---|---|
| Environmental enrichment | Providing additional stimulus to increase neuronal activity and focus behaviors |
| Noncontingent reinforcement | Presenting reinforcers according to a fixed schedule |
| Differential reinforcement | Desired behaviors are reinforced and inappropriate behaviors are ignored |
| Response blocking | Physically block a patient’s attempts to eat nonedible items |
| Source: Reference 8 | |
Related Resources
- Blinder BJ, Salama C. An update on pica: prevalence, contributing causes, and treatment. Psychiatric Times. www.psychiatrictimes.com/display/article/10168/1159376?pageNumber=1. Published May 1, 2008.
- Nurcombe B. Developmental disorders of attachment, feeding, elimination, & sleeping. In: Ebert MH, Loosen PT, Nurcombe B, et al, eds. CURRENT diagnosis & treatment: psychiatry. 2nd ed. New York, NY: McGraw Hill; 2008.
Drug Brand Names
- Buprenorphine • Subutex
- Bupropion • Wellbutrin, Zyban
- Chlorimipramine • Anafranil
- Esomeprazole • Nexium
- Fluoxetine • Prozac
- Lorazepam • Ativan
- Olanzapine • Zyprexa
- Ziprasidone • Geodon
Disclosure
The authors report no financial relationship with any company whose products are mentioned in this article or with manufacturers of competing products.
1. Diagnostic and statistical manual of mental disorders, 4th ed, text rev. Washington DC: American Psychiatric Association; 2000.
2. Patton W, Gibbs K. Cardboard bezoar complicating laparoscopic gastric bypass. Surg Obes Relat Dis. 2010;6(3):313-315.
3. Nurcombe B. Developmental disorders of attachment feeding, elimination, & sleeping. In: Ebert MH, Loosen PT, Nurcombe B, et al, eds. CURRENT diagnosis & treatment: psychiatry. 2nd ed. New York, NY: McGraw Hill; 2008.
4. Kushner F, Gleason B, Shanta-Retelny V. Reemergence of pica following gastric bypass surgery for obesity: a new presentation of an old problem. J Am Diet Assoc. 2004;104(9):1393-1397.
5. Kushner F, Shanta Retelny V. Emergence of pica (ingestion of non-food substances) accompanying iron deficiency anemia after gastric bypass surgery. Obes Surg. 2005;15(10):1491-1495.
6. Marinella MA. Nocturnal pagophagia complicating gastric bypass. Mayo Clin Proc. 2008;83(8):961.-
7. Bernstein B, Weinstein M. Normal pregnancy & prenatal care. In: DeCherney AH Nathan L, Goodwin TM, et al, eds. CURRENT diagnosis & treatment obstetrics & gynecology. 10th ed. New York, NY: McGraw Hill; 2007.
8. Piazza C, Fisher W, Hanley P, et al. Treatment of pica through multiple analyses of its reinforcing functions. J Appl Behav Anal. 1998;31(2):165-189.
9. Williams DE, McAdam D. Assessment behavioral treatment, and prevention of pica: clinical guidelines and recommendations for practitioners. Res Dev Disabil. 2012;33(6):2050-2057.
10. Blinder BJ, Salama C. An update on pica: prevalence contributing causes, and treatment. Psychiatric Times. http://www.psychiatrictimes.com/display/article/10168/1159376?pageNumber=1. Published May 1, 2008. Accessed January 23, 2013.
11. Lerner AJ. Treatment of pica behavior with olanzapine. CNS Spectr. 2008;13(1):19.-
Discuss this article at www.facebook.com/CurrentPsychiatry
CASE: Nauseous and full
Ms. O, age 48, presents to the emergency department reporting a 3-day history of vomiting approximately 5 minutes after consuming solids or liquids. She’s had 10 vomiting episodes, which were associated with “fullness” and an “aching” sensation she rates as 6 on a 10-point scale pain scale that is diffuse over the upper epigastric area, with no palliative factors. Ms. O has not had a bowel movement for 3 days and her last menstrual period was 8 days ago. She is taking lorazepam, 1 mg/d. Her medical and psychiatric history includes anxiety, depression, personality disorder symptoms of affective dysregulation, obesity (270 lbs; medium height), and pica. She was 352 lbs when she underwent a Roux-en-Y gastric bypass 2 years ago. One year earlier, she had a laparoscopic gastric bezoar removal and an incisional hernia repair. Ms. O had no pica-related surgeries before undergoing gastric bypass surgery.
Ms. O denies shortness of breath, chest pain, allergies, smoking, or alcohol abuse, but reports uncontrollable cravings for paper products, specifically cardboard, which she describes as “just so delicious.” This craving led her to consume large amounts of cardboard and newspaper in the days before she began vomiting.
What may be causing Ms. O’s pica symptoms?
- iron deficiency anemia
- complications from gastric bypass surgery
- personality disorder
- generalized anxiety disorder (GAD)
The authors’ observations
DSM-IV-TR diagnostic criteria for pica include the persistent eating of non-nutritive substances for ≥1 month that is inappropriate for the level of a person’s development and not an acceptable part of one’s culture.1 If pica occurs with other mental disorders, it must be severe enough to indicate further clinical assessment to receive a separate diagnosis. Often associated with pregnancy, iron deficiency anemia, early development, and mental retardation, pica has been observed in post-gastric bypass surgery patients, all of whom presented with pagophagia (compulsive ice eating), and in one case was associated with a bezoar causing obstruction of the GI tract.1,2 With the dramatic increase in gastric bypass surgery and the required presurgical mental health evaluation, the consequences of failing to screen patients for pica behaviors can be devastating.
EVALUATION: Low iron
Ms. O’s vital signs on admission are stable, and physical exam is notable for mild abdominal distention with no guarding, tenderness, rigidity, or masses. No rebound tenderness is elicited. CT scan shows evidence of post-surgical changes involving the small bowel consistent with gastric bypass surgery and a hiatal hernia, but no obstruction, focal inflammation, free fluids, or gas. Lab values for amylase, lipase, urinalysis, coagulation studies, cardiac enzymes, and complete metabolic profile are within normal limits. Although not anemic, Ms. O is iron deficient, with ferritin, 10 ng/mL (normal 10 to 120 ng/mL); B12, 299 pg/mL (normal 100 to 700 pg/mL); and iron, 25 μg/dL (normal 50 to 170 μg/dL).
A foreign body is removed endoscopically and the specimen is sent to pathology. It is determined to be a gastric bezoar, yellowish-green in color, measuring 2.5 cm × 1 cm × 0.8 cm. After bezoar removal, Ms. O tolerates food and is discharged home on vitamin B12, 1,000 mcg/d for 2 weeks; folate, 1 mg/d for 1 month; calcium with vitamin D, 1 g/d; and esomeprazole, 40 mg/d for frequent heartburn. She is referred to psychiatry for behavioral modification therapy and medication management.
How would you treat Ms. O?
- start a selective serotonin reuptake inhibitor (SSRI)
- prescribe an atypical antipsychotic
- continue lorazepam
- begin behavioral therapy
HISTORY: Pica during pregnancy
During psychiatric workup, Ms. O admits to having pica urges most of her life, but experienced an uncontrollable exacerbation after gastric bypass surgery. This led to intense, chaotic periods of pica, resulting in a previous bezoar removal. She is particularly attracted to cardboard and newspaper cartoons, but notes she also has felt the urge to eat charcoal, moist soil, clay, chalk, pencils, and new shoes, which she chews on. In the past, her extreme anxiety and preoccupation with these urges had lead to diagnoses of personality disorder not otherwise specified, GAD, and obsessive-compulsive disorder.
Her first experience with pica was during her first pregnancy at age 15, when she had an impulse to eat soil. The urges briefly stopped until she became pregnant again. During each of her 5 pregnancies her pica symptoms returned. At one point during her last pregnancy she reports having felt out of control, eating 2 to 3 pencils with the eraser per day, after which she would feel intense relaxation. Her mother also exhibited symptoms of pica toward charcoal and soil. Ms. O had been taking unknown dosages of lorazepam for anxiety and fluoxetine for depression, both of which she stopped because she feared side effects during her last pregnancy. However, she never experienced any side effects.
The authors’ observations
Although pica is most commonly observed in young children, it sometimes is seen in pregnant women.1 Pica frequently is associated with other mental disorders, such as pervasive developmental disorder and mental retardation,1 and can be associated with premorbid psychosis and anxiety disorders. Occasional vitamin and mineral deficiencies, such as iron or zinc, have been reported, but usually patients’ lab values are normal. Treatment usually is initiated in the context of medical complications, such as iron deficiency anemia. In Ms. O’s case, the precipitating event was mechanical bowel obstruction due to a bezoar.
Several theories about the origins of pica have been proposed, but none truly are explanatory or satisfactory. The nutritional theory—that patients eat non-nutritive substances to compensate for mineral deficiencies—is popular because of pica’s frequent association with mineral deficiencies, but it is unknown whether pica is the cause or the result of the deficiency. An example of this is anemia due to eating clay instead of foods that contain iron. Another theory is that because pica is normal in early childhood development, it may be a manifestation of delayed development or mental retardation. The cultural theory is attractive because pregnant women in several cultures eat starch or clay as a part of their native rituals, and the incidence of pica is relatively high among pregnant African American women who live in rural areas.3 In the Roux-en-Y procedure, bypass of the duodenum and proximal jejunum can significantly decrease a patient’s iron uptake, leading to iron deficiency anemia, and could trigger pica in a susceptible patient.4
Exacerbation after gastric bypass
Kushner et al4 describes re-emergent pica after bariatric surgery in 2 patients with pagophagia associated with concomitant iron deficiency anemia. A 41-year-old white woman presented with pagophagia and a history of childhood consumption of dirt, chalk, and clay. Another patient, a 34-year-old African American woman, suffered from a lifelong desire to eat dirt, which she was able to resist, but experienced pagophagia during pregnancy and later when she developed iron deficiency anemia.4 In another case series, Kushner et al5 describes a 35-year-old woman with iron deficiency anemia with pagophagia presenting 2 years after Roux-en-Y. Her history was significant for eating clay as a child, but this new-onset pagophagia was so intense she purchased 2 snow cone machines, one for home and one for work, to feed her urges. Another patient, a 45-year-old African American woman, had an irresistible craving for calcium carbonate antacids, eating 40 to 50 a day, as well as several 30-ounce cups of ice.5 A third case report details a 33-year-old woman with iron deficiency anemia who presented with nocturnal pagophagia after Roux-en-Y anastomosis. She repeatedly rose during the night to eat the frost off the ice maker in her refrigerator.6 Another case described a female patient who ate cardboard after having a Roux-en-Y.2
Common themes in these case reports are female sex, Roux-en-Y, and dramatic resurgence of previously noted pica behaviors after gastric bypass surgery. Several studies have shown that pagophagia and pica in patients who are iron deficient or have iron deficiency anemia can be rapidly curbed with iron supplements.5 Ms. O, who has low iron, is taking iron supplementation, yet continues to experience pica cravings, albeit less severely. Her pica could be psychiatric in origin, perhaps related to her history of anxiety.
OUTCOME: Combination therapy
We start Ms. O on ziprasidone, 80 mg twice a day, restart lorazepam, 1 mg/d, and schedule monthly follow-up appointments to monitor her pica symptoms. We prescribe ziprasidone because it could treat paranoia and preoccupations and is considered to be weight-neutral. She continues her supplements, including ferrous sulfate, 325 mg 3 times daily. Ms. O attends weekly behavioral therapy sessions, during which the therapist monitors her mood and cravings with response prevention, which entails purposely avoiding behaviors after initiating a distressing stimulus. Ms. O responds well to medication and psychotherapy 1 month after the gastric bezoar removal, and she reports a decreased urge to eat cardboard. She is able to increase the amount of time she can go without eating non-nutritive substances—once daily, rather than repeatedly throughout the day.
The authors’ observations
Each patient with pica likely needs customized care. Children need to be supervised to prevent ingestion of lead-containing substances such as paint chips. Iron supplements are recommended for iron deficiency anemia and prophylaxis for iron deficiency anemia in Roux-en-Y patients.3,4 Pica in pregnant patients should be addressed to maintain adequate nutrition and prevent accidental poisonings.7 Behavioral intervention strategies are based on positive reinforcement and punishment (Table).8 A report of 3 young children with pica noted successful treatment of one with automatic reinforcement, and the other 2 with a combination of social and automatic reinforcement.9 There are no FDA-approved medications for pica. Positive effects have been seen with SSRIs, bupropion, atypical antipsychotics, buprenorphine, and chlorimipramine.10 Olanzapine has shown positive results as a treatment for pica.11 Most pica patients need concurrent psychotherapy.10
Table
Behavioral interventions for pica
| Intervention | Comments |
|---|---|
| Environmental enrichment | Providing additional stimulus to increase neuronal activity and focus behaviors |
| Noncontingent reinforcement | Presenting reinforcers according to a fixed schedule |
| Differential reinforcement | Desired behaviors are reinforced and inappropriate behaviors are ignored |
| Response blocking | Physically block a patient’s attempts to eat nonedible items |
| Source: Reference 8 | |
Related Resources
- Blinder BJ, Salama C. An update on pica: prevalence, contributing causes, and treatment. Psychiatric Times. www.psychiatrictimes.com/display/article/10168/1159376?pageNumber=1. Published May 1, 2008.
- Nurcombe B. Developmental disorders of attachment, feeding, elimination, & sleeping. In: Ebert MH, Loosen PT, Nurcombe B, et al, eds. CURRENT diagnosis & treatment: psychiatry. 2nd ed. New York, NY: McGraw Hill; 2008.
Drug Brand Names
- Buprenorphine • Subutex
- Bupropion • Wellbutrin, Zyban
- Chlorimipramine • Anafranil
- Esomeprazole • Nexium
- Fluoxetine • Prozac
- Lorazepam • Ativan
- Olanzapine • Zyprexa
- Ziprasidone • Geodon
Disclosure
The authors report no financial relationship with any company whose products are mentioned in this article or with manufacturers of competing products.
1. Diagnostic and statistical manual of mental disorders, 4th ed, text rev. Washington DC: American Psychiatric Association; 2000.
2. Patton W, Gibbs K. Cardboard bezoar complicating laparoscopic gastric bypass. Surg Obes Relat Dis. 2010;6(3):313-315.
3. Nurcombe B. Developmental disorders of attachment feeding, elimination, & sleeping. In: Ebert MH, Loosen PT, Nurcombe B, et al, eds. CURRENT diagnosis & treatment: psychiatry. 2nd ed. New York, NY: McGraw Hill; 2008.
4. Kushner F, Gleason B, Shanta-Retelny V. Reemergence of pica following gastric bypass surgery for obesity: a new presentation of an old problem. J Am Diet Assoc. 2004;104(9):1393-1397.
5. Kushner F, Shanta Retelny V. Emergence of pica (ingestion of non-food substances) accompanying iron deficiency anemia after gastric bypass surgery. Obes Surg. 2005;15(10):1491-1495.
6. Marinella MA. Nocturnal pagophagia complicating gastric bypass. Mayo Clin Proc. 2008;83(8):961.-
7. Bernstein B, Weinstein M. Normal pregnancy & prenatal care. In: DeCherney AH Nathan L, Goodwin TM, et al, eds. CURRENT diagnosis & treatment obstetrics & gynecology. 10th ed. New York, NY: McGraw Hill; 2007.
8. Piazza C, Fisher W, Hanley P, et al. Treatment of pica through multiple analyses of its reinforcing functions. J Appl Behav Anal. 1998;31(2):165-189.
9. Williams DE, McAdam D. Assessment behavioral treatment, and prevention of pica: clinical guidelines and recommendations for practitioners. Res Dev Disabil. 2012;33(6):2050-2057.
10. Blinder BJ, Salama C. An update on pica: prevalence contributing causes, and treatment. Psychiatric Times. http://www.psychiatrictimes.com/display/article/10168/1159376?pageNumber=1. Published May 1, 2008. Accessed January 23, 2013.
11. Lerner AJ. Treatment of pica behavior with olanzapine. CNS Spectr. 2008;13(1):19.-
Ceramides
Structured in lamellar sheets, the primary lipids of the epidermis – ceramides, cholesterol, and free fatty acids – play a crucial role in the barrier function of the skin. Ceramides have come to be known as a complex family of lipids (sphingolipids – a sphingoid base and a fatty acid) involved in cell signaling in addition to their role in barrier homeostasis and water retention. In fact, ceramides are known to play a critical role in cell proliferation, differentiation, and apoptosis (Food Chem. Toxicol. 2009;47:681-6). Significantly, they cannot be replenished or obtained through natural sources, but synthetic ceramides, studied since the 1950s, are increasingly sophisticated and useful.
This column will review some key aspects of natural human ceramides as well as topically applied synthetic versions (also known as pseudoceramides), which are thought to ameliorate the structure and function of ceramide-depleted skin.
Ceramide structure and function
Lipids in the stratum corneum (SC) play an important role in the barrier function of the skin. The intercellular lipids of the SC are thought to be composed of approximately equal proportions of ceramides (J. Invest. Dermatol. 1987;88:2s-6s), cholesterol, and fatty acids (Am. J. Clin. Dermatol. 2003;4:107-29). Ceramides are not found in significant supply in lower levels of the epidermis, such as the stratum granulosum or basal layer. This implies that terminal differentiation is an important component of the natural production of ceramides, of which there are at least nine classes in the SC. Ceramide 1 was first identified in 1982. In addition to ceramides 1 to 9, there are two protein-bound ceramides classified as ceramides A and B, which are covalently bound to cornified envelope proteins, such as involucrin (Bouwstra JA, Pilgrim K, Ponec M. Structure of the skin barrier, in "Skin Barrier," Elias PM, Feingold KR, Eds. New York: Taylor & Francis, 2006, p. 65) .
Ceramides are named based on the polarity and composition of the molecule. As suggested above, the foundational ceramide structure is a fatty acid covalently bound to a sphingoid base. The various classes of ceramides are grouped according to the arrangements of sphingosine (S), phytosphingosine (P), or 6-hydroxysphingosine (H) bases, to which an alpha-hydroxy (A) or nonhydroxy (N) fatty acid is attached, in addition to the presence or absence of a discrete omega-esterified linoleic acid residue (J. Lipid. Res. 2004;45:923-32).

Ceramide 1 is unique in that it is nonpolar, and it contains linoleic acid. The special function of ceramide 1 in the SC is typically ascribed to its unique structure, which is thought to allow it to act as a molecular rivet, binding the multiple bilayers of the SC (J. Invest. Dermatol. 1987;88:2s-6s). This would explain the stacking of lipid bilayers in lamellar sheets observed in the barrier. Ceramides 1, 4, and 7 exhibit critical functions in terms of epidermal integrity by serving as the primary storage areas for linoleic acid, an essential fatty acid with significant roles in the epidermal lipid barrier (J. Invest. Dermatol. 1980;74:230-3). Although all epidermal ceramides are produced from a lamellar body–derived glucosylceramide precursor, sphingomyelin-derived ceramides (ceramides 2 and 5) are essential for maintaining the integrity of the SC (J. Lipid. Res. 2000;41:2071-82). It is worth noting that because an alkaline pH suppresses beta-glucocerebrosidase and acid sphingomyelinase activity (J. Invest. Dermatol. 2005;125:510-20), alkaline soaps can exacerbate poor barrier formation.
Exposure to UVB radiation and cytokines has been associated with an increase in the regulatory enzyme for ceramide synthesis, serine palmitoyltransferase, and it has been determined that in response to UVB exposure, the epidermis upregulates sphingolipid synthesis at the mRNA and protein levels (J. Lipid. Res. 1998;39:2031-8).
Synthetic ceramides
Skin conditions such as atopic dermatitis (AD), psoriasis, contact dermatitis, and some genetic disorders have been associated with depleted ceramide levels (Am. J. Clin. Dermatol. 2005;6:215-23), but these diseases can be ameliorated through the use of exogenous ceramides or their analogues (topical ceramide replacement therapy) (Curr. Med. Chem. 2010;17:2301-24; J. Dermatol. Sci. 2008;51:37-43; Am. J. Clin. Dermatol. 2005;6:215-23). Notably, the activities of enzymes in the SC, particularly ceramidase, sphingomyelin deacylase, and glucosylceramide deacylase, have been shown to be elevated in epidermal AD (Am. J. Clin. Dermatol. 2005;6:215-23).
Synthetic ceramides, or pseudoceramides, contain hydroxyl groups, two alkyl groups, and an amide bond – the same key structural components as natural ceramides. Consequently, various synthetic ceramides have been reported to form the multilamellar structure observed in the intercellular spaces of the SC (J. Lipid. Res. 1996;37:361-7).
Coderch et al., in a review of ceramides and skin function, endorsed the potential of topical therapy for several skin conditions using complete lipid mixtures and some ceramide supplementation, as well as the topical delivery of lipid precursors (Am. J. Clin. Dermatol. 2003;4:107-29). And, in fact, the topical application of synthetic ceramides has been shown to speed up the repair of impaired SC (J. Clin. Invest. 1994;94:89-96; Dermatology 2005;211:128-34). Recent reports by Tokudome et al. also indicate that the application of sphingomyelin-based liposomes effectively augments the levels of various ceramides in cultured human skin models (Skin Pharmacol. Physiol. 2011;24:218-23; J. Liposome Res. 2010;20:49-54).
In 2005, de Jager et al. used small-angle and wide-angle x-ray diffraction to show that lipid mixtures prepared with well-defined synthetic ceramides exhibit organization and lipid-phase behavior that are very similar to those of lamellar and lateral SC lipids, and can be used to further elucidate the molecular structure and roles of individual ceramides (J. Lipid. Res. 2005;46:2649-56).
In light of the uncertainty regarding the metabolic impact of pseudoceramides, in 2008, Uchida et al. compared the effects of two chemically unrelated, commercially available products to exogenous cell-permeant or natural ceramide on cell growth and apoptosis thresholds. Using cultured human keratinocytes, the investigators found that the commercial ceramides did not suppress keratinocyte growth or increase cell toxicity, as did the cell-permeant. The investigators suggested that these findings buttress the preclinical studies indicating that these pseudoceramides are safe for topical application (J. Dermatol. Sci. 2008;51:37-43).
Kang et al. recently conducted studies of synthetic ceramide derivatives of PC-9S (N-ethanol-2-mirystyl-3-oxostearamide), which, itself, has been shown to be effective in atopic and psoriatic patients. Both studies, conducted in NC/Nga mice, demonstrated that the topical application of the derivative K6PC-9 or the derivative K6PC-9p reduced skin inflammation and AD symptoms. According to the authors, K6PC-9 warrants consideration as a topical agent for AD, and K6PC-9p warrants consideration as a treatment for inflammatory skin diseases in general (Int. Immunopharmacol. 2007;7:1589-97; Exp. Dermatol. 2008;17:958-64).
Subsequently, Kang et al. studied the effects of another ceramide derivative of PC-9S, K112PC-5 (2-acetyl-N-(1,3-dihydroxyisopropyl)tetradecanamide), on macrophage and T-lymphocyte function in primary macrophages and splenocytes, respectively. The researchers also studied the impact of topically applied K112PC-5 on skin inflammation and AD in NC/Nga mice. Among several findings, the investigators noted that K112PC-5 suppressed AD induced by extracts of dust mites, Dermatophagoides pteronyssinus and Dermatophagoides farinae, with the pseudoceramide exhibiting in vitro and in vivo anti-inflammatory activity. They concluded that K112PC-5 is another synthetic ceramide derivative with potential as a topical agent for the treatment of AD (Arch. Pharm. Res. 2008;31:1004-9).
In 2009, Morita et al. studied the potential adverse effects of the synthetic pseudoceramide SLE66, which has demonstrated the capacity to improve xerosis, pruritus, and scaling of human skin. They found that the tested product failed to provoke cutaneous irritation or sensitization in animal and human studies. In addition, they did not observe any phototoxicity or photosensitization, and they established 1,000 mg/kg/day (the highest level tested) as the no-observed-adverse-effect (NOAEL) for systemic toxicity after oral administration or topical application (Food Chem. Toxicol. 2009;47:669-73).
Conclusion
Ceramides are among the primary lipid constituents, along with cholesterol and fatty acids, of the lamellar sheets found in the intercellular spaces of the SC. Together, these lipids maintain the water permeability barrier role of the skin. Ceramides also play an important role in cell signaling. Research over the last several decades, particularly the last 20 years, indicates that topically applied synthetic ceramide agents can effectively compensate for diminished ceramide levels associated with various skin conditions.
Dr. Baumann is in private practice in Miami Beach. She did not disclose any conflicts of interest. To respond to this column, or to suggest topics for future columns, write to her at [email protected].
Structured in lamellar sheets, the primary lipids of the epidermis – ceramides, cholesterol, and free fatty acids – play a crucial role in the barrier function of the skin. Ceramides have come to be known as a complex family of lipids (sphingolipids – a sphingoid base and a fatty acid) involved in cell signaling in addition to their role in barrier homeostasis and water retention. In fact, ceramides are known to play a critical role in cell proliferation, differentiation, and apoptosis (Food Chem. Toxicol. 2009;47:681-6). Significantly, they cannot be replenished or obtained through natural sources, but synthetic ceramides, studied since the 1950s, are increasingly sophisticated and useful.
This column will review some key aspects of natural human ceramides as well as topically applied synthetic versions (also known as pseudoceramides), which are thought to ameliorate the structure and function of ceramide-depleted skin.
Ceramide structure and function
Lipids in the stratum corneum (SC) play an important role in the barrier function of the skin. The intercellular lipids of the SC are thought to be composed of approximately equal proportions of ceramides (J. Invest. Dermatol. 1987;88:2s-6s), cholesterol, and fatty acids (Am. J. Clin. Dermatol. 2003;4:107-29). Ceramides are not found in significant supply in lower levels of the epidermis, such as the stratum granulosum or basal layer. This implies that terminal differentiation is an important component of the natural production of ceramides, of which there are at least nine classes in the SC. Ceramide 1 was first identified in 1982. In addition to ceramides 1 to 9, there are two protein-bound ceramides classified as ceramides A and B, which are covalently bound to cornified envelope proteins, such as involucrin (Bouwstra JA, Pilgrim K, Ponec M. Structure of the skin barrier, in "Skin Barrier," Elias PM, Feingold KR, Eds. New York: Taylor & Francis, 2006, p. 65) .
Ceramides are named based on the polarity and composition of the molecule. As suggested above, the foundational ceramide structure is a fatty acid covalently bound to a sphingoid base. The various classes of ceramides are grouped according to the arrangements of sphingosine (S), phytosphingosine (P), or 6-hydroxysphingosine (H) bases, to which an alpha-hydroxy (A) or nonhydroxy (N) fatty acid is attached, in addition to the presence or absence of a discrete omega-esterified linoleic acid residue (J. Lipid. Res. 2004;45:923-32).
Ceramide 1 is unique in that it is nonpolar, and it contains linoleic acid. The special function of ceramide 1 in the SC is typically ascribed to its unique structure, which is thought to allow it to act as a molecular rivet, binding the multiple bilayers of the SC (J. Invest. Dermatol. 1987;88:2s-6s). This would explain the stacking of lipid bilayers in lamellar sheets observed in the barrier. Ceramides 1, 4, and 7 exhibit critical functions in terms of epidermal integrity by serving as the primary storage areas for linoleic acid, an essential fatty acid with significant roles in the epidermal lipid barrier (J. Invest. Dermatol. 1980;74:230-3). Although all epidermal ceramides are produced from a lamellar body–derived glucosylceramide precursor, sphingomyelin-derived ceramides (ceramides 2 and 5) are essential for maintaining the integrity of the SC (J. Lipid. Res. 2000;41:2071-82). It is worth noting that because an alkaline pH suppresses beta-glucocerebrosidase and acid sphingomyelinase activity (J. Invest. Dermatol. 2005;125:510-20), alkaline soaps can exacerbate poor barrier formation.
Exposure to UVB radiation and cytokines has been associated with an increase in the regulatory enzyme for ceramide synthesis, serine palmitoyltransferase, and it has been determined that in response to UVB exposure, the epidermis upregulates sphingolipid synthesis at the mRNA and protein levels (J. Lipid. Res. 1998;39:2031-8).
Synthetic ceramides
Skin conditions such as atopic dermatitis (AD), psoriasis, contact dermatitis, and some genetic disorders have been associated with depleted ceramide levels (Am. J. Clin. Dermatol. 2005;6:215-23), but these diseases can be ameliorated through the use of exogenous ceramides or their analogues (topical ceramide replacement therapy) (Curr. Med. Chem. 2010;17:2301-24; J. Dermatol. Sci. 2008;51:37-43; Am. J. Clin. Dermatol. 2005;6:215-23). Notably, the activities of enzymes in the SC, particularly ceramidase, sphingomyelin deacylase, and glucosylceramide deacylase, have been shown to be elevated in epidermal AD (Am. J. Clin. Dermatol. 2005;6:215-23).
Synthetic ceramides, or pseudoceramides, contain hydroxyl groups, two alkyl groups, and an amide bond – the same key structural components as natural ceramides. Consequently, various synthetic ceramides have been reported to form the multilamellar structure observed in the intercellular spaces of the SC (J. Lipid. Res. 1996;37:361-7).
Coderch et al., in a review of ceramides and skin function, endorsed the potential of topical therapy for several skin conditions using complete lipid mixtures and some ceramide supplementation, as well as the topical delivery of lipid precursors (Am. J. Clin. Dermatol. 2003;4:107-29). And, in fact, the topical application of synthetic ceramides has been shown to speed up the repair of impaired SC (J. Clin. Invest. 1994;94:89-96; Dermatology 2005;211:128-34). Recent reports by Tokudome et al. also indicate that the application of sphingomyelin-based liposomes effectively augments the levels of various ceramides in cultured human skin models (Skin Pharmacol. Physiol. 2011;24:218-23; J. Liposome Res. 2010;20:49-54).
In 2005, de Jager et al. used small-angle and wide-angle x-ray diffraction to show that lipid mixtures prepared with well-defined synthetic ceramides exhibit organization and lipid-phase behavior that are very similar to those of lamellar and lateral SC lipids, and can be used to further elucidate the molecular structure and roles of individual ceramides (J. Lipid. Res. 2005;46:2649-56).
In light of the uncertainty regarding the metabolic impact of pseudoceramides, in 2008, Uchida et al. compared the effects of two chemically unrelated, commercially available products to exogenous cell-permeant or natural ceramide on cell growth and apoptosis thresholds. Using cultured human keratinocytes, the investigators found that the commercial ceramides did not suppress keratinocyte growth or increase cell toxicity, as did the cell-permeant. The investigators suggested that these findings buttress the preclinical studies indicating that these pseudoceramides are safe for topical application (J. Dermatol. Sci. 2008;51:37-43).
Kang et al. recently conducted studies of synthetic ceramide derivatives of PC-9S (N-ethanol-2-mirystyl-3-oxostearamide), which, itself, has been shown to be effective in atopic and psoriatic patients. Both studies, conducted in NC/Nga mice, demonstrated that the topical application of the derivative K6PC-9 or the derivative K6PC-9p reduced skin inflammation and AD symptoms. According to the authors, K6PC-9 warrants consideration as a topical agent for AD, and K6PC-9p warrants consideration as a treatment for inflammatory skin diseases in general (Int. Immunopharmacol. 2007;7:1589-97; Exp. Dermatol. 2008;17:958-64).
Subsequently, Kang et al. studied the effects of another ceramide derivative of PC-9S, K112PC-5 (2-acetyl-N-(1,3-dihydroxyisopropyl)tetradecanamide), on macrophage and T-lymphocyte function in primary macrophages and splenocytes, respectively. The researchers also studied the impact of topically applied K112PC-5 on skin inflammation and AD in NC/Nga mice. Among several findings, the investigators noted that K112PC-5 suppressed AD induced by extracts of dust mites, Dermatophagoides pteronyssinus and Dermatophagoides farinae, with the pseudoceramide exhibiting in vitro and in vivo anti-inflammatory activity. They concluded that K112PC-5 is another synthetic ceramide derivative with potential as a topical agent for the treatment of AD (Arch. Pharm. Res. 2008;31:1004-9).
In 2009, Morita et al. studied the potential adverse effects of the synthetic pseudoceramide SLE66, which has demonstrated the capacity to improve xerosis, pruritus, and scaling of human skin. They found that the tested product failed to provoke cutaneous irritation or sensitization in animal and human studies. In addition, they did not observe any phototoxicity or photosensitization, and they established 1,000 mg/kg/day (the highest level tested) as the no-observed-adverse-effect (NOAEL) for systemic toxicity after oral administration or topical application (Food Chem. Toxicol. 2009;47:669-73).
Conclusion
Ceramides are among the primary lipid constituents, along with cholesterol and fatty acids, of the lamellar sheets found in the intercellular spaces of the SC. Together, these lipids maintain the water permeability barrier role of the skin. Ceramides also play an important role in cell signaling. Research over the last several decades, particularly the last 20 years, indicates that topically applied synthetic ceramide agents can effectively compensate for diminished ceramide levels associated with various skin conditions.
Dr. Baumann is in private practice in Miami Beach. She did not disclose any conflicts of interest. To respond to this column, or to suggest topics for future columns, write to her at [email protected].

Knee Pain After Falling Off Ladder
ANSWER
The radiograph shows a lucency within the lateral tibial plateau and tibial metaphysis, consistent with a fracture. It is mildly depressed and slightly comminuted.
Fluid collection is also evident on the lateral view, likely reflecting a lipohemarthrosis. The patient was placed in a knee immobilizer and made non–weight-bearing. She was instructed to follow up with an orthopedist when she returned home (as she was visiting from out of town).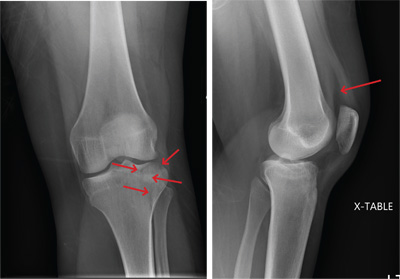

A 25-year-old woman presents for evaluation of left knee pain secondary to a fall. She states she was descending a ladder when she missed a step while still several feet above the ground. She landed on her left foot, awkwardly twisting her leg. She now has swelling and pain in her knee and difficulty bearing weight on that leg. Her medical history is unremarkable. Examination reveals a moderate amount of swelling that limits her ability to flex her left knee. She has diffuse tenderness throughout the knee. Because of the swelling and the patient’s severe discomfort, instability tests are not performed. She has good distal pulses and sensation. Radiographs of the knee are obtained. What is your impression?