User login
The Flu, or a Problem with His Pacemaker?
ANSWER
This ECG is remarkable for ventricular pacing at a rate of 70 beats/min, with an underlying sinus rhythm at the same rate as the pacemaker but dissociated from ventricular pacing. Ventricular pacing is evidenced by the presence of a pacing spike before each QRS complex, and the fact that each QRS complex in all leads is wide (200 ms) and does not demonstrate variability within an ECG lead. The T waves are similar in each lead as well. A left-axis deviation of –83° is attributable to pacing from the right ventricle.
What is interesting to note is that P waves are visible and are at a rate very close to that of the ventricular paced beats; however, they show no association with the pacing spike or the QRS complexes. This is most evident in lead V1 and the rhythm strip of lead I, which shows the P waves marching through the QRS and T-wave complexes without being associated with any ventricular conduction. This is an unusual situation in which the sinus rate and the paced ventricular rate are very similar.
Interrogation of the pacemaker generator revealed that the programming had been inadvertently changed from DDDR at a rate of 60 beats/min to VVI at a rate of 70 beats/min. After the device was reprogrammed to its original settings, the patient’s symptoms resolved.

A 75-year-old man presents to your office with complaints of shortness of breath. He states he has had “the flu” for the past week, but it doesn’t seem to be getting any better. His shortness of breath has persisted without change, and he is concerned he may be developing pneumonia. He denies having a productive cough, fevers, chills, or night sweats. Medical history is remarkable for GERD, hyperlipidemia, hypertension, and complete heart block with implantation of a dual-chamber permanent pacemaker in 2010. He has had several surgeries, including a right inguinal hernia repair and an appendectomy. Family history is positive for breast cancer, colon cancer, and stroke. There is no family history of cardiac or pulmonary disease. Social history reveals a retired accountant who lives at home with his wife. He has an occasional brandy in the evening and has never smoked. His current medications include metoprolol, rosu¬\vastatin, and omeprazole. He has no known drug allergies. The review of systems is unremarkable, with the exception of the shortness of breath. The patient is concerned, however, that since his pacemaker was interrogated one week ago, he hasn’t “felt the same.” Physical examination reveals a blood pressure of 130/70 mm Hg; pulse, 70 beats/min; respiratory rate, 16 breaths/min-1; temperature, 36.6°C; and O2 saturation, 97% on room air. The patient’s weight is 105 kg. The cardiovascular exam reveals a regular rate of 70 beats/min, and a grade II/VI early systolic murmur best heard at the left upper sternal border and without radiation. There are no rubs, gallops, or bruits. The pulmonary exam reveals scattered crackles in the right lower chest, which clear with coughing. There are no rhonchi or bronchial breath sounds. All other exams yield normal results. The patient provides a copy of an interrogation report from one year ago, which states his pacemaker is programmed DDDR at a rate of 60 beats/min, with an upper tracking and sensing rate of 130 beats/min, a paced AV delay of 150 ms, and a sensed AV delay of 120 ms. Given the patient’s concern about his most recent interrogation, you call an experienced practitioner to determine whether the patient’s device is functioning appropriately. While waiting, you obtain an ECG, which reveals the following: a ventricular rate of 70 beats/min; PR interval, not measurable; QRS duration, 200 ms; QT/QTc interval, 500/540 ms; no P axis; R axis, –83°; and T axis, 71°. What is your interpretation, and is there any concern regarding his pacemaker function?
All of Her Friends Say She Has Ringworm
ANSWER
The correct answer is pityriasis rosea (PR; choice “d”), which is commonly seen in patients ages 10 to 35 and is about twice as likely to occur in women as in men.
Lichen planus (LP; choice “a”) can mimic PR but lacks the peculiar centripetal scale and oval shape. Furthermore, it does not present with a herald patch.
Guttate psoriasis (choice “b”) could easily be confused for PR. However, it displays heavier white uniform scales with a salmon-pink base, tends to have a distinctly round configuration, and does not involve the appearance of a herald patch.
Secondary syphilis (choice “c”) can usually be ruled out by the sexual history, but also by the lack of a herald patch and the absence of centripetal scaling. Highly variable in appearance, the lesions of secondary syphilis are often seen on the palms.
DISCUSSION
PR was first described in 1860 by Camille Gibert, who used the term pityriasis to describe the fine scale seen with this condition, and chose the term rosea to denote the rosy or pink color.
For a variety of reasons, PR is assumed to be a viral exanthema since, as with many such eruptions, its incidence clusters in the fall and spring, it occurs in close contacts and families, and it is commonly seen in immunocompromised patients. In addition, acquiring the condition appears to confer lifelong immunity.
However, the jury is still out with regard to the exact virus responsible for the disease. Human herpesviruses 6 and 7 are the strongest candidates in terms of antibody production, but no herpesviral particles have been detected in tissue samples.
The so-called herald patch appears initially, in a majority of cases, as a salmon-pink patch that can become as large as 5 to 10 cm, on the trunk or arms. The smaller oval lesions begin to appear within a week or two, averaging 1 to 2 cm in diameter; most display the characteristic “centripetal” scaling, clearly sparing the lesions’ periphery and serving as an essentially pathognomic finding.
On darker-skinned patients, the lesions (including the herald patch) will tend to be brown to black. The examiner must then look for the other characteristic aspects of PR, including the oval (as opposed to round) shape, the long axes of which will often parallel the skin tension lines on the back to produce what is termed the “Christmas tree pattern.” In the author’s experience, the most consistent diagnostic finding is the centripetal scaling seen in at least a few lesions.
Since secondary syphilis is a major item in the differential, obtaining a careful sexual history is essential. If this is uncertain, or if the lesions are not a good fit for PR, obtaining a punch biopsy and serum rapid plasma reagin is necessary. The biopsy in secondary syphilis will show an infiltrate largely composed of plasma cells.
TREATMENT
Once the diagnosis of PR is made, patient education is essential. Affected patients should be reassured about the benign and self-limiting nature of the problem, but also about the likelihood that the condition will persist for up to nine weeks. Darker-skinned patients need to understand that the hyperpigmentation will last for months after the condition has resolved.
Relief of the itching experienced by 75% of PR patients can be achieved with topical steroids (eg, triamcinolone 0.1% cream) and oral antihistamines at bedtime (eg, hydroxyzine 25 to 50 mg) and/or during the daytime (cetirizine 10 mg/d), plus the liberal use of soothing OTC lotions (eg, those containing camphor and menthol). Systemic steroids appear to prolong the condition and are not terribly helpful in controlling the symptoms. In severe cases, phototherapy (narrow-band UVB) can be useful in controlling the itching.
Three weeks ago, a 25-year-old woman noticed an asymp¬tomatic lesion of unknown origin on her chest. Since then, smaller versions have appeared in “crops” on her trunk, arms, and lower neck. Friends were unanimous in their opinion that she had “ringworm,” so she consulted her pharmacist, who recommended clotrimazole cream. Despite her use of it, however, the lesions continue to increase in number. Her original lesion has become less red and scaly, though. The patient has felt fine from the outset and maintains that she is “quite healthy” in other respects. Employed as an IT technician, she denies any exposure to children, pets, or sexually transmitted diseases. The patient, who is African-American, has type V skin. Her original lesion—located on her left inframammary chest—is dark brown, macular, oval to round, and measures about 3.8 cm. On her trunk, arms, and lower neck, 15 to 20 oval, papulosquamous lesions are seen; these are widely scattered, all hyperpigmented (brown), and average 1.5 cm in diameter. Several of these smaller lesions have scaly centers that spare the peripheral margins. The long axes of her oval back lesions are parallel with natural lines of cleavage in the skin.

ACO Insider: An Rx for rising health spending
With the looming federal "sequestration" threatening drastic spending cuts, our nation’s leaders are finally confronting the main drivers of our deficit dilemma: government "entitlement" programs such as Social Security, Medicare, and Medicaid.
Meanwhile, there is broad consensus that many of our runaway health care costs are avoidable. Our current fee-for-service health care payment system rewards higher-intensity care in greater volume, with no consequence for lack of coordination. It is a significant reason that our health care system is fragmented, inefficient, and too costly.
Federal government receipts total approximately 19% of our nation’s gross domestic product. Yet if our health care spending trends remain unchecked, by 2035 Medicare and Medicaid alone are predicted to consume 13% of GDP. By 2080, Medicare and Medicaid will consume all federal taxes, while total public and private health spending will claim almost 50% of GDP. We will have to borrow to pay for the rest of the federal government’s obligations: defense, education, transportation, etc.
As of 2012, our nation is already $16 trillion in the hole and counting. Sticking with the status quo would be a disastrous choice.
However, if medical providers work together and accept new payment incentives that reward value instead of volume, we can help fix America’s broken health care system.
That cannot be done remotely in Washington. It requires health care providers in each community cooperating to increase health care quality and cut cumulative costs.
Quality, savings, and patient satisfaction all must be achieved for providers to receive incentive payments under the new health care payment model, called "value-based reimbursement."
There is plenty of waste to be found and eliminated. Last summer, the Institute of Medicine concluded that America wastes about 30% of its health care spending – some $750 billion a year – on unneeded care, excessive paperwork, fraud, and other inefficiencies.
With basic health care becoming unaffordable for many ordinary working families and individuals, that amount of waste is unacceptable.
Although no one can hope to eradicate it overnight, it’s time somebody did something about it. America is asking physicians to step up and form teams, teams such as accountable care organizations.
By doing so, you can help ensure access, improve patient care, promote efficiency, stretch health care dollars, and make patients more of a partner in their treatment. ACOs typically receive 50% of the savings they create, which should be considered compensation to you for professional services.
As healers with a calling to serve, you have an opportunity to do your part to enhance patient care while helping to improve our nation’s fiscal health. Besides empowering, and paying, physicians to regain control of the physician/patient relationship, your patients, your profession, and your nation need you.
Mr. Bobbitt is a senior partner and head of the Health Law Group at the Smith Anderson law firm in Raleigh, N.C. He has many years’ experience assisting physicians form integrated delivery systems. He has spoken and written nationally to primary care physicians on the strategies and practicalities of forming or joining ACOs. This article is meant to be educational and does not constitute legal advice. For additional information, readers may contact the author at [email protected], or at 919-821-6612.

Third drug approved for metastatic, treatment-resistant GIST
Regorafenib, a multikinase inhibitor, has been approved as a treatment for locally advanced, unresectable, or metastatic gastrointestinal stromal tumor in people who have been treated with imatinib and sunitinib, the other two treatments approved for GIST, the Food and Drug Administration announced on Feb. 26.
Regorafenib was first approved in September as a treatment for metastatic colorectal cancer, and "provides an important new treatment option for patients with GIST in which other approved drugs are no longer effective," Dr. Richard Pazdur, director of the Office of Hematology and Oncology Products in the FDA’s Center for Drug Evaluation and Research, said in the statement. The recommended dose is 160 mg orally once a day for the first 21 days of each 28-day cycle, according to the prescribing information for regorafenib, which is marketed as Stivarga by Bayer HealthCare Pharmaceuticals.
Approval was based on the interim results of the phase III GRID (GIST – Regorafenib In Progressive Disease) study, comparing placebo plus best supportive care (BSC) to regorafenib plus BSC in 199 patients with locally advanced, unresectable, or metastatic GIST, previously treated with imatinib and sunitinib, according to the FDA statement, as well as the statement issued by the manufacturer. The median progression-free survival (the primary endpoint) was 4.8 months among those on regorafenib, compared with 0.8 months among those on placebo, a statistically significant difference (Lancet 381;9863:295-302). At the time of the planned interim analysis, there was no statistically significant difference in overall survival.
The most common adverse events associated with treatment, reported by at least 30% of those treated, included hand-foot syndrome, diarrhea, mucositis, dysphonia, asthenia/fatigue, hypertension, reduced appetite and food intake, and rash. Serious adverse events, affecting less than 1% of patients, included hepatotoxicity, severe bleeding, blistering and peeling of skin, very high blood pressures requiring emergency treatment, heart attacks, and intestinal perforations. The regorafenib label includes a boxed warning about the risk of hepatotoxicity associated with treatment, noting that severe and sometimes fatal hepatotoxicity has been reported in clinical trials, and that hepatic function should be monitored before and during treatment.
Regorafenib inhibits multiple kinases that are involved in normal cellular functions, as well as oncogenesis, tumor angiogenesis, and maintenance of the tumor microenvironment, according to the manufacturer.
Regorafenib was the focus of the FDA’s priority review program, which evaluates the drug in 6 months instead of the usual 12 months, and is designated for products "that may provide safe and effective therapy when no satisfactory alternative therapy exists, or offer significant improvement compared to marketed products," according to the FDA statement.
The FDA cites a National Cancer Institute estimate that 3,300-6,000 new cases of GIST are diagnosed every year in the United States, affecting mostly older adults. The previously approved colorectal cancer indication is for people who have metastatic colorectal cancer, who have been previously treated with fluoropyrimidine-, oxaliplatin- and irinotecan-based chemotherapy, an anti-VEGF therapy, and, if KRAS wild type, an anti-EGFR therapy.
Imatinib (Gleevec) and sunitinib (Sutent) are both orally administered kinase inhibitors.
The EHR Report Podcast: Optimal Use

Despite all the discussion of meaningful use of EHRs to earn federal incentives, what physicians seem most frustrated with is the lack of optimal use of their EHRs. In this podcast, Dr. Skolnik and Dr. Notte talk about what you can do to optimize your EHR and make your interactions with it easier and more effective throughout the clinical day.
To download the podcast, right-click here.
To read the related column, click here.
To listen via this Web page, click on the player below:
Survey of Academic PHM Programs in the US
Pediatric hospital medicine (PHM) is a relatively new field that has been growing rapidly over the past 20 years.[1] The field has been increasingly recognized for its contributions to high‐quality patient care, patient safety, systems improvement, medical education, and research.[2, 3, 4, 5, 6, 7, 8, 9] However, there appears to be significant variation among programs, even in basic factors such as how clinical effort is defined, the extent of in‐house coverage provided, and the scope of clinical services provided, and there exists a paucity of data describing these variations.[8]
Most previously published work did not specifically focus on academic programs,[2, 3, 8, 9] and specifically targeted hospital leadership,[2] practicing hospitalists,[3] residents,[7] and pediatric residency or clerkship directors,[4, 7] rather than hospitalist directors.[9] Furthermore, previous work focused on specific aspects of PHM programs such as education,[4, 7] value,[2] work environment,[9] and clinical practice,[3] rather than a more comprehensive approach.
We conducted a survey of academic PHM programs to learn about the current state and variation among programs across multiple domains (organizational, administrative, and financial). We speculated that:
- Many institutions currently lacking an academic PHM program were planning on starting a program in the next 3 years.
- Variability exists in hospitalist workload among programs.
- In programs providing clinical coverage at more than 1 site, variability exists in the relationship between the main site and satellite site(s) in terms of decision making, scheduling, and reporting of performance.
METHODS
Sample
We used the online American Medical Association Fellowship and Residency Electronic Interactive Database (FREIDA) to identify all 198 accredited pediatric residency training programs in the United States. A total of 246 hospitals were affiliated with these programs, and all of these were targeted for the survey. In addition, academic PHM program leaders were targeted directly with email invitations through the American Academy of Pediatrics (AAP) Section on Hospital Medicine LISTSERV.
Survey Instrument
A 49‐question online survey on the administrative, organizational, and financial aspects of academic PHM programs was developed with the input of academic PHM hospital leaders from Cincinnati Children's Hospital Medical Center and St. Louis Children's Hospital. First, the survey questions were developed de novo by the researchers. Then, multiple hospitalist leaders from each institution took the survey and gave feedback on content and structure. Using this feedback, changes were made and then tested by the leaders taking the new version of the survey. This process was repeated for 3 cycles until consensus was reached by the researchers on the final version of the survey. The survey contained questions that asked if the program provided coverage at a single site or at multiple sites and utilized a combination of open‐ended and fixed‐choice questions. For some questions, more than 1 answer was permitted. For the purposes of this survey, we utilized the following definitions adapted from the Society of Hospital Medicine. A hospitalist was defined as a physician who specializes in the practice of hospital medicine.[10] An academic PHM program was defined as any hospitalist practice associated with a pediatric residency program.[11] A nocturnist was defined as a hospitalist who predominantly works a schedule providing night coverage.[12]
Survey Administration
SurveyMonkey, an online survey software, was used to administer the survey. In June 2011, letters were mailed to all 246 hospitals affiliated with an accredited pediatric residency program as described above. These were addressed to either the hospital medicine director (if identified using the institutions Web site) or pediatric residency director. The letter asked the recipient to either participate in the survey or forward the survey to the physician best able to answer the survey. The letters included a description of the study and a link to the online survey. Of note, there was no follow‐up on this process. We also distributed the direct link to the survey and a copy of the letter utilizing the AAP Section on Hospital Medicine LISTSERV. Two reminders were sent through the LISTSERV in the month after the initial request. All respondents were informed that they would receive the deidentified raw data as an incentive to participate in the survey. Respondents were defined as those answering the first question, Does your program have an academic hospitalist program?
Statistical Analysis
Completed survey responses were extracted to Microsoft Excel (Microsoft Corp., Redmond, WA) for data analysis. Basic statistics were utilized to determine response rates for each question. Data were stratified for program type (single site or at multiple sites). For some questions, data were further stratified for the main site of multiple‐site programs for comparison to single‐site programs. In a few instances, more than 1 physician from a particular program responded to the survey. For these, the most appropriate respondent (PHM director, residency director, senior hospitalist) was identified utilizing the programs' publicly available Web site; only that physician's answers were used in the analysis.
Human Subjects Protection
This study was determined to be exempt from review by the Cincinnati Children's Hospital Medical Center and Washington University in St. Louis institutional review boards. All potential responders received written information about the survey. Survey design allowed for anonymous responses with voluntary documentation of program name and responders' contact information. The willingness to respond was qualified as implied consent. Data were deidentified prior to analysis and prior to sharing with the survey participants.
RESULTS
Response Rates
A total of 133 responses were received. Duplicate responses from the same program (13/133) were eliminated from the analysis. This yielded an overall response rate of 48.8% (120/246). A total of 81.7% (98/120) of institutions reported having an academic PHM program. Of the 18.3% (22/120) of institutions reporting not having a program, 9.1% (2/22) reported planning on starting a program in the next 3 years. Of the 98 respondents with an academic PHM program, 17 answered only the first survey question, Does your program have an academic hospitalist program? The remaining 81 completed surveys were left for further analysis. All of these respondents identified their program, and therefore we are certain that there were no duplicate responses in the analytic dataset. Of these, 23 (28%) indicated that their programs provided clinical care at multiple sites, and 58 (72%) indicated that their program provided care at a single site (Figure 1).

Administrative
Respondents reported wide variation for the definition of a 1.0 full‐time employee (FTE) hospitalist in their group. This included the units used (hours/year, weeks/year, shifts/year) as well as actual physician workload (Table 1). Weeks/year was the most common unit utilized by programs to define workload (66% of single‐site programs, 48% of multiple‐site programs), followed by hours/year (19%, 22%) and shifts/year (14%, 22%). The mean and median workload per FTE is represented (Table 1). The large ranges and the standard deviations from the mean indicate variability in workload per FTE (Table 1).
| Single‐Site Program | Multiple‐Site Programs | |||||||||
|---|---|---|---|---|---|---|---|---|---|---|
| % Programs | Mean | Median | SD | Range | % Programs | Mean | Median | SD | Range | |
| ||||||||||
| Weeks on service | 66 | 27.14 | 26 | 8.1 | 1246 | 48 | 27.2 | 24 | 9.6 | 1736 |
| Hours/year | 19 | 1886.25 | 1880 | 231.2 | 16002300 | 22 | 1767.33 | 1738 | 109.0 | 16641944 |
| Shifts/year* | 14 | 183 | 191 | 52.2 | 182240 | 22 | 191 | 184 | 38.3 | 155214 |
Scheduled in‐house hospitalist coverage also varied. Daytime coverage was defined as until 3 to 5 pm, evening coverage was defined a until 10 pm to midnight, and 24‐hour coverage was defined a 24/7. Programs reported plans to increase in‐house coverage with the implementation of the 2011 Accreditation Council for Graduate Medical Education (ACGME) resident work hours restrictions.[13] Among single‐site programs, there was a planned 50% increase in day/evening coverage (14% to 21%), with a planned decrease in day‐only coverage, and no change in 24/7 coverage (Table 2). Among the main sites of multiple‐site programs, there was a planned 50% increase in 24/7 in‐house coverage (35% to 52%), with a planned decrease in day‐only coverage, and no change in day/evening coverage (Table 3). Among the satellite sites of multiple‐site programs, there was a planned 9% increase in 24/7 coverage (41% to 50%), with a planned decrease in day‐only coverage, and no change in day/evening coverage (Table 2). Most programs reported that all hospitalists share night coverage (87% single site, 89% multiple sites) (Table 2). Multiple‐site programs were more likely than single‐site programs to use nocturnists, moonlighters, and incentives for those providing evening or night coverage (Table 2).
| Single Site (n=58) | Main Site of Multiple‐Site Programs (n=23) | |||
|---|---|---|---|---|
| Proportion | Response Rate | Proportion | Response Rate | |
| ||||
| Organizational | ||||
| Night shifts | .79 (46/58) | .83 (19/23) | ||
| All share nights | .87 (40/46) | .89 (17/19) | ||
| Nocturnists | .09 (4/46) | .26 (5/19) | ||
| Moonlighters | .04 (2/46) | .12 (2/19) | ||
| Night shift incentives | .74 (43/58) | .78 (18/23) | ||
| Financial | .12 (5/43) | .28 (5/18) | ||
| Time | .12 (5/43) | .22 (4/18) | ||
| No incentives | .79 (34/43) | .61 (11/18) | ||
| In‐house hospitalist coverage pre July 2011a | 1.0 (58/58) | 1.0 (23/23) | ||
| 24/7 | .29 (17/58) | .35 (8/23) | ||
| Day and evening | .14 (8/58) | .17 (4/23) | ||
| Day only | .57 (33/58) | .48 (11/23) | ||
| In‐house hospitalist coverage post July 2011a | 1.0 (58/58) | 1.0 (23/23) | ||
| 24/7 | .29 (17/58) | .52 (12/23) | ||
| Day and evening | .21 (12/58) | .17 (4/23) | ||
| Day only | .50 (29/58) | .30 (7/23) | ||
| Administrative | ||||
| Own division | .32 (18/57) | .98 (57/58) | .74 (17/23) | 1.0 (23/23) |
| Part of another division | .68 (39/57) | .26 (6/23) | ||
| Financial | ||||
| Revenues>expenses | .26 (14/53) | .91 (53/58) | .04 (1/23) | .04 (19/23) |
| Incentives supplement base salary | .45 (25/55) | .95 (55/58) | .48 (10/21) | .91 (21/23) |
| Metrics used to determine incentivesb | .47 (27/58) | .52 (12/23) | ||
| RVUs/MD | .85 (23/27) | .83 (10/12) | ||
| Costs/discharge | .19 (5/27) | .08 (1/12) | ||
| Financial reportingb | .81 (47/58) | .04 (19/23) | ||
| Charges | .64 (30/47) | .68 (13/19) | ||
| Collections | .66 (31/47) | .68 (13/19) | ||
| RVUs | .77 (36/47) | .47 (9/19) | ||
| Main Site (n=23) | Satellite Sites (n=51) | |||
|---|---|---|---|---|
| Proportion | Response Rate | Proportion | Response Rate | |
| In‐house hospitalist coverage pre July 2011 | 1.0 (23/23) | .80 (41/51) | ||
| 24/7 | .35 (8/23) | .41 (17/41) | ||
| Day and evening | .17 (4/23) | .10 (4/41) | ||
| Day only | .48 (11/23) | .49 (20/41) | ||
| In‐house hospitalist coverage post July 2011 | 1.0 (23/23) | |||
| 24/7 | .52 (12/23) | .50 (19/38) | .75 (38/51) | |
| Day and evening | .17 (4/23) | .11 (4/38) | ||
| Day only | .30 (7/23) | .39 (15/38) | ||
| Night shift coverage | .83 (19/23) | .78 (18/23) | ||
| All share nights | .89 (17/19) | .94 (17/18) | ||
| Nocturnists | .26 (5/19) | .22 (4/18) | ||
| Moonlighters | .12 (2/19) | .17 (3/18) | ||
The vast majority of multiple‐site programs reported that their different clinical sites are considered parts of a single hospitalist program (96%), and that there is a designated medical director for each site (83%). However, only 70% of multiple‐site programs report that decisions concerning physician coverage are made as a group, and only 65% report that scheduling is done centrally. In addition, there is variability in how quality, safety, and patient satisfaction is reported (group vs site). The majority of programs report sharing revenues and expenses among the sites (Table 4).
| Proportion | Response Rate | |
|---|---|---|
| Sites regularly collaborate on: | 1.0 (23/23) | |
| Quality improvement projects | .74 (17/23) | |
| Safety initiatives | .74 (17/23) | |
| Research | .48 (11/23) | |
| Have a designated hospitalist medical director for each site | .83 (19/23) | 1.0 (23/23) |
| Different sites considered parts of a single hospitalist program | .96 (22/23) | 1.0 (23/23) |
| Make decisions on program/coverage/hour changes as a group | .70 (16/23) | 1.0 (23/23) |
| Scheduling done centrally | .65 (15/23) | 1.0 (23/23) |
| Report or track the following as individual sites: | ||
| Quality measures | .43 (9/21) | .91 (21/23) |
| Safety measures | .48 (10/21) | .91 (21/23) |
| Patient satisfaction | .50 (10/20) | .87 (20/23) |
| Report or track the following as a group: | ||
| Quality measures | .33 (7/21) | .91 (21/23) |
| Safety measures | .33 (7/21) | .91 (21/23) |
| Patient satisfaction | .30 (6/20) | .87 (20/23) |
| Report or track the following as both individual sites and as a group: | ||
| Quality measures | .24 (5/21) | .91 (21/23) |
| Safety measures | .19 (4/21) | .91 (21/23) |
| Patient satisfaction | .25 (4/20) | .87 (20/23) |
| Sites share revenues and expenses | .67 (14/21) | .91 (21/23) |
Organizational
Of the single‐site programs that answered the question Is your hospital medicine program considered its own division or a section within another division? 32% reported that their programs were considered its own division, and 68% reported that they were a part of another division, predominately (62%) general pediatrics, but also a few (6% combined) within emergency medicine, critical care, physical medicine and rehabilitation, and infectious diseases. Of the multiple‐site programs, a majority of 74% programs were their own division, and 26% were part of another division (Table 2). Respondents reported that their satellite sites included pediatric units in small community hospitals, small pediatric hospitals, large nonpediatric hospitals with pediatric units, rehabilitation facilities, and Shriner orthopedic hospitals.
Financial
Of the single‐site programs that answered the question Do patient revenues produced by your hospitalist group cover all expenses? only 26% reported that revenues exceeded expenses. Of the multiple‐site programs responding to this question, only 4% reported that the main site of their programs had revenues greater than expenses (Table 2). Programs used a combination of metrics to report revenue, and relative value unit (RVU)/medical doctor (MD) is the most commonly used metric to determine incentive pay (Table 2).
DISCUSSION
Our study demonstrates that academic PHM programs are common, which is consistent with previous data.[4, 7, 9, 14] The data support our belief that more institutions are planning on starting PHM programs. However, there exist much variability in a variety of program factors.[2, 3, 8, 9, 14] The fact that up to 35% of categorical pediatric residents are considering a career as a hospitalist further highlights the need for better data on PHM programs.[7]
We demonstrated that variability existed in hospitalist workload at academic PHM programs. We found considerable variation in the workload per hospitalist (large ranges and standard deviations), as well as variability in how an FTE is defined (hours/year, weeks/year, shifts/year) (Table 1). In addition, survey respondents might have interpreted certain questions differently, and this might have led to increased variability in the data. For example, the question concerning the definition of an FTE was worded as A clinical FTE is defined as. Some of the reported variation in workload might be partially explained by hospitalists having additional nonclinical responsibilities within hospital medicine or another field, including protected time for quality improvement, medical education, research, or administrative activities. Furthermore, some hospitalists might have clinical responsibilities outside of hospital medicine. Given that most PHM programs lack a formal internal definition of what it means to be a hospitalist,[7] it is not surprising to find such variation between programs. The variability in the extent of in‐house coverage provided by academic PHM programs, as well as institutional plans for increased coverage with the 2011 residency work‐hours restrictions is also described, and is consistent with other recently published data.[14] This is likely to continue, as 70% of academic PHM programs reported an anticipated increase in coverage in the near future,[14] suggesting that academic hospitalists are being used to help fill gaps in coverage left by changes in resident staffing.
Our data describe the percentage of academic programs that have a distinct division of hospital medicine. The fact that multisite programs were more likely to report being a distinct division might reflect the increased complexities of providing care at more than 1 site, requiring a greater infrastructure. This might be important in institutional planning as well as academic and financial expectations of academic pediatric hospitalists.
We also demonstrated that programs with multiple sites differ as far as the degree of integration of the various sites, with variation reported in decision making, scheduling, and how quality, safety, and patient satisfaction are reported (Table 4). Whether or not increased integration between the various clinical sites of a multiple‐site program is associated with better performance and/or physician satisfaction are questions that need to be answered. However, academic PHM directors would likely agree that there are great challenges inherent in managing these programs. These challenges include professional integration (do hospitalists based at satellite sites feel that they are academically supported?), clinical work/expectations (fewer resources and fewer learners at satellite sites likely affects workload), and administrative issues (physician scheduling likely becomes more complex as the number of sites increases). As programs continue to grow and provide clinical services in multiple geographic sites, it will become more important to understand how the different sites are coordinated to identify and develop best practices.
Older studies have described that the majority of PHM programs (70%78%) reported that professional revenues do not cover expenses, unfortunately these results were not stratified for program type (academic vs community).[2, 9]
Our study describes that few academic PHM programs (26% of single site, 4% of multiple‐site programs) report revenues (defined in our survey as only the collections from professional billing) in excess of expenses. This is consistent with prior studies that have included both academic and community PHM programs.[2] Therefore, it appears to be common for PHM programs to require institutional funding to cover all program expenses, as collections from professional billing are not generally adequate for this purpose. We believe that this is a critical point for both hospitalists and administrators to understand. However, it is equally important that they be transparent about the importance and value of the nonrevenue‐generating work performed by PHM programs. It has been reported that the vast majority of pediatric hospitalists are highly involved in education, quality improvement work, practice guideline development, and other work that is vitally important to institutions.[3] Furthermore, although one might expect PHM leaders to believe that their programs add value beyond the professional revenue collected,[9] even hospital leadership has been reported to perceive that PHM programs add value in several ways, including increased patient satisfaction (94%), increased referring MD satisfaction (90%), decreased length of stay (81%), and decreased costs (62%).[2] Pediatric residency and clerkship directors report that pediatric hospitalists are more accessible than other faculty (84% vs 64%) and are associated with an increase in the practice of evidence‐based medicine (76% vs 61%).[4] Therefore, there is strong evidence supporting that pediatric hospitalist programs provide important value that is not evident on a balance sheet.
In addition, our data also indicate that programs currently use a variety of metrics in combination to report productivity, and there is no accepted gold standard for measuring the performance of a hospitalist or hospitalist program (Table 2). Given that hospitalists generally cannot control how many patients they see, and given the fact that hospitalists are strongly perceived to provide value to their institutions beyond generating clinical revenue, metrics such as RVUs and charges likely do not accurately represent actual productivity.[2] Furthermore, it is likely that the metrics currently used underestimate actual productivity as they are not designed to take into account confounding factors that might affect hospitalist productivity. For example, consider an academic hospitalist who has clinical responsibilities divided between direct patient care and supervisory patient care (such as a team with some combination of residents, medical students, and physician extenders). When providing direct patient care, the hospitalist is likely responsible or all of the tasks usually performed by residents, including writing all patient notes and prescriptions, all communication with families, nurses, specialists, and primary care providers; and discharge planning. Conversely, when providing supervisory care, it is likely that the tasks are divided among the team members, and the hospitalist has the additional responsibility for providing teaching. However, the hospitalist might be responsible for more complex and acute patients. These factors are not adequately measured by RVUs or professional billing. Furthermore, these metrics do not capture the differences in providing in‐house daytime versus evening/night coverage, and do not measure the work performed while being on call when outside of the hospital. It is important for PHM programs and leaders to develop a better representation of the value provided by hospitalists, and for institutional leaders to understand this value, because previous work has suggested that the majority of hospital leaders do not plan to phase out the subsidy of hospitalists over time, as they do not anticipate the program(s) will be able to covercosts.[2] Given the realities of decreasing reimbursement and healthcare reform, it is unlikely to become more common for PHM programs to generate enough professional revenue to cover expenses.
The main strength of this descriptive study is the comprehensive nature of the survey, including many previously unreported data. In addition, the data are consistent with previously published work, which validates the quality of the data.
This study has several limitations including a low response rate and the exclusion of some hospitals or programs because they provided insufficient data for analysis. However, a post hoc analysis demonstrated that the majority of the institutions reporting that they did not have an academic PHM program (18/22), and those that were excluded due to insufficient data (12/17) were either smaller residency programs (<60 residents) or hospitals that were not the main site of a residency program. Therefore, our data likely are a good representation of academic PHM programs at larger academic institutions. Another potential weakness is that, although PHM program directors and pediatric residency directors were targeted, the respondent might not have been the person with the best knowledge of the program, which could have produced inaccurate data, particularly in terms of finances. However, the general consistency of our findings with previous work, particularly the high percentage of institutions with academic PHM programs,[4, 7, 9, 14] the low percentage of programs with revenues greater than expenses,[2, 9] and the trend toward increased in‐house coverage associated with the 2011 ACGME work‐hour restrictions,[14] supports the validity of our other results. In addition, survey respondents might have interpreted certain questions differently, specifically the questions concerning the definition of an FTE, and this might have led to increased variability in the data.
CONCLUSIONS
Academic PHM programs exist in the vast majority of academic centers, and more institutions are planning on starting programs in the next few years. There appears to be variability in a number of program factors, including hospitalist workload, in‐house coverage, and whether the program is a separate division or a section within another academic division. Many programs are currently providing care at more than 1 site. Programs uncommonly reported that their revenues exceeded their expenses. These data are the most comprehensive data existing for academic PHM programs.
Acknowledgment
Disclosure: Nothing to report.
- . Pediatric hospital medicine: historical perspectives, inspired future. Curr Probl Pediatr Adolesc Health Care. 2012;42(5):107–112.
- , , . Assessing the value of pediatric hospitalist programs: the perspective of hospital leaders. Acad Pediatr. 2009;9(3):192–196.
- , . Pediatric hospitalists: training, current practice, and career goals. J Hosp Med. 2009;4(3):179–186.
- , , . Hospitalists' involvement in pediatrics training: perspectives from pediatric residency program and clerkship directors. Acad Med. 2009;84(11):1617–1621.
- , . Research in pediatric hospital medicine: how research will impact clinical care. Curr Probl Pediatr Adolesc Health Care. 2012;42(5):127–130.
- , . Pediatric hospitalists in medical education: current roles and future directions. Curr Probl Pediatr Adolesc Health Care. 2012;42(5):120–126.
- , , , , . Pediatric hospitalists' influences on education and career plans. J Hosp Med. 2012;7(4):282–286.
- , . Pediatric hospitalist systems versus traditional models of care: effect on quality and cost outcomes. J Hosp Med. 2012;7(4):350–357.
- , , , . Characteristics of the pediatric hospitalist workforce: its roles and work environment. Pediatrics. 2007;120(33):33–39.
- Society of Hospital Medicine. Definition of a hospitalist and hospital medicine. Available at: http://www.hospitalmedicine.org/AM/Template.cfm?Section=Hospitalist_Definition7(4):299–303.
Pediatric hospital medicine (PHM) is a relatively new field that has been growing rapidly over the past 20 years.[1] The field has been increasingly recognized for its contributions to high‐quality patient care, patient safety, systems improvement, medical education, and research.[2, 3, 4, 5, 6, 7, 8, 9] However, there appears to be significant variation among programs, even in basic factors such as how clinical effort is defined, the extent of in‐house coverage provided, and the scope of clinical services provided, and there exists a paucity of data describing these variations.[8]
Most previously published work did not specifically focus on academic programs,[2, 3, 8, 9] and specifically targeted hospital leadership,[2] practicing hospitalists,[3] residents,[7] and pediatric residency or clerkship directors,[4, 7] rather than hospitalist directors.[9] Furthermore, previous work focused on specific aspects of PHM programs such as education,[4, 7] value,[2] work environment,[9] and clinical practice,[3] rather than a more comprehensive approach.
We conducted a survey of academic PHM programs to learn about the current state and variation among programs across multiple domains (organizational, administrative, and financial). We speculated that:
- Many institutions currently lacking an academic PHM program were planning on starting a program in the next 3 years.
- Variability exists in hospitalist workload among programs.
- In programs providing clinical coverage at more than 1 site, variability exists in the relationship between the main site and satellite site(s) in terms of decision making, scheduling, and reporting of performance.
METHODS
Sample
We used the online American Medical Association Fellowship and Residency Electronic Interactive Database (FREIDA) to identify all 198 accredited pediatric residency training programs in the United States. A total of 246 hospitals were affiliated with these programs, and all of these were targeted for the survey. In addition, academic PHM program leaders were targeted directly with email invitations through the American Academy of Pediatrics (AAP) Section on Hospital Medicine LISTSERV.
Survey Instrument
A 49‐question online survey on the administrative, organizational, and financial aspects of academic PHM programs was developed with the input of academic PHM hospital leaders from Cincinnati Children's Hospital Medical Center and St. Louis Children's Hospital. First, the survey questions were developed de novo by the researchers. Then, multiple hospitalist leaders from each institution took the survey and gave feedback on content and structure. Using this feedback, changes were made and then tested by the leaders taking the new version of the survey. This process was repeated for 3 cycles until consensus was reached by the researchers on the final version of the survey. The survey contained questions that asked if the program provided coverage at a single site or at multiple sites and utilized a combination of open‐ended and fixed‐choice questions. For some questions, more than 1 answer was permitted. For the purposes of this survey, we utilized the following definitions adapted from the Society of Hospital Medicine. A hospitalist was defined as a physician who specializes in the practice of hospital medicine.[10] An academic PHM program was defined as any hospitalist practice associated with a pediatric residency program.[11] A nocturnist was defined as a hospitalist who predominantly works a schedule providing night coverage.[12]
Survey Administration
SurveyMonkey, an online survey software, was used to administer the survey. In June 2011, letters were mailed to all 246 hospitals affiliated with an accredited pediatric residency program as described above. These were addressed to either the hospital medicine director (if identified using the institutions Web site) or pediatric residency director. The letter asked the recipient to either participate in the survey or forward the survey to the physician best able to answer the survey. The letters included a description of the study and a link to the online survey. Of note, there was no follow‐up on this process. We also distributed the direct link to the survey and a copy of the letter utilizing the AAP Section on Hospital Medicine LISTSERV. Two reminders were sent through the LISTSERV in the month after the initial request. All respondents were informed that they would receive the deidentified raw data as an incentive to participate in the survey. Respondents were defined as those answering the first question, Does your program have an academic hospitalist program?
Statistical Analysis
Completed survey responses were extracted to Microsoft Excel (Microsoft Corp., Redmond, WA) for data analysis. Basic statistics were utilized to determine response rates for each question. Data were stratified for program type (single site or at multiple sites). For some questions, data were further stratified for the main site of multiple‐site programs for comparison to single‐site programs. In a few instances, more than 1 physician from a particular program responded to the survey. For these, the most appropriate respondent (PHM director, residency director, senior hospitalist) was identified utilizing the programs' publicly available Web site; only that physician's answers were used in the analysis.
Human Subjects Protection
This study was determined to be exempt from review by the Cincinnati Children's Hospital Medical Center and Washington University in St. Louis institutional review boards. All potential responders received written information about the survey. Survey design allowed for anonymous responses with voluntary documentation of program name and responders' contact information. The willingness to respond was qualified as implied consent. Data were deidentified prior to analysis and prior to sharing with the survey participants.
RESULTS
Response Rates
A total of 133 responses were received. Duplicate responses from the same program (13/133) were eliminated from the analysis. This yielded an overall response rate of 48.8% (120/246). A total of 81.7% (98/120) of institutions reported having an academic PHM program. Of the 18.3% (22/120) of institutions reporting not having a program, 9.1% (2/22) reported planning on starting a program in the next 3 years. Of the 98 respondents with an academic PHM program, 17 answered only the first survey question, Does your program have an academic hospitalist program? The remaining 81 completed surveys were left for further analysis. All of these respondents identified their program, and therefore we are certain that there were no duplicate responses in the analytic dataset. Of these, 23 (28%) indicated that their programs provided clinical care at multiple sites, and 58 (72%) indicated that their program provided care at a single site (Figure 1).
Administrative
Respondents reported wide variation for the definition of a 1.0 full‐time employee (FTE) hospitalist in their group. This included the units used (hours/year, weeks/year, shifts/year) as well as actual physician workload (Table 1). Weeks/year was the most common unit utilized by programs to define workload (66% of single‐site programs, 48% of multiple‐site programs), followed by hours/year (19%, 22%) and shifts/year (14%, 22%). The mean and median workload per FTE is represented (Table 1). The large ranges and the standard deviations from the mean indicate variability in workload per FTE (Table 1).
| Single‐Site Program | Multiple‐Site Programs | |||||||||
|---|---|---|---|---|---|---|---|---|---|---|
| % Programs | Mean | Median | SD | Range | % Programs | Mean | Median | SD | Range | |
| ||||||||||
| Weeks on service | 66 | 27.14 | 26 | 8.1 | 1246 | 48 | 27.2 | 24 | 9.6 | 1736 |
| Hours/year | 19 | 1886.25 | 1880 | 231.2 | 16002300 | 22 | 1767.33 | 1738 | 109.0 | 16641944 |
| Shifts/year* | 14 | 183 | 191 | 52.2 | 182240 | 22 | 191 | 184 | 38.3 | 155214 |
Scheduled in‐house hospitalist coverage also varied. Daytime coverage was defined as until 3 to 5 pm, evening coverage was defined a until 10 pm to midnight, and 24‐hour coverage was defined a 24/7. Programs reported plans to increase in‐house coverage with the implementation of the 2011 Accreditation Council for Graduate Medical Education (ACGME) resident work hours restrictions.[13] Among single‐site programs, there was a planned 50% increase in day/evening coverage (14% to 21%), with a planned decrease in day‐only coverage, and no change in 24/7 coverage (Table 2). Among the main sites of multiple‐site programs, there was a planned 50% increase in 24/7 in‐house coverage (35% to 52%), with a planned decrease in day‐only coverage, and no change in day/evening coverage (Table 3). Among the satellite sites of multiple‐site programs, there was a planned 9% increase in 24/7 coverage (41% to 50%), with a planned decrease in day‐only coverage, and no change in day/evening coverage (Table 2). Most programs reported that all hospitalists share night coverage (87% single site, 89% multiple sites) (Table 2). Multiple‐site programs were more likely than single‐site programs to use nocturnists, moonlighters, and incentives for those providing evening or night coverage (Table 2).
| Single Site (n=58) | Main Site of Multiple‐Site Programs (n=23) | |||
|---|---|---|---|---|
| Proportion | Response Rate | Proportion | Response Rate | |
| ||||
| Organizational | ||||
| Night shifts | .79 (46/58) | .83 (19/23) | ||
| All share nights | .87 (40/46) | .89 (17/19) | ||
| Nocturnists | .09 (4/46) | .26 (5/19) | ||
| Moonlighters | .04 (2/46) | .12 (2/19) | ||
| Night shift incentives | .74 (43/58) | .78 (18/23) | ||
| Financial | .12 (5/43) | .28 (5/18) | ||
| Time | .12 (5/43) | .22 (4/18) | ||
| No incentives | .79 (34/43) | .61 (11/18) | ||
| In‐house hospitalist coverage pre July 2011a | 1.0 (58/58) | 1.0 (23/23) | ||
| 24/7 | .29 (17/58) | .35 (8/23) | ||
| Day and evening | .14 (8/58) | .17 (4/23) | ||
| Day only | .57 (33/58) | .48 (11/23) | ||
| In‐house hospitalist coverage post July 2011a | 1.0 (58/58) | 1.0 (23/23) | ||
| 24/7 | .29 (17/58) | .52 (12/23) | ||
| Day and evening | .21 (12/58) | .17 (4/23) | ||
| Day only | .50 (29/58) | .30 (7/23) | ||
| Administrative | ||||
| Own division | .32 (18/57) | .98 (57/58) | .74 (17/23) | 1.0 (23/23) |
| Part of another division | .68 (39/57) | .26 (6/23) | ||
| Financial | ||||
| Revenues>expenses | .26 (14/53) | .91 (53/58) | .04 (1/23) | .04 (19/23) |
| Incentives supplement base salary | .45 (25/55) | .95 (55/58) | .48 (10/21) | .91 (21/23) |
| Metrics used to determine incentivesb | .47 (27/58) | .52 (12/23) | ||
| RVUs/MD | .85 (23/27) | .83 (10/12) | ||
| Costs/discharge | .19 (5/27) | .08 (1/12) | ||
| Financial reportingb | .81 (47/58) | .04 (19/23) | ||
| Charges | .64 (30/47) | .68 (13/19) | ||
| Collections | .66 (31/47) | .68 (13/19) | ||
| RVUs | .77 (36/47) | .47 (9/19) | ||
| Main Site (n=23) | Satellite Sites (n=51) | |||
|---|---|---|---|---|
| Proportion | Response Rate | Proportion | Response Rate | |
| In‐house hospitalist coverage pre July 2011 | 1.0 (23/23) | .80 (41/51) | ||
| 24/7 | .35 (8/23) | .41 (17/41) | ||
| Day and evening | .17 (4/23) | .10 (4/41) | ||
| Day only | .48 (11/23) | .49 (20/41) | ||
| In‐house hospitalist coverage post July 2011 | 1.0 (23/23) | |||
| 24/7 | .52 (12/23) | .50 (19/38) | .75 (38/51) | |
| Day and evening | .17 (4/23) | .11 (4/38) | ||
| Day only | .30 (7/23) | .39 (15/38) | ||
| Night shift coverage | .83 (19/23) | .78 (18/23) | ||
| All share nights | .89 (17/19) | .94 (17/18) | ||
| Nocturnists | .26 (5/19) | .22 (4/18) | ||
| Moonlighters | .12 (2/19) | .17 (3/18) | ||
The vast majority of multiple‐site programs reported that their different clinical sites are considered parts of a single hospitalist program (96%), and that there is a designated medical director for each site (83%). However, only 70% of multiple‐site programs report that decisions concerning physician coverage are made as a group, and only 65% report that scheduling is done centrally. In addition, there is variability in how quality, safety, and patient satisfaction is reported (group vs site). The majority of programs report sharing revenues and expenses among the sites (Table 4).
| Proportion | Response Rate | |
|---|---|---|
| Sites regularly collaborate on: | 1.0 (23/23) | |
| Quality improvement projects | .74 (17/23) | |
| Safety initiatives | .74 (17/23) | |
| Research | .48 (11/23) | |
| Have a designated hospitalist medical director for each site | .83 (19/23) | 1.0 (23/23) |
| Different sites considered parts of a single hospitalist program | .96 (22/23) | 1.0 (23/23) |
| Make decisions on program/coverage/hour changes as a group | .70 (16/23) | 1.0 (23/23) |
| Scheduling done centrally | .65 (15/23) | 1.0 (23/23) |
| Report or track the following as individual sites: | ||
| Quality measures | .43 (9/21) | .91 (21/23) |
| Safety measures | .48 (10/21) | .91 (21/23) |
| Patient satisfaction | .50 (10/20) | .87 (20/23) |
| Report or track the following as a group: | ||
| Quality measures | .33 (7/21) | .91 (21/23) |
| Safety measures | .33 (7/21) | .91 (21/23) |
| Patient satisfaction | .30 (6/20) | .87 (20/23) |
| Report or track the following as both individual sites and as a group: | ||
| Quality measures | .24 (5/21) | .91 (21/23) |
| Safety measures | .19 (4/21) | .91 (21/23) |
| Patient satisfaction | .25 (4/20) | .87 (20/23) |
| Sites share revenues and expenses | .67 (14/21) | .91 (21/23) |
Organizational
Of the single‐site programs that answered the question Is your hospital medicine program considered its own division or a section within another division? 32% reported that their programs were considered its own division, and 68% reported that they were a part of another division, predominately (62%) general pediatrics, but also a few (6% combined) within emergency medicine, critical care, physical medicine and rehabilitation, and infectious diseases. Of the multiple‐site programs, a majority of 74% programs were their own division, and 26% were part of another division (Table 2). Respondents reported that their satellite sites included pediatric units in small community hospitals, small pediatric hospitals, large nonpediatric hospitals with pediatric units, rehabilitation facilities, and Shriner orthopedic hospitals.
Financial
Of the single‐site programs that answered the question Do patient revenues produced by your hospitalist group cover all expenses? only 26% reported that revenues exceeded expenses. Of the multiple‐site programs responding to this question, only 4% reported that the main site of their programs had revenues greater than expenses (Table 2). Programs used a combination of metrics to report revenue, and relative value unit (RVU)/medical doctor (MD) is the most commonly used metric to determine incentive pay (Table 2).
DISCUSSION
Our study demonstrates that academic PHM programs are common, which is consistent with previous data.[4, 7, 9, 14] The data support our belief that more institutions are planning on starting PHM programs. However, there exist much variability in a variety of program factors.[2, 3, 8, 9, 14] The fact that up to 35% of categorical pediatric residents are considering a career as a hospitalist further highlights the need for better data on PHM programs.[7]
We demonstrated that variability existed in hospitalist workload at academic PHM programs. We found considerable variation in the workload per hospitalist (large ranges and standard deviations), as well as variability in how an FTE is defined (hours/year, weeks/year, shifts/year) (Table 1). In addition, survey respondents might have interpreted certain questions differently, and this might have led to increased variability in the data. For example, the question concerning the definition of an FTE was worded as A clinical FTE is defined as. Some of the reported variation in workload might be partially explained by hospitalists having additional nonclinical responsibilities within hospital medicine or another field, including protected time for quality improvement, medical education, research, or administrative activities. Furthermore, some hospitalists might have clinical responsibilities outside of hospital medicine. Given that most PHM programs lack a formal internal definition of what it means to be a hospitalist,[7] it is not surprising to find such variation between programs. The variability in the extent of in‐house coverage provided by academic PHM programs, as well as institutional plans for increased coverage with the 2011 residency work‐hours restrictions is also described, and is consistent with other recently published data.[14] This is likely to continue, as 70% of academic PHM programs reported an anticipated increase in coverage in the near future,[14] suggesting that academic hospitalists are being used to help fill gaps in coverage left by changes in resident staffing.
Our data describe the percentage of academic programs that have a distinct division of hospital medicine. The fact that multisite programs were more likely to report being a distinct division might reflect the increased complexities of providing care at more than 1 site, requiring a greater infrastructure. This might be important in institutional planning as well as academic and financial expectations of academic pediatric hospitalists.
We also demonstrated that programs with multiple sites differ as far as the degree of integration of the various sites, with variation reported in decision making, scheduling, and how quality, safety, and patient satisfaction are reported (Table 4). Whether or not increased integration between the various clinical sites of a multiple‐site program is associated with better performance and/or physician satisfaction are questions that need to be answered. However, academic PHM directors would likely agree that there are great challenges inherent in managing these programs. These challenges include professional integration (do hospitalists based at satellite sites feel that they are academically supported?), clinical work/expectations (fewer resources and fewer learners at satellite sites likely affects workload), and administrative issues (physician scheduling likely becomes more complex as the number of sites increases). As programs continue to grow and provide clinical services in multiple geographic sites, it will become more important to understand how the different sites are coordinated to identify and develop best practices.
Older studies have described that the majority of PHM programs (70%78%) reported that professional revenues do not cover expenses, unfortunately these results were not stratified for program type (academic vs community).[2, 9]
Our study describes that few academic PHM programs (26% of single site, 4% of multiple‐site programs) report revenues (defined in our survey as only the collections from professional billing) in excess of expenses. This is consistent with prior studies that have included both academic and community PHM programs.[2] Therefore, it appears to be common for PHM programs to require institutional funding to cover all program expenses, as collections from professional billing are not generally adequate for this purpose. We believe that this is a critical point for both hospitalists and administrators to understand. However, it is equally important that they be transparent about the importance and value of the nonrevenue‐generating work performed by PHM programs. It has been reported that the vast majority of pediatric hospitalists are highly involved in education, quality improvement work, practice guideline development, and other work that is vitally important to institutions.[3] Furthermore, although one might expect PHM leaders to believe that their programs add value beyond the professional revenue collected,[9] even hospital leadership has been reported to perceive that PHM programs add value in several ways, including increased patient satisfaction (94%), increased referring MD satisfaction (90%), decreased length of stay (81%), and decreased costs (62%).[2] Pediatric residency and clerkship directors report that pediatric hospitalists are more accessible than other faculty (84% vs 64%) and are associated with an increase in the practice of evidence‐based medicine (76% vs 61%).[4] Therefore, there is strong evidence supporting that pediatric hospitalist programs provide important value that is not evident on a balance sheet.
In addition, our data also indicate that programs currently use a variety of metrics in combination to report productivity, and there is no accepted gold standard for measuring the performance of a hospitalist or hospitalist program (Table 2). Given that hospitalists generally cannot control how many patients they see, and given the fact that hospitalists are strongly perceived to provide value to their institutions beyond generating clinical revenue, metrics such as RVUs and charges likely do not accurately represent actual productivity.[2] Furthermore, it is likely that the metrics currently used underestimate actual productivity as they are not designed to take into account confounding factors that might affect hospitalist productivity. For example, consider an academic hospitalist who has clinical responsibilities divided between direct patient care and supervisory patient care (such as a team with some combination of residents, medical students, and physician extenders). When providing direct patient care, the hospitalist is likely responsible or all of the tasks usually performed by residents, including writing all patient notes and prescriptions, all communication with families, nurses, specialists, and primary care providers; and discharge planning. Conversely, when providing supervisory care, it is likely that the tasks are divided among the team members, and the hospitalist has the additional responsibility for providing teaching. However, the hospitalist might be responsible for more complex and acute patients. These factors are not adequately measured by RVUs or professional billing. Furthermore, these metrics do not capture the differences in providing in‐house daytime versus evening/night coverage, and do not measure the work performed while being on call when outside of the hospital. It is important for PHM programs and leaders to develop a better representation of the value provided by hospitalists, and for institutional leaders to understand this value, because previous work has suggested that the majority of hospital leaders do not plan to phase out the subsidy of hospitalists over time, as they do not anticipate the program(s) will be able to covercosts.[2] Given the realities of decreasing reimbursement and healthcare reform, it is unlikely to become more common for PHM programs to generate enough professional revenue to cover expenses.
The main strength of this descriptive study is the comprehensive nature of the survey, including many previously unreported data. In addition, the data are consistent with previously published work, which validates the quality of the data.
This study has several limitations including a low response rate and the exclusion of some hospitals or programs because they provided insufficient data for analysis. However, a post hoc analysis demonstrated that the majority of the institutions reporting that they did not have an academic PHM program (18/22), and those that were excluded due to insufficient data (12/17) were either smaller residency programs (<60 residents) or hospitals that were not the main site of a residency program. Therefore, our data likely are a good representation of academic PHM programs at larger academic institutions. Another potential weakness is that, although PHM program directors and pediatric residency directors were targeted, the respondent might not have been the person with the best knowledge of the program, which could have produced inaccurate data, particularly in terms of finances. However, the general consistency of our findings with previous work, particularly the high percentage of institutions with academic PHM programs,[4, 7, 9, 14] the low percentage of programs with revenues greater than expenses,[2, 9] and the trend toward increased in‐house coverage associated with the 2011 ACGME work‐hour restrictions,[14] supports the validity of our other results. In addition, survey respondents might have interpreted certain questions differently, specifically the questions concerning the definition of an FTE, and this might have led to increased variability in the data.
CONCLUSIONS
Academic PHM programs exist in the vast majority of academic centers, and more institutions are planning on starting programs in the next few years. There appears to be variability in a number of program factors, including hospitalist workload, in‐house coverage, and whether the program is a separate division or a section within another academic division. Many programs are currently providing care at more than 1 site. Programs uncommonly reported that their revenues exceeded their expenses. These data are the most comprehensive data existing for academic PHM programs.
Acknowledgment
Disclosure: Nothing to report.
- . Pediatric hospital medicine: historical perspectives, inspired future. Curr Probl Pediatr Adolesc Health Care. 2012;42(5):107–112.
- , , . Assessing the value of pediatric hospitalist programs: the perspective of hospital leaders. Acad Pediatr. 2009;9(3):192–196.
- , . Pediatric hospitalists: training, current practice, and career goals. J Hosp Med. 2009;4(3):179–186.
- , , . Hospitalists' involvement in pediatrics training: perspectives from pediatric residency program and clerkship directors. Acad Med. 2009;84(11):1617–1621.
- , . Research in pediatric hospital medicine: how research will impact clinical care. Curr Probl Pediatr Adolesc Health Care. 2012;42(5):127–130.
- , . Pediatric hospitalists in medical education: current roles and future directions. Curr Probl Pediatr Adolesc Health Care. 2012;42(5):120–126.
- , , , , . Pediatric hospitalists' influences on education and career plans. J Hosp Med. 2012;7(4):282–286.
- , . Pediatric hospitalist systems versus traditional models of care: effect on quality and cost outcomes. J Hosp Med. 2012;7(4):350–357.
- , , , . Characteristics of the pediatric hospitalist workforce: its roles and work environment. Pediatrics. 2007;120(33):33–39.
- Society of Hospital Medicine. Definition of a hospitalist and hospital medicine. Available at: http://www.hospitalmedicine.org/AM/Template.cfm?Section=Hospitalist_Definition7(4):299–303.
Copyright © 2013 Society of Hospital Medicine
Preventing the intergenerational transmission of trauma
Intergenerational trauma often proves to be a prevailing feature of family systems.
The trauma of the Nazi concentration camps, for example, can be re-experienced in the lives of the children of camp survivors. Even the grandchildren of Holocaust survivors have been found to suffer from the effects of trauma. These effects manifest through characteristics such as increased suspiciousness of others, anger, and irritability in these individuals compared with controls (J. Relig. Health 2011;50:321-9).
Such intergenerational trauma has been found among urban American Indian and Alaska Native populations who have been involved in culturally specific sobriety maintenance programs (Am. Indian Alsk. Native Ment. Health Res. 2011;18:17-40). Likewise, a body of research supports the notion that untreated intergenerational trauma tied to generations of slavery in the United States continues to negatively affect many in the black community.
Other kinds of trauma can be passed down through the generations, as well. Take the trauma of a combat soldier; victim of or prisoner of war; survivor of a mass shooting or of child abuse; witness of genocide; or survivor of colonial suppression, slavery, or political totalitarianism. People who have experienced these traumas can pass down the consequences to subsequent generations.
We know that people who suffer trauma firsthand often develop posttraumatic stress disorder symptoms (PTSD) symptoms such as fearfulness, nightmares, flashbacks, sorrow, and difficulty with emotional closeness. However, it also is clear that compared with controls, the children of veterans with PTSD have shown an inability to experience appropriate emotional responses to situations and difficulty in solving problems effectively both within and outside the family unit (Aust. N.Z. J. Psychiatry 2001;35:345-51).
The trauma of childhood abuse also is transmitted down through the influences of the other members of the family, especially their children.
Another group known to suffer from the effects of intergenerational trauma is the children of alcoholics. This is a group that has demonstrated an increased need to care for others and keep secrets. They might use lying as a normal coping style and sometimes experience difficulty being children. Such behaviors are understood as a direct consequence of the experience of the family dysfunction. The question about trauma is: How do the symptoms of PTSD get "passed down" through the next generations, when the younger family members were not exposed to any trauma?
Various mechanisms have been considered, with individual psychological mechanisms and family dynamics being the most commonly cited mechanisms. Other factors have been suggested, such as the role of cultural and societal factors in the perpetuation of symptoms. Children and young adults might develop retaliatory fantasies "to right the wrongs done to their families." These types of beliefs and fantasies fuel many sectarian struggles around the world.
Individual psychological mechanisms commonly considered to be important are projection and identification. The parent with PTSD projects unwanted aspects of himself onto the child, who takes up the projection and identifies with it; this is called projective identification. Fear of the cold or the dark in the father then becomes the child’s fear instead. Children who are closest to the traumatized parent will be most affected.
Other postulated mechanisms focus on affect regulation. Parents who have difficulty with emotional regulation will have difficulty bonding appropriately with their child. On the other hand, emotional numbing might be present, which interferes with the development of a strong bond between parent and child.
One study of male Vietnam veterans found that "emotional numbing" and the quality of their relationship with their children remained significant even after investigators controlled for numerous factors, including the fathers’ family-of-origin stressors, combat exposure, depression, and substance abuse (J. Trauma Stress 2002;15:351-7). In other words, the children then suffer from secondary trauma.
Trauma-affected families also might have difficulty setting appropriate boundaries between parent and child so that the child becomes the caregiver of sorts and protector of the parent. The fears of the parent can become the fears of the child. It might be confusing for the child when a parent says: "Shh! Did you hear that noise," implying that "they" will get us, without really specifying the who and why, thus depriving the child of a rational explanation of his or her own experiences.
However, sometimes, trauma is not transmitted intergenerationally, a series of meta-analyses shows (Attach. Hum. Dev. 2008;10:105-21). Instead, these families are able to develop resilience and adapt well in the face of adversity – and achieve posttraumatic growth. How do we help the families with trauma become these resilient families?
Here is a list of nine points that can help guide the family psychiatrist:
1. The ability to regulate emotions, especially negative affect, is key to maintaining an understandable emotional climate for others in the family. Frequent unexplained emotional outbursts are difficult for other family members to understand. For children, it is especially important for them to understand that any emotional dysregulation is not caused by their behavior but by the parent’s experience of prior trauma.
2. The family should have an understanding of the meaning and cause of the traumatic events.
The traumatic events must be symbolized in a way that allows conversation and discussion about the past. The mention of wartime trauma can be phrased in a way that allows for the experience of pain, and then recovery, with hope and resilience as the message. A narrative story is important, with a good ending that the parent has survived, has overcome difficulties, and is here in the present with the child.
3. The parent must have "worked through" the trauma to the extent that he can internally symbolize his experiences enough to be able to talk about them and relay them to his
offspring in a coherent narrative with a positive message.
4. Open communication about the trauma prevents any unsymbolized, unspoken aspects of the trauma from being driven into unconsciousness, where they become dark fearful secrets that haunt the imagination and awaken the children, even as adults, at night.
5. Being able to access public accounts of the traumatic events is helpful to widen the family’s understanding of how others are affected, thus reducing the fearfulness of being alone with the trauma. Families should be encouraged to access these sources in order to understand the global aspects of trauma and the associated suffering and recovery.
6. For many families, having suffered trauma means that they must always be prepared for disaster. This, too, can be framed in a positive way, more like the scout motto of "be prepared," rather than the fearful posture of the survivalist.
7. A family fleeing from trauma might experience displacement through immigration and have no sense of home. This can be modulated by reestablishing and developing a new sense of community, and developing strong social and family rootedness. Sometimes, this involves a religious or spiritual group affiliation.
8. Family members who have suffered trauma often can identify skills that helped them survive. Hope, education, community, art – these values can be transmitted as the positive legacy of trauma. Helping families identify with positive resilient features of surviving trauma does not mean forgetting about the trauma but identifying the aspects that help the family go forward, enabling them to develop a narrative that allows recovery and growth.
9. If the child or other family members develop ongoing secondary PTSD or have enduring feelings of survivor guilt, persecution, and so on that are not resolved by family intervention, individual assessment might be needed.
In conclusion, despite the many illuminating case reports and anecdotes about the intergenerational transmission of trauma (for example, see J. Marital Fam. Ther. 2004;30:45-59), the message to families must be resilience focused. The question for these families becomes: "What did you do to manage the trauma and survive?"
Using a narrative framework, we can help these families identify the factors that can contribute to resilience, and build a future for the family that does not transmit traumatic symptoms but rather transmits the ability to move forward, despite traumatic symptoms.
E-mail Dr. Heru at [email protected].

How Should Physicians Assess and Manage Pressure Ulcers in the Hospitalized Patient?
The Case
An 85-year-old woman with stroke, functional quadriplegia, and diabetes mellitus presents with altered mental status. She is febrile (38.5°C) with leukocytosis (14,400 cells/mm3) and has a 5 cm x 4 cm x 2 cm Stage III malodorous sacral ulcer without surrounding erythema, tunneling, or pain. The ulcer base is partially covered by green slough. How should this pressure ulcer be evaluated and treated?
Overview
Pressure ulcers in vulnerable populations, such as the elderly and those with limited mobility, are exceedingly common. In the acute-care setting, the incidence of pressure ulcers ranges from 0.4% to 38%, with 2.5 million cases treated annually at an estimated cost of $11 billion per year.1,2 Moreover, as of Oct. 1, 2008, the Centers for Medicare & Medicaid Services (CMS) guideline states that hospitals will no longer receive additional payment when a hospitalized patient develops Stage III or IV pressure ulcers that are not present on admission.
A pressure ulcer is a localized injury to skin and underlying soft tissue over a bony prominence due to sustained external pressure.3 Prolonged pressure on these weight-bearing areas leads to reduced blood flow, ischemia, cell death, and necrosis of local tissues.4 Risk factors for developing pressure ulcers include increased external pressure, shear, friction, moisture, poor perfusion, immobility, incontinence, malnutrition, and impaired mental status.4 Inadequately treated pressure ulcers can lead to pain, tunneling, fistula formation, disfigurement, infection, prolonged hospitalization, lower quality of life, and increased mortality.4
Because of the significant morbidities and high costs associated with the care of pressure ulcers in acute care, hospitalists must be familiar with the assessment and treatment of pressure ulcers in vulnerable patients.
Review of the Data
The management of pressure ulcers in the hospitalized patient starts with a comprehensive assessment of the patient’s medical comorbidities, risk factors, and wound-staging. Considerations must be given to differentiate an infected pressure ulcer from a noninfected ulcer. These evaluations then guide the appropriate treatments of pressure ulcers, including the prevention of progression or formation of new ulcers, debridement, application of wound dressing, and antibiotic use.
Assessing pressure ulcer stage. The National Pressure Ulcer Advisory Panel (NPUAP) Classification System is the most commonly used staging tool. It describes four stages of pressure ulcers (see Table 1).3 A Stage 1 pressure ulcer is characterized by intact skin with nonblanchable erythema and may be discolored, painful, soft, firm, and warmer or cooler compared to adjacent area. A Stage II pressure ulcer presents with partial thickness skin loss with a shallow red-pink wound bed without slough, or as an intact or ruptured serum-filled blister. Stage II pressure ulcers do not include skin tears, tape burns, macerations, or excoriations. A Stage III pressure ulcer has full thickness skin loss with or without visible subcutaneous fat. Bone, tendon, or muscle are not exposed or directly palpable. Slough may be present but it does not obscure the depth of ulcer. Deep ulcers can develop in anatomical regions with high adiposity, such as the pelvic girdle. A Stage IV pressure ulcer has full thickness tissue loss with exposed and palpable bone, tendon, or muscle. Slough, eschar, undermining, and tunneling may be present. The depth of a Stage IV ulcer varies depending on anatomical location and adiposity. Stage IV ulcers also create a nidus for osteomyelitis.
NPUAP describes two additional categories of pressure ulcers: unstageable and deep tissue injury.3 An unstageable ulcer has full thickness skin or tissue loss of unknown depth because the wound base is completely obscured by slough or eschar. The ulcer can only be accurately categorized as Stage III or IV after sufficient slough or eschar is removed to identify wound depth. Lastly, suspected deep tissue injury describes a localized area of discolored intact skin (purple or maroon) or blood-filled blister due to damage of underlying tissue from pressure or shear.
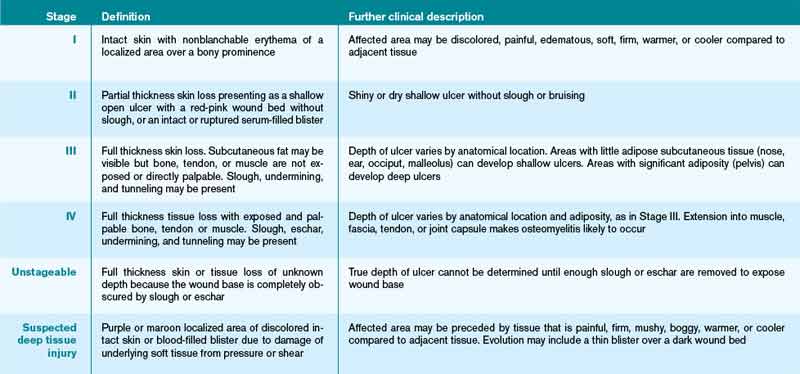
Diagnosing infected pressure ulcers. Pressure ulcer infection delays wound healing and increases risks for sepsis, cellulitis, osteomyelitis, and death.5,6 Clinical evidence of soft tissue involvement, such as erythema, warmth, tenderness, foul odor, or purulent discharge, and systemic inflammatory response (fever, tachycardia, or leukocytosis) are suggestive of a wound infection.3,5 However, these clinical signs may be absent and thus make the distinction between chronic wound and infected pressure ulcer difficult.7 Delayed healing with friable granulation tissue and increased pain in a treated wound may be the only signs of a pressure ulcer infection.3,5,7
Routine laboratory tests (i.e. white blood cell count, C-reactive protein, and erythrocyte sedimentation rate) are neither sensitive nor specific in diagnosing wound infection. Moreover, because pressure ulcers are typically colonized with ≥105 organisms/mL of normal skin flora and bacteria from adjacent gastrointestinal or urogenital environments, swab cultures identify colonizing organisms and are not recommended as a diagnostic test for pressure ulcer microbiologic evaluation.5,6 If microbiological data are needed to guide antibiotic use, cultures of blood, bone, or deep tissue biopsied from a surgically debrided wound should be used.5 Importantly, a higher index of suspicion should be maintained for infection of Stage III or IV pressure ulcers because they are more commonly infected than Stage I or II ulcers.3
Prevention. The prevention of wound progression is essential in treating acute, chronic, or infected pressure ulcers. Although management guidelines are limited by few high-quality, randomized controlled trials, NPUAP recommends a number of prevention strategies targeting risk factors that contribute to pressure ulcer development.2,3,8
For all bed-bound and chair-bound persons with impaired ability to self-reposition, risk assessment for pressure ulcer should be done on admission and repeated every 24 hours. The presence of such risk factors as immobility, shear, friction, moisture, incontinence, and malnutrition should be used to guide preventive treatments. Pressure relief on an ulcer can be achieved by repositioning the immobile patient at one- to two-hour intervals. Pressure-redistributing support surfaces (static, overlays, or dynamic) reduce tissue pressure and decrease overall incidence of pressure ulcers. Due to a lack of relative efficacy data, the selection of a support surface should be determined by the patient’s individual needs in order to reduce pressure and shear.3 For instance, dynamic support is an appropriate surface for an immobile patient with multiple or nonhealing ulcers. Shearing force and friction can be reduced by limiting head-of-bed elevation to <30° and using such transfer aids as bed linens while repositioning patients. The use of pillows, foam wedges, or other devices should be used to eliminate direct contact of bony prominences or reduce pressure on heels.8
Skin care should be optimized to limit excessive dryness or moisture. This includes using moisturizers for dry skin, particularly for the sacrum, and implementing bowel and bladder programs and absorbent underpads in patients with bowel or bladder incontinence.2 Given that patients with pressure ulcers are in a catabolic state, those who are nutritionally compromised may benefit from nutritional supplementation.3 Lastly, appropriate use of local and systemic pain regimen for painful pressure ulcers can improve patient cooperation in repositioning, dressing change, and quality of life.
Debridement. Wound debridement removes necrotic tissue often present in infected or chronic pressure ulcers, reduces risk for further infection, and promotes granulation tissue formation and wound healing. Debridement, however, is not indicated for ulcers of an ischemic limb or dry eschar of the heel, due to propensity for complications.3,4 The five common debridement methods are sharp, mechanical, autolytic, enzymatic, and biosurgical. The debridement method of choice is determined by clinician preference and availability.4
Sharp debridement results in rapid removal of large amounts of nonviable necrotic tissues and eschar using sharp instruments and, therefore, is indicated if wound infection or sepsis is present. Mechanical debridement by wet-to-dry dressing or whirlpool nonselectively removes granulation tissue and, thus, should be used cautiously. Autolytic debridement uses occlusive dressings (i.e. hydrocolloid or hydrogel) to maintain a moist wound environment in order to optimize the body’s inherent ability to selectively self-digest necrotic tissues. Enzymatic debridement with concentrated topical proteolytic enzymes (i.e. collagenase) digests necrotic tissues and achieves faster debridement than autolysis while being less invasive than surgical intervention. Biosurgery utilizes maggots (i.e. Lucilia sericata) that produce enzymes to effectively debride necrotic tissues.
Wound care and dressing. Pressure ulcers should be cleansed with each dressing change using such physiologic solutions as normal saline. Cleansing with antimicrobial solutions for ulcers with large necrotic debris or infection needs to be thoughtfully administered due to the potential impairment on wound healing.4 Wound dressing should maintain a moist wound environment to allow epithelialization and limit excessive exudates in order to prevent maceration. Although there are many categories of moisture retentive dressings, their comparative effectiveness remain unclear.4 Table 2 summarizes characteristics of common wound dressings and their applications.
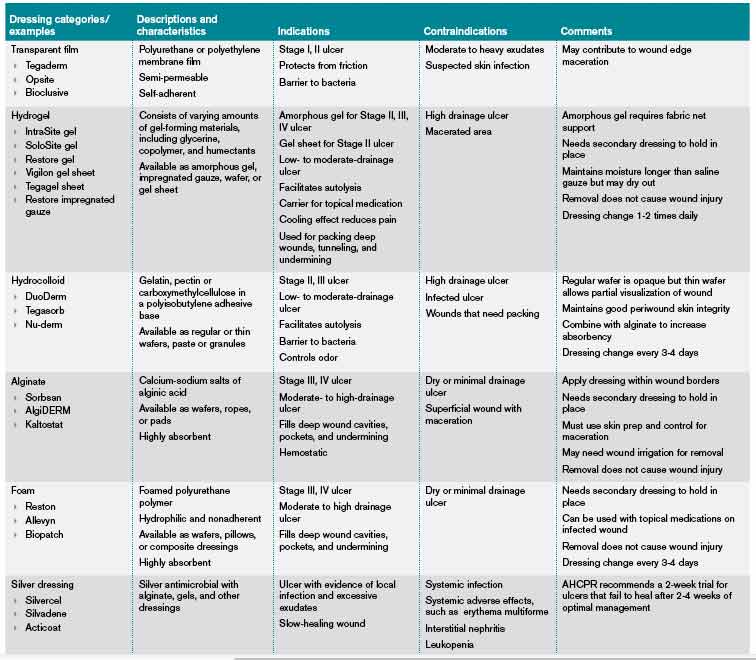
Antibiotic use. Topical antibiotics are appropriate for Stage III or IV ulcers with signs of local infection, including periwound erythema and friable granulation tissue.4 The Agency for Health Care Policy and Research recommends a two-week trial of a topical antibiotic, such as silver sulfadiazine, for pressure ulcers that fail to heal after two to four weeks of optimal care.6 Systemic antibiotics should be used for patients who demonstrate evidence of systemic infection including sepsis, osteomyelitis, or cellulitis with associated fever and leukocytosis. The choice of systemic antibiotics should be based on cultures from blood, bone, or deep tissue biopsied from a surgically debrided wound.4,6
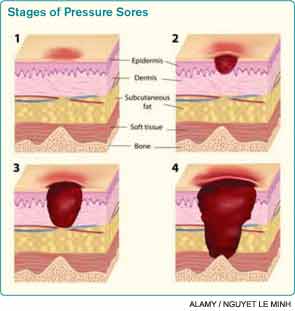
Back to the Case
The patient was hospitalized for altered mental status. She was at high risk for the progression of her sacral ulcer and the development of new pressure ulcers due to immobility, incontinence, malnutrition, and impaired mental status. The sacral wound was a chronic, Stage III pressure ulcer without evidence of local tissue infection. However, the presence of leukocytosis and fever were suggestive of an underlying infection. Her urine analysis was consistent with a urinary tract infection.
Trimethoprim/sulfamethoxazole was administered with subsequent resolution of leukocytosis, fever, and delirium. The sacral ulcer was cleansed with normal saline and covered with hydrocolloid dressing every 72 hours in order to maintain a moist wound environment and facilitate autolysis. Preventive interventions guided by her risk factors for pressure ulcer were implemented. Interventions included:
- Daily skin and wound assessment;
- Pressure relief with repositioning every two hours;
- Use of a dynamic support surface;
- Head-of-bed elevation of no more than <30° to reduce shear and friction;
- Use of transfer aids;
- Use of devices to eliminate direct contact of bony prominences;
- Optimizing skin care with moisturizers for dry skin and frequent changing of absorbent under pads for incontinence; and
- Consulting nutrition service to optimize nutritional intake.
Bottom Line
Assessments of pressure ulcer stage, wound infection, and risk factors guide targeted therapeutic interventions that facilitate wound healing and prevent new pressure ulcer formation.
Dr. Prager is a fellow in the Brookdale Department of Geriatrics and Palliative Medicine at Mount Sinai School of Medicine in New York City. Dr. Ko is a hospitalist and an assistant professor in the Brookdale Department of Geriatrics and Palliative Medicine at Mount Sinai.
References
- Pressure ulcers in America: prevalence, incidence, and implications for the future. An executive summary of the National Pressure Ulcer Advisory Panel monograph. Adv Skin Wound Care. 2001;14(4):208-215.
- Reddy M, Gill SS, Rochon PA. Preventing pressure ulcers: a systematic review. JAMA. 2006;296(8):974-984.
- European Pressure Ulcer Advisory Panel and National Pressure Ulcer Advisory Panel. Treatment of Pressure Ulcers: Quick Reference Guide. Washington, D.C.: National Pressure Ulcer Advisory Panel; 2009.
- Bates-Jensen BM. Chapter 58. Pressure Ulcers. In: Halter JB, Ouslander JG, Tinetti ME, Studenski S, High KP, Asthana S, eds. Hazzard’s Geriatric Medicine and Gerontology. 6th ed. New York: McGraw-Hill; 2009.
- Livesley NJ, Chow AW. Infected pressure ulcers in elderly individuals. Clin Infect Dis. 2002;35(11):1390-1396.
- Agency for Health Care Policy and Research (AHCPR). Treatment of Pressure Ulcers. Clinical Practice Guideline Number 15. U.S. Department of Health and Human Services. 1994.
- Reddy M, Gill SS, Wu W, Kalkar SR, Rochon PA. Does this patient have an infection of a chronic wound? JAMA. 2012;307(6):605-611.
- National Pressure Ulcer Advisory Panel. Pressure Ulcer Prevention Points. National Pressure Ulcer Advisory Panel website. Available at: http://www.npuap.org/resources/educational-and-clinical-resources/pressure-ulcer-prevention-points/. Accessed Aug. 1, 2012.
- Reuben DB, Herr KA, Pacala JT, et al. Skin Ulcers. In: Geriatrics At Your Fingertips. 12th ed. New York: The American Geriatrics Society; 2010.
The Case
An 85-year-old woman with stroke, functional quadriplegia, and diabetes mellitus presents with altered mental status. She is febrile (38.5°C) with leukocytosis (14,400 cells/mm3) and has a 5 cm x 4 cm x 2 cm Stage III malodorous sacral ulcer without surrounding erythema, tunneling, or pain. The ulcer base is partially covered by green slough. How should this pressure ulcer be evaluated and treated?
Overview
Pressure ulcers in vulnerable populations, such as the elderly and those with limited mobility, are exceedingly common. In the acute-care setting, the incidence of pressure ulcers ranges from 0.4% to 38%, with 2.5 million cases treated annually at an estimated cost of $11 billion per year.1,2 Moreover, as of Oct. 1, 2008, the Centers for Medicare & Medicaid Services (CMS) guideline states that hospitals will no longer receive additional payment when a hospitalized patient develops Stage III or IV pressure ulcers that are not present on admission.
A pressure ulcer is a localized injury to skin and underlying soft tissue over a bony prominence due to sustained external pressure.3 Prolonged pressure on these weight-bearing areas leads to reduced blood flow, ischemia, cell death, and necrosis of local tissues.4 Risk factors for developing pressure ulcers include increased external pressure, shear, friction, moisture, poor perfusion, immobility, incontinence, malnutrition, and impaired mental status.4 Inadequately treated pressure ulcers can lead to pain, tunneling, fistula formation, disfigurement, infection, prolonged hospitalization, lower quality of life, and increased mortality.4
Because of the significant morbidities and high costs associated with the care of pressure ulcers in acute care, hospitalists must be familiar with the assessment and treatment of pressure ulcers in vulnerable patients.
Review of the Data
The management of pressure ulcers in the hospitalized patient starts with a comprehensive assessment of the patient’s medical comorbidities, risk factors, and wound-staging. Considerations must be given to differentiate an infected pressure ulcer from a noninfected ulcer. These evaluations then guide the appropriate treatments of pressure ulcers, including the prevention of progression or formation of new ulcers, debridement, application of wound dressing, and antibiotic use.
Assessing pressure ulcer stage. The National Pressure Ulcer Advisory Panel (NPUAP) Classification System is the most commonly used staging tool. It describes four stages of pressure ulcers (see Table 1).3 A Stage 1 pressure ulcer is characterized by intact skin with nonblanchable erythema and may be discolored, painful, soft, firm, and warmer or cooler compared to adjacent area. A Stage II pressure ulcer presents with partial thickness skin loss with a shallow red-pink wound bed without slough, or as an intact or ruptured serum-filled blister. Stage II pressure ulcers do not include skin tears, tape burns, macerations, or excoriations. A Stage III pressure ulcer has full thickness skin loss with or without visible subcutaneous fat. Bone, tendon, or muscle are not exposed or directly palpable. Slough may be present but it does not obscure the depth of ulcer. Deep ulcers can develop in anatomical regions with high adiposity, such as the pelvic girdle. A Stage IV pressure ulcer has full thickness tissue loss with exposed and palpable bone, tendon, or muscle. Slough, eschar, undermining, and tunneling may be present. The depth of a Stage IV ulcer varies depending on anatomical location and adiposity. Stage IV ulcers also create a nidus for osteomyelitis.
NPUAP describes two additional categories of pressure ulcers: unstageable and deep tissue injury.3 An unstageable ulcer has full thickness skin or tissue loss of unknown depth because the wound base is completely obscured by slough or eschar. The ulcer can only be accurately categorized as Stage III or IV after sufficient slough or eschar is removed to identify wound depth. Lastly, suspected deep tissue injury describes a localized area of discolored intact skin (purple or maroon) or blood-filled blister due to damage of underlying tissue from pressure or shear.
Diagnosing infected pressure ulcers. Pressure ulcer infection delays wound healing and increases risks for sepsis, cellulitis, osteomyelitis, and death.5,6 Clinical evidence of soft tissue involvement, such as erythema, warmth, tenderness, foul odor, or purulent discharge, and systemic inflammatory response (fever, tachycardia, or leukocytosis) are suggestive of a wound infection.3,5 However, these clinical signs may be absent and thus make the distinction between chronic wound and infected pressure ulcer difficult.7 Delayed healing with friable granulation tissue and increased pain in a treated wound may be the only signs of a pressure ulcer infection.3,5,7
Routine laboratory tests (i.e. white blood cell count, C-reactive protein, and erythrocyte sedimentation rate) are neither sensitive nor specific in diagnosing wound infection. Moreover, because pressure ulcers are typically colonized with ≥105 organisms/mL of normal skin flora and bacteria from adjacent gastrointestinal or urogenital environments, swab cultures identify colonizing organisms and are not recommended as a diagnostic test for pressure ulcer microbiologic evaluation.5,6 If microbiological data are needed to guide antibiotic use, cultures of blood, bone, or deep tissue biopsied from a surgically debrided wound should be used.5 Importantly, a higher index of suspicion should be maintained for infection of Stage III or IV pressure ulcers because they are more commonly infected than Stage I or II ulcers.3
Prevention. The prevention of wound progression is essential in treating acute, chronic, or infected pressure ulcers. Although management guidelines are limited by few high-quality, randomized controlled trials, NPUAP recommends a number of prevention strategies targeting risk factors that contribute to pressure ulcer development.2,3,8
For all bed-bound and chair-bound persons with impaired ability to self-reposition, risk assessment for pressure ulcer should be done on admission and repeated every 24 hours. The presence of such risk factors as immobility, shear, friction, moisture, incontinence, and malnutrition should be used to guide preventive treatments. Pressure relief on an ulcer can be achieved by repositioning the immobile patient at one- to two-hour intervals. Pressure-redistributing support surfaces (static, overlays, or dynamic) reduce tissue pressure and decrease overall incidence of pressure ulcers. Due to a lack of relative efficacy data, the selection of a support surface should be determined by the patient’s individual needs in order to reduce pressure and shear.3 For instance, dynamic support is an appropriate surface for an immobile patient with multiple or nonhealing ulcers. Shearing force and friction can be reduced by limiting head-of-bed elevation to <30° and using such transfer aids as bed linens while repositioning patients. The use of pillows, foam wedges, or other devices should be used to eliminate direct contact of bony prominences or reduce pressure on heels.8
Skin care should be optimized to limit excessive dryness or moisture. This includes using moisturizers for dry skin, particularly for the sacrum, and implementing bowel and bladder programs and absorbent underpads in patients with bowel or bladder incontinence.2 Given that patients with pressure ulcers are in a catabolic state, those who are nutritionally compromised may benefit from nutritional supplementation.3 Lastly, appropriate use of local and systemic pain regimen for painful pressure ulcers can improve patient cooperation in repositioning, dressing change, and quality of life.
Debridement. Wound debridement removes necrotic tissue often present in infected or chronic pressure ulcers, reduces risk for further infection, and promotes granulation tissue formation and wound healing. Debridement, however, is not indicated for ulcers of an ischemic limb or dry eschar of the heel, due to propensity for complications.3,4 The five common debridement methods are sharp, mechanical, autolytic, enzymatic, and biosurgical. The debridement method of choice is determined by clinician preference and availability.4
Sharp debridement results in rapid removal of large amounts of nonviable necrotic tissues and eschar using sharp instruments and, therefore, is indicated if wound infection or sepsis is present. Mechanical debridement by wet-to-dry dressing or whirlpool nonselectively removes granulation tissue and, thus, should be used cautiously. Autolytic debridement uses occlusive dressings (i.e. hydrocolloid or hydrogel) to maintain a moist wound environment in order to optimize the body’s inherent ability to selectively self-digest necrotic tissues. Enzymatic debridement with concentrated topical proteolytic enzymes (i.e. collagenase) digests necrotic tissues and achieves faster debridement than autolysis while being less invasive than surgical intervention. Biosurgery utilizes maggots (i.e. Lucilia sericata) that produce enzymes to effectively debride necrotic tissues.
Wound care and dressing. Pressure ulcers should be cleansed with each dressing change using such physiologic solutions as normal saline. Cleansing with antimicrobial solutions for ulcers with large necrotic debris or infection needs to be thoughtfully administered due to the potential impairment on wound healing.4 Wound dressing should maintain a moist wound environment to allow epithelialization and limit excessive exudates in order to prevent maceration. Although there are many categories of moisture retentive dressings, their comparative effectiveness remain unclear.4 Table 2 summarizes characteristics of common wound dressings and their applications.
Antibiotic use. Topical antibiotics are appropriate for Stage III or IV ulcers with signs of local infection, including periwound erythema and friable granulation tissue.4 The Agency for Health Care Policy and Research recommends a two-week trial of a topical antibiotic, such as silver sulfadiazine, for pressure ulcers that fail to heal after two to four weeks of optimal care.6 Systemic antibiotics should be used for patients who demonstrate evidence of systemic infection including sepsis, osteomyelitis, or cellulitis with associated fever and leukocytosis. The choice of systemic antibiotics should be based on cultures from blood, bone, or deep tissue biopsied from a surgically debrided wound.4,6
Back to the Case
The patient was hospitalized for altered mental status. She was at high risk for the progression of her sacral ulcer and the development of new pressure ulcers due to immobility, incontinence, malnutrition, and impaired mental status. The sacral wound was a chronic, Stage III pressure ulcer without evidence of local tissue infection. However, the presence of leukocytosis and fever were suggestive of an underlying infection. Her urine analysis was consistent with a urinary tract infection.
Trimethoprim/sulfamethoxazole was administered with subsequent resolution of leukocytosis, fever, and delirium. The sacral ulcer was cleansed with normal saline and covered with hydrocolloid dressing every 72 hours in order to maintain a moist wound environment and facilitate autolysis. Preventive interventions guided by her risk factors for pressure ulcer were implemented. Interventions included:
- Daily skin and wound assessment;
- Pressure relief with repositioning every two hours;
- Use of a dynamic support surface;
- Head-of-bed elevation of no more than <30° to reduce shear and friction;
- Use of transfer aids;
- Use of devices to eliminate direct contact of bony prominences;
- Optimizing skin care with moisturizers for dry skin and frequent changing of absorbent under pads for incontinence; and
- Consulting nutrition service to optimize nutritional intake.
Bottom Line
Assessments of pressure ulcer stage, wound infection, and risk factors guide targeted therapeutic interventions that facilitate wound healing and prevent new pressure ulcer formation.
Dr. Prager is a fellow in the Brookdale Department of Geriatrics and Palliative Medicine at Mount Sinai School of Medicine in New York City. Dr. Ko is a hospitalist and an assistant professor in the Brookdale Department of Geriatrics and Palliative Medicine at Mount Sinai.
References
- Pressure ulcers in America: prevalence, incidence, and implications for the future. An executive summary of the National Pressure Ulcer Advisory Panel monograph. Adv Skin Wound Care. 2001;14(4):208-215.
- Reddy M, Gill SS, Rochon PA. Preventing pressure ulcers: a systematic review. JAMA. 2006;296(8):974-984.
- European Pressure Ulcer Advisory Panel and National Pressure Ulcer Advisory Panel. Treatment of Pressure Ulcers: Quick Reference Guide. Washington, D.C.: National Pressure Ulcer Advisory Panel; 2009.
- Bates-Jensen BM. Chapter 58. Pressure Ulcers. In: Halter JB, Ouslander JG, Tinetti ME, Studenski S, High KP, Asthana S, eds. Hazzard’s Geriatric Medicine and Gerontology. 6th ed. New York: McGraw-Hill; 2009.
- Livesley NJ, Chow AW. Infected pressure ulcers in elderly individuals. Clin Infect Dis. 2002;35(11):1390-1396.
- Agency for Health Care Policy and Research (AHCPR). Treatment of Pressure Ulcers. Clinical Practice Guideline Number 15. U.S. Department of Health and Human Services. 1994.
- Reddy M, Gill SS, Wu W, Kalkar SR, Rochon PA. Does this patient have an infection of a chronic wound? JAMA. 2012;307(6):605-611.
- National Pressure Ulcer Advisory Panel. Pressure Ulcer Prevention Points. National Pressure Ulcer Advisory Panel website. Available at: http://www.npuap.org/resources/educational-and-clinical-resources/pressure-ulcer-prevention-points/. Accessed Aug. 1, 2012.
- Reuben DB, Herr KA, Pacala JT, et al. Skin Ulcers. In: Geriatrics At Your Fingertips. 12th ed. New York: The American Geriatrics Society; 2010.
The disability application process
Being rheumatologists, we all probably get letters on fancy lawyer letterheads asking for our office notes for a patient who is applying for disability. Then we receive more requests asking the physician to please describe in detail how much or how little work the patient can be expected to perform. Not infrequently, I even receive requests for disability assessments for patients I’ve never heard of, only to find out that I am seeing them as new patients in the coming days.
So I was excited to learn that subspecialty grand rounds was going to be given by a disability lawyer. He did a good job of explaining the law and breaking down the process.
Disability, as defined by the law, is "the inability to engage in any substantial gainful activity by reason of any medically determinable physical or mental impairment which ... has lasted or can be expected to last for a continuous period of not less than 12 months."
The process of getting disability is lengthy. According to the Social Security Administration, for the past 3 years, roughly 35% of first-time applications were granted. Of applicants who were denied, only half submitted a request for reconsideration, and of those, only 12%-14% were granted disability status.
After the agency denies an applicant twice, the applicant’s next recourse is to request a hearing. At this point an administrative law judge reviews the information, hears the case, and makes a decision. Data from the past 3 years reveals that about 60% succeed at this stage. If denied, the applicant can appeal this decision, and it goes to the same judge.
If, at the end of all that, the patient still does not get disability, he can either elevate the appeal to a federal judge or file a new application altogether.
Documentation has to be submitted to the effect that the patient cannot perform his or her past work. Then the question is whether, given his age, education, and work experience, he is able to perform other kinds of work.
The gold standard for evidence of a patient’s ability to work is a physician’s description of the patient’s functional limits. This is where those onerous forms come in. In the pesky and interminable "residual functional capacity" questionnaires, we are asked to estimate how much or how little standing/sitting/lifting the patient can do in a given amount of time.
But while the disability lawyer clarified the process of getting disability, he nonetheless interpreted the process through his own perspective. I felt that the following points he made oversimplified the important questions that physicians must answer:
• Disability is really difficult to obtain. Therefore, people who are willing to put up with the process must really be in bad shape.
This is a bogus bifurcation, a fallacy of apriorism. People will do unpleasant things, like wait a very long time to get disability, if they perceive it as the better of two unpleasant options.
• He asks his audience, "Would you hire them?"
I would counter that there may be other issues that would lead an employer to not hire someone, and the law specifically states that disability status is denied or granted "regardless of ... whether or not he would be hired if he applied for work."
• It is not easy, if you have chronic pain, to lift a 10-pound weight frequently throughout the day, which is how the Department of Labor defines "light work."
But the same paragraph that defines light work as the frequent lifting of objects weighing up to 10 pounds also says, "Even though the weight lifted may be very little, a job is in this category when it requires a good deal of walking or standing, or when it involves sitting most of the time with some pushing and pulling of arm or leg controls."
I think these sorts of points illustrate a line of reasoning that does not serve patients well when they seek legal advice on applying for disability. They paint a picture that gives doctors reasons to be skeptical of the process (especially when the doctor has not even met the patient yet) and may encourage patients to seek disability when they still have the ability "to engage in any substantial gainful activity."
Dr. Chan practices rheumatology in Pawtucket, R.I. E-mail her at [email protected]

Low Concordance for Site of Death
At the turn of the 20th century, most deaths in the United States occurred at home. By the 1960s, over 70% of deaths occurred in an institutional setting, reflecting an evolution of medical technology.[1, 2, 3] With the birth of the hospice movement in the 1970s, dying patients had the opportunity to have both death at home and aggressive symptom control at the end of life. Although there has been a slow decline in the proportion of deaths that occur in the hospital over the past 2 decades,[3] the overwhelming majority of persons state that they would prefer to die at home. However, recent findings suggest that most people will die in an institutional setting.[3, 4, 5, 6]
Although good data exist describing population preferences for location of death, and we know, based on death records, where deaths occur in the United States, there are few studies that examine concordance between preferred and actual site of death at the individual patient level. Furthermore, although factors have been identified that predict death at home, factors predicting concordance between preferred and actual site of death are not well described.[3, 6, 7, 8, 9, 10, 11, 12, 13]
Regardless of where death ultimately occurs, most adults will experience multiple hospitalizations within the last years of their life. Understanding the preferences and subsequent experiences of this population is of particular relevance to hospitalist physicians who are in a unique position to elicit goals from seriously ill patients and help match patient preferences with their medical care. In this observational study, we sought to determine preferences for site of death in a cohort of adult patients admitted to the hospital for medical illness, and then follow those patients to determine where death occurred for those who died. We also sought to explore factors that may predict concordance between preferred and actual site of death. We hypothesized that ethnic diversity and lower socioeconomic status would be associated with a lower likelihood of concordance between preferred and actual site of death. We also hypothesized that advanced care planning would be associated with a higher likelihood of concordance. The Colorado Multi‐Institutional Review Board approved this study.
METHODS
Participants were recruited from 3 hospitals affiliated with the University of Colorado School of Medicine Internal Medicine Residency program, including the Denver Veterans' Administration Center (DVAMC), Denver Health Medical Center (DHMC), and University of Colorado Hospital (UCH). The DVAMC is a large urban Veterans Administration hospital, serving veterans from the Denver metro area, and is a tertiary referral center for veterans in rural Colorado, Wyoming, and parts of Montana. DHMC, the safety‐net hospital for the Denver area, serves over 25% of the residents in the city and county of Denver, including such special populations as the indigent, chronically mentally ill, and persons with polysubstance dependence. UCH had 350 licensed beds at the time of our study and serves as the Rocky Mountain region's only academic tertiary, specialty care, and referral center. At the time of this study, there was limited inpatient palliative care services at the DVAMC and UH, and no palliative care services at DHMC. Participants were screened on the first day following admission to the adult general medical service. Participants were recruited on 96 postadmission days between February 2004 and June 2006. Recruitment days varied from Monday through Friday, to include admissions from the weekend and throughout the year to reduce potential bias due to seasonal trends of diseases such as influenza. Patients were excluded if they died or were discharged within the first 24 hours of admission, were pregnant, jailed, or unable to give informed consent. All other patients were approached and invited to participate in a brief survey.
After informed consent was obtained, participants completed a bedside interview that included self‐identified ethnicity and the Berkman‐Syme Social Network Index,[14] a brief questionnaire quantifying social support from spouse or domestic partner, family, friends, and other religious or secular organizations. Baseline socioeconomic measures (eg, income, employment, home ownership, car ownership) and questions related to the last days of life were also included. Participants were asked the following question, If you were very sick, with an illness that could not be cured, and in bed most of the time, where would you spend the last days of your life if you could chose?
For each participant, we performed a detailed chart review to determine demographic data, presence of advance directives, and CARING criteria (Cancer, Admissions 2, Residence in a nursing home, Intensive care unit admit with multiorgan failure, 2 Noncancer hospice Guidelines), a set of prognostic criteria identifying patients at an index hospitalization who have a high burden of illness and are at risk for death in the following year.[15] We then followed patients for 5 years. If participants died within the follow‐up period, we collected the date and location of death using medical records, death certificates, or in a few cases when official death records were unavailable, direct contact with the family. Participants were considered alive if they had a clinic visit or MD/RN phone contact within 3 months prior to the final collection point date.
Analysis
SAS 9.1 (SAS Institute Inc., Cary, NC) was used for all analyses. Simple frequencies and means statistics were used to determine rates of descriptive characteristics of the sample as well as rates of the measured outcomes, preferred place to spend last days of life, and actual site of death. Agreement or concordance between preferred and actual site of death was calculated. For the purposes of the analysis, we assumed all persons who stated they had no preference died in a place concordant with their wishes. To calculate agreement by preferred and actual site, participants who expressed a preference and died (n=111) in hospital, nursing home, home, or hospice setting were included in the analysis, and participants (n=4) who died in an unknown or other locations were excluded (eg, motel room).
Logistic Regression Modeling
2 tests were performed for all categorical variables to determine a significant association with outcome variables. Preferred place of death and concordance between preferred and actual site of death were modeled using predictive variables selected if univariable association demonstrated a P0.25. This standard cutoff was selected to broadly identify candidate variables for logistic regression modeling.[16] A stepwise algorithm was used to select significant predictors that would remain in the model.
In lieu of fitting a multinomial logit model for preferred site of death of home vs hospital vs nursing home or hospice facility as preferred site of death, 3 logit models (although only 2 may be sufficient to estimate the underlying multinomial logit model[17]) were considered with outcome categories: home vs nursing home or hospice facility, and hospital vs nursing home or hospice facility and home vs hospital.
For the logistic regression modeling of concordance, we included the full sample of patients who died during the follow‐up period (n=123). We classified participants as dying in a place concordant with their wishes or not concordant.
RESULTS
Study Population
Subjects were recruited on 96 post‐admission days totaling 842 admissions. Three hundred thirty‐one patients (39%) were ineligible for study participation (n=175 discharged within 24 hours, n=76 unable to consent, n=78 ineligible for other reasons [eg, prisoner, pregnant, under 18 years old], n=2 died within 24 hours of admission). Only 53 of the remaining 511 (10%) patients refused; 458 patients (90%) gave informed consent to participate. Characteristics of the study population are depicted in Table 1. There were very few missing cases (<3%), that is persons without a recent clinic follow‐up date, contact, or a confirmed date of death. These persons were considered alive. Overall, the sample population was ethnically diverse, slightly older than middle age, mostly male (due to the inclusion of the Veterans Administration hospital), and of low socioeconomic status.
| Mean age (SD), y | 57.9 (14.8) |
|---|---|
| |
| Mean time to death (SD), d | 339.5 (348.4) |
| Ethnicity | |
| African American | 19% (88) |
| Caucasian | 52% (239) |
| Latino | 22% (102) |
| Other | 6% (29) |
| Spanish language only | 6% (27) |
| Female gender | 35% (159) |
| Admitted to DVAMC | 41% (188) |
| Admitted to DHMC | 38% (174) |
| Admitted to UCH | 21% (96) |
| CARING criteria | |
| Cancer diagnosis | 11% (51) |
| Admitted to hospital 2 times in the past year for chronic illness | 40% (181) |
| Resident in a nursing home | 2% (9) |
| Noncancer hospice guidelines (meeting 2) | 13% (59) |
| Income <$30,000/year | 84% (377) |
| No greater than high school education | 55% (248) |
| Home owner | 26% (120) |
| Rents home | 39% (177) |
| Unstable living situationa | 34% (156) |
| Low social supportb | 36% (165) |
| Uninsured | 18% (81) |
| Regular primary care provider | 73% (330) |
Preferred Site of Death
When asked where they preferred to spend the last days of their life, 75% of patients (n=343) stated they would like to be at home. In the hospital was the preferred location for 10% of patients, whereas 6% stated a nursing home and 4% a hospice inpatient facility. Two percent stated they had no preference, and 3% refused to answer (Figure 1)

We found that in the univariable analysis the following factors were associated with preference for site of death at a significance level of P<0.25: unstable housing, hospital setting, income level, ethnicity, CARING criteria, presence of an advance directive, education level, married, primary care provider, and presence of public insurance. Results of the logit models (home vs nursing home or hospice facility, and hospital vs nursing home or hospice facility and home vs hospital) are presented in Table 2.
| Adjusted Odds Ratio (95% Confidence Interval) | |||
|---|---|---|---|
| Home vs Nursing Home/Hospice Facility | Hospital vs Nursing Home/Hospice Facility | Home vs Hospital | |
| |||
| Low income | 2.71 (1.305.67) | 3.05 (1.019.24) | 0.99 (0.422.37) |
| Married | 2.44 (1.145.21) | 2.40 (0.876.62) | 0.82 (0.421.57) |
| CARING criteria | 0.58 (0.301.14) | 0.44 (0.181.09) | 0.89 (0.471.66) |
Patients with income <$30,000/year were more likely to prefer home (or hospital) over a nursing home or hospice facility. Being married was predictive of preferring home over nursing home or hospice facility. Patients meeting 1 of the CARING criteria trended toward being less likely (P=0.11 for home and P=0.08 for hospital) to prefer home (or hospital) vs nursing home or hospice facility. However, there were no significant predictors for a preference for home or hospital when directly comparing the 2 locations, as expected from observing similar effects of variables in the other 2 logit models.
Actual Site of Death
One hundred twenty‐three patients died during the follow‐up period (26% of the total sample). Of those who died, the mean age was 64 years (standard deviation 13), 82% had annual incomes <$30,000, 73% were men, and 77% met at least 1 of the CARING criteria suggesting advanced medical illness. The distribution of ethnicities of the deceased subsample was similar to that of the overall cohort. Complete death records were obtained for 121 patients. Only 31% (n=38) died at home, whereas 35% (n=42) died in a hospital, 20% (n=24) died in a nursing home, and 12% (n=14) died in an inpatient hospice facility (Figure 1).
In univariable analysis, there were no associations at a 25% significance level between actual site of death and ethnicity, gender, age, severity of illness, high vs low social support, high or low socioeconomic status, stable vs unstable housing, or presence of a completed advance directive in the medical record.
Concordance Between Preferred and Actual Site of Death
Overall, 37% of the patients died where they stated they would prefer to die, including the 2 with no preference. Concordance rates for each site of death are presented in Table 3. We examined sociodemographic variables, disease severity, advance‐care planning, primary care provider, health insurance, and hospital site to look for associations with concordance. We found that female gender was positively associated with concordance (odds ratio [OR], 3.30; 95% confidence interval [CI], 1.25‐8.72). CARING criteria (P=0.06) and Latino ethnicity (vs all other ethnicity categories, P=0.12) also showed trends for association. Restricting to those who preferred home, the associations became stronger (OR, 4.62; 95% CI, 1.44‐14.79 for female; OR, 7.72; 95% CI, 1.67‐35.71 for CARING criteria), and the trend for the negative association between Latino ethnicity and concordance remained (P=0.12). Results of the model are shown in Table 4.
| Actual Site of Death, n (Row %) | Row Total, % Out of 111 | ||||
|---|---|---|---|---|---|
| Hospital | Nursing Home | Home | Hospice Facility | ||
| Preferred hospital | 5 (42%) | 3 (25%) | 2 (17%) | 2 (17%) | 12 (11%) |
| Preferred nursing home | 1 (13%) | 5 (63%) | 2 (25%) | 0 | 8 (7%) |
| Preferred home | 30 (34%) | 15 (17%) | 31 (35%) | 12 (14%) | 88 (79%) |
| Preferred hospice facility | 3 (100%) | 0 | 0 | 0 | 3 (3%) |
| Adjusted Odds Ratio (95% Confidence Interval) | |||
|---|---|---|---|
| All | Home (Using Same Variables) | Home (Using Only Significant Variables) | |
| |||
| Female gender | 3.30 (1.258.72) | 4.62 (1.4414.79) | 3.57 (1.2410.34) |
| CARING criteria | 3.09 (0.979.81) | 7.72 (1.6735.71) | 5.93 (1.4124.91) |
| Latino vs African American/Caucasian/other | 0.43 (0.151.24) | 0.35 (0.091.30) | |
DISCUSSION
We found, similarly to previous reports in the literature, the majority of patients preferred to die at home. We did not find a significant difference in preferences or location of death by ethnicity or illness severity. Lower‐income patients and married patients were more likely to prefer to be at home over a nursing home or a hospice facility in the last days of life. We found that the minority of patients died at their stated preferred site of death, and female gender was the only predictive variable we found to distinguish those patients who died in a place concordant with their wishes compared to those who did not.
In the literature, previous studies have reported concordance rates between preferred and actual site of death that range from 30% to 90%.[12, 13, 18, 19, 20, 21, 22, 23, 24] We found a concordance rate at the lowest end of this spectrum. In trying to understand our findings and place them in context, it is helpful to examine other studies. Many of these studies focused solely on cancer patients.[13, 18, 19, 20, 21, 22, 23] Cancer follows a more predictable trajectory of decline compared to other common life‐threatening illnesses, such as cardiac disease, emphysema, or liver failure, that often involve periods of acute deteriorations and plateaus throughout illness progression. The more predictable trajectory may explain the overall higher concordance rates found in the studies involving cancer patients.
The majority of studies in the literature examining concordance between preferred and actual site of death recruited the study sample from home health or home palliative care programs that were providing support and care to participants.[10, 12, 13, 18, 22, 25, 26, 27] The high concordance rates reported may be the result of the patients in the sample receiving services at home aimed at eliciting preferences and providing support at home. Our observational study is unique in that we elicited patient preferences from a diverse group of hospitalized adults. Patients had a broad range of medical illness and were at various stages in their disease trajectory. This allowed our findings to be more generalizable, a major strength of our study.
The only variable associated with concordance that we identified to predict concordance between preferred and actual site of death was female gender. Women have been shown to be more active in medical decision making, which may explain our findings.[28] Female gender and illness severity (as measured by the CARING criteria) were found to be associated with concordance when the preference is for death at home. For persons with more advanced medical illness, they may have had more opportunity to consider their preferences and talk about these preferences. It is even possible that our interview prompted some participants to have discussions with their families or providers.
Variables with high face validity, such as high social support, higher education, and completing an advance directive, did not demonstrate any effect on the outcome of concordance. Other studies have shown that low functional status, Caucasian ethnicity, home care, higher education, and social support have been associated with a greater likelihood for a home death.[3, 6, 9] However, although studies specifically examining concordance between preferred and actual site of death have looked at predictors for home death, we were unable to find predictors for concordance across all preferences in the literature. We can conclude from our findings that the factors that influence concordance of preferences for site of death are extremely complex and difficult to capture and measure. This is extremely unsatisfying in the face of the low concordance rate of 30% we identified.
Latino ethnicity showed a trend toward having a negative association with concordance between preferred and actual site of death. This trend persisted whether it was concordance overall or for concordance with those who preferred a death at home. In the literature, Latinos have been found to be less likely to complete advance directives, use hospice services at the end of life, and are more likely to experience a hospital death.[29, 30, 31, 32, 33] As care at the end of life continues to improve, careful attention should be paid to ensure that these kinds of gaps do not widen any further.
We interviewed patients at an index hospitalization. Patients had an acute medical illness or an exacerbation of a chronic medical illness and required at least 24 hours of hospitalization to be eligible for inclusion. Our bedside interview made use of an opportune time to question patients, a time when it may have been easier for patients to visualize severe illness at the end of life, rather than asking this question during a time of wellness. Although participants overwhelmingly stated they preferred to be at home, for those who died, decisions were made in their care that did not allow for this preference.
Our follow‐up after the initial bedside interview only included death records of where and when participants died. We do not have the details and narrative of the conversations that may have taken place that led to the care decisions that determined participants' actual place of death. We do not know if preferences were elicited or discussed, and care decisions then negotiated, to best meet the goals and preferences expressed at that time. We also do not know if the conversations did not occur and the default of medical intervention and cure‐focused care dictated how participants spent the last days of their life. There is evidence that when conversations about goals and preferences do occur, concordance between preferences and care received are high.[12, 21]
We were unable to identify any predictors beyond gender in this cohort of adults hospitalized with a broad spectrum of severe medical illness to predict concordance with stated preferences and actual site of death. We can conclude then, based on our findings and supported by the literature, that the default trends toward institutional end‐of‐life experiences. To shift to a more patient‐centered approach, away from the default, healthcare providers need to embrace a palliative approach and incorporate preferences and goals into the discussions about next steps of care to facilitate the peaceful death that the majority of patients imagine for themselves. Hospitalist physicians have a unique opportunity at an index hospitalization to start the conversation about preferences for care including where patients would want to spend the last days of their life.
Our study does have some limitations. We elicited preferences at a single point in time, at an index hospitalization. It is possible that participants' preferences changed over the course of their illness. However, in Agar et al.'s study of longitudinal patient preferences for site of death and place of care, most preferences remained stable over time.[18] We also did not have data that included palliative care involvement, homecare or hospice utilization, or cause of death. All of these variables may be important predictors of concordance. Issues of symptom management and lack of caregiver may also dictate place of death, even when goals and care are aligned. We do not have data to address these components of end‐of‐life decision making.
CONCLUSION
Patients continue to express a preference for death at home. However, the majority of patients experienced an institutional death. Furthermore, few participants achieved concordance with where they preferred to die and where they actually died. Female gender was the sole factor associated with concordance between preferred and actual site of death. Incorporating a palliative approach that elicits goals and helps match goals to care, may offer the best opportunity to help people die where they chose.
Disclosures: This research was supported by the Brookdale National Fellowship Award and the NIA/Beeson grant 5K23AG028957. All authors have seen and agree with the contents of the article. This submission was not under review by any other publication. The authors have no financial interest or other potential conflicts of interest.
- Field MJ, Cassel CK, eds. Committee on Care at the End of Life. Approaching Death: Improving Care at the End of Life. Washington DC: National Academy Press; 1997.
- , . Demography and epidemiology of dying in the U.S. with emphasis on deaths of older persons. Hosp J. 1998;13:49–60.
- , , , . Factors associated with site of death: a national study of where people die. Med Care. 2003;41:323–335.
- , , , , , . Terminal cancer care and patient's preferences for place of death: a prospective study. BMJ. 1990;301:415–417.
- , , , et al. Influence of patient preferences and local health system characteristics on the place of death. SUPPORT Investigators. Study to Understand Prognoses and Preferences for Risks and Outcomes of Treatment. J Am Geriatr Soc. 1998;46:1242–1250.
- , , , , , . Where people die: a multilevel approach to understanding influences on site of death in America. Med Care Res Rev. 2007;64:351–378.
- , , , , , . Dying at home or in an institution using death certificates to explore the factors associated with place of death. Health Policy. 2006;78:319–329.
- , . How do cancer patients who die at home differ from those who die elsewhere? Palliat Med. 1998;12:279–286.
- , . Factors influencing death at home in terminally ill patients with cancer: systematic review [published correction appears in BMJ. 2006;332:1012]. BMJ 2006;332:515–521.
- , , , , , . Predictive factors for home deaths among cancer patients in Swedish palliative home care. Support Care Cancer. 2003;11:560–567.
- , . Systemic adenosine infusions alleviated neuropathic pain. Pain. 2001;94:121–122.
- , , . Prevalence, effectiveness, and predictors of planning their place of death among older persons followed in community‐based long term care. J Am Geriatr Soc. 2000;48:943–948.
- , , , , . Preferences for place of care and place of death among informal caregivers of the terminally ill. Palliat Med. 2005;19:492–499.
- , . Social networks, host resistance, and mortality: a nine‐year follow‐up study of Alameda County residents. Am J Epidemiol. 1979;109:186–204.
- , , , , , . A practical tool to identify patients who may benefit from a palliative approach: the CARING criteria. J Pain Symptom Manage. 2006;31:285–292.
- , . Applied Logistic Regression. 2nd ed. New York, NY: Wiley‐Interscience; 2000.
- , . Calculation of polychotmous logistic regression parameters using individualized regressions. Biometrika. 1984;71:11–18.
- , , , , , . Preference for place of care and place of death in palliative care: are these different questions? Palliat Med. 2008;22(7):787–795.
- , , . Place of death: preferences among cancer patients and their carers. Soc Sci Med. 2004;58:2431–2444.
- , . Determinants of congruence between the preferred and actual place of death for terminally ill cancer patients. J Palliat Care. 2003;19:230–237.
- , , . Factors associated with location of death (home or hospital) of patients referred to a palliative care team. CMAJ. 1995;152:361–367.
- , , , et al. Proxy perspectives regarding end‐of‐life care for persons with cancer. Cancer. 2008;112:1854–1861.
- , , , , , . Actual and preferred place of death of cancer patients. Results from the Italian survey of the dying of cancer (ISDOC). J Epidemiol Community Health. 2006;60:412–416.
- , , , . Family reports of barriers to optimal care of the dying. Nurs Res. 2000;49:310–317.
- , , . Place of death: preferences among cancer patients and their carers. Soc Sci Med. 2004;58(12):2431–2444.
- , . Where do elderly patients prefer to die? Place of death and patient characteristics of 100 elderly patients under the care of a home health care team. J Am Geriatr Soc. 1983;31:457–461.
- , , , , , . Predictors of home death in palliative care cancer patients. J Palliat Care. 2000;16:23–28.
- , . Patient preferences for medical decision making: who really wants to participate? Med Care. 2000;38:335–341.
- , , , et al. Racial and ethnic differences in advance care planning among patients with cancer: impact of terminal illness acknowledgment, religiousness, and treatment preferences. J Clin Oncol. 2008;26:4131–4137.
- , , , . Influence of ethnicity on advance directives and end‐of‐life decisions. JAMA. 1997;277:298–299.
- , , , . Differences in end‐of‐life decision making among black and white ambulatory cancer patients. J Gen Intern Med. 1996;11:651–656.
- , , . Hospice usage by minorities in the last year of life: results from the National Mortality Feedback Survey. J Am Geriatr Soc. 2003;51:970–978.
- , , , , , . Place of death: correlations with quality of life of patients with cancer and predictors of bereaved caregivers' mental health. J Clin Oncol. 2010;28:4457–4464.
At the turn of the 20th century, most deaths in the United States occurred at home. By the 1960s, over 70% of deaths occurred in an institutional setting, reflecting an evolution of medical technology.[1, 2, 3] With the birth of the hospice movement in the 1970s, dying patients had the opportunity to have both death at home and aggressive symptom control at the end of life. Although there has been a slow decline in the proportion of deaths that occur in the hospital over the past 2 decades,[3] the overwhelming majority of persons state that they would prefer to die at home. However, recent findings suggest that most people will die in an institutional setting.[3, 4, 5, 6]
Although good data exist describing population preferences for location of death, and we know, based on death records, where deaths occur in the United States, there are few studies that examine concordance between preferred and actual site of death at the individual patient level. Furthermore, although factors have been identified that predict death at home, factors predicting concordance between preferred and actual site of death are not well described.[3, 6, 7, 8, 9, 10, 11, 12, 13]
Regardless of where death ultimately occurs, most adults will experience multiple hospitalizations within the last years of their life. Understanding the preferences and subsequent experiences of this population is of particular relevance to hospitalist physicians who are in a unique position to elicit goals from seriously ill patients and help match patient preferences with their medical care. In this observational study, we sought to determine preferences for site of death in a cohort of adult patients admitted to the hospital for medical illness, and then follow those patients to determine where death occurred for those who died. We also sought to explore factors that may predict concordance between preferred and actual site of death. We hypothesized that ethnic diversity and lower socioeconomic status would be associated with a lower likelihood of concordance between preferred and actual site of death. We also hypothesized that advanced care planning would be associated with a higher likelihood of concordance. The Colorado Multi‐Institutional Review Board approved this study.
METHODS
Participants were recruited from 3 hospitals affiliated with the University of Colorado School of Medicine Internal Medicine Residency program, including the Denver Veterans' Administration Center (DVAMC), Denver Health Medical Center (DHMC), and University of Colorado Hospital (UCH). The DVAMC is a large urban Veterans Administration hospital, serving veterans from the Denver metro area, and is a tertiary referral center for veterans in rural Colorado, Wyoming, and parts of Montana. DHMC, the safety‐net hospital for the Denver area, serves over 25% of the residents in the city and county of Denver, including such special populations as the indigent, chronically mentally ill, and persons with polysubstance dependence. UCH had 350 licensed beds at the time of our study and serves as the Rocky Mountain region's only academic tertiary, specialty care, and referral center. At the time of this study, there was limited inpatient palliative care services at the DVAMC and UH, and no palliative care services at DHMC. Participants were screened on the first day following admission to the adult general medical service. Participants were recruited on 96 postadmission days between February 2004 and June 2006. Recruitment days varied from Monday through Friday, to include admissions from the weekend and throughout the year to reduce potential bias due to seasonal trends of diseases such as influenza. Patients were excluded if they died or were discharged within the first 24 hours of admission, were pregnant, jailed, or unable to give informed consent. All other patients were approached and invited to participate in a brief survey.
After informed consent was obtained, participants completed a bedside interview that included self‐identified ethnicity and the Berkman‐Syme Social Network Index,[14] a brief questionnaire quantifying social support from spouse or domestic partner, family, friends, and other religious or secular organizations. Baseline socioeconomic measures (eg, income, employment, home ownership, car ownership) and questions related to the last days of life were also included. Participants were asked the following question, If you were very sick, with an illness that could not be cured, and in bed most of the time, where would you spend the last days of your life if you could chose?
For each participant, we performed a detailed chart review to determine demographic data, presence of advance directives, and CARING criteria (Cancer, Admissions 2, Residence in a nursing home, Intensive care unit admit with multiorgan failure, 2 Noncancer hospice Guidelines), a set of prognostic criteria identifying patients at an index hospitalization who have a high burden of illness and are at risk for death in the following year.[15] We then followed patients for 5 years. If participants died within the follow‐up period, we collected the date and location of death using medical records, death certificates, or in a few cases when official death records were unavailable, direct contact with the family. Participants were considered alive if they had a clinic visit or MD/RN phone contact within 3 months prior to the final collection point date.
Analysis
SAS 9.1 (SAS Institute Inc., Cary, NC) was used for all analyses. Simple frequencies and means statistics were used to determine rates of descriptive characteristics of the sample as well as rates of the measured outcomes, preferred place to spend last days of life, and actual site of death. Agreement or concordance between preferred and actual site of death was calculated. For the purposes of the analysis, we assumed all persons who stated they had no preference died in a place concordant with their wishes. To calculate agreement by preferred and actual site, participants who expressed a preference and died (n=111) in hospital, nursing home, home, or hospice setting were included in the analysis, and participants (n=4) who died in an unknown or other locations were excluded (eg, motel room).
Logistic Regression Modeling
2 tests were performed for all categorical variables to determine a significant association with outcome variables. Preferred place of death and concordance between preferred and actual site of death were modeled using predictive variables selected if univariable association demonstrated a P0.25. This standard cutoff was selected to broadly identify candidate variables for logistic regression modeling.[16] A stepwise algorithm was used to select significant predictors that would remain in the model.
In lieu of fitting a multinomial logit model for preferred site of death of home vs hospital vs nursing home or hospice facility as preferred site of death, 3 logit models (although only 2 may be sufficient to estimate the underlying multinomial logit model[17]) were considered with outcome categories: home vs nursing home or hospice facility, and hospital vs nursing home or hospice facility and home vs hospital.
For the logistic regression modeling of concordance, we included the full sample of patients who died during the follow‐up period (n=123). We classified participants as dying in a place concordant with their wishes or not concordant.
RESULTS
Study Population
Subjects were recruited on 96 post‐admission days totaling 842 admissions. Three hundred thirty‐one patients (39%) were ineligible for study participation (n=175 discharged within 24 hours, n=76 unable to consent, n=78 ineligible for other reasons [eg, prisoner, pregnant, under 18 years old], n=2 died within 24 hours of admission). Only 53 of the remaining 511 (10%) patients refused; 458 patients (90%) gave informed consent to participate. Characteristics of the study population are depicted in Table 1. There were very few missing cases (<3%), that is persons without a recent clinic follow‐up date, contact, or a confirmed date of death. These persons were considered alive. Overall, the sample population was ethnically diverse, slightly older than middle age, mostly male (due to the inclusion of the Veterans Administration hospital), and of low socioeconomic status.
| Mean age (SD), y | 57.9 (14.8) |
|---|---|
| |
| Mean time to death (SD), d | 339.5 (348.4) |
| Ethnicity | |
| African American | 19% (88) |
| Caucasian | 52% (239) |
| Latino | 22% (102) |
| Other | 6% (29) |
| Spanish language only | 6% (27) |
| Female gender | 35% (159) |
| Admitted to DVAMC | 41% (188) |
| Admitted to DHMC | 38% (174) |
| Admitted to UCH | 21% (96) |
| CARING criteria | |
| Cancer diagnosis | 11% (51) |
| Admitted to hospital 2 times in the past year for chronic illness | 40% (181) |
| Resident in a nursing home | 2% (9) |
| Noncancer hospice guidelines (meeting 2) | 13% (59) |
| Income <$30,000/year | 84% (377) |
| No greater than high school education | 55% (248) |
| Home owner | 26% (120) |
| Rents home | 39% (177) |
| Unstable living situationa | 34% (156) |
| Low social supportb | 36% (165) |
| Uninsured | 18% (81) |
| Regular primary care provider | 73% (330) |
Preferred Site of Death
When asked where they preferred to spend the last days of their life, 75% of patients (n=343) stated they would like to be at home. In the hospital was the preferred location for 10% of patients, whereas 6% stated a nursing home and 4% a hospice inpatient facility. Two percent stated they had no preference, and 3% refused to answer (Figure 1)
We found that in the univariable analysis the following factors were associated with preference for site of death at a significance level of P<0.25: unstable housing, hospital setting, income level, ethnicity, CARING criteria, presence of an advance directive, education level, married, primary care provider, and presence of public insurance. Results of the logit models (home vs nursing home or hospice facility, and hospital vs nursing home or hospice facility and home vs hospital) are presented in Table 2.
| Adjusted Odds Ratio (95% Confidence Interval) | |||
|---|---|---|---|
| Home vs Nursing Home/Hospice Facility | Hospital vs Nursing Home/Hospice Facility | Home vs Hospital | |
| |||
| Low income | 2.71 (1.305.67) | 3.05 (1.019.24) | 0.99 (0.422.37) |
| Married | 2.44 (1.145.21) | 2.40 (0.876.62) | 0.82 (0.421.57) |
| CARING criteria | 0.58 (0.301.14) | 0.44 (0.181.09) | 0.89 (0.471.66) |
Patients with income <$30,000/year were more likely to prefer home (or hospital) over a nursing home or hospice facility. Being married was predictive of preferring home over nursing home or hospice facility. Patients meeting 1 of the CARING criteria trended toward being less likely (P=0.11 for home and P=0.08 for hospital) to prefer home (or hospital) vs nursing home or hospice facility. However, there were no significant predictors for a preference for home or hospital when directly comparing the 2 locations, as expected from observing similar effects of variables in the other 2 logit models.
Actual Site of Death
One hundred twenty‐three patients died during the follow‐up period (26% of the total sample). Of those who died, the mean age was 64 years (standard deviation 13), 82% had annual incomes <$30,000, 73% were men, and 77% met at least 1 of the CARING criteria suggesting advanced medical illness. The distribution of ethnicities of the deceased subsample was similar to that of the overall cohort. Complete death records were obtained for 121 patients. Only 31% (n=38) died at home, whereas 35% (n=42) died in a hospital, 20% (n=24) died in a nursing home, and 12% (n=14) died in an inpatient hospice facility (Figure 1).
In univariable analysis, there were no associations at a 25% significance level between actual site of death and ethnicity, gender, age, severity of illness, high vs low social support, high or low socioeconomic status, stable vs unstable housing, or presence of a completed advance directive in the medical record.
Concordance Between Preferred and Actual Site of Death
Overall, 37% of the patients died where they stated they would prefer to die, including the 2 with no preference. Concordance rates for each site of death are presented in Table 3. We examined sociodemographic variables, disease severity, advance‐care planning, primary care provider, health insurance, and hospital site to look for associations with concordance. We found that female gender was positively associated with concordance (odds ratio [OR], 3.30; 95% confidence interval [CI], 1.25‐8.72). CARING criteria (P=0.06) and Latino ethnicity (vs all other ethnicity categories, P=0.12) also showed trends for association. Restricting to those who preferred home, the associations became stronger (OR, 4.62; 95% CI, 1.44‐14.79 for female; OR, 7.72; 95% CI, 1.67‐35.71 for CARING criteria), and the trend for the negative association between Latino ethnicity and concordance remained (P=0.12). Results of the model are shown in Table 4.
| Actual Site of Death, n (Row %) | Row Total, % Out of 111 | ||||
|---|---|---|---|---|---|
| Hospital | Nursing Home | Home | Hospice Facility | ||
| Preferred hospital | 5 (42%) | 3 (25%) | 2 (17%) | 2 (17%) | 12 (11%) |
| Preferred nursing home | 1 (13%) | 5 (63%) | 2 (25%) | 0 | 8 (7%) |
| Preferred home | 30 (34%) | 15 (17%) | 31 (35%) | 12 (14%) | 88 (79%) |
| Preferred hospice facility | 3 (100%) | 0 | 0 | 0 | 3 (3%) |
| Adjusted Odds Ratio (95% Confidence Interval) | |||
|---|---|---|---|
| All | Home (Using Same Variables) | Home (Using Only Significant Variables) | |
| |||
| Female gender | 3.30 (1.258.72) | 4.62 (1.4414.79) | 3.57 (1.2410.34) |
| CARING criteria | 3.09 (0.979.81) | 7.72 (1.6735.71) | 5.93 (1.4124.91) |
| Latino vs African American/Caucasian/other | 0.43 (0.151.24) | 0.35 (0.091.30) | |
DISCUSSION
We found, similarly to previous reports in the literature, the majority of patients preferred to die at home. We did not find a significant difference in preferences or location of death by ethnicity or illness severity. Lower‐income patients and married patients were more likely to prefer to be at home over a nursing home or a hospice facility in the last days of life. We found that the minority of patients died at their stated preferred site of death, and female gender was the only predictive variable we found to distinguish those patients who died in a place concordant with their wishes compared to those who did not.
In the literature, previous studies have reported concordance rates between preferred and actual site of death that range from 30% to 90%.[12, 13, 18, 19, 20, 21, 22, 23, 24] We found a concordance rate at the lowest end of this spectrum. In trying to understand our findings and place them in context, it is helpful to examine other studies. Many of these studies focused solely on cancer patients.[13, 18, 19, 20, 21, 22, 23] Cancer follows a more predictable trajectory of decline compared to other common life‐threatening illnesses, such as cardiac disease, emphysema, or liver failure, that often involve periods of acute deteriorations and plateaus throughout illness progression. The more predictable trajectory may explain the overall higher concordance rates found in the studies involving cancer patients.
The majority of studies in the literature examining concordance between preferred and actual site of death recruited the study sample from home health or home palliative care programs that were providing support and care to participants.[10, 12, 13, 18, 22, 25, 26, 27] The high concordance rates reported may be the result of the patients in the sample receiving services at home aimed at eliciting preferences and providing support at home. Our observational study is unique in that we elicited patient preferences from a diverse group of hospitalized adults. Patients had a broad range of medical illness and were at various stages in their disease trajectory. This allowed our findings to be more generalizable, a major strength of our study.
The only variable associated with concordance that we identified to predict concordance between preferred and actual site of death was female gender. Women have been shown to be more active in medical decision making, which may explain our findings.[28] Female gender and illness severity (as measured by the CARING criteria) were found to be associated with concordance when the preference is for death at home. For persons with more advanced medical illness, they may have had more opportunity to consider their preferences and talk about these preferences. It is even possible that our interview prompted some participants to have discussions with their families or providers.
Variables with high face validity, such as high social support, higher education, and completing an advance directive, did not demonstrate any effect on the outcome of concordance. Other studies have shown that low functional status, Caucasian ethnicity, home care, higher education, and social support have been associated with a greater likelihood for a home death.[3, 6, 9] However, although studies specifically examining concordance between preferred and actual site of death have looked at predictors for home death, we were unable to find predictors for concordance across all preferences in the literature. We can conclude from our findings that the factors that influence concordance of preferences for site of death are extremely complex and difficult to capture and measure. This is extremely unsatisfying in the face of the low concordance rate of 30% we identified.
Latino ethnicity showed a trend toward having a negative association with concordance between preferred and actual site of death. This trend persisted whether it was concordance overall or for concordance with those who preferred a death at home. In the literature, Latinos have been found to be less likely to complete advance directives, use hospice services at the end of life, and are more likely to experience a hospital death.[29, 30, 31, 32, 33] As care at the end of life continues to improve, careful attention should be paid to ensure that these kinds of gaps do not widen any further.
We interviewed patients at an index hospitalization. Patients had an acute medical illness or an exacerbation of a chronic medical illness and required at least 24 hours of hospitalization to be eligible for inclusion. Our bedside interview made use of an opportune time to question patients, a time when it may have been easier for patients to visualize severe illness at the end of life, rather than asking this question during a time of wellness. Although participants overwhelmingly stated they preferred to be at home, for those who died, decisions were made in their care that did not allow for this preference.
Our follow‐up after the initial bedside interview only included death records of where and when participants died. We do not have the details and narrative of the conversations that may have taken place that led to the care decisions that determined participants' actual place of death. We do not know if preferences were elicited or discussed, and care decisions then negotiated, to best meet the goals and preferences expressed at that time. We also do not know if the conversations did not occur and the default of medical intervention and cure‐focused care dictated how participants spent the last days of their life. There is evidence that when conversations about goals and preferences do occur, concordance between preferences and care received are high.[12, 21]
We were unable to identify any predictors beyond gender in this cohort of adults hospitalized with a broad spectrum of severe medical illness to predict concordance with stated preferences and actual site of death. We can conclude then, based on our findings and supported by the literature, that the default trends toward institutional end‐of‐life experiences. To shift to a more patient‐centered approach, away from the default, healthcare providers need to embrace a palliative approach and incorporate preferences and goals into the discussions about next steps of care to facilitate the peaceful death that the majority of patients imagine for themselves. Hospitalist physicians have a unique opportunity at an index hospitalization to start the conversation about preferences for care including where patients would want to spend the last days of their life.
Our study does have some limitations. We elicited preferences at a single point in time, at an index hospitalization. It is possible that participants' preferences changed over the course of their illness. However, in Agar et al.'s study of longitudinal patient preferences for site of death and place of care, most preferences remained stable over time.[18] We also did not have data that included palliative care involvement, homecare or hospice utilization, or cause of death. All of these variables may be important predictors of concordance. Issues of symptom management and lack of caregiver may also dictate place of death, even when goals and care are aligned. We do not have data to address these components of end‐of‐life decision making.
CONCLUSION
Patients continue to express a preference for death at home. However, the majority of patients experienced an institutional death. Furthermore, few participants achieved concordance with where they preferred to die and where they actually died. Female gender was the sole factor associated with concordance between preferred and actual site of death. Incorporating a palliative approach that elicits goals and helps match goals to care, may offer the best opportunity to help people die where they chose.
Disclosures: This research was supported by the Brookdale National Fellowship Award and the NIA/Beeson grant 5K23AG028957. All authors have seen and agree with the contents of the article. This submission was not under review by any other publication. The authors have no financial interest or other potential conflicts of interest.
- Field MJ, Cassel CK, eds. Committee on Care at the End of Life. Approaching Death: Improving Care at the End of Life. Washington DC: National Academy Press; 1997.
- , . Demography and epidemiology of dying in the U.S. with emphasis on deaths of older persons. Hosp J. 1998;13:49–60.
- , , , . Factors associated with site of death: a national study of where people die. Med Care. 2003;41:323–335.
- , , , , , . Terminal cancer care and patient's preferences for place of death: a prospective study. BMJ. 1990;301:415–417.
- , , , et al. Influence of patient preferences and local health system characteristics on the place of death. SUPPORT Investigators. Study to Understand Prognoses and Preferences for Risks and Outcomes of Treatment. J Am Geriatr Soc. 1998;46:1242–1250.
- , , , , , . Where people die: a multilevel approach to understanding influences on site of death in America. Med Care Res Rev. 2007;64:351–378.
- , , , , , . Dying at home or in an institution using death certificates to explore the factors associated with place of death. Health Policy. 2006;78:319–329.
- , . How do cancer patients who die at home differ from those who die elsewhere? Palliat Med. 1998;12:279–286.
- , . Factors influencing death at home in terminally ill patients with cancer: systematic review [published correction appears in BMJ. 2006;332:1012]. BMJ 2006;332:515–521.
- , , , , , . Predictive factors for home deaths among cancer patients in Swedish palliative home care. Support Care Cancer. 2003;11:560–567.
- , . Systemic adenosine infusions alleviated neuropathic pain. Pain. 2001;94:121–122.
- , , . Prevalence, effectiveness, and predictors of planning their place of death among older persons followed in community‐based long term care. J Am Geriatr Soc. 2000;48:943–948.
- , , , , . Preferences for place of care and place of death among informal caregivers of the terminally ill. Palliat Med. 2005;19:492–499.
- , . Social networks, host resistance, and mortality: a nine‐year follow‐up study of Alameda County residents. Am J Epidemiol. 1979;109:186–204.
- , , , , , . A practical tool to identify patients who may benefit from a palliative approach: the CARING criteria. J Pain Symptom Manage. 2006;31:285–292.
- , . Applied Logistic Regression. 2nd ed. New York, NY: Wiley‐Interscience; 2000.
- , . Calculation of polychotmous logistic regression parameters using individualized regressions. Biometrika. 1984;71:11–18.
- , , , , , . Preference for place of care and place of death in palliative care: are these different questions? Palliat Med. 2008;22(7):787–795.
- , , . Place of death: preferences among cancer patients and their carers. Soc Sci Med. 2004;58:2431–2444.
- , . Determinants of congruence between the preferred and actual place of death for terminally ill cancer patients. J Palliat Care. 2003;19:230–237.
- , , . Factors associated with location of death (home or hospital) of patients referred to a palliative care team. CMAJ. 1995;152:361–367.
- , , , et al. Proxy perspectives regarding end‐of‐life care for persons with cancer. Cancer. 2008;112:1854–1861.
- , , , , , . Actual and preferred place of death of cancer patients. Results from the Italian survey of the dying of cancer (ISDOC). J Epidemiol Community Health. 2006;60:412–416.
- , , , . Family reports of barriers to optimal care of the dying. Nurs Res. 2000;49:310–317.
- , , . Place of death: preferences among cancer patients and their carers. Soc Sci Med. 2004;58(12):2431–2444.
- , . Where do elderly patients prefer to die? Place of death and patient characteristics of 100 elderly patients under the care of a home health care team. J Am Geriatr Soc. 1983;31:457–461.
- , , , , , . Predictors of home death in palliative care cancer patients. J Palliat Care. 2000;16:23–28.
- , . Patient preferences for medical decision making: who really wants to participate? Med Care. 2000;38:335–341.
- , , , et al. Racial and ethnic differences in advance care planning among patients with cancer: impact of terminal illness acknowledgment, religiousness, and treatment preferences. J Clin Oncol. 2008;26:4131–4137.
- , , , . Influence of ethnicity on advance directives and end‐of‐life decisions. JAMA. 1997;277:298–299.
- , , , . Differences in end‐of‐life decision making among black and white ambulatory cancer patients. J Gen Intern Med. 1996;11:651–656.
- , , . Hospice usage by minorities in the last year of life: results from the National Mortality Feedback Survey. J Am Geriatr Soc. 2003;51:970–978.
- , , , , , . Place of death: correlations with quality of life of patients with cancer and predictors of bereaved caregivers' mental health. J Clin Oncol. 2010;28:4457–4464.
Copyright © 2013 Society of Hospital Medicine