User login
The American Journal of Orthopedics is an Index Medicus publication that is valued by orthopedic surgeons for its peer-reviewed, practice-oriented clinical information. Most articles are written by specialists at leading teaching institutions and help incorporate the latest technology into everyday practice.
AAOS Introduces New Apps for Patient Education
The American Academy of Orthopedic Surgeons has introduced apps that orthopedic surgeons can use to explain musculoskeletal problems and procedures to their patients. The Guides to Orthopedic Surgery cover total knee replacement, total hip replacement, and ACL reconstruction. These apps can be loaded onto exam room desktops or used on an iPad.
The apps also provide ways to create custom educational information for patients, and may be set up with certain electronic medical records to support Meaningful Use requirements. A free trial of the apps is available until June 30. More information: www.aaosnotice.org/Ortho_App/.
The Effect of Humeral Inclination on Range of Motion in Reverse Total Shoulder Arthroplasty: A Systematic Review
Reverse total shoulder arthroplasty (RTSA) has become a reliable treatment option for many pathologic conditions of the shoulder, including rotator cuff arthropathy, proximal humerus fractures, and others.1-4 While the treatment outcomes have generally been reported as good, some concern exists over the postoperative range of motion (ROM) in patients following RTSA, including external rotation.5-7 The original RTSA design was introduced by Neer in the 1970s and has undergone many modifications since that time.1,2 The original Grammont-style prosthesis involved medialization of the glenoid, inferiorizing the center of rotation (with increased deltoid tensioning), and a neck-shaft angle of 155°.1,8 While clinical results of the 155° design were encouraging, concerns arose over the significance of the common finding of scapular notching, or contact between the scapular neck and inferior portion of the humeral polyethylene when the arm is adducted.9,10
To address this concern, a prosthesis design with a 135° neck-shaft angle was introduced.11 This new design did significantly decrease the rate of scapular notching, and although some reported a concern over implant stability with the 135° prosthesis, recent data has shown no difference in dislocation rates between the 135° and 155° prostheses.3 A different variable that has not been evaluated between these prostheses is the active ROM that is achieved postoperatively, and the change in ROM from pre- to post-RTSA.12,13 As active ROM plays a significant role in shoulder function and patient satisfaction, the question of whether a significant difference exists in postoperative ROM between the 135° and 155° prostheses must be addressed.
The purpose of this study was to perform a systematic review investigating active ROM following RTSA to determine if active postoperative ROM following RTSA differs between the 135° and 155° humeral inclination prostheses, and to determine if there is a significant difference between the change in preoperative and postoperative ROM between the 135° and 155° prostheses. The authors hypothesize that there will be no significant difference in active postoperative ROM between the 135° and 155° prostheses, and that the difference between preoperative and postoperative ROM (that is, the amount of motion gained by the surgery) will not significantly differ between the 135° and 155° prostheses.
Methods
A systematic review was conducted according to Preferred Reporting Items for Systematic Reviews and Meta-Analyses (PRISMA) guidelines using a PRISMA checklist.15 Systematic review registration was performed using the PROSPERO international prospective register of systematic reviews (registration date 3/9/15, registration number CRD42015017367).16 Two reviewers independently conducted the search on March 7, 2015 using the following databases: Medline, Cochrane Central Register of Controlled Trials, SportDiscus, and CINAHL. The electronic search citation algorithm utilized was: (((((reverse[Title/Abstract]) AND shoulder[Title/Abstract]) AND arthroplasty[Title/Abstract]) NOT arthroscopic[Title/Abstract]) NOT cadaver[Title/Abstract]) NOT biomechanical[Title/Abstract]. English language Level I-IV evidence (2011 update by the Oxford Centre for Evidence-Based Medicine17) clinical studies that reported the type of RTSA prosthesis that was used as well as postoperative ROM with at least 12 months follow-up were eligible. All references within included studies were cross-referenced for inclusion if missed by the initial search. If duplicate subject publications were discovered, the study with the longer duration of follow-up or larger number of patients was included. Level V evidence reviews, letters to the editor, basic science, biomechanical studies, arthroscopic shoulder surgery, imaging, surgical technique, and classification studies were excluded. Studies were excluded if both a 135° and 155° prosthesis were utilized and the outcomes were not stratified by the humeral inclination. Studies that did not report ROM were excluded.
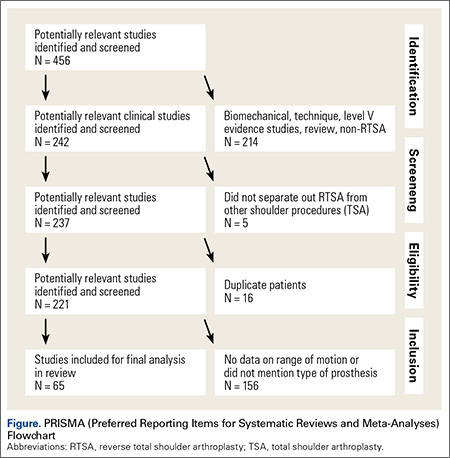
A total of 456 studies were located, and, after implementation of the exclusion criteria, 65 studies from 2005-2015 were included in the final analysis (Figure). Subjects of interest in this systematic review underwent a RTSA. Studies were not excluded based on the surgical indications (rotator cuff tear arthropathy, proximal humerus fractures, osteoarthritis) and there was no minimum follow-up or rehabilitation requirement. Study and subject demographic parameters analyzed included year of publication, journal of publication, country and continent of publication, years of subject enrollment, presence of study financial conflict of interest, number of subjects and shoulders, gender, age, the manufacturer and type of prosthesis used, and the degree of the humeral inclination (135° vs 155° humeral cup). Preoperative ROM, including forward elevation, abduction, external rotation with the arm adducted, and external rotation with the arm at 90° of abduction, were recorded. The same ROM measurements were recorded for the final follow-up visit that was reported. Internal rotation was recorded, but because of the variability with how this measurement was reported, it was not analyzed. Clinical outcome scores and complications were not assessed. Study methodological quality was evaluated using the Modified Coleman Methodology Score (MCMS).18
Statistical Analysis
Descriptive statistics were calculated, including mean ± standard deviation for quantitative continuous data and frequencies with percentages for qualitative categorical data. ROM comparisons between 135° and 155° components (pre- vs postoperative for each and postoperative between the 2) were made using 2 proportion z-test calculator (http://in-silico.net/tools/statistics/ztest) using alpha .05 because of the difference in sample sizes between compared groups.
Results
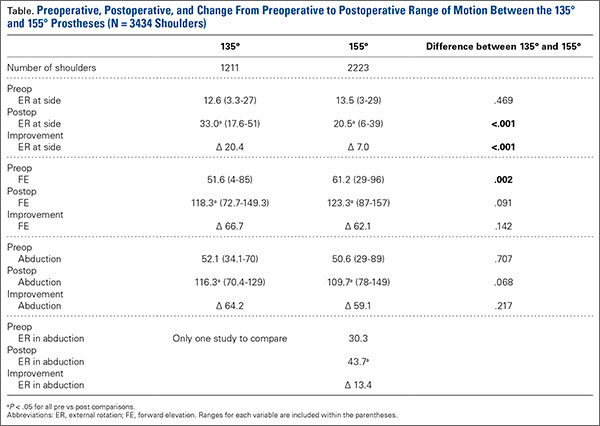
Sixty-five studies with 3302 patients (3434 shoulders) were included in this study. There was a total of 1211 shoulders in the 135° lateralized glenosphere group and 2223 shoulders in the 155° group. The studies had an average MCMS of 40.4 ± 8.2 (poor), 48% of studies reported a conflict of interest, 32% had no conflict of interest, and 20% did not report whether a conflict of interest existed or not. The majority of studies included were level IV evidence (85%). Mean patient age was 71.1 ± 7.6 years; 29% of patients were male and 71% were female. No significant difference existed between patient age at the time of surgery; the average age of patients in the 135° lateralized glenosphere group was 71.67 ± 3.8 years, while the average patient age of patients in the 155° group was 70.97 ± 8.8 years. Mean follow-up for all patients included in this study was 37.2 ± 16.5 months. Of the 65 studies included, 3 were published from Asia, 4 were published from Australia, 24 were from North America, and 34 were from Europe. Of the individual countries whose studies were included, the United States had 23 included studies, France had 13 included studies, and Italy had 4 included studies. All other countries had <4 studies included.
Patients who received either a 135° or a 155° prosthesis showed significant improvements in external rotation with the arm at the side (P < .05), forward elevation (P < .05), and abduction (P < .05) following surgery (Table). When comparing the 135° and 155° groups, patients who received a 135° prosthesis showed significantly greater improvements in external rotation with the arm at the side (P < .001) and had significantly more overall external rotation postoperatively (P < .001) than patients who received a 155° prosthesis. The only preoperative ROM difference between groups was the 155° group started with significantly more forward elevation than the 135°group prior to surgery (P = .002).
Discussion
RTSA is indicated in patients with rotator cuff tear arthropathy, pseudoparalysis, and a functional deltoid.1,2,4 The purpose of this systematic review was to determine if active ROM following RTSA differs between the 135° and 155° humeral inclination prostheses, and to determine if there is a significant difference between the change in preoperative and postoperative ROM between the 135° and 155° prostheses. Forward elevation, abduction, and external rotation all significantly improved following surgery in both groups, with no significant difference between groups in motion or amount of motion improvement, mostly confirming the study hypotheses. However, patients in the 135° group had significantly greater postoperative external rotation and greater amount of external rotation improvement compared to the 155° group.
Two of the frequently debated issues regarding implant geometry is stability and scapular notching between the 135° and 155° humeral inclination designs. Erickson and colleagues3 recently evaluated the rate of scapular notching and dislocations between the 135° and 155° RTSA prostheses. The authors found that the 135° prosthesis had a significantly lower incidence of scapular notching vs the 155° group and that the rate of dislocations was not significantly different between groups.3 In the latter systematic review, the authors attempted to evaluate ROM between the 135° and 155° prostheses, but as the inclusion criteria of the study was reporting on scapular notching and dislocation rates, many studies reporting solely on ROM were excluded, and the influence of humeral inclination on ROM was inconclusive.3 Furthermore, there have been no studies that have directly compared ROM following RTSA between the 135° and 155° prostheses. While studies evaluating each prosthesis on an individual level have shown an improvement in ROM from pre- to postsurgery, there have been no large studies that have compared the postoperative ROM and change in pre- to postoperative ROM between the 135° and 155° prostheses.11,13,19,20
One study by Valenti and colleagues21 evaluated a group of 30 patients with an average age of 69.5 years who underwent RTSA using either a 135° or a 155° prosthesis. Although the study did not directly compare the 2 types of prostheses, it did report the separate outcomes for each prosthesis. At an average follow-up of 36.4 months, the authors found that patients who had the 135° prosthesis implanted had a mean increase in forward elevation and external rotation of 53° and 9°, while patients who had the 155° showed an increase of 56° in forward elevation and a loss of 1° of external rotation. Both prostheses showed a significant increase in forward elevation, but neither had a significant increase in external rotation. Furthermore, scapular notching was seen in 4 patients in the 155° group, while no patients in the 135° group had evidence of notching.
The results of the current study were similar in that both the 135° and 155° prosthesis showed improvements in forward elevation following surgery, and the 135° group showed a significantly greater gain in external rotation than the 155° group. A significant component of shoulder function and patient satisfaction following RTSA is active ROM. However, this variable has not explicitly been evaluated in the literature until now. The clinical significance of this finding is unclear. Patients with adequate external rotation prior to surgery likely would not see a functional difference between prostheses, while those patients who were borderline on a functional amount of external rotation would see a clinically significant benefit with the 135° prosthesis. Studies have shown that the 135° prosthesis is more anatomic than the 155°, and this could explain the difference seen in ROM outcomes between the 2 prostheses.19 Ladermann and colleagues22 recently created and evaluated a 3-dimensional computer model to evaluate possible differences between the 135° and 155° prosthesis. The authors found a significant increase in external rotation of the 135° compared to the 155°, likely related to a difference in acromiohumeral distance as well as inlay vs onlay humeral trays between the 2 prostheses. The results of this study parallel the computer model, thereby validating these experimental results.
It is important to understand what the minimum functional ROM of the shoulder is (in other words, the ROM necessary to complete activities of daily living (ADLs).23 Namdari and colleagues24 used motion analysis software to evaluate the shoulder ROM necessary to complete 10 different ADLs, including combing hair, washing the back of the opposite shoulder, and reaching a shelf above their head without bending their elbow in 20 patients with a mean age of 29.2 years. They found that patients required 121° ± 6.7° of flexion, 46° ± 5.3° of extension, 128° ± 7.9° of abduction, 116° ± 9.1° of cross-body adduction, 59° ± 10° of external rotation with the arm 90° abducted, and 102° ± 7.7° of internal rotation with the arm at the side (external rotation with the arm at the side was not well defined).24 Hence, while abduction and forward elevation seem comparable, the results from the current study do raise concerns about the amount of external rotation obtained following RTSA as it relates to a patients’ ability to perform ADLs, specifically in the 155° prosthesis, as the average postoperative external rotation in this group was 20.5°. Therefore, based on the results of this study, it appears that, while both the 135° and 155° RTSA prostheses provide similar gain in forward elevation and abduction ROM as well as overall forward elevation and abduction, the 135° prosthesis provides significantly more external rotation with the arm at the side than the 155° prosthesis.
Limitations
Although this study attempted to look at all studies that reported active ROM in patients following a RTSA, and 2 authors performed the search, there is a possibility that some studies were missed, introducing study selection bias. Furthermore, the mean follow-up was over 3 years following surgery, but the minimum follow-up requirement for studies to be included was only 12 months. Hence, this transfer bias introduces the possibility that the patient’s ROM would have changed had they been followed for a standard period of time. There are many variables that come into play in evaluating ROM, and although the study attempted to control for these, there are some that could not be controlled for due to lack of reporting by some studies. Glenosphere size and humeral retroversion were not recorded, as they were not reliably reported in all studies, so motion outcomes based on these variables was not evaluated. Complications and clinical outcomes were not assessed in this review and as such, conclusions regarding these variables cannot be drawn from this study. Finally, indications for surgery were not reliably reported in the studies included in this paper, so differences may have existed between surgical indications of the 135° and 155° groups that could have affected outcomes.
Conclusion
Patients who receive a 135° RTSA gain significantly more external rotation from pre- to postsurgery and have an overall greater amount of external rotation than patients who receive a 155° prosthesis. Both groups show improvements in forward elevation, external rotation, and abduction following surgery.
1. Flatow EL, Harrison AK. A history of reverse total shoulder arthroplasty. Clin Orthop Relat Res. 2011;469(9):2432-2439.
2. Hyun YS, Huri G, Garbis NG, McFarland EG. Uncommon indications for reverse total shoulder arthroplasty. Clin Orthop Surg. 2013;5(4):243-255.
3. Erickson BJ, Frank RM, Harris JD, Mall N, Romeo AA. The influence of humeral head inclination in reverse total shoulder arthroplasty: a systematic review. J Shoulder Elbow Surg. 2015;24(6):988-993.
4. Gupta AK, Harris JD, Erickson BJ, et al. Surgical management of complex proximal humerus fractures--asystematic review of 92 studies including 4500 patients. J Orthop Trauma. 2015;29(1):54-59.
5. Feeley BT, Zhang AL, Barry JJ, et al. Decreased scapular notching with lateralization and inferior baseplate placement in reverse shoulder arthroplasty with high humeral inclination. Int J Shoulder Surg. 2014;8(3):65-71.
6. Kiet TK, Feeley BT, Naimark M, et al. Outcomes after shoulder replacement: comparison between reverse and anatomic total shoulder arthroplasty. J Shoulder Elbow Surg. 2015;24(2):179-185.
7. Alentorn-Geli E, Guirro P, Santana F, Torrens C. Treatment of fracture sequelae of the proximal humerus: comparison of hemiarthroplasty and reverse total shoulder arthroplasty. Arch Orthop Trauma Surg. 2014;134(11):1545-1550.
8. Baulot E, Sirveaux F, Boileau P. Grammont’s idea: The story of Paul Grammont’s functional surgery concept and the development of the reverse principle. Clin Orthop Relat Res. 2011;469(9):2425-2431.
9. Cazeneuve JF, Cristofari DJ. Grammont reversed prosthesis for acute complex fracture of the proximal humerus in an elderly population with 5 to 12 years follow-up. Orthop Traumatol Surg Res. 2014;100(1):93-97.
10. Naveed MA, Kitson J, Bunker TD. The Delta III reverse shoulder replacement for cuff tear arthropathy: a single-centre study of 50 consecutive procedures. J Bone Joint Surg Br. 2011;93(1):57-61.
11. Levy J, Frankle M, Mighell M, Pupello D. The use of the reverse shoulder prosthesis for the treatment of failed hemiarthroplasty for proximal humeral fracture. J Bone Joint Surg Am. 2007;89(2):292-300.
12. Mulieri P, Dunning P, Klein S, Pupello D, Frankle M. Reverse shoulder arthroplasty for the treatment of irreparable rotator cuff tear without glenohumeral arthritis. J Bone Joint Surg Am. 2010;92(15):2544-2556.
13. Atalar AC, Salduz A, Cil H, Sungur M, Celik D, Demirhan M. Reverse shoulder arthroplasty: radiological and clinical short-term results. Acta Orthop Traumatol Turc. 2014;48(1):25-31.
14. Raiss P, Edwards TB, da Silva MR, Bruckner T, Loew M, Walch G. Reverse shoulder arthroplasty for the treatment of nonunions of the surgical neck of the proximal part of the humerus (type-3 fracture sequelae). J Bone Joint Surg Am. 2014;96(24):2070-2076.
15. Liberati A, Altman DG, Tetzlaff J, et al. The PRISMA statement for reporting systematic reviews and meta-analyses of studies that evaluate health care interventions: explanation and elaboration. J Clin Epidemiol. 2009;62(10):e1-e34.
16. The University of York Centre for Reviews and Dissemination. PROSPERO International prospective register of systematic reviews. Available at: http://www.crd.york.ac.uk/PROSPERO/. Accessed April 11, 2016.
17. The University of Oxford. Oxford Centre for Evidence Based Medicine. Available at: http://www.cebm.net/. Accessed April 11, 2016
18. Cowan J, Lozano-Calderon S, Ring D. Quality of prospective controlled randomized trials. Analysis of trials of treatment for lateral epicondylitis as an example. J Bone Joint Surg Am. 2007;89(8):1693-1699.
19. Clark JC, Ritchie J, Song FS, et al. Complication rates, dislocation, pain, and postoperative range of motion after reverse shoulder arthroplasty in patients with and without repair of the subscapularis. J Shoulder Elbow Surg. 2012;21(1):36-41.
20. Sayana MK, Kakarala G, Bandi S, Wynn-Jones C. Medium term results of reverse total shoulder replacement in patients with rotator cuff arthropathy. Ir J Med Sci. 2009;178(2):147-150.
21. Valenti P, Kilinc AS, Sauzieres P, Katz D. Results of 30 reverse shoulder prostheses for revision of failed hemi- or total shoulder arthroplasty. Eur J Orthop Surg Traumatol. 2014;24(8):1375-1382.
22. Ladermann A, Denard PJ, Boileau P, et al. Effect of humeral stem design on humeral position and range of motion in reverse shoulder arthroplasty. Int Orthop. 2015;39(11):2205-2213.
23. Vasen AP, Lacey SH, Keith MW, Shaffer JW. Functional range of motion of the elbow. J Hand Surg Am. 1995;20(2):288-292.
24. Namdari S, Yagnik G, Ebaugh DD, et al. Defining functional shoulder range of motion for activities of daily living. J Shoulder Elbow Surg. 2012;21(9):1177-1183.
Reverse total shoulder arthroplasty (RTSA) has become a reliable treatment option for many pathologic conditions of the shoulder, including rotator cuff arthropathy, proximal humerus fractures, and others.1-4 While the treatment outcomes have generally been reported as good, some concern exists over the postoperative range of motion (ROM) in patients following RTSA, including external rotation.5-7 The original RTSA design was introduced by Neer in the 1970s and has undergone many modifications since that time.1,2 The original Grammont-style prosthesis involved medialization of the glenoid, inferiorizing the center of rotation (with increased deltoid tensioning), and a neck-shaft angle of 155°.1,8 While clinical results of the 155° design were encouraging, concerns arose over the significance of the common finding of scapular notching, or contact between the scapular neck and inferior portion of the humeral polyethylene when the arm is adducted.9,10
To address this concern, a prosthesis design with a 135° neck-shaft angle was introduced.11 This new design did significantly decrease the rate of scapular notching, and although some reported a concern over implant stability with the 135° prosthesis, recent data has shown no difference in dislocation rates between the 135° and 155° prostheses.3 A different variable that has not been evaluated between these prostheses is the active ROM that is achieved postoperatively, and the change in ROM from pre- to post-RTSA.12,13 As active ROM plays a significant role in shoulder function and patient satisfaction, the question of whether a significant difference exists in postoperative ROM between the 135° and 155° prostheses must be addressed.
The purpose of this study was to perform a systematic review investigating active ROM following RTSA to determine if active postoperative ROM following RTSA differs between the 135° and 155° humeral inclination prostheses, and to determine if there is a significant difference between the change in preoperative and postoperative ROM between the 135° and 155° prostheses. The authors hypothesize that there will be no significant difference in active postoperative ROM between the 135° and 155° prostheses, and that the difference between preoperative and postoperative ROM (that is, the amount of motion gained by the surgery) will not significantly differ between the 135° and 155° prostheses.
Methods
A systematic review was conducted according to Preferred Reporting Items for Systematic Reviews and Meta-Analyses (PRISMA) guidelines using a PRISMA checklist.15 Systematic review registration was performed using the PROSPERO international prospective register of systematic reviews (registration date 3/9/15, registration number CRD42015017367).16 Two reviewers independently conducted the search on March 7, 2015 using the following databases: Medline, Cochrane Central Register of Controlled Trials, SportDiscus, and CINAHL. The electronic search citation algorithm utilized was: (((((reverse[Title/Abstract]) AND shoulder[Title/Abstract]) AND arthroplasty[Title/Abstract]) NOT arthroscopic[Title/Abstract]) NOT cadaver[Title/Abstract]) NOT biomechanical[Title/Abstract]. English language Level I-IV evidence (2011 update by the Oxford Centre for Evidence-Based Medicine17) clinical studies that reported the type of RTSA prosthesis that was used as well as postoperative ROM with at least 12 months follow-up were eligible. All references within included studies were cross-referenced for inclusion if missed by the initial search. If duplicate subject publications were discovered, the study with the longer duration of follow-up or larger number of patients was included. Level V evidence reviews, letters to the editor, basic science, biomechanical studies, arthroscopic shoulder surgery, imaging, surgical technique, and classification studies were excluded. Studies were excluded if both a 135° and 155° prosthesis were utilized and the outcomes were not stratified by the humeral inclination. Studies that did not report ROM were excluded.
A total of 456 studies were located, and, after implementation of the exclusion criteria, 65 studies from 2005-2015 were included in the final analysis (Figure). Subjects of interest in this systematic review underwent a RTSA. Studies were not excluded based on the surgical indications (rotator cuff tear arthropathy, proximal humerus fractures, osteoarthritis) and there was no minimum follow-up or rehabilitation requirement. Study and subject demographic parameters analyzed included year of publication, journal of publication, country and continent of publication, years of subject enrollment, presence of study financial conflict of interest, number of subjects and shoulders, gender, age, the manufacturer and type of prosthesis used, and the degree of the humeral inclination (135° vs 155° humeral cup). Preoperative ROM, including forward elevation, abduction, external rotation with the arm adducted, and external rotation with the arm at 90° of abduction, were recorded. The same ROM measurements were recorded for the final follow-up visit that was reported. Internal rotation was recorded, but because of the variability with how this measurement was reported, it was not analyzed. Clinical outcome scores and complications were not assessed. Study methodological quality was evaluated using the Modified Coleman Methodology Score (MCMS).18
Statistical Analysis
Descriptive statistics were calculated, including mean ± standard deviation for quantitative continuous data and frequencies with percentages for qualitative categorical data. ROM comparisons between 135° and 155° components (pre- vs postoperative for each and postoperative between the 2) were made using 2 proportion z-test calculator (http://in-silico.net/tools/statistics/ztest) using alpha .05 because of the difference in sample sizes between compared groups.
Results
Sixty-five studies with 3302 patients (3434 shoulders) were included in this study. There was a total of 1211 shoulders in the 135° lateralized glenosphere group and 2223 shoulders in the 155° group. The studies had an average MCMS of 40.4 ± 8.2 (poor), 48% of studies reported a conflict of interest, 32% had no conflict of interest, and 20% did not report whether a conflict of interest existed or not. The majority of studies included were level IV evidence (85%). Mean patient age was 71.1 ± 7.6 years; 29% of patients were male and 71% were female. No significant difference existed between patient age at the time of surgery; the average age of patients in the 135° lateralized glenosphere group was 71.67 ± 3.8 years, while the average patient age of patients in the 155° group was 70.97 ± 8.8 years. Mean follow-up for all patients included in this study was 37.2 ± 16.5 months. Of the 65 studies included, 3 were published from Asia, 4 were published from Australia, 24 were from North America, and 34 were from Europe. Of the individual countries whose studies were included, the United States had 23 included studies, France had 13 included studies, and Italy had 4 included studies. All other countries had <4 studies included.
Patients who received either a 135° or a 155° prosthesis showed significant improvements in external rotation with the arm at the side (P < .05), forward elevation (P < .05), and abduction (P < .05) following surgery (Table). When comparing the 135° and 155° groups, patients who received a 135° prosthesis showed significantly greater improvements in external rotation with the arm at the side (P < .001) and had significantly more overall external rotation postoperatively (P < .001) than patients who received a 155° prosthesis. The only preoperative ROM difference between groups was the 155° group started with significantly more forward elevation than the 135°group prior to surgery (P = .002).
Discussion
RTSA is indicated in patients with rotator cuff tear arthropathy, pseudoparalysis, and a functional deltoid.1,2,4 The purpose of this systematic review was to determine if active ROM following RTSA differs between the 135° and 155° humeral inclination prostheses, and to determine if there is a significant difference between the change in preoperative and postoperative ROM between the 135° and 155° prostheses. Forward elevation, abduction, and external rotation all significantly improved following surgery in both groups, with no significant difference between groups in motion or amount of motion improvement, mostly confirming the study hypotheses. However, patients in the 135° group had significantly greater postoperative external rotation and greater amount of external rotation improvement compared to the 155° group.
Two of the frequently debated issues regarding implant geometry is stability and scapular notching between the 135° and 155° humeral inclination designs. Erickson and colleagues3 recently evaluated the rate of scapular notching and dislocations between the 135° and 155° RTSA prostheses. The authors found that the 135° prosthesis had a significantly lower incidence of scapular notching vs the 155° group and that the rate of dislocations was not significantly different between groups.3 In the latter systematic review, the authors attempted to evaluate ROM between the 135° and 155° prostheses, but as the inclusion criteria of the study was reporting on scapular notching and dislocation rates, many studies reporting solely on ROM were excluded, and the influence of humeral inclination on ROM was inconclusive.3 Furthermore, there have been no studies that have directly compared ROM following RTSA between the 135° and 155° prostheses. While studies evaluating each prosthesis on an individual level have shown an improvement in ROM from pre- to postsurgery, there have been no large studies that have compared the postoperative ROM and change in pre- to postoperative ROM between the 135° and 155° prostheses.11,13,19,20
One study by Valenti and colleagues21 evaluated a group of 30 patients with an average age of 69.5 years who underwent RTSA using either a 135° or a 155° prosthesis. Although the study did not directly compare the 2 types of prostheses, it did report the separate outcomes for each prosthesis. At an average follow-up of 36.4 months, the authors found that patients who had the 135° prosthesis implanted had a mean increase in forward elevation and external rotation of 53° and 9°, while patients who had the 155° showed an increase of 56° in forward elevation and a loss of 1° of external rotation. Both prostheses showed a significant increase in forward elevation, but neither had a significant increase in external rotation. Furthermore, scapular notching was seen in 4 patients in the 155° group, while no patients in the 135° group had evidence of notching.
The results of the current study were similar in that both the 135° and 155° prosthesis showed improvements in forward elevation following surgery, and the 135° group showed a significantly greater gain in external rotation than the 155° group. A significant component of shoulder function and patient satisfaction following RTSA is active ROM. However, this variable has not explicitly been evaluated in the literature until now. The clinical significance of this finding is unclear. Patients with adequate external rotation prior to surgery likely would not see a functional difference between prostheses, while those patients who were borderline on a functional amount of external rotation would see a clinically significant benefit with the 135° prosthesis. Studies have shown that the 135° prosthesis is more anatomic than the 155°, and this could explain the difference seen in ROM outcomes between the 2 prostheses.19 Ladermann and colleagues22 recently created and evaluated a 3-dimensional computer model to evaluate possible differences between the 135° and 155° prosthesis. The authors found a significant increase in external rotation of the 135° compared to the 155°, likely related to a difference in acromiohumeral distance as well as inlay vs onlay humeral trays between the 2 prostheses. The results of this study parallel the computer model, thereby validating these experimental results.
It is important to understand what the minimum functional ROM of the shoulder is (in other words, the ROM necessary to complete activities of daily living (ADLs).23 Namdari and colleagues24 used motion analysis software to evaluate the shoulder ROM necessary to complete 10 different ADLs, including combing hair, washing the back of the opposite shoulder, and reaching a shelf above their head without bending their elbow in 20 patients with a mean age of 29.2 years. They found that patients required 121° ± 6.7° of flexion, 46° ± 5.3° of extension, 128° ± 7.9° of abduction, 116° ± 9.1° of cross-body adduction, 59° ± 10° of external rotation with the arm 90° abducted, and 102° ± 7.7° of internal rotation with the arm at the side (external rotation with the arm at the side was not well defined).24 Hence, while abduction and forward elevation seem comparable, the results from the current study do raise concerns about the amount of external rotation obtained following RTSA as it relates to a patients’ ability to perform ADLs, specifically in the 155° prosthesis, as the average postoperative external rotation in this group was 20.5°. Therefore, based on the results of this study, it appears that, while both the 135° and 155° RTSA prostheses provide similar gain in forward elevation and abduction ROM as well as overall forward elevation and abduction, the 135° prosthesis provides significantly more external rotation with the arm at the side than the 155° prosthesis.
Limitations
Although this study attempted to look at all studies that reported active ROM in patients following a RTSA, and 2 authors performed the search, there is a possibility that some studies were missed, introducing study selection bias. Furthermore, the mean follow-up was over 3 years following surgery, but the minimum follow-up requirement for studies to be included was only 12 months. Hence, this transfer bias introduces the possibility that the patient’s ROM would have changed had they been followed for a standard period of time. There are many variables that come into play in evaluating ROM, and although the study attempted to control for these, there are some that could not be controlled for due to lack of reporting by some studies. Glenosphere size and humeral retroversion were not recorded, as they were not reliably reported in all studies, so motion outcomes based on these variables was not evaluated. Complications and clinical outcomes were not assessed in this review and as such, conclusions regarding these variables cannot be drawn from this study. Finally, indications for surgery were not reliably reported in the studies included in this paper, so differences may have existed between surgical indications of the 135° and 155° groups that could have affected outcomes.
Conclusion
Patients who receive a 135° RTSA gain significantly more external rotation from pre- to postsurgery and have an overall greater amount of external rotation than patients who receive a 155° prosthesis. Both groups show improvements in forward elevation, external rotation, and abduction following surgery.
1. Flatow EL, Harrison AK. A history of reverse total shoulder arthroplasty. Clin Orthop Relat Res. 2011;469(9):2432-2439.
2. Hyun YS, Huri G, Garbis NG, McFarland EG. Uncommon indications for reverse total shoulder arthroplasty. Clin Orthop Surg. 2013;5(4):243-255.
3. Erickson BJ, Frank RM, Harris JD, Mall N, Romeo AA. The influence of humeral head inclination in reverse total shoulder arthroplasty: a systematic review. J Shoulder Elbow Surg. 2015;24(6):988-993.
4. Gupta AK, Harris JD, Erickson BJ, et al. Surgical management of complex proximal humerus fractures--asystematic review of 92 studies including 4500 patients. J Orthop Trauma. 2015;29(1):54-59.
5. Feeley BT, Zhang AL, Barry JJ, et al. Decreased scapular notching with lateralization and inferior baseplate placement in reverse shoulder arthroplasty with high humeral inclination. Int J Shoulder Surg. 2014;8(3):65-71.
6. Kiet TK, Feeley BT, Naimark M, et al. Outcomes after shoulder replacement: comparison between reverse and anatomic total shoulder arthroplasty. J Shoulder Elbow Surg. 2015;24(2):179-185.
7. Alentorn-Geli E, Guirro P, Santana F, Torrens C. Treatment of fracture sequelae of the proximal humerus: comparison of hemiarthroplasty and reverse total shoulder arthroplasty. Arch Orthop Trauma Surg. 2014;134(11):1545-1550.
8. Baulot E, Sirveaux F, Boileau P. Grammont’s idea: The story of Paul Grammont’s functional surgery concept and the development of the reverse principle. Clin Orthop Relat Res. 2011;469(9):2425-2431.
9. Cazeneuve JF, Cristofari DJ. Grammont reversed prosthesis for acute complex fracture of the proximal humerus in an elderly population with 5 to 12 years follow-up. Orthop Traumatol Surg Res. 2014;100(1):93-97.
10. Naveed MA, Kitson J, Bunker TD. The Delta III reverse shoulder replacement for cuff tear arthropathy: a single-centre study of 50 consecutive procedures. J Bone Joint Surg Br. 2011;93(1):57-61.
11. Levy J, Frankle M, Mighell M, Pupello D. The use of the reverse shoulder prosthesis for the treatment of failed hemiarthroplasty for proximal humeral fracture. J Bone Joint Surg Am. 2007;89(2):292-300.
12. Mulieri P, Dunning P, Klein S, Pupello D, Frankle M. Reverse shoulder arthroplasty for the treatment of irreparable rotator cuff tear without glenohumeral arthritis. J Bone Joint Surg Am. 2010;92(15):2544-2556.
13. Atalar AC, Salduz A, Cil H, Sungur M, Celik D, Demirhan M. Reverse shoulder arthroplasty: radiological and clinical short-term results. Acta Orthop Traumatol Turc. 2014;48(1):25-31.
14. Raiss P, Edwards TB, da Silva MR, Bruckner T, Loew M, Walch G. Reverse shoulder arthroplasty for the treatment of nonunions of the surgical neck of the proximal part of the humerus (type-3 fracture sequelae). J Bone Joint Surg Am. 2014;96(24):2070-2076.
15. Liberati A, Altman DG, Tetzlaff J, et al. The PRISMA statement for reporting systematic reviews and meta-analyses of studies that evaluate health care interventions: explanation and elaboration. J Clin Epidemiol. 2009;62(10):e1-e34.
16. The University of York Centre for Reviews and Dissemination. PROSPERO International prospective register of systematic reviews. Available at: http://www.crd.york.ac.uk/PROSPERO/. Accessed April 11, 2016.
17. The University of Oxford. Oxford Centre for Evidence Based Medicine. Available at: http://www.cebm.net/. Accessed April 11, 2016
18. Cowan J, Lozano-Calderon S, Ring D. Quality of prospective controlled randomized trials. Analysis of trials of treatment for lateral epicondylitis as an example. J Bone Joint Surg Am. 2007;89(8):1693-1699.
19. Clark JC, Ritchie J, Song FS, et al. Complication rates, dislocation, pain, and postoperative range of motion after reverse shoulder arthroplasty in patients with and without repair of the subscapularis. J Shoulder Elbow Surg. 2012;21(1):36-41.
20. Sayana MK, Kakarala G, Bandi S, Wynn-Jones C. Medium term results of reverse total shoulder replacement in patients with rotator cuff arthropathy. Ir J Med Sci. 2009;178(2):147-150.
21. Valenti P, Kilinc AS, Sauzieres P, Katz D. Results of 30 reverse shoulder prostheses for revision of failed hemi- or total shoulder arthroplasty. Eur J Orthop Surg Traumatol. 2014;24(8):1375-1382.
22. Ladermann A, Denard PJ, Boileau P, et al. Effect of humeral stem design on humeral position and range of motion in reverse shoulder arthroplasty. Int Orthop. 2015;39(11):2205-2213.
23. Vasen AP, Lacey SH, Keith MW, Shaffer JW. Functional range of motion of the elbow. J Hand Surg Am. 1995;20(2):288-292.
24. Namdari S, Yagnik G, Ebaugh DD, et al. Defining functional shoulder range of motion for activities of daily living. J Shoulder Elbow Surg. 2012;21(9):1177-1183.
Maximizing Efficiency in the Operating Room for Total Joint Arthroplasty
Developing a high-efficiency operating room (OR) is both a challenging and rewarding goal for any healthcare system. The OR is traditionally a high-cost/high-revenue environment1 and operative efficacy has been correlated with low complication rates and surgical success.2 An efficient OR is one that maximizes utilization while providing safe, reproducible, cost-effective, high-quality care. Total joint arthroplasty (TJA) has occupied the center stage for OR efficiency research, in part due to increasing demands from our aging population3 and economic pressures related to high implant costs, decreased reimbursement, and competition for market shares when OR time and space are limited.
A PubMed search on OR efficiency in TJA shows a disproportionately high focus on surgical technique, such as use of patient-specific instrumentation (PSI), computer-assisted surgery (CAS), minimally invasive surgery, and closure with barbed suture. In a retrospective review of 352 TKA patients who had PSI vs conventional instrumentation, DeHaan and colleagues4 found that PSI was associated with significantly decreased operative and room turnover times (20.4 minutes and 6.4 minutes, respectively). In another prospective multicenter study, Mont and colleagues5 showed a reduction in surgical time by 8.90 min for navigated total knee arthroplasty (TKA) performed with single-use instruments, cutting blocks, and trials. Other investigators compared PSI to CAS in TKA and found PSI to be 1.45 times more profitable than CAS, with 3 PSI cases performed in an 8-hour OR day compared to 2 CAS cases.6
There is no question that improved surgical technique can enhance OR efficiency. However, this model, while promising, is difficult to implement on a wide scale due to surgeon preferences, vendor limitations, and added costs related to the advanced preoperative imaging studies, manufacturing of the custom guides, and maintenance of navigation equipment. In addition, while interventions such as the use of barbed suture have the potential for speeding closure time, the time saved (4.7 minutes in one randomized trial)7 may not be enough to affect major utilization differences per OR per day. These technologies are also frequently employed by high-volume surgeons with high-volume teams and institutions.
Ideally, we need investment in the human capital and a collective change in work cultures to produce high-quality, well-choreographed, easily reproducible routines. An efficient OR requires the synchronous involvement of a large team of individuals, including hospital administrators, surgery schedulers, surgeons, anesthesiologists, preoperative holding area staff, OR nurses, surgical attendants, sterile processing personnel, and recovery room nurses. Case schedulers should match allocated block time with time required for surgery based on the historical performance of the individual surgeon, preferably scheduling similar cases on the same day. Preoperative work-up and medical clearance should be completed prior to scheduling to avoid last-minute cancellations. Patient reminders and accommodations for those traveling from long distances can further minimize late arrivals. Prompt initiation of the perioperative clinical pathway upon a patient’s check-in is important. The surgical site should be marked and the anesthesia plan confirmed upon arrival in the preoperative holding area. Necessary products need to be ready and/or administrated in time for transfer to the OR. These include prophylactic antibiotics, coagulation factors (eg, tranexamic acid), and blood products as indicated. Spinal anesthesia, regional nerve blocks, and intravenous (IV) lines should be completed before transfer to the OR. A “block room” close to the OR can allow concurrent induction of anesthesia and has been shown to increase the number of surgical cases performed during a regular workday.8 Hair clipping within the surgical site and pre-scrubbing of the operative extremity should also be performed prior to transfer to the OR in order to minimize micro-organisms and dispersal of loose hair onto the sterile field.
Upon arrival of the patient to the OR, instrument tables based on the surgeon preference cards should be opened, instrument count and implant templating completed, necessary imaging displayed, and OR staff ready with specific responsibilities assigned to each member. Small and colleagues9 showed that using dedicated orthopedic staff familiar with the surgical routine decreased operative time by 19 minutes per procedure, or 1.25 hours for a surgeon performing 4 primary TJAs per day. Practices such as routine placement of a urinary catheter should be seriously scrutinized. In a randomized prospective study of patients undergoing total hip arthroplasty under spinal anesthesia, Miller and colleagues10 found no benefit for indwelling catheters in preventing urinary retention. In another randomized prospective study, Huang and colleagues11 found the prevalence of urinary tract infections was significantly higher in TJA patients who received indwelling urinary catheters.
A scrub nurse familiar with the instruments, their assembly, and the sequence of events can ensure efficient surgical flow. The scrub nurse needs to anticipate missing or defective tools and call for them, ideally before the incision is made. Direct comparison studies are needed to assess the efficacy of routine intraoperative imaging vs commercially available universal cup alignment guides or clinical examinations in determining acceptable component positioning and limb length. Following component implantation and before wound closure, the circulating nurse should initiate the process of acquisition of a recovery room bed, make sure dressing supplies and necessary equipment are available, and call for surgical attendants. Lack of surgical attendants, delayed transfer from the OR table to hospital bed, and prolonged acquisition of a recovery room bed have been identified as major OR inefficiencies in a retrospective study by Attarian and colleagues.12
In summary, time is the OR’s most valuable resource.13 We believe that a consistent, almost automated attitude to the above procedures decreases variability and improves efficiency. By providing clear communication of the surgical needs with the team, having consistent anesthesia and nursing staff, implementing consistent perioperative protocols, and insuring that all necessary instruments and modalities are available prior to starting the procedure, we were able to sustainably increase OR throughput in a large teaching hospital.9,14 This process, however, requires constant review to identify and eliminate new gaps, with each member of the team sharing a frank desire to improve. In this regard, hospital administrators share the duty to facilitate the implementation of any necessary changes, allocation of needed resources, and rewarding good effort, which could ultimately increase staff satisfaction and retention. Because efficiency is the ratio of benefits (eg, revenue, safety, etc.) to investment (eg, implant costs, wages, etc.), raises the question: what would be the effect of transitioning from hourly-wage to a salary-based system for key support staff? Unlike hourly-wage personnel, who have no incentive for productivity, a salaried employee assigned to a high-efficiency OR will inherently strive for improvement, employing higher organizational skills to accomplish a common goal. To our knowledge, there is no published data on this topic.
1. Krupka DC, Sandberg WS. Operating room design and its impact on operating room economics. Curr Opin Anaesthesiol. 2006;19(2):185-191.
2. Scott WN, Booth RE Jr, Dalury DF, Healy WL, Lonner JH. Efficiency and economics in joint arthroplasty. J Bone Joint Surg Am. 2009;91 Suppl 5:33-36.
3. Kurtz S, Ong K, Lau E, Mowat F, Halpern M. Projections of primary and revision hip and knee arthroplasty in the United States from 2005 to 2030. J Bone Joint Surg Am. 2007;89(4):780-785.
4. DeHaan AM, Adams JR, DeHart ML, Huff TW. Patient-specific versus conventional instrumentation for total knee arthroplasty: peri-operative and cost differences. J Arthroplasty. 2014;29(11):2065-2069.
5. Mont MA, McElroy MJ, Johnson AJ, Pivec R; Single-Use Multicenter Trial Group Writing Group. Single-use instruments, cutting blocks, and trials increase efficiency in the operating room during total knee arthroplasty: a prospective comparison of navigated and non-navigated cases. J Arthroplasty. 2013;28(7):1135-1140.
6. Lionberger DR, Crocker CL, Chen V. Patient specific instrumentation. J Arthroplasty. 2014;29(9):1699-1704.
7. Sah AP. Is there an advantage to knotless barbed suture in TKA wound closure? A randomized trial in simultaneous bilateral TKAs. Clin Orthop Relat Res. 2015;473(6):2019-2027.
8. Torkki PM, Marjamaa RA, Torkki MI, Kallio PE, Kirvelä OA. Use of anesthesia induction rooms can increase the number of urgent orthopedic cases completed within 7 hours. Anesthesiology. 2005;103(2):401-405.
9. Small TJ, Gad BV, Klika AK, Mounir-Soliman LS, Gerritsen RL, Barsoum WK. Dedicated orthopedic operating room unit improves operating room efficiency. J Arthroplasty. 2013;28(7):1066-1071.e2.
10. Miller AG, McKenzie J, Greenky M, et al. Spinal anesthesia: should everyone receive a urinary catheter?: a randomized, prospective study of patients undergoing total hip arthroplasty. J Bone Joint Surg Am. 2013;95(16):1498-1503.
11. Huang Z, Ma J, Shen B, Pei F. General anesthesia: to catheterize or not? A prospective randomized controlled study of patients undergoing total knee arthroplasty. J Arthroplasty. 2015;30(3):502-506.
12. Attarian DE, Wahl JE, Wellman SS, Bolognesi MP. Developing a high-efficiency operating room for total joint arthroplasty in an academic setting. Clin Orthop Relat Res. 2013;471(6):1832-1836.
13. Gamble M. 6 cornerstones of operating room efficiency: best practices for each. Becker’s Hospital Review Web site. http://www.beckershospitalreview.com/or-efficiencies/6-cornerstones-of-operating-room-efficiency-best-practices-for-each.html. Updated January 18, 2013. Accessed September 3, 2015.
14. Smith MP, Sandberg WS, Foss J, et al. High-throughput operating room system for joint arthroplasties durably outperforms routine processes. Anesthesiology. 2008;109(1):25-35.
Developing a high-efficiency operating room (OR) is both a challenging and rewarding goal for any healthcare system. The OR is traditionally a high-cost/high-revenue environment1 and operative efficacy has been correlated with low complication rates and surgical success.2 An efficient OR is one that maximizes utilization while providing safe, reproducible, cost-effective, high-quality care. Total joint arthroplasty (TJA) has occupied the center stage for OR efficiency research, in part due to increasing demands from our aging population3 and economic pressures related to high implant costs, decreased reimbursement, and competition for market shares when OR time and space are limited.
A PubMed search on OR efficiency in TJA shows a disproportionately high focus on surgical technique, such as use of patient-specific instrumentation (PSI), computer-assisted surgery (CAS), minimally invasive surgery, and closure with barbed suture. In a retrospective review of 352 TKA patients who had PSI vs conventional instrumentation, DeHaan and colleagues4 found that PSI was associated with significantly decreased operative and room turnover times (20.4 minutes and 6.4 minutes, respectively). In another prospective multicenter study, Mont and colleagues5 showed a reduction in surgical time by 8.90 min for navigated total knee arthroplasty (TKA) performed with single-use instruments, cutting blocks, and trials. Other investigators compared PSI to CAS in TKA and found PSI to be 1.45 times more profitable than CAS, with 3 PSI cases performed in an 8-hour OR day compared to 2 CAS cases.6
There is no question that improved surgical technique can enhance OR efficiency. However, this model, while promising, is difficult to implement on a wide scale due to surgeon preferences, vendor limitations, and added costs related to the advanced preoperative imaging studies, manufacturing of the custom guides, and maintenance of navigation equipment. In addition, while interventions such as the use of barbed suture have the potential for speeding closure time, the time saved (4.7 minutes in one randomized trial)7 may not be enough to affect major utilization differences per OR per day. These technologies are also frequently employed by high-volume surgeons with high-volume teams and institutions.
Ideally, we need investment in the human capital and a collective change in work cultures to produce high-quality, well-choreographed, easily reproducible routines. An efficient OR requires the synchronous involvement of a large team of individuals, including hospital administrators, surgery schedulers, surgeons, anesthesiologists, preoperative holding area staff, OR nurses, surgical attendants, sterile processing personnel, and recovery room nurses. Case schedulers should match allocated block time with time required for surgery based on the historical performance of the individual surgeon, preferably scheduling similar cases on the same day. Preoperative work-up and medical clearance should be completed prior to scheduling to avoid last-minute cancellations. Patient reminders and accommodations for those traveling from long distances can further minimize late arrivals. Prompt initiation of the perioperative clinical pathway upon a patient’s check-in is important. The surgical site should be marked and the anesthesia plan confirmed upon arrival in the preoperative holding area. Necessary products need to be ready and/or administrated in time for transfer to the OR. These include prophylactic antibiotics, coagulation factors (eg, tranexamic acid), and blood products as indicated. Spinal anesthesia, regional nerve blocks, and intravenous (IV) lines should be completed before transfer to the OR. A “block room” close to the OR can allow concurrent induction of anesthesia and has been shown to increase the number of surgical cases performed during a regular workday.8 Hair clipping within the surgical site and pre-scrubbing of the operative extremity should also be performed prior to transfer to the OR in order to minimize micro-organisms and dispersal of loose hair onto the sterile field.
Upon arrival of the patient to the OR, instrument tables based on the surgeon preference cards should be opened, instrument count and implant templating completed, necessary imaging displayed, and OR staff ready with specific responsibilities assigned to each member. Small and colleagues9 showed that using dedicated orthopedic staff familiar with the surgical routine decreased operative time by 19 minutes per procedure, or 1.25 hours for a surgeon performing 4 primary TJAs per day. Practices such as routine placement of a urinary catheter should be seriously scrutinized. In a randomized prospective study of patients undergoing total hip arthroplasty under spinal anesthesia, Miller and colleagues10 found no benefit for indwelling catheters in preventing urinary retention. In another randomized prospective study, Huang and colleagues11 found the prevalence of urinary tract infections was significantly higher in TJA patients who received indwelling urinary catheters.
A scrub nurse familiar with the instruments, their assembly, and the sequence of events can ensure efficient surgical flow. The scrub nurse needs to anticipate missing or defective tools and call for them, ideally before the incision is made. Direct comparison studies are needed to assess the efficacy of routine intraoperative imaging vs commercially available universal cup alignment guides or clinical examinations in determining acceptable component positioning and limb length. Following component implantation and before wound closure, the circulating nurse should initiate the process of acquisition of a recovery room bed, make sure dressing supplies and necessary equipment are available, and call for surgical attendants. Lack of surgical attendants, delayed transfer from the OR table to hospital bed, and prolonged acquisition of a recovery room bed have been identified as major OR inefficiencies in a retrospective study by Attarian and colleagues.12
In summary, time is the OR’s most valuable resource.13 We believe that a consistent, almost automated attitude to the above procedures decreases variability and improves efficiency. By providing clear communication of the surgical needs with the team, having consistent anesthesia and nursing staff, implementing consistent perioperative protocols, and insuring that all necessary instruments and modalities are available prior to starting the procedure, we were able to sustainably increase OR throughput in a large teaching hospital.9,14 This process, however, requires constant review to identify and eliminate new gaps, with each member of the team sharing a frank desire to improve. In this regard, hospital administrators share the duty to facilitate the implementation of any necessary changes, allocation of needed resources, and rewarding good effort, which could ultimately increase staff satisfaction and retention. Because efficiency is the ratio of benefits (eg, revenue, safety, etc.) to investment (eg, implant costs, wages, etc.), raises the question: what would be the effect of transitioning from hourly-wage to a salary-based system for key support staff? Unlike hourly-wage personnel, who have no incentive for productivity, a salaried employee assigned to a high-efficiency OR will inherently strive for improvement, employing higher organizational skills to accomplish a common goal. To our knowledge, there is no published data on this topic.
1. Krupka DC, Sandberg WS. Operating room design and its impact on operating room economics. Curr Opin Anaesthesiol. 2006;19(2):185-191.
2. Scott WN, Booth RE Jr, Dalury DF, Healy WL, Lonner JH. Efficiency and economics in joint arthroplasty. J Bone Joint Surg Am. 2009;91 Suppl 5:33-36.
3. Kurtz S, Ong K, Lau E, Mowat F, Halpern M. Projections of primary and revision hip and knee arthroplasty in the United States from 2005 to 2030. J Bone Joint Surg Am. 2007;89(4):780-785.
4. DeHaan AM, Adams JR, DeHart ML, Huff TW. Patient-specific versus conventional instrumentation for total knee arthroplasty: peri-operative and cost differences. J Arthroplasty. 2014;29(11):2065-2069.
5. Mont MA, McElroy MJ, Johnson AJ, Pivec R; Single-Use Multicenter Trial Group Writing Group. Single-use instruments, cutting blocks, and trials increase efficiency in the operating room during total knee arthroplasty: a prospective comparison of navigated and non-navigated cases. J Arthroplasty. 2013;28(7):1135-1140.
6. Lionberger DR, Crocker CL, Chen V. Patient specific instrumentation. J Arthroplasty. 2014;29(9):1699-1704.
7. Sah AP. Is there an advantage to knotless barbed suture in TKA wound closure? A randomized trial in simultaneous bilateral TKAs. Clin Orthop Relat Res. 2015;473(6):2019-2027.
8. Torkki PM, Marjamaa RA, Torkki MI, Kallio PE, Kirvelä OA. Use of anesthesia induction rooms can increase the number of urgent orthopedic cases completed within 7 hours. Anesthesiology. 2005;103(2):401-405.
9. Small TJ, Gad BV, Klika AK, Mounir-Soliman LS, Gerritsen RL, Barsoum WK. Dedicated orthopedic operating room unit improves operating room efficiency. J Arthroplasty. 2013;28(7):1066-1071.e2.
10. Miller AG, McKenzie J, Greenky M, et al. Spinal anesthesia: should everyone receive a urinary catheter?: a randomized, prospective study of patients undergoing total hip arthroplasty. J Bone Joint Surg Am. 2013;95(16):1498-1503.
11. Huang Z, Ma J, Shen B, Pei F. General anesthesia: to catheterize or not? A prospective randomized controlled study of patients undergoing total knee arthroplasty. J Arthroplasty. 2015;30(3):502-506.
12. Attarian DE, Wahl JE, Wellman SS, Bolognesi MP. Developing a high-efficiency operating room for total joint arthroplasty in an academic setting. Clin Orthop Relat Res. 2013;471(6):1832-1836.
13. Gamble M. 6 cornerstones of operating room efficiency: best practices for each. Becker’s Hospital Review Web site. http://www.beckershospitalreview.com/or-efficiencies/6-cornerstones-of-operating-room-efficiency-best-practices-for-each.html. Updated January 18, 2013. Accessed September 3, 2015.
14. Smith MP, Sandberg WS, Foss J, et al. High-throughput operating room system for joint arthroplasties durably outperforms routine processes. Anesthesiology. 2008;109(1):25-35.
Biomechanical Evaluation of All-Polyethylene Pegged Bony Ingrowth Glenoid Fixation Techniques on Implant Micromotion
Since Neer and colleagues1 first reported in 1982, glenoid loosening persists as a common cause of anatomic total shoulder arthroplasty (TSA) failure.1-4 Currently, cemented, all-polyethylene glenoid components are the gold standard, and minimum clinical survival of 10 to 15 years is expected.3,5 Several clinical studies5-9 and in vitro biomechanical studies10 have suggested an advantage of pegged over keeled glenoid components, but glenoid component loosening remains a frequent complication,11 with the cement–implant interface suggested as the weak link of fixation.10,12 In addition to mechanical loosening, poor cement penetration and heat-induced necrosis have been postulated as contributing to glenoid component loosening.13,14
Because of these potential complications, there is a growing consideration to minimize or abandon cement fixation and rely on biological fixation to polyethylene for long-term component stability.15 A newer pegged glenoid component design consists of traditional, peripherally located pegs designed for cement fixation as well as a central, uncemented, fluted, interference-fit peg that allows for bony ingrowth. Short-term clinical studies have shown that bony ingrowth into the space between the flutes can be achieved with a hybrid cementation technique and that, when that occurs, excellent outcomes are likely.13,16-19 The immediate in vivo stability of this implant design upon initial implantation, before the cement has cured, has prompted some surgeons to consider implanting the device without cement. In a recent series in which this implant design was used without cement, clinical and radiographic results were promising.15
Despite the widespread clinical use, little biomechanical work has been done to characterize initial fixation of all-polyethylene pegged glenoid implants. We conducted a study to compare glenoid micromotion in an all-polyethylene, centrally fluted pegged glenoid component as a function of 3 fixation techniques: cementless interference-fit fixation, hybrid partial cementation based on manufacturer recommendations, and full cementation to simulate a gold-standard, traditional, cemented, pegged design.
Materials and MethodsBiomechanical Testing
The biomechanical testing methodology used in this study was based on previous studies20-23 and on ASTM standard F2028-1224 using polyurethane bone substitute 0.24 g/cm3 (Pacific Research Laboratories) with ultimate strength of 4.9 MPa and compressive modulus of 123 MPa for component implantation. This material was selected because its mechanical properties are similar to those of cancellous glenoid bone in primary shoulder arthroplasty,25 and it minimizes variability with use of cadaveric specimens. Components were mounted on an MTS 858 Mini-Bionix II materials testing frame (Figure 1). A static compressive load of 756 N (170 lb) was applied via a mass-pulley system simulating the joint compressive force the shoulder is likely to experience during higher load activities.24,26 The glenoid component was positioned on a linear bearing to allow for joint compression.
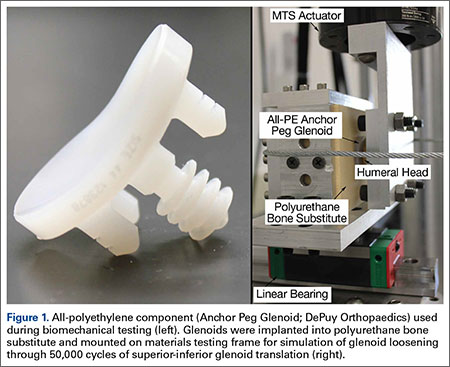
Test Groups and Cement Fixation Techniques
All-polyethylene pegged glenoid components (Anchor Peg Glenoid, size 44; DePuy Orthopaedics) were used for biomechanical testing (Figure 1). Polyurethane blocks were reamed with a size 44 reamer until the superior-inferior distance reached 33 mm, ensuring complete seating of implant. Three fixation-technique groups were formed: interference-fit, hybrid cement, and fully cemented. Interference-fit fixation was done without polymethylmethacrylate (PMMA) cement. In hybrid fixation, 2 cm3 of PMMA (SpeedSet Cement, Stryker Orthopaedics) was injected (using a catheter tip syringe) into the peripheral peg holes and manually pressurized; the central peg was press-fit into polyurethane bone substitute. In the fully cemented group, both peripheral and central peg holes received PMMA; the peripheral peg holes were cemented as in hybrid fixation, and the central peg hole was injected with 3 cm3 of PMMA, which was then manually pressurized. The humeral head component (Global Advantage, 44×18 mm; DePuy Synthes) was mounted on the test frame actuator and centrally located within the glenoid at the start of the test.
Determination of Humeral Head Translation via Subluxation Testing
Humeral head subluxation distance, simulating a humeral head rim loading event, was calculated on the basis of preliminary tests outlined in the ASTM standard.24 Three glenoids (1 per fixation technique) were mounted on the test frame with a humeral head positioned centrally within the glenoid. After the joint compressive force was applied, the humeral head was translated along the true superior axis of the glenoid at a rate of 50 mm/min. Testing software was used to record humeral head displacement and load data at a frequency of 100 Hz. Humeral head subluxation displacement was determined at the end of the linear region of the force versus displacement response. This distance, averaged from the 3 subluxation tests, was used as the subluxation distance during cyclic testing.
Determination of Glenoid Component Motion via Cyclic Testing
After subluxation displacement was determined, glenoid components were mounted on the test frame (5 per fixation technique) and subjected to 50,000 cycles of humeral head translation at a frequency of 2 Hz. Amplitude of the humeral head displacement against the glenoid component followed a sinusoidal pattern with maxima and minima represented by the subluxation displacement (positive and negative, respectively). Glenoid edge compression/distraction of the superior edge and glenoid inferior/superior translation were monitored with 2 variable resistance reluctance transducers (Microminiature DVRT; 4.5-µm resolution; MicroStrain) secured to the glenoid component and testing fixture.
Microminiature DVRT measurements of glenoid motion were taken for 5 consecutive cycles at cycles 1, 20, 100, 500, 1000, 5000, 10,000, 15,000, 20,000, 30,000, 40,000, and 50,000. Distraction-compression displacement and superior-inferior translation measurements were recorded relative to the glenoid position with the humeral head at the neutral position at a given cycle. Final glenoid micromotion data were calculated from the mean of consecutive cycles at each cycle time point.
Statistical Analysis
Glenoid motion results are reported as means and standard deviations. Comparisons with 2 factors of fixation technique and number of cycles for glenoid distraction, glenoid compression, and absolute glenoid translation were characterized with 2-way analysis of variance (SigmaPlot Version 11.0; Systat Software), with the Holm-Šídák test used for post hoc determination of significant relationships.
Results
Under subluxation testing, the humeral head translation distance at the end of the linear region was determined to be 0.50 mm. Subsequently for cyclic testing, the humeral head was then translated 0.50 mm from the neutral position of the humeral head along both the superior and inferior axes of the glenoid. All glenoids successfully completed the entire 50,000 cycles of testing. For the glenoid component, Figure 2 depicts distraction and compression, and Figure 3 depicts superior-inferior translation.
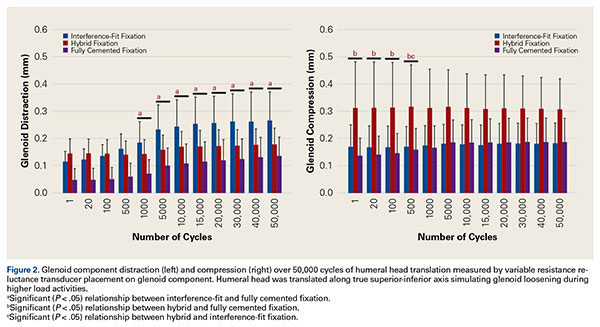
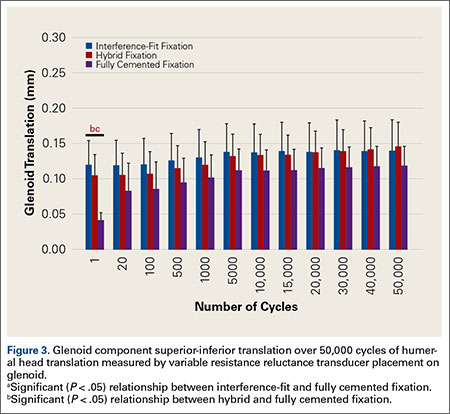
Glenoid Component Distraction
Overall, mean (SD) glenoid distraction was significantly higher for interference-fit fixation, 0.21 (0.10) mm, than for hybrid cement fixation, 0.16 (0.05) mm (P < .001), and fully cemented fixation, 0.09 (0.07) mm (P < .001). It was also significantly higher for hybrid fixation than fully cemented fixation (P < .001). From cycle 1000 to cycle 50,000, distraction was significantly higher for interference-fit fixation than for fully cemented fixation at each time point (P < .05).
Glenoid Component Compression
Mean (SD) compression was significantly higher for hybrid cement fixation, 0.31 (0.13) mm, than for interference-fit fixation, 0.17 (0.07) mm (P < .001), and fully cemented fixation, 0.17 (0.08) mm (P < .001). No significant difference was found between interference-fit and fully cemented fixation (P = .793) (Figure 2). At cycles 1, 20, 100, and 500, compression was significantly higher for hybrid fixation than for fully cemented fixation (P < .05). In addition, at cycle 500, it was significantly higher for hybrid fixation than for interference-fit fixation (P < .05).
Glenoid Component Translation
Mean (SD) glenoid translation was significantly lower for fully cemented fixation, 0.10 (0.04) mm, than for interference-fit fixation, 0.13 (0.04) mm (P < .001), and hybrid cement fixation, 0.13 (0.03) mm (P < .001), with all time points considered. There was no significant difference between interference-fit and hybrid fixation (P = .343). Initial translation at cycle 1 was significantly higher for interference-fit and hybid fixation than for fully cemented fixation.
Discussion
Despite advances in glenoid component design, glenoid loosening remains the most common cause of anatomical TSA failure. Recent implants have been designed to take advantage of an all-polyethylene component while providing long-lasting fixation through bony ingrowth into a central peg. In a study of the hybrid cementation technique drescribed here, Groh17 found no glenoid loosening or radiolucent lines but discovered fingerlike projections of bone between the flanges of the implant in 24 (29%) of 83 cases. Churchill and colleagues16 also reported bony ingrowth into the central peg in 15 (75%) of 20 patients. Furthermore, Arnold and colleagues13 reported complete bony ingrowth (6/6 inter-fin compartments) in 23 (71%) of 35 shoulders at a mean of 43 months. Wirth and colleagues19 reported increased radiodensity between the flanges of the central peg in 30 of 44 cases (68%) and osteolysis around the central peg in 3 of 44 cases (7%) at 3 years.
There are also reports of successful bony ingrowth associated with all-polyethylene components implanted without cement. In a canine study using an early ingrowth implant design, Wirth and colleagues27 showed that, though initial fixation was superior with a cemented, keeled implant, pullout strength of the uncemented, pegged implant improved over time and eventually far surpassed that of the cemented, keeled implant owing to both the loosening of the cemented component and the bony ingrowth into the central peg component. Furthermore, Anglin and colleagues10 confirmed that component micromotion was lower with pegged glenoid components than with keeled components in a biomechanical model. De Wilde and colleagues15 recently reported on a series of uncemented, central fluted peg glenoids implanted in 34 patients followed clinically and with computed tomography for a minimum of 24 months. The investigators found bony ingrowth into the central peg in 27 (79%) of 34 patients and no signs of loosening in 30 (88%) of 34 patients. Incomplete lucencies around 1 or 2 peripheral pegs were found in 2 (6%) of 34 patients, and complete lucencies around 2 or more peripheral pegs were found in 2 (6%) of 34 patients. However, there was no statistical difference in clinical outcome between patients with and without loosening.
With this type of implant, initial fixation that provides stability while minimizing micromotion under biomechanical loading likely is crucial for attaining bony growth within the central peg flanges. To our knowledge, this is the first biomechanical study to compare micromotion using 3 different fixation methods with a central fluted peg glenoid component design. Of all these fixation methods, fully cemented fixation yielded the most stable glenoid throughout testing with respect to the evaluated parameters. However, this method is not necessarily clinically applicable, as a fully cemented glenoid would inhibit any bony growth within the central flange, which is necessary for long-term biological fixation. Our data showed that, though glenoid distraction was significantly lower with hybrid cement fixation, this fixation method exhibited significantly higher glenoid compression. In addition, there were no significant differences between glenoid components with hybrid fixation and glenoid components with interference-fit fixation with respect to component translation in the superior-inferior direction. These findings may indicate that initial fixation is not significantly improved by the addition of cement to the peripheral pegs in a glenoid component with a central fluted peg design.
The interference fit of the central peg is primarily responsible for conferring long-term implant stability,13,27 which is ultimately achieved by bony formation between the flutes of the peg. Other authors have reported that, for bony ingrowth to occur, micromotion between the bone–implant interface must not exceed 20 to 150 µm.28-30 Other than for interference-fit distraction at more than 1000 cycles and hybrid cement fixation compression at each time point throughout testing, our data fall within the reported upper limits of micromotion to support bony ingrowth. Increased micromotion in the interference-fit fixation group is seen at later time points and may be caused by the inability to simulate the potential fixation gained from bony ingrowth allowed with this surgical technique. Research is needed to further explain this increase in distraction.
Results from this study must be interpreted with caution because of limitations of the in vitro testing methodology. This biomechanical model using bone substitute characterizes glenoid fixation at time zero, directly after implantation, followed by repetitive cyclic loading simulating 5 years of implant service. This differs from the clinical scenario in which the shoulder undergoes postoperative immobilization or protected motion during which the early phases of bony remodeling are likely occurring. Furthermore, simulation of 5 years of implant service may not be necessary for an implant that is expected to achieve ultimate fixation by bony ingrowth within the first several months after implantation. Use of this implant without cement is classified off-label, and surgeons should take this into consideration during implantation. Last, this study could not simulate the effect of bony ingrowth on fixation, though our experimental technique of cementing the central peg may be a gross approximation of a fully ingrown central peg and its expected rigid fixation.
Fully cemented fixation of a polyethylene glenoid is superior to hybrid cement fixation and interference-fit fixation with respect to early glenoid micromotion. However, the long-term stability of a fully cemented polyethylene glenoid component remains a clinical concern, as fixation is achieved by bony ingrowth around the central fluted peg of the implant. In this study, interference-fit and hybrid fixation had equivocal component micromotion in biomechanical testing. Our findings suggest that cementation of the peripheral pegs confers no additional initial stability over an uncemented interference-fit technique in a biomechanical model. More research is needed to further evaluate interference-fit fixation as a viable option for implantation of a central fluted, all-polyethylene glenoid component.
1. Neer CS 2nd, Watson KC, Stanton FJ. Recent experience in total shoulder replacement. J Bone Joint Surg Am. 1982;64(3):319-337.
2. Sperling JW, Cofield RH, O’Driscoll SW, Torchia ME, Rowland CM. Radiographic assessment of ingrowth total shoulder arthroplasty. J Shoulder Elbow Surg. 2000;9(6):507-513.
3. Torchia ME, Cofield RH, Settergren CR. Total shoulder arthroplasty with the Neer prosthesis: long-term results. J Shoulder Elbow Surg. 1997;6(6):495-505.
4. Wirth MA, Rockwood CA Jr. Complications of total shoulder-replacement arthroplasty. J Bone Joint Surg Am. 1996;78(4):603-616.
5. Fox TJ, Cil A, Sperling JW, Sanchez-Sotelo J, Schleck CD, Cofield RH. Survival of the glenoid component in shoulder arthroplasty. J Shoulder Elbow Surg. 2009;18(6):859-863.
6. Edwards TB, Labriola JE, Stanley RJ, O’Connor DP, Elkousy HA, Gartsman GM. Radiographic comparison of pegged and keeled glenoid components using modern cementing techniques: a prospective randomized study. J Shoulder Elbow Surg. 2010;19(2):251-257.
7. Gartsman GM, Elkousy HA, Warnock KM, Edwards TB, O’Connor DP. Radiographic comparison of pegged and keeled glenoid components. J Shoulder Elbow Surg. 2005;14(3):252-257.
8. Klepps S, Chiang AS, Miller S, Jiang CY, Hazrati Y, Flatow EL. Incidence of early radiolucent glenoid lines in patients having total shoulder replacements. Clin Orthop Relat Res. 2005;(435):118-125.
9. Lazarus MD, Jensen KL, Southworth C, Matsen FA 3rd. The radiographic evaluation of keeled and pegged glenoid component insertion. J Bone Joint Surg Am. 2002;84(7):1174-1182.
10. Anglin C, Wyss UP, Nyffeler RW, Gerber C. Loosening performance of cemented glenoid prosthesis design pairs. Clin Biomech. 2001;16(2):144-150.
11. Walch G, Young AA, Melis B, Gazielly D, Loew M, Boileau P. Results of a convex-back cemented keeled glenoid component in primary osteoarthritis: multicenter study with a follow-up greater than 5 years. J Shoulder Elbow Surg. 2011;20(3):385-394.
12. Gregory T, Hansen U, Taillieu F, et al. Glenoid loosening after total shoulder arthroplasty: an in vitro CT-scan study. J Orthop Res. 2009;27(12):1589-1595.
13. Arnold RM, High RR, Grosshans KT, Walker CW, Fehringer EV. Bone presence between the central peg’s radial fins of a partially cemented pegged all poly glenoid component suggest few radiolucencies. J Shoulder Elbow Surg. 2011;20(2):315-321.
14. Churchill RS, Boorman RS, Fehringer EV, Matsen FA 3rd. Glenoid cementing may generate sufficient heat to endanger the surrounding bone. Clin Orthop Relat Res. 2004;(419):76-79.
15. De Wilde L, Dayerizadeh N, De Neve F, Basamania C, Van Tongel A. Fully uncemented glenoid component in total shoulder arthroplasty. J Shoulder Elbow Surg. 2013;22(10):e1-e7.
16. Churchill RS, Zellmer C, Zimmers HJ, Ruggero R. Clinical and radiographic analysis of a partially cemented glenoid implant: five-year minimum follow-up. J Shoulder Elbow Surg. 2010;19(7):1091-1097.
17. Groh GI. Survival and radiographic analysis of a glenoid component with a cementless fluted central peg. J Shoulder Elbow Surg. 2010;19(8):1265-1268.
18. Vidil A, Valenti P, Guichoux F, Barthas JH. CT scan evaluation of glenoid component fixation: a prospective study of 27 minimally cemented shoulder arthroplasties. Eur J Orthop Surg Traumatol. 2012;23(5):521-525.
19. Wirth MA, Loredo R, Garcia G, Rockwood CA Jr, Southworth C, Iannotti JP. Total shoulder arthroplasty with an all-polyethylene pegged bone-ingrowth glenoid component: a clinical and radiographic outcome study. J Bone Joint Surg Am. 2012;94(3):260-267.
20. Anglin C, Wyss UP, Pichora DR. Mechanical testing of shoulder prostheses and recommendations for glenoid design. J Shoulder Elbow Surg. 2000;9(4):323-331.
21. Hoenig MP, Loeffler B, Brown S, et al. Reverse glenoid component fixation: is a posterior screw necessary? J Shoulder Elbow Surg. 2010;19(4):544-549.
22. Sarah J, Sanjay G, Sanjay S, et al. Failure mechanism of the all-polyethylene glenoid implant. J Biomech. 2010;43(4):714-719.
23. Suárez DR, Nerkens W, Valstar ER, Rozing PM, van Keulen F. Interface micromotions increase with less-conforming cementless glenoid components. J Shoulder Elbow Surg. 2012;21(4):474-482.
24. ASTM International. Standard Test Methods for Dynamic Evaluation of Glenoid Loosening or Disassociation. West Conshocken, PA: ASTM International; 2012. ASTM F2028-08.
25. Anglin C, Tolhurst P, Wyss UP, Pichora DR. Glenoid cancellous bone strength and modulus. J Biomech. 1999;32(10):1091-1097.
26. Anglin C, Wyss U, Pichora D. Glenohumeral contact forces. Proc Inst Mech Eng H. 2000;214(6):637-644.
27. Wirth MA, Korvick DL, Basamania CJ, Toro F, Aufdemorte TB, Rockwood CA Jr. Radiologic, mechanical, and histologic evaluation of 2 glenoid prosthesis designs in a canine model. J Shoulder Elbow Surg. 2001;10(2):140-148.
28. Pilliar RM, Lee JM, Maniatopoulos C. Observations on the effect of movement on bone ingrowth into porous-surfaced implants. Clin Orthop Relat Res. 1986;(208):108-113.
29. Ramamurti BS, Orr TE, Bragdon CR, Lowenstein JD, Jasty M, Harris WH. Factors influencing stability at the interface between a porous surface and cancellous bone: a finite element analysis of a canine in vivo micromotion experiment. J Biomed Mater Res. 1997;36(2):274-280.
30. Şahin S, Cehreli MC, Yalçın E. The influence of functional forces on the biomechanics of implant-supported prostheses—a review. J Dent. 2002;30(7-8):271-282.
Since Neer and colleagues1 first reported in 1982, glenoid loosening persists as a common cause of anatomic total shoulder arthroplasty (TSA) failure.1-4 Currently, cemented, all-polyethylene glenoid components are the gold standard, and minimum clinical survival of 10 to 15 years is expected.3,5 Several clinical studies5-9 and in vitro biomechanical studies10 have suggested an advantage of pegged over keeled glenoid components, but glenoid component loosening remains a frequent complication,11 with the cement–implant interface suggested as the weak link of fixation.10,12 In addition to mechanical loosening, poor cement penetration and heat-induced necrosis have been postulated as contributing to glenoid component loosening.13,14
Because of these potential complications, there is a growing consideration to minimize or abandon cement fixation and rely on biological fixation to polyethylene for long-term component stability.15 A newer pegged glenoid component design consists of traditional, peripherally located pegs designed for cement fixation as well as a central, uncemented, fluted, interference-fit peg that allows for bony ingrowth. Short-term clinical studies have shown that bony ingrowth into the space between the flutes can be achieved with a hybrid cementation technique and that, when that occurs, excellent outcomes are likely.13,16-19 The immediate in vivo stability of this implant design upon initial implantation, before the cement has cured, has prompted some surgeons to consider implanting the device without cement. In a recent series in which this implant design was used without cement, clinical and radiographic results were promising.15
Despite the widespread clinical use, little biomechanical work has been done to characterize initial fixation of all-polyethylene pegged glenoid implants. We conducted a study to compare glenoid micromotion in an all-polyethylene, centrally fluted pegged glenoid component as a function of 3 fixation techniques: cementless interference-fit fixation, hybrid partial cementation based on manufacturer recommendations, and full cementation to simulate a gold-standard, traditional, cemented, pegged design.
Materials and MethodsBiomechanical Testing
The biomechanical testing methodology used in this study was based on previous studies20-23 and on ASTM standard F2028-1224 using polyurethane bone substitute 0.24 g/cm3 (Pacific Research Laboratories) with ultimate strength of 4.9 MPa and compressive modulus of 123 MPa for component implantation. This material was selected because its mechanical properties are similar to those of cancellous glenoid bone in primary shoulder arthroplasty,25 and it minimizes variability with use of cadaveric specimens. Components were mounted on an MTS 858 Mini-Bionix II materials testing frame (Figure 1). A static compressive load of 756 N (170 lb) was applied via a mass-pulley system simulating the joint compressive force the shoulder is likely to experience during higher load activities.24,26 The glenoid component was positioned on a linear bearing to allow for joint compression.
Test Groups and Cement Fixation Techniques
All-polyethylene pegged glenoid components (Anchor Peg Glenoid, size 44; DePuy Orthopaedics) were used for biomechanical testing (Figure 1). Polyurethane blocks were reamed with a size 44 reamer until the superior-inferior distance reached 33 mm, ensuring complete seating of implant. Three fixation-technique groups were formed: interference-fit, hybrid cement, and fully cemented. Interference-fit fixation was done without polymethylmethacrylate (PMMA) cement. In hybrid fixation, 2 cm3 of PMMA (SpeedSet Cement, Stryker Orthopaedics) was injected (using a catheter tip syringe) into the peripheral peg holes and manually pressurized; the central peg was press-fit into polyurethane bone substitute. In the fully cemented group, both peripheral and central peg holes received PMMA; the peripheral peg holes were cemented as in hybrid fixation, and the central peg hole was injected with 3 cm3 of PMMA, which was then manually pressurized. The humeral head component (Global Advantage, 44×18 mm; DePuy Synthes) was mounted on the test frame actuator and centrally located within the glenoid at the start of the test.
Determination of Humeral Head Translation via Subluxation Testing
Humeral head subluxation distance, simulating a humeral head rim loading event, was calculated on the basis of preliminary tests outlined in the ASTM standard.24 Three glenoids (1 per fixation technique) were mounted on the test frame with a humeral head positioned centrally within the glenoid. After the joint compressive force was applied, the humeral head was translated along the true superior axis of the glenoid at a rate of 50 mm/min. Testing software was used to record humeral head displacement and load data at a frequency of 100 Hz. Humeral head subluxation displacement was determined at the end of the linear region of the force versus displacement response. This distance, averaged from the 3 subluxation tests, was used as the subluxation distance during cyclic testing.
Determination of Glenoid Component Motion via Cyclic Testing
After subluxation displacement was determined, glenoid components were mounted on the test frame (5 per fixation technique) and subjected to 50,000 cycles of humeral head translation at a frequency of 2 Hz. Amplitude of the humeral head displacement against the glenoid component followed a sinusoidal pattern with maxima and minima represented by the subluxation displacement (positive and negative, respectively). Glenoid edge compression/distraction of the superior edge and glenoid inferior/superior translation were monitored with 2 variable resistance reluctance transducers (Microminiature DVRT; 4.5-µm resolution; MicroStrain) secured to the glenoid component and testing fixture.
Microminiature DVRT measurements of glenoid motion were taken for 5 consecutive cycles at cycles 1, 20, 100, 500, 1000, 5000, 10,000, 15,000, 20,000, 30,000, 40,000, and 50,000. Distraction-compression displacement and superior-inferior translation measurements were recorded relative to the glenoid position with the humeral head at the neutral position at a given cycle. Final glenoid micromotion data were calculated from the mean of consecutive cycles at each cycle time point.
Statistical Analysis
Glenoid motion results are reported as means and standard deviations. Comparisons with 2 factors of fixation technique and number of cycles for glenoid distraction, glenoid compression, and absolute glenoid translation were characterized with 2-way analysis of variance (SigmaPlot Version 11.0; Systat Software), with the Holm-Šídák test used for post hoc determination of significant relationships.
Results
Under subluxation testing, the humeral head translation distance at the end of the linear region was determined to be 0.50 mm. Subsequently for cyclic testing, the humeral head was then translated 0.50 mm from the neutral position of the humeral head along both the superior and inferior axes of the glenoid. All glenoids successfully completed the entire 50,000 cycles of testing. For the glenoid component, Figure 2 depicts distraction and compression, and Figure 3 depicts superior-inferior translation.
Glenoid Component Distraction
Overall, mean (SD) glenoid distraction was significantly higher for interference-fit fixation, 0.21 (0.10) mm, than for hybrid cement fixation, 0.16 (0.05) mm (P < .001), and fully cemented fixation, 0.09 (0.07) mm (P < .001). It was also significantly higher for hybrid fixation than fully cemented fixation (P < .001). From cycle 1000 to cycle 50,000, distraction was significantly higher for interference-fit fixation than for fully cemented fixation at each time point (P < .05).
Glenoid Component Compression
Mean (SD) compression was significantly higher for hybrid cement fixation, 0.31 (0.13) mm, than for interference-fit fixation, 0.17 (0.07) mm (P < .001), and fully cemented fixation, 0.17 (0.08) mm (P < .001). No significant difference was found between interference-fit and fully cemented fixation (P = .793) (Figure 2). At cycles 1, 20, 100, and 500, compression was significantly higher for hybrid fixation than for fully cemented fixation (P < .05). In addition, at cycle 500, it was significantly higher for hybrid fixation than for interference-fit fixation (P < .05).
Glenoid Component Translation
Mean (SD) glenoid translation was significantly lower for fully cemented fixation, 0.10 (0.04) mm, than for interference-fit fixation, 0.13 (0.04) mm (P < .001), and hybrid cement fixation, 0.13 (0.03) mm (P < .001), with all time points considered. There was no significant difference between interference-fit and hybrid fixation (P = .343). Initial translation at cycle 1 was significantly higher for interference-fit and hybid fixation than for fully cemented fixation.
Discussion
Despite advances in glenoid component design, glenoid loosening remains the most common cause of anatomical TSA failure. Recent implants have been designed to take advantage of an all-polyethylene component while providing long-lasting fixation through bony ingrowth into a central peg. In a study of the hybrid cementation technique drescribed here, Groh17 found no glenoid loosening or radiolucent lines but discovered fingerlike projections of bone between the flanges of the implant in 24 (29%) of 83 cases. Churchill and colleagues16 also reported bony ingrowth into the central peg in 15 (75%) of 20 patients. Furthermore, Arnold and colleagues13 reported complete bony ingrowth (6/6 inter-fin compartments) in 23 (71%) of 35 shoulders at a mean of 43 months. Wirth and colleagues19 reported increased radiodensity between the flanges of the central peg in 30 of 44 cases (68%) and osteolysis around the central peg in 3 of 44 cases (7%) at 3 years.
There are also reports of successful bony ingrowth associated with all-polyethylene components implanted without cement. In a canine study using an early ingrowth implant design, Wirth and colleagues27 showed that, though initial fixation was superior with a cemented, keeled implant, pullout strength of the uncemented, pegged implant improved over time and eventually far surpassed that of the cemented, keeled implant owing to both the loosening of the cemented component and the bony ingrowth into the central peg component. Furthermore, Anglin and colleagues10 confirmed that component micromotion was lower with pegged glenoid components than with keeled components in a biomechanical model. De Wilde and colleagues15 recently reported on a series of uncemented, central fluted peg glenoids implanted in 34 patients followed clinically and with computed tomography for a minimum of 24 months. The investigators found bony ingrowth into the central peg in 27 (79%) of 34 patients and no signs of loosening in 30 (88%) of 34 patients. Incomplete lucencies around 1 or 2 peripheral pegs were found in 2 (6%) of 34 patients, and complete lucencies around 2 or more peripheral pegs were found in 2 (6%) of 34 patients. However, there was no statistical difference in clinical outcome between patients with and without loosening.
With this type of implant, initial fixation that provides stability while minimizing micromotion under biomechanical loading likely is crucial for attaining bony growth within the central peg flanges. To our knowledge, this is the first biomechanical study to compare micromotion using 3 different fixation methods with a central fluted peg glenoid component design. Of all these fixation methods, fully cemented fixation yielded the most stable glenoid throughout testing with respect to the evaluated parameters. However, this method is not necessarily clinically applicable, as a fully cemented glenoid would inhibit any bony growth within the central flange, which is necessary for long-term biological fixation. Our data showed that, though glenoid distraction was significantly lower with hybrid cement fixation, this fixation method exhibited significantly higher glenoid compression. In addition, there were no significant differences between glenoid components with hybrid fixation and glenoid components with interference-fit fixation with respect to component translation in the superior-inferior direction. These findings may indicate that initial fixation is not significantly improved by the addition of cement to the peripheral pegs in a glenoid component with a central fluted peg design.
The interference fit of the central peg is primarily responsible for conferring long-term implant stability,13,27 which is ultimately achieved by bony formation between the flutes of the peg. Other authors have reported that, for bony ingrowth to occur, micromotion between the bone–implant interface must not exceed 20 to 150 µm.28-30 Other than for interference-fit distraction at more than 1000 cycles and hybrid cement fixation compression at each time point throughout testing, our data fall within the reported upper limits of micromotion to support bony ingrowth. Increased micromotion in the interference-fit fixation group is seen at later time points and may be caused by the inability to simulate the potential fixation gained from bony ingrowth allowed with this surgical technique. Research is needed to further explain this increase in distraction.
Results from this study must be interpreted with caution because of limitations of the in vitro testing methodology. This biomechanical model using bone substitute characterizes glenoid fixation at time zero, directly after implantation, followed by repetitive cyclic loading simulating 5 years of implant service. This differs from the clinical scenario in which the shoulder undergoes postoperative immobilization or protected motion during which the early phases of bony remodeling are likely occurring. Furthermore, simulation of 5 years of implant service may not be necessary for an implant that is expected to achieve ultimate fixation by bony ingrowth within the first several months after implantation. Use of this implant without cement is classified off-label, and surgeons should take this into consideration during implantation. Last, this study could not simulate the effect of bony ingrowth on fixation, though our experimental technique of cementing the central peg may be a gross approximation of a fully ingrown central peg and its expected rigid fixation.
Fully cemented fixation of a polyethylene glenoid is superior to hybrid cement fixation and interference-fit fixation with respect to early glenoid micromotion. However, the long-term stability of a fully cemented polyethylene glenoid component remains a clinical concern, as fixation is achieved by bony ingrowth around the central fluted peg of the implant. In this study, interference-fit and hybrid fixation had equivocal component micromotion in biomechanical testing. Our findings suggest that cementation of the peripheral pegs confers no additional initial stability over an uncemented interference-fit technique in a biomechanical model. More research is needed to further evaluate interference-fit fixation as a viable option for implantation of a central fluted, all-polyethylene glenoid component.
1. Neer CS 2nd, Watson KC, Stanton FJ. Recent experience in total shoulder replacement. J Bone Joint Surg Am. 1982;64(3):319-337.
2. Sperling JW, Cofield RH, O’Driscoll SW, Torchia ME, Rowland CM. Radiographic assessment of ingrowth total shoulder arthroplasty. J Shoulder Elbow Surg. 2000;9(6):507-513.
3. Torchia ME, Cofield RH, Settergren CR. Total shoulder arthroplasty with the Neer prosthesis: long-term results. J Shoulder Elbow Surg. 1997;6(6):495-505.
4. Wirth MA, Rockwood CA Jr. Complications of total shoulder-replacement arthroplasty. J Bone Joint Surg Am. 1996;78(4):603-616.
5. Fox TJ, Cil A, Sperling JW, Sanchez-Sotelo J, Schleck CD, Cofield RH. Survival of the glenoid component in shoulder arthroplasty. J Shoulder Elbow Surg. 2009;18(6):859-863.
6. Edwards TB, Labriola JE, Stanley RJ, O’Connor DP, Elkousy HA, Gartsman GM. Radiographic comparison of pegged and keeled glenoid components using modern cementing techniques: a prospective randomized study. J Shoulder Elbow Surg. 2010;19(2):251-257.
7. Gartsman GM, Elkousy HA, Warnock KM, Edwards TB, O’Connor DP. Radiographic comparison of pegged and keeled glenoid components. J Shoulder Elbow Surg. 2005;14(3):252-257.
8. Klepps S, Chiang AS, Miller S, Jiang CY, Hazrati Y, Flatow EL. Incidence of early radiolucent glenoid lines in patients having total shoulder replacements. Clin Orthop Relat Res. 2005;(435):118-125.
9. Lazarus MD, Jensen KL, Southworth C, Matsen FA 3rd. The radiographic evaluation of keeled and pegged glenoid component insertion. J Bone Joint Surg Am. 2002;84(7):1174-1182.
10. Anglin C, Wyss UP, Nyffeler RW, Gerber C. Loosening performance of cemented glenoid prosthesis design pairs. Clin Biomech. 2001;16(2):144-150.
11. Walch G, Young AA, Melis B, Gazielly D, Loew M, Boileau P. Results of a convex-back cemented keeled glenoid component in primary osteoarthritis: multicenter study with a follow-up greater than 5 years. J Shoulder Elbow Surg. 2011;20(3):385-394.
12. Gregory T, Hansen U, Taillieu F, et al. Glenoid loosening after total shoulder arthroplasty: an in vitro CT-scan study. J Orthop Res. 2009;27(12):1589-1595.
13. Arnold RM, High RR, Grosshans KT, Walker CW, Fehringer EV. Bone presence between the central peg’s radial fins of a partially cemented pegged all poly glenoid component suggest few radiolucencies. J Shoulder Elbow Surg. 2011;20(2):315-321.
14. Churchill RS, Boorman RS, Fehringer EV, Matsen FA 3rd. Glenoid cementing may generate sufficient heat to endanger the surrounding bone. Clin Orthop Relat Res. 2004;(419):76-79.
15. De Wilde L, Dayerizadeh N, De Neve F, Basamania C, Van Tongel A. Fully uncemented glenoid component in total shoulder arthroplasty. J Shoulder Elbow Surg. 2013;22(10):e1-e7.
16. Churchill RS, Zellmer C, Zimmers HJ, Ruggero R. Clinical and radiographic analysis of a partially cemented glenoid implant: five-year minimum follow-up. J Shoulder Elbow Surg. 2010;19(7):1091-1097.
17. Groh GI. Survival and radiographic analysis of a glenoid component with a cementless fluted central peg. J Shoulder Elbow Surg. 2010;19(8):1265-1268.
18. Vidil A, Valenti P, Guichoux F, Barthas JH. CT scan evaluation of glenoid component fixation: a prospective study of 27 minimally cemented shoulder arthroplasties. Eur J Orthop Surg Traumatol. 2012;23(5):521-525.
19. Wirth MA, Loredo R, Garcia G, Rockwood CA Jr, Southworth C, Iannotti JP. Total shoulder arthroplasty with an all-polyethylene pegged bone-ingrowth glenoid component: a clinical and radiographic outcome study. J Bone Joint Surg Am. 2012;94(3):260-267.
20. Anglin C, Wyss UP, Pichora DR. Mechanical testing of shoulder prostheses and recommendations for glenoid design. J Shoulder Elbow Surg. 2000;9(4):323-331.
21. Hoenig MP, Loeffler B, Brown S, et al. Reverse glenoid component fixation: is a posterior screw necessary? J Shoulder Elbow Surg. 2010;19(4):544-549.
22. Sarah J, Sanjay G, Sanjay S, et al. Failure mechanism of the all-polyethylene glenoid implant. J Biomech. 2010;43(4):714-719.
23. Suárez DR, Nerkens W, Valstar ER, Rozing PM, van Keulen F. Interface micromotions increase with less-conforming cementless glenoid components. J Shoulder Elbow Surg. 2012;21(4):474-482.
24. ASTM International. Standard Test Methods for Dynamic Evaluation of Glenoid Loosening or Disassociation. West Conshocken, PA: ASTM International; 2012. ASTM F2028-08.
25. Anglin C, Tolhurst P, Wyss UP, Pichora DR. Glenoid cancellous bone strength and modulus. J Biomech. 1999;32(10):1091-1097.
26. Anglin C, Wyss U, Pichora D. Glenohumeral contact forces. Proc Inst Mech Eng H. 2000;214(6):637-644.
27. Wirth MA, Korvick DL, Basamania CJ, Toro F, Aufdemorte TB, Rockwood CA Jr. Radiologic, mechanical, and histologic evaluation of 2 glenoid prosthesis designs in a canine model. J Shoulder Elbow Surg. 2001;10(2):140-148.
28. Pilliar RM, Lee JM, Maniatopoulos C. Observations on the effect of movement on bone ingrowth into porous-surfaced implants. Clin Orthop Relat Res. 1986;(208):108-113.
29. Ramamurti BS, Orr TE, Bragdon CR, Lowenstein JD, Jasty M, Harris WH. Factors influencing stability at the interface between a porous surface and cancellous bone: a finite element analysis of a canine in vivo micromotion experiment. J Biomed Mater Res. 1997;36(2):274-280.
30. Şahin S, Cehreli MC, Yalçın E. The influence of functional forces on the biomechanics of implant-supported prostheses—a review. J Dent. 2002;30(7-8):271-282.
Shoulder Arthroplasty: Disposition and Perioperative Outcomes in Patients With and Without Rheumatoid Arthritis
Shoulder arthroplasty (SA), including total SA (TSA) and reverse TSA, is an effective surgical treatment for fracture and primary or secondary degenerative disease of the shoulder.1 Over the past few decades, use of SA has increased dramatically, from about 5000 cases in 1990 to 7000 in 2000 and more than 26,000 in 2008.1,2
Complications associated with SA generally are classified as perioperative (occurring during the operative index) or long-term (postdischarge).3 Long-term complications include implant loosening, instability, revision, infection, rotator cuff tear, neural injury, and deltoid detachment.1,4,5 Perioperative complications, which are less commonly reported, include intraoperative fracture, infection, neural injury, venous thromboembolic events (VTEs, including pulmonary embolism [PE] and deep vein thrombosis [DVT]), transfusion, and death.3,6-10
SA is an attractive treatment option for patients with rheumatoid arthritis (RA), as the effects of pain on these patients are greater in the shoulder joint than in any other joint.11 Patients with RA pose unique orthopedic surgical challenges, including any combination of decreased bone mineralization, poor capsular tissue integrity, and osteonecrosis.3,12 In addition, RA patients may be taking immunosuppressive medications that have severe side effects, and they may require multiple surgeries.12,13 These factors predispose patients with RA to complications that include infection and wound dehiscence.3,5,12-14
The complex nature of RA has prompted investigators to examine outcome measures in this patient group. Hambright and colleagues3 used the Nationwide Inpatient Sample (NIS) to examine perioperative outcomes in RA patients who underwent TSA between 1988 and 2005.3 They found that TSA patients with RA had shorter and less costly hospital stays and were more likely to have a routine discharge.3 Using the same patient population drawn from the period 2006–2011, we conducted a study to determine if this unexpected trend persists as the number of TSAs and quality of postoperative care continue to increase. Given the potential for anemia of chronic disease and the systemic inflammatory nature of RA, we hypothesized that the perioperative complication profile of RA patients would be worse than that of non-RA patients.
Materials and Methods
NIS data were acquired for the period 2006–2011. The NIS is the largest publicly available all-payer inpatient database, with a random 20% sample of about 1000 US hospitals accounting for 7 to 8 million inpatient stays. The database supplies weights used to estimate national totals, at about 35 million inpatient visits per year. NIS inpatient data are limited to the operative index. Postdischarge information is not available. The NIS is managed by the Healthcare Cost and Utilization Project, which is sponsored by the Agency for Healthcare Research and Quality. The quality of NIS data is assessed and validated by an independent contractor. NIS data have been widely used to examine perioperative outcomes.15-17
NIS data cover patient and hospital demographics, hospital length of stay (LOS), discharge status, payer information, charges, and perioperative outcomes and procedure/diagnosis codes (ICD-9; International Classification of Diseases, Ninth Revision18).
As our Institutional Review Board (IRB) reviewed the database and determined the project was not human subject research, IRB involvement was not required. This study paralleled successful efforts with similar RA and non-RA patients who had shoulder and elbow surgery.3,19 SA patients were identified by ICD-9 procedure code 81.80, but this code does not specify whether the prosthesis was unconstrained, semiconstrained, or constrained. ICD-9 coding also does not specify whether the TSA was traditional or reverse. Patients with RA were identified by ICD-9 diagnosis codes 714.0, 714.1, and 714.2. Patients without one of these codes were placed in the non-RA cohort. Patients with codes associated with pathologic fractures secondary to metastatic cancer or bone malignant neoplasm as a secondary or primary diagnosis and patients who had revision surgery indicated by code 81.83 were excluded, as they have a disproportionately higher comorbidity burden.
After each cohort was defined, demographic data (age, sex, race, income quartile based on ZIP postal code) were compared, as were data on primary payer, hospital demographics, LOS (≤5 days, defined as perioperative index), discharge type, inflation-adjusted charges in 2014 dollars based on the Consumer Price Indexes (http://www.bls.gov/cpi/), and mortality. Perioperative complications—respiratory, gastrointestinal, genitourinary, accidental puncture/laceration, central nervous system, wound dehiscence, device-related (including embolism, fibrosis, hemorrhage, pain, stenosis, or thrombus caused by any device, implant, or graft), cardiac, hematoma/seroma, acute respiratory distress syndrome, postoperative shock, VTE, postoperative infection complications, and intraoperative transfusions—were considered using ICD-9 codes (996.X-999.X and 99.X, respectively).20 Although commonly used to determine perioperative comorbidity burden using ICD-9 coding, the modified Charlson index was not considered because RA is a component of the index and would therefore bias the variable.3,21
Statistical analyses, including χ2 tests and 2-sample t tests, were performed for categorical and continuous variables, respectively. P < .05 was considered significant. Fisher exact test was used for cohorts with fewer than 5 occurrences. Multivariate logistic regression models were then calculated to determine the effect of RA on different outcomes and complications, with age, race, sex, hospital region, hospital type, number of hospital beds, primary payer, and hospital ownership as covariates. Statistical analyses were performed using the R statistical programming language.22
Results
Of the 34,970 patients who underwent SA between 2006 and 2011, 1674 (4.8%) had a diagnosis of RA and 33,296 (95.2%) did not. On average, patients with RA tended to be younger than patients without RA (66.4 vs 69.1 years; P < .001), and a larger percentage of RA patients were female (75.5% vs 54.4%; P < .001). Compared with non-RA patients, RA patients comprised a different ethnic group and had a different expected primary payer (P < .001). SA patients with and without RA did not differ in income quartile based on ZIP code, total number of hospital beds, hospital region, or hospital teaching status (P = .34, .78, .59, and .82, respectively) (Table 1).
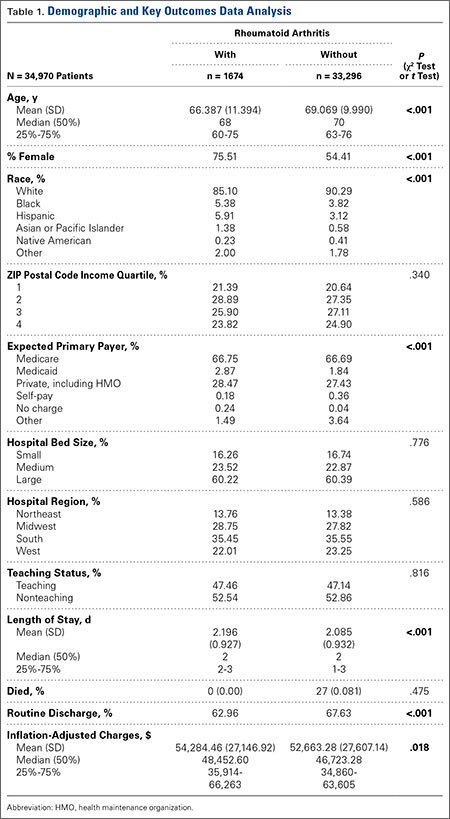
LOS was significantly (P < .001) statistically longer for RA patients (2.196 days) than for non-RA patients (2.085 days). RA patients were significantly less likely to be discharged home (63.0% vs 67.6%; P < .001). (Routine discharge was defined as discharge home, whereas nonroutine discharge was defined as discharge to a short-term hospital, skilled nursing facility, intermediate care, another type of facility, home health care, against medical advice, or death.) In addition, inflation-adjusted charges associated with SA were significantly higher (P = .018) for RA patients ($54,284) than for non-RA patients ($52,663) (Table 1).
Regarding the rates of complications that occurred during the perioperative index, there were no significant differences between RA and non-RA cohorts. These complications included respiratory, gastrointestinal, genitourinary, accidental puncture/laceration, central nervous system, wound dehiscence, device-related, cardiac, hematoma/seroma, acute respiratory distress syndrome, postoperative shock, VTE, and postoperative infection (Table 2). In addition, there was no significant difference in mortality between the groups (P = .48).
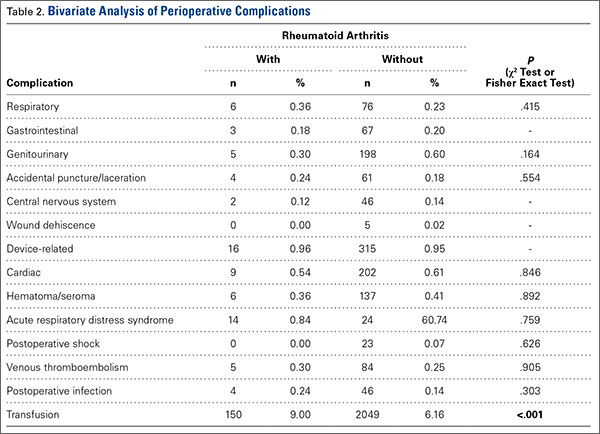
In TSA, blood transfusions were more likely (P < .001) to be given to RA patients (9.00%) than to non-RA patients (6.16%). Multivariate regression analyses were performed with age, race, sex, hospital region, hospital type, number of hospital beds, primary payer, and hospital ownership as covariates. These analyses revealed that transfusion (P < .001), discharge type (P = .002), total inflation-adjusted charges (P < .001), and LOS (P = .047) remained significant (Table 3).
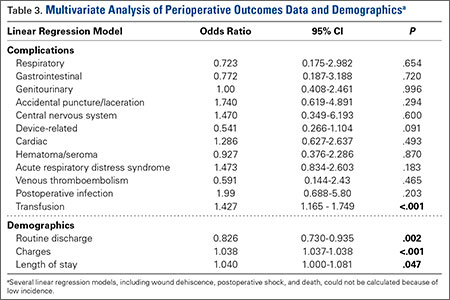
Discussion
Large national databases like NIS allow study of uncommon medical occurrences and help delineate risks and trends that otherwise might be indeterminable. Although it has been suggested that patients with RA may have poorer long-term outcomes after SA, the perioperative risk profile indicates that TSA is well tolerated in RA patients during the operative index.3,23-25
The data on this study’s 34,970 patients, drawn from the period 2006–2011, demonstrated no significant differences in safety profile with respect to the 14 perioperative complications and outcomes examined, except blood transfusion rate. Rates of postoperative infection (RA, 0.24%; non-RA, 0.14%; P = .303), VTE (RA, 0.30%; non-RA, 0.25%; P = .905), and transfusion (RA, 9.00%; non-RA, 6.16%; P < .001) are of particular interest because of the severity of these situations.
Postoperative infection is a potentially serious complication and often occurs secondary to diabetes, RA, lupus erythematosus, prior surgery, or a nosocomial or remote source.1 The often costly treatment options include antibiotic suppression, irrigation and debridement with implant retention, 1-stage exchange with antibiotic-impregnated cement fixation, staged reimplantation, resection arthroplasty, arthrodesis, and amputation.1 The overall 0.14% infection rate determined in this study is lower than the 0.7% reported for SA patients in the literature.1 Given the nature of the NIS database, this rate underestimates the true postoperative infection rate, as any infection that occurred after the perioperative period is not captured.26 The present study’s perioperative infection rates (RA, 0.24%; non-RA, 0.14%) for the period 2006–2011 are comparable to the rates (RA, 0.17%; non-RA, 0.24%) reported by Hambright and colleagues3 for the same patient population over the preceding, 18-year period (1988–2005) and similarly do not significantly differ between groups. Although infection is uncommon in the immediate perioperative period, the ICD-9 codes used refer specifically to infection resulting from surgery and do not represent concomitant infection.
VTEs, which include PEs and DVTs, are rare but potentially life-threatening surgical complications.27,28 Mechanical prophylaxis and chemical prophylaxis have been recommended for major orthopedic surgery, particularly lower extremity surgery, such as total hip arthroplasty (THA) and total knee arthroplasty (TKA).28,29 In the present study, VTE rates were low, 0.30% (RA) and 0.25% (non-RA), and not significantly different in bivariate or multivariate analyses. These rates are comparable to those found in other national-database SA studies.28 VTEs that occur outside the index hospital admission are not captured in this database. Therefore, the rates in the present study may be lower than the true incidence after SA. Mortality secondary to VTE usually occurs within 24 hours but may occur up to 90 days after surgery. DVT rates, on the other hand, are difficult to evaluate because of differences in screening practices.27,28,30,31
That RA patients were more likely than non-RA patients to receive perioperative blood transfusions supports prior findings that SA patients with RA were more likely than SA patients with osteoarthritis (OA) to receive perioperative blood transfusions.8 RA patients have been shown to have high rates of anemia of chronic disease, ranging from 22% to 77%.32 During joint replacement, these patients often require transfusions.32,33 However, these findings differ from prior findings of no differences between RA and non-RA patients in the same patient population during the period 1988–2005.3 This difference may be a product of the constantly changing transfusion guidelines and increased use; transfusion rates increased 140% between 1997 and 2007, making transfusions the fastest growing common procedure in the United States during that time.34 There was no difference between RA and non-RA patients in household income (as determined by ZIP code analysis), number of hospital beds, hospital region, or hospital teaching status. Compared with non-RA patients, RA patients were more likely to be younger, female, and of a difference race and to have a different expected primary payer (P < .001).These findings are consistent with previous findings in the literature.3 In the present SA study, however, RA patients were more likely than non-RA patients to have longer LOS, higher inflation-adjusted hospital charges, and nonroutine discharge. These findings deviate from those of the study covering the preceding 18 years (1988–2005).3 Despite the findings of a changing environment of care for RA patients, by Hambright and colleagues3 and Weiss and colleagues,35 the trend appears to have shifted. Both groups had shorter average LOS than either group from the preceding 18 years.3 Although statistically significant in bivariate analysis, the difference in LOS between the 2 groups differed by an average of 0.11 day (2 hours 24 minutes) and was not clinically relevant.
In addition, the higher charges for patients with RA represent a deviation from the preceding 18 years.3 Other studies have also shown that RA is associated with increased cost in TSA.36 Patients with RA often have rotator cuff pathology, indicating reverse SA may be used more frequently.37,38 The increased implant cost associated with reverse SA may account for the increased costs in RA patients.39 As mentioned, TSA type is not captured in the NIS database. In addition, that RA patients were less likely than non-RA patients to have routine discharge may indicate RA cases are more complex because of their complications.1,5,14,40 A recent study of complications in RA patients (1163 who underwent THA, 2692 who underwent TKA) found that THA patients with RA were significantly more likely than THA patients with OA to dislocate, and TKA patients with RA were significantly more likely than TKA patients with OA to develop an infection after surgery.41 Postoperative dislocation has been shown to increase hospital costs in other orthopedic procedures.42 Also, during TSA, patients with RA are more likely than patients with OA to receive intraoperative blood transfusions.8 These complications—combined with the fact that RA is a chronic, progressive, systemic inflammatory disease that can affect soft tissue and blood vessel wall healing and is associated with medications having potential side effects—could contribute to the apparent increased hospital charges and LOS.3,12,13,43 Factors that include surgeon preference, impact of primary payer, and hospital practice may also affect final charges. Total charges in the NIS database include administrative fees, hospital costs, device-related costs, operating room costs, and ancillary staff costs. Total charges do not include professional fees and differ from the total cost that represents the amount reimbursed by the payer. Charges tend to correlate with but overestimate the total costs.44
This study had several important limitations. As mentioned, only events that occur during the operative admission are captured in the NIS database, and thus postoperative complications or serious adverse events that lead to readmission cannot be identified. In addition, outpatient TSAs are not captured in the NIS database, and thus inclusion of only inpatient procedures yields higher average LOS and total charges.45 Given the limited granularity of ICD-9 coding, this study could not determine RA severity, estimated blood loss, length of surgery, complication severity, type of TSA procedure/prosthesis, or cause of death. Although commonly used to determine comorbidity burden, the modified Charlson index could not be used, and therefore could not be entered as a covariate in multivariate analysis. Furthermore, the NIS database does not include imaging or patient-reported outcomes information, such as improvements in pain or function, which are of crucial importance in considering surgery.
Conclusion
Our findings corroborated findings that the demographics and the perioperative safety profile for TSA were similar for patients with and without RA. The risk for complications or death in the perioperative period was low. Compared with non-RA patients, RA patients had significantly higher charges and longer LOS and were less likely to be discharged home after surgery. The 0.11-day difference in LOS, though statistically significant, was not clinically relevant. These findings differ from those for the preceding, 18-year period (1988–2005). Future research should focus on the causes of these changes.
1. Bohsali KI, Wirth MA, Rockwood CA Jr. Complications of total shoulder arthroplasty. J Bone Joint Surg Am. 2006;88(10):2279-2292.
2. Kim SH, Wise BL, Zhang Y, Szabo RM. Increasing incidence of shoulder arthroplasty in the United States. J Bone Joint Surg Am. 2011;93(24):2249-2254.
3. Hambright D, Henderson RA, Cook C, Worrell T, Moorman CT, Bolognesi MP. A comparison of perioperative outcomes in patients with and without rheumatoid arthritis after receiving a total shoulder replacement arthroplasty. J Shoulder Elbow Surg. 2011;20(1):77-85.
4. van de Sande MA, Brand R, Rozing PM. Indications, complications, and results of shoulder arthroplasty. Scand J Rheumatol. 2006;35(6):426-434.
5. Wirth MA, Rockwood CA Jr. Complications of shoulder arthroplasty. Clin Orthop Relat Res. 1994;(307):47-69.
6. Young AA, Smith MM, Bacle G, Moraga C, Walch G. Early results of reverse shoulder arthroplasty in patients with rheumatoid arthritis. J Bone Joint Surg Am. 2011;93(20):
1915-1923.
7. Sperling JW, Kozak TK, Hanssen AD, Cofield RH. Infection after shoulder arthroplasty. Clin Orthop Relat Res. 2001;(382):206-216.
8. Sperling JW, Duncan SF, Cofield RH, Schleck CD, Harmsen WS. Incidence and risk factors for blood transfusion in shoulder arthroplasty. J Shoulder Elbow Surg. 2005;14(6):599-601.
9. Kumar S, Sperling JW, Haidukewych GH, Cofield RH. Periprosthetic humeral fractures after shoulder arthroplasty. J Bone Joint Surg Am. 2004;86(4):680-689.
10. Sperling JW, Cofield RH. Pulmonary embolism following shoulder arthroplasty. J Bone Joint Surg Am. 2002;84(11):1939-1941.
11. Tanaka E, Saito A, Kamitsuji S, et al. Impact of shoulder, elbow, and knee joint involvement on assessment of rheumatoid arthritis using the American College of Rheumatology core data set. Arthritis Rheum. 2005;53(6):864-871.
12. Nassar J, Cracchiolo A 3rd. Complications in surgery of the foot and ankle in patients with rheumatoid arthritis. Clin Orthop Relat Res. 2001;(391):140-152.
13. den Broeder AA, Creemers MC, Fransen J, et al. Risk factors for surgical site infections and other complications in elective surgery in patients with rheumatoid arthritis with special attention for anti-tumor necrosis factor: a large retrospective study. J Rheumatol. 2007;34(4):689-695.
14. Sanchez-Sotelo J. (i) Shoulder arthroplasty for osteoarthritis and rheumatoid arthritis. Curr Orthop. 2007;21(6):405-414.
15. Agency for Healthcare Research and Quality, Healthcare Cost and Utilization Project (HCUP). Overview of the National (Nationwide) Inpatient Sample (NIS). 2012. http://www.hcup-us.ahrq.gov/nisoverview.jsp. Accessed February 3, 2015.
16. Hervey SL, Purves HR, Guller U, Toth AP, Vail TP, Pietrobon R. Provider volume of total knee arthroplasties and patient outcomes in the HCUP-Nationwide Inpatient Sample. J Bone Joint Surg Am. 2003;85(9):1775-1783.
17. Noskin GA, Rubin RJ, Schentag JJ, et al. The burden of Staphylococcus aureus infections on hospitals in the United States: an analysis of the 2000 and 2001 Nationwide Inpatient Sample database. Arch Intern Med. 2005;165(15):1756-1761.
18. World Health Organization. International Classification of Diseases, Ninth Revision, Clinical Modification (ICD-9-CM). Geneva, Switzerland: World Health Organization; 2008.
19. Cook C, Hawkins R, Aldridge JM 3rd, Tolan S, Krupp R, Bolognesi M. Comparison of perioperative complications in patients with and without rheumatoid arthritis who receive total elbow replacement. J Shoulder Elbow Surg. 2009;18(1):21-26.
20. Goz V, Weinreb JH, McCarthy I, Schwab F, Lafage V, Errico TJ. Perioperative complications and mortality after spinal fusions: analysis of trends and risk factors. Spine. 2013;38(22):1970-1976.
21. Deyo RA, Cherkin DC, Ciol MA. Adapting a clinical comorbidity index for use with ICD-9-CM administrative databases. J Clin Epidemiol. 1992;45(6):613-619.
22. R: a language and environment for statistical computing [computer program]. Vienna, Austria: Foundation for Statistical Computing; 2012.
23. Cuomo F, Greller MJ, Zuckerman JD. The rheumatoid shoulder. Rheum Dis Clin North Am. 1998;24(1):67-82.
24. Kelly IG, Foster RS, Fisher WD. Neer total shoulder replacement in rheumatoid arthritis. J Bone Joint Surg Br. 1987;69(5):723-726.
25. Donigan JA, Frisella WA, Haase D, Dolan L, Wolf B. Pre-operative and intra-operative factors related to shoulder arthroplasty outcomes. Iowa Orthop J. 2009;29:60-66.
26. Deshmukh AV, Koris M, Zurakowski D, Thornhill TS. Total shoulder arthroplasty: long-term survivorship, functional outcome, and quality of life. J Shoulder Elbow Surg. 2005;14(5):471-479.
27. Willis AA, Warren RF, Craig EV, et al. Deep vein thrombosis after reconstructive shoulder arthroplasty: a prospective observational study. J Shoulder Elbow Surg. 2009;18(1):100-106.
28. Jameson SS, James P, Howcroft DW, et al. Venous thromboembolic events are rare after shoulder surgery: analysis of a national database. J Shoulder Elbow Surg. 2011;20(5):
764-770.
29. Falck-Ytter Y, Francis CW, Johanson NA, et al. Prevention of VTE in orthopedic surgery patients: antithrombotic therapy and prevention of thrombosis: American College of Chest Physicians evidence-based clinical practice guidelines. Chest J. 2012;141(2 suppl):e278S-e325S.
30. White CB, Sperling JW, Cofield RH, Rowland CM. Ninety-day mortality after shoulder arthroplasty. J Arthroplasty. 2003;18(7):886-888.
31. Lussana F, Squizzato A, Permunian ET, Cattaneo M. A systematic review on the effect of aspirin in the prevention of post-operative arterial thrombosis in patients undergoing total hip and total knee arthroplasty. Thromb Res. 2014;134(3):599-603.
32. Wilson A, Yu H, Goodnough LT, Nissenson AR. Prevalence and outcomes of anemia in rheumatoid arthritis: a systematic review of the literature. Am J Med. 2004;116(7):50-57.
33. Mercuriali F, Gualtieri G, Sinigaglia L, et al. Use of recombinant human erythropoietin to assist autologous blood donation by anemic rheumatoid arthritis patients undergoing major orthopedic surgery. Transfusion. 1994;34(6):501-506.
34. Shander A, Gross I, Hill S, et al. A new perspective on best transfusion practices. Blood Transfus. 2013;11(2):193-202.
35. Weiss RJ, Ehlin A, Montgomery SM, Wick MC, Stark A, Wretenberg P. Decrease of RA-related orthopaedic surgery of the upper limbs between 1998 and 2004: data from 54,579 Swedish RA inpatients. Rheumatology. 2008;47(4):491-494.
36. Davis DE, Paxton ES, Maltenfort M, Abboud J. Factors affecting hospital charges after total shoulder arthroplasty: an evaluation of the national inpatient sample database.
J Shoulder Elbow Surg. 2014;23(12):1860-1866.
37. Cuff D, Pupello D, Virani N, Levy J, Frankle M. Reverse shoulder arthroplasty for the treatment of rotator cuff deficiency. J Bone Joint Surg Am. 2008;90(6):1244-1251.
38. Rittmeister M, Kerschbaumer F. Grammont reverse total shoulder arthroplasty in patients with rheumatoid arthritis and nonreconstructible rotator cuff lesions. J Shoulder Elbow Surg. 2001;10(1):17-22.
39. Coe MP, Greiwe RM, Joshi R, et al. The cost-effectiveness of reverse total shoulder arthroplasty compared with hemiarthroplasty for rotator cuff tear arthropathy. J Shoulder Elbow Surg. 2012;21(10):1278-1288.
40. Garner RW, Mowat AG, Hazleman BL. Wound healing after operations of patients with rheumatoid arthritis. J Bone Joint Surg Br. 1973;55(1):134-144.
41. Ravi B, Croxford R, Hollands S, et al. Increased risk of complications following total joint arthroplasty in patients with rheumatoid arthritis. Arthritis Rheumatol. 2014;66(2):254-263.
42. Sanchez-Sotelo J, Haidukewych GJ, Boberg CJ. Hospital cost of dislocation after primary total hip arthroplasty. J Bone Joint Surg Am. 2006;88(2):290-294.
43. Ward MM. Decreases in rates of hospitalizations for manifestations of severe rheumatoid arthritis, 1983-2001. Arthritis Rheum. 2004;50(4):1122-1131.
44. Goz V, Weinreb JH, Schwab F, Lafage V, Errico TJ. Comparison of complications, costs, and length of stay of three different lumbar interbody fusion techniques: an analysis of the Nationwide Inpatient Sample database. Spine J. 2014;14(9):2019-2027.
45. Goz V, Errico TJ, Weinreb JH, et al. Vertebroplasty and kyphoplasty: national outcomes and trends in utilization from 2005 through 2010. Spine J. 2015;15(5):959-965.
Shoulder arthroplasty (SA), including total SA (TSA) and reverse TSA, is an effective surgical treatment for fracture and primary or secondary degenerative disease of the shoulder.1 Over the past few decades, use of SA has increased dramatically, from about 5000 cases in 1990 to 7000 in 2000 and more than 26,000 in 2008.1,2
Complications associated with SA generally are classified as perioperative (occurring during the operative index) or long-term (postdischarge).3 Long-term complications include implant loosening, instability, revision, infection, rotator cuff tear, neural injury, and deltoid detachment.1,4,5 Perioperative complications, which are less commonly reported, include intraoperative fracture, infection, neural injury, venous thromboembolic events (VTEs, including pulmonary embolism [PE] and deep vein thrombosis [DVT]), transfusion, and death.3,6-10
SA is an attractive treatment option for patients with rheumatoid arthritis (RA), as the effects of pain on these patients are greater in the shoulder joint than in any other joint.11 Patients with RA pose unique orthopedic surgical challenges, including any combination of decreased bone mineralization, poor capsular tissue integrity, and osteonecrosis.3,12 In addition, RA patients may be taking immunosuppressive medications that have severe side effects, and they may require multiple surgeries.12,13 These factors predispose patients with RA to complications that include infection and wound dehiscence.3,5,12-14
The complex nature of RA has prompted investigators to examine outcome measures in this patient group. Hambright and colleagues3 used the Nationwide Inpatient Sample (NIS) to examine perioperative outcomes in RA patients who underwent TSA between 1988 and 2005.3 They found that TSA patients with RA had shorter and less costly hospital stays and were more likely to have a routine discharge.3 Using the same patient population drawn from the period 2006–2011, we conducted a study to determine if this unexpected trend persists as the number of TSAs and quality of postoperative care continue to increase. Given the potential for anemia of chronic disease and the systemic inflammatory nature of RA, we hypothesized that the perioperative complication profile of RA patients would be worse than that of non-RA patients.
Materials and Methods
NIS data were acquired for the period 2006–2011. The NIS is the largest publicly available all-payer inpatient database, with a random 20% sample of about 1000 US hospitals accounting for 7 to 8 million inpatient stays. The database supplies weights used to estimate national totals, at about 35 million inpatient visits per year. NIS inpatient data are limited to the operative index. Postdischarge information is not available. The NIS is managed by the Healthcare Cost and Utilization Project, which is sponsored by the Agency for Healthcare Research and Quality. The quality of NIS data is assessed and validated by an independent contractor. NIS data have been widely used to examine perioperative outcomes.15-17
NIS data cover patient and hospital demographics, hospital length of stay (LOS), discharge status, payer information, charges, and perioperative outcomes and procedure/diagnosis codes (ICD-9; International Classification of Diseases, Ninth Revision18).
As our Institutional Review Board (IRB) reviewed the database and determined the project was not human subject research, IRB involvement was not required. This study paralleled successful efforts with similar RA and non-RA patients who had shoulder and elbow surgery.3,19 SA patients were identified by ICD-9 procedure code 81.80, but this code does not specify whether the prosthesis was unconstrained, semiconstrained, or constrained. ICD-9 coding also does not specify whether the TSA was traditional or reverse. Patients with RA were identified by ICD-9 diagnosis codes 714.0, 714.1, and 714.2. Patients without one of these codes were placed in the non-RA cohort. Patients with codes associated with pathologic fractures secondary to metastatic cancer or bone malignant neoplasm as a secondary or primary diagnosis and patients who had revision surgery indicated by code 81.83 were excluded, as they have a disproportionately higher comorbidity burden.
After each cohort was defined, demographic data (age, sex, race, income quartile based on ZIP postal code) were compared, as were data on primary payer, hospital demographics, LOS (≤5 days, defined as perioperative index), discharge type, inflation-adjusted charges in 2014 dollars based on the Consumer Price Indexes (http://www.bls.gov/cpi/), and mortality. Perioperative complications—respiratory, gastrointestinal, genitourinary, accidental puncture/laceration, central nervous system, wound dehiscence, device-related (including embolism, fibrosis, hemorrhage, pain, stenosis, or thrombus caused by any device, implant, or graft), cardiac, hematoma/seroma, acute respiratory distress syndrome, postoperative shock, VTE, postoperative infection complications, and intraoperative transfusions—were considered using ICD-9 codes (996.X-999.X and 99.X, respectively).20 Although commonly used to determine perioperative comorbidity burden using ICD-9 coding, the modified Charlson index was not considered because RA is a component of the index and would therefore bias the variable.3,21
Statistical analyses, including χ2 tests and 2-sample t tests, were performed for categorical and continuous variables, respectively. P < .05 was considered significant. Fisher exact test was used for cohorts with fewer than 5 occurrences. Multivariate logistic regression models were then calculated to determine the effect of RA on different outcomes and complications, with age, race, sex, hospital region, hospital type, number of hospital beds, primary payer, and hospital ownership as covariates. Statistical analyses were performed using the R statistical programming language.22
Results
Of the 34,970 patients who underwent SA between 2006 and 2011, 1674 (4.8%) had a diagnosis of RA and 33,296 (95.2%) did not. On average, patients with RA tended to be younger than patients without RA (66.4 vs 69.1 years; P < .001), and a larger percentage of RA patients were female (75.5% vs 54.4%; P < .001). Compared with non-RA patients, RA patients comprised a different ethnic group and had a different expected primary payer (P < .001). SA patients with and without RA did not differ in income quartile based on ZIP code, total number of hospital beds, hospital region, or hospital teaching status (P = .34, .78, .59, and .82, respectively) (Table 1).
LOS was significantly (P < .001) statistically longer for RA patients (2.196 days) than for non-RA patients (2.085 days). RA patients were significantly less likely to be discharged home (63.0% vs 67.6%; P < .001). (Routine discharge was defined as discharge home, whereas nonroutine discharge was defined as discharge to a short-term hospital, skilled nursing facility, intermediate care, another type of facility, home health care, against medical advice, or death.) In addition, inflation-adjusted charges associated with SA were significantly higher (P = .018) for RA patients ($54,284) than for non-RA patients ($52,663) (Table 1).
Regarding the rates of complications that occurred during the perioperative index, there were no significant differences between RA and non-RA cohorts. These complications included respiratory, gastrointestinal, genitourinary, accidental puncture/laceration, central nervous system, wound dehiscence, device-related, cardiac, hematoma/seroma, acute respiratory distress syndrome, postoperative shock, VTE, and postoperative infection (Table 2). In addition, there was no significant difference in mortality between the groups (P = .48).
In TSA, blood transfusions were more likely (P < .001) to be given to RA patients (9.00%) than to non-RA patients (6.16%). Multivariate regression analyses were performed with age, race, sex, hospital region, hospital type, number of hospital beds, primary payer, and hospital ownership as covariates. These analyses revealed that transfusion (P < .001), discharge type (P = .002), total inflation-adjusted charges (P < .001), and LOS (P = .047) remained significant (Table 3).
Discussion
Large national databases like NIS allow study of uncommon medical occurrences and help delineate risks and trends that otherwise might be indeterminable. Although it has been suggested that patients with RA may have poorer long-term outcomes after SA, the perioperative risk profile indicates that TSA is well tolerated in RA patients during the operative index.3,23-25
The data on this study’s 34,970 patients, drawn from the period 2006–2011, demonstrated no significant differences in safety profile with respect to the 14 perioperative complications and outcomes examined, except blood transfusion rate. Rates of postoperative infection (RA, 0.24%; non-RA, 0.14%; P = .303), VTE (RA, 0.30%; non-RA, 0.25%; P = .905), and transfusion (RA, 9.00%; non-RA, 6.16%; P < .001) are of particular interest because of the severity of these situations.
Postoperative infection is a potentially serious complication and often occurs secondary to diabetes, RA, lupus erythematosus, prior surgery, or a nosocomial or remote source.1 The often costly treatment options include antibiotic suppression, irrigation and debridement with implant retention, 1-stage exchange with antibiotic-impregnated cement fixation, staged reimplantation, resection arthroplasty, arthrodesis, and amputation.1 The overall 0.14% infection rate determined in this study is lower than the 0.7% reported for SA patients in the literature.1 Given the nature of the NIS database, this rate underestimates the true postoperative infection rate, as any infection that occurred after the perioperative period is not captured.26 The present study’s perioperative infection rates (RA, 0.24%; non-RA, 0.14%) for the period 2006–2011 are comparable to the rates (RA, 0.17%; non-RA, 0.24%) reported by Hambright and colleagues3 for the same patient population over the preceding, 18-year period (1988–2005) and similarly do not significantly differ between groups. Although infection is uncommon in the immediate perioperative period, the ICD-9 codes used refer specifically to infection resulting from surgery and do not represent concomitant infection.
VTEs, which include PEs and DVTs, are rare but potentially life-threatening surgical complications.27,28 Mechanical prophylaxis and chemical prophylaxis have been recommended for major orthopedic surgery, particularly lower extremity surgery, such as total hip arthroplasty (THA) and total knee arthroplasty (TKA).28,29 In the present study, VTE rates were low, 0.30% (RA) and 0.25% (non-RA), and not significantly different in bivariate or multivariate analyses. These rates are comparable to those found in other national-database SA studies.28 VTEs that occur outside the index hospital admission are not captured in this database. Therefore, the rates in the present study may be lower than the true incidence after SA. Mortality secondary to VTE usually occurs within 24 hours but may occur up to 90 days after surgery. DVT rates, on the other hand, are difficult to evaluate because of differences in screening practices.27,28,30,31
That RA patients were more likely than non-RA patients to receive perioperative blood transfusions supports prior findings that SA patients with RA were more likely than SA patients with osteoarthritis (OA) to receive perioperative blood transfusions.8 RA patients have been shown to have high rates of anemia of chronic disease, ranging from 22% to 77%.32 During joint replacement, these patients often require transfusions.32,33 However, these findings differ from prior findings of no differences between RA and non-RA patients in the same patient population during the period 1988–2005.3 This difference may be a product of the constantly changing transfusion guidelines and increased use; transfusion rates increased 140% between 1997 and 2007, making transfusions the fastest growing common procedure in the United States during that time.34 There was no difference between RA and non-RA patients in household income (as determined by ZIP code analysis), number of hospital beds, hospital region, or hospital teaching status. Compared with non-RA patients, RA patients were more likely to be younger, female, and of a difference race and to have a different expected primary payer (P < .001).These findings are consistent with previous findings in the literature.3 In the present SA study, however, RA patients were more likely than non-RA patients to have longer LOS, higher inflation-adjusted hospital charges, and nonroutine discharge. These findings deviate from those of the study covering the preceding 18 years (1988–2005).3 Despite the findings of a changing environment of care for RA patients, by Hambright and colleagues3 and Weiss and colleagues,35 the trend appears to have shifted. Both groups had shorter average LOS than either group from the preceding 18 years.3 Although statistically significant in bivariate analysis, the difference in LOS between the 2 groups differed by an average of 0.11 day (2 hours 24 minutes) and was not clinically relevant.
In addition, the higher charges for patients with RA represent a deviation from the preceding 18 years.3 Other studies have also shown that RA is associated with increased cost in TSA.36 Patients with RA often have rotator cuff pathology, indicating reverse SA may be used more frequently.37,38 The increased implant cost associated with reverse SA may account for the increased costs in RA patients.39 As mentioned, TSA type is not captured in the NIS database. In addition, that RA patients were less likely than non-RA patients to have routine discharge may indicate RA cases are more complex because of their complications.1,5,14,40 A recent study of complications in RA patients (1163 who underwent THA, 2692 who underwent TKA) found that THA patients with RA were significantly more likely than THA patients with OA to dislocate, and TKA patients with RA were significantly more likely than TKA patients with OA to develop an infection after surgery.41 Postoperative dislocation has been shown to increase hospital costs in other orthopedic procedures.42 Also, during TSA, patients with RA are more likely than patients with OA to receive intraoperative blood transfusions.8 These complications—combined with the fact that RA is a chronic, progressive, systemic inflammatory disease that can affect soft tissue and blood vessel wall healing and is associated with medications having potential side effects—could contribute to the apparent increased hospital charges and LOS.3,12,13,43 Factors that include surgeon preference, impact of primary payer, and hospital practice may also affect final charges. Total charges in the NIS database include administrative fees, hospital costs, device-related costs, operating room costs, and ancillary staff costs. Total charges do not include professional fees and differ from the total cost that represents the amount reimbursed by the payer. Charges tend to correlate with but overestimate the total costs.44
This study had several important limitations. As mentioned, only events that occur during the operative admission are captured in the NIS database, and thus postoperative complications or serious adverse events that lead to readmission cannot be identified. In addition, outpatient TSAs are not captured in the NIS database, and thus inclusion of only inpatient procedures yields higher average LOS and total charges.45 Given the limited granularity of ICD-9 coding, this study could not determine RA severity, estimated blood loss, length of surgery, complication severity, type of TSA procedure/prosthesis, or cause of death. Although commonly used to determine comorbidity burden, the modified Charlson index could not be used, and therefore could not be entered as a covariate in multivariate analysis. Furthermore, the NIS database does not include imaging or patient-reported outcomes information, such as improvements in pain or function, which are of crucial importance in considering surgery.
Conclusion
Our findings corroborated findings that the demographics and the perioperative safety profile for TSA were similar for patients with and without RA. The risk for complications or death in the perioperative period was low. Compared with non-RA patients, RA patients had significantly higher charges and longer LOS and were less likely to be discharged home after surgery. The 0.11-day difference in LOS, though statistically significant, was not clinically relevant. These findings differ from those for the preceding, 18-year period (1988–2005). Future research should focus on the causes of these changes.
1. Bohsali KI, Wirth MA, Rockwood CA Jr. Complications of total shoulder arthroplasty. J Bone Joint Surg Am. 2006;88(10):2279-2292.
2. Kim SH, Wise BL, Zhang Y, Szabo RM. Increasing incidence of shoulder arthroplasty in the United States. J Bone Joint Surg Am. 2011;93(24):2249-2254.
3. Hambright D, Henderson RA, Cook C, Worrell T, Moorman CT, Bolognesi MP. A comparison of perioperative outcomes in patients with and without rheumatoid arthritis after receiving a total shoulder replacement arthroplasty. J Shoulder Elbow Surg. 2011;20(1):77-85.
4. van de Sande MA, Brand R, Rozing PM. Indications, complications, and results of shoulder arthroplasty. Scand J Rheumatol. 2006;35(6):426-434.
5. Wirth MA, Rockwood CA Jr. Complications of shoulder arthroplasty. Clin Orthop Relat Res. 1994;(307):47-69.
6. Young AA, Smith MM, Bacle G, Moraga C, Walch G. Early results of reverse shoulder arthroplasty in patients with rheumatoid arthritis. J Bone Joint Surg Am. 2011;93(20):
1915-1923.
7. Sperling JW, Kozak TK, Hanssen AD, Cofield RH. Infection after shoulder arthroplasty. Clin Orthop Relat Res. 2001;(382):206-216.
8. Sperling JW, Duncan SF, Cofield RH, Schleck CD, Harmsen WS. Incidence and risk factors for blood transfusion in shoulder arthroplasty. J Shoulder Elbow Surg. 2005;14(6):599-601.
9. Kumar S, Sperling JW, Haidukewych GH, Cofield RH. Periprosthetic humeral fractures after shoulder arthroplasty. J Bone Joint Surg Am. 2004;86(4):680-689.
10. Sperling JW, Cofield RH. Pulmonary embolism following shoulder arthroplasty. J Bone Joint Surg Am. 2002;84(11):1939-1941.
11. Tanaka E, Saito A, Kamitsuji S, et al. Impact of shoulder, elbow, and knee joint involvement on assessment of rheumatoid arthritis using the American College of Rheumatology core data set. Arthritis Rheum. 2005;53(6):864-871.
12. Nassar J, Cracchiolo A 3rd. Complications in surgery of the foot and ankle in patients with rheumatoid arthritis. Clin Orthop Relat Res. 2001;(391):140-152.
13. den Broeder AA, Creemers MC, Fransen J, et al. Risk factors for surgical site infections and other complications in elective surgery in patients with rheumatoid arthritis with special attention for anti-tumor necrosis factor: a large retrospective study. J Rheumatol. 2007;34(4):689-695.
14. Sanchez-Sotelo J. (i) Shoulder arthroplasty for osteoarthritis and rheumatoid arthritis. Curr Orthop. 2007;21(6):405-414.
15. Agency for Healthcare Research and Quality, Healthcare Cost and Utilization Project (HCUP). Overview of the National (Nationwide) Inpatient Sample (NIS). 2012. http://www.hcup-us.ahrq.gov/nisoverview.jsp. Accessed February 3, 2015.
16. Hervey SL, Purves HR, Guller U, Toth AP, Vail TP, Pietrobon R. Provider volume of total knee arthroplasties and patient outcomes in the HCUP-Nationwide Inpatient Sample. J Bone Joint Surg Am. 2003;85(9):1775-1783.
17. Noskin GA, Rubin RJ, Schentag JJ, et al. The burden of Staphylococcus aureus infections on hospitals in the United States: an analysis of the 2000 and 2001 Nationwide Inpatient Sample database. Arch Intern Med. 2005;165(15):1756-1761.
18. World Health Organization. International Classification of Diseases, Ninth Revision, Clinical Modification (ICD-9-CM). Geneva, Switzerland: World Health Organization; 2008.
19. Cook C, Hawkins R, Aldridge JM 3rd, Tolan S, Krupp R, Bolognesi M. Comparison of perioperative complications in patients with and without rheumatoid arthritis who receive total elbow replacement. J Shoulder Elbow Surg. 2009;18(1):21-26.
20. Goz V, Weinreb JH, McCarthy I, Schwab F, Lafage V, Errico TJ. Perioperative complications and mortality after spinal fusions: analysis of trends and risk factors. Spine. 2013;38(22):1970-1976.
21. Deyo RA, Cherkin DC, Ciol MA. Adapting a clinical comorbidity index for use with ICD-9-CM administrative databases. J Clin Epidemiol. 1992;45(6):613-619.
22. R: a language and environment for statistical computing [computer program]. Vienna, Austria: Foundation for Statistical Computing; 2012.
23. Cuomo F, Greller MJ, Zuckerman JD. The rheumatoid shoulder. Rheum Dis Clin North Am. 1998;24(1):67-82.
24. Kelly IG, Foster RS, Fisher WD. Neer total shoulder replacement in rheumatoid arthritis. J Bone Joint Surg Br. 1987;69(5):723-726.
25. Donigan JA, Frisella WA, Haase D, Dolan L, Wolf B. Pre-operative and intra-operative factors related to shoulder arthroplasty outcomes. Iowa Orthop J. 2009;29:60-66.
26. Deshmukh AV, Koris M, Zurakowski D, Thornhill TS. Total shoulder arthroplasty: long-term survivorship, functional outcome, and quality of life. J Shoulder Elbow Surg. 2005;14(5):471-479.
27. Willis AA, Warren RF, Craig EV, et al. Deep vein thrombosis after reconstructive shoulder arthroplasty: a prospective observational study. J Shoulder Elbow Surg. 2009;18(1):100-106.
28. Jameson SS, James P, Howcroft DW, et al. Venous thromboembolic events are rare after shoulder surgery: analysis of a national database. J Shoulder Elbow Surg. 2011;20(5):
764-770.
29. Falck-Ytter Y, Francis CW, Johanson NA, et al. Prevention of VTE in orthopedic surgery patients: antithrombotic therapy and prevention of thrombosis: American College of Chest Physicians evidence-based clinical practice guidelines. Chest J. 2012;141(2 suppl):e278S-e325S.
30. White CB, Sperling JW, Cofield RH, Rowland CM. Ninety-day mortality after shoulder arthroplasty. J Arthroplasty. 2003;18(7):886-888.
31. Lussana F, Squizzato A, Permunian ET, Cattaneo M. A systematic review on the effect of aspirin in the prevention of post-operative arterial thrombosis in patients undergoing total hip and total knee arthroplasty. Thromb Res. 2014;134(3):599-603.
32. Wilson A, Yu H, Goodnough LT, Nissenson AR. Prevalence and outcomes of anemia in rheumatoid arthritis: a systematic review of the literature. Am J Med. 2004;116(7):50-57.
33. Mercuriali F, Gualtieri G, Sinigaglia L, et al. Use of recombinant human erythropoietin to assist autologous blood donation by anemic rheumatoid arthritis patients undergoing major orthopedic surgery. Transfusion. 1994;34(6):501-506.
34. Shander A, Gross I, Hill S, et al. A new perspective on best transfusion practices. Blood Transfus. 2013;11(2):193-202.
35. Weiss RJ, Ehlin A, Montgomery SM, Wick MC, Stark A, Wretenberg P. Decrease of RA-related orthopaedic surgery of the upper limbs between 1998 and 2004: data from 54,579 Swedish RA inpatients. Rheumatology. 2008;47(4):491-494.
36. Davis DE, Paxton ES, Maltenfort M, Abboud J. Factors affecting hospital charges after total shoulder arthroplasty: an evaluation of the national inpatient sample database.
J Shoulder Elbow Surg. 2014;23(12):1860-1866.
37. Cuff D, Pupello D, Virani N, Levy J, Frankle M. Reverse shoulder arthroplasty for the treatment of rotator cuff deficiency. J Bone Joint Surg Am. 2008;90(6):1244-1251.
38. Rittmeister M, Kerschbaumer F. Grammont reverse total shoulder arthroplasty in patients with rheumatoid arthritis and nonreconstructible rotator cuff lesions. J Shoulder Elbow Surg. 2001;10(1):17-22.
39. Coe MP, Greiwe RM, Joshi R, et al. The cost-effectiveness of reverse total shoulder arthroplasty compared with hemiarthroplasty for rotator cuff tear arthropathy. J Shoulder Elbow Surg. 2012;21(10):1278-1288.
40. Garner RW, Mowat AG, Hazleman BL. Wound healing after operations of patients with rheumatoid arthritis. J Bone Joint Surg Br. 1973;55(1):134-144.
41. Ravi B, Croxford R, Hollands S, et al. Increased risk of complications following total joint arthroplasty in patients with rheumatoid arthritis. Arthritis Rheumatol. 2014;66(2):254-263.
42. Sanchez-Sotelo J, Haidukewych GJ, Boberg CJ. Hospital cost of dislocation after primary total hip arthroplasty. J Bone Joint Surg Am. 2006;88(2):290-294.
43. Ward MM. Decreases in rates of hospitalizations for manifestations of severe rheumatoid arthritis, 1983-2001. Arthritis Rheum. 2004;50(4):1122-1131.
44. Goz V, Weinreb JH, Schwab F, Lafage V, Errico TJ. Comparison of complications, costs, and length of stay of three different lumbar interbody fusion techniques: an analysis of the Nationwide Inpatient Sample database. Spine J. 2014;14(9):2019-2027.
45. Goz V, Errico TJ, Weinreb JH, et al. Vertebroplasty and kyphoplasty: national outcomes and trends in utilization from 2005 through 2010. Spine J. 2015;15(5):959-965.
Linea Aspera as Rotational Landmark for Tumor Endoprostheses: A Computed Tomography Study
The distal or proximal femur with tumor endoprosthesis is commonly replaced after segmental resections for bone tumors, complex trauma, or revision arthroplasty. In conventional joint replacements, correct rotational alignment of the component is referenced off anatomical landmarks in the proximal or distal femur. After tumor resection, however, these landmarks are often not available for rotational orientation. There are no reports of studies validating a particular method of establishing rotation in these cases.
To establish a guide for rotational alignment of tumor endoprostheses, we set out to define the natural location of the linea aspera (LA) based on axial computed tomography (CT) scans. The LA is often the most outstanding visible bony landmark on a cross-section of the femur during surgery, and it would be helpful to know its normal orientation in relation to the true anteroposterior (AP) axis of the femur and to the femoral version. We wanted to answer these 5 questions:
1. Is the prominence of the LA easily identifiable on cross-section at different levels of the femoral shaft?
2. Does an axis passing through the LA correspond to the AP axis of the femur?
3. If not, is this axis offset internally or externally and by how much?
4. Is this offset constant at all levels of the femoral shaft?
5. How does the LA axis relate to the femoral neck axis at these levels?
The answers determine if the LA can be reliably used for rotational alignment of tumor endoprostheses.
Materials and Methods
After this study received Institutional Review Board approval, we retrospectively reviewed whole-body fluorine-18-deoxyglucose (FDG) positron emission tomography–computed tomography (PET-CT) studies performed in our hospital between 2003 and 2006 to identify those with full-length bilateral femur CT scans. These scans were available on the hospital’s computerized picture archiving system (General Electric). Patients could be included in the study as long as they were at least 18 years old at time of scan and did not have any pathology that deformed the femur, broke a cortex, or otherwise caused any gross asymmetry of the femur. Of the 72 patients with full-length femur CT scans, 3 were excluded: 1 with a congenital hip dysplasia, 1 with an old, malunited femoral fracture, and 1 who was 15 years old at time of scan.
Axial Slice Selection
For each patient, scout AP films were used to measure femoral shaft length from the top of the greater trochanter to the end of the lateral femoral condyle. The levels of the proximal third, midshaft, and distal third were then calculated based on this length. The LA was studied on the axial slices nearest these levels. Next, we scrolled through the scans to identify an axial slice that best showed the femoral neck axis. The literature on CT measurement of femoral anteversion is varied. Some articles describe a technique that uses 2 superimposed axial slices, and others describe a single axial slice.1-3 We used 1 axial slice to draw the femoral neck axis because our computer software could not superimpose 2 images on 1 screen and because the CT scans were not made under specific protocols to measure anteversion but rather were part of a cancer staging work-up. Axial cuts were made at 5-mm intervals, and not all scans included a single slice capturing the head, neck, and greater trochanter. Therefore, we used a (previously described) method in which the femoral neck axis is drawn on a slice that most captured the femoral neck, usually toward its base.4 Last, in order to draw the posterior condyle (PC) axis, we selected an axial slice that showed the posterior-most aspects of the femoral condyles at the intercondylar notch.
Determining Anteroposterior and Posterior Condyle Axes of Femur
As we made all measurements for each femur off a single CT scan, we were able to use a straight horizontal line—drawn on-screen with a software tool—as a reference for measuring rotation. On a distal femur cut, the PC axis is drawn by connecting the posterior-most points of both condyles. The software calculates the angle formed—the PC angle (Figure 1). This angle, the degree to which the PC axis deviates from a straight horizontal line on-screen, can be used to account for gross rotation of the limb on comparison of images. The AP axis of the femur is the axis perpendicular to the PC axis. As such, the PC angle can also be used to determine degree of deviation of the AP axis from a straight vertical line on-screen. The AP axis was used when calculating the LA axis at the various levels of the femur (Figure 2).
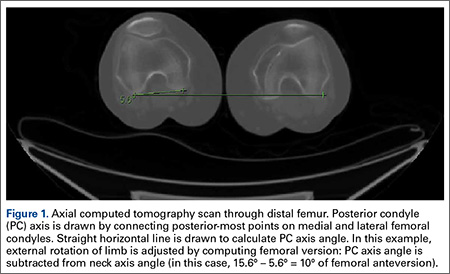
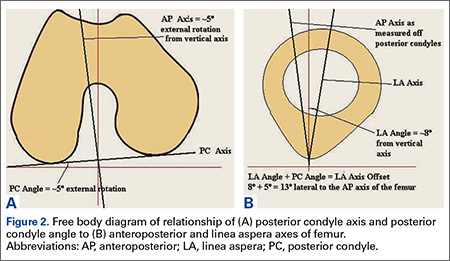
Femoral Version
We used the software tool to draw the femoral neck axis. From the end of this line, a straight horizontal line is drawn on-screen (Figure 3). The software calculates the angle formed—the femoral neck axis angle. We assigned a positive value for a femoral head that pointed anteriorly on the image and a negative value for a head that pointed posteriorly. Adjusting for external rotation of the limb involved calculating the femoral version by subtracting the PC angle from the neck axis angle; adjusting for internal rotation involved adding these 2 angles.
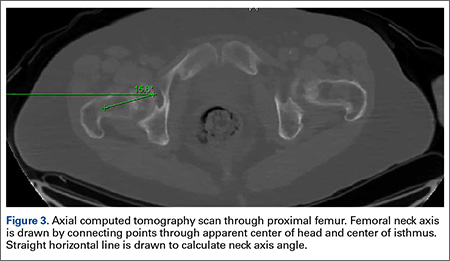
Linea Aspera Morphology
After viewing the first 20 CT scans, we identified 3 types of LA morphology. Type I presents as a thickening on the posterior cortex with a sharp apex; type II presents as a flat-faced but distinct ridge of bone between the medial and lateral lips; and in type III there is no distinct cortical thickening with blunted medial and lateral lips; the latter is always more prominent.
Linea Aspera Axis Offset
From the most posterior point of the LA, a line drawn forward bisecting the femoral canal defined the LA axis. In type I morphology, the posterior-most point was the apex; in type II, the middle of flat posterior surface was used as the starting point; in type III, the lateral lip was used, as it was sharper than the medial lip. This line is again referenced with a straight horizontal line across the image. The PC angle is then added to account for limb rotation, and the result is the LA angle. As the AP axis is perpendicular to the PC axis, the LA angle is subtracted from 90°; the difference represents the amount of offset of the LA axis from the AP axis. By convention, we assigned this a positive value for an LA lateral to the midpoint of the femur and a negative value for an LA medial to the midpoint (Figure 4).
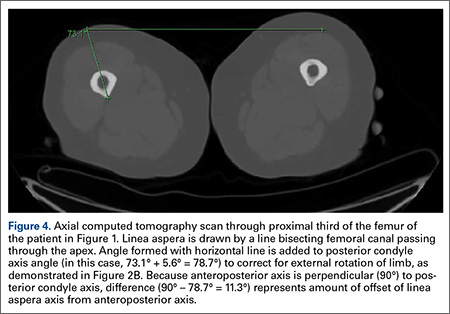
Linea Aspera Axis and Femoral Neck Axis
The angle between the LA axis and the PC axis was measured. The femoral version angle was subtracted from that angle to obtain the arc between the LA axis and the femoral neck axis.
Statistical Analyses
All analyses were performed with SAS 9.1 (SAS Institute). All tests were 2-sided and conducted at the .05 significance level. No adjustments were made for multiple testing. Statistical analysis was performed with nonparametric tests and without making assumptions about the distribution of the study population. Univariate analyses were performed to test for significant side-to-side differences in femoral length, femoral version angle, and LA torsion angles at each level. A multivariate analysis was performed to test for interactions between sex, side, and level. In all analyses, P < .05 was used as the cutoff value for statistical significance.
Results
Femoral lengths varied by side and sex. The left side was longer than the right by a mean of 1.3 mm (P = .008). With multivariate analysis taking into account sex and age (cumulated per decade), there was still a significant effect of side on femoral length. Sex also had a significant effect on femoral length, with females’ femurs shorter by 21.7 mm (standard error, 5.0 mm). Mean (SD) anteversion of the femoral neck was 7.9° (12.7°) on the left and 13.3° (13.0°) on the right; the difference between sides was significant (P < .001). In a multivariate analysis performed to identify potential predictors of femoral version, side still had a significant (P < .001) independent effect; sex and age did not have an effect.
LA morphology varied according to femoral shaft level (Table 1). The morphology was type I in 75% of patients at the distal femur and 74% of patients at the midshaft femur, while only 53% of patients had a type I morphology at the proximal femur. The proportion of type III morphology was larger in the proximal femur (41%) than in the other locations.
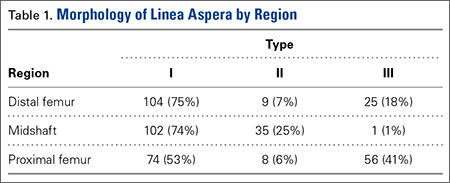
The LA axis of the femur did not correspond exactly to the AP axis at all femoral levels. At the distal femur, mean (SD) lateral offset of the LA axis was 5.5° (7.5°) on the left and 8.3° (8.9°) on the right. At the midshaft, mean (SD) medial offset of the LA axis was 3.1° (8.4°) on the left and 1.2° (7.9°) on the right. At the proximal femur, mean (SD) lateral offset of the LA axis was 5.4° (9.2°) on the left and 6.2° (8.3°) on the right. The side-to-side differences were statistically significant for the distal femur and midshaft but not the proximal femur. Table 2 lists the 95% confidence intervals for the mean values. As the range of differences was small (0.7°-2.8°), and the differences may not be clinically detected on gross inspection during surgery, we pooled both sides’ values to arrive at a single mean for each level. The LA axis was offset a mean (SD) of 6.9° (8.3°) laterally at the distal femur, 2.2° (8.2°) medially at the midshaft, and 5.8° (8.6°) laterally at the proximal femur. Figure 5 shows the frequency of distribution of LA axis offset.Offset of the LA axis from the AP axis of the femur was significantly (P < .001) different for each femoral level, even when a multivariate analysis was performed to determine the effect of sex, age, or side. Age and sex had no significant effect on mean offset of LA axis from AP axis.
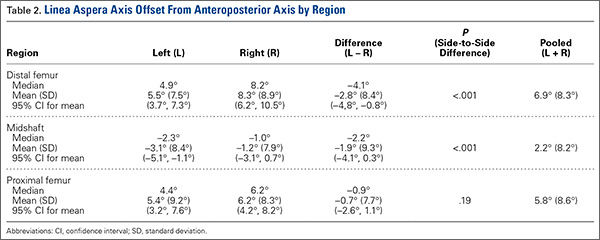
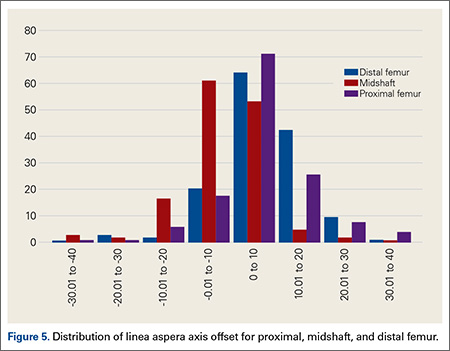
We compared the mean arc between femoral neck axis and LA axis after referencing both off the PC axis. At the distal femur, mean (SD) arc between these 2 axes was 76.6° (13.1°) on the left and 68.3° (13.6°) on the right (mean difference, 8.3°); at the midshaft, mean (SD) arc was 85.2° (13.5°) on the left and 77.9° (13.1°) on the right (mean difference, 7.4°); at the proximal femur, mean (SD) arc was 76.7° (11.9°) on the left and 70.5° (12.8°) on the right (mean difference, 6.2°). The side-to-side differences were statistically significant (P < .001) for all locations.
In multivariate analysis, sex and age did not have an effect on mean arc between the 2 axes. Side and femoral level, however, had a significant effect (P < .001).
Discussion
In total hip arthroplasty, the goal is to restore femoral anteversion, usually referenced to the remaining femoral neck segment.3 In total knee arthroplasty (TKA), proper rotation preserves normal patellofemoral tracking.5 Various landmarks are used, such as the PCs or the epicondyles. After tumor resections, these landmarks are often lost.6 However, there are no reports of studies validating a particular method of achieving proper rotational orientation of tumor endoprostheses, though several methods are being used. One method involves inserting 2 drill bits before osteotomy—one proximal to the intended level of resection on the anterior femur, and the other on the anterior tibial shaft. The straight line formed can establish a plane of rotation (and length), which the surgeon must aim to restore when the components are placed. This method is useful for distal femur resections but not proximal femur resections. Another method, based on the LA’s anatomical position on the posterior aspect of the femur,4 uses the prominence of the LA to align the prosthesis. With this method, the LA is assumed to be directly posterior (6 o’clock) on the femur. However, this assumption has not been confirmed by any study. A third method, described by Heck and Carnesale,5 involves marking the anterior aspect of the femur after resection and aligning the components to it. The authors cautioned against using the LA as a landmark, saying that its course is highly variable.
The LA is a narrow, elevated length of bone, with medial and lateral lips, that serves as an attachment site for muscles in the posterior thigh. Proximally, the LA presents with lateral, medial, and intermediate lips. In the midshaft, it is often elevated by an underlying bony ridge or pilaster complex. Distally, it diverges into 2 ridges that form the triangular popliteal surface.1,7 For the LA to be a reliable landmark, first it must be clearly identifiable on viewing a femoral cross-section. The LA that presents with type I or II morphology is distinctly identifiable, and an axis from its apex and bisecting the canal can easily be constructed. In our study, the LA presented with type I or II morphology in 82% of distal femoral sections and 99% of midshaft femoral sections. Therefore, the LA is a conspicuous landmark at these levels. In the proximal femur, 59% had type I or II morphology. Type III morphology could be identified on cross-sections by the persisting prominence of the lateral lip. However, it may be difficult to appreciate the LA with this morphology at surgery.
Once the LA is identified, its normal cross-sectional position must be defined. One way to do this is to establish the relationship of its axis (LA axis) to the true AP axis. Based on mean values, the LA axis is laterally offset 7º at the distal third of the femur, medially offset 2º at the midshaft, and laterally offset 6º at the proximal third. Therefore, for ideal placement with the LA used for orientation, the component must be internally rotated 7º relative to the LA for femoral resection at the distal third, externally rotated 2º for resection at the midshaft, and internally rotated 6º for resection at the proximal third. Studies have demonstrated that joint contact forces and mechanical alignment of the lower limb can be altered with as little as 5º of femoral malrotation.8,9 Although such a small degree of malrotation is often asymptomatic, it can have long-term effects on soft-tissue tension and patellar tracking.10,11 Rotating-platform mobile-bearing TKA designs can compensate for femoral malrotation, but they may have little to no effect on patellar tracking.12 Therefore, we think aligning the components as near as possible to their natural orientation can prove beneficial in long-term patient management.
Another way of defining the normal cross-sectional position of the LA is to relate it to the femoral neck axis. We measured the difference between these 2 axes. Mean differences were 72º (distal femur), 81.5º (midshaft), and 73.5º (proximal third). Mean arc differences at all levels were larger on the left side—a reflection of the femoral neck being less anteverted on that side in our measurements. Standard deviations were smaller for measurements of LA axis offset from AP axis (range, 7.5°-9.2°) than for measurements of arc between LA axis and femoral neck axis (range, 11.9°-13.6°). This finding indicates there is less variation in the former method, making it preferable for defining the cross-sectional position of the LA.
It has been said that the course of the LA is variable, and our data provide confirmation. The LA does not lie directly posterior (6 o’clock), and it does not trace a straight longitudinal course along the posterior femur, as demonstrated by the different LA axis offsets at 3 levels. However, we may still use it as a landmark if we remain aware how much the LA is offset from the AP axis at each femoral level. Figures 6A-6D, which show CT scans of a patient who underwent distal femoral resection and replacement with an endoprosthesis, illustrate how the LA axis was measured before surgery and how proper prosthesis placement was confirmed after surgery.
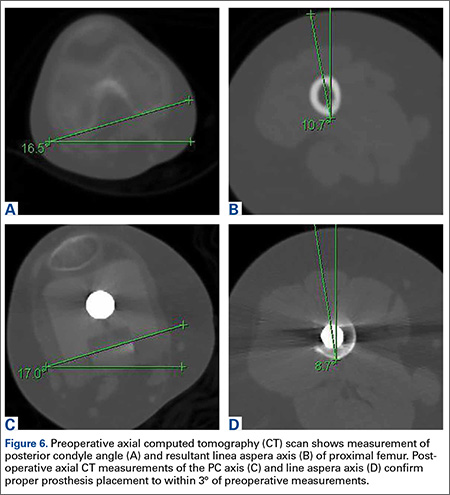
In hip arthroplasty, restoration of normal femoral version is the reference for endoprosthetic placement. The literature on “normal” femoral anteversion varies with the method used. In a review of studies on CT-measured adult femoral version, reported values ranged from 6.3° to 40°.2 Mean femoral version in our study ranged from 8° to 13°. Orthopedics textbooks generally put the value at 10° to 15º, and this seems to be the range that surgeons target.6 However, we found a statistically significant mean side-to-side difference of 5.4°. This finding is possibly explained by our large sample—it was larger than the samples used in other studies of CT-measured femoral version. Other studies have found mean side-to-side differences of up to 4.0º.5 Another explanation for our finding is that the studies may differ methodologically. The studies that established values for femoral anteversion were based on CT protocols—thinner slices (1-5 mm), use of foot holders to standardize limb rotation, use of 2 axial cuts in proximal femur to establish femoral neck axis2,13—designed specifically for this measurement. As the CT scans reviewed in our study are not designed for this purpose, errors in femoral version measurement may have been introduced, which may also explain why there is larger variation in measurements of the arc between the LA axis and the femoral neck axis.
Conclusion
The LA does not lie directly on the posterior surface of the femur. It deviates 6.9° laterally at the distal femur, 2.2° medially at the midshaft, and 6.9° laterally at the proximal third. As the LA is an easily identifiable structure on cross-sections of the femoral shaft at the midshaft and distal third of the femur, it may be useful as a rotational landmark for resections at these levels if these deviations are considered during tumor endoprosthetic replacements.
1. Desai SC, Willson S. Radiology of the linea aspera. Australas Radiol. 1985;29(3):273-274.
2. Kuo TY, Skedros JG, Bloebaum RD. Measurement of femoral anteversion by biplane radiography and computed tomography imaging: comparison with an anatomic reference. Invest Radiol. 2003;38(4):221-229.
3. Wines AP, McNicol D. Computed tomography measurement of the accuracy of component version in total hip arthroplasty. J Arthroplasty. 2006;21(5):696-701.
4. Gray H. Anatomy of the Human Body. Philadelphia, PA: Lea & Febiger; 1918.
5. Heck RK, Carnesale PG. General principles of tumors. In: Canale ST, ed. Campbell’s Operative Orthopaedics. Vol 1. 10th ed. St. Louis, MO: Mosby; 2003:733-791.
6. Katz, MA, Beck TD, Silber JS, Seldes RM, Lotke PA. Determining femoral rotational alignment in total knee arthroplasty: reliability of techniques. J Arthroplasty. 2001;16(3):301-305.
7. Pitt MJ. Radiology of the femoral linea aspera–pilaster complex: the track sign. Radiology. 1982;142(1):66.
8. Bretin P, O’Loughlin PF, Suero EM, et al. Influence of femoral malrotation on knee joint alignment and intra-articular contact pressures. Arch Orthop Trauma Surg. 2011;131(8):1115-1120.
9. Zihlmann MS, Stacoff A, Romero J, Quervain IK, Stüssi E. Biomechanical background and clinical observations of rotational malalignment in TKA: literature review and consequences. Clin Biomech. 2005;20(7):661-668.
10. Ghosh KM, Merican AM, Iranpour F, Deehan DJ, Amis AA. The effect of femoral component rotation on the extensor retinaculum of the knee. J Orthop Res. 2010;28(9):1136-1141.
11. Verlinden C, Uvin P, Labey L, Luyckx JP, Bellemans J, Vandenneucker H. The influence of malrotation of the femoral component in total knee replacement on the mechanics of patellofemoral contact during gait: an in vitro biomechanical study. J Bone Joint Surg Br. 2010;92(5):737-742.
12. Kessler O, Patil S, Colwell CW Jr, D’Lima DD. The effect of femoral component malrotation on patellar biomechanics. J Biomech. 2008;41(16):3332-3339.
13. Strecker W, Keppler P, Gebhard F, Kinzl L. Length and torsion of the lower limb. J Bone Joint Surg Br. 1997;79(6):1019-1023.
The distal or proximal femur with tumor endoprosthesis is commonly replaced after segmental resections for bone tumors, complex trauma, or revision arthroplasty. In conventional joint replacements, correct rotational alignment of the component is referenced off anatomical landmarks in the proximal or distal femur. After tumor resection, however, these landmarks are often not available for rotational orientation. There are no reports of studies validating a particular method of establishing rotation in these cases.
To establish a guide for rotational alignment of tumor endoprostheses, we set out to define the natural location of the linea aspera (LA) based on axial computed tomography (CT) scans. The LA is often the most outstanding visible bony landmark on a cross-section of the femur during surgery, and it would be helpful to know its normal orientation in relation to the true anteroposterior (AP) axis of the femur and to the femoral version. We wanted to answer these 5 questions:
1. Is the prominence of the LA easily identifiable on cross-section at different levels of the femoral shaft?
2. Does an axis passing through the LA correspond to the AP axis of the femur?
3. If not, is this axis offset internally or externally and by how much?
4. Is this offset constant at all levels of the femoral shaft?
5. How does the LA axis relate to the femoral neck axis at these levels?
The answers determine if the LA can be reliably used for rotational alignment of tumor endoprostheses.
Materials and Methods
After this study received Institutional Review Board approval, we retrospectively reviewed whole-body fluorine-18-deoxyglucose (FDG) positron emission tomography–computed tomography (PET-CT) studies performed in our hospital between 2003 and 2006 to identify those with full-length bilateral femur CT scans. These scans were available on the hospital’s computerized picture archiving system (General Electric). Patients could be included in the study as long as they were at least 18 years old at time of scan and did not have any pathology that deformed the femur, broke a cortex, or otherwise caused any gross asymmetry of the femur. Of the 72 patients with full-length femur CT scans, 3 were excluded: 1 with a congenital hip dysplasia, 1 with an old, malunited femoral fracture, and 1 who was 15 years old at time of scan.
Axial Slice Selection
For each patient, scout AP films were used to measure femoral shaft length from the top of the greater trochanter to the end of the lateral femoral condyle. The levels of the proximal third, midshaft, and distal third were then calculated based on this length. The LA was studied on the axial slices nearest these levels. Next, we scrolled through the scans to identify an axial slice that best showed the femoral neck axis. The literature on CT measurement of femoral anteversion is varied. Some articles describe a technique that uses 2 superimposed axial slices, and others describe a single axial slice.1-3 We used 1 axial slice to draw the femoral neck axis because our computer software could not superimpose 2 images on 1 screen and because the CT scans were not made under specific protocols to measure anteversion but rather were part of a cancer staging work-up. Axial cuts were made at 5-mm intervals, and not all scans included a single slice capturing the head, neck, and greater trochanter. Therefore, we used a (previously described) method in which the femoral neck axis is drawn on a slice that most captured the femoral neck, usually toward its base.4 Last, in order to draw the posterior condyle (PC) axis, we selected an axial slice that showed the posterior-most aspects of the femoral condyles at the intercondylar notch.
Determining Anteroposterior and Posterior Condyle Axes of Femur
As we made all measurements for each femur off a single CT scan, we were able to use a straight horizontal line—drawn on-screen with a software tool—as a reference for measuring rotation. On a distal femur cut, the PC axis is drawn by connecting the posterior-most points of both condyles. The software calculates the angle formed—the PC angle (Figure 1). This angle, the degree to which the PC axis deviates from a straight horizontal line on-screen, can be used to account for gross rotation of the limb on comparison of images. The AP axis of the femur is the axis perpendicular to the PC axis. As such, the PC angle can also be used to determine degree of deviation of the AP axis from a straight vertical line on-screen. The AP axis was used when calculating the LA axis at the various levels of the femur (Figure 2).
Femoral Version
We used the software tool to draw the femoral neck axis. From the end of this line, a straight horizontal line is drawn on-screen (Figure 3). The software calculates the angle formed—the femoral neck axis angle. We assigned a positive value for a femoral head that pointed anteriorly on the image and a negative value for a head that pointed posteriorly. Adjusting for external rotation of the limb involved calculating the femoral version by subtracting the PC angle from the neck axis angle; adjusting for internal rotation involved adding these 2 angles.
Linea Aspera Morphology
After viewing the first 20 CT scans, we identified 3 types of LA morphology. Type I presents as a thickening on the posterior cortex with a sharp apex; type II presents as a flat-faced but distinct ridge of bone between the medial and lateral lips; and in type III there is no distinct cortical thickening with blunted medial and lateral lips; the latter is always more prominent.
Linea Aspera Axis Offset
From the most posterior point of the LA, a line drawn forward bisecting the femoral canal defined the LA axis. In type I morphology, the posterior-most point was the apex; in type II, the middle of flat posterior surface was used as the starting point; in type III, the lateral lip was used, as it was sharper than the medial lip. This line is again referenced with a straight horizontal line across the image. The PC angle is then added to account for limb rotation, and the result is the LA angle. As the AP axis is perpendicular to the PC axis, the LA angle is subtracted from 90°; the difference represents the amount of offset of the LA axis from the AP axis. By convention, we assigned this a positive value for an LA lateral to the midpoint of the femur and a negative value for an LA medial to the midpoint (Figure 4).
Linea Aspera Axis and Femoral Neck Axis
The angle between the LA axis and the PC axis was measured. The femoral version angle was subtracted from that angle to obtain the arc between the LA axis and the femoral neck axis.
Statistical Analyses
All analyses were performed with SAS 9.1 (SAS Institute). All tests were 2-sided and conducted at the .05 significance level. No adjustments were made for multiple testing. Statistical analysis was performed with nonparametric tests and without making assumptions about the distribution of the study population. Univariate analyses were performed to test for significant side-to-side differences in femoral length, femoral version angle, and LA torsion angles at each level. A multivariate analysis was performed to test for interactions between sex, side, and level. In all analyses, P < .05 was used as the cutoff value for statistical significance.
Results
Femoral lengths varied by side and sex. The left side was longer than the right by a mean of 1.3 mm (P = .008). With multivariate analysis taking into account sex and age (cumulated per decade), there was still a significant effect of side on femoral length. Sex also had a significant effect on femoral length, with females’ femurs shorter by 21.7 mm (standard error, 5.0 mm). Mean (SD) anteversion of the femoral neck was 7.9° (12.7°) on the left and 13.3° (13.0°) on the right; the difference between sides was significant (P < .001). In a multivariate analysis performed to identify potential predictors of femoral version, side still had a significant (P < .001) independent effect; sex and age did not have an effect.
LA morphology varied according to femoral shaft level (Table 1). The morphology was type I in 75% of patients at the distal femur and 74% of patients at the midshaft femur, while only 53% of patients had a type I morphology at the proximal femur. The proportion of type III morphology was larger in the proximal femur (41%) than in the other locations.
The LA axis of the femur did not correspond exactly to the AP axis at all femoral levels. At the distal femur, mean (SD) lateral offset of the LA axis was 5.5° (7.5°) on the left and 8.3° (8.9°) on the right. At the midshaft, mean (SD) medial offset of the LA axis was 3.1° (8.4°) on the left and 1.2° (7.9°) on the right. At the proximal femur, mean (SD) lateral offset of the LA axis was 5.4° (9.2°) on the left and 6.2° (8.3°) on the right. The side-to-side differences were statistically significant for the distal femur and midshaft but not the proximal femur. Table 2 lists the 95% confidence intervals for the mean values. As the range of differences was small (0.7°-2.8°), and the differences may not be clinically detected on gross inspection during surgery, we pooled both sides’ values to arrive at a single mean for each level. The LA axis was offset a mean (SD) of 6.9° (8.3°) laterally at the distal femur, 2.2° (8.2°) medially at the midshaft, and 5.8° (8.6°) laterally at the proximal femur. Figure 5 shows the frequency of distribution of LA axis offset.Offset of the LA axis from the AP axis of the femur was significantly (P < .001) different for each femoral level, even when a multivariate analysis was performed to determine the effect of sex, age, or side. Age and sex had no significant effect on mean offset of LA axis from AP axis.
We compared the mean arc between femoral neck axis and LA axis after referencing both off the PC axis. At the distal femur, mean (SD) arc between these 2 axes was 76.6° (13.1°) on the left and 68.3° (13.6°) on the right (mean difference, 8.3°); at the midshaft, mean (SD) arc was 85.2° (13.5°) on the left and 77.9° (13.1°) on the right (mean difference, 7.4°); at the proximal femur, mean (SD) arc was 76.7° (11.9°) on the left and 70.5° (12.8°) on the right (mean difference, 6.2°). The side-to-side differences were statistically significant (P < .001) for all locations.
In multivariate analysis, sex and age did not have an effect on mean arc between the 2 axes. Side and femoral level, however, had a significant effect (P < .001).
Discussion
In total hip arthroplasty, the goal is to restore femoral anteversion, usually referenced to the remaining femoral neck segment.3 In total knee arthroplasty (TKA), proper rotation preserves normal patellofemoral tracking.5 Various landmarks are used, such as the PCs or the epicondyles. After tumor resections, these landmarks are often lost.6 However, there are no reports of studies validating a particular method of achieving proper rotational orientation of tumor endoprostheses, though several methods are being used. One method involves inserting 2 drill bits before osteotomy—one proximal to the intended level of resection on the anterior femur, and the other on the anterior tibial shaft. The straight line formed can establish a plane of rotation (and length), which the surgeon must aim to restore when the components are placed. This method is useful for distal femur resections but not proximal femur resections. Another method, based on the LA’s anatomical position on the posterior aspect of the femur,4 uses the prominence of the LA to align the prosthesis. With this method, the LA is assumed to be directly posterior (6 o’clock) on the femur. However, this assumption has not been confirmed by any study. A third method, described by Heck and Carnesale,5 involves marking the anterior aspect of the femur after resection and aligning the components to it. The authors cautioned against using the LA as a landmark, saying that its course is highly variable.
The LA is a narrow, elevated length of bone, with medial and lateral lips, that serves as an attachment site for muscles in the posterior thigh. Proximally, the LA presents with lateral, medial, and intermediate lips. In the midshaft, it is often elevated by an underlying bony ridge or pilaster complex. Distally, it diverges into 2 ridges that form the triangular popliteal surface.1,7 For the LA to be a reliable landmark, first it must be clearly identifiable on viewing a femoral cross-section. The LA that presents with type I or II morphology is distinctly identifiable, and an axis from its apex and bisecting the canal can easily be constructed. In our study, the LA presented with type I or II morphology in 82% of distal femoral sections and 99% of midshaft femoral sections. Therefore, the LA is a conspicuous landmark at these levels. In the proximal femur, 59% had type I or II morphology. Type III morphology could be identified on cross-sections by the persisting prominence of the lateral lip. However, it may be difficult to appreciate the LA with this morphology at surgery.
Once the LA is identified, its normal cross-sectional position must be defined. One way to do this is to establish the relationship of its axis (LA axis) to the true AP axis. Based on mean values, the LA axis is laterally offset 7º at the distal third of the femur, medially offset 2º at the midshaft, and laterally offset 6º at the proximal third. Therefore, for ideal placement with the LA used for orientation, the component must be internally rotated 7º relative to the LA for femoral resection at the distal third, externally rotated 2º for resection at the midshaft, and internally rotated 6º for resection at the proximal third. Studies have demonstrated that joint contact forces and mechanical alignment of the lower limb can be altered with as little as 5º of femoral malrotation.8,9 Although such a small degree of malrotation is often asymptomatic, it can have long-term effects on soft-tissue tension and patellar tracking.10,11 Rotating-platform mobile-bearing TKA designs can compensate for femoral malrotation, but they may have little to no effect on patellar tracking.12 Therefore, we think aligning the components as near as possible to their natural orientation can prove beneficial in long-term patient management.
Another way of defining the normal cross-sectional position of the LA is to relate it to the femoral neck axis. We measured the difference between these 2 axes. Mean differences were 72º (distal femur), 81.5º (midshaft), and 73.5º (proximal third). Mean arc differences at all levels were larger on the left side—a reflection of the femoral neck being less anteverted on that side in our measurements. Standard deviations were smaller for measurements of LA axis offset from AP axis (range, 7.5°-9.2°) than for measurements of arc between LA axis and femoral neck axis (range, 11.9°-13.6°). This finding indicates there is less variation in the former method, making it preferable for defining the cross-sectional position of the LA.
It has been said that the course of the LA is variable, and our data provide confirmation. The LA does not lie directly posterior (6 o’clock), and it does not trace a straight longitudinal course along the posterior femur, as demonstrated by the different LA axis offsets at 3 levels. However, we may still use it as a landmark if we remain aware how much the LA is offset from the AP axis at each femoral level. Figures 6A-6D, which show CT scans of a patient who underwent distal femoral resection and replacement with an endoprosthesis, illustrate how the LA axis was measured before surgery and how proper prosthesis placement was confirmed after surgery.
In hip arthroplasty, restoration of normal femoral version is the reference for endoprosthetic placement. The literature on “normal” femoral anteversion varies with the method used. In a review of studies on CT-measured adult femoral version, reported values ranged from 6.3° to 40°.2 Mean femoral version in our study ranged from 8° to 13°. Orthopedics textbooks generally put the value at 10° to 15º, and this seems to be the range that surgeons target.6 However, we found a statistically significant mean side-to-side difference of 5.4°. This finding is possibly explained by our large sample—it was larger than the samples used in other studies of CT-measured femoral version. Other studies have found mean side-to-side differences of up to 4.0º.5 Another explanation for our finding is that the studies may differ methodologically. The studies that established values for femoral anteversion were based on CT protocols—thinner slices (1-5 mm), use of foot holders to standardize limb rotation, use of 2 axial cuts in proximal femur to establish femoral neck axis2,13—designed specifically for this measurement. As the CT scans reviewed in our study are not designed for this purpose, errors in femoral version measurement may have been introduced, which may also explain why there is larger variation in measurements of the arc between the LA axis and the femoral neck axis.
Conclusion
The LA does not lie directly on the posterior surface of the femur. It deviates 6.9° laterally at the distal femur, 2.2° medially at the midshaft, and 6.9° laterally at the proximal third. As the LA is an easily identifiable structure on cross-sections of the femoral shaft at the midshaft and distal third of the femur, it may be useful as a rotational landmark for resections at these levels if these deviations are considered during tumor endoprosthetic replacements.
1. Desai SC, Willson S. Radiology of the linea aspera. Australas Radiol. 1985;29(3):273-274.
2. Kuo TY, Skedros JG, Bloebaum RD. Measurement of femoral anteversion by biplane radiography and computed tomography imaging: comparison with an anatomic reference. Invest Radiol. 2003;38(4):221-229.
3. Wines AP, McNicol D. Computed tomography measurement of the accuracy of component version in total hip arthroplasty. J Arthroplasty. 2006;21(5):696-701.
4. Gray H. Anatomy of the Human Body. Philadelphia, PA: Lea & Febiger; 1918.
5. Heck RK, Carnesale PG. General principles of tumors. In: Canale ST, ed. Campbell’s Operative Orthopaedics. Vol 1. 10th ed. St. Louis, MO: Mosby; 2003:733-791.
6. Katz, MA, Beck TD, Silber JS, Seldes RM, Lotke PA. Determining femoral rotational alignment in total knee arthroplasty: reliability of techniques. J Arthroplasty. 2001;16(3):301-305.
7. Pitt MJ. Radiology of the femoral linea aspera–pilaster complex: the track sign. Radiology. 1982;142(1):66.
8. Bretin P, O’Loughlin PF, Suero EM, et al. Influence of femoral malrotation on knee joint alignment and intra-articular contact pressures. Arch Orthop Trauma Surg. 2011;131(8):1115-1120.
9. Zihlmann MS, Stacoff A, Romero J, Quervain IK, Stüssi E. Biomechanical background and clinical observations of rotational malalignment in TKA: literature review and consequences. Clin Biomech. 2005;20(7):661-668.
10. Ghosh KM, Merican AM, Iranpour F, Deehan DJ, Amis AA. The effect of femoral component rotation on the extensor retinaculum of the knee. J Orthop Res. 2010;28(9):1136-1141.
11. Verlinden C, Uvin P, Labey L, Luyckx JP, Bellemans J, Vandenneucker H. The influence of malrotation of the femoral component in total knee replacement on the mechanics of patellofemoral contact during gait: an in vitro biomechanical study. J Bone Joint Surg Br. 2010;92(5):737-742.
12. Kessler O, Patil S, Colwell CW Jr, D’Lima DD. The effect of femoral component malrotation on patellar biomechanics. J Biomech. 2008;41(16):3332-3339.
13. Strecker W, Keppler P, Gebhard F, Kinzl L. Length and torsion of the lower limb. J Bone Joint Surg Br. 1997;79(6):1019-1023.
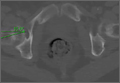
Strangulation of Radial Nerve Within Nondisplaced Fracture Component of Humeral Shaft Fracture
A radial nerve injury in association with a humeral shaft fracture is not an infrequent occurrence.1,2 The nerve injury typically is thought to be a neurapraxia caused by a contusion, as spontaneous recovery rates range from 70% to 90%.2-4 In cases in which acute nerve exploration and open reduction and internal fixation (ORIF) are not indicated, patient and clinician wait months for the nerve to recover. In some conservatively treated cases, the nerve is lacerated or entrapped. Patients with a lacerated or entrapped nerve may have better outcomes with early operative management.
We report on a rare case of the radial nerve entrapped within a nondisplaced segment of a closed humeral shaft fracture and describe the clinical outcome of early operative management. The patient provided written informed consent for print and electronic publication of this case report.
Case Report
An intoxicated, restrained 18-year-old driver in a motor vehicle collision sustained multiple injuries, including rib fracture, apical pneumothorax with pulmonary contusion, and corneal abrasion. Orthopedic injuries included right subtrochanteric femur fracture and midshaft right humeral shaft fracture (Figure 1).
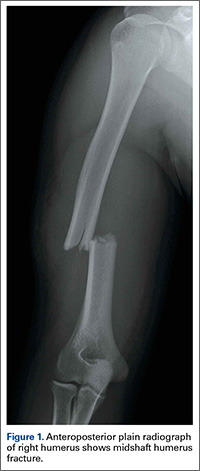
Initial orthopedic evaluation of the right arm revealed decreased sensation in the radial nerve distribution. Motor function in the radial nerve was absent; the patient was incapable of active wrist extension or finger extension. Median and ulnar nerves were motor- and sensory-intact. Radiographs showed a displaced transverse midshaft humeral shaft fracture with a minimally displaced vertical fracture line extending from the fracture site about 3 cm into the proximal segment. The patient was placed in a coaptation splint. The femur fracture was treated with an antegrade piriformis entry intramedullary nail.
ORIF of the humerus was performed to facilitate mobilization of this polytrauma patient. He was positioned prone on a flat-top table with his right arm over a radiolucent extension. The arm was abducted at the shoulder and the elbow flexed. A posterior midline skin incision was made to reflect the triceps in a lateral-to-medial direction, facilitating dissection of the lateral brachial cutaneous nerve on the lateral aspect of the triceps, with resultant localization of the radial nerve. At that time, the radial nerve was noted to be entrapped in the fracture site (Figure 2). In the proximal segment was a sagittal split, displaced about 1 mm, and it was in this interval the nerve was held. This sagittal fracture appeared incomplete as it was followed more proximally. A unicortical Kirschner wire was placed in a posterior-to-anterior direction in each fragment alongside the nerve. A lamina spreader engaged the wires and distracted the fracture site as the tines were spread apart, releasing the nerve (Figure 3). The nerve was in continuity but was severely contused at that location. After the sagittal split was reduced, two 2.7-mm lag screws were used in lag fashion, and the transverse midshaft component was fixed with a 10-hole, 4.5-mm narrow locking compression plate. The radial nerve lay on the posterior aspect of the plate, between holes 4 and 5 (Figures 4, 5). The wound was closed, and the patient was made weight-bearing as tolerated in the right upper extremity. He was sent to occupational therapy, and static and dynamic splints were made for his wrist and hand.
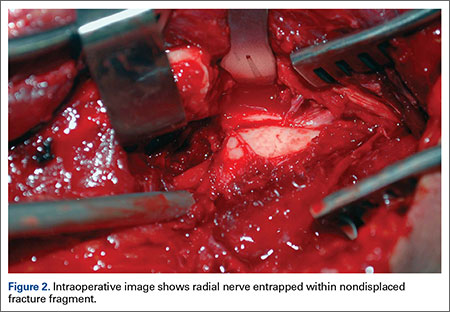
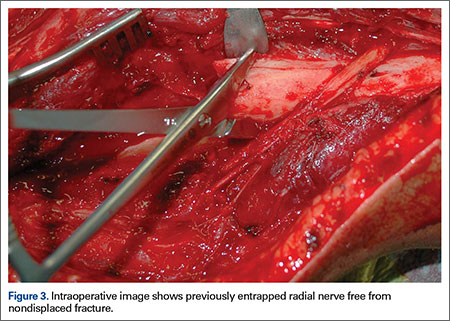
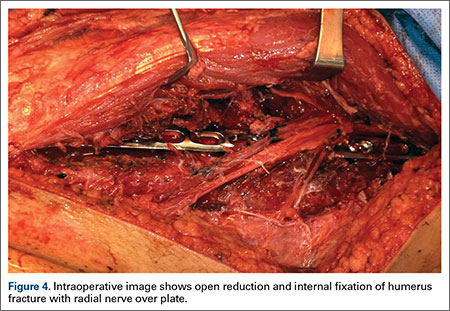
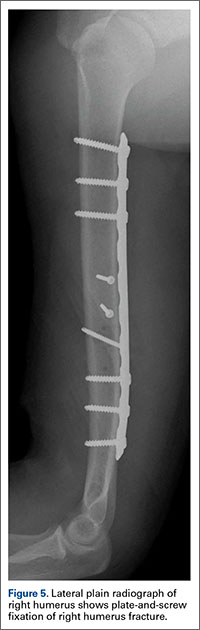
Two months after injury, radial nerve examination findings were unchanged: decreased sensation on dorsum of hand and no motor function. At 3 months, electrodiagnostic testing showed neurophysiologic evidence of severe right radial neuropathy proximal to the innervation of the right brachioradialis. There were electrodiagnostic signs of ongoing axonal loss and no signs of ongoing reinnervation. At 4 months, only motor strength in wrist extension was improved (2/5). At 5 months, the patient had 4–/5 wrist extension, 3/5 metacarpophalangeal (MCP) extension of fingers, and 0/5 MCP/interphalangeal extension of thumb. Sensation in the radial nerve distribution was still decreased. At 7 months, strength in wrist extension and finger MCP extension was 4+/5. The fracture was now well healed, with maintained alignment and no changes in hardware appearance.
Discussion
In most cases, closed treatment of a humeral shaft fracture with an associated radial nerve injury has a successful outcome.5 The etiology of the neurapraxia likely is nerve contusion after the fracture. A neurapraxia is by definition a temporary injury to the myelin sheath with an intact nerve; the nerve function recovers rapidly.
Some humeral shaft fractures, however, have been associated with radial nerve injuries more severe than contusions, resulting in axonotmesis or neurotmesis. These more severe injuries make up 10% to 30% of humeral shaft fractures, including those with a frank laceration of the nerve and those with an entrapped nerve.2,3 Shao and colleagues2 reported a 90% recovery rate for patients who delayed extrication of the entrapped radial nerve. Although there is no consensus on timing of surgical exploration, motor and sensory function of the nerve is temporally related, which may indicate that earlier diagnosis and treatment lead to improved outcome.6,7 Loss of radial nerve function can have devastating effects on upper extremity function. Often, patients lose all or some extension of the wrist and fingers and abduction and extension of the thumb.
In a standard history or physical examination, there are no particular features indicating nerve entrapment. Absolute indications for humeral shaft fractures with radial palsy are limited to open fractures, vascular injuries, and unacceptable fracture alignment. Relative indications are polytrauma and secondary palsy after attempted fracture reduction. For all other humeral shaft fractures with radial nerve palsy, observation is still the mainstay of treatment, with spontaneous recovery occurring in up to 90% of patients.2,8-12 Our patient did not have an absolute indication for operative treatment; surgery was nevertheless performed to address the polytrauma and to facilitate earlier mobilization.
Electromyelogram (EMG) studies typically are not useful after acute injury. EMG studies are better used serially to evaluate reinnervation after the acute phase. Bodner and colleagues13,14 used ultrasonography to identify the radial nerve in a patient with unimproved radial nerve palsy 6 weeks after humeral shaft fracture. They found the nerve within the fracture site, whereas magnetic resonance imaging (MRI) could not follow its course. Neither ultrasonography nor MRI would likely be used after acute injury. More research is needed to improve evaluation of patients with continued palsy after nonoperative treatment.
In the case of our patient’s humeral shaft fracture, surgery was performed early because of polytrauma and radial nerve entrapment. If left interposed between 2 fracture fragments, the nerve would have been subjected to continued ischemia and likely would not have recovered spontaneously. Ikeda and Osamura7 reported on a case of radial nerve palsy that occurred after humerus shaft fracture. The nerve, entrapped between fracture fragments, was explored later, after function failed to return. As it was found within callus, the nerve was cut and then repaired end-to-end. In our patient’s case, early exploration led to release of the radial nerve from the fracture site—preventing irreversible nerve damage and allowing for spontaneous recovery over subsequent months.
Surgery for polytrauma patients with a humeral shaft fracture and radial nerve palsy may also be beneficial with respect to early nerve exploration and early mobilization. Although our patient’s fracture was well aligned and as an isolated injury would not have required surgery, the polytrauma called for early surgical management, which revealed radial nerve entrapment and led to early recovery of nerve function.
1. Ekholm R, Adami J, Tidermark J, Hansson K, Törnkvist H, Ponzer S. Fractures of the shaft of the humerus. An epidemiological study of 401 fractures. J Bone Joint Surg Br. 2006;88(11):1469-1473.
2. Shao YC, Harwood P, Grotz MR, Limb D, Giannoudis PV. Radial nerve palsy associated with fractures of the shaft of the humerus: a systematic review. J Bone Joint Surg Br. 2005;87(12):1647-1652.
3. Shah JJ, Bhatti NA. Radial nerve paralysis associated with fractures of the humerus. A review of 62 cases. Clin Orthop Relat Res. 1983;(172):171-176.
4. Ring D, Chin K, Jupiter JB. Radial nerve palsy associated with high-energy humeral shaft fractures. J Hand Surg. 2004;29(1):144-147.
5. Sarmiento A, Zagorski JB, Zych GA, Latta LL, Capps CA. Functional bracing for the treatment of fractures of the humeral diaphysis. J Bone Joint Surg Am. 2000;82(4):478-486.
6. Hugon S, Daubresse F, Depierreux L. Radial nerve entrapment in a humeral fracture callus. Acta Orthop Belg. 2008;74(1):118-121.
7. Ikeda K, Osamura N. The radial nerve palsy caused by embedding in the humeral shaft fracture—a case report. Hand Surg. 2014;19(1):91-93.
8. Green DP, Hotchkiss RN, Pederson WC, Wolfe SW, eds. Green’s Operative Hand Surgery. 2 vols. 5th ed. Philadelphia, PA: Elsevier/Churchill Livingstone; 2005.
9. Kettelkamp DB, Alexander H. Clinical review of radial nerve injury. J Trauma. 1967;7(3):424-432.
10. Pollock FH, Drake D, Bovill EG, Day L, Trafton PG. Treatment of radial neuropathy associated with fractures of the humerus. J Bone Joint Surg Am. 1981;63(2):239-243.
11. Li Y, Ning G, Wu Q, Wu Q, Li Y, Feng S. Review of literature of radial nerve injuries associated with humeral fractures—an integrated management strategy. PloS One. 2013;8(11):e78576.
12. DeFranco MJ, Lawton JN. Radial nerve injuries associated with humeral fractures. J Hand Surg. 2006;31(4):655-663.
13. Bodner G, Huber B, Schwabegger A, Lutz M, Waldenberger P. Sonographic detection of radial nerve entrapment within a humerus fracture. J Ultrasound Med. 1999;18(10):703-706.
14. Bodner G, Buchberger W, Schocke M, et al. Radial nerve palsy associated with humeral shaft fracture: evaluation with US—initial experience. Radiology. 2001;219(3):811-816.
A radial nerve injury in association with a humeral shaft fracture is not an infrequent occurrence.1,2 The nerve injury typically is thought to be a neurapraxia caused by a contusion, as spontaneous recovery rates range from 70% to 90%.2-4 In cases in which acute nerve exploration and open reduction and internal fixation (ORIF) are not indicated, patient and clinician wait months for the nerve to recover. In some conservatively treated cases, the nerve is lacerated or entrapped. Patients with a lacerated or entrapped nerve may have better outcomes with early operative management.
We report on a rare case of the radial nerve entrapped within a nondisplaced segment of a closed humeral shaft fracture and describe the clinical outcome of early operative management. The patient provided written informed consent for print and electronic publication of this case report.
Case Report
An intoxicated, restrained 18-year-old driver in a motor vehicle collision sustained multiple injuries, including rib fracture, apical pneumothorax with pulmonary contusion, and corneal abrasion. Orthopedic injuries included right subtrochanteric femur fracture and midshaft right humeral shaft fracture (Figure 1).
Initial orthopedic evaluation of the right arm revealed decreased sensation in the radial nerve distribution. Motor function in the radial nerve was absent; the patient was incapable of active wrist extension or finger extension. Median and ulnar nerves were motor- and sensory-intact. Radiographs showed a displaced transverse midshaft humeral shaft fracture with a minimally displaced vertical fracture line extending from the fracture site about 3 cm into the proximal segment. The patient was placed in a coaptation splint. The femur fracture was treated with an antegrade piriformis entry intramedullary nail.
ORIF of the humerus was performed to facilitate mobilization of this polytrauma patient. He was positioned prone on a flat-top table with his right arm over a radiolucent extension. The arm was abducted at the shoulder and the elbow flexed. A posterior midline skin incision was made to reflect the triceps in a lateral-to-medial direction, facilitating dissection of the lateral brachial cutaneous nerve on the lateral aspect of the triceps, with resultant localization of the radial nerve. At that time, the radial nerve was noted to be entrapped in the fracture site (Figure 2). In the proximal segment was a sagittal split, displaced about 1 mm, and it was in this interval the nerve was held. This sagittal fracture appeared incomplete as it was followed more proximally. A unicortical Kirschner wire was placed in a posterior-to-anterior direction in each fragment alongside the nerve. A lamina spreader engaged the wires and distracted the fracture site as the tines were spread apart, releasing the nerve (Figure 3). The nerve was in continuity but was severely contused at that location. After the sagittal split was reduced, two 2.7-mm lag screws were used in lag fashion, and the transverse midshaft component was fixed with a 10-hole, 4.5-mm narrow locking compression plate. The radial nerve lay on the posterior aspect of the plate, between holes 4 and 5 (Figures 4, 5). The wound was closed, and the patient was made weight-bearing as tolerated in the right upper extremity. He was sent to occupational therapy, and static and dynamic splints were made for his wrist and hand.
Two months after injury, radial nerve examination findings were unchanged: decreased sensation on dorsum of hand and no motor function. At 3 months, electrodiagnostic testing showed neurophysiologic evidence of severe right radial neuropathy proximal to the innervation of the right brachioradialis. There were electrodiagnostic signs of ongoing axonal loss and no signs of ongoing reinnervation. At 4 months, only motor strength in wrist extension was improved (2/5). At 5 months, the patient had 4–/5 wrist extension, 3/5 metacarpophalangeal (MCP) extension of fingers, and 0/5 MCP/interphalangeal extension of thumb. Sensation in the radial nerve distribution was still decreased. At 7 months, strength in wrist extension and finger MCP extension was 4+/5. The fracture was now well healed, with maintained alignment and no changes in hardware appearance.
Discussion
In most cases, closed treatment of a humeral shaft fracture with an associated radial nerve injury has a successful outcome.5 The etiology of the neurapraxia likely is nerve contusion after the fracture. A neurapraxia is by definition a temporary injury to the myelin sheath with an intact nerve; the nerve function recovers rapidly.
Some humeral shaft fractures, however, have been associated with radial nerve injuries more severe than contusions, resulting in axonotmesis or neurotmesis. These more severe injuries make up 10% to 30% of humeral shaft fractures, including those with a frank laceration of the nerve and those with an entrapped nerve.2,3 Shao and colleagues2 reported a 90% recovery rate for patients who delayed extrication of the entrapped radial nerve. Although there is no consensus on timing of surgical exploration, motor and sensory function of the nerve is temporally related, which may indicate that earlier diagnosis and treatment lead to improved outcome.6,7 Loss of radial nerve function can have devastating effects on upper extremity function. Often, patients lose all or some extension of the wrist and fingers and abduction and extension of the thumb.
In a standard history or physical examination, there are no particular features indicating nerve entrapment. Absolute indications for humeral shaft fractures with radial palsy are limited to open fractures, vascular injuries, and unacceptable fracture alignment. Relative indications are polytrauma and secondary palsy after attempted fracture reduction. For all other humeral shaft fractures with radial nerve palsy, observation is still the mainstay of treatment, with spontaneous recovery occurring in up to 90% of patients.2,8-12 Our patient did not have an absolute indication for operative treatment; surgery was nevertheless performed to address the polytrauma and to facilitate earlier mobilization.
Electromyelogram (EMG) studies typically are not useful after acute injury. EMG studies are better used serially to evaluate reinnervation after the acute phase. Bodner and colleagues13,14 used ultrasonography to identify the radial nerve in a patient with unimproved radial nerve palsy 6 weeks after humeral shaft fracture. They found the nerve within the fracture site, whereas magnetic resonance imaging (MRI) could not follow its course. Neither ultrasonography nor MRI would likely be used after acute injury. More research is needed to improve evaluation of patients with continued palsy after nonoperative treatment.
In the case of our patient’s humeral shaft fracture, surgery was performed early because of polytrauma and radial nerve entrapment. If left interposed between 2 fracture fragments, the nerve would have been subjected to continued ischemia and likely would not have recovered spontaneously. Ikeda and Osamura7 reported on a case of radial nerve palsy that occurred after humerus shaft fracture. The nerve, entrapped between fracture fragments, was explored later, after function failed to return. As it was found within callus, the nerve was cut and then repaired end-to-end. In our patient’s case, early exploration led to release of the radial nerve from the fracture site—preventing irreversible nerve damage and allowing for spontaneous recovery over subsequent months.
Surgery for polytrauma patients with a humeral shaft fracture and radial nerve palsy may also be beneficial with respect to early nerve exploration and early mobilization. Although our patient’s fracture was well aligned and as an isolated injury would not have required surgery, the polytrauma called for early surgical management, which revealed radial nerve entrapment and led to early recovery of nerve function.
1. Ekholm R, Adami J, Tidermark J, Hansson K, Törnkvist H, Ponzer S. Fractures of the shaft of the humerus. An epidemiological study of 401 fractures. J Bone Joint Surg Br. 2006;88(11):1469-1473.
2. Shao YC, Harwood P, Grotz MR, Limb D, Giannoudis PV. Radial nerve palsy associated with fractures of the shaft of the humerus: a systematic review. J Bone Joint Surg Br. 2005;87(12):1647-1652.
3. Shah JJ, Bhatti NA. Radial nerve paralysis associated with fractures of the humerus. A review of 62 cases. Clin Orthop Relat Res. 1983;(172):171-176.
4. Ring D, Chin K, Jupiter JB. Radial nerve palsy associated with high-energy humeral shaft fractures. J Hand Surg. 2004;29(1):144-147.
5. Sarmiento A, Zagorski JB, Zych GA, Latta LL, Capps CA. Functional bracing for the treatment of fractures of the humeral diaphysis. J Bone Joint Surg Am. 2000;82(4):478-486.
6. Hugon S, Daubresse F, Depierreux L. Radial nerve entrapment in a humeral fracture callus. Acta Orthop Belg. 2008;74(1):118-121.
7. Ikeda K, Osamura N. The radial nerve palsy caused by embedding in the humeral shaft fracture—a case report. Hand Surg. 2014;19(1):91-93.
8. Green DP, Hotchkiss RN, Pederson WC, Wolfe SW, eds. Green’s Operative Hand Surgery. 2 vols. 5th ed. Philadelphia, PA: Elsevier/Churchill Livingstone; 2005.
9. Kettelkamp DB, Alexander H. Clinical review of radial nerve injury. J Trauma. 1967;7(3):424-432.
10. Pollock FH, Drake D, Bovill EG, Day L, Trafton PG. Treatment of radial neuropathy associated with fractures of the humerus. J Bone Joint Surg Am. 1981;63(2):239-243.
11. Li Y, Ning G, Wu Q, Wu Q, Li Y, Feng S. Review of literature of radial nerve injuries associated with humeral fractures—an integrated management strategy. PloS One. 2013;8(11):e78576.
12. DeFranco MJ, Lawton JN. Radial nerve injuries associated with humeral fractures. J Hand Surg. 2006;31(4):655-663.
13. Bodner G, Huber B, Schwabegger A, Lutz M, Waldenberger P. Sonographic detection of radial nerve entrapment within a humerus fracture. J Ultrasound Med. 1999;18(10):703-706.
14. Bodner G, Buchberger W, Schocke M, et al. Radial nerve palsy associated with humeral shaft fracture: evaluation with US—initial experience. Radiology. 2001;219(3):811-816.

The Effect of Orthopedic Advertising and Self-Promotion on a Naïve Population
In 1975, the American Medical Association (AMA) lifted the professional ban on physician advertising after a successful Federal Trade Commission suit.1 Since then, there has been a marked increase in the number of physicians marketing themselves directly to patients and consumers. With the pervasive nature of the Internet, never before has it been so easy and inexpensive to effectively communicate with a targeted population of people and influence their behavior. Few would dispute the role of advertising on consumer choices when used to sell products and services, change behavior, and educate consumers across all types of industries and professions. Thus, it is reasonable to hypothesize that the nature and content of a surgeon’s web presence could significantly affect patients’ decision-making and their impression of the orthopedic surgery profession.
There is a lack of consensus among physician organizations regarding physician advertising. For example, the American Association of Physicians and Surgeons (AAPS) takes an ethical stand on physician self-promotion. Their position states “The physician should not solicit patients. Professional reputation is the major source of patient referrals. The physician should be circumspect and restrained in dealing with the communication media, always avoiding self-aggrandizement.2” In contrast, the AMA has a less defined stance on physician self-promotion. With the exception of conflicts of interest and privacy guidelines, the AMA has few recommendations regarding the content of physician websites. The organization’s position states “There are no restrictions on advertising by physicians except those that can be specifically justified to protect the public from deceptive practices. …Nothing in this opinion is intended to discourage or to limit advertising and representations which are not false or deceptive.3” This guideline emphasizes accuracy of health-related information, but does not limit physician self-promotion or self-aggrandizement. The American Academy of Orthopaedic Surgeons (AAOS) holds a similar position. In their position statement on advertising by orthopedic surgeons, they encourage advertising and competition as “ethical and acceptable” as long as they are representing services in a “clear and accurate manner.”4 Furthermore, the AAOS also states that “An orthopaedic surgeon shall not use photographs, images, endorsements and/or statements in a false or misleading manner that communicate a degree of relief, safety, effectiveness, or benefits from orthopaedic care that are not representative of results attained by that orthopaedic surgeon.”4 The surgeon is responsible for his/her advertising materials and the content and claims therein, and is generally policed by peers through a complaint process with the AAOS.
Notably, up to 75% of Americans use the Internet for health-related information and this number is likely to increase.5Patients who utilize the Internet must choose from a vast array of search results for medical information from credible resources. Which sources are to be believed and relied upon? This depends on the health literacy among the general population. Inadequate health literacy is defined as “limited ability to obtain, process, and understand basic health information and services needed to make appropriate health decisions and follow instructions for treatment.”6 Patients have different levels of health literacy often unknown to even the most well-intentioned healthcare professional. It is often difficult to provide appropriate and meaningful information at a level that is most beneficial to the patient. It is estimated that 89 million people in the US have insufficient health literacy to understand treatments or preventive care.7 Certainly, with this information in mind, the orthopedic surgeon must consider his/her audience, and the potential for a fiduciary responsibility when preparing Internet content.
A tangible example of marketing results is the increasing popularity of robotic surgery over the last decade.8 Hospitals routinely advertise the availability of robotic surgery at their institution through various means, including roadside billboards. Despite limited evidence supporting a benefit of robotic surgery beyond less expensive conventional laparoscopic surgery, patients are increasingly seeking robotic surgery.8 With society’s increasing infatuation with technology, this is likely based on the presumption that robotic surgery is better and safer than conventional methods. It is likely that marketing pressure is at least partly responsible for the widespread adoption of robotic-assisted surgery and words used in marketing highlighting novelty have an important influence on patient preference.8
Orthopedic surgery, with its large proportion of elective surgeries, offers a unique venue to study differences in patient perceptions. Preoperative evaluations in orthopedics are often performed after an assessment of a surgeon’s reputation, which offers the patient an ability to choose their surgeon within their community.
We pondered how different promotional styles would affect potential patients’ perceptions. Would people believe that a self-promoting physician was more competent? Could fellow doctors “see through” the self-promotion of their peers? Based on the premise that advertising and self-promotion are undertaken because they are effective, we hypothesized that nonphysician patients perceive self-promoting orthopedic surgeons more favorably compared to members of the medical community.
Although numerous anonymous physician review sites exist, our analysis focused on surgeon self-promotion through personal websites or web pages. Within these sources, there exists a wide array of information and methods that physicians utilize to present themselves. Some physicians merely post their educational background and qualifications. This appears most often when the physician is associated with an academic institution and their profile is part of an institution’s website. Others post extensive self-promoting statements about technical skill and innovations in clinical practice. They sometimes include information regarding charity donations, level of community involvement, and practice philosophy.
Materials and Methods
Categorization of Surgeon Websites and Ratings
Surgeon websites were selected from the 5 largest population centers in the United States. Analysis was undertaken to categorize the self-promotion content of each selected website using an objective scale to quantitatively assess the number of times that physicians referred to themselves in a positive manner. A thorough search of the literature did not reveal any validated questionnaire or assessment tool usable for this purpose. Five blinded raters were asked to count the number of positive self-directed remarks made by the author of each website. Websites were ranked based on the number of such statements. No rater was exposed to any styling or graphical information from any website. Only textual statements were used for the purposes of this study. All statements were printed on paper and evaluated without the use of a computer to prevent any searching or contamination of the subject or rater pool.
Websites were considered as self-promoting (using language that promotes the physician beyond the use of basic facts), or non-self-promoting(presenting little beyond basic biographical information) based on the presence of many (more than 5) or few (less than 5) self-promoting statements. The breakpoint of 5 self-promoting statements served to highlight a clear transition between the 2 general types of websites and provided a good demarcation between self-promoters and non-self-promoters. This distinction allowed for the choosing of contrasting websites, which could directly probe the question in our hypothesis about the effect of such websites on naïve or surgeon-peer respondents.
Each website was judged independently by 5 blinded raters. Inter-rater reliability scores were then calculated using Fleiss’ Kappa to assess reliability of the categorization of self-promoter or non-self-promoter. This value was calculated to be k = .80, 95% confidence interval (0.58-1.01), which is suggestive of a “substantial level of agreement.”9 Websites categorized as non-self-promoting contained a mean number of self-promoting statements of less than 2 (0-1.8) as judged by the 5 raters. By contrast, websites categorized as self-promoting had a mean number of self-promoting statements of 6.4 or higher (6.4-22.6). When the self-promoting websites and the non-self-promoting websites were compared, they were significantly different in the number of self-promoting statements t (43) = 7.90, P < .001, with self-promoting websites having significantly more self-promoting statements than non-self-promoting websites.
Surveys and Respondents
Next, a survey of 10 questions of interest was developed. A thorough literature search revealed no validated measure or survey to measure the effects of surgeon or physician self-promotion. We developed a 10-question survey to prove the impressions and allow for assessment of differences between respondent groups to measure the effect of promotion. The questions (see Appendix for survey questions) included a forced Likert rating system. Each response occurs and is presented on a scale from 0 to 3 (0 = Strongly Disagree, 1 = Disagree, 2 = Agree, and 3 = Strongly Agree).
Respondents were true volunteers recruited from 2 groups that were termed “surgeon-peers” and “naïve subjects.” Surgeon-peers were board-certified orthopedic surgeons (N = 21, all with medical doctorates). Demographic breakdown of the surgeon-peers revealed them to be reflective of the general population of orthopedic surgeons (71.4% male, 28.6% female, 90.2% Caucasian, 4.8% African American, and 4.8% Asian, all with professional degrees). Naïve subjects (N = 24, average age 41 years) were selected based on the criterion of having no affiliation with a healthcare system and no history of interaction with an orthopedic surgery or surgery in general. The demographic breakdown of naïve subjects was 45.8% male, 54.2% female, 79.1% Caucasian, 16.7% African American, and 4.2% Asian. Half of the naïve respondents had a Bachelor’s degree, 17% had a Master’s degree, 4% had a professional degree, and 29% had a high school diploma. No volunteer, in either group, received any form of inducement or reward for participation so as not to skew any responses in favor of physicians.
All participants were asked to read each surgeon’s statements and then complete a survey for each statement. Volunteers were not informed of a surgeon’s calculated level of self-promotion, and they were presented the survey questions in random order. Survey completion required unreimbursed time of approximately 1 to 2 hours.
Statistical Methods
The data compiled was then analyzed with SAS/STAT Software (SAS Institute Inc.) and a LR Type III analysis using the GENMOD procedure. The method of analysis and presentation of data focuses on the relationship between respondents perceptions between the surgeon-peer and naïve subject groups. The P values presented are the significance of the testing of interactions comparing the difference between surgeon-peers and naïve subjects, and the differences in their responses to each question for self-promoters and non-self-promoters. Surgeon-peers answer questions differently based on their assessment of a self-promoter or non-self-promoter website. It is this difference that is compared to the analogous difference for naïve subjects and statistically evaluated. The LR statistic for type III analysis tests if the differences are significantly different, ie, if the difference between the 2 subject groups is statistically significant. All statistical methods were performed by a qualified statistician who helped guide the design of this study.
Results
Each respondent was asked if they were aware that misinformation about doctors exists on the Internet. Half of the naïve subjects affirmed awareness of this whereas the other half were unaware. All surgeon-peers were aware of the presence of misinformation regarding physicians on the Internet.
The results of the comparisons are shown in the Table. The columns show the average response to each question for self-promoters and non-self-promoters grouped by either surgeon-peer or naïve subject. In judging the overall accuracy of statements made on the Internet, naïve subjects found no difference between self-promoters and non-self-promoters, whereas surgeon-peers judged the difference to be large and significant in favor of non-self-promoting surgeons. Surgeon-peers generally rated non-self-promoters with significantly more positive Likert scores, indicating improved “competence”, “excellence”, and “better quality of care” when compared to naïve respondents (Table). The direction and magnitude of the difference was also striking, with the naïve respondents favoring self-promoters on all of these questions. This held true for the choice of orthopedic surgeon, where naïve responders favored self-promoters and surgeon-peers favored non-self-promoters. Moreover, naïve subjects believed that self-promoters would be significantly more likely to help them in the event of a complication, whereas surgeon-peers believed the opposite. Even when the direction of difference was the same in both groups, statistically significant differences in the responses were evident, as was the case when respondents were asked “Did the surgeon inflate his/her technical skills?” or “Did the author of this statement seem arrogant?” Both groups favored self-promoters for these questions, but the differences were larger among surgeon-peers, indicating that naïve subjects were somewhat less sensitive to the differences between promoters and non-self-promoters. There was no difference between surgeon-peers and naïve subjects in their expectations of sanctions against self-promoters’ licenses when compared to non-self-promoters, which was the only question to fail to garner a significant difference between respondents.
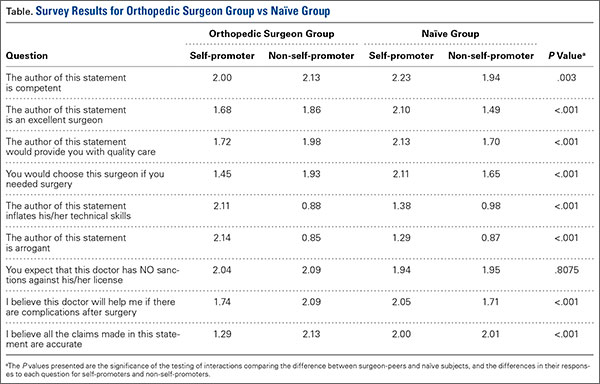
Discussion
This study explores the differences in the perceptions of physician websites between board-certified orthopedic surgeons and naïve individuals. These websites contain varying amounts of information presented in numerous ways. While we did not poll the website authors regarding their intent, the purpose of a website seems naturally to communicate believable information to the public. The information provided ranges widely from basic facts regarding education and contact information to statements regarding technical skills, reputation, television appearances, and the friendly nature of the office staff.
Our results suggest that board-certified orthopedic surgeons, peers of the writers of these websites, tend to view self-promoting surgeons more negatively than do their nonphysician counterparts. These findings support our hypothesis that self-promoting surgeons are perceived more favorably by the naïve, nonphysician population.
At first glance, our results suggest that the mere absence of a surgeon from the medium may affect the patient’s choice, because 50% of our naïve respondents indicated that they would use the Internet to choose a doctor. Interestingly, both the surgeon-peer group and naïve subjects were equally aware that misinformation exists on the Internet. However, when reviewing the websites, naïve subjects were significantly more likely to view self-promoters as more competent, more excellent, and more likely to provide quality care, and were more likely to choose the self-promoter if they needed surgery compared to the surgeon-peer group. The naïve group viewed self-promoters as less likely to inflate their technical skills but more likely to be arrogant. They viewed self-promoters as more likely to help if things went wrong and more likely to make accurate statements compared to the surgeon-peer group. This suggests that patients with little experience are more likely to choose a self-promoting physician than one who does not self-promote for reasons that cannot be proven true or false in the confines of a website. Further study is needed to see if perceptions based on web content translate into actual changes in healthcare choices.
This study had several limitations. Though statistically sound, the sample size of 45 people was small and should likely be expanded in further investigations to allow for analysis of demographics and socioeconomic factors. The study focused only on the text content of websites and purposely removed the influences of the other potential content mentioned previously. While a biography serves as an introduction, further research is needed to determine how initial perceptions affect future perceptions throughout the course of the patient-physician relationship. The small number of Internet biographies used cannot represent the vast array of information that could be displayed in numerous ways, but was necessary given the length of time donated by each uncompensated subject (1-2 hours). To minimize complexity, we purposefully ignored websites in the middle, somewhere in the continuum between self-promoting and non-self-promoting. Instead we selected websites that would be stark in their self-promotion to allow for the assessment of our hypothesis. Finally, this study was not designed to address economic implications of promotional advertising. The goal of much advertising is to generate revenue, and in the case of orthopedic surgery, one goal is likely attracting more patients, but this effect is beyond the scope of the current study. Given the elective nature of many orthopedic surgery procedures, the effect of promotional websites on a person’s decision to have surgery or not is an important topic for future study.
Taken together, the data suggests a profound influence of the content of the Internet website in the impressions made on different groups of people. These facts, although profound in their influence and unregulated by the medical profession, present both great opportunities and liabilities. The opportunities arise from the professional community to help guide what surgeons do to generate interest on the Internet. The liabilities arise on consideration of the consequences of self-promotion in the setting of real world surgical complications.
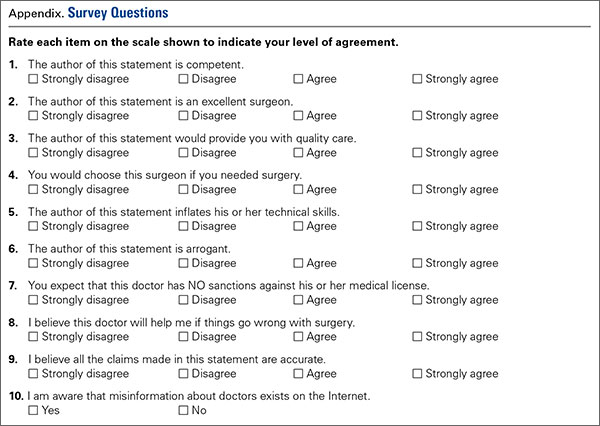
1. Tomycz ND. A profession selling out: lamenting the paradigm shift in physician advertising. J Med Ethics. 2006;32(1):26-28.
2. The principles of medical ethics of the Association of American Physicians and Surgeons. Association of American Physicians and Surgeons Web site. http://www.aapsonline.org/index.php/principles_of_medical_ethics. Accessed September 20, 2013.
3. Opinion 5.027 – Use of health-related online sites. American Medical Association Web site. http://www.ama-assn.org/ama/pub/physician-resources/medical-ethics/code-medical-ethics/opinion5027.page. Accessed September 10, 2013.
4. Standards of professionalism. Advertising by orthopaedic surgeons. Adopted April 18, 2007. American Academy of Orthopaedic Surgeons Web site. http://www.aaos.org/cc_files/aaosorg/member/profcomp/advertisingbyos.pdf. Accessed May 6, 2016.
5. Mostaghimi A, Crotty BH, Landon BE. The availability and nature of physician information on the internet. J Gen Intern Med. 2010;25(11):1152-1156.
6. Ad Hoc Committee on Health Literacy for the Council on Scientific Affairs, American Medical Association. Health Literacy: Report of the Council on Scientific Affairs. JAMA. 1999;281(6):552-557. doi:10.1001/jama.281.6.552.
7. Leroy G, Endicott JE, Mouradi O, Kauchak D, Just ML. Improving perceived and actual text difficulty for health information consumers using semi-automated methods. AMIA Annu Symp Proc. 2012;2012:522–531.
8. Dixon PR, Grant RC, Urbach DR. The impact of promotional language on patient preference for innovative procedures. J Am Coll Surg. 2013;217(3):S100.
9. Landis JR, Koch GG. A one-way components of variance model for categorical data. Biometrics. 1977;33(4):671–679.
In 1975, the American Medical Association (AMA) lifted the professional ban on physician advertising after a successful Federal Trade Commission suit.1 Since then, there has been a marked increase in the number of physicians marketing themselves directly to patients and consumers. With the pervasive nature of the Internet, never before has it been so easy and inexpensive to effectively communicate with a targeted population of people and influence their behavior. Few would dispute the role of advertising on consumer choices when used to sell products and services, change behavior, and educate consumers across all types of industries and professions. Thus, it is reasonable to hypothesize that the nature and content of a surgeon’s web presence could significantly affect patients’ decision-making and their impression of the orthopedic surgery profession.
There is a lack of consensus among physician organizations regarding physician advertising. For example, the American Association of Physicians and Surgeons (AAPS) takes an ethical stand on physician self-promotion. Their position states “The physician should not solicit patients. Professional reputation is the major source of patient referrals. The physician should be circumspect and restrained in dealing with the communication media, always avoiding self-aggrandizement.2” In contrast, the AMA has a less defined stance on physician self-promotion. With the exception of conflicts of interest and privacy guidelines, the AMA has few recommendations regarding the content of physician websites. The organization’s position states “There are no restrictions on advertising by physicians except those that can be specifically justified to protect the public from deceptive practices. …Nothing in this opinion is intended to discourage or to limit advertising and representations which are not false or deceptive.3” This guideline emphasizes accuracy of health-related information, but does not limit physician self-promotion or self-aggrandizement. The American Academy of Orthopaedic Surgeons (AAOS) holds a similar position. In their position statement on advertising by orthopedic surgeons, they encourage advertising and competition as “ethical and acceptable” as long as they are representing services in a “clear and accurate manner.”4 Furthermore, the AAOS also states that “An orthopaedic surgeon shall not use photographs, images, endorsements and/or statements in a false or misleading manner that communicate a degree of relief, safety, effectiveness, or benefits from orthopaedic care that are not representative of results attained by that orthopaedic surgeon.”4 The surgeon is responsible for his/her advertising materials and the content and claims therein, and is generally policed by peers through a complaint process with the AAOS.
Notably, up to 75% of Americans use the Internet for health-related information and this number is likely to increase.5Patients who utilize the Internet must choose from a vast array of search results for medical information from credible resources. Which sources are to be believed and relied upon? This depends on the health literacy among the general population. Inadequate health literacy is defined as “limited ability to obtain, process, and understand basic health information and services needed to make appropriate health decisions and follow instructions for treatment.”6 Patients have different levels of health literacy often unknown to even the most well-intentioned healthcare professional. It is often difficult to provide appropriate and meaningful information at a level that is most beneficial to the patient. It is estimated that 89 million people in the US have insufficient health literacy to understand treatments or preventive care.7 Certainly, with this information in mind, the orthopedic surgeon must consider his/her audience, and the potential for a fiduciary responsibility when preparing Internet content.
A tangible example of marketing results is the increasing popularity of robotic surgery over the last decade.8 Hospitals routinely advertise the availability of robotic surgery at their institution through various means, including roadside billboards. Despite limited evidence supporting a benefit of robotic surgery beyond less expensive conventional laparoscopic surgery, patients are increasingly seeking robotic surgery.8 With society’s increasing infatuation with technology, this is likely based on the presumption that robotic surgery is better and safer than conventional methods. It is likely that marketing pressure is at least partly responsible for the widespread adoption of robotic-assisted surgery and words used in marketing highlighting novelty have an important influence on patient preference.8
Orthopedic surgery, with its large proportion of elective surgeries, offers a unique venue to study differences in patient perceptions. Preoperative evaluations in orthopedics are often performed after an assessment of a surgeon’s reputation, which offers the patient an ability to choose their surgeon within their community.
We pondered how different promotional styles would affect potential patients’ perceptions. Would people believe that a self-promoting physician was more competent? Could fellow doctors “see through” the self-promotion of their peers? Based on the premise that advertising and self-promotion are undertaken because they are effective, we hypothesized that nonphysician patients perceive self-promoting orthopedic surgeons more favorably compared to members of the medical community.
Although numerous anonymous physician review sites exist, our analysis focused on surgeon self-promotion through personal websites or web pages. Within these sources, there exists a wide array of information and methods that physicians utilize to present themselves. Some physicians merely post their educational background and qualifications. This appears most often when the physician is associated with an academic institution and their profile is part of an institution’s website. Others post extensive self-promoting statements about technical skill and innovations in clinical practice. They sometimes include information regarding charity donations, level of community involvement, and practice philosophy.
Materials and Methods
Categorization of Surgeon Websites and Ratings
Surgeon websites were selected from the 5 largest population centers in the United States. Analysis was undertaken to categorize the self-promotion content of each selected website using an objective scale to quantitatively assess the number of times that physicians referred to themselves in a positive manner. A thorough search of the literature did not reveal any validated questionnaire or assessment tool usable for this purpose. Five blinded raters were asked to count the number of positive self-directed remarks made by the author of each website. Websites were ranked based on the number of such statements. No rater was exposed to any styling or graphical information from any website. Only textual statements were used for the purposes of this study. All statements were printed on paper and evaluated without the use of a computer to prevent any searching or contamination of the subject or rater pool.
Websites were considered as self-promoting (using language that promotes the physician beyond the use of basic facts), or non-self-promoting(presenting little beyond basic biographical information) based on the presence of many (more than 5) or few (less than 5) self-promoting statements. The breakpoint of 5 self-promoting statements served to highlight a clear transition between the 2 general types of websites and provided a good demarcation between self-promoters and non-self-promoters. This distinction allowed for the choosing of contrasting websites, which could directly probe the question in our hypothesis about the effect of such websites on naïve or surgeon-peer respondents.
Each website was judged independently by 5 blinded raters. Inter-rater reliability scores were then calculated using Fleiss’ Kappa to assess reliability of the categorization of self-promoter or non-self-promoter. This value was calculated to be k = .80, 95% confidence interval (0.58-1.01), which is suggestive of a “substantial level of agreement.”9 Websites categorized as non-self-promoting contained a mean number of self-promoting statements of less than 2 (0-1.8) as judged by the 5 raters. By contrast, websites categorized as self-promoting had a mean number of self-promoting statements of 6.4 or higher (6.4-22.6). When the self-promoting websites and the non-self-promoting websites were compared, they were significantly different in the number of self-promoting statements t (43) = 7.90, P < .001, with self-promoting websites having significantly more self-promoting statements than non-self-promoting websites.
Surveys and Respondents
Next, a survey of 10 questions of interest was developed. A thorough literature search revealed no validated measure or survey to measure the effects of surgeon or physician self-promotion. We developed a 10-question survey to prove the impressions and allow for assessment of differences between respondent groups to measure the effect of promotion. The questions (see Appendix for survey questions) included a forced Likert rating system. Each response occurs and is presented on a scale from 0 to 3 (0 = Strongly Disagree, 1 = Disagree, 2 = Agree, and 3 = Strongly Agree).
Respondents were true volunteers recruited from 2 groups that were termed “surgeon-peers” and “naïve subjects.” Surgeon-peers were board-certified orthopedic surgeons (N = 21, all with medical doctorates). Demographic breakdown of the surgeon-peers revealed them to be reflective of the general population of orthopedic surgeons (71.4% male, 28.6% female, 90.2% Caucasian, 4.8% African American, and 4.8% Asian, all with professional degrees). Naïve subjects (N = 24, average age 41 years) were selected based on the criterion of having no affiliation with a healthcare system and no history of interaction with an orthopedic surgery or surgery in general. The demographic breakdown of naïve subjects was 45.8% male, 54.2% female, 79.1% Caucasian, 16.7% African American, and 4.2% Asian. Half of the naïve respondents had a Bachelor’s degree, 17% had a Master’s degree, 4% had a professional degree, and 29% had a high school diploma. No volunteer, in either group, received any form of inducement or reward for participation so as not to skew any responses in favor of physicians.
All participants were asked to read each surgeon’s statements and then complete a survey for each statement. Volunteers were not informed of a surgeon’s calculated level of self-promotion, and they were presented the survey questions in random order. Survey completion required unreimbursed time of approximately 1 to 2 hours.
Statistical Methods
The data compiled was then analyzed with SAS/STAT Software (SAS Institute Inc.) and a LR Type III analysis using the GENMOD procedure. The method of analysis and presentation of data focuses on the relationship between respondents perceptions between the surgeon-peer and naïve subject groups. The P values presented are the significance of the testing of interactions comparing the difference between surgeon-peers and naïve subjects, and the differences in their responses to each question for self-promoters and non-self-promoters. Surgeon-peers answer questions differently based on their assessment of a self-promoter or non-self-promoter website. It is this difference that is compared to the analogous difference for naïve subjects and statistically evaluated. The LR statistic for type III analysis tests if the differences are significantly different, ie, if the difference between the 2 subject groups is statistically significant. All statistical methods were performed by a qualified statistician who helped guide the design of this study.
Results
Each respondent was asked if they were aware that misinformation about doctors exists on the Internet. Half of the naïve subjects affirmed awareness of this whereas the other half were unaware. All surgeon-peers were aware of the presence of misinformation regarding physicians on the Internet.
The results of the comparisons are shown in the Table. The columns show the average response to each question for self-promoters and non-self-promoters grouped by either surgeon-peer or naïve subject. In judging the overall accuracy of statements made on the Internet, naïve subjects found no difference between self-promoters and non-self-promoters, whereas surgeon-peers judged the difference to be large and significant in favor of non-self-promoting surgeons. Surgeon-peers generally rated non-self-promoters with significantly more positive Likert scores, indicating improved “competence”, “excellence”, and “better quality of care” when compared to naïve respondents (Table). The direction and magnitude of the difference was also striking, with the naïve respondents favoring self-promoters on all of these questions. This held true for the choice of orthopedic surgeon, where naïve responders favored self-promoters and surgeon-peers favored non-self-promoters. Moreover, naïve subjects believed that self-promoters would be significantly more likely to help them in the event of a complication, whereas surgeon-peers believed the opposite. Even when the direction of difference was the same in both groups, statistically significant differences in the responses were evident, as was the case when respondents were asked “Did the surgeon inflate his/her technical skills?” or “Did the author of this statement seem arrogant?” Both groups favored self-promoters for these questions, but the differences were larger among surgeon-peers, indicating that naïve subjects were somewhat less sensitive to the differences between promoters and non-self-promoters. There was no difference between surgeon-peers and naïve subjects in their expectations of sanctions against self-promoters’ licenses when compared to non-self-promoters, which was the only question to fail to garner a significant difference between respondents.
Discussion
This study explores the differences in the perceptions of physician websites between board-certified orthopedic surgeons and naïve individuals. These websites contain varying amounts of information presented in numerous ways. While we did not poll the website authors regarding their intent, the purpose of a website seems naturally to communicate believable information to the public. The information provided ranges widely from basic facts regarding education and contact information to statements regarding technical skills, reputation, television appearances, and the friendly nature of the office staff.
Our results suggest that board-certified orthopedic surgeons, peers of the writers of these websites, tend to view self-promoting surgeons more negatively than do their nonphysician counterparts. These findings support our hypothesis that self-promoting surgeons are perceived more favorably by the naïve, nonphysician population.
At first glance, our results suggest that the mere absence of a surgeon from the medium may affect the patient’s choice, because 50% of our naïve respondents indicated that they would use the Internet to choose a doctor. Interestingly, both the surgeon-peer group and naïve subjects were equally aware that misinformation exists on the Internet. However, when reviewing the websites, naïve subjects were significantly more likely to view self-promoters as more competent, more excellent, and more likely to provide quality care, and were more likely to choose the self-promoter if they needed surgery compared to the surgeon-peer group. The naïve group viewed self-promoters as less likely to inflate their technical skills but more likely to be arrogant. They viewed self-promoters as more likely to help if things went wrong and more likely to make accurate statements compared to the surgeon-peer group. This suggests that patients with little experience are more likely to choose a self-promoting physician than one who does not self-promote for reasons that cannot be proven true or false in the confines of a website. Further study is needed to see if perceptions based on web content translate into actual changes in healthcare choices.
This study had several limitations. Though statistically sound, the sample size of 45 people was small and should likely be expanded in further investigations to allow for analysis of demographics and socioeconomic factors. The study focused only on the text content of websites and purposely removed the influences of the other potential content mentioned previously. While a biography serves as an introduction, further research is needed to determine how initial perceptions affect future perceptions throughout the course of the patient-physician relationship. The small number of Internet biographies used cannot represent the vast array of information that could be displayed in numerous ways, but was necessary given the length of time donated by each uncompensated subject (1-2 hours). To minimize complexity, we purposefully ignored websites in the middle, somewhere in the continuum between self-promoting and non-self-promoting. Instead we selected websites that would be stark in their self-promotion to allow for the assessment of our hypothesis. Finally, this study was not designed to address economic implications of promotional advertising. The goal of much advertising is to generate revenue, and in the case of orthopedic surgery, one goal is likely attracting more patients, but this effect is beyond the scope of the current study. Given the elective nature of many orthopedic surgery procedures, the effect of promotional websites on a person’s decision to have surgery or not is an important topic for future study.
Taken together, the data suggests a profound influence of the content of the Internet website in the impressions made on different groups of people. These facts, although profound in their influence and unregulated by the medical profession, present both great opportunities and liabilities. The opportunities arise from the professional community to help guide what surgeons do to generate interest on the Internet. The liabilities arise on consideration of the consequences of self-promotion in the setting of real world surgical complications.
1. Tomycz ND. A profession selling out: lamenting the paradigm shift in physician advertising. J Med Ethics. 2006;32(1):26-28.
2. The principles of medical ethics of the Association of American Physicians and Surgeons. Association of American Physicians and Surgeons Web site. http://www.aapsonline.org/index.php/principles_of_medical_ethics. Accessed September 20, 2013.
3. Opinion 5.027 – Use of health-related online sites. American Medical Association Web site. http://www.ama-assn.org/ama/pub/physician-resources/medical-ethics/code-medical-ethics/opinion5027.page. Accessed September 10, 2013.
4. Standards of professionalism. Advertising by orthopaedic surgeons. Adopted April 18, 2007. American Academy of Orthopaedic Surgeons Web site. http://www.aaos.org/cc_files/aaosorg/member/profcomp/advertisingbyos.pdf. Accessed May 6, 2016.
5. Mostaghimi A, Crotty BH, Landon BE. The availability and nature of physician information on the internet. J Gen Intern Med. 2010;25(11):1152-1156.
6. Ad Hoc Committee on Health Literacy for the Council on Scientific Affairs, American Medical Association. Health Literacy: Report of the Council on Scientific Affairs. JAMA. 1999;281(6):552-557. doi:10.1001/jama.281.6.552.
7. Leroy G, Endicott JE, Mouradi O, Kauchak D, Just ML. Improving perceived and actual text difficulty for health information consumers using semi-automated methods. AMIA Annu Symp Proc. 2012;2012:522–531.
8. Dixon PR, Grant RC, Urbach DR. The impact of promotional language on patient preference for innovative procedures. J Am Coll Surg. 2013;217(3):S100.
9. Landis JR, Koch GG. A one-way components of variance model for categorical data. Biometrics. 1977;33(4):671–679.
Choosing a Graft for Anterior Cruciate Ligament Reconstruction: Surgeon Influence Reigns Supreme
Anterior cruciate ligament (ACL) injuries affect >175,000 people each year,1 with >100,000 Americans undergoing ACL reconstruction annually.2 Due to the high impact this injury has on the general population, and especially on athletes, it is important to determine the factors that influence a patient’s selection of a particular graft type. With increasing access to information and other outside influences, surgeons should attempt to provide as much objective information as possible in order to allow patients to make appropriate informed decisions regarding their graft choice for ACL surgery.
While autografts are used in >60% of primary ACL reconstructions, allografts are used in >80% of revision procedures.3 Both autografts and allografts offer advantages and disadvantages, and the advantages of each may depend on patient age, activity level, and occupation.4 For example, graft rerupture rates have been shown to be higher in patients with ACL allografts4, while kneeling pain has been shown to be worse in patients with bone-patellar tendon-bone (BPTB) autografts compared to hamstring autografts5 as well as BPTB allografts.4
Patient satisfaction rates are high for ACL autografts and allografts. Boonriong and Kietsiriroje6 have shown visual analog scale (VAS) patient satisfaction score averages to be 88 out of 100 for BPTB autografts and 93 out of 100 for hamstring tendon autografts. Fox and colleagues7 showed that 87% of patients were completely or mostly satisfied following revision ACL reconstruction with patellar tendon allograft. Cohen and colleagues8 evaluated 240 patients undergoing primary ACL reconstruction; 63.3% underwent ACL reconstruction with an allograft and 35.4% with an autograft. Of all patients enrolled in the study, 93% were satisfied with their graft choice, with 12.7% of patients opting to choose another graft if in the same situation again. Of those patients, 63.3% would have switched from an autograft to allograft. Although these numbers represent high patient satisfaction following a variety of ACL graft types, it is important to continue to identify graft selection factors in order to maximize patient outcomes.
The purposes of this prospective study were to assess patients’ knowledge of their graft type used for ACL reconstruction, to determine the most influential factors involved in graft selection, and to determine the level of satisfaction with the graft of choice at a minimum of 1-year follow-up. Based on a previous retrospective study,8 we hypothesized that physician recommendation would be the most influential factor in ACL graft selection. We also hypothesized that patients receiving an autograft would be more accurate in stating their graft harvest location compared to allograft patients.
Materials and Methods
We prospectively enrolled 304 patients who underwent primary ACL reconstruction from January 2008 to September 2013. Surgery was performed by 9 different surgeons within the same practice. All patients undergoing primary ACL reconstruction were eligible for the study.
All surgeons explained to each patient the pros and cons of each graft choice based upon peer-reviewed literature. Each patient was allowed to choose autograft or allograft, although most of the surgeons strongly encourage patients under age 25 years to choose autograft. One of the surgeons specifically encourages a patellar tendon autograft in patients under age 30 to 35 years, except for those patients with a narrow patellar tendon on magnetic resonance imaging, in which case he recommends a hamstring autograft. Another surgeon also specifically encourages patellar tendon autograft in patients under 35 years, except in skeletally immature patients, for whom he encourages hamstring autograft. However, none of the surgeons prohibited patients from choosing autograft or allograft, regardless of age.
The Institutional Review Board at our institution provided approval for this study. At the first postoperative follow-up appointment, each patient completed a questionnaire asking to select from a list the type (“your own” or “a cadaver”) and harvest site of the graft that was used for the surgery. Patients were also asked how they decided upon that graft type by ranking a list of 4 factors from 1 to 4. These included (1) physician recommendation, (2) family/friend’s recommendation, (3) coach’s recommendation, and (4) the media. Patients had the option of ranking more than one factor as most important in their decision. In addition, patients were asked to list any other factors that influenced their decision regarding graft type.
At a minimum of 1 year following surgery, patients completed the same questionnaire described above. In addition, patients were asked if they were satisfied with their graft and whether they would choose the same graft type if undergoing ACL reconstruction again. Patients who would have chosen a different graft were asked which graft they would have chosen and why. Any patient who experienced graft rupture prior to follow-up was included in the analysis.
Statistical Analysis
Chi square tests were used to compare dichotomous outcomes. A type I error of less than 5% (P < .05) was considered statistically significant.
Results
At least 1 year following ACL reconstruction, 213 of 304 patients (70%) successfully completed the same questionnaire as they did at their first postoperative follow-up appointment. The mean age of these patients at the time of surgery was 31.9 ± 11.0 years (range, 13.9 to 58.0 years). The mean follow-up time was 1.4 ± 0.4 years (range, 1.0 to 2.6 years), and 59% of these patients were male.
Autografts were used for 139 patients (139/304, 46%), allografts for 156 patients (156/304, 51%), and hybrid grafts for 9 patients (9/304, 3%). Overall, 77% of patients were accurate in stating the type of graft used for their ACL reconstruction, including 88% of autograft patients, 71% of allograft patients, and 11% of hybrid graft patients (Table 1). Patients who underwent reconstruction with an autograft were significantly more accurate in stating their graft type compared to patients with an allograft (P < .001). Graft type by surgeon is shown in Table 2. A statistically significant difference was found in the proportion of patients choosing autograft versus allograft based on surgeon (P < .0001).
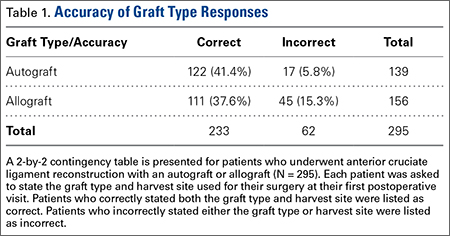
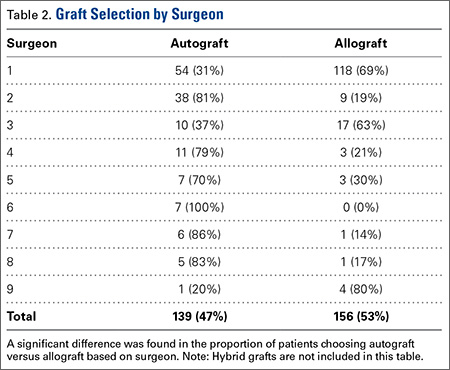
When asked which type of graft was used for their surgery, 12 of 304 patients (4%) did not know their graft type or harvest location. Twenty-nine patients stated that their graft was an allograft but did not know the harvest location. Five patients stated that their graft was an autograft but did not know the harvest location. The 34 patients who classified their choice of graft but did not know the harvest site (11%) stated their surgeon never told them where their graft was from or they did not remember. A complete list of graft type responses is shown in Table 3.
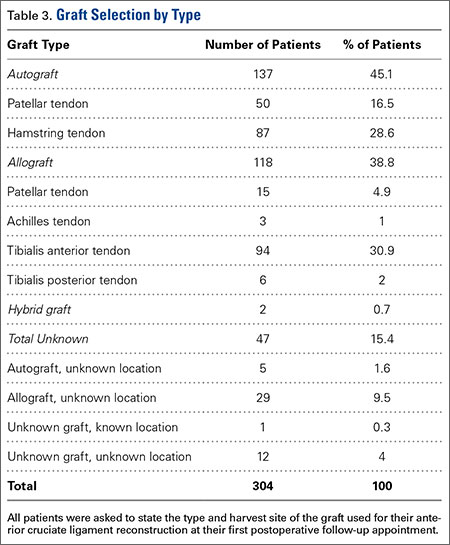
Of the 29 patients who stated that their graft was an allograft but did not know the harvest location, 19 (66%) had a tibialis anterior allograft, 7 (24%) had a BPTB allograft, 2 (7%) had an Achilles tendon allograft, and 1 (3%) had a tibialis anterior autograft.
Physician recommendation was the most important decision-making factor listed for 82% of patients at their first postoperative appointment (Table 4). In addition to the 4 factors listed on our survey, patients were allowed to write in other factors involved in their decision. The most popular answers included recovery time, personal research on graft types, and prior personal experience with ACL reconstruction on the contralateral knee.
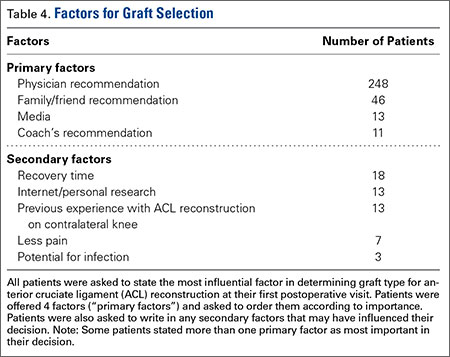
At the time of 1-year follow-up, 205 of 213 patients (96%) said they were satisfied with their graft choice (Table 5). All 4 unsatisfied autograft patients received a hamstring autograft, 3 of which were performed by the same surgeon. No significant difference was found in satisfaction rates between patients with autograft vs allograft (P = .87). There was a higher satisfaction rate among patients with a BPTB autograft compared to those with a hamstring autograft (P = .043). Of the unsatisfied patients, 3 patients stated that their graft had failed in the time prior to follow-up and 2 patients stated that they were having donor site pain following surgery with hamstring autograft and would consider an allograft if the reconstruction were repeated (Table 6). Two patients stated that they were unsatisfied with their graft but would need to do more research before deciding on a different graft type.
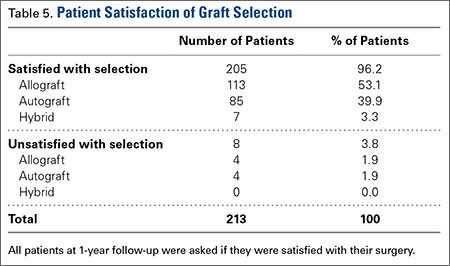
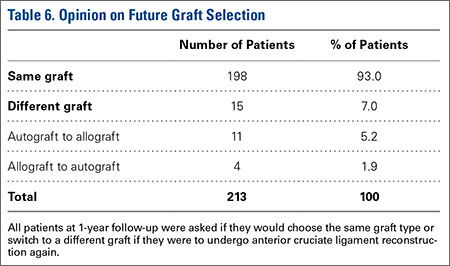
As shown in Tables 5 and 6, there is a discrepancy between the number of patients who were unsatisfied with their graft and the number of patients who stated that they would switch to a different graft type if they were to have ACL reconstruction again. A number of patients stated that they were satisfied with their graft, yet they would switch to a different graft. The main reasons for this related to issues from a hamstring autograft harvest site. One patient noted that although she was satisfied with her graft, she would switch after doing further research.
Discussion
Determining the decision-making factors for patients choosing between graft types for ACL reconstruction is important to ensure that patients can make a decision based on objective information. Several previous studies have evaluated patient selection of ACL grafts.8-10 All 3 of these studies showed that surgeon recommendation is the primary factor in a patient’s decision. Similar to previous studies, we also found that physician recommendation is the most influential factor involved in this decision.
At an average follow-up of 41 months, Cohen and colleagues8 found that 1.3% of patients did not know whether they received an autograft or allograft for their ACL reconstruction. Furthermore, 50.7% of patients stating they received an allograft in Cohen’s study8 were unsure of the harvest location. In our study, 4% of patients at their first postoperative visit did not know whether they had received an autograft or allograft and 10% of patients stating they received an allograft selected an unknown harvest site. In contrast, only 2% of autograft patients in our study were unsure of the harvest location at their first postoperative appointment. It is likely that, over time, patients with an allograft forget the harvest location, whereas autograft patients are more likely to remember the location of harvest. This is especially true in patients with anterior knee pain or hamstring pain following ACL reconstruction with a BPTB or hamstring tendon autograft, respectively.
In terms of patients’ knowledge of their graft type, we found an overall accuracy of 77%, with 88% of autograft patients, 71% of allograft patients, and 11% of hybrid graft patients remembering their graft type and harvest location. Although we do not believe it to be critical for patients to remember these details, we do believe that patients who do not know their graft type likely relied on the recommendation of their physician.
We found a significant difference in the proportion of patients choosing autograft vs allograft based on surgeon, despite these surgeons citing available data in the literature to each patient and ultimately allowing each patient to make his or her own decision. This is partly due to the low sample size of most of the surgeons involved. However, the main reason for this distortion is likely that different surgeons may highlight different aspects of the literature to “spin” patients towards one graft or another in certain cases.
Currently, there remains a lack of clarity in the literature on appropriate ACL graft choices for patients. With constant new findings being published on different aspects of various grafts, it is important for surgeons to remain up to date with the literature. Nevertheless, we believe that certain biases are inevitable among surgeons due to unique training experiences as well as experience with their own patients.
Cohen and colleagues8 found that only 7% of patients reported that their own personal research influenced their decision, and only 6.4% of patients reported the media as their primary decision-making factor. Cheung and colleagues9 conducted a retrospective study and found that more than half of patients did significant personal research prior to making a decision regarding their graft type. Most of this research was done using medical websites and literature. Koh and colleagues10 noted that >80% of patients consulted the internet for graft information before making a decision. Koh’s study10 was performed in Korea and therefore the high prevalence of internet use may be culturally-related.
Overall, quality of information for patients undergoing ACL reconstruction is mixed across the internet, with only 22.5% of top websites being affiliated with an academic institution and 35.5% of websites authored by private physicians or physician groups.11 Although a majority of internet websites offer discussion into the condition and surgical procedure of ACL reconstruction, less than half of these websites share the equally important information on the eligibility for surgery and concomitant complications following surgery.11In our study, only 39 patients (13%) listed the media as either the first (13, 4%) or second (26, 9%) most important factor in their graft decision. Clearly there is some discrepancy between studies regarding the influence of personal research and media. There are a few potential reasons for this. First, we did not explicitly ask patients if their own personal research had any influence on their graft decision. Rather, we asked patients to rank their decision-making factors, and few patients ranked the media as their first or second greatest influence. Second, the word “media” was used in our questionnaire rather than “online research” or “internet.” It may seem somewhat vague to patients what the word “media” really means in terms of their own research, whereas listing “online research” or “internet” as selection options may have influenced patient responses.
In our study, we asked patients for any additional factors that influenced their graft choice. Thirteen patients (4%) noted that “personal research” through internet, orthopaedic literature, and the media influenced their graft decision. This corroborates the idea that “media” may have seemed vague to some patients. Of these patients, 9 chose an autograft and 4 chose an allograft. The relative ease in accessing information regarding graft choice in ACL reconstruction should be noted. Numerous websites offer advice, graft options, and commentary from group practices and orthopaedic surgeons. Whether or not these sources provide reasonable support for one graft vs another graft remains to be answered. The physician should be responsible for providing the patient with this collected objective information.
In our study, 205 patients (96%) were satisfied with their graft choice at the time of follow-up, with 15 patients (7%) stating that they would have chosen a different graft type if they could redo the operation. Cheung and colleagues9 found a satisfaction rate of 87.4% at an average follow-up time of 19 months, with 4.6% stating they would have chosen a different graft type. Many factors can contribute to patient satisfaction after ACL reconstruction. Looking at patient variables such as age, demographics, occupation, activity level, surgical technique including tunnel placement and fixation, postoperative rehabilitation, and graft type may influence the success of the patient after ACL reconstruction.
The strengths of this study include the patient population size with 1-year follow-up as well as the prospective study design. In comparison to a previous retrospective study in 2009 by Cohen and colleagues8with a sample size of 240 patients, our study collected 213 patients with 70% follow-up at minimum 1 year. Collecting data prospectively ensures accurate representation of the factors influencing each patient’s graft selection, while follow-up data was useful for patient satisfaction.
The limitations of this study include the percentage of patients lost from follow-up as well as any bias generated from the organization of the questionnaire. Unfortunately, with a younger, transient population of patients undergoing ACL reconstruction in a major metropolitan area, a percentage of patients are lost to follow-up. Many attempts were made to locate these patients. Another potential limitation was the order of decision factors listed on the questionnaire. These factors were not ordered randomly on each survey, but were listed in the following order: (1) physician recommendation (2) family/friend’s recommendation (3) coach’s recommendation and (4) the media. This may have influenced patient responses. The organization of these factors in the questionnaire started with physician recommendation, which may have influenced the patient’s initial thought process of which factor had the greatest influence in their graft decision. In addition, for the surveys completed at least 1 year following surgery, some patients were contacted via e-mail and others via telephone. Thus, some patients may have changed their answers if they were able to see the questions rather than hearing the questions. We believe this is particularly true of the question regarding graft harvest site.
Our study indicates that the majority of patients undergoing ACL reconstruction are primarily influenced by the physician’s recommendation.
1. Madick S. Anterior cruciate ligament reconstruction of the knee. AORN J. 2011;93(2):210-222.
2. Baer GS, Harner CD. Clinical outcomes of allograft versus autograft in anterior cruciate ligament reconstruction. Clin Sports Med. 2007;26(4):661-681.
3. Paxton EW, Namba RS, Maletis GB, et al. A prospective study of 80,000 total joint and 5000 anterior cruciate ligament reconstruction procedures in a community-based registry in the United States. J Bone Joint Surg Am. 2010;92(suppl 2):117-132.
4. Kraeutler MJ, Bravman JT, McCarty EC. Bone-patellar tendon-bone autograft versus allograft in outcomes of anterior cruciate ligament reconstruction: A meta-analysis of 5182 patients. Am J Sports Med. 2013;41(10):2439-2448.
5. Spindler KP, Kuhn JE, Freedman KB, Matthews CE, Dittus RS, Harrell FE Jr. Anterior cruciate ligament reconstruction autograft choice: bone-tendon-bone versus hamstring: does it really matter? A systematic review. Am J Sports Med. 2004;32(8):1986-1995.
6. Boonriong T, Kietsiriroje N. Arthroscopically assisted anterior cruciate ligament reconstruction: comparison of bone-patellar tendon-bone versus hamstring tendon autograft. J Med Assoc Thai. 2004;87(9):1100-1107.
7. Fox JA, Pierce M, Bojchuk J, Hayden J, Bush-Joseph CA, Bach BR Jr. Revision anterior cruciate ligament reconstruction with nonirradiated fresh-frozen patellar tendon allograft. Arthroscopy. 2004;20(8):787-794.
8. Cohen SB, Yucha DT, Ciccotti MC, Goldstein DT, Ciccotti MA, Ciccotti MG. Factors affecting patient selection of graft type in anterior cruciate ligament reconstruction. Arthroscopy. 2009;25(9):1006-1010.
9. Cheung SC, Allen CR, Gallo RA, Ma CB, Feeley BT. Patients’ attitudes and factors in their selection of grafts for anterior cruciate ligament reconstruction. Knee. 2012;19(1):49-54.
10. Koh HS, In Y, Kong CG, Won HY, Kim KH, Lee JH. Factors affecting patients’ graft choice in anterior cruciate ligament reconstruction. Clin Orthop Surg. 2010;2(2):69-75.
11. Duncan IC, Kane PW, Lawson KA, Cohen SB, Ciccotti MG, Dodson CC. Evaluation of information available on the internet regarding anterior cruciate ligament reconstruction. Arthroscopy. 2013;29(6):1101-1107.
Anterior cruciate ligament (ACL) injuries affect >175,000 people each year,1 with >100,000 Americans undergoing ACL reconstruction annually.2 Due to the high impact this injury has on the general population, and especially on athletes, it is important to determine the factors that influence a patient’s selection of a particular graft type. With increasing access to information and other outside influences, surgeons should attempt to provide as much objective information as possible in order to allow patients to make appropriate informed decisions regarding their graft choice for ACL surgery.
While autografts are used in >60% of primary ACL reconstructions, allografts are used in >80% of revision procedures.3 Both autografts and allografts offer advantages and disadvantages, and the advantages of each may depend on patient age, activity level, and occupation.4 For example, graft rerupture rates have been shown to be higher in patients with ACL allografts4, while kneeling pain has been shown to be worse in patients with bone-patellar tendon-bone (BPTB) autografts compared to hamstring autografts5 as well as BPTB allografts.4
Patient satisfaction rates are high for ACL autografts and allografts. Boonriong and Kietsiriroje6 have shown visual analog scale (VAS) patient satisfaction score averages to be 88 out of 100 for BPTB autografts and 93 out of 100 for hamstring tendon autografts. Fox and colleagues7 showed that 87% of patients were completely or mostly satisfied following revision ACL reconstruction with patellar tendon allograft. Cohen and colleagues8 evaluated 240 patients undergoing primary ACL reconstruction; 63.3% underwent ACL reconstruction with an allograft and 35.4% with an autograft. Of all patients enrolled in the study, 93% were satisfied with their graft choice, with 12.7% of patients opting to choose another graft if in the same situation again. Of those patients, 63.3% would have switched from an autograft to allograft. Although these numbers represent high patient satisfaction following a variety of ACL graft types, it is important to continue to identify graft selection factors in order to maximize patient outcomes.
The purposes of this prospective study were to assess patients’ knowledge of their graft type used for ACL reconstruction, to determine the most influential factors involved in graft selection, and to determine the level of satisfaction with the graft of choice at a minimum of 1-year follow-up. Based on a previous retrospective study,8 we hypothesized that physician recommendation would be the most influential factor in ACL graft selection. We also hypothesized that patients receiving an autograft would be more accurate in stating their graft harvest location compared to allograft patients.
Materials and Methods
We prospectively enrolled 304 patients who underwent primary ACL reconstruction from January 2008 to September 2013. Surgery was performed by 9 different surgeons within the same practice. All patients undergoing primary ACL reconstruction were eligible for the study.
All surgeons explained to each patient the pros and cons of each graft choice based upon peer-reviewed literature. Each patient was allowed to choose autograft or allograft, although most of the surgeons strongly encourage patients under age 25 years to choose autograft. One of the surgeons specifically encourages a patellar tendon autograft in patients under age 30 to 35 years, except for those patients with a narrow patellar tendon on magnetic resonance imaging, in which case he recommends a hamstring autograft. Another surgeon also specifically encourages patellar tendon autograft in patients under 35 years, except in skeletally immature patients, for whom he encourages hamstring autograft. However, none of the surgeons prohibited patients from choosing autograft or allograft, regardless of age.
The Institutional Review Board at our institution provided approval for this study. At the first postoperative follow-up appointment, each patient completed a questionnaire asking to select from a list the type (“your own” or “a cadaver”) and harvest site of the graft that was used for the surgery. Patients were also asked how they decided upon that graft type by ranking a list of 4 factors from 1 to 4. These included (1) physician recommendation, (2) family/friend’s recommendation, (3) coach’s recommendation, and (4) the media. Patients had the option of ranking more than one factor as most important in their decision. In addition, patients were asked to list any other factors that influenced their decision regarding graft type.
At a minimum of 1 year following surgery, patients completed the same questionnaire described above. In addition, patients were asked if they were satisfied with their graft and whether they would choose the same graft type if undergoing ACL reconstruction again. Patients who would have chosen a different graft were asked which graft they would have chosen and why. Any patient who experienced graft rupture prior to follow-up was included in the analysis.
Statistical Analysis
Chi square tests were used to compare dichotomous outcomes. A type I error of less than 5% (P < .05) was considered statistically significant.
Results
At least 1 year following ACL reconstruction, 213 of 304 patients (70%) successfully completed the same questionnaire as they did at their first postoperative follow-up appointment. The mean age of these patients at the time of surgery was 31.9 ± 11.0 years (range, 13.9 to 58.0 years). The mean follow-up time was 1.4 ± 0.4 years (range, 1.0 to 2.6 years), and 59% of these patients were male.
Autografts were used for 139 patients (139/304, 46%), allografts for 156 patients (156/304, 51%), and hybrid grafts for 9 patients (9/304, 3%). Overall, 77% of patients were accurate in stating the type of graft used for their ACL reconstruction, including 88% of autograft patients, 71% of allograft patients, and 11% of hybrid graft patients (Table 1). Patients who underwent reconstruction with an autograft were significantly more accurate in stating their graft type compared to patients with an allograft (P < .001). Graft type by surgeon is shown in Table 2. A statistically significant difference was found in the proportion of patients choosing autograft versus allograft based on surgeon (P < .0001).
When asked which type of graft was used for their surgery, 12 of 304 patients (4%) did not know their graft type or harvest location. Twenty-nine patients stated that their graft was an allograft but did not know the harvest location. Five patients stated that their graft was an autograft but did not know the harvest location. The 34 patients who classified their choice of graft but did not know the harvest site (11%) stated their surgeon never told them where their graft was from or they did not remember. A complete list of graft type responses is shown in Table 3.
Of the 29 patients who stated that their graft was an allograft but did not know the harvest location, 19 (66%) had a tibialis anterior allograft, 7 (24%) had a BPTB allograft, 2 (7%) had an Achilles tendon allograft, and 1 (3%) had a tibialis anterior autograft.
Physician recommendation was the most important decision-making factor listed for 82% of patients at their first postoperative appointment (Table 4). In addition to the 4 factors listed on our survey, patients were allowed to write in other factors involved in their decision. The most popular answers included recovery time, personal research on graft types, and prior personal experience with ACL reconstruction on the contralateral knee.
At the time of 1-year follow-up, 205 of 213 patients (96%) said they were satisfied with their graft choice (Table 5). All 4 unsatisfied autograft patients received a hamstring autograft, 3 of which were performed by the same surgeon. No significant difference was found in satisfaction rates between patients with autograft vs allograft (P = .87). There was a higher satisfaction rate among patients with a BPTB autograft compared to those with a hamstring autograft (P = .043). Of the unsatisfied patients, 3 patients stated that their graft had failed in the time prior to follow-up and 2 patients stated that they were having donor site pain following surgery with hamstring autograft and would consider an allograft if the reconstruction were repeated (Table 6). Two patients stated that they were unsatisfied with their graft but would need to do more research before deciding on a different graft type.
As shown in Tables 5 and 6, there is a discrepancy between the number of patients who were unsatisfied with their graft and the number of patients who stated that they would switch to a different graft type if they were to have ACL reconstruction again. A number of patients stated that they were satisfied with their graft, yet they would switch to a different graft. The main reasons for this related to issues from a hamstring autograft harvest site. One patient noted that although she was satisfied with her graft, she would switch after doing further research.
Discussion
Determining the decision-making factors for patients choosing between graft types for ACL reconstruction is important to ensure that patients can make a decision based on objective information. Several previous studies have evaluated patient selection of ACL grafts.8-10 All 3 of these studies showed that surgeon recommendation is the primary factor in a patient’s decision. Similar to previous studies, we also found that physician recommendation is the most influential factor involved in this decision.
At an average follow-up of 41 months, Cohen and colleagues8 found that 1.3% of patients did not know whether they received an autograft or allograft for their ACL reconstruction. Furthermore, 50.7% of patients stating they received an allograft in Cohen’s study8 were unsure of the harvest location. In our study, 4% of patients at their first postoperative visit did not know whether they had received an autograft or allograft and 10% of patients stating they received an allograft selected an unknown harvest site. In contrast, only 2% of autograft patients in our study were unsure of the harvest location at their first postoperative appointment. It is likely that, over time, patients with an allograft forget the harvest location, whereas autograft patients are more likely to remember the location of harvest. This is especially true in patients with anterior knee pain or hamstring pain following ACL reconstruction with a BPTB or hamstring tendon autograft, respectively.
In terms of patients’ knowledge of their graft type, we found an overall accuracy of 77%, with 88% of autograft patients, 71% of allograft patients, and 11% of hybrid graft patients remembering their graft type and harvest location. Although we do not believe it to be critical for patients to remember these details, we do believe that patients who do not know their graft type likely relied on the recommendation of their physician.
We found a significant difference in the proportion of patients choosing autograft vs allograft based on surgeon, despite these surgeons citing available data in the literature to each patient and ultimately allowing each patient to make his or her own decision. This is partly due to the low sample size of most of the surgeons involved. However, the main reason for this distortion is likely that different surgeons may highlight different aspects of the literature to “spin” patients towards one graft or another in certain cases.
Currently, there remains a lack of clarity in the literature on appropriate ACL graft choices for patients. With constant new findings being published on different aspects of various grafts, it is important for surgeons to remain up to date with the literature. Nevertheless, we believe that certain biases are inevitable among surgeons due to unique training experiences as well as experience with their own patients.
Cohen and colleagues8 found that only 7% of patients reported that their own personal research influenced their decision, and only 6.4% of patients reported the media as their primary decision-making factor. Cheung and colleagues9 conducted a retrospective study and found that more than half of patients did significant personal research prior to making a decision regarding their graft type. Most of this research was done using medical websites and literature. Koh and colleagues10 noted that >80% of patients consulted the internet for graft information before making a decision. Koh’s study10 was performed in Korea and therefore the high prevalence of internet use may be culturally-related.
Overall, quality of information for patients undergoing ACL reconstruction is mixed across the internet, with only 22.5% of top websites being affiliated with an academic institution and 35.5% of websites authored by private physicians or physician groups.11 Although a majority of internet websites offer discussion into the condition and surgical procedure of ACL reconstruction, less than half of these websites share the equally important information on the eligibility for surgery and concomitant complications following surgery.11In our study, only 39 patients (13%) listed the media as either the first (13, 4%) or second (26, 9%) most important factor in their graft decision. Clearly there is some discrepancy between studies regarding the influence of personal research and media. There are a few potential reasons for this. First, we did not explicitly ask patients if their own personal research had any influence on their graft decision. Rather, we asked patients to rank their decision-making factors, and few patients ranked the media as their first or second greatest influence. Second, the word “media” was used in our questionnaire rather than “online research” or “internet.” It may seem somewhat vague to patients what the word “media” really means in terms of their own research, whereas listing “online research” or “internet” as selection options may have influenced patient responses.
In our study, we asked patients for any additional factors that influenced their graft choice. Thirteen patients (4%) noted that “personal research” through internet, orthopaedic literature, and the media influenced their graft decision. This corroborates the idea that “media” may have seemed vague to some patients. Of these patients, 9 chose an autograft and 4 chose an allograft. The relative ease in accessing information regarding graft choice in ACL reconstruction should be noted. Numerous websites offer advice, graft options, and commentary from group practices and orthopaedic surgeons. Whether or not these sources provide reasonable support for one graft vs another graft remains to be answered. The physician should be responsible for providing the patient with this collected objective information.
In our study, 205 patients (96%) were satisfied with their graft choice at the time of follow-up, with 15 patients (7%) stating that they would have chosen a different graft type if they could redo the operation. Cheung and colleagues9 found a satisfaction rate of 87.4% at an average follow-up time of 19 months, with 4.6% stating they would have chosen a different graft type. Many factors can contribute to patient satisfaction after ACL reconstruction. Looking at patient variables such as age, demographics, occupation, activity level, surgical technique including tunnel placement and fixation, postoperative rehabilitation, and graft type may influence the success of the patient after ACL reconstruction.
The strengths of this study include the patient population size with 1-year follow-up as well as the prospective study design. In comparison to a previous retrospective study in 2009 by Cohen and colleagues8with a sample size of 240 patients, our study collected 213 patients with 70% follow-up at minimum 1 year. Collecting data prospectively ensures accurate representation of the factors influencing each patient’s graft selection, while follow-up data was useful for patient satisfaction.
The limitations of this study include the percentage of patients lost from follow-up as well as any bias generated from the organization of the questionnaire. Unfortunately, with a younger, transient population of patients undergoing ACL reconstruction in a major metropolitan area, a percentage of patients are lost to follow-up. Many attempts were made to locate these patients. Another potential limitation was the order of decision factors listed on the questionnaire. These factors were not ordered randomly on each survey, but were listed in the following order: (1) physician recommendation (2) family/friend’s recommendation (3) coach’s recommendation and (4) the media. This may have influenced patient responses. The organization of these factors in the questionnaire started with physician recommendation, which may have influenced the patient’s initial thought process of which factor had the greatest influence in their graft decision. In addition, for the surveys completed at least 1 year following surgery, some patients were contacted via e-mail and others via telephone. Thus, some patients may have changed their answers if they were able to see the questions rather than hearing the questions. We believe this is particularly true of the question regarding graft harvest site.
Our study indicates that the majority of patients undergoing ACL reconstruction are primarily influenced by the physician’s recommendation.
1. Madick S. Anterior cruciate ligament reconstruction of the knee. AORN J. 2011;93(2):210-222.
2. Baer GS, Harner CD. Clinical outcomes of allograft versus autograft in anterior cruciate ligament reconstruction. Clin Sports Med. 2007;26(4):661-681.
3. Paxton EW, Namba RS, Maletis GB, et al. A prospective study of 80,000 total joint and 5000 anterior cruciate ligament reconstruction procedures in a community-based registry in the United States. J Bone Joint Surg Am. 2010;92(suppl 2):117-132.
4. Kraeutler MJ, Bravman JT, McCarty EC. Bone-patellar tendon-bone autograft versus allograft in outcomes of anterior cruciate ligament reconstruction: A meta-analysis of 5182 patients. Am J Sports Med. 2013;41(10):2439-2448.
5. Spindler KP, Kuhn JE, Freedman KB, Matthews CE, Dittus RS, Harrell FE Jr. Anterior cruciate ligament reconstruction autograft choice: bone-tendon-bone versus hamstring: does it really matter? A systematic review. Am J Sports Med. 2004;32(8):1986-1995.
6. Boonriong T, Kietsiriroje N. Arthroscopically assisted anterior cruciate ligament reconstruction: comparison of bone-patellar tendon-bone versus hamstring tendon autograft. J Med Assoc Thai. 2004;87(9):1100-1107.
7. Fox JA, Pierce M, Bojchuk J, Hayden J, Bush-Joseph CA, Bach BR Jr. Revision anterior cruciate ligament reconstruction with nonirradiated fresh-frozen patellar tendon allograft. Arthroscopy. 2004;20(8):787-794.
8. Cohen SB, Yucha DT, Ciccotti MC, Goldstein DT, Ciccotti MA, Ciccotti MG. Factors affecting patient selection of graft type in anterior cruciate ligament reconstruction. Arthroscopy. 2009;25(9):1006-1010.
9. Cheung SC, Allen CR, Gallo RA, Ma CB, Feeley BT. Patients’ attitudes and factors in their selection of grafts for anterior cruciate ligament reconstruction. Knee. 2012;19(1):49-54.
10. Koh HS, In Y, Kong CG, Won HY, Kim KH, Lee JH. Factors affecting patients’ graft choice in anterior cruciate ligament reconstruction. Clin Orthop Surg. 2010;2(2):69-75.
11. Duncan IC, Kane PW, Lawson KA, Cohen SB, Ciccotti MG, Dodson CC. Evaluation of information available on the internet regarding anterior cruciate ligament reconstruction. Arthroscopy. 2013;29(6):1101-1107.
Silicone Arthroplasty After Ankylosis of Proximal Interphalangeal Joints in Rheumatoid Arthritis: A Case Report
Rheumatoid arthritis (RA) commonly affects the hand and fingers, most often at the metacarpophalangeal and proximal interphalangeal (PIP) joints. Synovitis, tendon ruptures, Boutonnière and swan-neck deformities, and joint destruction often occur. Bony ankylosis is not commonly described yet frequently occurs in patients with RA.1
Implant arthroplasty is an established treatment for arthritis of the hand and fingers. Indications for its use include RA, osteoarthritis, and posttraumatic arthritis. Most patients treated with implant arthroplasty can expect pain relief and 40° to 65° of PIP joint motion.2,3 Silicone arthroplasty historically has been used for pain relief but not for restoration of motion in an ankylosed joint. To our knowledge, there are no reports of using implant arthroplasty in the treatment of spontaneous ankylosis in RA. Contraindications for this procedure would include infection, irreparable flexor or extensor apparatus, and severe medical comorbidities.
In this article, we report a case of PIP joint autofusion treated with silicone PIP arthroplasty in a patient with RA. The patient provided written informed consent for print and electronic publication of this case report.
Case Report
A 56-year-old woman who had had RA for more than 20 years underwent left carpometacarpal arthroplasty and thumb reconstruction. She subsequently presented with complaints of progressively worsening functioning of the left ring and small fingers. On initial evaluation, her PIP joints were fused in about 15° of flexion. Radiographs (Figures 1A, 1B) showed severe diffuse arthritis of the hands and complete bony ankylosis of the ring- and small-finger PIP joints with radial deviation of the ring-finger middle phalanx. The patient had minimal pain but wanted improved hand motion and opted for takedown of the ankylosis with silicone PIP joint arthroplasty.
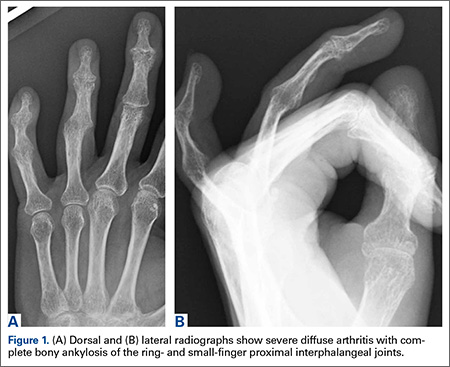
Radial dorsal incisions were made over the PIP joints of the ring and small fingers. As is not the case with arthroplasty for routine PIP joint arthritis, presence of bony ankylosis made identification of the native PIP joint more difficult. The transverse retinacular ligament was identified and opened, and the collateral ligament, which was not ankylosed, was dissected off the proximal phalanx. These landmarks were useful in locating the PIP joint, and proper positioning was confirmed with fluoroscopy. The ankylosed joint space was opened with an osteotome, and about 8 to 10 mm of bone was resected to create space for the instrumentation. As the amount of scarring within the flexor tendon sheath was not significant, restoration of motion did not require extensive tenolysis. The extensor mechanism was slightly contracted, but the bony resection allowed flexion to be restored. The distal portion of the proximal phalanx was then resected. The proximal and middle phalanges were reamed, and a silicone prosthesis was placed with the finger held straight. The collateral ligament was repaired back to the proximal phalanx with 4-0 polydioxanone sutures placed through a bone tunnel created with a Kirschner wire. The skin was closed with 4-0 nylon, and a postoperative splint was applied.
The initial postoperative course was unremarkable. The patient was immobilized in 10° of PIP joint flexion for 10 days, and therapy was initiated after the splint was removed. Twenty-four months after surgery, the patient was pain-free and had 60° of active PIP joint flexion, with extensor lag of only 10°. Clinically, alignment of the fingers was satisfactory; there was mild persistent radial deviation of 10° to 15° (Figures 2A, 2B). Radiographs showed good positioning of the implants (Figures 3A, 3B) and no sign of coronal instability. The patient was satisfied with her improved functioning and returned to employment as a hospital clerk, working full-time.
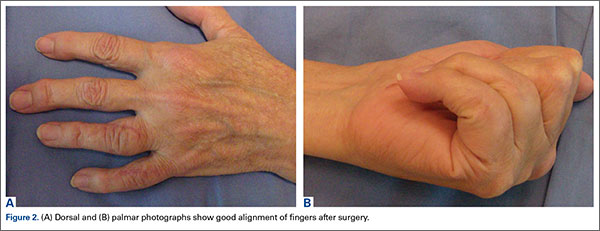
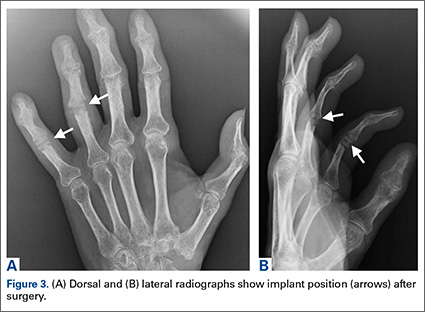
Discussion
RA of the hand and fingers can be painful and disabling. Although there are several treatment options for many of the most common manifestations, options are limited for bony ankylosis of the finger joints. The patient described in this case report had minimal pain, but the loss of motion of the PIP joints in her ring and small fingers created difficulties for her at work. She wanted surgery that would improve the functioning of her fingers. PIP joint arthroplasty traditionally has been the treatment of choice for PIP joint arthritis. In 1985, Swanson and colleagues2 reported on more than 400 silicone PIP arthroplasties performed over 16 years. Mean range of motion (ROM) was between 45° and 60°, with 70% of patients having ROM of more than 40°. Pain relief was complete in 98% of cases. Complications included implant fracture (5%) and recurrent or new deformities (6.5%). A 10.9% revision rate was noted at minimum 1-year follow-up. Recent implants made of improved biomaterials hold promise, but longer term follow-up is still needed.
Silicone arthroplasty has also been used as an effective treatment for non-RA of the PIP joint. Bales and colleagues4 reviewed long-term results of silicone arthroplasty for PIP joint osteoarthritis in 22 patients. At a mean of 10 years, mean QuickDASH (Disabilities of the Arm, Shoulder, and Hand) score was 17, mean visual analog scale score for pain was 0.4, and implant survivorship was 90%. Despite unchanged ROM and considerable implant deformation or fracture, patients’ pain relief and satisfaction were consistent.
Hage and colleagues5 reviewed long-term results of silicone PIP arthroplasty for posttraumatic arthritis in 14 patients. Most of the patients were satisfied: Although they had notable rotational deformity, alignment deviation, and loss of pinch strength and ROM, they were pain-free. The authors concluded that silicone arthroplasty should be used for posttraumatic arthrosis cases in which associated adhesions may be corrected with simple tenolysis, and even in these cases the objective results may not be as good as the subjective outcome.
Kaye6 used radiographs to determine the incidence of bony ankylosis in 203 patients with RA. Hand and wrist radiographs of 48 (23.6%) of these patients showed ankylosis, and 34 of the 48 patients had 2 or more joints fused. On a questionnaire, patients with ankylosis indicated more difficulty with activities of daily living and more limited activity. The authors concluded that radiographic bony ankylosis was a relatively common feature of RA and a marker of disease that was clinically, radiographically, and functionally more severe.
The patient described in this case report had a satisfactory result after PIP joint arthroplasty. At 2-year follow-up, she remained pain-free, and her previously ankylosed PIP joint had an arc of motion of 10° to 60°. Most patients with bony ankylosis of PIP joints present with minimal pain and do not seek surgical treatment. However, patients with ankylosis that limits functioning or activities of daily living may wish to pursue intervention that could be restorative. PIP joint arthroplasty may be effective in improving motion in patients with bony ankylosis of the finger joints.
1. Kaye JJ, Callahan LF, Nance EP Jr, Brooks R, Pincus T. Bony ankylosis in rheumatoid arthritis. Associations with longer duration and greater severity of disease. Invest Radiol. 1987;22(4):303-309.
2. Swanson AB, Maupin BK, Gajjar NV, Swanson GD. Flexible implant arthroplasty in the proximal interphalangeal joint of the hand. J Hand Surg Am. 1985;10(6 pt 1):796-805.
3. Rizzo M, Beckenbaugh RD. Proximal interphalangeal joint arthroplasty. J Am Acad Orthop Surg. 2007;15(3):189-197.
4. Bales J, Wall L, Stern PJ. Long-term results of Swanson silicone arthroplasty for proximal interphalangeal joint osteoarthritis. J Hand Surg Am. 2014;39(3):455-461.
5. Hage J, Yoe E, Zering J, de Groot P. Proximal interphalangeal joint silicone arthroplasty for posttraumatic arthritis. J Hand Surg Am. 1999;24(1):73-77.
6. Kaye JJ. Radiographic assessment of rheumatoid arthritis. Rheum Dis Clin North Am. 1995;21(2):395-406.
Rheumatoid arthritis (RA) commonly affects the hand and fingers, most often at the metacarpophalangeal and proximal interphalangeal (PIP) joints. Synovitis, tendon ruptures, Boutonnière and swan-neck deformities, and joint destruction often occur. Bony ankylosis is not commonly described yet frequently occurs in patients with RA.1
Implant arthroplasty is an established treatment for arthritis of the hand and fingers. Indications for its use include RA, osteoarthritis, and posttraumatic arthritis. Most patients treated with implant arthroplasty can expect pain relief and 40° to 65° of PIP joint motion.2,3 Silicone arthroplasty historically has been used for pain relief but not for restoration of motion in an ankylosed joint. To our knowledge, there are no reports of using implant arthroplasty in the treatment of spontaneous ankylosis in RA. Contraindications for this procedure would include infection, irreparable flexor or extensor apparatus, and severe medical comorbidities.
In this article, we report a case of PIP joint autofusion treated with silicone PIP arthroplasty in a patient with RA. The patient provided written informed consent for print and electronic publication of this case report.
Case Report
A 56-year-old woman who had had RA for more than 20 years underwent left carpometacarpal arthroplasty and thumb reconstruction. She subsequently presented with complaints of progressively worsening functioning of the left ring and small fingers. On initial evaluation, her PIP joints were fused in about 15° of flexion. Radiographs (Figures 1A, 1B) showed severe diffuse arthritis of the hands and complete bony ankylosis of the ring- and small-finger PIP joints with radial deviation of the ring-finger middle phalanx. The patient had minimal pain but wanted improved hand motion and opted for takedown of the ankylosis with silicone PIP joint arthroplasty.
Radial dorsal incisions were made over the PIP joints of the ring and small fingers. As is not the case with arthroplasty for routine PIP joint arthritis, presence of bony ankylosis made identification of the native PIP joint more difficult. The transverse retinacular ligament was identified and opened, and the collateral ligament, which was not ankylosed, was dissected off the proximal phalanx. These landmarks were useful in locating the PIP joint, and proper positioning was confirmed with fluoroscopy. The ankylosed joint space was opened with an osteotome, and about 8 to 10 mm of bone was resected to create space for the instrumentation. As the amount of scarring within the flexor tendon sheath was not significant, restoration of motion did not require extensive tenolysis. The extensor mechanism was slightly contracted, but the bony resection allowed flexion to be restored. The distal portion of the proximal phalanx was then resected. The proximal and middle phalanges were reamed, and a silicone prosthesis was placed with the finger held straight. The collateral ligament was repaired back to the proximal phalanx with 4-0 polydioxanone sutures placed through a bone tunnel created with a Kirschner wire. The skin was closed with 4-0 nylon, and a postoperative splint was applied.
The initial postoperative course was unremarkable. The patient was immobilized in 10° of PIP joint flexion for 10 days, and therapy was initiated after the splint was removed. Twenty-four months after surgery, the patient was pain-free and had 60° of active PIP joint flexion, with extensor lag of only 10°. Clinically, alignment of the fingers was satisfactory; there was mild persistent radial deviation of 10° to 15° (Figures 2A, 2B). Radiographs showed good positioning of the implants (Figures 3A, 3B) and no sign of coronal instability. The patient was satisfied with her improved functioning and returned to employment as a hospital clerk, working full-time.
Discussion
RA of the hand and fingers can be painful and disabling. Although there are several treatment options for many of the most common manifestations, options are limited for bony ankylosis of the finger joints. The patient described in this case report had minimal pain, but the loss of motion of the PIP joints in her ring and small fingers created difficulties for her at work. She wanted surgery that would improve the functioning of her fingers. PIP joint arthroplasty traditionally has been the treatment of choice for PIP joint arthritis. In 1985, Swanson and colleagues2 reported on more than 400 silicone PIP arthroplasties performed over 16 years. Mean range of motion (ROM) was between 45° and 60°, with 70% of patients having ROM of more than 40°. Pain relief was complete in 98% of cases. Complications included implant fracture (5%) and recurrent or new deformities (6.5%). A 10.9% revision rate was noted at minimum 1-year follow-up. Recent implants made of improved biomaterials hold promise, but longer term follow-up is still needed.
Silicone arthroplasty has also been used as an effective treatment for non-RA of the PIP joint. Bales and colleagues4 reviewed long-term results of silicone arthroplasty for PIP joint osteoarthritis in 22 patients. At a mean of 10 years, mean QuickDASH (Disabilities of the Arm, Shoulder, and Hand) score was 17, mean visual analog scale score for pain was 0.4, and implant survivorship was 90%. Despite unchanged ROM and considerable implant deformation or fracture, patients’ pain relief and satisfaction were consistent.
Hage and colleagues5 reviewed long-term results of silicone PIP arthroplasty for posttraumatic arthritis in 14 patients. Most of the patients were satisfied: Although they had notable rotational deformity, alignment deviation, and loss of pinch strength and ROM, they were pain-free. The authors concluded that silicone arthroplasty should be used for posttraumatic arthrosis cases in which associated adhesions may be corrected with simple tenolysis, and even in these cases the objective results may not be as good as the subjective outcome.
Kaye6 used radiographs to determine the incidence of bony ankylosis in 203 patients with RA. Hand and wrist radiographs of 48 (23.6%) of these patients showed ankylosis, and 34 of the 48 patients had 2 or more joints fused. On a questionnaire, patients with ankylosis indicated more difficulty with activities of daily living and more limited activity. The authors concluded that radiographic bony ankylosis was a relatively common feature of RA and a marker of disease that was clinically, radiographically, and functionally more severe.
The patient described in this case report had a satisfactory result after PIP joint arthroplasty. At 2-year follow-up, she remained pain-free, and her previously ankylosed PIP joint had an arc of motion of 10° to 60°. Most patients with bony ankylosis of PIP joints present with minimal pain and do not seek surgical treatment. However, patients with ankylosis that limits functioning or activities of daily living may wish to pursue intervention that could be restorative. PIP joint arthroplasty may be effective in improving motion in patients with bony ankylosis of the finger joints.
1. Kaye JJ, Callahan LF, Nance EP Jr, Brooks R, Pincus T. Bony ankylosis in rheumatoid arthritis. Associations with longer duration and greater severity of disease. Invest Radiol. 1987;22(4):303-309.
2. Swanson AB, Maupin BK, Gajjar NV, Swanson GD. Flexible implant arthroplasty in the proximal interphalangeal joint of the hand. J Hand Surg Am. 1985;10(6 pt 1):796-805.
3. Rizzo M, Beckenbaugh RD. Proximal interphalangeal joint arthroplasty. J Am Acad Orthop Surg. 2007;15(3):189-197.
4. Bales J, Wall L, Stern PJ. Long-term results of Swanson silicone arthroplasty for proximal interphalangeal joint osteoarthritis. J Hand Surg Am. 2014;39(3):455-461.
5. Hage J, Yoe E, Zering J, de Groot P. Proximal interphalangeal joint silicone arthroplasty for posttraumatic arthritis. J Hand Surg Am. 1999;24(1):73-77.
6. Kaye JJ. Radiographic assessment of rheumatoid arthritis. Rheum Dis Clin North Am. 1995;21(2):395-406.