User login
Bringing you the latest news, research and reviews, exclusive interviews, podcasts, quizzes, and more.
div[contains(@class, 'read-next-article')]
div[contains(@class, 'nav-primary')]
nav[contains(@class, 'nav-primary')]
section[contains(@class, 'footer-nav-section-wrapper')]
nav[contains(@class, 'nav-ce-stack nav-ce-stack__large-screen')]
header[@id='header']
div[contains(@class, 'header__large-screen')]
div[contains(@class, 'read-next-article')]
div[contains(@class, 'main-prefix')]
div[contains(@class, 'nav-primary')]
nav[contains(@class, 'nav-primary')]
section[contains(@class, 'footer-nav-section-wrapper')]
footer[@id='footer']
section[contains(@class, 'nav-hidden')]
div[contains(@class, 'ce-card-content')]
nav[contains(@class, 'nav-ce-stack')]
div[contains(@class, 'view-medstat-quiz-listing-panes')]
div[contains(@class, 'pane-article-sidebar-latest-news')]
Novel liver dialysis device may safely curb ACLF
An investigational liver dialysis device (DIALIVE) was associated with significantly greater survival of patients with acute-on-chronic liver failure (ACLF), compared with the standard of care in a multicenter randomized study.
Among 30 evaluable patients with ACLF from alcoholic cirrhosis randomized to treatment with the DIALIVE system or standard of care, two-thirds of patients assigned to DIALIVE had both survived and experienced resolution of ACLF by 28 days, compared with one-third of patients assigned to standard of care, reported Banwari Agarwal, MBBS, MD from the Royal Free Hospital in London at the meeting sponsored by the European Association for the Study of the Liver.
Different from MARS
The DIALIVE system differs from the Molecular Adsorbent Recirculating System (MARS) liver dialysis system in that DIALIVE removes and replaces albumin, including proinflammatory albumin, rather than filtering and recirculating it, he explained.
“It addresses systemic inflammation, which wasn’t quite the case with MARS,” he said in the question-and-answer portion of his presentation in a general session.
In patients with ACLF, the risk of 28-day mortality increases substantially as the grade of ACLF increases.
“ACLF, however, is potentially reversible, and the initial grade at presentation undergoes changes over time during the natural course of the illness, with some patients deteriorating, some improving, and some even achieving complete ACLF resolution. The final grade is reached by days 3-7, and it is this final grade which determines their future outcome trajectory. I therefore propose that ACLF resolution in itself is an important therapeutic target,” he said.
Study details
Dr. Agarwal and coinvestigators from eight centers in six European countries enrolled patients with a history indicative of alcohol-related cirrhosis, at least one acute decompensation event, and progression to ACLF grades 1, 2, or 3a.
Patients with an international normalized ratio above 3 were excluded, as were those with more than three organ failures, uncontrolled infections, patients with primary respiratory organ failure, and those with hemodynamic instability refractory to volume resuscitation and low-dose vasopressors.
A total of 32 patients, of whom 30 were evaluable, were randomized to receive liver dialysis in three to five DIALIVE sessions lasting 8-12 hours each (15 evaluable patients) or to standard of care at participating institutions (15 patients).
The investigators looked at safety of the device (the primary endpoint) in all patients who received at least one DIALIVE treatment (safety population), and a modified safety population of patients who received at least three DIALIVE treatments.
The median patient age in each arm was 49 years, and all patients had alcoholic cirrhosis, with alcoholic hepatitis accounting for at least one decompensation event. In addition, about 25% of patients in each arm had decompensation with infections and/or sepsis as precipitating factors.
Safety
Serious adverse events on days 1-10 occurred in 11 of 17 patients in the DIALIVE arm, and in 8 in the standard-of-care arm. In the DIALIVE arm, there were seven treatment-related serious device events, three unexpected serious device events (anemia, septic shock, and hypotension), and one patient discontinued dialysis after having unsafe levels of thrombocytopenia.
Four patients in the DIALIVE arm died on study. The first two died on day 1 one from hypotension, coagulopathy, and multiorgan failure, and this prompted a change in the protocol mandating that DIALIVE be conducted only in an ICU setting with more invasive monitoring and more frequent lab analysis of clotting and other biochemical parameters. Of the two other patients in the DIALIVE arm who on died on study, one died from non-MI cardiac arrest on day 8, and one patient with ACLF grade 3 and a European Foundation for the study of chronic liver failure (CLIF)–ACLF score of 68 died from multiorgan failure.
“I must emphasize that even this very sick patient tolerated the device very, very well,” Dr. Agarwal said.
In the standard-of-care arm, two patients died from progressive liver failure on days 17 and 27, respectively, and one died on day 17 from bacterial infections, bleeding, and progressive liver failure.
There were eight instances of filters clotting out of 64 filters used in total, and four episodes of device deficiency, including two instances where tubing could not be disconnected from an Oxiris filter during setup of the DIALIVE circuit, requiring use of new DIALIVE kits; one use of an incorrect dialysis fluid; and one incorrect setup of the DIALIVE circuit.
Significant improvements in many scores
In the DIALIVE group, there were significant improvements over baseline at day 10 in both liver scores (P < .05) and brain scores (P < .001). In contrast, in the standard-of-care group there were no improvements in individual organ scores, and respiration scores were significantly worse (P < .01).
DIALIVE was also associated with significant improvements in CLIF-C organ failure scores, compared with standard of care at day 5 and day 10 (P = .021 and .001, respectively); CLIF-C–ACLF scores at days 5 and 10 (P = .045 and .023); and Model for End-Stage Liver Disease scores at day 5 (P = .028).
In the DIALIVE group, 40% of patients had ACLF resolution by day 5, and 66.7% had resolution by day 10. In the standard-of-care arm, 15% had resolution on day 5, and 33.3% had resolution on day 10. DIALIVE was also associated with a significantly faster median time to resolution, compared with standard of care (10 days vs. not reached; P = .0307). At 28 days, 10 of 15 evaluable patients were alive and had resolution of ACLF with DIALIVE versus 5 of 15 with standard of care (P = .0281).
Dr. Agarwal said that the data justify the implementation of late-phase clinical trials of the liver dialysis device.
‘Hopeful’ findings
“It’s very early, but we’re really desperate in finding something to bridge to transplantation,” commented Tobias Boettler, MD, from the University of Freiburg (Germany), who was not involved in the study.
“I think this is very hopeful,” said Dr. Boettler, who moderated the briefing where Dr. Agarwal summarized the study findings.
In the question and answer following the talk in a general session, moderator Philip N. Newsome, MD, from University Hospitals Birmingham (England) asked whether patients who were not treated should have been included in the analysis.
Dr. Agarwal replied that “the whole idea behind this study was to understand what this device does to these patients, and how these patients react to this device, so really not looking at the efficacy.”
The study was supported by the European Union’s Horizon 2020 initiative. Dr. Agarwal received a study grant from the initiative, but had no other relevant disclosures. Dr. Boettler and Dr. Newsome had no disclosures relevant to the study.
FROM ILC 2021
Worse survival with recurrent AIH after transplant
Autoimmune hepatitis that recurs following a liver transplant can impair both graft survival and overall survival, results of a large international study showed.
Among 736 patients with autoimmune hepatitis who underwent liver transplant and were followed for up to 20 years, those who had recurrent AIH had a more than 10-fold higher risk for graft failure and a more than twofold higher risk of death, compared with patients who did not have recurrences, reported Aldo J. Montano-Loza, MD, MSc, PhD, from the University of Alberta, Edmonton.
“Recurrent disease impacts graft and overall survival, highlighting the need for improved management strategies,” he said in an oral abstract presentation during the International Liver Congress sponsored by the European Association for the Study of the Liver.
AIH is characterized by the presence of high IgG levels, autoantibodies, and histologic evidence of interface hepatitis. Most patients with AIH respond to immunosuppressive therapy, but some have progression to end-stage liver disease; for these patients, a liver transplant can be lifesaving, with 1-year survival of approximately 90%, and 5-year survival of about 70%, he said.
AIH frequently recurs after transplant, and although previous studies have suggested that recurrent disease does not adversely affect either graft survival or long-term survival, those studies had limited patient numbers and inadequate follow-up, Dr. Montano-Loza said.
He cited two recent studies, one from UNOS, the United Network for Organ Sharing, and the other from ELTR, the European Liver Transplant Registry, that showed that overall survival after liver transplant was worse for patients with AIH, compared with those who underwent transplant for other autoimmune liver diseases.
Multicenter retrospective study
To get a better picture of long-term posttransplant outcomes in patients with AIH, investigators in 33 centers in North and South America, Europe, and Asia conducted a retrospective cohort study. Their goal was to establish the frequency of recurrent AIH, identify clinical factors and biomarkers for higher risk of recurrence, and evaluate the association between recurrent AIH and both patient and graft survival.
They accomplished this by performing chart reviews, including data on demographics, IgG levels before transplant, and Model for End-Stage Liver Disease scores.
They also collected data on serum liver function tests within the first year after transplant, posttransplant infections, rejection episodes, and immunosuppressive regimens, as well as variables such as donor age and sex, sex mismatch between donor and recipients, calendar year of transplant, and transplant volume for AIH at each center.
Of the 736 patients, 563 (76%) were female. The mean age at AIH diagnosis was 34 years, and the mean age at transplant was 42 years. About one-fifth of patients (21%) had concomitant autoimmune diseases.
Posttransplant immunosuppression regimens included the usual suspects: tacrolimus in 78% of patients, cyclosporine in 11%, prednisone in 76%, mycophenolate mofetil in 55%, and azathioprine in 10%.
In all, 147 of the 736 patients had a diagnosis of recurrent AIH. The investigators found that the cumulative probability of recurrent AIH was 49% after 20 years of follow-up.
Risk factors identified
In multivariate analysis controlling for age, concomitant disease, immunosuppressive regimens, organ-sex mismatch, acute rejection, liver function tests, bilirubin, and IgG, factors significantly associated with AIH recurrence included age 42 or younger at the time of transplant (hazard ratio, 3.15; P = .02), use of mycophenolate mofetil after transplant (HR, 3.06; P = .005), donor/recipient sex mismatch (HR, 2.57; P = .003), and high IgG levels pretransplant (HR, 1.04; P = .004).
Among 529 patients who had a liver biopsy after transplant, factors that remained as significant predictors of AIH recurrence were posttransplant mycophenolate mofetil (HR, 2.75; P = .003), donor/recipient sex mismatch (HR, 2.03; P = .02), and pretransplant IgG levels (HR, 1.04 per each g/L; P = .001).
An analysis of features associated with graft survival showed that recurrent AIH was associated with significantly increased risk for graft failure (HR, 10.79; P < .001). Patients with high bilirubin levels 1 year after transplantation were also at higher risk for failure (HR, 1.004 per micromol/L; P < .001).
Factors significantly associated with survival were recurrence of AIH (HR for death, 2.53; P = .001), elevated ALT at 12 months after transplant (HR, 1.002; P = .004), and elevated bilirubin at 12 months (HR, 1.003 per micromol/L; P < .001).
The investigators acknowledged that the study was limited by the retrospective design and by the fact that the diagnosis of recurrent AIH may have differed between centers that performed liver biopsy according to protocol and those that performed them only when clinically indicated, which may have resulted in differences in time to diagnosis.
Possible explanations for risk factors
In the question-and-answer session following his presentation, comoderator moderator Philip N. Newsome, PhD, from University Hospitals Birmingham (England), asked: “In terms of age, is that a reflection of worse disease, or is it adherence, or is it a combination, and should we be managing those patients more aggressively with immunosuppression?”
“We consider age is more a reflection of an aggressive disease,” Dr. Montano-Loza said. “Basically, in the univariate analysis we found that patients with a diagnosis at a younger age and even a transplant at a younger age were definitely associated with a higher risk of recurrence, so we think this is more related to an aggressive [disease] behavior in younger patient that translates into worse clinical outcomes.”
He added that patients younger than 40 who require transplants should be closely monitored for recurrence.
“Actually, we could make the argument that maybe these patients will benefit from protocol biopsies,” he said.
He noted that 15% of patients had significant fibrosis at the time of recurrent AIH diagnosis, and that the recurrences were not detected by laboratory monitoring alone.
Asked by an audience member why mycophenolate mofetil was associated with increased risk for recurrence, Dr. Montano-Loza replied that the retrospective nature of the data precludes the possibility of a definitive answer, but he noted that, for patients with other autoimmune liver diseases, the type of immunosuppression used has an impact on recurrence rates.
“For example, cyclosporine has a protective effect for patients transplanted for primary biliary cholangitis,” he said.
He said it may also be possible that there is a rebound effect leading to recurrence when patients are taken off mycophenolate or switched to another agent.
The study was supported by grants to individual researchers. Dr. Montano-Loza and Dr. Newsome reported having no relevant conflicts of interest.
FROM ILC 2021
New COVID-19 vaccinations decline again in 12- to 15-year-olds
Even though less than 21% of all children aged 12-15 years are fully vaccinated against COVID-19, the number seeking first vaccinations continues to decline, according to data from the Centers for Disease Control and Prevention.

and 462,000 during the week ending June 14. Collectively, 30.2% of 12- to 15-year-olds have gotten at least one dose of vaccine so far and 20.7% are now fully vaccinated, the CDC said on its COVID Data Tracker site.
Among children aged 16-17 years, who were able to start the vaccination process earlier, 42.9% have received at least one dose and 34.0% have completed the COVID-19 vaccine regimen. Vaccine initiation – measured as the proportion of all individuals getting a first shot over the previous 2 weeks – has been consistently around 4.8% during the month of June for this age group but has dropped from 17.9% on June 7 to 14.3% on June 28 for those aged 12-15, the CDC data show.
Looking at the same measure for vaccine completion, 16.7% of all those who reached full vaccination status in the 14 days ending June 28 were 12- to 15-years-olds, down from 21.5% on June 21 and 19.6% on June 14. The numbers for those aged 15-16 were, respectively, 4.6%, 4.5%, and 4.2%, the CDC reported.
Fortunately, in the wake of recent vaccination trends, new cases of COVID-19 in children were down to their lowest level – just 8,447 for the week ending June 24 – since May of 2020, according to a new report from the American Academy of Pediatrics and the Children’s Hospital Association.
New cases had been well over 15,000 the previous week (June 17), following weeks of 14,000 (June 10) and 16,000 (June 3) new cases, so the latest drop down to just four digits represents a 1-week decline of over 46% in the 49 states (excluding New York) that are reporting age distribution, along with the District of Columbia, New York City, Puerto Rico, and Guam.
The cumulative number of child COVID-19 cases in those jurisdictions is about 4.03 million since the beginning of the pandemic, which represents 14.2% of all cases in the United States. At the state level, the cumulative rate of cases in children is highest in Vermont (22.7%) and lowest in Florida (8.9%), which uses an age range of 0-14 years for children, compared with 0-17 or 0-19 for most states, the AAP and CHA said.
Severe illness has been rare in children, which is reflected in the proportion of children among all hospitalizations, 2.2% in 24 jurisdictions, and the proportion of deaths, 0.06% in 46 jurisdictions, since the start of the pandemic, the AAP and CHA said, with a total of 336 COVID-19–related deaths reported.
Even though less than 21% of all children aged 12-15 years are fully vaccinated against COVID-19, the number seeking first vaccinations continues to decline, according to data from the Centers for Disease Control and Prevention.
and 462,000 during the week ending June 14. Collectively, 30.2% of 12- to 15-year-olds have gotten at least one dose of vaccine so far and 20.7% are now fully vaccinated, the CDC said on its COVID Data Tracker site.
Among children aged 16-17 years, who were able to start the vaccination process earlier, 42.9% have received at least one dose and 34.0% have completed the COVID-19 vaccine regimen. Vaccine initiation – measured as the proportion of all individuals getting a first shot over the previous 2 weeks – has been consistently around 4.8% during the month of June for this age group but has dropped from 17.9% on June 7 to 14.3% on June 28 for those aged 12-15, the CDC data show.
Looking at the same measure for vaccine completion, 16.7% of all those who reached full vaccination status in the 14 days ending June 28 were 12- to 15-years-olds, down from 21.5% on June 21 and 19.6% on June 14. The numbers for those aged 15-16 were, respectively, 4.6%, 4.5%, and 4.2%, the CDC reported.
Fortunately, in the wake of recent vaccination trends, new cases of COVID-19 in children were down to their lowest level – just 8,447 for the week ending June 24 – since May of 2020, according to a new report from the American Academy of Pediatrics and the Children’s Hospital Association.
New cases had been well over 15,000 the previous week (June 17), following weeks of 14,000 (June 10) and 16,000 (June 3) new cases, so the latest drop down to just four digits represents a 1-week decline of over 46% in the 49 states (excluding New York) that are reporting age distribution, along with the District of Columbia, New York City, Puerto Rico, and Guam.
The cumulative number of child COVID-19 cases in those jurisdictions is about 4.03 million since the beginning of the pandemic, which represents 14.2% of all cases in the United States. At the state level, the cumulative rate of cases in children is highest in Vermont (22.7%) and lowest in Florida (8.9%), which uses an age range of 0-14 years for children, compared with 0-17 or 0-19 for most states, the AAP and CHA said.
Severe illness has been rare in children, which is reflected in the proportion of children among all hospitalizations, 2.2% in 24 jurisdictions, and the proportion of deaths, 0.06% in 46 jurisdictions, since the start of the pandemic, the AAP and CHA said, with a total of 336 COVID-19–related deaths reported.
Nocturnal hypoglycemia halved with insulin degludec vs. glargine
Patients with type 1 diabetes who used insulin degludec as their basal insulin had fewer than half the number of nocturnal hypoglycemia events, compared with patients who used insulin glargine U100, in a head-to-head crossover study with 51 patients who had a history of nighttime hypoglycemia episodes.
Patients with type 1 diabetes who are “struggling with nocturnal hypoglycemia would benefit from insulin degludec treatment,” said Julie M. Brøsen, MD, at the annual scientific sessions of the American Diabetes Association.
Accumulating evidence for less hypoglycemia with insulin degludec
Results from several studies comparing insulin degludec (Tresiba), a second-generation, longer-acting insulin with more stable steady-state performance, with the first-generation basal insulin analogue glargine (Lantus), have built the case that degludec produces fewer hypoglycemia events.
The landmark SWITCH 1 crossover study published in 2017 showed in about 500 patients with type 1 diabetes and a risk factor for hypoglycemia that treatment with insulin degludec led to significantly few total hypoglycemia episodes and significantly fewer nocturnal episodes, compared with insulin glargine.
Next came similar findings from ReFLeCT, a multicenter observational study that followed 556 unselected patients with type 1 diabetes in routine practice settings who switched to insulin degludec following treatment with a different basal insulin. The results again showed a significant drop-off in total, nonsevere, severe, and nocturnal hypoglycemia events.
Homing in on higher-risk patients
The current study, HypoDeg (Insulin Degludec and Symptomatic Nocturnal Hypoglycaemia), ran at 10 Danish centers and enrolled 149 adults with type 1 diabetes who had at least one episode of severe nocturnal hypoglycemia within the prior 2 years, focusing on patients most at risk for future nocturnal hypoglycemia events. In an unusual study design, researchers identified nocturnal hypoglycemic episodes with hourly venous blood samples drawn from a subcutaneous line.
They randomized the patients to basal insulin treatment with either insulin degludec or to insulin glargine U100, allowed their treatment to stabilize for 3 months, and then tallied nocturnal hypoglycemia events for 9 months. They then crossed patients to the alternative basal insulin and repeated the process.
Results from the full study have not yet appeared in published form but were in a pair of reports at the 2020 scientific sessions of the ADA.
One report included findings based on 136 episodes of severe hypoglycemia identified clinically and showed these events occurred 35% less often during treatment with insulin degludec, a significant difference. The overall finding was primarily driven by 48% fewer episodes of severe nocturnal hypoglycemia, but this difference was not significant.
The second report identified hypoglycemia events with continuous glucose monitoring in 74 of the study participants, which identified 193 episodes of nonsevere nocturnal hypoglycemia and found that treatment with insulin degludec cut the rate by 47%, primarily by reducing asymptomatic episodes.
Hourly blood draws track overnight hypoglycemia
The current study included 51 of the 149 HypoDeg patients who agreed to undergo overnight blood sampling and had this done at least once while treated with each of the two study insulins. (The study design called for two blood sampling nights for each willing patient during each of the two treatment periods.) The 51 patients had type 1 diabetes for an average of 28 years and an average age of 58 years. Two-thirds were men, their baseline A1c was 7.8%, and on average had 2.6 episodes of severe nocturnal hypoglycemia during the prior 2 years.
The researchers drew hourly blood specimens on a total of 196 nights from the 51 participating patients and identified 57 nights when blood glucose levels reached hypoglycemia thresholds in 33 patients. One-third of the events occurred when patients were on insulin degludec treatment, and two-thirds when they were on insulin glargine, reported Dr. Brøsen.
She presented three separate analyses of the data. One analysis focused on level 1 hypoglycemia events, when blood glucose dips to 70 mg/dL or less, which occurred 54% less often when patients were on insulin degludec. A second analysis looked at level 2 events, when blood glucose falls below 54 mg/dL, and treatment with insulin degludec cut this by 64% compared with insulin glargine. The third analysis focused on symptomatic events when blood glucose was 70 mg/dL or less, and treatment with insulin degludec linked with a 62% cut in this metric. All three between-group differences were significant.
Evidence supports already-changed practice
This new evidence “supports recommending” insulin degludec over insulin glargine, commented Bastiaan E. de Galan, MD, PhD, an endocrinologist and professor at Maastrict (the Netherlands) University Medical Center. The new results “extend those from previous trials in populations with type 1 diabetes that were unselected for the risk of hypoglycemia. In clinical practice, insulin degludec is already considered for patients who reported nocturnal hypoglycemia while on insulin glargine U100, but it’s great this study provides the scientific evidence,” said Dr. de Galan in an interview.

“The lower rate of nocturnal hypoglycemia with degludec, compared with glargine U100 is well established. Inpatient assessment of hypoglycemia with measurement of hourly plasma glucose allowed HypoDeg to provide stronger evidence than prior studies. The benefit of delgudec versus glargine U100 was significant and clinically meaningful, in hypo-prone patients who would benefit the most” by using insulin degludec, commented Gian Paolo Fadini, MD, an endocrinologist at the University of Padova (Italy), and a lead investigator on the ReFLeCT study.
But insulin degludec is not a completely silver bullet. Its prolonged duration of action and stability that may in part explain why it limits hypoglycemia events can also be a drawback: “It probably offers fewer options for flexibility. Any change in dose takes at least a day or 2 to settle, which may be unfavorable in certain circumstances,” noted Dr. de Galan.
“I wouldn’t recommend insulin degludec for all patients with type 1 diabetes. It’s an individual evaluation in each patient,” said Dr. Brøsen. “We will be looking into whether some patients are better off on insulin glargine.”
Cost makes a difference
Another, potentially more consequential flaw is insulin degludec’s relative expense.
“To date, use of degludec in routine practice has been limited by its cost, compared with older basal insulins,” observed Dr. Fadini in an interview. “In several countries, including the United States, degludec is substantially more expensive than glargine.”
The ADA’s Standards of Medical Care in Diabetes–2021 includes table 9.3 that lists the costs of various insulins and shows the median average wholesale price of insulin glargine U100 follow-on products as $190/vial, compared with a $407 price for a similar vial of insulin degludec.

Insulin degludec “is clearly superior from a hypoglycemia standpoint. Patients with type 1 diabetes like the reduction because hypoglycemia is scary, and dangerous. The main issue is cost, and the extent to which it may be covered by insurance,” commented Lisa Chow, MD, an endocrinologist at the University of Minnesota, Minneapolis. “We generally won’t prescribe degludec unless it is at a price affordable to the patient. We try to use patient assistance programs sponsored by the company [that markets insulin degludec: Novo Nordisk] to try to make it more affordable.”
Dr. Chow also highlighted that a new wrinkle has been introduction of a more concentrated formulation of insulin glargine, U300, which appears to cause less hypoglycemia than insulin glargine U100. Recent study results indicated that no significant difference exists in the incidence of hypoglycemia among patients treated with insulin glargine U300 and those treated with insulin degludec, such as findings from the BRIGHT trial, which included just over 900 patients, and in the CONCLUDE trial, which randomized more than 1,600 patients.
The HypoDeg study was sponsored by Novo Nordisk, the company that markets insulin degludec. Dr. Brøsen had no personal disclosures, but several of her coauthors were either Novo Nordisk employees or had financial relationships with the company. Dr. de Galan has received research funding from Novo Nordisk. Dr. Fadini has received lecture fees and research funding from Novo Nordisk, from Sanofi, the company that markets insulin glargine, and from several other companies. Dr. Chow has received research funding from Dexcom.
Patients with type 1 diabetes who used insulin degludec as their basal insulin had fewer than half the number of nocturnal hypoglycemia events, compared with patients who used insulin glargine U100, in a head-to-head crossover study with 51 patients who had a history of nighttime hypoglycemia episodes.
Patients with type 1 diabetes who are “struggling with nocturnal hypoglycemia would benefit from insulin degludec treatment,” said Julie M. Brøsen, MD, at the annual scientific sessions of the American Diabetes Association.
Accumulating evidence for less hypoglycemia with insulin degludec
Results from several studies comparing insulin degludec (Tresiba), a second-generation, longer-acting insulin with more stable steady-state performance, with the first-generation basal insulin analogue glargine (Lantus), have built the case that degludec produces fewer hypoglycemia events.
The landmark SWITCH 1 crossover study published in 2017 showed in about 500 patients with type 1 diabetes and a risk factor for hypoglycemia that treatment with insulin degludec led to significantly few total hypoglycemia episodes and significantly fewer nocturnal episodes, compared with insulin glargine.
Next came similar findings from ReFLeCT, a multicenter observational study that followed 556 unselected patients with type 1 diabetes in routine practice settings who switched to insulin degludec following treatment with a different basal insulin. The results again showed a significant drop-off in total, nonsevere, severe, and nocturnal hypoglycemia events.
Homing in on higher-risk patients
The current study, HypoDeg (Insulin Degludec and Symptomatic Nocturnal Hypoglycaemia), ran at 10 Danish centers and enrolled 149 adults with type 1 diabetes who had at least one episode of severe nocturnal hypoglycemia within the prior 2 years, focusing on patients most at risk for future nocturnal hypoglycemia events. In an unusual study design, researchers identified nocturnal hypoglycemic episodes with hourly venous blood samples drawn from a subcutaneous line.
They randomized the patients to basal insulin treatment with either insulin degludec or to insulin glargine U100, allowed their treatment to stabilize for 3 months, and then tallied nocturnal hypoglycemia events for 9 months. They then crossed patients to the alternative basal insulin and repeated the process.
Results from the full study have not yet appeared in published form but were in a pair of reports at the 2020 scientific sessions of the ADA.
One report included findings based on 136 episodes of severe hypoglycemia identified clinically and showed these events occurred 35% less often during treatment with insulin degludec, a significant difference. The overall finding was primarily driven by 48% fewer episodes of severe nocturnal hypoglycemia, but this difference was not significant.
The second report identified hypoglycemia events with continuous glucose monitoring in 74 of the study participants, which identified 193 episodes of nonsevere nocturnal hypoglycemia and found that treatment with insulin degludec cut the rate by 47%, primarily by reducing asymptomatic episodes.
Hourly blood draws track overnight hypoglycemia
The current study included 51 of the 149 HypoDeg patients who agreed to undergo overnight blood sampling and had this done at least once while treated with each of the two study insulins. (The study design called for two blood sampling nights for each willing patient during each of the two treatment periods.) The 51 patients had type 1 diabetes for an average of 28 years and an average age of 58 years. Two-thirds were men, their baseline A1c was 7.8%, and on average had 2.6 episodes of severe nocturnal hypoglycemia during the prior 2 years.
The researchers drew hourly blood specimens on a total of 196 nights from the 51 participating patients and identified 57 nights when blood glucose levels reached hypoglycemia thresholds in 33 patients. One-third of the events occurred when patients were on insulin degludec treatment, and two-thirds when they were on insulin glargine, reported Dr. Brøsen.
She presented three separate analyses of the data. One analysis focused on level 1 hypoglycemia events, when blood glucose dips to 70 mg/dL or less, which occurred 54% less often when patients were on insulin degludec. A second analysis looked at level 2 events, when blood glucose falls below 54 mg/dL, and treatment with insulin degludec cut this by 64% compared with insulin glargine. The third analysis focused on symptomatic events when blood glucose was 70 mg/dL or less, and treatment with insulin degludec linked with a 62% cut in this metric. All three between-group differences were significant.
Evidence supports already-changed practice
This new evidence “supports recommending” insulin degludec over insulin glargine, commented Bastiaan E. de Galan, MD, PhD, an endocrinologist and professor at Maastrict (the Netherlands) University Medical Center. The new results “extend those from previous trials in populations with type 1 diabetes that were unselected for the risk of hypoglycemia. In clinical practice, insulin degludec is already considered for patients who reported nocturnal hypoglycemia while on insulin glargine U100, but it’s great this study provides the scientific evidence,” said Dr. de Galan in an interview.
“The lower rate of nocturnal hypoglycemia with degludec, compared with glargine U100 is well established. Inpatient assessment of hypoglycemia with measurement of hourly plasma glucose allowed HypoDeg to provide stronger evidence than prior studies. The benefit of delgudec versus glargine U100 was significant and clinically meaningful, in hypo-prone patients who would benefit the most” by using insulin degludec, commented Gian Paolo Fadini, MD, an endocrinologist at the University of Padova (Italy), and a lead investigator on the ReFLeCT study.
But insulin degludec is not a completely silver bullet. Its prolonged duration of action and stability that may in part explain why it limits hypoglycemia events can also be a drawback: “It probably offers fewer options for flexibility. Any change in dose takes at least a day or 2 to settle, which may be unfavorable in certain circumstances,” noted Dr. de Galan.
“I wouldn’t recommend insulin degludec for all patients with type 1 diabetes. It’s an individual evaluation in each patient,” said Dr. Brøsen. “We will be looking into whether some patients are better off on insulin glargine.”
Cost makes a difference
Another, potentially more consequential flaw is insulin degludec’s relative expense.
“To date, use of degludec in routine practice has been limited by its cost, compared with older basal insulins,” observed Dr. Fadini in an interview. “In several countries, including the United States, degludec is substantially more expensive than glargine.”
The ADA’s Standards of Medical Care in Diabetes–2021 includes table 9.3 that lists the costs of various insulins and shows the median average wholesale price of insulin glargine U100 follow-on products as $190/vial, compared with a $407 price for a similar vial of insulin degludec.
Insulin degludec “is clearly superior from a hypoglycemia standpoint. Patients with type 1 diabetes like the reduction because hypoglycemia is scary, and dangerous. The main issue is cost, and the extent to which it may be covered by insurance,” commented Lisa Chow, MD, an endocrinologist at the University of Minnesota, Minneapolis. “We generally won’t prescribe degludec unless it is at a price affordable to the patient. We try to use patient assistance programs sponsored by the company [that markets insulin degludec: Novo Nordisk] to try to make it more affordable.”
Dr. Chow also highlighted that a new wrinkle has been introduction of a more concentrated formulation of insulin glargine, U300, which appears to cause less hypoglycemia than insulin glargine U100. Recent study results indicated that no significant difference exists in the incidence of hypoglycemia among patients treated with insulin glargine U300 and those treated with insulin degludec, such as findings from the BRIGHT trial, which included just over 900 patients, and in the CONCLUDE trial, which randomized more than 1,600 patients.
The HypoDeg study was sponsored by Novo Nordisk, the company that markets insulin degludec. Dr. Brøsen had no personal disclosures, but several of her coauthors were either Novo Nordisk employees or had financial relationships with the company. Dr. de Galan has received research funding from Novo Nordisk. Dr. Fadini has received lecture fees and research funding from Novo Nordisk, from Sanofi, the company that markets insulin glargine, and from several other companies. Dr. Chow has received research funding from Dexcom.
FROM ADA 2021
Calories may outweigh nutrients in diets for fatty liver
Intermittent calorie restriction offers only modest advantages over a low-carbohydrate, high-fat (LCHF) diet for treating nonalcoholic fatty liver disease (NAFLD), researchers say.
The intermittent diet offers more benefit for liver stiffness and LDL cholesterol, and might be easier to maintain, said Magnus Holmer, MD, head of the hepatology unit at the Karolinska Institute in Stockholm.
But the intermittent diet also has drawbacks and the differences between the two were slight, he said in an interview.
“They were more or less identically effective in reducing liver steatosis in NAFLD and also reducing body weight,” he said. “And from this, we can say that the composition of macronutrients such as fat or sugar seems to be less important than how many calories you eat.”
Dr. Holmer and colleagues presented their findings at the meeting sponsored by the European Association for the Study of the Liver and published them in JHEP Reports
While previous studies have shown that dieting can effectively treat NAFLD, researchers have debated whether popular LCHF diets might cause more harm than good.
At the same time, intermittent-calorie restriction diets have also been gaining in popularity, particularly the 5:2 diet in which participants eat normally for 5 days a week and restrict their calories the other 2 days.
How do the two diets compare?
To see if one was more effective than the other, the researchers recruited 74 people with NAFLD. They diagnosed the patients either by radiologic assessment or a combination of controlled attenuation parameter (CAP) greater than 280 dB/m and obesity, or a CAP greater than 280 dB/m, elevated ALT, and overweight. Sixteen of the patients were being treated with statins.
The researchers randomly assigned 25 people to an LCHF diet, 25 to a 5:2 diet, and 24 to standard care. The groups were similar in diet, age, body mass index, liver stiffness, and most other criteria at baseline, although there were more women in the standard-care group.
At the start of the study, the participants in the standard-care group consulted with a hepatologist who advised them to avoid sweets and saturated fats, eat three meals a day, and avoid large portions.
The researchers asked women in the 5:2 diet to eat up to 500 kcal/day each of 2 days per week and up to 2,000 kcal/day each of the other 5 days. They asked men in the group to eat up to 600 kcal/day each of 2 days per week and up to 2,400 kcal/day the other 5 days.
They provided all the 5:2 participants with recipes that followed the Nordic Nutrition Recommendations, an adaptation of the Mediterranean diet that emphasizes foods traditional in Nordic countries, particularly grains such as whole-grain rye, oats, and barley; fruits such as apples, pears, berries, and plums; root vegetables, cabbages, onions, peas, beans, fish, boiled potatoes, and dairy products; and the use of rapeseed (canola) oil. The calories provided in the recipes were composed of 45%-60% carbohydrates, 25% fat, and 10%-20% protein.
The researchers asked women in the LCHF diet to eat an average of 1,600 kcal/day and men to eat an average of 1,900 kcal/day. All the participants used recipes based on meat, fish, eggs, low-carbohydrate vegetables, and dairy fat. Participants avoided sugar, bread, pasta, rice, pies, potatoes, and fruit. The calories in the recipes were composed of 5%-10% carbohydrates, 50%-80% fat, and 15%-40% protein.
All the participants reported what they ate over the previous 3 days, both at the start of the study and after 12 weeks. Participants in the 5:2 and LCHF groups also received follow-up calls to report their past 24 hours of eating at 2, 4, 8, and 12 weeks, and also at week 6, when they visited a dietitian.
In addition, the researchers measured the participants’ linoleic acid and alpha-linolenic acid intake to verify that the participants’ diets were different among the groups.
After 12 weeks, all three groups lost a significant amount of liver fat, but the LCHF and 5:2 groups lost more than the standard care group. Liver stiffness decreased significantly in the 5:2 and standard care groups, but not in the LCHF group.
The differences in steatosis change between the standard care and LCHF groups was statistically significant (P = .001), as it was between the standard care and 5:2 groups (P = .029). The differences between the LCHF and 5:2 groups were not statistically significant for weight or steatosis, but they were statistically significant for liver stiffness.
In addition, the 5:2 group significantly reduced total and LDL cholesterol, while the standard care group did not. In the LCHF group, levels of LDL cholesterol, HDL cholesterol, and total cholesterol all increased.
The long-term implications of the cholesterol findings are unclear, Dr. Holmer said. He hopes to follow up on these patients after 18-24 months. But the initial cholesterol findings are perhaps enough to constitute a red flag for anyone with a history of cardiovascular disease.
Diet adherence
Only one person dropped out of the 5:2 group, compared with five in the LCHF group and four in the standard-care group. More people in the LCHF group reported adverse events, such as gastrointestinal upset.
“With LCHF, it’s a drastic change for most people,” Dr. Holmer said. “Many patients are a bit shocked when they realize how much fat they are supposed to eat for breakfast, for lunch, and for dinner. They might eat bacon and eggs for breakfast every day.” The diet could be challenging for people who want to reduce their consumption of meat for environmental reasons.
The 5:2 group offers the advantage that people can choose what they want to eat as long as they adhere to the calorie restrictions, he pointed out. Still, he cautioned that the diet would not work well for people with insulin-dependent diabetes because of the difficulty of adjusting insulin levels on fasting days. He also recommended against this diet for people with cirrhosis because they need to eat frequent meals.
LCHF and 5:2 diets can work
But for most people the good news is that a variety of diets will work to treat NAFLD, Dr. Holmer said.
“I begin with saying to my patients that this can be completely cured, as long as you’re able to lose weight,” he said. “Then the next question is, how are they going to go ahead with that task? And if they’re already interested in some sort of specific diet, then I can, based on these findings, encourage that.”
Stephen Harrison, MD, a visiting professor of hepatology at Radcliffe Department of Medicine, University of Oxford, England, said that longer-term results will be important. For example, it will be interesting to see if the diets had effects on ballooning or inflammation.
Another limitation of the study is that it is relatively small in size, he said. He pointed out that people with NAFLD should increase their physical activity as well as eating less.
Still, Dr. Harrison greeted the findings enthusiastically, saying: “This is an important study.”
It’s useful to compare two popular diets head to head, and it’s also encouraging to get confirmation that either one can work, he added.
The study was supported by grants from the Stockholm County Council, the Dietary Science Foundation (Kostfonden), the Skandia Research Foundation, and the Åke Wiberg Foundation. Dr. Holmer has disclosed no relevant financial relationships. Harrison is a consultant to Madrigal Pharmaceuticals.
A version of this article first appeared on Medscape.com.
Diabetes plus frequent sleep disturbances tied to higher mortality
A single, simple question about sleep habits asked to people with diabetes in the UK Biobank database identified a subgroup with a nearly doubled mortality rate during almost 9 years of follow-up: those who said they usually had sleep disturbances.

The question was: Do you never, rarely, sometimes, or usually have trouble falling asleep, or waking in the middle of the night?
Adults in the UK Biobank with any form of self-reported diabetes or insulin use who answered that they usually have sleep disturbances had a significant 87% higher mortality rate than did those without diabetes who said they never or rarely had sleep disturbances, in a fully adjusted model with an average follow-up of 8.9 years, Kristen L. Knutson, PhD, and coauthors reported in the Journal of Sleep Research.
Mortality was 11% higher in respondents who reported frequent sleep disturbances but had no diabetes than in those without frequent sleep disturbances. Furthermore, those with diabetes but without frequent sleep disturbances had a 67% higher mortality rate, compared with those without diabetes. Both differences were statistically significant in a model that adjusted for age, sex, ethnicity, smoking, sleep duration, body mass index, and other covariates.
The findings suggest that diabetes and frequent sleep disturbances act in a roughly additive way to raise mortality risk, said Dr. Knutson, an epidemiologist and neurologist who specializes in sleep medicine at Northwestern University, Chicago.
She suggested that, based on these findings, clinicians should consider annually asking patients with diabetes this key question about the frequency of their sleep disturbances. They should then follow up with patients who report usual disturbances by referring them to a sleep clinic to test for a sleep disorders such as insomnia or sleep apnea. Sleep apnea especially is “particularly common in patients with type 2 diabetes,” Dr. Knutson noted in an interview.
A need to ‘spread awareness’ about diabetes and disturbed sleep.
The study run by Dr. Knutson and associates “is one of the largest population-based studies” to examine the relationship between sleep disturbances, diabetes, and mortality, commented Sirimon Reutrakul, MD, an endocrinologist and diabetes specialist at the University of Illinois Hospital in Chicago.
“This study highlights the detrimental effects of sleep disturbances in people with or without diabetes, and adds to the effects of sleep disturbances such as insomnia symptoms. People with diabetes often have sleep disturbances. Obstructive sleep apnea is very common in people with diabetes, and insomnia symptoms could be present in people with obstructive sleep apnea or it could be a separate problem,” Dr. Reutrakul said in an interview. Sleep disturbances can arise from direct effects of diabetes, such as nocturia, worry about glucose levels, pain, depressive symptoms, and anxiety, or can result from comorbidities that interfere with sleep.
“It is prudent to ask patients with diabetes about sleep patterns,” said Dr. Reutrakul, and she endorsed the specific question that Dr. Knutson recommended asking patients. Other aspects of sleep quality that could be helpful for a diagnosis include sleep duration, sleep timing, and snoring. “Some physicians ask these questions, but we need to spread awareness,” she added.
Prior to referring patients to a sleep clinic, Dr. Reutrakul suggested that clinicians could also assess possible triggers such as inadequate glucose control, pain, and anxiety, and they could also recommend good sleep hygiene strategies such as what’s recommended by the Sleep Foundation.
Sleep disturbances ‘highly prevalent’ among U.K. adults.
The UK Biobank enrolled just over 500,000 people aged 37-73 years during 2006-2010, and 487,728 of these people had data available that allowed their inclusion in the analysis. That group averaged about 57 years of age, 54% were women, 94% were White, and their average body mass index was 27-28 kg/m2.
More than a quarter of these people reported having “usual” sleep disturbances, showing that sleep disturbances are “highly prevalent” among U.K. residents, noted the authors. Just under a quarter of the subjects reported they never or rarely had sleep disturbances, and the remaining half of subjects said they “sometimes” had sleep disturbances.
In addition, 69% reported neither diabetes nor frequent sleep disturbances, 26% had frequent sleep disturbances but no diabetes, 3% had diabetes but not frequent sleep disturbances, and 2% had both diabetes and frequent sleep disturbances.
During the average 8.9-year follow-up, 19,177 people died from any cause (4%), and 3,874 of these deaths involved cardiovascular disease causes. Despite the significant association of diabetes and frequent sleep disturbances with an increased rate of all-cause mortality, the same combination showed no significant link with cardiovascular mortality in the study’s full-adjusted model. This may be because “frequent sleep disturbances can lead to a variety of causes of death,” Dr. Knutson suggested.
The information collected by the UK Biobank did not allow the researchers to distinguish between type 1 and type 2 diabetes.
The findings “suggest that regardless of the cause of sleep disturbance, reporting sleep disturbances on a frequent basis is an important signal of elevated risk of mortality. Such symptoms should therefore be investigated further by physicians, particularly in patients who have also been diagnosed with diabetes,” wrote Dr. Knutson and coauthors. “This is the first study to examine the effect of the combination of insomnia and diabetes on mortality risk.”
But Dr. Knutson highlighted that “sleep problems are important for everyone, not just people with diabetes.
Neither Dr. Knutson and coauthors nor Dr. Reutrakul had no disclosures.
A single, simple question about sleep habits asked to people with diabetes in the UK Biobank database identified a subgroup with a nearly doubled mortality rate during almost 9 years of follow-up: those who said they usually had sleep disturbances.
The question was: Do you never, rarely, sometimes, or usually have trouble falling asleep, or waking in the middle of the night?
Adults in the UK Biobank with any form of self-reported diabetes or insulin use who answered that they usually have sleep disturbances had a significant 87% higher mortality rate than did those without diabetes who said they never or rarely had sleep disturbances, in a fully adjusted model with an average follow-up of 8.9 years, Kristen L. Knutson, PhD, and coauthors reported in the Journal of Sleep Research.
Mortality was 11% higher in respondents who reported frequent sleep disturbances but had no diabetes than in those without frequent sleep disturbances. Furthermore, those with diabetes but without frequent sleep disturbances had a 67% higher mortality rate, compared with those without diabetes. Both differences were statistically significant in a model that adjusted for age, sex, ethnicity, smoking, sleep duration, body mass index, and other covariates.
The findings suggest that diabetes and frequent sleep disturbances act in a roughly additive way to raise mortality risk, said Dr. Knutson, an epidemiologist and neurologist who specializes in sleep medicine at Northwestern University, Chicago.
She suggested that, based on these findings, clinicians should consider annually asking patients with diabetes this key question about the frequency of their sleep disturbances. They should then follow up with patients who report usual disturbances by referring them to a sleep clinic to test for a sleep disorders such as insomnia or sleep apnea. Sleep apnea especially is “particularly common in patients with type 2 diabetes,” Dr. Knutson noted in an interview.
A need to ‘spread awareness’ about diabetes and disturbed sleep.
The study run by Dr. Knutson and associates “is one of the largest population-based studies” to examine the relationship between sleep disturbances, diabetes, and mortality, commented Sirimon Reutrakul, MD, an endocrinologist and diabetes specialist at the University of Illinois Hospital in Chicago.
“This study highlights the detrimental effects of sleep disturbances in people with or without diabetes, and adds to the effects of sleep disturbances such as insomnia symptoms. People with diabetes often have sleep disturbances. Obstructive sleep apnea is very common in people with diabetes, and insomnia symptoms could be present in people with obstructive sleep apnea or it could be a separate problem,” Dr. Reutrakul said in an interview. Sleep disturbances can arise from direct effects of diabetes, such as nocturia, worry about glucose levels, pain, depressive symptoms, and anxiety, or can result from comorbidities that interfere with sleep.
“It is prudent to ask patients with diabetes about sleep patterns,” said Dr. Reutrakul, and she endorsed the specific question that Dr. Knutson recommended asking patients. Other aspects of sleep quality that could be helpful for a diagnosis include sleep duration, sleep timing, and snoring. “Some physicians ask these questions, but we need to spread awareness,” she added.
Prior to referring patients to a sleep clinic, Dr. Reutrakul suggested that clinicians could also assess possible triggers such as inadequate glucose control, pain, and anxiety, and they could also recommend good sleep hygiene strategies such as what’s recommended by the Sleep Foundation.
Sleep disturbances ‘highly prevalent’ among U.K. adults.
The UK Biobank enrolled just over 500,000 people aged 37-73 years during 2006-2010, and 487,728 of these people had data available that allowed their inclusion in the analysis. That group averaged about 57 years of age, 54% were women, 94% were White, and their average body mass index was 27-28 kg/m2.
More than a quarter of these people reported having “usual” sleep disturbances, showing that sleep disturbances are “highly prevalent” among U.K. residents, noted the authors. Just under a quarter of the subjects reported they never or rarely had sleep disturbances, and the remaining half of subjects said they “sometimes” had sleep disturbances.
In addition, 69% reported neither diabetes nor frequent sleep disturbances, 26% had frequent sleep disturbances but no diabetes, 3% had diabetes but not frequent sleep disturbances, and 2% had both diabetes and frequent sleep disturbances.
During the average 8.9-year follow-up, 19,177 people died from any cause (4%), and 3,874 of these deaths involved cardiovascular disease causes. Despite the significant association of diabetes and frequent sleep disturbances with an increased rate of all-cause mortality, the same combination showed no significant link with cardiovascular mortality in the study’s full-adjusted model. This may be because “frequent sleep disturbances can lead to a variety of causes of death,” Dr. Knutson suggested.
The information collected by the UK Biobank did not allow the researchers to distinguish between type 1 and type 2 diabetes.
The findings “suggest that regardless of the cause of sleep disturbance, reporting sleep disturbances on a frequent basis is an important signal of elevated risk of mortality. Such symptoms should therefore be investigated further by physicians, particularly in patients who have also been diagnosed with diabetes,” wrote Dr. Knutson and coauthors. “This is the first study to examine the effect of the combination of insomnia and diabetes on mortality risk.”
But Dr. Knutson highlighted that “sleep problems are important for everyone, not just people with diabetes.
Neither Dr. Knutson and coauthors nor Dr. Reutrakul had no disclosures.
FROM THE JOURNAL OF SLEEP RESEARCH
Omnipod 5 ‘artificial pancreas’ shows benefit in type 1 diabetes
Insulet’s investigational Omnipod 5 automated insulin delivery system improves glycemic control in people with type 1 diabetes aged as young as 2 years, new data suggest.
The Omnipod 5 system combines a tubing-free insulin-filled delivery “Pod” with the Dexcom G6 continuous glucose monitor and an algorithm built into the Pod connecting the two devices via a smartphone app to semiautomate insulin delivery. It is currently under review by the Food and Drug Administration. The company expects to launch it in limited release during the second half of 2021.
Results from a pivotal trial of the system in children aged 2-5.9 years with type 1 diabetes were presented during the annual scientific sessions of the American Diabetes Association.
Follow-up data at 6 months were also presented for another pivotal study of 112 children aged 6-13.9 years and 129 adults aged 14-70 years. Those primary 3-month data were reported earlier this year at the Endocrine Society’s annual meeting and subsequently published online June 7, 2021, in Diabetes Care. Another study presented at ADA looked at quality of life in children using Omnipod 5 and their caregivers.
If approved by the FDA, the Omnipod 5 would be the third commercially available automated insulin delivery system – also called hybrid closed-loop or artificial pancreas systems – in the United States. It would be the second approved for children as young as 2 years of age and the first to deliver insulin subcutaneously without tubing.
‘No-tubing’ feature will be a draw for parents of young children
Asked to comment, pediatric endocrinologist Laura M. Jacobsen, MD, of the University of Florida, Gainesville, said in an interview: “I think the big advantage for the Omnipod 5 is that [if approved it will be] the only tubeless automated insulin delivery system in the U.S.”
“The automated delivery systems have just been wonderful for helping patients achieve time in range, especially overnight. And the fact that this goes down to such a young age where that can be very difficult is wonderful.”
Another difference between the Omnipod 5 and other systems is the ability to adjust glucose targets (from 110 to 150 mg/dL), although newer versions of the currently available hybrid closed-loop systems are expected to include that feature as well. “They’re all slightly different in the way the algorithms work, but I think the end result is similar,” Dr. Jacobsen said.
But, she said, the no-tubing feature might be particularly helpful for some very active young kids. “A lot of small kids do use the tubed pumps, and you can make it work with a lot of kids, but with some kids it just won’t ... the tubing gets caught. I think this really helps parents make the step. A lot of them don’t want to try the tubing whereas they see the Omnipod and might feel a little more confidence to try a pump.”
Overall, said Dr. Jacobsen, who has no financial disclosures with Insulet, Dexcom, or any of their competitors, “I think any addition to the technology field to improve quality of life for people with type 1 diabetes is important and people need choices.”
Pivotal data show benefit in ‘difficult-to-manage’ preschool children
Pivotal 3-month data for the Omnipod 5 in children aged 2-5.9 years with type 1 diabetes were presented on June 26 by pediatric endocrinologist Jennifer Sherr, MD, PhD, Yale University, New Haven, Conn.
“As a pediatric endocrinologist, I can attest to the difficulty of managing this age group, due to grazing eating patterns and erratic physical activity. Oftentimes, care providers may fear hypoglycemia as these youth can not verbalize or self-treat lows,” she remarked.
A total of 80 children were enrolled at 10 institutions across the United Sates. There was a single 14-day standard therapy phase (baseline), followed by 3 months of automated insulin delivery during which the children’s eating and exercise were unrestricted.
At 3 months, average hemoglobin A1c had fallen from 7.4% at baseline to 6.9%, a significant difference (P < .05). The proportions achieving the target A1c of less than 7% were 54% at 3 months versus 31% at baseline. The reduction was even greater among the 25 with baseline A1c of 8% or greater, although it was significant even among the 55 who started with a lower A1c (–1.06 vs. –0.31 percentage points; both P < .05).
Time in range rose from 57.2% at baseline to 68.1% at 3 months (P < .05).
“These youngsters are spending an average of 2.6 more hours/day in range,” Dr. Sherr commented, noting that the difference became apparent shortly after study start and was maintained during the 3 months.
Dr. Sherr noted that this 10.9% improvement in time in range with Omnipod 5 was similar to improvements in the previously reported pivotal study of older children and adults. Data from that study showed improvement in time in range from a gain of 15.6% for the 6 to 13.9 year olds to 8.0% for those aged 26-49 years. Interestingly, improvements in time in range were seen even in the oldest group, aged 50-70, who increased from an already high baseline of 69.9% to 79.1% with Omnipod 5 after 3 months.
In her current study, in the youngest age group, the improvement in time in range was achieved primarily by a reduction of time above range, from 2.4 fewer hours/day above 180 mg/dL, while time below 70 mg/dL was reduced by 4 minutes/day. Overnight time in range improved by 1.4 hours/night, with most of the improvements in reduction of hyperglycemia.
The proportions meeting the combined goals of less than 4% time below range and greater than 60% time in range rose from 29% to 65%.
There were no episodes of severe hypoglycemia or diabetic ketoacidosis during the 3-month study phase.
Another important related metric, sleep quality for parents/caregivers, also improved. The percentage reporting overall sleep quality of “very good” or “fairly good” increased from 65% at baseline to 90% with Omnipod 5, while “very bad” sleep quality fell from 8.8% to 0%.
All 80 patients completed the study and elected to continue in a 12-month extension phase.
Ongoing benefit seen in older children and adults
In a late-breaking poster presented on June 25, Anders L. Carlson, MD, medical director at the International Diabetes Center at Park Nicollet, Minneapolis, presented more follow-up data to the previously reported 3-month pivotal study, including 108 older children and 109 adults from the original study.
A1c remained lower after 6 months than at baseline for both children and adults (P < .001). In the children, A1c levels weren’t significantly different at the end of 6 versus 3 months, while in the adults there was an additional 0.1 percentage point decrease (P < .01).
There was one episode of diabetic ketoacidosis and no severe hypoglycemic episodes in the 3-month extension. “Sustained reduction of A1c indicates the potential long-term benefit of the Omnipod 5 System,” Dr. Carlson and colleagues concluded.
Reduced diabetes distress, don’t forget parents’ quality of life
Meanwhile, psychologist Korey K. Hood, PhD, of Stanford (Calif.) University, presented quality of life data at the meeting for 83 children aged 6-11.9 years and 42 teens aged 12-17.9 years using the Omnipod 5 from the larger study population and their parents.
Significant improvements were seen for both the youth and their caregivers in the Problem Areas in Diabetes score, a measure of diabetes-related emotional distress. Changes were less dramatic on the Hypoglycemic Confidence Scale, although improvements were significant for the caregivers of the younger children.
“We know this is a group that is really worried about hypoglycemia across a lot of situations, not just sleep but also school and outside of the home. So, to increase their confidence to this extent I think is a pretty important finding,” Dr. Hood commented.
There were nonsignificant trends in improvement across groups on the Pittsburgh Sleep Quality Index, but overall sleep quality did significantly improve among parents of the younger children. And on the World Health Organization–5 quality of life survey, significant improvements again were seen among the caregivers of young children.
“Reduced diabetes distress and improved quality of life are key benefits of using the Omnipod 5 [automated insulin delivery] system that are complementary to the glycemic benefits achieved,” Dr. Hood said.
Dr. Jacobsen has reported no relevant financial relationships. Dr. Sherr has reported being an adviser for, consultant for, and/or grant recipient from Bigfoot Biomedical, Cecelia Health, Insulet, Medtronic Diabetes, Eli Lilly, Lexicon, Sanofi, and the National Institute of Diabetes and Digestive and Kidney Diseases. Dr. Hood has reported being a consultant for Cecelia Health, Havas, and Cercacor.
A version of this article first appeared on Medscape.com.
Intervention opens access to care for minority youths with type 1 diabetes
For racial or ethnic minority youths with type 1 diabetes, participating in an interventional program improves access to care, new research shows.
Youth categorized as Black, Indigenous, and other people of color (BIPOC) had significantly improved outpatient attendance during and after participating in Novel Interventions in Children’s Healthcare (NICH), a systems intervention for children with chronic health conditions and their families.
By comparison, no improvements in care access were observed among BIPOC children who were not able to access the program because of insurance or other reasons, David V. Wagner, PhD, Associate Professor and NICH research director at Oregon Health & Science University, Portland, reported at the annual scientific sessions of the American Diabetes Association.
The findings demonstrate a need for intensive, home-based services that aim to correct health inequities, said Dr. Wagner, who presented the findings along with Winniebhelle Cadiz, a scholar in the BUILD EXITO undergraduate research training program at Portland (Ore.) State University.
The NICH program hinges on trained interventionists who visit families at home, attend clinic visits, and work with schools and other contacts to help solve problems that keep children from following medical instructions, according to a program description.
“Families report having somebody by their side to help them navigate the system, address the transportation difficulties experienced, and help them and build that relationship with their health care provider seems to be hugely influential in terms of helping them navigate and access care,” Dr. Wagner said in a presentation of the study.
A NICH for youths with chronic health conditions
The NICH program differs from some other programs that have been developed in an attempt to improve health outcomes among youths in the community, according to Dr. Wagner.
“Many of the programs that exist out there are often piloted on, and seemingly built for, those who have more resources,” he said in his presentation. “Those who are in greatest need often have difficulty accessing and responding to the services.”
NICH doesn’t take the place of existing services, but is “an addition to the continuum of care” for youths and families who are struggling because of lack of resources or marginalization in the health care system, Dr. Wagner said.
While NICH is not specific to any one chronic health condition, several previous investigations have specifically looked at the impact of the NICH program on access to care in youths with type 1 diabetes.
Youths participating in the program for a year had fewer ED visits, including fewer visits with diabetic ketoacidosis (DKA), as well as fewer and shorter admissions as compared with the year prior to participating in the program, Dr. Wagner said.
In another study, youths had fewer admissions for diabetes or DKA and less frequent pediatric ICU contact during the NICH program, as compared with before the program.
Another study showed that, while NICH had no impact overall on access to care among youths with type 1 diabetes, BIPOC youths had an improvement in the mean number of outpatient visits as compared with preprogram levels. However, because none of those studies included a control group, Dr. Wagner said, it remained unclear whether this systems intervention might improve outpatient access among youths with type 1 diabetes as compared with those who did not participate.
Intervention linked to increased BIPOC care access
The latest study includes 144 youths with type 1 diabetes referred for the program. The mean age was 13.7 years, 58% were female, and 81% were non-Hispanic White. While 51 youths were able to participate in NICH, the remaining 93 were not served by the program because of insurance denial or nonresponse, according to investigators.
While participation in the program made no difference in access to care overall, results of this study suggest NICH reduced access disparities among BIPOC youths, the investigators said.
Those BIPOC youth, 28 in total, had significantly worse access to care prior to referral. However, BIPOC youth participation in NICH was associated with improved attendance at endocrinology appointments and outpatient attendance overall.
A mean change of 1.9 more appointments per year was seen among BIPOC youth who participated in NICH, compared with a mean decrease of 0.5 appointments per year among BIPOC youth not served by the program (P = .03), according to the study abstract.
Prior to NICH participation, outpatient attendance among BIPOC youths was about 2.5 visits per year, data presented by the investigators show.
Systemic changes needed
This study is representative of systemic changes that are needed to improve access to quality care for BIPOC youth, according Cynthia E. Muñoz, PhD, MPH, ADA’s president of health care and education.

“We know that there are increased risks for poor health outcomes for these children and youths, and we know that there is a risk for mental health and psychosocial challenges for youth from these communities,” said Dr. Muñoz, a bilingual licensed psychologist and assistant professor of clinical pediatrics at the University of Southern California, Los Angeles.
In his presentation, Dr. Wagner said lumping racial and ethnic minority participants under a single BIPOC header probably wasn’t ideal because of the diversity and differences among racial and ethnic minorities. However, it was necessary in this particular study because of limited sample size.
Dr. Wagner and coauthors disclosed no conflicts of interest related to the research, which was supported by the Leona M. and Harry B. Helmsley Charitable Trust.
For racial or ethnic minority youths with type 1 diabetes, participating in an interventional program improves access to care, new research shows.
Youth categorized as Black, Indigenous, and other people of color (BIPOC) had significantly improved outpatient attendance during and after participating in Novel Interventions in Children’s Healthcare (NICH), a systems intervention for children with chronic health conditions and their families.
By comparison, no improvements in care access were observed among BIPOC children who were not able to access the program because of insurance or other reasons, David V. Wagner, PhD, Associate Professor and NICH research director at Oregon Health & Science University, Portland, reported at the annual scientific sessions of the American Diabetes Association.
The findings demonstrate a need for intensive, home-based services that aim to correct health inequities, said Dr. Wagner, who presented the findings along with Winniebhelle Cadiz, a scholar in the BUILD EXITO undergraduate research training program at Portland (Ore.) State University.
The NICH program hinges on trained interventionists who visit families at home, attend clinic visits, and work with schools and other contacts to help solve problems that keep children from following medical instructions, according to a program description.
“Families report having somebody by their side to help them navigate the system, address the transportation difficulties experienced, and help them and build that relationship with their health care provider seems to be hugely influential in terms of helping them navigate and access care,” Dr. Wagner said in a presentation of the study.
A NICH for youths with chronic health conditions
The NICH program differs from some other programs that have been developed in an attempt to improve health outcomes among youths in the community, according to Dr. Wagner.
“Many of the programs that exist out there are often piloted on, and seemingly built for, those who have more resources,” he said in his presentation. “Those who are in greatest need often have difficulty accessing and responding to the services.”
NICH doesn’t take the place of existing services, but is “an addition to the continuum of care” for youths and families who are struggling because of lack of resources or marginalization in the health care system, Dr. Wagner said.
While NICH is not specific to any one chronic health condition, several previous investigations have specifically looked at the impact of the NICH program on access to care in youths with type 1 diabetes.
Youths participating in the program for a year had fewer ED visits, including fewer visits with diabetic ketoacidosis (DKA), as well as fewer and shorter admissions as compared with the year prior to participating in the program, Dr. Wagner said.
In another study, youths had fewer admissions for diabetes or DKA and less frequent pediatric ICU contact during the NICH program, as compared with before the program.
Another study showed that, while NICH had no impact overall on access to care among youths with type 1 diabetes, BIPOC youths had an improvement in the mean number of outpatient visits as compared with preprogram levels. However, because none of those studies included a control group, Dr. Wagner said, it remained unclear whether this systems intervention might improve outpatient access among youths with type 1 diabetes as compared with those who did not participate.
Intervention linked to increased BIPOC care access
The latest study includes 144 youths with type 1 diabetes referred for the program. The mean age was 13.7 years, 58% were female, and 81% were non-Hispanic White. While 51 youths were able to participate in NICH, the remaining 93 were not served by the program because of insurance denial or nonresponse, according to investigators.
While participation in the program made no difference in access to care overall, results of this study suggest NICH reduced access disparities among BIPOC youths, the investigators said.
Those BIPOC youth, 28 in total, had significantly worse access to care prior to referral. However, BIPOC youth participation in NICH was associated with improved attendance at endocrinology appointments and outpatient attendance overall.
A mean change of 1.9 more appointments per year was seen among BIPOC youth who participated in NICH, compared with a mean decrease of 0.5 appointments per year among BIPOC youth not served by the program (P = .03), according to the study abstract.
Prior to NICH participation, outpatient attendance among BIPOC youths was about 2.5 visits per year, data presented by the investigators show.
Systemic changes needed
This study is representative of systemic changes that are needed to improve access to quality care for BIPOC youth, according Cynthia E. Muñoz, PhD, MPH, ADA’s president of health care and education.
“We know that there are increased risks for poor health outcomes for these children and youths, and we know that there is a risk for mental health and psychosocial challenges for youth from these communities,” said Dr. Muñoz, a bilingual licensed psychologist and assistant professor of clinical pediatrics at the University of Southern California, Los Angeles.
In his presentation, Dr. Wagner said lumping racial and ethnic minority participants under a single BIPOC header probably wasn’t ideal because of the diversity and differences among racial and ethnic minorities. However, it was necessary in this particular study because of limited sample size.
Dr. Wagner and coauthors disclosed no conflicts of interest related to the research, which was supported by the Leona M. and Harry B. Helmsley Charitable Trust.
FROM ADA 2021
Type 1 diabetes amputation rates fall in Sweden, rise in U.S.
according to a national registry analysis.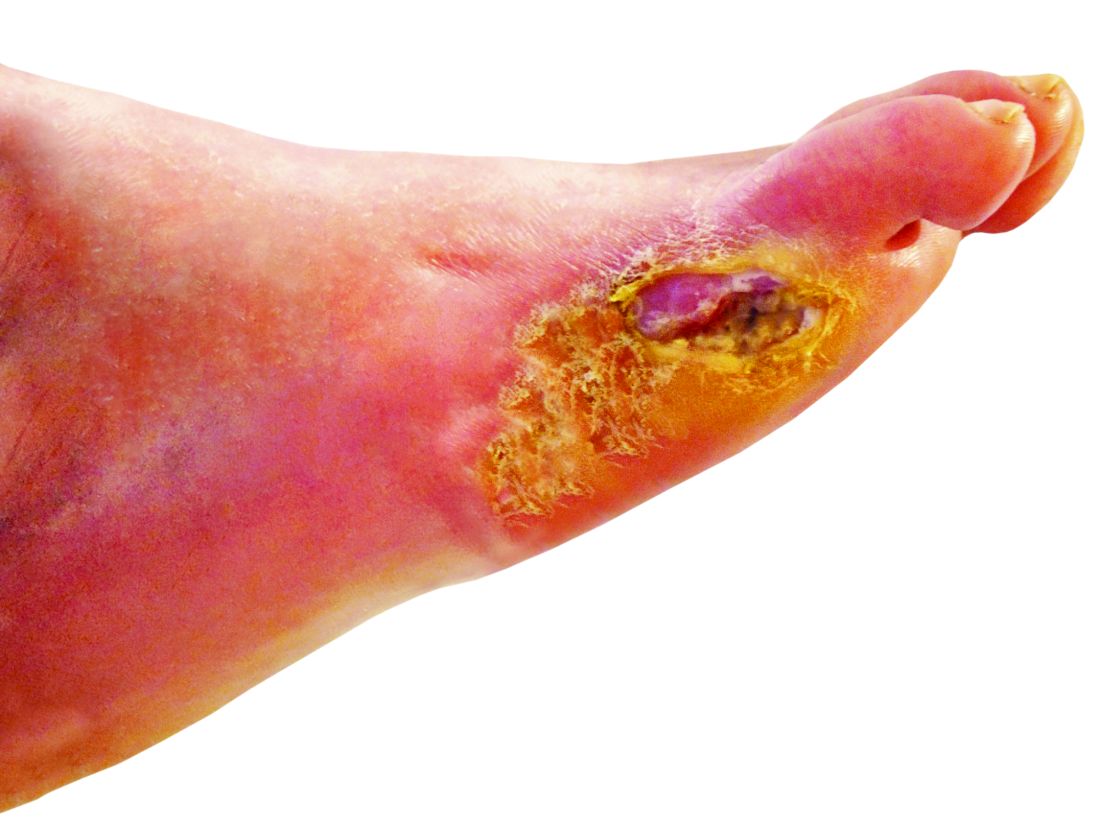
The incidence of any amputation trended downward from 2011 to 2019, Sara Hallström, MD, reported at the annual scientific sessions of the American Diabetes Association.
Levels of hemoglobin A1c have also trended downward over time in Sweden among those with type 1 diabetes, while renal function has remained stable among patients who did not undergo amputations, Dr. Hallström said in a virtual presentation.
“Observing stable renal function and decreasing levels of [hemoglobin] A1c, along with decreasing incidence of amputation, indicates a shift in the prognosis of persons with type 1 diabetes,” she said.
Drilling down on amputation risk in type 1 diabetes
Lower-extremity amputation is a major source of disability and distress in people with diabetes, and also poses a significant financial burden for the health care system, according to Dr. Hallström of Sahlgrenska University Hospital and the University of Gothenburg (Sweden).
“Limb loss due to amputation is not seldom a final outcome of diabetic foot ulcers,” she said in the presentation.
Most studies of amputation incidence and risk factors have grouped patients with different types of diabetes, though a few recent studies have singled out type 1 diabetes.
Among these is a 2019 study indicating a 40-fold higher risk of amputation among individuals with type 1 diabetes, compared with the general population, based on analysis of Swedish National Diabetes Register data from 1998 to 2013.
Trends over time
In the present study, Dr. Hallström and coinvestigators queried that same Swedish registry and identified 46,008 individuals with type 1 diabetes from 1998 to 2019. The mean age was 32.5 years and 55% were male. Overall, 1,519 of these individuals (3.3%) underwent amputation.
The incidence of any amputation fluctuated from 1998 to 2011, followed by a “decreasing trend over time” from 2011 to 2019, Dr. Hallström said.
The incidence of amputation per 1,000 patient-years was 2.84 in the earliest time period of 1998-2001, decreasing to 1.64 in 2017-2019.
Levels of A1c decreased over time, starting at 2012, both in participants with and without amputations, Dr. Hallström said. Renal function over that period remained stable in persons without amputation, and showed a decreasing trend in persons with amputation.
Compared with individuals with no amputations, those undergoing amputation were older (50 years vs. 32 years), had a longer duration of diabetes (34.9 years vs. 16.5 years), and had higher mean A1c, Dr. Hellström said. The amputee group also included a higher proportion of smokers, at 19.4% versus 14.0%, data show.
Risk factors for amputation included renal dysfunction, hyperglycemia, older age, smoking, hypertension, and cardiovascular comorbidities, according to the researcher.
U.S. amputations on the rise overall
While authors say results of this study point to a potentially improved prognosis for individuals with type 1 diabetes in Sweden, Robert A. Gabbay, MD, PhD, chief scientific and medical officer of the ADA, said amputation rates remains “concerning” based on U.S. data focused largely on type 2 diabetes.

“The amputation rate is unfortunately rising,” he said. “Sadly, this continues to be an issue.”
Significant health disparities persist, he added, with Black Americans having two- to threefold higher rates of amputations.
To help reduce amputation rates, clinicians should be asking patient about claudication and using simple screening techniques such as inspecting patient’s feet. “The big deal here is preventing ulcer formation, because once the ulcer forms, it often doesn’t heal, and it’s a downward spiral,” he said.
In addition, recent research suggests seeking a second opinion may help: “Many of those amputations could be avoided, in part because people aren’t aware of some of the treatments that can open up the arteries and reestablish blood flow,” he added.
Dr. Hallström reported no conflicts of interest. One coauthor on the study provided disclosures related to Abbott, AstraZeneca, Boehringer Ingelheim, Lilly Diabetes, and Novo Nordisk.
according to a national registry analysis.
The incidence of any amputation trended downward from 2011 to 2019, Sara Hallström, MD, reported at the annual scientific sessions of the American Diabetes Association.
Levels of hemoglobin A1c have also trended downward over time in Sweden among those with type 1 diabetes, while renal function has remained stable among patients who did not undergo amputations, Dr. Hallström said in a virtual presentation.
“Observing stable renal function and decreasing levels of [hemoglobin] A1c, along with decreasing incidence of amputation, indicates a shift in the prognosis of persons with type 1 diabetes,” she said.
Drilling down on amputation risk in type 1 diabetes
Lower-extremity amputation is a major source of disability and distress in people with diabetes, and also poses a significant financial burden for the health care system, according to Dr. Hallström of Sahlgrenska University Hospital and the University of Gothenburg (Sweden).
“Limb loss due to amputation is not seldom a final outcome of diabetic foot ulcers,” she said in the presentation.
Most studies of amputation incidence and risk factors have grouped patients with different types of diabetes, though a few recent studies have singled out type 1 diabetes.
Among these is a 2019 study indicating a 40-fold higher risk of amputation among individuals with type 1 diabetes, compared with the general population, based on analysis of Swedish National Diabetes Register data from 1998 to 2013.
Trends over time
In the present study, Dr. Hallström and coinvestigators queried that same Swedish registry and identified 46,008 individuals with type 1 diabetes from 1998 to 2019. The mean age was 32.5 years and 55% were male. Overall, 1,519 of these individuals (3.3%) underwent amputation.
The incidence of any amputation fluctuated from 1998 to 2011, followed by a “decreasing trend over time” from 2011 to 2019, Dr. Hallström said.
The incidence of amputation per 1,000 patient-years was 2.84 in the earliest time period of 1998-2001, decreasing to 1.64 in 2017-2019.
Levels of A1c decreased over time, starting at 2012, both in participants with and without amputations, Dr. Hallström said. Renal function over that period remained stable in persons without amputation, and showed a decreasing trend in persons with amputation.
Compared with individuals with no amputations, those undergoing amputation were older (50 years vs. 32 years), had a longer duration of diabetes (34.9 years vs. 16.5 years), and had higher mean A1c, Dr. Hellström said. The amputee group also included a higher proportion of smokers, at 19.4% versus 14.0%, data show.
Risk factors for amputation included renal dysfunction, hyperglycemia, older age, smoking, hypertension, and cardiovascular comorbidities, according to the researcher.
U.S. amputations on the rise overall
While authors say results of this study point to a potentially improved prognosis for individuals with type 1 diabetes in Sweden, Robert A. Gabbay, MD, PhD, chief scientific and medical officer of the ADA, said amputation rates remains “concerning” based on U.S. data focused largely on type 2 diabetes.
“The amputation rate is unfortunately rising,” he said. “Sadly, this continues to be an issue.”
Significant health disparities persist, he added, with Black Americans having two- to threefold higher rates of amputations.
To help reduce amputation rates, clinicians should be asking patient about claudication and using simple screening techniques such as inspecting patient’s feet. “The big deal here is preventing ulcer formation, because once the ulcer forms, it often doesn’t heal, and it’s a downward spiral,” he said.
In addition, recent research suggests seeking a second opinion may help: “Many of those amputations could be avoided, in part because people aren’t aware of some of the treatments that can open up the arteries and reestablish blood flow,” he added.
Dr. Hallström reported no conflicts of interest. One coauthor on the study provided disclosures related to Abbott, AstraZeneca, Boehringer Ingelheim, Lilly Diabetes, and Novo Nordisk.
FROM ADA 2020
SUSTAIN FORTE: Higher-dose semaglutide safely boosts glycemic control, weight loss
Accumulating evidence shows that
Just weeks after the Food and Drug Administration approved an increased, 2.4-mg/week dose of semaglutide (Wegovy) for the indication of weight loss, results from a new randomized study with 961 patients that directly compared the standard 1.0-mg weekly dose for glycemic control with a 2.0-mg weekly dose showed that, over 40 weeks, the higher dose produced modest incremental improvements in both A1c reduction and weight loss while maintaining safety.
“Once weekly 2.0-mg subcutaneous semaglutide [Ozempic] was superior to 1.0 mg in reducing A1c, with greater weight loss and a similar safety profile,” Juan P. Frias, MD, said at the annual scientific sessions of the American Diabetes Association while presenting results of the SUSTAIN FORTE trial.
Average impact of the increased efficacy was measured. In the study’s “treatment policy estimand” analysis (considered equivalent to an intention-to-treat analysis), the primary endpoint of the cut in average A1c fell by a further 0.18% among patients on the higher dose, compared with the lower-dose arm, a significant difference in patients who entered the study with an average A1c of 8.9%. The average incremental boost for weight loss on the higher dose was about 0.8 kg, a difference that just missed significance (P = .0535).
In the study’s “trial product estimand” analysis (which censors data when patients stop the study drug or add on rescue medications), the effects were slightly more robust. The 2-mg dose produced an average 0.23% incremental decrease in A1c, compared with 1 mg, and an average incremental 0.93-kg weight reduction, both significant, reported Dr. Frias, an endocrinologist and medical director of the National Research Institute in Los Angeles.
Dr. Frias highlighted that these modest average differences had a clinical impact for some patients. In the treatment product estimand analysis, the percentage of patients achieving an A1c level of less than 7.0% increased from 58% of those who received 1 mg semaglutide to 68% of those treated with 2 mg, and achievement of an A1c of less than 6.5% occurred in 39% of patients on 1 mg and in 52% of those on 2 mg.
A similar pattern existed for weight loss in the treatment product estimand. Weight loss of at least 5% happened in 51% of patients on the 1-mg dose and in 59% of those on the higher dose.
Gradual up-titration aids tolerance
“The GLP-1 receptor agonists have so many benefits, but we were concerned in the past about pushing the dose. We’ve learned more about how to do that so that patients can better tolerate it,” commented Robert A. Gabbay, MD, PhD, chief science and medicine officer of the ADA in Arlington, Va. “The challenge with the medications from this class has been tolerability.”
A key to minimizing adverse effects, especially gastrointestinal effects, from treatment with semaglutide and other GLP-1 receptor agonists has been more gradual up-titration to the target dose, Dr. Gabbay noted in an interview, and SUSTAIN FORTE took this approach. All patients started on a 0.25-mg injection of semaglutide once weekly for the first 4 weeks, followed by a 0.5-mg dose once weekly for 4 weeks, and then a 1.0 mg weekly dose. Patients in the arm randomized to receive 2.0 mg had one further dose escalation after receiving the 1.0-mg dose for 4 weeks.
The result was that gastrointestinal adverse effects occurred in 31% of patients maintained for 32 weeks on the 1-mg dose (with 40 total weeks of semaglutide treatment), and in 34% of patients who received the 2-mg dose for 28 weeks (and 40 total weeks of semaglutide treatment). Serious adverse events of all types occurred in 5% of patients in the 1-mg arm and in 4% of those on 2 mg. Total adverse events resulting in treatment discontinuation occurred in about 4.5% of patients in both arms, and discontinuations because of gastrointestinal effects occurred in about 3% of patients in both arms.
Severe hypoglycemia episodes occurred in 1 patient maintained on 1 mg weekly and in 2 patients in the 2-mg arm, while clinically significant episodes of hypoglycemia occurred in 18 patients on the 1-mg dose (4%) and in 12 of the patients on 2 mg (3%).
“It’s reassuring that the higher dose is tolerated,” commented Dr. Gabbay.
Several doses to choose from
SUSTAIN FORTE ran during 2019-2020 at about 125 centers in 10 countries, with roughly half the sites in the United States. It randomized adults with type 2 diabetes and an A1c of 8.0%-10.0% despite ongoing metformin treatment in all patients. Just over half the patients were also maintained on a sulfonylurea agent at entry. The enrolled patients had been diagnosed with diabetes for an average of about 10 years. They averaged 58 years of age, their body mass index averaged nearly 35 kg/m2, and about 58% were men.
The new evidence in support of a 2.0-mg weekly dose of semaglutide for patients with type 2 diabetes introduces a new wrinkle in a growing menu of dose options for this drug. On June 4, 2021, the FDA approved a weekly 2.4-mg dose of semaglutide for the indication of weight loss regardless of diabetes status in patients with a body mass index of 30 or higher (or in people at 27 or more with at least one weight-related comorbidity).
Dr. Gabbay suggested that, in practice, clinicians may focus more on treatment goals for individual patients rather than drug dose, especially with an agent that’s safer with slow dose titration.
In general, “clinicians establish a goal for each patient’s A1c; you use the drug dose that gets you there,” he observed.
SUSTAIN FORTE was sponsored by Novo Nordisk, the company that markets semaglutide. Dr. Frias has been a consultant to Novo Nordisk and numerous other companies, he has been a speaker on behalf of Lilly, Merck, and Sanofi, and he has received research funding from Novo Nordisk and numerous other companies. Dr. Gabbay had no relevant disclosures.
FROM ADA 2021