User login
Study Finds Racial Gaps in Military Pediatric Asthma Care
Study Finds Racial Gaps in Military Pediatric Asthma Care
TOPLINE:
Among pediatric beneficiaries in the Military Health System (MHS), racial and ethnic disparities in asthma care persisted, with Black children having the highest odds of an asthma diagnosis and emergency department (ED) visit among all racial and ethnic groups.
METHODOLOGY:
- This cross-sectional study examined racial and ethnic differences in asthma prevalence and related outcomes among pediatric beneficiaries in the MHS.
- They included 950,896 dependents aged 2-17 years (50.9% boys) who had ≥ 1 inpatient or outpatient encounter during fiscal year 2023.
- Race and ethnicity were self-reported by the beneficiary and derived from the sponsor’s demographic records.
- An asthma diagnosis required at least one inpatient claim or two outpatient claims with an asthma diagnostic code recorded in the primary or secondary diagnosis field.
- Asthma-related outcomes assessed were potentially avoidable hospitalizations, ED visits, specialist visits, and asthma-related prescriptions.
TAKEAWAY:
- Overall, 3.3% of children had an asthma diagnosis; the prevalence was higher among children aged 5-10 or 11-17 years, boys, and those with 1 or 2 siblings.
- The odds of an asthma diagnosis were significantly higher in all racial and ethnic groups than in White children, and were highest in Black children, who had 85% higher odds across all ages (P < .001).
- Similarly, Black children were 39% more likely than White children to have an asthma-related ED visit; Hispanic children were 36% more likely and Native Hawaiian or Pacific Islander children were 25% more likely (P < .05 for all comparisons).
- Black children also had slightly higher odds of an asthma-related specialist visit than White children, and both Black and Hispanic children were more likely to receive any asthma prescription.
IN PRACTICE:
These results highlighted how access to low-cost or no-cost care, consistent insurance coverage, and effective prescription practices within the MHS may have helped to improve asthma outcomes. Still, the persistence of racial and ethnic disparities pointed to the need for further action. Efforts to close these gaps should include expanding access to culturally responsive care, increasing availability of specialists, and continuing to assess and improve how care is delivered across the system,” the authors wrote.
SOURCE:
This study was led by Felicia Yeboah Denteh, DrPH, MHA, Center for Health Services Research, Uniformed Services University of the Health Sciences, Bethesda, Maryland. It was published online on January 26, 2026, in JAMA Network Open.
LIMITATIONS:
This study used the sponsor’s race and ethnicity as proxies for children’s race and ethnicity, which could have misclassified multiracial children, adopted children, and wards. It also relied on coding in secondary data and did not include factors such as BMI, pollution, and family history.
DISCLOSURES:
This study was funded by the Department of War, Defense Health Agency. The authors did not report any conflicts of interest.
This article was created using several editorial tools, including AI, as part of the process. Human editors reviewed this content before publication.
A version of this article first appeared on Medscape.com.
Study Finds Racial Gaps in Military Pediatric Asthma Care
Study Finds Racial Gaps in Military Pediatric Asthma Care
Nonhealing Lesion on the Ear in a Child
Nonhealing Lesion on the Ear in a Child
THE DIAGNOSIS: Cutaneous Leishmaniasis
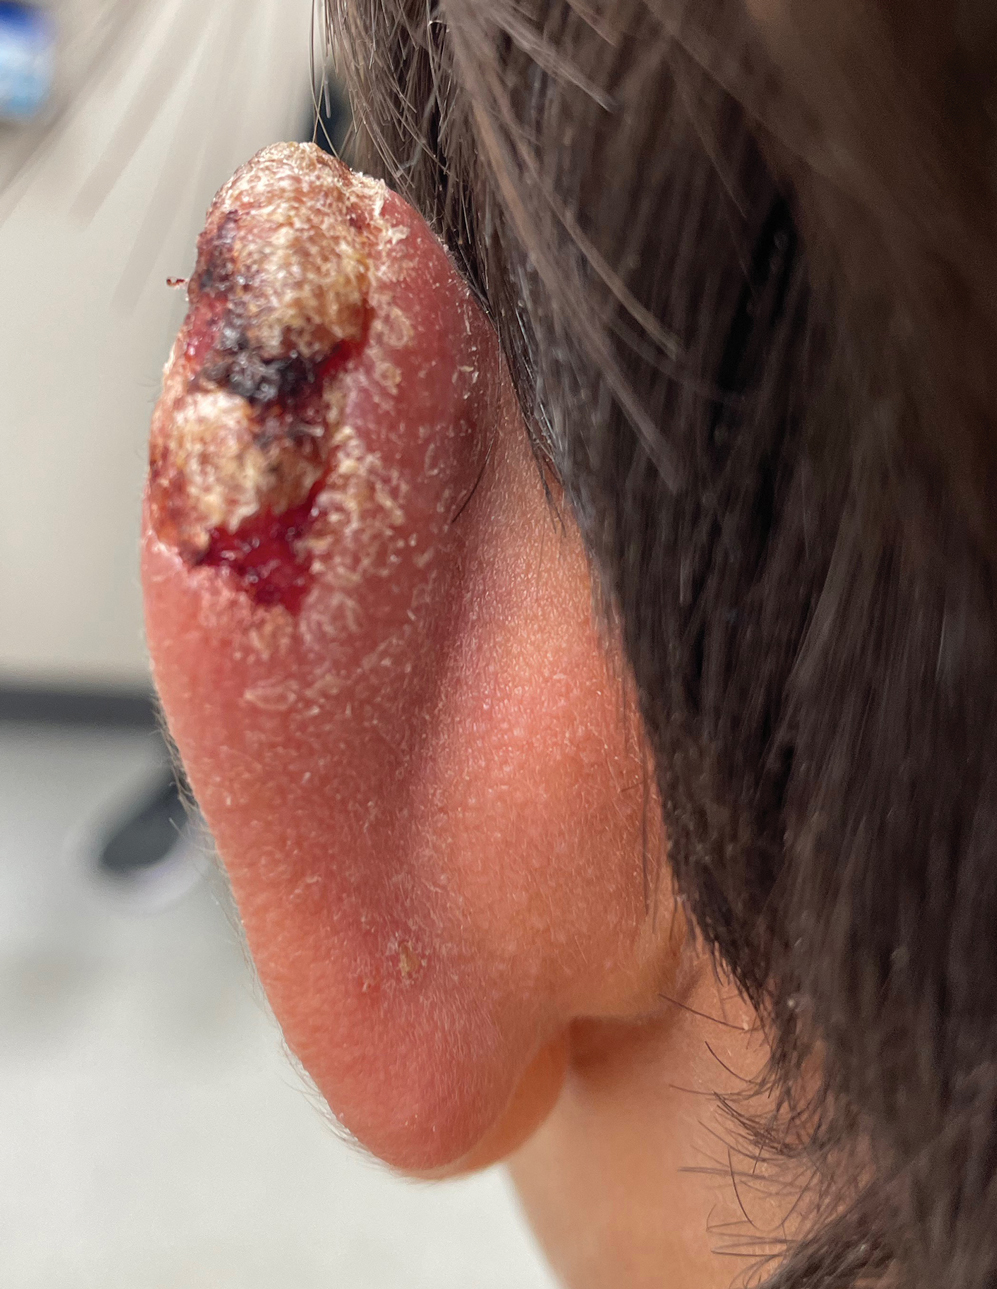
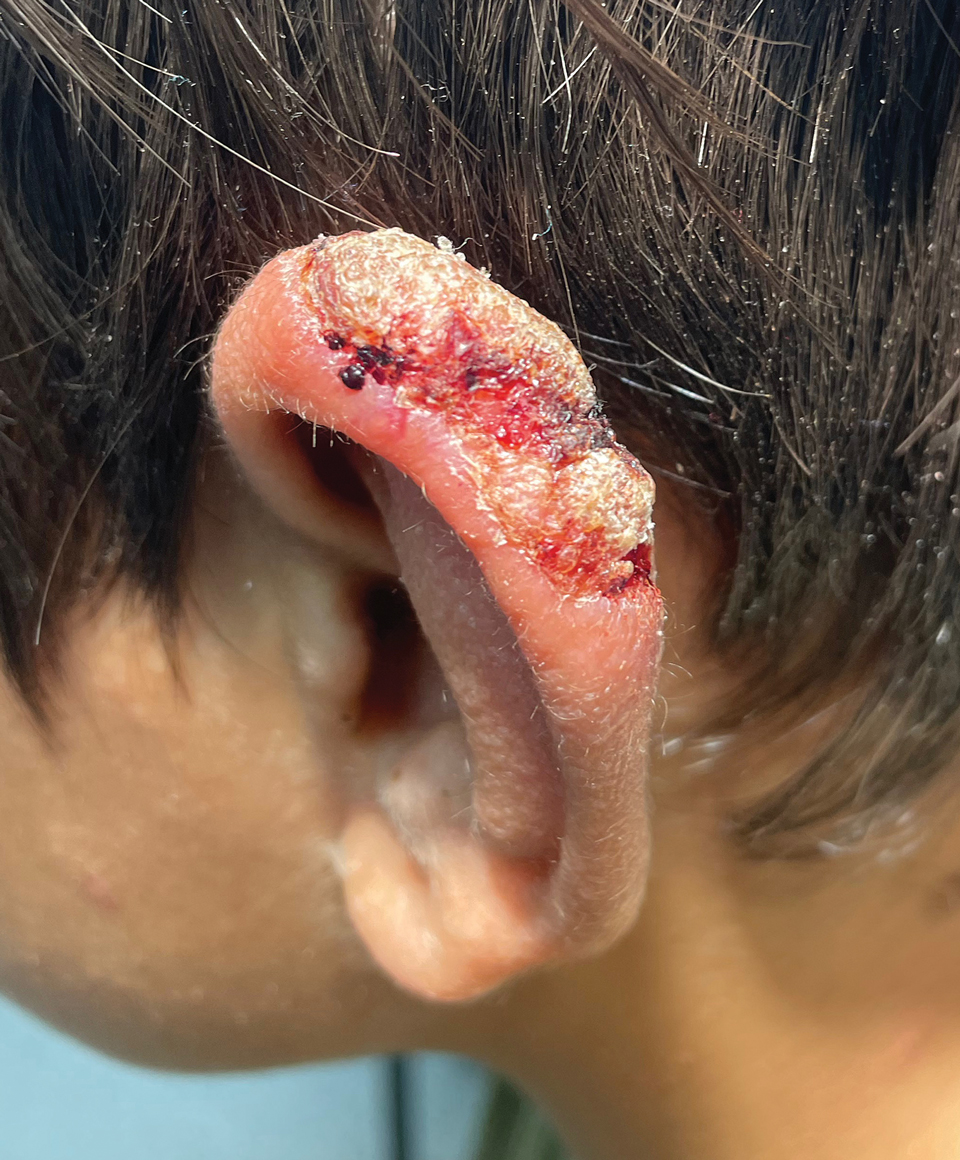
The biopsy results demonstrated a nonspecific chronic granulomatous inflammatory infiltrate, including few multinucleated histiocytes, a surrounding mixed inflammatory infiltrate, mostly mature lymphocytes, few plasma cells, and fragmented neutrophils. A special stain panel was negative for acid-fast bacilli (AFB), Fite, and periodic acid–Schiff for fungi. Bacterial cultures from biopsy tissue grew normal skin flora, and both fungal and AFB cultures were negative. A second punch biopsy was recommended by infectious disease due to clinical suspicion of cutaneous leishmaniasis (CL). Histopathology showed nonnecrotizing granulomas with dense lymphoplasmacytic inflammation and negative Giemsa staining for Leishmania amastigotes; however, it was concluded by pathology that the reason for the negative Leishmania staining was the late stage of the disease, indicated by the presence of granulomas, which can make visualization of organisms difficult. Nonetheless, universal polymerase chain reaction (PCR) testing was positive for Leishmania tropica. Thus, although microscopic analysis was negative for visualization of Leishmania amastigotes, molecular analysis via PCR ultimately demonstrated a positive result and confirmed the diagnosis of CL (Figure 1). The variance in diagnostic accuracy exemplified in our case reinforces the need for multimodal diagnosis.
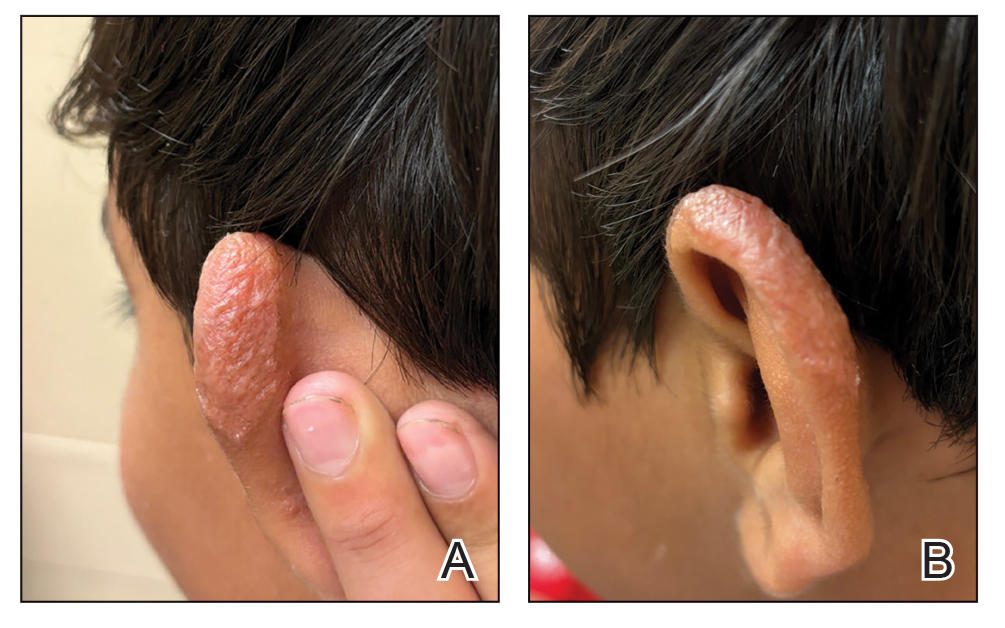
Multiple factors needed to be considered with regard to treatment in our patient, including but not limited to the location of the lesion on a slow-healing cartilaginous surface and the patient’s age. Considering the recalcitrant nature of the lesion and the L tropica strain exhibiting resistance to topical treatments, systemic therapies were the only option. Furthermore, parenteral routes of administration were confounded by the patient’s age, decreasing the likelihood of compliance with therapy. With these variables in mind and recommendations from the Infectious Diseases Society of America and the Centers for Disease Control and Prevention, the best treatment for our patient was deemed to be a 28-day course of oral miltefosine 50 mg twice daily. Compared to the initial presentation, a 1-month follow-up visit after completing the 28-day course of treatment demonstrated flattening of the lesion (Figure 2).
Leishmaniasis is a disease caused by a protozoan parasite of the Leishmania genus, spread via inoculation from the bite of sandfly vectors.1 Cutaneous leishmaniasis is the most common clinical manifestation of leishmaniasis. Other clinical manifestations include mucocutaneous leishmaniasis and visceral leishmaniasis.1,2 Cutaneous leishmaniasis typically manifests as open wounds on areas of skin that may have been exposed to sandfly bites.3 The lesion may not appear until weeks to months or even years after the initial inoculation.2 Initially, CL manifests as papules that may progress to nodular plaques, with eventual evolution to volcanic ulcerations with raised borders and central crateriform indentations covered by scabs or crusting.2,3 The infection may be localized or diffuse—in either case, development of satellite lesions, regional lymphadenopathy, and/or nodular lymphangitis is not uncommon. Generally, CL is not lethal, but the severity of the lesions may vary and can lead to permanent scarring and atrophy.2 Many cases of CL remain undiagnosed because of its appearance as a nonspecific ulcer that can mimic many other cutaneous lesions and because it generally heals spontaneously, leaving only scarring as an indicator of prior infection.4 Thus, CL requires a high diagnostic suspicion, as it can have a nonspecific presentation and is rare in nonendemic regions.
Diagnosis of CL is accomplished via microscopy, isoenzyme analysis, or serology or is made molecularly.3 Microscopic diagnosis includes visualization of Leishmania amastigotes, the stage of replication that occurs after the promastigote stage is phagocytosed by macrophages.3 Amastigote is the only stage that can be visualized in human tissue and is stained via Giemsa and/or hematoxylin and eosin.3 However, Leishmania amastigotes are morphologically indistinguishable from Trypanosoma cruzi amastigotes on microscopy, thus limiting diagnostic accuracy.3 Moreover, there is potential for missed diagnosis of persistent CL caused by L tropica due to fewer parasites being present, further complicating the diagnosis.5 In these cases, molecular diagnostics are helpful as they have higher sensitivity and quicker results. Additionally, DNA technologies can differentiate strains, which is beneficial for guiding treatment. Isoenzyme analysis also can help identify Leishmania species, although results can take weeks to return.3 Serologic testing is useful for suspected visceral leishmaniasis despite negative definitive diagnoses or conflicts with conducting definitive studies; however, there is not a strong antibody response in CL, thus serology is ineffective.3,5 Furthermore, serology can have cross-reactivity with T cruzi and cannot be used to assess for treatment response.3,5 The Infectious Diseases Society of America guidelines for diagnosis of leishmaniasis recommend using multiple methods to ensure a positive result, with molecular assays being the most sensitive.5
Differential diagnoses include any cause of cutaneous ulcerated lesions, including but not limited to mycobacterial or fungal infections. Leprosy often initially manifests with a hypopigmented macule with a raised border, although there often are associated neuropathic symptoms.6 Cutaneous tuberculosis is an extremely rare manifestation that occurs via direct inoculation of the mycobacterium, occurring primarily in children. Initially, it may manifest as a firm red papule that progresses to a painless shallow ulcer with a granular base.7 Cutaneous chromoblastomycosis is a fungal infection resulting from an initial cutaneous injury, similar to our patient, followed by a slow-developing warty lesion that may heal into ivory scars or spread as plaques on normal skin.8 The verrucous lesions seen in cutaneous chromoblastomycosis tend to manifest on the lower extremities and are unlikely to manifest on the head. Sarcoidosis is another granulomatous skin eruption that can be clinically nonspecific.9 Histologically, lesions may demonstrate noncaseating granulomatous inflammation, as seen with cutaneous leishmaniasis, with a broad presentation; for example, lupus pernio, a sarcoid variant, manifests as large blue-red dusky nodules/plaques on the face, ears, or digits.9 Other sarcoid lesions include red/brown, thickened, circular plaques; variably discolored papulonodular lesions; or mucosal involvement.9 Ultimately, it is important to differentiate these nonspecific and similarly appearing lesions through diagnostic techniques such as AFB culture and smear, fungal staining, tuberculosis testing, and PCR in more challenging cases.
Treatment of cutaneous leishmaniasis should be individualized to each case.5 A more than 50% reduction in lesion size within 4 to 6 weeks indicates successful treatment. Ulcerated lesions should be fully re-epithelialized and healed by 3 months posttreatment. Treatment failure is categorized by failure of reepithelization, incomplete healing by 3 months, or worsening of the lesion at any time, each necessitating additional treatment, such as a second course of miltefosine or a different medication regimen.5 Careful monitoring is required throughout treatment, assessing for treatment failure, adding to the challenges of leishmaniasis.
In conclusion, CL requires a high index of suspicion in nonendemic areas to ensure successful diagnosis and treatment. Our case highlights the importance of using multimodal diagnostic techniques for CL, as a single modality may not exhibit a positive result due to variations in diagnostic accuracy. Our case also exhibits the complex treatment of CL, and the considerations that should be made when choosing a treatment modality.
- Leishmaniasis. World Health Organization. Accessed September 14, 2024. https://www.who.int/news-room/fact-sheets/detail/leishmaniasis
- Clinical overview of leishmaniasis. Centers for Disease Control and Prevention. Accessed September 14, 2024. https://www.cdc.gov/leishmaniasis/hcp/clinical-overview/index.html
- CDC DPDx Leishmaniasis. Centers for Disease Control and Prevention. Accessed September 15, 2024. https://www.cdc.gov/dpdx/leishmaniasis/index.html
- Stark CG. Leishmaniasis differential diagnoses. Medscape. March 21, 2023. Accessed October 12, 2024. https://emedicine.medscape.com/article/220298-differential
- Aronson N, Herwaldt BL, Libman M, et al. Diagnosis and treatment of leishmaniasis: clinical practice guidelines by the Infectious Diseases Society of America (IDSA) and the American Society of Tropical Medicine and Hygiene (ASTMH). Clin Infect Dis. 2016;63:E202-E264. doi:10.1093/cid/ciw670
- Lewis FS. Dermatologic manifestations of leprosy. Medscape. June 19, 2023. Accessed October 12, 2024. https://emedicine.medscape.com/article/1104977-overview
- Ngan V. Cutaneous tuberculosis. DermNet. Accessed October 12, 2024. https://dermnetnz.org/topics/cutaneous-tuberculosis
- Schwartz RA. Chromoblastomycosis. Medscape. May 13, 2023. Accessed October 12, 2024. https://emedicine.medscape.com/article/1092695-overview#a4
- Elyoussfi S, Coulson I. Sarcoidosis. DermNet. May 31, 2024. Accessed October 25, 2024. https://dermnetnz.org/topics/sarcoidosis
THE DIAGNOSIS: Cutaneous Leishmaniasis
The biopsy results demonstrated a nonspecific chronic granulomatous inflammatory infiltrate, including few multinucleated histiocytes, a surrounding mixed inflammatory infiltrate, mostly mature lymphocytes, few plasma cells, and fragmented neutrophils. A special stain panel was negative for acid-fast bacilli (AFB), Fite, and periodic acid–Schiff for fungi. Bacterial cultures from biopsy tissue grew normal skin flora, and both fungal and AFB cultures were negative. A second punch biopsy was recommended by infectious disease due to clinical suspicion of cutaneous leishmaniasis (CL). Histopathology showed nonnecrotizing granulomas with dense lymphoplasmacytic inflammation and negative Giemsa staining for Leishmania amastigotes; however, it was concluded by pathology that the reason for the negative Leishmania staining was the late stage of the disease, indicated by the presence of granulomas, which can make visualization of organisms difficult. Nonetheless, universal polymerase chain reaction (PCR) testing was positive for Leishmania tropica. Thus, although microscopic analysis was negative for visualization of Leishmania amastigotes, molecular analysis via PCR ultimately demonstrated a positive result and confirmed the diagnosis of CL (Figure 1). The variance in diagnostic accuracy exemplified in our case reinforces the need for multimodal diagnosis.
Multiple factors needed to be considered with regard to treatment in our patient, including but not limited to the location of the lesion on a slow-healing cartilaginous surface and the patient’s age. Considering the recalcitrant nature of the lesion and the L tropica strain exhibiting resistance to topical treatments, systemic therapies were the only option. Furthermore, parenteral routes of administration were confounded by the patient’s age, decreasing the likelihood of compliance with therapy. With these variables in mind and recommendations from the Infectious Diseases Society of America and the Centers for Disease Control and Prevention, the best treatment for our patient was deemed to be a 28-day course of oral miltefosine 50 mg twice daily. Compared to the initial presentation, a 1-month follow-up visit after completing the 28-day course of treatment demonstrated flattening of the lesion (Figure 2).
Leishmaniasis is a disease caused by a protozoan parasite of the Leishmania genus, spread via inoculation from the bite of sandfly vectors.1 Cutaneous leishmaniasis is the most common clinical manifestation of leishmaniasis. Other clinical manifestations include mucocutaneous leishmaniasis and visceral leishmaniasis.1,2 Cutaneous leishmaniasis typically manifests as open wounds on areas of skin that may have been exposed to sandfly bites.3 The lesion may not appear until weeks to months or even years after the initial inoculation.2 Initially, CL manifests as papules that may progress to nodular plaques, with eventual evolution to volcanic ulcerations with raised borders and central crateriform indentations covered by scabs or crusting.2,3 The infection may be localized or diffuse—in either case, development of satellite lesions, regional lymphadenopathy, and/or nodular lymphangitis is not uncommon. Generally, CL is not lethal, but the severity of the lesions may vary and can lead to permanent scarring and atrophy.2 Many cases of CL remain undiagnosed because of its appearance as a nonspecific ulcer that can mimic many other cutaneous lesions and because it generally heals spontaneously, leaving only scarring as an indicator of prior infection.4 Thus, CL requires a high diagnostic suspicion, as it can have a nonspecific presentation and is rare in nonendemic regions.
Diagnosis of CL is accomplished via microscopy, isoenzyme analysis, or serology or is made molecularly.3 Microscopic diagnosis includes visualization of Leishmania amastigotes, the stage of replication that occurs after the promastigote stage is phagocytosed by macrophages.3 Amastigote is the only stage that can be visualized in human tissue and is stained via Giemsa and/or hematoxylin and eosin.3 However, Leishmania amastigotes are morphologically indistinguishable from Trypanosoma cruzi amastigotes on microscopy, thus limiting diagnostic accuracy.3 Moreover, there is potential for missed diagnosis of persistent CL caused by L tropica due to fewer parasites being present, further complicating the diagnosis.5 In these cases, molecular diagnostics are helpful as they have higher sensitivity and quicker results. Additionally, DNA technologies can differentiate strains, which is beneficial for guiding treatment. Isoenzyme analysis also can help identify Leishmania species, although results can take weeks to return.3 Serologic testing is useful for suspected visceral leishmaniasis despite negative definitive diagnoses or conflicts with conducting definitive studies; however, there is not a strong antibody response in CL, thus serology is ineffective.3,5 Furthermore, serology can have cross-reactivity with T cruzi and cannot be used to assess for treatment response.3,5 The Infectious Diseases Society of America guidelines for diagnosis of leishmaniasis recommend using multiple methods to ensure a positive result, with molecular assays being the most sensitive.5
Differential diagnoses include any cause of cutaneous ulcerated lesions, including but not limited to mycobacterial or fungal infections. Leprosy often initially manifests with a hypopigmented macule with a raised border, although there often are associated neuropathic symptoms.6 Cutaneous tuberculosis is an extremely rare manifestation that occurs via direct inoculation of the mycobacterium, occurring primarily in children. Initially, it may manifest as a firm red papule that progresses to a painless shallow ulcer with a granular base.7 Cutaneous chromoblastomycosis is a fungal infection resulting from an initial cutaneous injury, similar to our patient, followed by a slow-developing warty lesion that may heal into ivory scars or spread as plaques on normal skin.8 The verrucous lesions seen in cutaneous chromoblastomycosis tend to manifest on the lower extremities and are unlikely to manifest on the head. Sarcoidosis is another granulomatous skin eruption that can be clinically nonspecific.9 Histologically, lesions may demonstrate noncaseating granulomatous inflammation, as seen with cutaneous leishmaniasis, with a broad presentation; for example, lupus pernio, a sarcoid variant, manifests as large blue-red dusky nodules/plaques on the face, ears, or digits.9 Other sarcoid lesions include red/brown, thickened, circular plaques; variably discolored papulonodular lesions; or mucosal involvement.9 Ultimately, it is important to differentiate these nonspecific and similarly appearing lesions through diagnostic techniques such as AFB culture and smear, fungal staining, tuberculosis testing, and PCR in more challenging cases.
Treatment of cutaneous leishmaniasis should be individualized to each case.5 A more than 50% reduction in lesion size within 4 to 6 weeks indicates successful treatment. Ulcerated lesions should be fully re-epithelialized and healed by 3 months posttreatment. Treatment failure is categorized by failure of reepithelization, incomplete healing by 3 months, or worsening of the lesion at any time, each necessitating additional treatment, such as a second course of miltefosine or a different medication regimen.5 Careful monitoring is required throughout treatment, assessing for treatment failure, adding to the challenges of leishmaniasis.
In conclusion, CL requires a high index of suspicion in nonendemic areas to ensure successful diagnosis and treatment. Our case highlights the importance of using multimodal diagnostic techniques for CL, as a single modality may not exhibit a positive result due to variations in diagnostic accuracy. Our case also exhibits the complex treatment of CL, and the considerations that should be made when choosing a treatment modality.
- Leishmaniasis. World Health Organization. Accessed September 14, 2024. https://www.who.int/news-room/fact-sheets/detail/leishmaniasis
- Clinical overview of leishmaniasis. Centers for Disease Control and Prevention. Accessed September 14, 2024. https://www.cdc.gov/leishmaniasis/hcp/clinical-overview/index.html
- CDC DPDx Leishmaniasis. Centers for Disease Control and Prevention. Accessed September 15, 2024. https://www.cdc.gov/dpdx/leishmaniasis/index.html
- Stark CG. Leishmaniasis differential diagnoses. Medscape. March 21, 2023. Accessed October 12, 2024. https://emedicine.medscape.com/article/220298-differential
- Aronson N, Herwaldt BL, Libman M, et al. Diagnosis and treatment of leishmaniasis: clinical practice guidelines by the Infectious Diseases Society of America (IDSA) and the American Society of Tropical Medicine and Hygiene (ASTMH). Clin Infect Dis. 2016;63:E202-E264. doi:10.1093/cid/ciw670
- Lewis FS. Dermatologic manifestations of leprosy. Medscape. June 19, 2023. Accessed October 12, 2024. https://emedicine.medscape.com/article/1104977-overview
- Ngan V. Cutaneous tuberculosis. DermNet. Accessed October 12, 2024. https://dermnetnz.org/topics/cutaneous-tuberculosis
- Schwartz RA. Chromoblastomycosis. Medscape. May 13, 2023. Accessed October 12, 2024. https://emedicine.medscape.com/article/1092695-overview#a4
- Elyoussfi S, Coulson I. Sarcoidosis. DermNet. May 31, 2024. Accessed October 25, 2024. https://dermnetnz.org/topics/sarcoidosis
Nonhealing Lesion on the Ear in a Child
Nonhealing Lesion on the Ear in a Child
A 10-year-old boy who recently emigrated from Afghanistan presented to his pediatrician for evaluation of a painless nonhealing plaque on the posterior left pinna of more than 1 year's duration. The lesion reportedly started as a small scratch following an ear injury, initially improved with an unknown topical treatment administered in Afghanistan, and then recurred with no other associated lesions and no known insect bite. The lesion persisted for more than 1 year postemigration before the patient presented to his pediatrician, who noted signs of excoriation, which was confirmed by the patient's father. The patient was started on a 7-day course of cephalexin oral suspension and topical mupirocin 2%. After 2 months without improvement, a 2-week course of oral trimethoprim/sulfamethoxazole was initiated; however, the lesion continued to grow with no signs of healing, and he was referred to dermatology.
The patient presented to pediatric dermatology 3 months after the initial presentation to his pediatrician and 2 weeks after he completed the course of oral trimethoprim/sulfamethoxazole. Physical examination demonstrated a papulosquamous eruption with swelling and blistering on the helix of the left ear. Based on these findings, the patient was started on a 1-month trial of topical triamcinolone 1% followed by the addition of topical pimecrolimus 1%. Due to no improvement of the lesion and subsequent progression to ulceration, a punch biopsy was performed.

Early Infantile Hemangioma Diagnosis Is Key in Skin of Color
Early Infantile Hemangioma Diagnosis Is Key in Skin of Color
Infantile hemangioma (IH) is the most common vascular tumor of infancy, appearing within the first few weeks of life and typically reaching peak size by age 3 to 5 months.1 It classically manifests as a raised or flat bright-red lesion in the upper dermis of the skin and/or subcutaneous tissue and can vary in number, size, shape, and location.2 It is characterized by a rapid proliferative phase, especially between 5 and 8 weeks of age, followed by gradual spontaneous regression over 1 to 10 years.1-3
Infantile hemangiomas are categorized based on depth (superficial, deep, or mixed) and distribution pattern (focal, multifocal, segmental, or indeterminate).4 In most cases, complete regression occurs by age 4 years, but there can be residual telangiectasia, fibrofatty tissue, and/or scarring.1,4 About 10% to 15% of IHs result in complications that require medical intervention (eg, visual, airway, or auditory compromise; ulceration; disfigurement); ideally, these patients should be referred to a specialist by 5 weeks of age.4 Prompt assessment of IH severity is essential to prevent or mitigate potential complications and ultimately improve outcomes.3 Social drivers of health contribute to delayed diagnosis and management of hemangiomas, leading to increased complications in some patient populations.5-7
Epidemiology
Infantile hemangiomas are estimated to manifest in 4.5% of infants in the United States.1 The most common type is superficial IH, typically found on the head or neck.5 Risk factors in infants include female sex, White race, premature birth, and low birth weight (<1000 g).1,3 Maternal risk factors include advanced gestational age (ie, >35 years), multiple gestations, family history of IH, tobacco use, use of progesterone therapy during pregnancy, and pre-eclampsia.1,3
Focal IH typically manifests as a single localized lesion that can occur anywhere on the body.2,3 In contrast, segmental IH manifests in a linear pattern and/or is distributed on a large anatomic area, most commonly on the face and less frequently the extremities and trunk.
Key Clinical Features
Superficial IH in patients with darker skin tones may appear as a dark-red or violaceous papule or plaque compared to bright red in lighter skin tones.5 Deep IH may appear as a soft, round, flesh-colored or blue-hued subcutaneous mass, the color of which may be harder to appreciate in those with darker skin tones.5
Worth Noting
Complications from IH may require imaging, close follow-up, systemic therapy, multidisciplinary care, and advanced health literacy and patient/family navigation. Multifocal IHs (≥5 lesions) are more likely to be associated with infantile hepatic hemangiomas.2,3 Large (>5 cm) segmental IHs on the face and lumbosacral area require further evaluation for PHACES (posterior fossa malformation, hemangiomas, arterial anomalies, cardiac defects, eye anomalies, and sternal raphe/cleft defects) and LUMBAR (lower-body segmental IH; urogenital anomalies and ulceration; myelopathy; bony deformities; anorectal malformations and arterial anomalies; and renal anomalies) syndromes, which are more common in patients of Hispanic ethnicity.2,3
The Infantile Hemangioma Referral Score is a recently validated tool that can assist primary care physicians in timely referral of IHs requiring early specialist intervention.4,9 It takes into account the location, number, and size of the lesions and the age of the patient; these factors help to determine which IHs may be managed conservatively vs those that may require treatment to prevent life-threatening complications.1-3
Systemic corticosteroids historically have been the primary treatment for IH; however, in the past decade, propranolol oral solution (4.28 mg/mL) has become the first-line therapy for most infants requiring systemic management.10 It is the only medication approved by the US Food and Drug Administration for proliferating IH, with treatment initiation as young as 5 weeks corrected age.11 As a nonselective beta-blocker, propranolol is believed to reduce IHs through vasoconstriction or by inhibition of angiogenesis.1,4,10
For small superficial IHs, treatment options include timolol maleate ophthalmic solution 0.5% (one drop applied twice daily to the IH) or pulsed dye laser therapy.4,10 Surgical excision typically is avoided during infancy due to concerns about anesthetic risks and potential blood loss.4,10 Surgery is reserved for cases involving residual fibrofatty tissue, postinvolution scarring, obstruction of vital structures, or lesions in aesthetically sensitive areas as well as when propranolol is contraindicated.4,10
Health Disparity Highlight
Infants with skin of color and those of lower socioeconomic status (SES) face a heightened risk for delayed diagnosis and more advanced disease at the initial evaluation for IH.5,7 Access barriers such as geographic limitations to specialty services, lack of insurance, underinsurance, and language differences impact timely diagnosis and treatment.5,6 Implementation of telemedicine services in areas with limited access to specialists can facilitate early evaluation and risk stratification for IH.12
A retrospective cohort study of 804 children seen at a large academic hospital found that those of lower SES were more likely to seek care after 3 months of age than their higher-SES counterparts.6 Those who presented after 6 months of age also had higher IH severity scores compared to their counterparts with higher SES.6 Delayed access to care may cause children to miss the critical treatment window during the rapid proliferative growth phase.6,12 However, children insured through Medicaid or the Children’s Health Insurance Program who participated in institutional care management programs (which assist in scheduling specialty care appointments within the institution) sought treatment earlier regardless of their SES, suggesting that such programs may help reduce disparities in timely access for children of lower SES.6
An epidemiologic study analyzing the demographics of children hospitalized across the United States demonstrated that Black infants with IH were more likely to belong to the lowest income quartile compared with White infants or those of other races. They also were 2 times older on average at initial presentation (1.8 vs 1.0 years), experienced longer hospitalizations (16.4 vs 13.8 days), and underwent more IH-related procedures than White infants and infants of other races (2.4, 1.9, and 2.1, respectively).7
These and other factors may contribute to missed windows of opportunity for timely treatment of high-risk IHs in patients with darker skin tones and/or those facing challenges stemming from social drivers of health.
- Léauté-Labrèze C, Harper JI, Hoeger PH. Infantile haemangioma. Lancet. 2017;390:85-94.
- Mitra R, Fitzsimons HL, Hale T, et al. Recent advances in understanding the molecular basis of infantile haemangioma development. Br J Dermatol. 2024;191:661-669.
- Rodríguez Bandera AI, Sebaratnam DF, Wargon O, et al. Infantile hemangioma. part 1: epidemiology, pathogenesis, clinical presentation and assessment. J Am Acad Dermatol. 2021;85:1379-1392.
- Sebaratnam DF, Rodríguez Bandera AL, Wong LCF, et al. Infantile hemangioma. part 2: management. J Am Acad Dermatol. 2021;85:1395-1404.
- Taye ME, Shah J, Seiverling EV, et al. Diagnosis of vascular anomalies in patients with skin of color. J Clin Aesthet Dermatol. 2024;17:54-62.
- Lie E, Psoter KJ, Püttgen KB. Lower socioeconomic status is associated with delayed access to care for infantile hemangioma: a cohort study. J Am Acad Dermatol. 2023;88:E221-E230.
- Kumar KD, Desai AD, Shah VP, et al. Racial discrepancies in presentation of hospitalized infantile hemangioma cases using the Kids’ Inpatient Database. Health Sci Rep. 2023;6:E1092.
- Chiller KG, Passaro D, Frieden IJ. Hemangiomas of infancy: clinical characteristics, morphologic subtypes, and their relationship to race, ethnicity, and sex. Arch Dermatol. 2002;138:1567.
- Léauté-Labrèze C, Baselga Torres E, Weibel L, et al. The infantile hemangioma referral score: a validated tool for physicians. Pediatrics. 2020;145:E20191628.
- Macca L, Altavilla D, Di Bartolomeo L, et al. Update on treatment of infantile hemangiomas: what’s new in the last five years? Front Pharmacol. 2022;13:879602.
- Krowchuk DP, Frieden IJ, Mancini AJ, et al. Clinical practice guideline for the management of infantile hemangiomas. Pediatrics. 2019;143:E20183475.
- Frieden IJ, Püttgen KB, Drolet BA, et al. Management of infantile hemangiomas during the COVID pandemic. Pediatr Dermatol. 2020;37:412-418.
Infantile hemangioma (IH) is the most common vascular tumor of infancy, appearing within the first few weeks of life and typically reaching peak size by age 3 to 5 months.1 It classically manifests as a raised or flat bright-red lesion in the upper dermis of the skin and/or subcutaneous tissue and can vary in number, size, shape, and location.2 It is characterized by a rapid proliferative phase, especially between 5 and 8 weeks of age, followed by gradual spontaneous regression over 1 to 10 years.1-3
Infantile hemangiomas are categorized based on depth (superficial, deep, or mixed) and distribution pattern (focal, multifocal, segmental, or indeterminate).4 In most cases, complete regression occurs by age 4 years, but there can be residual telangiectasia, fibrofatty tissue, and/or scarring.1,4 About 10% to 15% of IHs result in complications that require medical intervention (eg, visual, airway, or auditory compromise; ulceration; disfigurement); ideally, these patients should be referred to a specialist by 5 weeks of age.4 Prompt assessment of IH severity is essential to prevent or mitigate potential complications and ultimately improve outcomes.3 Social drivers of health contribute to delayed diagnosis and management of hemangiomas, leading to increased complications in some patient populations.5-7
Epidemiology
Infantile hemangiomas are estimated to manifest in 4.5% of infants in the United States.1 The most common type is superficial IH, typically found on the head or neck.5 Risk factors in infants include female sex, White race, premature birth, and low birth weight (<1000 g).1,3 Maternal risk factors include advanced gestational age (ie, >35 years), multiple gestations, family history of IH, tobacco use, use of progesterone therapy during pregnancy, and pre-eclampsia.1,3
Focal IH typically manifests as a single localized lesion that can occur anywhere on the body.2,3 In contrast, segmental IH manifests in a linear pattern and/or is distributed on a large anatomic area, most commonly on the face and less frequently the extremities and trunk.
Key Clinical Features
Superficial IH in patients with darker skin tones may appear as a dark-red or violaceous papule or plaque compared to bright red in lighter skin tones.5 Deep IH may appear as a soft, round, flesh-colored or blue-hued subcutaneous mass, the color of which may be harder to appreciate in those with darker skin tones.5
Worth Noting
Complications from IH may require imaging, close follow-up, systemic therapy, multidisciplinary care, and advanced health literacy and patient/family navigation. Multifocal IHs (≥5 lesions) are more likely to be associated with infantile hepatic hemangiomas.2,3 Large (>5 cm) segmental IHs on the face and lumbosacral area require further evaluation for PHACES (posterior fossa malformation, hemangiomas, arterial anomalies, cardiac defects, eye anomalies, and sternal raphe/cleft defects) and LUMBAR (lower-body segmental IH; urogenital anomalies and ulceration; myelopathy; bony deformities; anorectal malformations and arterial anomalies; and renal anomalies) syndromes, which are more common in patients of Hispanic ethnicity.2,3
The Infantile Hemangioma Referral Score is a recently validated tool that can assist primary care physicians in timely referral of IHs requiring early specialist intervention.4,9 It takes into account the location, number, and size of the lesions and the age of the patient; these factors help to determine which IHs may be managed conservatively vs those that may require treatment to prevent life-threatening complications.1-3
Systemic corticosteroids historically have been the primary treatment for IH; however, in the past decade, propranolol oral solution (4.28 mg/mL) has become the first-line therapy for most infants requiring systemic management.10 It is the only medication approved by the US Food and Drug Administration for proliferating IH, with treatment initiation as young as 5 weeks corrected age.11 As a nonselective beta-blocker, propranolol is believed to reduce IHs through vasoconstriction or by inhibition of angiogenesis.1,4,10
For small superficial IHs, treatment options include timolol maleate ophthalmic solution 0.5% (one drop applied twice daily to the IH) or pulsed dye laser therapy.4,10 Surgical excision typically is avoided during infancy due to concerns about anesthetic risks and potential blood loss.4,10 Surgery is reserved for cases involving residual fibrofatty tissue, postinvolution scarring, obstruction of vital structures, or lesions in aesthetically sensitive areas as well as when propranolol is contraindicated.4,10
Health Disparity Highlight
Infants with skin of color and those of lower socioeconomic status (SES) face a heightened risk for delayed diagnosis and more advanced disease at the initial evaluation for IH.5,7 Access barriers such as geographic limitations to specialty services, lack of insurance, underinsurance, and language differences impact timely diagnosis and treatment.5,6 Implementation of telemedicine services in areas with limited access to specialists can facilitate early evaluation and risk stratification for IH.12
A retrospective cohort study of 804 children seen at a large academic hospital found that those of lower SES were more likely to seek care after 3 months of age than their higher-SES counterparts.6 Those who presented after 6 months of age also had higher IH severity scores compared to their counterparts with higher SES.6 Delayed access to care may cause children to miss the critical treatment window during the rapid proliferative growth phase.6,12 However, children insured through Medicaid or the Children’s Health Insurance Program who participated in institutional care management programs (which assist in scheduling specialty care appointments within the institution) sought treatment earlier regardless of their SES, suggesting that such programs may help reduce disparities in timely access for children of lower SES.6
An epidemiologic study analyzing the demographics of children hospitalized across the United States demonstrated that Black infants with IH were more likely to belong to the lowest income quartile compared with White infants or those of other races. They also were 2 times older on average at initial presentation (1.8 vs 1.0 years), experienced longer hospitalizations (16.4 vs 13.8 days), and underwent more IH-related procedures than White infants and infants of other races (2.4, 1.9, and 2.1, respectively).7
These and other factors may contribute to missed windows of opportunity for timely treatment of high-risk IHs in patients with darker skin tones and/or those facing challenges stemming from social drivers of health.
- Léauté-Labrèze C, Harper JI, Hoeger PH. Infantile haemangioma. Lancet. 2017;390:85-94.
- Mitra R, Fitzsimons HL, Hale T, et al. Recent advances in understanding the molecular basis of infantile haemangioma development. Br J Dermatol. 2024;191:661-669.
- Rodríguez Bandera AI, Sebaratnam DF, Wargon O, et al. Infantile hemangioma. part 1: epidemiology, pathogenesis, clinical presentation and assessment. J Am Acad Dermatol. 2021;85:1379-1392.
- Sebaratnam DF, Rodríguez Bandera AL, Wong LCF, et al. Infantile hemangioma. part 2: management. J Am Acad Dermatol. 2021;85:1395-1404.
- Taye ME, Shah J, Seiverling EV, et al. Diagnosis of vascular anomalies in patients with skin of color. J Clin Aesthet Dermatol. 2024;17:54-62.
- Lie E, Psoter KJ, Püttgen KB. Lower socioeconomic status is associated with delayed access to care for infantile hemangioma: a cohort study. J Am Acad Dermatol. 2023;88:E221-E230.
- Kumar KD, Desai AD, Shah VP, et al. Racial discrepancies in presentation of hospitalized infantile hemangioma cases using the Kids’ Inpatient Database. Health Sci Rep. 2023;6:E1092.
- Chiller KG, Passaro D, Frieden IJ. Hemangiomas of infancy: clinical characteristics, morphologic subtypes, and their relationship to race, ethnicity, and sex. Arch Dermatol. 2002;138:1567.
- Léauté-Labrèze C, Baselga Torres E, Weibel L, et al. The infantile hemangioma referral score: a validated tool for physicians. Pediatrics. 2020;145:E20191628.
- Macca L, Altavilla D, Di Bartolomeo L, et al. Update on treatment of infantile hemangiomas: what’s new in the last five years? Front Pharmacol. 2022;13:879602.
- Krowchuk DP, Frieden IJ, Mancini AJ, et al. Clinical practice guideline for the management of infantile hemangiomas. Pediatrics. 2019;143:E20183475.
- Frieden IJ, Püttgen KB, Drolet BA, et al. Management of infantile hemangiomas during the COVID pandemic. Pediatr Dermatol. 2020;37:412-418.
Early Infantile Hemangioma Diagnosis Is Key in Skin of Color
Early Infantile Hemangioma Diagnosis Is Key in Skin of Color

Therapeutic Approaches for Alopecia Areata in Children Aged 6 to 11 Years
Therapeutic Approaches for Alopecia Areata in Children Aged 6 to 11 Years
Pediatric alopecia areata (AA) is a chronic autoimmune disease of the hair follicles characterized by nonscarring hair loss. Its incidence in children in the United States ranges from 13.6 to 33.5 per 100,000 person-years, with a prevalence of 0.04% to 0.11%.1 Alopecia areata has important effects on quality of life, particularly in children. Hair loss at an early age can decrease participation in school, sports, and extracurricular activities2 and is associated with increased rates of comorbid anxiety and depression.3 Families also experience psychosocial stress, often comparable to other chronic pediatric illnesses.4 Thus, management requires not only medical therapy but also psychosocial support and school-based accommodations.
Systemic therapies for treatment of AA in adolescents and adults are increasingly available, including US Food and Drug Administration (FDA)–approved Janus kinase (JAK) inhibitors such as baricitinib, deuruxolitinib (for adults), and ritlecitinib (for adolescents and adults); however, no systemic therapies have been approved by the FDA for children younger than 12 years. The therapeutic gap is most acute for those aged 6 to 11 years, for whom the psychosocial burden is high but treatment options are limited.3
This article highlights options and strategies for managing AA in children aged 6 to 11 years, emphasizing supportive and psychosocial care (including camouflage techniques), topical therapies, and off-label systemic approaches.
Supportive and Psychosocial Care
Treatment of AA in children extends beyond the affected child to include parents, caregivers, and even school staff (eg, teachers, principals, nurses).4 Disease-specific organizations such as the National Alopecia Areata Foundation (naaf.org) and the Children’s Alopecia Project (childrensalopeciaproject.org) provide education, support groups, and advocacy resources. These organizations assist families in navigating school accommodations, including Section 504 plans that may allow children with AA to wear hats in school to mitigate stigma. Additional resources include handouts for teachers and school nurses developed by the Society for Pediatric Dermatology.5
Psychological support for these patients is critical. Many children benefit from seeing a psychologist, particularly if anxiety, depression, and/or bullying is present.3 In clinics without embedded psychology services, dermatologists should maintain referral lists or encourage families to seek guidance from their pediatrician.
Camouflage techniques can help children cope with visible hair loss. Wigs and hairpieces are available free of charge through charitable organizations for patients younger than 17; however, young children often find adhesives uncomfortable, and they will not wear nonadherent wigs for long periods of time. Alternatives include soft hats, bonnets, scarves, and beanies. For partial hair loss, root concealers, scalp powders, or hair mascara can be useful. Temporary eyebrow tattoos are a good cosmetic approach, whereas microblading generally is not advised in children younger than 12 due to procedural risks including pain.
Topical Therapies
Topical agents remain the mainstay of treatment for AA in children aged 6 to 11 years. Potent class 1 or class 2 topical corticosteroids commonly are used, sometimes in combination with calcineurin inhibitors or topical minoxidil. Off-label compounded topical JAK inhibitors also have been tried in this population and may be helpful for eyebrow hair loss,6 though data on their efficacy for scalp AA are mixed.7 Intralesional corticosteroid injections, effective in adolescents and adults, generally are poorly tolerated by younger children and may cause considerable distress. Contact immunotherapy with squaric acid dibutyl ester or anthralin can be considered, but these agents are designed to elicit irritation, which may be intolerable for young children.8 Shared decision-making with families is essential to balance efficacy, tolerability, and treatment burden.
Systemic Therapies
Systemic therapy generally is reserved for children with extensive or refractory AA. Low-dose oral minoxidil is emerging as an off-label option. One systematic review reported that low-dose oral minoxidil was well tolerated in pediatric patients with minimal adverse effects.9 Doses of 0.01 to 0.02 mg/kg/d are reasonable starting points, achieved by cutting tablets or compounding oral solutions.10
In children with AA and concurrent atopic dermatitis, dupilumab may offer dual benefit. A real-world observational study demonstrated hair regrowth in pediatric patients with AA treated with dupilumab.11 Immunosuppressive options such as low-dose methotrexate or pulse corticosteroids (dexamethasone or prednisolone) also may be considered, although use of these agents requires careful monitoring due to increased risk for infection, clinically significant blood count and liver enzyme changes, and metabolic adverse effects related to long-term use of corticosteroids.
Clinical trials of JAK inhibitors in children aged 6 to 11 years are anticipated to begin in late 2025. Until then, off-label use of ritlecitinib, baricitinib, tofacitinib, or other JAK inhibitors may be considered in select cases with considerable disease burden and quality-of-life impairment following thorough discussion with the patient and their caregivers. Currently available pediatric data show few serious adverse events in children—the most common included upper respiratory infections (nasopharyngitis), acne, and headaches—but long-term risks remain unknown. Dosing challenges also exist for children who cannot swallow pills; currently ritlecitinib is available only as a capsule that cannot be opened while other JAK inhibitors are available in more accessible forms (baricitinib can be crushed and dissolved, and tofacitinib is available in liquid formulation for other pediatric indications). Insurance coverage is a major barrier, as these therapies are not FDA approved for AA in this age group.
Final Thoughts
Alopecia areata in children aged 6 to 11 years presents unique therapeutic challenges. While highly effective systemic therapies exist for older patients, younger children have limited options. For the 6-to-11 age group, management strategies should prioritize psychosocial support, topical therapy, and low-burden systemic alternatives such as low-dose oral minoxidil. Family education, school-based accommodations, and access to camouflage techniques are integral to holistic care. The commencement of pediatric clinical trials for JAK inhibitors offers hope for more robust treatment strategies in the near future. In the meantime, clinicians must engage in shared decision-making, tailoring therapy to the child’s disease severity, emotional well-being, and family priorities.
- Adhanom R, Ansbro B, Castelo-Soccio L. Epidemiology of pediatric alopecia areata. Pediatr Dermatol. 2025;42(suppl 1):12-23. doi:10.1111/pde.15803
- Paller AS, Rangel SM, Chamlin SL, et al; Pediatric Dermatology Research Alliance. Stigmatization and mental health impact of chronic pediatric skin disorders. JAMA Dermatol. 2024;160:621-630.
- van Dalen M, Muller KS, Kasperkovitz-Oosterloo JM, et al. Anxiety, depression, and quality of life in children and adults with alopecia areata: systematic review and meta-analysis. Front Med (Lausanne). 2022;9:1054898.
- Yücesoy SN, Uzunçakmak TK, Selçukog?lu Ö, et al. Evaluation of quality of life scores and family impact scales in pediatric patients with alopecia areata: a cross-sectional cohort study. Int J Dermatol. 2024;63:1414-1420.
- Alopecia areata. Society for Pediatric Dermatology. Accessed November 17, 2025. https://pedsderm.net/site/assets/files/18580/spd_school_handout_1_alopecia.pdf
- Liu LY, King BA. Response to tofacitinib therapy of eyebrows and eyelashes in alopecia areata. J Am Acad Dermatol. 2019;80:1778-1779.
- Bokhari L, Sinclair R. Treatment of alopecia universalis with topical Janus kinase inhibitors—a double blind, placebo, and active controlled pilot study. Int J Dermatol. 2018;57:1464-1470.
- Hill ND, Bunata K, Hebert AA. Treatment of alopecia areata with squaric acid dibutylester. Clin Dermatol. 2015;33:300-304.
- Williams KN, Olukoga CTY, Tosti A. Evaluation of the safety and effectiveness of oral minoxidil in children: a systematic review. Dermatol Ther (Heidelb). 2024;14:1709-1727.
- Lemes LR, Melo DF, de Oliveira DS, et al. Topical and oral minoxidil for hair disorders in pediatric patients: what do we know so far? Dermatol Ther. 2020;33:E13950.
- David E, Shokrian N, Del Duca E, et al. Dupilumab induces hair regrowth in pediatric alopecia areata: a real-world, single-center observational study. Arch Dermatol Res. 2024;316:487.
Pediatric alopecia areata (AA) is a chronic autoimmune disease of the hair follicles characterized by nonscarring hair loss. Its incidence in children in the United States ranges from 13.6 to 33.5 per 100,000 person-years, with a prevalence of 0.04% to 0.11%.1 Alopecia areata has important effects on quality of life, particularly in children. Hair loss at an early age can decrease participation in school, sports, and extracurricular activities2 and is associated with increased rates of comorbid anxiety and depression.3 Families also experience psychosocial stress, often comparable to other chronic pediatric illnesses.4 Thus, management requires not only medical therapy but also psychosocial support and school-based accommodations.
Systemic therapies for treatment of AA in adolescents and adults are increasingly available, including US Food and Drug Administration (FDA)–approved Janus kinase (JAK) inhibitors such as baricitinib, deuruxolitinib (for adults), and ritlecitinib (for adolescents and adults); however, no systemic therapies have been approved by the FDA for children younger than 12 years. The therapeutic gap is most acute for those aged 6 to 11 years, for whom the psychosocial burden is high but treatment options are limited.3
This article highlights options and strategies for managing AA in children aged 6 to 11 years, emphasizing supportive and psychosocial care (including camouflage techniques), topical therapies, and off-label systemic approaches.
Supportive and Psychosocial Care
Treatment of AA in children extends beyond the affected child to include parents, caregivers, and even school staff (eg, teachers, principals, nurses).4 Disease-specific organizations such as the National Alopecia Areata Foundation (naaf.org) and the Children’s Alopecia Project (childrensalopeciaproject.org) provide education, support groups, and advocacy resources. These organizations assist families in navigating school accommodations, including Section 504 plans that may allow children with AA to wear hats in school to mitigate stigma. Additional resources include handouts for teachers and school nurses developed by the Society for Pediatric Dermatology.5
Psychological support for these patients is critical. Many children benefit from seeing a psychologist, particularly if anxiety, depression, and/or bullying is present.3 In clinics without embedded psychology services, dermatologists should maintain referral lists or encourage families to seek guidance from their pediatrician.
Camouflage techniques can help children cope with visible hair loss. Wigs and hairpieces are available free of charge through charitable organizations for patients younger than 17; however, young children often find adhesives uncomfortable, and they will not wear nonadherent wigs for long periods of time. Alternatives include soft hats, bonnets, scarves, and beanies. For partial hair loss, root concealers, scalp powders, or hair mascara can be useful. Temporary eyebrow tattoos are a good cosmetic approach, whereas microblading generally is not advised in children younger than 12 due to procedural risks including pain.
Topical Therapies
Topical agents remain the mainstay of treatment for AA in children aged 6 to 11 years. Potent class 1 or class 2 topical corticosteroids commonly are used, sometimes in combination with calcineurin inhibitors or topical minoxidil. Off-label compounded topical JAK inhibitors also have been tried in this population and may be helpful for eyebrow hair loss,6 though data on their efficacy for scalp AA are mixed.7 Intralesional corticosteroid injections, effective in adolescents and adults, generally are poorly tolerated by younger children and may cause considerable distress. Contact immunotherapy with squaric acid dibutyl ester or anthralin can be considered, but these agents are designed to elicit irritation, which may be intolerable for young children.8 Shared decision-making with families is essential to balance efficacy, tolerability, and treatment burden.
Systemic Therapies
Systemic therapy generally is reserved for children with extensive or refractory AA. Low-dose oral minoxidil is emerging as an off-label option. One systematic review reported that low-dose oral minoxidil was well tolerated in pediatric patients with minimal adverse effects.9 Doses of 0.01 to 0.02 mg/kg/d are reasonable starting points, achieved by cutting tablets or compounding oral solutions.10
In children with AA and concurrent atopic dermatitis, dupilumab may offer dual benefit. A real-world observational study demonstrated hair regrowth in pediatric patients with AA treated with dupilumab.11 Immunosuppressive options such as low-dose methotrexate or pulse corticosteroids (dexamethasone or prednisolone) also may be considered, although use of these agents requires careful monitoring due to increased risk for infection, clinically significant blood count and liver enzyme changes, and metabolic adverse effects related to long-term use of corticosteroids.
Clinical trials of JAK inhibitors in children aged 6 to 11 years are anticipated to begin in late 2025. Until then, off-label use of ritlecitinib, baricitinib, tofacitinib, or other JAK inhibitors may be considered in select cases with considerable disease burden and quality-of-life impairment following thorough discussion with the patient and their caregivers. Currently available pediatric data show few serious adverse events in children—the most common included upper respiratory infections (nasopharyngitis), acne, and headaches—but long-term risks remain unknown. Dosing challenges also exist for children who cannot swallow pills; currently ritlecitinib is available only as a capsule that cannot be opened while other JAK inhibitors are available in more accessible forms (baricitinib can be crushed and dissolved, and tofacitinib is available in liquid formulation for other pediatric indications). Insurance coverage is a major barrier, as these therapies are not FDA approved for AA in this age group.
Final Thoughts
Alopecia areata in children aged 6 to 11 years presents unique therapeutic challenges. While highly effective systemic therapies exist for older patients, younger children have limited options. For the 6-to-11 age group, management strategies should prioritize psychosocial support, topical therapy, and low-burden systemic alternatives such as low-dose oral minoxidil. Family education, school-based accommodations, and access to camouflage techniques are integral to holistic care. The commencement of pediatric clinical trials for JAK inhibitors offers hope for more robust treatment strategies in the near future. In the meantime, clinicians must engage in shared decision-making, tailoring therapy to the child’s disease severity, emotional well-being, and family priorities.
- Adhanom R, Ansbro B, Castelo-Soccio L. Epidemiology of pediatric alopecia areata. Pediatr Dermatol. 2025;42(suppl 1):12-23. doi:10.1111/pde.15803
- Paller AS, Rangel SM, Chamlin SL, et al; Pediatric Dermatology Research Alliance. Stigmatization and mental health impact of chronic pediatric skin disorders. JAMA Dermatol. 2024;160:621-630.
- van Dalen M, Muller KS, Kasperkovitz-Oosterloo JM, et al. Anxiety, depression, and quality of life in children and adults with alopecia areata: systematic review and meta-analysis. Front Med (Lausanne). 2022;9:1054898.
- Yücesoy SN, Uzunçakmak TK, Selçukog?lu Ö, et al. Evaluation of quality of life scores and family impact scales in pediatric patients with alopecia areata: a cross-sectional cohort study. Int J Dermatol. 2024;63:1414-1420.
- Alopecia areata. Society for Pediatric Dermatology. Accessed November 17, 2025. https://pedsderm.net/site/assets/files/18580/spd_school_handout_1_alopecia.pdf
- Liu LY, King BA. Response to tofacitinib therapy of eyebrows and eyelashes in alopecia areata. J Am Acad Dermatol. 2019;80:1778-1779.
- Bokhari L, Sinclair R. Treatment of alopecia universalis with topical Janus kinase inhibitors—a double blind, placebo, and active controlled pilot study. Int J Dermatol. 2018;57:1464-1470.
- Hill ND, Bunata K, Hebert AA. Treatment of alopecia areata with squaric acid dibutylester. Clin Dermatol. 2015;33:300-304.
- Williams KN, Olukoga CTY, Tosti A. Evaluation of the safety and effectiveness of oral minoxidil in children: a systematic review. Dermatol Ther (Heidelb). 2024;14:1709-1727.
- Lemes LR, Melo DF, de Oliveira DS, et al. Topical and oral minoxidil for hair disorders in pediatric patients: what do we know so far? Dermatol Ther. 2020;33:E13950.
- David E, Shokrian N, Del Duca E, et al. Dupilumab induces hair regrowth in pediatric alopecia areata: a real-world, single-center observational study. Arch Dermatol Res. 2024;316:487.
Therapeutic Approaches for Alopecia Areata in Children Aged 6 to 11 Years
Therapeutic Approaches for Alopecia Areata in Children Aged 6 to 11 Years

Solitary Yellow Papule on the Upper Back in an Infant
The Diagnosis: Juvenile Xanthogranuloma
Given the patient’s age, clinical features of the lesion, and characteristic setting-sun pattern on dermoscopy, a diagnosis of juvenile xanthogranuloma (JXG) was made. The patient showed no other signs of neurofibromatosis type 1 (NF1) or systemic disease and was managed conservatively with observation and routine follow-up. Minimal growth of the lesion was noted at 1-year follow-up, and he was meeting all age-appropriate developmental milestones and showed no other symptoms consistent with NF1.
Juvenile xanthogranuloma is the most common childhood non–Langerhans cell histiocytosis. While it typically manifests as an isolated condition, JXG also can be associated with NF1 as well as juvenile myelomonocytic leukemia.1-3 Neurofibromatosis type 1 is a multisystem disorder with variable clinical manifestations that commonly is associated with skin findings such as café au lait macules, intertriginous freckling, and neurofibromas, in addition to JXG.2,3 Diagnosis of JXG should prompt noninvasive evaluation for further signs and symptoms of NF1, including thorough patient and family history and physical examination to identify other characteristic cutaneous findings, and can include consideration of slit lamp eye examination and radiography for identification of osseous findings.
The pathogenesis of JXG is not fully known, though there is evidence that it may be associated with a mutation in the mitogen-activated protein kinase pathway.1 The majority of cases appear in the first year of life.4 Clinically, JXG can manifest with extracutaneous lesions, including on the eyes and lungs.5-7 Juvenile xanthogranuloma can be noninvasively diagnosed with dermoscopy. As seen in our patient, dermoscopic findings include a red-yellow or yellow-orange background with an erythematous border, typically described as a setting-sun pattern.4,8 Biopsy can confirm the diagnosis; however, given the usually benign course, this often is unnecessary. Most pediatric patients with cutaneous manifestations have a self-limited course with regression over several months to years. Generally, no treatment is required for cutaneous manifestations alone; however, lesions can be removed for aesthetic concerns. For those with systemic involvement, a range of other treatments have been used, including chemotherapy, radiotherapy, systemic corticosteroids, and cyclosporine.6,7
The differential diagnosis for JXG includes Brooke-Spiegler syndrome, Fabry disease, solitary cutaneous mastocytoma, and tuberous sclerosis complex. Brooke-Spiegler syndrome is an autosomal-dominant condition characterized by the growth of adnexal neoplasms, including trichoepitheliomas, cylindromas, and spiradenomas. These lesions usually manifest on the face but can include other areas such as the trunk.9 Fabry disease is an X-linked recessive lysosomal storage disorder with cutaneous manifestations such as angiokeratoma corporis diffusum and hypohidrosis. Patients also may present with systemic symptoms including hypertension and renal and cardiovascular disease.10 Mastocytosis encompasses several clinical disorders defined by mast cell hyperplasia and accumulation in various organ systems, and solitary cutaneous mastocytoma is the most common manifestation in children.11,12 Cutaneous mastocytoma can manifest as a single red-brown or yellow papule, usually located on the arms or legs.13 Solitary cutaneous mastocytomas in pediatric patients typically are diagnosed based on clinical appearance and the formation of a wheal upon firm palpation (Darier sign).11-13 Our patient did not demonstrate the Darier sign, and the lesion was asymptomatic. Tuberous sclerosis complex is an autosomal-dominant neurocutaneous disorder with neurologic and skin findings that occur early in the disease course and include facial angiofibromas, hypomelanotic macules, shagreen patches, and café-au-lait macules.14
- Durham BH, Lopez Rodrigo E, Picarsic J, et al. Activating mutations in CSF1R and additional receptor tyrosine kinases in histiocytic neoplasms. Nat Med. 2019;25:1839-1842.
- Friedman JM. Neurofibromatosis 1. In: Adam MP, Feldman J, Mirzaa GM, et al, eds. GeneReviews®. University of Washington, Seattle; 1998.
- Miraglia E, Laghi A, Moramarco A, et al. Juvenile xanthogranuloma in neurofibromatosis type 1. Prevalence and possible correlation with lymphoproliferative diseases: experience of a single center and review of the literature. Clin Ther. 2022;173:353-355.
- Collie JS, Harper CD, Fillman EP. Juvenile xanthogranuloma. StatPearls [Internet]. StatPearls Publishing; 2025. Updated August 8, 2023. Accessed November 4, 2025. https://www.ncbi.nlm.nih.gov/books/NBK526103/
- Newman B, Hu W, Nigro K, et al. Aggressive histiocytic disorders that can involve the skin. J Am Acad Dermatol. 2007;56:302-316.
- Freyer DR, Kennedy R, Bostrom BC, et al. Juvenile xanthogranuloma: forms of systemic disease and their clinical implications. J Pediatr. 1996;129:227-237.
- Murphy JT, Soeken T, Megison S, et al. Juvenile xanthogranuloma: diverse presentations of noncutaneous disease. J Pediatr Hematol Oncol.2014;36:641-645.
- Xu J, Ma L. Dermoscopic patterns in juvenile xanthogranuloma based on the histological classification. Front Med (Lausanne). 2021;7:618946.
- Kazakov DV. Brooke-Spiegler syndrome and phenotypic variants: an update. Head Neck Pathol. 2016;10:125-130.
- Bokhari SRA, Zulfiqar H, Hariz A. Fabry disease. StatPearls [Internet]. StatPearls Publishing; 2025. Update July 4, 2023. Accessed November 4, 2025. https://www.ncbi.nlm.nih.gov/books/NBK435996/
- Hartmann K, Escribano L, Grattan C, et al. Cutaneous manifestations in patients with mastocytosis: consensus report of the European Competence Network on Mastocytosis; the American Academy of Allergy, Asthma & Immunology; and the European Academy of Allergology and Clinical Immunology. J Allergy Clin Immunol. 2016;137:35-45.
- Klaiber N, Kumar S, Irani AM. Mastocytosis in children. Curr Allergy Asthma Rep. 2017;17:80.
- Sławin´ ska M, Kaszuba A, Lange M, et al. Dermoscopic features of different forms of cutaneous mastocytosis: a systematic review. J Clin Med. 2022;11:4649.
- Teng JM, Cowen EW, Wataya-Kaneda M, et al. Dermatologic and dental aspects of the 2012 International Tuberous Sclerosis Complex Consensus Statements. JAMA Dermatol. 2014;150:1095-1101.
The Diagnosis: Juvenile Xanthogranuloma
Given the patient’s age, clinical features of the lesion, and characteristic setting-sun pattern on dermoscopy, a diagnosis of juvenile xanthogranuloma (JXG) was made. The patient showed no other signs of neurofibromatosis type 1 (NF1) or systemic disease and was managed conservatively with observation and routine follow-up. Minimal growth of the lesion was noted at 1-year follow-up, and he was meeting all age-appropriate developmental milestones and showed no other symptoms consistent with NF1.
Juvenile xanthogranuloma is the most common childhood non–Langerhans cell histiocytosis. While it typically manifests as an isolated condition, JXG also can be associated with NF1 as well as juvenile myelomonocytic leukemia.1-3 Neurofibromatosis type 1 is a multisystem disorder with variable clinical manifestations that commonly is associated with skin findings such as café au lait macules, intertriginous freckling, and neurofibromas, in addition to JXG.2,3 Diagnosis of JXG should prompt noninvasive evaluation for further signs and symptoms of NF1, including thorough patient and family history and physical examination to identify other characteristic cutaneous findings, and can include consideration of slit lamp eye examination and radiography for identification of osseous findings.
The pathogenesis of JXG is not fully known, though there is evidence that it may be associated with a mutation in the mitogen-activated protein kinase pathway.1 The majority of cases appear in the first year of life.4 Clinically, JXG can manifest with extracutaneous lesions, including on the eyes and lungs.5-7 Juvenile xanthogranuloma can be noninvasively diagnosed with dermoscopy. As seen in our patient, dermoscopic findings include a red-yellow or yellow-orange background with an erythematous border, typically described as a setting-sun pattern.4,8 Biopsy can confirm the diagnosis; however, given the usually benign course, this often is unnecessary. Most pediatric patients with cutaneous manifestations have a self-limited course with regression over several months to years. Generally, no treatment is required for cutaneous manifestations alone; however, lesions can be removed for aesthetic concerns. For those with systemic involvement, a range of other treatments have been used, including chemotherapy, radiotherapy, systemic corticosteroids, and cyclosporine.6,7
The differential diagnosis for JXG includes Brooke-Spiegler syndrome, Fabry disease, solitary cutaneous mastocytoma, and tuberous sclerosis complex. Brooke-Spiegler syndrome is an autosomal-dominant condition characterized by the growth of adnexal neoplasms, including trichoepitheliomas, cylindromas, and spiradenomas. These lesions usually manifest on the face but can include other areas such as the trunk.9 Fabry disease is an X-linked recessive lysosomal storage disorder with cutaneous manifestations such as angiokeratoma corporis diffusum and hypohidrosis. Patients also may present with systemic symptoms including hypertension and renal and cardiovascular disease.10 Mastocytosis encompasses several clinical disorders defined by mast cell hyperplasia and accumulation in various organ systems, and solitary cutaneous mastocytoma is the most common manifestation in children.11,12 Cutaneous mastocytoma can manifest as a single red-brown or yellow papule, usually located on the arms or legs.13 Solitary cutaneous mastocytomas in pediatric patients typically are diagnosed based on clinical appearance and the formation of a wheal upon firm palpation (Darier sign).11-13 Our patient did not demonstrate the Darier sign, and the lesion was asymptomatic. Tuberous sclerosis complex is an autosomal-dominant neurocutaneous disorder with neurologic and skin findings that occur early in the disease course and include facial angiofibromas, hypomelanotic macules, shagreen patches, and café-au-lait macules.14
- Durham BH, Lopez Rodrigo E, Picarsic J, et al. Activating mutations in CSF1R and additional receptor tyrosine kinases in histiocytic neoplasms. Nat Med. 2019;25:1839-1842.
- Friedman JM. Neurofibromatosis 1. In: Adam MP, Feldman J, Mirzaa GM, et al, eds. GeneReviews®. University of Washington, Seattle; 1998.
- Miraglia E, Laghi A, Moramarco A, et al. Juvenile xanthogranuloma in neurofibromatosis type 1. Prevalence and possible correlation with lymphoproliferative diseases: experience of a single center and review of the literature. Clin Ther. 2022;173:353-355.
- Collie JS, Harper CD, Fillman EP. Juvenile xanthogranuloma. StatPearls [Internet]. StatPearls Publishing; 2025. Updated August 8, 2023. Accessed November 4, 2025. https://www.ncbi.nlm.nih.gov/books/NBK526103/
- Newman B, Hu W, Nigro K, et al. Aggressive histiocytic disorders that can involve the skin. J Am Acad Dermatol. 2007;56:302-316.
- Freyer DR, Kennedy R, Bostrom BC, et al. Juvenile xanthogranuloma: forms of systemic disease and their clinical implications. J Pediatr. 1996;129:227-237.
- Murphy JT, Soeken T, Megison S, et al. Juvenile xanthogranuloma: diverse presentations of noncutaneous disease. J Pediatr Hematol Oncol.2014;36:641-645.
- Xu J, Ma L. Dermoscopic patterns in juvenile xanthogranuloma based on the histological classification. Front Med (Lausanne). 2021;7:618946.
- Kazakov DV. Brooke-Spiegler syndrome and phenotypic variants: an update. Head Neck Pathol. 2016;10:125-130.
- Bokhari SRA, Zulfiqar H, Hariz A. Fabry disease. StatPearls [Internet]. StatPearls Publishing; 2025. Update July 4, 2023. Accessed November 4, 2025. https://www.ncbi.nlm.nih.gov/books/NBK435996/
- Hartmann K, Escribano L, Grattan C, et al. Cutaneous manifestations in patients with mastocytosis: consensus report of the European Competence Network on Mastocytosis; the American Academy of Allergy, Asthma & Immunology; and the European Academy of Allergology and Clinical Immunology. J Allergy Clin Immunol. 2016;137:35-45.
- Klaiber N, Kumar S, Irani AM. Mastocytosis in children. Curr Allergy Asthma Rep. 2017;17:80.
- Sławin´ ska M, Kaszuba A, Lange M, et al. Dermoscopic features of different forms of cutaneous mastocytosis: a systematic review. J Clin Med. 2022;11:4649.
- Teng JM, Cowen EW, Wataya-Kaneda M, et al. Dermatologic and dental aspects of the 2012 International Tuberous Sclerosis Complex Consensus Statements. JAMA Dermatol. 2014;150:1095-1101.
A 6-month-old male infant with a history of cradle cap and an infantile hemangioma on the left shoulder presented to the dermatology clinic for evaluation of a slow-growing yellow papule on the upper back of 3 months’ duration. The lesion initially was noted 2 months prior to the current presentation by the patient’s pediatrician, who recommended follow-up with dermatology after an unsuccessful attempt at incision and drainage. Physical examination revealed a 7-mm, yellow, dome-shaped papule with a red collarette on the right upper back. No axillary freckling, ocular findings, or other skin findings were found. The patient was born at term with no complications, and his mother reported that he was otherwise healthy. There were no developmental concerns or known allergies, and his family history was negative for any similar lesions. Dermoscopic examination of the lesion revealed a well-circumscribed, circular, yellow-orange papule with an erythematous border and setting-sun appearance.
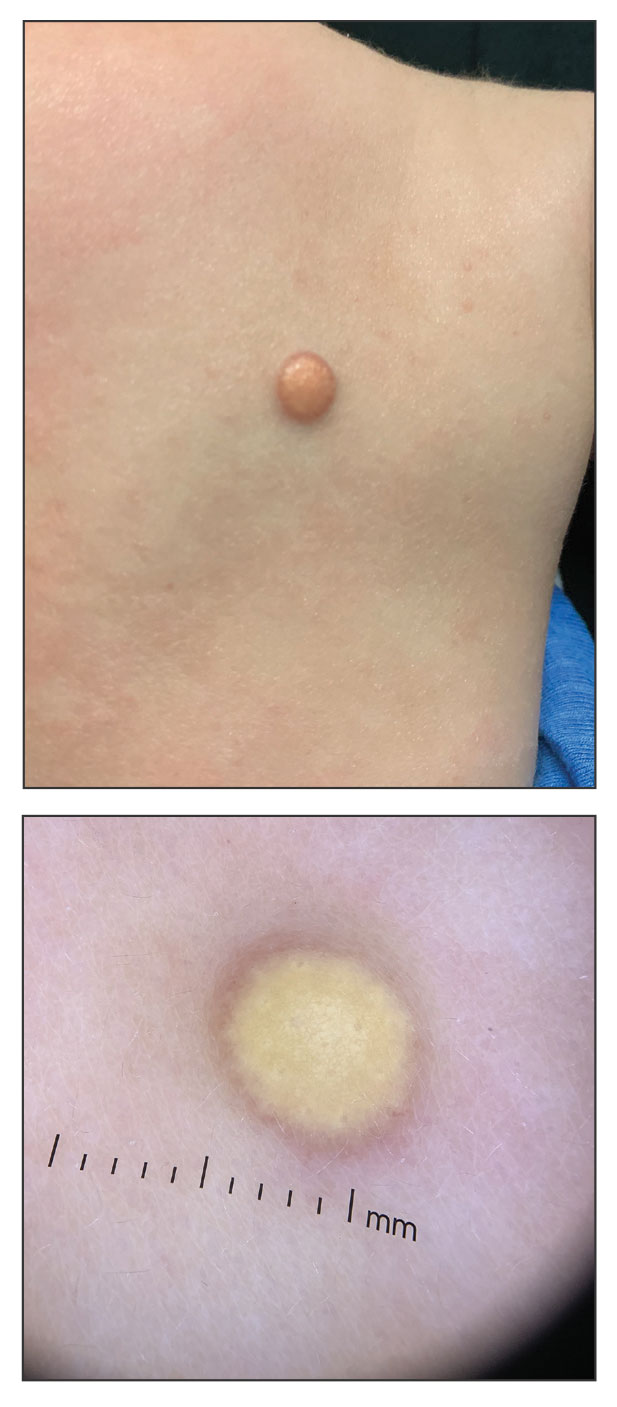
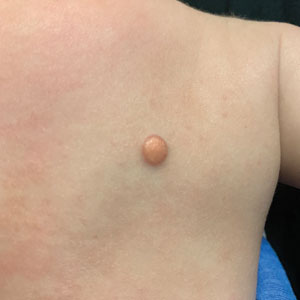
Epidemiologic and Clinical Evaluation of the Bidirectional Link Between Molluscum Contagiosum and Atopic Dermatitis in Children
Epidemiologic and Clinical Evaluation of the Bidirectional Link Between Molluscum Contagiosum and Atopic Dermatitis in Children
Molluscum contagiosum (MC), which is caused by a DNA virus in the Poxviridae family, is a common viral skin infection that primarily affects children.1-4 The reported incidence and prevalence of MC exhibit notable geographic variation. Worldwide, annual incidence rates per 1000 individuals range from 3.1 to 25, and prevalence ranges from 0.27% to 34.6%.2-7
Molluscum contagiosum is diagnosed clinically and typically manifests as smooth, flesh-colored papules measuring 2 to 6 mm in diameter with central umbilication. It can manifest as a single lesion or multiple clustered lesions, or in a disseminated pattern. The primary mode of transmission is through contact with skin, lesions, or contaminated personal items, or via self-inoculation. The majority of cases are asymptomatic, but in some patients, MC may be associated with pruritus, tenderness, erythema, or irritation. When present, secondary bacterial infections can cause localized inflammation and pain.1,3,4 The pathogenesis hinges on MC virus replication within keratinocytes, disrupting cellular differentiation and keratinization. The virus persists in the host by influencing the immune response through various mechanisms, including interference with signaling pathways, apoptosis inhibition, and antigen presentation disruption.3,4
Molluscum contagiosum typically follows a self-limiting trajectory, resolving over several months to 2 years.3,4 The resolution timeframe is intricately linked to variables such as the patient’s immune profile, lesion burden, and treatment approach. For symptomatic lesions, a variety of treatment options have been described, including physical ablation (eg, cryotherapy, curettage) and topical agents such as potassium hydroxide, cantharidin, imiquimod, and salicylic acid.3,4,8,9
Atopic dermatitis (AD) is a common chronic relapsing inflammatory skin disorder. In the United States, its prevalence ranges from 15% to 30% in children and from 2% to 10% in adults, with ongoing evidence of a growing global incidence.10-14 While AD can emerge at any age, typical onset is during early childhood. The clinical manifestation of AD includes a spectrum of eczematous features, often accompanied by persistent itching. The pathogenesis is multifactorial, involving a complex interplay of genetic, immunologic, and environmental factors. Key contributors to this multifaceted process encompass a compromised epidermal barrier, alterations in the skin microbiome, and an immune dysregulation promoting a type 2 immune response. Epidermal barrier dysfunction can be attributed to various factors, including diminished ceramide production, altered lipid composition, the release of inflammatory mediators, and mechanical damage from the persistent itch-scratch cycle.10-13,15 These factors or their interplay may enhance the susceptibility of patients with AD to infections.
Several studies conducted across various geographic regions examining the relationship between MC and AD have reported variable findings.2,6,7,16-21 Published studies have reported a prevalence of AD in children with MC ranging from 13.2% to 43%.2,6,7,16-21 Although some studies suggest a higher rate of atopy in patients with MC, not all research has confirmed this association.16,21 Dohil et al2 reported a greater number of MC lesions in children with AD than those without an atopic background. Silverberg20 reported that in 10% (5/50) of children with MC, the onset of AD was triggered, and in 22% (11/50) MC was associated with flares of pre-existing AD.
In this study, we aimed to assess MC infection rates in children with AD, analyze the epidemiologic aspects and severity differences between atopic children with and without MC infection, and compare data from atopic and nonatopic children with MC.
Methods
In this retrospective cohort study, we analyzed the medical records of pediatric patients diagnosed with MC, AD, or both conditions at an outpatient dermatology practice in Netanya, HaSharon, Israel, from September 2013 to August 2022. Data were collected from the electronic medical records and included patient demographics, the clinical presentation of MC and/or AD at diagnosis, and the duration of both conditions. Only patients with complete data and at least 6 months of follow-up were included. Key epidemiologic characteristics assessed included patient sex, age at the initial visit, and age at the onset of MC and/or AD. Diagnoses of MC and AD were established through clinical examinations conducted by dermatologists. The clinical evaluation of AD encompassed the assessment of body surface area involvement (categorized as <5%, 5%-10%, or >10%). Atopic dermatitis severity was classified as mild, moderate, or severe using the validated Investigator Global Assessment Scale for Atopic Dermatitis.22 Clinical evaluation of MC included assessment of the number of lesions (categorized as ≤4, 5-9, or ≥10), presence of inflammatory lesions, and resolution times for individual lesions (categorized as <1 week, several weeks, or unknown), as well as the overall resolution time for all lesions (categorized as <6 months, 6-12 months, 13-18 months, or >18 months). The temporal relationship between the appearance of MC and AD also was assessed.
Statistical Analysis—Numbers and percentages were used for categorical variables. Continuous variables were represented by mean and standard deviation. Categorical variables were compared using the χ2 test, and continuous variables between groups were compared using the Student t test. All statistical tests were 2-sided, with statistical significance defined as P≤.05. Statistical analysis was performed using SPSS software version 28 (IBM).
Results
Study Population—A total of 610 children were included in the study; 263 (43%) were female and 347 (57%) were male. The patients ranged in age from 4 months to 10 years, with a mean (SD) age of 4.87 (1.82) years. Five hundred fifty-six (91%) patients had AD, and 336 (55%) had MC. Within this cohort, 274 (45%) children had AD only, 54 (9%) had MC only, and 282 (46%) had both AD and MC. Regarding the temporal sequence, among the 282 children who had both AD and MC, AD preceded MC in 203 (72%) cases, both conditions were diagnosed concomitantly in 43 (15%) cases, and MC preceded AD in 36 (13%) cases. For cases in which the MC diagnosis followed the diagnosis of AD, the mean (SD) time between each diagnosis was 3.17 (1.5) years.
Comparison of Atopic and Nonatopic Children With MC—Although a higher proportion of males were diagnosed with MC (with or without concurrent AD), the differences in sex distribution between the 2 groups did not reach statistical significance. Among all children with MC, the majority (81.5% [274/336]) were aged 1 to 6 years at presentation. Patients with MC as their sole diagnosis had a similar mean age compared with those with concurrent AD. However, a detailed age subgroup analysis revealed a notable distinction: in the group with MC as the sole diagnosis, the majority (95% [51/54]) were younger than 7 years. In contrast, in the combined MC and AD group, MC manifested across a wider age range, with 21% (58/282) of patients being older than 7 years. In MC cases associated with AD, a notably higher lesion count and increased local inflammatory response were observed compared to those without AD. The time for complete resolution of all MC lesions was substantially prolonged in patients with comorbid AD. Specifically, 93% (50/54) of patients with MC without comorbid AD achieved full resolution within 1 year, whereas 52% (146/282) of patients with comorbid AD required more than 1 year for resolution (eTable 1).
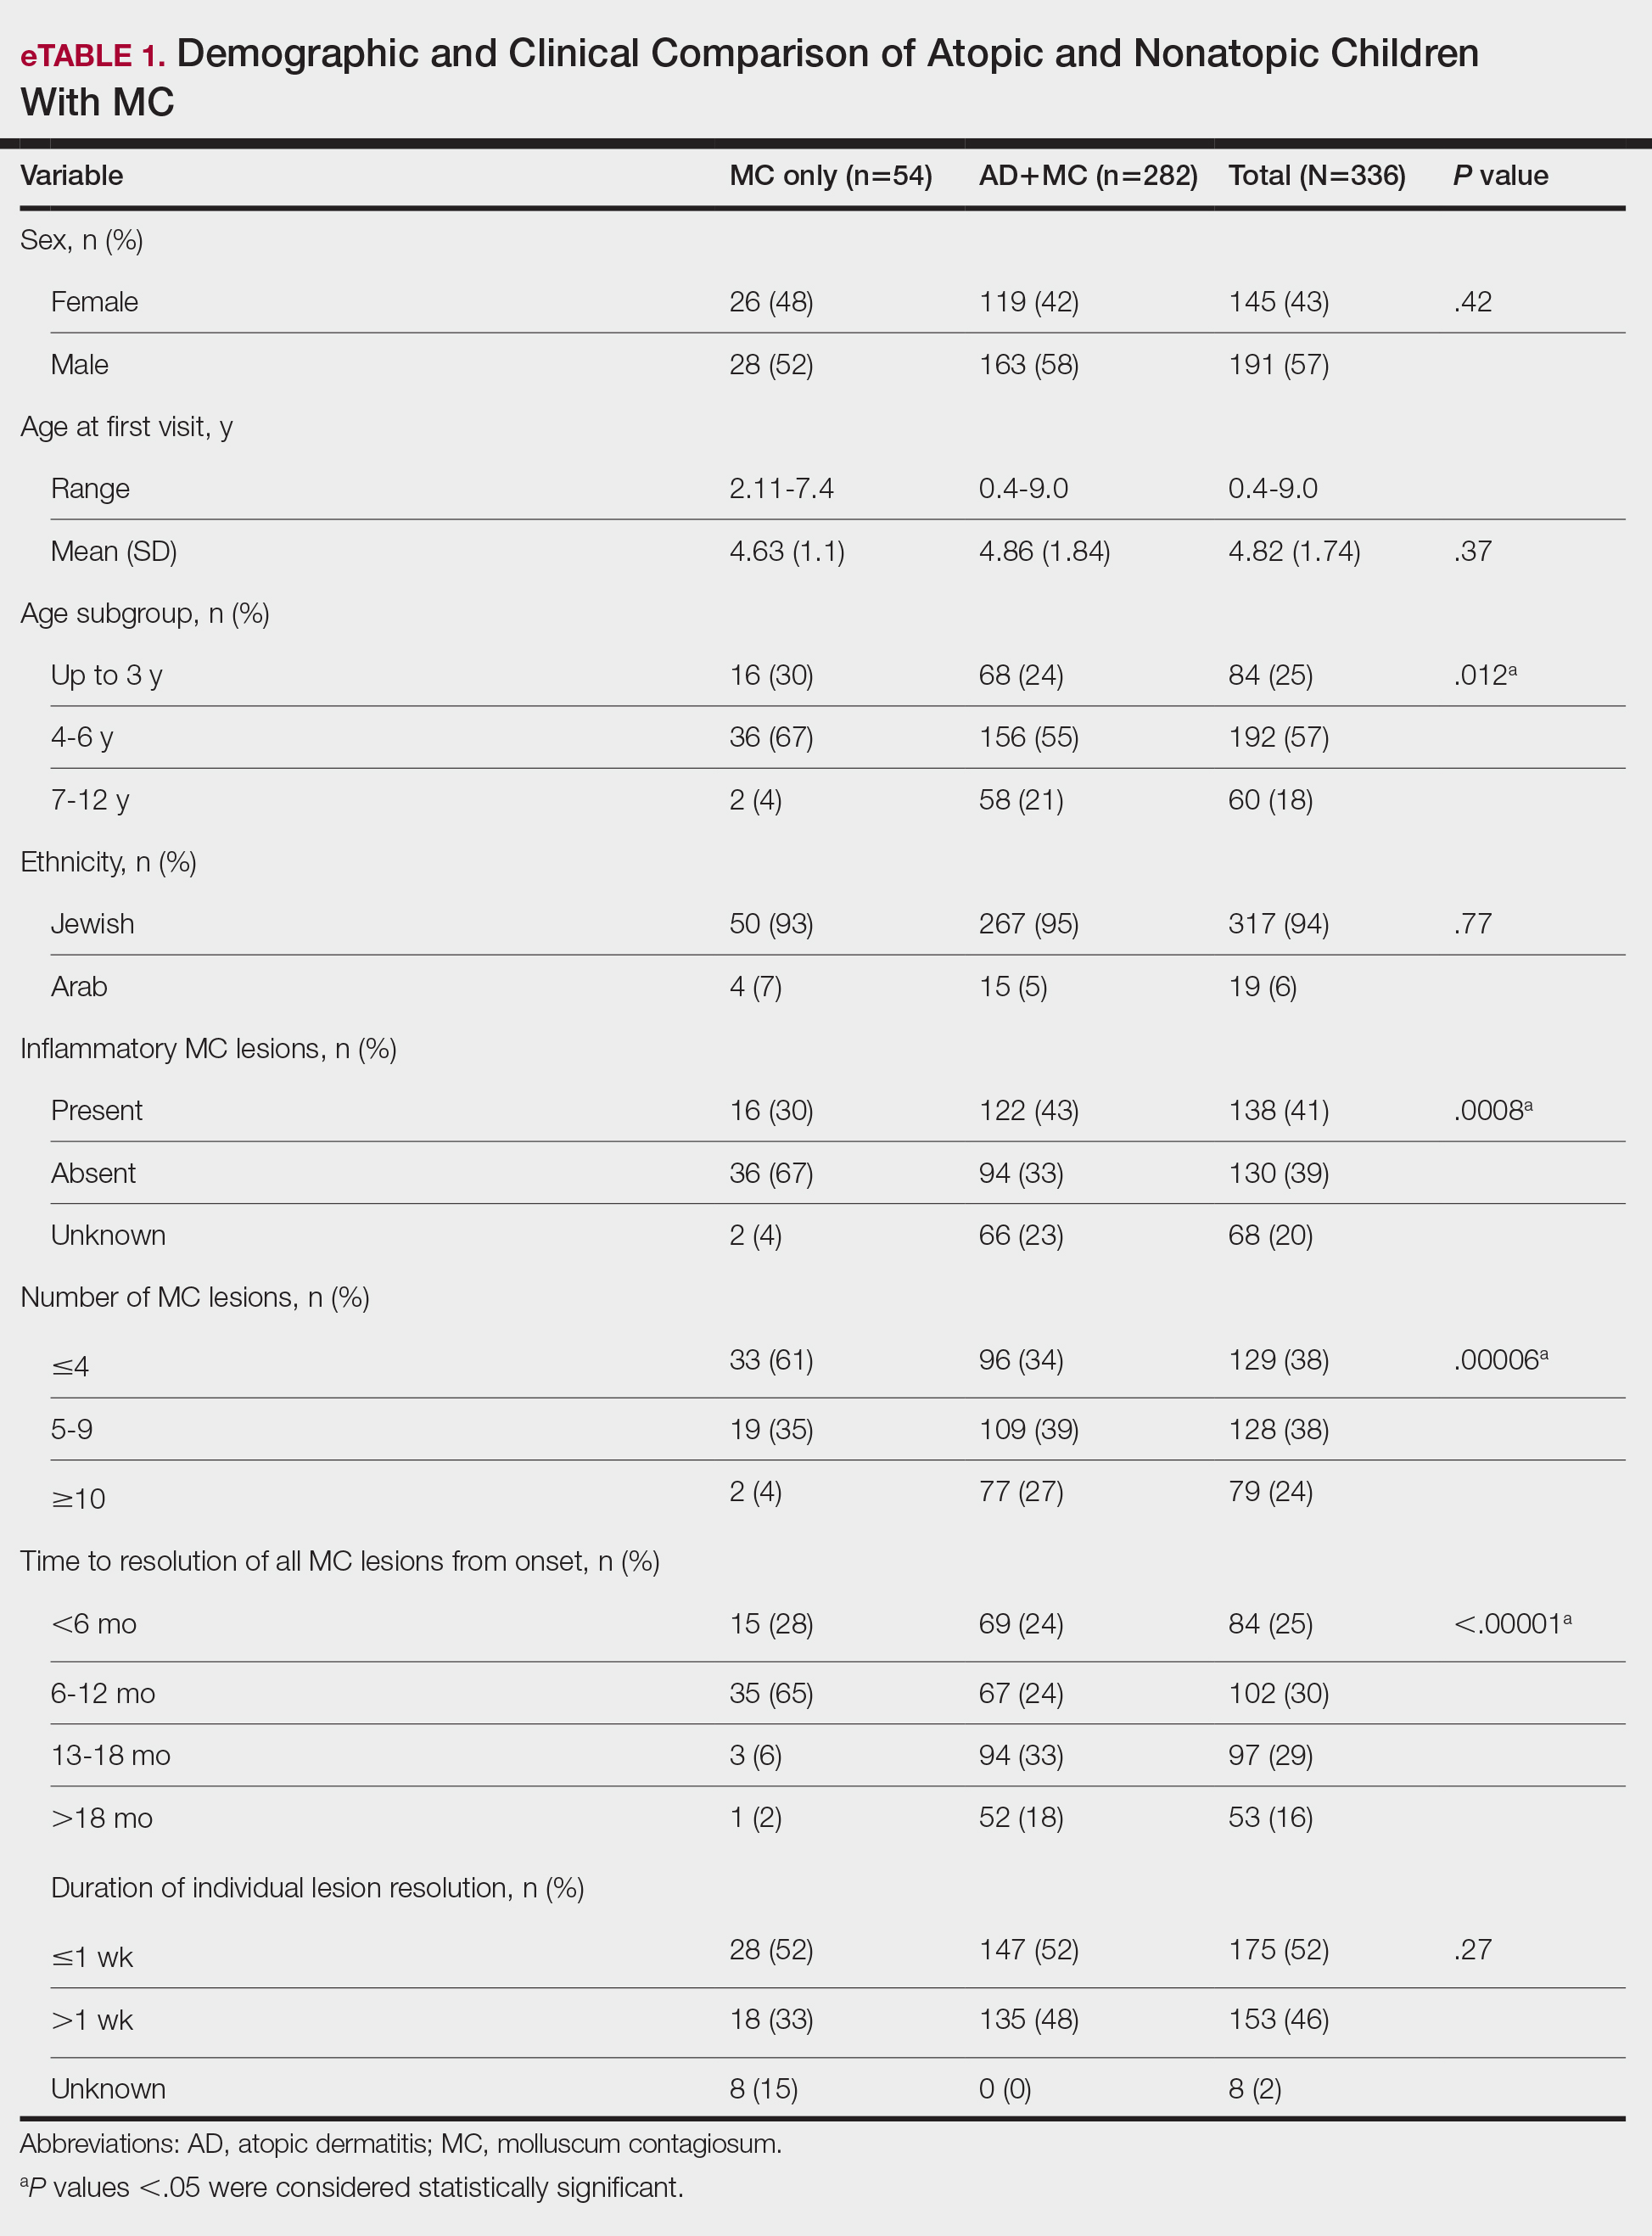
Comparison of Atopic Children With and Without MC—Sex, age distribution, and disease duration showed no differences between atopic patients with and without MC. Atopic patients with MC exhibited greater body surface area involvement and higher validated Investigator Global Assessment Scale for Atopic Dermatitis scores compared to atopic patients without MC (eTable 2).
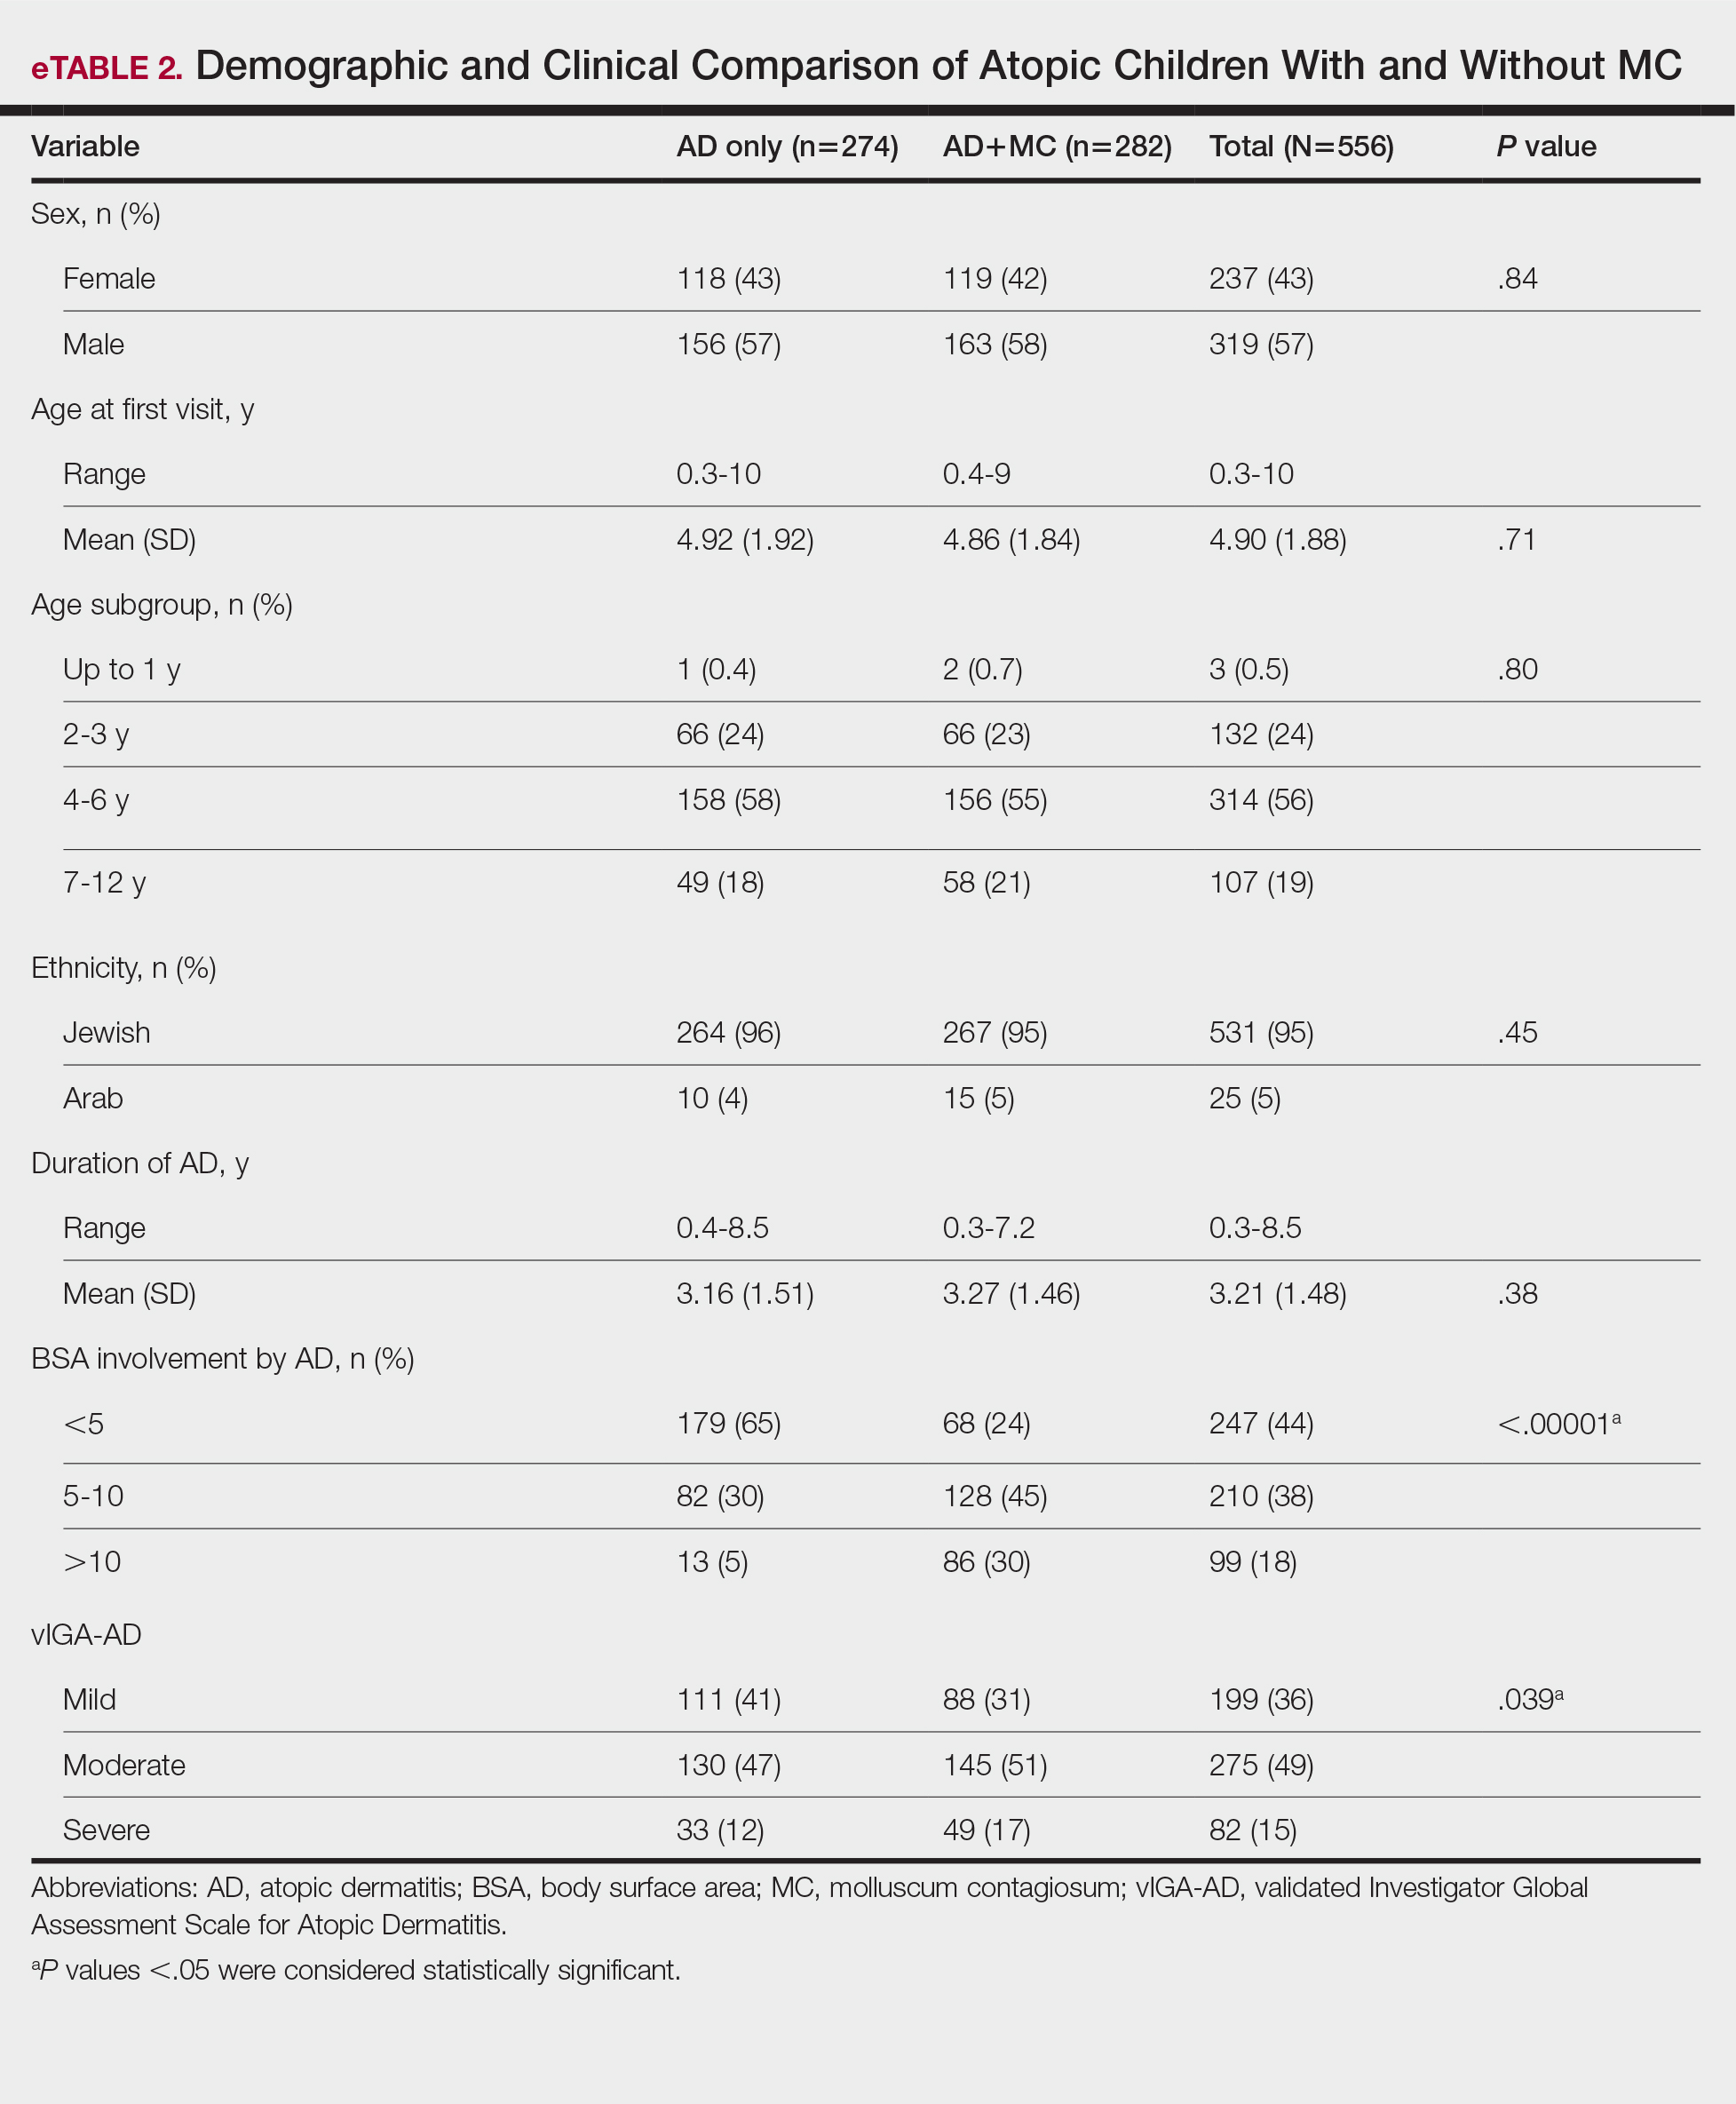
Comment
This study examined the relationship between MC and AD in pediatric patients, revealing a notable correlation and yielding valuable epidemiologic and clinical insights. Consistent with previous research, our study demonstrated a high prevalence of AD in children with MC.2,6,7,16-21 Previous studies indicated AD rates of 13% to 43% in pediatric patients with MC, whereas our study found a higher prevalence (84%), signifying a substantial majority of patients with MC in our cohort had AD. This discrepancy arises from factors such as demographic, genetic, and environmental differences, along with differences in access to medical care, referral practices, and diagnostic approaches across health care systems.14
Our temporal analysis of MC and AD diagnoses offers important insights. In the majority (72% [203/282]) of cases, the diagnosis of AD preceded MC, supporting previous research suggesting that the underlying pathophysiology of AD heightens susceptibility to MC.15,17-20 Less frequently, MC was diagnosed before or concurrently with AD, indicating that MC may occasionally trigger or exacerbate milder or undiagnosed AD, as previously proposed.20
A notable finding in our study was the expanded age range for MC onset in patients with AD, encompassing older age groups compared to patients with MC as their sole diagnosis, possibly due to persistent immune dysregulation. To the best of our knowledge, this specific observation has not been systematically reported or documented in prior cohort studies. Visible skin lesions of MC may have a psychological impact on patients, influencing self-consciousness and causing embarrassment and emotional distress. This may be more pronounced in older children, who are more aware of their appearance and social perceptions.23-25 These considerations should play a role in the management of MC.
Our study revealed that children with AD and MC displayed higher lesion counts, increased local inflammatory responses, and a more protracted resolution period compared to nonatopic children. In more than 50% of children with AD, MC took more than 1 year for resolution, whereas the majority of those without AD achieved resolution within 1 year. These findings may be attributed to AD-related immune dysregulation, influencing the natural course of MC. Consequently, it suggests that while nonatopic children with MC usually are managed through observation, atopic patients may benefit from an intervention-oriented approach.
Comparing atopic patients with and without MC showed a heightened occurrence of severe and extensive AD among those with concurrent MC. Several factors could contribute to this observation. On one hand, there could be a direct association between the extent and severity of AD, leading to an elevated susceptibility to MC. Conversely, MC might exacerbate immunologic dysregulation and intensify skin inflammation in atopic individuals.20 Additionally, itching related to both disorders may exacerbate inflammation and compromise the epidermal barrier, facilitating the spread of MC. This interplay suggests that each condition exacerbates the other in a self-reinforcing cycle. The importance of patient and caregiver education is underscored by recognizing these interactions. To manage both conditions effectively, health care providers should counsel patients and caregivers on maintaining proper skin care practices such as gentle cleansing with mild, fragrance-free products, regular moisturization, and avoidance of irritants, encourage them to avoid scratching, and recommend adopting an active treatment approach.
Our study had notable strengths. Firstly, a substantial sample size enhanced the statistical reliability of our findings. Additionally, valuable insights into the epidemiology and clinical aspects of AD and MC were obtained by utilizing real-world data from an outpatient dermatology practice. In our study, clinical evaluations covered body surface area involvement and disease severity for AD while also assessing lesion counts and the presence of inflammatory lesions for MC. This comprehensive approach facilitated a thorough analysis of both conditions. The extended data collection period not only allowed for observation of their clinical course and duration, but also enabled a detailed assessment of their interplay.
Our study also had several limitations. Primarily, its retrospective design relied on the accuracy and comprehensiveness of medical records, which may have introduced bias. The exclusion of some patients due to incomplete data further increased the potential for selection bias. Additionally, this study was conducted in a single outpatient dermatology practice in Israel, resulting in a study population composed predominantly of Jewish patients (94%), with a minority (6%) of Arab patients. Other ethnic groups, including Black, Asian, and Hispanic populations, were not represented. This reflects the country’s demographic composition rather than an intentional selection bias. However, the limited ethnic diversity reduces the generalizability of our findings. Differences in demographics, coding practices, health care utilization (eg, timeliness of seeking care, access to dermatology services), and treatment strategies also may impact the observed prevalence, clinical characteristics, and patient outcomes. Furthermore, while our study highlighted the potential advantages of a proactive treatment approach for atopic children with MC, it did not evaluate specific treatment protocols. Future research should aim to confirm the most efficacious therapeutic strategies for managing MC in atopic individuals and to include a more diverse population to better understand the applicability of findings across various ethnic groups.
Conclusion
Our study found a high prevalence of AD in children with MC and a strong bidirectional relationship between these conditions. Pediatric patients with AD display a broader age range for MC, greater lesion burden, increased local inflammatory responses, prolonged resolution times, and more extensive and severe AD.
Recognizing the interplay between MC and AD is crucial, highlighting the importance of health care providers educating patients and caregivers. Emphasizing skin hygiene, discouraging scratching, and implementing proactive treatment approaches can enhance the outcomes of both conditions. Further research into the underlying mechanisms of this association and effective therapeutic strategies for MC in atopic individuals is warranted.
Acknowledgments—The authors thank Zvi Segal, MD (Tel Hashomer, Israel) for his insightful contribution to the statistical analysis of the results. We would like to express our appreciation to the dedicated team of the dermatology practice in Netanya for the support throughout the performance of the study. Additionally, we thank all study participants and their parents for their participation and contribution to our research.
- Han H, Smythe C, Yousefian F, et al. Molluscum contagiosum virus evasion of immune surveillance: a review. J Drugs Dermatol. 2023;22182-189.
- Dohil MA, Lin P, Lee J, et al. The epidemiology of molluscum contagiosum in children. J Am Acad Dermatol. 2006;54:47-54.
- Silverberg NB. Pediatric molluscum: an update. Cutis. 2019;104:301-305;E1;E2.
- Forbat E, Al-Niaimi F, Ali FR. Molluscum contagiosum: review and update on management. Pediatr Dermatol. 2017;34:504-515.
- Olsen JR, Gallacher J, Piguet V, et al. Epidemiology of molluscum contagiosum in children: a systematic review. Fam Pract. 2014;31:130-136.
- Kakourou T, Zachariades A, Anastasiou T, et al. Molluscum contagiosum in Greek children: a case series. Int J Dermatol. 2005;44:221-223.
- Osio A, Deslandes E, Saada V, et al. Clinical characteristics of molluscum contagiosum in children in a private dermatology practice in the greater Paris area, France: a prospective study in 661 patients. Dermatology. 2011;222:314-320.
- Hebert AA, Bhatia N, Del Rosso JQ. Molluscum contagiosum: epidemiology, considerations, treatment options, and therapeutic gaps. J Clin Aesthet Dermatol. 2023;16(8 Suppl 1):S4-S11.
- Chao YC, Ko MJ, Tsai WC, et al. Comparative efficacy of treatments for molluscum contagiosum: a systematic review and network meta-analysis. J Dtsch Dermatol Ges. 2023;21:587-597.
- Garg N, Silverberg JI. Epidemiology of childhood atopic dermatitis. Clin Dermatol. 2015;33:281-288.
- Hale G, Davies E, Grindlay DJC, et al. What’s new in atopic eczema? an analysis of systematic reviews published in 2017. part 2: epidemiology, etiology, and risk factors. Clin Exp Dermatol. 2019;44:868-873.
- Tracy A, Bhatti S, Eichenfield LF. Update on pediatric atopic dermatitis. Cutis. 2020;106:143-146.
- Langan SM, Irvine AD, Weidinger S. Atopic dermatitis. Lancet. 2020;396:345-360.
- Silverberg JI. Public health burden and epidemiology of atopic dermatitis. Dermatol Clin. 2017;35:283-289.
- Manti S, Amorini M, Cuppari C, et al. Filaggrin mutations and molluscum contagiosum skin infection in patients with atopic dermatitis. Ann Allergy Asthma Immunol. 2017;119446-451.
- Seize M, Ianhez M, Cestari S. A study of the correlation between molluscum contagiosum and atopic dermatitis in children. An Bras Dermatol. 2011;86:663-668.
- Ren Z, Silverberg JI. Association of atopic dermatitis with bacterial, fungal, viral, and sexually transmitted skin infections. Dermatitis. 2020;31:157-164.
- Olsen JR, Piguet V, Gallacher J, et al. Molluscum contagiosum and associations with atopic eczema in children: a retrospective longitudinal study in primary care. Br J Gen Pract. 2016;66:E53-E58.
- Han JH, Yoon JW, Yook HJ, et al. Evaluation of atopic dermatitis and cutaneous infectious disorders using sequential pattern mining: a nationwide population-based cohort study. J Clin Med. 2022;11:3422.
- Silverberg NB. Molluscum contagiosum virus infection can trigger atopic dermatitis disease onset or flare. Cutis. 2018;102:191-194.
- Hayashida S, Furusho N, Uchi H, et al. Are lifetime prevalence of impetigo, molluscum and herpes infection really increased in children having atopic dermatitis? J Dermatol Sci. 2010;60:173-178.
- Simpson E, Bissonnette R, Eichenfield LF, et al. The Validated Investigator Global Assessment for Atopic Dermatitis (vIGA-AD): the development and reliability testing of a novel clinical outcome measurement instrument for the severity of atopic dermatitis. J Am Acad Dermatol. 2020;83:839-846.
- Olsen JR, Gallacher J, Finlay AY, et al. Time to resolution and effect on quality of life of molluscum contagiosum in children in the UK: a prospective community cohort study. Lancet Infect Dis. 2015;15:190-195.
- Ðurovic´ MR, Jankovic´ J, Spiric´ VT, et al. Does age influence the quality of life in children with atopic dermatitis? PLoS One. 2019;14:E0224618.
- Chernyshov PV. Stigmatization and self-perception in children with atopic dermatitis. Clin Cosmet Investig Dermatol. 2016;9:159-166.
Molluscum contagiosum (MC), which is caused by a DNA virus in the Poxviridae family, is a common viral skin infection that primarily affects children.1-4 The reported incidence and prevalence of MC exhibit notable geographic variation. Worldwide, annual incidence rates per 1000 individuals range from 3.1 to 25, and prevalence ranges from 0.27% to 34.6%.2-7
Molluscum contagiosum is diagnosed clinically and typically manifests as smooth, flesh-colored papules measuring 2 to 6 mm in diameter with central umbilication. It can manifest as a single lesion or multiple clustered lesions, or in a disseminated pattern. The primary mode of transmission is through contact with skin, lesions, or contaminated personal items, or via self-inoculation. The majority of cases are asymptomatic, but in some patients, MC may be associated with pruritus, tenderness, erythema, or irritation. When present, secondary bacterial infections can cause localized inflammation and pain.1,3,4 The pathogenesis hinges on MC virus replication within keratinocytes, disrupting cellular differentiation and keratinization. The virus persists in the host by influencing the immune response through various mechanisms, including interference with signaling pathways, apoptosis inhibition, and antigen presentation disruption.3,4
Molluscum contagiosum typically follows a self-limiting trajectory, resolving over several months to 2 years.3,4 The resolution timeframe is intricately linked to variables such as the patient’s immune profile, lesion burden, and treatment approach. For symptomatic lesions, a variety of treatment options have been described, including physical ablation (eg, cryotherapy, curettage) and topical agents such as potassium hydroxide, cantharidin, imiquimod, and salicylic acid.3,4,8,9
Atopic dermatitis (AD) is a common chronic relapsing inflammatory skin disorder. In the United States, its prevalence ranges from 15% to 30% in children and from 2% to 10% in adults, with ongoing evidence of a growing global incidence.10-14 While AD can emerge at any age, typical onset is during early childhood. The clinical manifestation of AD includes a spectrum of eczematous features, often accompanied by persistent itching. The pathogenesis is multifactorial, involving a complex interplay of genetic, immunologic, and environmental factors. Key contributors to this multifaceted process encompass a compromised epidermal barrier, alterations in the skin microbiome, and an immune dysregulation promoting a type 2 immune response. Epidermal barrier dysfunction can be attributed to various factors, including diminished ceramide production, altered lipid composition, the release of inflammatory mediators, and mechanical damage from the persistent itch-scratch cycle.10-13,15 These factors or their interplay may enhance the susceptibility of patients with AD to infections.
Several studies conducted across various geographic regions examining the relationship between MC and AD have reported variable findings.2,6,7,16-21 Published studies have reported a prevalence of AD in children with MC ranging from 13.2% to 43%.2,6,7,16-21 Although some studies suggest a higher rate of atopy in patients with MC, not all research has confirmed this association.16,21 Dohil et al2 reported a greater number of MC lesions in children with AD than those without an atopic background. Silverberg20 reported that in 10% (5/50) of children with MC, the onset of AD was triggered, and in 22% (11/50) MC was associated with flares of pre-existing AD.
In this study, we aimed to assess MC infection rates in children with AD, analyze the epidemiologic aspects and severity differences between atopic children with and without MC infection, and compare data from atopic and nonatopic children with MC.
Methods
In this retrospective cohort study, we analyzed the medical records of pediatric patients diagnosed with MC, AD, or both conditions at an outpatient dermatology practice in Netanya, HaSharon, Israel, from September 2013 to August 2022. Data were collected from the electronic medical records and included patient demographics, the clinical presentation of MC and/or AD at diagnosis, and the duration of both conditions. Only patients with complete data and at least 6 months of follow-up were included. Key epidemiologic characteristics assessed included patient sex, age at the initial visit, and age at the onset of MC and/or AD. Diagnoses of MC and AD were established through clinical examinations conducted by dermatologists. The clinical evaluation of AD encompassed the assessment of body surface area involvement (categorized as <5%, 5%-10%, or >10%). Atopic dermatitis severity was classified as mild, moderate, or severe using the validated Investigator Global Assessment Scale for Atopic Dermatitis.22 Clinical evaluation of MC included assessment of the number of lesions (categorized as ≤4, 5-9, or ≥10), presence of inflammatory lesions, and resolution times for individual lesions (categorized as <1 week, several weeks, or unknown), as well as the overall resolution time for all lesions (categorized as <6 months, 6-12 months, 13-18 months, or >18 months). The temporal relationship between the appearance of MC and AD also was assessed.
Statistical Analysis—Numbers and percentages were used for categorical variables. Continuous variables were represented by mean and standard deviation. Categorical variables were compared using the χ2 test, and continuous variables between groups were compared using the Student t test. All statistical tests were 2-sided, with statistical significance defined as P≤.05. Statistical analysis was performed using SPSS software version 28 (IBM).
Results
Study Population—A total of 610 children were included in the study; 263 (43%) were female and 347 (57%) were male. The patients ranged in age from 4 months to 10 years, with a mean (SD) age of 4.87 (1.82) years. Five hundred fifty-six (91%) patients had AD, and 336 (55%) had MC. Within this cohort, 274 (45%) children had AD only, 54 (9%) had MC only, and 282 (46%) had both AD and MC. Regarding the temporal sequence, among the 282 children who had both AD and MC, AD preceded MC in 203 (72%) cases, both conditions were diagnosed concomitantly in 43 (15%) cases, and MC preceded AD in 36 (13%) cases. For cases in which the MC diagnosis followed the diagnosis of AD, the mean (SD) time between each diagnosis was 3.17 (1.5) years.
Comparison of Atopic and Nonatopic Children With MC—Although a higher proportion of males were diagnosed with MC (with or without concurrent AD), the differences in sex distribution between the 2 groups did not reach statistical significance. Among all children with MC, the majority (81.5% [274/336]) were aged 1 to 6 years at presentation. Patients with MC as their sole diagnosis had a similar mean age compared with those with concurrent AD. However, a detailed age subgroup analysis revealed a notable distinction: in the group with MC as the sole diagnosis, the majority (95% [51/54]) were younger than 7 years. In contrast, in the combined MC and AD group, MC manifested across a wider age range, with 21% (58/282) of patients being older than 7 years. In MC cases associated with AD, a notably higher lesion count and increased local inflammatory response were observed compared to those without AD. The time for complete resolution of all MC lesions was substantially prolonged in patients with comorbid AD. Specifically, 93% (50/54) of patients with MC without comorbid AD achieved full resolution within 1 year, whereas 52% (146/282) of patients with comorbid AD required more than 1 year for resolution (eTable 1).
Comparison of Atopic Children With and Without MC—Sex, age distribution, and disease duration showed no differences between atopic patients with and without MC. Atopic patients with MC exhibited greater body surface area involvement and higher validated Investigator Global Assessment Scale for Atopic Dermatitis scores compared to atopic patients without MC (eTable 2).
Comment
This study examined the relationship between MC and AD in pediatric patients, revealing a notable correlation and yielding valuable epidemiologic and clinical insights. Consistent with previous research, our study demonstrated a high prevalence of AD in children with MC.2,6,7,16-21 Previous studies indicated AD rates of 13% to 43% in pediatric patients with MC, whereas our study found a higher prevalence (84%), signifying a substantial majority of patients with MC in our cohort had AD. This discrepancy arises from factors such as demographic, genetic, and environmental differences, along with differences in access to medical care, referral practices, and diagnostic approaches across health care systems.14
Our temporal analysis of MC and AD diagnoses offers important insights. In the majority (72% [203/282]) of cases, the diagnosis of AD preceded MC, supporting previous research suggesting that the underlying pathophysiology of AD heightens susceptibility to MC.15,17-20 Less frequently, MC was diagnosed before or concurrently with AD, indicating that MC may occasionally trigger or exacerbate milder or undiagnosed AD, as previously proposed.20
A notable finding in our study was the expanded age range for MC onset in patients with AD, encompassing older age groups compared to patients with MC as their sole diagnosis, possibly due to persistent immune dysregulation. To the best of our knowledge, this specific observation has not been systematically reported or documented in prior cohort studies. Visible skin lesions of MC may have a psychological impact on patients, influencing self-consciousness and causing embarrassment and emotional distress. This may be more pronounced in older children, who are more aware of their appearance and social perceptions.23-25 These considerations should play a role in the management of MC.
Our study revealed that children with AD and MC displayed higher lesion counts, increased local inflammatory responses, and a more protracted resolution period compared to nonatopic children. In more than 50% of children with AD, MC took more than 1 year for resolution, whereas the majority of those without AD achieved resolution within 1 year. These findings may be attributed to AD-related immune dysregulation, influencing the natural course of MC. Consequently, it suggests that while nonatopic children with MC usually are managed through observation, atopic patients may benefit from an intervention-oriented approach.
Comparing atopic patients with and without MC showed a heightened occurrence of severe and extensive AD among those with concurrent MC. Several factors could contribute to this observation. On one hand, there could be a direct association between the extent and severity of AD, leading to an elevated susceptibility to MC. Conversely, MC might exacerbate immunologic dysregulation and intensify skin inflammation in atopic individuals.20 Additionally, itching related to both disorders may exacerbate inflammation and compromise the epidermal barrier, facilitating the spread of MC. This interplay suggests that each condition exacerbates the other in a self-reinforcing cycle. The importance of patient and caregiver education is underscored by recognizing these interactions. To manage both conditions effectively, health care providers should counsel patients and caregivers on maintaining proper skin care practices such as gentle cleansing with mild, fragrance-free products, regular moisturization, and avoidance of irritants, encourage them to avoid scratching, and recommend adopting an active treatment approach.
Our study had notable strengths. Firstly, a substantial sample size enhanced the statistical reliability of our findings. Additionally, valuable insights into the epidemiology and clinical aspects of AD and MC were obtained by utilizing real-world data from an outpatient dermatology practice. In our study, clinical evaluations covered body surface area involvement and disease severity for AD while also assessing lesion counts and the presence of inflammatory lesions for MC. This comprehensive approach facilitated a thorough analysis of both conditions. The extended data collection period not only allowed for observation of their clinical course and duration, but also enabled a detailed assessment of their interplay.
Our study also had several limitations. Primarily, its retrospective design relied on the accuracy and comprehensiveness of medical records, which may have introduced bias. The exclusion of some patients due to incomplete data further increased the potential for selection bias. Additionally, this study was conducted in a single outpatient dermatology practice in Israel, resulting in a study population composed predominantly of Jewish patients (94%), with a minority (6%) of Arab patients. Other ethnic groups, including Black, Asian, and Hispanic populations, were not represented. This reflects the country’s demographic composition rather than an intentional selection bias. However, the limited ethnic diversity reduces the generalizability of our findings. Differences in demographics, coding practices, health care utilization (eg, timeliness of seeking care, access to dermatology services), and treatment strategies also may impact the observed prevalence, clinical characteristics, and patient outcomes. Furthermore, while our study highlighted the potential advantages of a proactive treatment approach for atopic children with MC, it did not evaluate specific treatment protocols. Future research should aim to confirm the most efficacious therapeutic strategies for managing MC in atopic individuals and to include a more diverse population to better understand the applicability of findings across various ethnic groups.
Conclusion
Our study found a high prevalence of AD in children with MC and a strong bidirectional relationship between these conditions. Pediatric patients with AD display a broader age range for MC, greater lesion burden, increased local inflammatory responses, prolonged resolution times, and more extensive and severe AD.
Recognizing the interplay between MC and AD is crucial, highlighting the importance of health care providers educating patients and caregivers. Emphasizing skin hygiene, discouraging scratching, and implementing proactive treatment approaches can enhance the outcomes of both conditions. Further research into the underlying mechanisms of this association and effective therapeutic strategies for MC in atopic individuals is warranted.
Acknowledgments—The authors thank Zvi Segal, MD (Tel Hashomer, Israel) for his insightful contribution to the statistical analysis of the results. We would like to express our appreciation to the dedicated team of the dermatology practice in Netanya for the support throughout the performance of the study. Additionally, we thank all study participants and their parents for their participation and contribution to our research.
- Han H, Smythe C, Yousefian F, et al. Molluscum contagiosum virus evasion of immune surveillance: a review. J Drugs Dermatol. 2023;22182-189.
- Dohil MA, Lin P, Lee J, et al. The epidemiology of molluscum contagiosum in children. J Am Acad Dermatol. 2006;54:47-54.
- Silverberg NB. Pediatric molluscum: an update. Cutis. 2019;104:301-305;E1;E2.
- Forbat E, Al-Niaimi F, Ali FR. Molluscum contagiosum: review and update on management. Pediatr Dermatol. 2017;34:504-515.
- Olsen JR, Gallacher J, Piguet V, et al. Epidemiology of molluscum contagiosum in children: a systematic review. Fam Pract. 2014;31:130-136.
- Kakourou T, Zachariades A, Anastasiou T, et al. Molluscum contagiosum in Greek children: a case series. Int J Dermatol. 2005;44:221-223.
- Osio A, Deslandes E, Saada V, et al. Clinical characteristics of molluscum contagiosum in children in a private dermatology practice in the greater Paris area, France: a prospective study in 661 patients. Dermatology. 2011;222:314-320.
- Hebert AA, Bhatia N, Del Rosso JQ. Molluscum contagiosum: epidemiology, considerations, treatment options, and therapeutic gaps. J Clin Aesthet Dermatol. 2023;16(8 Suppl 1):S4-S11.
- Chao YC, Ko MJ, Tsai WC, et al. Comparative efficacy of treatments for molluscum contagiosum: a systematic review and network meta-analysis. J Dtsch Dermatol Ges. 2023;21:587-597.
- Garg N, Silverberg JI. Epidemiology of childhood atopic dermatitis. Clin Dermatol. 2015;33:281-288.
- Hale G, Davies E, Grindlay DJC, et al. What’s new in atopic eczema? an analysis of systematic reviews published in 2017. part 2: epidemiology, etiology, and risk factors. Clin Exp Dermatol. 2019;44:868-873.
- Tracy A, Bhatti S, Eichenfield LF. Update on pediatric atopic dermatitis. Cutis. 2020;106:143-146.
- Langan SM, Irvine AD, Weidinger S. Atopic dermatitis. Lancet. 2020;396:345-360.
- Silverberg JI. Public health burden and epidemiology of atopic dermatitis. Dermatol Clin. 2017;35:283-289.
- Manti S, Amorini M, Cuppari C, et al. Filaggrin mutations and molluscum contagiosum skin infection in patients with atopic dermatitis. Ann Allergy Asthma Immunol. 2017;119446-451.
- Seize M, Ianhez M, Cestari S. A study of the correlation between molluscum contagiosum and atopic dermatitis in children. An Bras Dermatol. 2011;86:663-668.
- Ren Z, Silverberg JI. Association of atopic dermatitis with bacterial, fungal, viral, and sexually transmitted skin infections. Dermatitis. 2020;31:157-164.
- Olsen JR, Piguet V, Gallacher J, et al. Molluscum contagiosum and associations with atopic eczema in children: a retrospective longitudinal study in primary care. Br J Gen Pract. 2016;66:E53-E58.
- Han JH, Yoon JW, Yook HJ, et al. Evaluation of atopic dermatitis and cutaneous infectious disorders using sequential pattern mining: a nationwide population-based cohort study. J Clin Med. 2022;11:3422.
- Silverberg NB. Molluscum contagiosum virus infection can trigger atopic dermatitis disease onset or flare. Cutis. 2018;102:191-194.
- Hayashida S, Furusho N, Uchi H, et al. Are lifetime prevalence of impetigo, molluscum and herpes infection really increased in children having atopic dermatitis? J Dermatol Sci. 2010;60:173-178.
- Simpson E, Bissonnette R, Eichenfield LF, et al. The Validated Investigator Global Assessment for Atopic Dermatitis (vIGA-AD): the development and reliability testing of a novel clinical outcome measurement instrument for the severity of atopic dermatitis. J Am Acad Dermatol. 2020;83:839-846.
- Olsen JR, Gallacher J, Finlay AY, et al. Time to resolution and effect on quality of life of molluscum contagiosum in children in the UK: a prospective community cohort study. Lancet Infect Dis. 2015;15:190-195.
- Ðurovic´ MR, Jankovic´ J, Spiric´ VT, et al. Does age influence the quality of life in children with atopic dermatitis? PLoS One. 2019;14:E0224618.
- Chernyshov PV. Stigmatization and self-perception in children with atopic dermatitis. Clin Cosmet Investig Dermatol. 2016;9:159-166.
Epidemiologic and Clinical Evaluation of the Bidirectional Link Between Molluscum Contagiosum and Atopic Dermatitis in Children
Epidemiologic and Clinical Evaluation of the Bidirectional Link Between Molluscum Contagiosum and Atopic Dermatitis in Children
Practice Points
- There is a high prevalence of atopic dermatitis (AD) in children with molluscum contagiosum, with a strong bidirectional relationship between these conditions.
- Children with AD display a broader age range for molluscum contagiosum, greater lesion burden, increased local inflammatory responses, prolonged resolution time, and more extensive and severe disease.

Cosmetic Laser Procedures and Nonsurgical Body Contouring in Patients With Skin of Color
Cosmetic Laser Procedures and Nonsurgical Body Contouring in Patients With Skin of Color
Cosmetic laser procedures as well as energy-based fat reduction and body-contouring devices are increasingly popular among individuals with skin of color (SOC). Innovations in cosmetic devices and procedures tailored for SOC have allowed for the optimization of outcomes in this patient population. In this article, SOC is defined as darker skin types, including Fitzpatrick skin types (FSTs) IV to VI and ethnic backgrounds such as LatinX, African American, Southeast Asian, Native American, Pacific Islander, Middle Eastern, Asian, and African. Indications for laser treatment include dermatosis papulosa nigrans (DPN), acne scars, skin rejuvenation, and hyperpigmentation. There currently are 6 procedures for nonsurgical fat reduction that are approved by the US Food and Drug Administration (FDA): high-frequency focused ultrasound, cryolipolysis, laser lipolysis, injection lipolysis, radiofrequency lipolysis, and magnetic resonance contouring (Supplementary Table S1).1
In this review, our initial focus is cosmetic laser procedures, encompassing FDA-cleared indications along with the associated risks and benefits in SOC populations. Subsequently, we delve into the realms of energy-based fat reduction and body contouring, offering a comprehensive overview of these noninvasive therapies and addressing considerations for efficacy and safety in these patients.
Dermatosis Papulosa Nigra
In patients with SOC, scissor excision, curettage, or electrodesiccation are the mainstay treatments for removal of DPN (Figure 1). Curettage and electrodesiccation can cause temporary postinflammatory hyperpigmentation (PIH) in these populations, while cryotherapy is not a preferred method in patients with SOC due to the possibility of cryotherapy-induced depigmentation. In a 14-patient split-face study comparing the 532-nm potassium titanyl phosphate (KTP) laser vs electrodesiccation in FSTs IV to VI, the KTP-treated side showed an improvement rate of 96%, while the electrodesiccation side showed an improvement rate of 79%. There was a statistically significant favorable experience for KTP with regard to pain tolerability (P=.002).2 Complete resolution of lesions may be seen after 3 to 4 sessions at 4-week intervals. Additionally, the 1064-nm Nd:YAG laser was assessed for treatment of DPN in 2 patients, with 70% to 90% of lesions resolved after a single treatment with no complications.3
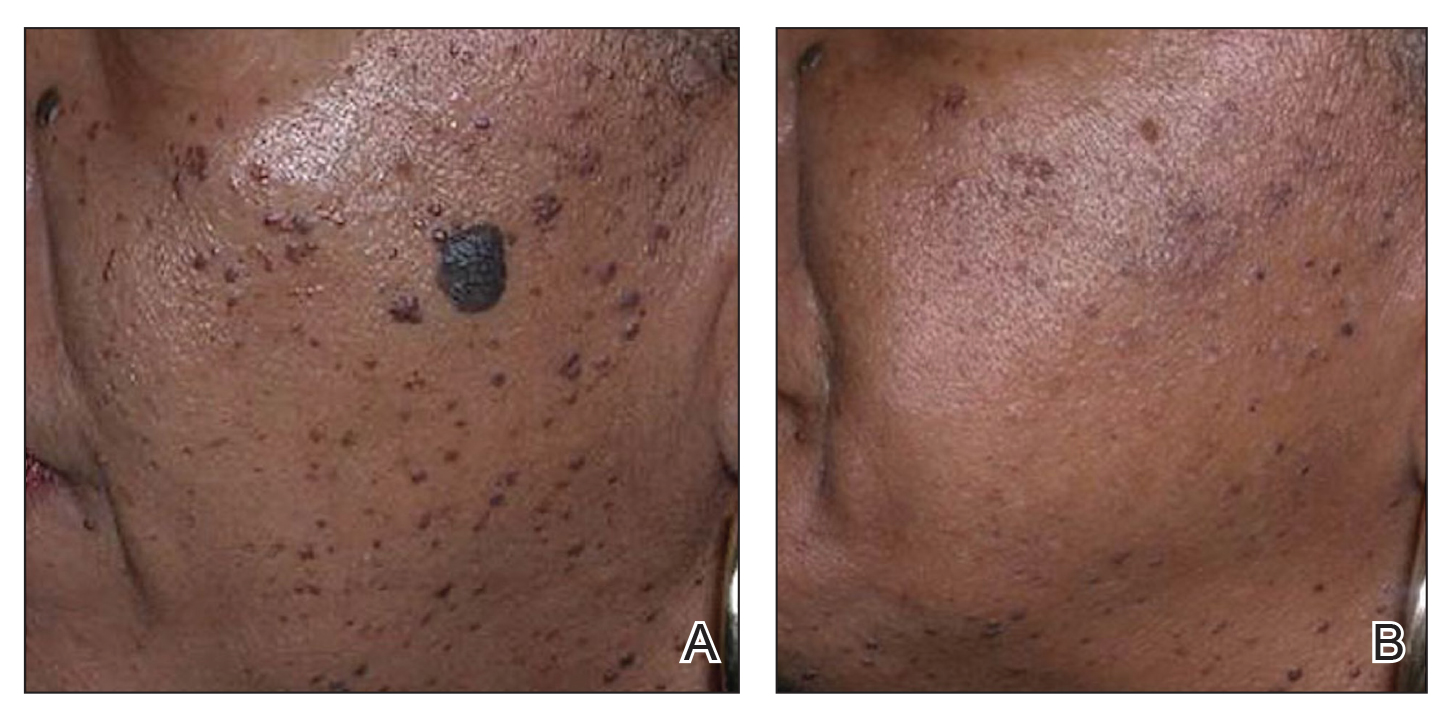
Most dermatologists still rely on curettage and electrodesiccation instead of laser therapy to remove DPNs in patients with SOC. The use of the Nd:YAG laser is promising yet expensive for the provider both to purchase and maintain. Electrodesiccation has been used by dermatology practices for decades and can be used without permanent discoloration. To minimize the risk for PIH, we recommend application of a healing ointment such as petroleum jelly or aloe vera gel to the treated lesions as well as lightening agents for PIH and daily use of sunscreen. Overall, providers do not need to purchase an expensive laser device for DPN removal.
Acne Scars
The invention of fractional technology in the early 2000s and its favorable safety profile have changed how dermatologists treat scarring in patients with SOC.
In one study of the short-pulsed nonablative Nd:YAG laser, 9 patients with FSTs I to V and 2 patients with FSTs IV to V underwent 8 treatments at 2-week intervals. Three blinded observers found a 29% improvement in the Global Acne Scar Severity score, while 89% (8/9) of patients self-reported subjective improvement in their acne scars.10
The 755-nm picosecond laser and diffractive lens array also have been shown to reduce the appearance of acne scars in patients with SOC, as shown via serial photography in a retrospective study of 56 patients with FSTs IV to VI. Transient hyperpigmentation, erythema, and edema were reported.11
Nonablative laser therapy is preferred for skin rejuvenation in patients with SOC due to a reduced risk for postprocedural hyperpigmentation.11 Ablative resurfacing (eg, CO2 laser) poses major risks for postprocedural hyperpigmentation, hypopigmentation, and scar formation and therefore should be avoided in these populations.12,13 A study involving 30 Asian patients (FSTs III-IV) demonstrated that the 1550-nm fractional laser was well tolerated, though higher treatment densities and fluences may lead to temporary adverse effects such as increased redness, swelling, and pain (P<.01).14 Furthermore, greater density was shown to cause higher levels of redness, hyperpigmentation, and swelling in comparison to higher fluence settings. Of note, patient satisfaction was markedly higher in patients who underwent treatment with higher fluence settings but not in patients with higher densities (P<.05). Postprocedural hyperpigmentation was noted in 6.7% (2/30) of patients studied.14 In another study, 8 patients with FSTs II to V were treated with either the 1064-nm long-pulsed Nd:YAG laser or the grid fractional monopolar radiofrequency laser.15 All participants experienced a significant decrease in mean wrinkle count using the Lemperle wrinkle assessment (P<.05). A significant decrease in mean wrinkle assessment score from 3.5 to 3.17 in clinical assessment and a decrease from 3.165 to 2.33 for photographic assessment was noted in patients treated with the grid laser (P<.05). A similar decrease in mean wrinkle assessment score was observed in the Nd:YAG group, with a mean decrease of 3.665 to 2.83 after 2 months for clinical assessment and 3.5 to 2.67 for photographic assessment. Among all patients in the study, 68% (6/8) experienced erythema, 25% (2/8) had a burning sensation, and 25% (2/8) experienced urticaria immediately postprocedure.15
Nonablative fractional resurfacing is preferred for the management of acne scars in patients with SOC. Adverse effects such as hyperpigmentation typically are transient, and the risk may be minimized with strict photoprotective practices following the procedure. Furthermore, avoidance of topicals containing exfoliants or α-hydroxy acids applied to the treated area following the procedure also may mitigate the risk for postprocedural hyperpigmentation.16 If hyperpigmentation does occur, use of topical melanogenesis inhibitors such as hydroquinone, kojic acid, or azelaic acid has shown some utility in practice.
Skin Rejuvenation
Nonablative fractional lasers (NAFLs) continue to be popular for treatment of photoaging. One study including 10 Asian patients (FSTs III-V) assessed the 1440-nm diode-based fractional laser for facial rejuvenation.17 After 4 sessions at 2-week intervals, 80% (8/10) of patients reported decreased skin roughness after both the second and third treatments, while 90% (9/10) had improved texture 1 month after the final procedure. Adverse effects included moderate facial edema and one case of transient hyperpigmentation.17 Another study reported a significant reduction in pore score (P<.002), with patients noting an overall improvement in skin appearance with minimal erythema, dryness, and flaking following 6 sessions at 2-week intervals using the 1440-nm diode-based fractional laser.18
The 1550-nm diode fractional laser significantly improved skin pigmentation (P<.001) and texture (P<.001) in 10 patients with FSTs II to IV following 5 sessions at 2- to 3-week intervals, with self-resolving erythema and edema posttreatment (Supplementary Table S2).19 Overall, NAFLs for the treatment of photoaging are effective with minimal adverse effects (eg, facial edema), which can be reduced with application of cold compression to the face and elevation of the head following treatment as well as the use of additional pillows during overnight sleep.
Laser Treatment for Hyperpigmentation Disorders
Melasma—The FDA recently approved fractional photothermolysis for the treatment of melasma; however, due to the risk for hyperpigmentation given its pathogenesis linked to hyperactive melanocytes, this laser is not considered a first-line therapy for melasma.20 In a split-face, randomized study, 22 patients with FSTs III to V who were diagnosed with either dermal or mixed-type melasma were treated with a low-fluence Q-switched Nd:YAG laser combined with hydroquinone 2% vs hydroquinone 2% alone (Supplementary Table S3).21 Each patient was treated weekly for 5 consecutive weeks. The laser-treated side was found to reach an average of 92.5% improvement compared with 19.7% on the hydroquinone-only side. Three of the 22 (13.6%) patients developed mottled hypopigmentation after 5 laser treatments, and 8 (36.4%) developed confetti-type hypopigmentation. Four (18.2%) patients developed rebound hyperpigmentation, and all 22 patients experienced recurrence of melasma by 12 weeks posttreatment.21
First-line treatment for melasma involves the application of topical lightening agents such as hydroquinone, azelaic acid, kojic acid, retinoids, or mild topical steroids. Combining laser technology with topical medications can enhance treatment outcomes, particularly yielding positive results for patients with persistent pigmentation concerns. Notably, utilization of 650-microsecond technology with the 1064-nm Nd:YAG laser is considered superior in clinical practice, especially for patients with FSTs IV through VI.
Postinflammatory Hyperpigmentation—A retrospective evaluation of 61 patients with FSTs IV to VI with PIH treated with a 1927-nm NAFL showed a mean improvement of 43.24%, as assessed by 2 dermatologists.22 Additionally, the Nd:YAG 1064-nm 650-microsecond pulse duration laser is an emerging treatment that delivers high and low fluences between 4 J/cm2 and 255 J/cm2 within a single 650-microsecond pulse duration.23 The short-pulse duration avoids overheating the skin, mitigating procedural discomfort and the risk for adverse effects commonly seen with the previous generation of low-pulsed lasers. In addition to PIH, this laser has been successfully used to treat pseudofolliculitis barbae.24
Solar Lentigos—In a split-face study treating solar lentigos in Asian patients, 4 treatments with a low-pulsed KTP 532-nm laser were administered with and without a second treatment with a low-pulsed 1064-nm Nd:YAG laser.25 Scoring of a modified pigment severity index and measurement of the melanin index showed that skin treated with the low-pulsed 532-nm laser alone and in combination with the low-pulsed 1064-nm Nd:YAG laser resulted in improvement at 3 months’ follow-up. However, there was no difference between the 2 sides of the face, leading the researchers to conclude that the low-pulsed 532-nm laser appears to be safe and effective for treatment of solar lentigos in Asian patients and does not require the addition of the low-pulsed 1064-nm laser.25
To avoid hyperpigmentation in patients with SOC, strict photoprotection to the treated areas should be advised. Proper cooling of the laser-treated area is required to minimize PIH, as cooling decreases tissue damage and excessive thermal injury. Test spots should be considered prior to initiation of the full laser treatment. Hydroquinone in a 4% concentration applied daily for 2 weeks preprocedure commonly is employed to reduce the risk for postprocedural hyperpigmentation in clinical practice.26,27
Skin Tightening and Body Contouring
In general, skin-tightening and body-contouring devices are among the most sought-after procedures. Studies performed in patients with SOC are limited. Herein, we provide background on why these devices are favorable for patients with SOC and our experiences in using them. A summary of these devices can be found in Supplementary Table S4.
Radiofrequency Skin Tightening—Radiofrequency devices are utilized for skin tightening as well as mild fat reduction; they commonly are used on the abdomen, thighs, buttocks, and face.28 People with SOC are more responsive to radiofrequency skin-tightening therapy due to higher baseline collagen content and dermal thickness, more sebaceous activity and skin elasticity, and more melanin content which offers protective thermal buffering.29,30 As the radiofrequency device emits heat, penetrating deep into the dermis, it generates collagen remodeling and synthesis within 4 to 6 months posttreatment.
Nonsurgical Fat Reduction
Procedures for nonsurgical fat reduction are favorable due to minimal recovery time, manageable cost, and an in-office procedure setting. As noted previously, there are 6 FDA-indicated interventions for nonsurgical fat reduction: ultrasonography, cryolipolysis, laser lipolysis, injection lipolysis, radiofrequency lipolysis, and magnetic resonance contouring.31
Ultrasonography—Ultrasound devices designed for body contouring are used for skin tightening and mild fat reduction through the use of acoustic energy.32 These devices can be divided into 2 categories: high frequency and low frequency, with the high-frequency devices being the most popular. High-frequency ultrasound energy produces heat at target sites, which induces necrosis of adipocytes and stimulates collagen remodeling within the tissue matrix.33 Tissue temperatures above 56°C stimulate adipocyte necrosis while sparing nearby nerves and vessels.28 Because of the short duration of the procedure, the risk for epidermal damage is minimal. Contrary to high-frequency ultrasonography, focus-pulsed ultrasonography employs low-frequency waves to induce the mechanical disruption of adipocytes, which is generally better tolerated due to its nonthermal mechanism. The latter may be advantageous in patients with SOC due to a reduced risk for thermal injury to the epidermis. Multiple treatments often are needed at 3- to 4-week intervals, resulting in gradual improvement observed over 2 to 6 months. One study of microfocused ultrasonography in 25 Asian patients for treatment of face and neck laxity reported that skin laxity was improved or much improved in 84% (21/25) of patients following treatment.34 Adverse effects were reported as mild and transient, resolving within 90 days.34 Ultrasound devices also were shown to improve wrinkles, texture, and overall appearance of the skin in a 71-year-old African American woman 4 months following treatment (Figure 2). These photographs highlight the clinical utility of a microfocused ultrasound skin-tightening treatment in African American patients.
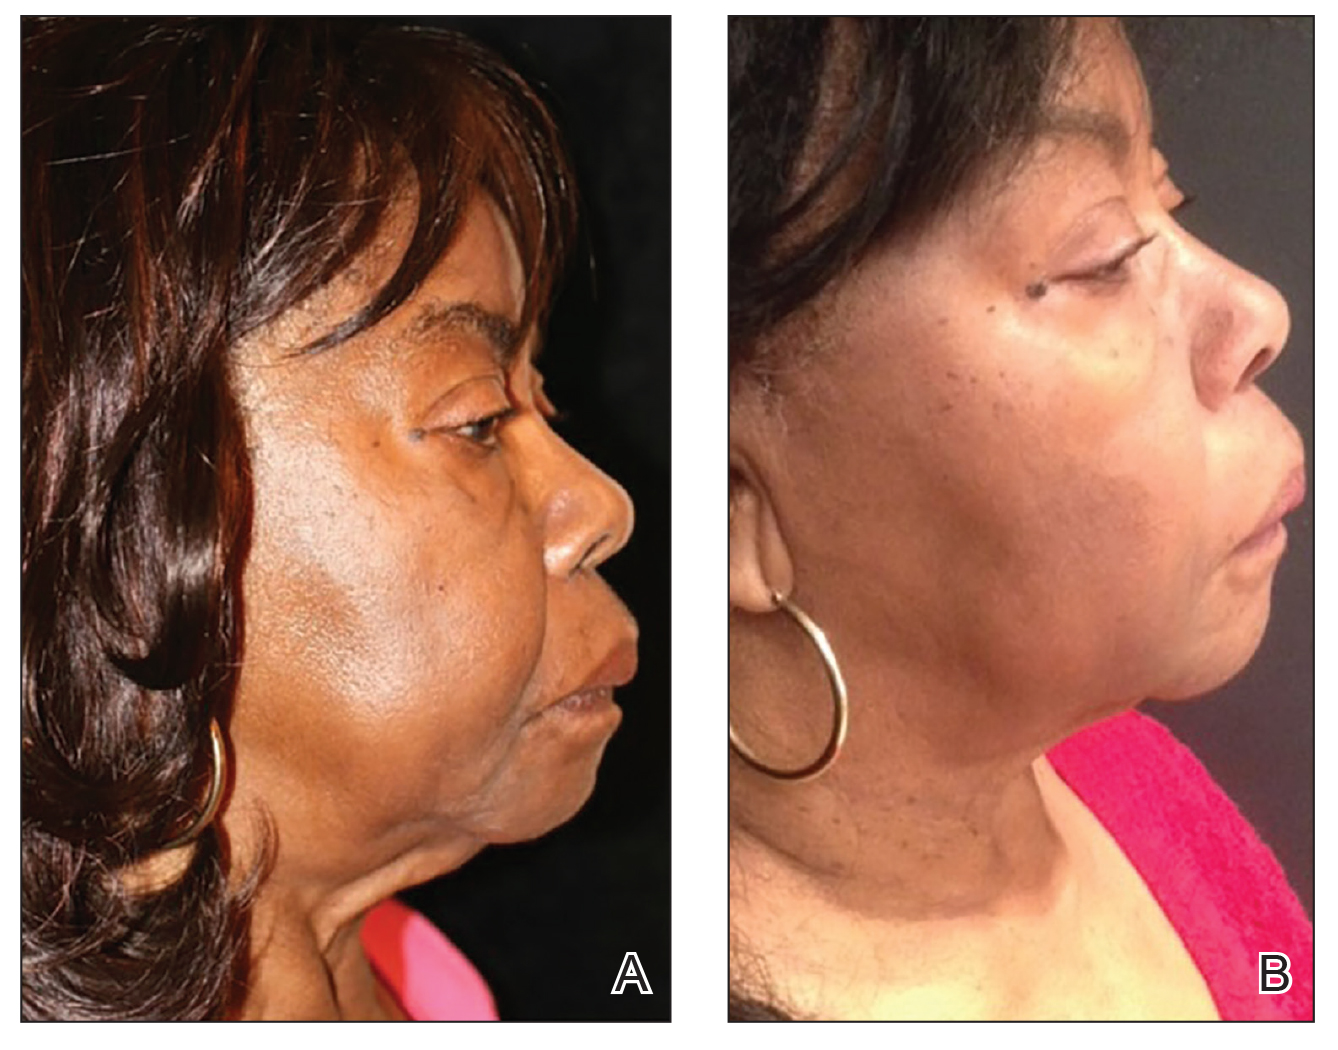
Cryolipolysis—Cryolipolysis is a noninvasive body contouring procedure that employs controlled cooling to induce subcutaneous panniculitis. Through cold-induced apoptosis of adipocytes, this procedure selectively reduces adipose tissue in localized areas such as the flank, abdomen, thighs, buttocks, back, submental area, and upper arms. The temperature used in cryolipolysis is approximately –10°C.35 The lethal temperature for melanocytes is –4 °C, below which melanocyte apoptosis may be induced, resulting in depigmentation. Given the prolonged contact of the skin with a cryolipolysis device for up to 60 minutes during a body-contouring procedure, there is a risk for resultant depigmentation in darker skin types. Controlled studies are needed to fully evaluate the safety and efficacy of cryolipolysis in patients with SOC. One retrospective study of cryolipolysis applied to the abdomen and upper arm of 4122 Asian patients reported a significant (P<.05) reduction in the circumference of the abdomen and the upper-arm areas. No long-term adverse effects were reported.36
Laser Lipolysis—The 1060-nm diode laser for body contouring selectively destroys adipose tissue, resulting in body contouring via thermally induced inflammation. Hyperthermic exposure for 15 minutes selectively elevates adipocyte temperature between 42°C to 47°C, which triggers apoptosis and the eventual clearance of destroyed cells from the interstitial space.37 The selectivity of the 1060-nm wavelength coupled with the device’s contact cooling system preserves the overlying skin and adnexa during the procedure,37 which would minimize epidermal damage that may induce dyspigmentation in patients with SOC. No notable adverse effects or dyspigmentation have been reported using this device.
Injection Lipolysis—Deoxycholic acid is an injectable adipocytolytic for the reduction of submental fat. It nonselectively lyses muscle and other adjacent nonfatty tissue. One study of 50 Indian patients demonstrated a substantial reduction of submental fat in 90% (45/50).38 For each treatment, 5 mL of 30 mg/mL deoxycholic acid was injected. Serial sessions were conducted at 2-month intervals, and most (64% [32/50]) patients required 3 sessions to see a treatment effect. Adverse effects included transient swelling, lumpiness, and tenderness. A phase 2a investigation of the novel injectable small-molecule drug CBL-514 in 43 Asian and White participants found a significant improvement in the reduction in abdominal fat volume (P<.00001) and thickness (P<.0001) relative to baseline at higher doses (unit dose, 2.0 mg/cm2 and 1.6 mg/cm2).39 In addition to the adverse effects mentioned previously, pruritus, repeated urticaria, body rash, and fever also were reported.39
Radiofrequency Lipolysis—Radiofrequency is used for adipolysis through heat-induced apoptosis. To achieve this effect, adipose tissue must sustain a temperature of 42 °C to 45 °C for at least 15 minutes.40 In one study, 4 treatments performed at 7-day intervals resulted in a statistically significant reduction in circumference to the treated areas of the inner and outer thighs without any reported adverse effects (P<0.001).41 Of note, there was 1 cm of distance between the applicator and the skin. The absence of direct contact with the skin is likely to reduce the risk for postprocedural complications in patients with SOC.
Magnetic Resonance Contouring—Magnetic resonance contouring with high-intensity focused electromagnetic technology is an emerging treatment modality for noninvasive body contouring. One distinguishing characteristic from other currently available noninvasive fat-reduction therapies is that magnetic resonance may improve strength, tone, and muscle thickness.42 This modality is FDA approved for contouring of the buttocks and abdomen and employs electromagnetic energy to stimulate approximately 20,000 muscle contractions within a time frame of 30 minutes. Though the mechanisms causing benefits to muscular and adipose tissue have not been elucidated, current findings suggest that the contractions stimulate substantial lipolysis of adipocytes, resulting in the release of large amounts of free fatty acids that cause damage to nearby adipose tissue.43 Multiple treatments are required over time to maintain effect. No major adverse effects have been reported. The likely mechanism of action of magnetic resonance contouring does not appear to pose an increased risk to patients with SOC.
Final Thoughts
One of the major roadblocks in distilling indications along with associated risks and benefits for nonsurgical cosmetic practices for patients with SOC is a void in the primary literature involving these populations. Clinical experience serves to address this deficit in combination with a thorough review of the literature. The 1064-nm Nd:YAG laser has shown clinical utility in the treatment of DPN, melanoma, and acne scars, but it poses financial constraints to the provider in comparison to modalities used for many years. Notably, NAF resurfacing is preferred for the management of acne scars in patients with SOC and continues to gain popularity for the treatment of photoaging. Regarding skin-tightening and body-contouring devices, studies performed in patients with SOC are limited and affected by factors such as small sample sizes, underrepresentation of FSTs IV through VI, short follow-up durations, and a lack of standardized outcome measures. Additionally, few studies assess pigmentary adverse effects or stratify results by skin type, which is critical given the higher risk for PIH in SOC. Ultrasound devices showed clinical utility in improvement of skin laxity, texture, and overall improvement. Patients with SOC respond well to skin-tightening devices due to the increased collagen synthesis. Regarding emerging devices for reduction of adipocytes, deoxycholic acid when injected showed notable improvement in fat reduction but also had adverse effects. As additional studies on cosmetic procedures in SOC emerge, an expansion of treatment options could be offered to this demographic group with confidence, provided proper treatment and follow-up protocols are in place.
Cosmetic laser procedures as well as energy-based fat reduction and body-contouring devices are increasingly popular among individuals with skin of color (SOC). Innovations in cosmetic devices and procedures tailored for SOC have allowed for the optimization of outcomes in this patient population. In this article, SOC is defined as darker skin types, including Fitzpatrick skin types (FSTs) IV to VI and ethnic backgrounds such as LatinX, African American, Southeast Asian, Native American, Pacific Islander, Middle Eastern, Asian, and African. Indications for laser treatment include dermatosis papulosa nigrans (DPN), acne scars, skin rejuvenation, and hyperpigmentation. There currently are 6 procedures for nonsurgical fat reduction that are approved by the US Food and Drug Administration (FDA): high-frequency focused ultrasound, cryolipolysis, laser lipolysis, injection lipolysis, radiofrequency lipolysis, and magnetic resonance contouring (Supplementary Table S1).1
In this review, our initial focus is cosmetic laser procedures, encompassing FDA-cleared indications along with the associated risks and benefits in SOC populations. Subsequently, we delve into the realms of energy-based fat reduction and body contouring, offering a comprehensive overview of these noninvasive therapies and addressing considerations for efficacy and safety in these patients.
Dermatosis Papulosa Nigra
In patients with SOC, scissor excision, curettage, or electrodesiccation are the mainstay treatments for removal of DPN (Figure 1). Curettage and electrodesiccation can cause temporary postinflammatory hyperpigmentation (PIH) in these populations, while cryotherapy is not a preferred method in patients with SOC due to the possibility of cryotherapy-induced depigmentation. In a 14-patient split-face study comparing the 532-nm potassium titanyl phosphate (KTP) laser vs electrodesiccation in FSTs IV to VI, the KTP-treated side showed an improvement rate of 96%, while the electrodesiccation side showed an improvement rate of 79%. There was a statistically significant favorable experience for KTP with regard to pain tolerability (P=.002).2 Complete resolution of lesions may be seen after 3 to 4 sessions at 4-week intervals. Additionally, the 1064-nm Nd:YAG laser was assessed for treatment of DPN in 2 patients, with 70% to 90% of lesions resolved after a single treatment with no complications.3
Most dermatologists still rely on curettage and electrodesiccation instead of laser therapy to remove DPNs in patients with SOC. The use of the Nd:YAG laser is promising yet expensive for the provider both to purchase and maintain. Electrodesiccation has been used by dermatology practices for decades and can be used without permanent discoloration. To minimize the risk for PIH, we recommend application of a healing ointment such as petroleum jelly or aloe vera gel to the treated lesions as well as lightening agents for PIH and daily use of sunscreen. Overall, providers do not need to purchase an expensive laser device for DPN removal.
Acne Scars
The invention of fractional technology in the early 2000s and its favorable safety profile have changed how dermatologists treat scarring in patients with SOC.
In one study of the short-pulsed nonablative Nd:YAG laser, 9 patients with FSTs I to V and 2 patients with FSTs IV to V underwent 8 treatments at 2-week intervals. Three blinded observers found a 29% improvement in the Global Acne Scar Severity score, while 89% (8/9) of patients self-reported subjective improvement in their acne scars.10
The 755-nm picosecond laser and diffractive lens array also have been shown to reduce the appearance of acne scars in patients with SOC, as shown via serial photography in a retrospective study of 56 patients with FSTs IV to VI. Transient hyperpigmentation, erythema, and edema were reported.11
Nonablative laser therapy is preferred for skin rejuvenation in patients with SOC due to a reduced risk for postprocedural hyperpigmentation.11 Ablative resurfacing (eg, CO2 laser) poses major risks for postprocedural hyperpigmentation, hypopigmentation, and scar formation and therefore should be avoided in these populations.12,13 A study involving 30 Asian patients (FSTs III-IV) demonstrated that the 1550-nm fractional laser was well tolerated, though higher treatment densities and fluences may lead to temporary adverse effects such as increased redness, swelling, and pain (P<.01).14 Furthermore, greater density was shown to cause higher levels of redness, hyperpigmentation, and swelling in comparison to higher fluence settings. Of note, patient satisfaction was markedly higher in patients who underwent treatment with higher fluence settings but not in patients with higher densities (P<.05). Postprocedural hyperpigmentation was noted in 6.7% (2/30) of patients studied.14 In another study, 8 patients with FSTs II to V were treated with either the 1064-nm long-pulsed Nd:YAG laser or the grid fractional monopolar radiofrequency laser.15 All participants experienced a significant decrease in mean wrinkle count using the Lemperle wrinkle assessment (P<.05). A significant decrease in mean wrinkle assessment score from 3.5 to 3.17 in clinical assessment and a decrease from 3.165 to 2.33 for photographic assessment was noted in patients treated with the grid laser (P<.05). A similar decrease in mean wrinkle assessment score was observed in the Nd:YAG group, with a mean decrease of 3.665 to 2.83 after 2 months for clinical assessment and 3.5 to 2.67 for photographic assessment. Among all patients in the study, 68% (6/8) experienced erythema, 25% (2/8) had a burning sensation, and 25% (2/8) experienced urticaria immediately postprocedure.15
Nonablative fractional resurfacing is preferred for the management of acne scars in patients with SOC. Adverse effects such as hyperpigmentation typically are transient, and the risk may be minimized with strict photoprotective practices following the procedure. Furthermore, avoidance of topicals containing exfoliants or α-hydroxy acids applied to the treated area following the procedure also may mitigate the risk for postprocedural hyperpigmentation.16 If hyperpigmentation does occur, use of topical melanogenesis inhibitors such as hydroquinone, kojic acid, or azelaic acid has shown some utility in practice.
Skin Rejuvenation
Nonablative fractional lasers (NAFLs) continue to be popular for treatment of photoaging. One study including 10 Asian patients (FSTs III-V) assessed the 1440-nm diode-based fractional laser for facial rejuvenation.17 After 4 sessions at 2-week intervals, 80% (8/10) of patients reported decreased skin roughness after both the second and third treatments, while 90% (9/10) had improved texture 1 month after the final procedure. Adverse effects included moderate facial edema and one case of transient hyperpigmentation.17 Another study reported a significant reduction in pore score (P<.002), with patients noting an overall improvement in skin appearance with minimal erythema, dryness, and flaking following 6 sessions at 2-week intervals using the 1440-nm diode-based fractional laser.18
The 1550-nm diode fractional laser significantly improved skin pigmentation (P<.001) and texture (P<.001) in 10 patients with FSTs II to IV following 5 sessions at 2- to 3-week intervals, with self-resolving erythema and edema posttreatment (Supplementary Table S2).19 Overall, NAFLs for the treatment of photoaging are effective with minimal adverse effects (eg, facial edema), which can be reduced with application of cold compression to the face and elevation of the head following treatment as well as the use of additional pillows during overnight sleep.
Laser Treatment for Hyperpigmentation Disorders
Melasma—The FDA recently approved fractional photothermolysis for the treatment of melasma; however, due to the risk for hyperpigmentation given its pathogenesis linked to hyperactive melanocytes, this laser is not considered a first-line therapy for melasma.20 In a split-face, randomized study, 22 patients with FSTs III to V who were diagnosed with either dermal or mixed-type melasma were treated with a low-fluence Q-switched Nd:YAG laser combined with hydroquinone 2% vs hydroquinone 2% alone (Supplementary Table S3).21 Each patient was treated weekly for 5 consecutive weeks. The laser-treated side was found to reach an average of 92.5% improvement compared with 19.7% on the hydroquinone-only side. Three of the 22 (13.6%) patients developed mottled hypopigmentation after 5 laser treatments, and 8 (36.4%) developed confetti-type hypopigmentation. Four (18.2%) patients developed rebound hyperpigmentation, and all 22 patients experienced recurrence of melasma by 12 weeks posttreatment.21
First-line treatment for melasma involves the application of topical lightening agents such as hydroquinone, azelaic acid, kojic acid, retinoids, or mild topical steroids. Combining laser technology with topical medications can enhance treatment outcomes, particularly yielding positive results for patients with persistent pigmentation concerns. Notably, utilization of 650-microsecond technology with the 1064-nm Nd:YAG laser is considered superior in clinical practice, especially for patients with FSTs IV through VI.
Postinflammatory Hyperpigmentation—A retrospective evaluation of 61 patients with FSTs IV to VI with PIH treated with a 1927-nm NAFL showed a mean improvement of 43.24%, as assessed by 2 dermatologists.22 Additionally, the Nd:YAG 1064-nm 650-microsecond pulse duration laser is an emerging treatment that delivers high and low fluences between 4 J/cm2 and 255 J/cm2 within a single 650-microsecond pulse duration.23 The short-pulse duration avoids overheating the skin, mitigating procedural discomfort and the risk for adverse effects commonly seen with the previous generation of low-pulsed lasers. In addition to PIH, this laser has been successfully used to treat pseudofolliculitis barbae.24
Solar Lentigos—In a split-face study treating solar lentigos in Asian patients, 4 treatments with a low-pulsed KTP 532-nm laser were administered with and without a second treatment with a low-pulsed 1064-nm Nd:YAG laser.25 Scoring of a modified pigment severity index and measurement of the melanin index showed that skin treated with the low-pulsed 532-nm laser alone and in combination with the low-pulsed 1064-nm Nd:YAG laser resulted in improvement at 3 months’ follow-up. However, there was no difference between the 2 sides of the face, leading the researchers to conclude that the low-pulsed 532-nm laser appears to be safe and effective for treatment of solar lentigos in Asian patients and does not require the addition of the low-pulsed 1064-nm laser.25
To avoid hyperpigmentation in patients with SOC, strict photoprotection to the treated areas should be advised. Proper cooling of the laser-treated area is required to minimize PIH, as cooling decreases tissue damage and excessive thermal injury. Test spots should be considered prior to initiation of the full laser treatment. Hydroquinone in a 4% concentration applied daily for 2 weeks preprocedure commonly is employed to reduce the risk for postprocedural hyperpigmentation in clinical practice.26,27
Skin Tightening and Body Contouring
In general, skin-tightening and body-contouring devices are among the most sought-after procedures. Studies performed in patients with SOC are limited. Herein, we provide background on why these devices are favorable for patients with SOC and our experiences in using them. A summary of these devices can be found in Supplementary Table S4.
Radiofrequency Skin Tightening—Radiofrequency devices are utilized for skin tightening as well as mild fat reduction; they commonly are used on the abdomen, thighs, buttocks, and face.28 People with SOC are more responsive to radiofrequency skin-tightening therapy due to higher baseline collagen content and dermal thickness, more sebaceous activity and skin elasticity, and more melanin content which offers protective thermal buffering.29,30 As the radiofrequency device emits heat, penetrating deep into the dermis, it generates collagen remodeling and synthesis within 4 to 6 months posttreatment.
Nonsurgical Fat Reduction
Procedures for nonsurgical fat reduction are favorable due to minimal recovery time, manageable cost, and an in-office procedure setting. As noted previously, there are 6 FDA-indicated interventions for nonsurgical fat reduction: ultrasonography, cryolipolysis, laser lipolysis, injection lipolysis, radiofrequency lipolysis, and magnetic resonance contouring.31
Ultrasonography—Ultrasound devices designed for body contouring are used for skin tightening and mild fat reduction through the use of acoustic energy.32 These devices can be divided into 2 categories: high frequency and low frequency, with the high-frequency devices being the most popular. High-frequency ultrasound energy produces heat at target sites, which induces necrosis of adipocytes and stimulates collagen remodeling within the tissue matrix.33 Tissue temperatures above 56°C stimulate adipocyte necrosis while sparing nearby nerves and vessels.28 Because of the short duration of the procedure, the risk for epidermal damage is minimal. Contrary to high-frequency ultrasonography, focus-pulsed ultrasonography employs low-frequency waves to induce the mechanical disruption of adipocytes, which is generally better tolerated due to its nonthermal mechanism. The latter may be advantageous in patients with SOC due to a reduced risk for thermal injury to the epidermis. Multiple treatments often are needed at 3- to 4-week intervals, resulting in gradual improvement observed over 2 to 6 months. One study of microfocused ultrasonography in 25 Asian patients for treatment of face and neck laxity reported that skin laxity was improved or much improved in 84% (21/25) of patients following treatment.34 Adverse effects were reported as mild and transient, resolving within 90 days.34 Ultrasound devices also were shown to improve wrinkles, texture, and overall appearance of the skin in a 71-year-old African American woman 4 months following treatment (Figure 2). These photographs highlight the clinical utility of a microfocused ultrasound skin-tightening treatment in African American patients.
Cryolipolysis—Cryolipolysis is a noninvasive body contouring procedure that employs controlled cooling to induce subcutaneous panniculitis. Through cold-induced apoptosis of adipocytes, this procedure selectively reduces adipose tissue in localized areas such as the flank, abdomen, thighs, buttocks, back, submental area, and upper arms. The temperature used in cryolipolysis is approximately –10°C.35 The lethal temperature for melanocytes is –4 °C, below which melanocyte apoptosis may be induced, resulting in depigmentation. Given the prolonged contact of the skin with a cryolipolysis device for up to 60 minutes during a body-contouring procedure, there is a risk for resultant depigmentation in darker skin types. Controlled studies are needed to fully evaluate the safety and efficacy of cryolipolysis in patients with SOC. One retrospective study of cryolipolysis applied to the abdomen and upper arm of 4122 Asian patients reported a significant (P<.05) reduction in the circumference of the abdomen and the upper-arm areas. No long-term adverse effects were reported.36
Laser Lipolysis—The 1060-nm diode laser for body contouring selectively destroys adipose tissue, resulting in body contouring via thermally induced inflammation. Hyperthermic exposure for 15 minutes selectively elevates adipocyte temperature between 42°C to 47°C, which triggers apoptosis and the eventual clearance of destroyed cells from the interstitial space.37 The selectivity of the 1060-nm wavelength coupled with the device’s contact cooling system preserves the overlying skin and adnexa during the procedure,37 which would minimize epidermal damage that may induce dyspigmentation in patients with SOC. No notable adverse effects or dyspigmentation have been reported using this device.
Injection Lipolysis—Deoxycholic acid is an injectable adipocytolytic for the reduction of submental fat. It nonselectively lyses muscle and other adjacent nonfatty tissue. One study of 50 Indian patients demonstrated a substantial reduction of submental fat in 90% (45/50).38 For each treatment, 5 mL of 30 mg/mL deoxycholic acid was injected. Serial sessions were conducted at 2-month intervals, and most (64% [32/50]) patients required 3 sessions to see a treatment effect. Adverse effects included transient swelling, lumpiness, and tenderness. A phase 2a investigation of the novel injectable small-molecule drug CBL-514 in 43 Asian and White participants found a significant improvement in the reduction in abdominal fat volume (P<.00001) and thickness (P<.0001) relative to baseline at higher doses (unit dose, 2.0 mg/cm2 and 1.6 mg/cm2).39 In addition to the adverse effects mentioned previously, pruritus, repeated urticaria, body rash, and fever also were reported.39
Radiofrequency Lipolysis—Radiofrequency is used for adipolysis through heat-induced apoptosis. To achieve this effect, adipose tissue must sustain a temperature of 42 °C to 45 °C for at least 15 minutes.40 In one study, 4 treatments performed at 7-day intervals resulted in a statistically significant reduction in circumference to the treated areas of the inner and outer thighs without any reported adverse effects (P<0.001).41 Of note, there was 1 cm of distance between the applicator and the skin. The absence of direct contact with the skin is likely to reduce the risk for postprocedural complications in patients with SOC.
Magnetic Resonance Contouring—Magnetic resonance contouring with high-intensity focused electromagnetic technology is an emerging treatment modality for noninvasive body contouring. One distinguishing characteristic from other currently available noninvasive fat-reduction therapies is that magnetic resonance may improve strength, tone, and muscle thickness.42 This modality is FDA approved for contouring of the buttocks and abdomen and employs electromagnetic energy to stimulate approximately 20,000 muscle contractions within a time frame of 30 minutes. Though the mechanisms causing benefits to muscular and adipose tissue have not been elucidated, current findings suggest that the contractions stimulate substantial lipolysis of adipocytes, resulting in the release of large amounts of free fatty acids that cause damage to nearby adipose tissue.43 Multiple treatments are required over time to maintain effect. No major adverse effects have been reported. The likely mechanism of action of magnetic resonance contouring does not appear to pose an increased risk to patients with SOC.
Final Thoughts
One of the major roadblocks in distilling indications along with associated risks and benefits for nonsurgical cosmetic practices for patients with SOC is a void in the primary literature involving these populations. Clinical experience serves to address this deficit in combination with a thorough review of the literature. The 1064-nm Nd:YAG laser has shown clinical utility in the treatment of DPN, melanoma, and acne scars, but it poses financial constraints to the provider in comparison to modalities used for many years. Notably, NAF resurfacing is preferred for the management of acne scars in patients with SOC and continues to gain popularity for the treatment of photoaging. Regarding skin-tightening and body-contouring devices, studies performed in patients with SOC are limited and affected by factors such as small sample sizes, underrepresentation of FSTs IV through VI, short follow-up durations, and a lack of standardized outcome measures. Additionally, few studies assess pigmentary adverse effects or stratify results by skin type, which is critical given the higher risk for PIH in SOC. Ultrasound devices showed clinical utility in improvement of skin laxity, texture, and overall improvement. Patients with SOC respond well to skin-tightening devices due to the increased collagen synthesis. Regarding emerging devices for reduction of adipocytes, deoxycholic acid when injected showed notable improvement in fat reduction but also had adverse effects. As additional studies on cosmetic procedures in SOC emerge, an expansion of treatment options could be offered to this demographic group with confidence, provided proper treatment and follow-up protocols are in place.
Cosmetic Laser Procedures and Nonsurgical Body Contouring in Patients With Skin of Color
Cosmetic Laser Procedures and Nonsurgical Body Contouring in Patients With Skin of Color
- Mazzoni D, Lin MJ, Dubin DP, et al. Review of non-invasive body contouring devices for fat reduction, skin tightening and muscle definition. Australas J Dermatol. 2019;60:278-283. doi:10.1111/ajd.13090
- Kundu RV, Joshi SS, Suh KY, et al. Comparison of electrodesiccation and potassium-titanyl-phosphate laser for treatment of dermatosis papulosa nigra. Dermatol Surg. 2009;35:1079-1083. doi:10.1111/j.1524-4725.2009.01186.x&
- Schweiger ES, Kwasniak L, Aires DJ. Treatment of dermatosis papulosa nigra with a 1064 nm Nd:YAG laser: report of two cases. J Cosmet Laser Ther. 2008;10:120-122. doi:10.1080/14764170801950070
- Manstein D, Herron GS, Sink RK, et al. Fractional photothermolysis: a new concept for cutaneous remodeling using microscopic patterns of thermal injury. Lasers Surg Med. 2004;34:426-438. doi:10.1002/lsm.20048
- Alajlan AM, Alsuwaidan SN. Acne scars in ethnic skin treated with both non-ablative fractional 1,550 nm and ablative fractional CO2 lasers: comparative retrospective analysis with recommended guidelines. Lasers Surg Med. 2011;43effi:787-791. doi:10.1002/lsm.21092
- Ke R, Cai B, Ni X, et al. Efficacy and safety of non-ablative vs. ablative lasers for acne scarring: a meta-analysis. J Deutschen Dermatologischen Gesellschaft. Published online March 11, 2025. doi: 10.1111/ddg.15651
- Goel A, Krupashankar DS, Aurangabadkar S, et al. Fractional lasers in dermatology—current status and recommendations. Indian J Dermatol Venereol Leprol. 2011;77:369. doi:10.4103/0378-6323.79732
- Lee HS, Lee JH, Ahn GY, et al. Fractional photothermolysis for the treatment of acne scars: a report of 27 Korean patients. J Dermatolog Treat. 2008;19:45-49. doi:10.1080/09546630701691244
- Zhang AD, Clovie J, Lazar M, et al. Treatment of benign pigmented lesions using lasers: a scoping review. J Clin Med. 2025;14li:3985. doi:10.3390/jcm14113985
- Lipper GM, Perez M. Nonablative acne scar reduction after a series of treatments with a short-pulsed 1,064-nm neodymium:YAG laser. Dermatol Surg. 2006;32:998-1006. doi:10.1111/j.1524-4725.2006.32222.x
- Mar K, Khalid B, Maazi M, et al. Treatment of post-inflammatory hyperpigmentation in skin of colour: a systematic review. J Cutan Med Surg. 2024;28:473-480. doi:10.1177/12034754241265716
- Kono T, Chan HH, Groff WF, et al. Prospective direct comparison study of fractional resurfacing using different fluences and densities for skin rejuvenation in Asians. Lasers Surg Med. 2007;39:311-314. doi:10.1002/lsm.20484
- Sharkey JR, Sharf BF, St John JA. “Una persona derechita (staying right in the mind)”: perceptions of Spanish-speaking Mexican American older adults in South Texas colonias. Gerontologist. 2009;49 suppl 1:S79-85. doi:10.1093/geront/gnp086
- Wu X, Cen Q, Jin J, et al. An effective and safe laser treatment strategy of fractional carbon dioxide laser for Chinese populations with periorbital wrinkles: a randomized split-face trial. Dermatol Therapy. 2025;15:1307-1317.
- Milante RR, Doria-Ruiz MJ, Beloso MB, et al. Split-face comparison of grid fractional radiofrequency vs 1064-nm Nd-YAG laser treatment of periorbital rhytides among Filipino patients. Dermatol Ther. 2020;33:e14031. doi:10.1111/dth.14031
- Alexis AF, Andriessen A, Beach RA, et al. Periprocedural skincare for nonenergy and nonablative energy-based aesthetic procedures in patients with skin of color. J Cosmet Dermatol. 2025;24:E16712. doi:10.1111/jocd.16712
- Marmon S, Shek SYN, Yeung CK, et al. Evaluating the safety and efficacy of the 1,440-nm laser in the treatment of photodamage in Asian skin. Lasers Surg Med. 2014;46:375-379. doi:10.1002/lsm.22242
- Saedi N, Petrell K, Arndt K, et al. Evaluating facial pores and skin texture after low-energy nonablative fractional 1440-nm laser treatments. J Am Acad Dermatol. 2013;68:113-118. doi:10.1016/j.jaad.2012.08.041
- Jih MH, Goldberg LH, Kimyai-Asadi A. Fractional photothermolysis for photoaging of hands. Dermatol Surg. 2008;34:73-78. doi:10.1111/j.1524-4725.2007.34011.x
- Prohaska J, Hohman MH. Laser complications. StatPearls. Updated August 28, 2023. Accessed July 23, 2025. http://www.ncbi.nlm.nih.gov/books/NBK532248/
- Trivedi MK, Yang FC, Cho BK. A review of laser and light therapy in melasma. Int J Womens Dermatol. 2017;3:11-20. doi:10.1016/j.ijwd.2017.01.004
- Brauer JA, Kazlouskaya V, Alabdulrazzaq H, et al. Use of a picosecond pulse duration laser with specialized optic for treatment of facial acne scarring. JAMA Dermatol. 2015;151:278-284. doi:10.1001/jamadermatol.2014.3045
- Greywal T, Ortiz A. Treating melasma with the 1064 nm Nd:YAG laser with a 650-microsecond pulse duration: a clinical evaluation. J Cosmet Dermatol. 2021;20:3889-3892. doi:10.1111/jocd.14558
- Weaver SM, Sagaral EC. Treatment of pseudofolliculitis barbae using the long-pulse Nd:YAG laser on skin types V and VI. Dermatol Surg. 2003;29:1187-1191. doi:10.1111/j.1524-4725.2003.29387.x
- Negishi K, Tanaka S, Tobita S. Prospective, randomized, evaluator-blinded study of the long pulse 532-nm KTP laser alone or in combination with the long pulse 1064-nm Nd:YAG laser on facial rejuvenation in Asian skin. Lasers Surg Med. 2016;48:844-851. doi:10.1002/lsm.22582
- Kaushik S, Alexis AF. Nonablative fractional laser resurfacing in skin of color: evidence-based review. J Clin Aesthetic Dermatol. 2017;10:51-67.
- Garg S, Vashisht KR, Garg D, et al. Advancements in laser therapies for dermal hyperpigmentation in skin of color: a comprehensive literature review and experience of sequential laser treatments in a cohort of 122 Indian patients. J Clin Med. 2024;13:2116. doi:10.3390/jcm13072116
- Alizadeh Z, Halabchi F, Mazaheri R, et al. Review of the mechanisms and effects of noninvasive body contouring devices on cellulite and subcutaneous fat. Int J Endocrinol Metab. 2016;14:e36727. doi:10.5812/ijem.36727
- Rawlings AV. Ethnic skin types: are there differences in skin structure and function? Int J Cosmet Sci. 2006;28:79-93. doi:10.1111/j.1467-2494.2006.00302.x
- El-Domyati M, El-Ammawi TS, Medhat W, et al. Radiofrequency facial rejuvenation: Evidence-based effect. J Am Acad Dermatol. 2011;64:524-535. doi:10.1016/j.jaad.2010.06.045
- US Food and Drug Administration. Non-invasive body contouring technologies. Published December 7, 2022. Accessed July 23, 2025. https://www.fda.gov/medical-devices/aesthetic-cosmetic-devices/non-invasive-body-contouring-technologies
- Robinson DM, Kaminer MS, Baumann L, et al. High-intensity focused ultrasound for the reduction of subcutaneous adipose tissue using multiple treatment techniques. Dermatol Surg. 2014;40:641-651. doi:10.1111/dsu.0000000000000022
- Biskanaki F, Tertipi N, Sfyri E, et al. Complications and risks of high-intensity focused ultrasound (HIFU) in esthetic procedures: a review. Applied Sciences. 2025;15:4958. doi:10.3390/app15094958
- Lu PH, Yang CH, Chang YC. Quantitative analysis of face and neck skin tightening by microfocused ultrasound with visualization in Asians. Dermatol Surg. 2017;43:1332-1338. doi:10.1097/DSS.0000000000001181
- Avram MM, Harry RS. Cryolipolysis for subcutaneous fat layer reduction. Lasers Surg Med. 2009;41:703-708. doi:10.1002/lsm.20864
- Nishikawa A, Aikawa Y. Quantitative assessment of the cryolipolysis method for body contouring in Asian patients. Clin Cosmet Investig Dermatol. 2021;14:1773-1781. doi:10.2147/CCID.S337487
- Bass LS, Doherty ST. Safety and efficacy of a non-invasive 1060 nm diode laser for fat reduction of the abdomen. J Drugs Dermatol. 2018;17:106-112
- Shome D, Khare S, Kapoor R. The use of deoxycholic acid for the clinical reduction of excess submental fat in Indian patients. J Drugs Dermatol. 2019;18:266-272.
- Goodman GJ, Ho WWS, Chang KJ, et al. Efficacy of a novel injection lipolysis to induce targeted adipocyte apoptosis: a randomized, phase IIa study of CBL-514 injection on abdominal subcutaneous fat reduction. Aesthetic Surg J. 2022;42:NP662-NP674. doi:10.1093/asj/sjac162
- McDaniel D, Lozanova P. Human adipocyte apoptosis immediately following high frequency focused field radio frequency: case study.J Drugs Dermatol. 2015;14:622-623.
- Fritz K, Samková P, Salavastru C, et al. A novel selective RF applicator for reducing thigh circumference: a clinical evaluation. Dermatol Ther. 2016;29:92-95. doi:10.1111/dth.12304
- Kinney BM, Lozanova P. High intensity focused electromagnetic therapy evaluated by magnetic resonance imaging: safety and efficacy study of a dual tissue effect based non-invasive abdominal body shaping. Lasers Surg Med. 2019;51:40-46. doi:10.1002/lsm.23024
- Negosanti F, Cannarozzo G, Zingoni T, et al. Is it possible to reshape the body and tone it at the same time? Schwarzy: the new technology for body sculpting. Bioengineering (Basel). 2022;9:284. doi:10.3390/bioengineering9070284
PRACTICE POINTS
- Nonablative fractional lasers are preferred for acne scars in skin of color (SOC), minimizing hyperpigmentation risk.
- The 1064-nm Nd:YAG and picosecond lasers are safe and effective when used with SOC-appropriate settings.
- Photoprotection and topical lightening agents reduce postprocedure pigmentation risks.

Jumping Jacks and Cold Water: How Pediatricians Are Stepping up in the Youth Mental Health Crisis
A young boy with a habit of screaming when he didn’t get his way is among the patients Joannie Yeh, MD, a primary care physician at Nemours Children’s Health in Media, Pennsylvania, has helped in her practice.
Yeh taught the boy to stretch out his hands into the shape of a starfish, then trace around the edges of his fingers while breathing slowly and deeply. His parents later reported that after using the strategy at home, their son was no longer taking his rage out on his younger siblings.
Interventions like breathing exercises are just a few techniques Yeh hopes more primary care clinicians will teach young patients as mental health issues among this population soar to a national state of emergency, major medical groups say. But many children go without treatment because of shortages of mental health clinicians and long wait-lists for appointments.
“Knowledge of different types of interventions allows pediatricians to offer more options to families — more than just medication alone,” Yeh said. “There are some strategies, like cognitive behavioral therapy, that a therapist is equipped to deliver, but we can help explain them or teach simple skills that borrow from principles of higher-level techniques and can help patients and families while they wait to see a therapist.”
, said Theresa Nguyen, MD, chair of pediatrics at Greater Baltimore Medical Center, Baltimore.
“It kind of sucks if you come in worried and then your doctor says, ‘Okay, let me send you to a psychiatrist who you can’t see for 6 months; let me send you to a therapist who’s going to take a couple of weeks to get in with,’” Nguyen said.
Yeh said over the past few years she has cared for more youth coming in as follow-ups after an emergency department visit for a mental health episode.
“Oftentimes, this is the first time we become aware that the child is struggling,” Yeh said. “We are seeing issues like intentional medication overdose, referrals after other self-harm actions, or even the discovery of a note indicating the intention to do harm to self.”
Suicide deaths among 10- to 14-year-olds tripled between 2007 and 2018 and held steady through 2021, with rates climbing even among children as young as 8 years, according to a research in JAMA Network Open. Meanwhile, one in five high school students seriously contemplated suicide in 2023 (27% girls, 14% boys).
Mental Health Strategies for Kids in Primary Care
While pediatricians cannot replace a mental health professional, they have the unique advantage of maintaining a long-term relationship with patients. Experts said clinicians should take an active role in supporting the mental health of patients through a variety of evidence-based strategies.
Changing Thought Patterns
Cognitive-behavioral therapy (CBT) involves identifying and challenging automatic negative thoughts, which can affect a child’s emotional state and lead to behaviors like withdrawal or lashing out.
Yeh recommended asking a child about what is bothering them, pointing out unhelpful and negative thoughts, and then offering a different, positive one instead.
She also often draws a picture of the CBT chart, which is a visual representation of how feelings lead to thoughts, and then behaviors.
“I draw this diagram because it helps give the patients a visual understanding of how their feelings and emotions are connected,” Yeh said.
Tools to Tolerate Stressful Situations
Simple tools like breathing exercises, body scanning, and physical exercise can help children better tolerate distress.
Pediatricians can also recommend families use guided meditations, which have been shown to lower anxiety and increase positive social behavior, said Mollie Grow, MD, an associate professor of pediatrics at the University of Washington Medicine and Seattle Children’s Hospital, both in Seattle.
But a child might first need to get negative energy out before they can become calm.
“So I’m like, ‘okay, let’s do actual physical exercise. Give me 10 jumping jacks.’ No one’s nervous after those jumping jacks,” Nguyen said. “When you’ve already been triggered, your nerves have gotten going, and you’re starting to spiral, you can’t slow yourself down enough to do a breathing exercise.”
Nguyen also said that cold water quickly calms the nervous system.
“I’ll run cold water in the office and have them put their hand in it until it’s almost frozen,” and the child or teen is able to think more clearly, Nguyen said. “It’s a real physiological response. It works.”
The Origin of a Feeling
Explaining how symptoms of anxiety, depression, or ADHD work can help children and teens better understand that what they are experiencing is normal and better cope, Yeh said.
Clinicians might teach patients about how shallow breathing — a symptom of anxiety — is a result of the brain scanning for danger, and how slowing breathing tricks the brain into feeling safe again.
Barriers Abound
The use of these interventions in pediatric settings is not yet widespread, Grow said.
But starting in July 2025, the Accreditation Council for Graduate Medical Education will require pediatric residencies to include 4 weeks of mental health training. How that requirement is fulfilled will be up to residencies, said Brian Alverson, MD, pediatric program director and vice-chair of education at Nemours Children’s Hospital in Wilmington, Delaware.
Even with training, many pediatricians lack the time to address mental health issues during an office visit, said Carlos Lerner, MD, a professor of clinical pediatrics at University of California, Los Angeles Health. And despite low or sometimes no reimbursement for discussing these issues with patients, “the reality is we end up doing it anyway.”
Treating issues like anxiety and depression “is a daily, constant part of the care that I provide for my patients,” said Lerner. “Whether the pandemic or social media exacerbated it, we are absolutely seeing a rise in mental health issues.”
A version of this article first appeared on Medscape.com.
Atopic Dermatitis and Sleep Disturbances
Recently one of my keep-up-to-date apps alerted me to a study in Pediatric Dermatology on sleep and atopic dermatitis. When I chased down the abstract it was a shoulder-shrugging-so-what encounter. The authors reported that having a child with atopic dermatitis decreased the odds of a parent getting 7 hours of sleep a night and increased the odds that the parent was also taking sleep-aiding medications. The authors felt their data was meaningful enough to publish based on the size and the cross-sectional nature of their sample. However, anyone who has worked with families with atopic dermatitis shouldn’t be surprised at their findings.
Curious about what other investigators had discovered about the anecdotally obvious relationship between sleep and atopic dermatitis, I dug until I found a rather thorough discussion of the literature published in The Journal of Clinical Immunology Practice. These authors from the University of Rochester Medical School in New York begin by pointing out that, although 47%-80% of children with atopic dermatitis and 33%-90% of adults with atopic dermatitis have disturbed sleep, “literature on this topic remains sparse with most studies evaluating sleep as a secondary outcome using subjective measures.” They further note that sleep is one of the three most problematic symptoms for children with atopic dermatitis and their families.

Characterizing the Sleep Loss
Difficulty falling asleep, frequent and long waking, and excessive daytime sleepiness are the most common symptoms reported. In the few sleep laboratory studies that have been done there has been no significant decrease in sleep duration, which is a bit of a surprise. However, as expected, sleep-onset latency, more wake time after sleep onset, sleep fragmentation, and decreased sleep efficiency have been observed in the atopic dermatitis patients. In other studies of younger children, female gender and lower socioeconomic status seem to be associated with poor sleep quality.
Most studies found that in general the prevalence and severity of sleep disturbances increases with the severity of the disease. As the disease flares, increased bedtime resistance, nocturnal wakings and daytime sleepiness become more likely. These parentally reported associations have also been confirmed by sleep laboratory observations.
The sleep disturbances quickly become a family affair with 60% of siblings and parents reporting disturbed sleep. When the child with atopic dermatitis is having a flareup, nearly 90% of their parents report losing up to 2.5 hours of sleep. Not surprisingly sleep disturbances have been associated with behavioral and emotional problems including decreased happiness, poor cognitive performance, hyperactivity, and inattention. Mothers seem to bear the brunt of the problem and interpersonal conflicts and exhaustion are unfortunately not uncommon.
Probing the Causes
So why are atopic dermatitis patients and their families so prone to the ill effects of disturbed sleep? Although you might think it should be obvious, this review of the “sparse” literature doesn’t provide a satisfying answer. However, the authors provide three possible explanations.
The one with the least supporting evidence is circadian variations in the products of inflammation such as cytokines and their effect on melatonin production. The explanation which I think most of us have already considered is that pruritus disrupts sleep. This is the often-quoted itch-scratch feedback cycle which can release inflammatory mediators (“pruritogens”). However, the investigators have found that many studies report “conflicting results or only weak correlations.”
The third alternative posed by the authors is by far the most appealing and hinges on the assumption that, as with many other chronic conditions, atopic dermatitis renders the patient vulnerable to insomnia. “Nocturnal scratching disrupts sleep and sets the stage for cognitive and behavioral factors that reinforce insomnia as a conditioned response.” In other words, even after the “co-concurring condition” resolves insomnia related sleep behaviors continue. The investigators point to a study supporting this explanation which found that, even after a child’s skin cleared, his/her sleep arousals failed to return to normal suggesting that learned behavior patterns might be playing a role.
It may be a stretch to suggest that poor sleep hygiene might in and of itself cause atopic dermatitis, but it can’t be ruled out. At a minimum the current research suggests that there is a bidirectional relationship between sleep disturbances and atopic dermatitis.
Next Steps
The authors of this study urge that we be more creative in using already-existing portable and relatively low-cost sleep monitoring technology to better define this relationship. While that is a worthwhile avenue for research, I think we who see children (both primary care providers and dermatologists) now have enough evidence to move managing the sleep hygiene of our atopic dermatitis patients to the front burner, along with moisturizers and topical medications, without needing to do costly and time-consuming studies.
This means taking a thorough sleep history. If, in the rare cases where the child’s sleep habits are normal, the parents should be warned that falling off the sleep wagon is likely to exacerbate the child’s skin. If the history reveals an inefficient and dysfunctional bedtime routine or other symptoms of insomnia, advise the parents on how it can be improved. Then follow up at each visit if there has been no improvement. Sleep management can be time-consuming as well but it should be part of every primary care pediatrician’s toolbox. For the dermatologist who doesn’t feel comfortable managing sleep problems, a consultation with a pediatrician or a sleep specialist is in order.
The adult with atopic dermatitis is a somewhat different animal and a formal sleep study may be indicated. Cognitive-behavioral therapy might be helpful for adult population but the investigators could find no trials of its use in patients with atopic dermatitis.
Convincing the parents of an atopic dermatitis patient that their family’s disturbed sleep may not only be the result of his/her itchy skin but may be a preexisting compounding problem may not be an easy sell. I hope if you can be open to the strong possibility that disordered sleep is not just the effect but in some ways may be a likely contributor to your patients’ atopic dermatitis, you may become more effective in managing the disease.
Dr. Wilkoff practiced primary care pediatrics in Brunswick, Maine, for nearly 40 years. He has authored several books on behavioral pediatrics, including “How to Say No to Your Toddler.” Other than a Littman stethoscope he accepted as a first-year medical student in 1966, Dr. Wilkoff reports having nothing to disclose. Email him at [email protected].
Recently one of my keep-up-to-date apps alerted me to a study in Pediatric Dermatology on sleep and atopic dermatitis. When I chased down the abstract it was a shoulder-shrugging-so-what encounter. The authors reported that having a child with atopic dermatitis decreased the odds of a parent getting 7 hours of sleep a night and increased the odds that the parent was also taking sleep-aiding medications. The authors felt their data was meaningful enough to publish based on the size and the cross-sectional nature of their sample. However, anyone who has worked with families with atopic dermatitis shouldn’t be surprised at their findings.
Curious about what other investigators had discovered about the anecdotally obvious relationship between sleep and atopic dermatitis, I dug until I found a rather thorough discussion of the literature published in The Journal of Clinical Immunology Practice. These authors from the University of Rochester Medical School in New York begin by pointing out that, although 47%-80% of children with atopic dermatitis and 33%-90% of adults with atopic dermatitis have disturbed sleep, “literature on this topic remains sparse with most studies evaluating sleep as a secondary outcome using subjective measures.” They further note that sleep is one of the three most problematic symptoms for children with atopic dermatitis and their families.
Characterizing the Sleep Loss
Difficulty falling asleep, frequent and long waking, and excessive daytime sleepiness are the most common symptoms reported. In the few sleep laboratory studies that have been done there has been no significant decrease in sleep duration, which is a bit of a surprise. However, as expected, sleep-onset latency, more wake time after sleep onset, sleep fragmentation, and decreased sleep efficiency have been observed in the atopic dermatitis patients. In other studies of younger children, female gender and lower socioeconomic status seem to be associated with poor sleep quality.
Most studies found that in general the prevalence and severity of sleep disturbances increases with the severity of the disease. As the disease flares, increased bedtime resistance, nocturnal wakings and daytime sleepiness become more likely. These parentally reported associations have also been confirmed by sleep laboratory observations.
The sleep disturbances quickly become a family affair with 60% of siblings and parents reporting disturbed sleep. When the child with atopic dermatitis is having a flareup, nearly 90% of their parents report losing up to 2.5 hours of sleep. Not surprisingly sleep disturbances have been associated with behavioral and emotional problems including decreased happiness, poor cognitive performance, hyperactivity, and inattention. Mothers seem to bear the brunt of the problem and interpersonal conflicts and exhaustion are unfortunately not uncommon.
Probing the Causes
So why are atopic dermatitis patients and their families so prone to the ill effects of disturbed sleep? Although you might think it should be obvious, this review of the “sparse” literature doesn’t provide a satisfying answer. However, the authors provide three possible explanations.
The one with the least supporting evidence is circadian variations in the products of inflammation such as cytokines and their effect on melatonin production. The explanation which I think most of us have already considered is that pruritus disrupts sleep. This is the often-quoted itch-scratch feedback cycle which can release inflammatory mediators (“pruritogens”). However, the investigators have found that many studies report “conflicting results or only weak correlations.”
The third alternative posed by the authors is by far the most appealing and hinges on the assumption that, as with many other chronic conditions, atopic dermatitis renders the patient vulnerable to insomnia. “Nocturnal scratching disrupts sleep and sets the stage for cognitive and behavioral factors that reinforce insomnia as a conditioned response.” In other words, even after the “co-concurring condition” resolves insomnia related sleep behaviors continue. The investigators point to a study supporting this explanation which found that, even after a child’s skin cleared, his/her sleep arousals failed to return to normal suggesting that learned behavior patterns might be playing a role.
It may be a stretch to suggest that poor sleep hygiene might in and of itself cause atopic dermatitis, but it can’t be ruled out. At a minimum the current research suggests that there is a bidirectional relationship between sleep disturbances and atopic dermatitis.
Next Steps
The authors of this study urge that we be more creative in using already-existing portable and relatively low-cost sleep monitoring technology to better define this relationship. While that is a worthwhile avenue for research, I think we who see children (both primary care providers and dermatologists) now have enough evidence to move managing the sleep hygiene of our atopic dermatitis patients to the front burner, along with moisturizers and topical medications, without needing to do costly and time-consuming studies.
This means taking a thorough sleep history. If, in the rare cases where the child’s sleep habits are normal, the parents should be warned that falling off the sleep wagon is likely to exacerbate the child’s skin. If the history reveals an inefficient and dysfunctional bedtime routine or other symptoms of insomnia, advise the parents on how it can be improved. Then follow up at each visit if there has been no improvement. Sleep management can be time-consuming as well but it should be part of every primary care pediatrician’s toolbox. For the dermatologist who doesn’t feel comfortable managing sleep problems, a consultation with a pediatrician or a sleep specialist is in order.
The adult with atopic dermatitis is a somewhat different animal and a formal sleep study may be indicated. Cognitive-behavioral therapy might be helpful for adult population but the investigators could find no trials of its use in patients with atopic dermatitis.
Convincing the parents of an atopic dermatitis patient that their family’s disturbed sleep may not only be the result of his/her itchy skin but may be a preexisting compounding problem may not be an easy sell. I hope if you can be open to the strong possibility that disordered sleep is not just the effect but in some ways may be a likely contributor to your patients’ atopic dermatitis, you may become more effective in managing the disease.
Dr. Wilkoff practiced primary care pediatrics in Brunswick, Maine, for nearly 40 years. He has authored several books on behavioral pediatrics, including “How to Say No to Your Toddler.” Other than a Littman stethoscope he accepted as a first-year medical student in 1966, Dr. Wilkoff reports having nothing to disclose. Email him at [email protected].
Most Kids With COVID-Linked MIS-C Recover by 6 Months
Children who were severely ill with multisystem inflammatory syndrome in children (MIS-C) related to COVID-19 infection appear to show excellent cardiovascular and noncardiovascular outcomes by 6 months, according to data published in JAMA Pediatrics.
MIS-C is a life-threatening complication of COVID-19 infection and data on outcomes are limited, wrote the authors, led by Dongngan T. Truong, MD, MSSI, with Children’s Healthcare of Atlanta Cardiology, Emory University School of Medicine in Atlanta, Georgia. These 6-month results are from the Long-Term Outcomes After the Multisystem Inflammatory Syndrome in Children (MUSIC) study, sponsored by the National Heart, Lung, and Blood Institute.
Researchers found in this cohort study of 1204 participants that by 6 months after hospital discharge, 99% had normalization of left ventricular systolic function, and 92.3% had normalized coronary artery dimensions. More than 95% reported being more than 90% back to baseline health.
Patient-Reported Outcomes Measurement Information Systems (PROMIS) Global Health scores were at least equivalent to prepandemic population normative values. PROMIS Global Health parent/guardian proxy median T scores for fatigue, global health, and pain interference improved significantly from 2 weeks to 6 months: fatigue, 56.1 vs 48.9; global health, 48.8 vs 51.3; pain interference, 53.0 vs 43.3 (P < .001).
The most common symptoms reported at 2 weeks were fatigue (15.9%) and low stamina/energy (9.2%); both decreased to 3.4% and 3.3%, respectively, by 6 months. The most common cardiovascular symptom at 2 weeks was palpitations (1.5%), which decreased to 0.6%.
Chest Pain Increased Over Time
Reports of chest pain, however, reportedly increased over time, with 1.3% reporting chest pain at rest at 2 weeks and 2.2% at 6 months. Although gastrointestinal symptoms were common during the acute MIS-C, only 5.3% of respondents reported those symptoms at 2 weeks.
Children in the cohort had a median age of 9 years, and 60% were men. They self-identified with the following races and ethnicities: American Indian or Alaska Native (0.1%), Asian (3.3%), Black (27.0%), Hawaiian Native or Other Pacific Islander (0.2%), Hispanic or Latino (26.9%), multiracial (2.7%), White (31.2%), other (1.0%), and unknown or refused to specify (7.6%). Authors wrote that the cohort was followed-up to 2 years after illness onset and long-term results are not yet known.
Time to Exhale
David J. Goldberg, MD, with the Cardiac Center, Children’s Hospital of Philadelphia, Pennsylvania, and colleagues, wrote in an accompanying editorial that “the decreased frequency of the disease along (with) the reassuring reports on midterm outcomes can allow the pediatric community a moment of collective exhale.”
The editorialists note that of those who initially presented with myocardial dysfunction, all but one patient evaluated had a normal ejection fraction at follow-up. Energy, sleep, appetite, cognition, and mood also normalized by midterm.
“The results of the MUSIC study add to the emerging midterm outcomes data suggesting a near-complete cardiovascular recovery in the overwhelming majority of patients who develop MIS-C,” Goldberg and colleagues wrote. “Despite initial concerns, driven by the severity of acute presentation at diagnosis and longer-term questions that remain (for example, does coronary microvascular dysfunction persist even after normalization of coronary artery z score?), these data suggest an encouraging outlook for the long-term health of affected children.”
The Centers for Disease Control and Prevention and other agencies have reported a declining overall incidence of MIS-C and highlighted the protective value of vaccination.
The editorialists add, however, that while the drop in MIS-C cases is encouraging, cases are still reported, especially amid high viral activity periods, “and nearly half of affected children continue to require intensive care in the acute phase of illness.”
Truong reported grants from the National Institutes of Health and serving as coprincipal investigator for Pfizer for research on COVID-19 vaccine-associated myocarditis funded by Pfizer and occurring through the framework of the National Heart, Lung, and Blood Institute’s Pediatric Heart Network outside the submitted work. One coauthor reported grants from Pfizer and Boston Scientific outside the submitted work. One coauthor reported receiving grants from Additional Ventures Foundation outside the submitted work. One coauthor reported receiving consultant fees from Amryt Pharma, Chiesi, Esperion, and Ultragenyx outside the submitted work. A coauthor reported receiving consultant fees from Larimar Therapeutics for mitochondrial therapies outside the submitted work. One coauthor reported being an employee of Takeda Pharmaceuticals since July 2023. One editorialist reported grants from Childhood Arthritis and Rheumatology Research Alliance and the Arthritis Foundation, Academy Health, and the Gordon and Betty Moore Foundation during the conduct of the study.
A version of this article first appeared on Medscape.com.
FROM JAMA PEDIATRICS