User login
End of '08 Drug Update
The FDA has approved the first nucleic acid HBV viral DNA test for measuring HBV viral load from a patient’s blood. Via HBV viral load assessment, healthcare professionals now have a highly sensitive method for gauging antiviral therapy progress in patients with chronic HBV infections.
The test is known as the COBAS TaqMan HBV Test (Roche Diagnostic Division). It is used to measure HBV levels before beginning treatment, and then follow-up levels during treatment to assess therapy response. It is estimated that approximately 1.25 million people in the U.S. are infected with HBV, with approximately 60,000 becoming infected each year. About 5,000 people die from HBV-related complications each year.8
New Warnings
In October 2007, the Federal Drug and Food Administration (FDA) issued information for healthcare professionals regarding the subcutaneous use of exenatide (Byetta, Amylin Pharmaceuti-cals).9 Since then, the FDA has received at least six additional case reports of necrotizing or pancreatitis in patients taking exenatide.
Of these six cases, all patients needed hospitalization, two patients died, and four were recovering at the time of the reporting. Exenatide was discontinued in all of these patients.
If pancreatitis is suspected, exenatide and other potentially suspect drugs should be discontinued. There are no signs or symptoms distinguishing acute hemorrhagic or necrotizing pancreatitis associated with exenatide from less severe forms of pancreatitis. If pancreatitis is confirmed, appropriate treatment should be initiated and patients should be carefully monitored until they fully recover. Exenatide should not be restarted. The FDA is working with Amylin Pharmaceuticals to add stronger and more prominent warnings to the product label regarding the noted risks.
Since the last warning of natalizumab injection (Tysabri, Biogen IDEC), the FDA has informed healthcare professionals of two new cases of progressive multifocal leukoencephalopathy (PML) in European patients receiving it for more than a year as monotherapy for multiple sclerosis (MS).10
The agent currently is FDA approved to treat multiple sclerosis and Crohn’s disease. Approximately 39,000 patients have received treatment worldwide, with approximately 12,000 patients receiving treatment for at least a year. No new cases have been reported in the U.S., where approximately 7,500 patients have received the drug for more than a year and approximately 3,300 have received the drug for more than 18 months.
The FDA still believes natalizumab monotherapy may confer a lower risk of PML than usage with other immunomodulatory medications. Prescribing information for natalizumab has been revised to reflect this new information. TH
Michele B. Kaufman, PharmD, BSc, RPh, is a registered pharmacist based in New York City.
References:
1. Peck P. IV calcium channel blocker wins FDA okay. www.medpagetoday.com/ProductAlert/Prescriptions/10431. Published August 5, 2008. Accessed October 28, 2008.
2. Riley K. www.fda.gov. FDA approves first bone marrow stimulator to treat immune-related low platelet counts. www.fda.gov/bbs/topics/NEWS/2008/NEW01876.html Published August 22, 2008. Accessed October 28, 2008.
4. Waknine Y. www.fda.org. FDA approvals: stavzor, cardene IV, eovist. www.medscape.com/viewarticle/ 579068. Published August 14, 2008. Accessed October 28, 2008.
5. Eisai Pharmaceutical Company. www.eisai.com. FDA approves ALOXI® (palonosetron HCl) capsules for prevention of acute chemotherapy-induced nausea and vomiting. www.eisai.com/view_press_ release.asp? ID=147&press=195. Published August 23, 2008. Accessed October 28, 2008.
6. Monthly Prescribing Reference. www. prescribingreference.com. FDA approves viread for hepatitis B. www. prescribingreference.com/news/showNews/ which/FDAApprovesVireadForHepatitisB8123/. Published August 12, 2008. Accessed October 28, 2008.
7. Nainggolan L. theheart.org. First ARB/CCB combo approved for initial therapy. www.theheart.org/ article/886011.do. Published August 5, 2008. Accessed October 28. 2008.
8. Long P. U.S. Food & Drug Administration. www.fda.org. FDA approves DNA test to measure hepatitis B virus levels. www.fda.gov/bbs/topics/ NEWS/2008/NEW01880.html. Published September 4, 2008. Accessed October 28, 2008.
9. U.S. Food & Drug Administration. www.fda.org. 2007 safety alerts for human medical products—Byetta (exenatide). www.fda.gov/medwatch/safety/2007 /safety07.htm#Byetta. Published August 18, 2008. Accessed October 28, 2008.
10. U.S. Food & Drug Administration. www.fda.org. 2008 safety alerts for human medical products–Tysabri (natalizumab). www.fda.gov/medwatch/ safety/2008/safety08.htm#Tysabri2. Published August 25, 2008. Accessed October 28, 2008.
Back to Basics
Most primary care physicians will tell you it’s getting harder to maintain a traditional medical practice with a foot in both the outpatient and inpatient realms. Caseload demands, inadequate reimbursement, and other professional and medical pressures are forcing primary care physicians to choose one setting or the other.
For those interested in exploring the field of hospital medicine, a unique, three-day, hands-on training course at the University of California-San Francisco (UCSF) Medical Center offered an opportunity to address some of the gaps in their inpatient clinical knowledge and skills, which either were not sufficiently covered in residency training or have atrophied from lack of practice.
The hospitalist “mini-college” allowed working hospitalists and prospective hospitalists to practice short neurological exams on real patients, use ultrasound to guide needle placements, interpret radiologic evidence, engage in diagnostic reasoning exercises, and even conduct online medical information searches, all under the watchful eyes of UCSF faculty. The course was limited to 27 participants to maximize small group interactions. It emphasized clinical practice needs identified in surveys of hospitalists and assessments by the faculty, led by Robert M. Wachter, MD, professor and chief of the division of hospital medicine at UCSF, a former SHM president, and author of the blog “Wachter’s World” (www.wachtersworld.com).
Participants in this intensive course were a mix of working hospitalists in stable positions seeking to enhance their clinical practice, and physicians in various stages of transition—in or out of hospitalist positions. More than half of the participants are in their first hospitalist job and have worked in the field for less than two years, according to attendee surveys. Two-thirds say they are pretty satisfied and 24% say they are very satisfied with their work, according to the survey. Most say they love the clinical aspects best, but others express frustrations with caseload pressures and ownership changes at their practices.
“For me, being a doctor always meant being a primary care doctor, and I find great joy working in both the inpatient and outpatient settings. But primary care is becoming a losing proposition,” says Ronald Distajo, MD, who has maintained a primary clinic practice for Cambridge Health Alliance in Cambridge, Mass., for the past three years—all the while moonlighting as a hospitalist for the health system.
With student loans, long hours, and relatively low pay in the outpatient setting, Dr. Distajo plans to find full-time work as a hospitalist. At the mini-college, he received a phone call informing him the outpatient clinic he practices in will close by the end of the year. The UCSF course seemed like a timely opportunity to bolster his inpatient management skills in areas he believes he could benefit from a refresher. “They’ve done a good job of picking all of them,” Dr. Distajo says.
Another mini-college participant in transition, Madeleine Martindale, MD, was looking to hear what “hospitalists in other places are doing, to confirm and validate my own experience.” Dr. Martindale recently left a hospitalist position in Anchorage, Alaska, in part because of high caseloads. “A lot of the topics presented here will help me. I also wanted to learn more about the range of responsibilities expected in hospital medicine.”
With few work settings for hospitalists in Alaska, Dr. Martindale is planning to become a traveling hospitalist in the lower 48 states next year. She is hoping to devote part of the year to practicing medicine in a high-altitude clinic, as she prepares to staff a clinic in Nepal operated by the Himalayan Rescue Association. She also plans to serve as the support physician—stationed mainly at base camp—for a two-month Mount Everest climb. “There are a lot of hospitalist services and places to practice, if I’m willing to leave Alaska,” she says. “I feel inspired to hear hospitalists who love their jobs and are interested in quality of care and safety.”
Student and Staff Member

Mini-college participants were issued temporary visitor privileges at UCSF, name badges and lab coats. “So much of our planning for this experience was about getting [participants] into the hospital, and to offer [them] a set of knowledge and skills that may be new or taught in a new way, which [they] can apply in [their own] hospitals,” says Arpana R. Vidyarthi, MD, a hospitalist at UCSF and mini-college co-chair.
The first session, hosted by Gurpreet Dhaliwal, MD, assistant professor of medicine, nocturnist, and recipient of a distinguished teaching award at UCSF, led participants through an exercise in clinical reasoning, using a challenging case to exercise diagnostic skills. “When you leave medical training, the assumption is that you’re done, and you will get better and better on the job somehow through experience,” Dr. Dhaliwal explained. However, there is little in the literature addressing how doctors actually get better and what separates those who continue to improve from those who plateau in their careers. “What are the things doctors do to put themselves in the upper 10% of diagnosticians? We know from other fields that innate smartness rarely counts the most, and that expertise is not something that necessarily comes with experience.”
Dr. Dhaliwal recommends a program of “progressive reinvestment” in diagnostics—a deliberate practice of challenging mental processes and learning something new from every case. He also suggests regularly seeking feedback from peers, tracking down what happened to patients treated and whether the discharge diagnosis matched the hospitalist’s initial assessment, and even practicing diagnostic skills with sample cases like the New England Journal of Medicine’s “Case Records of the Massachusetts General Hospital.”
Participants broke into small groups to visit hospital wards with UCSF neurologists and intensivists, discuss actual cases and practice their examination skills at the bedside. H. Quinny Cheng, MD, a hospitalist and director of the UCSF’s medical consultation and neurosurgery co-management services, walked them through current research and controversies in the pre-operative evaluation and management of surgical patients, including recent data on the use of anti-coagulants, beta blockers, deep vein thrombosis prophylaxis, and drug-eluting coronary artery stents. UCSF respiratory therapist Brian Daniel, RRT, reviewed recent advances in ventilator equipment, including the high-flow nasal cannula.
S. Andrew Josephson, MD, a neurologist and director of the neuro-hospitalist program at UCSF, says hospitalists generally do not have time for full neurological workups on their patients. He suggests high-yield results can be derived from quick assessments of patients’ language, gait, and visual fields.

“I thought the neurology session was fantastic,” says participant Marcus Zachary, MD, group leader for Cogent Healthcare of California at St. Francis Memorial Hospital in San Francisco. “I know across the country hospitalists are being asked to bear a heavy load in this area, and we’re not really prepared. Neurologists don’t want to come into the hospital, and hospitalists increasingly are plugging the gap.”
Dr. Wachter convened a Department of Hospital Medicine case conference discussion of a real patient. He also led a simulated root cause analysis discussion of an actual medical error, which occurred at UCSF when the wrong patient was given an unnecessary cardiovascular physiology procedure scheduled for a different patient with a similar sounding name. Organized discussion of medical errors, led by UCSF hospitalists, take place weekly at the medical center.
In a hands-on procedure workshop in the library, Diane Sliwka, MD, who developed the hospitalist procedure service at UCSF, introduced the clinical benefits of using ultrasound diagnostic imaging to guide routine central line placements, paracentesis, and thoracentesis in hospitalized patients. She reviewed the basics of frequency, contrast, and sterile technique with ultrasound, and the visual and spatial orientation necessary to interpret the image on the screen. Participants used the equipment to locate pockets of ascites in the abdomen of a UCSF patient and frequent training volunteer known to have pleural effusions. Participants also practiced needle insertion technique with actual hospital equipment on prepared chicken carcasses.
“Ultrasound does enhance the safety of bedside procedures. Ultrasound basics are learnable with practice and give a new dimension of ‘sight’ to common bedside procedures,” Dr. Sliwka explained to the participants, 70% of whom had not used ultrasound for bedside procedures. “Where it’s available, you can learn to do it with a bit of practice.”
Attendee Moira Ogden, MD, hospitalist at Terrebonne General Medical Center in Houma, La., is interested in bringing ultrasound-guided procedures into her practice, although she fears access to the equipment may not be easy to obtain. “I want to start using them; I just need to know the cost,” she says.
Mini-college Motives
“We’ve been at it for a year with our new hospitalist program,” Dr. Ogden said. “There’s such a difference between academic medicine and practice in the community. In my hospital, it’s very busy, although we’ve really just scratched the surface. It’s hard to keep up with the literature, and when I saw the flyer for this course, it looked so in-depth—almost like a re-introduction to hospital medicine.”
“Part of it was just plain curiosity—what is this going to be about? What do they see as blind spots for hospitalists in their day-to-day jobs?” asks Dr. Zachary, a six-year hospitalist, discussing his interest in attending the UCSF mini-college. “For the most part, my sense of the gaps has been dead-on.”
San Francisco Souvenirs
Participants in the UCSF mini-college received hands-on training and nuggets of new information. Here are some snippets of what they took home from the three-day course:
The clinical reasoning session with Dr. Dhaliwal was exceptional and very unique. To spend time with someone like that makes for a special experience. The preoperative evaluation review of where the evidence stands with practice management decisions we often see in the hospital was also helpful. From a career standpoint, the knowledge covered here is very applicable and very high yield.
—Kevin Leary, MD, internal medicine faculty, Walter Reed Army Medical Center, Washington, D.C.

The hands-on experience. Best was the neurology—how you do a quick neurologic exam on a hospitalized patient? The procedures workshop was also invaluable. Vascular access is the procedure I do most often, and if my hospital provides the ultrasound monitor, I’ll start using it. … I thought this course would be a great refresher for me, four years out of residency. It was not only a refresher, it’s an inspiration. We all want to be the best at what we do.
—Leslie Copeland, MD, hospitalist, St. Tammany Parish Hospital, Covington, La.
I thought the ultrasound laboratory was a lot of fun, which I’ll bring back to my institution. I’m sort of old school in how I place my lines, but we do have two ultrasound machines in the hospital, one on the units and one in the emergency department where they’re most likely to be used. It takes a little more preparation and time to use ultrasound, but it clearly benefits the patient.
— Marcus Zachary, MD, group leader, Cogent Healthcare of California, St. Francis Memorial Hospital, San Francisco

What I liked best were the small sessions. They were really informative. Also, the pearls, such as neurological physical exams that don’t take 30 minutes, and the signs of upper motor neuron disease. We often get calls from the emergency department for patients who are reporting weakness, asking if they should be admitted. You are trained to deal with that, but this was about how to do it in the real world.
—Reina Rodriguez, MD, hospitalist, Summit Medical Center, Oakland, Calif.

At my hospital, we don’t have intensivists. So there’s not a lot of structure for critical care. I was interested in seeing the studies about sepsis and the emphasis on washing teeth twice a day in the ICU. I was also interested in the discussion about how not to just plateau in your career. I’ve never been average my whole life. I don’t want to be an average physician, and that’s why I came to this course.
—Moira Ogden, MD, hospitalist, Terrebonne General Medical Center, Houma, La.
Kevin Leary, MD, internal medicine faculty at Walter Reed Army Medical Center in Washington, D.C., is not a hospitalist, although his position with the teaching service is similar in many ways. “My goal in coming here is to learn more about the field of hospital medicine and to meet physicians who are hospitalists,” Dr. Leary explains. “When I leave my role in the military service, I would get a lot of job satisfaction out of becoming a hospitalist.”

Charles Oppong, MD, a native of Ghana who now lives in Los Angeles with his wife and infant daughter, is waiting for his application for a California medical license to be processed and currently works part-time as a hospitalist in Circleville, Ohio, and in LaCrosse, Wis. “Personally, I enjoy caring for patients in the inpatient setting. I like the challenges of keeping my medical skills current,” he says. “I heard about UCSF and its famous hospitalist program, and when they sent me a flyer, I saw all of these topics to improve my inpatient management skills.”
Organizers of the mini-college are attempting to give participants an opportunity to re-experience “what it was like in residency to participate in rounds with a truly spectacular teacher. With the teaching resources we have here at UCSF, we have the capacity to offer that kind of experience,” Dr. Wachter says.
“Those of us who stay in academic settings are constantly jazzed by our interactions with young people, who tend to ask a lot of questions,” he adds. “For many other hospitalists, they don’t have much opportunity to step back and recapture what brought them to the field in the first place. That’s what I hoped to capture with the mini-college. If we can do that, then we’ve succeeded.” TH
Larry Beresford is a medical writer based in Oakland, Calif.
Most primary care physicians will tell you it’s getting harder to maintain a traditional medical practice with a foot in both the outpatient and inpatient realms. Caseload demands, inadequate reimbursement, and other professional and medical pressures are forcing primary care physicians to choose one setting or the other.
For those interested in exploring the field of hospital medicine, a unique, three-day, hands-on training course at the University of California-San Francisco (UCSF) Medical Center offered an opportunity to address some of the gaps in their inpatient clinical knowledge and skills, which either were not sufficiently covered in residency training or have atrophied from lack of practice.
The hospitalist “mini-college” allowed working hospitalists and prospective hospitalists to practice short neurological exams on real patients, use ultrasound to guide needle placements, interpret radiologic evidence, engage in diagnostic reasoning exercises, and even conduct online medical information searches, all under the watchful eyes of UCSF faculty. The course was limited to 27 participants to maximize small group interactions. It emphasized clinical practice needs identified in surveys of hospitalists and assessments by the faculty, led by Robert M. Wachter, MD, professor and chief of the division of hospital medicine at UCSF, a former SHM president, and author of the blog “Wachter’s World” (www.wachtersworld.com).
Participants in this intensive course were a mix of working hospitalists in stable positions seeking to enhance their clinical practice, and physicians in various stages of transition—in or out of hospitalist positions. More than half of the participants are in their first hospitalist job and have worked in the field for less than two years, according to attendee surveys. Two-thirds say they are pretty satisfied and 24% say they are very satisfied with their work, according to the survey. Most say they love the clinical aspects best, but others express frustrations with caseload pressures and ownership changes at their practices.
“For me, being a doctor always meant being a primary care doctor, and I find great joy working in both the inpatient and outpatient settings. But primary care is becoming a losing proposition,” says Ronald Distajo, MD, who has maintained a primary clinic practice for Cambridge Health Alliance in Cambridge, Mass., for the past three years—all the while moonlighting as a hospitalist for the health system.
With student loans, long hours, and relatively low pay in the outpatient setting, Dr. Distajo plans to find full-time work as a hospitalist. At the mini-college, he received a phone call informing him the outpatient clinic he practices in will close by the end of the year. The UCSF course seemed like a timely opportunity to bolster his inpatient management skills in areas he believes he could benefit from a refresher. “They’ve done a good job of picking all of them,” Dr. Distajo says.
Another mini-college participant in transition, Madeleine Martindale, MD, was looking to hear what “hospitalists in other places are doing, to confirm and validate my own experience.” Dr. Martindale recently left a hospitalist position in Anchorage, Alaska, in part because of high caseloads. “A lot of the topics presented here will help me. I also wanted to learn more about the range of responsibilities expected in hospital medicine.”
With few work settings for hospitalists in Alaska, Dr. Martindale is planning to become a traveling hospitalist in the lower 48 states next year. She is hoping to devote part of the year to practicing medicine in a high-altitude clinic, as she prepares to staff a clinic in Nepal operated by the Himalayan Rescue Association. She also plans to serve as the support physician—stationed mainly at base camp—for a two-month Mount Everest climb. “There are a lot of hospitalist services and places to practice, if I’m willing to leave Alaska,” she says. “I feel inspired to hear hospitalists who love their jobs and are interested in quality of care and safety.”
Student and Staff Member
Mini-college participants were issued temporary visitor privileges at UCSF, name badges and lab coats. “So much of our planning for this experience was about getting [participants] into the hospital, and to offer [them] a set of knowledge and skills that may be new or taught in a new way, which [they] can apply in [their own] hospitals,” says Arpana R. Vidyarthi, MD, a hospitalist at UCSF and mini-college co-chair.
The first session, hosted by Gurpreet Dhaliwal, MD, assistant professor of medicine, nocturnist, and recipient of a distinguished teaching award at UCSF, led participants through an exercise in clinical reasoning, using a challenging case to exercise diagnostic skills. “When you leave medical training, the assumption is that you’re done, and you will get better and better on the job somehow through experience,” Dr. Dhaliwal explained. However, there is little in the literature addressing how doctors actually get better and what separates those who continue to improve from those who plateau in their careers. “What are the things doctors do to put themselves in the upper 10% of diagnosticians? We know from other fields that innate smartness rarely counts the most, and that expertise is not something that necessarily comes with experience.”
Dr. Dhaliwal recommends a program of “progressive reinvestment” in diagnostics—a deliberate practice of challenging mental processes and learning something new from every case. He also suggests regularly seeking feedback from peers, tracking down what happened to patients treated and whether the discharge diagnosis matched the hospitalist’s initial assessment, and even practicing diagnostic skills with sample cases like the New England Journal of Medicine’s “Case Records of the Massachusetts General Hospital.”
Participants broke into small groups to visit hospital wards with UCSF neurologists and intensivists, discuss actual cases and practice their examination skills at the bedside. H. Quinny Cheng, MD, a hospitalist and director of the UCSF’s medical consultation and neurosurgery co-management services, walked them through current research and controversies in the pre-operative evaluation and management of surgical patients, including recent data on the use of anti-coagulants, beta blockers, deep vein thrombosis prophylaxis, and drug-eluting coronary artery stents. UCSF respiratory therapist Brian Daniel, RRT, reviewed recent advances in ventilator equipment, including the high-flow nasal cannula.
S. Andrew Josephson, MD, a neurologist and director of the neuro-hospitalist program at UCSF, says hospitalists generally do not have time for full neurological workups on their patients. He suggests high-yield results can be derived from quick assessments of patients’ language, gait, and visual fields.
“I thought the neurology session was fantastic,” says participant Marcus Zachary, MD, group leader for Cogent Healthcare of California at St. Francis Memorial Hospital in San Francisco. “I know across the country hospitalists are being asked to bear a heavy load in this area, and we’re not really prepared. Neurologists don’t want to come into the hospital, and hospitalists increasingly are plugging the gap.”
Dr. Wachter convened a Department of Hospital Medicine case conference discussion of a real patient. He also led a simulated root cause analysis discussion of an actual medical error, which occurred at UCSF when the wrong patient was given an unnecessary cardiovascular physiology procedure scheduled for a different patient with a similar sounding name. Organized discussion of medical errors, led by UCSF hospitalists, take place weekly at the medical center.
In a hands-on procedure workshop in the library, Diane Sliwka, MD, who developed the hospitalist procedure service at UCSF, introduced the clinical benefits of using ultrasound diagnostic imaging to guide routine central line placements, paracentesis, and thoracentesis in hospitalized patients. She reviewed the basics of frequency, contrast, and sterile technique with ultrasound, and the visual and spatial orientation necessary to interpret the image on the screen. Participants used the equipment to locate pockets of ascites in the abdomen of a UCSF patient and frequent training volunteer known to have pleural effusions. Participants also practiced needle insertion technique with actual hospital equipment on prepared chicken carcasses.
“Ultrasound does enhance the safety of bedside procedures. Ultrasound basics are learnable with practice and give a new dimension of ‘sight’ to common bedside procedures,” Dr. Sliwka explained to the participants, 70% of whom had not used ultrasound for bedside procedures. “Where it’s available, you can learn to do it with a bit of practice.”
Attendee Moira Ogden, MD, hospitalist at Terrebonne General Medical Center in Houma, La., is interested in bringing ultrasound-guided procedures into her practice, although she fears access to the equipment may not be easy to obtain. “I want to start using them; I just need to know the cost,” she says.
Mini-college Motives
“We’ve been at it for a year with our new hospitalist program,” Dr. Ogden said. “There’s such a difference between academic medicine and practice in the community. In my hospital, it’s very busy, although we’ve really just scratched the surface. It’s hard to keep up with the literature, and when I saw the flyer for this course, it looked so in-depth—almost like a re-introduction to hospital medicine.”
“Part of it was just plain curiosity—what is this going to be about? What do they see as blind spots for hospitalists in their day-to-day jobs?” asks Dr. Zachary, a six-year hospitalist, discussing his interest in attending the UCSF mini-college. “For the most part, my sense of the gaps has been dead-on.”
San Francisco Souvenirs
Participants in the UCSF mini-college received hands-on training and nuggets of new information. Here are some snippets of what they took home from the three-day course:
The clinical reasoning session with Dr. Dhaliwal was exceptional and very unique. To spend time with someone like that makes for a special experience. The preoperative evaluation review of where the evidence stands with practice management decisions we often see in the hospital was also helpful. From a career standpoint, the knowledge covered here is very applicable and very high yield.
—Kevin Leary, MD, internal medicine faculty, Walter Reed Army Medical Center, Washington, D.C.
The hands-on experience. Best was the neurology—how you do a quick neurologic exam on a hospitalized patient? The procedures workshop was also invaluable. Vascular access is the procedure I do most often, and if my hospital provides the ultrasound monitor, I’ll start using it. … I thought this course would be a great refresher for me, four years out of residency. It was not only a refresher, it’s an inspiration. We all want to be the best at what we do.
—Leslie Copeland, MD, hospitalist, St. Tammany Parish Hospital, Covington, La.
I thought the ultrasound laboratory was a lot of fun, which I’ll bring back to my institution. I’m sort of old school in how I place my lines, but we do have two ultrasound machines in the hospital, one on the units and one in the emergency department where they’re most likely to be used. It takes a little more preparation and time to use ultrasound, but it clearly benefits the patient.
— Marcus Zachary, MD, group leader, Cogent Healthcare of California, St. Francis Memorial Hospital, San Francisco
What I liked best were the small sessions. They were really informative. Also, the pearls, such as neurological physical exams that don’t take 30 minutes, and the signs of upper motor neuron disease. We often get calls from the emergency department for patients who are reporting weakness, asking if they should be admitted. You are trained to deal with that, but this was about how to do it in the real world.
—Reina Rodriguez, MD, hospitalist, Summit Medical Center, Oakland, Calif.
At my hospital, we don’t have intensivists. So there’s not a lot of structure for critical care. I was interested in seeing the studies about sepsis and the emphasis on washing teeth twice a day in the ICU. I was also interested in the discussion about how not to just plateau in your career. I’ve never been average my whole life. I don’t want to be an average physician, and that’s why I came to this course.
—Moira Ogden, MD, hospitalist, Terrebonne General Medical Center, Houma, La.
Kevin Leary, MD, internal medicine faculty at Walter Reed Army Medical Center in Washington, D.C., is not a hospitalist, although his position with the teaching service is similar in many ways. “My goal in coming here is to learn more about the field of hospital medicine and to meet physicians who are hospitalists,” Dr. Leary explains. “When I leave my role in the military service, I would get a lot of job satisfaction out of becoming a hospitalist.”
Charles Oppong, MD, a native of Ghana who now lives in Los Angeles with his wife and infant daughter, is waiting for his application for a California medical license to be processed and currently works part-time as a hospitalist in Circleville, Ohio, and in LaCrosse, Wis. “Personally, I enjoy caring for patients in the inpatient setting. I like the challenges of keeping my medical skills current,” he says. “I heard about UCSF and its famous hospitalist program, and when they sent me a flyer, I saw all of these topics to improve my inpatient management skills.”
Organizers of the mini-college are attempting to give participants an opportunity to re-experience “what it was like in residency to participate in rounds with a truly spectacular teacher. With the teaching resources we have here at UCSF, we have the capacity to offer that kind of experience,” Dr. Wachter says.
“Those of us who stay in academic settings are constantly jazzed by our interactions with young people, who tend to ask a lot of questions,” he adds. “For many other hospitalists, they don’t have much opportunity to step back and recapture what brought them to the field in the first place. That’s what I hoped to capture with the mini-college. If we can do that, then we’ve succeeded.” TH
Larry Beresford is a medical writer based in Oakland, Calif.
Physician Ratings on the Horizon

Physician Ratings on the Horizon
I’ve heard Zagat is going to start rating doctors. Do you think patients are going to choose their doctor just like they choose restaurants?
D. Ricketts, Houston, Texas
Dr. Hospitalist responds: You are correct. The Angie’s List Web site, www.angieslist.com, which is famous for home improvement contractor reviews, is doing the same. Zagat also is planning to review hospitals and other healthcare providers. Rating services are commonplace (e.g., RateMDs.com, Vitals.com and DrScore.com).
Many of us routinely check out a review before buying a camera, a big-screen television or a new automobile. The World Wide Web makes this information readily accessible.
Hospital ratings have been commonplace for years. Who hasn’t heard of the U.S. News and World Report Hospital Rankings? Even Consumer Reports is preparing to launch a new hospital rating service.
Doctors, however, are not accustomed to reading reviews about doctors. I’m sure I would be thrilled to read a fantastic review about myself. The problem lies in the possibility of bad reviews. Rating services tend to attract “very good” or “very bad” comments. Most of the silent majority typically avoids comment.
I also suspect these rating services are less applicable to hospitalists than elective-care physicians, such as dermatologists and plastic surgeons. Most patients with chest pain won’t be going online to check out their hospitalist before they head down to the emergency department. Even if they were going to look up the hospitalist’s Zagat review, what is a layperson going to learn? They might be able to read comments about “bedside manner.”
I don’t want to underestimate the importance of communication, but it is only one part of what makes a good doctor. These rating services won’t be able to provide information about a physician’s diagnostic skills or surgical technique. I think we have a long way to go before consumers will be satisfied with the information they can glean from physician ratings, but don’t for a second think it will dissuade companies from publishing ratings.
Signature Solution
I am the director of a hospitalist group and I have been catching grief from our quality officer because of the poor legibility of our hospitalists’ signatures and their continued use of unapproved abbreviations. I have spoken with our hospitalists repeatedly but with minimal success. Have you found anything that works?
C. Macleod, Simi Valley, Calif.
Dr. Hospitalist responds: All of us have heard the jokes about physicians’ poor handwriting, but as you and your hospital quality officer recognize, illegible handwriting is no laughing matter. Each of us is aware of examples of how illegible handwriting has resulted in medical error. Some abbreviations result in error because of misinterpretation. The Joint Commission has pushed hospitals to eliminate illegible signatures and the use of some abbreviations. This is easier said than done. Changing old habits is difficult, if not impossible.
Undoubtedly, education is important. Providers must understand why poor handwriting and the use of prohibited abbreviations can result in medical error and patient harm. Education is necessary, but rarely is it sufficient. Requiring adults to write legibly is difficult, especially when they are in a hurry. This also is the time they are more likely to make mistakes.
I believe the illegible signature problem and the use of prohibited abbreviations requires a systemic solution. You might contend the poor penmanship issue would go away if hospitals adopted a comprehensive electronic medical record (EMR) system. This might be true, but few hospitals have an entirely electronic process to enter inpatient medical information. An investment in EMR requires a significant capital investment. Also, recognize EMRs are not a panacea. You could be replacing one problem with another because typing notes and orders would require increased physician time and effort, which might not be acceptable. Transcriptionists and voice recognition software are potential alternatives to asking physicians to log inpatient notes and orders. Voice recognition software has come a long way, but additional improvements are necessary for widespread acceptability for this purpose. Use of transcriptionists for dictation of all inpatient notes could be cost prohibitive and an unrealistic workflow option, as transcribed notes might not be available in a timely fashion.
So what is a hospitalist director to do? One possible solution is the use of signature ink stamps–and requiring physicians use them. Universal acceptance is difficult to achieve. Some stamps are messy and physicians tend to lose them. Others give them up the first time their stamp runs out of ink. I don’t view stamps as an acceptable long-term solution.
The most acceptable solution I know of involves the use of pre-printed paper templates. For example, I have more than 30 providers in my hospitalist group. We print each of their names at the bottom of our paper template. There is a checkbox next to each name. A doctor still might scrawl their illegible signature, but as long as they check the box next to their name, we know who filled out the order and this satisfies the Joint Commission’s mandate for legible signatures.
Pre-printed text with elements of the history, review of system, and physical examination on the template not only saves time, but also minimize legibility and prohibited abbreviation issues. Templates allow providers to document the necessary information and minimizing handwriting. Then again, I don’t think we can eliminate handwriting altogether. Consider printing the prohibited abbreviations at the bottom of each page of your template. This will serve as a daily reminder. Also require intermittent updates of these templates to keep up with changing documentation requirements. When the time comes for EMR, change your template into a macro file. Using a template in the EMR will minimize typing and the use of prohibited abbreviations. TH
Technological Advance or Workplace Setback?
Last month I discussed my concern regarding how often hospitalists are interrupted. In fact, I suspect frequent interruptions to our train of thought and workflow might lead to as many problems and errors as the sleep deprivation associated with long on-call shifts.
Every hospitalist group should think carefully about the effect their practice organization has on interruptions. Variables, such as the work schedule, the use of communication tools (or interruption tools) such as pagers, cell phones, and e-mail, and the use of clerical support staff, have an impact on the number of interruptions. This month, I will discuss the use of a “triage pager,” which is one example of practice organization that can have a huge impact on physician interruptions.
Worth the Interruptions?
Many large hospitalist groups have a pager to which all calls about new referrals go, and the pager is passed from one hospitalist to another each day or shift. This pager often is referred to as the “triage” or “hot” pager. It makes it easy for emergency room (ER) doctors and others to know how to reach the correct hospitalist about a new referral–they always call the same number. Typically, the hospitalist holding the pager calls the ER doctor back, learns about the patient, and then pages whichever hospitalist actually will care for the patient. The second hospitalist calls back and learns about the new patient from the “triage” hospitalist.
Although this is a valuable service for ER doctors and others referring patients to the hospitalists, it is terribly disruptive for the hospitalist carrying the pager. The unlucky person is interrupted constantly, and likely will have a very hard time providing patient care. Is there a better way to handle the triage function? Is there an alternative triage method, one that reduces hospitalist interruptions and switch tasking? There are three potential adjustments to the triage system you may want to consider (and remember, this is an issue only for larger groups–say more than 15 or 20 hospitalists).
Clerical Assistance
During business hours, Mondays through Fridays, have incoming referral calls go to a clerical person working for the hospitalists. A call received by this person might go something like:
- Phone rings;
- Clerical staff answers: “Hospitalist referral line;”
- ER doctor (or ER secretary): “I have a patient to be admitted to the hospitalist service;”
- Staff looks at the roster and determines the appropriate hospitalist for the next new patient;
- Staff: “That patient will go to Dr. Lovett. Give me the patient’s name and I’ll page Dr. Lovett, who will call you back to discuss the case in a couple minutes.”
This system preserves the easiest way to call referrals to the hospitalists, but decreases hospitalist interruptions and prevents the daisy chain of communication between the ER doctor, the triage doctor, and, finally, the hospitalist who actually will see the patient. Outside of regular business hours, these calls could go to another clerical person on duty in the hospital, or, perhaps, the ER secretary could field the calls and keep track of which hospitalist is up for referral.
On-Duty Hospitalist
If your group can’t, or doesn’t, want to have such calls funneled through a clerical person, the calls could go to an on-duty hospitalist. Rather than calling the ER to learn the details of a new patient who will be cared for by a different hospitalist, the “triage” hospitalist simply looks at a list to determine which hospitalist is up for the next new referral, then sends a page to the physician to call the ER. The triage doctor is interrupted, but immediately hands off the burden of communicating with the ER doctor to the hospitalist who actually will care for the patient.
A New Position
Or, instead of the two approaches above, you might take a 180-degree approach. You could create a new triage doctor position. This hospitalist would have no other responsibilities. In other words, while on triage, a doctor does not have a list of patients to round on and manage. The triage doctor’s only duty is to maximize ED throughput by quickly providing an opinion about whether a patient is appropriate for admission to the hospitalist service, and to assist moving them out of the ED and to the floor quickly. Eric Howell, MD, director, Zieve Medical Services, Johns Hopkins Bayview Medical Center at Johns Hopkins University in Baltimore has studied this third option, the use of a triage hospitalist who has no other clinical responsibilities, in a teaching hospital setting. Dr. Howell first implemented this as a daytime-only service, however, it proved so invaluable to improving emergency department throughput that it is now in place 24/7. He has published a study of this system and described the evolution in the following post on the SHM list serve:1
“Until 2006, when our gen-med service admission numbers were lower (approximately24 a day), we had the triage hospitalist carry a 50% clinical load, so that they could dedicate 50% time to triage. As our volume increased, and after we expanded the triage service to the ICUs and specialty floors, we dedicated one doc 24-7 (two, 12-hours shifts, actually) to the sole task of triage.
“It initially sounded like a large amount of resources just to triage, but at our 330-bed hospital, it has increased ED capacity substantially. The effect has been not to just increase ED visits and department of medicine admissions, but to increase surgical admissions through the ED, as well. The effect has been to dramatically reduce ambulance diversion. So, now the hospital funds the 24/7 triage position without a second thought.
“We have had enormous success and even expanded the hospitalist triage role to non-hospitalist wards showing dramatic decrease (25%) in ED length of stay. ”
Practical Measures
I’m skeptical a triage pager system, such as Dr. Howell describes above, is a good idea for most hospitalist practices. It is very expensive for a practice to devote physician manpower solely to non-billable services. The payoff, as measured in more productive or less-stressed hospitalists, would not justify the investment. Instead, as Dr. Howell did, you would have to look for a return on the investment outside the hospitalist practice itself, such as improvements in ED throughput.
Remember, Dr. Howell’s study was done in a teaching setting, and I suspect the reason a dedicated triage doctor proved so beneficial was it kept interns from setting up camp in the ED to complete the time-consuming admission process and delaying the patients’ transfer out of the ED. The triage doctor ensures nearly all ED admissions quickly move to the floor where the admitting team will make the time-consuming, initial (admitting) visit. In a non-teaching setting, that process isn’t burdened with trainees who take so long to admit patients, therefore, a dedicated triage hospitalist system probably would not result in such dramatic improvements in ED throughput.
Recommendations
I’ll finish by offering a summary and recommendations, based on my reasonably extensive experience, but almost no research data.
- For practices smaller than 10 hospitalists, the decision to use a triage pager can be based on preference. It won’t have significant impact on interruptions or work flow.
- Larger practices, especially those with more than 20 hospitalists, should first try to use a clerical person to field incoming referral calls during weekday business hours. The clerical employee would then page the hospitalist due to get the next new patient, and that hospitalist would call the referring doctor to learn about the patient directly.
- Large practices in teaching hospitals should think about whether it would be worthwhile to dedicate a hospitalist solely to the task of triage in hopes of reaping benefits elsewhere in the hospital, such as ED throughput. TH
Dr. Nelson has been a practicing hospitalist since 1988 and is co-founder and past president of SHM. He is a principal in Nelson/Flores Associates, a national hospitalist practice management consulting firm. He is part of the faculty for SHM’s “Best Practices in Managing a Hospital Medicine Program” course. This column represents his views and is not intended to reflect an official position of SHM.
Reference
1. Howell EE, Bessman ES, Rubin HR. Hospitalists and an innovative emergency department admission process. J Gen Intern Med. 2004.19(3):266-268.
Lions, Planes, Bears, Oh My

As the trail dips past the creek and the sun crests the sky, something catches the corner of my eye. I immediately sense I am in trouble; this is how my life will end, presaged by the signpost at the trailhead.
I have a friend who is convinced everyone who lives in Colorado will die in a mountain lion attack. If pushed, she may allow a soul or two to be gobbled up by a bear. But the mountain lion—a.k.a. cougar—will get the, well, lion’s share of us. To her, everyone who ventures out into the wild for a hike, mountain bike or snowshoe adventure is just biding time, simmering away in the cougar’s crock, eventual forest filet for our feral friends.
Prior to a hike, I’ll often call up her various bits of wisdom, such as never hike alone, wear a bell, bring a whistle, carry mace (both the atomized spray and the medieval warring device, I presume). All this in the name of preventing or fending off a predator’s attack. This always has struck me as a bit paranoid, especially considering only 20 deaths by mountain lions have been recorded in all of North America since 1890. Still, this friend is unwaveringly convinced mountain lions pose a real threat to life and limb. And for the time being, hiking alone, I can’t help but share her fear.
Just a quick blur; then nothing. Pupils dilating, palms moist, I slowly pivot, centering my peripheral vision on my attacker.
Phobia Management
It always struck me that there are things in life we tend to fear and things we tend to trust, and more often than not we get them confused. To be sure, mountain lion and bear attacks do happen, but are exceedingly uncommon. Ditto plane crashes. While most of us harbor at least a modicum of fear of perishing in a plane crash, it’s nearly impossible to die in such a manner. By one estimate, a modern commercial airline traveler would need to fly continuously for nearly 20,000 years to reach a 50-50 chance of death by plane crash. To put it another way, the chances of dying on your next flight are one in a many million, roughly the same as winning the lottery. People do win the lottery, but you and I probably won’t.
Reaching for my pepper spray, I am struck by the fact I don’t hike with pepper spray. But I am carrying a sizable rock—I picked it up a mile back—and I slowly turn it over in my palm preparing to crush the skull of my ambusher.
Then there are the things we should fear: cars, guns, fishing.
The average U.S. adult has about a one in 6,500 chance of dying in a car accident every year. This means you are infinitely more likely to die on the road than in the air (a one in 430,000 chance of death per annum). Also more likely to do you in are firearms, which are 17 times more likely to kill you than air travel (1 in 25,000). Oddly perilous is fishing. Statistically speaking, there is one death annually for every 1,000 fisherman. Now, growing up in northern Wisconsin I spent the bulk of my formative years in a boat with drunken fishermen. Still, I was surprised to learn fishing is so mortal. However, it turns out commercial—not recreational fishing—is the most dangerous occupation in America.
The White Elephant
Heart in torsades, I tried to recollect whether a lion attack merited I run or remain still-but-menacing. Paralyzed by indecision, I coaxed a scowl across my face, just in case it was the latter.
Then there is the thing we should all truly fear, U.S. healthcare.
As many as one in 200 individuals hospitalized in the U.S. will die from an adverse event during a hospital stay. This doesn’t include the numerous people who come into the hospital with a disease, such as pneumonia, and die of pneumonia. Rather, these are patients who come into the hospital with pneumonia and die from an anaphylactic penicillin reaction, which doctors overlooked on their allergy list or from a pulmonary embolism doctors forgot to prophylax against.
Two landmark patient safety studies, respectively, revealed 2.9% and 3.7% rates of medical error in hospitals. Moreover, in these two studies, 6.6% and 13.6% of the errors led to death, respectively. That means roughly one in 30 patients suffered a medical error with one in 10 of those errors resulting in death. Further math reveals 0.2% to 0.5% of overall hospitalized patients will die from a medical error. In other words, the patient awaiting admission orders in your emergency department right now has a 1 in 200 to 1 in 500 chance of death from an error your hospital or its staff will make. Now that’s something to really fear.
Not all of these deaths are avoidable; however, many of the nearly 100,000 annual deaths from adverse events are preventable. Furthermore, these events represent just the tip of the iceberg. Millions more errors yield mere morbid outcomes, or do not reach the level of harm, but are nonetheless noteworthy. One study found 19% of all medications administered in the hospital are given erroneously. Basically, only 80% of medications are given correctly.
Think of these numbers the next time you fly. What if the pilot’s post-takeoff announcement assured you there was an 80% chance they’d get you to the correct destination, a 96% chance you’d arrive without the pilot making a serious error, and a 99% chance you’d arrive alive. Would you fly?
Unfortunately, our patients don’t have the option to avoid our hospitals.
Resolved to fight to the death, my assassin slowly came into view. Shrouded in cover, the first thing I noticed about my predator was his eyes, yellow and foreboding as they pierced my soul.
Next, I uncovered his torso, sinewy and compact, ready to pounce.
Finally, his tail, long and tapered—wait, not long but short. Not tapered but bushy.
Just then I heard a child coming up the trail shriek with delight.
“Look mommy, a deer!” TH
Dr. Glasheen is associate professor of medicine at the University of Colorado Denver, where he serves as director of the hospital mdicine program and the hospitalist Training program, and as associate program director of the Internal Medicine Residency Program.
References
1. Arizona Game and Fish Department. http://www.azgfd.gov/w_c/mtn_lion_attacks.shtml. Accessed November 3, 2008.
2. National Safety Council 2004 statistics. http://www.nsc.org/research/odds.aspx. Accessed November 3, 2008.
3. Centers for Disease Control. http://www.cdc.gov/niosh/topics/fishing/. Accessed November 3, 2008.
4. Thomas EJ, Studdert DM, Burstin HR, et al. Incidence and types of adverse events and negligent care in Utah and Colorado. Med Care 2000;38:261-271.
5. Brennan TA, Leape LL, Laird NM, et al. Incidence of adverse events and negligence in hospitalized patients. Results of the Harvard Medical Practice Study I. N Engl J Med. 1991;7;324:370-376.
6. Barker KN, Flynn EA, Pepper GA, Bates DW, Mikeal RL. Medication errors observed in 36 healthcare facilities. Arch Intern Med. 2002;162:1897-1903.
The Sky Isn’t Falling, Yet

“Hospital Doctors Brace for Layoff.”
As I was scanning an online news source recently, the headline above caught my eye. The story detailed a U.S. hospital experiencing a loss in the past year, and one of the cost-cutting measures being considered by the hospital administration was a layoff of some of the health system’s hospitalists.
Now, while the story caught my eye, I was not surprised. All hospitalists and hospital medicine group leaders should take this as a warning and be prepared for potential cost tightening at your local hospital in the next year. Many hospitalist groups are vulnerable to cutbacks, because support often is needed to maintain the viability of the HM program and, in tough economic times, all HM support receives closer scrutiny.
It’s no secret; the U.S. economy is in a decline. A recession has yet to be declared, as a recession normally is defined as two consecutive fiscal quarters of negative gross domestic product growth. However, this economy has been flat the past two quarters, in terms of GDP, and expectations for the fourth quarter aren’t good. Additionally, the country is experiencing increased costs across the continuum related to oil prices, food prices, the housing downturn, and the mortgage mess. So, while there may not be an official recession, many businesses are experiencing a financial tightening, with decreased revenues from slower growth and higher costs from a variety of areas.
Even Healthcare Has Soft Spots
On Wall Street, conventional wisdom dictates the healthcare industry is more stable and resistant to recession than other industries. The general belief is people get sick no matter the state of the economy. But the healthcare industry is diverse and revenue has many avenues. Certainly in biotechnology and pharmaceuticals, there is a greater degree of recession resistance, but within the healthcare industry, hospitals and providers are much more sensitive to an economic downturn, even though a large percentage of revenues are from government sources.
In an economic downturn, hospital demand decreases secondary to a less admissions and elective procedures, particularly in patients with non-government payers. Additionally, the number of uninsured rises, which results in a change in payer mix at hospitals. Finally, due to the rise in out-of-pocket expenses associated with health insurance, it is highly likely patients will forgo healthcare at a quicker rate than in past recessions. When things get tough, patients must pick and choose what to pay for, and with the higher out-of-pocket expenses, healthcare is not as easy to access for many people.
In the meantime, the cost of running a hospital continues to escalate. Labor shortages continue, so hospitals must continue to pay competitive salaries to attract and maintain employees. Hospitals have made significant investments in patient safety, information technology, new construction, and physician practices in the past several years. All of these factors continue to contribute to the high fixed costs of hospital financials.
And so, as hospitals begin to look at costs that are not as fixed, and thus easier to cut, payments to physician groups are one of the early items undergoing close examination. Hospitalists aren’t alone in this budgetary fix, as hospital CEOs are scrutinizing all physician support. Emergency medicine, surgeon on-call pay, medical directorships, and group practice support are just a few examples.
Proactive Steps
So what is a hospitalist group to do? Be prepared! Here are some steps you can take to stay ahead of the game.
- Understand the financial situation at your hospital. Is the hospital making money? Is it spending money on capital equipment? What is the hospital’s margin? What is the pattern over the last several years?
- Understand your HMG’s impact on the hospital. Regardless of your employment status, you need to know the impact. Do not rely on a hospital administrator to do the impact analysis for you. Don’t wait to seek out the data until you are forced to defend your group’s value. If you get into a situation where you must quickly defend your group’s value, time usually is not on your side, and it may be difficult to obtain the appropriate data in a timely manner. It is best to have the analysis already complete.
- Write down the impact analysis, obtain data to back up the assertions, and regularly review it with senior hospital leaders, medical staff leaders and your group. While a full SWOT analysis is ideal, as this provides a complete picture of your HMG’s strengths, weaknesses, opportunities, and threats, a regularly updated impact analysis is a living document that should be shared.
Executing an Impact Analysis
Begin by putting all your hospitalists in a room for a few hours and have everyone brainstorm the HMG’s impact on the hospital. The entire group should be involved, because it is important each individual hospitalist understands the impact you have on the facility.
- What is your impact on PCP referrals? What is your impact on elective surgical cases coming to the hospital? What about subspecialty care? Do you admit all the subspecialists’ patients? What is your impact on quality and patient safety? What is your impact on hospital committees?
- Once you have listed your potential impact areas, have a discussion about the kinds of data needed to back up each impact assertion. Find the data (hospital sources, practice resources, SHM data, etc.) and put it in the impact analysis.
- If your impact analysis exceeds two pages, you need to do an executive summary. The goal is for leaders to read this on a regular basis and understand the larger, global points.
- Update this impact analysis regularly. At a minimum, this should be yearly, but at times it may require updating every three to four months.
No Need to Reinvent the Wheel
None of this information is new at SHM. One of our core commitments is to make sure you have the information to understand your HMG’s value to the hospital and what you can do to provide greater value. The practice management committee has published a series of value-added articles, as well as a regular update on management best practices. SHM leaders have been talking about value and impact for years, and the need to keep your hospital group knowledgeable at all times.
But we also realize in a high-growth practice, some operational details are left to later. So, if you have not done an impact analysis, or if you have one and haven’t updated it in a while, use the urgency of the general economic downturn to get started. You, your group, your hospital, and your patients will be much better off if you are prepared. TH
Dr. Cawley is president of SHM.
Report Card Reservations
When Rajeev Alexander, MD, lead hospitalist at Oregon Medical Group with PeaceHealth of Eugene, Ore., sought out an ophthalmologist, he didn’t go to provider Web sites or directory pages. He did what most healthcare patients do: He asked around.
Some of the nurses at work gave him suggestions. “‘This guy does a lot of LASIK and might push it.’ Or, ‘This guy has good relationships with patients.’ Or, ‘This is the guy I’d send my husband to,’” Dr. Alexander explains. “That helped.”
Were he to recommend a hospital, Dr. Alexander says he would base his selection on one major criterion: the collegiality of the facility’s doctors, pharmacists, and nurses. “If all the specialists in the hospital are talking to each other, and if they feel they can trust each other,” he says, “then I think you’re going to get good care.”
Dr. Alexander never mentions checking the performance of the physician or hospital he may use. It seems he’s not alone. In recent years, some famous cases have brought attention to how infrequently patients actually consult the available quality data when selecting a provider.
It’s unlikely, for example, that Sen. Ted Kennedy (D-Mass.) researched provider collegiality as a quality measure when he chose a neurosurgeon at Duke University Medical Center to remove his malignant glioma. In 2004, when President Clinton needed his quadruple coronary bypass operation, he used an average-rated New York cardiologist. Why? Because, according to Dr. Jha, he didn’t compare quality reports.
Physicians are just as guilty of ignoring the information. Audience feedback at a hospital medicine continuing medical education course demonstrated to Robert M. Wachter, MD, chief of the division of hospital medicine and chief of the medical service at the University of California San Francisco Medical Center, that even members of UCSF’s Epidemiology and Biostatistics Department do not consult quality data before making medical decisions for themselves or a loved one. “Patients won’t start using quality data until we do it ourselves,” Dr. Wachter writes in his blog, Wachter’s World (www.wachtersworld.com). “Best guess: three to five years.”
So how much progress have we really made in using publicly reported data to pick individual providers and hospitals? What should be measured in the future as it affects hospitalist practice? How can hospitalists influence the types of data collected?
Along the Continuum
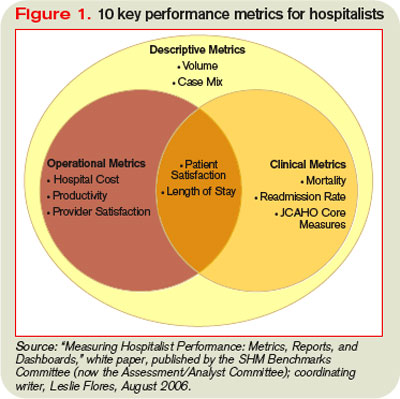
The problem isn’t because people don’t know about the data. More than one-quarter (26%) of consumers who participated in a 2002 Harris poll said they are aware of hospital report cards, Dr. Wachter writes in his book Internal Bleeding: The Truth Behind America’s Terrifying Epidemic of Medical Mistakes. However, only 3% considered changing their care based on those ratings, and only 1% actually made a change.1
Those who do consult the data seem to benefit—at least that is the case for users of New York state’s public reporting system for coronary artery bypass surgery. Dr. Jha and Arnold Epstein, MD, professor and chair of the department of Health Policy and Management at Harvard’s School of Public Health, found users who picked a top-performing hospital or surgeon had approximately half the mortality risk as did those who selected from the bottom quartile.2
But it is unusual for patients to choose a hospital based on publicly reported information alone, and Dr. Jha believes it’s largely due to mindset. “People are not used to approaching healthcare the way they would walk into a car dealership, for instance, ready to do battle,” he says.
Even if physicians and patients don’t consistently use the data, publishing it still has value. It helps physicians gauge their professional status, for example. “If someone is not looking good,” Dr. Jha says, “it is a huge impetus to improve, as long as you believe that what you are measuring is really associated with quality.”
Those who don’t believe it may have trouble, and sooner than they think. With 70 million beneficiaries, the Centers for Medicare and Medicaid Services (CMS) sets the tone for healthcare quality in the U.S. In fact, Medicare beneficiaries comprise about one-third of those in a typical hospitalist’s practice. Since March 2008, the CMS Web site www.hospitalcompare.hhs.gov/ has reported hospital service data and soon will post cost comparisons.
“CMS is a payer we have to pay attention to (them),” says Patrick Torcson, MD, chair of SHM’s Performance and Standards Committee. “The CMS performance and quality agenda is specified at the statutory level as part of the Congressional record, and is very political. Therefore, that agenda right now is part scientific, part policy, and part methodology. There is a little something in it for everybody.”
Increasingly, quality measures are gradually, and insidiously, changing healthcare. For instance, Dr. Jha’s study found outcomes data did not greatly influence hospital market share, however, the surgeons with the highest publicly reported mortality rates were much more likely to retire after the release of each report card.2
Obstacles to Utilization
If these data can help us make educated healthcare decisions, why aren’t more people consulting them? To start, current measures aren’t sufficient, says Peter K. Lindenauer, MD, MSc, FACP, a hospitalist and associate professor of medicine at Baystate Medical Center in Springfield, Mass.
“The number of measures and the strength of the evidence that current process measures are based on are still quite limited,” Dr. Lindenauer says. “Moreover, it is unclear how much the structural and process measures that have remained the focus of most public reporting contribute to patient outcomes.” It’s difficult to make statistically meaningful comparisons across hospitals or providers. Those efforts are “hampered by inadequate risk adjustment and tend to be underpowered to detect statistically significant differences.”
Another problem facing public reporting comparison initiatives is differences in healthcare utilization and spending across U.S. regions with similar levels of patient illness, says Stephanie Jackson, MD, a hospitalist with PeaceHealth and a member of SHM’s Public Policy Committee.3 The public cannot look at data it doesn’t have. For example, when Dr. Jackson asked researchers for data on coronary stroke rates, she was informed some physicians asked the data be held back because they didn’t like what it showed. “Why aren’t we demanding [that data]?” Dr. Jackson asks.
Essentially, then, quality data utilization is an evolving story. ”An ongoing debate exists between proponents of public reporting who believe that the best way to improve measures is to start using them,” Dr. Lindenauer says, “and those who advocate a more cautious approach and argue we should not rush to publicize data until we are clear about what the numbers signify and what to measure.”
Some hospitals use more than 10 criteria as the benchmark for core measures, and 10 additional dimensions hospitalists use to assess their own internal performance (see Figure 1, pg. 41). Beyond that, metrics vary from hospital to hospital.
What Hospitalists Can Do
“It is very challenging to find doctors who are well-versed in public reporting of quality data,” says Latha Sivaprasad, MD, medical director, quality management and patient safety at Beth Israel Medical Center in New York City. Dr. Jackson believes the more hospitalists know about quality data, the more they will want to use it. “Even though some hospitalists may be afraid to find out how they are doing,” she says, “in general, the better we get at measuring individual performance, the more hospitalists can examine their performance and how they can improve as individuals, as a group, and as an institution.”
Additionally, the era of value-based purchasing (pay for performance) is here—in the form of CMS’ Physician Quality Reporting Initiative. For the past year, physicians have reported on specific performance measures tied to a 1.5% bonus payout. Of the program’s 74 measures in 2007 and 119 measures in 2008, 11 have reporting specifications applicable to hospitalists.
“Three to 5% of the DRG [diagnosis-related group] reimbursement could be at stake for hospitals to achieve certain benchmarks,” Dr. Torcson says. “This will be a great opportunity for hospitalists to partner with their hospitals to develop synergy in achieving performance goals that are going to help maximize hospital quality initiatives and reimbursement.”
Hospitalists can get more involved with quality measures by:
- Joining the hospital quality improvement or patient safety teams;
- Creating toolkits to educate physicians in using quality data;
- Setting up unit-sponsored interdisciplinary teams on the floors to marry all lines of care; and
- Educating the public.
“The conventional wisdom is that the more procedures that an institution does, the better their performance,” Dr. Alexander says, giving as an example a specialized cardiac hospital. “But you really want your surgery in a hospital where they manage at least a moderately high number of procedures and have a very high” success rate treating complications.
Dr. Sivaprasad believes the public wants guidance on medical care quality, legal ramifications of care, physician-specific volume, and the significance of physician hospital privileges. “Maybe we should be more public about system outcomes changes that resulted from root-cause analyses performed,” she adds.
Whatever the level, hospitalists should get involved, Dr. Vidyarthi says. “Quality improvement is an area where you as hospitalists may be asked to engage—and you’re needed.” TH
Andrea M. Sattinger is a medical writer based in North Carolina and a frequent contributor to The Hospitalist.
References
1. Wachter R, Shojania K. Internal Bleeding: The Truth Behind America's Terrifying Epidemic of Medical Mistakes. New York. Rugged Land. 2004.
2. Jha AK, Epstein AM. The predictive accuracy of the New York state coronary artery bypass surgery report-card system. Health Aff. 2006;25(3):844-855.
3. Sirovich BE, Gottlieb DJ, Welch HG, Fisher ES. Regional variations in healthcare intensity and physician perceptions of quality of care. Ann Intern Med 2006;144(9):641-649.
When Rajeev Alexander, MD, lead hospitalist at Oregon Medical Group with PeaceHealth of Eugene, Ore., sought out an ophthalmologist, he didn’t go to provider Web sites or directory pages. He did what most healthcare patients do: He asked around.
Some of the nurses at work gave him suggestions. “‘This guy does a lot of LASIK and might push it.’ Or, ‘This guy has good relationships with patients.’ Or, ‘This is the guy I’d send my husband to,’” Dr. Alexander explains. “That helped.”
Were he to recommend a hospital, Dr. Alexander says he would base his selection on one major criterion: the collegiality of the facility’s doctors, pharmacists, and nurses. “If all the specialists in the hospital are talking to each other, and if they feel they can trust each other,” he says, “then I think you’re going to get good care.”
Dr. Alexander never mentions checking the performance of the physician or hospital he may use. It seems he’s not alone. In recent years, some famous cases have brought attention to how infrequently patients actually consult the available quality data when selecting a provider.
It’s unlikely, for example, that Sen. Ted Kennedy (D-Mass.) researched provider collegiality as a quality measure when he chose a neurosurgeon at Duke University Medical Center to remove his malignant glioma. In 2004, when President Clinton needed his quadruple coronary bypass operation, he used an average-rated New York cardiologist. Why? Because, according to Dr. Jha, he didn’t compare quality reports.
Physicians are just as guilty of ignoring the information. Audience feedback at a hospital medicine continuing medical education course demonstrated to Robert M. Wachter, MD, chief of the division of hospital medicine and chief of the medical service at the University of California San Francisco Medical Center, that even members of UCSF’s Epidemiology and Biostatistics Department do not consult quality data before making medical decisions for themselves or a loved one. “Patients won’t start using quality data until we do it ourselves,” Dr. Wachter writes in his blog, Wachter’s World (www.wachtersworld.com). “Best guess: three to five years.”
So how much progress have we really made in using publicly reported data to pick individual providers and hospitals? What should be measured in the future as it affects hospitalist practice? How can hospitalists influence the types of data collected?
Along the Continuum
The problem isn’t because people don’t know about the data. More than one-quarter (26%) of consumers who participated in a 2002 Harris poll said they are aware of hospital report cards, Dr. Wachter writes in his book Internal Bleeding: The Truth Behind America’s Terrifying Epidemic of Medical Mistakes. However, only 3% considered changing their care based on those ratings, and only 1% actually made a change.1
Those who do consult the data seem to benefit—at least that is the case for users of New York state’s public reporting system for coronary artery bypass surgery. Dr. Jha and Arnold Epstein, MD, professor and chair of the department of Health Policy and Management at Harvard’s School of Public Health, found users who picked a top-performing hospital or surgeon had approximately half the mortality risk as did those who selected from the bottom quartile.2
But it is unusual for patients to choose a hospital based on publicly reported information alone, and Dr. Jha believes it’s largely due to mindset. “People are not used to approaching healthcare the way they would walk into a car dealership, for instance, ready to do battle,” he says.
Even if physicians and patients don’t consistently use the data, publishing it still has value. It helps physicians gauge their professional status, for example. “If someone is not looking good,” Dr. Jha says, “it is a huge impetus to improve, as long as you believe that what you are measuring is really associated with quality.”
Those who don’t believe it may have trouble, and sooner than they think. With 70 million beneficiaries, the Centers for Medicare and Medicaid Services (CMS) sets the tone for healthcare quality in the U.S. In fact, Medicare beneficiaries comprise about one-third of those in a typical hospitalist’s practice. Since March 2008, the CMS Web site www.hospitalcompare.hhs.gov/ has reported hospital service data and soon will post cost comparisons.
“CMS is a payer we have to pay attention to (them),” says Patrick Torcson, MD, chair of SHM’s Performance and Standards Committee. “The CMS performance and quality agenda is specified at the statutory level as part of the Congressional record, and is very political. Therefore, that agenda right now is part scientific, part policy, and part methodology. There is a little something in it for everybody.”
Increasingly, quality measures are gradually, and insidiously, changing healthcare. For instance, Dr. Jha’s study found outcomes data did not greatly influence hospital market share, however, the surgeons with the highest publicly reported mortality rates were much more likely to retire after the release of each report card.2
Obstacles to Utilization
If these data can help us make educated healthcare decisions, why aren’t more people consulting them? To start, current measures aren’t sufficient, says Peter K. Lindenauer, MD, MSc, FACP, a hospitalist and associate professor of medicine at Baystate Medical Center in Springfield, Mass.
“The number of measures and the strength of the evidence that current process measures are based on are still quite limited,” Dr. Lindenauer says. “Moreover, it is unclear how much the structural and process measures that have remained the focus of most public reporting contribute to patient outcomes.” It’s difficult to make statistically meaningful comparisons across hospitals or providers. Those efforts are “hampered by inadequate risk adjustment and tend to be underpowered to detect statistically significant differences.”
Another problem facing public reporting comparison initiatives is differences in healthcare utilization and spending across U.S. regions with similar levels of patient illness, says Stephanie Jackson, MD, a hospitalist with PeaceHealth and a member of SHM’s Public Policy Committee.3 The public cannot look at data it doesn’t have. For example, when Dr. Jackson asked researchers for data on coronary stroke rates, she was informed some physicians asked the data be held back because they didn’t like what it showed. “Why aren’t we demanding [that data]?” Dr. Jackson asks.
Essentially, then, quality data utilization is an evolving story. ”An ongoing debate exists between proponents of public reporting who believe that the best way to improve measures is to start using them,” Dr. Lindenauer says, “and those who advocate a more cautious approach and argue we should not rush to publicize data until we are clear about what the numbers signify and what to measure.”
Some hospitals use more than 10 criteria as the benchmark for core measures, and 10 additional dimensions hospitalists use to assess their own internal performance (see Figure 1, pg. 41). Beyond that, metrics vary from hospital to hospital.
What Hospitalists Can Do
“It is very challenging to find doctors who are well-versed in public reporting of quality data,” says Latha Sivaprasad, MD, medical director, quality management and patient safety at Beth Israel Medical Center in New York City. Dr. Jackson believes the more hospitalists know about quality data, the more they will want to use it. “Even though some hospitalists may be afraid to find out how they are doing,” she says, “in general, the better we get at measuring individual performance, the more hospitalists can examine their performance and how they can improve as individuals, as a group, and as an institution.”
Additionally, the era of value-based purchasing (pay for performance) is here—in the form of CMS’ Physician Quality Reporting Initiative. For the past year, physicians have reported on specific performance measures tied to a 1.5% bonus payout. Of the program’s 74 measures in 2007 and 119 measures in 2008, 11 have reporting specifications applicable to hospitalists.
“Three to 5% of the DRG [diagnosis-related group] reimbursement could be at stake for hospitals to achieve certain benchmarks,” Dr. Torcson says. “This will be a great opportunity for hospitalists to partner with their hospitals to develop synergy in achieving performance goals that are going to help maximize hospital quality initiatives and reimbursement.”
Hospitalists can get more involved with quality measures by:
- Joining the hospital quality improvement or patient safety teams;
- Creating toolkits to educate physicians in using quality data;
- Setting up unit-sponsored interdisciplinary teams on the floors to marry all lines of care; and
- Educating the public.
“The conventional wisdom is that the more procedures that an institution does, the better their performance,” Dr. Alexander says, giving as an example a specialized cardiac hospital. “But you really want your surgery in a hospital where they manage at least a moderately high number of procedures and have a very high” success rate treating complications.
Dr. Sivaprasad believes the public wants guidance on medical care quality, legal ramifications of care, physician-specific volume, and the significance of physician hospital privileges. “Maybe we should be more public about system outcomes changes that resulted from root-cause analyses performed,” she adds.
Whatever the level, hospitalists should get involved, Dr. Vidyarthi says. “Quality improvement is an area where you as hospitalists may be asked to engage—and you’re needed.” TH
Andrea M. Sattinger is a medical writer based in North Carolina and a frequent contributor to The Hospitalist.
References
1. Wachter R, Shojania K. Internal Bleeding: The Truth Behind America's Terrifying Epidemic of Medical Mistakes. New York. Rugged Land. 2004.
2. Jha AK, Epstein AM. The predictive accuracy of the New York state coronary artery bypass surgery report-card system. Health Aff. 2006;25(3):844-855.
3. Sirovich BE, Gottlieb DJ, Welch HG, Fisher ES. Regional variations in healthcare intensity and physician perceptions of quality of care. Ann Intern Med 2006;144(9):641-649.
When should lipid-lowering therapy be started in the hospitalized patient?
Case
A 52-year-old man with no medical history other than a transient ischemic attack (TIA) three months ago presents to the emergency department (ED) following multiple episodes of substernal (ST) chest pressure. He takes no medication. His electrocardiogram (ECG) revealed lateral ST segment depressions, and his cardiac biomarkers were elevated. He underwent cardiac catheterization, and a single drug-eluting stent was successfully placed to a culprit left circumflex lesion. He is now stable less than 24 hours following his initial presentation, without any evidence of heart failure. His providers prescribe aspirin, clopidogrel, metoprolol, and lisinopril. His fasting LDL level is 92 mg/dL.
What, if any, is the role for lipid-lowering therapy at this time?
Overview
Long-term therapy with HMG CoA reductase inhibitors (statins) has been shown through several large, randomized, controlled trials to reduce the risk for death, myocardial infarction (MI), and stroke in patients with established coronary disease. The most significant effects were evident after approximately two years of treatment.1,2,3,4
Subsequent trials have shown earlier and more significant reductions in the rates of recurrent ischemic cardiovascular events following acute coronary syndromes (ACS) when statins are administered early—within days of the initial event. This is a window of time in which most patients still are hospitalized.4,5,6,7
In addition to this data regarding statin use following ACS, a large, randomized, controlled trial demonstrated similar reductions in the incidence of strokes and cardiovascular events when high-dose atorvastatin was administered within one to six months following TIA or stroke in patients without established coronary disease.8 There is growing data supporting the hypothesis that statins have pleiotropic (non cholesterol-lowering), neuroprotective, properties that may improve patient outcomes following cerebrovascular events.9,10,11 There are ongoing trials investing the role of statins in the acute management of stroke.12,13
Hospitalists frequently manage patients in the stages immediately following ACS and stroke. Based on the large and evolving volume of data regarding the use of statins following these events, when and how should a statin be started in the hospital?
Review of the Data
Following Acute Coronary Syndrome: Death and recurrent ischemic events following ACS are most likely to occur in the early phase of recovery. Based on this observation and evidence supporting the early (in some cases within hours of administration) ‘pleiotropic’ or non-cholesterol lowering effects of statins, including improvement in endothelial function and decreases in platelet aggregation, thrombus deposition, and vascular inflammation, the MIRACL study was designed to answer the question of whether the initiation of treatment with a statin within 24 to 96 hours following ACS would reduce the occurrence of death and recurrent ischemia.4,7,14 Investigators randomized 3,086 patients within 24-96 hours (mean 63 hours) following admission for non-ST segment myocardial infarction (NSTEMI) or unstable angina (UA) to receive either atorvastatin 80 mg/d or placebo.
Investigators monitored patients for the primary end points of ischemic events (death, non-fatal MI, cardiac arrest with resuscitation, symptomatic myocardial ischemia with objective evidence) during a 16-week period. In the treatment arm, the risk of the primary combined end point was significantly reduced—relative risk (RR) 0.84; 95% confidence interval (CI), 0.70-1.00; p=0.048. (See Figure 1, pg. 39)
No significant differences were found between atorvastatin and placebo in the risk of death, non-fatal MI, or cardiac arrest with resuscitation. There was, however, a significantly lower risk of recurrent symptomatic myocardial ischemia with objective evidence requiring emergent re-hospitalization in the treatment arm (RR, 0.74; 95% CI, 0.57-0.95; p=0.02). The mean baseline LDL level in the treatment arm was 124 mg/dL, a value that may represent, in part, suppression of the LDL level in the setting of acute ACS. This is a phenomenon previously described in an analysis of the LUNAR trial.15
Suppression of LDL level after ACS appeared to be minimal, however, and is unlikely to be clinically significant. The benefits of atorvastatin in the MIRACL trial did not appear to depend on baseline LDL level—suggesting the decision to initiate statin therapy after ACS should not be influenced by LDL level at the time of the event.
Only one dose of statin was used in the MIRACL trial, and the investigators commented they were unable to determine if a lower dose of atorvastatin or a gradual dose titration to a predetermined LDL target would have achieved similar benefits. The PROVE IT-TIMI 22 trial was designed to compare the reductions in death and major cardiovascular events following ACS between LDL lowering to approximately 100 mg/dL using 40 mg/d of pravastatin, and more intensive LDL lowering to approximately 70 mg/dL using 80 mg/d of atorvastatin.5 Investigators enrolled 4,162 patients for a median of seven days following ACS (STEMI, NSTEMI, or UA) to the two treatment arms. Investigators observed patients for a period of 18 to 36 months for the primary end points of death, MI, UA, revascularization, and stroke. The median LDL level at the time of enrollment was 106 mg/dL in both treatment arms. During follow up, the median LDL levels achieved were 95 mg/dL in the pravastatin group and 62 mg/dL in the atorvastatin group. After two years, a 16% reduction in the hazard ratio for any primary end point was seen favoring 80 mg/d of atorvastatin—p=0.005; 95% CI=5-26%. (See Figure 2, pg. 39) The benefit of high-dose atorvastatin was seen as early as 30 days after randomization and was sustained throughout the trial.
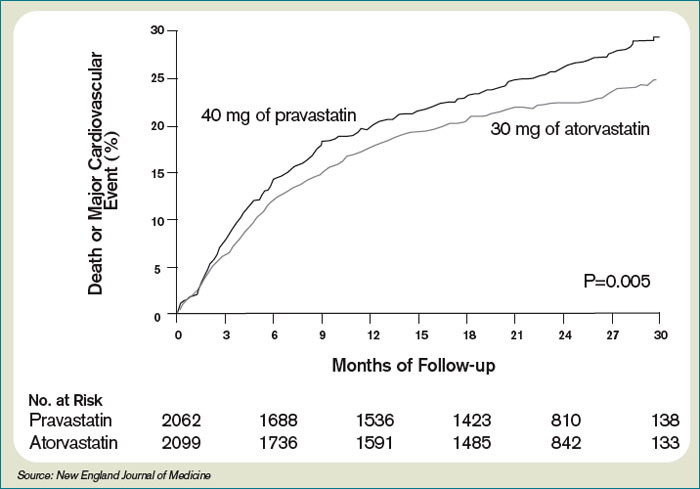
While the PROVE IT-TIMI 22 trial supported a specified dosing strategy for statin use following ACS, Phase Z of the A-to-Z trial was designed to evaluate the early initiation of intensive lipid lowering following ACS, as compared to a delayed and less-intensive strategy.5,6 Investigators randomized 4,497 patients (a mean of 3.7 days following either NSTEMI or STEMI) to receive either placebo for four months followed by simvastatin 20 mg/d or simvastatin 40 mg/d for one month followed by simvastatin 80 mg/d. They followed patients for 24 months for the primary end points of cardiovascular death, MI, readmission for ACS, or stroke. The primary end point occurred in 16.7% of the delayed, lower-intensity treatment group and in 14.4% of the early, higher-intensity treatment group (95% CI 0.76-1.04; p=0.14). Despite the lack of a significant difference in the composite primary end point between the two treatment arms, a significant reduction in the secondary end points of cardiovascular mortality (absolute risk reduction (ARR 1.3%; P=0.05) and congestive heart failure (ARR 1.3%; P=0.04) was evident favoring the early, intensive treatment strategy. These differences were not evident until at least four months after randomization. The A-to-Z trial investigators offered several possible explanations for the delay in evident clinical benefits in their trial when compared against the strong trend toward clinical benefit seen with 30 days following the early initiation of high-dose atorvastatin following ACS in the PROVE IT-TIMI 22 trial. In the PROVE IT trial, patients were enrolled an average of seven days after their index event, and as a result, 69% had undergone revascularization by this time. In the A-to-Z trial, patients were enrolled an average of three to four days earlier, and, therefore, were less likely to have undergone a revascularization procedure by the time of enrollment—and may have continued on with active thrombotic processes relatively less responsive to statin therapy.6 Another notable difference between PROVE IT and A-to-Z subjects was the C-reactive protein (CRP) concentrations in the A-to-Z subjects did not differ between treatment groups within 30 days despite significant differences in their LDL levels.16 This lack of a concurrent, pleiotropic, anti-inflammatory effect in the A-to-Z trial aggressive treatment arm may also have contributed to the delayed treatment effect.
In conclusion, the A-to-Z investigators suggest more intensive statin therapy (than the 40 mg Simvastatin in their intensive treatment arm) may be required to derive the most rapid and maximal clinical benefits during the highest risk period immediately following ACS.
Following stroke: Although there is more robust data supporting the benefits of early, intensive, statin therapy following ACS, there also is established and emerging data supporting similar treatment approaches following stroke.
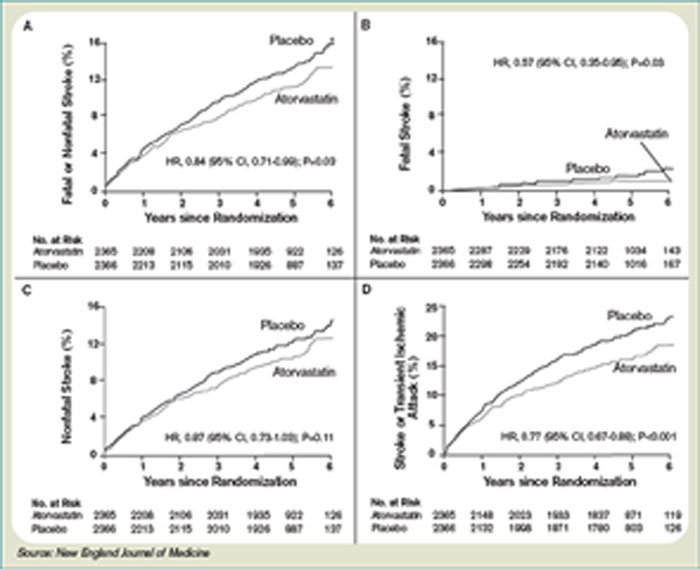
The Stroke Prevention by Aggressive Reduction in Cholesterol Levels (SPARCL) trial was designed to determine whether or not atorvastatin 80 mg daily would reduce the risk of stroke in patients without known coronary heart disease who had suffered a TIA or stroke within the preceding six months.8 Patients who experienced a hemorrhagic or ischemic TIA or stroke between one to six months before study entry were randomized to receive either atorvastatin 80 mg/d or placebo.
Investigators followed patients for a mean period of 4.9 years for the primary end point of time to non-fatal or fatal stroke. Secondary composite end points included stroke or TIA, and any coronary or peripheral arterial event, including death from cardiac causes, non-fatal MI, ACS, revascularization (coronary, carotid, peripheral), and death from any cause. No difference in mean baseline LDL levels was witnessed between the treatment and placebo arms (132.7 and 133.7 mg/dL, respectively). Atorvastatin was associated with a 16% relative reduction in the risk of stroke—hazard ratio, 0.84; 95% CI 0.71–0.99; p=0.03. This was found despite an increase in hemorrhagic stroke in the atorvastatin group—a finding that supports an epidemiologic association between low cholesterol levels and brain hemorrhage. The risk of cardiovascular events also was significantly reduced, however, no significant difference in overall mortality was observed between the two groups.
In conclusion, the authors recommend the initiation of high-dose atorvastatin “soon” after stroke or TIA. One can only conclude, based on these data, statin therapy should be initiated within six months of TIA or stroke, in accordance with the study design. There is retrospective data suggesting benefit to statin therapy initiated within four weeks following ischemic stroke, and there are prospective trials in process evaluating the potential benefits of statins initiated within 24 hours following ischemic stroke, however, no large, randomized, controlled trial can demonstrate the effect of statins when used as acute stroke therapy.9,12,13,17
Back to the Case
The patient described in our case has a history of TIA and experienced an acute coronary syndrome (NSTEMI) within the preceding 24 hours. He underwent a revascularization procedure (PCI with stent), and is on appropriate therapy, including dual anti-platelet therapy with aspirin and clopidogrel, a beta-blocker, and an angiotensin-converting enzyme inhibitor. Based on the data and conclusions of the MIRACL, PROVE IT-TIMI 22, and SPARCL trials, high-dose statin therapy with atorvastatin 80 mg/d should be initiated immediately in the patient in order to significantly reduce his risk of recurrent ischemic cardiovascular events and stroke following his acute coronary syndrome and TIA.
Bottom Line
Following ACS, high-dose statin therapy with 80 mg of atorvastatin per day should be initiated when the patient is still in the hospital, irrespective of baseline LDL level. Statin therapy should also strongly be considered for secondary stroke prevention in most patients with a history of stroke or transient ischemic attack. TH
Caleb Hale, MD, is a hospitalist at Beth Israel Deaconess Medical Center in Boston. Joseph Ming Wah Li is director of the hospital medicine program and associate chief, division of general medicine and primary care at Beth Israel Deaconess Medical Center in Boston, and assistant professor of Medicine at Harvard Medical School.
References
1. Scandinavian Simvastatin Survival Study Group. Randomised trial of cholesterol lowering in 4444 patients with coronary heart disease: the Scandinavian Simvastatin Survival Study (4S). Lancet 1994;344:1383-1389.
2. Sacks RM, Pfeffer MA, Moye LA, et al. The effect of pravastatin on coronary events after myocardial infarction in patients with average cholesterol levels. N Engl J Med 1996;335:1001-1009.
3. The Long-Term Intervention with Pravastatin in Ischaemic Disease (LIPID) Study Group. Prevention of cardiovascular events and death with pravastatin in patients with coronary heart disease and a broad range of initial cholesterol levels. N Engl J Med 1998;339:1349-1357.
4. Schwartz GG, Olsson AG, Ezekowitz MD, et al. Effects of atorvastatin on early recurrent ischemic events in acute coronary syndromes. The MIRACL study: a randomized controlled trial. JAMA. 2001;285:1711-1718.
5. Cannon CP, Braunwald E, McCabe CH, et al. Intensive versus moderate lipid lowering with statins after acute coronary syndromes. N Engl J Med. 2004;350:1495-1504.
6. Lemos JA, Blazing MA, Wiviott SD, et al. Early intensive vs. a delayed conservative simvastatin strategy in patients with acute coronary syndromes. Phase Z of the A to Z trial. JAMA. 2004;292:1307-1316.
7. Waters D, Schwartz GG, Olsson AG. The myocardial ischemia reduction with acute cholesterol lowering (MIRACL) trial: a new frontier for statins? Curr Control Trials Cardiovasc Med. 2001;2;111-114.
8. The Stroke Prevention by Aggressive Reduction in Cholesterol Levels (SPARCL) Investigators. High-dose atorvastatin after stroke or transient ischemic attack. N Engl J Med. 2006;355:549-559.
9. Moonis M, Kane K, Schwiderski U, Sandage BW, Fisher M. HMG-CoA reductase inhibitors improve acute ischemic stroke outcome. Stroke. 2005;36:1298-1300.
10. Elkind MS, Flint AC, Sciacca RR, Sacco RL. Lipid-lowering agent use at ischemic stroke onset is associated with decreased mortality. Neurology. 2005;65:253-258.
11. Vaughan CJ, Delanty N. Neuroprotective properties of statins in cerebral ischemia and stroke. Stroke. 1999;30:1969-1973.
12. Elkind MS, Sacco RL, MacArthur RB, et al. The neuroprotection with statin therapy for acute recovery trial (NeuSTART): an adaptive design phase I dose-escalation study of high-dose lovastatin in acute ischemic stroke. Int J Stroke. 2008;3:210-218.
13. Montaner J, Chacon P, Krupinski J, et al. Simvastatin in the acute phase of ischemic stroke: a safety and efficacy pilot trial. Eur J of Neurol. 2008;15:82-90.
14. Ridker PM, Cannon CP, Morrow D, et al. C-reactive protein levels and outcomes after statin therapy. N Engl J Med. 2005;352:20-28.
15. Pitt B, Loscalzo J, Ycas J, Raichlen JS. Lipid levels after acute coronary syndromes. JACC. 2008;51:1440-1445.
16. Wiviott SD, de Lemos JA, Cannon CP, et al. A tale of two trials: a comparison of the post-acute coronary syndrome lipid-lowering trials of A to Z and PROVE IT-TIMI 22. Circulation. 2006;113:1406-1414.
17. Elking MS. Statins as acute-stroke treatment. Int J Stroke. 2006;1:224-225.
Case
A 52-year-old man with no medical history other than a transient ischemic attack (TIA) three months ago presents to the emergency department (ED) following multiple episodes of substernal (ST) chest pressure. He takes no medication. His electrocardiogram (ECG) revealed lateral ST segment depressions, and his cardiac biomarkers were elevated. He underwent cardiac catheterization, and a single drug-eluting stent was successfully placed to a culprit left circumflex lesion. He is now stable less than 24 hours following his initial presentation, without any evidence of heart failure. His providers prescribe aspirin, clopidogrel, metoprolol, and lisinopril. His fasting LDL level is 92 mg/dL.
What, if any, is the role for lipid-lowering therapy at this time?
Overview
Long-term therapy with HMG CoA reductase inhibitors (statins) has been shown through several large, randomized, controlled trials to reduce the risk for death, myocardial infarction (MI), and stroke in patients with established coronary disease. The most significant effects were evident after approximately two years of treatment.1,2,3,4
Subsequent trials have shown earlier and more significant reductions in the rates of recurrent ischemic cardiovascular events following acute coronary syndromes (ACS) when statins are administered early—within days of the initial event. This is a window of time in which most patients still are hospitalized.4,5,6,7
In addition to this data regarding statin use following ACS, a large, randomized, controlled trial demonstrated similar reductions in the incidence of strokes and cardiovascular events when high-dose atorvastatin was administered within one to six months following TIA or stroke in patients without established coronary disease.8 There is growing data supporting the hypothesis that statins have pleiotropic (non cholesterol-lowering), neuroprotective, properties that may improve patient outcomes following cerebrovascular events.9,10,11 There are ongoing trials investing the role of statins in the acute management of stroke.12,13
Hospitalists frequently manage patients in the stages immediately following ACS and stroke. Based on the large and evolving volume of data regarding the use of statins following these events, when and how should a statin be started in the hospital?
Review of the Data
Following Acute Coronary Syndrome: Death and recurrent ischemic events following ACS are most likely to occur in the early phase of recovery. Based on this observation and evidence supporting the early (in some cases within hours of administration) ‘pleiotropic’ or non-cholesterol lowering effects of statins, including improvement in endothelial function and decreases in platelet aggregation, thrombus deposition, and vascular inflammation, the MIRACL study was designed to answer the question of whether the initiation of treatment with a statin within 24 to 96 hours following ACS would reduce the occurrence of death and recurrent ischemia.4,7,14 Investigators randomized 3,086 patients within 24-96 hours (mean 63 hours) following admission for non-ST segment myocardial infarction (NSTEMI) or unstable angina (UA) to receive either atorvastatin 80 mg/d or placebo.
Investigators monitored patients for the primary end points of ischemic events (death, non-fatal MI, cardiac arrest with resuscitation, symptomatic myocardial ischemia with objective evidence) during a 16-week period. In the treatment arm, the risk of the primary combined end point was significantly reduced—relative risk (RR) 0.84; 95% confidence interval (CI), 0.70-1.00; p=0.048. (See Figure 1, pg. 39)
No significant differences were found between atorvastatin and placebo in the risk of death, non-fatal MI, or cardiac arrest with resuscitation. There was, however, a significantly lower risk of recurrent symptomatic myocardial ischemia with objective evidence requiring emergent re-hospitalization in the treatment arm (RR, 0.74; 95% CI, 0.57-0.95; p=0.02). The mean baseline LDL level in the treatment arm was 124 mg/dL, a value that may represent, in part, suppression of the LDL level in the setting of acute ACS. This is a phenomenon previously described in an analysis of the LUNAR trial.15
Suppression of LDL level after ACS appeared to be minimal, however, and is unlikely to be clinically significant. The benefits of atorvastatin in the MIRACL trial did not appear to depend on baseline LDL level—suggesting the decision to initiate statin therapy after ACS should not be influenced by LDL level at the time of the event.
Only one dose of statin was used in the MIRACL trial, and the investigators commented they were unable to determine if a lower dose of atorvastatin or a gradual dose titration to a predetermined LDL target would have achieved similar benefits. The PROVE IT-TIMI 22 trial was designed to compare the reductions in death and major cardiovascular events following ACS between LDL lowering to approximately 100 mg/dL using 40 mg/d of pravastatin, and more intensive LDL lowering to approximately 70 mg/dL using 80 mg/d of atorvastatin.5 Investigators enrolled 4,162 patients for a median of seven days following ACS (STEMI, NSTEMI, or UA) to the two treatment arms. Investigators observed patients for a period of 18 to 36 months for the primary end points of death, MI, UA, revascularization, and stroke. The median LDL level at the time of enrollment was 106 mg/dL in both treatment arms. During follow up, the median LDL levels achieved were 95 mg/dL in the pravastatin group and 62 mg/dL in the atorvastatin group. After two years, a 16% reduction in the hazard ratio for any primary end point was seen favoring 80 mg/d of atorvastatin—p=0.005; 95% CI=5-26%. (See Figure 2, pg. 39) The benefit of high-dose atorvastatin was seen as early as 30 days after randomization and was sustained throughout the trial.
While the PROVE IT-TIMI 22 trial supported a specified dosing strategy for statin use following ACS, Phase Z of the A-to-Z trial was designed to evaluate the early initiation of intensive lipid lowering following ACS, as compared to a delayed and less-intensive strategy.5,6 Investigators randomized 4,497 patients (a mean of 3.7 days following either NSTEMI or STEMI) to receive either placebo for four months followed by simvastatin 20 mg/d or simvastatin 40 mg/d for one month followed by simvastatin 80 mg/d. They followed patients for 24 months for the primary end points of cardiovascular death, MI, readmission for ACS, or stroke. The primary end point occurred in 16.7% of the delayed, lower-intensity treatment group and in 14.4% of the early, higher-intensity treatment group (95% CI 0.76-1.04; p=0.14). Despite the lack of a significant difference in the composite primary end point between the two treatment arms, a significant reduction in the secondary end points of cardiovascular mortality (absolute risk reduction (ARR 1.3%; P=0.05) and congestive heart failure (ARR 1.3%; P=0.04) was evident favoring the early, intensive treatment strategy. These differences were not evident until at least four months after randomization. The A-to-Z trial investigators offered several possible explanations for the delay in evident clinical benefits in their trial when compared against the strong trend toward clinical benefit seen with 30 days following the early initiation of high-dose atorvastatin following ACS in the PROVE IT-TIMI 22 trial. In the PROVE IT trial, patients were enrolled an average of seven days after their index event, and as a result, 69% had undergone revascularization by this time. In the A-to-Z trial, patients were enrolled an average of three to four days earlier, and, therefore, were less likely to have undergone a revascularization procedure by the time of enrollment—and may have continued on with active thrombotic processes relatively less responsive to statin therapy.6 Another notable difference between PROVE IT and A-to-Z subjects was the C-reactive protein (CRP) concentrations in the A-to-Z subjects did not differ between treatment groups within 30 days despite significant differences in their LDL levels.16 This lack of a concurrent, pleiotropic, anti-inflammatory effect in the A-to-Z trial aggressive treatment arm may also have contributed to the delayed treatment effect.
In conclusion, the A-to-Z investigators suggest more intensive statin therapy (than the 40 mg Simvastatin in their intensive treatment arm) may be required to derive the most rapid and maximal clinical benefits during the highest risk period immediately following ACS.
Following stroke: Although there is more robust data supporting the benefits of early, intensive, statin therapy following ACS, there also is established and emerging data supporting similar treatment approaches following stroke.
The Stroke Prevention by Aggressive Reduction in Cholesterol Levels (SPARCL) trial was designed to determine whether or not atorvastatin 80 mg daily would reduce the risk of stroke in patients without known coronary heart disease who had suffered a TIA or stroke within the preceding six months.8 Patients who experienced a hemorrhagic or ischemic TIA or stroke between one to six months before study entry were randomized to receive either atorvastatin 80 mg/d or placebo.
Investigators followed patients for a mean period of 4.9 years for the primary end point of time to non-fatal or fatal stroke. Secondary composite end points included stroke or TIA, and any coronary or peripheral arterial event, including death from cardiac causes, non-fatal MI, ACS, revascularization (coronary, carotid, peripheral), and death from any cause. No difference in mean baseline LDL levels was witnessed between the treatment and placebo arms (132.7 and 133.7 mg/dL, respectively). Atorvastatin was associated with a 16% relative reduction in the risk of stroke—hazard ratio, 0.84; 95% CI 0.71–0.99; p=0.03. This was found despite an increase in hemorrhagic stroke in the atorvastatin group—a finding that supports an epidemiologic association between low cholesterol levels and brain hemorrhage. The risk of cardiovascular events also was significantly reduced, however, no significant difference in overall mortality was observed between the two groups.
In conclusion, the authors recommend the initiation of high-dose atorvastatin “soon” after stroke or TIA. One can only conclude, based on these data, statin therapy should be initiated within six months of TIA or stroke, in accordance with the study design. There is retrospective data suggesting benefit to statin therapy initiated within four weeks following ischemic stroke, and there are prospective trials in process evaluating the potential benefits of statins initiated within 24 hours following ischemic stroke, however, no large, randomized, controlled trial can demonstrate the effect of statins when used as acute stroke therapy.9,12,13,17
Back to the Case
The patient described in our case has a history of TIA and experienced an acute coronary syndrome (NSTEMI) within the preceding 24 hours. He underwent a revascularization procedure (PCI with stent), and is on appropriate therapy, including dual anti-platelet therapy with aspirin and clopidogrel, a beta-blocker, and an angiotensin-converting enzyme inhibitor. Based on the data and conclusions of the MIRACL, PROVE IT-TIMI 22, and SPARCL trials, high-dose statin therapy with atorvastatin 80 mg/d should be initiated immediately in the patient in order to significantly reduce his risk of recurrent ischemic cardiovascular events and stroke following his acute coronary syndrome and TIA.
Bottom Line
Following ACS, high-dose statin therapy with 80 mg of atorvastatin per day should be initiated when the patient is still in the hospital, irrespective of baseline LDL level. Statin therapy should also strongly be considered for secondary stroke prevention in most patients with a history of stroke or transient ischemic attack. TH
Caleb Hale, MD, is a hospitalist at Beth Israel Deaconess Medical Center in Boston. Joseph Ming Wah Li is director of the hospital medicine program and associate chief, division of general medicine and primary care at Beth Israel Deaconess Medical Center in Boston, and assistant professor of Medicine at Harvard Medical School.
References
1. Scandinavian Simvastatin Survival Study Group. Randomised trial of cholesterol lowering in 4444 patients with coronary heart disease: the Scandinavian Simvastatin Survival Study (4S). Lancet 1994;344:1383-1389.
2. Sacks RM, Pfeffer MA, Moye LA, et al. The effect of pravastatin on coronary events after myocardial infarction in patients with average cholesterol levels. N Engl J Med 1996;335:1001-1009.
3. The Long-Term Intervention with Pravastatin in Ischaemic Disease (LIPID) Study Group. Prevention of cardiovascular events and death with pravastatin in patients with coronary heart disease and a broad range of initial cholesterol levels. N Engl J Med 1998;339:1349-1357.
4. Schwartz GG, Olsson AG, Ezekowitz MD, et al. Effects of atorvastatin on early recurrent ischemic events in acute coronary syndromes. The MIRACL study: a randomized controlled trial. JAMA. 2001;285:1711-1718.
5. Cannon CP, Braunwald E, McCabe CH, et al. Intensive versus moderate lipid lowering with statins after acute coronary syndromes. N Engl J Med. 2004;350:1495-1504.
6. Lemos JA, Blazing MA, Wiviott SD, et al. Early intensive vs. a delayed conservative simvastatin strategy in patients with acute coronary syndromes. Phase Z of the A to Z trial. JAMA. 2004;292:1307-1316.
7. Waters D, Schwartz GG, Olsson AG. The myocardial ischemia reduction with acute cholesterol lowering (MIRACL) trial: a new frontier for statins? Curr Control Trials Cardiovasc Med. 2001;2;111-114.
8. The Stroke Prevention by Aggressive Reduction in Cholesterol Levels (SPARCL) Investigators. High-dose atorvastatin after stroke or transient ischemic attack. N Engl J Med. 2006;355:549-559.
9. Moonis M, Kane K, Schwiderski U, Sandage BW, Fisher M. HMG-CoA reductase inhibitors improve acute ischemic stroke outcome. Stroke. 2005;36:1298-1300.
10. Elkind MS, Flint AC, Sciacca RR, Sacco RL. Lipid-lowering agent use at ischemic stroke onset is associated with decreased mortality. Neurology. 2005;65:253-258.
11. Vaughan CJ, Delanty N. Neuroprotective properties of statins in cerebral ischemia and stroke. Stroke. 1999;30:1969-1973.
12. Elkind MS, Sacco RL, MacArthur RB, et al. The neuroprotection with statin therapy for acute recovery trial (NeuSTART): an adaptive design phase I dose-escalation study of high-dose lovastatin in acute ischemic stroke. Int J Stroke. 2008;3:210-218.
13. Montaner J, Chacon P, Krupinski J, et al. Simvastatin in the acute phase of ischemic stroke: a safety and efficacy pilot trial. Eur J of Neurol. 2008;15:82-90.
14. Ridker PM, Cannon CP, Morrow D, et al. C-reactive protein levels and outcomes after statin therapy. N Engl J Med. 2005;352:20-28.
15. Pitt B, Loscalzo J, Ycas J, Raichlen JS. Lipid levels after acute coronary syndromes. JACC. 2008;51:1440-1445.
16. Wiviott SD, de Lemos JA, Cannon CP, et al. A tale of two trials: a comparison of the post-acute coronary syndrome lipid-lowering trials of A to Z and PROVE IT-TIMI 22. Circulation. 2006;113:1406-1414.
17. Elking MS. Statins as acute-stroke treatment. Int J Stroke. 2006;1:224-225.
Cultural Considerations
Sharnjit Grewal, MD, a hospitalist at Mercy Medical Group in Sacramento, Calif., is familiar with what he calls “the double-take.” A Sikh born and raised in California, Dr. Grewal wears a traditional turban and full beard. When he walks into the room, some patient’s simply don’t know what to make of him, he admits.
“It’s confusing—even to my Hindu and Sikh patients,” Dr. Grewal says. “They sometimes say, ‘You talk like an American, you’re obviously from the West, but you follow a faith from the East. The line between religion and culture is obscured.”
Although the medical community stresses cultural awareness and sensitivity, Dr. Grewal’s experience highlights the fine line between religion and culture, and the barriers standing stand in the way of cultural awareness.
Today, hospitals experience shifting patient demographics and a growing number of languages and dialects observed in the United States today. Between 1990-2000, the foreign-born population in the U.S. increased by 57%, compared with a 9.3% increase for the native population and a 13% increase for the total U.S. population, according to the U.S. Census Bureau.
Break Down Walls
When hospitalists and patients share a culture or language, the result can be extremely positive. In fact, the Joint Commission report states some hospitals in the United States are working to increase racial and ethnic similarities between staff and patient populations.
Joseph Li, MD, a hospitalist at Beth Israel Deaconess Medical Center in Boston, frequently works with Cantonese-speaking patients referred to the hospital by the healthcare clinic in Boston’s Chinatown section. When he greets patients in their native tongue, Dr. Li says he can feel their comfort level rise; even though he speaks what he calls “5-year-old Cantonese.”
“There is an improved therapeutic relationship when doctors and patients share a language, culture, or belief,” Dr. Li says. “There’s a level of comfort that you are going to be understood and nothing will be lost in translation.”
A patient’s culture may drive decisions contradictory to traditional Western medicine, and hospitalists need to make the time to listen and respond. Recently, Dr. Grewal treated a dying, elderly Asian patient whose family insisted on administering an unknown, water-like fluid to cure the loved one. First, the family requested giving the fluid to the patient by mouth. Dr. Grewal denied the request, and told them the water would end up in the patient’s lungs because he was comatose and could not swallow. Then, the family asked if they could add it to the intravenous line. Again, Dr. Grewal denied the request, and told them water in an un-buffered solution could be harmful to red blood cells.
“It was frustrating for them,” Dr. Grewal says. “I told them, ‘It’s not that I don’t believe the water will cure him. Maybe it will or maybe it won’t. But from a medical standpoint, I know there will be complications and I just cannot do this.’ ”
Eventually, the family asked if a tube could be inserted into the patient’s stomach. When the request was denied, the family decided on comfort care for their loved one. Eventually, he passed away. The family, Dr. Grewal says, was grateful for the hospital staff’s care and effort, even though their requests to administer the fluid were denied.
Difficult Cases
Firm cultural beliefs may lead patients to resist treatment. Manish Patel, MD, a hospitalist and assistant professor with the division of General Internal Medicine at the University of Medicine and Dentistry of New Jersey-Robert Wood Johnson Medical School in New Brunswick, N.J., recalls working with an elderly member of the Indian community who refused to be transferred to a rehabilitation facility. Dr. Patel took time to speak to the patient and learned she came from a tradition that encouraged younger generations to care for the elderly. The patient interpreted her transfer to a rehabilitation facility as a sign her family was abandoning her, Dr. Patel says.
“Sometimes you have to probe to learn more,” Dr. Patel says. “Once we understood her fears, we were able to convey to her that this was a temporary situation and that her family could not provide her with the services that she needed at that point in time.”
Dr. Patel also interacts with Hispanic and Indian patients—many of whom revere doctors and defer to them for treatment decisions. In these situations, he uses the same approach as he does with patients who question his treatment recommendations.
“The patient may defer to you, but it’s important to empower the patient and give them all the information they need to make major choices in their healthcare.”
Information Pipeline
Hospitalists may prefer to be upfront about a patient’s condition and treatment, however, cultural norms sometimes dictate who receives information—and how much. For example, Scott Enderby, DO, a hospitalist at Alta Bates Summit Medical Center in Berkeley, Calif., says some Asian families prefer medical staff deliver bad news about the patient to them first. The family then decides what they will tell the patient, he says.
These situations create challenges and opportunities, Enderby says. Medical staff tries to establish a patient-centric care system, so it is important to continue appropriate communication with the patient. It also is important for healthcare providers to avoid putting the family in the middle and marginalizing the patient, he says. Healthcare teams can become frustrated when family members are at odds about decisions and options, and the patient is not involved at the family’s request, he says. In these cases, Dr. Enderby sees an opportunity to further engage the family, and, therefore, the patient.
“Often, when there are cultural and language barriers, a disengaged family can make caring for the patient very challenging,” Dr. Enderby says. “Having the family involved can help everyone feel more aligned with a treatment plan or strategy.”
For Alpesh Amin, MD, associate professor of medicine and vice chair for Clinical Affairs and Quality in the Department of Medicine at the University of California Irvine School of Medicine, being aware of a patient’s cultural values is critical to quality care. As executive director of the hospitalist program at the UCI Medical Center in Orange, Calif., Dr. Amin helped develop curriculum to train students on how to collect “values history” from patients, which includes asking questions about religion and culture. Students document their own values history, and then ask the same questions of a patient. Students discuss patient care and the importance of these histories during small group sessions.
“Knowing a patient's cultural information is just as important as knowing their sexual history or drug history,” Dr. Amin says. “It’s another piece of information that helps you get to know them as a whole. Their overall care is more comprehensive, if you have this knowledge.” TH
Gina Gotsill is a journalist based in California.
Industry Innovator Eyes HM Challenges Ahead
Brian Bossard, MD, was practicing as a hospitalist before he even knew what a hospitalist was. In 1993, Dr. Bossard, then a private practice internist, initiated a contract with Lincoln General Hospital in Lincoln, Neb. He agreed to care for hospital patients who didn’t have physicians. The hospital signed the contract—three years before HM pioneer Bob Wachter, MD, professor and chief of the division of hospital medicine at the University of California San Francisco, former SHM president and author of the blog “Wachter’s World” (www.wachtersworld.com), coined the term “hospitalist.”
Dr. Bossard, director and CEO of Inpatient Physician Associates in Lincoln, recently spoke with The Hospitalist about being at the forefront of the hospital medicine movement.
Q: How did you come to form your own hospitalist group?
—Brian Bossard, MD
A: [Starting in 1993], I was providing hospital medicine service while at the same time working in a private practice model. I took care of my own patients and also took care of all the assigned patients through the hospital. During that period, I started getting referrals from other physicians who wanted to turn their patients’ care over to me. It became clear after just a few years of doing that I was getting very busy and that there was a need for a more formal hospital medicine program. So, beginning in 1998, I started going to national hospital medicine meetings. I took my hospital administrator with me to the first meeting, and during the next four years developed an infrastructure for a mature hospital medicine program.
Q: What trends have you identified in HM since that time?
A: In the case of academic medicine models, hospital medicine developed because they needed to have a system to provide a cap for the residents—both in terms of number of hours they worked and the number of patients they saw. That was a new development and one that wasn’t in place when I went through training.
Private practice or community-based hospitals had physicians who were no longer interested in providing community call for taking care of patients that didn’t have physicians, or maybe didn’t have insurance. Community hospitals were finding that many physicians were opting out of that community call so they needed hospital medicine support to take care of those patients.
Q: What is the most significant change you’ve witnessed?
A: It’s become clear hospital medicine programs not only provide staffing to take care of those patients who otherwise wouldn’t be taken care of, but also provide a structure to take care of patients better. Probably the most positive and meaningful change since the mid-’90s is that hospital medicine programs are seen as quality drivers, efficiency drivers, and as a source of leadership within hospital policy making and decision making.
Q: What are your responsibilities as CEO of your group?
A: I run the business from top to bottom. Since I started the group in 2002, we’ve grown from just six physicians to 18 physicians and three nurse coordinators. So, I’ve had an opportunity during the last seven years to develop leadership roles within our group and delegate some activities to other leaders in the group. Where I once oversaw every little detail, I am now able to turn over some things to other, very talented group members. What I really focus on now is recruitment, the clinical aspects, public relations, and those sorts of things. But I never lose sight of the importance of developing data to drive our decisions, so I’m very involved in that, as well. As we add more and more physicians, I have to dedicate more time to management of the group. My clinical time goes down as the group grows.
Q: You mentioned that you collect data?
A: I work with the folks in the IT and Division Analysis departments in the hospital to identify what data we can get, what is important for me to know … so we can make decisions for the better of the group and the hospital. Some of that involves knowing what time of the day we have the highest admissions consults and what days of the week we’re busiest, and then organizing our schedule accordingly. It’s important to look at numbers and data, as opposed to going by when you feel you’re busy and when you’re not, because sometimes the feel is different from what is actually happening.
Q: What are the challenges facing your HMG?
A: Recruitment is a huge challenge. The growth of hospital medicine is much greater than anticipated even five years ago. Many programs are understaffed right now. That’s not because they don’t have financing, but because they don’t have physicians available to staff the slots. When I started my group, I was able to recruit a strong, core group of five physicians in six months. I don’t think there is any way you could do that now. That’s a trend that’s changed for the worst. I don’t think internal medicine is going to be able to support the need for care providers within hospital medicine programs.
Q: How should hospital medicine groups look to fill their vacancies?
A: I think opportunities will exist for well-trained and motivated family medicine physicians. Many more rural or community-based hospitals are turning to family physicians to staff programs. Typically, family physicians represent only 3% of hospital medicine program slots. I see that percentage increasing fairly significantly in the next five years. TH