User login
Really, It’s Switch Tasking

It’s fitting that I’ve been interrupted many times while I’ve been writing this column. My topic is interruptions in the work of a hospitalist. I’ll leave it to you to judge whether the interruptions I suffered while writing have adversely affected the quality of this column. The more important question is how much the quality, efficiency and patient safety of hospitalists’ work suffers because of interruptions.
For the most part, the hospital where I worked as an orderly (how is that for an antiquated term!) in the 1970s was like a library; nursing stations usually were quiet and slow paced, well suited for concentration and focus. Today, the nursing station in a typical hospital looks more like the floor of the stock exchange, with many people trying to talk over each other and jostling for a position at a computer. People who study this kind of thing would say that we increasingly work in high-tempo settings with a high communication burden, and, as a result, our work has become increasingly “interrupt driven.”
It is tempting to say hospitalists (and emergency room doctors and others) have to do a lot of multitasking. But I think that we’re really “switch tasking” most of the time, rather than multitasking.1 Switch tasking means frequently changing tasks. With some regularity we stop in the middle of one task and switch our attention to another—and incur two costs in the process. One cost is the mental energy consumed and stress of frequently shifting our attention.
The other cost is that it is reasonably common that we fail to return to the original task, so it remains uncompleted. How often have you promised a patient you’d write a PRN order for a sleeping pill, but got interrupted and never circled back to write the order? And it is easy for most of us to think of similar errors with more significant consequences.
Kevin O’Leary and colleagues at Northwestern University in Evanston, Ill., conducted a time-motion study of hospitalists. It found hospitalists were interrupted by pages an average of 3.4 times per hour (+/- 1.5).2 Emergency room (ER) doctors face an environment similar to hospitalists, and one study found ER doctors were interrupted an average of once every 5 minutes, and two-thirds of the time did not return to the prior task.3
Interruptions vs. Sleep Depravation
I’ve found it difficult to adjust my work style and habits to keep up with the pace of change and the increasing frequency of interruptions. My first, and generally ineffective, impulse is to try and decrease the noise and interruptions by doing things like asking others to page me less often, and only for time-sensitive clinical issues and not for routine things. But the problem is that promptly addressing many of these interruptions is our job, not simply a distraction.
Even if we can’t make the interruptions go away, we can try to manage them. In 2005, I was thrilled to learn of an emerging field known as “interruption science.” For a really engaging look at this field, search the Internet for “Meet the Life Hackers,” an article by Clive Owen in the New York Times [Sunday] Magazine, October 16, 2005. It describes people who are devoting their research careers to understanding the best ways to manage interruptions and where our attention shifts next.
One workplace that has been studied extensively is the cockpit of fighter jets. They’re full of remarkable gadgets that provide constant information via lights and noisemaking devices, including one that sounds like the female voice on your car’s GPS navigator. But research showed that during times of high pilot workload, some of these alarms distracted the pilots from more important tasks and increased errors. One strategy has been to suppress some alarms when the jet is configured for a complex operation, such as dropping a precision bomb or landing.
Although I have absolutely no data to prove it, I suspect hospitalists’ high volume of interruptions increases the errors we make. In fact, frequent interruptions might lead to more problems and errors than the sleep deprivation that has received so much attention in the past few years.
Fixing the problem of sleep deprivation seems easy, at first. Just eliminate the long work periods. But that means moving toward more shift work, which decreases continuity and increases the potential for new problems, like fumbled handoffs. It is really tough to figure out how to optimally balance the competing needs of preventing sleep deprivation and maximizing continuity to the point that minimizes the errors and problems caused by each. And I think it’s even tougher to find solutions to reduce hospitalist interruptions and the adverse consequences.
Proactive Measures
Two strategies to minimize hospitalist interruptions have been used in a handful of places with some success. Neither is perfect, and both are difficult to implement. But each can serve as a starting place for brainstorming about where you could or should direct your efforts.
The first is to have a rounding assistant accompany each hospitalist throughout the day. This person:
- Doesn’t need any medical training and functions much like a mobile receptionist.
- Would hold the doctor’s pager and keep track of all incoming calls, some of which would be handled without involving the doctor. As an example, this assistant should be able to handle the “family is anxious and wants to know when you will be here” call without interrupting the doctor.
- Could find charts, look up test results on the computer, page consultants, etc.
All these things could decrease the hospitalist’s interruptions with little impact on others.
Although it sounds wonderful, a rounding assistant ends up being very expensive and few practices use them. Some practices have case managers dedicated to the hospitalists, which provide some rounding assistant functions in addition to their case management work.
A second strategy that can significantly influence interruptions is to implement a system of unit-based hospitalists, in which a given hospitalist has most patients on a single unit of the hospital. This can decrease the number of pages to the hospitalist, as well as influencing communication in other ways that impact interruptions. TH
Dr. Nelson has been a practicing hospitalist since 1988 and is co-founder and past president of SHM. He is a principal in Nelson/Flores Associates, a national hospitalist practice management consulting firm. He is also part of the faculty for SHM’s “Best Practices in Managing a Hospital Medicine Program” course. This column represents his views and is not intended to reflect an official position of SHM.
References
1. Crenshaw D. The Myth of Multitasking: How Doing it All Gets Nothing Done. Hoboken, NJ. Jossey-Boss; 2008.
2. O’Leary, KJ, Liebovitz DM, Baker, DW. How hospitalists spend their time: Insights on efficiency and safety. J Hosp Med. 2006;11(2);88-93.
3. Chisolm et. al. Emergency department workplace interruptions: Are emergency physicians “interrupt-driven” and “multitasking?” Acad Emerg Med. 2000;7:1239-1243.
Market Meltdown

The financial sector and Wall Street, as we know it, are gone. The carnage is breathtaking in its breadth, swiftness and finality. As a passive retirement investor, with an even more passive understanding of the world of finance, I was shocked when Bear Stearns collapsed. Then Lehman Brothers, a 158-year old investment firm failed, and Merrill Lynch narrowly avoided bankruptcy, albeit through a Bank of America buyout.
Questions swirled in my mind: How could a company like Lehman, which makes money by trading money, go bankrupt? How could they have survived the economic crises of 1873, 1929 and 1987 only to succumb in 2008? How could a company with billions of dollars in assets fail? How could an established company go from leader to loser so fast—sweeping the streets that they used to own?
If this calamity could befall presumably intelligent, highly educated, seasoned managers of Fortune 500 companies, could it happen to my company, the hospitalist group I direct? I have neither an MBA nor an undergraduate business degree; never set foot in the business school at my college. Truth be told, I don’t even balance my checkbook.
With the disclaimer that I know about as much about Wall Street’s operations as they know about mine, here are a few cautionary lessons I learned from watching this financial meltdown.
—Coldplay “Viva la Vida”
Liquidity and Reserves
It appears many of Wall Street’s problems can be traced to liquidity—that is having dollars held in reserve. Although sub-prime mortgages are at the center of this crisis, the reality is the vast majority of these loans are not in default. Instead, as big a contributor to this meltdown was the practice of lending money without liquid reserves to back those loans. Investment firms had plenty of assets, just not enough in reserves to cover a spat of delinquencies or a rush of withdrawals.
Hospitalist groups operate in similar ways, with the major difference being almost all of us lose money. In the most recent SHM Bi-Annual Survey on the State of the Hospital Medicine Movement, 85% of hospitalist groups reported an operating deficit. This means we require capital from an outside source to stay afloat. That someone, our creditor, is most often the hospital. Ninety-one percent of HM groups receive financial support from hospitals through offset agreements or an annual stipend.
Just like our Wall Street counterparts, HMGs have a ton of assets in the form of human capital, but often hold very little financial capital in reserve. So, if our investors suddenly pulled their support, the result might not be too dissimilar to what is happening on Wall Street. I’d venture a guess that very few hospitalist groups have enough money in reserve to weather a storm. Look at your balance sheet. Could your group handle a 20% cut in hospital support next year without having to lower salaries or cut hospitalists? If the answer is “no,” you probably could benefit from more reserves.
Understand Your Business
It seems so obvious, but to be successful you need a firm grasp of what you do. I have no doubt someone at Lehman understood credit derivatives, credit default swaps, and mortgage-backed securities. However, it is painfully clear they didn’t recognize all the implications of these products. For example, what would happen if a company that increasingly invested in sub-prime mortgages suddenly saw a rash of these investments go sour—namely, a rush of creditors wanting their money back—immediately? Bankruptcy, that’s what would—and did—happen.
This couldn’t happen to hospitalists, could it? Well, shockingly, 35% and 37% of hospitalist group leaders said they did not know their group’s annual professional fee revenues and expenses, respectively. It is, therefore, likely many leaders do not know the more granular data points necessary to have long-term success (i.e., payer mixes, service line profit margins, rates of quality adherence and reimbursement and denial rates). To understand the potential implications of not knowing your business, look no further than the current crisis on Wall Street.
Diversification
The old saw about not putting all your eggs in one basket seems as applicable to the credit crisis as it is to your retirement accounts. The more traditional banking institutions, such as Bank of America, appear as if they will survive in large part because they remained diversified. Although they engaged in sub-prime mortgages, they also maintained a large commercial banking operation that deposited savings and kept them in holding. The upshot? When creditors came calling, Bank of America had plenty of cash on hand.
I’m not suggesting hospitalist groups open a savings and loan, rather we diversify the services we offer to help soften potential future turmoil. I often hear from hospitalists who don’t want co-management, as it is not traditional medicine and it may subjugate them to their surgical colleagues. While the latter point is valid and must be mitigated, surgical co-management, stroke services, observation units, palliative care services, and preoperative clinics all serve as potential markets for diversification. We cannot predict how future market forces (e.g., Medicare coverage changes, payment bundling, disproportionate share cuts, etc.) will impact our practice; but we can increase our chances of future success by diversifying our business portfolio.
Although clinical diversification is important, don’t forget to grow your quality service line. I strongly believe those that can impact quality in meaningful and measurable ways will win in the end. Once the hospitalist market saturates, there will be competition and groups that have a track record for systematically improving outcomes will be the ones who continue to garner hospital funding.
I fundamentally believe in the strength of the hospitalist movement and doubt our business will ever experience the type of calamity that has ensnared the financial sector. However, it behooves us to learn from our fallen Wall Street brethren, lest we someday find ourselves sweeping the streets alongside them. TH
Dr. Glasheen is associate professor of medicine at the University of Colorado Denver, where he serves as director of the hospital medicine program and the hospitalist Training program, and as associate program director of the Internal Medicine Residency Program.
We’re All in This Together

I have been spending quite a lot of time “outside” of hospital medicine recently. I have spoken to a group of hospital CEOs in New York about the hospital of the future, and I have created a Webcast for hospital executives for the Ohio Hospital Association. Society of Hospital Medicine staff and I have met with senior leaders at the American College of Physician Executives (ACPE) and the Medical Group Management Association (MGMA) regarding partnerships with SHM and hospitalists. We have worked with the critical care societies about a common approach to the “never events” that Medicare has been proposing. And we have met with the American College of Physicians (ACP) and the American Association of Family Physicians (AAFP) about the Patient-Centered Medical Home (PCMH) that they hope will transform primary care.
There are common themes that seem to percolate through many of these meetings. Hospitalists are now practicing at many of our nation’s hospitals. More importantly, as medical care and hospital-based care are being transformed, hospitalists are central to this change on many levels.
Change is taking the form of new payment models. Medicare’s decision not to pay for conditions that are not present on admission (POA) and that should never (or rarely) occur in the hospital is driving hospital CEOs to change their hospital’s culture and processes out of financial necessity. This is a huge step up the quality improvement ladder from one or two patient safety nurses with clipboards and a checklist “documenting” that a specific quality improvement measure has been met. These changes might transform the very way hospitals view themselves and their critical mission. The new payment model will affect how hospitals are rewarded and perceived by their communities and, in the end, will change their business.
It is clear that hospital CEOs think pay for performance has been a distraction, bringing about no additional funding and failing to arouse hospital leadership to move forward to significantly improve clinical performance. It appears rewarding key hospital executives based on patient satisfaction scores, along with publishing hospital specific information in Hospital Consumer Assessment of Healthcare Providers and Systems (HCAHPS) data on the internet, has been more effective in driving tangible change at many hospitals.
More radical approaches are being considered in Washington. Some would fundamentally change the way payment flows to hospitals (and doctors). Sen. Max Baucus, chairman of the Senate Finance Committee, the group that determines Medicare funding, has held hearings on value based purchasing (VBP). SHM leaders have been there and testified. MedPAC, which advises Congress and Medicare, also is considering VBP as one of its recommendations for the future of payment reform. At its core, VBP would move away from simply paying because a visit was made or a procedure was performed to rewarding documented performance and outcomes.
VBP plays to the strengths of the mature hospital medicine group, where data collection, analysis, systems improvement, and change leadership are part of our DNA. It moves hospitalists from simply replacing the clinical roles previously performed by other physicians, be it primary care physicians (PCPs) or surgeons or subspecialists, to partnering with their hospitals and allied health team members to change the culture and performance of their institutions. This moves hospital medicine from a subsidized health profession to a core group of clinicians central to the hospital’s mission, reputation, and financial future.
Other payment changes, including bundling of both the facility fee (Medicare Part A) and the professional fee (Medicare Part B), further plants the hospitalist group firmly in the middle of hospital funding and allocation of manpower. Bundled payments would not necessarily flow to the hospital to distribute to the physicians, but more likely would be managed by a joint physician-hospital partnership. The entire enterprise (doctors and the hospital) would be rewarded for efficient and effective care (i.e., using the appropriate resources to generate the best outcomes.) Decisions would need to be made and negotiated to allocate funds to the hospital and to each physician who participated in the patient’s care, based on time, skill, and performance. With hospitalists taking an important role in most inpatient care, one can see how central they will be in this new system of payment.
But it would be naïve to think that today all hospitalists are ready to step up to the new challenges brought on by payment reform and the increasing demand for documented performance improvement and patient safety. That is where SHM and some of the partnerships we are entertaining come in.
SHM has seen hospitalists coming out of their residency training or from a previous practice mode entering hospital medicine as a career with enthusiasm and drive, but needing key new skills if they are to step up to and into new roles as change leaders at their hospitals. With this in mind, SHM has created our Practice Management Institute with training in starting, managing, growing, and improving a hospital medicine group, including front-end skills in billing and collecting, as well as dashboards for data collection and analysis, and taking the hospitalist enterprise to the next level.
Knowing that helping create the next generation of hospital medicine leaders and hospital leaders is a key competency for hospital medicine, SHM’s successful Leadership Academy already has started nearly 1,000 hospital medicine leaders in the right direction in the last four years. Understanding the growing need for trained leaders in quality improvement and patient safety, SHM has been providing courses for quality improvement leaders, as well as practical implementation tools and strategies in quality improvement and patient safety in Web based resource rooms, as well as mentored implementation strategies and expert training that gets results on a local level on the fronts lines where care is delivered and results matter.
Several things are clear right now.
- Hospital CEOs, the rest of the C-suite, medical staffs, and allied health recognize that hospitalists are not only part of their medical landscape, but a potential partner in many of the acute care changes coming to their hospitals.
- We are moving to a time where there is more action than talk about changing the way hospitals and their doctors are paid and what level of performance is expected, to a time where CMS and the Blues are making incremental changes that will reshape the way hospitals function.
- While the first steps may be CMS not paying for “never events” or CEO compensation being tied to patient satisfaction, more likely sooner than later we will see coverage for the 47 million uninsured, a revamping of primary care, a shift to value based purchasing, and with a bundling of payment for inpatient care.
- Some who are near the end of their professional careers may have the luxury of playing out the string and waiting out any changes. For hospitalists who are by and large at the beginning of their careers, and by the very virtue of their practice styles right smack in the middle of the hospital, literally and figuratively, this is not a choice but a destiny. We need to embrace change, prepare for our role, and create a future that works for our patients, our health communities, and ourselves.
And that is why SHM is seeking partners who can accelerate our production of training and strategies for our hospitalists on the front lines. It is why we are talking to hospitals at the American Hospital Association (AHA) and the C-suite at American College of Healthcare Executives (ACHE) and in New York and in Ohio and in the publications they read. It is why SHM is meeting with the PCP community at ACP and AAFP, and why we are trying to shape the rules of the road in quality improvement and patient safety at the ABIM and other certifying boards, at the Joint Commission, National Quality Forum (NQF), and the AMA’s Physician Consortium on Performance Improvement (PCPI). It is why we are looking to the MGMA and the ACPE and others who have a track record of educating, measuring, and credentialing physician leaders and administrators to help SHM craft the next set of resources you need.
There is no status quo any longer in health care. You are either moving forward or out of date and out of touch. Hospital medicine was born into these times of change (some would even say bred because of the necessity to do things differently.) This is our calling and our destiny. This won’t be easy. It never is. And SHM will be with you every step of the way. Just continue to tell us what you need and we will look for innovative ways to do our part on this incredible journey. TH
Dr. Wellikson is the CEO of SHM
When It Comes to Quality Measures, Size Matters
You work in a small rural hospital. In one year, you admit six patients with acute myocardial infarctions (AMI). You follow CMS and Hospital Quality Alliance guidelines for the eight process measures for AMI, and your hospital scores 100% for that year.
A neighboring hospital isn’t as lucky: One of its four AMI admits, a 99-year-old man, refuses a beta blocker at discharge. What could have been a perfect score (a beta blocker prescribed four out of a possible four times, or 100%), is now 75%.
A study released in June by Duke University Medical Center elucidates the challenges faced by small hospitals when they report performance measures. Smaller hospitals, according to the study, are more likely to rate as top performers when reporting on the eight AMI process measures.1 However, the authors conclude, reports such as those required by Medicare, which ignore denominator size when assessing process performance, can unfairly reward or penalize hospitals.
“The scores can be very misleading,” says Randy Ferrance, DC, MD, a hospitalist at the 67-bed Riverside Tappahannock Hospital in Tappahannock, Va. “If we miss aspirin on discharge for one patient and everything else was perfect, we have the potential to slide into a lower percentile, whereas larger hospitals can miss aspirin at discharge and do just fine.”
Small Denominators, Big Differences
Doug Koekkoek, MD, is in a unique position to see how performance and quality metrics vary by hospital size. As chief medical officer of the Providence Hospitalist Programs in Oregon, Dr. Koekkoek oversees two tertiary facilities, Providence Portland Medical Center (483 beds) and Providence St. Vincent Medical Center (523 beds), as well as a 77-bed community hospital (Providence Milwaukie Hospital), a 40-bed community hospital (Providence Newberg Medical Center), and a 24-bed critical access hospital (Providence Seaside Hospital).
“When we do a roll-up, looking at our appropriate care score, which looks at all the CMS metrics for AMI, congestive heart failure, and pneumonia, we can see that in the bigger institutions, where you have a much bigger denominator of patients who qualify for each diagnosis, the trends are fairly even,” Dr. Koekkoek says. “But in the smaller hospitals, there is much greater variability.”
Rather than focus on each month’s scores, he looks at trends for several months to get a better sense of how his hospitals rate. “You can run at 100% on the heart-failure measures for nine months and then, if your denominator is 10 cases in a quarter and you miss only two or three of the measures, all of a sudden, you’re in the 80% or 70% performance percentile,” he says. “You don’t get a full picture unless you’re looking back over the last six, eight, or 10 months.”
The American Hospital Association (AHA) recommends presenting data to consumers in the same way. “We encourage our hospitals to not let the data themselves tell the story, but to help set them in context and portray to the communities they serve exactly what the data mean,” says Nancy Foster, AHA’s vice president for quality and patient safety.
Foster concedes the issue raised in the Duke study, that quality data don’t reflect low case volumes, has plagued the data-reporting process, but the AHA believes the process should continue. “We firmly believe that all hospitals ought to be sharing good, reliable information on the quality of care they’re providing with the communities they serve,” she says.
Document Challenges
Conveying an accurate representation of your hospital starts with appropriate documentation, says Christian Voge, MD, a hospitalist with Central Coast Chest Consultants, which provides coverage to Sierra Vista Regional Medical Center and French Hospital Medical Center in San Luis Obispo, Calif.
He gives an example: An ACE inhibitor—one of the CMS care process measures for AMI—is contraindicated in a patient. “The way the rules are, if the physician does not document the reason for not giving the medication, this will look like you simply did not meet that measure and will show up as a deficiency.”
It’s similar to billing and coding processes, says hospitalist Joseph Babbitt, MD, who works at the 25-bed Blue Hill Memorial Hospital in Blue Hill, Maine, “It’s not about what you do. It’s about what you document,” he says. “You can provide ‘the best care,’ but if you didn’t write down why an ACE inhibitor was contraindicated and not given, this will not show up as ‘the best care.’ ”
Another complicating factor, in the opinion of Matthew Szvetecz, MD, a hospitalist at St. Mary Medical Center, a rural hospital with 142 beds in Walla Walla, Wash., is severity indexes for determining patients' underlying risk for complications and mortality “are very coarse–there could be small hospitals taking care of very sick patients that are not getting picked up because they do not have that level of detail in an interpretable format."
More Accurate Results
It’s true smaller hospitals are more vulnerable to large swings in performance ratings. However, with fewer staff who need to buy into the process, these hospitals may have an advantage over larger institutions when launching quality improvement initiatives. Case in point: Gifford Medical Center, a 25-bed critical access hospital in Randolph, Vt.
Hospitalist Josh Plavin, MD, MPH, who is board certified in internal medicine and pediatrics, serves as Gifford’s medical director. The current hospitalist program consists of one hospitalist and three physician assistants who provide round-the-clock coverage. For the hospital’s quality improvement effort, all admitting staff, including the eight emergency room providers, must use the hospital’s systemwide, CMS-compliant order set. In addition, quality management staff participate in multidisciplinary rounds and help track performance measures for patients admitted to the hospital. According to Dr. Plavin, the hospital has been 100% compliant with CMS measures the past three quarters since instituting this system.
Dr. Voge agrees smaller hospitals better lend themselves to quality improvement initiatives. “If you have only three or four hospitalists with a contractual arrangement with the hospital, they’re going to be a little more open to ensuring that their numbers–and the hospital’s numbers–look good,” he notes.
Reference
1. O’Brien SM, DeLong ER, and Peterson ED. Impact of case volume on hospital performance assessment. Arch Intern Med. June 2008;168(12):1277-1284.
One Size Does Not Fit All
When it comes to hospital medicine groups, size matters. Some physicians, like Jeffrey Hay, MD, senior vice president for medical operations and chief medical officer at Lakeside Comprehensive Healthcare in Glendale, Calif., say larger groups (i.e., those with 20 or more physicians) have the advantages of financial stability, better advancement opportunities and more support for physicians.
But Dr. Hay also sings the praises of smaller groups. A small hospital medicine group (HMG) can be a niche for those who seek particular geographic ties and a long-term commitment, he says.
Then again, a big hospital in an affluent coastal area of California, for example, has had a long-term relationship with its hospitalist group for more than 10 years. “The [hospitalists] made a decision,” Dr. Hay says. “They want to be there, they want to work and retire there. This is it; and it works for everybody.”
Which size works for you? The Hospitalist asked physicians who have experience with both large and small groups to comment about salary, shift coverage, advancement and research opportunities, and social networking. Perhaps their answers can help you decide.
Salary Expectation
Working at a smaller institution doesn’t necessarily mean receiving lower compensation, says Joe D. Metcalf II, MD, director of the five-physician HMG at Faith Regional Health Services in Norfolk, Neb. “Because recruiting hospitalists to any location is competitive, most recruiters understand they must offer a competitive salary and benefit package to their applicants.”
Salary discrepancies could, however, stem from geographic location of the group, differing workload expectations, or level of market saturation, says Brian Bossard, MD, director of Inpatient Physician Associates in Lincoln, Neb. “Salaries are increasing rapidly because of a rapid increase in the number of groups around the country,” he says.
In its annual survey of programs around the country, the Society of Hospital Medicine documents the normal salaries for different hospital medicine practices. The latest survey suggests the large-chain, independent groups have the highest average salaries. One factor affecting salary is the location: the farther away from an urban area a practice group is, sometimes the greater the salary because of added recruiting difficulties.
As a hospitalist moves from a small group to a large one, interest in the characteristics of an individual physician may be diminished. “The ability to negotiate a better salary by being a ‘good Joe’ is less important in a large group than in a small one,” Dr. Bossard says. In addition, fringe benefits of a small group might not be available in a larger group; in Dr. Bossard’s group of 20 hospitalists, an extra bonus is awarded as an end-of-the-year thanks for hard work. “That’s not part of contract, there’s no qualification for that except being a good member of the group. I doubt that would not happen in a large group,” he says.
If you are considering joining a large HMG, Dr. Hay suggests asking what role you will play in the direction of the organization and whether the possibility exists for eventual partnership or equity in the company.
Shift Coverage
Ease and availability of shift coverage varies greatly between small and large groups. In the latter, for example, physicians experience a good deal of schedule flexibility because more people can cover shifts or do the work. When Donna Beeson, DO, a hospitalist at Kadlec Medical Center in Richland, Wash., worked at the large St. Luke’s Health System in Kansas City, Mo., she had help in most aspects of practice.
“There was interventional radiology for all procedures, eICU [technology] to help with intensive care patients, a more experienced ancillary staff available for emergency situations, more partners to help out when your load gets to be too much,” Dr. Beeson says. She also had strong ancillary support at St. Luke’s, where three nurses were available to the HMG at all times.
Having so many people, however, prevented Dr. Beeson from learning her staff’s strengths and weaknesses. That’s where a smaller group has its advantages. What it lacks in physician and staff availability, it makes up for in operating as a cohesive unit, Dr. Metcalf says. “A small group of physicians is more likely to be more relationally connected and, therefore, more willing to provide help to their colleagues when special needs arise and patient-care assistance is needed,” he says.
The hospital medicine group at Riverside Tappahannock Hospital in Tappahannock, Va., exemplifies the small, cohesive group. Randy Ferrance, MD, medical director there, says having a small group made it easier to work out a three-weeks-on, one-week-off schedule (necessary because the physicians sometimes work 100-hour weeks).
In addition, though there are fewer hands in a smaller program, certain tasks, such as X-rays, reports and lab tests get accomplished with fewer hiccups. Plus, knowing the staff’s idiosyncrasies means understanding when a matter needs immediate attention or when it can be addressed later.
Dr. Beeson believes this phenomenon has made her a stronger doctor. “You know that you cannot always rely on someone else,” she says. “You realize that you have to do something or you have to make the diagnosis, because the consultant may not [do so] and you do not have a willing IR staff to help you with procedures.”
That means wearing many hats, an aspect of working in a small HMG that Dr. Ferrance says he loves. “I get to treat a lot of clinical cases that in a large hospital, a specialist might be called in to treat, whether that is necessary or not.”
One drawback to a smaller HMG is the difficulty transferring patients to bigger hospitals. It is more time consuming and challenging, Dr. Beeson says, and you lose the ability to follow through with a patient to the end of a diagnosis or disease process.
Advancement and Research Opportunities
It may seem like a no-brainer that opportunities for research and career advancement exist more within larger groups. This isn’t always the case, however, says Brian Wolfe, MD, a hospitalist with Cogent Healthcare who practices at Temple University in Philadelphia. “The ability for a group to offer protected time to do research may be more linked to the setting and schedule than whether a group is large or small.”
Of course, it doesn’t hurt to work at an institution that conducts a good deal of research, such as UMass Memorial Medical Center in Worcester Mass. Elizabeth Gundersen, MD, a hospitalist there, says she enjoys the large group’s abundant opportunities to participate in quality projects in areas of medicine that interest her. “I also enjoy having a large and diverse group of colleagues,” she adds. “I get to interact with my fellow hospitalists during the workday, whether it is to bounce ideas off them or just to socialize. There is a great amount of energy within the group.”
On the other end of the spectrum, hospitalists at smaller HMGs may have fewer hoops to jump through to get projects approved. “A smaller institution is often more amenable to the introduction of change,” says Dr. Metcalf, of Faith Regional Health Services, “which may be attractive to a hospitalist who has an interest in medical processes, quality and safety.” Dr. Ferrance adds, “We have very tight control of the hospital’s quality control because there are only four people who have to buy into a policy.”
Plus, a hospitalist at a smaller HMG quickly can establish a strong reputation, “which, in turn, provides venues for influence through involvement in committees,” Dr. Metcalf says. “An interested physician may be offered a position as a committee chairman, chief of medical staff or even as the vice president of medical affairs.”
Social Networking
In any sized group, social networking is key. Before joining the group at Temple, Dr. Wolfe thought physicians in a smaller group would automatically be closer than those in a large one. “I was surprised that we are so inter-relationally dependent and responsible to each other,” Dr. Wolfe says, “but that’s because there are so many inter-service hand-offs and trade-offs, and we see each other so much.”
Scheduling social events for 20-plus doctors and their families can be a challenge. Some, like Dr. Bossard, say it’s a priority, though it could mean orchestrating events for 75 people. “When that social connection is lost in a group,” Dr. Bossard says, “it may reflect burnout on the leader’s part.”
What is most important for any group, no matter its location or size, is having a forward-thinking leadership with operational expertise and a strong infrastructure. “If they don’t have that,” Dr. Hay says, “they may get displaced by big organizations, leaving the hospitalists locked out and scrambling for jobs.” TH
What interventions most effectively protect against contrast media-induced nephropathy?
Case
A 68-year-old diabetic woman hospitalized for non-ST-segment elevation myocardial infarction develops increasing chest pain despite maximal appropriate medical therapy and is referred for urgent coronary angiography. She is normotensive, weighs 60 kg, and is without signs of congestive heart failure on examination. The serum creatinine is 1.6 mg/dL (her baseline). What is her risk for contrast media-induced nephropathy (CIN)? What measures can be undertaken to reduce her risk?
Background
Radiocontrast agents are well-recognized nephrotoxins that can cause a usually reversible, non-oliguric form of renal failure within 24 hours and up to five days following administration. Contrast nephropathy is associated with longer hospital stays and higher mortality. The incidence varies widely according to patient characteristics and the type and quantity of contrast agent used.
The pathogenesis of CIN is not completely understood, but likely represents a combination of contrast-mediated renal vasoconstriction, oxidative damage, and direct cytotoxic effects. Newer low-osmolar or iso-osmolar contrast agents are associated with lower rates of CIN than high-osmolar contrast agents. Multiple pharmacologic strategies for CIN prevention have been investigated, with several important trials published in the past two years. This review summarizes the risk assessment and prophylactic strategies required for optimal protection of patients from CIN.
Assesment of Patient Risk
Contrast-induced nephropathy is defined variably in clinical trials, most commonly as a 25% increase in serum creatinine above baseline at 48 hours after contrast administration. The most important risk factor for CIN is pre-existing kidney disease—more specifically, a diminished glomerular filtration rate (GFR) below 60 mL/minute/1.73 m2 body surface area.1 The serum creatinine concentration can be misleading. Advancing age, female gender, low lean body mass, or unstable rising creatinine all can lead to overestimation of the GFR. The Modification of Diet in Renal Disease (MDRD) estimate of GFR and the Cockcroft-Gault estimate of creatinine clearance are calculated in a basic formula. (see Table 1, left)
Several other factors have been linked to increased risk for CIN. Table 2 (left) summarizes these risk factors and assigns them various point scores. In general, patients with chronic kidney disease or any of these risk factors should have a serum creatinine drawn before the contrast study to clarify their CIN risk and facilitate decisions regarding prophylaxis. Patients with a score of six or more are at substantial risk for CIN.1

Strategy for Prophylaxis
Low-osmolar and iso-osmolar contrast agents have been associated with lower rates of CIN compared to high-osmolar contrast. However, the referring hospitalist rarely determines the type and volume of contrast used. Fortunately, high-osmolar contrast is used infrequently today. The primary strategy for CIN prophylaxis is to:
1) Determine CIN risk using a validated tool (see Table 2).
2) If “at risk,” consider alternate diagnostic modalities that do not involve the intravenous administration of iodinated contrast. Consider delaying testing with contrast agents until potentially reversible conditions affecting GFR are addressed, such as volume depletion, recent contrast use, or concomitant use of nonsteroidal anti-inflammatory drugs or angiotensin-converting enzyme inhibitors.
3) Provide pharmacologic and intravenous fluid prophylaxis as described below.
Pharmacologic Prophylaxis
Multiple agents have been investigated in the prevention of CIN: mannitol, furosemide, theophylline, fenoldopam, dopamine, N-acetylcysteine, and others. The most effective noteworthy of these is N-acetylcysteine (NAC). The first major trial of NAC for CIN prevention was published in 2000.2 Since then, more than two dozen studies, mostly randomized controlled trials (RCTs), and nearly a dozen meta-analyses have been published, with inconsistent results.
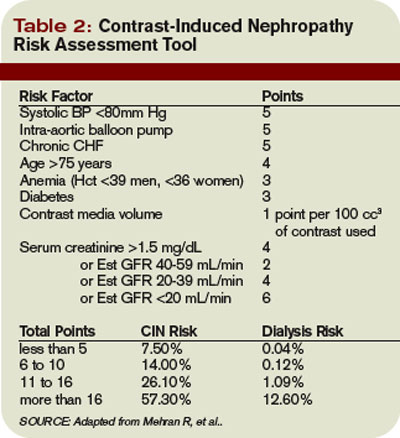
Of particular note, systematic reviews and meta-analyses have reached differing conclusions on the overall efficacy of NAC in the prevention of CIN. One recent study including NAC trials published before June 2006 concluded there has been “significant publication bias throughout the life cycle of this clinical question … further amplified by meta-analyses.”3 It has been estimated a single trial enrolling 1,800 patients (about 10 times larger than most completed trials) would be needed to definitively answer this question.4 The latest meta-analysis includes at least one large RCT of NAC not included in prior meta-analyses and concludes that NAC is effective in the prevention of CIN.5 The pooled relative risk for CIN was 0.62 (95% C.I. 0.44-0.88). These investigators concluded there was no significant publication bias.
Taken together, the primary literature and secondary meta-analyses suggest that NAC is probably effective in the prevention of CIN, although there may be some publication bias. Practically speaking, NAC is essentially without side effects, and the likelihood that it affords some degree of protection suggests it should be used routinely, unless or until larger studies demonstrate otherwise. A NAC dose of 1,200 mg twice daily beginning the day prior and continuing through the day of contrast administration was part of the successful protocol published by Brigouri, et al., in 2007.
Intravenous Crystalloids Trials
A landmark trial published in 1994 showed half-normal saline in 5% dextrose given 12 hours before and 12 hours after administering a radiocontrast agent was superior to half-normal saline plus mannitol or half-normal saline plus furosemide in preventing CIN.6 This regimen remained the standard of care until 2002, when a large RCT compared half- normal saline in 5% dextrose to isotonic normal saline in 1,620 patients undergoing coronary angioplasty.7 About 20% of the patients had underlying renal dysfunction and about 15% were diabetic. The rate of CIN decreased from 2% (14/698) to 0.7% (5/685), a modest-but-statistically-significant difference. After this study, practice generally shifted to using normal saline at 1 mL/kg/hr 12 hours before and 12 hours after contrast procedures. One notable review article published in 2006 concluded that isotonic saline was the best-proven strategy for the prevention of CIN.8
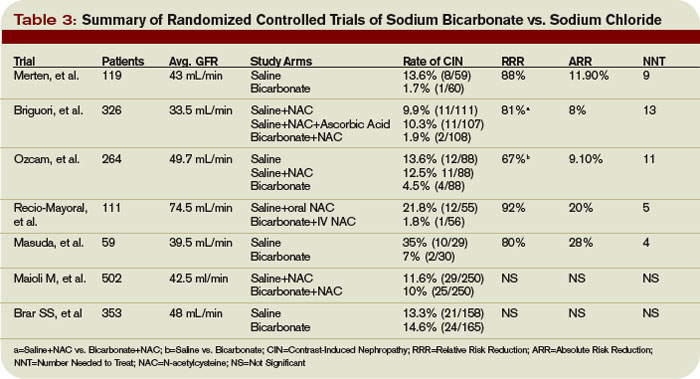
How does intravenous sodium chloride reduce the rate of CIN? The mechanism is unclear, but it may work simply by treating subclinical states of volume depletion. But as free radical oxidation has been implicated in the pathophysiology of CIN, investigators hypothesized that alkalinizing the urine (reducing free radical formation) with isotonic sodium bicarbonate might better protect patients from CIN than saline. In 2004, the first trial demonstrating the efficacy of bicarbonate was stopped early after the rate of CIN had decreased from 13.6% (8/59) in the saline arm to 1.7% (1/60) in the bicarbonate arm.9 The editorial accompanying this small trial cautioned “prospective confirmation should be required before accepting new therapies into routine clinical practice.”
In 2007, four prospective trials comparing various hydration regimens were published; each concluding that bicarbonate is superior to saline. The largest of these studies was the REMEDIAL trial.10 Patients were referred for coronary angiography and had a baseline serum creatinine of 2.0 mg/dl or higher or an estimated GFR below 40 mL/minute/1.73 m2 (or both). In double-blind fashion, patients were randomized to one of three preventative strategies: normal saline plus NAC (n=111), sodium bicarbonate plus NAC (n=108), or normal saline plus NAC plus ascorbic acid (n=107). The primary endpoint was defined as a 25% or higher increase in serum creatinine at 48 hours. This occurred in 9.9% (11/111) of the normal saline plus NAC group, 1.9% (2/108) of the sodium bicarbonate plus NAC group, and 10.3% (11/107) of the normal saline plus NAC plus ascorbic acid group (p=0.019 for sodium bicarbonate plus NAC versus normal saline plus NAC).
The sodium bicarbonate regimen was the same as that reported by Merten in 2004—namely, 154 mEq/L of sodium bicarbonate in 5% dextrose solution, given at 3 mL/kg/hr for one hour before contrast administration and 1 mL/kg/hr for six hours afterward. The saline regimen (154 mEq/L) was the same as that reported by Mueller in 2002—1 mL/kg/hr for 12 hours before contrast administration and 12 hours afterward. All patients received NAC at a dose of 1,200 mg twice daily the day before and the day of contrast administration. It is not possible to conclude from this trial whether sodium bicarbonate without NAC would have been as effective as the regimen studied. Ascorbic acid was included in this trial as another antioxidant to compare with NAC. The three other RCTs published in 2007 are summarized in Table 3 (see p. 21).11,12,13
Recently, two large RCTs of saline versus bicarbonate concluded there was no difference between the two.14,15 These trials were the largest to date, each of them single center and unblinded, and using slightly different methods than the REMEDIAL trial. CIN also was defined more broadly as a 0.5mg/dL or 25% change in creatinine within five days after contrast. Follow-up was only 88% in one trial. Nevertheless, these two new trials reach quite different conclusions than those before. Table 3 (see p. 21) summarizes seven RCTs of saline versus bicarbonate in the prevention of CIN. Differences in design and methods, definitions of CIN, completeness of follow-up, and severity of renal dysfunction among patients studied, make direct comparisons among these trials difficult. But as five of the seven RCTs of saline versus bicarbonate have concluded that bicarbonate is superior, and none have concluded saline is superior, this author recommends that at the present time intravenous sodium bicarbonate be used according to the Merten protocol when providing IVF for the prevention of CIN.
Back to the Case
The patient in the vignette has an estimated GFR of about 32 mL/min by the MDRD equation. With this level of renal dysfunction, the presence of diabetes mellitus, mellitus and assuming at least a 100 cc contrast bolus with the angiography, her risk for CIN is about 14% (eight points on the Mehran scale illustrated in Table 21). Alternatives to coronary angiography are limited in this example, and pharmacologic and IVF measures to prevent CIN are indicated. Borrowing from the regimen used in the REMEDIAL trial, she should ideally receive NAC 1200 mg orally BID for two days, starting one day prior to the procedure (in this case, would begin as soon as the risk for CIN is appreciated and continue for four doses). More importantly, she should receive sodium bicarbonate 154mEq/L at a rate of 3 mL/kg/hr one hour prior to contrast and 1 mL/kg/hr during and for six hours following the contrast procedure.
Bottom Line
Contrast nephropathy risk varies inversely with GFR and can be estimated according to a validated tool. Patients at risk for CIN should be identified early and offered NAC and sodium bicarbonate, if there are no alternatives to administering intravenous contrast. Intravenous saline also is effective, but may not be as effective as bicarbonate. TH
Dr. Anderson is an assistant professor of medicine at the University of Colorado Denver and the associate chief, Medical Service, at the Denver VA Medical Center.
References
1. Mehran R, Aymong ED, Nikolsky E, et al. A simple risk score for prediction of contrast-induced nephropathy after percutaneous coronary intervention: development and initial validation. J Am Coll Cardiol. 2004;44:1393-1399.
2. Tepel M, van der Giet M, Schwarzfeld C, et al. Prevention of radiographic-contrast-agent-induced reductions in renal function by acetylcysteine. N Engl J Med. 2000;343:180-184.
3. Vaitkus PT and Brar C. N-Acetylcysteine in the prevention of contrast-induced nephropathy: publication bias perpetuated by meta-analyses. Am Heart J. 2007;153:275-280.
4. Bagshaw SM, McAlister FA, Manns BJ, Ghali WA. Acetylcysteine in the prevention of contrast-induced nephropathy: a case study of the pitfalls in the evolution of evidence. Arch Intern Med. 2006;166:161-166.
5. Kelly AM, Dwamena B, Cronin P, Bernstein SJ and Carlos RC. Meta-analysis: effectiveness of drugs for preventing contrast-induced nephropathy. Ann Intern Med. 2008;148:284-294.
6. Solomon R, Werner C, Mann D, et al. Effects of saline, mannitol, and furosemide on acute decreases in renal function induced by radiocontrast agents. N Engl J Med. 1994;331:14-16.
7. Mueller C, Buerkle G, Buettner HJ, et al. Prevention of contrast-media associated nephropathy: randomized comparison of 2 hydration regimens in 1620 patients undergoing coronary angioplasty. Arch Intern Med. 2002;162:329-336.
8. Barrett BJ and Parfrey PS. Preventing nephropathy induced by contrast medium. N Engl J Med. 2006;354:379-386.
9. Merten GJ, Burgess WP, Gray LV, et al. Prevention of contrast-induced nephropathy with bicarbonate: a randomized controlled trial. JAMA. 2004;291:2328-2334.
10. Brigouri C, Airoldi F, D.Andrea, et al. Renal insufficiency following contrast media administration trial (remedial): a randomized comparison of 3 preventive strategies. Circulation. 2007;115:1211-1217.
11. Masuda M, Yamada T, Mine T, et al. Comparison of usefulness of sodium bicarbonate versus sodium chloride to prevent contrast-induced nephropathy in patients undergoing an emergent coronary procedure. Am J Cardiol. 2007;100:781-786.
12. Recio-Mayoral A, Chaparro M, Prado B, et al. The reno-protective effect of hydration with sodium bicarbonate plus n-acetylcysteine in patients undergoing emergency percutaneous coronary intervention: the reno study. J Am Coll Cardiol. 2007;49:1283-1288.
13. Ozcan EE, Guneri S, Akdeniz B, et al. Sodium bicarbonate, n-acetylcysteine, and saline for the prevention of radiocontrast-induced nephropathy. a comparison of 3 regimens for protecting contrast-induced nephropathy (sic) in patients undergoing coronary procedures. a single center prospective controlled trial. Am Heart J. 2007;154:539-544.
14. Maioli M, Toso A, Leoncini M, et al. Sodium bicarbonate versus saline for the prevention of contrast-induced nephropathy in patients with renal dysfunction undergoing coronary angiography or intervention. J Am Coll Cardiol. 2008;52:599-604.
15. Brar SS, Shen AYJ, Jorgensen MB, et al. Sodium bicarbonate vs. sodium chloride for the prevention of contrast medium-induced nephropathy in patients undergoing coronary angiography: a randomized trial. JAMA. 2008;300:1038-1046.
Case
A 68-year-old diabetic woman hospitalized for non-ST-segment elevation myocardial infarction develops increasing chest pain despite maximal appropriate medical therapy and is referred for urgent coronary angiography. She is normotensive, weighs 60 kg, and is without signs of congestive heart failure on examination. The serum creatinine is 1.6 mg/dL (her baseline). What is her risk for contrast media-induced nephropathy (CIN)? What measures can be undertaken to reduce her risk?
Background
Radiocontrast agents are well-recognized nephrotoxins that can cause a usually reversible, non-oliguric form of renal failure within 24 hours and up to five days following administration. Contrast nephropathy is associated with longer hospital stays and higher mortality. The incidence varies widely according to patient characteristics and the type and quantity of contrast agent used.
The pathogenesis of CIN is not completely understood, but likely represents a combination of contrast-mediated renal vasoconstriction, oxidative damage, and direct cytotoxic effects. Newer low-osmolar or iso-osmolar contrast agents are associated with lower rates of CIN than high-osmolar contrast agents. Multiple pharmacologic strategies for CIN prevention have been investigated, with several important trials published in the past two years. This review summarizes the risk assessment and prophylactic strategies required for optimal protection of patients from CIN.
Assesment of Patient Risk
Contrast-induced nephropathy is defined variably in clinical trials, most commonly as a 25% increase in serum creatinine above baseline at 48 hours after contrast administration. The most important risk factor for CIN is pre-existing kidney disease—more specifically, a diminished glomerular filtration rate (GFR) below 60 mL/minute/1.73 m2 body surface area.1 The serum creatinine concentration can be misleading. Advancing age, female gender, low lean body mass, or unstable rising creatinine all can lead to overestimation of the GFR. The Modification of Diet in Renal Disease (MDRD) estimate of GFR and the Cockcroft-Gault estimate of creatinine clearance are calculated in a basic formula. (see Table 1, left)
Several other factors have been linked to increased risk for CIN. Table 2 (left) summarizes these risk factors and assigns them various point scores. In general, patients with chronic kidney disease or any of these risk factors should have a serum creatinine drawn before the contrast study to clarify their CIN risk and facilitate decisions regarding prophylaxis. Patients with a score of six or more are at substantial risk for CIN.1
Strategy for Prophylaxis
Low-osmolar and iso-osmolar contrast agents have been associated with lower rates of CIN compared to high-osmolar contrast. However, the referring hospitalist rarely determines the type and volume of contrast used. Fortunately, high-osmolar contrast is used infrequently today. The primary strategy for CIN prophylaxis is to:
1) Determine CIN risk using a validated tool (see Table 2).
2) If “at risk,” consider alternate diagnostic modalities that do not involve the intravenous administration of iodinated contrast. Consider delaying testing with contrast agents until potentially reversible conditions affecting GFR are addressed, such as volume depletion, recent contrast use, or concomitant use of nonsteroidal anti-inflammatory drugs or angiotensin-converting enzyme inhibitors.
3) Provide pharmacologic and intravenous fluid prophylaxis as described below.
Pharmacologic Prophylaxis
Multiple agents have been investigated in the prevention of CIN: mannitol, furosemide, theophylline, fenoldopam, dopamine, N-acetylcysteine, and others. The most effective noteworthy of these is N-acetylcysteine (NAC). The first major trial of NAC for CIN prevention was published in 2000.2 Since then, more than two dozen studies, mostly randomized controlled trials (RCTs), and nearly a dozen meta-analyses have been published, with inconsistent results.
Of particular note, systematic reviews and meta-analyses have reached differing conclusions on the overall efficacy of NAC in the prevention of CIN. One recent study including NAC trials published before June 2006 concluded there has been “significant publication bias throughout the life cycle of this clinical question … further amplified by meta-analyses.”3 It has been estimated a single trial enrolling 1,800 patients (about 10 times larger than most completed trials) would be needed to definitively answer this question.4 The latest meta-analysis includes at least one large RCT of NAC not included in prior meta-analyses and concludes that NAC is effective in the prevention of CIN.5 The pooled relative risk for CIN was 0.62 (95% C.I. 0.44-0.88). These investigators concluded there was no significant publication bias.
Taken together, the primary literature and secondary meta-analyses suggest that NAC is probably effective in the prevention of CIN, although there may be some publication bias. Practically speaking, NAC is essentially without side effects, and the likelihood that it affords some degree of protection suggests it should be used routinely, unless or until larger studies demonstrate otherwise. A NAC dose of 1,200 mg twice daily beginning the day prior and continuing through the day of contrast administration was part of the successful protocol published by Brigouri, et al., in 2007.
Intravenous Crystalloids Trials
A landmark trial published in 1994 showed half-normal saline in 5% dextrose given 12 hours before and 12 hours after administering a radiocontrast agent was superior to half-normal saline plus mannitol or half-normal saline plus furosemide in preventing CIN.6 This regimen remained the standard of care until 2002, when a large RCT compared half- normal saline in 5% dextrose to isotonic normal saline in 1,620 patients undergoing coronary angioplasty.7 About 20% of the patients had underlying renal dysfunction and about 15% were diabetic. The rate of CIN decreased from 2% (14/698) to 0.7% (5/685), a modest-but-statistically-significant difference. After this study, practice generally shifted to using normal saline at 1 mL/kg/hr 12 hours before and 12 hours after contrast procedures. One notable review article published in 2006 concluded that isotonic saline was the best-proven strategy for the prevention of CIN.8
How does intravenous sodium chloride reduce the rate of CIN? The mechanism is unclear, but it may work simply by treating subclinical states of volume depletion. But as free radical oxidation has been implicated in the pathophysiology of CIN, investigators hypothesized that alkalinizing the urine (reducing free radical formation) with isotonic sodium bicarbonate might better protect patients from CIN than saline. In 2004, the first trial demonstrating the efficacy of bicarbonate was stopped early after the rate of CIN had decreased from 13.6% (8/59) in the saline arm to 1.7% (1/60) in the bicarbonate arm.9 The editorial accompanying this small trial cautioned “prospective confirmation should be required before accepting new therapies into routine clinical practice.”
In 2007, four prospective trials comparing various hydration regimens were published; each concluding that bicarbonate is superior to saline. The largest of these studies was the REMEDIAL trial.10 Patients were referred for coronary angiography and had a baseline serum creatinine of 2.0 mg/dl or higher or an estimated GFR below 40 mL/minute/1.73 m2 (or both). In double-blind fashion, patients were randomized to one of three preventative strategies: normal saline plus NAC (n=111), sodium bicarbonate plus NAC (n=108), or normal saline plus NAC plus ascorbic acid (n=107). The primary endpoint was defined as a 25% or higher increase in serum creatinine at 48 hours. This occurred in 9.9% (11/111) of the normal saline plus NAC group, 1.9% (2/108) of the sodium bicarbonate plus NAC group, and 10.3% (11/107) of the normal saline plus NAC plus ascorbic acid group (p=0.019 for sodium bicarbonate plus NAC versus normal saline plus NAC).
The sodium bicarbonate regimen was the same as that reported by Merten in 2004—namely, 154 mEq/L of sodium bicarbonate in 5% dextrose solution, given at 3 mL/kg/hr for one hour before contrast administration and 1 mL/kg/hr for six hours afterward. The saline regimen (154 mEq/L) was the same as that reported by Mueller in 2002—1 mL/kg/hr for 12 hours before contrast administration and 12 hours afterward. All patients received NAC at a dose of 1,200 mg twice daily the day before and the day of contrast administration. It is not possible to conclude from this trial whether sodium bicarbonate without NAC would have been as effective as the regimen studied. Ascorbic acid was included in this trial as another antioxidant to compare with NAC. The three other RCTs published in 2007 are summarized in Table 3 (see p. 21).11,12,13
Recently, two large RCTs of saline versus bicarbonate concluded there was no difference between the two.14,15 These trials were the largest to date, each of them single center and unblinded, and using slightly different methods than the REMEDIAL trial. CIN also was defined more broadly as a 0.5mg/dL or 25% change in creatinine within five days after contrast. Follow-up was only 88% in one trial. Nevertheless, these two new trials reach quite different conclusions than those before. Table 3 (see p. 21) summarizes seven RCTs of saline versus bicarbonate in the prevention of CIN. Differences in design and methods, definitions of CIN, completeness of follow-up, and severity of renal dysfunction among patients studied, make direct comparisons among these trials difficult. But as five of the seven RCTs of saline versus bicarbonate have concluded that bicarbonate is superior, and none have concluded saline is superior, this author recommends that at the present time intravenous sodium bicarbonate be used according to the Merten protocol when providing IVF for the prevention of CIN.
Back to the Case
The patient in the vignette has an estimated GFR of about 32 mL/min by the MDRD equation. With this level of renal dysfunction, the presence of diabetes mellitus, mellitus and assuming at least a 100 cc contrast bolus with the angiography, her risk for CIN is about 14% (eight points on the Mehran scale illustrated in Table 21). Alternatives to coronary angiography are limited in this example, and pharmacologic and IVF measures to prevent CIN are indicated. Borrowing from the regimen used in the REMEDIAL trial, she should ideally receive NAC 1200 mg orally BID for two days, starting one day prior to the procedure (in this case, would begin as soon as the risk for CIN is appreciated and continue for four doses). More importantly, she should receive sodium bicarbonate 154mEq/L at a rate of 3 mL/kg/hr one hour prior to contrast and 1 mL/kg/hr during and for six hours following the contrast procedure.
Bottom Line
Contrast nephropathy risk varies inversely with GFR and can be estimated according to a validated tool. Patients at risk for CIN should be identified early and offered NAC and sodium bicarbonate, if there are no alternatives to administering intravenous contrast. Intravenous saline also is effective, but may not be as effective as bicarbonate. TH
Dr. Anderson is an assistant professor of medicine at the University of Colorado Denver and the associate chief, Medical Service, at the Denver VA Medical Center.
References
1. Mehran R, Aymong ED, Nikolsky E, et al. A simple risk score for prediction of contrast-induced nephropathy after percutaneous coronary intervention: development and initial validation. J Am Coll Cardiol. 2004;44:1393-1399.
2. Tepel M, van der Giet M, Schwarzfeld C, et al. Prevention of radiographic-contrast-agent-induced reductions in renal function by acetylcysteine. N Engl J Med. 2000;343:180-184.
3. Vaitkus PT and Brar C. N-Acetylcysteine in the prevention of contrast-induced nephropathy: publication bias perpetuated by meta-analyses. Am Heart J. 2007;153:275-280.
4. Bagshaw SM, McAlister FA, Manns BJ, Ghali WA. Acetylcysteine in the prevention of contrast-induced nephropathy: a case study of the pitfalls in the evolution of evidence. Arch Intern Med. 2006;166:161-166.
5. Kelly AM, Dwamena B, Cronin P, Bernstein SJ and Carlos RC. Meta-analysis: effectiveness of drugs for preventing contrast-induced nephropathy. Ann Intern Med. 2008;148:284-294.
6. Solomon R, Werner C, Mann D, et al. Effects of saline, mannitol, and furosemide on acute decreases in renal function induced by radiocontrast agents. N Engl J Med. 1994;331:14-16.
7. Mueller C, Buerkle G, Buettner HJ, et al. Prevention of contrast-media associated nephropathy: randomized comparison of 2 hydration regimens in 1620 patients undergoing coronary angioplasty. Arch Intern Med. 2002;162:329-336.
8. Barrett BJ and Parfrey PS. Preventing nephropathy induced by contrast medium. N Engl J Med. 2006;354:379-386.
9. Merten GJ, Burgess WP, Gray LV, et al. Prevention of contrast-induced nephropathy with bicarbonate: a randomized controlled trial. JAMA. 2004;291:2328-2334.
10. Brigouri C, Airoldi F, D.Andrea, et al. Renal insufficiency following contrast media administration trial (remedial): a randomized comparison of 3 preventive strategies. Circulation. 2007;115:1211-1217.
11. Masuda M, Yamada T, Mine T, et al. Comparison of usefulness of sodium bicarbonate versus sodium chloride to prevent contrast-induced nephropathy in patients undergoing an emergent coronary procedure. Am J Cardiol. 2007;100:781-786.
12. Recio-Mayoral A, Chaparro M, Prado B, et al. The reno-protective effect of hydration with sodium bicarbonate plus n-acetylcysteine in patients undergoing emergency percutaneous coronary intervention: the reno study. J Am Coll Cardiol. 2007;49:1283-1288.
13. Ozcan EE, Guneri S, Akdeniz B, et al. Sodium bicarbonate, n-acetylcysteine, and saline for the prevention of radiocontrast-induced nephropathy. a comparison of 3 regimens for protecting contrast-induced nephropathy (sic) in patients undergoing coronary procedures. a single center prospective controlled trial. Am Heart J. 2007;154:539-544.
14. Maioli M, Toso A, Leoncini M, et al. Sodium bicarbonate versus saline for the prevention of contrast-induced nephropathy in patients with renal dysfunction undergoing coronary angiography or intervention. J Am Coll Cardiol. 2008;52:599-604.
15. Brar SS, Shen AYJ, Jorgensen MB, et al. Sodium bicarbonate vs. sodium chloride for the prevention of contrast medium-induced nephropathy in patients undergoing coronary angiography: a randomized trial. JAMA. 2008;300:1038-1046.
A Truly Different World
(Maj) Heather Cereste, MD, chair of the Bioethics Committee at Wilford Hall Medical Center at Lackland Air Force Base near San Antonio, Texas, and a member of Team Hospitalist, is the only geriatric-trained internist in the U.S. Air Force. From January through May 2007, she served as the attending primary care physician at Balad Trauma Hospital in Balad, Iraq. She recently spoke with The Hospitalist about her experience as a wartime physician.
Q: What motivated you to join the Air Force?
A: I talked to the Air Force near end of third year in residency. A number of things played into my decision. I was in Manhattan during 9/11 and got caught up in the surge of patriotism. I had thought about the military before, and was at a point when I was about to enter geriatrics and wasn’t sure if wanted to go into the traditional workforce or explore something else. I joined the reserves in 2004 and went active in 2006. To be honest with you, I never thought I would be deployed to a combat zone.
—Heather Cereste, MD
Q: What type of training did you receive before going to Iraq?
A: I was just undergoing the credentialing process when I was asked by my commander [to] deploy with her in a few months. I was a little shocked and taken aback, and didn’t feel at all prepared. So I inquired about further training and was referred to the shock trauma group in Baltimore, Md. It was the closest I could get to warfare type of injuries because it’s an urban warfare they fight in Baltimore. There, I was able to gain confidence in doing some procedures, including chest tubes, and refreshing myself about central lines and the acuity of care.
Q: What was it like working in Iraq?
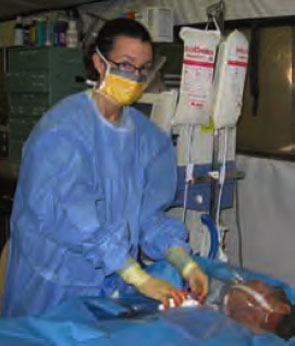
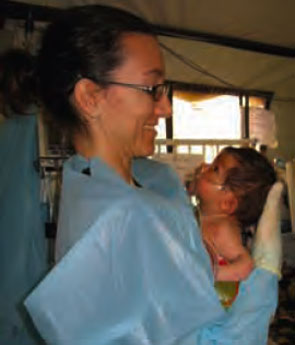
A: Our team worked seven days a week in the intensive care unit. We were on call every fifth night, overnight. We took care of the critically ill patients who came in through ER or who were directed to us. For the most part, we interacted with the coalition people for only 24–48 hours before they were transported out. The American and British people often went to Germany for more definitive care.
Q: What medical conditions did you see?
A: Over five months we managed about 528 critically ill people. There were certainly a lot of postoperative cases. We took care of burns and head wounds, which were increasing in number, a lot of limb amputations, as well as blast injuries and gunshot wounds. Civilians would present at our gates and we could triage them, if we had enough room.
Q: Did you feel like you were in a war zone?
A: It was very surreal. I was one of the last rotations to go when it was a tent hospital, so when we had rain and weather, we’d have to deal with floods, etc. It was a very rustic environment; there was dust was everywhere. The helicopters would come in and land right outside our tents.
Our hospital was right next to the wire–that’s a barbed wire fence that separated our base from the outside of the base–so we heard machine guns constantly while we were doing our rounds. We also got mortared frequently. Disgruntled people on the other side would set up across the river. They had some Russian mortars that they would throw over to our side. Whenever we could identify that the mortars were coming over the wall, sirens would go off and we’d have to dive for cover.
You’re constantly reminded of war, if not by the sounds, than certainly with the injuries. And people were carrying their guns all the time. It was strange to be a physician carrying a gun.
Q: How did your background in geriatrics come into play?
A: Believe it or not, many of the Iraqi civilians we treated were not chronically aged, but were physiology aged. We saw a lot of geriatric syndromes, even in 45-year-olds. Diet and access to care were common issues.
Q: Did you have enough resources?
A: As far as combat hospitals go, in my limited experience, I think we had excellent resources. But sometimes, if patients required extended intensive care and if we didn’t have the dialysis or the level of burn care, we just couldn’t treat them. It was a challenge every day to deal with certain patients who we knew under normal circumstances we could take care of, but because of the circumstance we had to stop care. That made it really hard.
Q: Is there one case that stands out as an example of what can be done in a combat zone?
A: There was one young baby who was a medical case. He was 28 days old when he first presented. He came to the gate with his parents with an infected arm. He had been seen at an outside facility and was treated for some kind of infection.
We thought from an initial admitting diagnosis that he had pericardial infusion. He had a long, protracted course where he required intubation. He was quite the enigma, and required a lot of attention and care and resources. Everyone at the hospital, from the nursing staff, to the medical technicians, to chaplains, would stop by say hello to the baby. We all did our best to keep him alive. He ended up getting discharged; the last we heard he was doing all right. My hope is that he would grow very strong.
It was nice to have a child around. It was also great because the family had entrusted us to take care of him. They seemed grateful when they were finally able to take him home.
Q: Would you go back?
A: Definitely. It was probably the most amazing experience in my life, professional and personally. It’s a wonderful place to do medicine because you’re forced to practice outside your comfort zone. You also feel that your efforts are playing a positive role. You get out of that whole humdrum, “beaten-by-the-system” feeling that I think people may feel here. I got to meet interesting people and be a part of history. And I survived, so that was good. TH
(Maj) Heather Cereste, MD, chair of the Bioethics Committee at Wilford Hall Medical Center at Lackland Air Force Base near San Antonio, Texas, and a member of Team Hospitalist, is the only geriatric-trained internist in the U.S. Air Force. From January through May 2007, she served as the attending primary care physician at Balad Trauma Hospital in Balad, Iraq. She recently spoke with The Hospitalist about her experience as a wartime physician.
Q: What motivated you to join the Air Force?
A: I talked to the Air Force near end of third year in residency. A number of things played into my decision. I was in Manhattan during 9/11 and got caught up in the surge of patriotism. I had thought about the military before, and was at a point when I was about to enter geriatrics and wasn’t sure if wanted to go into the traditional workforce or explore something else. I joined the reserves in 2004 and went active in 2006. To be honest with you, I never thought I would be deployed to a combat zone.
—Heather Cereste, MD
Q: What type of training did you receive before going to Iraq?
A: I was just undergoing the credentialing process when I was asked by my commander [to] deploy with her in a few months. I was a little shocked and taken aback, and didn’t feel at all prepared. So I inquired about further training and was referred to the shock trauma group in Baltimore, Md. It was the closest I could get to warfare type of injuries because it’s an urban warfare they fight in Baltimore. There, I was able to gain confidence in doing some procedures, including chest tubes, and refreshing myself about central lines and the acuity of care.
Q: What was it like working in Iraq?
A: Our team worked seven days a week in the intensive care unit. We were on call every fifth night, overnight. We took care of the critically ill patients who came in through ER or who were directed to us. For the most part, we interacted with the coalition people for only 24–48 hours before they were transported out. The American and British people often went to Germany for more definitive care.
Q: What medical conditions did you see?
A: Over five months we managed about 528 critically ill people. There were certainly a lot of postoperative cases. We took care of burns and head wounds, which were increasing in number, a lot of limb amputations, as well as blast injuries and gunshot wounds. Civilians would present at our gates and we could triage them, if we had enough room.
Q: Did you feel like you were in a war zone?
A: It was very surreal. I was one of the last rotations to go when it was a tent hospital, so when we had rain and weather, we’d have to deal with floods, etc. It was a very rustic environment; there was dust was everywhere. The helicopters would come in and land right outside our tents.
Our hospital was right next to the wire–that’s a barbed wire fence that separated our base from the outside of the base–so we heard machine guns constantly while we were doing our rounds. We also got mortared frequently. Disgruntled people on the other side would set up across the river. They had some Russian mortars that they would throw over to our side. Whenever we could identify that the mortars were coming over the wall, sirens would go off and we’d have to dive for cover.
You’re constantly reminded of war, if not by the sounds, than certainly with the injuries. And people were carrying their guns all the time. It was strange to be a physician carrying a gun.
Q: How did your background in geriatrics come into play?
A: Believe it or not, many of the Iraqi civilians we treated were not chronically aged, but were physiology aged. We saw a lot of geriatric syndromes, even in 45-year-olds. Diet and access to care were common issues.
Q: Did you have enough resources?
A: As far as combat hospitals go, in my limited experience, I think we had excellent resources. But sometimes, if patients required extended intensive care and if we didn’t have the dialysis or the level of burn care, we just couldn’t treat them. It was a challenge every day to deal with certain patients who we knew under normal circumstances we could take care of, but because of the circumstance we had to stop care. That made it really hard.
Q: Is there one case that stands out as an example of what can be done in a combat zone?
A: There was one young baby who was a medical case. He was 28 days old when he first presented. He came to the gate with his parents with an infected arm. He had been seen at an outside facility and was treated for some kind of infection.
We thought from an initial admitting diagnosis that he had pericardial infusion. He had a long, protracted course where he required intubation. He was quite the enigma, and required a lot of attention and care and resources. Everyone at the hospital, from the nursing staff, to the medical technicians, to chaplains, would stop by say hello to the baby. We all did our best to keep him alive. He ended up getting discharged; the last we heard he was doing all right. My hope is that he would grow very strong.
It was nice to have a child around. It was also great because the family had entrusted us to take care of him. They seemed grateful when they were finally able to take him home.
Q: Would you go back?
A: Definitely. It was probably the most amazing experience in my life, professional and personally. It’s a wonderful place to do medicine because you’re forced to practice outside your comfort zone. You also feel that your efforts are playing a positive role. You get out of that whole humdrum, “beaten-by-the-system” feeling that I think people may feel here. I got to meet interesting people and be a part of history. And I survived, so that was good. TH
Reimbursement Rights
Recent changes in healthcare have forced academic medical centers to seek additional resources in the delivery of quality care. In response to internal and external pressures to minimize length of stay, adhere to limitations on the maximum number of admitted patients, focus on evidence-based care, and improve outcomes of care, hospitalists have incorporated non-physician providers (NPPs), such as acute care nurse practitioners (ACNPs), into their group practices.1
Whereas traditional nurse practitioners focus on the promotion of health and management of chronic illness, ACNPs focus on the care of acutely ill patients. Hospitalists utilize NPPs to expand medical service capacity and improve the efficiency and quality of patient care.2
Research indicates physician/nurse practitioner collaboration in the multidisciplinary management of hospitalized medical patients reduces length of stay and improves hospital profit without altering readmissions or mortality.3 Billing and documentation standards for NPP services must comply with current state and federal regulations. Hospitalist groups should become familiar with these guidelines prior to billing for NPP services involved in this patient care model.
The following highlights inpatient services provided by nurse practitioners (NPs) and physician assistants (PAs).
Covered Services
Medicare pays for services considered reasonable and necessary and not otherwise excluded from coverage. NPPs may provide any service permitted by the state scope of practice and performed in conjunction with the appropriate level of supervision or collaboration, as outlined in licensure or billing requirements. Being only limited by state and/or facility regulations, NPP services comprise visits or procedures typically rendered by ancillary staff or considered a physician service (a doctor of medicine, MD, or osteopathy, DO). Additionally, NPPs must meet the insurer-specified qualifications.
Independent Billing
Since 1998, designated NPPs are allowed to submit Medicare Part B claims for services, including procedures, provided in any inpatient or outpatient setting. For billing purposes, these “independent” services do not require physician involvement (e.g. physician initiation of care plan, physician-patient encounter, or physician presence on patient floor/unit) unless otherwise specified by state legislation or facility standards of practice. NPPs do not need to be employed by the physician group. The entity employing the physician group also may employ the NPP.
Claim requirements mandate the use of a national provider identifier (NPI) on all claims, therefore, all NPPs receive an NPI for claim submission. However, not all NPPs may directly bill Medicare or receive direct payment (e.g., physician assistant).1 In this situation, the NPP employer (i.e., physician or group), reports the service with the physician or group provider number and the NPP’s NPI included for identification of who actually provided the service.
Medicare Part B processes NPP claims reported under the independent billing option. Duplicate payments from any other Medicare Part A or Part B source is strictly prohibited and may result in refunds, fines and penalties. Generally, Medicare payment for NPP services is limited to 85% of the allowable physician rate. Financial impact of the 15% rate reduction is typically offset by the increase in physician time. Physicians may use this time to provide more comprehensive or complex services (admissions or consultations), potentially generating more revenue. Consistent with all provider documentation, NPP documentation must support the reported service.
Shared/Split Billing
The shared/split billing option first appeared in 2002 to address facility-based services provided to a single patient by an NPP and physician from the same group practice on the same calendar day. This option only applies to evaluation and management services provided in an emergency department, outpatient or inpatient hospital. It excludes consultations and critical care services. Unlike the independent billing option, the shared/split billing option only involves service provided by nurse practitioners, physician assistants, clinical nurse specialists, and certified nurse-midwives.
In order to qualify as a shared/split service, the NPP and the physician each must have a face-to-face encounter with the patient, although the extent of each provider’s involvement is left to provider discretion and/or local Medicare contractor requirements. The timing of each provider’s visit is irrelevant, as long as the two services are performed on the same date. For example, the NPP may see a hospital inpatient in the morning with a follow-up visit by the physician later in the day.4 When documenting, both the NPP and the physician should identify the name of the individual with whom the service is shared/split. This will allow for appropriate service capture, and ensure that the correct notes are sent to the payer in the event of claim denial and subsequent appeal. Each provider must document their portion of the rendered service and select the visit level supported by the cumulative encounter. The physician need not duplicate the elements performed and documented by the NPP, but merely perform and record the physician-determined critical or key portions. Do not confuse this billing option with teaching physician regulations. Physician and the specified NPPs cannot share or split a service with any other provider type (e.g., residents, medical or nursing students).
Only one claim may be submitted for a shared/split service. The physician may choose to report the service under his own name or under the NPP name. Reimbursement is dependent upon this selection. The physician name secures 100% of the Medicare allowable rate; the NPP name earns 85% of the allowable physician rate.
While the physician has the opportunity to report the service under his own name for the full service rate, the shared/split billing option requires the efforts of two individuals and may be an impractical approach for some physician groups.
“Incident-to”
Hospitalists, or their staff, may have encountered the term “incident-to” and wondered how this billing option applies to hospitalist services. “Incident-to” guidelines only apply to procedures and services performed in a private physician office. In this setting, the patient establishes care with the physician and the physician develops a patient-specific plan of care. Subsequent services may be provided to the established patient by the NPP, yet reported under the physician’s name for 100% of the allowable physician rate. “Incident-to” services cannot be reported by a hospitalist, since hospitalist services only take place in facility-based locations.
Summary
NPPs currently are involved in an extensive number of services within the hospital, and Medicare has two billing options for NPP services provided on behalf of or in conjunction with hospitalists. Each option involves specific rules and regulations with which NPPs and physician groups must comply.
Successful reporting requires understanding of and adherence to federal, state, and facility guidelines. It is important to identify NPP employment relationships, the NPP’s role in the provision of services, the state supervisory or collaborative rules, and local payer interpretations to prevent misrepresentation, misunderstanding, or erroneous reporting. TH
Carol Pohlig is a billing and coding expert with the University of Pennsylvania Medical Center, Philadelphia. She also is on the faculty of SHM’s inpatient coding course.
References
1. Centers for Medicare and Medicaid Services. Medicare benefit policy manual. www.cms.hhs.gov/manuals/Downloads/bp102c15.pdf. Accessed September 12, 2008.
2. Howie J, Erickson M. Acute care nurse practitioners: creating and implementing a model of care for an inpatient general medical service. Am J of Critical Care. 2002;11:448-458.
3. Cowan M, Shapiro M, et al.. The effect of a multidisciplinary hospitalist/physician and advanced practice nurse collaboration on hospital costs. J Nursing Admin. 2006;36:79-85.
4. CMS. Medicare claims processing manual: Chapter 12, Section 30.6.1B. www.cms.hhs.gov/manuals/downloads/clm104c12.pdf. Accessed September 14, 2008.
5. Pohlig C. Nonphysician providers in your practice. In: coding for chest medicine 2008. Northbrook, IL: Am Coll Chest Phy. 2008;249-254.
Enough Is Enough, I’m Calling a Lawyer
Physicians are no strangers to specialized careers. In narrowing the scope of their practice, specialists develop the expertise and experience to benefit patients and colleagues alike.
Specialization is common in the legal profession, as well, and some legal issues present the need to obtain specialized legal assistance. Just as a patient needing an appendectomy shouldn’t visit a psychiatrist, a medical malpractice client shouldn’t visit a tax attorney.
Before working with an attorney, pose the following questions:
- How many times have you represented clients with my particular legal problem?
- How many of those cases have gone to trial?
- Have you received any specialized training in the area of my legal problem?
- Have you written any articles or taught any courses in the area of my legal problem?
- And, most importantly, what is your philosophy towards handling legal matters?
Some legal issues will require an aggressive attorney; others may need a softer touch, an attorney who will work toward resolving a matter amicably. You should feel comfortable your attorney has the experience to handle the claim and the right philosophy toward litigation. If you want confirmation, feel free to ask for the name of a prior client.
Here are some brief descriptions of the different types of specialized legal services available. Choosing the right attorney will save you time, money and should maximize the possibility that you will have a successful outcome.
Medical Malpractice Defense Counsel
In the unfortunate event you are sued for medical malpractice, you want to make sure your insurance company assigns you an attorney who has substantial experience in defending medical malpractice. These lawsuits are very complex and require defense attorneys to understand not only the legal requirements of the claim, but also the medical conditions and interventions undertaken on the patients’ behalf.
Professional Licensure Defense Counsel
Some attorneys focus on defending health care professionals before licensing agencies, such as the Board of Medical Examiners or the Drug Enforcement Agency. These proceedings often involve issues that are non-medical in nature, such as fraud, sexual misconduct and substance abuse. Attorneys specialized in representing clients before licensing agencies will have a better understanding of how the agency views the issues and will be able to recommend prospective courses of action, such as peer assistance or continuing education programs, making formal disciplinary proceedings less likely.
Labor and Employment Litigator
There are numerous laws governing the workplace, so when an employment issue surfaces, it’s important to work with an experienced labor and employment attorney. Most attorneys further specialize and represent plaintiffs or defendants, so make sure that you consult with an attorney on the right side of your issue.
Personal Injury Litigator
Some personal injury attorneys work on a volume basis and defer much of the process to paralegals and staff members. Other counselors take on a smaller volume of cases and give each case more individual attention. If you are injured in the workplace and need to find a personal injury attorney, you might want to ask a medical malpractice defense lawyer or your insurance company for a referral.
Matrimonial
One of the most common reasons a physician needs to hire counsel is the dissolution of a marriage. These cases raise intense, personal issues dealing with the division of assets, sale of property, and the allocation of parental responsibilities. Many of these issues are the subject of state laws, which attempt to compel an equitable determination. Working with an experienced matrimonial attorney will keep the focus on the legal merits of the case.
Tax Counsel
Tax law is one of the areas in which law schools offer an advanced degree, known as an LLM. It is the equivalent of a post-doctoral training program. These professionals have tremendous experience in representing individuals and businesses in the formation of business entities and in dealing with federal and state taxing authorities.
Medical Entity Formation
Depending on the state you live in, you may have a choice of business entities for your practice, such as corporations, partnerships, limited liability partnerships (LLP), and professional corporations. In choosing and structuring a business entity, you should consult with an attorney who has experience in representing health care professionals. State and federal regulations may affect your choice of an entity. A good attorney also can help clients anticipate and avoid potential dissolution issues, such as disputes over non-compete provisions, distribution of accounts receivable, and transfer of patient files.
Real Property
When attorneys refer to “real property,” they are describing the purchase and development of land, which can raise complex legal issues related to zoning, easements, assessments, restrictive covenants, and leasing.
Intellectual Property
When lawyers refer to “intellectual property,” they are describing the protections provided to a person’s creative efforts, such as copyright, trademarks and patents. Attorneys can earn a formal advanced degree in this area through an LLM program. If you develop an invention or write a book, intellectual property attorneys are best suited to make sure you receive the benefits of your creative efforts.
Trust and Estate
When people die, they leave an estate, which can be the subject of extensive probate proceedings to determine the heirs’ rights. Even if there are no disputes between heirs, there can be probate proceedings to determine the value of the estate and the taxes that might be assessed against it. TH
Patrick O’Rourke works in the Office of University Counsel, Department of Litigation, University of Colorado, Denver.
Mind Your Manners
Beginning January 1, 2009, your on-the-job behavior—and that of other healthcare providers—will be held to a new standard. New Joint Commission standards include a requirement for healthcare organizations to create a code of conduct outlining acceptable and unacceptable behaviors for healthcare professionals, and to implement a process for managing problematic behavior. The reason for this unusual step is the belief that disruptive or intimidating behavior by physicians, nurses, and other healthcare workers has a negative impact on the quality of care.
“I think the standard shows that the Joint Commission is interested in behaviors within hospitals and other healthcare organizations, and how that affects quality of care, safety and the patient experience,” says Russell L. Holman, MD, immediate past president of SHM and chief operating officer for Cogent Healthcare, Nashville, Tenn. “By highlighting this as an area to be included in reviews and standards, it causes organizations to look for their own policies on disruptive behaviors.”
Here is a closer look at the new standard and how it might impact hospital medicine.
Not Physicians Only
The Joint Commission standard addresses “the problem of behaviors that threaten the performance of the healthcare team,” mentioning unprofessional behavior, specifically “intimidating and disruptive behaviors.” To many, this seems to target physicians. “In a hospital, there is an unwritten hierarchy, with physicians at the top,” Dr. Holman points out. “As such, some feel that different standards are applied to physician behaviors. For example, if a nurse or a pharmacist uses obscene language, they may be terminated. If a physician does this, they may receive feedback that the language was inappropriate.”
However, the Sentinel Event Alert released by the Joint Commission in July states, “While most formal research centers on intimidating and disruptive behaviors among physicians and nurses, there is evidence that these behaviors occur among other healthcare professionals, such as pharmacists, therapists, and support staff, as well as among administrators.” The alert does not single out physicians or any other healthcare profession regarding bad behaviors.
“I think the Joint Commission has been very clear in its intent that the standard applies equally to physicians and non-physicians,” Dr. Holman says.
When Hospitalists Cross the Line
How will this code of conduct standard affect hospitalists? Because of the nature of their work, they will be held to the standards of any hospital they work in. In the case of hospitalists who are directly employed by a hospital, the response should be straightforward. However, independent hospital medicine groups will have to work with their hospitals on behavior issues. First, these groups will need to decide whether they should have their own policies and procedures for code of conduct. “Hospital medicine groups need appropriate systems of identifying disruptive behavior, monitoring it, and taking any necessary actions to make sure the behavior is not continued,” Dr. Holman stresses.
Second, independent groups must communicate closely with the hospital when a behavior issue arises. “If you have a hospitalist who is not directly employed by the hospital, there is a dual responsibility for managing their disruptive behavior,” Dr. Holman says. “The hospital has medical staff standards, which are reflected in the medical staff bylaws and rules and regulations. These documents need to include policy and procedures around the incidence of disruptive physician behavior.”
But just because procedures are in place doesn’t mean the hospital will address a problem hospitalist. “This is where in practice, things can get a little fuzzy,” Dr. Holman admits. “The hospital may defer the responsibility for managing the physician to the employer. This is the scenario that has come up in hospital medicine.” He adds, “In my personal opinion, there is a dual responsibility. The hospital needs to apply its standard to all medical staff, regardless of specialty, tenure or employment status.” At the same time, the hospital medicine group/employer should have—and should implement—an approach to managing disruptive behavior.
“Different employers will have different capabilities,” Dr. Holman says. “For example, large, multi-specialty medical groups may have an infrastructure, including human resources professionals, risk managers and depth of medical and operational management, in place for dealing with disruptive behavior. … Small practices won’t have this. They may rely more heavily on the hospital’s infrastructure.”
—Russell L. Holman, MD, COO, Cogent Healthcare, Nashville, Tenn.
Regardless of the hospital medicine group’s size and capabilities, it should promote two-way communication with the hospital regarding problems with individual hospitalists. “If an incident occurs in the hospital, the employer needs to know the details so they can follow up,” Dr. Holman says. “They have to be careful about sharing appropriate information, and protect all privacies. And they have to balance this communication with the fact that it doesn’t absolve one or the other from acting. There must be follow through from both parties, including disciplinary or corrective action as necessary.”
Defining “Disruptive”
One concern healthcare leaders—and the people they lead—may have is deciding the standard used in crafting a policy that specifies what types of behavior are unprofessional. “The challenge is defining disruptive behavior,” Dr. Holman says. “Of course, it can be very clear sometimes. But a surgeon throwing instruments in the operating room is different than someone who is a little bit outspoken.” Consider a hospitalist or other physician who’s in the habit of questioning authority; could this requirement lead to efforts to shut them down?
“Naturally, there is a degree of concern amongst physicians that this is a physician-directed standard, and that there may be a tough time distinguishing between the good faith criticisms of outspoken physicians and those who demonstrate physically threatening behavior,” Dr. Holman says.
The best way for hospitals, hospital medicine groups and other healthcare organizations to avoid this is to find established policies on this subject that are fair, carefully phrased and comprehensive, then customize one or more to their own specifications and distribute to all affected employees.
“I think these policies are nice to include in new physician orientations or training programs, so that physicians are aware of them,” Dr. Holman suggests.
For more information on the code of conduct standard, visit www.jointcommis-sion.org/SentinelEvents/SentinelEventAlert/sea_40.htm. TH
Jane Jerrard is a medical writer based in Chicago.