User login
Performance and Standards Committee Furthers SHM’s Quality Mission

The Performance and Standards Task Force (PSTF) was formed in May 2006 when SHM leadership recognized the need for a coordinated approach to working with other organizations in the quality arena.
A task force normally would have a beginning and an end to its scope of work. However, PSTF’s ongoing mission has matured, becoming more and more engaged in quality activities. In late fall 2007, the time had come for the PSTF to evolve into SHM’s Performance and Standards Committee (PSC).
What We Do
As SHM’s senior adviser for quality standards and compliance, I continue to work with PSC Chair Patrick Torcson, MD, along with senior staff and leadership of the Public Policy Committee (PPC), to monitor the national performance and quality landscape. The PSC, which engages with national organizations and is charged with developing performance measures and building consensus, also works to develop relationships with other professional medical societies and organizations.
Recognizing the need to communicate more frequently on SHM quality/policy issues related to quality improvement and patient safety, the PSC has also forged a stronger tie with the Hospital Quality and Patient Safety Committee (HQPSC) and was represented in the HQPSC-led Quality Summit in October.
Through the PSC, SHM has worked to influence performance measure development, consensus, and the endorsement process by joining the AMA Physician Consortium for Performance Improvement (PCPI) and the National Quality Forum (NQF).
Broader Reach
SHM members have contributed to the process by participating in activities relevant to hospital medicine and building relationships with senior staff and leadership within these national stakeholder groups.
The PCPI is committed to enhancing quality of care and patient safety by taking the lead in the development, testing, and maintaining evidence-based clinical performance measures and performance measurement resources for physicians. The NQF is a nonprofit organization charged by Congress to endorse consensus-based national standards for measurement and public reporting of healthcare performance data. Beginning in 2006, the PCPI and NQF have worked to influence the development of physician-level performance measures as part of the CMS Physician Quality Reporting Initiative (PQRI). Joining the PCPI has given SHM the opportunity to participate with other organizations on expert work groups to develop performance measures. SHM has been involved in performance measure development for topics such as geriatrics, emergency medicine, outpatient parenteral antimicrobial therapy, and anesthesiology issues including perioperative normothermia and critical care.
Many of these measures have been included in the PQRI program. SHM submitted feedback during public comment periods on measures related to perioperative care and chronic kidney disease. Most importantly, PCPI participation has given SHM high visibility among measurement stakeholder groups, including CMS and NQF. This has raised the acceptance of hospital medicine as a specialty, as well as the influence and credibility of SHM as a professional society.
As a collaborative effort on behalf of SHM, the PSC and PPC drafted and submitted a comment letter on the 2008 Centers for Medicare and Medicaid Studies (CMS) Proposed Rule regarding the future of the PQRI. SHM has supported the CMS value-based purchasing initiative and the PQRI in general. The PSC recommended that CMS and national stakeholder groups like the PCPI and NQF re-evaluate the denominators of several measures, existing and proposed, to make them applicable to the inpatient setting for hospitalist reporting.
PSC senior staff attended the PCPI meeting in Chicago last October and met with Susan Nedza, MD, of the CMS Special Program Office, Value-Based Purchasing, to express SHM’s appreciation of increased CMS recognition of hospitalists through its quality initiatives. This also was an opportunity to receive input on additional ways hospitalists can become engaged in the 2008 PQRI and other CMS quality efforts.
PQRI Success
In early November, Dr. Nedza and her staff, Dr. Torcson, and SHM senior staff met via conference call to discuss the preliminary results of the 2007 PQRI and exchange thoughts on the program related to hospitalists. A concern for hospitalists was the intent for the PQRI to include performance measures for each of the 39 medical specialties recognized by CMS; hospitalists were lumped under general internal medicine. By working closely with CMS and the PCPI, SHM succeeded in achieving denominator specification changes for additional relevant measures to become available for hospitalist reporting through the 2007 PQRI.
Soon thereafter, the CMS Final Rule on Physician Payment was released, indicating that 10 of the 11 measures available for hospitalist reporting in the 2007 PQRI also were to be included for 2008. “Beta-blocker on Arrival for Acute Myocardial Infarction” was the one measure no longer part of the 2008 PQRI. One new measure available for hospitalist reporting in 2008 is measure No. 75, “Prevention of Ventilator-Associated Pneumonia—Head Elevation,” for which hospitalists can report using a critical care code.
The 2007 PQRI included the following measures on which hospitalists could report:
- No. 5: “Heart Failure: Angiotensin-Converting Enzyme (ACE) Inhibitor or Angiotensin Receptor Blocker (ARB) Therapy for Left Ventricular Systolic Dysfunction (LVSD)”;
- No. 6: “Oral Antiplatelet Therapy Prescribed for Patients with Coronary Artery Disease”;
- No. 7: “Beta-blocker Therapy for CAD Patients with Prior Myocardial Infarction”;
- No. 29: “Beta-blocker at Time of Arrival for Acute Myocardial Infarction”;
- No. 31: “Stroke and Stroke Rehabilitation: Deep Vein Thrombosis Prophylaxis”;
- No. 32: “Stroke and Stroke Rehabilitation: Discharged on Antiplatelet Therapy”;
- No. 33: “Stroke and Stroke Rehabilitation: Anticoagulant Therapy Prescribed for Atrial Fibrillation at Discharge”;
- No. 34: “Stroke and Stroke Rehabilitation: Tissue Plasminogen Activator Considered”;
- No. 35: “Stroke and Stroke Rehabilitation: Screening for Dysphagia”;
- No. 36: “Stroke and Stroke Rehabilitation: Consideration of Rehabilitation Services”; and
- No. 47: “Documentation of an Advanced Care Plan.”
After the final specifications for the 2008 PQRI were released, there was a proposal for denominator specification changes that would preclude inpatient reporting for many of the measures relevant and available to hospitalists in 2007. The PSC again worked closely with the PCPI and relevant professional organizations to preserve the measure specifications for the 2008 PQRI to allow inpatient and thus hospitalist reporting. This experience has further enhanced productive SHM relationships with the PCPI and CMS.
The PSC has an ongoing commitment to recommend SHM members for appointments to PCPI expert measure workgroups, depending on the topic. For example, SHM was recently asked to identify a member to join a newly forming asthma measures workgroup that will be looking to develop inpatient measures. SHM will be notified when a palliative care measures workgroup is being formed.
Senior staff and leadership will meet PCPI senior staff to discuss formation of an expert workgroup on care transitions measures. This work group will be co-chaired by SHM and the American College of Physicians (ACP) and include societies such as the Society of General Internal Medicine (SGIM), the American Geriatrics Society (AGS), and others engaged in the development of the transitions of care consensus document in summer 2007. The work group also will refer to the principles and standards that resulted from the ABIM Foundation’s Stepping Up to the Plate (SUTTP) Alliance as a resource in its development of measures.
Looking ahead to the 2009 PQRI, the PSC has requested measure specification changes to the following PQRI measures:
- No. 56: “Vital Signs for Community Acquired Pneumonia”;
- No. 57: “Oxygenation Assessment for Community Acquired Pneumonia”;
- No. 58: “Assessment of Mental Status for Community Acquired Pneumonia”; and
- No. 59: “Empiric Antibiotic for Community Acquired Pneumonia.”
These measures harmonize with the Joint Commission’s core measures and are relevant for hospitalist performance reporting.
With the NQF
On Sept. 26-28, PSC member Greg Seymann represented SHM at NQF’s 8th Annual Meeting in Washington, D.C. This meeting featured plenary sessions focusing on issues at the forefront of policy discussions related to quality of care including:
- Chronic care episodes across care settings;
- Medications and quality;
- Medicare performance monitoring and payment initiatives;
- Moving performance measures into electronic health record requirements; and
- Nursing leadership in measurement activities and achieving higher performance.
- In the first quarter of 2008, the PSC has:
- Reviewed and commented on NQF’s “National Voluntary Consensus Standards for Hospital Care: Additional Priorities–2007, Part 2”;
- Sent a representative to the steering committee for the National Voluntary Consensus Clinician-Level Perioperative Care Standards meeting;
- Submitted nominees for the National Voluntary Consensus Standards for Emergency Care Phase II steering committee and the Prevention and Management of Stroke Across the Continuum steering committee (our nominee was accepted for the latter);
- Reviewed and commented on the National Voluntary Consensus Standards for Prevention and
- Care of Venous Thromboembolism: Performance Measures/Phase II; and;
- Has sent senior leadership and staff to the NQF Spring Meeting and Implementation Conference on Care Coordination.
In the Works
The PSC and the HQPSC submitted a comment letter on CMS’ selection of hospital-acquired conditions and present on admission indicator reporting for 2009. SHM supported CMS’ efforts to improve the quality of care for hospitalized patients by preventing avoidable hospital-acquired conditions and outlining its concerns regarding unintended consequences as relates to the various conditions.
With its new status as the PSC, this enthusiastic and committed group is preparing to extend its mission and scope of work in 2008.
The PSC plans to restructure and serve as expert liaisons for internal and external activities. This not only will empower committee members to become more engaged in our performance agenda, but also allow them to serve as key contacts for staff when monitoring the ever-growing landscape of performance measurement, quality, and policy. TH
VTE Collaborative Succeeding

It has been nearly 18 months since SHM launched the VTE Prevention Collaborative, which offers individualized assistance to hospitalists wishing to take the lead on reducing the incidence of preventable, hospital-acquired VTE at their sites.
The collaborative features two technical assistance options: a full year of distance mentoring or a one-day evaluation and consultation visit to the enrollee’s hospital. The project is led by Gregory Maynard, MD, and Jason Stein, MD. Both are stellar clinicians with quality improvement (QI) expertise and experience leading VTE prevention efforts. Dr. Maynard is head of the Division of Hospital Medicine and associate clinical professor of medicine at the University of California-San Diego. Dr. Stein is a hospitalist at Atlanta’s Emory University Hospital, assistant professor of Medicine at Emory University School of Medicine, and director of Quality Improvement for the Emory Hospital Medicine Unit.
Though we expect to continue working with sites enrolled in the mentoring program for many more months, the collaborative has been in place long enough that we can start evaluating outcomes and thinking about what we’ve learned.
In all, 35 hospitals so far have enrolled in the collaborative: three in the consultation program and 32 in the mentoring program. Because the participants enrolled in the mentoring program generally were starting from an earlier point in the QI process (i.e., thinking about starting a project vs. trying to improve an existing effort), we’ve focused our evaluation attention on them.
At the time of enrollment, 33% of these sites were thinking of starting a VTE-prevention project, 42% had an active QI project but had not yet implemented any interventions, and 25% had an active QI project and had implemented an intervention (i.e., a new order set or risk-assessment protocol).
We surveyed the 21 sites that have been involved in the mentoring program for at least six months, asking about the status of their VTE-prevention project and their experiences working with SHM mentors. So far, 15 have responded to the survey, and the results are quite interesting.
Since becoming involved with the collaborative, nearly every participant had made significant progress with their project:
- 94% had redesigned the processes for assessing VTE risk and bleeding risk and providing appropriate prophylaxis;
- 100% had selected a VTE risk assessment model, and 88% had developed prophylaxis recommendations for each level of risk;
- 100% had defined absolute and relative contraindications to pharmacologic prophylaxis and recommendations for what to do if they exist;
- 100% had developed order sets or protocols that encourage initial assessment of VTE risk and provision of appropriate prophylaxis; and
- 75% had developed order sets or protocols in use at their hospitals.
All seven sites that had a baseline figure that could be used for comparison reported their current rate of appropriate VTE prophylaxis is higher than it was before they became involved in the collaborative.
We asked participants to identify the topics with which they were helped by their mentors. The responses showed the breadth of issues that need attention to create a successful QI project. The topics covered and percentage of enrollees who sought help with them include:
- Defining the goals, aims and scope of your project, 93%;
- Redesigning your VTE prevention process, 87%;
- Developing risk assessment and prophylaxis recommendations, 87%;
- Developing order sets and protocols, 87%;
- Data collection and measurement, 87%;
- Piloting and revising risk assessment tools, order sets and protocols, 60%;
- Securing institutional support for your project, 47%;
- Assembling your project team, 47%;
- Mapping the original (pre-collaborative involvement) VTE prevention process at your site, 40%;
- Identifying and securing support from key stakeholders, 33%; and
- Developing educational/outreach strategies or materials, 27%.
Data collection and measurement remain a central issue for most participants. Nearly every mentoring call (mentors and participants speak once a month for the first six months of enrollment and every three months thereafter) focused at least in part on figuring out how to develop baseline data, monitor adherence to a new protocol, and determine if clinical outcomes were improving.
Of note, 100% of respondents said they would recommend the collaborative to others.
Hospitalists and QI
An impressive 67% of respondents indicated their work on the VTE project has helped identify them as a QI leader in their hospital or within their hospital medicine group. More impressively, 93% are working on or have signed up to work on other QI efforts.
The range of topics participants are turning their attention to are amazingly varied: acute coronary syndromes, heart failure, sepsis, glycemic control, pneumonia, delirium prevention, therapeutic hypothermia, hand washing, core measures, Joint Commission certification for a number of diagnoses/processes, do-not-resuscitate documentation/ordering, medication reconciliation, SCIP, hand-off communications, and computerized physician order entry. Or, as one respondent put it, “too many projects to name.”
While it is heartening that success in one area is being leveraged in other areas, a sobering reality is that only 7% of these folks have allotted time to pursue QI projects – all others do QI work on a volunteer basis, in addition to existing clinical and administrative responsibilities.
QI work is fun and rewarding but also time-consuming and at times, difficult and lonely. Heroic volunteerism is not necessarily a bad thing—many hospitalists are passionate about improving care and contributing to the hospitals where they work. Too much volunteerism leads to burnout and ultimately is not sustainable. Perhaps a mentoring emphasis should be helping people recognize and quantify the value of their efforts, and developing the negotiation skills that would help secure funding for their work.
What’s Next?
Drs. Maynard and Stein are among the SHM members with an interest in VTE who have convened the VTE Advisory Board. Under the leadership of Sylvia McKean, MD, the advisory board is exploring ways SHM can continue its work to promote the prevention, diagnosis and treatment of VTE.
Areas of interest include working with health systems, as opposed to individual hospitals, as a means of rapidly spreading tools and processes that promote assessment of VTE risk and administration of appropriate prophylaxis. The VTE collaborative team was thrilled to welcome five Veterans Affairs (VA) hospitals into the collaborative. It is hoped this group will succeed not only in developing successful local VTE prevention efforts, but also will develop a framework and set of tools that can be exported to all VA sites. Leveraging commonly used health IT systems is another exciting option for rapidly disseminating the tools and materials the collaborative’s members have developed.
Hospitalist’s “Whodunit” Tackles Ethical Concerns

Many hospitalists face mysteries at work every day: a new admission’s enigmatic symptoms, inexplicable protocols for coding and other documentation—even the mystery of the missing chart.
One physician has created a much greater and more interesting mystery. Gil Porat, MD, a hospitalist with Colorado Springs Health Partners, just had his first novel, The Other Face of Murder, published by Alondra Press in April.
A Second Career
Dr. Porat worked on the novel steadily for years, starting during his residency. “I’ve been practicing medicine as a hospitalist for about five years now, so this novel has been a longer journey than medical school for me,” he admits.
His regular schedule, along with his dedication to writing, allowed him to finish the novel while working full time. “As a hospitalist, I work seven days on, seven days off, and that’s a terrific way to manage a second career,” explains Dr. Porat. “I spend my week off with my family—I have a wife and two boys—and on writing.”
Heavy Subject
The Other Face of Murder opens with a young physician stumbling across the corpse of his friend after hosting a dinner party. While it’s an entertaining mystery, the book also addresses deeper themes. As the physician investigates his friend’s untimely demise, he discovers not just “whodunit,” but ethical controversies behind the death.
“I did my residency in Oregon, which is the only state that has legalized physician-assisted suicide,” Dr. Porat notes. “The book discusses this, but it also discusses a lot of bioethical conundrums in medicine, including end-of-life care. It always disturbs physicians and staff to see a lot of suffering in end-of-life care; a big theme in the book is that we should be doing more palliative care [for these patients] and less intrusive care.”
Dr. Porat says he wrote the book for average mystery readers who may not be aware of these medical issues.
“My goal was to do more than just entertain; I wanted to teach some of the lessons that I’ve learned along the way,” he says. “Very little is heard in society regarding end-of-life issues. I hope this book will stimulate discussion about this in the general public.”
With his first published novel on the shelves, Dr. Porat has not taken a break. “I’m already working on a second book,” he says, “and that too will have a medical theme.” TH
Jane Jerrard is a medical writer based in Chicago.
Quest for Independence
There is an increasing debate in major academic medical centers across the county on where hospitalists fit in the organizational structure—and consequently what resources, prestige, and power they will have.
The movement of academic hospitalists toward autonomy may be inevitable. Community hospitalists are less affected by the separation issue, most agree, because a community hospital may have fewer hospitalists who relish remaining in general internal medicine divisions. Conversely, they may have their own division because they are not driven by research or teaching. Either structure seems to work well in a community setting.
Even those who want academic hospitalists to remain firmly ensconced in divisions of general internal medicine realize it may be a losing battle as hospitalist groups increase in size, depth, and importance. So they caution: “Not so fast.”
Hospitalists would be better off remaining in divisions of general internal medicine and “learning from the mistakes we’ve made over the last 25 years,” says Bob Centor, MD, professor and director of the division of general internal medicine at the University of Alabama at Birmingham and associate dean for the Huntsville Regional Medical campus.
While Dr. Centor acknowledges it’s not always wrong to have a separate division, he believes leadership in general medicine divisions can help hospitalists succeed in their careers and negotiate academic politics to better advance their interests.
Early Stirrings
The independence movement began about two years ago when some academic hospitalists formed separate divisions, frustrated by chairs of general internal medicine “who just didn’t get it,” says Dr. Centor.
Others have found support from division chiefs who worked to develop academic hospitalists and encouraged them to go out on their own.
Academic hospitalists at the University of California, San Francisco’s (UCSF) school of medicine became a separate division two years ago. The move was encouraged by its division of general internal medicine chief, according to Bob Wachter, MD, hospitalist division chief at UCSF who coined the term hospitalist. “After 10 years of growth, we had 38 academic hospitalists, 10 assistant professors, many faculty with impressive accomplishments, a robust research department and the support of the chief,” he says. “Clearly we were ready.”
Separation has become a hot topic as the numbers of hospitalist faculty reach critical mass in academic medical centers, with some hospitalists’ departments having larger faculties than any other specialty within the division.
While it may be time for hospitalists to separate in large medical centers, that may not be the case at smaller schools,” says Karen DeSalvo, MD, MPH, MSc, chief of general internal medicine and geriatrics, Tulane School of Medicine in New Orleans, and president-elect of the Association of Chiefs of General Internal Medicine. “For smaller medical schools, it just doesn’t make sense financially to have a separate division.”
A school’s culture also can be a barrier to separation, she points out. Tulane takes a multidisciplinary approach to teaching with faculty encouraged to work across traditional specialty areas. This is easier when hospitalists are in the same division, she says.
However, size is not the only requirement for divisions in medical schools. “The goals of divisions within the infrastructure of medical centers are clinical care, teaching, and research,” says SHM President-elect Scott A. Flanders, MD, associate professor of medicine at the University of Michigan, Ann Arbor. “While most hospitalist programs at major academic medical centers do a great job with clinical care and many have teaching success, very few have succeeded in developing robust research programs.” Until this happens, hospitalists should remain in divisions of general internal medicine and take advantage of their resources to develop research programs and faculty, he says.
Dr. Wachter agrees: “It’s not just size. It’s also scope and accomplishments and whether your leader is experienced enough and strong enough to go toe to toe with other division chiefs.”
Anticipate Demand
Dr. Flanders says the controversy has heated up as academic medical centers seek to recruit leaders for large hospitalist programs. “They dangle the division chief position as a tool to recruit from the small pool of experienced academic hospitalists who could head a program,” he says. Along with creating a division comes a package of incentives, such as tenure, investments in building the academic and research components, power, and prestige.
That was the case at Northwestern University’s Feinberg School of Medicine, which lured Mark Williams, MD, away from 18 years at Emory University to head a new division of hospital medicine. Dr. Williams, editor of the Journal of Hospital Medicine, believes it’s important for hospitalists to have a separate division so they are at the same level as the other academic specialties. “That’s why I came to Northwestern,” he says. “I think it’s essential that hospitalists have division status so they are present at the table when decisions are made about investments in research, coverage, teaching of residents, and particularly budgetary matters.”
However, Dr. DeSalvo points out that there are not enough experienced academic hospitalists to head divisions in all medical schools. “If we were to say tomorrow that all hospitalists should have their own divisions, there would not be enough experienced people to head all those divisions,” he stresses. “So if it’s going to happen, it will happen over time.” In the meantime, it’s important that schools mentor and train academic hospitalists who could be division chiefs, she says.
The issue has become a priority for SHM and the Society of General Internal Medicine (SGIM), which have created task forces to find ways to help academic hospitalists advance their careers without “isolating themselves as to site of care,” Dr. Centor says. “Hospitalists are complementary to outpatient physicians and vice versa. They have to talk to each other, and the general internal medicine division structure provides that.”
Fault Lines
Hospitalists and general internists have more in common and more reasons to stay together than to separate, according to Dr. Centor. “Internists and hospitalists both concentrate on taking care of the whole patient and see patients who have multiple diseases.” Their issues are the same: advancing their careers, creating knowledge, and developing better teaching methods, he says. “Exactly the same issues general internal medicine has been working on for the last 25 years,” he explains.
General internists worry hospitalists are dichotomizing internal medicine and their careers by separating. “If you have a division of inpatient medicine and a division of outpatient medicine, it becomes harder for hospitalists to switch to outpatient medicine when they burn out,” Dr. Centor says.
Dr. Williams says hospitalist burnout is a myth: “People keep bringing up hospitalist burnout as a threat. It’s not a problem. We have programs in which the original hospitalists have been practicing since 1988 and are still enjoying doing it.”
The question of where academic hospitalists, with so few older physicians in its ranks, will find mentors concerns those opposed to separate divisions. Dr. Williams says there is nothing preventing general internal medicine physicians from mentoring hospitalists whether or not they are in a separate division.
Dr. Wachter says strong division leaders help academic hospitalists find mentors among more experienced physicians in other divisions and even at other institutions.
Some general internists and hospitalists believe separation is an academic issue that doesn’t affect patient care. Dr. Williams disagrees. “Decisions on whether hospitalists are going to be the primary people delivering care to patients can affect budgetary, scheduling, and training issue, which ultimately affect patients,” he counters.
Academic turf wars, politics, and allocation of resources also play into the desire to keep hospitalists within divisions of general internal medicine. “Many chiefs don’t want them to separate because they see it as a reduction or fracturing of their division’s resources, both financial and human,” Dr. Flanders says.
Academic hospitalists who remain within divisions of general internal medicine need the support of those divisions. The SGIM task force recommended that divisions provide leadership to support hospitalists, build mentorships, create sustainable academic jobs, and value the education and quality improvement work of hospitalists, according to Dr. Flanders.
Many believe the independence of hospitalists is inevitable. “It’s where we are heading, and we will get there,” says Dr. Flanders.
Dr. Wachter says academic hospitalists are following the predictable “organizational rules of gravity. You start small and you build and you become more independent. Those who need parenting, over time, become adolescents and go to college and become independent. That’s just the nature of the beast,” he says. “It won’t happen at every place at the same minute, but I’ll be very surprised if 10 years from now, there aren’t very few academic hospitalists groups of any size that are not freestanding divisions.” TH
Barbara Dillard is a medical journalist based in Chicago.
The Lean Hospital
What does being lean have to do with operating a hospital? Well, when you’re talking about the lean method known as the Toyota Production System, it just may be what puts hospitals back in the driver’s seat of their bottom lines.
Six years ago, few hospital administrators had ever heard the term. Today, what began as an experiment at Seattle’s Virginia Mason Medical Center is sweeping through cash-strapped hospitals across the country.
Originally envisioned by the Japanese automaker as a way of doing more with less, the much-copied management system is becoming the gold standard for U.S. hospitals. They are betting that going Toyota lean will streamline processes, increase employee satisfaction, improve their finances, and most importantly, enhance patient care.
What does being lean entail?
“At its core, lean is a process-improvement methodology and management improvement system,” says Mark Graban, a senior consultant with Ortho-Clinical Diagnostics’ ValuMetrix Services in Rochester, N.Y. Graban teaches the Toyota system to hospitals throughout the country. One of the system’s most basic tenets is respect for the work force. Another is that it does not assign blame. Instead, Graban explains, “Lean engages the work force to improve the work they are involved in—improving process and quality, and reducing delays for patients.”
Can Hospitalists Go Lean?
Hospitals have used lean to improve productivity in areas as diverse as inventory, testing, purchasing, and food service. What about their most critical function — patient care? Can lean help hospitalists to perform their jobs, too?
“Yes,” asserts Christopher Kim, MD, MBA, of the Departments of Internal Medicine and Pediatrics at the University of Michigan. Dr. Kim studied lean and applied it at his hospital in Ann Arbor. “To really do lean projects well, you need the buy-in of the physicians—the hospitalists. I believe hospitalists have a huge role in how successful lean projects can be. It behooves them to participate in these process improvement projects and take a lead role.”
Managers must sign on, as well.
“Lean gets managers out of their offices and into various departments to see what the problems are,” says Graban, whose book Lean Hospitals: Improving Quality, Patient Safety, and Employee Satisfaction is due out this summer. “Lean allows you to see it firsthand rather than relying on budget reports. We take executives to the nursing unit, and you see the light bulb go off. They say, ‘We need to help our employees provide care.’ ’’
Waste Not, Want Not
Lean solutions involve looking at processes, breaking them down into parts, and eliminating waste. Waste is an important concept in lean thinking, especially as it relates to time and motion.
“Lean is not necessarily about clinical care, but about reducing inefficiencies in processes needed for that care, by transforming waste into value,” explains Dr. Kim.
Waste, Graban asserts, “is any problem that pops up during the day that delays care.” Just ask a patient waiting for a doctor to write discharge orders or a nurse running around searching for missing supplies how much time is spent waiting.
“Up to 40% of time spent in hospitals is waste,” says Dr. Kim.
When lean strategy eliminates wasted time and motion that means efficiency, productivity, employee satisfaction, and patient satisfaction all increase. “That’s how hospitalists can use this—so much of what we do is about process,” Dr. Kim explains. “Once a clinical encounter is finished, much of what we do to achieve our goal of treating patients is really about those processes.” And processes are what lean seeks to optimize.
Hospitalist Brian Bossard, MD, director, Inpatient Associates, Lincoln, Neb., uses lean concepts to optimize his physicians’ patient loads. “We try to get each individual physician’s patient census close together—physically put the beds together to reduce the time the doctors are moving from one place to another,” he says. “It’s also much easier to communicate with nurses; [it’s] a significant savings in time and manpower.”
Lean Solutions
Max Langham, MD, chief of surgery at LeBonheur Children’s Medical Center in Memphis, Tenn., puts hospitals’ dilemmas about quality succinctly: “Most places want to be good and are working at getting better. It’s one thing to talk about it, but how do you do it?” His hospital chose Toyota lean, hiring Graban’s team to train the operating room (OR) staff.
Time-motion studies of the OR revealed a chaotic inventory system. Supplies were not systematically accounted for, resulting in either too much or inappropriate inventory. Sterilized surgical kits would be opened for one instrument, requiring resterilization of the rest. Establishing a master control inventory system and a master location for each supply made it easier to track them all in real time. First-year inventory savings were $243,828.
“Nurses know exactly where to go to get things now,” says Dr. Langham. “Lean’s focus was reducing waste and freeing up resources—and in a constrained environment that made a ton of sense.”
Recognizing what’s wrong with a process is the first step toward improving it, says Dr. Kim. He thinks hospitalists are uniquely qualified for the job. “They’re the ones who have the clear picture of the entire process for the patient,” he says. “They have the overview.”
One of the first processes Dr. Kim’s team examined was the turnaround time for placing PIC lines so patients could be discharged to home IV therapy. Applying lean methods reduced the average PIC wait time from 26 hours to 16, a reduction of 38%, with a concomitant savings in time, money, and patient satisfaction.
In radiation oncology, treatment for brain and bone metastases was streamlined from a three-visit procedure to a single hospital appointment by using lean methods. “The radiology workers at first did not like it,” says Dr. Kim. They feared job loss or increased workload, but soon found that lean is more about working smarter than harder. “Now they love it,” he says.
Success is not always assured. “We’ve had some areas of great success, some mediocre, and a few failures,” says Dr. Kim. The failures? “If too many departments and too many people are involved in one project, it tends to lead to failure,” he explains. “We are still on the upward phase of the learning curve.”
Lean is definitely not a set of cookie-cutter procedures. Each hospital has its own bottlenecks and waste points. Lean is a way of finding them and finding a customized correction for them.
“People used to work around obstacles,” Dr. Kim says. “Now we try to identify and eliminate them so people don’t have to work around them.”
At St. Joseph’s Mercy Hospital in Ypsilanti, Mich., inefficient ordering of diagnostic studies was a problem. “We have primarily used lean in test ordering and reporting,” says hospitalist Lakshmi Halasyamani, MD. “We decreased waiting times both for patients and for important diagnostic studies.” She thinks this can be of special value to hospitalists. “We benefit even more than others because we’re in the hospital all the time and ordering all the tests all the time,” she says.
Meanwhile, Mark Pool, MD, laboratory director of Riverside Medical Center in Kankakee, Ill., saw room for improvement in his lab. “Just walking through I saw a lot of redundant effort,” he explains. The results of his lean initiative were impressive. By getting a handle on inventory control, eliminating batching of tests, and standardizing procedures, Dr. Pool decreased test time considerably. That minimized backups in the emergency department. “Sitting in ED is like sitting in a taxi with the meter running,” he says. His department is able to turn the meter off. The lean project cost his hospital $300,000. The savings? “I don’t know, exactly,” he says. “But right off the bat with basic inventory control management, we saved $30,000 before we even blinked.” And he expects those savings to continue to add up.
Complacency is the Enemy
Any organization has its own long-term institutional culture. That culture also can lead to complacency, a “we’ve-always-done-it-this-way” attitude. That was the culture the Denver Health System wanted to change when it chose to go lean.
Eugene Chu, MD, director of the hospital medicine program at Denver Health, says his hospital’s lean program was initiated by Patricia Gabow, MD, the hospital’s CEO. “She had a vision that Denver Health and most healthcare systems were doing the same things for 20, 30, 40 years,” he says. “They had not changed anything. And she felt there was a lot to learn from outsiders, [like] how to manage operations and different products of the medical center.”
Dr. Gabow secured a grant from the Agency for Healthcare Research and Quality (AHRQ) to bring in a team of consultants to train hospital personnel as “black belts” in Toyota lean. Dr. Chu is one of them. “We have tried to improve patient flow and work flow,” he says. One project is to standardize the admissions procedure. “Before, house staff wrote things on crumpled pieces of paper and stored them in various places,” he recalls. Now, admissions are the responsibility of the hospitalists. No more chasing after a busy resident to get the pertinent facts out of his pocket. Admissions are transparent on Excel folders in hospital computers, for all staff to access.
Dr. Chu warns that Toyota lean doesn’t come easily or inexpensively. “To really do it right it is a significant investment. It is a set of tools and knowledge that you have to learn properly, and practice and develop,” he says, adding “Our black belts take 100 hours of training.”
Lean savings relating to billing procedures or food service can be easily measured. Savings related to actual patient care can be difficult to quantify. Dr. Chu says the hospital realized a $5 million net savings for all its lean projects. “It is just 1% of the operating budget, but it still helps,” he says.
Lean isn’t the only management system available. Julia Wright, MD, a hospitalist at the University of Wisconsin Hospital and Clinics in Madison, says her hospital is using a different approach to increase efficiency. “You need a system that can expedite care,” she says. “Lean is one way of doing it, but there are other models, too.”
Her hospital’s solution is a new IT system, with handheld computers into which physicians can enter and access data in real time. “Lean may not be IT-based, but it’s the same bottom line—a way of bringing care to the patient instead of bringing the patient to care,” she explains. That saves patients time. “When we look at patient satisfaction surveys, people get really frustrated with wait times. That’s what angers them,” she says.
As good as lean is, “I don’t think “lean” is [the be-all, end-all solution] to hospital efficiency and quality and safety,” Dr. Kim says. Other systems have come and gone as hospitals seek to rein in costs and improve care. “It’s not the model you choose,” Dr. Kim concludes. “It’s how you look at the model and decide to incorporate it into your hospital.” TH
Carol Berczuk is a medical journalist based in New York.
Clinical Privileges

Clinical Privileges
Question: Is there a standard percentage of time for inpatient care that is used to define a hospitalist? (i.e., 25% of time in inpatient activities = expert in hospital medicine). Our hospitalist section is drafting a clinical privilege form, and I have been searching for a national standard.
Heather Toth, MD, Hospital Medicine, Department of Pediatrics, Department of Internal Medicine, Medical College of Wisconsin, Milwaukee
Dr. Hospitalist responds: You and others may be aware of a little secret in hospital medicine: hospitalists have been around in this country for decades.
Even though Drs. Robert Wachter and Lee Goldman coined the term “hospitalist” in the New England Journal of Medicine in 1996, hospitalists have been working our nation’s hospitals for a long, long time.
Don’t get me wrong—I am not diminishing their roles in establishing the field of hospital medicine. What I am saying is that hospitalists were around before 1996, but nobody had defined their role. and nobody knew what to call them.
Drs. Wachter and Goldman did not only name the profession, they also gave it credibility. Prior to the mid-’90s, I get the sense most medical professionals viewed hospitalists as second-rate doctors. These hospital doctors were doing the jobs most respectable doctors didn’t want to do or didn’t have to do.

Those jobs included caring for critically ill patients when other doctors were unavailable or didn’t have the time to see their patients. This could be at 2 p.m. or 2 a.m. in most hospitals. Drs. Wachter and Goldman were, and are, respected academic physicians. In their seminal article, they essentially called out these hospital doctors and lauded their roles in the hospital. Moreover, they anticipated growth in this field of medicine. In some ways, they were saying, “I’m OK and you’re OK. It’s OK to be a hospitalist.”
Well, the rest is history; whereas we had about 2,000 hospitalists in the mid-’90s, we now have an estimated 20,000 hospitalists in the country.
It seems nowadays, many doctors are calling themselves hospitalists. How many times have you heard a doctor say, “I was a hospitalist before the field existed?” I wonder whether we really had so many hospital doctors back then.
Or, is it an issue of how one defines “hospitalist”? Some doctors may be making claims about being a hospitalist because it is now acceptable to be a hospitalist. Whereas 15 years ago, hospitalists were looking in at the establishment; in some parts of the country, hospitalists have become the establishment.
My brother was a member of his high school basketball team, which was ranked No. 1 in the state. Ignore the fact that as a scrub he never came close to stepping onto the court during a game. He still made sure people knew he was a player on the championship team. Everyone wants to be part of a winner.
There may be other reasons to call oneself a hospitalist. Many view hospitalists as specialists in inpatient care. Before long, hospitals may grant privileges to hospitalists that they may not grant to other types of doctors. We have seen this before.
At one time, there was virtually no such thing as a “closed” ICU in hospitals.
Evidence suggested patients received better care when intensivists cared for ICU patients. Today, it is rare to find an academic medical center without a closed ICU, and many community hospitals have adopted a similar model.
Whether doctors are calling themselves “hospitalists” because it is the cool thing to do now or whether it is a matter of turf, you bring up a good question: “How much inpatient work does one have to do to be called a hospitalist?” Drs. Wachter and Goldman certainly didn’t specifically address this issue in their article, and neither has SHM.
SHM’s definition of a hospitalist is: “Hospitalists are physicians whose primary professional focus is the general medical care of hospitalized patients. Their activities include patient care, teaching, research, and leadership related to hospital medicine.”
This definition of a hospitalist is about as good as any I have heard. It should be noted this definition makes no mention of training. One can be an internist, family physician, pediatrician, obstetrician, or general surgeon and be a hospitalist.
With this definition, it does mean, however, you can take care of patients one to two months out of the year and still be considered a “hospitalist” as long as your non-clinical work (teaching, research, and leadership roles) is related to hospital medicine.
I will caution you however as you draft your clinical privilege form that whether you are a hospitalist or not is a different issue than whether you are qualified or not to provide a specific type of clinical care.
Hospitalists are individuals with different knowledge bases and skills sets. You can work clinically as a hospitalist 12 months a year, but if you have never put in a central line, your hospital should not grant you privileges to put in central lines until you have demonstrated some minimal level of competency.
I suspect you are not alone. There are many doctors and institutions around the country that are or will be struggling with the same issues you are facing. TH
Clinical Privileges
Question: Is there a standard percentage of time for inpatient care that is used to define a hospitalist? (i.e., 25% of time in inpatient activities = expert in hospital medicine). Our hospitalist section is drafting a clinical privilege form, and I have been searching for a national standard.
Heather Toth, MD, Hospital Medicine, Department of Pediatrics, Department of Internal Medicine, Medical College of Wisconsin, Milwaukee
Dr. Hospitalist responds: You and others may be aware of a little secret in hospital medicine: hospitalists have been around in this country for decades.
Even though Drs. Robert Wachter and Lee Goldman coined the term “hospitalist” in the New England Journal of Medicine in 1996, hospitalists have been working our nation’s hospitals for a long, long time.
Don’t get me wrong—I am not diminishing their roles in establishing the field of hospital medicine. What I am saying is that hospitalists were around before 1996, but nobody had defined their role. and nobody knew what to call them.
Drs. Wachter and Goldman did not only name the profession, they also gave it credibility. Prior to the mid-’90s, I get the sense most medical professionals viewed hospitalists as second-rate doctors. These hospital doctors were doing the jobs most respectable doctors didn’t want to do or didn’t have to do.
Those jobs included caring for critically ill patients when other doctors were unavailable or didn’t have the time to see their patients. This could be at 2 p.m. or 2 a.m. in most hospitals. Drs. Wachter and Goldman were, and are, respected academic physicians. In their seminal article, they essentially called out these hospital doctors and lauded their roles in the hospital. Moreover, they anticipated growth in this field of medicine. In some ways, they were saying, “I’m OK and you’re OK. It’s OK to be a hospitalist.”
Well, the rest is history; whereas we had about 2,000 hospitalists in the mid-’90s, we now have an estimated 20,000 hospitalists in the country.
It seems nowadays, many doctors are calling themselves hospitalists. How many times have you heard a doctor say, “I was a hospitalist before the field existed?” I wonder whether we really had so many hospital doctors back then.
Or, is it an issue of how one defines “hospitalist”? Some doctors may be making claims about being a hospitalist because it is now acceptable to be a hospitalist. Whereas 15 years ago, hospitalists were looking in at the establishment; in some parts of the country, hospitalists have become the establishment.
My brother was a member of his high school basketball team, which was ranked No. 1 in the state. Ignore the fact that as a scrub he never came close to stepping onto the court during a game. He still made sure people knew he was a player on the championship team. Everyone wants to be part of a winner.
There may be other reasons to call oneself a hospitalist. Many view hospitalists as specialists in inpatient care. Before long, hospitals may grant privileges to hospitalists that they may not grant to other types of doctors. We have seen this before.
At one time, there was virtually no such thing as a “closed” ICU in hospitals.
Evidence suggested patients received better care when intensivists cared for ICU patients. Today, it is rare to find an academic medical center without a closed ICU, and many community hospitals have adopted a similar model.
Whether doctors are calling themselves “hospitalists” because it is the cool thing to do now or whether it is a matter of turf, you bring up a good question: “How much inpatient work does one have to do to be called a hospitalist?” Drs. Wachter and Goldman certainly didn’t specifically address this issue in their article, and neither has SHM.
SHM’s definition of a hospitalist is: “Hospitalists are physicians whose primary professional focus is the general medical care of hospitalized patients. Their activities include patient care, teaching, research, and leadership related to hospital medicine.”
This definition of a hospitalist is about as good as any I have heard. It should be noted this definition makes no mention of training. One can be an internist, family physician, pediatrician, obstetrician, or general surgeon and be a hospitalist.
With this definition, it does mean, however, you can take care of patients one to two months out of the year and still be considered a “hospitalist” as long as your non-clinical work (teaching, research, and leadership roles) is related to hospital medicine.
I will caution you however as you draft your clinical privilege form that whether you are a hospitalist or not is a different issue than whether you are qualified or not to provide a specific type of clinical care.
Hospitalists are individuals with different knowledge bases and skills sets. You can work clinically as a hospitalist 12 months a year, but if you have never put in a central line, your hospital should not grant you privileges to put in central lines until you have demonstrated some minimal level of competency.
I suspect you are not alone. There are many doctors and institutions around the country that are or will be struggling with the same issues you are facing. TH
Follow the Money

I eagerly await results from SHM’s survey of hospitalist productivity and compensation every two years. I’m most curious about whether a typical hospitalist has experienced an improvement in his/her “juice to squeeze ratio” (aka compensation per unit of work).
I was pleased to see in the recently released “Society of Hospital Medicine 2007-08 Survey: The Authoritative Source on the State of the Hospitalist Movement” that average hospitalist salaries increased the most for any two-year interval since we began surveying in 1997. If you haven’t seen the survey results, go to SHM’s Web site www.hospitalmedicine.org. Production remained flat, while compensation increased to an average of $188,500. (The survey showed an adjusted mean annual compensation of $193,300, and a median salary of $183,900. See complete survey for explanation regarding the adjusted mean, which refers to data for hospitalists who care for adult patients only.)
The 2008 survey has a couple of findings even more compelling than the gratifying improvement in compensation:
- 37% of HMG leaders did not know their annual expenses; and
- 35% of HMG leaders did not know their annual professional fee revenues.
Think about this for a minute. One-third of hospitalist group leaders don’t know enough about their own practice’s financial picture to know high-level details related to income and expenses. We only can presume an even larger portion of non-leader hospitalists don’t know these things about their practice.
These numbers are disconcerting, and they’re even a little worse than the numbers reported two years ago. How can this be?
Behind the Numbers
My first inclination is to look for reasons the data are misleading. Maybe some leaders chose to respond by indicating they don’t know these numbers, when in fact they do have the numbers but were just too busy to look them up and complete that part of the survey. So they might be better informed than the survey suggests, but just too busy to demonstrate it.
Or, some group leaders in large organizations, like Kaiser, may track and account for productivity and financial health in ways that differ from a typical practice. They may know a lot about their practice, but the metrics the survey asks for aren’t relevant to them.
Maybe the survey results are misleading and group leaders know a lot more about their practice financials than these numbers suggest. Well, maybe.
Unfortunately, in my consulting work up close and personal with hundreds of practices, I regularly meet group leaders who don’t see financial accountability as one of their duties. I think the survey numbers may be a reasonably accurate reflection of reality.
I typically ask group leaders things like what portion of their practice budget is funded by professional fee collections vs. payment from the hospital (or other “sponsoring organization”) and what the pro fee collection rate is. As in the survey, a large portion don’t know. They often say it’s up to someone else to keep track of those numbers and worry about the practice budget. I worry that a leader with such a hands-off approach to the practice budget can’t be very effective.
I also ask leaders things like what is their most important duty as group leader. “Making the schedule” is too often the disappointing answer. Clearly the schedule is a critical part of operating a practice, but in many practices it is reasonable, even optimal, to have a clerical person manage the schedule, or rotate responsibility for creating it among all members of the group. This frees some time the leader can spend on other activities like managing the group’s financial performance, among other things.
What Leaders Do
The ideal hospitalist practice leader’s job description will vary from place to place. It includes many things in addition to ensuring the schedule gets created. There are a handful of things that should probably be on every leader’s list. For my money, this leader should:
- Understand where the money comes from, where it goes, and what portion comes from professional fee collections vs. other sources. Also, to ensure all members of the group are updated on financial parameters regularly;
- Put in place mechanisms to ensure the hospitalists provide high-quality care to patients;
- Facilitate communication among hospitalists, hospital personnel, and medical staff to foster effective working relationships and facilitate problem-solving and conflict resolution;
- Proactively identify opportunities for the practice to enhance the service it provides to its constituents and the organization in general, and negotiating a reasonable balance between such opportunities and the practice’s resources and clinical expertise;
- Serve as a point of contact for referring primary care physicians;
- Representing the group when working and negotiating with the hospital administration; and
- Take an active role in recruitment while addressing behavior and performance issues within the practice.
Whether the leader handles these issues alone, delegates responsibility but still provides oversight, or forms a committee with other hospitalists, will vary from place to place. In every case, though, the leader should make sure these things are happening effectively.
Our field is young, and I think tends to attract people who want to avoid managing a complex practice. Perhaps it is no surprise some leaders may not be handling their job optimally. Fortunately, help is available.
Any group leader who wants to function more effectively can do several things. First, start talking to other practice leaders in your hospital. You could ask the lead doctor in another group what he/she regards as the most important components of their leadership role, and strategies that person used to become an effective leader.
Additionally, SHM has a highly regarded Leadership Academy designed to provide group leaders with the skills and resources required to successfully lead and manage a hospital medicine program now and in the future.
Each group leader should periodically step back from the day-to-day work to think about whether his/her time and energy is optimally allocated. Is the mix of clinical and administrative work reasonable? Does the leader devote time to activities (e.g., making the schedule) that could be handed off to others?
The standards used to differentiate between an effective and ineffective leader are hard to pin down and will vary a lot depending on the characteristics of a practice. Still, a comprehensive understanding of the practice’s budget and financial performance should probably be on everyone’s list. I hope the next SHM survey in late 2009 shows a lot more group leaders know things like their group’s annual expenses and revenues. We’ll see. TH
Dr. Nelson has been a practicing hospitalist since 1988 and is co-founder and past president of SHM. He is a principal in Nelson/Flores Associates, a national hospitalist practice management consulting firm. He is also part of the faculty for SHM’s “Best Practices in Managing a Hospital Medicine Program” course. This column represents his views and is not intended to reflect an official position of SHM.
Promise or Insanity?

Insanity is doing the same thing over and over again and expecting different results.—Albert Einstein
A hospitalist is defined as a provider whose primary professional focus is the general medical care of hospitalized patients.1
While this allows a concise, usable characterization of a hospitalist, it’s not the whole story. If it were, medical residents, nurses, and inpatient pharmacists all would be hospitalists.
Indeed, a traditional internist with a large hospital practice could reasonably deem him or herself a hospitalist. What defines what a hospitalist does, or should be doing—and how, if at all, is that different than what a traditional internist does in the hospital?
Education Deficiencies
Early data suggested a stark difference between outcomes attributed to hospitalists and general internists who rotated between the clinic and the hospital.
An early experience from the academic environment showed a hospitalist teaching model, when compared with a traditional teaching service, resulted in a 0.6-day length-of-stay (LOS) reduction and a cost savings of $700 per patient with no decrement in the quality of care, clinical outcomes, or satisfaction of provider, housestaff, or patient.2
Similar findings were revealed when community teaching and non-teaching hospitals transitioned to the hospitalist model.3-5 A 2002 review of 19 hospitalist studies revealed an average decreased LOS of 17% coupled with a 1% reduction in hospital costs per case.6
The year 2002 also saw, for the first time, published data that the hospitalist model could reduce in-hospital and 30-day mortality rates.7,8 Together with a 2004 paper showing reductions in minor post-operative complications with hospitalist comanagement of orthopedic patients, these studies suggested hospitalists’ care transcended mere cost savings, improving quality measures as well.9

More recently, however, Lindenauer, et al., found important but less robust differences between hospitalists and non-hospitalists.10 As compared with traditional internists, hospitalists reduced LOS 0.4 days and cost per patient by $268.
While these moderate reductions in LOS and cost versus traditional internists are statistically and clinically significant, they are less vigorous than previous findings. Despite some methodological concerns, this largest investigation—in terms of hospital sites (45), patients (76,926) and hospitalists (284)—revealed no demonstrable improvements in the quality outcomes measured.
Similarly, another recent publication found consultation, provided by medical subspecialists or hospitalists, did not improve glycemic control, rate of appropriate venous thromboembolism (VTE) prophylaxis or perioperative beta-blocker use compared with patients cared for by surgeons alone.11,12
While it is tempting to think hospitalists have re-engineered the systems of care to the point that any provider can fluently and adroitly care for patients, continued reports of less-than-optimal hospital outcomes do not support this hypothesis. More likely, the variance in the early and recent studies relates to the egress from the hospital of less capable or engaged non-hospitalist providers such that more recent findings reflect a comparator group that more closely approximates, in terms of clinical volume, hospitalists.
It’s time to reconsider how we document the merit of hospitalists. Continuing to benchmark hospitalists against non-hospitalists will not tell us if inpatient care is becoming safer, only how one group is doing compared with another. Nor will it necessarily lead to improvements in the quality of care.
To fulfill the promise of the hospitalist model, we need to ensure hospitalists are doing it better, not just better than an external comparator group. As such, it would be more valuable to evaluate hospitalists today versus those five years ago. If, as I suspect, there would be little difference in the clinical outcomes between a new hospitalist (or one in practice for three years) in 2003 and one in 2008 and we accept that hospitalist care has yet to achieve its pinnacle then we must adopt a new path. This will require redesigning the way we train hospitalists.
The ineffectiveness of our current training system is playing out in Dr. Lindenauer’s New England Journal of Medicine paper last year. He found hospitalist outcomes are only marginally better than their similarly trained traditional internist colleagues. To expect differences is to succumb to Albert Einstein’s definition of insanity. We simply cannot expect hospitalists to improve the quality of care with the same set of tools that didn’t allow our predecessors to do so.
Hospitalist-Focused Curricula
Several studies have evaluated the gap between internal medicine (IM) training and hospital medicine practice. A 2007 paper reported that nearly 30% of a community hospitalist practice consisted of areas of under emphasis in traditional IM training.13
These include consultative medicine (6.4% of practice) and the care of the patients with neurological (13.4%), orthopedic (6.4%), or general surgical (2.2%) issues. Additionally, nearly 50% of their practice consisted of patients older than 65, with the largest subset of patients ages 75-84.
Yet, most IM residency training programs do not adequately train housestaff to care for these types of patients and problems. Plauth, et al., documented areas of educational deficiencies by surveying several hundred IM-trained hospitalists about their preparedness to practice hospital medicine following residency training.14
The respondents reported feeling unprepared to care for the type and amount of neurology, geriatrics, palliative care and consultative and perioperative medicine they encountered.
Additionally, they were ill-equipped for the myriad quality improvement and systems and transitions-of-care issues they faced daily.
The “2005-2006 SHM Survey: State of the Hospital Medicine Movement” further highlighted the level of hospitalist non-clinical work, showing that 86% of hospitalist groups engage in quality improvement, 72% contribute practice guidelines, 54% work in utilization review, and 54% are involved in developing electronic medical records and provider order entry.15
For the hospitalist model to deliver outcomes superior to our traditional care model, we will need to create training programs that provide hospitalists with the skills current IM graduates do not possess.
Training programs must evolve to include the necessary clinical and non-clinical aspects of this new medical specialty. Hospitalists have populated the American healthcare landscape for more than a decade, yet very few training programs support innovation in the field of hospital medicine.
It is past time for IM educators, many of whom are hospitalists, to bridge this educational chasm through curricular reform. Short of this, the hospital medicine movement will achieve its pinnacle well short of its promise. TH
Dr. Glasheen is associate professor of medicine at the University of Colorado at Denver, where he serves as director of the Hospital Medicine Program and the Hospitalist Training Program, and as associate program director of the Internal Medicine Residency Program.
References
- Society of Hospital Medicine. General information about SHM. Available at: www.hospitalmedicine.org/Content/NavigationMenu/AboutSHM/GeneralInformation/General_Information.htm. Accessed April 25, 2008.
- Wachter RB, Katz P, Showstack J, Bindman AB, Goldman L. Reorganizing an academic medical service. JAMA. 1998;279:1560-1565.
- Diamond HS, Goldberg E, Janosky JE. The effect of full-time faculty hospitalists on the efficiency of care at a community teaching hospital. Ann Intern Med. 1998;129:197-203.
- Freese RB. The Park Nicollet experience in establishing a hospitalist system. Ann Intern Med. 1999;130:350-354.
- Craig DE, Hartka L, Likosky WH, Caplan WM, Litsky P, Smithey J. Implementation of a hospitalist system in a large health maintenance organization: The Kaiser Permanente experience. Ann Intern Med. 1999;130:355-359.
- Wachter RM, Goldman L. The hospitalist movement 5 years later. JAMA. 2002;287:487-494.
- Meltzer D, Manning W, Morrison J, et al. Effects of physician experience on costs and outcomes on an academic general medicine service: results of a trial of hospitalists. Ann Intern Med. 2002;137:866-874.
- Auerbach AD, Wachter RM, Katz P, et al. Implementation of a voluntary hospitalist service at a community teaching hospital: Improved clinical efficiency and patient outcomes. Ann Intern Med. 2002;137:859-865.
- Huddleston JM, Long KH, Naessens JM, et al. Medical and surgical comanagement after elective hip and knee arthroplasty. Ann Intern Med. 2004;141:28-38.
- Lindenauer PK, Rothber MB, Pekow PS, Kenwood C, Benjamin EM, Auerbach AD. Outcomes of care by hospitalist, general internists, and family physicians. N Engl J Med. 2007;357:2589-600.
- Dr Andrew Auerbach, personal communication, January 7, 2008.
- Auerbach AD, Rasic MA, Sehgal N, Ide B, Stone B, Maselli J. Opportunity missed: medical consultation, resource use, and quality of care of patients undergoing major surgery. Arch Intern Med. 2007;167:2338-2344.
- Glasheen JJ, Epstein KR, Siegal E, Kutner J, Prochazka AV. The spectrum of community-based hospitalist practice, a call to tailor internal medicine residency training. Arch Intern Med. 2007;167(7):727-728.
- Plauth WH, Pantilat SZ, Wachter RM et al. Hospitalist’s perceptions of their residency training needs: Results of a national survey. Am J Med. 2001;111:247-254.
- Society of Hospital Medicine. 2005-2006 SHM Survey: State of the Hospital Medicine Movement. Available at: http://dev.hospitalmedicine.org/AM/Template.cfm?Section=Survey&Template=/CM/ContentDisplay.cfm&ContentID=14352. Accessed April 28, 2008.
Insanity is doing the same thing over and over again and expecting different results.—Albert Einstein
A hospitalist is defined as a provider whose primary professional focus is the general medical care of hospitalized patients.1
While this allows a concise, usable characterization of a hospitalist, it’s not the whole story. If it were, medical residents, nurses, and inpatient pharmacists all would be hospitalists.
Indeed, a traditional internist with a large hospital practice could reasonably deem him or herself a hospitalist. What defines what a hospitalist does, or should be doing—and how, if at all, is that different than what a traditional internist does in the hospital?
Education Deficiencies
Early data suggested a stark difference between outcomes attributed to hospitalists and general internists who rotated between the clinic and the hospital.
An early experience from the academic environment showed a hospitalist teaching model, when compared with a traditional teaching service, resulted in a 0.6-day length-of-stay (LOS) reduction and a cost savings of $700 per patient with no decrement in the quality of care, clinical outcomes, or satisfaction of provider, housestaff, or patient.2
Similar findings were revealed when community teaching and non-teaching hospitals transitioned to the hospitalist model.3-5 A 2002 review of 19 hospitalist studies revealed an average decreased LOS of 17% coupled with a 1% reduction in hospital costs per case.6
The year 2002 also saw, for the first time, published data that the hospitalist model could reduce in-hospital and 30-day mortality rates.7,8 Together with a 2004 paper showing reductions in minor post-operative complications with hospitalist comanagement of orthopedic patients, these studies suggested hospitalists’ care transcended mere cost savings, improving quality measures as well.9
More recently, however, Lindenauer, et al., found important but less robust differences between hospitalists and non-hospitalists.10 As compared with traditional internists, hospitalists reduced LOS 0.4 days and cost per patient by $268.
While these moderate reductions in LOS and cost versus traditional internists are statistically and clinically significant, they are less vigorous than previous findings. Despite some methodological concerns, this largest investigation—in terms of hospital sites (45), patients (76,926) and hospitalists (284)—revealed no demonstrable improvements in the quality outcomes measured.
Similarly, another recent publication found consultation, provided by medical subspecialists or hospitalists, did not improve glycemic control, rate of appropriate venous thromboembolism (VTE) prophylaxis or perioperative beta-blocker use compared with patients cared for by surgeons alone.11,12
While it is tempting to think hospitalists have re-engineered the systems of care to the point that any provider can fluently and adroitly care for patients, continued reports of less-than-optimal hospital outcomes do not support this hypothesis. More likely, the variance in the early and recent studies relates to the egress from the hospital of less capable or engaged non-hospitalist providers such that more recent findings reflect a comparator group that more closely approximates, in terms of clinical volume, hospitalists.
It’s time to reconsider how we document the merit of hospitalists. Continuing to benchmark hospitalists against non-hospitalists will not tell us if inpatient care is becoming safer, only how one group is doing compared with another. Nor will it necessarily lead to improvements in the quality of care.
To fulfill the promise of the hospitalist model, we need to ensure hospitalists are doing it better, not just better than an external comparator group. As such, it would be more valuable to evaluate hospitalists today versus those five years ago. If, as I suspect, there would be little difference in the clinical outcomes between a new hospitalist (or one in practice for three years) in 2003 and one in 2008 and we accept that hospitalist care has yet to achieve its pinnacle then we must adopt a new path. This will require redesigning the way we train hospitalists.
The ineffectiveness of our current training system is playing out in Dr. Lindenauer’s New England Journal of Medicine paper last year. He found hospitalist outcomes are only marginally better than their similarly trained traditional internist colleagues. To expect differences is to succumb to Albert Einstein’s definition of insanity. We simply cannot expect hospitalists to improve the quality of care with the same set of tools that didn’t allow our predecessors to do so.
Hospitalist-Focused Curricula
Several studies have evaluated the gap between internal medicine (IM) training and hospital medicine practice. A 2007 paper reported that nearly 30% of a community hospitalist practice consisted of areas of under emphasis in traditional IM training.13
These include consultative medicine (6.4% of practice) and the care of the patients with neurological (13.4%), orthopedic (6.4%), or general surgical (2.2%) issues. Additionally, nearly 50% of their practice consisted of patients older than 65, with the largest subset of patients ages 75-84.
Yet, most IM residency training programs do not adequately train housestaff to care for these types of patients and problems. Plauth, et al., documented areas of educational deficiencies by surveying several hundred IM-trained hospitalists about their preparedness to practice hospital medicine following residency training.14
The respondents reported feeling unprepared to care for the type and amount of neurology, geriatrics, palliative care and consultative and perioperative medicine they encountered.
Additionally, they were ill-equipped for the myriad quality improvement and systems and transitions-of-care issues they faced daily.
The “2005-2006 SHM Survey: State of the Hospital Medicine Movement” further highlighted the level of hospitalist non-clinical work, showing that 86% of hospitalist groups engage in quality improvement, 72% contribute practice guidelines, 54% work in utilization review, and 54% are involved in developing electronic medical records and provider order entry.15
For the hospitalist model to deliver outcomes superior to our traditional care model, we will need to create training programs that provide hospitalists with the skills current IM graduates do not possess.
Training programs must evolve to include the necessary clinical and non-clinical aspects of this new medical specialty. Hospitalists have populated the American healthcare landscape for more than a decade, yet very few training programs support innovation in the field of hospital medicine.
It is past time for IM educators, many of whom are hospitalists, to bridge this educational chasm through curricular reform. Short of this, the hospital medicine movement will achieve its pinnacle well short of its promise. TH
Dr. Glasheen is associate professor of medicine at the University of Colorado at Denver, where he serves as director of the Hospital Medicine Program and the Hospitalist Training Program, and as associate program director of the Internal Medicine Residency Program.
References
- Society of Hospital Medicine. General information about SHM. Available at: www.hospitalmedicine.org/Content/NavigationMenu/AboutSHM/GeneralInformation/General_Information.htm. Accessed April 25, 2008.
- Wachter RB, Katz P, Showstack J, Bindman AB, Goldman L. Reorganizing an academic medical service. JAMA. 1998;279:1560-1565.
- Diamond HS, Goldberg E, Janosky JE. The effect of full-time faculty hospitalists on the efficiency of care at a community teaching hospital. Ann Intern Med. 1998;129:197-203.
- Freese RB. The Park Nicollet experience in establishing a hospitalist system. Ann Intern Med. 1999;130:350-354.
- Craig DE, Hartka L, Likosky WH, Caplan WM, Litsky P, Smithey J. Implementation of a hospitalist system in a large health maintenance organization: The Kaiser Permanente experience. Ann Intern Med. 1999;130:355-359.
- Wachter RM, Goldman L. The hospitalist movement 5 years later. JAMA. 2002;287:487-494.
- Meltzer D, Manning W, Morrison J, et al. Effects of physician experience on costs and outcomes on an academic general medicine service: results of a trial of hospitalists. Ann Intern Med. 2002;137:866-874.
- Auerbach AD, Wachter RM, Katz P, et al. Implementation of a voluntary hospitalist service at a community teaching hospital: Improved clinical efficiency and patient outcomes. Ann Intern Med. 2002;137:859-865.
- Huddleston JM, Long KH, Naessens JM, et al. Medical and surgical comanagement after elective hip and knee arthroplasty. Ann Intern Med. 2004;141:28-38.
- Lindenauer PK, Rothber MB, Pekow PS, Kenwood C, Benjamin EM, Auerbach AD. Outcomes of care by hospitalist, general internists, and family physicians. N Engl J Med. 2007;357:2589-600.
- Dr Andrew Auerbach, personal communication, January 7, 2008.
- Auerbach AD, Rasic MA, Sehgal N, Ide B, Stone B, Maselli J. Opportunity missed: medical consultation, resource use, and quality of care of patients undergoing major surgery. Arch Intern Med. 2007;167:2338-2344.
- Glasheen JJ, Epstein KR, Siegal E, Kutner J, Prochazka AV. The spectrum of community-based hospitalist practice, a call to tailor internal medicine residency training. Arch Intern Med. 2007;167(7):727-728.
- Plauth WH, Pantilat SZ, Wachter RM et al. Hospitalist’s perceptions of their residency training needs: Results of a national survey. Am J Med. 2001;111:247-254.
- Society of Hospital Medicine. 2005-2006 SHM Survey: State of the Hospital Medicine Movement. Available at: http://dev.hospitalmedicine.org/AM/Template.cfm?Section=Survey&Template=/CM/ContentDisplay.cfm&ContentID=14352. Accessed April 28, 2008.
Medicine’s Guiding Team
Change is in the air. Some pundits point to a new healthcare system; others point to something a little less dramatic on the edges. No matter how one views it, change definitely is afoot.
The last time I recall a similar feeling was 1993. There was a general feeling then among many in healthcare that a unique convergence of events might result in healthcare reform. Because of the similarities between 1993 and 2008, many people are naturally wondering whether the atmosphere is similar enough to again result in reform this time.
What do we know about healthcare in 2008 as opposed to 1993? Well, an even greater share of the United States economy is based on healthcare. The quality and patient-safety movement has arrived. There is a greater discussion about pay for performance. The effects of consumerism are being felt by all healthcare providers. There is evidence the United States does not have the best healthcare.1 There still are some physician shortages, and predictions of greater shortages, albeit in different areas then 1993. So, if anything, the burning platform for change appears brighter in 2008 than in 1993.

As I reflect on these facts and the differences between then and now, I think of the principles of change management.2,3 Establishing the burning platform or the sense of urgency is only the first step in change. It is a vital one, but if the next steps are not completed, hard-wired change does not occur.
The second tenet of change management is that you must pull together a guiding team. There must be a powerful group guiding the change—one with leadership skills, credibility, communications ability, authority, analytical skills, and sense of urgency.
This is the main difference between 1993 and 2008 and one that convinces me we are on the road to change in healthcare. For the biggest difference is you. In 1993, there were several hundred hospitalists in the United States. Now, there are approximately 20,000 and a robust professional society to help manage and lead the group.
You are the guiding team. Why? In many mature hospital medicine programs, hospitalists account for the majority of a hospital’s admissions. Add this to the fact that more than 30% of healthcare is spent on hospital care. The result is that hospitalists through their pens control a significant amount of the healthcare market. Hospitalists have the leadership, authority, and credibility to be the guiding team. And when I see the tremendous skills of hospitalists in guiding new programs and serving as medical staff leaders, I am convinced hospitalists are the nation’s guiding team in healthcare reform.
The third step in change management principles is deciding what to do. There must be a unified vision and strategy. I am not as confident this vision is fully formed yet and hence one of the reasons we won’t get change immediately. To create a unified vision and strategy, we need additional innovation in hospital care. Granted, hospital medicine is a relatively recent innovation; we are far from done developing the right care mode for hospitalized patients.
What is the area we need to innovate in the most? Our practices. While there is much innovation occurring in hospital medicine, we need to continue aggressively pursuing new methods of care delivery. Year after year at our annual meetings, we see tremendous evidence of innovation in the numerous abstracts presented. Still, we must try to take it up to a new level. The present way of doing things isn’t sustainable. We cannot completely care for patients by merely working harder in our current care-delivery model. Working differently or fundamentally redesigning our jobs will help us. It will help us see more patients and deliver greater quality, all while maintaining high degrees of personal and professional satisfaction.
Do not leave the innovation up to others. Each of us must continue to assess how we deliver care through a team model. We must evaluate how to better integrate with midlevel providers. We must lead in transitions of care and discharge planning. We need to re-examine the basic model of physician-patient care. We must make sure residency and post-residency training prepare hospitalists for all of this. Finally, we need to innovate on how hospital administrators and hospitalists work together to improve quality and patient safety.
Don’t forget to share those innovations with SHM. SHM is your conduit to change healthcare—and if you take things to the third step of change management, SHM easily can help you through the remaining steps. TH
Dr. Cawley is president of SHM.
References
- Davis K, Schoen C, Schoenbaum SC, et al. Mirror, mirror on the wall: an international update on the comparative performance of American health care. Commonwealth Fund: May 2007.
- Kotter J. Leading change. Boston: Harvard Business Press; 1996.
- Kotter J, Rathgebar H. Our iceberg is melting: changing and succeeding under any condition. New York: St. Martin’s Press; 2005.
Change is in the air. Some pundits point to a new healthcare system; others point to something a little less dramatic on the edges. No matter how one views it, change definitely is afoot.
The last time I recall a similar feeling was 1993. There was a general feeling then among many in healthcare that a unique convergence of events might result in healthcare reform. Because of the similarities between 1993 and 2008, many people are naturally wondering whether the atmosphere is similar enough to again result in reform this time.
What do we know about healthcare in 2008 as opposed to 1993? Well, an even greater share of the United States economy is based on healthcare. The quality and patient-safety movement has arrived. There is a greater discussion about pay for performance. The effects of consumerism are being felt by all healthcare providers. There is evidence the United States does not have the best healthcare.1 There still are some physician shortages, and predictions of greater shortages, albeit in different areas then 1993. So, if anything, the burning platform for change appears brighter in 2008 than in 1993.
As I reflect on these facts and the differences between then and now, I think of the principles of change management.2,3 Establishing the burning platform or the sense of urgency is only the first step in change. It is a vital one, but if the next steps are not completed, hard-wired change does not occur.
The second tenet of change management is that you must pull together a guiding team. There must be a powerful group guiding the change—one with leadership skills, credibility, communications ability, authority, analytical skills, and sense of urgency.
This is the main difference between 1993 and 2008 and one that convinces me we are on the road to change in healthcare. For the biggest difference is you. In 1993, there were several hundred hospitalists in the United States. Now, there are approximately 20,000 and a robust professional society to help manage and lead the group.
You are the guiding team. Why? In many mature hospital medicine programs, hospitalists account for the majority of a hospital’s admissions. Add this to the fact that more than 30% of healthcare is spent on hospital care. The result is that hospitalists through their pens control a significant amount of the healthcare market. Hospitalists have the leadership, authority, and credibility to be the guiding team. And when I see the tremendous skills of hospitalists in guiding new programs and serving as medical staff leaders, I am convinced hospitalists are the nation’s guiding team in healthcare reform.
The third step in change management principles is deciding what to do. There must be a unified vision and strategy. I am not as confident this vision is fully formed yet and hence one of the reasons we won’t get change immediately. To create a unified vision and strategy, we need additional innovation in hospital care. Granted, hospital medicine is a relatively recent innovation; we are far from done developing the right care mode for hospitalized patients.
What is the area we need to innovate in the most? Our practices. While there is much innovation occurring in hospital medicine, we need to continue aggressively pursuing new methods of care delivery. Year after year at our annual meetings, we see tremendous evidence of innovation in the numerous abstracts presented. Still, we must try to take it up to a new level. The present way of doing things isn’t sustainable. We cannot completely care for patients by merely working harder in our current care-delivery model. Working differently or fundamentally redesigning our jobs will help us. It will help us see more patients and deliver greater quality, all while maintaining high degrees of personal and professional satisfaction.
Do not leave the innovation up to others. Each of us must continue to assess how we deliver care through a team model. We must evaluate how to better integrate with midlevel providers. We must lead in transitions of care and discharge planning. We need to re-examine the basic model of physician-patient care. We must make sure residency and post-residency training prepare hospitalists for all of this. Finally, we need to innovate on how hospital administrators and hospitalists work together to improve quality and patient safety.
Don’t forget to share those innovations with SHM. SHM is your conduit to change healthcare—and if you take things to the third step of change management, SHM easily can help you through the remaining steps. TH
Dr. Cawley is president of SHM.
References
- Davis K, Schoen C, Schoenbaum SC, et al. Mirror, mirror on the wall: an international update on the comparative performance of American health care. Commonwealth Fund: May 2007.
- Kotter J. Leading change. Boston: Harvard Business Press; 1996.
- Kotter J, Rathgebar H. Our iceberg is melting: changing and succeeding under any condition. New York: St. Martin’s Press; 2005.
What is the best intervention to help hospitalized patients quit smoking?
Case
A 56-year-old male with a 60-pack-a-year history of cigarette smoking is admitted to the telemetry unit with an initial assessment of acute coronary syndrome. Because there is a no-smoking policy in the hospital, he is willing to comply but is concerned about tobacco withdrawal symptoms.
Overview
As of 2006, approximately 20.8% of U.S. adults smoke cigarettes.1 Responsible for approximately 438,000 deaths annually, cigarette smoking is the most important preventable cause of death and disease in the U.S.2
Smoking cessation reduces the risk of tobacco-related diseases; the potential health benefits are numerous. This is most evident in the reduction of cardiovascular disease events upon tobacco abstinence.3 Yet, it remains a constant struggle for smokers to quit and stay abstinent.
The main barrier to quitting is nicotine addiction, which causes tolerance and physical dependence. Upon cessation of tobacco use, withdrawal symptoms, such as irritability, restlessness, impatience, and depression may occur within a few hours, peak within the first several days, and then wane during the next few months.
The crucial time frame to prevent relapse is the first week of cessation. For smokers to stay off cigarettes, they must break from routines, behaviors, or cues that trigger the urge to smoke.4
Among patients with acute myocardial infarction (AMI) in a study done by Van Spall, et al., 39% of them still smoked.5 Indeed, smoking is associated with 1.5 to three times increased relative risk of AMI, and hospitalists increasingly must manage cardiovascular disease patients’ tobacco dependence during their hospital stay.
Intervention strategies: Methods for smoking cessation need to target two aspects that support tobacco use—physical and psychological factors. High-intensity counseling and systematic behavioral intervention followed by sustained contact—in person or by phone up to one month after discharge—are effective behavioral interventions for sustained tobacco cessation.6 Pharmacotherapy also helps when added to high-intensity counseling of a hospitalized patient. It especially is beneficial for controlling withdrawal symptoms.
In addition, with policies prohibiting smoking in almost all U.S. hospitals, temporary tobacco abstinence promotes smoking cessation for hospitalized patients. Unfortunately, most hospitalized patients go back to smoking soon after discharge. Hospitalization may be the opportune time to help patients try to quit and avoid relapse.
Some hospitals feature inpatient smoking cessation programs in which nurse practitioners and counselors educate and counsel patients. It is highly recommended that a multidisciplinary team be involved in a tobacco cessation program catered to an individual patient’s needs. However, most hospitals have no such program. Nevertheless, the hospitalist can help a patient with brief or low-intensity tobacco cessation counseling, pharmacotherapy for nicotine withdrawal symptom control if clinically indicated, and follow-up upon discharge for relapse prevention.
Counseling: Smoking cessation counseling in the hospital after an AMI has been found to be associated with a relative risk reduction of mortality by 37% in one year. The hospitalist should give a two-minute cessation message as the first step. If tobacco cessation counselors or nurse practitioners are available, their additional counseling also may improve outcomes of smoking cessation therapies.7 However, if no established inpatient tobacco cessation program is available to the hospitalist, the following may be used to aid in physician counseling of the hospitalized cardiac patient:
The first step in treating tobacco dependence is to identify and assess tobacco use status.
Tobacco users willing to quit should be treated using the 5 A’s (Ask, Advise, Assess, Assist, and Arrange) (see Figure 1, p. 30). Tobacco users not willing to quit at the time of interaction should be treated using the 5 R’s for motivational intervention:
- Relevance (indicate why quitting is personally relevant);
- Risks (have patient identify potentially negative consequences of smoking);
- Rewards (have patient identify potential benefits of quitting smoking);
- Roadblocks (have patient identify potential barriers to smoking cessation and provide patient problem-solving techniques and pharmacotherapy to overcome the barriers); and
- Repetition (repeat motivational intervention to unmotivated patient each visit).
Further, former smokers who recently quit using tobacco should be given relapse prevention treatment.8 For the hospitalized smoker with acute cardiovascular disease, providing bedside counseling, enhancing self-coping behavior change, and arranging follow-up after discharge to maintain behavior change can help sustain tobacco abstinence.
Pharmacotherapy: The most important purpose of pharmacotherapy for smoking cessation is to reduce withdrawal symptoms and cigarette cravings. Public Health Service clinical guidelines for smoking cessation mention five first-line agents. These are sustained-release bupropion and four nicotine-replacement therapies (NRT): transdermal patch, gum, nasal spray, and vapor inhaler. Further, there are two second-line agents: clonidine and nortriptyline. Since the clinical guidelines’ release in 2000, the Food and Drug Administration has approved a fifth NRT product, the nicotine lozenge, in 2002, and a partial nicotine agonist, varenicline, in 2006 (see Table 1, right).9,10
Current guidelines recommend that NRT be used with caution in patients with unstable angina, serious arrhythmias, or an MI within the previous two weeks due to limited supportive data on the safety of use in these patients.11 The transdermal patch delivers nicotine at a slow and constant rate in contrast to the other forms of NRT and has been used safely in patients with stable coronary artery disease. However, the use of any NRT, including the patch, in acute cardiovascular disease is not advised due to the nicotine-mediated hemodynamic effects, such as increase heart rate and arterial vasoconstriction, which lead to increased myocardial workload.
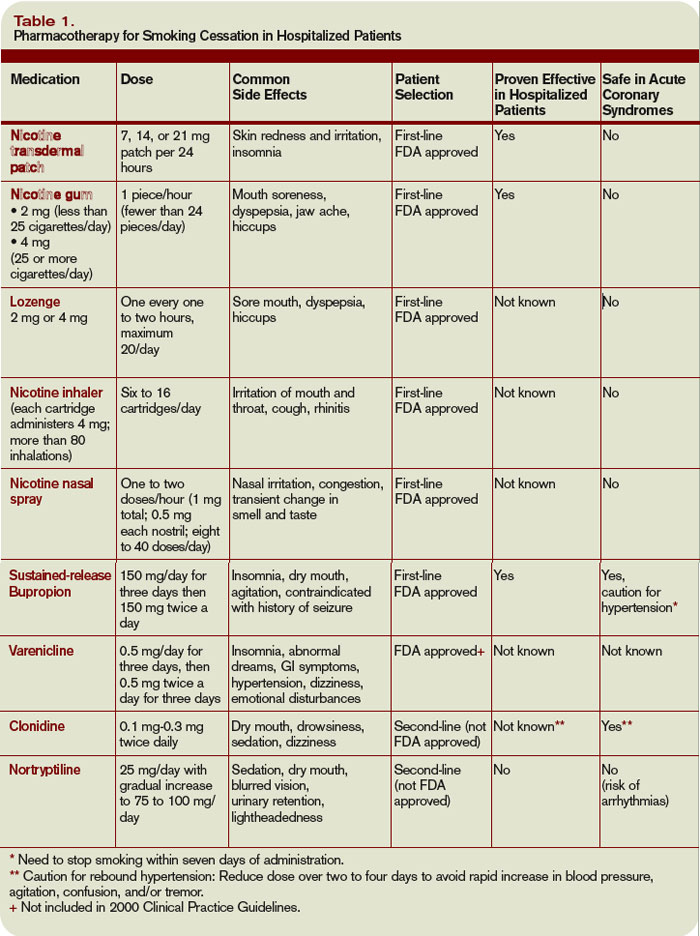
Sustained-release bupropion generally is well tolerated by hospitalized patients with cardiovascular disease, but there may be a delay in control of withdrawal symptoms. In addition, blood pressure must be monitored especially if combined with NRT as there have been anecdotal reports of increase in blood pressure with bupropion alone.12 Bupropion must be used cautiously in patients with recent MI. Other contraindications include history of seizure, conditions that potentially can increase risk for convulsions, and use of monoamine oxidase inhibitors (MAOI) within 14 days.
The new drug varenicline has not been studied in hospitalized patients or patients with acute coronary syndrome. However, since it does not have any important hemodynamic effects, it may be useful in this setting and in selected patients with close monitoring for mood changes since there have been anecdotal case reports of psychotic events in patients with underlying psychiatric disorders.13 Its routine use currently is not recommended.
Follow-up after discharge: Pharmacotherapy may be added for withdrawal control, as well as relapse prevention for the hospitalized patient who recently quit smoking. However, inclusion of intensive tobacco cessation counseling during the hospital stay is the most effective intervention given the setting and patient condition, and follow-up support up to at least one month after discharge has been found to be more effective in sustaining tobacco abstinence than pharmacotherapy alone. In order to maximize long-term quit rates among patients who recently abstained from smoking, the hospitalist should arrange access to ongoing outpatient post-discharge support and tobacco cessation treatment.
Back to the Case
After appropriate cardiac testing, the patient was found to have a non-cardiac etiology for his symptoms. From the start of his hospital stay, he was counseled by the hospitalist and started on sustained-release bupropion, but withdrawal symptoms and cravings persisted.
Prior to his discharge home, the patient wanted to discontinue bupropion and be provided an alternative. The patient was given a nicotine patch, and a follow-up appointment at the tobacco cessation clinic within one week of discharge from the hospital was arranged. The patient has been compliant with his quit-smoking treatment and has followed-up for continued tobacco cessation counseling. He hasn’t smoked cigarettes for a year. TH
Dr. Palisoc is a preventive medicine resident at the University of Colorado Denver. Dr. Prochazka works at the Denver VA and is a professor of medicine at the University of Colorado Denver.
References
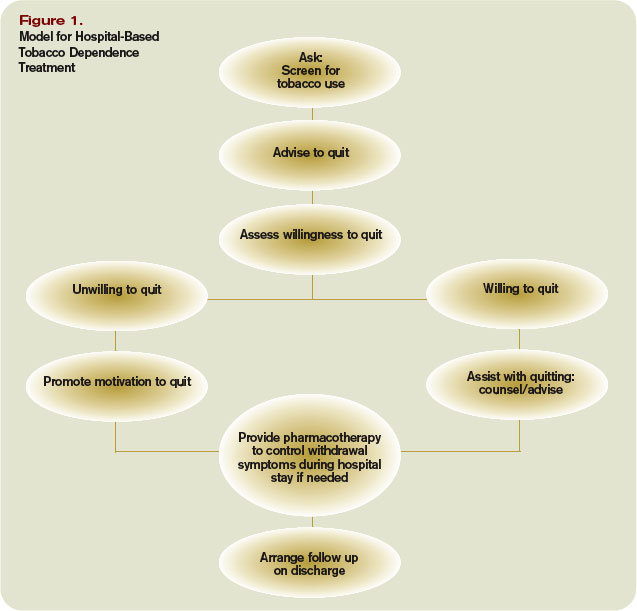
- CDC. Cigarette Smoking Among Adults, United States, 2006. MMWR Morbidity Mortality Wkly Rep. 2007;56(44):1157-1161. Available at www.cdc.gov/mmwr/preview/mmwrhtml/mm5644a2.htm. Last accessed March 4, 2008.
- CDC. Annual Smoking-Attributable Mortality, Years of Potential Life Lost, and Productivity, United States, 1997-2001. MMWR Morbidity Mortality Wkly Rep. 2005;54(25):625-628.
- Thomson CC, Rigotti NA. Hospital- and clinic-based smoking cessation interventions for smokers with cardiovascular disease. Prog Cardiovasc Dis. 2003;45(6):459-479.
- Rigotti NA. Treatment of tobacco use and dependence. N Engl J Med. 2002;346(7):506-512.
- Van Spall HGC, Chong A, Tu JV. Inpatient smoking-cessation counseling and all-cause mortality in patients with acute myocardial infarction. Am Heart J. 2007;154(2):213-220.
- Rigotti NA, Munafo MR, Stead LF. Interventions for smoking cessation in hospitalized patients. Cochrane Database Syst Rev. 2007;Issue 3.
- Ludvig J, Miner B, and Eisenberg, MJ. Smoking cessation in patients with coronary artery disease. Am Heart J. 2005;149(4):565-572.
- Fiore MC, Bailey WC, Cohen SJ, et al. Treating tobacco use and dependence: clinical practice guideline. Rockville, MD: U.S. Department of Health and Human Services, Public Health Service 2000.
- Rigotti NA, Thorndike AN, Regan S, et al. Bupropion for smokers hospitalized with acute cardiovascular disease. Am J Med. 2006;199:1080-1087.
- Jorenby DE, Hays JT, Rigotti NA, et al. Efficacy of varenicline, an alpha4beta2 nicotinic acetylcholine receptor partial agonist, vs. placebo or sustained-release bupropion for smoking cessation: a randomized controlled trial. JAMA. 2006;296(1):56-63.
- Joseph AM, Fu SS. Safety issues in pharmacotherapy for smoking in patients with cardiovascular disease. Prog Cardiovasc Dis. 2003;45(6):429-441.
- FDA. Prescribing information of Zyban (bupropion hydrochloride) sustained release tablets. June 2007. Available at www.fda.gov/medwatch/safety/2007/ Aug_PI/Zyban_PI.pdf. Last accessed March 6, 2008.
- FDA. Early Communication About an Ongoing Safety Review: Varenicline (marketed as Chantix). November 2007. Available at www.fda.gov/cder/drug/early_comm/varenicline.htm. Last accessed March 6, 2008.
Case
A 56-year-old male with a 60-pack-a-year history of cigarette smoking is admitted to the telemetry unit with an initial assessment of acute coronary syndrome. Because there is a no-smoking policy in the hospital, he is willing to comply but is concerned about tobacco withdrawal symptoms.
Overview
As of 2006, approximately 20.8% of U.S. adults smoke cigarettes.1 Responsible for approximately 438,000 deaths annually, cigarette smoking is the most important preventable cause of death and disease in the U.S.2
Smoking cessation reduces the risk of tobacco-related diseases; the potential health benefits are numerous. This is most evident in the reduction of cardiovascular disease events upon tobacco abstinence.3 Yet, it remains a constant struggle for smokers to quit and stay abstinent.
The main barrier to quitting is nicotine addiction, which causes tolerance and physical dependence. Upon cessation of tobacco use, withdrawal symptoms, such as irritability, restlessness, impatience, and depression may occur within a few hours, peak within the first several days, and then wane during the next few months.
The crucial time frame to prevent relapse is the first week of cessation. For smokers to stay off cigarettes, they must break from routines, behaviors, or cues that trigger the urge to smoke.4
Among patients with acute myocardial infarction (AMI) in a study done by Van Spall, et al., 39% of them still smoked.5 Indeed, smoking is associated with 1.5 to three times increased relative risk of AMI, and hospitalists increasingly must manage cardiovascular disease patients’ tobacco dependence during their hospital stay.
Intervention strategies: Methods for smoking cessation need to target two aspects that support tobacco use—physical and psychological factors. High-intensity counseling and systematic behavioral intervention followed by sustained contact—in person or by phone up to one month after discharge—are effective behavioral interventions for sustained tobacco cessation.6 Pharmacotherapy also helps when added to high-intensity counseling of a hospitalized patient. It especially is beneficial for controlling withdrawal symptoms.
In addition, with policies prohibiting smoking in almost all U.S. hospitals, temporary tobacco abstinence promotes smoking cessation for hospitalized patients. Unfortunately, most hospitalized patients go back to smoking soon after discharge. Hospitalization may be the opportune time to help patients try to quit and avoid relapse.
Some hospitals feature inpatient smoking cessation programs in which nurse practitioners and counselors educate and counsel patients. It is highly recommended that a multidisciplinary team be involved in a tobacco cessation program catered to an individual patient’s needs. However, most hospitals have no such program. Nevertheless, the hospitalist can help a patient with brief or low-intensity tobacco cessation counseling, pharmacotherapy for nicotine withdrawal symptom control if clinically indicated, and follow-up upon discharge for relapse prevention.
Counseling: Smoking cessation counseling in the hospital after an AMI has been found to be associated with a relative risk reduction of mortality by 37% in one year. The hospitalist should give a two-minute cessation message as the first step. If tobacco cessation counselors or nurse practitioners are available, their additional counseling also may improve outcomes of smoking cessation therapies.7 However, if no established inpatient tobacco cessation program is available to the hospitalist, the following may be used to aid in physician counseling of the hospitalized cardiac patient:
The first step in treating tobacco dependence is to identify and assess tobacco use status.
Tobacco users willing to quit should be treated using the 5 A’s (Ask, Advise, Assess, Assist, and Arrange) (see Figure 1, p. 30). Tobacco users not willing to quit at the time of interaction should be treated using the 5 R’s for motivational intervention:
- Relevance (indicate why quitting is personally relevant);
- Risks (have patient identify potentially negative consequences of smoking);
- Rewards (have patient identify potential benefits of quitting smoking);
- Roadblocks (have patient identify potential barriers to smoking cessation and provide patient problem-solving techniques and pharmacotherapy to overcome the barriers); and
- Repetition (repeat motivational intervention to unmotivated patient each visit).
Further, former smokers who recently quit using tobacco should be given relapse prevention treatment.8 For the hospitalized smoker with acute cardiovascular disease, providing bedside counseling, enhancing self-coping behavior change, and arranging follow-up after discharge to maintain behavior change can help sustain tobacco abstinence.
Pharmacotherapy: The most important purpose of pharmacotherapy for smoking cessation is to reduce withdrawal symptoms and cigarette cravings. Public Health Service clinical guidelines for smoking cessation mention five first-line agents. These are sustained-release bupropion and four nicotine-replacement therapies (NRT): transdermal patch, gum, nasal spray, and vapor inhaler. Further, there are two second-line agents: clonidine and nortriptyline. Since the clinical guidelines’ release in 2000, the Food and Drug Administration has approved a fifth NRT product, the nicotine lozenge, in 2002, and a partial nicotine agonist, varenicline, in 2006 (see Table 1, right).9,10
Current guidelines recommend that NRT be used with caution in patients with unstable angina, serious arrhythmias, or an MI within the previous two weeks due to limited supportive data on the safety of use in these patients.11 The transdermal patch delivers nicotine at a slow and constant rate in contrast to the other forms of NRT and has been used safely in patients with stable coronary artery disease. However, the use of any NRT, including the patch, in acute cardiovascular disease is not advised due to the nicotine-mediated hemodynamic effects, such as increase heart rate and arterial vasoconstriction, which lead to increased myocardial workload.
Sustained-release bupropion generally is well tolerated by hospitalized patients with cardiovascular disease, but there may be a delay in control of withdrawal symptoms. In addition, blood pressure must be monitored especially if combined with NRT as there have been anecdotal reports of increase in blood pressure with bupropion alone.12 Bupropion must be used cautiously in patients with recent MI. Other contraindications include history of seizure, conditions that potentially can increase risk for convulsions, and use of monoamine oxidase inhibitors (MAOI) within 14 days.
The new drug varenicline has not been studied in hospitalized patients or patients with acute coronary syndrome. However, since it does not have any important hemodynamic effects, it may be useful in this setting and in selected patients with close monitoring for mood changes since there have been anecdotal case reports of psychotic events in patients with underlying psychiatric disorders.13 Its routine use currently is not recommended.
Follow-up after discharge: Pharmacotherapy may be added for withdrawal control, as well as relapse prevention for the hospitalized patient who recently quit smoking. However, inclusion of intensive tobacco cessation counseling during the hospital stay is the most effective intervention given the setting and patient condition, and follow-up support up to at least one month after discharge has been found to be more effective in sustaining tobacco abstinence than pharmacotherapy alone. In order to maximize long-term quit rates among patients who recently abstained from smoking, the hospitalist should arrange access to ongoing outpatient post-discharge support and tobacco cessation treatment.
Back to the Case
After appropriate cardiac testing, the patient was found to have a non-cardiac etiology for his symptoms. From the start of his hospital stay, he was counseled by the hospitalist and started on sustained-release bupropion, but withdrawal symptoms and cravings persisted.
Prior to his discharge home, the patient wanted to discontinue bupropion and be provided an alternative. The patient was given a nicotine patch, and a follow-up appointment at the tobacco cessation clinic within one week of discharge from the hospital was arranged. The patient has been compliant with his quit-smoking treatment and has followed-up for continued tobacco cessation counseling. He hasn’t smoked cigarettes for a year. TH
Dr. Palisoc is a preventive medicine resident at the University of Colorado Denver. Dr. Prochazka works at the Denver VA and is a professor of medicine at the University of Colorado Denver.
References
- CDC. Cigarette Smoking Among Adults, United States, 2006. MMWR Morbidity Mortality Wkly Rep. 2007;56(44):1157-1161. Available at www.cdc.gov/mmwr/preview/mmwrhtml/mm5644a2.htm. Last accessed March 4, 2008.
- CDC. Annual Smoking-Attributable Mortality, Years of Potential Life Lost, and Productivity, United States, 1997-2001. MMWR Morbidity Mortality Wkly Rep. 2005;54(25):625-628.
- Thomson CC, Rigotti NA. Hospital- and clinic-based smoking cessation interventions for smokers with cardiovascular disease. Prog Cardiovasc Dis. 2003;45(6):459-479.
- Rigotti NA. Treatment of tobacco use and dependence. N Engl J Med. 2002;346(7):506-512.
- Van Spall HGC, Chong A, Tu JV. Inpatient smoking-cessation counseling and all-cause mortality in patients with acute myocardial infarction. Am Heart J. 2007;154(2):213-220.
- Rigotti NA, Munafo MR, Stead LF. Interventions for smoking cessation in hospitalized patients. Cochrane Database Syst Rev. 2007;Issue 3.
- Ludvig J, Miner B, and Eisenberg, MJ. Smoking cessation in patients with coronary artery disease. Am Heart J. 2005;149(4):565-572.
- Fiore MC, Bailey WC, Cohen SJ, et al. Treating tobacco use and dependence: clinical practice guideline. Rockville, MD: U.S. Department of Health and Human Services, Public Health Service 2000.
- Rigotti NA, Thorndike AN, Regan S, et al. Bupropion for smokers hospitalized with acute cardiovascular disease. Am J Med. 2006;199:1080-1087.
- Jorenby DE, Hays JT, Rigotti NA, et al. Efficacy of varenicline, an alpha4beta2 nicotinic acetylcholine receptor partial agonist, vs. placebo or sustained-release bupropion for smoking cessation: a randomized controlled trial. JAMA. 2006;296(1):56-63.
- Joseph AM, Fu SS. Safety issues in pharmacotherapy for smoking in patients with cardiovascular disease. Prog Cardiovasc Dis. 2003;45(6):429-441.
- FDA. Prescribing information of Zyban (bupropion hydrochloride) sustained release tablets. June 2007. Available at www.fda.gov/medwatch/safety/2007/ Aug_PI/Zyban_PI.pdf. Last accessed March 6, 2008.
- FDA. Early Communication About an Ongoing Safety Review: Varenicline (marketed as Chantix). November 2007. Available at www.fda.gov/cder/drug/early_comm/varenicline.htm. Last accessed March 6, 2008.