User login
The Ultrasound Advantage
The iPhone may be the latest “it” gadget, but a flurry of recent innovation has given portable ultrasound devices a healthy buzz within the biomedical community.
Beyond the gee-whiz factor, though, a growing number of studies demonstrate the everyday value of putting portable units in the hands of hospitalists.
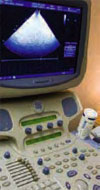
“The big news has been the tiny portable scanner,” says Stephen Smith, a biomedical engineer at Duke University, in North Carolina, and a pioneer in ultrasound technology. Siemens recently introduced a hand-held device called the Acuson P10, which weighs 1.6 pounds, retails for $9,499 and can fit within a hospitalist’s coat pocket. Not to be outdone, GE has announced plans to introduce an ultrasound unit no bigger than an iPod.
Smith and his collaborators have taken the technology one step farther. They incorporate electrocardial leads on the unit’s transducer face to permit electrocardiograms and a microphone to let hospitalists use the ultrasound like a stethoscope.
Eric Isaacs, MD, a clinical professor of medicine at San Francisco General Hospital, says he routinely uses ultrasound for vascular access “to ensure the safety of procedures that we previously performed either blind or by anatomical landmarks.” Beyond improving the accuracy of placing central and peripheral lines, he says, “the reason we are using ultrasound more now is that the machine is so portable. The radiologists are no longer in the hospital 24 hours a day, and so by necessity we are using the tools that were previously only accessible from 9 to 5.”
Range of Uses
Among the reports recognizing ultrasound’s value, he cited a 2003 study in the British Medical Journal affirming the technology’s superiority to relying on physical landmarks in gaining central venous access, resulting in a lower technical failure rate, reduced complications, and faster access.1 Dr. Issacs says ultrasound also has helped guide procedures such as thorancentesis and paracentesis, other applications once confined to radiology. “It’s something that’s allowing me to do at the bedside what I would otherwise have to wait several hours for,” he says.
For heart patients, he says, a hospitalist can bring ultrasound to the bedside during a cardiac arrest to inspect cardiac motion and fluid, and monitor the patient’s hydration status by examining the size of the inferior vena cava. Internists likewise could examine the size of a patient’s aorta to look for signs of an aneurism, especially for a patient experiencing abdominal pain in the middle of the night. “Quite frankly, it seems like the only limit to ultrasound use is imagination,” Dr. Isaacs says.
Robert Rodriguez, MD, a clinical professor of medicine and emergency medicine at San Francisco General Hospital, says he uses ultrasound on 25% of the patients he sees on an in-patient basis. His biggest use, he says, is for placing central lines—though that could soon change.
“I work with a population that has a very high percentage of injection drug abuse, in whom it’s very difficult to find even a peripheral vein,” he says. At least once a day, he uses ultrasound to locate the brachial vein for such peripheral lines, circumventing the need for a central line through the subclavian vein and the risk of a pneumothorax. “In the past, we would have to put in a central line for just about anything,” he says. “And now we can put in a peripheral line that saves them the risk.”
Another benefit, he says, is in breeding better patient interactions—for example, with gallstones. “You can say to the patient: ‘This is the gallbladder, these are the stones in the gallbladder, this is what’s causing the pain,’” he says. “I think patients appreciate being able to see that firsthand. I think they also appreciate that it’s going to lessen their likelihood of having a complication.”
At the University of Chicago Medical Center, cardiologist Kirk Spencer, MD, says ultrasound procedures still are performed mainly by sonographers and cardiologists. He hopes to change that with a slew of studies demonstrating the feasibility of putting portable ultrasound in the hands of internists.
In one study, hospitalized patients indicated for echocardiography received an echocardiogram, while all others were examined with ultrasound. “We found a significant number of cardio pathologies,” Dr. Spencer says. The findings, he says, were independent of specific medical complaints, such as endocrinology or orthopedic problems.2 “If you were sick enough to get in the hospital, there was a chance that you had a significant cardiac problem that needed to be addressed,” he says.
The study that most excites Dr. Spencer was presented at the 2007 IEEE International Ultrasonics Symposium in October.2 It looked at using ultrasound before releasing a cardiac patient. “One of the biggest problems, one of the most common diagnoses is congestive heart failure,” he says, with a six-month readmission rate of 30% to 40%. Giving ultrasound devices to internists allowed them to look at the amount of fluid around the heart of each cardiac patient.
“The patients who got readmitted all had more fluid detected by ultrasound,” Dr. Spencer says. “So we can do that and say, ‘Hey, you need to stay in the hospital two more days. But if that prevents you from coming back in six months, then that’s a good thing.’”
In patients diagnosed with congestive heart failure, he and his collaborators found, the mean fluid volume was higher for those who were later readmitted. Dr. Spencer plans to pick a reasonable cut-off value and prospectively test whether delaying the release of patients whose fluid levels exceed that value can cut readmission rates.
Most of the battery-operated units used by the medical center weigh between 6 to 10 pounds and cost between $12,000 and $20,000, he says. The devices, about twice the thickness of an iBook, can easily be carried on a shoulder strap. Echocardiogram machines, by contrast, weigh about 300 pounds, must be plugged in and retail for about $250,000.
Concerns, Obstacles
Dr. Spencer cautioned that ultrasound shouldn’t replace echocardiograms or other tools. “So no one is proposing that this would replace a full exam,” he says. “What we’re hoping is that this would detect things that have gone missing or would help ask very specific questions at the bedside.” His studies suggest the approach works well as long as the questions are simple: “Is there fluid or not? Is the heart good or bad?’ But not: ‘Is there an infection?’”
Beyond cardiology and the emergency room, Dr. Spencer says ultrasound has obvious imaging uses in the ICU. The dichotomy, he says, is that imaging intensive care patients can be especially difficult due to their edema, wounds, and lack of mobility. “That area has not blossomed as well as it could have,” he says.
Even so, the burgeoning number of applications for ultrasound “really has huge potential for good,” says Harvey Nisenbaum, MD, an associate professor of radiology at the University of Pennsylvania School of Medicine and president-elect of the American Institute of Ultrasound in Medicine (AIUM). “But the problem is that it’s an art form in the sense that it’s not automated.” No two ultrasound images will be identical, for example, because each depends upon the probe’s precise location. The key, Dr. Nisenbaum says, is proper training under agreed-upon guidelines, followed by continuing education and the maintenance of a hospitalist’s competency.
The AIUM, Nisenbaum says, is working to develop standard credentialing criteria for a range of ultrasound applications to help unify what has been a patchwork approach. Another limitation, he says, has been the lack of Food and Drug Administration (FDA) approval for ultrasound contrast agents Optison and Definity for noncardiac applications. Several deaths have been linked to the use of the intravenous agents in the sickest patients.
The institute is working with the FDA on trying to get the reagents approved for broader use, as they are in other countries. Nisenbaum cautioned the process likely will take a while. Once approved, getting a reimbursement code established for insurance purposes could take even longer.
A further obstacle, according to Dr. Spencer, is the lack of resolution surrounding medical legal issues. “Are we going to agree that this is like a physical examination?” he asks. “It’s unclear whether the medical legal community is going to accept that with ultrasound,” he says.
For cardiology applications, at least, he wonders if the push for reimbursement is such a good thing. “General internists are under incredible pressure [for billing],” he says. “They’re in a really tough spot, and so there would be enormous pressure to get reimbursed for every ultrasound.” As it is, he says, Medicare is targeting echocardiogram as an overutilized reimbursement item. “I hope the reason we’re using this is because we’re examining the patients anyway and this would allow us to find things that we might have missed,” he says. “It’s a better way of examining people, not a new technique for generating revenues. I think that would be a disaster.”

Jeffrey Wiese, MD, SHM board member and associate dean of graduate medical education at Tulane University School of Medicine’s Section of General Internal Medicine and Geriatrics in New Orleans, began putting ultrasound in the hands of his hospitalists and residents in 2007. It’s the “100% right thing to do,” he advises hospitalist groups. “It can be a meaningful way of improving safety. I hope that everyody would move that way.”
Dr. Wiese says residents began using ultrasound more and more for extra visualization during procedures.
“The reason we got into this was straightaway safety, independent of [Centers for Medicare and Medicaid Services] codes and billing—particularly regarding thoracentesis and internal lines,’’ he says. His hospitalists use SonaSite’s MicroMaxx system, “which was a key piece in the way of being able to bill. For all CMT just like endoscopy and bronchoscopy, you have to provide images of the procedure to prove you did it. With the MicroMaxx machine, it allows you to insert a USB and pull down images, take them to a print machine, print them out, and put them in a chart.”
Dr. Wiese touts the sheer amount of what hospitalists can use ultrasound for. “You can do echoes and abdominal ultrasound—not at the level of the radiology room or the cardiology lab, but you can get a quick look,” he says.
Should other hospitalist programs go in the same direction? “From a quality perspective there’s no question you go down that road,” Dr. Wiese asserts. “You do the math: How much does one pneumothorax cost? That’s especially true if [a] pneuothorax finds its way to CMS. One pneuomothorax that you prevent probably pays for your [$20,000-$30,000] machine. That’s even before you get into issues of billing for the use of it, which I think is a secondary way of funding the purchase.”
Forging Ahead
In the meantime, researchers are focusing on ever-diverse applications and smaller units.
At the Mayo Clinic in Jacksonville, Fla., director of regional anesthesia Steven Clendenen, MD, has pioneered the use of ultrasound for guiding nerve blocks.3 The imaging has “totally revolutionized” how the hospital manages pain, he says. As yet, the device still is cart-based, though he expects its size to shrink considerably. “You remember the first calculators, how big they were, and now look at them,” he says.
Beyond working toward miniaturized ultrasound units, Duke’s Smith has been developing real-time three-dimensional angiograms of blood vessels in the brain, a potential boon for stroke diagnoses.4 Another project may bring hospital-based ultrasound full circle: a device that produces a 3-D stereo-image, “like in the IMAX theater,” he says.5 Smith and his colleagues have modified a commercial scanner, “so the target comes out of the screen at you.” Among the many potential uses, expectant parents could see a 3-D stereo view of the developing fetus—something not even the iPhone can offer. TH
Bryn Nelson is a science journalist based in New York.
References
- Hind, D, Calvert, N, McWilliams, R, Davidson, A, Paisley, S, Beverley, C, Thomas, S. Ultrasonic locating devices for central venous cannulation: meta-analysis. Br Med J. 2003;327(7411):361.
- Fedson, S, Neithardt, G, Thomas, P, et al. Unsuspected clinically important findings detected with a small portable ultrasound device in patients admitted to a general medicine service. J Am Soc Echocardiogr. 2003;16(9):901-905.
- Feinglass NG, Clendenen SR, Torp KD, Wang RD, Castello R, Greengrass RA. Real-time three-dimensional ultrasound for continuous popliteal blockade: a case report and image description. Anesth Analg. 2007;105(1):272-274.
- Smith SW, Chu K, Idriss SF, Ivancevich NM, Light ED, Wolf PD. Feasibility Study: Real time 3D ultrasound imaging of the brain. Ultras Med Biol. 2004;30:1365-1371.
- Noble JR, Fronheiser MP, Smith SW. Real-time Stereo 3D Ultrasound. Ultrason Imaging. 2006;28:245-254.
The iPhone may be the latest “it” gadget, but a flurry of recent innovation has given portable ultrasound devices a healthy buzz within the biomedical community.
Beyond the gee-whiz factor, though, a growing number of studies demonstrate the everyday value of putting portable units in the hands of hospitalists.
“The big news has been the tiny portable scanner,” says Stephen Smith, a biomedical engineer at Duke University, in North Carolina, and a pioneer in ultrasound technology. Siemens recently introduced a hand-held device called the Acuson P10, which weighs 1.6 pounds, retails for $9,499 and can fit within a hospitalist’s coat pocket. Not to be outdone, GE has announced plans to introduce an ultrasound unit no bigger than an iPod.
Smith and his collaborators have taken the technology one step farther. They incorporate electrocardial leads on the unit’s transducer face to permit electrocardiograms and a microphone to let hospitalists use the ultrasound like a stethoscope.
Eric Isaacs, MD, a clinical professor of medicine at San Francisco General Hospital, says he routinely uses ultrasound for vascular access “to ensure the safety of procedures that we previously performed either blind or by anatomical landmarks.” Beyond improving the accuracy of placing central and peripheral lines, he says, “the reason we are using ultrasound more now is that the machine is so portable. The radiologists are no longer in the hospital 24 hours a day, and so by necessity we are using the tools that were previously only accessible from 9 to 5.”
Range of Uses
Among the reports recognizing ultrasound’s value, he cited a 2003 study in the British Medical Journal affirming the technology’s superiority to relying on physical landmarks in gaining central venous access, resulting in a lower technical failure rate, reduced complications, and faster access.1 Dr. Issacs says ultrasound also has helped guide procedures such as thorancentesis and paracentesis, other applications once confined to radiology. “It’s something that’s allowing me to do at the bedside what I would otherwise have to wait several hours for,” he says.
For heart patients, he says, a hospitalist can bring ultrasound to the bedside during a cardiac arrest to inspect cardiac motion and fluid, and monitor the patient’s hydration status by examining the size of the inferior vena cava. Internists likewise could examine the size of a patient’s aorta to look for signs of an aneurism, especially for a patient experiencing abdominal pain in the middle of the night. “Quite frankly, it seems like the only limit to ultrasound use is imagination,” Dr. Isaacs says.
Robert Rodriguez, MD, a clinical professor of medicine and emergency medicine at San Francisco General Hospital, says he uses ultrasound on 25% of the patients he sees on an in-patient basis. His biggest use, he says, is for placing central lines—though that could soon change.
“I work with a population that has a very high percentage of injection drug abuse, in whom it’s very difficult to find even a peripheral vein,” he says. At least once a day, he uses ultrasound to locate the brachial vein for such peripheral lines, circumventing the need for a central line through the subclavian vein and the risk of a pneumothorax. “In the past, we would have to put in a central line for just about anything,” he says. “And now we can put in a peripheral line that saves them the risk.”
Another benefit, he says, is in breeding better patient interactions—for example, with gallstones. “You can say to the patient: ‘This is the gallbladder, these are the stones in the gallbladder, this is what’s causing the pain,’” he says. “I think patients appreciate being able to see that firsthand. I think they also appreciate that it’s going to lessen their likelihood of having a complication.”
At the University of Chicago Medical Center, cardiologist Kirk Spencer, MD, says ultrasound procedures still are performed mainly by sonographers and cardiologists. He hopes to change that with a slew of studies demonstrating the feasibility of putting portable ultrasound in the hands of internists.
In one study, hospitalized patients indicated for echocardiography received an echocardiogram, while all others were examined with ultrasound. “We found a significant number of cardio pathologies,” Dr. Spencer says. The findings, he says, were independent of specific medical complaints, such as endocrinology or orthopedic problems.2 “If you were sick enough to get in the hospital, there was a chance that you had a significant cardiac problem that needed to be addressed,” he says.
The study that most excites Dr. Spencer was presented at the 2007 IEEE International Ultrasonics Symposium in October.2 It looked at using ultrasound before releasing a cardiac patient. “One of the biggest problems, one of the most common diagnoses is congestive heart failure,” he says, with a six-month readmission rate of 30% to 40%. Giving ultrasound devices to internists allowed them to look at the amount of fluid around the heart of each cardiac patient.
“The patients who got readmitted all had more fluid detected by ultrasound,” Dr. Spencer says. “So we can do that and say, ‘Hey, you need to stay in the hospital two more days. But if that prevents you from coming back in six months, then that’s a good thing.’”
In patients diagnosed with congestive heart failure, he and his collaborators found, the mean fluid volume was higher for those who were later readmitted. Dr. Spencer plans to pick a reasonable cut-off value and prospectively test whether delaying the release of patients whose fluid levels exceed that value can cut readmission rates.
Most of the battery-operated units used by the medical center weigh between 6 to 10 pounds and cost between $12,000 and $20,000, he says. The devices, about twice the thickness of an iBook, can easily be carried on a shoulder strap. Echocardiogram machines, by contrast, weigh about 300 pounds, must be plugged in and retail for about $250,000.
Concerns, Obstacles
Dr. Spencer cautioned that ultrasound shouldn’t replace echocardiograms or other tools. “So no one is proposing that this would replace a full exam,” he says. “What we’re hoping is that this would detect things that have gone missing or would help ask very specific questions at the bedside.” His studies suggest the approach works well as long as the questions are simple: “Is there fluid or not? Is the heart good or bad?’ But not: ‘Is there an infection?’”
Beyond cardiology and the emergency room, Dr. Spencer says ultrasound has obvious imaging uses in the ICU. The dichotomy, he says, is that imaging intensive care patients can be especially difficult due to their edema, wounds, and lack of mobility. “That area has not blossomed as well as it could have,” he says.
Even so, the burgeoning number of applications for ultrasound “really has huge potential for good,” says Harvey Nisenbaum, MD, an associate professor of radiology at the University of Pennsylvania School of Medicine and president-elect of the American Institute of Ultrasound in Medicine (AIUM). “But the problem is that it’s an art form in the sense that it’s not automated.” No two ultrasound images will be identical, for example, because each depends upon the probe’s precise location. The key, Dr. Nisenbaum says, is proper training under agreed-upon guidelines, followed by continuing education and the maintenance of a hospitalist’s competency.
The AIUM, Nisenbaum says, is working to develop standard credentialing criteria for a range of ultrasound applications to help unify what has been a patchwork approach. Another limitation, he says, has been the lack of Food and Drug Administration (FDA) approval for ultrasound contrast agents Optison and Definity for noncardiac applications. Several deaths have been linked to the use of the intravenous agents in the sickest patients.
The institute is working with the FDA on trying to get the reagents approved for broader use, as they are in other countries. Nisenbaum cautioned the process likely will take a while. Once approved, getting a reimbursement code established for insurance purposes could take even longer.
A further obstacle, according to Dr. Spencer, is the lack of resolution surrounding medical legal issues. “Are we going to agree that this is like a physical examination?” he asks. “It’s unclear whether the medical legal community is going to accept that with ultrasound,” he says.
For cardiology applications, at least, he wonders if the push for reimbursement is such a good thing. “General internists are under incredible pressure [for billing],” he says. “They’re in a really tough spot, and so there would be enormous pressure to get reimbursed for every ultrasound.” As it is, he says, Medicare is targeting echocardiogram as an overutilized reimbursement item. “I hope the reason we’re using this is because we’re examining the patients anyway and this would allow us to find things that we might have missed,” he says. “It’s a better way of examining people, not a new technique for generating revenues. I think that would be a disaster.”
Jeffrey Wiese, MD, SHM board member and associate dean of graduate medical education at Tulane University School of Medicine’s Section of General Internal Medicine and Geriatrics in New Orleans, began putting ultrasound in the hands of his hospitalists and residents in 2007. It’s the “100% right thing to do,” he advises hospitalist groups. “It can be a meaningful way of improving safety. I hope that everyody would move that way.”
Dr. Wiese says residents began using ultrasound more and more for extra visualization during procedures.
“The reason we got into this was straightaway safety, independent of [Centers for Medicare and Medicaid Services] codes and billing—particularly regarding thoracentesis and internal lines,’’ he says. His hospitalists use SonaSite’s MicroMaxx system, “which was a key piece in the way of being able to bill. For all CMT just like endoscopy and bronchoscopy, you have to provide images of the procedure to prove you did it. With the MicroMaxx machine, it allows you to insert a USB and pull down images, take them to a print machine, print them out, and put them in a chart.”
Dr. Wiese touts the sheer amount of what hospitalists can use ultrasound for. “You can do echoes and abdominal ultrasound—not at the level of the radiology room or the cardiology lab, but you can get a quick look,” he says.
Should other hospitalist programs go in the same direction? “From a quality perspective there’s no question you go down that road,” Dr. Wiese asserts. “You do the math: How much does one pneumothorax cost? That’s especially true if [a] pneuothorax finds its way to CMS. One pneuomothorax that you prevent probably pays for your [$20,000-$30,000] machine. That’s even before you get into issues of billing for the use of it, which I think is a secondary way of funding the purchase.”
Forging Ahead
In the meantime, researchers are focusing on ever-diverse applications and smaller units.
At the Mayo Clinic in Jacksonville, Fla., director of regional anesthesia Steven Clendenen, MD, has pioneered the use of ultrasound for guiding nerve blocks.3 The imaging has “totally revolutionized” how the hospital manages pain, he says. As yet, the device still is cart-based, though he expects its size to shrink considerably. “You remember the first calculators, how big they were, and now look at them,” he says.
Beyond working toward miniaturized ultrasound units, Duke’s Smith has been developing real-time three-dimensional angiograms of blood vessels in the brain, a potential boon for stroke diagnoses.4 Another project may bring hospital-based ultrasound full circle: a device that produces a 3-D stereo-image, “like in the IMAX theater,” he says.5 Smith and his colleagues have modified a commercial scanner, “so the target comes out of the screen at you.” Among the many potential uses, expectant parents could see a 3-D stereo view of the developing fetus—something not even the iPhone can offer. TH
Bryn Nelson is a science journalist based in New York.
References
- Hind, D, Calvert, N, McWilliams, R, Davidson, A, Paisley, S, Beverley, C, Thomas, S. Ultrasonic locating devices for central venous cannulation: meta-analysis. Br Med J. 2003;327(7411):361.
- Fedson, S, Neithardt, G, Thomas, P, et al. Unsuspected clinically important findings detected with a small portable ultrasound device in patients admitted to a general medicine service. J Am Soc Echocardiogr. 2003;16(9):901-905.
- Feinglass NG, Clendenen SR, Torp KD, Wang RD, Castello R, Greengrass RA. Real-time three-dimensional ultrasound for continuous popliteal blockade: a case report and image description. Anesth Analg. 2007;105(1):272-274.
- Smith SW, Chu K, Idriss SF, Ivancevich NM, Light ED, Wolf PD. Feasibility Study: Real time 3D ultrasound imaging of the brain. Ultras Med Biol. 2004;30:1365-1371.
- Noble JR, Fronheiser MP, Smith SW. Real-time Stereo 3D Ultrasound. Ultrason Imaging. 2006;28:245-254.
Know the Score
With hospitals facing increasing pressure to improve safety based on measurements, hospitalists need to build a key role in improving quality by developing safety scorecards, say leading hospital medicine experts.
A framework for designing scorecards was recently suggested by researchers at Johns Hopkins University in Baltimore in an article published by the Journal of the American Medical Association.1 The commentary suggests a framework to help healthcare organizations develop safety scorecards, evaluate their validity, and understand measures appropriate to present as rates.
Their framework is intended to build scorecards that monitor progress in improving patient safety over time or relative to a benchmark. The authors urged organizations to think of safety on a continuum and look for improvements, rather than regard practices as either safe or unsafe. They also stated that their term “safety scorecard” acknowledges an overlap between quality and safety.
To build their framework, the researchers adapted elements of the “Users’ Guide to the Medical Literature: A Manual for Evidence-Based Clinical Practice,” to address three key questions:
- Is the measure important?
- Is the measure valid? and
- Can the measure be used to improve safety in healthcare organizations?
The resulting worksheet to evaluate a scorecard guides hospitals through questions aimed at determining whether their institution meets the three criteria.
Initial Reaction
“This worksheet would be very important to follow, a good step forward in efforts to improve quality because its questions make clear where a group might be falling down in developing a scorecard,” says hospitalist Brian Bossard, MD, director of Inpatient Physician Associates at BryanLGH Medical Center in Lincoln, Neb. Dr. Bossard, who is also the medical staff quality designee, says he believes large national hospitalist groups should be involved in planning scorecards as part of a multidisciplinary team.
Other experts also tout hospitalists’ importance in the vanguard of creating these vital instruments.
“Hospitalists should be on or chairing safety committees, and there should be investments in training them in these areas,” says Eric Kupersmith, MD, division head of hospital medicine and assistant professor of medicine for the Cooper Health System, University of Medicine and Dentistry of New Jersey Robert Wood Johnson Medical School in Newark. “Because we are frontline physicians experiencing what is happening with patients and orchestrating as well as delivering care, we should provide feedback.”
Dr. Kupersmith, who is on his facility’s patient safety committee and has participated in a root-cause analysis of hand-offs as well as worked on medical reconciliation and pneumonia core measure performance improvement, says SHM “should help take the lead in bringing together specialists, administrators, and nurses with hospitalists who should have a major impact in designing a scorecard as a society.”
As hospitalists mature as clinicians, they become system- and process-oriented, says Dr. Kupersmith. As a result, “We should be part of re-engineering efforts because of our experience bringing people together,” he says. “We’re in a good position to analyze the process.”
Use with Care
There is also value in hospitalists’ anecdotal experiences, Dr. Kupersmith says, but “there needs to be a filter between anecdotes and a facility’s leadership to ensure that the information provided is broadly important. Decisions shouldn’t be made on anecdotes, but creative ideas can come from them.”
Randy Ferrance, DC, MD, and chief of the medical staff at Riverside Tappahannock Hospital in Tappahan-nock, Va., regards anecdotal information in much the same light. “It should be seen as guidelines, not rules,” he cautions. “There is still an art to medicine even though it is clearly science. Sometimes the best available evidence may be anecdotal. It’s not hard data, but it can be valuable.”
Dr. Ferrance at one time chaired his hospital’s quality improvement committee; the panel now reports to him. He believes hospitalists are fortunate that “we became a specialty after evidence-based medicine really came to the forefront. We are fortunate to have the backing of much hard data.”
Still, he acknowledges the difficulty of establishing proof that an action affects patient outcome. “It’s hard, but what we can do is look at what might help result in things like decreased morbidity, length of stays and complications, and a faster return to a patient’s normal functions. Then we might see influence on patient outcomes.”
Beyond Core Measures
Richard Rohr, MD, vice president for medical affairs at Cortland Regional Medical Center in New York, works extensively on quality improvements. He urges hospitalists and institutions to go beyond required measures.
“A lot of what we’re doing now is imposed by government, insurers or the Joint Commission,” says Dr. Rohr. “In day-to-day work, we should look for areas to go beyond what is required.”
He believes hospitalists should look at specific issues underlying the Johns Hopkins framework’s three core questions.
For example, within the first core question “Is the measure important?” he suggests hospitalists consider what their facility’s priorities are. “There are thousands of things that could address safety,” he says. “Hospitalists should look at how a measure fits in to their organization’s priorities. At an institution known for cardiac care, look at safety measures in cardiology.”
He also suggests looking at a facility’s potential problem areas to help determine if a measure is important. “I worked at a facility that had a rule that Coumadin had to be ordered one day at a time,” says Dr. Rohr. “Since patient use of the medication was closely monitored, there were very few patients with serious bleeding.”
The point, he says, is that hospitalists should “make sure the safety process they’re interested in truly addresses a true problem and is not already in place. Try to add something of value.”
Hospitalists are in a good position to do this, he says, because of their day-to-day perspective on patients. “Hospitalists should start by looking at what their organization has addressed and what’s causing patient problems day to day and then set priorities,” he advises.
Institutional Support
—Richard Rohr, MD, vice president for medical affairs at Cortland Regional Medical Center, Cortland, N.Y.
Of critical importance also, Dr. Rohr says, is to see what their organization can support before deciding what safety measure to explore.
“Is it feasible to collect data to use this measure?” he asks. “That’s partly dependent on where your facility is in using electronic medical records. Does the benefit of researching and implementing outweigh the cost? You may have to spend some staff time to decide what is worthwhile.”
The last task may be easier for hospitalists working at more academic hospitals, he says, which is also an important part of trying to answer the Johns Hopkins framework’s second question: “Is the measure valid?”
It’s often hard to answer that one, Dr. Rohr acknowledges. “Research has at times shown that a process may show statistically significant improvement, but it does not show up clinically,” he says. “Aspirin and beta-blockers for heart patients, for example, has a statistically significant difference—but it is small.”
Most hospitalists try to see patients and do this kind of work on the side, he concedes: “They should do some research, but value what they see when treating patients. You have a good sense of what has helped patients.”

Julia Wright, MD, associate professor of medicine at the University of Wisconsin School of Medicine and Public Health and medical director for hospital medicine at the University of Wisconsin Hospital in Madison, agrees.
“The expertise of our specialty is that we deliver care that is not just clinical, asking, ‘Did I meet the guidelines?’’’ she says. “We’re with patients. We should help determine how quality and safety models are addressing how care is delivered.”
She also believes hospitalists should work closely with hospital administrators on these issues. “Hospitalists have an intrinsic sense of value in delivering care,” she notes. “We are unique in that we can combine consideration of hospital goals with knowledge of care at patient levels. This provides great value to the institutions.”
Culture of Safety
While he agrees with the importance of involving hospitalists deeply in safety efforts, Dr. Kupersmith believes institutions should strive to create a culture that focuses on safety and looks at all its processes in that light.
“You shouldn’t just track hard outcomes,” he suggests. “Track the outcomes of your processes. This gives an overall sense of safety awareness in all personnel. If you focus on the process and culture, you might find a significant change in outcomes.” This also helps address the difficulty of finding data on outcomes, he says.
He agrees with the researchers’ view that safety is on a continuum, and he thinks acknowledging that can help establish an institutional culture around safety. “There is always going to be patient danger,” he says. “You want to get to a point where it is minimized because of an awareness of actions. That focus on safety will lead to less danger.”
As a result, he believes quality improvement strategies must address culture. “You need to provide education for all on safety and provide oversight and monitoring with expectations that can be tracked,” he says. “You need to create this mandate and speak in the quality language from the top. Then you start to have people bring in information that affects outcomes.” TH
Karla Feuer is a journalist based in New York.
Reference
- Pronovost PJ, Berenholtz SM, Needham DM. A framework for health care organizations to develop and evaluate a safety scorecard. JAMA. 2007;298(17):2063-2065.
With hospitals facing increasing pressure to improve safety based on measurements, hospitalists need to build a key role in improving quality by developing safety scorecards, say leading hospital medicine experts.
A framework for designing scorecards was recently suggested by researchers at Johns Hopkins University in Baltimore in an article published by the Journal of the American Medical Association.1 The commentary suggests a framework to help healthcare organizations develop safety scorecards, evaluate their validity, and understand measures appropriate to present as rates.
Their framework is intended to build scorecards that monitor progress in improving patient safety over time or relative to a benchmark. The authors urged organizations to think of safety on a continuum and look for improvements, rather than regard practices as either safe or unsafe. They also stated that their term “safety scorecard” acknowledges an overlap between quality and safety.
To build their framework, the researchers adapted elements of the “Users’ Guide to the Medical Literature: A Manual for Evidence-Based Clinical Practice,” to address three key questions:
- Is the measure important?
- Is the measure valid? and
- Can the measure be used to improve safety in healthcare organizations?
The resulting worksheet to evaluate a scorecard guides hospitals through questions aimed at determining whether their institution meets the three criteria.
Initial Reaction
“This worksheet would be very important to follow, a good step forward in efforts to improve quality because its questions make clear where a group might be falling down in developing a scorecard,” says hospitalist Brian Bossard, MD, director of Inpatient Physician Associates at BryanLGH Medical Center in Lincoln, Neb. Dr. Bossard, who is also the medical staff quality designee, says he believes large national hospitalist groups should be involved in planning scorecards as part of a multidisciplinary team.
Other experts also tout hospitalists’ importance in the vanguard of creating these vital instruments.
“Hospitalists should be on or chairing safety committees, and there should be investments in training them in these areas,” says Eric Kupersmith, MD, division head of hospital medicine and assistant professor of medicine for the Cooper Health System, University of Medicine and Dentistry of New Jersey Robert Wood Johnson Medical School in Newark. “Because we are frontline physicians experiencing what is happening with patients and orchestrating as well as delivering care, we should provide feedback.”
Dr. Kupersmith, who is on his facility’s patient safety committee and has participated in a root-cause analysis of hand-offs as well as worked on medical reconciliation and pneumonia core measure performance improvement, says SHM “should help take the lead in bringing together specialists, administrators, and nurses with hospitalists who should have a major impact in designing a scorecard as a society.”
As hospitalists mature as clinicians, they become system- and process-oriented, says Dr. Kupersmith. As a result, “We should be part of re-engineering efforts because of our experience bringing people together,” he says. “We’re in a good position to analyze the process.”
Use with Care
There is also value in hospitalists’ anecdotal experiences, Dr. Kupersmith says, but “there needs to be a filter between anecdotes and a facility’s leadership to ensure that the information provided is broadly important. Decisions shouldn’t be made on anecdotes, but creative ideas can come from them.”
Randy Ferrance, DC, MD, and chief of the medical staff at Riverside Tappahannock Hospital in Tappahan-nock, Va., regards anecdotal information in much the same light. “It should be seen as guidelines, not rules,” he cautions. “There is still an art to medicine even though it is clearly science. Sometimes the best available evidence may be anecdotal. It’s not hard data, but it can be valuable.”
Dr. Ferrance at one time chaired his hospital’s quality improvement committee; the panel now reports to him. He believes hospitalists are fortunate that “we became a specialty after evidence-based medicine really came to the forefront. We are fortunate to have the backing of much hard data.”
Still, he acknowledges the difficulty of establishing proof that an action affects patient outcome. “It’s hard, but what we can do is look at what might help result in things like decreased morbidity, length of stays and complications, and a faster return to a patient’s normal functions. Then we might see influence on patient outcomes.”
Beyond Core Measures
Richard Rohr, MD, vice president for medical affairs at Cortland Regional Medical Center in New York, works extensively on quality improvements. He urges hospitalists and institutions to go beyond required measures.
“A lot of what we’re doing now is imposed by government, insurers or the Joint Commission,” says Dr. Rohr. “In day-to-day work, we should look for areas to go beyond what is required.”
He believes hospitalists should look at specific issues underlying the Johns Hopkins framework’s three core questions.
For example, within the first core question “Is the measure important?” he suggests hospitalists consider what their facility’s priorities are. “There are thousands of things that could address safety,” he says. “Hospitalists should look at how a measure fits in to their organization’s priorities. At an institution known for cardiac care, look at safety measures in cardiology.”
He also suggests looking at a facility’s potential problem areas to help determine if a measure is important. “I worked at a facility that had a rule that Coumadin had to be ordered one day at a time,” says Dr. Rohr. “Since patient use of the medication was closely monitored, there were very few patients with serious bleeding.”
The point, he says, is that hospitalists should “make sure the safety process they’re interested in truly addresses a true problem and is not already in place. Try to add something of value.”
Hospitalists are in a good position to do this, he says, because of their day-to-day perspective on patients. “Hospitalists should start by looking at what their organization has addressed and what’s causing patient problems day to day and then set priorities,” he advises.
Institutional Support
—Richard Rohr, MD, vice president for medical affairs at Cortland Regional Medical Center, Cortland, N.Y.
Of critical importance also, Dr. Rohr says, is to see what their organization can support before deciding what safety measure to explore.
“Is it feasible to collect data to use this measure?” he asks. “That’s partly dependent on where your facility is in using electronic medical records. Does the benefit of researching and implementing outweigh the cost? You may have to spend some staff time to decide what is worthwhile.”
The last task may be easier for hospitalists working at more academic hospitals, he says, which is also an important part of trying to answer the Johns Hopkins framework’s second question: “Is the measure valid?”
It’s often hard to answer that one, Dr. Rohr acknowledges. “Research has at times shown that a process may show statistically significant improvement, but it does not show up clinically,” he says. “Aspirin and beta-blockers for heart patients, for example, has a statistically significant difference—but it is small.”
Most hospitalists try to see patients and do this kind of work on the side, he concedes: “They should do some research, but value what they see when treating patients. You have a good sense of what has helped patients.”
Julia Wright, MD, associate professor of medicine at the University of Wisconsin School of Medicine and Public Health and medical director for hospital medicine at the University of Wisconsin Hospital in Madison, agrees.
“The expertise of our specialty is that we deliver care that is not just clinical, asking, ‘Did I meet the guidelines?’’’ she says. “We’re with patients. We should help determine how quality and safety models are addressing how care is delivered.”
She also believes hospitalists should work closely with hospital administrators on these issues. “Hospitalists have an intrinsic sense of value in delivering care,” she notes. “We are unique in that we can combine consideration of hospital goals with knowledge of care at patient levels. This provides great value to the institutions.”
Culture of Safety
While he agrees with the importance of involving hospitalists deeply in safety efforts, Dr. Kupersmith believes institutions should strive to create a culture that focuses on safety and looks at all its processes in that light.
“You shouldn’t just track hard outcomes,” he suggests. “Track the outcomes of your processes. This gives an overall sense of safety awareness in all personnel. If you focus on the process and culture, you might find a significant change in outcomes.” This also helps address the difficulty of finding data on outcomes, he says.
He agrees with the researchers’ view that safety is on a continuum, and he thinks acknowledging that can help establish an institutional culture around safety. “There is always going to be patient danger,” he says. “You want to get to a point where it is minimized because of an awareness of actions. That focus on safety will lead to less danger.”
As a result, he believes quality improvement strategies must address culture. “You need to provide education for all on safety and provide oversight and monitoring with expectations that can be tracked,” he says. “You need to create this mandate and speak in the quality language from the top. Then you start to have people bring in information that affects outcomes.” TH
Karla Feuer is a journalist based in New York.
Reference
- Pronovost PJ, Berenholtz SM, Needham DM. A framework for health care organizations to develop and evaluate a safety scorecard. JAMA. 2007;298(17):2063-2065.
The exercise treadmill test: Estimating cardiovascular prognosis
- Patient B is more likely than patient A to develop coronary artery disease.
- Patient B has a worse cardiovascular prognosis than patient A.
- Patient A’s exercise ECG results are falsely positive, whereas patient B’s results are truly positive.
- On the basis of their blood pressures during exercise, patient A has a higher risk of stroke than patient B.
EXERCISE TESTING FOR DIAGNOSIS AND PROGNOSIS
When we perform a stress test such as the treadmill test, we are asking two questions: does the patient have coronary artery disease (ie, what is the patient’s diagnosis) and is he or she likely to die or suffer a coronary event soon (ie, what is the patient’s prognosis).1,2
A stress test used diagnostically is considered to have a positive result if the patient develops signs and symptoms of ischemia during stress, ie, ST-segment depression and angina.1 The diagnostic accuracy of exercise testing is commonly assessed separately from its prognostic accuracy. Unfortunately, diagnostic accuracy can be assessed only in the minority of patients who subsequently undergo coronary angiography—the gold standard for comparison.
In contrast, the prognostic accuracy of a stress test can be assessed in a much larger group of patients, using clinical outcomes as the comparison standard; only those who undergo early revascularization and those who are lost to follow-up are excluded from this group.
Although the stress-induced markers of ischemia used in diagnosis—ST-segment depression and angina—have prognostic value as well, other variables are more powerful predictors of outcome. In this article I will discuss those other prognostic variables and how to interpret them.
PROGNOSTIC VARIABLES
Variables measured during exercise treadmill testing that predict outcome are actually indicators of general fitness and function of the autonomic nervous system:
- Exercise duration
- Exercise hypotension
- Exercise hypertension
- Chronotropic incompetence
- Heart rate recovery
- Ventricular ectopy.
Exercise duration
In the Bruce protocol used in exercise stress testing, the test begins with the treadmill set to a low speed (1.7 miles per hour) and a 10% incline, and every 3 minutes the speed and angle of incline are increased. Other protocols are similar. The test continues for a maximum of 27 minutes (usually attainable only by well-trained individuals) or until the patient quits or develops signs or symptoms of ischemia or an arrhythmia. Average time for a middle-aged adult is 8 to 10 minutes.
Because the longer the patient goes, the harder he or she must work, exercise duration—the number of minutes the patient can continue in the protocol—is a good measure of his or her functional capacity. Another way to measure functional capacity is to measure oxygen uptake during exercise, which can be converted to metabolic equivalents (METs): 1 MET = 3.5 mL O2/kg/min. However, most laboratories estimate functional capacity from exercise duration in a specific exercise protocol (eg, the Bruce protocol) based on published nomograms.
Remarkably, the longer the patient can keep going on the treadmill, the less likely he or she is to die soon of coronary artery disease—or of any cause. In fact, of the prognostic variables measured during exercise treadmill testing, exercise duration is the strongest.1,2 Its prognostic value has been demonstrated in healthy subjects being screened for coronary artery disease (Figure 1)3–6 and in patients being evaluated for suspected or known coronary artery disease (Figure 2).7–10 The independent prognostic value of exercise duration has been demonstrated in men,3,4,7,8 women,4–7,9 and the elderly.11 Although functional capacity decreases with age and generally is lower in women than men, exercise duration retains its prognostic value after adjusting for age and sex.
Exercise duration is such a good prognostic indicator that it is included in risk scores for exercise treadmill testing.13,14
Blood pressure during and after exercise
During exercise testing, blood pressure is usually measured by cuff sphygmomanometry. However, motion during exercise and background noise from the treadmill machine can reduce the accuracy of this measurement.
Several studies have compared blood pressures measured by cuff sphygmomanometry vs intra-arterial measurements,15 and most have found that systolic pressures are lower as measured by cuff sphygmomanometry, with smaller differences between methods at higher exercise intensity. The diastolic pressure is significantly lower as measured by cuff sphygmomanometry than by intra-arterial measurements at rest and during exercise; error increases with exercise intensity.
Hypotensive and hypertensive blood pressure responses to exercise have been defined in various ways.
Exercise hypotension is best defined as systolic blood pressure that is lower during exercise than while standing at rest before exercise.16 It reflects a failure of cardiac output to increase during exercise and is associated with severe coronary artery disease (eg, left main coronary artery or three-vessel involvement), left ventricular systolic dysfunction, or both.17,18
Dubach et al,16 in a study of 2,036 patients who underwent exercise treadmill testing to evaluate chronic coronary artery disease, found that exercise hypotension was associated with a threefold higher risk of cardiac events over 2 years.
In a large meta-analysis of exercise testing following myocardial infarction, the only independent predictors of risk were limited exercise workload and exercise hypotension.19
Exercise hypertension is defined as a rise in systolic blood pressure during exercise above a threshold, usually between 190 and 220 mm Hg.20 Some studies suggest that exercise hypertension predicts future arterial hypertension in people with normal resting blood pressure.21,22
Whether exercise hypertension predicts future cardiovascular events has not been extensively investigated. A Mayo Clinic study reported that exercise hypertension was significantly associated (P = .03) with cardiovascular events in people without symptoms or clinically evident cardiovascular disease during a mean follow-up of 7.7 years.23 On the other hand, a study from Cleveland Clinic showed that patients being evaluated for coronary artery disease who had a hypertensive response to exercise had a lower prevalence of severe angiographic coronary disease (P = .004) and a lower risk of death over the next 2 years (P = .03) compared with the rest of the study population.24
An abnormal systolic blood pressure recovery ratio, defined as an increase (rather than the expected decrease) in systolic blood pressure in the early postexercise recovery period has been shown to be a marker of underlying coronary artery disease,25 but has not consistently been associated with an adverse prognosis.26
Chronotropic incompetence
The heart rate normally increases with exercise and decreases as soon as exercise stops. Failure of the heart rate to increase as expected during exercise is termed chronotropic incompetence. Chronotropic incompetence predicts all-cause and cardiovascular death.27–30
Different criteria for defining chronotropic incompetence were used in different studies, based on resting heart rate, exercise protocol, patient age, and medications (especially beta-blockers).
The predicted chronotropic response can be calculated by a suggested formula31: (peak heart rate minus resting heart rate) ÷ (220 minus age minus resting heart rate). The difference between peak heart rate and resting heart rate is known as the heart rate reserve.
Chronotropic incompetence is defined as less than 80% of the predicted value and as less than 62% for patients taking beta-blockers.31,32
Heart rate recovery
Several variables influence heart rate recovery, including activity (eg, complete cessation of exercise or cool-down) and position (supine, sitting, standing). Suggested thresholds for abnormal responses are31:
- Upright: the heart rate should slow down by at least 12 beats/minute at 1 minute
- Supine: at least 18 beats/minute at 1 minute
- Sitting: at least 22 beats/minute at 2 minutes.
Heart rate variability
Heart rate variability, ie, differences in the beat-to-beat interval among successive heart cycles, can be quantified by spectral analysis, although this is not routinely available clinically. Dewey et al37 measured heart rate variability during the first and last 2 minutes of exercise and during the first 2 minutes of recovery in 1,335 subjects (95% men, mean age 58 years). Markers of impaired heart rate variability measured during exercise and in recovery were independent predictors of all-cause and cardiovascular death during a mean follow-up of 5 years.
Ventricular ectopy
Uncommon types of ventricular arrhythmias can occur during exercise testing:
- Sustained ventricular tachycardia or ventricular fibrillation due to coronary artery disease or left ventricular dysfunction occurs rarely but is life-threatening.
- Ventricular tachycardia in healthy young adults without structural heart disease may arise from the right ventricular outflow tract. It is benign.38
- Arrhythmogenic right ventricular dysplasia, a cardiomyopathy involving the right ventricle, can also occur in healthy young adults and has a poor prognosis. It must be distinguished from the benign form.
Short ventricular ectopies: Significance uncertain
Single ventricular premature contractions, couplets, or short episodes of nonsustained ventricular tachycardia occur during or soon after exercise treadmill testing more commonly than the sustained ventricular arrhythmias mentioned above. The prognostic significance of these ectopies is controversial. A recent review found that ventricular ectopy during exercise testing or recovery was associated with an increased death rate in 13 out of 22 studies.39 Fifteen of these studies included patient populations with symptomatic or known coronary artery disease; the other 7 studies were in healthy people without symptoms (eg, being screened for employment).
Jouven et al40 found that among 6,101 asymptomatic male French civil servants without clinically evident cardiovascular disease who underwent exercise testing, 2.3% had frequent premature ventricular contractions (defined as > 10% of all ventricular beats) and 4.4% had ECG changes during exercise that indicated ischemia. Having frequent premature ventricular contractions was associated with a higher risk (RR = 2.67) of cardiovascular death over 23 years of follow-up, independent of ischemia (Figure 4).
Frolkis et al41 evaluated 29,244 patients referred to Cleveland Clinic for exercise treadmill testing and found a low prevalence of frequent ventricular ectopy (3% during exercise, 2% after exercise, and 2% both during and after exercise). The 5-year mortality rate was higher in patients with frequent ventricular ectopy during exercise vs those without (9% vs 5%, P < .001) and was even higher in those with frequent ventricular ectopy in recovery vs those without (11% vs 5%, P < .001). After adjusting for confounding variables, only frequent ventricular ectopy in recovery, but not during exercise, was associated with an increased death rate (adjusted hazard ratio 1.5; 95% CI 1.1–1.9; P = .003).
The associations between exercise-induced ventricular ectopy and ischemia and left ventricular function are unclear.
CASE STUDIES REVISITED
As for the two men described at the beginning of this article, patient B has a worse cardiovascular prognosis than patient A.
Both men have the same pretest probability of coronary artery disease (about 50%), based on identical age, sex, and chest pain characteristics. The ST-segment response during exercise—the traditional marker of ischemia used to diagnose coronary disease—is also the same for each patient.
However, hemodynamic variables are markedly different between the two patients: patient B has several adverse prognostic indicators, including lower functional capacity, a hypotensive blood pressure response, and abnormal heart rate recovery.
The most widely used treadmill risk score, the Duke treadmill score,13 can be calculated as:
Exercise time (in minutes, Bruce protocol) minus 5 times the magnitude of ST-segment depression (in millimeters) minus 4 times the treadmill angina index (ie, 0 = no angina, 1 = nonlimiting angina, 2 = angina that is the reason for terminating exercise).
Applying this formula yields a Duke score of 4.5 (estimated annual cardiovascular mortality risk 0.25%) for patient A and a score of –3.5 (estimated annual cardiovascular mortality risk 2%) for patient B.
Because patient A exercised to a high workload, he is more likely to have a false-positive exercise ECG result than patient B. But whether an exercise ECG test is falsely positive or falsely negative can only be determined after coronary angiography.
Exercise hypotension, as seen in patient B, can indicate left ventricular systolic dysfunction with exercise but has not been shown to predict stroke risk.
MANAGEMENT CONSIDERATIONS
How to manage patients with an abnormal hemodynamic response in the absence of ischemia is uncertain. Given the excellent prognosis of patients with well-preserved exercise capacity, it is unlikely that revascularization procedures in these patients would improve outcome.
On the other hand, patients with an abnormal hemodynamic response due to poor general health or autonomic nervous system dysfunction may be able to achieve a better prognosis with interventions that improve some of the abnormal responses. Increased functional capacity through exercise training is associated with a lower mortality rate,42 and coronary artery bypass surgery can abolish exercise-induced hypotension.43
Strategies to further evaluate and treat patients with an isolated finding of chronotropic incompetence, abnormal heart rate recovery, or frequent exercise-induced ventricular ectopy are not clear and require future study.
- Arena R, Myers J, Williams MA, et al American Heart Association Committee on Exercise, Rehabilitation, and Prevention of the Council on Clinical Cardiology; American Heart Association Council on Cardiovascular Nursing. Assessment of functional capacity in clinical and research settings: a scientific statement from the American Heart Association Committee on Exercise, Rehabilitation, and Prevention of the Council on Clinical Cardiology and the Council on Cardiovascular Nursing. Circulation 2007; 116:329–343.
- Gibbons RJ, Balady GJ, Bricker JT, et al American College of Cardiology/American Heart Association Task Force on Practice Guidelines (Committee to Update the 1997 Exercise Testing Guidelines). ACC/AHA 2002 guideline update for exercise testing: summary article: a report of the American College of Cardiology/American Heart Association Task Force on Practice Guidelines (Committee to Update the 1997 Exercise Testing Guidelines). Circulation 2002; 106:1883–1892.
- Ekelund LG, Haskell WL, Johnson JL, Whaley FS, Criqui MH, Sheps DS. Physical fitness as a predictor of cardiovascular mortality in asymptomatic North American men. The Lipid Research Clinics Mortality Follow-up Study. N Engl J Med 1988; 319:1379–1384.
- Blair SN, Kohl HW, Paffenbarger RS, Clark DG, Cooper KH, Gibbons LW. Physical fitness and all-cause mortality. A prospective study of healthy men and women. JAMA 1989; 262:2395–2401.
- Mora S, Redberg RF, Cui Y, et al. Ability of exercise testing to predict cardiovascular and all-cause death in asymptomatic women: a 20-year follow-up of the Lipid Research Clinics prevalence study. JAMA 2003; 290:1600–1607.
- Gulati M, Pandey DK, Arnsdorf MF, et al. Exercise capacity and the risk of death in women: the St. James Women Take Heart Project. Circulation 2003; 108:1554–1559.
- Roger VL, Jacobsen SJ, Pellikka PA, Miller TD, Bailey KR, Gersh BJ. Prognostic value of treadmill exercise testing: a population-based study in Olmsted County, Minnesota. Circulation 1998; 98:2836–2841.
- Myers J, Prakash M, Froelicher V, Do D, Partington S, Atwood JE. Exercise capacity and mortality among men referred for exercise testing. N Engl J Med 2002; 346:793–801.
- Gulati M, Black HR, Shaw LJ, et al. The prognostic value of a nomogram for exercise capacity in women. N Engl J Med 2005; 353:468–475.
- Snader CE, Marwick TH, Pashkow FJ, Harvey SA, Thomas JD, Lauer MS. Importance of estimated functional capacity as a predictor of all-cause mortality among patients referred for exercise thallium single-photon emission computed tomography: report of 3,400 patients from a single center. J Am Coll Cardiol 1997; 30:641–648.
- Goraya TY, Jacobsen SJ, Pellikka PA, et al. Prognostic value of treadmill exercise testing in elderly persons. Ann Intern Med 2000; 132:862–870.
- Weiner DA, Ryan TJ, McCabe CH, et al. Prognostic importance of a clinical profile and exercise test in medically treated patients with coronary artery disease. J Am Coll Cardiol 1984; 3:772–779.
- Mark DB, Hlatky MA, Harrell FE, Lee KL, Califf RM, Pryor DB. Exercise treadmill score for predicting prognosis in coronary artery disease. Ann Intern Med 1987; 106:793–800.
- Prakash M, Myers J, Froelicher VF, et al. Clinical and exercise test predictors of all-cause mortality: results from > 6,000 consecutive referred male patients. Chest 2001; 120:1003–1013.
- Griffin SE, Robergs RA, Heyward VH. Blood pressure measurement during exercise: a review. Med Sci Sports Exerc 1997; 29:149–159.
- Dubach P, Froelicher VF, Klein J, Oakes D, Grover-McKay M, Friis R. Exercise-induced hypotension in a male population. Criteria, causes, and prognosis. Circulation 1988; 78:1380–1387.
- Hammermeister KE, DeRouen TA, Dodge HT, Zia M. Prognostic and predictive value of exertional hypotension in suspected coronary artery disease. Am J Cardiol 1983; 51:1261–1266.
- Hakki AH, Munley BM, Hadjimiltiades S, Meissner MD, Iskandrian AS. Determinants of abnormal blood pressure response to exercise in coronary artery disease. Am J Cardiol 1986; 57:71–75.
- Froelicher VF, Perdue S, Pewen W, Risch M. Application of meta-analysis using an electronic spread sheet to exercise testing in patients after myocardial infarction. Am J Med 1987; 83:1045–1054.
- Tzemos N, Lim PO, MacDonald TM. Is exercise blood pressure a marker of vascular endothelial function? QJM 2002; 95:423–429.
- Wilson NV, Meyer BM. Early prediction of hypertension using exercise blood pressure. Prev Med 1981; 10:62–68.
- Dlin RA, Hanne N, Silverberg DS, Bar-Or O. Follow-up of normotensive men with exaggerated blood pressure response to exercise. Am Heart J 1983; 106:316–320.
- Allison TG, Cordeiro MA, Miller TD, Daida H, Squires RW, Gau GT. Prognostic significance of exercise-induced systemic hypertension in healthy subjects. Am J Cardiol 1999; 83:371–375.
- Lauer MS, Pashkow FJ, Harvey SA, Marwick TH, Thomas JD. Angiographic and prognostic implications of an exaggerated exercise systolic blood pressure response and rest systolic blood pressure in adults undergoing evaluation for suspected coronary artery disease. J Am Coll Cardiol 1995; 26:1630–1636.
- Amon KW, Richards KL, Crawford MH. Usefulness of the postexercise response of systolic blood pressure in the diagnosis of coronary artery disease. Circulation 1984; 70:951–956.
- Ellis K, Pothier CE, Blackstone EH, Lauer MS. Is systolic blood pressure recovery after exercise a predictor of mortality? Am Heart J 2004; 147:287–292.
- Lauer MS, Okin PM, Larson MG, Evans JC, Levy D. Impaired heart rate response to graded exercise. Prognostic implications of chronotropic incompetence in the Framingham Heart Study. Circulation 1996; 93:1520–1526.
- Lauer MS, Francis GS, Okin PM, Pashkow FJ, Snader CE, Marwick TH. Impaired chronotropic response to exercise stress testing as a predictor of mortality. JAMA 1999; 281:524–529.
- Azarbal B, Hayes SW, Lewin HC, Hachamovitch R, Cohen I, Berman DS. The incremental prognostic value of percentage of heart rate reserve achieved over myocardial perfusion single-photon emission computed tomography in the prediction of cardiac death and all-cause mortality: superiority over 85% of maximal age-predicted heart rate. J Am Coll Cardiol 2004; 44:423–430.
- Myers J, Tan SY, Abella J, Aleti V, Froelicher VF. Comparison of the chronotropic response to exercise and heart rate recovery in predicting cardiovascular mortality. Eur J Cardiovasc Prev Rehab 2007; 14:215–221.
- Kligfield P, Lauer MS. Exercise electrocardiogram testing: beyond the ST segment. Circulation 2006; 114:2070–2082.
- Khan MN, Pothier CE, Lauer MS. Chronotropic incompetence as a predictor of death among patients with normal electrograms taking beta blockers (metoprolol or atenolol). Am J Cardiol 2005; 96:1328–1333.
- Cole CR, Blackstone EH, Pashkow FJ, Snader CE, Lauer MS. Heart-rate recovery immediately after exercise as a predictor of mortality. N Engl J Med 1999; 341:1351–1357.
- Cole CR, Foody JM, Blackstone EH, Lauer MS. Heart rate recovery after submaximal exercise testing as a predictor of mortality in a cardiovascularly healthy cohort. Ann Intern Med 2000; 132:552–555.
- Vivekananthan DP, Blackstone EH, Pothier CE, Lauer MS. Heart rate recovery after exercise is a predictor of mortality, independent of the angiographic severity of coronary disease. J Am Coll Cardiol 2003; 42:831–838.
- Jouven X, Empana JP, Schwartz PJ, Desnos M, Courbon D, Ducimetiere P. Heart-rate profile during exercise as a predictor of sudden death. N Engl J Med 2005; 352:1951–1958.
- Dewey FE, Freeman JV, Engel G, et al. Novel predictor of prognosis from exercise stress testing: heart rate variability response to the exercise treadmill test. Am Heart J 2007; 153:281–288.
- Lerman BB, Stein KM, Markowitz SM, Mittal S, Slotwiner DJ. Right ventricular outflow tract tachycardia: an update. Card Electrophysiol Rev 2002; 6:68–71.
- Beckerman J, Wu T, Jones S, Froelicher VF. Exercise test-induced arrhythmias. Prog Cardiovasc Dis 2005; 47:285–305.
- Jouven X, Zureik M, Desnos M, Courbon D, Ducimetiere P. Long-term outcome in asymptomatic men with exercise-induced premature ventricular depolarizations. N Engl J Med 2000; 343:826–833.
- Frolkis JP, Pothier CE, Blackstone EH, Lauer MS. Frequent ventricular ectopy after exercise as a predictor of death. N Engl J Med 2003; 348:781–790.
- Blair SN, Kohl HW, Barlow CE, Paffenbarger RS, Gibbons LW, Macera CA. Changes in physical fitness and all-cause mortality. A prospective study of healthy and unhealthy men. JAMA 1995; 273:1093–1098.
- Thomson PD, Kelemen MH. Hypotension accompanying the onset of exertional angina. A sign of severe compromise of left ventricular blood supply. Circulation 1975; 52:28–32.
- Patient B is more likely than patient A to develop coronary artery disease.
- Patient B has a worse cardiovascular prognosis than patient A.
- Patient A’s exercise ECG results are falsely positive, whereas patient B’s results are truly positive.
- On the basis of their blood pressures during exercise, patient A has a higher risk of stroke than patient B.
EXERCISE TESTING FOR DIAGNOSIS AND PROGNOSIS
When we perform a stress test such as the treadmill test, we are asking two questions: does the patient have coronary artery disease (ie, what is the patient’s diagnosis) and is he or she likely to die or suffer a coronary event soon (ie, what is the patient’s prognosis).1,2
A stress test used diagnostically is considered to have a positive result if the patient develops signs and symptoms of ischemia during stress, ie, ST-segment depression and angina.1 The diagnostic accuracy of exercise testing is commonly assessed separately from its prognostic accuracy. Unfortunately, diagnostic accuracy can be assessed only in the minority of patients who subsequently undergo coronary angiography—the gold standard for comparison.
In contrast, the prognostic accuracy of a stress test can be assessed in a much larger group of patients, using clinical outcomes as the comparison standard; only those who undergo early revascularization and those who are lost to follow-up are excluded from this group.
Although the stress-induced markers of ischemia used in diagnosis—ST-segment depression and angina—have prognostic value as well, other variables are more powerful predictors of outcome. In this article I will discuss those other prognostic variables and how to interpret them.
PROGNOSTIC VARIABLES
Variables measured during exercise treadmill testing that predict outcome are actually indicators of general fitness and function of the autonomic nervous system:
- Exercise duration
- Exercise hypotension
- Exercise hypertension
- Chronotropic incompetence
- Heart rate recovery
- Ventricular ectopy.
Exercise duration
In the Bruce protocol used in exercise stress testing, the test begins with the treadmill set to a low speed (1.7 miles per hour) and a 10% incline, and every 3 minutes the speed and angle of incline are increased. Other protocols are similar. The test continues for a maximum of 27 minutes (usually attainable only by well-trained individuals) or until the patient quits or develops signs or symptoms of ischemia or an arrhythmia. Average time for a middle-aged adult is 8 to 10 minutes.
Because the longer the patient goes, the harder he or she must work, exercise duration—the number of minutes the patient can continue in the protocol—is a good measure of his or her functional capacity. Another way to measure functional capacity is to measure oxygen uptake during exercise, which can be converted to metabolic equivalents (METs): 1 MET = 3.5 mL O2/kg/min. However, most laboratories estimate functional capacity from exercise duration in a specific exercise protocol (eg, the Bruce protocol) based on published nomograms.
Remarkably, the longer the patient can keep going on the treadmill, the less likely he or she is to die soon of coronary artery disease—or of any cause. In fact, of the prognostic variables measured during exercise treadmill testing, exercise duration is the strongest.1,2 Its prognostic value has been demonstrated in healthy subjects being screened for coronary artery disease (Figure 1)3–6 and in patients being evaluated for suspected or known coronary artery disease (Figure 2).7–10 The independent prognostic value of exercise duration has been demonstrated in men,3,4,7,8 women,4–7,9 and the elderly.11 Although functional capacity decreases with age and generally is lower in women than men, exercise duration retains its prognostic value after adjusting for age and sex.
Exercise duration is such a good prognostic indicator that it is included in risk scores for exercise treadmill testing.13,14
Blood pressure during and after exercise
During exercise testing, blood pressure is usually measured by cuff sphygmomanometry. However, motion during exercise and background noise from the treadmill machine can reduce the accuracy of this measurement.
Several studies have compared blood pressures measured by cuff sphygmomanometry vs intra-arterial measurements,15 and most have found that systolic pressures are lower as measured by cuff sphygmomanometry, with smaller differences between methods at higher exercise intensity. The diastolic pressure is significantly lower as measured by cuff sphygmomanometry than by intra-arterial measurements at rest and during exercise; error increases with exercise intensity.
Hypotensive and hypertensive blood pressure responses to exercise have been defined in various ways.
Exercise hypotension is best defined as systolic blood pressure that is lower during exercise than while standing at rest before exercise.16 It reflects a failure of cardiac output to increase during exercise and is associated with severe coronary artery disease (eg, left main coronary artery or three-vessel involvement), left ventricular systolic dysfunction, or both.17,18
Dubach et al,16 in a study of 2,036 patients who underwent exercise treadmill testing to evaluate chronic coronary artery disease, found that exercise hypotension was associated with a threefold higher risk of cardiac events over 2 years.
In a large meta-analysis of exercise testing following myocardial infarction, the only independent predictors of risk were limited exercise workload and exercise hypotension.19
Exercise hypertension is defined as a rise in systolic blood pressure during exercise above a threshold, usually between 190 and 220 mm Hg.20 Some studies suggest that exercise hypertension predicts future arterial hypertension in people with normal resting blood pressure.21,22
Whether exercise hypertension predicts future cardiovascular events has not been extensively investigated. A Mayo Clinic study reported that exercise hypertension was significantly associated (P = .03) with cardiovascular events in people without symptoms or clinically evident cardiovascular disease during a mean follow-up of 7.7 years.23 On the other hand, a study from Cleveland Clinic showed that patients being evaluated for coronary artery disease who had a hypertensive response to exercise had a lower prevalence of severe angiographic coronary disease (P = .004) and a lower risk of death over the next 2 years (P = .03) compared with the rest of the study population.24
An abnormal systolic blood pressure recovery ratio, defined as an increase (rather than the expected decrease) in systolic blood pressure in the early postexercise recovery period has been shown to be a marker of underlying coronary artery disease,25 but has not consistently been associated with an adverse prognosis.26
Chronotropic incompetence
The heart rate normally increases with exercise and decreases as soon as exercise stops. Failure of the heart rate to increase as expected during exercise is termed chronotropic incompetence. Chronotropic incompetence predicts all-cause and cardiovascular death.27–30
Different criteria for defining chronotropic incompetence were used in different studies, based on resting heart rate, exercise protocol, patient age, and medications (especially beta-blockers).
The predicted chronotropic response can be calculated by a suggested formula31: (peak heart rate minus resting heart rate) ÷ (220 minus age minus resting heart rate). The difference between peak heart rate and resting heart rate is known as the heart rate reserve.
Chronotropic incompetence is defined as less than 80% of the predicted value and as less than 62% for patients taking beta-blockers.31,32
Heart rate recovery
Several variables influence heart rate recovery, including activity (eg, complete cessation of exercise or cool-down) and position (supine, sitting, standing). Suggested thresholds for abnormal responses are31:
- Upright: the heart rate should slow down by at least 12 beats/minute at 1 minute
- Supine: at least 18 beats/minute at 1 minute
- Sitting: at least 22 beats/minute at 2 minutes.
Heart rate variability
Heart rate variability, ie, differences in the beat-to-beat interval among successive heart cycles, can be quantified by spectral analysis, although this is not routinely available clinically. Dewey et al37 measured heart rate variability during the first and last 2 minutes of exercise and during the first 2 minutes of recovery in 1,335 subjects (95% men, mean age 58 years). Markers of impaired heart rate variability measured during exercise and in recovery were independent predictors of all-cause and cardiovascular death during a mean follow-up of 5 years.
Ventricular ectopy
Uncommon types of ventricular arrhythmias can occur during exercise testing:
- Sustained ventricular tachycardia or ventricular fibrillation due to coronary artery disease or left ventricular dysfunction occurs rarely but is life-threatening.
- Ventricular tachycardia in healthy young adults without structural heart disease may arise from the right ventricular outflow tract. It is benign.38
- Arrhythmogenic right ventricular dysplasia, a cardiomyopathy involving the right ventricle, can also occur in healthy young adults and has a poor prognosis. It must be distinguished from the benign form.
Short ventricular ectopies: Significance uncertain
Single ventricular premature contractions, couplets, or short episodes of nonsustained ventricular tachycardia occur during or soon after exercise treadmill testing more commonly than the sustained ventricular arrhythmias mentioned above. The prognostic significance of these ectopies is controversial. A recent review found that ventricular ectopy during exercise testing or recovery was associated with an increased death rate in 13 out of 22 studies.39 Fifteen of these studies included patient populations with symptomatic or known coronary artery disease; the other 7 studies were in healthy people without symptoms (eg, being screened for employment).
Jouven et al40 found that among 6,101 asymptomatic male French civil servants without clinically evident cardiovascular disease who underwent exercise testing, 2.3% had frequent premature ventricular contractions (defined as > 10% of all ventricular beats) and 4.4% had ECG changes during exercise that indicated ischemia. Having frequent premature ventricular contractions was associated with a higher risk (RR = 2.67) of cardiovascular death over 23 years of follow-up, independent of ischemia (Figure 4).
Frolkis et al41 evaluated 29,244 patients referred to Cleveland Clinic for exercise treadmill testing and found a low prevalence of frequent ventricular ectopy (3% during exercise, 2% after exercise, and 2% both during and after exercise). The 5-year mortality rate was higher in patients with frequent ventricular ectopy during exercise vs those without (9% vs 5%, P < .001) and was even higher in those with frequent ventricular ectopy in recovery vs those without (11% vs 5%, P < .001). After adjusting for confounding variables, only frequent ventricular ectopy in recovery, but not during exercise, was associated with an increased death rate (adjusted hazard ratio 1.5; 95% CI 1.1–1.9; P = .003).
The associations between exercise-induced ventricular ectopy and ischemia and left ventricular function are unclear.
CASE STUDIES REVISITED
As for the two men described at the beginning of this article, patient B has a worse cardiovascular prognosis than patient A.
Both men have the same pretest probability of coronary artery disease (about 50%), based on identical age, sex, and chest pain characteristics. The ST-segment response during exercise—the traditional marker of ischemia used to diagnose coronary disease—is also the same for each patient.
However, hemodynamic variables are markedly different between the two patients: patient B has several adverse prognostic indicators, including lower functional capacity, a hypotensive blood pressure response, and abnormal heart rate recovery.
The most widely used treadmill risk score, the Duke treadmill score,13 can be calculated as:
Exercise time (in minutes, Bruce protocol) minus 5 times the magnitude of ST-segment depression (in millimeters) minus 4 times the treadmill angina index (ie, 0 = no angina, 1 = nonlimiting angina, 2 = angina that is the reason for terminating exercise).
Applying this formula yields a Duke score of 4.5 (estimated annual cardiovascular mortality risk 0.25%) for patient A and a score of –3.5 (estimated annual cardiovascular mortality risk 2%) for patient B.
Because patient A exercised to a high workload, he is more likely to have a false-positive exercise ECG result than patient B. But whether an exercise ECG test is falsely positive or falsely negative can only be determined after coronary angiography.
Exercise hypotension, as seen in patient B, can indicate left ventricular systolic dysfunction with exercise but has not been shown to predict stroke risk.
MANAGEMENT CONSIDERATIONS
How to manage patients with an abnormal hemodynamic response in the absence of ischemia is uncertain. Given the excellent prognosis of patients with well-preserved exercise capacity, it is unlikely that revascularization procedures in these patients would improve outcome.
On the other hand, patients with an abnormal hemodynamic response due to poor general health or autonomic nervous system dysfunction may be able to achieve a better prognosis with interventions that improve some of the abnormal responses. Increased functional capacity through exercise training is associated with a lower mortality rate,42 and coronary artery bypass surgery can abolish exercise-induced hypotension.43
Strategies to further evaluate and treat patients with an isolated finding of chronotropic incompetence, abnormal heart rate recovery, or frequent exercise-induced ventricular ectopy are not clear and require future study.
- Arena R, Myers J, Williams MA, et al American Heart Association Committee on Exercise, Rehabilitation, and Prevention of the Council on Clinical Cardiology; American Heart Association Council on Cardiovascular Nursing. Assessment of functional capacity in clinical and research settings: a scientific statement from the American Heart Association Committee on Exercise, Rehabilitation, and Prevention of the Council on Clinical Cardiology and the Council on Cardiovascular Nursing. Circulation 2007; 116:329–343.
- Gibbons RJ, Balady GJ, Bricker JT, et al American College of Cardiology/American Heart Association Task Force on Practice Guidelines (Committee to Update the 1997 Exercise Testing Guidelines). ACC/AHA 2002 guideline update for exercise testing: summary article: a report of the American College of Cardiology/American Heart Association Task Force on Practice Guidelines (Committee to Update the 1997 Exercise Testing Guidelines). Circulation 2002; 106:1883–1892.
- Ekelund LG, Haskell WL, Johnson JL, Whaley FS, Criqui MH, Sheps DS. Physical fitness as a predictor of cardiovascular mortality in asymptomatic North American men. The Lipid Research Clinics Mortality Follow-up Study. N Engl J Med 1988; 319:1379–1384.
- Blair SN, Kohl HW, Paffenbarger RS, Clark DG, Cooper KH, Gibbons LW. Physical fitness and all-cause mortality. A prospective study of healthy men and women. JAMA 1989; 262:2395–2401.
- Mora S, Redberg RF, Cui Y, et al. Ability of exercise testing to predict cardiovascular and all-cause death in asymptomatic women: a 20-year follow-up of the Lipid Research Clinics prevalence study. JAMA 2003; 290:1600–1607.
- Gulati M, Pandey DK, Arnsdorf MF, et al. Exercise capacity and the risk of death in women: the St. James Women Take Heart Project. Circulation 2003; 108:1554–1559.
- Roger VL, Jacobsen SJ, Pellikka PA, Miller TD, Bailey KR, Gersh BJ. Prognostic value of treadmill exercise testing: a population-based study in Olmsted County, Minnesota. Circulation 1998; 98:2836–2841.
- Myers J, Prakash M, Froelicher V, Do D, Partington S, Atwood JE. Exercise capacity and mortality among men referred for exercise testing. N Engl J Med 2002; 346:793–801.
- Gulati M, Black HR, Shaw LJ, et al. The prognostic value of a nomogram for exercise capacity in women. N Engl J Med 2005; 353:468–475.
- Snader CE, Marwick TH, Pashkow FJ, Harvey SA, Thomas JD, Lauer MS. Importance of estimated functional capacity as a predictor of all-cause mortality among patients referred for exercise thallium single-photon emission computed tomography: report of 3,400 patients from a single center. J Am Coll Cardiol 1997; 30:641–648.
- Goraya TY, Jacobsen SJ, Pellikka PA, et al. Prognostic value of treadmill exercise testing in elderly persons. Ann Intern Med 2000; 132:862–870.
- Weiner DA, Ryan TJ, McCabe CH, et al. Prognostic importance of a clinical profile and exercise test in medically treated patients with coronary artery disease. J Am Coll Cardiol 1984; 3:772–779.
- Mark DB, Hlatky MA, Harrell FE, Lee KL, Califf RM, Pryor DB. Exercise treadmill score for predicting prognosis in coronary artery disease. Ann Intern Med 1987; 106:793–800.
- Prakash M, Myers J, Froelicher VF, et al. Clinical and exercise test predictors of all-cause mortality: results from > 6,000 consecutive referred male patients. Chest 2001; 120:1003–1013.
- Griffin SE, Robergs RA, Heyward VH. Blood pressure measurement during exercise: a review. Med Sci Sports Exerc 1997; 29:149–159.
- Dubach P, Froelicher VF, Klein J, Oakes D, Grover-McKay M, Friis R. Exercise-induced hypotension in a male population. Criteria, causes, and prognosis. Circulation 1988; 78:1380–1387.
- Hammermeister KE, DeRouen TA, Dodge HT, Zia M. Prognostic and predictive value of exertional hypotension in suspected coronary artery disease. Am J Cardiol 1983; 51:1261–1266.
- Hakki AH, Munley BM, Hadjimiltiades S, Meissner MD, Iskandrian AS. Determinants of abnormal blood pressure response to exercise in coronary artery disease. Am J Cardiol 1986; 57:71–75.
- Froelicher VF, Perdue S, Pewen W, Risch M. Application of meta-analysis using an electronic spread sheet to exercise testing in patients after myocardial infarction. Am J Med 1987; 83:1045–1054.
- Tzemos N, Lim PO, MacDonald TM. Is exercise blood pressure a marker of vascular endothelial function? QJM 2002; 95:423–429.
- Wilson NV, Meyer BM. Early prediction of hypertension using exercise blood pressure. Prev Med 1981; 10:62–68.
- Dlin RA, Hanne N, Silverberg DS, Bar-Or O. Follow-up of normotensive men with exaggerated blood pressure response to exercise. Am Heart J 1983; 106:316–320.
- Allison TG, Cordeiro MA, Miller TD, Daida H, Squires RW, Gau GT. Prognostic significance of exercise-induced systemic hypertension in healthy subjects. Am J Cardiol 1999; 83:371–375.
- Lauer MS, Pashkow FJ, Harvey SA, Marwick TH, Thomas JD. Angiographic and prognostic implications of an exaggerated exercise systolic blood pressure response and rest systolic blood pressure in adults undergoing evaluation for suspected coronary artery disease. J Am Coll Cardiol 1995; 26:1630–1636.
- Amon KW, Richards KL, Crawford MH. Usefulness of the postexercise response of systolic blood pressure in the diagnosis of coronary artery disease. Circulation 1984; 70:951–956.
- Ellis K, Pothier CE, Blackstone EH, Lauer MS. Is systolic blood pressure recovery after exercise a predictor of mortality? Am Heart J 2004; 147:287–292.
- Lauer MS, Okin PM, Larson MG, Evans JC, Levy D. Impaired heart rate response to graded exercise. Prognostic implications of chronotropic incompetence in the Framingham Heart Study. Circulation 1996; 93:1520–1526.
- Lauer MS, Francis GS, Okin PM, Pashkow FJ, Snader CE, Marwick TH. Impaired chronotropic response to exercise stress testing as a predictor of mortality. JAMA 1999; 281:524–529.
- Azarbal B, Hayes SW, Lewin HC, Hachamovitch R, Cohen I, Berman DS. The incremental prognostic value of percentage of heart rate reserve achieved over myocardial perfusion single-photon emission computed tomography in the prediction of cardiac death and all-cause mortality: superiority over 85% of maximal age-predicted heart rate. J Am Coll Cardiol 2004; 44:423–430.
- Myers J, Tan SY, Abella J, Aleti V, Froelicher VF. Comparison of the chronotropic response to exercise and heart rate recovery in predicting cardiovascular mortality. Eur J Cardiovasc Prev Rehab 2007; 14:215–221.
- Kligfield P, Lauer MS. Exercise electrocardiogram testing: beyond the ST segment. Circulation 2006; 114:2070–2082.
- Khan MN, Pothier CE, Lauer MS. Chronotropic incompetence as a predictor of death among patients with normal electrograms taking beta blockers (metoprolol or atenolol). Am J Cardiol 2005; 96:1328–1333.
- Cole CR, Blackstone EH, Pashkow FJ, Snader CE, Lauer MS. Heart-rate recovery immediately after exercise as a predictor of mortality. N Engl J Med 1999; 341:1351–1357.
- Cole CR, Foody JM, Blackstone EH, Lauer MS. Heart rate recovery after submaximal exercise testing as a predictor of mortality in a cardiovascularly healthy cohort. Ann Intern Med 2000; 132:552–555.
- Vivekananthan DP, Blackstone EH, Pothier CE, Lauer MS. Heart rate recovery after exercise is a predictor of mortality, independent of the angiographic severity of coronary disease. J Am Coll Cardiol 2003; 42:831–838.
- Jouven X, Empana JP, Schwartz PJ, Desnos M, Courbon D, Ducimetiere P. Heart-rate profile during exercise as a predictor of sudden death. N Engl J Med 2005; 352:1951–1958.
- Dewey FE, Freeman JV, Engel G, et al. Novel predictor of prognosis from exercise stress testing: heart rate variability response to the exercise treadmill test. Am Heart J 2007; 153:281–288.
- Lerman BB, Stein KM, Markowitz SM, Mittal S, Slotwiner DJ. Right ventricular outflow tract tachycardia: an update. Card Electrophysiol Rev 2002; 6:68–71.
- Beckerman J, Wu T, Jones S, Froelicher VF. Exercise test-induced arrhythmias. Prog Cardiovasc Dis 2005; 47:285–305.
- Jouven X, Zureik M, Desnos M, Courbon D, Ducimetiere P. Long-term outcome in asymptomatic men with exercise-induced premature ventricular depolarizations. N Engl J Med 2000; 343:826–833.
- Frolkis JP, Pothier CE, Blackstone EH, Lauer MS. Frequent ventricular ectopy after exercise as a predictor of death. N Engl J Med 2003; 348:781–790.
- Blair SN, Kohl HW, Barlow CE, Paffenbarger RS, Gibbons LW, Macera CA. Changes in physical fitness and all-cause mortality. A prospective study of healthy and unhealthy men. JAMA 1995; 273:1093–1098.
- Thomson PD, Kelemen MH. Hypotension accompanying the onset of exertional angina. A sign of severe compromise of left ventricular blood supply. Circulation 1975; 52:28–32.
KEY POINTS
- Of the prognostic factors, exercise duration is the one most strongly associated with risk of coronary events and death, independent of age, sex, or known presence and severity of coronary artery disease.
- A decrease in blood pressure with exercise can reflect severe coronary artery disease or left ventricular systolic dysfunction.
- A heart rate that does not increase adequately during exercise or does not recover rapidly after exercise is associated with an increased risk of death.
- Exercise training may help to improve the prognosis of patients with an abnormal hemodynamic response to exercise caused by poor general health.
Update on infectious disease prevention: Human papillomavirus, hepatitis A
How we prevent human papillomavirus (HPV) infection, and how we prevent hepatitis A following exposure to an index case have changed, based on the results of several key clinical trials published during the past year. The results of these studies should influence the measures we take in our daily practice to prevent these diseases. Here is a brief overview of these “impact” studies.
QUADRIVALENT HPV VACCINE PREVENTS CERVICAL LESIONS
FUTURE II Study Group. Quadrivalent vaccine against human papillomavirus to prevent high-grade cervical lesions. N Engl J Med 2007; 356:1915–1927.
Cervical cancer is the second most common type of cancer in women and is the leading cause of cancer-related deaths in developing countries. More than 500,000 new cases of cervical cancer are reported worldwide each year, and about 250,000 women die of it.1
Nearly all cases of cervical cancer are caused by HPVs, and the oncogenic types HPV-16 and HPV-18 together account for about 70%. These two types also cause vulvo-vaginal cancer, which accounts for about 6% of all gynecologic malignancies.2 Two other HPV types, HPV-6 and HPV-11, cause genital warts and, less often, cervical intraepithelial neoplasia and cervical invasive cancers.
Two HPV vaccines have been developed. One, sold as Cervarix, is directed against HPV-16 and HPV-18; it is not yet available in the United States. The other, sold as Gardasil, is directed against four HPV types: 6, 11, 16, and 18, and it is currently available (reviewed by Widdice and Kahn3).
The study. The Females United to Unilaterally Reduce Endo/Ectocervical Cancer (FUTURE) II study4 assessed the ability of the quadrivalent vaccine to prevent high-grade cervical lesions. Between June 2002 and September 2003, more than 12,000 women ages 15 to 26 were enrolled at 90 sites in 13 countries. Eligible women were not pregnant, had no abnormal Papanicolaou (Pap) smear, had had four or fewer lifetime sexual partners, and agreed to use effective contraception throughout the course of the study.
In a randomized, double-blind fashion, patients received vaccine or a placebo injection at day 1 and again 2 and 6 months later. They returned for follow-up 1, 6, 24, 36, and 48 months after the third injection, with Pap smears and colposcopy of cervical lesions.
The primary composite end point was the development of grade 2 or 3 cervical intraepithelial neoplasia, adenocarcinoma in situ, or invasive cervical carcinoma, with detection of HPV-16 or HPV-18 or both in one or more of the adjacent sections of the same lesion.
In all, 6,087 patients received vaccine and 6,080 received placebo; the two groups were well matched. About 23% had serologic evidence of exposure to either HPV-16 or HPV-18 at enrollment.
Findings. In the analysis of the data, the patients were divided into three overlapping subgroups. The first comprised women who had no serologic evidence of HPV-16 or HPV-18 infection at enrollment, who received all three injections, who remained DNA-negative at month 7, and who had no protocol violations. In this “per-protocol susceptible population,” at an average of 3 years of follow-up, lesions associated with HPV-16 or HPV-18 had developed in 42 of 5,260 women who received placebo, compared with only 1 of 5,305 who received the vaccine. The vaccine efficacy was calculated at 98% (95% confidence interval [CI] 86–100).
The second subgroup were women who had no evidence of HPV-16 or HPV-18 infection at baseline, but whose compliance with the protocol was considered imperfect. In this “unrestricted susceptible population,” the vaccine efficacy was 95% (95% CI 85–99).
The third group included all comers, regardless of whether they were already infected at baseline. In this “intention-to-treat population,” the vaccine efficacy was 44% (95% CI 26–58).
The authors concluded that in young women not previously infected with HPV-16 or HPV-18, vaccine recipients had a significantly lower occurrence of high-grade cervical intraepithelial neoplasia related to these two oncogenic HPV types.
QUADRIVALENT HPV VACCINE PREVENTS ANOGENITAL DISEASE
Garland SM, Hernandez-Avila M, Wheeler CM, et al; Females United to Unilaterally Reduce Endo/Ectocervical Disease (FUTURE) Investigators. Quadrivalent vaccine against human papillomavirus to prevent anogenital diseases. J Engl J Med 2007; 356:1928–1943.
The study. This double-blind, placebo-controlled study5 tested the usefulness of the quadrivalent HPV vaccine to prevent anogenital disease. It included 5,400 women ages 16 to 24 and was conducted over 14 months in 2002 and 2003 at 62 sites in 16 countries. Women received vaccine or placebo at day 1 and again 2 and 6 months later, and then underwent anogenital and gynecologic examinations at intervals for up to 4 years.
The co-primary composite end points were the incidence of genital warts, vulvar or vaginal intraepithelial neoplasia or cancer, cervical intraepithelial neoplasia, cervical adenocarcinoma in situ, or cervical cancer associated with HPV types 6, 11, 16, or 18.
Findings. In all, 2,700 women were assigned to receive vaccine and 2,700 to receive placebo, and they were followed for an average of 3 years. Twenty percent had pre-existing serologic evidence of infection with one of these four HPV types. In the per-protocol population who were seronegative at day 1 and were compliant, the vaccine efficacy was 100%. In the intention-to-treat group, vaccine reduced the rate of vulvar or vaginal perianal lesions regardless of HPV type by 34%, and reduced the rate of cervical lesions regardless of type by 20%.
HPV VACCINE LIKELY COST-EFFECTIVE IN GIRLS, BUT NOT BOYS
Newall AT, Beutels P, Wood JG, Edmunds WJ, MacIntyre CR. Cost-effectiveness analyses of human papillomavirus vaccination. Lancet Infect Dis 2007; 7:289–296.
The study. In a review, Newall et al6 looked at four studies that examined the cost-effectiveness of the HPV vaccine. These studies were not perfect and had methodologic limitations because of uncertainty about vaccine efficacy, duration of protection, and the contribution of herd immunity. The studies nevertheless suggested that immunization of young girls but not young boys may be cost-effective, though they suggested the need for further research.
Findings. Three of the studies showed an incremental cost-effectiveness ratio of $14,000 to $24,000 per quality-adjusted year of life gained, which is well within the range for many preventive strategies that we employ in this country.
One of the studies examined the cost-effectiveness of immunizing males, and in that study it was found not to be cost-effective.
TAKE-HOME POINTS ON HPV VACCINATION
Quadrivalent vaccine does indeed reduce the incidence of HPV-associated cervical intra-epithelial neoplasia, vulvar and vaginal intra-epithelial neoplasia, and anogenital diseases in young women, and it is likely cost-effective.
The vaccine works only against HPV types 6, 11, 16, and 18, and 30% of cervical cancers are due to types other than HPV-16 and HPV-18. Also, vaccination is much more effective in patients not yet exposed to HPV, so it would be best to vaccinate them before they become sexually active.
The Advisory Committee on Immunization Practices voted to recommend that girls ages 11 to 12 in this country should receive vaccine.
Regrettably, many third-party payers do not yet pay for the vaccine, and the cost (around $375) must be paid out of pocket. Also, this issue remains politically charged and controversial. Some states have mandated vaccination and another 15 are presently considering legislation mandating vaccination. Such legislation has been defeated in four states.
My own practice is to offer the vaccine to 11- and 12-year old girls, and to older girls and young women (not to boys), especially if the health insurance plan covers it or if the patient or the patient’s family can afford it.
HEPATITIS A VACCINE IS AS GOOD AS IMMUNE GLOBULIN AFTER EXPOSURE
Victor JC, Monto AS, Surdina TY, et al. Hepatitis A vaccine versus immune globulin for postexposure prophylaxis. N Engl J Med 2007; 357:1685–1694.
Before 1995, when the first hepatitis A vaccine was introduced, about 30,000 cases of hepatitis A were reported each year in the United States. This was thought to be the tip of the iceberg: since this infection is often subclinical, estimates of up to 300,000 cases per year were given.
At first, immunization against hepatitis A in this country was confined to children over age 2 in states in which hepatitis A occurred more often than the norm. In 2005, after it had become clear that the vaccine was highly effective, the Advisory Committee on Immunization Practices revised its recommendations to include immunization of children between the ages of 12 and 23 months,7 so that they would complete this two-stage vaccination procedure by the time they reached the age of 2 years. With that strategy, the annual occurrence of hepatitis A in the United States fell dramatically, to about 4,000 cases per year in 2005, the lowest number of cases reported in the last 40 years. At present, most hepatitis A infections in this country are not from casual idiosyncratic transmission but rather are food-borne.
Still, hepatitis A remains a major problem in many parts of the world. Moreover, the availability of immune globulin, the traditional recommended agent for postexposure pro-phylaxis, has been limited because only one company manufactures it and the price has steadily escalated.
The study. Investigators at the University of Michigan and in Kazakhstan compared conventional doses of immune globulin vs hepatitis A vaccine as postexposure prophylaxis, given within 14 days of exposure to index cases of hepatitis A.8 Excluded were persons under the age of 2 years or over the age of 40, those with a history of hepatitis A or vaccination, those with liver disease, and those with other contraindications. The primary end point was the development of symptomatic, laboratory-confirmed hepatitis A, defined as a positive test for immunoglobulin M antibodies to hepatitis A; transaminase levels greater than two times the upper limit of normal; and symptoms consistent with hepatitis A in the absence of another identifiable disease that occurred within 15 to 56 days of exposure to the index case.
Findings. Of 4,524 contacts randomized, only 1,414 (31%) were susceptible to hepatitis A, suggesting that the prevalence of hepatitis A in Kazakhstan was high at that time. Of these, 1,090 completed the immunization and follow-up protocol and were eligible for the final analysis. Of these, 568 received vaccine and 522 received globulin. The average age was 12 years, the average time to vaccination after exposure was 10 days; 16% of the exposures occurred in the day-care setting, and 84% of the exposures occurred from household contacts.
Symptomatic hepatitis A occurred in 4.4% of vaccine recipients vs 3.3% of immunoglobulin recipients. The authors concluded that hepatitis A vaccine met the test of noninferiority, that both strategies were highly protective, but that immunoglobulin was modestly better. Thus, in June 2007, the Advisory Committee on Immunization Practices recommended hepatitis A vaccine as the preferred regimen for postexposure prophylaxis.9
This approach has several advantages:
- Hepatitis A vaccine confers immunity and long-term protection, which globulin does not
- The supply of vaccine is abundant
- Vaccine is relatively cheap
- Vaccine is easy to give.
This study, however, does not apply to people younger than 2 years or older than 40, those who are immunocompromised, or those who have chronic liver disease. In these groups, the recommendation is still to use immunoglobulin in postexposure prophylaxis.
- CancerMondial. International Agency for Research on Cancer. www-dep.iarc.fr/. Accessed May 12, 2008.
- Munoz N, Bosch FX, de Sanjose S, et al. Epidemiologic classification of human papillomavirus types associated with cervical cancer. N Engl J Med 2003; 348:518–527.
- Widdice LE, Kahn JA. Using the new HPV vaccines in clinical practice. Cleve Clin J Med 2006; 73:929–935.
- FUTURE II Study Group. Quadrivalent vaccine against human papillomavirus to prevent high-grade cervical lesions. N Engl J Med 2007; 356:1915–1927.
- Garland SM, Hernandez-Avila M, Wheeler CM, et al Females United to Unilaterally Reduce Endo/Ectocervical Disease (FUTURE) I Investigators. Quadrivalent vaccine against human papillomavirus to prevent anogenital diseases. N Engl J Med 2007; 356:1928–1943.
- Newall AT, Beutels P, Wood JG, Edmunds WJ, MacIntyre CR. Cost-effectiveness analyses of human papillomavirus vaccination. Lancet Infect Dis 2007; 7:289–296.
- Advisory Committee on Immunization Practices (ACIP)Fiore AE, Wasley A, Bell BP. Prevention of hepatitis A through active or passive immunization: recommendations of the Advisory Committee on Immunization Practices (ACIP). MMWR Recomm Rep 2006; 55( RR–7):1–23.
- Victor JC, Monto AS, Surdina TY, et al. Hepatitis A vaccine versus immune globulin for postexposure prophylaxis. N Engl J Med 2007; 357:1685–1694.
- Advisory Committee on Immunization Practices, US Centers for Disease Control and Prevention. Update: prevention of hepatitis A after exposure to hepatitis A virus and in international travelers. Updated recommendations of the Advisory Committee on Immunization Practices (ACIP). MMWR Morb Mortal Wkly Rep 2007; 56:1080–1084.
How we prevent human papillomavirus (HPV) infection, and how we prevent hepatitis A following exposure to an index case have changed, based on the results of several key clinical trials published during the past year. The results of these studies should influence the measures we take in our daily practice to prevent these diseases. Here is a brief overview of these “impact” studies.
QUADRIVALENT HPV VACCINE PREVENTS CERVICAL LESIONS
FUTURE II Study Group. Quadrivalent vaccine against human papillomavirus to prevent high-grade cervical lesions. N Engl J Med 2007; 356:1915–1927.
Cervical cancer is the second most common type of cancer in women and is the leading cause of cancer-related deaths in developing countries. More than 500,000 new cases of cervical cancer are reported worldwide each year, and about 250,000 women die of it.1
Nearly all cases of cervical cancer are caused by HPVs, and the oncogenic types HPV-16 and HPV-18 together account for about 70%. These two types also cause vulvo-vaginal cancer, which accounts for about 6% of all gynecologic malignancies.2 Two other HPV types, HPV-6 and HPV-11, cause genital warts and, less often, cervical intraepithelial neoplasia and cervical invasive cancers.
Two HPV vaccines have been developed. One, sold as Cervarix, is directed against HPV-16 and HPV-18; it is not yet available in the United States. The other, sold as Gardasil, is directed against four HPV types: 6, 11, 16, and 18, and it is currently available (reviewed by Widdice and Kahn3).
The study. The Females United to Unilaterally Reduce Endo/Ectocervical Cancer (FUTURE) II study4 assessed the ability of the quadrivalent vaccine to prevent high-grade cervical lesions. Between June 2002 and September 2003, more than 12,000 women ages 15 to 26 were enrolled at 90 sites in 13 countries. Eligible women were not pregnant, had no abnormal Papanicolaou (Pap) smear, had had four or fewer lifetime sexual partners, and agreed to use effective contraception throughout the course of the study.
In a randomized, double-blind fashion, patients received vaccine or a placebo injection at day 1 and again 2 and 6 months later. They returned for follow-up 1, 6, 24, 36, and 48 months after the third injection, with Pap smears and colposcopy of cervical lesions.
The primary composite end point was the development of grade 2 or 3 cervical intraepithelial neoplasia, adenocarcinoma in situ, or invasive cervical carcinoma, with detection of HPV-16 or HPV-18 or both in one or more of the adjacent sections of the same lesion.
In all, 6,087 patients received vaccine and 6,080 received placebo; the two groups were well matched. About 23% had serologic evidence of exposure to either HPV-16 or HPV-18 at enrollment.
Findings. In the analysis of the data, the patients were divided into three overlapping subgroups. The first comprised women who had no serologic evidence of HPV-16 or HPV-18 infection at enrollment, who received all three injections, who remained DNA-negative at month 7, and who had no protocol violations. In this “per-protocol susceptible population,” at an average of 3 years of follow-up, lesions associated with HPV-16 or HPV-18 had developed in 42 of 5,260 women who received placebo, compared with only 1 of 5,305 who received the vaccine. The vaccine efficacy was calculated at 98% (95% confidence interval [CI] 86–100).
The second subgroup were women who had no evidence of HPV-16 or HPV-18 infection at baseline, but whose compliance with the protocol was considered imperfect. In this “unrestricted susceptible population,” the vaccine efficacy was 95% (95% CI 85–99).
The third group included all comers, regardless of whether they were already infected at baseline. In this “intention-to-treat population,” the vaccine efficacy was 44% (95% CI 26–58).
The authors concluded that in young women not previously infected with HPV-16 or HPV-18, vaccine recipients had a significantly lower occurrence of high-grade cervical intraepithelial neoplasia related to these two oncogenic HPV types.
QUADRIVALENT HPV VACCINE PREVENTS ANOGENITAL DISEASE
Garland SM, Hernandez-Avila M, Wheeler CM, et al; Females United to Unilaterally Reduce Endo/Ectocervical Disease (FUTURE) Investigators. Quadrivalent vaccine against human papillomavirus to prevent anogenital diseases. J Engl J Med 2007; 356:1928–1943.
The study. This double-blind, placebo-controlled study5 tested the usefulness of the quadrivalent HPV vaccine to prevent anogenital disease. It included 5,400 women ages 16 to 24 and was conducted over 14 months in 2002 and 2003 at 62 sites in 16 countries. Women received vaccine or placebo at day 1 and again 2 and 6 months later, and then underwent anogenital and gynecologic examinations at intervals for up to 4 years.
The co-primary composite end points were the incidence of genital warts, vulvar or vaginal intraepithelial neoplasia or cancer, cervical intraepithelial neoplasia, cervical adenocarcinoma in situ, or cervical cancer associated with HPV types 6, 11, 16, or 18.
Findings. In all, 2,700 women were assigned to receive vaccine and 2,700 to receive placebo, and they were followed for an average of 3 years. Twenty percent had pre-existing serologic evidence of infection with one of these four HPV types. In the per-protocol population who were seronegative at day 1 and were compliant, the vaccine efficacy was 100%. In the intention-to-treat group, vaccine reduced the rate of vulvar or vaginal perianal lesions regardless of HPV type by 34%, and reduced the rate of cervical lesions regardless of type by 20%.
HPV VACCINE LIKELY COST-EFFECTIVE IN GIRLS, BUT NOT BOYS
Newall AT, Beutels P, Wood JG, Edmunds WJ, MacIntyre CR. Cost-effectiveness analyses of human papillomavirus vaccination. Lancet Infect Dis 2007; 7:289–296.
The study. In a review, Newall et al6 looked at four studies that examined the cost-effectiveness of the HPV vaccine. These studies were not perfect and had methodologic limitations because of uncertainty about vaccine efficacy, duration of protection, and the contribution of herd immunity. The studies nevertheless suggested that immunization of young girls but not young boys may be cost-effective, though they suggested the need for further research.
Findings. Three of the studies showed an incremental cost-effectiveness ratio of $14,000 to $24,000 per quality-adjusted year of life gained, which is well within the range for many preventive strategies that we employ in this country.
One of the studies examined the cost-effectiveness of immunizing males, and in that study it was found not to be cost-effective.
TAKE-HOME POINTS ON HPV VACCINATION
Quadrivalent vaccine does indeed reduce the incidence of HPV-associated cervical intra-epithelial neoplasia, vulvar and vaginal intra-epithelial neoplasia, and anogenital diseases in young women, and it is likely cost-effective.
The vaccine works only against HPV types 6, 11, 16, and 18, and 30% of cervical cancers are due to types other than HPV-16 and HPV-18. Also, vaccination is much more effective in patients not yet exposed to HPV, so it would be best to vaccinate them before they become sexually active.
The Advisory Committee on Immunization Practices voted to recommend that girls ages 11 to 12 in this country should receive vaccine.
Regrettably, many third-party payers do not yet pay for the vaccine, and the cost (around $375) must be paid out of pocket. Also, this issue remains politically charged and controversial. Some states have mandated vaccination and another 15 are presently considering legislation mandating vaccination. Such legislation has been defeated in four states.
My own practice is to offer the vaccine to 11- and 12-year old girls, and to older girls and young women (not to boys), especially if the health insurance plan covers it or if the patient or the patient’s family can afford it.
HEPATITIS A VACCINE IS AS GOOD AS IMMUNE GLOBULIN AFTER EXPOSURE
Victor JC, Monto AS, Surdina TY, et al. Hepatitis A vaccine versus immune globulin for postexposure prophylaxis. N Engl J Med 2007; 357:1685–1694.
Before 1995, when the first hepatitis A vaccine was introduced, about 30,000 cases of hepatitis A were reported each year in the United States. This was thought to be the tip of the iceberg: since this infection is often subclinical, estimates of up to 300,000 cases per year were given.
At first, immunization against hepatitis A in this country was confined to children over age 2 in states in which hepatitis A occurred more often than the norm. In 2005, after it had become clear that the vaccine was highly effective, the Advisory Committee on Immunization Practices revised its recommendations to include immunization of children between the ages of 12 and 23 months,7 so that they would complete this two-stage vaccination procedure by the time they reached the age of 2 years. With that strategy, the annual occurrence of hepatitis A in the United States fell dramatically, to about 4,000 cases per year in 2005, the lowest number of cases reported in the last 40 years. At present, most hepatitis A infections in this country are not from casual idiosyncratic transmission but rather are food-borne.
Still, hepatitis A remains a major problem in many parts of the world. Moreover, the availability of immune globulin, the traditional recommended agent for postexposure pro-phylaxis, has been limited because only one company manufactures it and the price has steadily escalated.
The study. Investigators at the University of Michigan and in Kazakhstan compared conventional doses of immune globulin vs hepatitis A vaccine as postexposure prophylaxis, given within 14 days of exposure to index cases of hepatitis A.8 Excluded were persons under the age of 2 years or over the age of 40, those with a history of hepatitis A or vaccination, those with liver disease, and those with other contraindications. The primary end point was the development of symptomatic, laboratory-confirmed hepatitis A, defined as a positive test for immunoglobulin M antibodies to hepatitis A; transaminase levels greater than two times the upper limit of normal; and symptoms consistent with hepatitis A in the absence of another identifiable disease that occurred within 15 to 56 days of exposure to the index case.
Findings. Of 4,524 contacts randomized, only 1,414 (31%) were susceptible to hepatitis A, suggesting that the prevalence of hepatitis A in Kazakhstan was high at that time. Of these, 1,090 completed the immunization and follow-up protocol and were eligible for the final analysis. Of these, 568 received vaccine and 522 received globulin. The average age was 12 years, the average time to vaccination after exposure was 10 days; 16% of the exposures occurred in the day-care setting, and 84% of the exposures occurred from household contacts.
Symptomatic hepatitis A occurred in 4.4% of vaccine recipients vs 3.3% of immunoglobulin recipients. The authors concluded that hepatitis A vaccine met the test of noninferiority, that both strategies were highly protective, but that immunoglobulin was modestly better. Thus, in June 2007, the Advisory Committee on Immunization Practices recommended hepatitis A vaccine as the preferred regimen for postexposure prophylaxis.9
This approach has several advantages:
- Hepatitis A vaccine confers immunity and long-term protection, which globulin does not
- The supply of vaccine is abundant
- Vaccine is relatively cheap
- Vaccine is easy to give.
This study, however, does not apply to people younger than 2 years or older than 40, those who are immunocompromised, or those who have chronic liver disease. In these groups, the recommendation is still to use immunoglobulin in postexposure prophylaxis.
- CancerMondial. International Agency for Research on Cancer. www-dep.iarc.fr/. Accessed May 12, 2008.
- Munoz N, Bosch FX, de Sanjose S, et al. Epidemiologic classification of human papillomavirus types associated with cervical cancer. N Engl J Med 2003; 348:518–527.
- Widdice LE, Kahn JA. Using the new HPV vaccines in clinical practice. Cleve Clin J Med 2006; 73:929–935.
- FUTURE II Study Group. Quadrivalent vaccine against human papillomavirus to prevent high-grade cervical lesions. N Engl J Med 2007; 356:1915–1927.
- Garland SM, Hernandez-Avila M, Wheeler CM, et al Females United to Unilaterally Reduce Endo/Ectocervical Disease (FUTURE) I Investigators. Quadrivalent vaccine against human papillomavirus to prevent anogenital diseases. N Engl J Med 2007; 356:1928–1943.
- Newall AT, Beutels P, Wood JG, Edmunds WJ, MacIntyre CR. Cost-effectiveness analyses of human papillomavirus vaccination. Lancet Infect Dis 2007; 7:289–296.
- Advisory Committee on Immunization Practices (ACIP)Fiore AE, Wasley A, Bell BP. Prevention of hepatitis A through active or passive immunization: recommendations of the Advisory Committee on Immunization Practices (ACIP). MMWR Recomm Rep 2006; 55( RR–7):1–23.
- Victor JC, Monto AS, Surdina TY, et al. Hepatitis A vaccine versus immune globulin for postexposure prophylaxis. N Engl J Med 2007; 357:1685–1694.
- Advisory Committee on Immunization Practices, US Centers for Disease Control and Prevention. Update: prevention of hepatitis A after exposure to hepatitis A virus and in international travelers. Updated recommendations of the Advisory Committee on Immunization Practices (ACIP). MMWR Morb Mortal Wkly Rep 2007; 56:1080–1084.
Instant Poll Results
JULY 2007
Have you been drilled recently to prepare for massive obstetric hemorrhage?
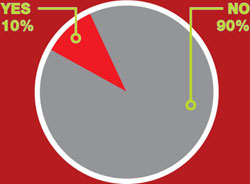
The Joint Commission recommends that labor and delivery services practice responding to common obstetric emergencies by using simulation training. Has your obstetric service had a simulation drill for massive obstetric hemorrhage during the past year?
SEPTEMBER 2007
Can you prognosticate the future of the specialty?
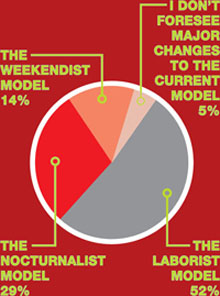
Gazing into the future, which of the following “-ist” models do you think ObGyn practices are most likely to heavily rely on to boost the career satisfaction of practicing obstetrician-gynecologists?
JULY 2007
Have you been drilled recently to prepare for massive obstetric hemorrhage?
The Joint Commission recommends that labor and delivery services practice responding to common obstetric emergencies by using simulation training. Has your obstetric service had a simulation drill for massive obstetric hemorrhage during the past year?
SEPTEMBER 2007
Can you prognosticate the future of the specialty?
Gazing into the future, which of the following “-ist” models do you think ObGyn practices are most likely to heavily rely on to boost the career satisfaction of practicing obstetrician-gynecologists?
When necessity calls for treating uterine fibroids
The author reports no financial relationships relevant to this article.
Part 1 of this article, in the May 2008 issue, discusses how to counsel patients who are found to have a uterine fibroid.
CASE 1 Menorrhagia with anemia
G.L. is a 44-year-old G2P2 who comes to the office for a second opinion on treatment for menorrhagia and a 10-weeks–size fibroid uterus. She reports that her periods last 8 days, and that for 3 of those days she changes a pad once an hour. Her most recent hemoglobin level was 10.2 g/dL. Her regular gynecologist has recommended abdominal hysterectomy. She would like to avoid major surgery and asks about alternatives. What therapies do you tell her are appropriate?
Most women who have uterine fibroids are asymptomatic or mildly symptomatic; they do not require treatment. In one study, 77% of women choosing observation for their fibroids had no significant changes in bleeding, pain, bothersome symptoms, mental health, general health, or activity after 1 year.1 After menopause, fibroids shrink, and the rate of surgery decreases greatly.2 For women such as these, “watchful waiting” may allow them to avoid treatment indefinitely.
For such women as G.L., however, who develop severe anemia from fibroid-related menorrhagia, treatment is necessary. It also is indicated in the rare case of hydro-nephrosis due to obstruction of the ureter(s) by fibroids, or when menorrhagia, pelvic pain or pressure, or urinary frequency or incontinence compromises quality of life.
The distress experienced by women with symptoms such as these can be severe. In one study, women who chose hysterectomy for fibroid-related symptoms assessed their quality of life as worse than that of women who suffered hypertension, heart disease, chronic lung disease, or arthritis.3
Nevertheless, when symptomatic women were offered hysterectomy as a first and sometimes sole treatment, some chose to adapt to symptoms and stop seeking treatment. In fact, hysterectomy is not the only option. A number of alternatives are available, including:
- medical therapy
- the progesterone-releasing IUD
- endometrial ablation
- hysteroscopic, laparoscopic, and abdominal myomectomy
- uterine artery embolization (UAE).4
With the exception of medical therapy, all of these modalities are described here.
- Most uterine fibroids are asymptomatic, require no treatment, and can be managed by watchful waiting.
- Treatment is indicated when fibroids cause severe anemia and when symptoms interfere with quality of life.
- Hysterectomy is not the only treatment option; alternatives include medical therapy, the progesterone-releasing intrauterine system, endometrial ablation, myomectomy (hysteroscopic, laparoscopic, or abdominal), uterine artery embolization (UAE), and focused ultrasound.
- Contraindications to UAE include active genitourinary infection, genital tract malignancy, reduced immune status, severe vascular disease, allergy to intravenous contrast, or impaired renal function. Relative contraindications include large submucous myomas, pedunculated myomas, recent treatment with gonadotropin-releasing hormone agonists, previous iliac or uterine artery occlusion, or postmenopausal status.
- Myomectomy may be considered even for women who have large uterine fibroids who wish to retain their uterus. Surgical techniques available for abdominal or laparoscopic myomectomy make this procedure safe.
- Women who have intractable symptoms and who have not been helped by other therapies may benefit from hysterectomy. Laparoscopic hysterectomy has the benefits of less postoperative pain, shorter hospital stay, and quicker recovery. If a vaginal hysterectomy is feasible, however, there is no benefit to a laparoscopic hysterectomy.
Progesterone-releasing intrauterine system
In a woman who has fibroids no larger than 12-weeks size and a normal uterine cavity, the levonorgestrel-releasing intrauterine system (IUS) (brand name, Mirena) has been shown to substantially reduce menstrual bleeding.5 Within 3 months, 22 of 26 (85%) women with documented menorrhagia treated in this way had normal bleeding and, by 12 months, 40% of all 76 women studied were amenorrheic.
CASE 1 CONTINUED
You perform an office hysteroscopy on G.L., which reveals a 3-cm, type 1 submucosal fibroid, suggesting, by its size, that the levonorgestrel-releasing IUS is unlikely to relieve her bleeding. What other treatments might be appropriate?
Studies show a reduction in bleeding following hysteroscopic resection of submucous fibroids. One hundred ninety-six consecutive women who had menorrhagia and one or more submucous myomas were followed for an average of 73 months after hysteroscopic myomectomy.6 Sixty-eight percent reported “satisfaction and ability to lead a normal life,” and 32% considered results unsatisfactory.
In a report of 285 consecutive women treated with hysteroscopic myomectomy for menorrhagia or metrorrhagia, additional surgery was necessary for 9.5% by 2 years, 10.8% by 5 years, and 26.7% by 8 years.7
Endometrial ablation
In women who do not desire future childbearing, endometrial ablation with or without hysteroscopic myomectomy may be an option. One study that used pad counts as an objective measure found that abnormal bleeding resolved in 48 of 51 women (94%) following endometrial ablation, after an average follow-up of 2 years.8
A study of 33 women who had uterine myomas and total uterine volume smaller than 16-weeks size, and who were followed for a mean of 8 months after Nd:YAG laser ablation of the endometrium, reported amenorrhea in 16 women (49%) and eumenorrhea or hypomenorrhea in the other 17.9
Hydrothermal ablation was used to treat 22 women who had submucous myomas as large as 4 cm in diameter, with 91% reporting amenorrhea, hypomenorrhea, or eumenorrhea after a minimum of 12 months of follow-up.10
Sixty-five women who suffered from menometrorrhagia with hysteroscopically confirmed type I or type II submucous myomas as large as 3 cm had endometrial ablation with the NovaSure System.11 After 1 year, 95% had a reduction in bleeding to a normal degree; 69% had amenorrhea. No intraoperative or postoperative complications occurred.
Uterine artery embolization
UAE appears to be an effective treatment for some women who have fibroids. At the moment, the effect of UAE on premature ovarian failure, fertility, and pregnancy is not clear; most interventional radiologists advise against the procedure for women who want to become pregnant. Although very rare, complications of UAE may necessitate lifesaving hysterectomy, and women who would not accept hysterectomy even under these circumstances should not undergo UAE.
Contraindications to UAE include active genitourinary infection, genital tract malignancy, reduced immune status, severe vascular disease, allergy to intravenous (IV) contrast, or impaired renal function. Relative contraindications include large submucous myomas, pedunculated myomas, recent gonadotropin-releasing hormone (GnRH) agonist treatment, previous iliac or uterine artery occlusion, and postmenopausal status.12
How UAE works
In UAE, a trained interventional radiologist performs percutaneous cannulation of the femoral artery. Embolization of the uterine artery and its branches (FIGURE 1) is accomplished with gelatin sponges, polyvinyl alcohol particles (PVA), or tris-acryl gelatin microspheres under fluoroscopic guidance. Total radiation exposure is equivalent to one to two computed tomography (CT) scans.
Postprocedural pain usually requires pain management in the hospital overnight, but most women are discharged the next day on a nonsteroidal anti-inflammatory drug (NSAID). Most women can return to normal activity in 1 to 3 weeks, although about 5% to 10% of women experience a longer bout of pain.
Postembolization syndrome requires admission for treatment with IV fluids, an NSAID, and pain management. It usually resolves in 48 to 72 hours. Persistent fever should be managed with antibiotics, but a failure to respond to antibiotics may indicate sepsis, indicating the need for aggressive management with hysterectomy. ACOG recommends that women considering UAE have a thorough evaluation with a gynecologist to help facilitate collaboration with the interventional radiologist, and that protocols be in place to establish the responsibility of caring for the patient at all times.13
FIGURE 1 Target: blood supply
Arteriogram showing blood supply to fibroid to be targeted during uterine artery embolization.
What the data show
The largest prospective study of UAE included 555 women, 18 to 59 years old, 40% of whom had required time off from work for fibroid-related symptoms. Three months after UAE, the largest myomas were reduced by a mean of 33%. Menorrhagia had improved in 83%; dysmenorrhea, in 77%; and urinary frequency, in 86%.14 Interestingly, improvement in menorrhagia was not related to pre-UAE uterine volume or the volume reduction attained.
Hysterectomy was performed for complications in 1.5% of women: two for infection, four for persistent postembolization pain, one for prolapsed myoma, and one for continued vaginal bleeding. Of 400 women followed for a mean of 16.7 months, 74% were considered a clinical success.15
More than 50,000 UAE procedures have been performed worldwide. Five deaths have been reported: two from septic shock, one from a pulmonary embolus, and two from uncertain causes. This compares favorably with the mortality of 3 for every 10,000 hysterectomies in a similar group of women, which was reported in the national inpatient sample of the Healthcare Cost and Utilization Project (HCUP) database of the Agency for HealthCare Research and Quality, available at http://hcup.ahrq.gov/HCUPnet.asp.
Effects on fertility
Following UAE, amenorrhea has been reported in 3% of women under 40 but in 41% of women over 50.16 Although normal follicle-stimulating hormone (FSH), estradiol, ovarian volume, and antral follicle counts have been found in most women shortly after UAE, such testing is unable to predict the onset of menopause.
Loss of follicles as a result of misembolization to the ovarian vessels and decreased ovarian perfusion might cause ovarian failure at an earlier age than expected (Robert Vogetzang, MD, personal communication, 2007). Long-term follow-up of women who have had UAE will be necessary to answer this important question.
CASE 1 RESOLVED
G.L. chose hysteroscopic myomectomy and endometrial ablation for her menorrhagia. Twelve months later, she remains amenorrheic.
CASE 2 Large fibroids; options other than hysterectomy?
A.M., a 39-year-old G2P2, complains of pelvic pressure and urinary frequency. On examination, you find a 14-weeks–size fibroid uterus. She has not given up hope for giving birth to one more child, and wants to avoid hysterectomy. Ultrasonography shows two fundal fibroids, both about 7 cm in diameter. A.M. asks what treatment options are available for her. What can you offer this patient?
Abdominal myomectomy
Myomectomy is used less often than hysterectomy. In 1999, when one third of the 598,000 hysterectomies performed annually were performed for fibroids, only 30,000 myomectomies were performed.17
As long ago as 1931, Victor Bonney advocated abdominal myomectomy because he believed that the procedure best served what should be the “ultimate goal of surgical treatment, the restoration and maintenance of physiologic function.” Yet women are still being told that hysterectomy is safer, associated with less blood loss—or that myomectomy is inappropriate because sarcoma may be present. Recent reports do not support these concerns.
Uterine fibroids are extremely common. By age 50, 80% of African-American and 70% of Caucasian women have fibroids.1 Fibroids were the primary indication for surgery in the United States in 1997, accounting for 199,000 hysterectomies and 30,000 myomectomies at a cost of $2.1 billion.1 The costs of alternative surgical therapies, medical treatments, and time away from work or family add significantly to the expense associated with fibroids.2
References
1. Farquhar CM, Steiner CA. Hysterectomy rates in the United States 1990–1997. Obstet Gynecol. 2002;99:229-234.
2. Myers E, Barber M, Couchman G, et al. Management of Uterine Fibroids. AHRQ Evidence Reports. Vol. 1, No. 34. Washington, DC: AHRQ; 2001.
Myomectomy vs hysterectomy
A review of 197 women who underwent myomectomy and 197 women who underwent hysterectomy with similar uterine size (14.4 vs 15.6 weeks) found the risks of hemorrhage, fever, unintended surgical procedures, life-threatening events, and rehospitalization equivalent between the two procedures.18 Women in the hysterectomy group had more surgical blood loss (484 mL vs 227 mL) and suffered more complications (13%), including one cystotomy, one ureteral injury, three bowel injuries, eight cases of ileus, and six cases of pelvic abscess.19
In contrast, only 5% of the myomectomy patients had a complication, which included one cystotomy, two reoperations for small bowel obstruction, and six cases of ileus. The authors concluded that myomectomy is a safe alternative to hysterectomy.
Myomectomy may be feasible even with large fibroids
Abdominal myomectomy may be considered even for women who have large uterine fibroids (FIGURE 2) and who wish to retain their uterus. A study of 91 women who had uterine size larger than 16 weeks (range, 16 to 36 weeks) and underwent abdominal myomectomy reported no instance of conversion to hysterectomy. Complications included one bowel injury, one bladder injury, and one reoperation for bowel obstruction.20
In the past, enlarging fibroids have been deemed an indication that hysterectomy should be performed because leiomyosarcoma may be present. This concern is unfounded. A study of 371 women with a “rapidly growing uterus” found leiomyosarcoma in only one.21
FIGURE 2 Abdominal myomectomy
Myomectomy may be appropriate even for women who have large fibroids who wish to retain their uterus.
Removing large fibroids safely
Surgical techniques available for myomectomy allow safe removal of even large fibroids. Tourniquets and vasoconstrictive substances (vasopressin [off-label use]) may be used to limit blood loss. Continuing the uterine incisions through the myometrium and entire pseudocapsule until the fibroid is clearly seen exposes a less vascular surgical plane, which is deeper than commonly appreciated. Vascular corrosion casting shows that fibroids are totally surrounded by a dense vascular layer and that no distinct “vascular pedicle” exists at the base of the myoma.22
Fibroids that are near dominant fibroids can be removed through the same uterine incision, but avoid tunneling through the myometrium to remove distant fibroids; many myometrial tunnels are hard to close and can continue to bleed. Promptly closing each incision allows immediate hemostasis and, although multiple uterine incisions may be needed, adhesion barriers may help limit formation of adhesions.23
Avoiding heterologous transfusion
Cell-saver technology has been used extensively in orthopedic, cardiac, and neurologic surgery; consider it during myomectomy (or hysterectomy).
The cell saver suctions blood from the operative field and mixes it with heparinized saline. If blood reinfusion is necessary, the blood is washed with saline, filtered, centrifuged to a hematocrit of approximately 50%, and given back to the patient via an IV line. The need for preoperative autologous blood donation or heterologous blood transfusion can therefore often be avoided, eliminating the risk of infection and transfusion reaction.24
Seventy of 91 women who underwent myomectomy for uterine size of 16 to 36 weeks had cell-saver blood reinfused (mean volume, 355 mL); only seven women required heterologous transfusion.20
Laparoscopic myomectomy
Instrumentation makes laparoscopic myomectomy feasible, although the application of this approach is limited by the size and number of fibroids that can be reasonably removed and by the difficulty of laparoscopic suturing. However, a study of 131 women randomized to abdominal and laparoscopic myomectomy for nonpedunculated large myomas (mean diameter, 7 cm) found a higher postoperative hemoglobin level, lower incidence of postoperative fever, and shorter hospital stays with laparoscopic myomectomy.25
A case series of 144 women (largest fibroid, 18 cm [mean, 7.8 cm]) reported that only two (1.4%) women required conversion to laparotomy.26
Myomas do not recur
Once individual myomas are removed, they do not recur, although new myomas may appear. Most women require no additional treatment. If the first myomectomy is performed for one fibroid, 11% of women require subsequent surgery (mean follow-up, 7.6 years). If multiple fibroids are removed initially, 26% require subsequent surgery.27
The appearance of a new myoma may reflect the persistence of fibroids not removed initially—as ultrasonography has demonstrated in 29% of women after myomectomy.28
CASE 2 RESOLVED
A.M. underwent pelvic magnetic resonance imaging, which revealed two 7-cm intramural fibroids and four other intramural fibroids between 2 cm and 4 cm in size. She chose abdominal myomectomy and is now attempting pregnancy.
CASE 3 Patient asks for hysterectomy
S.L. is a 44-year-old G2P2 who complains of missing a few days of work every month because of heavy menstrual bleeding and fatigue. Her hemoglobin level is now 8.2 g/dL. She underwent myomectomy about 10 years ago, successfully followed by two pregnancies, but her uterus is now about 12-weeks size. She is not interested in getting pregnant again and wants to be able to work without bleeding through her clothes. She has explored other options, but has decided to have a hysterectomy. She asks whether laparoscopic supracervical hysterectomy is appropriate for her situation. What do you advise?
Treating preoperative anemia
The first step for this patient is to treat her anemia.
Erythropoietin alfa and epoetin have been shown to increase preoperative hemoglobin concentrations in cardiac, orthopedic, and neurologic surgery. They should be considered more often, when appropriate, before gynecologic surgery.29 A randomized study showed that approximately 15,000 U of epoetin a week for 3 weeks before surgery raised the hemoglobin concentration by 1.6 g/dL and significantly reduced the transfusion rate when compared with controls.30 No side effects were reported.
GnRH agonists have been shown to reduce uterine volume, fibroid volume, and bleeding; these benefits may be limited, however, by side effects and risks. Reduction in uterine size occurs mostly within the first 3 months of treatment; after 6 months, fibroid volume is reduced by 30% and total uterine volume by 35%.31,32 Heavy bleeding responds well to GnRH agonists; in one study, 37 of 38 women had resolution by 6 months.
Side effects generally do not deter treatment
Side effects are common with GnRH agonists: 78% experience hot flushes; 32%, vaginal dryness; and 55%, transient headache. Arthralgia, myalgia, insomnia, emotional lability, and decreased libido are reported less often. However, only 8% of women terminate treatment because of side effects.33
Bone loss is significant after 6 months of a GnRH agonist.34
A Cochrane review found that women who have myomas and who were treated preoperatively with 3 to 4 months of a GnRH agonist had significantly reduced uterine volume and uterine size; an improved preoperative hemoglobin level; and reduced operating times and hospital stay.35 Although operative blood loss was less for both abdominal hysterectomy and abdominal myomectomy patients, there was no significant difference in the transfusion rate.
Hysterectomy
Fibroids were the indication for hysterectomy in 40% of abdominal, 17% of vaginal, and 29% of laparoscopic hysterectomies, according to a review in the United States.17 Women with intractable symptoms who have not been helped by other therapies may benefit from hysterectomy. The Maine Women’s Health Study found that, following hysterectomy (35% of which were performed for myomas) for moderate or severe symptoms, 72% of women felt “much better,” 16% felt a “little better,” and 3% felt worse than they did before surgery.1
Laparoscopic hysterectomy
Either total or supracervical laparoscopic hysterectomy is feasible. Benefits include less postoperative pain, short hospital stay, and quick recovery. However, if a vaginal hysterectomy is feasible, there is no benefit to laparoscopic hysterectomy.36
What the data show
A prospective, randomized, multicenter study concluded that laparoscopic-assisted hysterectomy offered the benefits of less invasive surgery without increased risk.37 Eighty women whose uterus was between 280 g and 700 g were randomized to laparoscopic-assisted vaginal and abdominal hysterectomy. Estimated blood loss, postoperative day 1 hemoglobin level, pain, and hospital stay were all significantly better for the laparoscopic-assisted group. Complications in the abdominal hysterectomy group included one woman who had a cuff hematoma and who required transfusion; one who had bleeding requiring reoperation and transfusion; and five who had fever. The only complication in the laparoscopic group was postoperative fever in two women.
Even large fibroids may benefit from laparoscopy
In experienced hands, the benefits of laparoscopic hysterectomy may extend to women who have large fibroids. A retrospective cohort study compared laparoscopic hysterectomy in 34 women who had a uterine weight greater than 500 g (range, 500 to 1,230 g) with 68 women whose uterus weighed less than 300 g.38 Operating time was significantly shorter in women with smaller uteri, but no difference was observed in complications, blood loss, hospital stay, or recovery, and no patient required conversion to laparotomy.
CASE 3 RESOLVED
S.L. underwent laparoscopic supracervical hysterectomy, which involved a 1-night hospital stay, and returned to work in 2 weeks. She is happy to be free of monthly bleeding and believes she made the right treatment decision.
Just as there are multiple options for removing myomas, so are there multiple coding possibilities for this service. Note that some procedures require special documentation of the clinical circumstances to ensure correct payment and that other treatments may be considered investigational by payers.
Surgical removal of uterine fibroids can be accomplished vaginally (58145), abdominally (58140, 58146), hysteroscopically (58561), and laparoscopically (58545–58546). Except for the hysteroscopic approach, all require documentation of the number and weight of the fibroids, to ensure that payment reflects how much work was done. When five or more fibroids are removed, or when the combined weight of all fibroids removed exceeds 250 g, the CPT codes that represent these services will reimburse at a higher rate. When endometrial ablation is the treatment of choice, you must choose between hysteroscopic (58563) and nonhysteroscopic (58353) methods when selecting a code.
Insertion of the levonorgestrel-releasing intrauterine system (Mirena) requires that you report more than one code. Report insertion 58300 (S4981 for Blue Cross and Blue Shield carriers). Bill for the device itself with J7302, or with J7306 (the system and supplies).
Last, some payers consider uterine artery embolization investigational, even though it has its own CPT code (37210).—MELANIE WITT, RN, CPC-OGS, MA
1. Carlson KJ, Miller BA, Fowler FJ, Jr. The Maine Women’s Health Study: II. Outcomes of nonsurgical management of leiomyomas, abnormal bleeding, and chronic pelvic pain. Obstet Gynecol. 1994;83:566-572.
2. Cramer SF, Marchetti C, Freedman J, Padela A. Relationship of myoma cell size and menopausal status in small uterine leiomyomas. Arch Pathol Lab Med. 2000;124:1448-1453.
3. Rowe MK, Kanouse DE, Mittman BS, Bernstein SJ. Quality of life among women undergoing hysterectomies. Obstet Gynecol. 1999;93:915-921.
4. Parker W. Uterine myomas: management. Fertil Steril. 2007;88:255-271.
5. Grigorieva V, Chen-Mok M, Tarasova M, Mikhailov A. Use of a levonorgestrel-releasing intrauterine system to treat bleeding related to uterine leiomyomas. Fertil Steril. 2003;79:1194-1198.
6. Cravello L. [Indications and modalities of surgical treatment for sub-mucosal myomas]. J Gynecol Obstet Biol Reprod (Paris). 1999;28:748-752.
7. Emanuel MH, Wamsteker K, Hart AA, Metz G, Lammes FB. Long-term results of hysteroscopic myomectomy for abnormal uterine bleeding. Obstet Gynecol. 1999;93:743-748.
8. Indman PD. Hysteroscopic treatment of menorrhagia associated with uterine leiomyomas. Obstet Gynecol. 1993;81:716-720.
9. Lomano J. Endometrial ablation for the treatment of menorrhagia: a comparison of patients with normal, enlarged, and fibroid uteri. Lasers Surg Med. 1991;11:8-12.
10. Glasser MH, Zimmerman JD. The HydroThermAblator system for management of menorrhagia in women with submucous myomas: 12- to 20-month follow-up. J Am Assoc Gynecol Laparosc. 2003;10:521-527.
11. Sabbah R, Desaulniers G. Use of the NovaSure Impedance Controlled Endometrial Ablation System in patients with intracavitary disease: 12-month follow-up results of a prospective, single-arm clinical study. J Minim Invasive Gynecol. 2006;13:467-471.
12. Society of Obstetricians and Gynaecologists of Canada. SOGC clinical practice guidelines. Uterine fibroid embolization (UFE). Number 150, October 2004. Int. J Gynaecol Obstet. 2005;89:305-318.
13. Committee on Gynecologic Practice, American College of Obstetricians and Gynecologists. ACOG Committee Opinion. Uterine artery embolization. Obstet Gynecol. 2004;103:403-404.
14. Pron G, Mocarski E, Bennett J, Vilos G, Common A, Vanderburgh L. Ontario UFE Collaborative Group. Pregnancy after uterine artery embolization for leiomyomata: the Ontario multicenter trial. Obstet Gynecol. 2005;105:67-76.
15. Walker WJ, Pelage JP. Uterine artery embolisation for symptomatic fibroids: clinical results in 400 women with imaging follow up. BJOG. 2002;109:1262-1272.
16. Pron G, Bennett J, Common A, Wall J, Asch M, Sniderman K. The Ontario Uterine Fibroid Embolization Trial. Part 2. Uterine fibroid reduction and symptom relief after uterine artery embolization for fibroids. Fertil Steril. 2003;79:120-127.
17. Farquhar CM, Steiner CA. Hysterectomy rates in the United States 1990-1997. Obstet Gynecol. 2002;99:229-234.
18. Iverson RE, Jr, Chelmow D, Strohbehn K, Waldman L, Evantash EG. Relative morbidity of abdominal hysterectomy and myomectomy for management of uterine leiomyomas. Obstet Gynecol. 1996;88:415-419.
19. Sawin SW, Pilevsky ND, Berlin JA, Barnhart KT. Comparability of perioperative morbidity between abdominal myomectomy and hysterectomy for women with uterine leiomyomas. Am J Obstet Gynecol. 2000;183:1448-1455.
20. West S, Ruiz R, Parker WH. Abdominal myomectomy in women with very large uterine size. Fertil Steril. 2006;85:36-39.
21. Parker WH, Fu YS, Berek JS. Uterine sarcoma in patients operated on for presumed leiomyoma and rapidly growing leiomyoma. Obstet Gynecol. 1994;83:414-418.
22. Walocha JA, Litwin JA, Miodonski AJ. Vascular system of intramural leiomyomata revealed by corrosion casting and scanning electron microscopy. Hum Reprod. 2003;18:1088-1093.
23. Diamond MP. Reduction of adhesions after uterine myomectomy by Seprafilm membrane (HAL-F): a blinded, prospective, randomized, multicenter clinical study. Seprafilm Adhesion Study Group. Fertil Steril. 1996;66:904-910.
24. Yamada T, Ikeda A, Okamoto Y, Okamoto Y, Kanda T, Ueki M. Intraoperative blood salvage in abdominal simple total hysterectomy for uterine myoma. Int J Gynaecol Obstet. 1997;59:233-236.
25. Seracchioli R, Rossi S, Govoni F, et al. Fertility and obstetric outcome after laparoscopic myomectomy of large myomata: a randomized comparison with abdominal myomectomy. Hum Reprod. 2000;15:2663-2668.
26. Malzoni M, Rotond M, Perone C, et al. Fertility after laparoscopic myomectomy of large uterine myomas: operative technique and preliminary results. Eur J Gynaecol Oncol. 2003;24:79-82.
27. Malone L. Myomectomy: recurrence after removal of solitary and multiple myomas. Obstet Gynecol. 1969;34:200-203.
28. Fedele L, Parazzini F, Luchini L, Mezzopane R, Tozzi L, Villa L. Recurrence of fibroids after myomectomy: a transvaginal ultrasonographic study. Hum Reprod. 1995;10:1795-1796.
29. Sesti F, Ticconi C, Bonifacio S, Piccione E. Preoperative administration of recombinant human erythropoietin in patients undergoing gynecologic surgery. Gynecol Obstet Invest. 2002;54:1-5.
30. Wurnig C, Schatz K, Noske H, et al. Collaborative Study Group. Subcutaneous low-dose epoetin beta for the avoidance of transfusion in patients scheduled for elective surgery not eligible for autologous blood donation. Eur Surg Res. 2001;33:303-310.
31. Schlaff WD, Zerhouni EA, Huth JA, Chen J, Damewood MD, Rock JA. A placebo-controlled trial of a depot gonadotropin-releasing hormone analogue (leuprolide) in the treatment of uterine leiomyomata. Obstet Gynecol. 1989;74:856-862.
32. Friedman AJ, Hoffman DI, Comite F, Browneller RW, Miller JD. Treatment of leiomyomata uteri with leuprolide acetate depot: a double-blind, placebo-controlled, multicenter study. The Leuprolide Study Group. Obstet Gynecol. 1991;77:720-725.
33. Letterie GS, Coddington CC, Winkel CA, Shawker TH, Loriaux DL, Collins RL. Efficacy of a gonadotropin-releasing hormone agonist in the treatment of uterine leiomyomata: long-term follow-up. Fertil Steril. 1989;51:951-956.
34. Leather AT, Studd JW, Watson NR, Holland EF. The prevention of bone loss in young women treated with GnRH analogues with “add-back” estrogen therapy. Obstet Gynecol. 1993;81:104-107.
35. Lethaby A, Vollenhoven B, Sowter M. Efficacy of pre-operative gonadotrophin hormone releasing analogues for women with uterine fibroids undergoing hysterectomy or myomectomy: a systematic review. BJOG. 2002;109:1097-1108.
36. Stovall TG, Summitt RL Jr, Bran DF, Ling FW. Outpatient vaginal hysterectomy: a pilot study. Obstet Gynecol. 1992;80:145-149.
37. Marana R, Busacca M, Zupi E, Garcea N, Paparella P, Catalano GF. Laparoscopically assisted vaginal hysterectomy versus total abdominal hysterectomy: a prospective, randomized, multi-center study. Am J Obstet Gynecol. 1999;180:270-275.
38. Wattiez A, Soriano D, Fiaccavento A, et al. Total laparoscopic hysterectomy for very enlarged uteri. J Am Assoc Gynecol Laparosc. 2002;9:125-130.
The author reports no financial relationships relevant to this article.
Part 1 of this article, in the May 2008 issue, discusses how to counsel patients who are found to have a uterine fibroid.
CASE 1 Menorrhagia with anemia
G.L. is a 44-year-old G2P2 who comes to the office for a second opinion on treatment for menorrhagia and a 10-weeks–size fibroid uterus. She reports that her periods last 8 days, and that for 3 of those days she changes a pad once an hour. Her most recent hemoglobin level was 10.2 g/dL. Her regular gynecologist has recommended abdominal hysterectomy. She would like to avoid major surgery and asks about alternatives. What therapies do you tell her are appropriate?
Most women who have uterine fibroids are asymptomatic or mildly symptomatic; they do not require treatment. In one study, 77% of women choosing observation for their fibroids had no significant changes in bleeding, pain, bothersome symptoms, mental health, general health, or activity after 1 year.1 After menopause, fibroids shrink, and the rate of surgery decreases greatly.2 For women such as these, “watchful waiting” may allow them to avoid treatment indefinitely.
For such women as G.L., however, who develop severe anemia from fibroid-related menorrhagia, treatment is necessary. It also is indicated in the rare case of hydro-nephrosis due to obstruction of the ureter(s) by fibroids, or when menorrhagia, pelvic pain or pressure, or urinary frequency or incontinence compromises quality of life.
The distress experienced by women with symptoms such as these can be severe. In one study, women who chose hysterectomy for fibroid-related symptoms assessed their quality of life as worse than that of women who suffered hypertension, heart disease, chronic lung disease, or arthritis.3
Nevertheless, when symptomatic women were offered hysterectomy as a first and sometimes sole treatment, some chose to adapt to symptoms and stop seeking treatment. In fact, hysterectomy is not the only option. A number of alternatives are available, including:
- medical therapy
- the progesterone-releasing IUD
- endometrial ablation
- hysteroscopic, laparoscopic, and abdominal myomectomy
- uterine artery embolization (UAE).4
With the exception of medical therapy, all of these modalities are described here.
- Most uterine fibroids are asymptomatic, require no treatment, and can be managed by watchful waiting.
- Treatment is indicated when fibroids cause severe anemia and when symptoms interfere with quality of life.
- Hysterectomy is not the only treatment option; alternatives include medical therapy, the progesterone-releasing intrauterine system, endometrial ablation, myomectomy (hysteroscopic, laparoscopic, or abdominal), uterine artery embolization (UAE), and focused ultrasound.
- Contraindications to UAE include active genitourinary infection, genital tract malignancy, reduced immune status, severe vascular disease, allergy to intravenous contrast, or impaired renal function. Relative contraindications include large submucous myomas, pedunculated myomas, recent treatment with gonadotropin-releasing hormone agonists, previous iliac or uterine artery occlusion, or postmenopausal status.
- Myomectomy may be considered even for women who have large uterine fibroids who wish to retain their uterus. Surgical techniques available for abdominal or laparoscopic myomectomy make this procedure safe.
- Women who have intractable symptoms and who have not been helped by other therapies may benefit from hysterectomy. Laparoscopic hysterectomy has the benefits of less postoperative pain, shorter hospital stay, and quicker recovery. If a vaginal hysterectomy is feasible, however, there is no benefit to a laparoscopic hysterectomy.
Progesterone-releasing intrauterine system
In a woman who has fibroids no larger than 12-weeks size and a normal uterine cavity, the levonorgestrel-releasing intrauterine system (IUS) (brand name, Mirena) has been shown to substantially reduce menstrual bleeding.5 Within 3 months, 22 of 26 (85%) women with documented menorrhagia treated in this way had normal bleeding and, by 12 months, 40% of all 76 women studied were amenorrheic.
CASE 1 CONTINUED
You perform an office hysteroscopy on G.L., which reveals a 3-cm, type 1 submucosal fibroid, suggesting, by its size, that the levonorgestrel-releasing IUS is unlikely to relieve her bleeding. What other treatments might be appropriate?
Studies show a reduction in bleeding following hysteroscopic resection of submucous fibroids. One hundred ninety-six consecutive women who had menorrhagia and one or more submucous myomas were followed for an average of 73 months after hysteroscopic myomectomy.6 Sixty-eight percent reported “satisfaction and ability to lead a normal life,” and 32% considered results unsatisfactory.
In a report of 285 consecutive women treated with hysteroscopic myomectomy for menorrhagia or metrorrhagia, additional surgery was necessary for 9.5% by 2 years, 10.8% by 5 years, and 26.7% by 8 years.7
Endometrial ablation
In women who do not desire future childbearing, endometrial ablation with or without hysteroscopic myomectomy may be an option. One study that used pad counts as an objective measure found that abnormal bleeding resolved in 48 of 51 women (94%) following endometrial ablation, after an average follow-up of 2 years.8
A study of 33 women who had uterine myomas and total uterine volume smaller than 16-weeks size, and who were followed for a mean of 8 months after Nd:YAG laser ablation of the endometrium, reported amenorrhea in 16 women (49%) and eumenorrhea or hypomenorrhea in the other 17.9
Hydrothermal ablation was used to treat 22 women who had submucous myomas as large as 4 cm in diameter, with 91% reporting amenorrhea, hypomenorrhea, or eumenorrhea after a minimum of 12 months of follow-up.10
Sixty-five women who suffered from menometrorrhagia with hysteroscopically confirmed type I or type II submucous myomas as large as 3 cm had endometrial ablation with the NovaSure System.11 After 1 year, 95% had a reduction in bleeding to a normal degree; 69% had amenorrhea. No intraoperative or postoperative complications occurred.
Uterine artery embolization
UAE appears to be an effective treatment for some women who have fibroids. At the moment, the effect of UAE on premature ovarian failure, fertility, and pregnancy is not clear; most interventional radiologists advise against the procedure for women who want to become pregnant. Although very rare, complications of UAE may necessitate lifesaving hysterectomy, and women who would not accept hysterectomy even under these circumstances should not undergo UAE.
Contraindications to UAE include active genitourinary infection, genital tract malignancy, reduced immune status, severe vascular disease, allergy to intravenous (IV) contrast, or impaired renal function. Relative contraindications include large submucous myomas, pedunculated myomas, recent gonadotropin-releasing hormone (GnRH) agonist treatment, previous iliac or uterine artery occlusion, and postmenopausal status.12
How UAE works
In UAE, a trained interventional radiologist performs percutaneous cannulation of the femoral artery. Embolization of the uterine artery and its branches (FIGURE 1) is accomplished with gelatin sponges, polyvinyl alcohol particles (PVA), or tris-acryl gelatin microspheres under fluoroscopic guidance. Total radiation exposure is equivalent to one to two computed tomography (CT) scans.
Postprocedural pain usually requires pain management in the hospital overnight, but most women are discharged the next day on a nonsteroidal anti-inflammatory drug (NSAID). Most women can return to normal activity in 1 to 3 weeks, although about 5% to 10% of women experience a longer bout of pain.
Postembolization syndrome requires admission for treatment with IV fluids, an NSAID, and pain management. It usually resolves in 48 to 72 hours. Persistent fever should be managed with antibiotics, but a failure to respond to antibiotics may indicate sepsis, indicating the need for aggressive management with hysterectomy. ACOG recommends that women considering UAE have a thorough evaluation with a gynecologist to help facilitate collaboration with the interventional radiologist, and that protocols be in place to establish the responsibility of caring for the patient at all times.13
FIGURE 1 Target: blood supply
Arteriogram showing blood supply to fibroid to be targeted during uterine artery embolization.
What the data show
The largest prospective study of UAE included 555 women, 18 to 59 years old, 40% of whom had required time off from work for fibroid-related symptoms. Three months after UAE, the largest myomas were reduced by a mean of 33%. Menorrhagia had improved in 83%; dysmenorrhea, in 77%; and urinary frequency, in 86%.14 Interestingly, improvement in menorrhagia was not related to pre-UAE uterine volume or the volume reduction attained.
Hysterectomy was performed for complications in 1.5% of women: two for infection, four for persistent postembolization pain, one for prolapsed myoma, and one for continued vaginal bleeding. Of 400 women followed for a mean of 16.7 months, 74% were considered a clinical success.15
More than 50,000 UAE procedures have been performed worldwide. Five deaths have been reported: two from septic shock, one from a pulmonary embolus, and two from uncertain causes. This compares favorably with the mortality of 3 for every 10,000 hysterectomies in a similar group of women, which was reported in the national inpatient sample of the Healthcare Cost and Utilization Project (HCUP) database of the Agency for HealthCare Research and Quality, available at http://hcup.ahrq.gov/HCUPnet.asp.
Effects on fertility
Following UAE, amenorrhea has been reported in 3% of women under 40 but in 41% of women over 50.16 Although normal follicle-stimulating hormone (FSH), estradiol, ovarian volume, and antral follicle counts have been found in most women shortly after UAE, such testing is unable to predict the onset of menopause.
Loss of follicles as a result of misembolization to the ovarian vessels and decreased ovarian perfusion might cause ovarian failure at an earlier age than expected (Robert Vogetzang, MD, personal communication, 2007). Long-term follow-up of women who have had UAE will be necessary to answer this important question.
CASE 1 RESOLVED
G.L. chose hysteroscopic myomectomy and endometrial ablation for her menorrhagia. Twelve months later, she remains amenorrheic.
CASE 2 Large fibroids; options other than hysterectomy?
A.M., a 39-year-old G2P2, complains of pelvic pressure and urinary frequency. On examination, you find a 14-weeks–size fibroid uterus. She has not given up hope for giving birth to one more child, and wants to avoid hysterectomy. Ultrasonography shows two fundal fibroids, both about 7 cm in diameter. A.M. asks what treatment options are available for her. What can you offer this patient?
Abdominal myomectomy
Myomectomy is used less often than hysterectomy. In 1999, when one third of the 598,000 hysterectomies performed annually were performed for fibroids, only 30,000 myomectomies were performed.17
As long ago as 1931, Victor Bonney advocated abdominal myomectomy because he believed that the procedure best served what should be the “ultimate goal of surgical treatment, the restoration and maintenance of physiologic function.” Yet women are still being told that hysterectomy is safer, associated with less blood loss—or that myomectomy is inappropriate because sarcoma may be present. Recent reports do not support these concerns.
Uterine fibroids are extremely common. By age 50, 80% of African-American and 70% of Caucasian women have fibroids.1 Fibroids were the primary indication for surgery in the United States in 1997, accounting for 199,000 hysterectomies and 30,000 myomectomies at a cost of $2.1 billion.1 The costs of alternative surgical therapies, medical treatments, and time away from work or family add significantly to the expense associated with fibroids.2
References
1. Farquhar CM, Steiner CA. Hysterectomy rates in the United States 1990–1997. Obstet Gynecol. 2002;99:229-234.
2. Myers E, Barber M, Couchman G, et al. Management of Uterine Fibroids. AHRQ Evidence Reports. Vol. 1, No. 34. Washington, DC: AHRQ; 2001.
Myomectomy vs hysterectomy
A review of 197 women who underwent myomectomy and 197 women who underwent hysterectomy with similar uterine size (14.4 vs 15.6 weeks) found the risks of hemorrhage, fever, unintended surgical procedures, life-threatening events, and rehospitalization equivalent between the two procedures.18 Women in the hysterectomy group had more surgical blood loss (484 mL vs 227 mL) and suffered more complications (13%), including one cystotomy, one ureteral injury, three bowel injuries, eight cases of ileus, and six cases of pelvic abscess.19
In contrast, only 5% of the myomectomy patients had a complication, which included one cystotomy, two reoperations for small bowel obstruction, and six cases of ileus. The authors concluded that myomectomy is a safe alternative to hysterectomy.
Myomectomy may be feasible even with large fibroids
Abdominal myomectomy may be considered even for women who have large uterine fibroids (FIGURE 2) and who wish to retain their uterus. A study of 91 women who had uterine size larger than 16 weeks (range, 16 to 36 weeks) and underwent abdominal myomectomy reported no instance of conversion to hysterectomy. Complications included one bowel injury, one bladder injury, and one reoperation for bowel obstruction.20
In the past, enlarging fibroids have been deemed an indication that hysterectomy should be performed because leiomyosarcoma may be present. This concern is unfounded. A study of 371 women with a “rapidly growing uterus” found leiomyosarcoma in only one.21
FIGURE 2 Abdominal myomectomy
Myomectomy may be appropriate even for women who have large fibroids who wish to retain their uterus.
Removing large fibroids safely
Surgical techniques available for myomectomy allow safe removal of even large fibroids. Tourniquets and vasoconstrictive substances (vasopressin [off-label use]) may be used to limit blood loss. Continuing the uterine incisions through the myometrium and entire pseudocapsule until the fibroid is clearly seen exposes a less vascular surgical plane, which is deeper than commonly appreciated. Vascular corrosion casting shows that fibroids are totally surrounded by a dense vascular layer and that no distinct “vascular pedicle” exists at the base of the myoma.22
Fibroids that are near dominant fibroids can be removed through the same uterine incision, but avoid tunneling through the myometrium to remove distant fibroids; many myometrial tunnels are hard to close and can continue to bleed. Promptly closing each incision allows immediate hemostasis and, although multiple uterine incisions may be needed, adhesion barriers may help limit formation of adhesions.23
Avoiding heterologous transfusion
Cell-saver technology has been used extensively in orthopedic, cardiac, and neurologic surgery; consider it during myomectomy (or hysterectomy).
The cell saver suctions blood from the operative field and mixes it with heparinized saline. If blood reinfusion is necessary, the blood is washed with saline, filtered, centrifuged to a hematocrit of approximately 50%, and given back to the patient via an IV line. The need for preoperative autologous blood donation or heterologous blood transfusion can therefore often be avoided, eliminating the risk of infection and transfusion reaction.24
Seventy of 91 women who underwent myomectomy for uterine size of 16 to 36 weeks had cell-saver blood reinfused (mean volume, 355 mL); only seven women required heterologous transfusion.20
Laparoscopic myomectomy
Instrumentation makes laparoscopic myomectomy feasible, although the application of this approach is limited by the size and number of fibroids that can be reasonably removed and by the difficulty of laparoscopic suturing. However, a study of 131 women randomized to abdominal and laparoscopic myomectomy for nonpedunculated large myomas (mean diameter, 7 cm) found a higher postoperative hemoglobin level, lower incidence of postoperative fever, and shorter hospital stays with laparoscopic myomectomy.25
A case series of 144 women (largest fibroid, 18 cm [mean, 7.8 cm]) reported that only two (1.4%) women required conversion to laparotomy.26
Myomas do not recur
Once individual myomas are removed, they do not recur, although new myomas may appear. Most women require no additional treatment. If the first myomectomy is performed for one fibroid, 11% of women require subsequent surgery (mean follow-up, 7.6 years). If multiple fibroids are removed initially, 26% require subsequent surgery.27
The appearance of a new myoma may reflect the persistence of fibroids not removed initially—as ultrasonography has demonstrated in 29% of women after myomectomy.28
CASE 2 RESOLVED
A.M. underwent pelvic magnetic resonance imaging, which revealed two 7-cm intramural fibroids and four other intramural fibroids between 2 cm and 4 cm in size. She chose abdominal myomectomy and is now attempting pregnancy.
CASE 3 Patient asks for hysterectomy
S.L. is a 44-year-old G2P2 who complains of missing a few days of work every month because of heavy menstrual bleeding and fatigue. Her hemoglobin level is now 8.2 g/dL. She underwent myomectomy about 10 years ago, successfully followed by two pregnancies, but her uterus is now about 12-weeks size. She is not interested in getting pregnant again and wants to be able to work without bleeding through her clothes. She has explored other options, but has decided to have a hysterectomy. She asks whether laparoscopic supracervical hysterectomy is appropriate for her situation. What do you advise?
Treating preoperative anemia
The first step for this patient is to treat her anemia.
Erythropoietin alfa and epoetin have been shown to increase preoperative hemoglobin concentrations in cardiac, orthopedic, and neurologic surgery. They should be considered more often, when appropriate, before gynecologic surgery.29 A randomized study showed that approximately 15,000 U of epoetin a week for 3 weeks before surgery raised the hemoglobin concentration by 1.6 g/dL and significantly reduced the transfusion rate when compared with controls.30 No side effects were reported.
GnRH agonists have been shown to reduce uterine volume, fibroid volume, and bleeding; these benefits may be limited, however, by side effects and risks. Reduction in uterine size occurs mostly within the first 3 months of treatment; after 6 months, fibroid volume is reduced by 30% and total uterine volume by 35%.31,32 Heavy bleeding responds well to GnRH agonists; in one study, 37 of 38 women had resolution by 6 months.
Side effects generally do not deter treatment
Side effects are common with GnRH agonists: 78% experience hot flushes; 32%, vaginal dryness; and 55%, transient headache. Arthralgia, myalgia, insomnia, emotional lability, and decreased libido are reported less often. However, only 8% of women terminate treatment because of side effects.33
Bone loss is significant after 6 months of a GnRH agonist.34
A Cochrane review found that women who have myomas and who were treated preoperatively with 3 to 4 months of a GnRH agonist had significantly reduced uterine volume and uterine size; an improved preoperative hemoglobin level; and reduced operating times and hospital stay.35 Although operative blood loss was less for both abdominal hysterectomy and abdominal myomectomy patients, there was no significant difference in the transfusion rate.
Hysterectomy
Fibroids were the indication for hysterectomy in 40% of abdominal, 17% of vaginal, and 29% of laparoscopic hysterectomies, according to a review in the United States.17 Women with intractable symptoms who have not been helped by other therapies may benefit from hysterectomy. The Maine Women’s Health Study found that, following hysterectomy (35% of which were performed for myomas) for moderate or severe symptoms, 72% of women felt “much better,” 16% felt a “little better,” and 3% felt worse than they did before surgery.1
Laparoscopic hysterectomy
Either total or supracervical laparoscopic hysterectomy is feasible. Benefits include less postoperative pain, short hospital stay, and quick recovery. However, if a vaginal hysterectomy is feasible, there is no benefit to laparoscopic hysterectomy.36
What the data show
A prospective, randomized, multicenter study concluded that laparoscopic-assisted hysterectomy offered the benefits of less invasive surgery without increased risk.37 Eighty women whose uterus was between 280 g and 700 g were randomized to laparoscopic-assisted vaginal and abdominal hysterectomy. Estimated blood loss, postoperative day 1 hemoglobin level, pain, and hospital stay were all significantly better for the laparoscopic-assisted group. Complications in the abdominal hysterectomy group included one woman who had a cuff hematoma and who required transfusion; one who had bleeding requiring reoperation and transfusion; and five who had fever. The only complication in the laparoscopic group was postoperative fever in two women.
Even large fibroids may benefit from laparoscopy
In experienced hands, the benefits of laparoscopic hysterectomy may extend to women who have large fibroids. A retrospective cohort study compared laparoscopic hysterectomy in 34 women who had a uterine weight greater than 500 g (range, 500 to 1,230 g) with 68 women whose uterus weighed less than 300 g.38 Operating time was significantly shorter in women with smaller uteri, but no difference was observed in complications, blood loss, hospital stay, or recovery, and no patient required conversion to laparotomy.
CASE 3 RESOLVED
S.L. underwent laparoscopic supracervical hysterectomy, which involved a 1-night hospital stay, and returned to work in 2 weeks. She is happy to be free of monthly bleeding and believes she made the right treatment decision.
Just as there are multiple options for removing myomas, so are there multiple coding possibilities for this service. Note that some procedures require special documentation of the clinical circumstances to ensure correct payment and that other treatments may be considered investigational by payers.
Surgical removal of uterine fibroids can be accomplished vaginally (58145), abdominally (58140, 58146), hysteroscopically (58561), and laparoscopically (58545–58546). Except for the hysteroscopic approach, all require documentation of the number and weight of the fibroids, to ensure that payment reflects how much work was done. When five or more fibroids are removed, or when the combined weight of all fibroids removed exceeds 250 g, the CPT codes that represent these services will reimburse at a higher rate. When endometrial ablation is the treatment of choice, you must choose between hysteroscopic (58563) and nonhysteroscopic (58353) methods when selecting a code.
Insertion of the levonorgestrel-releasing intrauterine system (Mirena) requires that you report more than one code. Report insertion 58300 (S4981 for Blue Cross and Blue Shield carriers). Bill for the device itself with J7302, or with J7306 (the system and supplies).
Last, some payers consider uterine artery embolization investigational, even though it has its own CPT code (37210).—MELANIE WITT, RN, CPC-OGS, MA
1. Carlson KJ, Miller BA, Fowler FJ, Jr. The Maine Women’s Health Study: II. Outcomes of nonsurgical management of leiomyomas, abnormal bleeding, and chronic pelvic pain. Obstet Gynecol. 1994;83:566-572.
2. Cramer SF, Marchetti C, Freedman J, Padela A. Relationship of myoma cell size and menopausal status in small uterine leiomyomas. Arch Pathol Lab Med. 2000;124:1448-1453.
3. Rowe MK, Kanouse DE, Mittman BS, Bernstein SJ. Quality of life among women undergoing hysterectomies. Obstet Gynecol. 1999;93:915-921.
4. Parker W. Uterine myomas: management. Fertil Steril. 2007;88:255-271.
5. Grigorieva V, Chen-Mok M, Tarasova M, Mikhailov A. Use of a levonorgestrel-releasing intrauterine system to treat bleeding related to uterine leiomyomas. Fertil Steril. 2003;79:1194-1198.
6. Cravello L. [Indications and modalities of surgical treatment for sub-mucosal myomas]. J Gynecol Obstet Biol Reprod (Paris). 1999;28:748-752.
7. Emanuel MH, Wamsteker K, Hart AA, Metz G, Lammes FB. Long-term results of hysteroscopic myomectomy for abnormal uterine bleeding. Obstet Gynecol. 1999;93:743-748.
8. Indman PD. Hysteroscopic treatment of menorrhagia associated with uterine leiomyomas. Obstet Gynecol. 1993;81:716-720.
9. Lomano J. Endometrial ablation for the treatment of menorrhagia: a comparison of patients with normal, enlarged, and fibroid uteri. Lasers Surg Med. 1991;11:8-12.
10. Glasser MH, Zimmerman JD. The HydroThermAblator system for management of menorrhagia in women with submucous myomas: 12- to 20-month follow-up. J Am Assoc Gynecol Laparosc. 2003;10:521-527.
11. Sabbah R, Desaulniers G. Use of the NovaSure Impedance Controlled Endometrial Ablation System in patients with intracavitary disease: 12-month follow-up results of a prospective, single-arm clinical study. J Minim Invasive Gynecol. 2006;13:467-471.
12. Society of Obstetricians and Gynaecologists of Canada. SOGC clinical practice guidelines. Uterine fibroid embolization (UFE). Number 150, October 2004. Int. J Gynaecol Obstet. 2005;89:305-318.
13. Committee on Gynecologic Practice, American College of Obstetricians and Gynecologists. ACOG Committee Opinion. Uterine artery embolization. Obstet Gynecol. 2004;103:403-404.
14. Pron G, Mocarski E, Bennett J, Vilos G, Common A, Vanderburgh L. Ontario UFE Collaborative Group. Pregnancy after uterine artery embolization for leiomyomata: the Ontario multicenter trial. Obstet Gynecol. 2005;105:67-76.
15. Walker WJ, Pelage JP. Uterine artery embolisation for symptomatic fibroids: clinical results in 400 women with imaging follow up. BJOG. 2002;109:1262-1272.
16. Pron G, Bennett J, Common A, Wall J, Asch M, Sniderman K. The Ontario Uterine Fibroid Embolization Trial. Part 2. Uterine fibroid reduction and symptom relief after uterine artery embolization for fibroids. Fertil Steril. 2003;79:120-127.
17. Farquhar CM, Steiner CA. Hysterectomy rates in the United States 1990-1997. Obstet Gynecol. 2002;99:229-234.
18. Iverson RE, Jr, Chelmow D, Strohbehn K, Waldman L, Evantash EG. Relative morbidity of abdominal hysterectomy and myomectomy for management of uterine leiomyomas. Obstet Gynecol. 1996;88:415-419.
19. Sawin SW, Pilevsky ND, Berlin JA, Barnhart KT. Comparability of perioperative morbidity between abdominal myomectomy and hysterectomy for women with uterine leiomyomas. Am J Obstet Gynecol. 2000;183:1448-1455.
20. West S, Ruiz R, Parker WH. Abdominal myomectomy in women with very large uterine size. Fertil Steril. 2006;85:36-39.
21. Parker WH, Fu YS, Berek JS. Uterine sarcoma in patients operated on for presumed leiomyoma and rapidly growing leiomyoma. Obstet Gynecol. 1994;83:414-418.
22. Walocha JA, Litwin JA, Miodonski AJ. Vascular system of intramural leiomyomata revealed by corrosion casting and scanning electron microscopy. Hum Reprod. 2003;18:1088-1093.
23. Diamond MP. Reduction of adhesions after uterine myomectomy by Seprafilm membrane (HAL-F): a blinded, prospective, randomized, multicenter clinical study. Seprafilm Adhesion Study Group. Fertil Steril. 1996;66:904-910.
24. Yamada T, Ikeda A, Okamoto Y, Okamoto Y, Kanda T, Ueki M. Intraoperative blood salvage in abdominal simple total hysterectomy for uterine myoma. Int J Gynaecol Obstet. 1997;59:233-236.
25. Seracchioli R, Rossi S, Govoni F, et al. Fertility and obstetric outcome after laparoscopic myomectomy of large myomata: a randomized comparison with abdominal myomectomy. Hum Reprod. 2000;15:2663-2668.
26. Malzoni M, Rotond M, Perone C, et al. Fertility after laparoscopic myomectomy of large uterine myomas: operative technique and preliminary results. Eur J Gynaecol Oncol. 2003;24:79-82.
27. Malone L. Myomectomy: recurrence after removal of solitary and multiple myomas. Obstet Gynecol. 1969;34:200-203.
28. Fedele L, Parazzini F, Luchini L, Mezzopane R, Tozzi L, Villa L. Recurrence of fibroids after myomectomy: a transvaginal ultrasonographic study. Hum Reprod. 1995;10:1795-1796.
29. Sesti F, Ticconi C, Bonifacio S, Piccione E. Preoperative administration of recombinant human erythropoietin in patients undergoing gynecologic surgery. Gynecol Obstet Invest. 2002;54:1-5.
30. Wurnig C, Schatz K, Noske H, et al. Collaborative Study Group. Subcutaneous low-dose epoetin beta for the avoidance of transfusion in patients scheduled for elective surgery not eligible for autologous blood donation. Eur Surg Res. 2001;33:303-310.
31. Schlaff WD, Zerhouni EA, Huth JA, Chen J, Damewood MD, Rock JA. A placebo-controlled trial of a depot gonadotropin-releasing hormone analogue (leuprolide) in the treatment of uterine leiomyomata. Obstet Gynecol. 1989;74:856-862.
32. Friedman AJ, Hoffman DI, Comite F, Browneller RW, Miller JD. Treatment of leiomyomata uteri with leuprolide acetate depot: a double-blind, placebo-controlled, multicenter study. The Leuprolide Study Group. Obstet Gynecol. 1991;77:720-725.
33. Letterie GS, Coddington CC, Winkel CA, Shawker TH, Loriaux DL, Collins RL. Efficacy of a gonadotropin-releasing hormone agonist in the treatment of uterine leiomyomata: long-term follow-up. Fertil Steril. 1989;51:951-956.
34. Leather AT, Studd JW, Watson NR, Holland EF. The prevention of bone loss in young women treated with GnRH analogues with “add-back” estrogen therapy. Obstet Gynecol. 1993;81:104-107.
35. Lethaby A, Vollenhoven B, Sowter M. Efficacy of pre-operative gonadotrophin hormone releasing analogues for women with uterine fibroids undergoing hysterectomy or myomectomy: a systematic review. BJOG. 2002;109:1097-1108.
36. Stovall TG, Summitt RL Jr, Bran DF, Ling FW. Outpatient vaginal hysterectomy: a pilot study. Obstet Gynecol. 1992;80:145-149.
37. Marana R, Busacca M, Zupi E, Garcea N, Paparella P, Catalano GF. Laparoscopically assisted vaginal hysterectomy versus total abdominal hysterectomy: a prospective, randomized, multi-center study. Am J Obstet Gynecol. 1999;180:270-275.
38. Wattiez A, Soriano D, Fiaccavento A, et al. Total laparoscopic hysterectomy for very enlarged uteri. J Am Assoc Gynecol Laparosc. 2002;9:125-130.
Purple-red papules on foot
An 88-year-old Caucasian man of Italian ancestry came into our clinic with multiple, painful purple-red “growths” on his left foot that he’d had for several years (FIGURE 1).
The patient had no systemic complaints (no fever, chills, weight loss, night sweats). He had a history of hypertension, a cardiac valve replacement, and chronic back pain (secondary to a motor vehicle accident). He was taking warfarin and nadolol.
The patient had multiple, 0.1– to 0.5-cm purple-red papules and nodules on the dorsal and plantar surfaces of the left foot, with associated moderate lower extremity edema and mottled dyspigmentation.
We did a punch biopsy, which showed a nodular neoplasm composed of moderately plump, spindle-shaped cells in short interweaving fascicles and numerous extravasated erythrocytes in the spaces (“vascular slits”) between the spindle-shaped cells (FIGURE 2).
FIGURE 1
Painful papules and nodules
FIGURE 2
Hematoxylin/eosin stain
What is your diagnosis?
How would you manage this condition?
Diagnosis: Kaposi’s sarcoma
Classic Kaposi’s sarcoma is a rare mesenchymal tumor most often seen in elderly men of Mediterranean or Ashkenazi Jewish origin with an annual incidence in the United States of between 0.02% and 0.06%, with a peak occurring in the 5th to 8th decade of life.1 (Two-thirds of cases develop after the age of 50.) Population-based studies in the United States have shown a male-to-female ratio of 4:1.1
First described by the Hungarian dermatologist Moritz Kaposi in 1872, Kaposi’s sarcoma assumed prominence during the emerging HIV epidemic and is now the most common tumor in patients with acquired immune deficiency syndrome (AIDS).2
Recent research has implicated the human herpes virus–8 (HHV–8) as an inductive agent (necessary though not sufficient) in all epidemiologic subsets of the disease.2
There are 4 principal clinical variants of Kaposi’s sarcoma:
- classic (or chronic),
- African endemic (includes childhood lymphadenopathic),
- transplant-associated, and
- AIDS-related.
What you’ll see
Clinically, classic Kaposi’s sarcoma often first manifests as blue-red, well-demarcated, painless macules confined to the distal lower extremities.3 These slow-growing lesions may enlarge to forms papules and plaques, or progress to nodules and tumors. Unilateral involvement is often observed at the outset of the disease, with potential centripetal spread occurring late-in-course.3
Early lesions are generally soft, spongy, and “angiomatous,” while in the advanced state, lesional skin becomes hard, solid, and brown in color.3 Edema of the surrounding tissue is common. In addition to the skin, classic Kaposi’s sarcoma also involves mucosal sites (especially the oral and gastrointestinal mucosae).
Differential includes melanocytic nevus
A differential diagnosis for classic Kaposi’s sarcoma includes stasis dermatitis (“acroangiodermatitis”), melanocytic nevus, pyogenic granuloma, hemangioma, granuloma annulare, arthropod assault, and dermatofibroma/dermatofibrosarcoma protuberans (DF/DFSP).
Melanocytic nevi, pyogenic granuloma, hemangioma, granuloma annulare, and DF/DFSP ordinarily feature single lesions, while Kaposi’s sarcoma has multiple lesions. An arthropod assault is pruritic, and stasis dermatitis typically has dilated/varicose veins.
Histology will confirm your suspicions
While epidemiological and clinical factors may suggest classic Kaposi’s sarcoma, a final diagnosis ultimately rests on confirmatory histology. The pathology of classic Kaposi’s sarcoma (like all of the variant subtypes) is based solely on stage of the lesion.
Early patch-stage lesions exhibit papillary dermal proliferation of small, angulated vessels lined by bland endothelial cells with an accompanying sparse infiltrate of lymphocytes and plasma cells.
As the disease progresses to the plaque stage, the vascular proliferation expands into the reticular dermis and subcutis. The transition to nodular Kaposi’s sarcoma develops when a population of spindle cells expressing endothelial markers occurs between the “vascular slits” (FIGURE 2).
Chemotherapy for rapidly progressive disease
There is minimal evidence-based data for the treatment of Kaposi’s sarcoma. Treatment options for limited disease include surgical excision, cryotherapy, laser ablation, topical retinoids (alitretinoin), interferon-alpha, and radiation.1
If rapidly progressive disease (>10 new lesions per month) exists, the most effective treatment remains systemic chemotherapy (vincristine, doxorubicin, vinblastine,4 bleomycin,4 or paclitaxel5). The benefits of chemotherapy can last for months—and even years.
Liquid nitrogen cryotherapy does the trick
We treated our patient with liquid nitrogen cryotherapy that was applied at regular 4- to 6-week intervals over several months. After 3 months, our patient’s lesions were nearly resolved. We followed him monthly thereafter.
Correspondence
John Patrick Welsh, MD, Associates in Dermatology, 4727 Friendship Avenue, Suite 300, Pittsburgh, PA 15224-1778; [email protected].
1. Iscovich J, Boffetta P, Franceschi S, Azizi E, Sarid R. Classic Kaposi sarcoma: epidemiology and risk factors. Cancer. 2000;88:500-517.
2. Pellet C, Kerob D, Dupuy A, et al. Kaposi’s sarcoma-associated herpesvirus viremia is associated with the progression of classic and endemic Kaposi’s sarcoma. J Invest Dermatol. 2006;126:621-627.
3. Schwartz R. Kaposi’s sarcoma: an update. J Surg Oncol. 2004;87:146-151.
4. Brambilla L, Miedico A, Ferrucci S, et al. Combination of vinblastine and bleomycin as first line therapy in advanced classic Kaposi’s sarcoma. J Eur Acad Dermatol Venereol. 2006;20:1090-1094.
5. Baskan EB, Tunali S, Adim SB, et al. Treatment of advanced classic Kaposi’s sarcoma with weekly low-dose paclitaxel therapy. Int J Dermatol. 2006;45:1441-1443.
An 88-year-old Caucasian man of Italian ancestry came into our clinic with multiple, painful purple-red “growths” on his left foot that he’d had for several years (FIGURE 1).
The patient had no systemic complaints (no fever, chills, weight loss, night sweats). He had a history of hypertension, a cardiac valve replacement, and chronic back pain (secondary to a motor vehicle accident). He was taking warfarin and nadolol.
The patient had multiple, 0.1– to 0.5-cm purple-red papules and nodules on the dorsal and plantar surfaces of the left foot, with associated moderate lower extremity edema and mottled dyspigmentation.
We did a punch biopsy, which showed a nodular neoplasm composed of moderately plump, spindle-shaped cells in short interweaving fascicles and numerous extravasated erythrocytes in the spaces (“vascular slits”) between the spindle-shaped cells (FIGURE 2).
FIGURE 1
Painful papules and nodules
FIGURE 2
Hematoxylin/eosin stain
What is your diagnosis?
How would you manage this condition?
Diagnosis: Kaposi’s sarcoma
Classic Kaposi’s sarcoma is a rare mesenchymal tumor most often seen in elderly men of Mediterranean or Ashkenazi Jewish origin with an annual incidence in the United States of between 0.02% and 0.06%, with a peak occurring in the 5th to 8th decade of life.1 (Two-thirds of cases develop after the age of 50.) Population-based studies in the United States have shown a male-to-female ratio of 4:1.1
First described by the Hungarian dermatologist Moritz Kaposi in 1872, Kaposi’s sarcoma assumed prominence during the emerging HIV epidemic and is now the most common tumor in patients with acquired immune deficiency syndrome (AIDS).2
Recent research has implicated the human herpes virus–8 (HHV–8) as an inductive agent (necessary though not sufficient) in all epidemiologic subsets of the disease.2
There are 4 principal clinical variants of Kaposi’s sarcoma:
- classic (or chronic),
- African endemic (includes childhood lymphadenopathic),
- transplant-associated, and
- AIDS-related.
What you’ll see
Clinically, classic Kaposi’s sarcoma often first manifests as blue-red, well-demarcated, painless macules confined to the distal lower extremities.3 These slow-growing lesions may enlarge to forms papules and plaques, or progress to nodules and tumors. Unilateral involvement is often observed at the outset of the disease, with potential centripetal spread occurring late-in-course.3
Early lesions are generally soft, spongy, and “angiomatous,” while in the advanced state, lesional skin becomes hard, solid, and brown in color.3 Edema of the surrounding tissue is common. In addition to the skin, classic Kaposi’s sarcoma also involves mucosal sites (especially the oral and gastrointestinal mucosae).
Differential includes melanocytic nevus
A differential diagnosis for classic Kaposi’s sarcoma includes stasis dermatitis (“acroangiodermatitis”), melanocytic nevus, pyogenic granuloma, hemangioma, granuloma annulare, arthropod assault, and dermatofibroma/dermatofibrosarcoma protuberans (DF/DFSP).
Melanocytic nevi, pyogenic granuloma, hemangioma, granuloma annulare, and DF/DFSP ordinarily feature single lesions, while Kaposi’s sarcoma has multiple lesions. An arthropod assault is pruritic, and stasis dermatitis typically has dilated/varicose veins.
Histology will confirm your suspicions
While epidemiological and clinical factors may suggest classic Kaposi’s sarcoma, a final diagnosis ultimately rests on confirmatory histology. The pathology of classic Kaposi’s sarcoma (like all of the variant subtypes) is based solely on stage of the lesion.
Early patch-stage lesions exhibit papillary dermal proliferation of small, angulated vessels lined by bland endothelial cells with an accompanying sparse infiltrate of lymphocytes and plasma cells.
As the disease progresses to the plaque stage, the vascular proliferation expands into the reticular dermis and subcutis. The transition to nodular Kaposi’s sarcoma develops when a population of spindle cells expressing endothelial markers occurs between the “vascular slits” (FIGURE 2).
Chemotherapy for rapidly progressive disease
There is minimal evidence-based data for the treatment of Kaposi’s sarcoma. Treatment options for limited disease include surgical excision, cryotherapy, laser ablation, topical retinoids (alitretinoin), interferon-alpha, and radiation.1
If rapidly progressive disease (>10 new lesions per month) exists, the most effective treatment remains systemic chemotherapy (vincristine, doxorubicin, vinblastine,4 bleomycin,4 or paclitaxel5). The benefits of chemotherapy can last for months—and even years.
Liquid nitrogen cryotherapy does the trick
We treated our patient with liquid nitrogen cryotherapy that was applied at regular 4- to 6-week intervals over several months. After 3 months, our patient’s lesions were nearly resolved. We followed him monthly thereafter.
Correspondence
John Patrick Welsh, MD, Associates in Dermatology, 4727 Friendship Avenue, Suite 300, Pittsburgh, PA 15224-1778; [email protected].
1. Iscovich J, Boffetta P, Franceschi S, Azizi E, Sarid R. Classic Kaposi sarcoma: epidemiology and risk factors. Cancer. 2000;88:500-517.
2. Pellet C, Kerob D, Dupuy A, et al. Kaposi’s sarcoma-associated herpesvirus viremia is associated with the progression of classic and endemic Kaposi’s sarcoma. J Invest Dermatol. 2006;126:621-627.
3. Schwartz R. Kaposi’s sarcoma: an update. J Surg Oncol. 2004;87:146-151.
4. Brambilla L, Miedico A, Ferrucci S, et al. Combination of vinblastine and bleomycin as first line therapy in advanced classic Kaposi’s sarcoma. J Eur Acad Dermatol Venereol. 2006;20:1090-1094.
5. Baskan EB, Tunali S, Adim SB, et al. Treatment of advanced classic Kaposi’s sarcoma with weekly low-dose paclitaxel therapy. Int J Dermatol. 2006;45:1441-1443.
How to make exercise counseling more effective: Lessons from rural America
- To help overweight patients and those with a sedentary lifestyle to adopt and stick with an exercise regimen, develop a detailed and realistic plan with their help, and follow up with them periodically to see how they’re doing.
Purpose: Exercise counseling by primary care physicians has been shown to improve physical activity in patients. However, the prevalence and effectiveness of physician counseling is unknown in rural populations that are at increased risk for chronic diseases.
Methods: Using a population-based telephone survey at baseline and again at 1-year follow-up, we assessed physical activity behavior among 1141 adults (75% female, 95% white) living within 12 rural communities of Missouri, Tennessee, and Arkansas. We tested the association between physician counseling and patients meeting current physical activity recommendations using logistic regression analysis controlling for demographic variables.
Results: Participants who saw a doctor for regular care were 54% more likely to be physically active (adjusted odds ratio [aOR]=1.54; 95% confidence interval [CI], 1.04-2.28). Overweight adults (body mass index [BMI]=25-29.9 kg/m2) who had been advised by their physician to exercise more were nearly 5 times more likely to meet physical activity recommendations if their doctor helped develop an exercise plan (aOR=4.99; 95% CI, 1.69-14.73).
Overweight individuals who received additional follow-up with the exercise plan from their doctor had a 5½-fold increase in likelihood of meeting physical activity recommendations (P<.05).
In the overall sample, patients were significantly more likely to initiate (P=.01) and maintain (P=.002) physical activity when the physician prescribed and followed up on an exercise plan.
Conclusion: This longitudinal study provides evidence that exercise counseling is most effective when the physician presents the counseling as a plan or prescription and when he or she follows up with the patient on it.
Simply telling sedentary patients that they need to exercise may not help them much. If the goal is to inspire action, a more effective approach would be to help them devise a plan for exercise and then inquire periodically about how it’s going. That premise was the basis for our study.
There’s good reason to get your patients moving
Physical inactivity is an independent risk factor for the most prevalent chronic diseases, including obesity, cardiovascular disease, and type 2 diabetes. Physical activity at moderate or vigorous intensities reduces stress and depressive symptoms, controls high blood pressure and cholesterol levels, improves sleep, reduces or reverses weight gain, and prevents or controls chronic diseases.1 Based on these benefits, all physicians are encouraged to counsel sedentary patients to increase activity levels.2
National disease prevention objectives of Healthy People 2010 call for physicians to counsel at-risk patients on health behaviors such as physical activity and diet.3 Knowledge of patients’ families, environments, and communities makes primary care physicians uniquely suited to give effective advice,4 and physician counseling is known to positively influence patients’ health-related behavior.5-12
To date, findings on counseling effectiveness have been mixed. Unfortunately, previous controlled trials of primary care physicians counseling adult patients on physical activity have varied in quality and yielded mixed results.13 Therefore, in its Guide to Clinical Preventive Services, the US Preventive Services Task Force did not recommend for or against behavioral counseling in primary care settings to promote physical activity.14 The guidelines state that existing studies do not provide a clear picture of which counseling components are effective.13
A population-based study by Glasgow and colleagues suggests that follow-up support by the physician may be needed to change physical activity behavior. Generalizations were limited, though, by the cross-sectional study design and post hoc analysis.15
More research is also needed to determine which strategies help patients stay physically active, a necessary component to sustaining the health benefits of exercise.16 Unfortunately, few primary care physicians counsel overweight or inactive patients on the benefits of diet and physical activity, let alone assist them with long-term follow-through.7,8,11,16-18
Why we chose to study a rural population
Rural Americans are among the groups at highest risk for chronic diseases. On average they are older, less educated, and poorer than their urban counterparts.19,20 And rural residents walk 13% less than suburbanites.21 According to the Rural Healthy People 2010 survey, 5 of the top 10 health concerns are chronic conditions that can be prevented or ameliorated with adequate physical activity.22
Studies have shown that healthy adults believe their health care providers are a credible source of information, and that they are motivated to comply with physician advice.23 Nondisabled adults believe their physicians want them to be physically active.19 However, to our knowledge, no study has examined the effects of physician counseling on physical activity behavior for patients at increased risk for chronic diseases in rural areas.
Our objectives. The first objective of this study was to identify the prevalence of specific components of physician counseling in a tri-state sample of at-risk, rural adults using telephone survey data. A second objective was to measure the longitudinal relationship between physician counseling and physical activity.
Methods
The Saint Louis University Institutional Review Board approved this study.
Study population and design
This study reports on baseline and 1-year follow-up telephone survey data collected as part of a larger 3-year intervention study in 12 rural communities from Missouri (6), Tennessee (4), and Arkansas (2). Project WOW (Walk the Ozarks to Wellness) aims to promote walking among overweight rural adults by integrating individual, interpersonal, and community-level interventions. Methods and details of the intervention are described in detail elsewhere.24 The target communities ranged in population from 766 to 12,993 adults, and in geographic area from 1.4 to 16.1 square miles.25
At baseline in the summer of 2003, we used a modified version of the Behavioral Risk Factor Surveillance System (BRFSS) interview protocol26,27 and randomly dialed telephone numbers to recruit participants residing within a 2-mile radius of a walking trail. In all, 2470 English-speaking adults, ages 18 and older, completed the baseline survey (65.2% response rate).28 Sampling was proportionate to community size.
At follow-up in the summer of 2004, participants identified at baseline completed the same telephone survey used a year earlier. This time, 1531 participants completed the survey (62.0% response rate).28
Demographic variables included age, sex, education, race/ethnicity, and annual combined household income (TABLE 1). Overweight and obesity, based on self-reported height and weight, were defined by a body mass index (BMI) of 25 to 29.9 kg/m2 and 30 kg/m2 or greater, respectively.
TABLE 1
The population sample
| PATIENT CHARACTERISTICS | FOLLOW-UP SURVEY (N =1141) % |
|---|---|
| Female | 74.6 |
| White, non-Hispanic | 94.6 |
| Education | |
| Less than high school | 9.7* |
| High school graduate | 30.8 |
| Some college | 23.9 |
| College graduate | 35.6 |
| Age | |
| 18-24 | 6.4* |
| 25-44 | 35.4 |
| 45-64 | 39.1 |
| 65+ | 19.1 |
| Annual household combined income (n=1102) | |
| < $25,000 31.7* | |
| ‡ $25,000 | 68.3 |
| Body mass index (n=1107) | |
| Normal (<25) | 43.7 |
| Overweight (25-29.9) | 31.5 |
| Obese (‡ 30) | 24.8 |
| Physician encounters/counseling | |
| Has doctor for regular care | 87.8* |
| In usual year, has seen doctor ≤1 time | 28.2* |
| Has been advised to exercise more | 35.1 |
| Doctor helped develop plan to exercise more | 33.8 |
| Doctor followed up on plan to exercise more | 46.3 |
| * Significant P value <.001 between responders and nonresponders at 1-year follow-up. | |
Measurement of dependent and independent variables
The survey instrument incorporated questions from the BRFSS, as well as questions developed by researchers from San Diego; Sumter County, South Carolina; and St. Louis.29-34 Psychometric properties of the questions and scales are reported elsewhere.35 The survey instrument contained 106 questions, including skip patterns; the average administration time was 34 minutes.
We assessed physician counseling about exercise with 5 questions from the survey (TABLE 2). These questions were modeled on the “4 As” counseling approach (Ask, Advise, Assist, and Arrange follow-up) recommended by the National Cancer Institute36 and used in a previous, similar BRFSS-based telephone survey.15 The questions were:
- Do you have a doctor whom you see for regular health care?
- In a usual year, how often do you see your doctor?
- Have you been advised within the last year by a doctor to exercise more?
- Has your doctor helped you to develop a plan to increase exercise?
- Has your doctor followed up with you at subsequent visits to see how you increased exercise?
We administered the questions at baseline and at follow-up. For our analyses, we used patient reports of physician counseling at 1-year follow-up, which covered all counseling received in the past 12 months.
We considered respondents to have met recommendations for physical activity if they had engaged in prescribed moderate or vigorous physical activities, or had walked for exercise 150 minutes a week.
Moderate physical activity was defined (according to the current CDC recommendations) as 30 cumulative minutes of moderate-intensity activity (brisk walking or jogging) at least 5 days per week.1
Vigorous physical activity was defined as 20 minutes of vigorous-intensity activity (running) at least 3 days per week.1
The sample was limited to participants who completed the baseline and follow-up surveys, and who reported at follow-up that they had no physical impairment that prevented walking (n=1141).
Statistical analysis
To evaluate how physician counseling would change a patient’s physical activity between baseline and 1-year follow-up, we used multivariate logistic regression analysis. In accordance with the questions asked in the survey, we defined 5 potential predictors of a patient’s decision to start exercising and keep exercising:
- Patient has seen a doctor for regular care.
- In a usual year, patient has seen a doctor once or less.
- Patient has been advised to exercise more.
- Doctor helped develop a plan to exercise more.
- Doctor followed up on plan to exercise more
For every patient who met physical activity recommendations at the 1-year follow-up, we performed regression analysis on each of these 5 measures, adjusting for baseline physical activity and potential confounders of age, education, and sex. This method allowed us to examine the independent effect of physician counseling on physical activity at 1-year follow-up.
The number of respondents analyzed differed according to the measure being examined. For example, we included all respondents in analyzing the effect of visit frequency and the effect of being advised to exercise more (n=1141). However, only those respondents who reported being advised to exercise more were included in the analyses of a physician helping to develop an exercise plan and physician follow-up in supporting exercise behavior (n=402).
To determine whether physician counseling was consistent across BMI categories and income (dichotomized at $25,000), we performed stratified analyses on the multilevel logistic regressions.
TABLE 2
What increased the likelihood of exercise? Regular medical care, a physician-assisted exercise plan, and physician follow-up (n=1141)
| PHYSICIAN ENCOUNTERS/COUNSELING | PATIENTS MEETING PHYSICAL ACTIVITY RECOMMENDATIONS | |
|---|---|---|
| aOR* | 95% CI | |
| 1. Do you have a doctor whom you see for regular health care? | ||
| Yes | 1.54 | 1.04-2.28 |
| No | Ref | |
| 2. In a usual year, how often do you see your doctor? | ||
| Once a year or less | 1.41 | 1.02-1.95 |
| Twice a year or more | Ref | |
| 3. Have you been advised within the last year by a doctor to exercise more? | ||
| Yes | 0.68 | 0.52-0.90 |
| No | Ref | |
| Of those advised to exercise more (n=402): 4. Has your doctor helped you to develop a plan to increase exercise? | ||
| Yes | 1.93 | 1.19-3.15 |
| No | Ref | |
| 5. Has your doctor followed up with you at subsequent visits to see how you increased exercise? | ||
| Yes | 2.84 | 1.78-4.53 |
| No | Ref | |
| aOR, adjusted odds ratio; CI, confidence interval; Ref, reference group. | ||
| *Adjusted for sex, age, educational attainment, and baseline physical activity. | ||
Results
The final cohort consisted of 1141 adults (TABLE 2). Those who did not respond to the follow-up survey were significantly more likely to be younger (P<.001), have less than a high school education (P<.001), and have an annual household combined income <$25,000 (P<.001). Those completing the follow-up survey were more likely to have a doctor for regular care (P<.001), although they saw their doctor, on average, significantly less per year than nonrespondents (P<.001).
Ninety percent of the cohort sample reported having a doctor whom they saw for regular care. Within the last year, 35% had been advised by their doctor to exercise more. Of those who had been so advised, 34% received help from their physician in developing a plan to increase exercise, and 46% were queried at subsequent visits as to how they were progressing with their exercise program.
After adjusting for age, sex, education, and baseline physical activity, we found that those who had a doctor for regular care were 54% more likely to be physically active than those who reported not having a doctor for regular care (aOR=1.54; 95% CI, 1.04-2.28). If the advising physician also developed a plan with the patient to increase exercise, there was nearly a 2-fold increase in physical activity compared with those who received only advice to exercise more (aOR=1.93; 95% CI, 1.19-3.15). If the physician followed up with the exercise plan at subsequent visits, the likelihood of physical activity increased further (aOR=2.84; 95% CI, 1.78-4.53) compared with those who did not receive follow-up from the physician.
Results of stratified analysis by BMI status are shown in TABLE 3. Individuals at normal weight were significantly more likely to be physically active if they had a physician for regular care (aOR=2.76; 95% CI, 1.49-5.13). Overweight adults (BMI 25-29.9 kg/m2) who had been advised by their physician to exercise more were significantly more likely to attain recommended levels of physical activity if their doctor helped develop an exercise plan than were those given more general advice about exercise (aOR=4.99; 95% CI, 1.69-14.73). Overweight individuals who received further counseling with follow-up inquiries were 5.64 times more likely to be physically active (95% CI, 2.10-15.17). A physician-developed exercise plan did not appreciably improve physical activity in obese adults (BMI ≥30 kg/m2); however, benefit in this group was demonstrated when physicians prescribed and followed up with the exercise plan (aOR=2.13; 95% CI, 1.10-4.12). Stratified analysis by income status provided no clear pattern (data not shown).
TABLE 3
What role does BMI play in patients achieving activity goals? (n=1107)
| PHYSICIAN ENCOUNTERS/COUNSELING | PATIENTS MEETING PHYSICAL ACTIVITY RECOMMENDATIONS* (aOR [95% CI]) | ||
|---|---|---|---|
| NORMAL (BMI<25) | OVERWEIGHT (BMI 25-29.9) | OBESE (BMI ≥30) | |
| Has seen a doctor for regular care | 2.76 (1.49-5.13) | 1.08 (0.51-2.29) | 1.34 (0.62-2.91) |
| In a usual year, has seen a doctor ≤1 time | 1.98 (1.13-3.47) | 0.95 (0.54-1.68) | 0.95 (0.47-1.92) |
| Has been advised to exercise more | 1.02 (0.56-1.85) | 0.75 (0.46-1.25) | 0.77 (0.46-1.31) |
| Doctor helped develop a plan to exercise more | 0.69 (0.22-2.18) | 4.99 (1.69-14.73) | 1.76 (0.87-3.56) |
| Doctor followed up on plan to exercise more | 2.59 (0.80-8.36) | 5.64 (2.10-15.17) | 2.13 (1.10-4.12) |
| aOR, adjusted odds ratio; BMI, body-mass index; CI, confidence interval. | |||
| *Adjusted for sex, age, educational attainment, and baseline physical activity. | |||
Discussion
Findings from our analyses support the need for more detailed and more frequent exercise counseling (including follow-up) by rural primary care physicians. In our study, physicians’ counsel was most effective when presented as a plan or prescription that was followed up with periodic inquiries. Patients’ initiation and maintenance of physical activity were significantly associated with physicians’ follow-up of exercise plans. Those who were merely “advised” to exercise more were less likely to meet physical activity recommendations. This illustrates the importance of detailed physician counseling over simple advice to exercise more.
Over 80% of normal-weight individuals, who comprised more than 40% of the sample, reported that their physician had not suggested they exercise more. There are many possible explanations for these reports. Rural populations are relatively isolated and slow to adopt changes. Thus patients may be unaware of new recommendations for physical activity and their significant benefit for disease prevention, and therefore unlikely to discuss such matters with their physician. Physicians also may perceive normal-weight individuals as healthy regardless of their actual health behaviors. On the other hand, 1 study showed that patients with disease risk factors (eg, high cholesterol, elevated BMI) were more likely to be counseled on preventive health behaviors.37
With overweight patients, who are at increased risk of developing chronic diseases, physician counseling strengthened their resolve significantly. Overweight individuals who received directives from their physician (a plan to increase exercise and subsequent follow-up) were 5½ times more likely to be physically active than those who received less counseling.
Obese patients did not receive counseling as often as overweight patients, or benefit from it as much when given, perhaps due to the presence of comorbidities. However, many studies show that regardless of BMI status, physical activity reduces all-cause mortality.38-41
Interestingly, our results showed that seeing a doctor less than once a year was associated with increases in physical activity. Patients who see their physician once a year may be going for annual wellness exams, providing more opportunity to discuss health behavior.
Overall, patients are counseled less often/thoroughly than needed. Our findings agree with those of a previous statewide study that used Missouri BRFSS data to assess the extent to which overweight or physically inactive people received advice from their physicians concerning these risk factors.42 Although most Missouri residents who were overweight or inactive reported seeing their physician within the past year, less than half said their doctors advised them to alter their risk behavior(s).42 Our findings are also consistent with a recent nationwide study by Ma and colleagues that focused on adults with obesity, diabetes, or other related conditions.43 Participants from across the United States reported receiving counseling for physical activity in <30% of visits to private physician offices and hospital outpatient departments.43
Our study was unique in that it examined a tri-state sample of the nation’s rural population for both evidence and effectiveness of physician counseling. It is one of very few studies using a longitudinal design, strengthening the associations found. Causality is limited, however, due to the multifaceted design of the intervention program from which the data were obtained. Future research should evaluate varying degrees of physician counseling and other indirect measures of its impact.
Limitations of the study
Our observational cohort design and the large, randomly selected sample resulted in fewer limitations than were seen with previous similar studies. However, our study had several limitations.
- Recall bias may be present. We assessed counseling with patient memory alone; we made no attempts to interview physicians or audit charts.
- Self-reported height and weight data tend to underestimate the prevalence of obesity.44,45 Resultant misclassification of overweight subjects as being at normal weight could have skewed the stratified analysis.
- The external validity of the physician-counseling questions we used has not been formally confirmed. Given the demographics of the analytic sample (ie, mostly female, white, low income), it would be appropriate to generalize our findings only to similar, rural populations.
Barriers to counseling, and means of removing them
Primary care physicians—rural or urban—are no doubt aware of the health risks associated with physical inactivity. However, the barriers physicians face in counseling at-risk patients overwhelm most efforts. These barriers include lack of time, inadequate provider counseling skills and training, perceived ineffectiveness and nonadherence, patient comorbidities, and lack of organizational support and reimbursement.46-48
Intervention programs and tools have been developed to help health care providers overcome time, skill, and training barriers. These programs, available even to rural providers, have proven effective.49,50 (Go to www.paceproject.org/Home.html and click on “Projects” to learn about the PACE program.) However, application of such skills and tools may be more successful if training is incorporated into medical school curricula and residency training programs rather than through CME endeavors.49 This would require medical institutions and organizations to prioritize the direct link between healthy lifestyle behaviors and disease prevention and the vital role physicians play in underscoring this link.
Finally, health care policy makers and systems must be persuaded to address the lack of organizational support and reimbursement that prevents physicians from counseling at-risk patients on unhealthy lifestyle behaviors. Responsible payers and providers should aggressively explore low-cost ways to promote physical activity and weight loss in primary care settings, to stem the tide of obesity-related chronic diseases. At the local level, physicians can team up to support policies that may enhance preventive counseling efforts2—increasing access to places for activity, encouraging physical activity programming in communities, schools, and organizations, and physical environment enhancements such as safe sidewalks, adequate lighting, and improved zoning.44,51,44,52
Acknowledgments
We thank the communities that are participating in the ongoing intervention study. For their assistance in data collection, we thank the Department of Health Management and Informatics, Behavioral Risk Research Unit at the University of Missouri, Columbia.
Funding/support
This study was funded through the National Institutes of Health grant NIDDK #5 R18 DK061706 and the Centers for Disease Control and Prevention contract U48/CCU710806 (Centers for Research and Demonstration of Health Promotion and Disease Prevention). Human subjects approval was obtained from the Saint Louis University Institutional Review Board.
Correspondence
Sarah L. Lovegreen, MPH, Prevention Research Center and Department of Community Health, Saint Louis University School of Public Health, 3545 Lafayette Ave., Salus Center, Suite 300, St. Louis, MO 63146; slove [email protected].
1. US Department of Health and Human Services. Physical Activity and Health: A report of the surgeon general. Atlanta, GA: US Department of Health and Human Services, Centers for Disease Control and Prevention National Center for Chronic Disease Prevention and Health Promotion, 1996.
2. Chakravarthy MV, Joyner MJ, Booth FW. An obligation for primary care physicians to prescribe physical activity to sedentary patients to reduce the risk of chronic health conditions. Mayo Clin Proc 2002;77:165-173.
3. US. Department of Health and Human Services. Health People 2010: Understanding and Improving Health. 2nd ed. Washington, DC: U.S. Government Printing Office, November 2000.
4. Iverson D, Fielding J, Crow R, Christenson G. The promotion of physical activity in the U.S. population: the status of programs in medical, worksite, community, and school settings. Public Health Rep 1985;100:212-224.
5. Kreuter MW, Chheda SG, Bull FC. How does physician advice influence patient behavior? Evidence for a priming effect. Arch Fam Med 2000;9:426-433.
6. The Writing Group for the Activity Counseling Trial Research Group. Effects of physical activity counseling in primary care: the Activity Counseling Trial: a randomized controlled trial. JAMA 2001;286:677-687.
7. Galuska DA, Will JC, Serdula MK, Ford ES. Are health care professionals advising obese patients to lose weight? JAMA 1999;282:1576-1578.
8. Calfas KJ, Long BJ, Sallis JF, Wooten WJ, Pratt M, Patrick K. A controlled trial of physician counseling to promote the adoption of physical activity. Prev Med 1996;25:225-233.
9. Sallis JF, Patrick K, Calfas KJ. Counseling patients/clients about physical activity and nutrition. Weight Control Digest 1999;9:843, 846-850.
10. Calfas KJ, Zabinski MF, Rupp J. Practical nutrition assessment in primary care settings: a review. Am J Prev Med. 2000;18:289-299.
11. Marcus BH, Goldstein MG, Jette A, et al. Training physicians to conduct physical activity counseling. Prev Med 1997;26:382-388.
12. Godin R, Shephard RJ. An evaluation of the potential role of the physician in influencing community exercise behavior. Am J Health Prom 1990;4:255-259.
13. Eden KB, Orleans CT, Mulrow CD, Pender NJ, Teutsch SM. Does counseling by clinicians improve physical activity? A summary of the evidence for the U.S. Preventive Services Task Force. Ann Intern Med 2002;137:208-215.
14. US. Preventive Services Task Force. Behavioral Counseling in Primary Care to Promote Physical Activity: Recommendations and Rationale. Rockville, MD: Agency for Healthcare Research and Quality; July 2002. Available at: http://www.ahrq.gov/clinic/3rduspstf/physactivity/physactrr.htm. Accessed April 24, 2008.
15. Glasgow RE, Eakin EG, Fisher EB, Bacak SJ, Brownson RC. Physician advice and support for physical activity: results from a national survey. Am J Prev Med 2001;21:189-196.
16. Marcus BH, Dubbert PM, Forsyth LH, et al. Physical activity behavior change: issues in adoption and maintenance. Health Psychol 2000;19(1 suppl):32-41.
17. Stafford RS, Farhat JH, Misra B, Schoenfeld DA. National patterns of physician activities related to obesity management. Arch Fam Med 2000;9:631-638.
18. Potter MB, Vu JD, Croughan-Minihane M. Weight management what patients want from their primary care physician. J Fam Pract 2001;50:513-518.
19. Sobal J, Troiana RP, Frongillo EA, Jr. Rural-urban differences in obesity. Rural Sociol 1996;2:289-305.
20. Miller MK, Stokes CS, Clifford WB. A comparison of the rural-urban mortality differential for deaths from all causes, cardiovascular disease and cancer. J Rural Health 1987;3(2):23-34.
21. Eyler AA, Brownson RC, Bacak SJ, Housemann RA. The epidemiology of walking for physical activity in the United States. Med Sci Sports Exerc 2003;35:1529-36.
22. Gamm L, Hutchison L, Bellamy G, et al. Rural healthy people 2010: identifying rural health priorities and models for practice. J Rural Health 2002;18(1):9-14.
23. Schappert SM. National ambulatory medical care survey: 1991 Summary. Hyattsville, MD: US Department of Health and Human Services. Public Health Service, Centers for Disease Control and Prevention, National Center for Health Statistics; 1993.
24. Brownson R, Hagood L, Lovegreen S, et al. A multilevel, ecological approach to promoting walking in rural communities. Prev Med 2005;41:837-842.
25. US. Census Bureau. Census 2000. Available at: http://www.census.gov/main/www/cen2000.html. Accessed November 2004.
26. Gentry EM, Kalsbeek WD, Hogelin GC, et al. The behavioral risk factor surveys: II. Design, methods, and estimates from combined state data. Am J Prev Med 1985;1(6):9-14.
27. Remington PL, Smith MY, Williamson DF, Anda RF, Gentry EM, Hogelin GC. Design, characteristics, and usefulness of state-based behavioral risk factor surveillance: 1981-87. Public Health Rep 1988;103:366-375.
28. Council of American Survey Research Organizations (CASRO) Task Force on Completion Rates. On the Definitions of Response Rates. Special Report. New York, NY: Council of American Survey Organizations; 1982.
29. Centers for Disease Control and Prevention. Behavioral Risk Factor Surveillance System. Available at: http://www.cdc.gov/brfss/. Accessed November 2004.
30. Saelens BE, Sallis JF, Black JB, Chen D. Neighborhood-based differences in physical activity: an environment scale evaluation. Am J Public Health 2003;93:1552-1558.
31. Eyler AA, Brownson RC, Donatelle RJ, King AC, Brown D, Sallis JF. Physical activity social support and middle- and older-aged minority women: results from a US survey. Soc Sci Med 1999;49:781-789.
32. King AC, Castro C, Wilcox S, Eyler AA, Sallis JF, Brownson RC. Personal and environmental factors associated with physical inactivity among different racial-ethnic groups of US middle- aged and older-aged women. Health Psychol 2000;19:354-364.
33. Ainsworth BE, Bassett DR, Jr, Strath SJ, et al. Comparison of three methods for measuring the time spent in physical activity. Med Sci Sports Exerc 2000;32(9 suppl):S457-S464.
34. Brownson RC, Baker EA, Housemann RA, Brennan LK, Bacak SJ. Environmental and policy determinants of physical activity in the United States. Am J Public Health 2001;91:1995-2003.
35. Brownson RC, Chang JJ, Eyler AA. Measuring the environment for friendliness toward physical activity: a comparison of the reliability of three questionnaires. Am J Public Health 2004;94:473-483.
36. Manely M, Epps R, Husten C, Glynn T, Shopland D. Clinical interventions in tobacco control: a National Cancer Institute training program for physicians. JAMA 1991;266:3172-3173.
37. Kreuter MW, Scharff DP, Brennan LK, Lukwago SN. Physician recommendations for diet and physical activity: which patients get advised to change? Prev Med 1997;26:825-833.
38. Hu FB, Willett WC, Li T, Stampfer MJ, Colditz GA, Manson JE. Adiposity as compared with physical activity in predicting mortality among women. N Engl J Med 2004;351:2694-2703.
39. Lee CD, Blair SN, Jackson AS. Cardiorespiratory fitness, body composition, and all-cause and cardiovascular disease mortality in men. Am J Clin Nut 1999;69:373-380.
40. Stevens J, Cai J, Evenson KR, Thomas R. Fitness and fatness as predictors of mortality from all causes and from cardiovascular disease in men and women in the Lipid Research Clinics Study. Am J Epidemiol 2002;156:832-841.
41. Wei M, Kampert JB, Barlow CE, et al. Relationship between low cardiorespiratory fitness and mortality in normal-weight, overweight and obese men. JAMA 1999;282:1547-1553.
42. Friedman C, Brownson RC, Peterson DE, Wilkerson JC. Physician advice to reduce chronic disease risk factors. Am J Prev Med 1994;10:367-371.
43. Ma J, Urizar GG, Alehegn T, Stafford R. Diet and physical activity counseling during ambulatory care visits in the United States. Prev Med 2004;39:815-822.
44. Palta M, Prineas RJ, Berman R, Hannan P. Comparison of self-reported and measured height and weight. Am J Epidemiol 1982;115:223-230.
45. Kuskowska-Wolk A, Karlsson P, Stolt M, Rossner S. The predictive validity of body mass index based on self-reported weight and height. Int J Obes 1989;13:441-453.
46. Kushner RF. Barriers to providing nutritional counseling by physicians: a survey of primary care practitioners. Prev Med 1995;24:546-552.
47. Rogers LQ, Bailey JE, Gutin B, et al. Teaching resi-dent physicians to provide physician counseling: a needs assessment. Acad Med 2002;77:841-844.
48. Hiss RG. Barriers to care in non-insulin-dependent diabetes mellitus. The Michigan experience. Ann Intern Med 1996;124:146-148.
49. Calfas KJ, Sallis JF, Zabinski MF, et al. Preliminary evaluation of a multi-component program for nutrition and physical activity change in primary care: PACE+ for adults. Prev Med 2002;34:153-161.
50. Sallis JF, Patrick K, Calfas KJ, et al. A multi-media behavior change program for nutrition and physical activity in primary care: PACE+ for adults. Homeostasis 1999;39:196-202.
51. Health GW, Brownson RC, Kruger J, et al. The effectiveness of urban design and land use and transport policies and practices to increase physical activity: a systematic review. J Phys Act Health 2006;3(suppl 1):555-576.
52. Sallis JF, Glanz K. The role of built environment in physical activity, eating and obesity in childhood. Future Child 2006 Spring;16(1):89-108.
- To help overweight patients and those with a sedentary lifestyle to adopt and stick with an exercise regimen, develop a detailed and realistic plan with their help, and follow up with them periodically to see how they’re doing.
Purpose: Exercise counseling by primary care physicians has been shown to improve physical activity in patients. However, the prevalence and effectiveness of physician counseling is unknown in rural populations that are at increased risk for chronic diseases.
Methods: Using a population-based telephone survey at baseline and again at 1-year follow-up, we assessed physical activity behavior among 1141 adults (75% female, 95% white) living within 12 rural communities of Missouri, Tennessee, and Arkansas. We tested the association between physician counseling and patients meeting current physical activity recommendations using logistic regression analysis controlling for demographic variables.
Results: Participants who saw a doctor for regular care were 54% more likely to be physically active (adjusted odds ratio [aOR]=1.54; 95% confidence interval [CI], 1.04-2.28). Overweight adults (body mass index [BMI]=25-29.9 kg/m2) who had been advised by their physician to exercise more were nearly 5 times more likely to meet physical activity recommendations if their doctor helped develop an exercise plan (aOR=4.99; 95% CI, 1.69-14.73).
Overweight individuals who received additional follow-up with the exercise plan from their doctor had a 5½-fold increase in likelihood of meeting physical activity recommendations (P<.05).
In the overall sample, patients were significantly more likely to initiate (P=.01) and maintain (P=.002) physical activity when the physician prescribed and followed up on an exercise plan.
Conclusion: This longitudinal study provides evidence that exercise counseling is most effective when the physician presents the counseling as a plan or prescription and when he or she follows up with the patient on it.
Simply telling sedentary patients that they need to exercise may not help them much. If the goal is to inspire action, a more effective approach would be to help them devise a plan for exercise and then inquire periodically about how it’s going. That premise was the basis for our study.
There’s good reason to get your patients moving
Physical inactivity is an independent risk factor for the most prevalent chronic diseases, including obesity, cardiovascular disease, and type 2 diabetes. Physical activity at moderate or vigorous intensities reduces stress and depressive symptoms, controls high blood pressure and cholesterol levels, improves sleep, reduces or reverses weight gain, and prevents or controls chronic diseases.1 Based on these benefits, all physicians are encouraged to counsel sedentary patients to increase activity levels.2
National disease prevention objectives of Healthy People 2010 call for physicians to counsel at-risk patients on health behaviors such as physical activity and diet.3 Knowledge of patients’ families, environments, and communities makes primary care physicians uniquely suited to give effective advice,4 and physician counseling is known to positively influence patients’ health-related behavior.5-12
To date, findings on counseling effectiveness have been mixed. Unfortunately, previous controlled trials of primary care physicians counseling adult patients on physical activity have varied in quality and yielded mixed results.13 Therefore, in its Guide to Clinical Preventive Services, the US Preventive Services Task Force did not recommend for or against behavioral counseling in primary care settings to promote physical activity.14 The guidelines state that existing studies do not provide a clear picture of which counseling components are effective.13
A population-based study by Glasgow and colleagues suggests that follow-up support by the physician may be needed to change physical activity behavior. Generalizations were limited, though, by the cross-sectional study design and post hoc analysis.15
More research is also needed to determine which strategies help patients stay physically active, a necessary component to sustaining the health benefits of exercise.16 Unfortunately, few primary care physicians counsel overweight or inactive patients on the benefits of diet and physical activity, let alone assist them with long-term follow-through.7,8,11,16-18
Why we chose to study a rural population
Rural Americans are among the groups at highest risk for chronic diseases. On average they are older, less educated, and poorer than their urban counterparts.19,20 And rural residents walk 13% less than suburbanites.21 According to the Rural Healthy People 2010 survey, 5 of the top 10 health concerns are chronic conditions that can be prevented or ameliorated with adequate physical activity.22
Studies have shown that healthy adults believe their health care providers are a credible source of information, and that they are motivated to comply with physician advice.23 Nondisabled adults believe their physicians want them to be physically active.19 However, to our knowledge, no study has examined the effects of physician counseling on physical activity behavior for patients at increased risk for chronic diseases in rural areas.
Our objectives. The first objective of this study was to identify the prevalence of specific components of physician counseling in a tri-state sample of at-risk, rural adults using telephone survey data. A second objective was to measure the longitudinal relationship between physician counseling and physical activity.
Methods
The Saint Louis University Institutional Review Board approved this study.
Study population and design
This study reports on baseline and 1-year follow-up telephone survey data collected as part of a larger 3-year intervention study in 12 rural communities from Missouri (6), Tennessee (4), and Arkansas (2). Project WOW (Walk the Ozarks to Wellness) aims to promote walking among overweight rural adults by integrating individual, interpersonal, and community-level interventions. Methods and details of the intervention are described in detail elsewhere.24 The target communities ranged in population from 766 to 12,993 adults, and in geographic area from 1.4 to 16.1 square miles.25
At baseline in the summer of 2003, we used a modified version of the Behavioral Risk Factor Surveillance System (BRFSS) interview protocol26,27 and randomly dialed telephone numbers to recruit participants residing within a 2-mile radius of a walking trail. In all, 2470 English-speaking adults, ages 18 and older, completed the baseline survey (65.2% response rate).28 Sampling was proportionate to community size.
At follow-up in the summer of 2004, participants identified at baseline completed the same telephone survey used a year earlier. This time, 1531 participants completed the survey (62.0% response rate).28
Demographic variables included age, sex, education, race/ethnicity, and annual combined household income (TABLE 1). Overweight and obesity, based on self-reported height and weight, were defined by a body mass index (BMI) of 25 to 29.9 kg/m2 and 30 kg/m2 or greater, respectively.
TABLE 1
The population sample
| PATIENT CHARACTERISTICS | FOLLOW-UP SURVEY (N =1141) % |
|---|---|
| Female | 74.6 |
| White, non-Hispanic | 94.6 |
| Education | |
| Less than high school | 9.7* |
| High school graduate | 30.8 |
| Some college | 23.9 |
| College graduate | 35.6 |
| Age | |
| 18-24 | 6.4* |
| 25-44 | 35.4 |
| 45-64 | 39.1 |
| 65+ | 19.1 |
| Annual household combined income (n=1102) | |
| < $25,000 31.7* | |
| ‡ $25,000 | 68.3 |
| Body mass index (n=1107) | |
| Normal (<25) | 43.7 |
| Overweight (25-29.9) | 31.5 |
| Obese (‡ 30) | 24.8 |
| Physician encounters/counseling | |
| Has doctor for regular care | 87.8* |
| In usual year, has seen doctor ≤1 time | 28.2* |
| Has been advised to exercise more | 35.1 |
| Doctor helped develop plan to exercise more | 33.8 |
| Doctor followed up on plan to exercise more | 46.3 |
| * Significant P value <.001 between responders and nonresponders at 1-year follow-up. | |
Measurement of dependent and independent variables
The survey instrument incorporated questions from the BRFSS, as well as questions developed by researchers from San Diego; Sumter County, South Carolina; and St. Louis.29-34 Psychometric properties of the questions and scales are reported elsewhere.35 The survey instrument contained 106 questions, including skip patterns; the average administration time was 34 minutes.
We assessed physician counseling about exercise with 5 questions from the survey (TABLE 2). These questions were modeled on the “4 As” counseling approach (Ask, Advise, Assist, and Arrange follow-up) recommended by the National Cancer Institute36 and used in a previous, similar BRFSS-based telephone survey.15 The questions were:
- Do you have a doctor whom you see for regular health care?
- In a usual year, how often do you see your doctor?
- Have you been advised within the last year by a doctor to exercise more?
- Has your doctor helped you to develop a plan to increase exercise?
- Has your doctor followed up with you at subsequent visits to see how you increased exercise?
We administered the questions at baseline and at follow-up. For our analyses, we used patient reports of physician counseling at 1-year follow-up, which covered all counseling received in the past 12 months.
We considered respondents to have met recommendations for physical activity if they had engaged in prescribed moderate or vigorous physical activities, or had walked for exercise 150 minutes a week.
Moderate physical activity was defined (according to the current CDC recommendations) as 30 cumulative minutes of moderate-intensity activity (brisk walking or jogging) at least 5 days per week.1
Vigorous physical activity was defined as 20 minutes of vigorous-intensity activity (running) at least 3 days per week.1
The sample was limited to participants who completed the baseline and follow-up surveys, and who reported at follow-up that they had no physical impairment that prevented walking (n=1141).
Statistical analysis
To evaluate how physician counseling would change a patient’s physical activity between baseline and 1-year follow-up, we used multivariate logistic regression analysis. In accordance with the questions asked in the survey, we defined 5 potential predictors of a patient’s decision to start exercising and keep exercising:
- Patient has seen a doctor for regular care.
- In a usual year, patient has seen a doctor once or less.
- Patient has been advised to exercise more.
- Doctor helped develop a plan to exercise more.
- Doctor followed up on plan to exercise more
For every patient who met physical activity recommendations at the 1-year follow-up, we performed regression analysis on each of these 5 measures, adjusting for baseline physical activity and potential confounders of age, education, and sex. This method allowed us to examine the independent effect of physician counseling on physical activity at 1-year follow-up.
The number of respondents analyzed differed according to the measure being examined. For example, we included all respondents in analyzing the effect of visit frequency and the effect of being advised to exercise more (n=1141). However, only those respondents who reported being advised to exercise more were included in the analyses of a physician helping to develop an exercise plan and physician follow-up in supporting exercise behavior (n=402).
To determine whether physician counseling was consistent across BMI categories and income (dichotomized at $25,000), we performed stratified analyses on the multilevel logistic regressions.
TABLE 2
What increased the likelihood of exercise? Regular medical care, a physician-assisted exercise plan, and physician follow-up (n=1141)
| PHYSICIAN ENCOUNTERS/COUNSELING | PATIENTS MEETING PHYSICAL ACTIVITY RECOMMENDATIONS | |
|---|---|---|
| aOR* | 95% CI | |
| 1. Do you have a doctor whom you see for regular health care? | ||
| Yes | 1.54 | 1.04-2.28 |
| No | Ref | |
| 2. In a usual year, how often do you see your doctor? | ||
| Once a year or less | 1.41 | 1.02-1.95 |
| Twice a year or more | Ref | |
| 3. Have you been advised within the last year by a doctor to exercise more? | ||
| Yes | 0.68 | 0.52-0.90 |
| No | Ref | |
| Of those advised to exercise more (n=402): 4. Has your doctor helped you to develop a plan to increase exercise? | ||
| Yes | 1.93 | 1.19-3.15 |
| No | Ref | |
| 5. Has your doctor followed up with you at subsequent visits to see how you increased exercise? | ||
| Yes | 2.84 | 1.78-4.53 |
| No | Ref | |
| aOR, adjusted odds ratio; CI, confidence interval; Ref, reference group. | ||
| *Adjusted for sex, age, educational attainment, and baseline physical activity. | ||
Results
The final cohort consisted of 1141 adults (TABLE 2). Those who did not respond to the follow-up survey were significantly more likely to be younger (P<.001), have less than a high school education (P<.001), and have an annual household combined income <$25,000 (P<.001). Those completing the follow-up survey were more likely to have a doctor for regular care (P<.001), although they saw their doctor, on average, significantly less per year than nonrespondents (P<.001).
Ninety percent of the cohort sample reported having a doctor whom they saw for regular care. Within the last year, 35% had been advised by their doctor to exercise more. Of those who had been so advised, 34% received help from their physician in developing a plan to increase exercise, and 46% were queried at subsequent visits as to how they were progressing with their exercise program.
After adjusting for age, sex, education, and baseline physical activity, we found that those who had a doctor for regular care were 54% more likely to be physically active than those who reported not having a doctor for regular care (aOR=1.54; 95% CI, 1.04-2.28). If the advising physician also developed a plan with the patient to increase exercise, there was nearly a 2-fold increase in physical activity compared with those who received only advice to exercise more (aOR=1.93; 95% CI, 1.19-3.15). If the physician followed up with the exercise plan at subsequent visits, the likelihood of physical activity increased further (aOR=2.84; 95% CI, 1.78-4.53) compared with those who did not receive follow-up from the physician.
Results of stratified analysis by BMI status are shown in TABLE 3. Individuals at normal weight were significantly more likely to be physically active if they had a physician for regular care (aOR=2.76; 95% CI, 1.49-5.13). Overweight adults (BMI 25-29.9 kg/m2) who had been advised by their physician to exercise more were significantly more likely to attain recommended levels of physical activity if their doctor helped develop an exercise plan than were those given more general advice about exercise (aOR=4.99; 95% CI, 1.69-14.73). Overweight individuals who received further counseling with follow-up inquiries were 5.64 times more likely to be physically active (95% CI, 2.10-15.17). A physician-developed exercise plan did not appreciably improve physical activity in obese adults (BMI ≥30 kg/m2); however, benefit in this group was demonstrated when physicians prescribed and followed up with the exercise plan (aOR=2.13; 95% CI, 1.10-4.12). Stratified analysis by income status provided no clear pattern (data not shown).
TABLE 3
What role does BMI play in patients achieving activity goals? (n=1107)
| PHYSICIAN ENCOUNTERS/COUNSELING | PATIENTS MEETING PHYSICAL ACTIVITY RECOMMENDATIONS* (aOR [95% CI]) | ||
|---|---|---|---|
| NORMAL (BMI<25) | OVERWEIGHT (BMI 25-29.9) | OBESE (BMI ≥30) | |
| Has seen a doctor for regular care | 2.76 (1.49-5.13) | 1.08 (0.51-2.29) | 1.34 (0.62-2.91) |
| In a usual year, has seen a doctor ≤1 time | 1.98 (1.13-3.47) | 0.95 (0.54-1.68) | 0.95 (0.47-1.92) |
| Has been advised to exercise more | 1.02 (0.56-1.85) | 0.75 (0.46-1.25) | 0.77 (0.46-1.31) |
| Doctor helped develop a plan to exercise more | 0.69 (0.22-2.18) | 4.99 (1.69-14.73) | 1.76 (0.87-3.56) |
| Doctor followed up on plan to exercise more | 2.59 (0.80-8.36) | 5.64 (2.10-15.17) | 2.13 (1.10-4.12) |
| aOR, adjusted odds ratio; BMI, body-mass index; CI, confidence interval. | |||
| *Adjusted for sex, age, educational attainment, and baseline physical activity. | |||
Discussion
Findings from our analyses support the need for more detailed and more frequent exercise counseling (including follow-up) by rural primary care physicians. In our study, physicians’ counsel was most effective when presented as a plan or prescription that was followed up with periodic inquiries. Patients’ initiation and maintenance of physical activity were significantly associated with physicians’ follow-up of exercise plans. Those who were merely “advised” to exercise more were less likely to meet physical activity recommendations. This illustrates the importance of detailed physician counseling over simple advice to exercise more.
Over 80% of normal-weight individuals, who comprised more than 40% of the sample, reported that their physician had not suggested they exercise more. There are many possible explanations for these reports. Rural populations are relatively isolated and slow to adopt changes. Thus patients may be unaware of new recommendations for physical activity and their significant benefit for disease prevention, and therefore unlikely to discuss such matters with their physician. Physicians also may perceive normal-weight individuals as healthy regardless of their actual health behaviors. On the other hand, 1 study showed that patients with disease risk factors (eg, high cholesterol, elevated BMI) were more likely to be counseled on preventive health behaviors.37
With overweight patients, who are at increased risk of developing chronic diseases, physician counseling strengthened their resolve significantly. Overweight individuals who received directives from their physician (a plan to increase exercise and subsequent follow-up) were 5½ times more likely to be physically active than those who received less counseling.
Obese patients did not receive counseling as often as overweight patients, or benefit from it as much when given, perhaps due to the presence of comorbidities. However, many studies show that regardless of BMI status, physical activity reduces all-cause mortality.38-41
Interestingly, our results showed that seeing a doctor less than once a year was associated with increases in physical activity. Patients who see their physician once a year may be going for annual wellness exams, providing more opportunity to discuss health behavior.
Overall, patients are counseled less often/thoroughly than needed. Our findings agree with those of a previous statewide study that used Missouri BRFSS data to assess the extent to which overweight or physically inactive people received advice from their physicians concerning these risk factors.42 Although most Missouri residents who were overweight or inactive reported seeing their physician within the past year, less than half said their doctors advised them to alter their risk behavior(s).42 Our findings are also consistent with a recent nationwide study by Ma and colleagues that focused on adults with obesity, diabetes, or other related conditions.43 Participants from across the United States reported receiving counseling for physical activity in <30% of visits to private physician offices and hospital outpatient departments.43
Our study was unique in that it examined a tri-state sample of the nation’s rural population for both evidence and effectiveness of physician counseling. It is one of very few studies using a longitudinal design, strengthening the associations found. Causality is limited, however, due to the multifaceted design of the intervention program from which the data were obtained. Future research should evaluate varying degrees of physician counseling and other indirect measures of its impact.
Limitations of the study
Our observational cohort design and the large, randomly selected sample resulted in fewer limitations than were seen with previous similar studies. However, our study had several limitations.
- Recall bias may be present. We assessed counseling with patient memory alone; we made no attempts to interview physicians or audit charts.
- Self-reported height and weight data tend to underestimate the prevalence of obesity.44,45 Resultant misclassification of overweight subjects as being at normal weight could have skewed the stratified analysis.
- The external validity of the physician-counseling questions we used has not been formally confirmed. Given the demographics of the analytic sample (ie, mostly female, white, low income), it would be appropriate to generalize our findings only to similar, rural populations.
Barriers to counseling, and means of removing them
Primary care physicians—rural or urban—are no doubt aware of the health risks associated with physical inactivity. However, the barriers physicians face in counseling at-risk patients overwhelm most efforts. These barriers include lack of time, inadequate provider counseling skills and training, perceived ineffectiveness and nonadherence, patient comorbidities, and lack of organizational support and reimbursement.46-48
Intervention programs and tools have been developed to help health care providers overcome time, skill, and training barriers. These programs, available even to rural providers, have proven effective.49,50 (Go to www.paceproject.org/Home.html and click on “Projects” to learn about the PACE program.) However, application of such skills and tools may be more successful if training is incorporated into medical school curricula and residency training programs rather than through CME endeavors.49 This would require medical institutions and organizations to prioritize the direct link between healthy lifestyle behaviors and disease prevention and the vital role physicians play in underscoring this link.
Finally, health care policy makers and systems must be persuaded to address the lack of organizational support and reimbursement that prevents physicians from counseling at-risk patients on unhealthy lifestyle behaviors. Responsible payers and providers should aggressively explore low-cost ways to promote physical activity and weight loss in primary care settings, to stem the tide of obesity-related chronic diseases. At the local level, physicians can team up to support policies that may enhance preventive counseling efforts2—increasing access to places for activity, encouraging physical activity programming in communities, schools, and organizations, and physical environment enhancements such as safe sidewalks, adequate lighting, and improved zoning.44,51,44,52
Acknowledgments
We thank the communities that are participating in the ongoing intervention study. For their assistance in data collection, we thank the Department of Health Management and Informatics, Behavioral Risk Research Unit at the University of Missouri, Columbia.
Funding/support
This study was funded through the National Institutes of Health grant NIDDK #5 R18 DK061706 and the Centers for Disease Control and Prevention contract U48/CCU710806 (Centers for Research and Demonstration of Health Promotion and Disease Prevention). Human subjects approval was obtained from the Saint Louis University Institutional Review Board.
Correspondence
Sarah L. Lovegreen, MPH, Prevention Research Center and Department of Community Health, Saint Louis University School of Public Health, 3545 Lafayette Ave., Salus Center, Suite 300, St. Louis, MO 63146; slove [email protected].
1. US Department of Health and Human Services. Physical Activity and Health: A report of the surgeon general. Atlanta, GA: US Department of Health and Human Services, Centers for Disease Control and Prevention National Center for Chronic Disease Prevention and Health Promotion, 1996.
2. Chakravarthy MV, Joyner MJ, Booth FW. An obligation for primary care physicians to prescribe physical activity to sedentary patients to reduce the risk of chronic health conditions. Mayo Clin Proc 2002;77:165-173.
3. US. Department of Health and Human Services. Health People 2010: Understanding and Improving Health. 2nd ed. Washington, DC: U.S. Government Printing Office, November 2000.
4. Iverson D, Fielding J, Crow R, Christenson G. The promotion of physical activity in the U.S. population: the status of programs in medical, worksite, community, and school settings. Public Health Rep 1985;100:212-224.
5. Kreuter MW, Chheda SG, Bull FC. How does physician advice influence patient behavior? Evidence for a priming effect. Arch Fam Med 2000;9:426-433.
6. The Writing Group for the Activity Counseling Trial Research Group. Effects of physical activity counseling in primary care: the Activity Counseling Trial: a randomized controlled trial. JAMA 2001;286:677-687.
7. Galuska DA, Will JC, Serdula MK, Ford ES. Are health care professionals advising obese patients to lose weight? JAMA 1999;282:1576-1578.
8. Calfas KJ, Long BJ, Sallis JF, Wooten WJ, Pratt M, Patrick K. A controlled trial of physician counseling to promote the adoption of physical activity. Prev Med 1996;25:225-233.
9. Sallis JF, Patrick K, Calfas KJ. Counseling patients/clients about physical activity and nutrition. Weight Control Digest 1999;9:843, 846-850.
10. Calfas KJ, Zabinski MF, Rupp J. Practical nutrition assessment in primary care settings: a review. Am J Prev Med. 2000;18:289-299.
11. Marcus BH, Goldstein MG, Jette A, et al. Training physicians to conduct physical activity counseling. Prev Med 1997;26:382-388.
12. Godin R, Shephard RJ. An evaluation of the potential role of the physician in influencing community exercise behavior. Am J Health Prom 1990;4:255-259.
13. Eden KB, Orleans CT, Mulrow CD, Pender NJ, Teutsch SM. Does counseling by clinicians improve physical activity? A summary of the evidence for the U.S. Preventive Services Task Force. Ann Intern Med 2002;137:208-215.
14. US. Preventive Services Task Force. Behavioral Counseling in Primary Care to Promote Physical Activity: Recommendations and Rationale. Rockville, MD: Agency for Healthcare Research and Quality; July 2002. Available at: http://www.ahrq.gov/clinic/3rduspstf/physactivity/physactrr.htm. Accessed April 24, 2008.
15. Glasgow RE, Eakin EG, Fisher EB, Bacak SJ, Brownson RC. Physician advice and support for physical activity: results from a national survey. Am J Prev Med 2001;21:189-196.
16. Marcus BH, Dubbert PM, Forsyth LH, et al. Physical activity behavior change: issues in adoption and maintenance. Health Psychol 2000;19(1 suppl):32-41.
17. Stafford RS, Farhat JH, Misra B, Schoenfeld DA. National patterns of physician activities related to obesity management. Arch Fam Med 2000;9:631-638.
18. Potter MB, Vu JD, Croughan-Minihane M. Weight management what patients want from their primary care physician. J Fam Pract 2001;50:513-518.
19. Sobal J, Troiana RP, Frongillo EA, Jr. Rural-urban differences in obesity. Rural Sociol 1996;2:289-305.
20. Miller MK, Stokes CS, Clifford WB. A comparison of the rural-urban mortality differential for deaths from all causes, cardiovascular disease and cancer. J Rural Health 1987;3(2):23-34.
21. Eyler AA, Brownson RC, Bacak SJ, Housemann RA. The epidemiology of walking for physical activity in the United States. Med Sci Sports Exerc 2003;35:1529-36.
22. Gamm L, Hutchison L, Bellamy G, et al. Rural healthy people 2010: identifying rural health priorities and models for practice. J Rural Health 2002;18(1):9-14.
23. Schappert SM. National ambulatory medical care survey: 1991 Summary. Hyattsville, MD: US Department of Health and Human Services. Public Health Service, Centers for Disease Control and Prevention, National Center for Health Statistics; 1993.
24. Brownson R, Hagood L, Lovegreen S, et al. A multilevel, ecological approach to promoting walking in rural communities. Prev Med 2005;41:837-842.
25. US. Census Bureau. Census 2000. Available at: http://www.census.gov/main/www/cen2000.html. Accessed November 2004.
26. Gentry EM, Kalsbeek WD, Hogelin GC, et al. The behavioral risk factor surveys: II. Design, methods, and estimates from combined state data. Am J Prev Med 1985;1(6):9-14.
27. Remington PL, Smith MY, Williamson DF, Anda RF, Gentry EM, Hogelin GC. Design, characteristics, and usefulness of state-based behavioral risk factor surveillance: 1981-87. Public Health Rep 1988;103:366-375.
28. Council of American Survey Research Organizations (CASRO) Task Force on Completion Rates. On the Definitions of Response Rates. Special Report. New York, NY: Council of American Survey Organizations; 1982.
29. Centers for Disease Control and Prevention. Behavioral Risk Factor Surveillance System. Available at: http://www.cdc.gov/brfss/. Accessed November 2004.
30. Saelens BE, Sallis JF, Black JB, Chen D. Neighborhood-based differences in physical activity: an environment scale evaluation. Am J Public Health 2003;93:1552-1558.
31. Eyler AA, Brownson RC, Donatelle RJ, King AC, Brown D, Sallis JF. Physical activity social support and middle- and older-aged minority women: results from a US survey. Soc Sci Med 1999;49:781-789.
32. King AC, Castro C, Wilcox S, Eyler AA, Sallis JF, Brownson RC. Personal and environmental factors associated with physical inactivity among different racial-ethnic groups of US middle- aged and older-aged women. Health Psychol 2000;19:354-364.
33. Ainsworth BE, Bassett DR, Jr, Strath SJ, et al. Comparison of three methods for measuring the time spent in physical activity. Med Sci Sports Exerc 2000;32(9 suppl):S457-S464.
34. Brownson RC, Baker EA, Housemann RA, Brennan LK, Bacak SJ. Environmental and policy determinants of physical activity in the United States. Am J Public Health 2001;91:1995-2003.
35. Brownson RC, Chang JJ, Eyler AA. Measuring the environment for friendliness toward physical activity: a comparison of the reliability of three questionnaires. Am J Public Health 2004;94:473-483.
36. Manely M, Epps R, Husten C, Glynn T, Shopland D. Clinical interventions in tobacco control: a National Cancer Institute training program for physicians. JAMA 1991;266:3172-3173.
37. Kreuter MW, Scharff DP, Brennan LK, Lukwago SN. Physician recommendations for diet and physical activity: which patients get advised to change? Prev Med 1997;26:825-833.
38. Hu FB, Willett WC, Li T, Stampfer MJ, Colditz GA, Manson JE. Adiposity as compared with physical activity in predicting mortality among women. N Engl J Med 2004;351:2694-2703.
39. Lee CD, Blair SN, Jackson AS. Cardiorespiratory fitness, body composition, and all-cause and cardiovascular disease mortality in men. Am J Clin Nut 1999;69:373-380.
40. Stevens J, Cai J, Evenson KR, Thomas R. Fitness and fatness as predictors of mortality from all causes and from cardiovascular disease in men and women in the Lipid Research Clinics Study. Am J Epidemiol 2002;156:832-841.
41. Wei M, Kampert JB, Barlow CE, et al. Relationship between low cardiorespiratory fitness and mortality in normal-weight, overweight and obese men. JAMA 1999;282:1547-1553.
42. Friedman C, Brownson RC, Peterson DE, Wilkerson JC. Physician advice to reduce chronic disease risk factors. Am J Prev Med 1994;10:367-371.
43. Ma J, Urizar GG, Alehegn T, Stafford R. Diet and physical activity counseling during ambulatory care visits in the United States. Prev Med 2004;39:815-822.
44. Palta M, Prineas RJ, Berman R, Hannan P. Comparison of self-reported and measured height and weight. Am J Epidemiol 1982;115:223-230.
45. Kuskowska-Wolk A, Karlsson P, Stolt M, Rossner S. The predictive validity of body mass index based on self-reported weight and height. Int J Obes 1989;13:441-453.
46. Kushner RF. Barriers to providing nutritional counseling by physicians: a survey of primary care practitioners. Prev Med 1995;24:546-552.
47. Rogers LQ, Bailey JE, Gutin B, et al. Teaching resi-dent physicians to provide physician counseling: a needs assessment. Acad Med 2002;77:841-844.
48. Hiss RG. Barriers to care in non-insulin-dependent diabetes mellitus. The Michigan experience. Ann Intern Med 1996;124:146-148.
49. Calfas KJ, Sallis JF, Zabinski MF, et al. Preliminary evaluation of a multi-component program for nutrition and physical activity change in primary care: PACE+ for adults. Prev Med 2002;34:153-161.
50. Sallis JF, Patrick K, Calfas KJ, et al. A multi-media behavior change program for nutrition and physical activity in primary care: PACE+ for adults. Homeostasis 1999;39:196-202.
51. Health GW, Brownson RC, Kruger J, et al. The effectiveness of urban design and land use and transport policies and practices to increase physical activity: a systematic review. J Phys Act Health 2006;3(suppl 1):555-576.
52. Sallis JF, Glanz K. The role of built environment in physical activity, eating and obesity in childhood. Future Child 2006 Spring;16(1):89-108.
Malpractice minute
Could a patient’s violent act
have been prevented?
THE PATIENT. A man under outpatient care of the state’s regional behavioral health authority was diagnosed with schizophrenia, paranoid type.
CASE FACTS. The patient killed his developmentally disabled niece, age 26.
THE VICTIM’S FAMILY’S CLAIM. The death would not have occurred if the patient had been civilly committed or heavily medicated.
THE BEHAVIORAL HEALTH AUTHORITY’S DEFENSE. The violent act was unforeseeable, and the patient was compliant with treatment. The victim’s mother should not have left the disabled woman alone with the patient.
Submit your verdict and find out how the court ruled. Click on “Have more to say about this topic?” to comment.
Cases are selected by Current Psychiatry from Medical Malpractice Verdicts, Settlements & Experts, with permission of its editor, Lewis Laska of Nashville, TN (www.verdictslaska.com). Information may be incomplete in some instances, but these cases represent clinical situations that typically result in litigation.
Could a patient’s violent act
have been prevented?
THE PATIENT. A man under outpatient care of the state’s regional behavioral health authority was diagnosed with schizophrenia, paranoid type.
CASE FACTS. The patient killed his developmentally disabled niece, age 26.
THE VICTIM’S FAMILY’S CLAIM. The death would not have occurred if the patient had been civilly committed or heavily medicated.
THE BEHAVIORAL HEALTH AUTHORITY’S DEFENSE. The violent act was unforeseeable, and the patient was compliant with treatment. The victim’s mother should not have left the disabled woman alone with the patient.
Submit your verdict and find out how the court ruled. Click on “Have more to say about this topic?” to comment.
Cases are selected by Current Psychiatry from Medical Malpractice Verdicts, Settlements & Experts, with permission of its editor, Lewis Laska of Nashville, TN (www.verdictslaska.com). Information may be incomplete in some instances, but these cases represent clinical situations that typically result in litigation.
Cases are selected by Current Psychiatry from Medical Malpractice Verdicts, Settlements & Experts, with permission of its editor, Lewis Laska of Nashville, TN (www.verdictslaska.com). Information may be incomplete in some instances, but these cases represent clinical situations that typically result in litigation.
Violence risk: Is clinical judgment enough?
Dear Dr. Mossman:
Multiple studies support the reliability and validity of actuarial measures—such as the Historical, Clinical, and Risk Management (HCR-20) risk assessment scheme—to assess violence risk, whereas physicians’ clinical judgment is highly variable. Should clinicians use actuarial measures to assess a patient’s risk of violence? Could it be considered negligent not to use actuarial measures?—Submitted by “Dr. S”
In the 30 years since the Tarasoff decision—which held that psychiatrists have a duty to protect individuals who are being threatened with bodily harm by a patient1—assessing patients’ risk of future violence has become an accepted part of mental health practice.2 Dr. S has asked 2 sophisticated questions about risk assessment. The short answer is that although so-called “actuarial” techniques for assessing risk are valuable, psychiatrists who do not use them are not practicing negligently. To explain why, this article discusses:
- the difference between “clinical” and “actuarial” judgment
- the HCR-20’s strengths and weaknesses
- actuarial measures and negligence.
- Submit your malpractice-related questions to Dr. Mossman at [email protected].
- Include your name, address, and practice location. If your question is chosen for publication, your name can be withheld by request.
- All readers who submit questions will be included in quarterly drawings for a $50 gift certificate for Professional Risk Management Services, Inc’s online marketplace of risk management publications and resources (www.prms.com).
Clinical vs actuarial judgment
In the 1970s and 1980s, mental health professionals believed they could not accurately predict violence.3 We now know this is not correct. Since the 1990s, when researchers adopted better methods for gauging the accuracy of risk assessments,4-6 research has shown that mental health clinicians can assess dangerousness with clearly-better-than-chance accuracy, whether the assessment covers just the next few days, several months, or years.4
Over the same period, psychologists recognized that when it comes to making predictions, clinical judgment—making predictions by putting together information in one’s head—often is inferior to using simple formulae derived from empirically demonstrated relationships between data and outcome.7 This approach—“actuarial” judgment—is how insurance companies use data to calculate risk.
By the late 1990s, psychologists had developed actuarial risk assessment instruments (ARAIs)8 that could accurately rank the likelihood of various forms of violence. Table 1 lists some well-known ARAIs and the populations for which they were designed. In clinical practice, psychiatrists usually focus on risk posed by psychiatric patients. The HCR-209 was designed to help evaluate this type of risk.
Table 1
Examples of actuarial risk assessment instruments (ARAIs)
| ARAI | Risk assessed |
|---|---|
| HCR-209 | Violence in psychiatric populations, such as formerly hospitalized patients |
| Classification Of Violence Risk (COVR) | Violence by civil psychiatric patients following discharge into the community |
| Violence Risk Assessment Guide (VRAG) | Violent recidivism by formerly incarcerated offenders |
| Static-99 | Recidivism by sex offenders |
HCR-20’s pros and cons
The HCR-20 has 20 items:
- 10 concerning the patient’s history
- 5 related to clinical factors
- 5 that deal with risk management (Table 2).
To use the HCR-20 as an exercise of true actuarial judgment, you would base your opinion of a patient’s risk of violence solely on the HCR-20 score, without regard for other patient factors. However, the HCR-20’s developers think this approach “may be unreasonable, unethical, and illegal.”9 One reason is that the HCR-20 omits obvious signs of potential violence, such as a clearly stated threat with unambiguous intent to act.
For example, if a patient is doing well in the hospital (and has a low score on HCR-20 clinical items), a psychiatrist might assume the patient will cause few problems after discharge. But if the risk management items generate a high score, the psychiatrist should realize that these factors raise the patient’s violence risk and may require additional intervention—perhaps a different type of community placement or special effort to help the patient follow up with out-patient treatment.
Table 2
Items from the Historical, Clinical, and Risk Management (HCR-20)
| Historical items | Clinical items | Risk management items |
|---|---|---|
| H1 Previous violence | C1 Lack of insight | R1 Plans lack feasibility |
| H2 Young age at first incident | C2 Negative attitudes | R2 Exposure to destabilizers |
| H3 Relationship instability | C3 Active symptoms of major mental illness | R3 Lack of personal support |
| H4 Employment problems | C4 Impulsivity | R4 Noncompliance with remediation attempts |
| H5 Substance use problems | C5 Unresponsive to treatment | R5 Stress |
| H6 Major mental illness | ||
| H7 Psychopathy | ||
| H8 Early maladjustment | ||
| H9 Personality disorder | ||
| H10 Prior supervision failure | ||
| Score each item 0, 1, or 2, depending on how closely the patient matches the described characteristic. For example, when scoring item C3 (active symptoms of major mental illness), a patient gets 0 for “no active symptoms,” 1 for “possible/less serious active symptoms,” or 2 for “definite/serious active symptoms.” An individual can receive a total HCR-20 score of 0 to 40. The higher the score, the higher likelihood of violence in the coming months. | ||
| Source: Reprinted with permission from Webster CD, Douglas KS, Eaves D, Hart SD. HCR-20: assessing risk for violence, version 2. Burnaby, British Columbia, Canada: Simon Fraser University, Mental Health, Law, and Policy Institute; 1997 | ||
Is not using ARAIs negligent?
Some writers believe that using ARAIs should12 or may soon13 become the standard of care. Why, then, do psychiatrists seldom use ARAIs in their clinical work? Partly it is because clinicians rarely receive adequate training in assessing violence risk or the science supporting it. After a 5-hour training module featuring the HCR-20, psychiatry residents could better identify factors that affect violence risk, organize their reasoning, and come up with risk management strategies.2
Psychiatrists may have other reasons for not using ARAIs that make clinical sense. Although ARAIs can rank individuals’ violence risk, the probabilities of violence associated with each rank aren’t substantial enough to justify differences in management.14 Scientifically, it’s interesting to know that we can separate patients into groups with “low” (9%) and “high” (49%) risks of violence.15 But would you want to manage these patients differently? Most psychiatrists probably would not feel comfortable ignoring a 9% risk of violence.
To avoid negligence, psychiatrists need only “exercise the skill, knowledge, and care normally possessed and exercised by other members of their profession.”17 Psychiatrists seldom use ARAIs,12 so failing to use them cannot constitute malpractice. As Simon points out, a practicing psychiatrist’s role is to treat patients, not predict violence. He concludes, “at this time, the standard of care does not require the average or reasonable psychiatrist to use actuarial assessment instruments in the evaluation and treatment of potentially violent patients.”16
1. Tarasoff vs Regents of the University of California, 551 P. 2d 334 (Cal. 1976).
2. McNiel DE, Chamberlain JR, Weaver CM, et al. Impact of clinical training on violence risk assessment. Am J Psychiatry 2008;165:195-200.
3. Monahan J. The clinical prediction of violent behavior. Washington, DC: National Institute of Mental Health; 1981.
4. Mossman D. Assessing predictions of violence: being accurate about accuracy. J Consult Clin Psychol 1994;62:783-92.
5. Rice ME, Harris GT. Violent recidivism: assessing predictive validity. J Consult Clin Psychol 1995;63:737-48.
6. Gardner W, Lidz CW, Mulvey EP, Shaw EC. Clinical versus actuarial predictions of violence in patients with mental illness. J Consult Clin Psychol 1996;64:602-9.
7. Dawes RM, Faust D, Meehl PE. Clinical versus actuarial judgment. Science 1989;243:1668-74.
8. Hart SD, Michie C, Cooke DJ. Precision of actuarial risk assessment instruments: evaluating the ‘margins of error’ of group v. individual predictions of violence. Brit J Psychiatry 2007;190:60-5.
9. Webster CD, Douglas KS, Eaves D, Hart SD. HCR-20: assessing risk for violence, version 2. Burnaby, British Columbia: Simon Fraser University, Mental Health, Law, and Policy Institute; 1997.
10. Quinsey VL, Harris GT, Rice ME, Cormier CA. Violent offenders: appraising and managing risk. 2nd ed. Washington, DC: American Psychological Association; 2006.
11. Hanson RK, Morton-Bourgon KE. The accuracy of recidivism risk assessments for sexual offenders: a meta-analysis. Ottawa, Canada: Public Safety Canada; 2007. Available at: http://www.publicsafety.gc.ca/res/cor/rep/_fl/crp2007-01-en.pdf. Accessed April 21, 2008.
12. Swanson JW. Preventing the unpredicted: managing violence risk in mental health care. Psychiatr Serv 2008;59:191-3.
13. Lamberg L. New tools aid violence risk assessment. JAMA 2007;298(5):499-501.
14. Mossman D. Commentary: assessing the risk of violence—are “accurate” predictions useful? J Am Acad Psychiatry Law 2000;28:272-81.
15. Monahan J, Steadman HJ, Robbins PC, et al. An actuarial model of violence risk assessment for persons with mental disorders. Psychiatr Serv 2005;56:810-15.
16. Simon RI. The myth of “imminent” violence in psychiatry and the law. Univ Cincinnati L Rev 2006;75:631-43.
17. Dobbs DB. The law of torts. St. Paul, MN: West Group; 2000:269.
Dear Dr. Mossman:
Multiple studies support the reliability and validity of actuarial measures—such as the Historical, Clinical, and Risk Management (HCR-20) risk assessment scheme—to assess violence risk, whereas physicians’ clinical judgment is highly variable. Should clinicians use actuarial measures to assess a patient’s risk of violence? Could it be considered negligent not to use actuarial measures?—Submitted by “Dr. S”
In the 30 years since the Tarasoff decision—which held that psychiatrists have a duty to protect individuals who are being threatened with bodily harm by a patient1—assessing patients’ risk of future violence has become an accepted part of mental health practice.2 Dr. S has asked 2 sophisticated questions about risk assessment. The short answer is that although so-called “actuarial” techniques for assessing risk are valuable, psychiatrists who do not use them are not practicing negligently. To explain why, this article discusses:
- the difference between “clinical” and “actuarial” judgment
- the HCR-20’s strengths and weaknesses
- actuarial measures and negligence.
- Submit your malpractice-related questions to Dr. Mossman at [email protected].
- Include your name, address, and practice location. If your question is chosen for publication, your name can be withheld by request.
- All readers who submit questions will be included in quarterly drawings for a $50 gift certificate for Professional Risk Management Services, Inc’s online marketplace of risk management publications and resources (www.prms.com).
Clinical vs actuarial judgment
In the 1970s and 1980s, mental health professionals believed they could not accurately predict violence.3 We now know this is not correct. Since the 1990s, when researchers adopted better methods for gauging the accuracy of risk assessments,4-6 research has shown that mental health clinicians can assess dangerousness with clearly-better-than-chance accuracy, whether the assessment covers just the next few days, several months, or years.4
Over the same period, psychologists recognized that when it comes to making predictions, clinical judgment—making predictions by putting together information in one’s head—often is inferior to using simple formulae derived from empirically demonstrated relationships between data and outcome.7 This approach—“actuarial” judgment—is how insurance companies use data to calculate risk.
By the late 1990s, psychologists had developed actuarial risk assessment instruments (ARAIs)8 that could accurately rank the likelihood of various forms of violence. Table 1 lists some well-known ARAIs and the populations for which they were designed. In clinical practice, psychiatrists usually focus on risk posed by psychiatric patients. The HCR-209 was designed to help evaluate this type of risk.
Table 1
Examples of actuarial risk assessment instruments (ARAIs)
| ARAI | Risk assessed |
|---|---|
| HCR-209 | Violence in psychiatric populations, such as formerly hospitalized patients |
| Classification Of Violence Risk (COVR) | Violence by civil psychiatric patients following discharge into the community |
| Violence Risk Assessment Guide (VRAG) | Violent recidivism by formerly incarcerated offenders |
| Static-99 | Recidivism by sex offenders |
HCR-20’s pros and cons
The HCR-20 has 20 items:
- 10 concerning the patient’s history
- 5 related to clinical factors
- 5 that deal with risk management (Table 2).
To use the HCR-20 as an exercise of true actuarial judgment, you would base your opinion of a patient’s risk of violence solely on the HCR-20 score, without regard for other patient factors. However, the HCR-20’s developers think this approach “may be unreasonable, unethical, and illegal.”9 One reason is that the HCR-20 omits obvious signs of potential violence, such as a clearly stated threat with unambiguous intent to act.
For example, if a patient is doing well in the hospital (and has a low score on HCR-20 clinical items), a psychiatrist might assume the patient will cause few problems after discharge. But if the risk management items generate a high score, the psychiatrist should realize that these factors raise the patient’s violence risk and may require additional intervention—perhaps a different type of community placement or special effort to help the patient follow up with out-patient treatment.
Table 2
Items from the Historical, Clinical, and Risk Management (HCR-20)
| Historical items | Clinical items | Risk management items |
|---|---|---|
| H1 Previous violence | C1 Lack of insight | R1 Plans lack feasibility |
| H2 Young age at first incident | C2 Negative attitudes | R2 Exposure to destabilizers |
| H3 Relationship instability | C3 Active symptoms of major mental illness | R3 Lack of personal support |
| H4 Employment problems | C4 Impulsivity | R4 Noncompliance with remediation attempts |
| H5 Substance use problems | C5 Unresponsive to treatment | R5 Stress |
| H6 Major mental illness | ||
| H7 Psychopathy | ||
| H8 Early maladjustment | ||
| H9 Personality disorder | ||
| H10 Prior supervision failure | ||
| Score each item 0, 1, or 2, depending on how closely the patient matches the described characteristic. For example, when scoring item C3 (active symptoms of major mental illness), a patient gets 0 for “no active symptoms,” 1 for “possible/less serious active symptoms,” or 2 for “definite/serious active symptoms.” An individual can receive a total HCR-20 score of 0 to 40. The higher the score, the higher likelihood of violence in the coming months. | ||
| Source: Reprinted with permission from Webster CD, Douglas KS, Eaves D, Hart SD. HCR-20: assessing risk for violence, version 2. Burnaby, British Columbia, Canada: Simon Fraser University, Mental Health, Law, and Policy Institute; 1997 | ||
Is not using ARAIs negligent?
Some writers believe that using ARAIs should12 or may soon13 become the standard of care. Why, then, do psychiatrists seldom use ARAIs in their clinical work? Partly it is because clinicians rarely receive adequate training in assessing violence risk or the science supporting it. After a 5-hour training module featuring the HCR-20, psychiatry residents could better identify factors that affect violence risk, organize their reasoning, and come up with risk management strategies.2
Psychiatrists may have other reasons for not using ARAIs that make clinical sense. Although ARAIs can rank individuals’ violence risk, the probabilities of violence associated with each rank aren’t substantial enough to justify differences in management.14 Scientifically, it’s interesting to know that we can separate patients into groups with “low” (9%) and “high” (49%) risks of violence.15 But would you want to manage these patients differently? Most psychiatrists probably would not feel comfortable ignoring a 9% risk of violence.
To avoid negligence, psychiatrists need only “exercise the skill, knowledge, and care normally possessed and exercised by other members of their profession.”17 Psychiatrists seldom use ARAIs,12 so failing to use them cannot constitute malpractice. As Simon points out, a practicing psychiatrist’s role is to treat patients, not predict violence. He concludes, “at this time, the standard of care does not require the average or reasonable psychiatrist to use actuarial assessment instruments in the evaluation and treatment of potentially violent patients.”16
1. Tarasoff vs Regents of the University of California, 551 P. 2d 334 (Cal. 1976).
2. McNiel DE, Chamberlain JR, Weaver CM, et al. Impact of clinical training on violence risk assessment. Am J Psychiatry 2008;165:195-200.
3. Monahan J. The clinical prediction of violent behavior. Washington, DC: National Institute of Mental Health; 1981.
4. Mossman D. Assessing predictions of violence: being accurate about accuracy. J Consult Clin Psychol 1994;62:783-92.
5. Rice ME, Harris GT. Violent recidivism: assessing predictive validity. J Consult Clin Psychol 1995;63:737-48.
6. Gardner W, Lidz CW, Mulvey EP, Shaw EC. Clinical versus actuarial predictions of violence in patients with mental illness. J Consult Clin Psychol 1996;64:602-9.
7. Dawes RM, Faust D, Meehl PE. Clinical versus actuarial judgment. Science 1989;243:1668-74.
8. Hart SD, Michie C, Cooke DJ. Precision of actuarial risk assessment instruments: evaluating the ‘margins of error’ of group v. individual predictions of violence. Brit J Psychiatry 2007;190:60-5.
9. Webster CD, Douglas KS, Eaves D, Hart SD. HCR-20: assessing risk for violence, version 2. Burnaby, British Columbia: Simon Fraser University, Mental Health, Law, and Policy Institute; 1997.
10. Quinsey VL, Harris GT, Rice ME, Cormier CA. Violent offenders: appraising and managing risk. 2nd ed. Washington, DC: American Psychological Association; 2006.
11. Hanson RK, Morton-Bourgon KE. The accuracy of recidivism risk assessments for sexual offenders: a meta-analysis. Ottawa, Canada: Public Safety Canada; 2007. Available at: http://www.publicsafety.gc.ca/res/cor/rep/_fl/crp2007-01-en.pdf. Accessed April 21, 2008.
12. Swanson JW. Preventing the unpredicted: managing violence risk in mental health care. Psychiatr Serv 2008;59:191-3.
13. Lamberg L. New tools aid violence risk assessment. JAMA 2007;298(5):499-501.
14. Mossman D. Commentary: assessing the risk of violence—are “accurate” predictions useful? J Am Acad Psychiatry Law 2000;28:272-81.
15. Monahan J, Steadman HJ, Robbins PC, et al. An actuarial model of violence risk assessment for persons with mental disorders. Psychiatr Serv 2005;56:810-15.
16. Simon RI. The myth of “imminent” violence in psychiatry and the law. Univ Cincinnati L Rev 2006;75:631-43.
17. Dobbs DB. The law of torts. St. Paul, MN: West Group; 2000:269.