User login
Which tocolytic agents are most likely to delay delivery and improve neonatal outcomes?
This statistical tour de force on the topic of tocolytic therapy attempts to determine which agents are most effective at delaying delivery. The analysis is not a typical meta-analysis but what the investigators refer to as “network meta-analysis,” the distinction being that the latter makes an assumption of consistency because all relevant data are compared, including treatments that may no longer appear to be effective or relevant. This distinction may be a bit too esoteric for most clinicians, me included.
Details of the trial
Investigators identified 95 randomized, controlled trials of tocolytic therapy.
The probability of delivery being delayed by 48 hours was greatest with prostaglandin inhibitors (odds ratio [OR], 5.39; 95% confidence interval [CI], 2.14–12.34), followed by magnesium sulfate (OR, 2.76; 95% CI, 1.58–4.94), calcium channel blockers (OR, 2.71; 95% CI, 1.17–5.91), beta mimetics (OR, 2.41; 95% CI, 1.27–4.55), and the oxytocin receptor blocker atosiban (OR, 2.02; 95% CI, 1.10–3.80), compared with placebo.
No class of tocolytic was superior to placebo in reducing the incidence of neonatal respiratory distress syndrome.
Side effects that required a change of medication were significantly more common with beta mimetics (OR, 22.68; 95% CI, 7.51–73.67), magnesium sulfate (OR, 8.15; 95% CI, 2.47–27.70), and calcium channel blockers (OR, 3.80; 95% CI, 1.02–16.92), compared with placebo.
Prostaglandin inhibitors and calcium channel blockers were the agents most likely to be ranked in the top three classes of medication for the outcomes of a 48-hour delay in delivery, lower risk of respiratory distress syndrome and neonatal mortality, and fewer maternal side effects.
Strengths and limitations
The major strength of this analysis is its inclusion of trials from the world literature.
Weaknesses include the:
- lack of practice standardization in many trials
- inclusion of many trials that used composite or secondary analysis
- inability to control for the inclusion of magnesium sulfate in more recent trials, when it was classified as a neuroprotective agent and not a tocolytic
- inclusion of studies involving drugs unavailable in the United States.
The investigators also made some decisions about which trials to include and exclude that could have confused the picture. For example, they excluded trials that used combination drug therapy for tocolysis. As a result, the use of magnesium sulfate as a neuroprotective agent could have confounded the results if it was not recorded as a tocolytic when used in conjunction with another tocolytic.
The most recent practice bulletin from the American College of Obstetricians and Gynecologists addresses this point when it cautions practitioners about developing guidelines for concurrent tocolytic use when employing magnesium sulfate for fetal neuroprotection.1 The practice bulletin also confirms Level A evidence for the use of beta-agonists, calcium channel blockers, or nonsteroidal anti-inflammatory drugs for short-term tocolysis, effectively summarizing current clinical practice and agreeing with the conclusions of Haas and colleagues.
Overall, Haas and colleagues affirm current practice, concluding that prostaglandin inhibitors (eg, indomethacin) and calcium channel blockers (eg, nifedipine, nicardipine) delay delivery and improve short-term neonatal outcomes, whereas beta-agonist therapy was not considered to be as preferable, largely due to its maternal side effect profile. In addition, it is difficult to decipher the relative contributions of the drugs described in this investigation to neonatal and maternal side effects.
I plan to continue my current practice of employing indomethacin or nifedipine as first-line, short-term tocolytic therapy in conjunction with administration of magnesium sulfate for fetal neuroprotection, when appropriate.
I give a starting dose of indomethacin of 50 to 100 mg (orally or rectally), with a maintenance dose of 25 mg orally every 4 hours or 50 mg every 6 hours, not to exceed 48 consecutive hours of treatment.
For nifedipine, I give 20 to 30 mg orally, which can be repeated in 2 hours, if necessary. The maintenance dose is 10 to 20 mg orally every 4 to 6 hours, not to exceed 180 mg/day or 72 consecutive hours of treatment.
JOHN T. REPKE, MD
We want to hear from you! Tell us what you think.
ON OBSTETRICS?
Which skin closure technique better reduces the risk of cesarean wound complications: surgical staples or subcuticular suture?
Dhanya Mackeen, MD, MPH; Vincenzo Berghella, MD (February 2013)
Does an unfavorable cervix preclude induction of labor at term in women who have gestational hypertension or mild preeclampsia?
George Macones, MD (December 2012)
Is the rate of progress the same for induced and spontaneous labors?
William F. Rayburn, MD (November 2012)
Does maternal exposure to magnesium sulfate affect fetal
heart-rate patterns?
John M. Thorp, Jr, MD (October 2012)
Is elective delivery at 37 weeks’ gestation safe in uncomplicated
twin pregnancies?
Steven T. Chasen, MD (September 2012)
Does mediolateral episiotomy reduce the risk of anal sphincter injury in operative vaginal delivery?
Errol T. Norwitz, MD, PhD (August 2012)
Does vaginal progesterone reduce preterm delivery among asymptomatic women who have a short cervix in the midtrimester?
John T. Repke, MD (April 2012)
Does weekly progesterone prolong gestation in women who
have PPROM?
Alex C. Vidaeff, MD, MPH (May 2011)
Reference
1. Committee on Practice Bulletin–Obstetrics; American College of Obstetricians and Gynecologists. ACOG Practice Bulletin No. 127: Management of preterm labor. Obstet Gynecol. 2012;119(6):1307-1317.
This statistical tour de force on the topic of tocolytic therapy attempts to determine which agents are most effective at delaying delivery. The analysis is not a typical meta-analysis but what the investigators refer to as “network meta-analysis,” the distinction being that the latter makes an assumption of consistency because all relevant data are compared, including treatments that may no longer appear to be effective or relevant. This distinction may be a bit too esoteric for most clinicians, me included.
Details of the trial
Investigators identified 95 randomized, controlled trials of tocolytic therapy.
The probability of delivery being delayed by 48 hours was greatest with prostaglandin inhibitors (odds ratio [OR], 5.39; 95% confidence interval [CI], 2.14–12.34), followed by magnesium sulfate (OR, 2.76; 95% CI, 1.58–4.94), calcium channel blockers (OR, 2.71; 95% CI, 1.17–5.91), beta mimetics (OR, 2.41; 95% CI, 1.27–4.55), and the oxytocin receptor blocker atosiban (OR, 2.02; 95% CI, 1.10–3.80), compared with placebo.
No class of tocolytic was superior to placebo in reducing the incidence of neonatal respiratory distress syndrome.
Side effects that required a change of medication were significantly more common with beta mimetics (OR, 22.68; 95% CI, 7.51–73.67), magnesium sulfate (OR, 8.15; 95% CI, 2.47–27.70), and calcium channel blockers (OR, 3.80; 95% CI, 1.02–16.92), compared with placebo.
Prostaglandin inhibitors and calcium channel blockers were the agents most likely to be ranked in the top three classes of medication for the outcomes of a 48-hour delay in delivery, lower risk of respiratory distress syndrome and neonatal mortality, and fewer maternal side effects.
Strengths and limitations
The major strength of this analysis is its inclusion of trials from the world literature.
Weaknesses include the:
- lack of practice standardization in many trials
- inclusion of many trials that used composite or secondary analysis
- inability to control for the inclusion of magnesium sulfate in more recent trials, when it was classified as a neuroprotective agent and not a tocolytic
- inclusion of studies involving drugs unavailable in the United States.
The investigators also made some decisions about which trials to include and exclude that could have confused the picture. For example, they excluded trials that used combination drug therapy for tocolysis. As a result, the use of magnesium sulfate as a neuroprotective agent could have confounded the results if it was not recorded as a tocolytic when used in conjunction with another tocolytic.
The most recent practice bulletin from the American College of Obstetricians and Gynecologists addresses this point when it cautions practitioners about developing guidelines for concurrent tocolytic use when employing magnesium sulfate for fetal neuroprotection.1 The practice bulletin also confirms Level A evidence for the use of beta-agonists, calcium channel blockers, or nonsteroidal anti-inflammatory drugs for short-term tocolysis, effectively summarizing current clinical practice and agreeing with the conclusions of Haas and colleagues.
Overall, Haas and colleagues affirm current practice, concluding that prostaglandin inhibitors (eg, indomethacin) and calcium channel blockers (eg, nifedipine, nicardipine) delay delivery and improve short-term neonatal outcomes, whereas beta-agonist therapy was not considered to be as preferable, largely due to its maternal side effect profile. In addition, it is difficult to decipher the relative contributions of the drugs described in this investigation to neonatal and maternal side effects.
I plan to continue my current practice of employing indomethacin or nifedipine as first-line, short-term tocolytic therapy in conjunction with administration of magnesium sulfate for fetal neuroprotection, when appropriate.
I give a starting dose of indomethacin of 50 to 100 mg (orally or rectally), with a maintenance dose of 25 mg orally every 4 hours or 50 mg every 6 hours, not to exceed 48 consecutive hours of treatment.
For nifedipine, I give 20 to 30 mg orally, which can be repeated in 2 hours, if necessary. The maintenance dose is 10 to 20 mg orally every 4 to 6 hours, not to exceed 180 mg/day or 72 consecutive hours of treatment.
JOHN T. REPKE, MD
We want to hear from you! Tell us what you think.
ON OBSTETRICS?
Which skin closure technique better reduces the risk of cesarean wound complications: surgical staples or subcuticular suture?
Dhanya Mackeen, MD, MPH; Vincenzo Berghella, MD (February 2013)
Does an unfavorable cervix preclude induction of labor at term in women who have gestational hypertension or mild preeclampsia?
George Macones, MD (December 2012)
Is the rate of progress the same for induced and spontaneous labors?
William F. Rayburn, MD (November 2012)
Does maternal exposure to magnesium sulfate affect fetal
heart-rate patterns?
John M. Thorp, Jr, MD (October 2012)
Is elective delivery at 37 weeks’ gestation safe in uncomplicated
twin pregnancies?
Steven T. Chasen, MD (September 2012)
Does mediolateral episiotomy reduce the risk of anal sphincter injury in operative vaginal delivery?
Errol T. Norwitz, MD, PhD (August 2012)
Does vaginal progesterone reduce preterm delivery among asymptomatic women who have a short cervix in the midtrimester?
John T. Repke, MD (April 2012)
Does weekly progesterone prolong gestation in women who
have PPROM?
Alex C. Vidaeff, MD, MPH (May 2011)
Reference
1. Committee on Practice Bulletin–Obstetrics; American College of Obstetricians and Gynecologists. ACOG Practice Bulletin No. 127: Management of preterm labor. Obstet Gynecol. 2012;119(6):1307-1317.
Reference
1. Committee on Practice Bulletin–Obstetrics; American College of Obstetricians and Gynecologists. ACOG Practice Bulletin No. 127: Management of preterm labor. Obstet Gynecol. 2012;119(6):1307-1317.
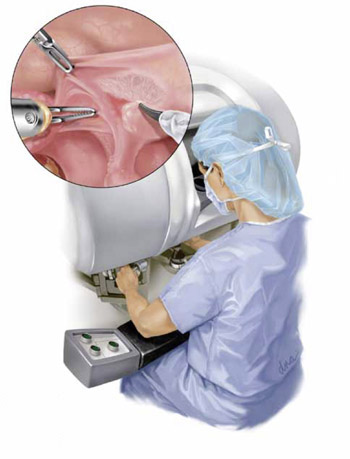
Identify your learning curve for robotic hysterectomy
To read 9 recent articles from OBG Management on the pros and cons of robotic surgery, click here.
In 2007, we and our colleagues began assessing the experience necessary to gain proficiency with robotic hysterectomy, and we published our findings early this year.1 We concluded that the number of cases needed to reach this threshold is about 91—many more than the 20 to 50 cases previously reported.2-4 Earlier studies defined proficiency in relation to the stabilization of operative times, which is subjective, somewhat arbitrary, and ignores patient outcomes.
To better elucidate the learning curve of robotic hysterectomy, we focused on a more objective, patient-centered analysis that utilized cumulative summation, or CUSUM, analysis and operative complications. This approach mitigates many of the problems encountered in earlier studies and reveals broader implications for the adoption of new surgical techniques and surgical quality control.
How CUSUM analysis works
E. S. Page introduced CUSUM analysis in 1954 for use in industrial quality control.5 This approach has been applied more recently to the construction of learning curves in cardiac surgery, general surgery, and anesthesiology.6-9 Standard CUSUM methodology defines each event—in our study, each robotic hysterectomy case—as a success or failure and tracks the sequence of events between two predefined parameters—the acceptable control limit and the unacceptable control limit. For each success, the CUSUM score decreases toward the acceptable control limit; for each failure, it increases toward the unacceptable limit.
In our study, a procedure was considered a success if no complication occurred; it was a failure if a complication did occur. The acceptable control limit was based on published complication rates of abdominal hysterectomy, and the unacceptable limit was set at twice that rate. A surgeon would be considered proficient when his or her CUSUM chart crosses the lower control limit, signifying that the surgeon’s complication rate is lower than the rate associated with abdominal hysterectomy. We used abdominal complication rates rather than those of laparoscopic hysterectomy because only abdominal and vaginal hysterectomy were performed at our institution, and the robotic system was introduced as a minimally invasive alternative to the abdominal approach.
We also conducted a risk-adjusted CUSUM analysis that was weighted for identified risk factors for complications. As in the standard CUSUM analysis, each score decreases for a successful attempt and increases for an unsuccessful attempt, but the scores are variable, depending on patient risk factors. That is, the score increases more for a complication in a low-risk patient than in a high-risk patient, and vice versa.
Instead of tracking between acceptable and unacceptable limits, the CUSUM scores were plotted around a line representing a predicted complication rate to determine whether complications for a particular surgeon were occurring more often, less often, or as predicted, based on patient risk factors.
Results based on intraoperative complications. With the score based only on intraoperative complications, we observed one surgeon to cross the acceptable control limit after 96 cases and a second surgeon to be trending toward a similar crossing point, although this surgeon had completed only 76 procedures. We calculated the average number of cases needed to develop proficiency to be 91 to cross the acceptable control limit.
Results based on intraoperative and postoperative complications. We also conducted a second analysis that was based on intraoperative and postoperative complications within 6 weeks of surgery. Our two surgeons crossed the acceptable control limit after 21 and 14 cases, respectively, using these parameters. We calculated the average number of cases needed to cross the acceptable control limit to be 44. We considered intraoperative complications to be most indicative of surgical skill; therefore, we concluded that 91 cases are needed to become proficient.
Any learning curve is an individual process
Our findings should not be used as a blanket mark of proficiency. Our conclusion is at first striking, but must be viewed within the context of CUSUM methodology. Ninety-one hysterectomy cases is an average number based on acceptable and unacceptable complication rates; we found it to be consistent with our observations of two active robotic surgeons.
However, any learning curve—not just in robotic hysterectomy—is an individual process dependent on many variables. An experienced, high-volume laparoscopic surgeon may reach proficiency with robotic hysterectomy in many fewer cases than our ballpark number of 91, just as an inexperienced, low-volume surgeon may take many more than 91 procedures to become proficient. Some surgeons may never become proficient. For these reasons, it is inappropriate to assign any single number as a mark of proficiency. Because of its original intent, CUSUM analysis assesses each surgeon on an individual basis and compares that surgeon to an objective benchmark, enabling it to take individual variances in surgeon attributes into account.
CUSUM analysis is a useful tool for surgical quality monitoring
Because it was designed for quality control, this methodology is most suitable when it is applied to assess a surgeon’s progress toward (or away from) proficiency, rather than to assign a representative number to classify a surgeon as proficient. By tracking a surgeon’s particular successes or failures with a procedure, CUSUM analysis can identify problems in an individual’s surgical quality.
If complication rates are tracking near, or cross, the unacceptable control limit using the standard method, or if they trend upward, away from the predicted complication rate with the risk-adjusted method, this fact should arouse concern so that the problem can be identified before patient safety is compromised.
Potential problems contributing to increased complications
Identifiable contributors to an increased complication rate could be intrinsic to the surgeon, such as:
- inadequate training
- low surgical volume
- sleep deprivation
- other personal issues.
Problems extrinsic to the surgeon also could be identified, such as:
- new policy changes in the surgical suite
- new staff assistance during cases
- excessive trainee involvement in surgery.
Ideally, both the standard and risk-adjusted CUSUM methods would be based on institution-specific complication rates and patient risk factors to make them internally valid. In this scenario, CUSUM analysis provides an opportunity for intervention to improve surgical quality and patient outcomes not only in robotic hysterectomy but also in any surgical procedure.
A surgeon’s proficiency waxes and wanes
At its most fundamental level, a learning curve for robotic surgery should be considered an individual continuum. A surgeon’s proficiency will wax and wane throughout his or her career, depending on any number of variables, including surgical volume, case complexity, practice setting, and personal attributes.
Although our findings suggest that a gynecologist, on average, will require 91 cases to become proficient in robotic hysterectomy, an overall benefit of robotic hysterectomy over abdominal hysterectomy was observed after completion of 21 and 14 cases by our two surgeons. We do not believe that credentialing bodies should mandate that 91 robotic hysterectomies be required of a surgeon. That approach would be too simplistic and obfuscates many of the true implications of our study—most importantly, that learning a new procedure is an individual process that must be compared with an acceptable outcome to determine proficiency and maintain patient safety.
After reading the Editorial on proficiency in robotic hysterectomy, tell us:
- How do you and/or your institution measure surgical proficiency?
- Do you agree that a surgeon’s proficiency with the robot should be considered an individual continuum? Why? Why not?
Write to us at [email protected], or click here. Include your name and city and state, and we’ll consider publishing your comments in an upcoming issue of OBG Management.
1. Woelk JL, Casiano ER, Weaver AL, Gostout BS, Trabuco EC, Gebhart JB. The learning curve of robotic hysterectomy. Obstet Gynecol. 2013;121(1):87-95.
2. Lenihan JP, Jr, Kovanda C, Seshadri-Kreaden U. What is the learning curve for robotic assisted gynecologic surgery? J Minim Invasive Gynecol. 2008;15(5):589-594.
3. Pitter MC, Anderson P, Blissett A, Pemberton N. Robotic-assisted gynaecological surgery—establishing training criteria; minimizing operative time and blood loss. Int J Med Robot. 2008;4(2):114-120.
4. Bell MC, Torgerson JL, Kreaden U. The first 100 da Vinci hysterectomies: an analysis of the learning curve for a single surgeon. S D Med. 2009;62(3):91, 93-95.
5. Page ES. Continuous inspection schemes. Biometrika. 1954;41:100-115.
6. Komatsu R, Kasuya Y, Yogo H, et al. Learning curves for bag-and-mask ventilation and orotracheal intubation: an application of the cumulative sum method. Anesthesiology. 2010;112(6):1525-1531.
7. Novick RJ, Fox SA, Kiaii BB, et al. Analysis of the learning curve in telerobotic, beating heart coronary artery bypass grafting: a 90-patient experience. Ann Thorac Surg. 2003;76(3):749-753.
8. Novick RJ, Stitt LW. The learning curve of an academic cardiac surgeon: use of the CUSUM method. J Card Surg. 1999;14(5):312-322.
9. Okrainec A, Ferri LE, Feldman LS, Fried GM. Defining the learning curve in laparoscopic paraesophageal hernia repair: a CUSUM analysis. Surg Endosc. 2011;25(4):1083-1087.

Joshua L. Woelk, MD, MS
Dr. Woelk is a Urogynecologist and Pelvic Reconstructive Surgeon at the Urogynecology and Continence Center at Methodist Physicians Clinic in Omaha, Nebraska.

John B. Gebhart, MD, MS
Dr. Gebhart is Associate Professor and Fellowship Program Director at the Mayo Clinic in Rochester, Minnesota.
The authors report no financial relationships relevant to this article.
Joshua L. Woelk, MD, MS
Dr. Woelk is a Urogynecologist and Pelvic Reconstructive Surgeon at the Urogynecology and Continence Center at Methodist Physicians Clinic in Omaha, Nebraska.
John B. Gebhart, MD, MS
Dr. Gebhart is Associate Professor and Fellowship Program Director at the Mayo Clinic in Rochester, Minnesota.
The authors report no financial relationships relevant to this article.
To read 9 recent articles from OBG Management on the pros and cons of robotic surgery, click here.
In 2007, we and our colleagues began assessing the experience necessary to gain proficiency with robotic hysterectomy, and we published our findings early this year.1 We concluded that the number of cases needed to reach this threshold is about 91—many more than the 20 to 50 cases previously reported.2-4 Earlier studies defined proficiency in relation to the stabilization of operative times, which is subjective, somewhat arbitrary, and ignores patient outcomes.
To better elucidate the learning curve of robotic hysterectomy, we focused on a more objective, patient-centered analysis that utilized cumulative summation, or CUSUM, analysis and operative complications. This approach mitigates many of the problems encountered in earlier studies and reveals broader implications for the adoption of new surgical techniques and surgical quality control.
How CUSUM analysis works
E. S. Page introduced CUSUM analysis in 1954 for use in industrial quality control.5 This approach has been applied more recently to the construction of learning curves in cardiac surgery, general surgery, and anesthesiology.6-9 Standard CUSUM methodology defines each event—in our study, each robotic hysterectomy case—as a success or failure and tracks the sequence of events between two predefined parameters—the acceptable control limit and the unacceptable control limit. For each success, the CUSUM score decreases toward the acceptable control limit; for each failure, it increases toward the unacceptable limit.
In our study, a procedure was considered a success if no complication occurred; it was a failure if a complication did occur. The acceptable control limit was based on published complication rates of abdominal hysterectomy, and the unacceptable limit was set at twice that rate. A surgeon would be considered proficient when his or her CUSUM chart crosses the lower control limit, signifying that the surgeon’s complication rate is lower than the rate associated with abdominal hysterectomy. We used abdominal complication rates rather than those of laparoscopic hysterectomy because only abdominal and vaginal hysterectomy were performed at our institution, and the robotic system was introduced as a minimally invasive alternative to the abdominal approach.
We also conducted a risk-adjusted CUSUM analysis that was weighted for identified risk factors for complications. As in the standard CUSUM analysis, each score decreases for a successful attempt and increases for an unsuccessful attempt, but the scores are variable, depending on patient risk factors. That is, the score increases more for a complication in a low-risk patient than in a high-risk patient, and vice versa.
Instead of tracking between acceptable and unacceptable limits, the CUSUM scores were plotted around a line representing a predicted complication rate to determine whether complications for a particular surgeon were occurring more often, less often, or as predicted, based on patient risk factors.
Results based on intraoperative complications. With the score based only on intraoperative complications, we observed one surgeon to cross the acceptable control limit after 96 cases and a second surgeon to be trending toward a similar crossing point, although this surgeon had completed only 76 procedures. We calculated the average number of cases needed to develop proficiency to be 91 to cross the acceptable control limit.
Results based on intraoperative and postoperative complications. We also conducted a second analysis that was based on intraoperative and postoperative complications within 6 weeks of surgery. Our two surgeons crossed the acceptable control limit after 21 and 14 cases, respectively, using these parameters. We calculated the average number of cases needed to cross the acceptable control limit to be 44. We considered intraoperative complications to be most indicative of surgical skill; therefore, we concluded that 91 cases are needed to become proficient.
Any learning curve is an individual process
Our findings should not be used as a blanket mark of proficiency. Our conclusion is at first striking, but must be viewed within the context of CUSUM methodology. Ninety-one hysterectomy cases is an average number based on acceptable and unacceptable complication rates; we found it to be consistent with our observations of two active robotic surgeons.
However, any learning curve—not just in robotic hysterectomy—is an individual process dependent on many variables. An experienced, high-volume laparoscopic surgeon may reach proficiency with robotic hysterectomy in many fewer cases than our ballpark number of 91, just as an inexperienced, low-volume surgeon may take many more than 91 procedures to become proficient. Some surgeons may never become proficient. For these reasons, it is inappropriate to assign any single number as a mark of proficiency. Because of its original intent, CUSUM analysis assesses each surgeon on an individual basis and compares that surgeon to an objective benchmark, enabling it to take individual variances in surgeon attributes into account.
CUSUM analysis is a useful tool for surgical quality monitoring
Because it was designed for quality control, this methodology is most suitable when it is applied to assess a surgeon’s progress toward (or away from) proficiency, rather than to assign a representative number to classify a surgeon as proficient. By tracking a surgeon’s particular successes or failures with a procedure, CUSUM analysis can identify problems in an individual’s surgical quality.
If complication rates are tracking near, or cross, the unacceptable control limit using the standard method, or if they trend upward, away from the predicted complication rate with the risk-adjusted method, this fact should arouse concern so that the problem can be identified before patient safety is compromised.
Potential problems contributing to increased complications
Identifiable contributors to an increased complication rate could be intrinsic to the surgeon, such as:
- inadequate training
- low surgical volume
- sleep deprivation
- other personal issues.
Problems extrinsic to the surgeon also could be identified, such as:
- new policy changes in the surgical suite
- new staff assistance during cases
- excessive trainee involvement in surgery.
Ideally, both the standard and risk-adjusted CUSUM methods would be based on institution-specific complication rates and patient risk factors to make them internally valid. In this scenario, CUSUM analysis provides an opportunity for intervention to improve surgical quality and patient outcomes not only in robotic hysterectomy but also in any surgical procedure.
A surgeon’s proficiency waxes and wanes
At its most fundamental level, a learning curve for robotic surgery should be considered an individual continuum. A surgeon’s proficiency will wax and wane throughout his or her career, depending on any number of variables, including surgical volume, case complexity, practice setting, and personal attributes.
Although our findings suggest that a gynecologist, on average, will require 91 cases to become proficient in robotic hysterectomy, an overall benefit of robotic hysterectomy over abdominal hysterectomy was observed after completion of 21 and 14 cases by our two surgeons. We do not believe that credentialing bodies should mandate that 91 robotic hysterectomies be required of a surgeon. That approach would be too simplistic and obfuscates many of the true implications of our study—most importantly, that learning a new procedure is an individual process that must be compared with an acceptable outcome to determine proficiency and maintain patient safety.
After reading the Editorial on proficiency in robotic hysterectomy, tell us:
- How do you and/or your institution measure surgical proficiency?
- Do you agree that a surgeon’s proficiency with the robot should be considered an individual continuum? Why? Why not?
Write to us at [email protected], or click here. Include your name and city and state, and we’ll consider publishing your comments in an upcoming issue of OBG Management.
1. Woelk JL, Casiano ER, Weaver AL, Gostout BS, Trabuco EC, Gebhart JB. The learning curve of robotic hysterectomy. Obstet Gynecol. 2013;121(1):87-95.
2. Lenihan JP, Jr, Kovanda C, Seshadri-Kreaden U. What is the learning curve for robotic assisted gynecologic surgery? J Minim Invasive Gynecol. 2008;15(5):589-594.
3. Pitter MC, Anderson P, Blissett A, Pemberton N. Robotic-assisted gynaecological surgery—establishing training criteria; minimizing operative time and blood loss. Int J Med Robot. 2008;4(2):114-120.
4. Bell MC, Torgerson JL, Kreaden U. The first 100 da Vinci hysterectomies: an analysis of the learning curve for a single surgeon. S D Med. 2009;62(3):91, 93-95.
5. Page ES. Continuous inspection schemes. Biometrika. 1954;41:100-115.
6. Komatsu R, Kasuya Y, Yogo H, et al. Learning curves for bag-and-mask ventilation and orotracheal intubation: an application of the cumulative sum method. Anesthesiology. 2010;112(6):1525-1531.
7. Novick RJ, Fox SA, Kiaii BB, et al. Analysis of the learning curve in telerobotic, beating heart coronary artery bypass grafting: a 90-patient experience. Ann Thorac Surg. 2003;76(3):749-753.
8. Novick RJ, Stitt LW. The learning curve of an academic cardiac surgeon: use of the CUSUM method. J Card Surg. 1999;14(5):312-322.
9. Okrainec A, Ferri LE, Feldman LS, Fried GM. Defining the learning curve in laparoscopic paraesophageal hernia repair: a CUSUM analysis. Surg Endosc. 2011;25(4):1083-1087.
Win Whitcomb: Hospital Value-Based Purchasing Program Adds Measure in Efficiency Domain

HVBP’s First Efficiency Measure
Move over, cost, LOS—make room for ‘Medicare spending per beneficiary’
The unwritten rule in hospitalist circles is that lower cost and length of stay (LOS) mean higher efficiency, with hospitalists (me included) often pointing to one or both of these as a yardstick of performance in the efficiency domain. But if we lower hospital length of stay and costs while shifting costs to post-hospital care, have we solved anything?
This very question was raised by Kuo and Goodwin’s observational study that revealed that decreased hospital costs and LOS were offset by higher utilization and costs after discharge under hospitalist care.1
Efficiency As a Domain of Quality
Using the Institute of Medicine’s (IOM) six domains of quality as a framework (see Table 1, right), the Centers for Medicare & Medicaid Services’ (CMS) Hospital Value-Based Purchasing (HVBP) program seeks to encourage enhanced quality in all of the IOM domains. For HVBP 2015, we see the addition of the first measure in the domain of efficiency.
You may be saying to yourself, “It’s only 2013. Why should I worry about HVBP 2015?” Here’s why: The measurement periods for HVBP 2015 are May to December 2011 (baseline) and May to December 2013 (performance). Hospitals can succeed under HVBP if they demonstrate improvement from baseline or attainment, which indicates maintenance of a high level of performance despite no substantial improvement from baseline. Medicare spending per beneficiary (MSPB) will make up 20% of the 2015 HVBP incentive pool for hospitals.
Medicare Spending Per Beneficiary Instead of Costs or LOS
Why did CMS choose to use MSPB as a measure and not simply hospital costs or length of stay? Measuring efficiency of hospital care has proven to be a sticky wicket. If one simply measures and rewards decreased hospital costs and/or length of stay (which you might legitimately argue is exactly what the current DRG system does by paying a case rate to the hospital), one runs the risk of shifting costs to settings beyond the four walls of the hospital, or even fueling higher rates of hospital readmissions. Also, physician costs and other costs (therapy, home care) are not accounted for; they are accounted for under MSPB (described below). Finally, hospital costs and LOS vary substantially across regions and by severity of illness of the patients being analyzed. This makes it difficult to compare, for example, LOS in California versus Massachusetts.
The MSPB is designed to be a comprehensive and equitable metric:
- It seeks to eliminate cost-shifting among settings by widening the time period from three days prior to 30 days post-inpatient-care episode;
- It looks at the full cost of care by including expenses from both Medicare Part A (hospital) and Part B (doctors, PT, OT, home health, others);
- It incorporates risk adjustment by taking into account differences in patient health status; and
- It seeks to level the playing field by using a price standardization methodology that factors in geographic payment differences in wages, practice costs, and payments for indirect medical education and disproportionate share hospitals (those that treat large numbers of the indigent population).
Driving High Performance in Medicare Spending Per Beneficiary
Hospitalists straddle the Part A and Part B elements of Medicare; they have one foot in the hospital and one foot in the physician practice world. They should be able to improve their hospitals’ performance under the MSPB yardstick. Since the performance measurement period starts in May, now is the time to sharpen your focus on MSPB.
Here are the top priorities for MSPB that I recommend for hospitalists:
Reduction of marginally beneficial resource utilization. This is a process of analyzing resource (e.g. pharmacy, radiology, laboratory, blood products) utilization for the purpose of minimizing costly practices that do not benefit the patient. This is an essential practice of a high-functioning hospitalist program. Through its participation in the Choosing Wisely campaign (see “Stop! Think Twice Before You Order,” p. 46), SHM has helped hospitalists have conversations about these practices with patients.
Hospital throughput. Work on “front end” throughput with the ED by having a process in place to quickly evaluate and facilitate potential admissions. Work with case management to assure timely (and early in the day) discharges.
Safe-discharge processes. We reviewed key elements of a safe discharge last month and provided a link to SHM’s Project BOOST (www.hospitalmedicine.org/boost). From the MSPB perspective: A safe discharge minimizes exorbitant spending after discharge.
Documentation integrity. Because MSPB is risk-adjusted, the more the record reflects patient severity of illness, the better your hospital will perform, all else being equal. Work collaboratively with your documentation integrity professionals!
Much of the success of the HM specialty has been built on the tenet that the hospitalist model delivers efficient inpatient care. In the coming years, the specialty’s contribution will increasingly be gauged by the MSPB measure.
Reference
Dr. Whitcomb is medical director of healthcare quality at Baystate Medical Center in Springfield, Mass. He is a co-founder and past president of SHM. Email him at [email protected].
STOP all activities that may lead to further shoulder impaction when you suspect possible shoulder dystocia
Shoulder dystocia is an obstetric complication that occurs in up to 1.4% of deliveries.1 Although the vast majority can be managed successfully, the complication is associated with risk of fetal injury. The most serious injury is brachial plexus palsy, which occurs in 4% to 40% of shoulder dystocia cases, although less than 10% of these injuries are permanent. Other injuries include fractures of the clavicle and humerus; in rare instances the complication may be associated with fetal asphyxia and death. Early recognition of the complication followed by an orderly approach to management will reduce the risk of fetal injury.
First, recognize shoulder dystocia and take control
Recognition of shoulder dystocia immediately followed by avoidance of further impaction, particularly of the anterior shoulder against the symphysis pubis, will likely increase the chances of successful resolution.
These factors should lead you to anticipate shoulder dystocia during delivery:
- suspected macrosomia
- diabetic parturient
- prolonged second stage.
However, a high percentage of cases occur in women without risk factors. Because persistent or forceful traction, used in an attempt to deliver the anterior shoulder, may be one of the causes of brachial plexus injury, early recognition of shoulder dystocia, followed by a halt of further traction, reduces the risk of that injury.
In my experience, if some movement of the anterior shoulder does not occur after 2 to 3 seconds of gentle downward guidance, you need to consider the possibility of shoulder dystocia. It is also important to take control of the situation: Instruct the patient to stop pushing and family members to stop urging the patient to push.
Click here to read 5 recent articles on shoulder dystocia
Avoid panic. Initiate a care-team management algorithm.
Having a management algorithm that can be quickly recalled and initiated allows the care team to proceed in an orderly fashion and remain calm and avoid panic, particularly if the dystocia is severe. In obstetric emergencies, panic is your enemy, leading to inefficient activity, team confusion, and an increased likelihood that an error in judgment (too much traction, fundal pressure) may occur. I advise my residents that whenever there are risk factors for shoulder dystocia, or it is suspected for any reason, to do a mental run-through of the management steps.
Rehearse the algorithm. It will make a difference in the delivery room.
To most effectively use a management algorithm, rehearsal using team training drills or simulation is necessary. Studies support simulation and team training even for individuals who have completed training in obstetrics or midwifery. Crofts and colleagues videotaped 450 simulations of shoulder dystocia involving 95 certified nurse midwives and 45 physicians.2 The authors noted that 1) shoulder dystocia could not be resolved in 57% of cases, and 2) there was frequent confusion regarding how to perform the internal maneuvers, with poor communication among team members. This same group of researchers later demonstrated that skills in managing shoulder dystocia improved significantly after simulation training. In fact, a high proportion of “trainees” maintained their skill level when tested a year later.3
Finally, when evaluating the impact of training on actual clinical outcomes in their hospital, Crofts and colleagues noted that the rate of obstetric brachial plexus injury fell from 7.4% in a 4-year period prior to training, to 2.3% in a 4-year period after training.4
Practice within your own L&D unit
The use of in situ simulation (ie, simulation within the labor and delivery unit) has two major advantages:
- It is more realistic than practicing within a lab. Systems issues, such as lack of a uniform procedure for getting help or a lack of chairs in the labor room to assist with performance of suprapubic pressure, can be identified.
- The full team, including ward clerks and other support personnel, can be part of the simulation more readily.
The box on this page provides a possible process to use in managing shoulder dystocia. If there has not been an opportunity for this training, practitioners, at the very least, should be cognizant of the steps they are going to take in managing such cases.
- Recognition of shoulder dystocia
- Stop bearing down and stop traction
- Communicate with staff and patient
- Call for help and begin timekeeping
- Initiate the McRoberts maneuver*
- Suprapubic pressure (may be combined with Rubin’s maneuver, pushing on anterior or posterior shoulder to rotate to an oblique position)*
- Attempt delivery of posterior arm (episiotomy can be performed at this step, if needed)*,**
- Woods screw or Rubin’s maneuver*,**
- Repeat above steps if delivery not accomplished
- Gaskin (all fours) maneuver*
- Zavanelli maneuver and cesarean delivery
- Document event and communicate with patient and family (use of checklists such as the one published by ACOG may help standardize the process)
* The patient can resume bearing down and the clinician can use gentle downward guidance after performing the maneuver. If there is no progress, continue to the next maneuver.
** Order of performance of secondary maneuvers may vary, although Gaskin maneuver may be best carried out near the end due to the need for repositioning and possible reduced patient mobility due to epidural anesthesia.
What should you do after primary maneuvers fail?
Try to deliver the posterior arm. Although the order of maneuvers in the proposed algorithm may vary, a recent study using a database of more than 130,000 deliveries suggests that use of posterior arm delivery after failure of primary maneuvers, such as McRoberts or suprapubic pressure, may more likely result in resolution.5
Start from the beginning, and try again. If the first set of maneuvers does not resolve the problem, running through them again usually leads to success. Although the risk of fetal hypoxia increases the longer it takes to resolve the dystocia, it may actually facilitate delivery because fetal tone may also decrease.
Zavanelli maneuver. In general, use of the Zavanelli maneuver with replacement of the fetal head accompanied by cesarean section is a last resort; there is a lack of data to support its use earlier in the process or more frequently. This maneuver requires reversing the cardinal movements related to head descent in order to successfully complete replacement.
Shoulder dystocia in obese patients proves more difficult
In my own experience with obese patients, suprapubic pressure is often ineffective due to the presence of a large fat pad or pannus. Use of an anterior Rubin’s maneuver to rotate the shoulders about 30° to the oblique often facilitates delivery.
Liberal use of episiotomy to facilitate posterior arm delivery or rotational maneuvers is often necessary with obese patients.
Documentation is key
Documentation of the dystocia event in the patient’s permanent record should not occur until after the care team has discussed the case. This will ensure that the maneuvers utilized and the related timing of events are recorded accurately. This is critically important should a lawsuit occur, since discrepancies or errors in charting will hamper defense of the case. A checklist, such as the one provided by the American College of Obstetricians and Gynecologists, lists key points that should be recorded and outlines important steps related to the event.6
We want to hear from you! Tell us what you think.
Most of our monthly Medical Verdicts columns include cases about shoulder dystocia, brachial plexus injury, or Erb’s palsy. CLICK HERE to read those from 2012 and 2013.
1. American College of Obstetricians and Gynecologists. ACOG Practice Bulletin No. 40: Shoulder dystocia. Obstet Gynecol. 2002;100(5 Part 1):1045-1050.
2. Crofts JF, Fox R, Ellis D, Winter C, Hinshaw K, Draycott TJ. Observations from 450 shoulder dystocia simulations: lessons for skills training. Obstet Gynecol. 2008;112(4):906-912.
3. Crofts JF, Bartlett C, Ellis D, Hunt LP, Fox R, Draycott TJ. Management of shoulder dystocia: skill retention 6 and 12 months after training. Obstet Gynecol. 2007;110(5):1069-1074.
4. Draycott TJ, Crofts JF, Ash JP, et al. Improving neonatal outcome through practical shoulder dystocia training. Obstet Gynecol. 2008;112(1):14-20.
5. Hoffman MK, Bailit JL, Branch DW, et al. Consortium on Safe Labor. A comparison of obstetric maneuvers for the acute management of shoulder dystocia. Obstet Gynecol. 2011;117(6):1272-1278.
6. American College of Obstetricians and Gynecologists. Patient Safety Checklist, Number 6: Documenting shoulder dystocia. http://www.acog.org/Resources_And_Publications/Patient_Safety_Checklists. Published August 2012. Accessed February 12, 2013.
EXPERT COMMENTARY

Ronald T. Burkman, MD
Professor, Department of Obstetrics and Gynecology, Tufts University School of Medicine, Boston, Massachusetts.
The author reports no financial relationships relevant to this article.
EXPERT COMMENTARY
Ronald T. Burkman, MD
Professor, Department of Obstetrics and Gynecology, Tufts University School of Medicine, Boston, Massachusetts.
The author reports no financial relationships relevant to this article.
EXPERT COMMENTARY
Ronald T. Burkman, MD
Professor, Department of Obstetrics and Gynecology, Tufts University School of Medicine, Boston, Massachusetts.
The author reports no financial relationships relevant to this article.
Shoulder dystocia is an obstetric complication that occurs in up to 1.4% of deliveries.1 Although the vast majority can be managed successfully, the complication is associated with risk of fetal injury. The most serious injury is brachial plexus palsy, which occurs in 4% to 40% of shoulder dystocia cases, although less than 10% of these injuries are permanent. Other injuries include fractures of the clavicle and humerus; in rare instances the complication may be associated with fetal asphyxia and death. Early recognition of the complication followed by an orderly approach to management will reduce the risk of fetal injury.
First, recognize shoulder dystocia and take control
Recognition of shoulder dystocia immediately followed by avoidance of further impaction, particularly of the anterior shoulder against the symphysis pubis, will likely increase the chances of successful resolution.
These factors should lead you to anticipate shoulder dystocia during delivery:
- suspected macrosomia
- diabetic parturient
- prolonged second stage.
However, a high percentage of cases occur in women without risk factors. Because persistent or forceful traction, used in an attempt to deliver the anterior shoulder, may be one of the causes of brachial plexus injury, early recognition of shoulder dystocia, followed by a halt of further traction, reduces the risk of that injury.
In my experience, if some movement of the anterior shoulder does not occur after 2 to 3 seconds of gentle downward guidance, you need to consider the possibility of shoulder dystocia. It is also important to take control of the situation: Instruct the patient to stop pushing and family members to stop urging the patient to push.
Click here to read 5 recent articles on shoulder dystocia
Avoid panic. Initiate a care-team management algorithm.
Having a management algorithm that can be quickly recalled and initiated allows the care team to proceed in an orderly fashion and remain calm and avoid panic, particularly if the dystocia is severe. In obstetric emergencies, panic is your enemy, leading to inefficient activity, team confusion, and an increased likelihood that an error in judgment (too much traction, fundal pressure) may occur. I advise my residents that whenever there are risk factors for shoulder dystocia, or it is suspected for any reason, to do a mental run-through of the management steps.
Rehearse the algorithm. It will make a difference in the delivery room.
To most effectively use a management algorithm, rehearsal using team training drills or simulation is necessary. Studies support simulation and team training even for individuals who have completed training in obstetrics or midwifery. Crofts and colleagues videotaped 450 simulations of shoulder dystocia involving 95 certified nurse midwives and 45 physicians.2 The authors noted that 1) shoulder dystocia could not be resolved in 57% of cases, and 2) there was frequent confusion regarding how to perform the internal maneuvers, with poor communication among team members. This same group of researchers later demonstrated that skills in managing shoulder dystocia improved significantly after simulation training. In fact, a high proportion of “trainees” maintained their skill level when tested a year later.3
Finally, when evaluating the impact of training on actual clinical outcomes in their hospital, Crofts and colleagues noted that the rate of obstetric brachial plexus injury fell from 7.4% in a 4-year period prior to training, to 2.3% in a 4-year period after training.4
Practice within your own L&D unit
The use of in situ simulation (ie, simulation within the labor and delivery unit) has two major advantages:
- It is more realistic than practicing within a lab. Systems issues, such as lack of a uniform procedure for getting help or a lack of chairs in the labor room to assist with performance of suprapubic pressure, can be identified.
- The full team, including ward clerks and other support personnel, can be part of the simulation more readily.
The box on this page provides a possible process to use in managing shoulder dystocia. If there has not been an opportunity for this training, practitioners, at the very least, should be cognizant of the steps they are going to take in managing such cases.
- Recognition of shoulder dystocia
- Stop bearing down and stop traction
- Communicate with staff and patient
- Call for help and begin timekeeping
- Initiate the McRoberts maneuver*
- Suprapubic pressure (may be combined with Rubin’s maneuver, pushing on anterior or posterior shoulder to rotate to an oblique position)*
- Attempt delivery of posterior arm (episiotomy can be performed at this step, if needed)*,**
- Woods screw or Rubin’s maneuver*,**
- Repeat above steps if delivery not accomplished
- Gaskin (all fours) maneuver*
- Zavanelli maneuver and cesarean delivery
- Document event and communicate with patient and family (use of checklists such as the one published by ACOG may help standardize the process)
* The patient can resume bearing down and the clinician can use gentle downward guidance after performing the maneuver. If there is no progress, continue to the next maneuver.
** Order of performance of secondary maneuvers may vary, although Gaskin maneuver may be best carried out near the end due to the need for repositioning and possible reduced patient mobility due to epidural anesthesia.
What should you do after primary maneuvers fail?
Try to deliver the posterior arm. Although the order of maneuvers in the proposed algorithm may vary, a recent study using a database of more than 130,000 deliveries suggests that use of posterior arm delivery after failure of primary maneuvers, such as McRoberts or suprapubic pressure, may more likely result in resolution.5
Start from the beginning, and try again. If the first set of maneuvers does not resolve the problem, running through them again usually leads to success. Although the risk of fetal hypoxia increases the longer it takes to resolve the dystocia, it may actually facilitate delivery because fetal tone may also decrease.
Zavanelli maneuver. In general, use of the Zavanelli maneuver with replacement of the fetal head accompanied by cesarean section is a last resort; there is a lack of data to support its use earlier in the process or more frequently. This maneuver requires reversing the cardinal movements related to head descent in order to successfully complete replacement.
Shoulder dystocia in obese patients proves more difficult
In my own experience with obese patients, suprapubic pressure is often ineffective due to the presence of a large fat pad or pannus. Use of an anterior Rubin’s maneuver to rotate the shoulders about 30° to the oblique often facilitates delivery.
Liberal use of episiotomy to facilitate posterior arm delivery or rotational maneuvers is often necessary with obese patients.
Documentation is key
Documentation of the dystocia event in the patient’s permanent record should not occur until after the care team has discussed the case. This will ensure that the maneuvers utilized and the related timing of events are recorded accurately. This is critically important should a lawsuit occur, since discrepancies or errors in charting will hamper defense of the case. A checklist, such as the one provided by the American College of Obstetricians and Gynecologists, lists key points that should be recorded and outlines important steps related to the event.6
We want to hear from you! Tell us what you think.
Most of our monthly Medical Verdicts columns include cases about shoulder dystocia, brachial plexus injury, or Erb’s palsy. CLICK HERE to read those from 2012 and 2013.
1. American College of Obstetricians and Gynecologists. ACOG Practice Bulletin No. 40: Shoulder dystocia. Obstet Gynecol. 2002;100(5 Part 1):1045-1050.
2. Crofts JF, Fox R, Ellis D, Winter C, Hinshaw K, Draycott TJ. Observations from 450 shoulder dystocia simulations: lessons for skills training. Obstet Gynecol. 2008;112(4):906-912.
3. Crofts JF, Bartlett C, Ellis D, Hunt LP, Fox R, Draycott TJ. Management of shoulder dystocia: skill retention 6 and 12 months after training. Obstet Gynecol. 2007;110(5):1069-1074.
4. Draycott TJ, Crofts JF, Ash JP, et al. Improving neonatal outcome through practical shoulder dystocia training. Obstet Gynecol. 2008;112(1):14-20.
5. Hoffman MK, Bailit JL, Branch DW, et al. Consortium on Safe Labor. A comparison of obstetric maneuvers for the acute management of shoulder dystocia. Obstet Gynecol. 2011;117(6):1272-1278.
6. American College of Obstetricians and Gynecologists. Patient Safety Checklist, Number 6: Documenting shoulder dystocia. http://www.acog.org/Resources_And_Publications/Patient_Safety_Checklists. Published August 2012. Accessed February 12, 2013.
Can a single progesterone test distinguish viable and nonviable pregnancies accurately in women with pain or bleeding?
Obstetrics
Jaimey M. Pauli, MD, and John T. Repke, MD (Update, January 2013)
Evolving applications of first-trimester ultrasound
Ilan E. Timor-Tritsch, MD, and Simi K. Gupta, MD (December 2012)
Is the hCG discriminatory zone a reliable indicator of intrauterine or ectopic pregnancy?
Andrew M. Kaunitz, MD (Examining the Evidence, February 2012)
A few outliers don’t justify dismissing the hCG
discriminatory zone
(Comment & Controversy, April 2012)
It is not uncommon to see a patient in her first trimester who is experiencing abdominal pain or vaginal bleeding or both. At my institution, we use the beta human chorionic gonadotropin (ß-hCG) value in conjunction with transvaginal ultrasonography to determine whether the pregnancy is a viable intrauterine pregnancy, a missed spontaneous abortion, or an ectopic gestation. However, even a combination of modalities can be inconclusive, necessitating repeated ß-hCG measurements and several ultrasound images. For the patient, it can provoke considerable anxiety to be told to wait and see if the pregnancy will continue.
Testing will not distinguish ectopic from intrauterine gestations
In their meta-analysis, Verhaegen and colleagues focused on a single measurement of progesterone to predict the pregnancy outcome in women who experienced pain or bleeding, or both. In early pregnancy, progesterone is produced first by the corpus luteum, then by the placenta. It stands to reason that nonviable pregnancies would have a lower level.
Although measurement of the progesterone level will not help distinguish an ectopic gestation from an intrauterine pregnancy, it does help identify nonviable pregnancy. This study found that a progesterone level below 6 ng/mL excluded a viable pregnancy in 99.2% of cases. Measuring progesterone could be very helpful when the ß-hCG level is low and ultrasound imaging is inconclusive. Currently, we tell patients under these circumstances that we need more time to sort it all out—we need to establish a trend for the ß-hCG and repeat ultrasonography. However, if we added assessment of the progesterone level and it were less than 6 ng/mL, we would be able to determine with near certainty that the pregnancy is nonviable. As a result, we could provide patients with some certainty earlier than we would otherwise be able to, even if it were not the news they had hoped to hear.
When the serum progesterone level is higher than 6 ng/mL, it doesn’t guarantee a viable pregnancy. Rather, it leaves us about where we were without it—somewhat unsure as to how things will turn out.
Testing may save money in the long run
Another advantage of adding the assessment of progesterone level may be lowered costs. If the progesterone level is less than 6 ng/mL and we can determine with almost 100% assurance when a pregnancy is nonviable, we stand to save the costs associated with additional visits, imaging, and ß-hCG testing. The authors did not address this issue, but perhaps another study will look at it more closely.
When a patient presents with pain or vaginal bleeding, or both, in early pregnancy, and ß-hCG measurement and ultrasonographic imaging are inconclusive, a single measurement of the woman’s progesterone level can help determine whether the pregnancy is viable. Values below 6 ng/mL suggest, with almost 100% certainty, that the gestation is nonviable.
LINDA R. CHAMBLISS, MD, MPH
We want to hear from you! Tell us what you think.
John Nelson: Why Spinal Epidural Abcess Poses A Particular Liability Risk for Hospitalists

Delayed diagnosis of, or treatment for, a spinal epidural abscess (SEA): that will be the case over which you are sued.
Over the last 15 years, I’ve served as an expert witness for six or seven malpractice cases. Most were related to spinal cord injuries, and in all but one of those, the etiology was epidural abscess. I’ve been asked to review about 40 or 50 additional cases, and while I’ve turned them down (I just don’t have time to do reviews), I nearly always ask about the clinical picture in every case. A significant number have been SEA-related. This experience has convinced me that SEA poses a particular liability risk for hospitalists.
Of course, it is patients who bear the real risk and unfortunate consequences of SEA. Being a defendant physician in a lawsuit is stressful, but it’s nothing compared to the distress of permanent loss of neurologic function. To prevent permanent sequelae, we need to maintain a very high index of suspicion to try to make a prompt diagnosis, and ensure immediate intervention once the diagnosis is made.
Data from Malpractice Insurers
I had the pleasure of getting to know a number of leaders at The Doctor’s Company, a large malpractice insurer that provides malpractice policies for all specialties, including a lot of hospitalists. From 2007 to 2011, they closed 28 SEA-related claims, for which they spent an average of $212,000 defending each one. Eleven of the 28 resulted in indemnity payments averaging $754,000 each (median was $455,000). These dollar amounts are roughly double what might be seen for all other claims and reflect only the payments made on behalf of the company’s insured doctors. The total award to each patient was likely much higher, because in most cases, several defendants (other doctors and a hospital) probably paid money to the patient.
The Physician Insurers Association of America (PIAA) “is the insurance industry trade association representing domestic and international medical professional liability insurance companies.” Their member malpractice insurance companies have the opportunity to report claims data that PIAA aggregates and makes available. Data from 2002 to 2011 showed 312 closed claims related to any diagnosis (not just SEA) for hospitalists, with an average indemnity payment of $272,553 (the highest hospitalist-related payment was $1.4 million). The most common allegations related to paid claims were 1) “errors in diagnosis,” 2) “failure/delay in referral or consultation,” and 3) “failure to supervise/monitor case.” Although only three of the 312 claims were related to “diseases of the spinal cord,” that was exceeded in frequency only by “diabetes.”
I think these numbers from the malpractice insurance industry support my concern that SEA is a high-risk area, but it doesn’t really support my anecdotal experience that SEA is clearly hospitalists’ highest-risk area. Maybe SEA is only one of several high-risk areas. Nevertheless, I’m going to stick to my sensationalist guns to get your attention.
Why Is Epidural Abscess a High Risk?
There likely are several reasons SEA is a treacherous liability problem. It can lead to devastating permanent disabling neurologic deficits in people who were previously healthy, and if the medical care was substandard, then significant financial compensation seems appropriate.
Delays in diagnosis of SEA are common. It can be a very sneaky illness that in the early stages is very easy to confuse with less-serious causes of back pain or fever. Even though I think about this particular diagnosis all the time, just last year I had a patient who reported an increase in his usual back pain. I felt reassured that he had no neurologic deficit or fever, and took the time to explain why there was no reason to repeat the spine MRI that had been done about two weeks prior to admission. But he was insistent that he have another MRI, and after a day or two I finally agreed to order it, assuring him it would not explain the cause of his pain. But it did. He had a significant SEA and went to emergency surgery. I was stunned, and profoundly relieved that he had no neurologic sequelae.
One of the remarkable things I’ve seen in the cases I’ve reviewed is that even when there is clear cause for concern, there is too often no action taken. In a number of cases, the nurses’ note indicates increasing back pain, loss of ability to stand, urinary retention, and other alarming signs. Yet the doctors either never learn of these issues, or they choose to attribute them to other causes.
Even when the diagnosis of SEA is clearly established, it is all too common for doctors caring for the patient not to act on this information. In several cases I reviewed, a radiologist had documented reporting the diagnosis to the hospitalist (and in one case the neurosurgeon as well), yet nothing was done for 12 hours or more. It is hard to imagine that establishing this diagnosis doesn’t reliably lead to an emergent response, but it doesn’t. (In some cases, nonsurgical management may be an option, but in these malpractices cases, there was just a failure to act on the diagnosis with any sort of plan.)
Practice Management Perspective
I usually discuss hospitalist practice operations in this space—things like work schedules and compensation. But attending to risk management is one component of effective practice operations, so I thought I’d raise the topic here. Obviously, there is a lot more to hospitalist risk management than one diagnosis, but a column on the whole universe of risk management would probably serve no purpose other than as a sleep aid. I hope that by focusing solely on SEA, there is some chance that you’ll remember it, and you’ll make sure that you disprove my first two sentences.
Lowering your risk of a malpractice lawsuit is valuable and worth spending time on. But far more important is that by keeping the diagnosis in mind, and ensuring that you act emergently when there is cause for concern, you might save someone from the devastating consequences of this disease.
Dr. Nelson has been a practicing hospitalist since 1988. He is co-founder and past president of SHM, and principal in Nelson Flores Hospital Medicine Consultants. He is co-director for SHM’s “Best Practices in Managing a Hospital Medicine Program” course. Write to him at [email protected].
Win Whitcomb: Mortality Rates Become a Measuring Stick for Hospital Performance

—Blue Oyster Cult
The designers of the hospital value-based purchasing (HVBP) program sought to include outcomes measures in 2014, and when they did, mortality was their choice. Specifically, HVBP for fiscal-year 2014 (starting October 2013) will include 30-day mortality rates for myocardial infarction, heart failure, and pneumonia. The weighting for the mortality domain will be 25% (see Table 1).
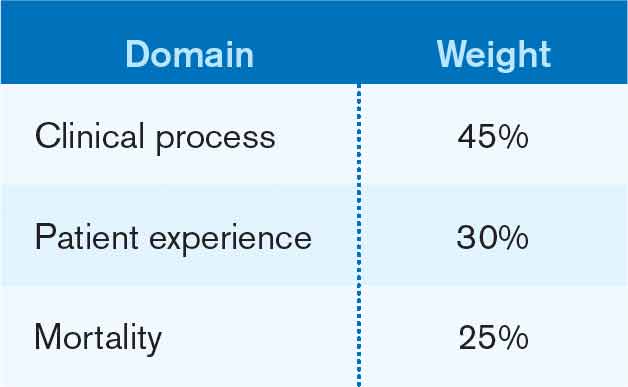
To review the requirements for the HVBP program in FY2014: All hospitals will have 1.25% of their Medicare inpatient payments withheld. They can earn back none, some, all, or an amount in excess of the 1.25%, depending on performance in the performance domains. To put it in perspective, 1.25% of Medicare inpatient payments for a 320-bed hospital are about $1 million. Such a hospital will have about $250,000 at risk in the mortality domain in FY2014.
Given the role hospitalists play in quality and safety initiatives, and the importance of medical record documentation in defining the risk of mortality and severity of illness, we can be crucial players in how our hospitals perform with regard to mortality.
Focus Areas for Mortality Reduction
Although many hospitalists might think that reducing mortality is like “boiling the ocean,” there are some areas where we can clearly focus our attention. There are four priority areas we should target in the coming years (also see Figure 1):
Reduce harm. This may take the form of reducing hospital-acquired infections, such as catheter-related UTIs, Clostridium difficile, and central-line-associated bloodstream infections, or reducing hospital-acquired VTE, falls, and delirium. Many hospital-acquired conditions have a collection, or bundle, of preventive practices. Hospitalists can work both in an institutional leadership capacity and in the course of daily clinical practice to implement bundles and best practices to reduce patient harm.
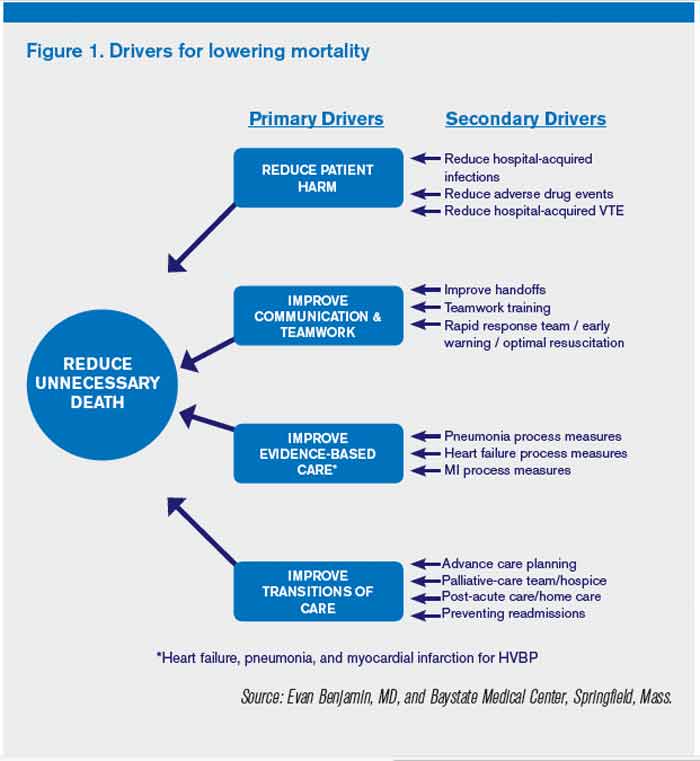
Improve teamwork. With hospitalists, “you started to have teams caring for inpatients in a coordinated way. So I regard this as [hospitalists] coming into their own, their vision of the future starting to really take hold,” said Brent James, coauthor of the recent Institute of Medicine report “Best Care at Lower Cost: The Path to Continuously Learning Health Care in America.” Partly, we’ve accomplished this through simply “showing up” and partly we’ve done it through becoming students of the art and science of teamwork. An example of teamwork training, developed by the Defense Department and the Agency for Healthcare Quality and Research (AHRQ), is TeamSTEPPS, which offers a systematic approach to cooperation, coordination, and communication among team members. Optimal patient resuscitation, in-hospital handoffs, rapid-response teams, and early-warning systems are essential pieces of teamwork that may reduce mortality.
Improve evidence-based care. This domain covers process measures aimed at optimizing care, including reducing mortality. For HVBP in particular, myocardial infarction, heart failure, and pneumonia are the focus.
Improve transitions of care. Best practices for care transitions and reducing readmissions, including advance-care planning, involvement of palliative care and hospice, and coordination with post-acute care, can be a key part of reducing 30-day mortality.
Documentation Integrity
Accurately capturing a patient’s condition in the medical record is crucial to assigning severity of illness and risk of mortality. Because mortality rates are severity-adjusted, accurate documentation is another important dimension to potentially improving a hospital’s performance with regard to the mortality domain. This is one more reason to work closely with your hospital’s documentation specialists.
Don’t Be Afraid...
Proponents of mortality as a quality measure point to it as the ultimate reflection of the care provided. While moving the needle might seem like a task too big to undertake, a disciplined approach to the elements of the driver diagram combined with a robust documentation program can provide your institution with a tangible focus on this definitive measure.
Dr. Whitcomb is medical director of healthcare quality at Baystate Medical Center in Springfield, Mass. He is a co-founder and past president of SHM. Email him at [email protected].
—Blue Oyster Cult
The designers of the hospital value-based purchasing (HVBP) program sought to include outcomes measures in 2014, and when they did, mortality was their choice. Specifically, HVBP for fiscal-year 2014 (starting October 2013) will include 30-day mortality rates for myocardial infarction, heart failure, and pneumonia. The weighting for the mortality domain will be 25% (see Table 1).
To review the requirements for the HVBP program in FY2014: All hospitals will have 1.25% of their Medicare inpatient payments withheld. They can earn back none, some, all, or an amount in excess of the 1.25%, depending on performance in the performance domains. To put it in perspective, 1.25% of Medicare inpatient payments for a 320-bed hospital are about $1 million. Such a hospital will have about $250,000 at risk in the mortality domain in FY2014.
Given the role hospitalists play in quality and safety initiatives, and the importance of medical record documentation in defining the risk of mortality and severity of illness, we can be crucial players in how our hospitals perform with regard to mortality.
Focus Areas for Mortality Reduction
Although many hospitalists might think that reducing mortality is like “boiling the ocean,” there are some areas where we can clearly focus our attention. There are four priority areas we should target in the coming years (also see Figure 1):
Reduce harm. This may take the form of reducing hospital-acquired infections, such as catheter-related UTIs, Clostridium difficile, and central-line-associated bloodstream infections, or reducing hospital-acquired VTE, falls, and delirium. Many hospital-acquired conditions have a collection, or bundle, of preventive practices. Hospitalists can work both in an institutional leadership capacity and in the course of daily clinical practice to implement bundles and best practices to reduce patient harm.
Improve teamwork. With hospitalists, “you started to have teams caring for inpatients in a coordinated way. So I regard this as [hospitalists] coming into their own, their vision of the future starting to really take hold,” said Brent James, coauthor of the recent Institute of Medicine report “Best Care at Lower Cost: The Path to Continuously Learning Health Care in America.” Partly, we’ve accomplished this through simply “showing up” and partly we’ve done it through becoming students of the art and science of teamwork. An example of teamwork training, developed by the Defense Department and the Agency for Healthcare Quality and Research (AHRQ), is TeamSTEPPS, which offers a systematic approach to cooperation, coordination, and communication among team members. Optimal patient resuscitation, in-hospital handoffs, rapid-response teams, and early-warning systems are essential pieces of teamwork that may reduce mortality.
Improve evidence-based care. This domain covers process measures aimed at optimizing care, including reducing mortality. For HVBP in particular, myocardial infarction, heart failure, and pneumonia are the focus.
Improve transitions of care. Best practices for care transitions and reducing readmissions, including advance-care planning, involvement of palliative care and hospice, and coordination with post-acute care, can be a key part of reducing 30-day mortality.
Documentation Integrity
Accurately capturing a patient’s condition in the medical record is crucial to assigning severity of illness and risk of mortality. Because mortality rates are severity-adjusted, accurate documentation is another important dimension to potentially improving a hospital’s performance with regard to the mortality domain. This is one more reason to work closely with your hospital’s documentation specialists.
Don’t Be Afraid...
Proponents of mortality as a quality measure point to it as the ultimate reflection of the care provided. While moving the needle might seem like a task too big to undertake, a disciplined approach to the elements of the driver diagram combined with a robust documentation program can provide your institution with a tangible focus on this definitive measure.
Dr. Whitcomb is medical director of healthcare quality at Baystate Medical Center in Springfield, Mass. He is a co-founder and past president of SHM. Email him at [email protected].
STOP using antiembolism stockings to prevent DVT
PREVENTING VTE?
- VTE risk from hormone therapy varies by formulation
(Web News, October 2012) - Does the risk of unplanned pregnancy outweigh the risk of VTE from hormonal contraception?
Jennifer Gunter, MD (Guest Editorial, October 2012) - Contraception
Tami Rowen, MD, MS; Mitchell D. Creinin, MD (Update, August 2012) - Menopause
Andrew M. Kaunitz, MD (Update, May 2012)
The author reports no financial relationships relevant to this article.
Venous thromboembolism (VTE)—deep vein thrombosis (DVT) and pulmonary embolism (PE)—remains a major cause of morbidity and mortality in the United States, resulting in an estimated 200,000 deaths each year.1 VTE is especially common among inpatients; hospitalization increases the risk of VTE eightfold,2 and VTE is the most common preventable cause of hospital-associated deaths.2,3 Most general medical and surgical inpatients have risk factors for VTE and, without prophylaxis, between 10% and 40% will develop DVT or PE.3 VTE is estimated to cost the US economy $4 billion annually in direct costs and substantially more in indirect costs, including lost productivity and subsequent medical expenses.4
There is no doubt that thromboprophylaxis is effective in preventing VTE in high-risk patients.2,3,5-7 For this reason, the Agency for Healthcare Research and Quality ranks VTE prophylaxis as the single most important patient safety initiative deserving of more widespread implementation.8 The importance of this intervention has also been acknowledged by the Joint Commission,9 and by the Centers for Medicare & Medicaid Services, which include VTE prophylaxis in their Surgical Care Improvement Project (SCIP) quality measures that guide hospital reimbursement.10
All patients undergoing surgery (including cesarean delivery) should be considered at high risk for VTE. Additional risk factors include, among others:
- personal or family history of VTE
- known inherited or acquired thrombophilia
- obesity
- advancing age
- prolonged immobility or bed rest
- cancer.2,3,5-7
Although there is general consensus that high-risk patients require thromboprophylaxis, exactly what form of prophylaxis to recommend remains controversial.
Graduated compression stockings may cause harm
Graduated compression stockings (also known as TED stockings) are commonly regarded as a safe and noninvasive method for preventing VTE. However, evidence in support of their efficacy is lacking. A recent consensus statement from the American College of Physicians recommended “against the use of mechanical prophylaxis with graduated compression stockings for prevention of venous thromboembolism (Grade: strong recommendation, moderate-quality evidence)” in medical and stroke patients.5 In support of their recommendation, the authors of this consensus statement cite a lack of evidence of benefit and significant evidence of patient harm related to skin breakdown from compression stockings. This recommendation is likely relevant also for obstetric and gynecologic patients. For this reason, I propose that the use of graduated compression stockings for DVT prophylaxis be abandoned.
Chemoprophylaxis should be routine in high-risk inpatients
VTE chemoprophylaxis with low molecular weight heparin (LMWH; eg, dalteparin or enoxaparin) or low-dose unfractionated heparin remains the most effective prophylactic measure and should be routine in all high-risk obstetric and gynecologic inpatients.2,3,5-7 Pneumatic compression devices and chemoprophylaxis may provide synergistic protection against VTE.5
Cesarean delivery affects need for prophylaxis
Although pregnancy is an independent risk factor for VTE, the absolute risk of VTE in an otherwise healthy patient is only about 0.05% in both the antepartum and postpartum periods.11 For this reason, routine VTE prophylaxis in pregnant patients would certainly cause more harm than good, and is not recommended. However, cesarean delivery doubles the risk of VTE, with an absolute risk in low-risk parturients of approximately 1 in 1,000 patients.12 And 85% of fatal PE cases in pregnancy follow cesarean delivery. For these reasons, placement of pneumatic compression devices and/or administration of LMWH is recommended before cesarean delivery for all women not already receiving chemoprophylaxis.7
One clarification. Although the use of graduated compression stockings to prevent VTE should be abandoned entirely, there is some evidence that compression stockings with an ankle pressure of 30 to 40 mm Hg may help reduce the risk of long-term phlebitis syndrome in patients with established DVT in pregnancy.13 Therefore, use of compression stockings may be considered in this setting.
We want to hear from you! Tell us what you think.
1. Horlander KT, Mannino DM, Leeper KV. Pulmonary embolism mortality in the United States 1979-1998: an analysis using multiple-cause mortality data. Arch Intern Med. 2003;163(14):1711-1717.
2. Michota F. Bridging the gap between evidence and practice in venous thromboembolism prophylaxis: quality improvement process. J Gen Intern Med. 2007;22(12):1762-1770.
3. Geerts WH, Bergqvist D, Pineo GF, et al. Prevention of venous thromboembolism: American College of Chest Physicians Evidence-Based Clinical Practice Guidelines. 8th ed. Chest. 2008;133(suppl 6):381S-453S.
4. Shorr A. The pharmacoeconomics of deep venous thrombosis treatment. Am J Med. 2007;120(10 Suppl 2):35S-41S.
5. Qaseem A, Chou R, Humphrey LL, et al. Clinical Guidelines Committee of the American College of Physicians. Venous thromboembolism prophylaxis in hospitalized patients: a clinical practice guideline from the American College of Physicians. Ann Int Med. 2011;155(9):625-632.
6. Committee on Practice Bulletins—Gynecology, American College of Obstetricians and Gynecologists. Practice Bulletin No. 84: Prevention of deep vein thrombosis and pulmonary embolism. Obstet Gynecol. 2007;110(2 Pt 1):429-440.
7. Committee on Practice Bulletins—Obstetrics, American College of Obstetricians and Gynecologists. Practice Bulletin No. 123: Thromboembolism in pregnancy. Obstet Gynecol. 2011;118(3):718-729.
8. Shojania KG, Duncan BW, McDonald KM, Wachter RM, Markowitz AJ. Making health care safer: a critical analysis of patient safety practices. Evid Rep Technol Assessment (Summ). 2001;(43):l-x, 1-668.
9. The Joint Commission. 2011 Comprehensive Accreditation Manual for Hospitals: The Official Handbook. Oak Brook IL: Joint Commission Resources; 2010.
10. Centers for Medicare & Medicaid Services (CMS). Medicare Program—Revisions to Hospital Outpatient Prospective Payment System and Calendar Year 2007 Payment Rates; Final Rule. Baltimore Maryland: CMS; November 24, 2006.
11. Bourjeily G, Paidas M, Khalil H, Rosene-Montella K, Rodger M. Pulmonary embolism in pregnancy. Lancet. 2010;375(9713):500-512.
12. Macklon NS, Greer IA. Venous thromboembolic disease in obstetrics and gynaecology: the Scottish experience. Scott Med J. 1996;41(3):83-86.
13. Brandjes DPM, Buller HR, Heijboer H, et al. Randomised trial of effect of compression stockings in patients with symptomatic proximal-vein thrombosis. Lancet. 1997;349(9054):759-762.

EXPERT COMMENTARY
Errol R. Norwitz, MD, PhD
Louis E. Phaneuf Professor of Obstetrics and Gynecology, Tufts University School of Medicine, and Chair, Department of Obstetrics and Gynecology, Tufts Medical Center, Boston, Massachusetts. Dr. Norwitz serves on the OBG Management Board of Editors.
EXPERT COMMENTARY
Errol R. Norwitz, MD, PhD
Louis E. Phaneuf Professor of Obstetrics and Gynecology, Tufts University School of Medicine, and Chair, Department of Obstetrics and Gynecology, Tufts Medical Center, Boston, Massachusetts. Dr. Norwitz serves on the OBG Management Board of Editors.
EXPERT COMMENTARY
Errol R. Norwitz, MD, PhD
Louis E. Phaneuf Professor of Obstetrics and Gynecology, Tufts University School of Medicine, and Chair, Department of Obstetrics and Gynecology, Tufts Medical Center, Boston, Massachusetts. Dr. Norwitz serves on the OBG Management Board of Editors.
PREVENTING VTE?
- VTE risk from hormone therapy varies by formulation
(Web News, October 2012) - Does the risk of unplanned pregnancy outweigh the risk of VTE from hormonal contraception?
Jennifer Gunter, MD (Guest Editorial, October 2012) - Contraception
Tami Rowen, MD, MS; Mitchell D. Creinin, MD (Update, August 2012) - Menopause
Andrew M. Kaunitz, MD (Update, May 2012)
The author reports no financial relationships relevant to this article.
Venous thromboembolism (VTE)—deep vein thrombosis (DVT) and pulmonary embolism (PE)—remains a major cause of morbidity and mortality in the United States, resulting in an estimated 200,000 deaths each year.1 VTE is especially common among inpatients; hospitalization increases the risk of VTE eightfold,2 and VTE is the most common preventable cause of hospital-associated deaths.2,3 Most general medical and surgical inpatients have risk factors for VTE and, without prophylaxis, between 10% and 40% will develop DVT or PE.3 VTE is estimated to cost the US economy $4 billion annually in direct costs and substantially more in indirect costs, including lost productivity and subsequent medical expenses.4
There is no doubt that thromboprophylaxis is effective in preventing VTE in high-risk patients.2,3,5-7 For this reason, the Agency for Healthcare Research and Quality ranks VTE prophylaxis as the single most important patient safety initiative deserving of more widespread implementation.8 The importance of this intervention has also been acknowledged by the Joint Commission,9 and by the Centers for Medicare & Medicaid Services, which include VTE prophylaxis in their Surgical Care Improvement Project (SCIP) quality measures that guide hospital reimbursement.10
All patients undergoing surgery (including cesarean delivery) should be considered at high risk for VTE. Additional risk factors include, among others:
- personal or family history of VTE
- known inherited or acquired thrombophilia
- obesity
- advancing age
- prolonged immobility or bed rest
- cancer.2,3,5-7
Although there is general consensus that high-risk patients require thromboprophylaxis, exactly what form of prophylaxis to recommend remains controversial.
Graduated compression stockings may cause harm
Graduated compression stockings (also known as TED stockings) are commonly regarded as a safe and noninvasive method for preventing VTE. However, evidence in support of their efficacy is lacking. A recent consensus statement from the American College of Physicians recommended “against the use of mechanical prophylaxis with graduated compression stockings for prevention of venous thromboembolism (Grade: strong recommendation, moderate-quality evidence)” in medical and stroke patients.5 In support of their recommendation, the authors of this consensus statement cite a lack of evidence of benefit and significant evidence of patient harm related to skin breakdown from compression stockings. This recommendation is likely relevant also for obstetric and gynecologic patients. For this reason, I propose that the use of graduated compression stockings for DVT prophylaxis be abandoned.
Chemoprophylaxis should be routine in high-risk inpatients
VTE chemoprophylaxis with low molecular weight heparin (LMWH; eg, dalteparin or enoxaparin) or low-dose unfractionated heparin remains the most effective prophylactic measure and should be routine in all high-risk obstetric and gynecologic inpatients.2,3,5-7 Pneumatic compression devices and chemoprophylaxis may provide synergistic protection against VTE.5
Cesarean delivery affects need for prophylaxis
Although pregnancy is an independent risk factor for VTE, the absolute risk of VTE in an otherwise healthy patient is only about 0.05% in both the antepartum and postpartum periods.11 For this reason, routine VTE prophylaxis in pregnant patients would certainly cause more harm than good, and is not recommended. However, cesarean delivery doubles the risk of VTE, with an absolute risk in low-risk parturients of approximately 1 in 1,000 patients.12 And 85% of fatal PE cases in pregnancy follow cesarean delivery. For these reasons, placement of pneumatic compression devices and/or administration of LMWH is recommended before cesarean delivery for all women not already receiving chemoprophylaxis.7
One clarification. Although the use of graduated compression stockings to prevent VTE should be abandoned entirely, there is some evidence that compression stockings with an ankle pressure of 30 to 40 mm Hg may help reduce the risk of long-term phlebitis syndrome in patients with established DVT in pregnancy.13 Therefore, use of compression stockings may be considered in this setting.
We want to hear from you! Tell us what you think.
1. Horlander KT, Mannino DM, Leeper KV. Pulmonary embolism mortality in the United States 1979-1998: an analysis using multiple-cause mortality data. Arch Intern Med. 2003;163(14):1711-1717.
2. Michota F. Bridging the gap between evidence and practice in venous thromboembolism prophylaxis: quality improvement process. J Gen Intern Med. 2007;22(12):1762-1770.
3. Geerts WH, Bergqvist D, Pineo GF, et al. Prevention of venous thromboembolism: American College of Chest Physicians Evidence-Based Clinical Practice Guidelines. 8th ed. Chest. 2008;133(suppl 6):381S-453S.
4. Shorr A. The pharmacoeconomics of deep venous thrombosis treatment. Am J Med. 2007;120(10 Suppl 2):35S-41S.
5. Qaseem A, Chou R, Humphrey LL, et al. Clinical Guidelines Committee of the American College of Physicians. Venous thromboembolism prophylaxis in hospitalized patients: a clinical practice guideline from the American College of Physicians. Ann Int Med. 2011;155(9):625-632.
6. Committee on Practice Bulletins—Gynecology, American College of Obstetricians and Gynecologists. Practice Bulletin No. 84: Prevention of deep vein thrombosis and pulmonary embolism. Obstet Gynecol. 2007;110(2 Pt 1):429-440.
7. Committee on Practice Bulletins—Obstetrics, American College of Obstetricians and Gynecologists. Practice Bulletin No. 123: Thromboembolism in pregnancy. Obstet Gynecol. 2011;118(3):718-729.
8. Shojania KG, Duncan BW, McDonald KM, Wachter RM, Markowitz AJ. Making health care safer: a critical analysis of patient safety practices. Evid Rep Technol Assessment (Summ). 2001;(43):l-x, 1-668.
9. The Joint Commission. 2011 Comprehensive Accreditation Manual for Hospitals: The Official Handbook. Oak Brook IL: Joint Commission Resources; 2010.
10. Centers for Medicare & Medicaid Services (CMS). Medicare Program—Revisions to Hospital Outpatient Prospective Payment System and Calendar Year 2007 Payment Rates; Final Rule. Baltimore Maryland: CMS; November 24, 2006.
11. Bourjeily G, Paidas M, Khalil H, Rosene-Montella K, Rodger M. Pulmonary embolism in pregnancy. Lancet. 2010;375(9713):500-512.
12. Macklon NS, Greer IA. Venous thromboembolic disease in obstetrics and gynaecology: the Scottish experience. Scott Med J. 1996;41(3):83-86.
13. Brandjes DPM, Buller HR, Heijboer H, et al. Randomised trial of effect of compression stockings in patients with symptomatic proximal-vein thrombosis. Lancet. 1997;349(9054):759-762.
Which skin closure technique better reduces the risk of cesarean wound complications: surgical staples or subcuticular suture?
Infectious disease
Patrick Duff, MD (Update, June 2012)
10 practical, evidence-based recommendations for improving maternal outcomes of cesarean delivery
Baha M. Sibai, MD (March 2012)
Does the rate of postcesarean maternal infection vary by uterine closure technique?
Vincenzo Berghella, MD (Examining the Evidence, February 2011)
The two most commonly utilized methods of skin closure after cesarean delivery are nonabsorbable metal staples and absorbable suture.1 A number of investigators have explored these methods of closure in regard to wound complications, pain perception, patient satisfaction, and physician assessment of cosmesis.2
A recent Cochrane meta-analysis of these studies revealed that there were no significant differences between these two methods with respect to wound infection, patient satisfaction, pain perception, or physician assessment of cosmesis.2 However, there was a significant difference between methods in terms of skin separation: Incisions closed with staples were almost four times as likely to be complicated by skin separation.2
Details of the trial
Participants had a viable pregnancy at 24 weeks’ gestation or beyond and were undergoing scheduled or unscheduled cesarean delivery. Of these, 198 women were randomly assigned to staples, and 200 were allocated to suture (Monocryl) for skin closure. Staples were removed 3 to 4 days after delivery for low transverse incisions and 7 to 10 days after delivery for vertical incisions.
Standardized physical examination of the wound was performed at hospital discharge (days 3–4) and 4 to 6 weeks postoperatively. The primary outcome was a composite of wound disruption or infection that occurred 4 to 6 weeks postoperatively; secondary outcomes included operative time, pain, cosmesis, and patient satisfaction with the scar.
Strengths of the trial include sample size
Of the studies that have been published to date, this trial by Figueroa and colleagues is the second largest to compare staples with suture for closure of cesarean skin incisions.
Another strength of this study is its intention-to-treat analysis and the low rate of patients who were lost to follow-up.
This study is similar to the largest study, by Basha and colleagues, that examined skin closure after cesarean, in that women undergoing cesarean delivery via vertical or low transverse incisions were allocated to closure of the skin with staples or absorbable (Monocryl) suture.3 In both studies, staples were removed 3 or 4 days after delivery, although Figueroa and colleagues specified that staples be removed on days 7 to 10 for women who had vertical incisions.3
A few weaknesses may limit generalizability of the findings
Figueroa and colleagues noted that women in their study received prophylactic antibiotics at the time of cord clamping, rather than preoperatively, although the latter approach now is considered more appropriate in terms of reducing wound morbidity.4
Another limitation: Enrollment was terminated early, after enrolling only approximately one-third of the intended sample size. Figueroa and colleagues explain that this decision was based on the findings of Basha and colleagues, which were published during active enrollment of the Figueroa study.3 Not only did Basha and colleagues report a higher incidence of wound complications than Figueroa and colleagues had used to calculate the required sample size, but the Basha study also concluded that sutures may be more optimal for skin closure with respect to skin separation.3
In the study by Figueroa and colleagues, the primary outcome was defined as a composite of wound disruption or infection. However, there was no specification as to length of skin dehiscence that would qualify as disruption—although the investigators did note that the difference in wound disruption remained statistically significant when analyses were limited to wounds involving disruption of more than 1 cm.
As have earlier studies, Figueroa and colleagues found that operative time was longer when sutures were used, compared with staples.
Most earlier studies that assessed cosmesis utilized the Physician Observer Scar Assessment Scale, but this study did not, so it is unclear whether the findings can be compared with prior investigations on this point.
For women undergoing cesarean delivery via low transverse incision, if staples are removed on day 3, the incidence of wound separation is higher—as both this study and earlier studies have demonstrated—so suture may be preferred. If, however, staples are removed later than day 3, data are insufficient to compare wound morbidity on the basis of skin closure techniques. (We recommend staple removal on day 5–10 for women of normal weight, and day 7–10 for women with a body mass index above 30 kg/m2). An additional randomized clinical trial is needed.
DHANYA MACKEEN, MD, MPH, AND
VINCENZO BERGHELLA, MD
We want to hear from you! Tell us what you think.
1. Mackeen AD, Devaraj T, Baxter JK. Cesarean skin closure p: a survey of obstetricians [published online ahead of print January 11 2013]. J Matern Fetal Neonatal Med. doi:10.3109/14767058.2012.755509.
2. Mackeen AD, Berghella V, Larsen ML. Techniques and materials for skin closure in cesarean section. Cochrane Database Syst Rev. 2012;11:CD003577.-doi:10.1002/14651858.CD003577.pub3.
3. Basha SL, Rochon ML, Quinones JN, Coassolo KM, Rust OA, Smulian JC. Randomized controlled trial of wound complication rates of subcuticular suture vs staples for skin closure at cesarean delivery. Am J Obstet Gynecol. 2010;203(3):285.e1-e8.doi:10.1016/j.ajog.2010.07.011.
4. Costantine MM, Rahman M, Ghulmiyah L, et al. Timing of perioperative antibiotics for cesarean delivery: a metaanalysis. Am J Obstet Gynecol. 2008;199(3):301.e1-e6.doi:10.1016/j.ajog.2008.06.077.
Infectious disease
Patrick Duff, MD (Update, June 2012)
10 practical, evidence-based recommendations for improving maternal outcomes of cesarean delivery
Baha M. Sibai, MD (March 2012)
Does the rate of postcesarean maternal infection vary by uterine closure technique?
Vincenzo Berghella, MD (Examining the Evidence, February 2011)
The two most commonly utilized methods of skin closure after cesarean delivery are nonabsorbable metal staples and absorbable suture.1 A number of investigators have explored these methods of closure in regard to wound complications, pain perception, patient satisfaction, and physician assessment of cosmesis.2
A recent Cochrane meta-analysis of these studies revealed that there were no significant differences between these two methods with respect to wound infection, patient satisfaction, pain perception, or physician assessment of cosmesis.2 However, there was a significant difference between methods in terms of skin separation: Incisions closed with staples were almost four times as likely to be complicated by skin separation.2
Details of the trial
Participants had a viable pregnancy at 24 weeks’ gestation or beyond and were undergoing scheduled or unscheduled cesarean delivery. Of these, 198 women were randomly assigned to staples, and 200 were allocated to suture (Monocryl) for skin closure. Staples were removed 3 to 4 days after delivery for low transverse incisions and 7 to 10 days after delivery for vertical incisions.
Standardized physical examination of the wound was performed at hospital discharge (days 3–4) and 4 to 6 weeks postoperatively. The primary outcome was a composite of wound disruption or infection that occurred 4 to 6 weeks postoperatively; secondary outcomes included operative time, pain, cosmesis, and patient satisfaction with the scar.
Strengths of the trial include sample size
Of the studies that have been published to date, this trial by Figueroa and colleagues is the second largest to compare staples with suture for closure of cesarean skin incisions.
Another strength of this study is its intention-to-treat analysis and the low rate of patients who were lost to follow-up.
This study is similar to the largest study, by Basha and colleagues, that examined skin closure after cesarean, in that women undergoing cesarean delivery via vertical or low transverse incisions were allocated to closure of the skin with staples or absorbable (Monocryl) suture.3 In both studies, staples were removed 3 or 4 days after delivery, although Figueroa and colleagues specified that staples be removed on days 7 to 10 for women who had vertical incisions.3
A few weaknesses may limit generalizability of the findings
Figueroa and colleagues noted that women in their study received prophylactic antibiotics at the time of cord clamping, rather than preoperatively, although the latter approach now is considered more appropriate in terms of reducing wound morbidity.4
Another limitation: Enrollment was terminated early, after enrolling only approximately one-third of the intended sample size. Figueroa and colleagues explain that this decision was based on the findings of Basha and colleagues, which were published during active enrollment of the Figueroa study.3 Not only did Basha and colleagues report a higher incidence of wound complications than Figueroa and colleagues had used to calculate the required sample size, but the Basha study also concluded that sutures may be more optimal for skin closure with respect to skin separation.3
In the study by Figueroa and colleagues, the primary outcome was defined as a composite of wound disruption or infection. However, there was no specification as to length of skin dehiscence that would qualify as disruption—although the investigators did note that the difference in wound disruption remained statistically significant when analyses were limited to wounds involving disruption of more than 1 cm.
As have earlier studies, Figueroa and colleagues found that operative time was longer when sutures were used, compared with staples.
Most earlier studies that assessed cosmesis utilized the Physician Observer Scar Assessment Scale, but this study did not, so it is unclear whether the findings can be compared with prior investigations on this point.
For women undergoing cesarean delivery via low transverse incision, if staples are removed on day 3, the incidence of wound separation is higher—as both this study and earlier studies have demonstrated—so suture may be preferred. If, however, staples are removed later than day 3, data are insufficient to compare wound morbidity on the basis of skin closure techniques. (We recommend staple removal on day 5–10 for women of normal weight, and day 7–10 for women with a body mass index above 30 kg/m2). An additional randomized clinical trial is needed.
DHANYA MACKEEN, MD, MPH, AND
VINCENZO BERGHELLA, MD
We want to hear from you! Tell us what you think.
1. Mackeen AD, Devaraj T, Baxter JK. Cesarean skin closure p: a survey of obstetricians [published online ahead of print January 11 2013]. J Matern Fetal Neonatal Med. doi:10.3109/14767058.2012.755509.
2. Mackeen AD, Berghella V, Larsen ML. Techniques and materials for skin closure in cesarean section. Cochrane Database Syst Rev. 2012;11:CD003577.-doi:10.1002/14651858.CD003577.pub3.
3. Basha SL, Rochon ML, Quinones JN, Coassolo KM, Rust OA, Smulian JC. Randomized controlled trial of wound complication rates of subcuticular suture vs staples for skin closure at cesarean delivery. Am J Obstet Gynecol. 2010;203(3):285.e1-e8.doi:10.1016/j.ajog.2010.07.011.
4. Costantine MM, Rahman M, Ghulmiyah L, et al. Timing of perioperative antibiotics for cesarean delivery: a metaanalysis. Am J Obstet Gynecol. 2008;199(3):301.e1-e6.doi:10.1016/j.ajog.2008.06.077.
Win Whitcomb: Hospitalists Central to Helping Hospitals Meet Performance Goals, Avoid Financial Penalities

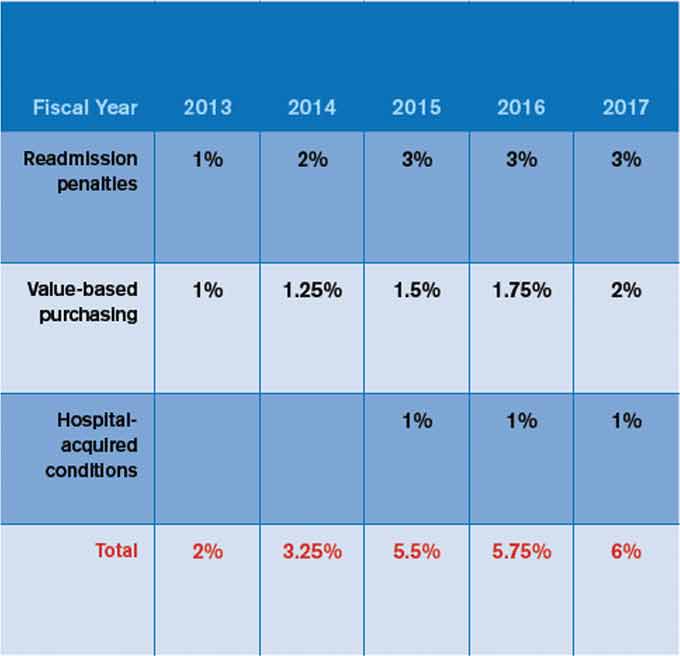
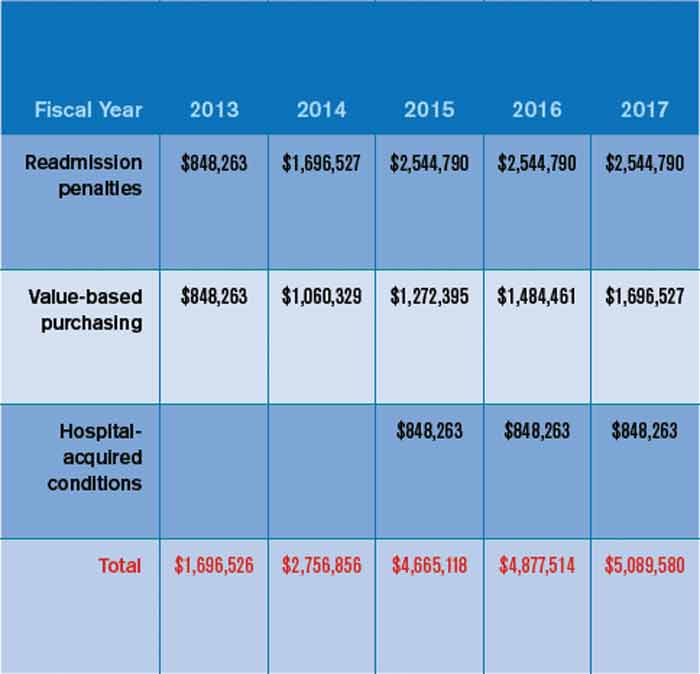
After a long wait, the time where quality really matters to the finance department has arrived. Why? Because now a lot of money is on the line based on hospitals’ ability to demonstrate performance on quality, patient safety, and patient satisfaction measures. And there is no physician group more central to the hospital’s performance on these measures than hospitalists.
To make this point, I will discuss the financial implications of three programs that are part of the Affordable Care Act: hospital value-based purchasing (HVBP), readmission penalties, and hospital-acquired conditions (HACs). Although many have found fault with these programs, especially the ones that only penalize hospitals (HACs and readmissions*), the dollars at risk can represent a new business case for hospitalist programs. High-performing hospitalist programs can positively impact their institution’s income statement.
In October 2012, readmissions penalties and VBP payments/penalties went into effect. In October 2014, a 1% penalty for groups in the worst-performing quartile in the HACs will be in force. Taken together, as Table 1 demonstrates, the total payments at risk will grow such that by fiscal-year 2017, 6% of a hospital’s inpatient payments from Medicare will be at risk. To put this in perspective, Table 2 models the dollars at risk for each of the five years beginning in 2013 for the three programs in a hypothetical, 327-bed hospital. While the risk in 2013 is a modest $1.7 million, by 2017, this hospital has more than $5 million at risk.
So where should hospitalists be focusing their efforts with these three programs and the monies that accompany them? First, for those designing incentive compensation for hospitalists, the incentives should address the applicable elements of these programs. Second, the components of VBP will evolve. For example, 2013 VPB payments are based on 70% process measures (a subset of the core measure set for heart failure, myocardial infarction, pneumonia, and surgery) and 30% patient satisfaction measures. In 2015, VBP will add such outcomes measures as central-line-associated bloodstream infections, catheter UTIs, mortality rates, and the new efficiency measure, Medicare spending per beneficiary. Third, readmissions penalties, while encompassing heart failure, myocardial infarction, and pneumonia for fiscal-year 2013 payments, will expand in fiscal-year 2015 to include chronic obstructive pulmonary disease, coronary artery bypass grafting, percutaneous coronary intervention, and other vascular conditions.
While all this can be hard to keep track of, not to mention address in the course of daily patient care, I suggest hospitalists set the following priorities to enable high performance for their hospitals under these programs:
- Catheter UTIs. Work with nursing, the ED, and other areas to ensure that catheters are indicated, insertion is sterile, there is a mechanism for their prompt removal, specimens are collected and handled appropriately, and that “present on admission” is documented if appropriate.
- Central-line-associated bloodstream infections. Ensure your hospital has the systems in place to support the central-line insertion bundle, and that the bundle elements are followed and documented.
- Readmissions. Focus on heart failure, pneumonia, myocardial infarction, and COPD; work with nursing and case management to identify those at high risk for readmission; perform targeted interventions based on that risk (e.g. palliative care or clinical pharmacy consultation); prioritize medication reconciliation; provide timely communication of discharge summary to the next provider of care; and contact the patient soon after discharge to ensure they are following their plan of care.
- Patient satisfaction. Have a system for high performance on the questions comprising the “doctor communication” domain. These are “How often did doctors treat you with courtesy and respect/listen carefully to you/explain things in a way you could understand?”
Medicare’s Message
Clearly, the financial impacts of hospital quality, satisfaction, and safety are growing, conveying the message from the Centers for Medicare & Medicaid Services (CMS) that quality matters, making a business case for quality. Our focus as leaders in hospital systems improvement will only sharpen as we see hospital payments increasingly affected as a direct consequence of our efforts. If that doesn’t get the attention of the finance department, what will?
Dr. Whitcomb is medical director of healthcare quality at Baystate Medical Center in Springfield, Mass. He is a co-founder and past president of SHM. Email him at [email protected].