User login
Richard Franki is the associate editor who writes and creates graphs. He started with the company in 1987, when it was known as the International Medical News Group. In his years as a journalist, Richard has worked for Cap Cities/ABC, Disney, Harcourt, Elsevier, Quadrant, Frontline, and Internet Brands. In the 1990s, he was a contributor to the ill-fated Indications column, predecessor of Livin' on the MDedge.
Tuberculosis rate drops, disparity continues
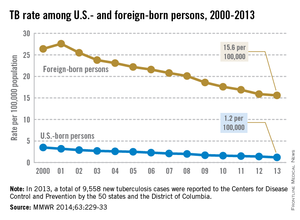
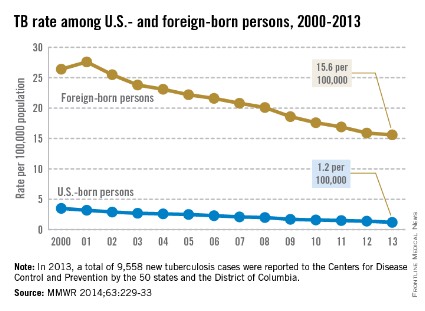
Despite the overall decline in tuberculosis, there continues to be a large disparity in incidence between U.S.-born and foreign-born U.S. residents, the Centers for Disease Control and Prevention reported March 20 in advance of World TB Day, which is on March 24.
In 2013, the TB incidence among foreign-born persons was 15.6 cases per 100,000 population, which was 13 times higher than the rate of 1.2 per 100,000 in U.S.-born persons. The CDC defines a U.S.-born person as anyone born in the United States or in a foreign country but having at least one parent who is a U.S. citizen.
The TB rate declined among both groups from 2012 to 2013, but only by 2.1% among foreign-born persons, compared with 8.4% for U.S.-born persons. Racial/ethnic disparities also continue, with Asians having a TB rate 25.9 times higher and blacks having a rate 6.2 times higher than whites, according to the CDC (MMWR 2014;63:229-33).
In a separate statement, the CDC said that updated recommendations for overseas TB screening of immigrants and refugees have saved the United States an estimated $15 million. Since 2007, people suspected of having TB have been required to undergo a sputum culture instead of a less sensitive microscopic sputum smear test so that their infection could be caught and treated prior to arriving in the United States.
FROM MORBIDITY AND MORTALITY WEEKLY REPORT
Hep C incidence up among most races/ethnicities
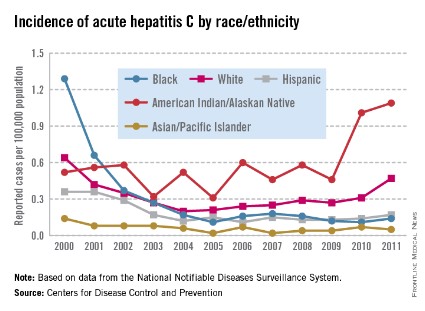
The incidence of acute hepatitis C increased 51.6% among whites from 2010 to 2011, the last year for which data are available, the Centers for Disease Control and Prevention reported.
Over a 2-year period, American Indians and Alaskan Natives had a 137% increase in acute hepatitis C virus (HCV) infections, going from 0.46 reported cases per 100,000 population in 2009 to 1.09 cases per 100,000 in 2011, according to data from the CDC’s National Notifiable Diseases Surveillance System.
These increases were accompanied by smaller rises in HCV incidence among blacks (up 27.3% from 2010 to 2011) and Hispanics (up 21.4% from 2010 to 2011). Asians and Pacific Islanders, who have the lowest rate among the major racial/ethnic groups, saw their HCV incidence drop almost 29% – from 0.07 per 100,000 to 0.05 – from 2010 to 2011, the CDC noted.
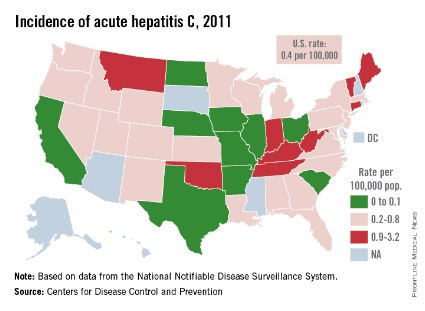
Incidence of acute hep C highest in Kentucky
Kentucky has the highest rate of acute hepatitis C infection – 3.2 cases per 100,000 population – in the United States, according to the Centers for Disease Control and Prevention.
Based on reports from 2011, the last year for which data are available, there were 142 cases of hepatitis C virus (HCV) infection in Kentucky, which was 58 more than Indiana, the state with the second-highest number of cases, and 96 more than West Virginia, the state with the second-highest rate, the CDC reported.
Among the 42 states that submitted reports to the CDC’s National Notifiable Disease Surveillance System, the average rate of acute HCV infection was 0.4 cases per 100,000. The U.S. total of 1,229 cases represents a 44% increase over 2010. Three states – Arkansas, Iowa, and North Dakota – reported zero cases for 2011, the report said.
The CDC also noted that most cases of hepatitis are not reported, and after adjusting for asymptomatic infections and underreporting, the agency estimated that 16,500 new HCV infections occurred in 2011.
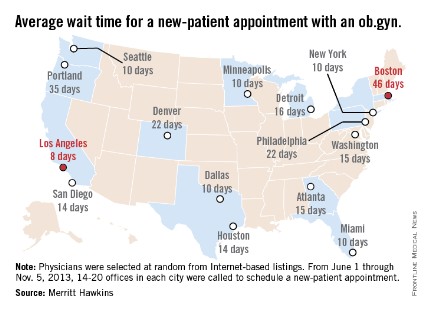
Wait time for ob.gyn. appointment longest in Boston
Boston had the longest wait time for an appointment with an ob.gyn. in a survey conducted in 15 metropolitan areas by physician job placement firm Merritt Hawkins.
The average wait time for a new-patient appointment was 46 days for the 20 Boston-area ob.gyn. offices contacted between June 1, 2013, and Nov. 5, 2013. That was 11 days longer than the city with the next-longest wait – Portland, Ore., at 35 days – but 24 days shorter than Boston’s time in the 2009 version of the survey, Merritt Hawkins reported.
The shortest wait – only 8 days – was in Los Angeles, with Dallas, Minneapolis, New York, Seattle, and Miami right behind at 10 days. The average wait time for all 15 cities was 17.3 days, which was down from the 27.5 days seen in 2009, Merritt Hawkins said.
For the survey, Merritt Hawkins selected 14-20 ob.gyns. from each metropolitan area at random from Internet-based listings. Each practice was called and asked for the first available appointment for a new patient who wanted a routine well-woman gynecologic exam.
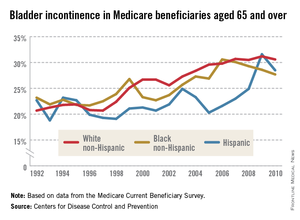
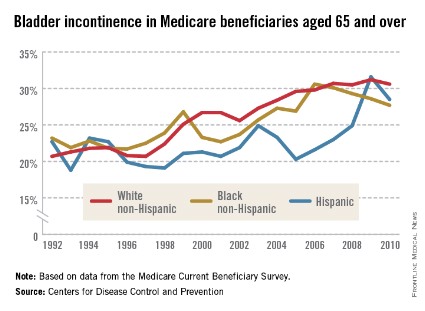
Bladder incontinence up 43% in elderly since 1992
The prevalence of bladder incontinence rose from 21.1% in 1992 to 30.2% in 2010 for Medicare beneficiaries aged 65 years and older – an increase of 43%, according to data from the Medicare Current Beneficiary Survey.
Among white non-Hispanic patients, prevalence of bladder incontinence rose by 48% – going from 20.7% in 1992 to 30.6% in 2010. Prevalence in Hispanics rose from 22.7% in 1992 to 28.5% in 2010, for an increase of almost 26%. Black non-Hispanics saw their prevalence of bladder incontinence rise from 23.2% in 1992 to 27.7% in 2010 – an increase of more than 19%.
In the overall Medicare population for the same time period, bladder incontinence was reported almost twice as often among women – going from 25.8% in 1992 to 38.3% in 2010 – as in men – 13.4% in 1992 and 19.5% in 2010, according to MCBS data on the CDC Health Data Interactive.
Wait time for family practice appointment longest in Boston
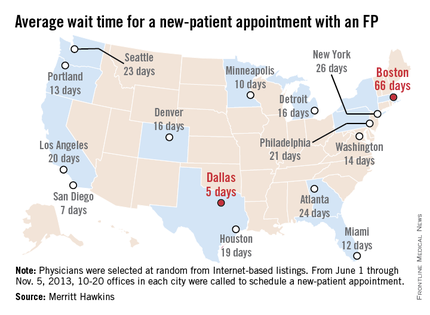
Boston had the longest wait time for an appointment with a family physician in a survey conducted in 15 metropolitan areas by physician job placement firm Merritt Hawkins.
The average wait time for a new-patient appointment was 66 days for the 20 Boston-area FP offices contacted between June 1, 2013, and Nov. 5, 2013. That was 40 days longer than the city with the next-longest wait – New York at 26 days – and 3 days longer than Boston’s time in the 2009 version of the survey, Merritt Hawkins reported.
The shortest wait – only 5 days – was in Dallas, with San Diego right behind at 7 days. The average wait time for all 15 cities was 19.5 days, which was down from the 20.3 days seen in 2009, Merritt Hawkins said.
For the survey, Merritt Hawkins selected 14-20 family physicians from each metropolitan area at random from Internet-based listings. Each practice was called and asked for the first available appointment for a new patient who wanted a routine physical.

Prostate cancer death rate highest in Montana
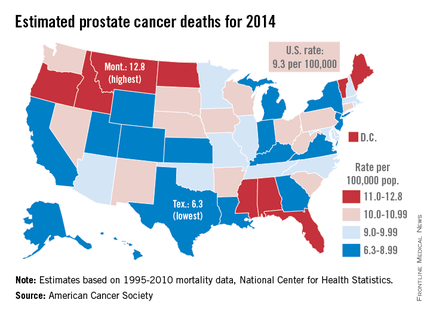
Montana is expected to have the highest rate of prostate cancer deaths in the United States for 2014, and it will be more than twice as high as that of Texas, which should have the lowest rate, the American Cancer Society reported.
Based on mortality data for 1995-2010 from the National Center for Health Statistics, the ACS estimates put the death rate at 12.8 per 100,000 population for Montana and 6.3 per 100,000 for Texas.
After Texas, Wyoming has the lowest estimated prostate cancer rate for 2014 at 6.9 per 100,000, followed by Utah at 7.2. The District of Columbia has the second-highest rate at 12.4 per 100,000, with Maine third at 12.0, according to the ACS estimates.
Although the number of prostate cancer deaths has been decreasing – dropping by an average of 3.1% per year from 2006 to 2010 – it is still the second-leading cause of cancer death in men. With almost 29,500 deaths expected in the United States this year, the national death rate from prostate cancer for 2014 is estimated to be 9.3 per 100,000, according to the ACS report.

West Nile virus has cost the United States nearly $800 million
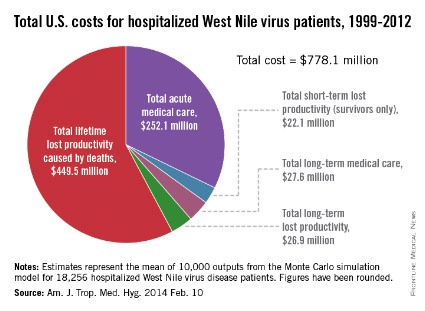
Since the West Nile virus was first detected in New York in 1999, hospitalized patients in the United States have cost an estimated $778.1 million in health care expenditures and lost productivity, according to a study published online Feb. 10 in the American Journal of Tropical Medicine and Hygiene.
Of that $778.1 million, the largest share – $449.5 million, or almost 58% – represents mean lifetime lost productivity from deaths caused by infection. Hospitalization for acute illness was estimated at $252.1 million, long-term medical care cost $27.6 million, long-term lost productivity cost $26.9 million, and short-term lost productivity (survivors only) totaled $22.1 million, investigators from the Centers for Disease Control and Prevention reported.
From 1999 through 2012, there were 37,088 cases of West Nile virus disease reported to the CDC’s ArboNET surveillance system, resulting in more than 18,000 hospitalizations and 1,529 deaths, the investigators said (Am. J. Trop. Med. Hyg. 2014 Feb. 10).
They determined the cost of initial hospitalization for 80 patients in a 2003 West Nile virus outbreak in Colorado, then calculated the cost of additional medical care and missed work for 38 patients who had 5 years of follow-up data available after the initial infection. These costs were then extrapolated to the total number of hospitalized cases in the United States since 1999.
FROM AMERICAN JOURNAL OF TROPICAL MEDICINE AND HYGIENE
Cigarette tax varies considerably among states
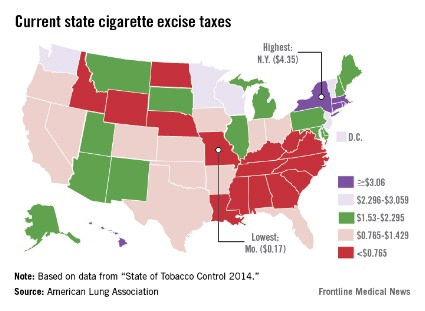
New York has the highest cigarette excise tax in the United States and Missouri has the lowest, with a difference of more than $4 in between, the American Lung Association said in a report released Jan. 22.
New York currently adds $4.35 to the price of each pack of cigarettes sold in the state, compared with Missouri’s lowest-in-the-nation rate of 17 cents per pack. Massachusetts has the second-highest tax at $3.51, while Virginia is second lowest at 30 cents. The U.S. average is $1.53 per pack, according to the association’s "State of Tobacco Control 2014" report.
The report noted a general lack of progress among states in smoking cessation and prevention in 2013, with only two states – Massachusetts and Minnesota – passing significant tax increases, "no states approving comprehensive smokefree workplace laws," and two states – Alaska and North Dakota – funding their tobacco prevention programs "at or above levels" recommended by the Centers for Disease Control and Prevention."
Hawaii named healthiest state in 2013
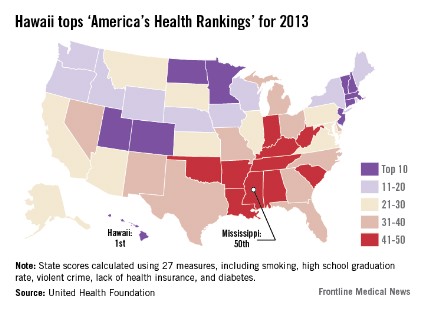
Residents of Hawaii are living in America’s healthiest state, according to "America's Health Rankings- 2013 Edition."
Hawaii, which has never finished out of the top six since the rankings began in 1990, reclaimed the top spot it last held in 2008. Vermont, which finished first in each of the previous 4 years, was second in 2013, followed by Minnesota, Massachusetts, and New Hampshire.
The bottom five consisted of West Virginia (46) and four states in the Southeast: Alabama (47), Louisiana (48), Arkansas (49), and Mississippi (50). Mississippi has finished "among the bottom three states since the inception of the rankings in 1990," the report said.
For the 2013 report, each state was ranked using 27 measures that represent various aspects of health, grouped into five categories: behaviors, community and environment, policy, clinical care, and outcomes.
"America’s Health Rankings" is published jointly by the United Health Foundation, the American Public Health Association, and the Partnership for Prevention. The private, not-for-profit United Health Foundation was founded in 1999 by UnitedHealth Group, which operates UnitedHealthcare.