User login
Updates in Multiple Sclerosis Imaging
Multiple sclerosis (MS) is a complex, chronic immune-mediated disease of the central nervous system characterized by focal inflammation, demyelination, and neurodegeneration. Magnetic resonance imaging (MRI), first incorporated into the McDonald Criteria for the diagnosis of MS in 2001, is an integral tool in the diagnosis, prognosis, and therapeutic monitoring of people with MS (PwMS).1
MRI research in MS is rapidly expanding and offers insights into the pathophysiology of MS with important implications for the routine clinical care of PwMS. At the Consortium of Multiple Sclerosis Centers 2024 Annual Meeting, the US Department of Veterans Affairs (VA) MS Centers of Excellence hosted an educational symposium highlighting MRI biomarkers in MS, including T2-lesions, chronic black holes (cBHs), brain atrophy, paramagnetic rim lesions (PRLs), and the central vein sign (CVS). The symposium also provided a brief overview of quantitative MRI techniques used to characterize MS lesion severity and research applications of these techniques. This clinical review summarizes the main points of that symposium with the goal of introducing key concepts to federal health care practitioners caring for PwMS.
MRI Biomarkers in MS
T2-lesions, Chronic Black Holes, and Brain Atrophy
Focal immune-mediated inflammation and demyelination in MS may be detected by MRI as hyperintense foci on T2-weighted (T2-w) imaging (eg, T2-w turbo spin echo or T2-w fluid attenuated inversion recovery sequences). These T2-lesions, critical for diagnosing MS, are typically ovoid and occur in the periventricular, juxtacortical, infratentorial spinal cord white matter (Figure 1A). T2-lesion number and volume show some association with disability and optic nerve.
Wattjes et al highlight 2 cases to demonstrate this point: a man aged 52 years with MS for 23 years and a woman aged 50 years with MS for 11 years. Despite having MS for a much shorter duration, the woman had worse disability due to a higher lesion number and volume.2 T2-lesion volume also impacts disability progression in PwMS. Gauthier et al compared the probability of progression in 3 women, all of whom were aged 39 years and had MS for 6 years. The profile with highest probability of disability progression had the highest quartile of T2-lesion volume.3 T2-lesion volume over 2 years correlates with worse scores on disability metrics such as the MS functional composite, paced auditory serial addition task, and brain volume.4 A 2024 systematic review and meta-analysis demonstrated that T2-lesion volume is significantly correlated with clinical disability in PwMS.5
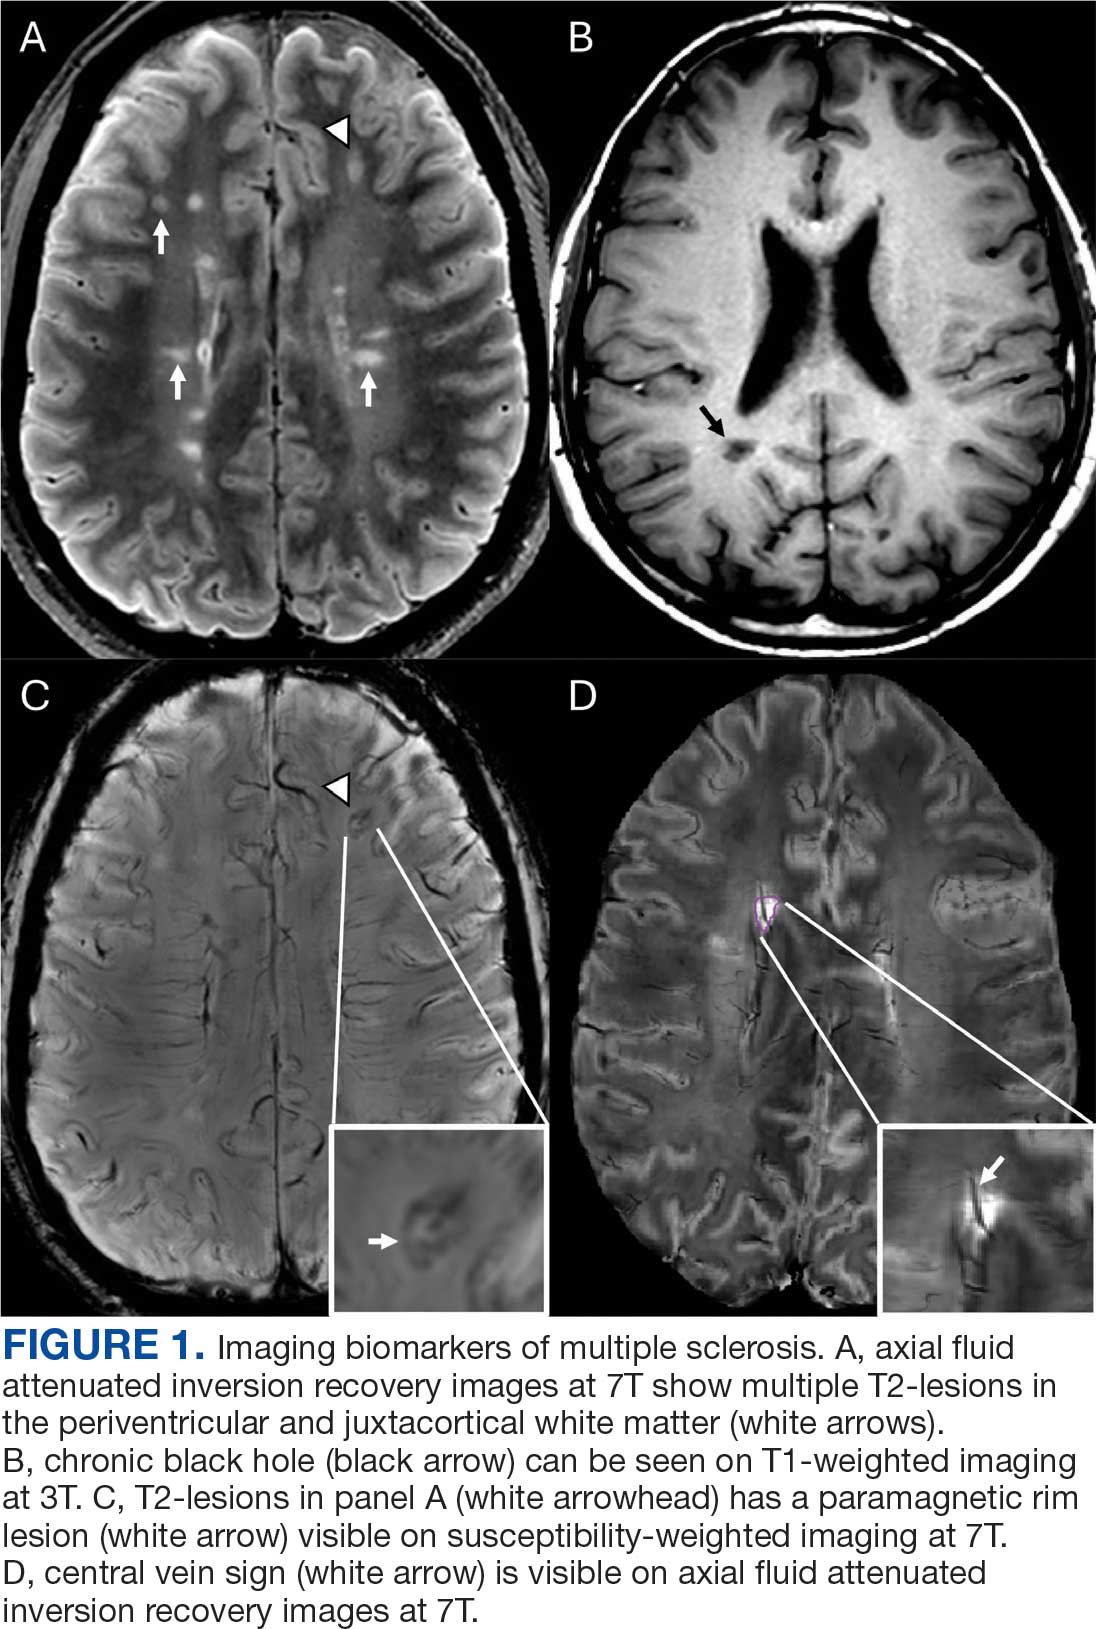
Select T2-lesions are also hypointense on T1-w spin echo images and are known as cBHs (Figure 1B). Histologically, T2-lesions with cBHs have more severe architectural disruption than those without cBHs.6 cBH number and volume are significantly correlated with disability, regardless of the degree of hypointensity on T1-w imaging.5,7 A 10-year longitudinal study demonstrated that cBHs were associated with disease progression after 5 years while T2-lesion volume was not, indicating that cBHs may be a more accurate predictor of disability.8
Brain atrophy, another imaging biomarker of MS, affects both the cerebral white and gray matter. White matter fraction (the volume of white matter relative to the intracranial compartment volume) and gray matter fraction (the volume of gray matter relative to the intracranial compartment) are significantly lower among PwMS compared with healthy controls. In addition, gray matter fraction is lower among patients with primary and secondary progressive MS compared with those with relapsing-remitting MS, clinically isolated syndrome (CIS), and radiologically isolated syndrome (RIS). Gray matter fraction is also correlated with several motor and cognitive disability indices.9
Paramagnetic Rim Lesions
Neurologic worsening in PwMS occurs by 2 distinct mechanisms: relapse-associated worsening, a stepwise worsening of symptoms due to incomplete recovery following a relapse; and progression independent of relapse activity (PIRA), which is an irreversible neurologic deterioration in the absence of clinical or radiological relapses.10 PIRA is associated with neurodegeneration and predominates in both primary and secondary progressive MS. However, recent data demonstrated that PIRA may contribute to as much as 50% of disability worsening in relapsing MS and occurs early in the RMS disease course.10,11 Current high-efficacy disease modifying therapy, such as ocrelizumab, are extraordinarily successful at preventing focal inflammation and relapses but are less effective for preventing the slow march of disability progression characterizing PIRA.12,13 The prevention of PIRA is therefore an unmet treatment need.
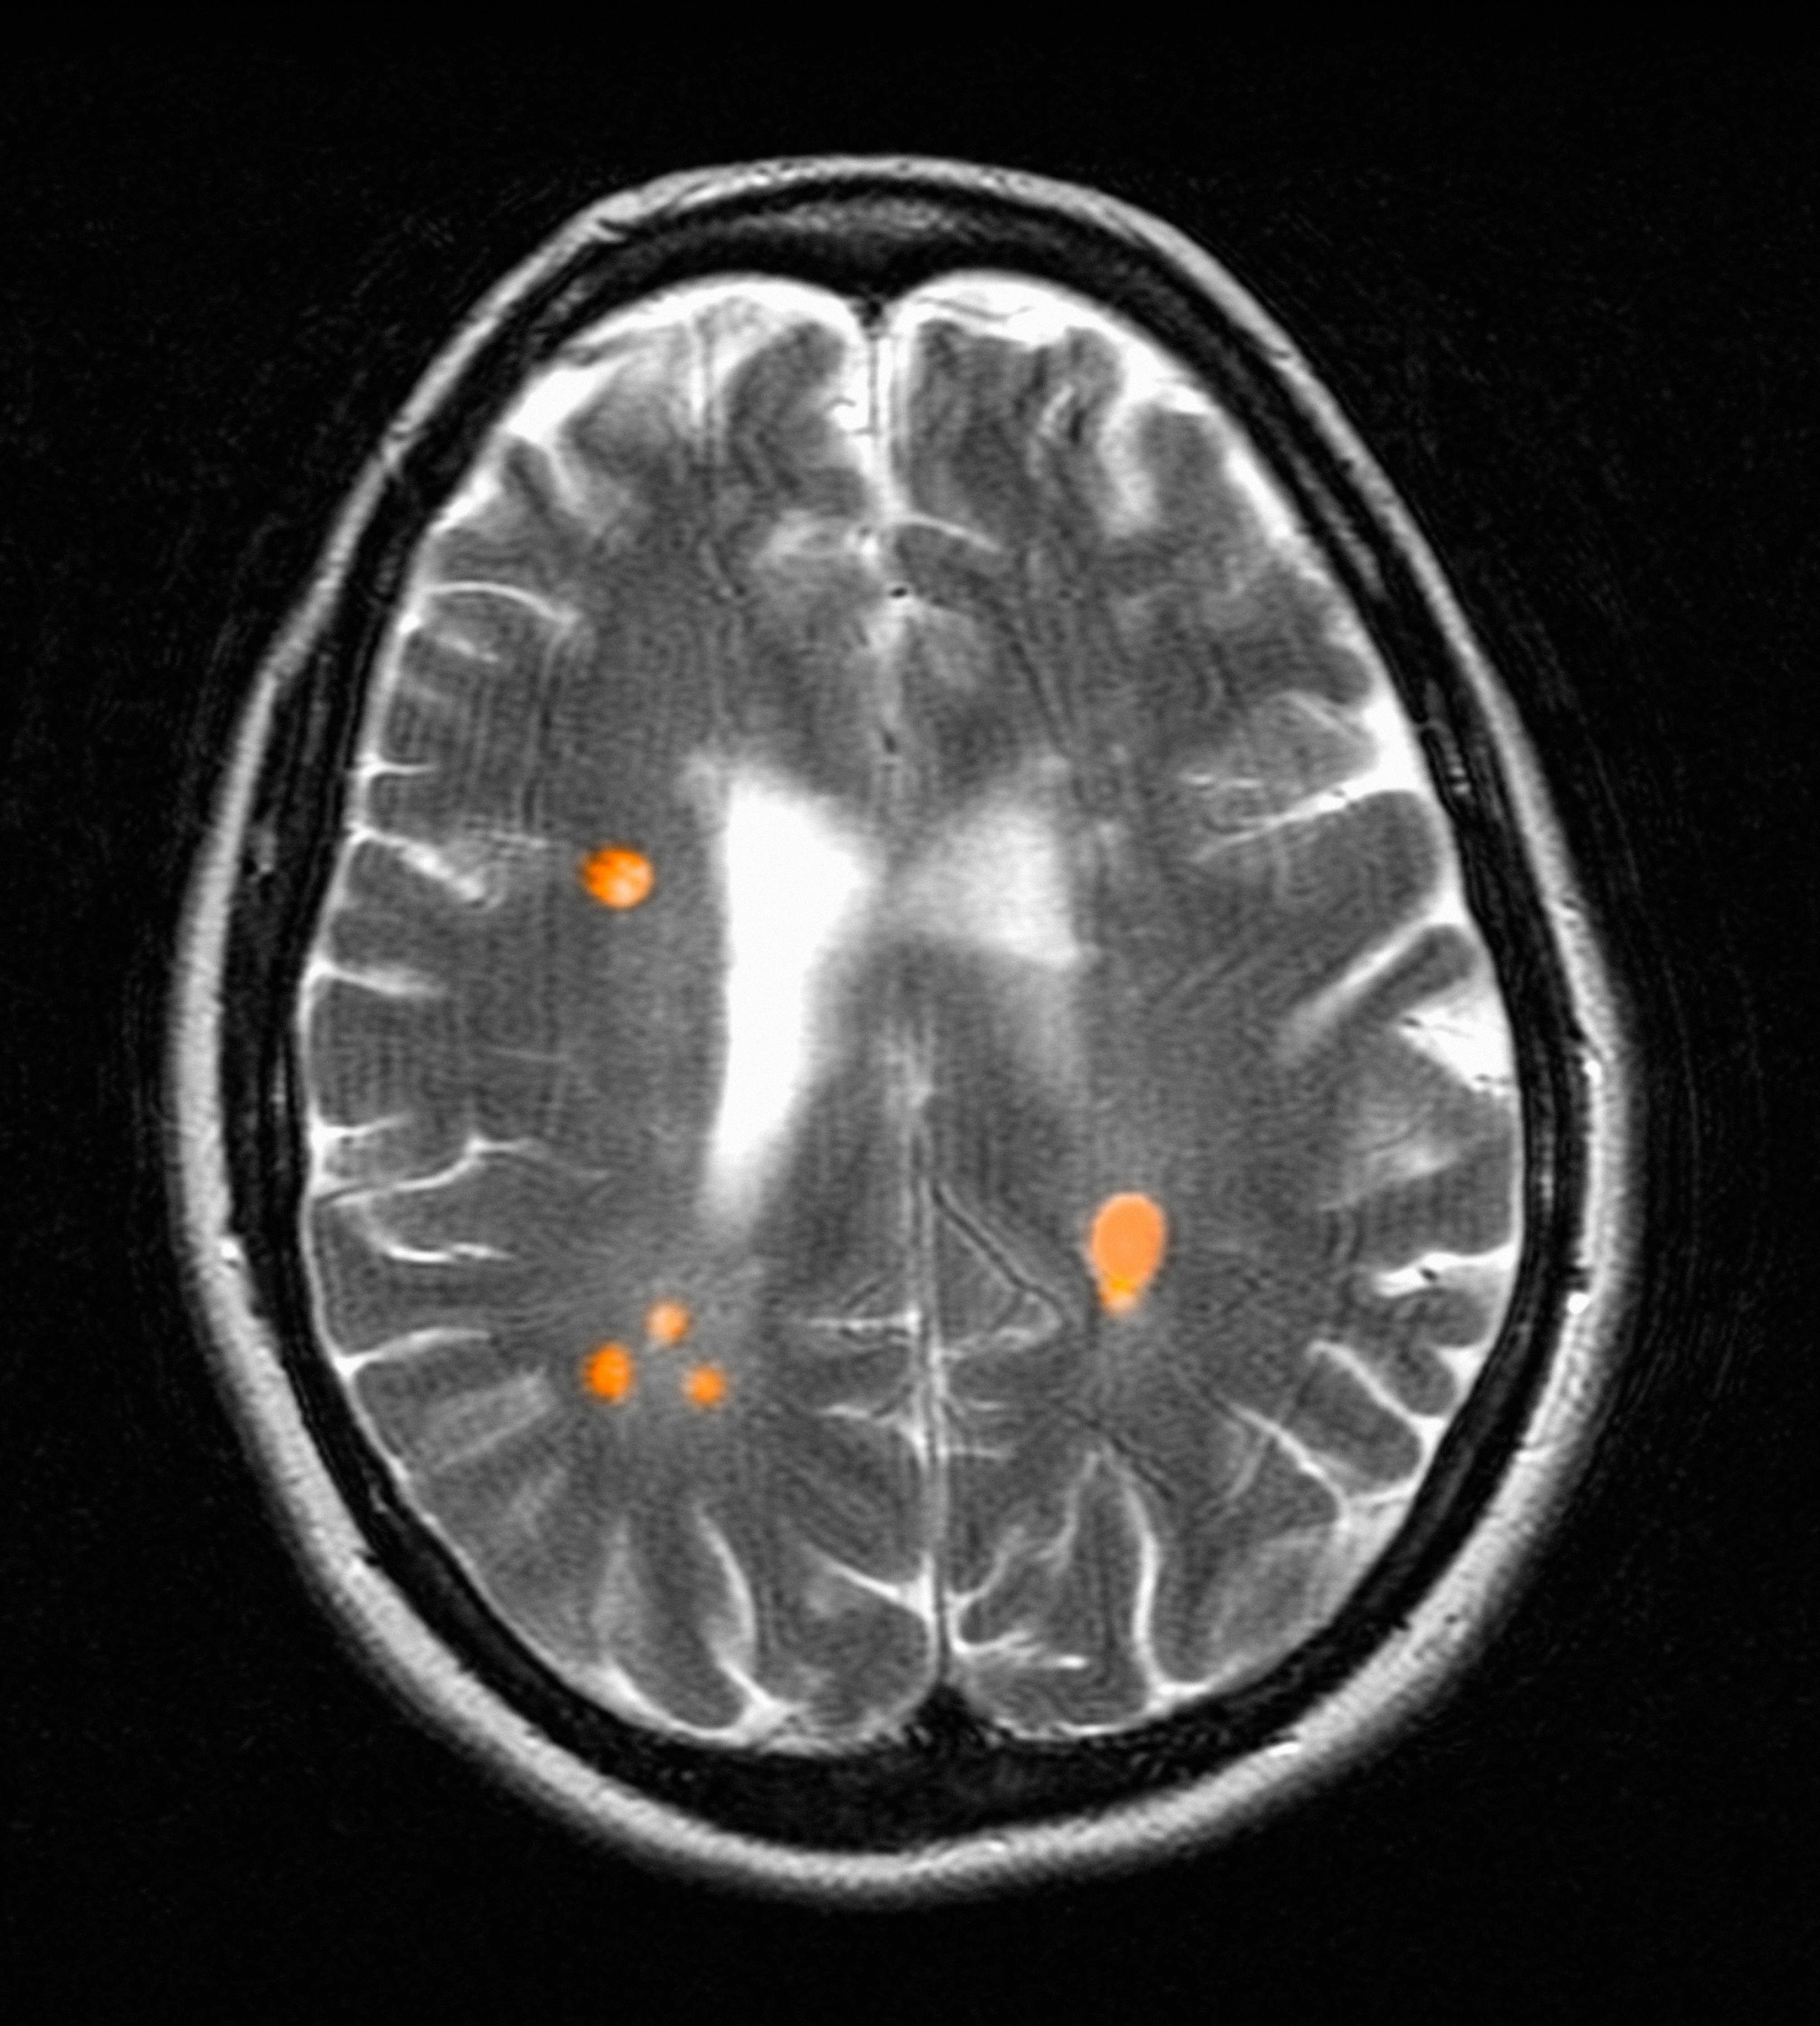
Chronic active lesions (CALs) are an important driver of PIRA. When an acute gadolinium-enhancing lesion develops in PwMS, there are 3 possible fates of this lesion. The lesion may become chronically inactive, remyelinate, or transition to CALs.14 The histopathologic signature of CALs is compartmentalized, low-grade inflammation behind an intact blood-brain barrier with evidence of both active and chronic components.15 CALs may be found not only in cerebral white matter but also in the cerebral cortex and spinal cord.16,17 Combined MRI and histopathological studies have shown that iron-laden microglia/macrophages can be detected by susceptibility-based MRI as a rim of paramagnetic signal surrounding select T2-lesions.19 These PRLs represent an in vivo imaging biomarker of CAL (Figure 1C). According to the North American Imaging in MS Cooperative (NAIMS) consensus criteria, a PRL must surround at least two-thirds of the outer edge of a T2-lesion, be visible in ≥ 2 consecutive MRI slices, and cannot be contrast enhancing.20
PRLs can be visualized on multiple susceptibility-based imaging methods, including multiecho derived R2*/T2*, phase maps, susceptibility-weighted imaging, and quantitative susceptibility mapping.21-23 Retrospective analyses have shown no significant differences in sensitivity across these imaging modalities.24 Although first visualized with 7T MRI, PRLs may also be detected by 1.5T and 3T MRI with comparable sensitivities.25-27 However, there remains a significant knowledge gap regarding the accuracy of each imaging modality. Systematic, prospectively designed studies are needed to ascertain the comparative value of each method.
The presence of PRL is a poor prognostic indicator. PwMS without PRLs have higher levels of disability, are more likely to progress, and demonstrate greater gray matter atrophy and cognitive dysfunction when compared with PwMS with PRLs.27-29 Lesions with PRL tend to slowly expand, exhibit greater demyelination, and have diminished white matter integrity.21,22,30
PRLs may also be used as a diagnostic tool. PRLs are highly specific for MS/CIS with a 99.7% specificity and 98.4% positive predictive value, although the sensitivity is limited to 24%.31 Taken together, these data indicate that the presence of a PRL substantially increases the likelihood of an MS/CIS diagnosis, whereas the absence of a PRL does not exclude these diagnoses.
Several unanswered questions remain: Why do select acute MS lesions transition to CALs? How may investigators utilize PRLs as outcome measures in future clinical trials? How should PRLs be incorporated into the routine care of PwMS? As the role of this imaging biomarker is clarified both in the research and clinical settings, clinicians caring for PwMS can expect to increasingly encounter the topic of PRLs in the near future.
Central Vein Sign
A CVS is defined by the presence of a central vessel within a demyelinating plaque (Figure 1D). As early as the 1820s, MS plaques on gross pathology were noted to follow the course of a vessel. Early histological studies reported that up to 91% of MS plaques had a central vessel present.32 Lesion formation is dependent on the movement of lymphocytes and other inflammatory cells from the systemic circulation across the blood brain barrier into the perivascular space, a privileged site where immune cells interact with antigen presenting cells to launch an inflammatory cascade and eventual demyelinating lesion.33
CVS can be visualized on 1.5T, 3T and 7T MRI. However, 7T MRI is superior to 3T in the detection of CVS, with 85% of MS lesions having CVS visible compared with 45% on 3T.34 With advances in 7T MRI, fluid attenuated inversion recovery and T2* susceptibility, weighted sequences can be overlaid, allowing simultaneous visualization of the vessel and the demyelinating lesion. With higher density of parenchymal veins in the periventricular regions, the CVS is most seen in lesions of this territory but can also be present in juxtacortical, thalamic and infratentorial lesions with decreasing prevalence as these approach the cortex.35
MS lesions are more likely to have CVS than T2 hyperintense white matter lesions of other causes, with a large study reporting 78% of MS lesions were CVS positive. Further, CVS positive lesions can be found across all MS phenotypes including relapsing remitting, primary progressive, and secondary progressive.35 The CVS is also specific to MS lesions and is an effective tool for differentiating MS lesions from other common causes of T2 hyperintense lesions including chronic ischemic white matter disease,36 migraines,37 neuromyelitis optica spectrum disorders,38,39 Susac syndrome,40 and systemic autoimmune diseases (Behcet disease, systemic lupus erythematosus, and antiphospholipid syndrome).41
With CVS emerging as a promising radiographic biomarker for MS, NAIMS issued a consensus statement on necessary properties of a CVS. These criteria included appearance of a thin hypointense line or small dot, visualized in ≥ 2 perpendicular planes, with diameter < 2 mm, and running partially or entirely through the center of the lesion. They also clarified that lesions < 3 mm, confluent lesions, lesions with multiple vessels present or poorly visualized lesions were excluded.42
A shared CVS definition was a necessary step toward routine use of CVS as a radiographic biomarker and its incorporation in the 2024 revised McDonald criteria.43 Remaining limitations including 7T MRI is primarily available in research settings and the lack of consensus on a diagnostic threshold. There have been many proposed methods, including a 40% cut off,44 60% cut off,45 and Select 3* or Select 6* methods.46 The goal of each method is to optimize sensitivity and specificity while not compromising efficiency of MRI review for both neurologists and radiologists.
The CVS has significant potential as a radiographic biomarker for MS and may allow the early stages of MS to be differentiated from other common causes of white matter lesions on MRI. However, it remains unclear whether CVS holds prognostic value for patients, if CVS is suggestive of differing underlying pathology, or if the presence of a CVS is dynamic over time. Progress in these areas is anticipated as CVS is incorporated into routine clinical practice.
Quantitative MRI Techniques
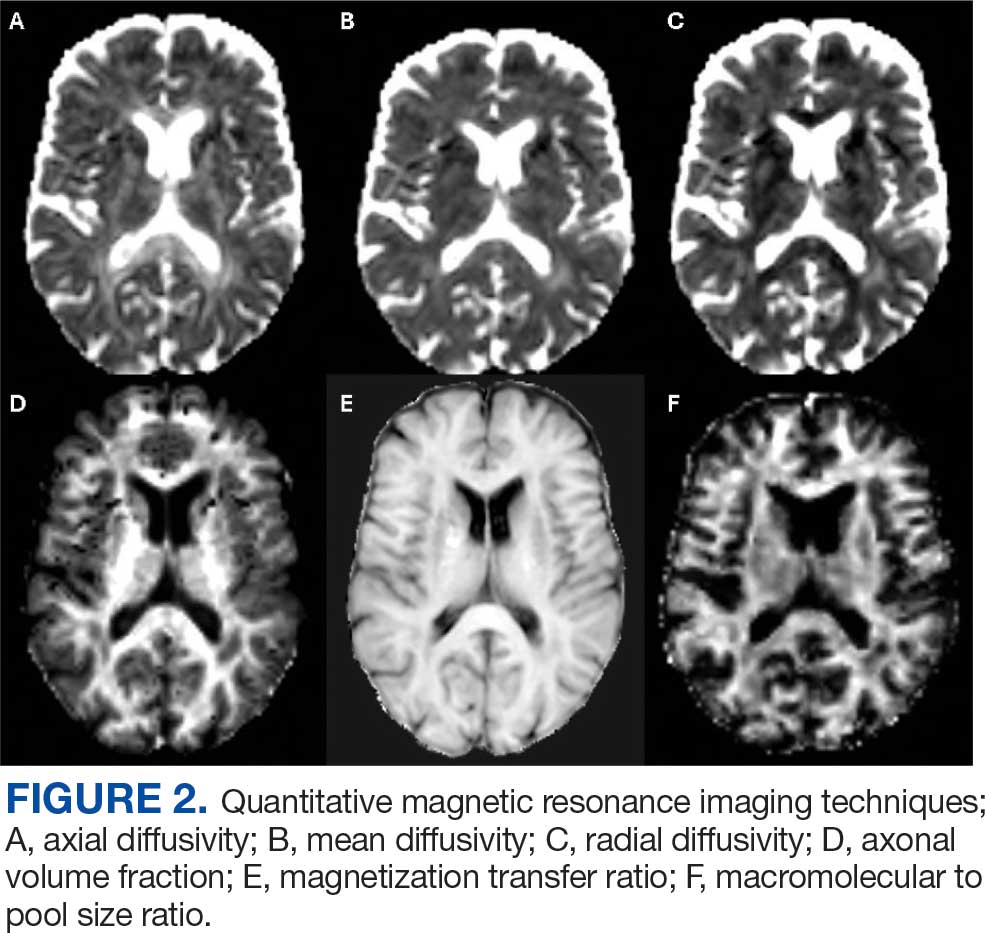
In the research setting, several imaging modalities can be used to quantify the degree of microstructural injury in PwMS. The goal of these methods is to identify and quantify myelin and axonal damage, the major drivers of neurodegeneration. Among these methods, diffusion-based imaging is a measure of the amount of diffusion or fluid mobility across the tissues of the brain.47 Diffusion-weighted imaging (DWI) yields several parametric maps including axial diffusivity (AD), radial diffusivity (RD), and mean diffusivity (Figure 2 A, B, and C). These parametric maps provide information on different directions of water molecules’ movements. Myelin surrounds the axons preventing water molecules diffusion perpendicular to axons (RD) while axonal content prevents water diffusion horizontal to the axons (AD).Thus, AD is considered more specific to axonal injury, whereas RD is specific to myelin content.48 A higher value of any of these metrics is associated with a higher degree of tissue injury.
Although sensitive to axonal and myelin injury, AD and RD computed from single b-shell DWI experience several limitations including being affected by nonpathologic factors such as fiber orientation, distribution, and crossing, and by various nonmyelin specific pathologies including fluid accumulation during inflammation, myelin sheath thickness, and axonal intactness.48 Several multi b-shell methods have been developed to overcome diffusion imaging limitations. For example, work at the Nashville VA MS Center of Excellence has focused on the use of the multicompartment diffusion MRI with spherical mean technique (SMT). This method removes the orientation dependency of the diffusion MRI signal, increasing the signal-to-noise ratio and reducing biases from fiber undulation, crossing, and dispersion.49 SMT generates the apparent axonal volume fraction (Vax), which is a direct measure of axonal integrity with lower values indicating lower axonal content and higher tissue destruction (Figure 2D). Vax was previously validated in MS as a measure of axonal integrity.49
In terms of myelin, several other specific measures have been developed. Magnetization transfer ratio (MTR) is another measure of tissue integrity that has been validated as a measure of tissue injury in MS (Figure 2E).50,51 Zheng et al found that the percentage of lesions with low MTR was significantly higher among patients whose disease disability progressed compared with patients who did not.52Selective inversion recovery with quantitative magnetization transfer (SIR-qMT) was developed to account for the limitations of MTR, including its sensitivity to edema and axonal density.52 Germane to myelin measurements, SIR-qMT generates the macromolecular to free size ratio (PSR). PSR represents the ratio of protons bound to macromolecules (myelin) to free protons (Figure 2F). PSR is considered a marker of myelin integrity, with lower values correlating with disability severity and indicating higher tissue damage and lower myelin content. Previous studies from the Nashville VA MS Center of Excellence validated the use of SIR-qMT among patients with MS, CIS, RIS, and healthy controls.53
Quantitative MRI has several research applications in the field of MS. We demonstrated that PRL harbor a higher degree of myelin injury indicated by PSR compared with rimless lesions.54 These MRI techniques are also helpful to investigate tissues surrounding the lesions, called normal appearing white matter (NAWM). Using quantitative MRI techniques such as MTR,52 PSR,53 and Vax,49 investigators have demonstrated that NAWM is injured in PwMS, and proximal NAWM may have higher degree of tissue damage compared with distant NAWM.55
Anticipated Innovations and Challenges
In the field of quantitative MRI, several new techniques are being adopted. Researchers are developing techniques such as myelin water fraction which evaluates the interaction between water and protons to measure myelin content. This is considered an advancement as it takes into account edema resulting from MS injury.56 Another example is multicompartment diffusion imaging, such as standard model imaging,57 and neurite orientation dispersion and density imaging,58 which considers water as an additional compartment compared with the SMT derived Vax. For PRL identification, more advanced methodologic techniques are developing such quantitative susceptibility mapping (QSM), which can detect iron deposits that surround the lesions with relatively high sensitivity and specificity of identifying PRL.59
Despite these innovations, several challenges remain before possible incorporation into the clinical setting. These limitations include longer scan time, familiarity of clinicians in using these maps, higher financial cost, and the necessity of advanced imaging processing skills. Artificial intelligence is a promising tool that may overcome these challenges through creating automated processing pipelines and developing synthetic maps without the need for additional acquisition.60
Conclusions
MRI is the most important tool for diagnosing and treating PwMS. Imaging biomarkers such as T2-lesions, cBHs, brain atrophy, PRLs, and CVS provide insight into the disease’s pathogenesis and are invaluable for the accurate diagnosis and prognostication of MS. Quantitative MRI techniques, while not available in the clinical setting, are important tools for translational research that may help direct the development of future therapeutics. In the near future, clinicians caring for PwMS should expect to encounter these imaging biomarkers more frequently in the clinical setting, especially with the inclusion of PRLs and CVS in the next iteration of the McDonald diagnostic criteria.
McDonald WI, Compston A, Edan G, et al. Recommended diagnostic criteria for multiple sclerosis: guidelines from the International Panel on the diagnosis of multiple sclerosis. Ann Neurol. 2001;50:121-127. doi:10.1002/ana.1032
Wattjes MP, Steenwijk MD, Stangel M. MRI in the diagnosis and monitoring of multiple sclerosis: an update. Clin Neuroradiol. 2015;25:157-165. doi:10.1007/s00062-015-0430-y
Gauthier SA, Mandel M, Guttmann CR, et al. Predicting short-term disability in multiple sclerosis. Neurology. 2007;68:2059-2065.doi:10.1212/01.wnl.0000264890.97479.b1
Rudick RA, Lee JC, Simon J, Fisher E. Significance of T2 lesions in multiple sclerosis: a 13-year longitudinal study. Ann Neurol. 2006;60:236-242. doi:10.1002/ana.20883
Nabizadeh F, Zafari R, Mohamadi M, et al. MRI features and disability in multiple sclerosis: a systematic review and meta-analysis. J Neuroradiol. 2024;51:24-37. doi:10.1016/j.neurad.2023.11.007
Bagnato F, Jeffries N, Richert ND, et al. Evolution of T1 black holes in patients with multiple sclerosis imaged monthly for 4 years. Brain. 2003;126:1782-1789. doi:10.1093/brain/awg182
Jacobsen C, Hagemeier J, Myhr KM, et al. Brain atrophy and disability progression in multiple sclerosis patients: a 10-year follow-up study. J Neurol Neurosurg Psychiatry. 2014;85:1109-1115. doi:10.1136/jnnp-2013-306906
Rovaris M, Gass A, Bammer R, et al. Diffusion MRI in multiple sclerosis. Neurology. 2005;65:1526-1532. doi:10.1212/01.wnl.0000184471.83948.e0
Fisniku LK, Chard DT, Jackson JS, et al. Gray matter atrophy is related to long-term disability in multiple sclerosis. Ann Neurol. 2008;64:247-254. doi:10.1002/ana.21423
Lublin FD, Häring DA, Ganjgahi H, et al. How patients with multiple sclerosis acquire disability. Brain. 2022;145:3147-3161. doi:10.1093/brain/awac016
Kappos L, Wolinsky JS, Giovannoni G, et al. Contribution of relapse-independent progression vs relapse-associated worsening to overall confirmed disability accumulation in typical relapsing multiple sclerosis in a pooled analysis of 2 randomized clinical trials. JAMA Neurol. 2020;77:1132-1140. doi:10.1001/jamaneurol.2020.1568
Hauser SL, Bar-Or A, Comi G, et al. Ocrelizumab versus interferon beta-1a in relapsing multiple sclerosis. N Engl J Med. 2017;376:221-234. doi:10.1056/NEJMoa1601277
Montalban X, Hauser SL, Kappos L, et al. Ocrelizumab versus placebo in primary progressive multiple sclerosis. N Engl J Med. 2017;376:209-220. doi:10.1056/NEJMoa1606468
Prineas JW, Kwon EE, Cho ES, et al. Immunopathology of secondary-progressive multiple sclerosis. Ann Neurol. 2001;50:646-657. doi:10.1002/ana.1255
Kuhlmann T, Ludwin S, Prat A, Antel J, Brück W, Lassmann H. An updated histological classification system for multiple sclerosis lesions. Acta Neuropathol. 2017;133:13-24. doi:10.1007/s00401-016-1653-y
Pitt D, Boster A, Pei W, et al. Imaging cortical lesions in multiple sclerosis with ultra-high-field magnetic resonance imaging. Arch Neurol. 2010;67:812-818. doi:10.1001/archneurol.2010.148
Gilmore CP, Geurts JJ, Evangelou N, et al. Spinal cord grey matter lesions in multiple sclerosis detected by post-mortem high field MR imaging. Mult Scler. 2009;15:180-188. doi:10.1177/1352458508096876
Lassmann H, Brück W, Lucchinetti CF. The immunopathology of multiple sclerosis: an overview. Brain Pathol. 2007;17:210-218. doi:10.1111/j.1750-3639.2007.00064.x
Bagnato F, Hametner S, Yao B, et al. Tracking iron in multiple sclerosis: a combined imaging and histopathological study at 7 Tesla. Brain. 2011;134:3602-3615. doi:10.1093/brain/awr278
Bagnato F, Sati P, Hemond CC, et al. Imaging chronic active lesions in multiple sclerosis: a consensus statement. Brain. 2024;147:2913-2933. doi:10.1093/brain/awae013
Dal-Bianco A, Grabner G, Kronnerwetter C, et al. Slow expansion of multiple sclerosis iron rim lesions: pathology and 7 T magnetic resonance imaging. Acta Neuropathol. 2017;133:25-42. doi:10.1007/s00401-016-1636-z
Absinta M, Sati P, Schindler M, et al. Persistent 7-tesla phase rim predicts poor outcome in new multiple sclerosis patient lesions. J Clin Invest. 2016;126:2597-2609. doi:10.1172/JCI86198
Gillen KM, Mubarak M, Park C, et al. QSM is an imaging biomarker for chronic glial activation in multiple sclerosis lesions. Ann Clin Transl Neurol. 2021;8:877-886. doi:10.1002/acn3.51338
Ng Kee Kwong KC, Mollison D, Meijboom R, et al. The prevalence of paramagnetic rim lesions in multiple sclerosis: a systematic review and meta-analysis. PLoS One. 2021;16:e0256845. doi:10.1371/journal.pone.0256845
Absinta M, Sati P, Fechner A, et al. Identification of chronic active multiple sclerosis lesions on 3T MRI. AJNR Am J Neuroradiol. 2018;39:1233-1238. doi:10.3174/ajnr.A5660
Hemond CC, Reich DS, Dundamadappa SK. Paramagnetic rim lesions in multiple sclerosis: comparison of visualization at 1.5-T and 3-T MRI. AJR Am J Roentgenol. 2022;219:120-131. doi:10.2214/AJR.21.26777
Altokhis AI, Hibbert AM, Allen CM, et al. Longitudinal clinical study of patients with iron rim lesions in multiple sclerosis. Mult Scler. 2022;28:2202-2211. doi:10.1177/13524585221114750
Choi S, Lake S, Harrison DM. Evaluation of the blood-brain barrier, demyelination, and neurodegeneration in paramagnetic rim lesions in multiple sclerosis on 7 tesla MRI. J Magn Reson Imaging. 2024;59:941-951. doi:10.1002/jmri.28847
Kazimuddin HF, Wang J, Hernandez B, et al. Paramagnetic rim lesions and their relationship with neurodegeneration and clinical disability at the time of multiple sclerosis diagnosis. Poster presented at: 2024 Americas Committee for Treatment and Research in Multiple Sclerosis (ACTRIMS) Forum; February 26-March 2; West Palm Beach, FL.
Rohm Z, Koch C, Kazimuddin H, et al. Longitudinal characterization of paramagnetic rim lesions in early multiple sclerosis. Poster presented at: 2024 Americas Committee for Treatment and Research in Multiple Sclerosis (ACTRIMS) Forum; February 26-March 2; West Palm Beach, FL.
Meaton I, Altokhis A, Allen CM, et al. Paramagnetic rims are a promising diagnostic imaging biomarker in multiple sclerosis. Mult Scler. 2022;28:2212-2220. doi:10.1177/13524585221118677
Fog T. On the vessel-plaque relationships in the brain in multiple sclerosis. Acta Neurol Scand Suppl. 1964;40:9-15.
Ineichen BV, Okar SV, Proulx ST, et al. Perivascular spaces and their role in neuroinflammation. Neuron. 2022;110:3566-3581. doi:10.1016/j.neuron.2022.10.024
Tallantyre EC, Morgan PS, Dixon JE, et al. A comparison of 3T and 7T in the detection of small parenchymal veins within MS lesions. Invest Radiol. 2009;44:491-494. doi:10.1097/RLI.0b013e3181b4c144
Kilsdonk ID, Lopez-Soriano A, Kuijer JP, et al. Morphological features of MS lesions on FLAIR* at 7 T and their relation to patient characteristics. J Neurol. 2014;261:1356-1364. doi:10.1007/s00415-014-7351-6
Tallantyre EC, Dixon JE, Donaldson I, et al. Ultra-high-field imaging distinguishes MS lesions from asymptomatic white matter lesions. Neurology. 2011;76:534-539. doi:10.1212/WNL.0b013e31820b7630
Solomon AJ, Schindler MK, Howard DB, et al. “Central vessel sign” on 3T FLAIR* MRI for the differentiation of multiple sclerosis from migraine. Ann Clin Transl Neurol. 2015;3:82-87. doi:10.1002/acn3.273
Sinnecker T, Dörr J, Pfueller CF, et al. Distinct lesion morphology at 7-T MRI differentiates neuromyelitis optica from multiple sclerosis. Neurology. 2012;79:708-714. doi:10.1212/WNL.0b013e3182648bc8
Kister I, Herbert J, Zhou Y, Ge Y. Ultrahigh-field MR (7 T) imaging of brain lesions in neuromyelitis optica. Mult Scler Int. 2013;2013:398259. doi:10.1155/2013/398259
Wuerfel J, Sinnecker T, Ringelstein EB, et al. Lesion morphology at 7 Tesla MRI differentiates Susac syndrome from multiple sclerosis. Mult Scler. 2012;18:1592-1599. doi:10.1177/1352458512441270
Massacesi L. Perivenular distribution of white matter lesions evaluated by MRI can differentiate MS lesions from inflammatory small vessel diseases. Eur J Neurol. 2016;23:86. doi:10.1212/WNL.86.16_supplement.P6.121
Sati P, Oh J, Constable RT, et al. The central vein sign and its clinical evaluation for the diagnosis of multiple sclerosis: a consensus statement from the North American Imaging in Multiple Sclerosis Cooperative. Nat Rev Neurol. 2016;12:714-722. doi:10.1038/nrneurol.2016.166
Montalban X, Lebrun-Frénay C, Oh J, et al. Diagnosis of multiple sclerosis: 2024 revisions of the McDonald criteria. Lancet Neurol. 2025;24:850-865. doi:10.1016/S1474-4422(25)00270-4
Mistry N, Dixon J, Tallantyre E, et al. Central veins in brain lesions visualized with high-field magnetic resonance imaging: a pathologically specific diagnostic biomarker for inflammatory demyelination in the brain. JAMA Neurol. 2013;70:623-628. doi:10.1001/jamaneurol.2013.1405
Campion T, Smith RJP, Altmann DR, et al. FLAIR* to visualize veins in white matter lesions: a new tool for the diagnosis of multiple sclerosis? Eur Radiol. 2017;27:4257-4263. doi:10.1007/s00330-017-4822-z
Solomon AJ, Watts R, Ontaneda D, et al. Diagnostic performance of central vein sign for multiple sclerosis with a simplified three-lesion algorithm. Mult Scler. 2018;24:750-757. doi:10.1177/1352458517726383
Cercignani M, Bozzali M, Iannucci G, Comi G, Filippi M. Intra-voxel and inter-voxel coherence in patients with multiple sclerosis assessed using diffusion tensor MRI. J Neurol. 2002;249:875-883. doi:10.1007/s00415-002-0752-y
Song SK, Yoshino J, Le TQ, et al. Demyelination increases radial diffusivity in corpus callosum of mouse brain. Neuroimage. 2005;26:132-140. doi:10.1016/j.neuroimage.2005.01.028
Bagnato F, Franco G, Li H, et al. Probing axons using multi-compartmental diffusion in multiple sclerosis. Ann Clin Transl Neurol. 2019;6:1595-1605. doi:10.1002/acn3.50836
Filippi M, Cercignani M, Inglese M, et al. Diffusion tensor magnetic resonance imaging in multiple sclerosis. Neurology. 2001;56:304-311. doi:10.1212/wnl.56.3.304
Bagnato F. Clinical application of magnetization transfer imaging. In: Advanced Neuro MR Techniques and Applications. Elsevier; 2022:403-417. doi:10.1016/B978-0-12-822479-3.00041-5
Zheng Y, Lee JC, Rudick R, Fisher E. Long-term magnetization transfer ratio evolution in multiple sclerosis white matter lesions. J Neuroimaging. 2018;28:191-198. doi:10.1111/jon.12480
Bagnato F, Hametner S, Franco G, et al. Selective inversion recovery quantitative magnetization transfer brain MRI at 7T: clinical and postmortem validation in multiple sclerosis. J Neuroimaging. 2018;28:380-388. doi:10.1111/jon.12511
Clarke MA, Cheek R, Hernandez B, et al. Paramagnetic rim lesions and the central vein sign: characterizing multiple sclerosis imaging markers. J Neuroimaging. 2024;34:86-94. doi:10.1111/jon.13173
Clarke MA, Lakhani DA, Wen S, et al. Perilesional neurodegenerative injury in multiple sclerosis: relation to focal lesions and impact on disability. Mult Scler Relat Disord. 2021;49:102738. doi:10.1016/j.msard.2021.102738
Laule C, Moore GRW. Myelin water imaging to detect demyelination and remyelination and its validation in pathology. Brain Pathol. 2018;28:750-764. doi:10.1111/bpa.12645
Coelho S, Baete SH, Lemberskiy G, et al. Reproducibility of the standard model of diffusion in white matter on clinical MRI systems. Neuroimage. 2022;257:119290. doi:10.1016/j.neuroimage.2022.119290
Novikov DS, Veraart J, Jelescu IO, et al. Rotationally-invariant mapping of scalar and orientational metrics of neuronal microstructure with diffusion MRI. Neuroimage. 2018;174:518-538. doi:10.1016/j.neuroimage.2018.03.006
Langkammer C, Liu T, Khalil M, et al. Quantitative susceptibility mapping in multiple sclerosis. Radiology. 2013;267:551-559. doi:10.1148/radiol.12120707
Collorone S, Coll L, Lorenzi M, et al. Artificial intelligence applied to MRI data to tackle key challenges in multiple sclerosis. Mult Scler. 2024;30:767-784. doi:10.1177/13524585241249422
Multiple sclerosis (MS) is a complex, chronic immune-mediated disease of the central nervous system characterized by focal inflammation, demyelination, and neurodegeneration. Magnetic resonance imaging (MRI), first incorporated into the McDonald Criteria for the diagnosis of MS in 2001, is an integral tool in the diagnosis, prognosis, and therapeutic monitoring of people with MS (PwMS).1
MRI research in MS is rapidly expanding and offers insights into the pathophysiology of MS with important implications for the routine clinical care of PwMS. At the Consortium of Multiple Sclerosis Centers 2024 Annual Meeting, the US Department of Veterans Affairs (VA) MS Centers of Excellence hosted an educational symposium highlighting MRI biomarkers in MS, including T2-lesions, chronic black holes (cBHs), brain atrophy, paramagnetic rim lesions (PRLs), and the central vein sign (CVS). The symposium also provided a brief overview of quantitative MRI techniques used to characterize MS lesion severity and research applications of these techniques. This clinical review summarizes the main points of that symposium with the goal of introducing key concepts to federal health care practitioners caring for PwMS.
MRI Biomarkers in MS
T2-lesions, Chronic Black Holes, and Brain Atrophy
Focal immune-mediated inflammation and demyelination in MS may be detected by MRI as hyperintense foci on T2-weighted (T2-w) imaging (eg, T2-w turbo spin echo or T2-w fluid attenuated inversion recovery sequences). These T2-lesions, critical for diagnosing MS, are typically ovoid and occur in the periventricular, juxtacortical, infratentorial spinal cord white matter (Figure 1A). T2-lesion number and volume show some association with disability and optic nerve.
Wattjes et al highlight 2 cases to demonstrate this point: a man aged 52 years with MS for 23 years and a woman aged 50 years with MS for 11 years. Despite having MS for a much shorter duration, the woman had worse disability due to a higher lesion number and volume.2 T2-lesion volume also impacts disability progression in PwMS. Gauthier et al compared the probability of progression in 3 women, all of whom were aged 39 years and had MS for 6 years. The profile with highest probability of disability progression had the highest quartile of T2-lesion volume.3 T2-lesion volume over 2 years correlates with worse scores on disability metrics such as the MS functional composite, paced auditory serial addition task, and brain volume.4 A 2024 systematic review and meta-analysis demonstrated that T2-lesion volume is significantly correlated with clinical disability in PwMS.5
Select T2-lesions are also hypointense on T1-w spin echo images and are known as cBHs (Figure 1B). Histologically, T2-lesions with cBHs have more severe architectural disruption than those without cBHs.6 cBH number and volume are significantly correlated with disability, regardless of the degree of hypointensity on T1-w imaging.5,7 A 10-year longitudinal study demonstrated that cBHs were associated with disease progression after 5 years while T2-lesion volume was not, indicating that cBHs may be a more accurate predictor of disability.8
Brain atrophy, another imaging biomarker of MS, affects both the cerebral white and gray matter. White matter fraction (the volume of white matter relative to the intracranial compartment volume) and gray matter fraction (the volume of gray matter relative to the intracranial compartment) are significantly lower among PwMS compared with healthy controls. In addition, gray matter fraction is lower among patients with primary and secondary progressive MS compared with those with relapsing-remitting MS, clinically isolated syndrome (CIS), and radiologically isolated syndrome (RIS). Gray matter fraction is also correlated with several motor and cognitive disability indices.9
Paramagnetic Rim Lesions
Neurologic worsening in PwMS occurs by 2 distinct mechanisms: relapse-associated worsening, a stepwise worsening of symptoms due to incomplete recovery following a relapse; and progression independent of relapse activity (PIRA), which is an irreversible neurologic deterioration in the absence of clinical or radiological relapses.10 PIRA is associated with neurodegeneration and predominates in both primary and secondary progressive MS. However, recent data demonstrated that PIRA may contribute to as much as 50% of disability worsening in relapsing MS and occurs early in the RMS disease course.10,11 Current high-efficacy disease modifying therapy, such as ocrelizumab, are extraordinarily successful at preventing focal inflammation and relapses but are less effective for preventing the slow march of disability progression characterizing PIRA.12,13 The prevention of PIRA is therefore an unmet treatment need.
Chronic active lesions (CALs) are an important driver of PIRA. When an acute gadolinium-enhancing lesion develops in PwMS, there are 3 possible fates of this lesion. The lesion may become chronically inactive, remyelinate, or transition to CALs.14 The histopathologic signature of CALs is compartmentalized, low-grade inflammation behind an intact blood-brain barrier with evidence of both active and chronic components.15 CALs may be found not only in cerebral white matter but also in the cerebral cortex and spinal cord.16,17 Combined MRI and histopathological studies have shown that iron-laden microglia/macrophages can be detected by susceptibility-based MRI as a rim of paramagnetic signal surrounding select T2-lesions.19 These PRLs represent an in vivo imaging biomarker of CAL (Figure 1C). According to the North American Imaging in MS Cooperative (NAIMS) consensus criteria, a PRL must surround at least two-thirds of the outer edge of a T2-lesion, be visible in ≥ 2 consecutive MRI slices, and cannot be contrast enhancing.20
PRLs can be visualized on multiple susceptibility-based imaging methods, including multiecho derived R2*/T2*, phase maps, susceptibility-weighted imaging, and quantitative susceptibility mapping.21-23 Retrospective analyses have shown no significant differences in sensitivity across these imaging modalities.24 Although first visualized with 7T MRI, PRLs may also be detected by 1.5T and 3T MRI with comparable sensitivities.25-27 However, there remains a significant knowledge gap regarding the accuracy of each imaging modality. Systematic, prospectively designed studies are needed to ascertain the comparative value of each method.
The presence of PRL is a poor prognostic indicator. PwMS without PRLs have higher levels of disability, are more likely to progress, and demonstrate greater gray matter atrophy and cognitive dysfunction when compared with PwMS with PRLs.27-29 Lesions with PRL tend to slowly expand, exhibit greater demyelination, and have diminished white matter integrity.21,22,30
PRLs may also be used as a diagnostic tool. PRLs are highly specific for MS/CIS with a 99.7% specificity and 98.4% positive predictive value, although the sensitivity is limited to 24%.31 Taken together, these data indicate that the presence of a PRL substantially increases the likelihood of an MS/CIS diagnosis, whereas the absence of a PRL does not exclude these diagnoses.
Several unanswered questions remain: Why do select acute MS lesions transition to CALs? How may investigators utilize PRLs as outcome measures in future clinical trials? How should PRLs be incorporated into the routine care of PwMS? As the role of this imaging biomarker is clarified both in the research and clinical settings, clinicians caring for PwMS can expect to increasingly encounter the topic of PRLs in the near future.
Central Vein Sign
A CVS is defined by the presence of a central vessel within a demyelinating plaque (Figure 1D). As early as the 1820s, MS plaques on gross pathology were noted to follow the course of a vessel. Early histological studies reported that up to 91% of MS plaques had a central vessel present.32 Lesion formation is dependent on the movement of lymphocytes and other inflammatory cells from the systemic circulation across the blood brain barrier into the perivascular space, a privileged site where immune cells interact with antigen presenting cells to launch an inflammatory cascade and eventual demyelinating lesion.33
CVS can be visualized on 1.5T, 3T and 7T MRI. However, 7T MRI is superior to 3T in the detection of CVS, with 85% of MS lesions having CVS visible compared with 45% on 3T.34 With advances in 7T MRI, fluid attenuated inversion recovery and T2* susceptibility, weighted sequences can be overlaid, allowing simultaneous visualization of the vessel and the demyelinating lesion. With higher density of parenchymal veins in the periventricular regions, the CVS is most seen in lesions of this territory but can also be present in juxtacortical, thalamic and infratentorial lesions with decreasing prevalence as these approach the cortex.35
MS lesions are more likely to have CVS than T2 hyperintense white matter lesions of other causes, with a large study reporting 78% of MS lesions were CVS positive. Further, CVS positive lesions can be found across all MS phenotypes including relapsing remitting, primary progressive, and secondary progressive.35 The CVS is also specific to MS lesions and is an effective tool for differentiating MS lesions from other common causes of T2 hyperintense lesions including chronic ischemic white matter disease,36 migraines,37 neuromyelitis optica spectrum disorders,38,39 Susac syndrome,40 and systemic autoimmune diseases (Behcet disease, systemic lupus erythematosus, and antiphospholipid syndrome).41
With CVS emerging as a promising radiographic biomarker for MS, NAIMS issued a consensus statement on necessary properties of a CVS. These criteria included appearance of a thin hypointense line or small dot, visualized in ≥ 2 perpendicular planes, with diameter < 2 mm, and running partially or entirely through the center of the lesion. They also clarified that lesions < 3 mm, confluent lesions, lesions with multiple vessels present or poorly visualized lesions were excluded.42
A shared CVS definition was a necessary step toward routine use of CVS as a radiographic biomarker and its incorporation in the 2024 revised McDonald criteria.43 Remaining limitations including 7T MRI is primarily available in research settings and the lack of consensus on a diagnostic threshold. There have been many proposed methods, including a 40% cut off,44 60% cut off,45 and Select 3* or Select 6* methods.46 The goal of each method is to optimize sensitivity and specificity while not compromising efficiency of MRI review for both neurologists and radiologists.
The CVS has significant potential as a radiographic biomarker for MS and may allow the early stages of MS to be differentiated from other common causes of white matter lesions on MRI. However, it remains unclear whether CVS holds prognostic value for patients, if CVS is suggestive of differing underlying pathology, or if the presence of a CVS is dynamic over time. Progress in these areas is anticipated as CVS is incorporated into routine clinical practice.
Quantitative MRI Techniques
In the research setting, several imaging modalities can be used to quantify the degree of microstructural injury in PwMS. The goal of these methods is to identify and quantify myelin and axonal damage, the major drivers of neurodegeneration. Among these methods, diffusion-based imaging is a measure of the amount of diffusion or fluid mobility across the tissues of the brain.47 Diffusion-weighted imaging (DWI) yields several parametric maps including axial diffusivity (AD), radial diffusivity (RD), and mean diffusivity (Figure 2 A, B, and C). These parametric maps provide information on different directions of water molecules’ movements. Myelin surrounds the axons preventing water molecules diffusion perpendicular to axons (RD) while axonal content prevents water diffusion horizontal to the axons (AD).Thus, AD is considered more specific to axonal injury, whereas RD is specific to myelin content.48 A higher value of any of these metrics is associated with a higher degree of tissue injury.
Although sensitive to axonal and myelin injury, AD and RD computed from single b-shell DWI experience several limitations including being affected by nonpathologic factors such as fiber orientation, distribution, and crossing, and by various nonmyelin specific pathologies including fluid accumulation during inflammation, myelin sheath thickness, and axonal intactness.48 Several multi b-shell methods have been developed to overcome diffusion imaging limitations. For example, work at the Nashville VA MS Center of Excellence has focused on the use of the multicompartment diffusion MRI with spherical mean technique (SMT). This method removes the orientation dependency of the diffusion MRI signal, increasing the signal-to-noise ratio and reducing biases from fiber undulation, crossing, and dispersion.49 SMT generates the apparent axonal volume fraction (Vax), which is a direct measure of axonal integrity with lower values indicating lower axonal content and higher tissue destruction (Figure 2D). Vax was previously validated in MS as a measure of axonal integrity.49
In terms of myelin, several other specific measures have been developed. Magnetization transfer ratio (MTR) is another measure of tissue integrity that has been validated as a measure of tissue injury in MS (Figure 2E).50,51 Zheng et al found that the percentage of lesions with low MTR was significantly higher among patients whose disease disability progressed compared with patients who did not.52Selective inversion recovery with quantitative magnetization transfer (SIR-qMT) was developed to account for the limitations of MTR, including its sensitivity to edema and axonal density.52 Germane to myelin measurements, SIR-qMT generates the macromolecular to free size ratio (PSR). PSR represents the ratio of protons bound to macromolecules (myelin) to free protons (Figure 2F). PSR is considered a marker of myelin integrity, with lower values correlating with disability severity and indicating higher tissue damage and lower myelin content. Previous studies from the Nashville VA MS Center of Excellence validated the use of SIR-qMT among patients with MS, CIS, RIS, and healthy controls.53
Quantitative MRI has several research applications in the field of MS. We demonstrated that PRL harbor a higher degree of myelin injury indicated by PSR compared with rimless lesions.54 These MRI techniques are also helpful to investigate tissues surrounding the lesions, called normal appearing white matter (NAWM). Using quantitative MRI techniques such as MTR,52 PSR,53 and Vax,49 investigators have demonstrated that NAWM is injured in PwMS, and proximal NAWM may have higher degree of tissue damage compared with distant NAWM.55
Anticipated Innovations and Challenges
In the field of quantitative MRI, several new techniques are being adopted. Researchers are developing techniques such as myelin water fraction which evaluates the interaction between water and protons to measure myelin content. This is considered an advancement as it takes into account edema resulting from MS injury.56 Another example is multicompartment diffusion imaging, such as standard model imaging,57 and neurite orientation dispersion and density imaging,58 which considers water as an additional compartment compared with the SMT derived Vax. For PRL identification, more advanced methodologic techniques are developing such quantitative susceptibility mapping (QSM), which can detect iron deposits that surround the lesions with relatively high sensitivity and specificity of identifying PRL.59
Despite these innovations, several challenges remain before possible incorporation into the clinical setting. These limitations include longer scan time, familiarity of clinicians in using these maps, higher financial cost, and the necessity of advanced imaging processing skills. Artificial intelligence is a promising tool that may overcome these challenges through creating automated processing pipelines and developing synthetic maps without the need for additional acquisition.60
Conclusions
MRI is the most important tool for diagnosing and treating PwMS. Imaging biomarkers such as T2-lesions, cBHs, brain atrophy, PRLs, and CVS provide insight into the disease’s pathogenesis and are invaluable for the accurate diagnosis and prognostication of MS. Quantitative MRI techniques, while not available in the clinical setting, are important tools for translational research that may help direct the development of future therapeutics. In the near future, clinicians caring for PwMS should expect to encounter these imaging biomarkers more frequently in the clinical setting, especially with the inclusion of PRLs and CVS in the next iteration of the McDonald diagnostic criteria.
McDonald WI, Compston A, Edan G, et al. Recommended diagnostic criteria for multiple sclerosis: guidelines from the International Panel on the diagnosis of multiple sclerosis. Ann Neurol. 2001;50:121-127. doi:10.1002/ana.1032
Wattjes MP, Steenwijk MD, Stangel M. MRI in the diagnosis and monitoring of multiple sclerosis: an update. Clin Neuroradiol. 2015;25:157-165. doi:10.1007/s00062-015-0430-y
Gauthier SA, Mandel M, Guttmann CR, et al. Predicting short-term disability in multiple sclerosis. Neurology. 2007;68:2059-2065.doi:10.1212/01.wnl.0000264890.97479.b1
Rudick RA, Lee JC, Simon J, Fisher E. Significance of T2 lesions in multiple sclerosis: a 13-year longitudinal study. Ann Neurol. 2006;60:236-242. doi:10.1002/ana.20883
Nabizadeh F, Zafari R, Mohamadi M, et al. MRI features and disability in multiple sclerosis: a systematic review and meta-analysis. J Neuroradiol. 2024;51:24-37. doi:10.1016/j.neurad.2023.11.007
Bagnato F, Jeffries N, Richert ND, et al. Evolution of T1 black holes in patients with multiple sclerosis imaged monthly for 4 years. Brain. 2003;126:1782-1789. doi:10.1093/brain/awg182
Jacobsen C, Hagemeier J, Myhr KM, et al. Brain atrophy and disability progression in multiple sclerosis patients: a 10-year follow-up study. J Neurol Neurosurg Psychiatry. 2014;85:1109-1115. doi:10.1136/jnnp-2013-306906
Rovaris M, Gass A, Bammer R, et al. Diffusion MRI in multiple sclerosis. Neurology. 2005;65:1526-1532. doi:10.1212/01.wnl.0000184471.83948.e0
Fisniku LK, Chard DT, Jackson JS, et al. Gray matter atrophy is related to long-term disability in multiple sclerosis. Ann Neurol. 2008;64:247-254. doi:10.1002/ana.21423
Lublin FD, Häring DA, Ganjgahi H, et al. How patients with multiple sclerosis acquire disability. Brain. 2022;145:3147-3161. doi:10.1093/brain/awac016
Kappos L, Wolinsky JS, Giovannoni G, et al. Contribution of relapse-independent progression vs relapse-associated worsening to overall confirmed disability accumulation in typical relapsing multiple sclerosis in a pooled analysis of 2 randomized clinical trials. JAMA Neurol. 2020;77:1132-1140. doi:10.1001/jamaneurol.2020.1568
Hauser SL, Bar-Or A, Comi G, et al. Ocrelizumab versus interferon beta-1a in relapsing multiple sclerosis. N Engl J Med. 2017;376:221-234. doi:10.1056/NEJMoa1601277
Montalban X, Hauser SL, Kappos L, et al. Ocrelizumab versus placebo in primary progressive multiple sclerosis. N Engl J Med. 2017;376:209-220. doi:10.1056/NEJMoa1606468
Prineas JW, Kwon EE, Cho ES, et al. Immunopathology of secondary-progressive multiple sclerosis. Ann Neurol. 2001;50:646-657. doi:10.1002/ana.1255
Kuhlmann T, Ludwin S, Prat A, Antel J, Brück W, Lassmann H. An updated histological classification system for multiple sclerosis lesions. Acta Neuropathol. 2017;133:13-24. doi:10.1007/s00401-016-1653-y
Pitt D, Boster A, Pei W, et al. Imaging cortical lesions in multiple sclerosis with ultra-high-field magnetic resonance imaging. Arch Neurol. 2010;67:812-818. doi:10.1001/archneurol.2010.148
Gilmore CP, Geurts JJ, Evangelou N, et al. Spinal cord grey matter lesions in multiple sclerosis detected by post-mortem high field MR imaging. Mult Scler. 2009;15:180-188. doi:10.1177/1352458508096876
Lassmann H, Brück W, Lucchinetti CF. The immunopathology of multiple sclerosis: an overview. Brain Pathol. 2007;17:210-218. doi:10.1111/j.1750-3639.2007.00064.x
Bagnato F, Hametner S, Yao B, et al. Tracking iron in multiple sclerosis: a combined imaging and histopathological study at 7 Tesla. Brain. 2011;134:3602-3615. doi:10.1093/brain/awr278
Bagnato F, Sati P, Hemond CC, et al. Imaging chronic active lesions in multiple sclerosis: a consensus statement. Brain. 2024;147:2913-2933. doi:10.1093/brain/awae013
Dal-Bianco A, Grabner G, Kronnerwetter C, et al. Slow expansion of multiple sclerosis iron rim lesions: pathology and 7 T magnetic resonance imaging. Acta Neuropathol. 2017;133:25-42. doi:10.1007/s00401-016-1636-z
Absinta M, Sati P, Schindler M, et al. Persistent 7-tesla phase rim predicts poor outcome in new multiple sclerosis patient lesions. J Clin Invest. 2016;126:2597-2609. doi:10.1172/JCI86198
Gillen KM, Mubarak M, Park C, et al. QSM is an imaging biomarker for chronic glial activation in multiple sclerosis lesions. Ann Clin Transl Neurol. 2021;8:877-886. doi:10.1002/acn3.51338
Ng Kee Kwong KC, Mollison D, Meijboom R, et al. The prevalence of paramagnetic rim lesions in multiple sclerosis: a systematic review and meta-analysis. PLoS One. 2021;16:e0256845. doi:10.1371/journal.pone.0256845
Absinta M, Sati P, Fechner A, et al. Identification of chronic active multiple sclerosis lesions on 3T MRI. AJNR Am J Neuroradiol. 2018;39:1233-1238. doi:10.3174/ajnr.A5660
Hemond CC, Reich DS, Dundamadappa SK. Paramagnetic rim lesions in multiple sclerosis: comparison of visualization at 1.5-T and 3-T MRI. AJR Am J Roentgenol. 2022;219:120-131. doi:10.2214/AJR.21.26777
Altokhis AI, Hibbert AM, Allen CM, et al. Longitudinal clinical study of patients with iron rim lesions in multiple sclerosis. Mult Scler. 2022;28:2202-2211. doi:10.1177/13524585221114750
Choi S, Lake S, Harrison DM. Evaluation of the blood-brain barrier, demyelination, and neurodegeneration in paramagnetic rim lesions in multiple sclerosis on 7 tesla MRI. J Magn Reson Imaging. 2024;59:941-951. doi:10.1002/jmri.28847
Kazimuddin HF, Wang J, Hernandez B, et al. Paramagnetic rim lesions and their relationship with neurodegeneration and clinical disability at the time of multiple sclerosis diagnosis. Poster presented at: 2024 Americas Committee for Treatment and Research in Multiple Sclerosis (ACTRIMS) Forum; February 26-March 2; West Palm Beach, FL.
Rohm Z, Koch C, Kazimuddin H, et al. Longitudinal characterization of paramagnetic rim lesions in early multiple sclerosis. Poster presented at: 2024 Americas Committee for Treatment and Research in Multiple Sclerosis (ACTRIMS) Forum; February 26-March 2; West Palm Beach, FL.
Meaton I, Altokhis A, Allen CM, et al. Paramagnetic rims are a promising diagnostic imaging biomarker in multiple sclerosis. Mult Scler. 2022;28:2212-2220. doi:10.1177/13524585221118677
Fog T. On the vessel-plaque relationships in the brain in multiple sclerosis. Acta Neurol Scand Suppl. 1964;40:9-15.
Ineichen BV, Okar SV, Proulx ST, et al. Perivascular spaces and their role in neuroinflammation. Neuron. 2022;110:3566-3581. doi:10.1016/j.neuron.2022.10.024
Tallantyre EC, Morgan PS, Dixon JE, et al. A comparison of 3T and 7T in the detection of small parenchymal veins within MS lesions. Invest Radiol. 2009;44:491-494. doi:10.1097/RLI.0b013e3181b4c144
Kilsdonk ID, Lopez-Soriano A, Kuijer JP, et al. Morphological features of MS lesions on FLAIR* at 7 T and their relation to patient characteristics. J Neurol. 2014;261:1356-1364. doi:10.1007/s00415-014-7351-6
Tallantyre EC, Dixon JE, Donaldson I, et al. Ultra-high-field imaging distinguishes MS lesions from asymptomatic white matter lesions. Neurology. 2011;76:534-539. doi:10.1212/WNL.0b013e31820b7630
Solomon AJ, Schindler MK, Howard DB, et al. “Central vessel sign” on 3T FLAIR* MRI for the differentiation of multiple sclerosis from migraine. Ann Clin Transl Neurol. 2015;3:82-87. doi:10.1002/acn3.273
Sinnecker T, Dörr J, Pfueller CF, et al. Distinct lesion morphology at 7-T MRI differentiates neuromyelitis optica from multiple sclerosis. Neurology. 2012;79:708-714. doi:10.1212/WNL.0b013e3182648bc8
Kister I, Herbert J, Zhou Y, Ge Y. Ultrahigh-field MR (7 T) imaging of brain lesions in neuromyelitis optica. Mult Scler Int. 2013;2013:398259. doi:10.1155/2013/398259
Wuerfel J, Sinnecker T, Ringelstein EB, et al. Lesion morphology at 7 Tesla MRI differentiates Susac syndrome from multiple sclerosis. Mult Scler. 2012;18:1592-1599. doi:10.1177/1352458512441270
Massacesi L. Perivenular distribution of white matter lesions evaluated by MRI can differentiate MS lesions from inflammatory small vessel diseases. Eur J Neurol. 2016;23:86. doi:10.1212/WNL.86.16_supplement.P6.121
Sati P, Oh J, Constable RT, et al. The central vein sign and its clinical evaluation for the diagnosis of multiple sclerosis: a consensus statement from the North American Imaging in Multiple Sclerosis Cooperative. Nat Rev Neurol. 2016;12:714-722. doi:10.1038/nrneurol.2016.166
Montalban X, Lebrun-Frénay C, Oh J, et al. Diagnosis of multiple sclerosis: 2024 revisions of the McDonald criteria. Lancet Neurol. 2025;24:850-865. doi:10.1016/S1474-4422(25)00270-4
Mistry N, Dixon J, Tallantyre E, et al. Central veins in brain lesions visualized with high-field magnetic resonance imaging: a pathologically specific diagnostic biomarker for inflammatory demyelination in the brain. JAMA Neurol. 2013;70:623-628. doi:10.1001/jamaneurol.2013.1405
Campion T, Smith RJP, Altmann DR, et al. FLAIR* to visualize veins in white matter lesions: a new tool for the diagnosis of multiple sclerosis? Eur Radiol. 2017;27:4257-4263. doi:10.1007/s00330-017-4822-z
Solomon AJ, Watts R, Ontaneda D, et al. Diagnostic performance of central vein sign for multiple sclerosis with a simplified three-lesion algorithm. Mult Scler. 2018;24:750-757. doi:10.1177/1352458517726383
Cercignani M, Bozzali M, Iannucci G, Comi G, Filippi M. Intra-voxel and inter-voxel coherence in patients with multiple sclerosis assessed using diffusion tensor MRI. J Neurol. 2002;249:875-883. doi:10.1007/s00415-002-0752-y
Song SK, Yoshino J, Le TQ, et al. Demyelination increases radial diffusivity in corpus callosum of mouse brain. Neuroimage. 2005;26:132-140. doi:10.1016/j.neuroimage.2005.01.028
Bagnato F, Franco G, Li H, et al. Probing axons using multi-compartmental diffusion in multiple sclerosis. Ann Clin Transl Neurol. 2019;6:1595-1605. doi:10.1002/acn3.50836
Filippi M, Cercignani M, Inglese M, et al. Diffusion tensor magnetic resonance imaging in multiple sclerosis. Neurology. 2001;56:304-311. doi:10.1212/wnl.56.3.304
Bagnato F. Clinical application of magnetization transfer imaging. In: Advanced Neuro MR Techniques and Applications. Elsevier; 2022:403-417. doi:10.1016/B978-0-12-822479-3.00041-5
Zheng Y, Lee JC, Rudick R, Fisher E. Long-term magnetization transfer ratio evolution in multiple sclerosis white matter lesions. J Neuroimaging. 2018;28:191-198. doi:10.1111/jon.12480
Bagnato F, Hametner S, Franco G, et al. Selective inversion recovery quantitative magnetization transfer brain MRI at 7T: clinical and postmortem validation in multiple sclerosis. J Neuroimaging. 2018;28:380-388. doi:10.1111/jon.12511
Clarke MA, Cheek R, Hernandez B, et al. Paramagnetic rim lesions and the central vein sign: characterizing multiple sclerosis imaging markers. J Neuroimaging. 2024;34:86-94. doi:10.1111/jon.13173
Clarke MA, Lakhani DA, Wen S, et al. Perilesional neurodegenerative injury in multiple sclerosis: relation to focal lesions and impact on disability. Mult Scler Relat Disord. 2021;49:102738. doi:10.1016/j.msard.2021.102738
Laule C, Moore GRW. Myelin water imaging to detect demyelination and remyelination and its validation in pathology. Brain Pathol. 2018;28:750-764. doi:10.1111/bpa.12645
Coelho S, Baete SH, Lemberskiy G, et al. Reproducibility of the standard model of diffusion in white matter on clinical MRI systems. Neuroimage. 2022;257:119290. doi:10.1016/j.neuroimage.2022.119290
Novikov DS, Veraart J, Jelescu IO, et al. Rotationally-invariant mapping of scalar and orientational metrics of neuronal microstructure with diffusion MRI. Neuroimage. 2018;174:518-538. doi:10.1016/j.neuroimage.2018.03.006
Langkammer C, Liu T, Khalil M, et al. Quantitative susceptibility mapping in multiple sclerosis. Radiology. 2013;267:551-559. doi:10.1148/radiol.12120707
Collorone S, Coll L, Lorenzi M, et al. Artificial intelligence applied to MRI data to tackle key challenges in multiple sclerosis. Mult Scler. 2024;30:767-784. doi:10.1177/13524585241249422
Updates in Multiple Sclerosis Imaging
Updates in Multiple Sclerosis Imaging