User login
BEAM technology shines a light on drug resistance mutations in GIST
CHICAGO – A novel technique for ferreting out DNA mutations in circulating plasma appears to be more sensitive than is conventional pathology at detecting drug-resistant mutations in patients with gastrointestinal stromal tumors, said an investigator at the annual meeting of the American Society of Clinical Oncology.
Secondary KIT mutations associated with resistance to tyrosine kinase inhibitors (TKIs) such as imatinib (Gleevec) were detected in 47% of plasma samples using "BEAMing" (beads, emulsions, amplification, magnetics) technology, compared with only 12% of tissue biopsy specimens, said Dr. George D. Demetri, director of the center for sarcoma and bone oncology at the Dana-Farber Cancer Institute in Boston.

"We know that tumor cells are constantly turning over, apoptosing, dying, and releasing free DNA into the bloodstream. I want to emphasize that this is not looking at circulating tumor cells; this is looking at free circulating DNA in the plasma, and by looking at that circulating DNA, we may be able to get a more comprehensive assessment of all the mutations from across all tumor burden in any given patient," Dr. Demetri said.
The technique, which some investigators have dubbed "liquid biopsy," involves treating plasma with beads coated with DNA sequences that are complementary to target mutational sequences to create an emulsion polymerase chain reaction (PCR). The PCR amplifies the circulating DNA, which can then be identified with flow cytometry. The test can detect one circulating DNA molecule per 10,000 in plasma, according to the American Association for Cancer Research.
Dr. Demetri and his colleagues used the technology to retrospectively study mutations from patient samples in the GRID (GIST-Regorafenib in Progressive Disease) phase III study. In that trial, regorafenib (Stivarga), a multikinase inhibitor, significantly improved progression-free survival (PFS) compared with placebo (hazard ratio, 0.27; P less than .0001) in patients with metastatic GIST after failure of both standard and targeted therapies, including imatinib and sunitinib (Sutent).
The investigators looked for primary and secondary mutations in KIT in both plasma samples (available for 163 of 199 patients in GRID) and tumor tissue (from 102 patients), and found that BEAMing detected mutations in 58% of plasma samples, compared with 66% of tumor samples analyzed by the Sanger DNA sequencing method.
In addition, BEAMing detected mutations in PDGFRA in 1% of samples, and in KRAS in one of two samples, compared with 3% and 1%, respectively, for sequencing. Neither analysis method detected any BRAF mutations, and the numbers of PDGFRA and KRAS mutations were too small for researchers to draw meaningful conclusions.
When it came to KIT, however, there was a high degree of concordance between the tests where both types of samples from individual patients were available, including 100% agreement for primary KIT exon 9 mutations, 79% for primary KIT exon 11 mutations, and 84% overall for primary KIT exon 9 and 11 mutations.
The BEAMing technology can help determine prognosis of patients with GIST, Dr. Demetri said, noting that in the GRID trial, patients in the placebo arm who had secondary KIT mutations had shorter PFS than did patients without KIT mutations (HR, 1.82; P = .05). Patients with KIT exon 9 mutations had received a shorter course of imatinib than did the rest of the study population (HR, 2.02; P = .002) and a longer course of sunitinib (HR, 0.54; P = .005).
BEAMing analysis also showed that patients with secondary KIT mutations who received regorafenib had significantly better PFS than did patients in the placebo arm (HR, 0.22; P less than .001).
The data Dr. Demetri presented were "very exciting," said invited discussant Dr. Shreyaskumar R. Patel, professor of sarcoma oncology at the University of Texas MD Anderson Cancer Center in Houston.
"The important take-home messages are that there is some very good concordance between the tumor tissue analysis and the plasma analysis," and that regorafenib "appears to be totally agnostic to any of the mutational subsets and seems to equally benefit all patients," Dr. Patel said.
The study was supported in part by Bayer HealthCare. Dr. Demetri disclosed serving as a scientific consultant to the company. Dr. Patel reported having no disclosures relevant to the study.
CHICAGO – A novel technique for ferreting out DNA mutations in circulating plasma appears to be more sensitive than is conventional pathology at detecting drug-resistant mutations in patients with gastrointestinal stromal tumors, said an investigator at the annual meeting of the American Society of Clinical Oncology.
Secondary KIT mutations associated with resistance to tyrosine kinase inhibitors (TKIs) such as imatinib (Gleevec) were detected in 47% of plasma samples using "BEAMing" (beads, emulsions, amplification, magnetics) technology, compared with only 12% of tissue biopsy specimens, said Dr. George D. Demetri, director of the center for sarcoma and bone oncology at the Dana-Farber Cancer Institute in Boston.
"We know that tumor cells are constantly turning over, apoptosing, dying, and releasing free DNA into the bloodstream. I want to emphasize that this is not looking at circulating tumor cells; this is looking at free circulating DNA in the plasma, and by looking at that circulating DNA, we may be able to get a more comprehensive assessment of all the mutations from across all tumor burden in any given patient," Dr. Demetri said.
The technique, which some investigators have dubbed "liquid biopsy," involves treating plasma with beads coated with DNA sequences that are complementary to target mutational sequences to create an emulsion polymerase chain reaction (PCR). The PCR amplifies the circulating DNA, which can then be identified with flow cytometry. The test can detect one circulating DNA molecule per 10,000 in plasma, according to the American Association for Cancer Research.
Dr. Demetri and his colleagues used the technology to retrospectively study mutations from patient samples in the GRID (GIST-Regorafenib in Progressive Disease) phase III study. In that trial, regorafenib (Stivarga), a multikinase inhibitor, significantly improved progression-free survival (PFS) compared with placebo (hazard ratio, 0.27; P less than .0001) in patients with metastatic GIST after failure of both standard and targeted therapies, including imatinib and sunitinib (Sutent).
The investigators looked for primary and secondary mutations in KIT in both plasma samples (available for 163 of 199 patients in GRID) and tumor tissue (from 102 patients), and found that BEAMing detected mutations in 58% of plasma samples, compared with 66% of tumor samples analyzed by the Sanger DNA sequencing method.
In addition, BEAMing detected mutations in PDGFRA in 1% of samples, and in KRAS in one of two samples, compared with 3% and 1%, respectively, for sequencing. Neither analysis method detected any BRAF mutations, and the numbers of PDGFRA and KRAS mutations were too small for researchers to draw meaningful conclusions.
When it came to KIT, however, there was a high degree of concordance between the tests where both types of samples from individual patients were available, including 100% agreement for primary KIT exon 9 mutations, 79% for primary KIT exon 11 mutations, and 84% overall for primary KIT exon 9 and 11 mutations.
The BEAMing technology can help determine prognosis of patients with GIST, Dr. Demetri said, noting that in the GRID trial, patients in the placebo arm who had secondary KIT mutations had shorter PFS than did patients without KIT mutations (HR, 1.82; P = .05). Patients with KIT exon 9 mutations had received a shorter course of imatinib than did the rest of the study population (HR, 2.02; P = .002) and a longer course of sunitinib (HR, 0.54; P = .005).
BEAMing analysis also showed that patients with secondary KIT mutations who received regorafenib had significantly better PFS than did patients in the placebo arm (HR, 0.22; P less than .001).
The data Dr. Demetri presented were "very exciting," said invited discussant Dr. Shreyaskumar R. Patel, professor of sarcoma oncology at the University of Texas MD Anderson Cancer Center in Houston.
"The important take-home messages are that there is some very good concordance between the tumor tissue analysis and the plasma analysis," and that regorafenib "appears to be totally agnostic to any of the mutational subsets and seems to equally benefit all patients," Dr. Patel said.
The study was supported in part by Bayer HealthCare. Dr. Demetri disclosed serving as a scientific consultant to the company. Dr. Patel reported having no disclosures relevant to the study.
AT THE ASCO ANNUAL MEETING 2013
Major finding: BEAMing plasma-analysis technology identified secondary KIT mutations in 47% of samples from patients with gastrointestinal stromal tumors (GIST), compared with 12% of tissue samples subjected to DNA sequencing.
Data source: Comparison study of mutational analysis techniques, a substudy of the GRID phase III trial in 199 patients with GIST.
Disclosures: The study was supported in part by Bayer HealthCare. Dr. Demetri disclosed serving as a scientific consultant to the company. Dr. Patel reported having no disclosures relevant to the study.

Including caregivers in patient care is an ethical imperative
Ms. Stout is a 58-year-old divorced mother of two. Her eldest son, Paul, aged 35, has cystic fibrosis and is the recipient of a lung transplant. He has several developmental delays, and his comprehension of medicolegal documents becomes quite limited when he is medically ill and on narcotics. His outpatient medical team is aware of this and includes his mother in all treatment decisions.
However, in the hospital, the medical teams do not appreciate his limitations. In the inpatient hospital setting, he does not retain information presented to him. They question his mother’s continual presence and see her as "overinvolved and enmeshed with her adult son." Ms. Stout says that she has to fight with each new physician team to get them to understand that they need to involve her in all her son’s health care decisions. The younger male physicians, especially, identify with Paul.
Paul presents as a well-adjusted young man. He is agreeable, open, and friendly with the staff. Paul has limited social contacts outside of the hospital. Because of his lengthy involvement in the hospital care system, he is comfortable in the hospital and especially enjoys his interaction with the female nurses. He understands basic procedures because they have been repeated so many times. However, he does not understand his complex health care needs. Unless his comprehension is specifically tested, his deficits go unrecognized.
His mother knows the details of his history and is a better resource than the chart. She insists on being present at all times, despite the demands of her other commitments. Each time her son is admitted, she faces scrutiny, and repeatedly has to explain herself and her son’s limitations to each new physician. She finds this situation exhausting and humiliating. She does not understand why her presence cannot be accepted as helpful.
The toll of caregiving
Family caregivers face many physical, emotional, and financial demands that make them vulnerable to stress-related conditions, both physical and psychological. Caregiving affects caregivers’ health, which, in turn, affects their ability to provide care. The Caregiver Health Effects Study demonstrated a strong link between caregiving and mortality risk, finding that elderly caregivers supporting disabled spouses at home were 63% more likely to die within 4 years than noncaregiving elderly spouses (JAMA 1999;282:2215-9). In addition, family caregivers often lack the time and energy to prepare their own meals, exercise, or engage in their own preventive medical care. Physicians must stress the importance of caregiver self-care for the benefit of both the caregiver and the patient, and identify appropriate sources of community support services, such as home health aides, respite, or adult day care.
In 2008, according to Suzanne Mintz, a cofounder of the National Family Caregivers Association, the estimated market value of the family caregivers’ services was $375 billion annually. Almost one-third of the U.S. population provides care for a chronically ill, disabled, or aged family member or friend during any given year and spends an average of 20 hours per week providing care for loved ones. Two-thirds of caregivers are women, and 13% of family caregivers are providing 40 hours of care a week or more.
The American Psychological Association has a "Caregiver Briefcase." The briefcase contains caregiving facts; a practice section with common caregiver problems and interventions; and sections on research, education, and advocacy. The website and its contents are useful for family members as well as professionals.
In addition, the American Psychological Association offers ways for family members to integrate into health care teams. For example, electronic medical records can allow family members access to portions such as the patient’s problem and medication lists and most recent laboratory findings. Family caregivers can provide ongoing, real-time observations about the patient through the portal, as well as share information about what it is like to be a family caregiver. Those secure messages become part of the patient’s permanent medical record.
Shifting patient decision making to family members is a delicate negotiation between the patient’s ability to make independent decisions and the family’s desire to protect the patient from potentially poor decisions. At critical times, the family has to step up and assume decision-making responsibility for the patient.
To help physicians understand the ethics of this process, the American College of Physicians offers guidelines to help the physician know how best to collaborate with the patient and the caregiver (J. Gen. Intern. Med. 2010;25:255-60). These guidelines are endorsed by 10 medical professional societies, including the Society of General Internal Medicine, the American Academy of Neurology, and the American Academy of Hospice and Palliative Medicine.
Ethical guidelines for collaboration
When working with patients, making sure that six factors are met will help us do a better job of ensuring that the relationship with caregivers is productive for all three parties involved. Here is a listing:
• Respect the patient’s dignity, rights, and values in all patient-physician-caregiver interactions.
• Recognize that physician accessibility and excellent communication are fundamental to supporting the patient and family caregiver.
• Recognize the value of family caregivers as a source of continuity regarding the patient’s medical and psychosocial history.
• Facilitate end of life adjustments for the family.
• Ensure appropriate boundaries when the caregiver is a health care professional.
• Ensure the caregiver receives appropriate support, referrals, and services.
Our failure to use patient and family-centered care (PFCC) is tied to attitudinal, educational, and organizational barriers. The first attitudinal barrier is the expectation that families will be unreasonable. The second is that families will compromise confidentiality. The third is that physicians are largely unaware of research on the benefits of PFCC. Finally, physicians believe that PFCC is time consuming and costs too much.
Educational barriers include the lack of skills needed for collaboration among professionals, administrators, patients, and families.
Organizational barriers that get in the way of PFCC are the lack of guiding vision, the top-down approach with insufficient effort to build staff commitment; grassroots effort that lacks leadership, commitment, and support; scarce fiscal resources and competing priorities; and the absence of a funded coordinator.
Psychiatric illnesses are chronic medical illnesses. As more people have experiences as patients and caregivers, the pressure to involve family members such as Ms. Stout increases. Where does the resistance to involving family members in patient care come from? There is an unfounded, unspoken fear on the part of health professionals that families want something that the health care provider cannot guarantee – that their relative "will get well and everything will be fine." Health care providers might limit what they say to family members in order "not to upset them." If the family members perceive that they are being brushed off and dismissed, they can develop feelings of apprehension. A small upset or misunderstanding can then unleash repressed feelings, resulting in family members lashing out. When health care teams include the family and develop collaborative relationships with families, the likelihood of this kind of conflict is reduced.
Resistance also comes from the perception that family involvement is not necessary for patient care. Many of the consequences of isolating patients from their family are invisible, such as relationship strain, role changes, and caregiver burden. The reality is that, for patients such as Ms. Stout’s son, his mother’s involvement helps his medical team do a better job of managing his care.
It is time that psychiatry, and specifically the American Psychiatric Association, develop ethical guidelines outlining how to work with families of patients with chronic psychiatric illness. At the very least, we should sign on with other medical specialties by endorsing the American College of Physicians’ ethical guidelines described above. We have lagged behind the rest of medicine by failing to address this important issue.
This column, "Families in Psychiatry," appears regularly in Clinical Psychiatry News, a publication of IMNG Medical Media. Dr. Heru is with the department of psychiatry at the University of Colorado at Denver, Aurora. She is editor of the recently published book, "Working With Families in Medical Settings: A Multidisciplinary Guide for Psychiatrists and Other Health Professionals" (New York: Routledge, 2013).

When health care has a tail
Is your hospital going to the dogs? Perhaps, that is, if your hospital administrators believe in AAT.
That’s not a new randomized placebo-controlled trial for a nifty new medication? Far less complex, it is the simple acronym for animal-assisted therapy, a novel therapeutic modality that is spreading across the country.

I was surprised the first time I saw a canine proudly strutting down the hall of a hospital like he belonged there, but it makes perfect sense. Numerous studies have shown the positive psychological, physical, and even survival benefits of pet ownership. For many, their pet is a beloved member of the family.
But does AAT really work? Apparently so.
Northwest Community Hospital in Arlington Heights, Ill., utilizes AAT regularly to improve both the emotional and physical well-being of its patients. The renowned UCLA Medical Center has gone four-legged. The UCLA People-Animal Connection (PAC) is one of America’s most comprehensive animal-assisted therapy and activity programs. Even the Joint Commission uses PAC’s protocols to promote AAT, both here and abroad.
According to research published in the American Journal of Critical Care (2008;17:373-6), the benefits of AAT are primarily the result of "contact comfort," a tactile process during which unconditional attachment bonds form between humans and animals, leading to relaxation by reducing cardiovascular reactivity to stress. AAT was found to improve hemodynamics in patients with advanced heart failure by reducing right atrial pressure, both systolic and diastolic pulmonary artery pressure, pulmonary capillary wedge pressure, and neurohormone levels.
So the next time you see a dog and his owner stroll down the halls of your hospital, step aside. They have an important job to do as well.
Dr. Hester is a hospitalist with Baltimore-Washington Medical Center, Glen Burnie, Md., who has a passion for empowering patients to partner in their health care. She is the creator of the Patient Whiz, a mobile app for iOS.
Is your hospital going to the dogs? Perhaps, that is, if your hospital administrators believe in AAT.
That’s not a new randomized placebo-controlled trial for a nifty new medication? Far less complex, it is the simple acronym for animal-assisted therapy, a novel therapeutic modality that is spreading across the country.
I was surprised the first time I saw a canine proudly strutting down the hall of a hospital like he belonged there, but it makes perfect sense. Numerous studies have shown the positive psychological, physical, and even survival benefits of pet ownership. For many, their pet is a beloved member of the family.
But does AAT really work? Apparently so.
Northwest Community Hospital in Arlington Heights, Ill., utilizes AAT regularly to improve both the emotional and physical well-being of its patients. The renowned UCLA Medical Center has gone four-legged. The UCLA People-Animal Connection (PAC) is one of America’s most comprehensive animal-assisted therapy and activity programs. Even the Joint Commission uses PAC’s protocols to promote AAT, both here and abroad.
According to research published in the American Journal of Critical Care (2008;17:373-6), the benefits of AAT are primarily the result of "contact comfort," a tactile process during which unconditional attachment bonds form between humans and animals, leading to relaxation by reducing cardiovascular reactivity to stress. AAT was found to improve hemodynamics in patients with advanced heart failure by reducing right atrial pressure, both systolic and diastolic pulmonary artery pressure, pulmonary capillary wedge pressure, and neurohormone levels.
So the next time you see a dog and his owner stroll down the halls of your hospital, step aside. They have an important job to do as well.
Dr. Hester is a hospitalist with Baltimore-Washington Medical Center, Glen Burnie, Md., who has a passion for empowering patients to partner in their health care. She is the creator of the Patient Whiz, a mobile app for iOS.

Early Fibrinolysis Effective in STEMI but Causes More Strokes (STREAM)
Clinical question
Is early fibrinolysis followed by angiography an effective strategy for patients with STEMI presenting to hospitals without the capability to perform percutaneous coronary intervention?
Bottom line
Current guidelines recommend primary percutaneous coronary intervention (PCI) with a door-to-balloon time of 90 minutes for patients presenting with ST-segment elevation myocardial infarction (STEMI). However, this can be difficult to achieve, especially in remote areas without prompt access to PCI. This study finds that early fibrinolysis plus adjunctive antiplatelet and anticoagulant therapy followed by coronary angiography within 24 hours is effective in preventing adverse outcomes in patients presenting with recent onset symptoms of STEMI in whom PCI within 1 hour is not feasible. However, fibrinolysis therapy leads to a higher rate of ischemic strokes and intracranial bleeding, suggesting that timely PCI is still the optimal therapy for these patients. (LOE = 1b)
Reference
Study design
Randomized controlled trial (nonblinded)
Funding source
Industry
Allocation
Concealed
Setting
Inpatient (any location) with outpatient follow-up
Synopsis
Using concealed allocation, these investigators randomized 1892 patients who presented within 3 hours after onset of symptoms of STEMI but could not undergo PCI within 1 hour to receive 1 of 2 interventions: immediate transfer to a PCI-capable facility, or initial fibrinolysis treatment with tenecteplase followed by angiography within 24 hours. The fibrinolysis group also received enoxaparin and clopidogrel as adjunctive therapy. The primary endpoint was the composite of all-cause mortality, shock, congestive heart failure, or reinfarction at 30 days. Baseline characteristics were similar in the 2 groups, except for a higher frequency of previous congestive heart failure in the PCI group. Partway through the trial, the dose of tenecteplase was halved in patients 75 years or older because of a higher frequency of intracranial bleeds in this group. The median time from symptom onset to start of reperfusion therapy (either initiation of fibrinolysis or arterial sheath insertion for PCI) was shorter in the fibrinolysis group (100 minutes vs 178 minutes; P < .0001). However, one third of the patients in the fibrinolysis group required rescue PCI because of failed reperfusion. Overall, there were no significant differences detected between the 2 groups in either the primary endpoint or in the individual components of the endpoint. The fibrinolysis group had a higher rate of total hemorrhagic and ischemic strokes (1.6% vs 0.5%; P = .03).
Dr. Kulkarni is an assistant professor of hospital medicine at Northwestern University in Chicago.
No Difference in Long-Term Outcomes with Full vs Trophic Feeding for Acute Lung Injury Patients
Clinical question
Does initial trophic feeding, as compared with full feeding, affect long-term outcomes in critically ill patients with acute lung injury?
Bottom line
There were no significant long-term differences in physical function, survival, psychological symptoms, or cognitive function in patients with acute lung injury who received initial trophic feeding as compared with full enteral feeding. (LOE = 1b)
Reference
Study design
Randomized controlled trial (nonblinded)
Funding source
Government
Allocation
Concealed
Setting
Inpatient (any location) with outpatient follow-up
Synopsis
Low-energy permissive underfeeding, or "trophic feeding," is one proposed nutritional strategy for mechanically ventilated patients. The previously published EDEN trial showed no significant differences in short-term mortality or ventilation-free days in patients with acute lung injury who received initial trophic feeding versus full enteral feeding (Rice, et al. JAMA 2012;307(8):795-803). In this follow-up of the EDEN trial, investigators examined the long-term effects of this intervention. The patients included in the EDEN trial had acute lung injury primarily due to pneumonia or sepsis and had a mean age of 52 years. The patients were randomized to either full feeding (meeting 80% of the caloric goal) or trophic feeding (meeting 25% of the caloric goal) for up to 6 days. Of the 951 patients in the initial EDEN trial, 563 consented to this follow-up study. Research staff interviewed the surviving participants at 6 months (n = 514) and at 12 months (n = 487). Taken together, these patients had decreased physical and mental abilities as compared with population norms, impaired quality of life and return to work, and increased psychological symptoms. When comparing the full feeding cohort with the patients that received trophic feeding, there was no significant difference in the primary outcome of physical function at 6 or 12 months as assessed by the Short-form Health Outcomes Survey (SF-36). The SF-36 mental health measures favored the trophic feeding group at 12 months, but the differences in scores were small. Overall, there were no differences in specific psychological symptoms -- such as anxiety or depression, 12-month survival, cognitive function, or employment status -- between the 2 groups.
Dr. Kulkarni is an assistant professor of hospital medicine at Northwestern University in Chicago.
Kudos to our departing Medical Editor, Dr. George Andros
Dr. George Andros, departing Medical Editor of Vascular Specialist, was presented with a Presidential Citation Award by Dr. Peter Gloviczki in recognition of his exemplary service to the Society for Vascular Surgery for outstanding editorial leadership of Vascular Specialist. He received the award during the SVS Business Meeting May 31 at the Vascular Annual Meeting.
Dr. Andros succeeded Dr. K. Wayne Johnston as only the second medical editor of Vascular Specialist. Under his esteemed leadership over the past years, Vascular Specialist has widened its coverage of vascular surgery and entered the online world with online-only editions, e-newsletters, and a website.
He installed a stellar board of editorial advisors from across the United States and the world and inspired them to provide the insightful commentaries that have so enhanced our pages.
As managing editor, I would personally like to thank Dr. Andros for his commitment, professionalism, and friendship throughout this time.
Dr. Andros will be succeeded by Dr. Russell Samson, who will begin his medical editor duties with the August print edition of Vascular Specialist.
Mark Lesney
Managing Editor, Vascular Specialist
A teen who is wasting away
CASE: Weak and passive
Cassandra, age 17, recently was discharged from a medical rehabilitation facility with a diagnosis of conversion disorder. Her school performance and attendance had been steadily declining for the last 6 months as she lost strength and motivation to take care of herself. Cassandra lives with her father, who is her primary caretaker. Her parents are separated and her mother has fibromyalgia and chronic fatigue syndrome, which leaves her unable to care for her daughter or participate in appointments.
Now lethargic and wasting away physically, Cassandra is pushed in a wheelchair by her weary father into a child psychiatrist’s office. She does not look up or make eye contact. Her father says “the doctors didn’t know what they were doing. That needle test, a nerve conduction study they did, is what made her worse.” Although Cassandra moves her arms to adjust herself in the wheelchair, she does not move her legs or try to move the wheelchair.
Cassandra’s father states that she has “congenital neuromyopathy. Her mother gave it to her in utero. But nobody listens to me or orders the tests that will prove I am right.” He insists on obscure and specialized blood tests and immune function panels to prove that a congenital condition is causing his daughter’s deterioration and physical debility. He is unwilling to accept that there is any other cause of her condition.
Cassandra’s father is unemployed and has no social contacts or supports. He asserts that “the medical system” is against him, and he believes medical interventions are harming his daughter. He keeps Cassandra isolated from friends and other family members.
How would you proceed?
a) separate Cassandra from her father during the interview
b) contact Cassandra’s mother for collateral information
c) assure Cassandra that there is no medical cause for her physical condition
d) order the testing her father requests
EVALUATION: Demoralized, hopeless
Cassandra is uncooperative with the interview and answers questions with one-word answers. Her affect is irritable and her demeanor is frustrated. She does not seem concerned that she needs assistance with eating and toileting.
When outpatient treatment with her primary care physician did not stop her physical deterioration, she was referred to a tertiary care academic medical center for a complete medical and neurologic workup. The workup, including an MRI, electroencephalogram, nerve conduction studies, and full immunologic panels, was negative for any physical illness, including neuromuscular degenerative disease. A muscle biopsy was considered, but not ordered because Cassandra and her father resisted.
During this hospitalization, she was diagnosed with conversion disorder by the psychiatry consultation service, and transferred to a physical rehabilitation facility for further care. At the rehab facility, Cassandra’s father interfered with her care, arguing constantly with the medical team. Cassandra demonstrated no effort to work with physical or occupational therapy and was discharged after 2 weeks because of noncompliance with treatment. Cassandra and her father are resentful that no physical cause was found and feel that the medical workup and time at the rehabilitation facility made her condition worse. The rehabilitation hospital referred Cassandra to an outpatient child psychiatrist for follow-up.
During the intake evaluation and follow-up appointments with the child psychiatrist, her affect is negativistic and restrictive. She is resistant to talking about her condition and accepting psychotherapeutic interventions. She is quick to blame others for her lack of progress and unable to take responsibility for working on her treatment plan. Cassandra feels demoralized, depressed, and hopeless about her situation and prospects for recovery. She feels that no one is listening to her father and if “they did just the tests he wants, we will know what is wrong with me and that he is right.”
The author’s observations
Table 1 lists conditions to consider in the differential diagnosis of conversion disorder. Although Cassandra’s conversion disorder diagnosis appears to be appropriate, it is important to consider 2 other possibilities: delusional disorder, somatic type with familial features, and Munchausen syndrome by proxy. An underlying depressive or anxiety disorder also should be considered and treated appropriately.

Conversion disorder has a challenging and often complex presentation in children and adolescents. Conversion disorders in children commonly are associated with stressful family situations including divorce, marital conflict, or loss of a close family member.1 An overbearing and conflict-prone parenting style also is associated with childhood conversion disorders.2 Common physical symptoms in conversion disorder are functional abdominal pain, partial paralysis, numbness, or seizures. Individuals such as Cassandra who are unable to express or verbalize their emotional distress are vulnerable to expressing their distress in somatic symptoms. Cassandra demonstrates La belle indifference, the characteristic attitude of not being overly concerned about what others would consider an alarming functional impairment.
Delusional disorder. A diagnosis of delusional disorder, somatic type with familial features was considered because Cassandra and her father shared persecutory and paranoid beliefs that her condition was brought on by some hidden, unrecognized medical condition. A delusional disorder with shared or “familial” features develops when a parent has strongly held delusional beliefs that are transferred to the child. Typically, it develops within the context of a close relationship with the parent, is similar in content to the parent’s belief, and is not preceded by psychosis or prodromal to schizophrenia.3
Because Cassandra’s father transferred his delusional system to his daughter, she clung to the belief that her physical symptoms and immobility were caused by medical misdiagnosis and failure to recognize her illness. Cassandra’s father strongly resisted and defended against accepting his role in her medical condition.
Munchausen by proxy. Because Cassandra and her father share a delusional system that prevented her from accepting and following treatment recommendations, it is possible that her father created her condition. Munchausen syndrome by proxy is a condition whereby illness-producing behavior in a child is exaggerated, fabricated, or induced by a parent or guardian.4 Separating Cassandra from her father and initiating antipsychotic treatment for him are critical considerations for her recovery.
How would you treat Cassandra?
a) call Child Protective Services (CPS) to remove Cassandra from her father’s custody
b) hospitalize Cassandra for intensive treatment of conversion disorder
c) start Cassandra on an atypical antipsychotic
d) begin cognitive-behavioral therapy (CBT) and an antidepressant
Treatment approach
Treating a patient with a conversion disorder, somatic type starts with validating that the patient’s and parent’s distress is real to them (Table 2).5 The clinician acknowledges that no physical evidence of physiological dysfunction has been found, which can be reassuring to the patient and family. The clinician then states that the patient’s condition and the physical manifestation of the symptoms are real. A patient’s or parent’s resistance to this reassurance may indicate that they have a large investment in the symptoms and perpetuating the dysfunction.

Taking a mind-body approach—explaining that the child’s condition is created and perpetuated by a mind-body connection and is not under their voluntary control—often is well received by patients and parents. The treating clinician emphasizes that the condition is physically disabling and that careful, appropriate, and intensive treatment is necessary.
A rehabilitation model has power for patients with conversion disorder because it acknowledges the patient’s discomfort and loss of function while shifting the focus away from finding what is wrong. The goal is to actively engage patients in their own care to help them return to normal functioning.6
Cassandra was encouraged to participate in physical therapy, go to school, and take care of herself. Actively participating in her care and recovery meant that Cassandra had to leave the sick role behind, which was impossible for her father, who saw her as passive, helpless, and fragile.
TREATMENT: Pharmacotherapy, CBT
During psychiatric evaluation, it becomes clear that in addition to her physical debility, Cassandra has major depressive disorder, moderate without psychotic features. Her depression contributes to her hopelessness and lack of participation in treatment. After discussion with her family about how her depressive symptoms are preventing her recovery, Cassandra is started on escitalopram, 10 mg/d. CBT helps her manage her depressive symptoms, prevent further somatization, and correct misperceptions about her body function and disabilities.
For conversion disorder patients, physical therapy can be combined with incentives tied to improvements in functioning. Cassandra has overwhelming anxiety while attempting physical therapy, which interferes with her participation in the therapy. Lorazepam, 0.5 mg/d, is prescribed for her intense anxiety and panic attacks, which led her to avoid physical therapy.
Staff at the rehabilitation hospital calls CPS because Cassandra’s father interferes with her care and treatment plan. CPS continues to monitor Cassandra’s progress through outpatient care. An individualized education plan and psychoeducational testing help determine a school placement to meet Cassandra’s educational needs.
CPS directs Cassandra to stay with her mother for alternating weeks. While at her mother’s, Cassandra is more interested in taking care of herself. She helps with getting herself into bed and to the toilet. Upon returning to her father’s home, these gains are lost.
The author’s observations
Psychodynamic and unconscious motivators for conversion disorder operate on a deeper, hidden level. The underlying primary conflict in pseudoseizures—a more common conversion disorder—has been described as an inability to express negative emotions such as anger. Social problems, conflict with parents, learning disorders,7 or sexual abuse8 produce the negative emotions caused by the primary conflict. Cassandra yearned for a closer relationship with her mother, yet she remained enmeshed with poor intrapsychic boundaries with her father. The fact that he assisted his 17-year-old daughter with toileting raised the possibility of sexual abuse. Sexual abuse could have led to her depression and physical decline. Cassandra’s physical debility also may have been her way to foster dependency on her father and protect him from perceived persecution.
Conversion disorder may have been a result of Cassandra’s defense mechanisms against admitting abuse and protecting against abandonment. Establishing a therapeutic alliance with Cassandra is essential to allow a graceful exit from the conversion disorder symptoms and her father’s hold on her thinking about her illness. However, this alliance may seem to threaten the child’s special connection with the parent. A therapeutic alliance was elusive in Cassandra’s case and likely nearly impossible.
Both parents underwent court-ordered psychological testing as part of the CPS evaluation. Testing on Cassandra’s father indicated a rigid personality structure with long-standing paranoia and mistrust of authority. Because Cassandra endorsed his delusional system completely, it is likely that her father inculcated her into believing his beliefs and transmitted his delusions to her by their close proximity and time together. Based upon this delusional belief system, Cassandra gave up trying to move her legs and her muscles atrophied. Her legs were so weak that she stopped trying to walk or move, illustrating the power of the mind-body connection to produce functional and physiological changes.
Children who live with a mother with chronic illness are at risk of developing psychosomatic disorders.9 Cassandra’s mother had fibromyalgia and chronic pain with symptoms of headache, weakness, and muscle pain and frequent medical office visits and tests without definitive results or symptom relief. Although Cassandra did not live with her mother, Cassandra’s somatization symptoms may be a result of modeling or observational learning within her family.9 Cassandra may have unconsciously adopted her mother’s symptoms and behaviors as a way to cope with stress and gain attention to her needs.
Cassandra’s negative affect, sensitivity to change, and lack of resiliency were further risk factors for developing a somatoform illness.10 She resisted and would not follow through with physical therapy. Krisnakumar10 also reported that an inability to persist in completing tasks is a risk factor for somatoform disorder. Family dynamics of problematic parental interactions also played a role in her somatoform disorder (Table 3).11
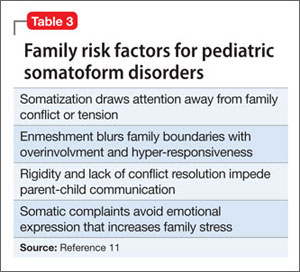
OUTCOME: Foster care, improvement
Cassandra receives weekly CBT and biweekly medication monitoring and demonstrates a moderate improvement in mood with less negativity and irritability. Her anxiety symptoms gradually respond to treatment. However, her emotional gains are not matched with improvement in her physical functioning or participation in physical therapy. Cassandra does not recover her muscular strength or control and shows little improvement in her physical capacity and independence.
After 3 months of treatment, Cassandra does not make sufficient progress or actively participate in treatment. Because her father continues to interfere with the treatment plan and does not receive treatment himself, CPS obtains a court order to prevent her father from directing her medical care and telling her treating physicians which tests to order.
Because these interventions do not improve her treatment response, Cassandra is removed from her parents’ care and placed in a therapeutic foster care home, thereby improving her independence and chances for recovery. After 3 months in foster care, she more actively participates in her physical rehabilitation. Water therapy, with the buoyancy and support in water, helps her regain muscle strength and control of her lower extremities.
Bottom Line
Patients with conversion disorder present with functional impairment and physical symptoms without clear physiological causes. Parents have a strong influence on the presentation and course of conversion disorder in children and adolescents. Parents’ mental and physical illnesses are independent risk factors for childhood somatoform disorders. Evaluation of parents’ psychological and psychiatric state is essential to determine intervention.
Related Resource
- Seltzer WJ. Conversion disorder in childhood and adolescence: a familial/cultural approach. Family Systems Medicine. 1985;3(3):261-280.
Drug Brand Names
Escitalopram • Lexapro
Lorazepam • Ativan
Disclosure
Dr. Leipsic reports no financial relationship with any company whose products are mentioned in this article or with manufacturers of competing products.
1. Wyllie E, Glazer JP, Benbadis S, et al. Psychiatric features of children and adolescents with pseudoseizures. Arch Pediatr Adolesc Med. 1999;153(3):244-248.
2. Salmon P, Al-Marzooqi SM, Baker G, et al. Childhood family dysfunction and associated abuse in patients with nonepileptic seizures: towards a casual model. Psychosom Med. 2003;65(4):695-700.
3. Manschreck T. Delusional disorder and shared psychotic disorder. In: Sadock BJ, Sadock VA, eds. Kaplan & Sadock’s comprehensive textbook of psychiatry. 7th ed.
Philadelphia, PA: Lippincott Williams & Wilkins; 2000: 1243-1264.
4. Meadow R. Munchausen syndrome by proxy. The hinterland of child abuse. Lancet. 1977;2(8033):343-345.
5. Campo JV, Fritsch SL. Somatization in children and adolescents. J Am Acad Child Adolesc Psychiatry. 1994; 33(9):1223-1235.
6. Campo JV, Fritz G. A management model for pediatric somatization. Psychosomatics. 2001;42(6):467-476.
7. Silver LB. Conversion disorder with pseudoseizures in adolescence: a stress reaction to unrecognized and untreated learning disabilities. J Am Accad Child Psychiatry. 1982; 21(5):508-512.
8. AlperK,DevinskyO,PerrineK,etal.Nonepilepticseizures and childhood sexual and physical abuse. Neurology. 1993; 43(10):1950-1953.
9. Jamison RN, Walker LS. Illness behavior in children of chronic pain patients. Int J Psychiatry Med. 1992;22(4): 329-342.
10. Krisnakumar P, Sumesh P, Mathews L. Tempermental traits associated with conversion disorder. Indian Pediatr. 2006;43(10):895-899.
11. Minuchin S, Rosman BL, Baker L. Psychosomatic families: anorexia nervosa in context. Cambridge, MA: Harvard University Press; 1978.
CASE: Weak and passive
Cassandra, age 17, recently was discharged from a medical rehabilitation facility with a diagnosis of conversion disorder. Her school performance and attendance had been steadily declining for the last 6 months as she lost strength and motivation to take care of herself. Cassandra lives with her father, who is her primary caretaker. Her parents are separated and her mother has fibromyalgia and chronic fatigue syndrome, which leaves her unable to care for her daughter or participate in appointments.
Now lethargic and wasting away physically, Cassandra is pushed in a wheelchair by her weary father into a child psychiatrist’s office. She does not look up or make eye contact. Her father says “the doctors didn’t know what they were doing. That needle test, a nerve conduction study they did, is what made her worse.” Although Cassandra moves her arms to adjust herself in the wheelchair, she does not move her legs or try to move the wheelchair.
Cassandra’s father states that she has “congenital neuromyopathy. Her mother gave it to her in utero. But nobody listens to me or orders the tests that will prove I am right.” He insists on obscure and specialized blood tests and immune function panels to prove that a congenital condition is causing his daughter’s deterioration and physical debility. He is unwilling to accept that there is any other cause of her condition.
Cassandra’s father is unemployed and has no social contacts or supports. He asserts that “the medical system” is against him, and he believes medical interventions are harming his daughter. He keeps Cassandra isolated from friends and other family members.
How would you proceed?
a) separate Cassandra from her father during the interview
b) contact Cassandra’s mother for collateral information
c) assure Cassandra that there is no medical cause for her physical condition
d) order the testing her father requests
EVALUATION: Demoralized, hopeless
Cassandra is uncooperative with the interview and answers questions with one-word answers. Her affect is irritable and her demeanor is frustrated. She does not seem concerned that she needs assistance with eating and toileting.
When outpatient treatment with her primary care physician did not stop her physical deterioration, she was referred to a tertiary care academic medical center for a complete medical and neurologic workup. The workup, including an MRI, electroencephalogram, nerve conduction studies, and full immunologic panels, was negative for any physical illness, including neuromuscular degenerative disease. A muscle biopsy was considered, but not ordered because Cassandra and her father resisted.
During this hospitalization, she was diagnosed with conversion disorder by the psychiatry consultation service, and transferred to a physical rehabilitation facility for further care. At the rehab facility, Cassandra’s father interfered with her care, arguing constantly with the medical team. Cassandra demonstrated no effort to work with physical or occupational therapy and was discharged after 2 weeks because of noncompliance with treatment. Cassandra and her father are resentful that no physical cause was found and feel that the medical workup and time at the rehabilitation facility made her condition worse. The rehabilitation hospital referred Cassandra to an outpatient child psychiatrist for follow-up.
During the intake evaluation and follow-up appointments with the child psychiatrist, her affect is negativistic and restrictive. She is resistant to talking about her condition and accepting psychotherapeutic interventions. She is quick to blame others for her lack of progress and unable to take responsibility for working on her treatment plan. Cassandra feels demoralized, depressed, and hopeless about her situation and prospects for recovery. She feels that no one is listening to her father and if “they did just the tests he wants, we will know what is wrong with me and that he is right.”
The author’s observations
Table 1 lists conditions to consider in the differential diagnosis of conversion disorder. Although Cassandra’s conversion disorder diagnosis appears to be appropriate, it is important to consider 2 other possibilities: delusional disorder, somatic type with familial features, and Munchausen syndrome by proxy. An underlying depressive or anxiety disorder also should be considered and treated appropriately.
Conversion disorder has a challenging and often complex presentation in children and adolescents. Conversion disorders in children commonly are associated with stressful family situations including divorce, marital conflict, or loss of a close family member.1 An overbearing and conflict-prone parenting style also is associated with childhood conversion disorders.2 Common physical symptoms in conversion disorder are functional abdominal pain, partial paralysis, numbness, or seizures. Individuals such as Cassandra who are unable to express or verbalize their emotional distress are vulnerable to expressing their distress in somatic symptoms. Cassandra demonstrates La belle indifference, the characteristic attitude of not being overly concerned about what others would consider an alarming functional impairment.
Delusional disorder. A diagnosis of delusional disorder, somatic type with familial features was considered because Cassandra and her father shared persecutory and paranoid beliefs that her condition was brought on by some hidden, unrecognized medical condition. A delusional disorder with shared or “familial” features develops when a parent has strongly held delusional beliefs that are transferred to the child. Typically, it develops within the context of a close relationship with the parent, is similar in content to the parent’s belief, and is not preceded by psychosis or prodromal to schizophrenia.3
Because Cassandra’s father transferred his delusional system to his daughter, she clung to the belief that her physical symptoms and immobility were caused by medical misdiagnosis and failure to recognize her illness. Cassandra’s father strongly resisted and defended against accepting his role in her medical condition.
Munchausen by proxy. Because Cassandra and her father share a delusional system that prevented her from accepting and following treatment recommendations, it is possible that her father created her condition. Munchausen syndrome by proxy is a condition whereby illness-producing behavior in a child is exaggerated, fabricated, or induced by a parent or guardian.4 Separating Cassandra from her father and initiating antipsychotic treatment for him are critical considerations for her recovery.
How would you treat Cassandra?
a) call Child Protective Services (CPS) to remove Cassandra from her father’s custody
b) hospitalize Cassandra for intensive treatment of conversion disorder
c) start Cassandra on an atypical antipsychotic
d) begin cognitive-behavioral therapy (CBT) and an antidepressant
Treatment approach
Treating a patient with a conversion disorder, somatic type starts with validating that the patient’s and parent’s distress is real to them (Table 2).5 The clinician acknowledges that no physical evidence of physiological dysfunction has been found, which can be reassuring to the patient and family. The clinician then states that the patient’s condition and the physical manifestation of the symptoms are real. A patient’s or parent’s resistance to this reassurance may indicate that they have a large investment in the symptoms and perpetuating the dysfunction.
Taking a mind-body approach—explaining that the child’s condition is created and perpetuated by a mind-body connection and is not under their voluntary control—often is well received by patients and parents. The treating clinician emphasizes that the condition is physically disabling and that careful, appropriate, and intensive treatment is necessary.
A rehabilitation model has power for patients with conversion disorder because it acknowledges the patient’s discomfort and loss of function while shifting the focus away from finding what is wrong. The goal is to actively engage patients in their own care to help them return to normal functioning.6
Cassandra was encouraged to participate in physical therapy, go to school, and take care of herself. Actively participating in her care and recovery meant that Cassandra had to leave the sick role behind, which was impossible for her father, who saw her as passive, helpless, and fragile.
TREATMENT: Pharmacotherapy, CBT
During psychiatric evaluation, it becomes clear that in addition to her physical debility, Cassandra has major depressive disorder, moderate without psychotic features. Her depression contributes to her hopelessness and lack of participation in treatment. After discussion with her family about how her depressive symptoms are preventing her recovery, Cassandra is started on escitalopram, 10 mg/d. CBT helps her manage her depressive symptoms, prevent further somatization, and correct misperceptions about her body function and disabilities.
For conversion disorder patients, physical therapy can be combined with incentives tied to improvements in functioning. Cassandra has overwhelming anxiety while attempting physical therapy, which interferes with her participation in the therapy. Lorazepam, 0.5 mg/d, is prescribed for her intense anxiety and panic attacks, which led her to avoid physical therapy.
Staff at the rehabilitation hospital calls CPS because Cassandra’s father interferes with her care and treatment plan. CPS continues to monitor Cassandra’s progress through outpatient care. An individualized education plan and psychoeducational testing help determine a school placement to meet Cassandra’s educational needs.
CPS directs Cassandra to stay with her mother for alternating weeks. While at her mother’s, Cassandra is more interested in taking care of herself. She helps with getting herself into bed and to the toilet. Upon returning to her father’s home, these gains are lost.
The author’s observations
Psychodynamic and unconscious motivators for conversion disorder operate on a deeper, hidden level. The underlying primary conflict in pseudoseizures—a more common conversion disorder—has been described as an inability to express negative emotions such as anger. Social problems, conflict with parents, learning disorders,7 or sexual abuse8 produce the negative emotions caused by the primary conflict. Cassandra yearned for a closer relationship with her mother, yet she remained enmeshed with poor intrapsychic boundaries with her father. The fact that he assisted his 17-year-old daughter with toileting raised the possibility of sexual abuse. Sexual abuse could have led to her depression and physical decline. Cassandra’s physical debility also may have been her way to foster dependency on her father and protect him from perceived persecution.
Conversion disorder may have been a result of Cassandra’s defense mechanisms against admitting abuse and protecting against abandonment. Establishing a therapeutic alliance with Cassandra is essential to allow a graceful exit from the conversion disorder symptoms and her father’s hold on her thinking about her illness. However, this alliance may seem to threaten the child’s special connection with the parent. A therapeutic alliance was elusive in Cassandra’s case and likely nearly impossible.
Both parents underwent court-ordered psychological testing as part of the CPS evaluation. Testing on Cassandra’s father indicated a rigid personality structure with long-standing paranoia and mistrust of authority. Because Cassandra endorsed his delusional system completely, it is likely that her father inculcated her into believing his beliefs and transmitted his delusions to her by their close proximity and time together. Based upon this delusional belief system, Cassandra gave up trying to move her legs and her muscles atrophied. Her legs were so weak that she stopped trying to walk or move, illustrating the power of the mind-body connection to produce functional and physiological changes.
Children who live with a mother with chronic illness are at risk of developing psychosomatic disorders.9 Cassandra’s mother had fibromyalgia and chronic pain with symptoms of headache, weakness, and muscle pain and frequent medical office visits and tests without definitive results or symptom relief. Although Cassandra did not live with her mother, Cassandra’s somatization symptoms may be a result of modeling or observational learning within her family.9 Cassandra may have unconsciously adopted her mother’s symptoms and behaviors as a way to cope with stress and gain attention to her needs.
Cassandra’s negative affect, sensitivity to change, and lack of resiliency were further risk factors for developing a somatoform illness.10 She resisted and would not follow through with physical therapy. Krisnakumar10 also reported that an inability to persist in completing tasks is a risk factor for somatoform disorder. Family dynamics of problematic parental interactions also played a role in her somatoform disorder (Table 3).11
OUTCOME: Foster care, improvement
Cassandra receives weekly CBT and biweekly medication monitoring and demonstrates a moderate improvement in mood with less negativity and irritability. Her anxiety symptoms gradually respond to treatment. However, her emotional gains are not matched with improvement in her physical functioning or participation in physical therapy. Cassandra does not recover her muscular strength or control and shows little improvement in her physical capacity and independence.
After 3 months of treatment, Cassandra does not make sufficient progress or actively participate in treatment. Because her father continues to interfere with the treatment plan and does not receive treatment himself, CPS obtains a court order to prevent her father from directing her medical care and telling her treating physicians which tests to order.
Because these interventions do not improve her treatment response, Cassandra is removed from her parents’ care and placed in a therapeutic foster care home, thereby improving her independence and chances for recovery. After 3 months in foster care, she more actively participates in her physical rehabilitation. Water therapy, with the buoyancy and support in water, helps her regain muscle strength and control of her lower extremities.
Bottom Line
Patients with conversion disorder present with functional impairment and physical symptoms without clear physiological causes. Parents have a strong influence on the presentation and course of conversion disorder in children and adolescents. Parents’ mental and physical illnesses are independent risk factors for childhood somatoform disorders. Evaluation of parents’ psychological and psychiatric state is essential to determine intervention.
Related Resource
- Seltzer WJ. Conversion disorder in childhood and adolescence: a familial/cultural approach. Family Systems Medicine. 1985;3(3):261-280.
Drug Brand Names
Escitalopram • Lexapro
Lorazepam • Ativan
Disclosure
Dr. Leipsic reports no financial relationship with any company whose products are mentioned in this article or with manufacturers of competing products.
1. Wyllie E, Glazer JP, Benbadis S, et al. Psychiatric features of children and adolescents with pseudoseizures. Arch Pediatr Adolesc Med. 1999;153(3):244-248.
2. Salmon P, Al-Marzooqi SM, Baker G, et al. Childhood family dysfunction and associated abuse in patients with nonepileptic seizures: towards a casual model. Psychosom Med. 2003;65(4):695-700.
3. Manschreck T. Delusional disorder and shared psychotic disorder. In: Sadock BJ, Sadock VA, eds. Kaplan & Sadock’s comprehensive textbook of psychiatry. 7th ed.
Philadelphia, PA: Lippincott Williams & Wilkins; 2000: 1243-1264.
4. Meadow R. Munchausen syndrome by proxy. The hinterland of child abuse. Lancet. 1977;2(8033):343-345.
5. Campo JV, Fritsch SL. Somatization in children and adolescents. J Am Acad Child Adolesc Psychiatry. 1994; 33(9):1223-1235.
6. Campo JV, Fritz G. A management model for pediatric somatization. Psychosomatics. 2001;42(6):467-476.
7. Silver LB. Conversion disorder with pseudoseizures in adolescence: a stress reaction to unrecognized and untreated learning disabilities. J Am Accad Child Psychiatry. 1982; 21(5):508-512.
8. AlperK,DevinskyO,PerrineK,etal.Nonepilepticseizures and childhood sexual and physical abuse. Neurology. 1993; 43(10):1950-1953.
9. Jamison RN, Walker LS. Illness behavior in children of chronic pain patients. Int J Psychiatry Med. 1992;22(4): 329-342.
10. Krisnakumar P, Sumesh P, Mathews L. Tempermental traits associated with conversion disorder. Indian Pediatr. 2006;43(10):895-899.
11. Minuchin S, Rosman BL, Baker L. Psychosomatic families: anorexia nervosa in context. Cambridge, MA: Harvard University Press; 1978.
Respondeat superior: What are your responsibilities?
Dear Dr. Mossman:
In my residency program, we cover the psychiatric emergency room (ER) overnight, and we admit, discharge, and make treatment recommendations without calling the attending psychiatrists about every decision. But if something goes wrong—eg, a discharged patient later commits suicide—I’ve heard that the faculty psychiatrist may be held liable despite never having met the patient. Should we awaken our attendings to discuss every major treatment decision?
Submitted by “Dr. R”
Postgraduate medical training programs in all specialties let interns and residents make judgments and decisions outside the direct supervision of board-certified faculty members. Medical education cannot occur unless doctors learn to take independent responsibility for patients. But if poor decisions by physicians-in-training lead to bad outcomes, might their teachers and training institutions share the blame—and the legal liability for damages?
The answer is “yes.” To understand why, and to learn about how Dr. R’s residency program should address this possibility, we’ll cover:
• the theory of respondeat superior
• factors affecting potential vicarious liability
• how postgraduate training balances supervision needs with letting residents get real-world treatment experience.
Vicarious liability
In general, if Person A injures Person B, Person B may initiate a tort action against Person A to seek monetary compensation. If the injury occurred while Person A was working for Person C, then under a legal doctrine called respondeat superior (Latin for “let the master answer”), courts may allow Person B to sue Person C, too, even if Person C wasn’t present when the injury occurred and did nothing that harmed Person B directly.
Respondeat superior imposes vicarious liability on an employer for negligent acts by employees who are “performing work assigned by the employer or engaging in a course of conduct subject to the employer’s control.”1 The doctrine extends back to 17th-century English courts and originated under the theory that, during a servant’s employment, one may presume that the servant acted by his master’s authority.2
Modern authors state that the justification for imposing vicarious liability “is largely one of public or social policy under which it has been determined that, irrespective of fault, a party should be held to respond for the acts of another.”3 Employers usually have more resources to pay damages than their employees do,4 and “in hard fact, the reason for the employers’ liability is the damages are taken from a deep pocket.”5
Determining potential responsibility
In Dr. R’s scenario, an adverse event follows the actions of a psychiatry resident who is performing a training activity at a hospital ER. Whether an attorney acting on behalf of an injured client can bring a claim of respondeat superior against the hospital, the resident’s academic institution, or the attending psychiatrist will depend on the nature of the relationships among these parties. This often becomes a complex legal matter that involves examining the residency program’s educational arrangements, official training documents (eg, affiliation agreements between a university and a hospital), employment contracts, and supervisory policies. In addition, statutes and legal precedents governing vicarious liability vary from state to state. Although an initial malpractice filing may name several individuals and institutions as defendants, courts eventually must apply their jurisdictions’ rules governing vicarious liability to determine which parties can lawfully bear potential liability.
Some courts have held that a private hospital generally is not responsible for negligent actions by attending physicians because the hospital does not control patient care decisions and physicians are not the hospital’s employees.6-8 Physicians in training, however, usually are employees of hospitals or their training institutions. Residents and attending physicians in many psychiatry training programs work at hospitals where patients reasonably believe that the doctors function as part of the hospital’s larger service enterprise. In some jurisdictions, this makes the hospitals potentially liable for their doctors’ acts,9 even when the doctors, as public employees, may have statutory immunity from being sued as individuals.10
Reuter11 has suggested that other agency theories may allow a resident’s error to create liability for an attending physician or medical school. The resident may be viewed as a “borrowed servant” such that, although a hospital was the resident’s general employer, the attending physician still exercised sufficient control with respect to the faulty act in question. A medical school faculty physician also may be liable along with the hospital under a joint employment theory based upon the faculty member’s “right to control” how the resident cares for the attending’s patient.11
Taking into account recent cases and trends in public expectations, Kachalia and Studdert12 suggest that potential liability of attending physicians rests on 2 factors: whether the treatment context and structure of supervisory obligations establishes a patient-physician relationship between the attending physician and the injured patient, and whether the attending physician has provided adequate supervision. Details of these 2 factors appear in Table 1.12-14
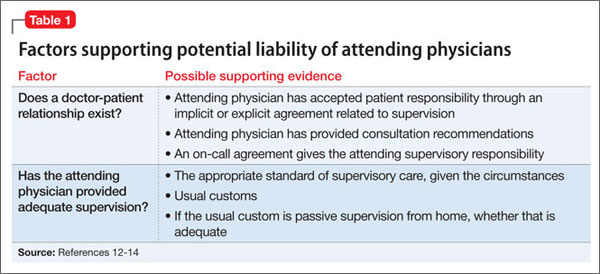
Independence vs oversight
Potential malpractice liability is one of many factors that postgraduate psychiatry programs consider when titrating the amount and intensity of supervision against letting residents make independent decisions and take on clinical responsibility for patients. Patients deserve good care and protection from mistakes that inexperienced physicians may make. At the same time, society recognizes that educating future physicians requires allowing residents to get real-world experiences in evaluating and treating patients.
These ideas are expressed in the “Program Requirements” for psychiatry residencies promulgated by the Accreditation Council for Graduate Medical Education (ACGME).15 According to the ACGME, the “essential learning activity” that teaches physicians how to provide medical care is “interaction with patients under the guidance and supervision of faculty members” who let residents “exercise those skills with greater independence.”15
Psychiatry residencies must fashion learning experiences and supervisory schemes that give residents “graded and progressive responsibility” for providing care. Although each patient should have “an identifiable, appropriately-credentialed and privileged attending physician,” residents may provide substantial services under various levels of supervision described in Table 2.16

Deciding when and what kinds of patient care may be delegated to residents is the responsibility of residency program directors, who should base their judgments on explicit, prespecified criteria using information provided by supervising faculty members. Before letting first-year residents see patients on their own, psychiatry programs must determine that the residents can:
• take a history accurately
• do emergency psychiatric assessments
• present findings and data accurately to supervisors.
Physicians at all levels need to recognize when they should ask for help. The most important ACGME criterion for allowing a psychiatry resident to work under less stringent supervision is that the resident has demonstrated an “ability and willingness to ask for help when indicated.”16
Getting specifics
One way to respond Dr. R’s questions is to ask, “Do you know when you need help, and will you ask for it?” But her concerns deserve a more detailed (and more thoughtful) response that inquires about details of her training program and its specific educational experiences. Although it would be impossible to list everything to consider, some possible topics include:
• At what level of experience and training do residents assume this coverage responsibility?
• What kind of preparation do residents receive?
• What range of problems and conditions do the patients present?
• What level of clinical support is available on site—eg, experienced psychiatric nurses, other mental health staff, or other medical specialists?
• What has the program’s experience shown about residents’ actual readiness to handle these coverage duties?
• What guidelines have faculty members provided about when to call an attending physician or request a faculty member’s presence? Do these guidelines seem sound, given the above considerations?
Bottom Line
Psychiatry residents have supervisee relationships that create potential vicarious liability for institutions and faculty members. Residency training programs address these concerns by implementing adequate preparation for advanced responsibility, developing evaluative criteria and supervisory guidelines, and making sure that residents will ask for help when they need it.
Related Resources
- Regan JJ, Regan WM. Medical malpractice and respondeat superior. South Med J. 2002;95(5):545-548.
- Winrow B, Winrow AR. Personal protection: vicarious liability as applied to the various business structures. J Midwifery Womens Health. 2008;53(2):146-149.
- Pozgar GD. Legal aspects of health care administration. 11th edition. Sudbury, MA: Jones & Bartlett Learning, LLC; 2012.
Disclosure
Dr. Mossman reports no financial relationship with any company whose products are mentioned in this article or with manufacturers of competing products.
References
1. Restatement of the law of agency. 3rd ed. §7.07(2). Philadelphia, PA: American Law Institute; 2006.
2. Baty T. Vicarious liability: a short history of the liability of employers, principals, partners, associations and trade-union members. Oxford, England: Clarendon Press; 1916.
3. Dessauer v Memorial General Hosp, 628 P.2d 337 (N.M. 1981).
4. Firestone MH. Agency. In: Sandbar SS, Firestone MH, eds. Legal medicine. 7th ed. Philadelphia, PA: Mosby Elsevier; 2007:43-47.
5. Dobbs D, Keeton RE, Owen DG. Prosser and Keaton on torts. 5th ed. St. Paul, MN: West Publishing Co; 1984.
6. Austin v Litvak, 682 P.2d 41 (Colo. 1984).
7. Kirk v Michael Reese Hospital and Medical Center, 513 N.E.2d 387 (Ill. 1987).
8. Gregg v National Medical Health Care Services, Inc., 499 P.2d 925 (Ariz. App. 1985).
9. Adamski v Tacoma General Hospital, 579 P.2d 970 (Wash. App. 1978).
10. Johnson v LeBonheur Children’s Medical Center, 74 S.W.3d 338 (Tenn. 2002).
11. Reuter SR. Professional liability in postgraduate medical education. Who is liable for resident negligence? J Leg Med. 1994;15(4):485-531.
12. Kachalia A, Studdert DM. Professional liability issues in graduate medical education. JAMA. 2004;292(9):1051-1056.
13. Lownsbury v VanBuren, 762 N.E.2d 354 (Ohio 2002).
14. Sterling v Johns Hopkins Hospital, 802 A.2d 440 (Md Ct Spec App 2002).
15. Accreditation Council for Graduate Medical Education. Program and institutional guidelines. https://www.acgme.org/acgmeweb/tabid/147/ProgramandInstitutional Guidelines/MedicalAccreditation/Psychiatry.aspx. Accessed April 8, 2013.
16. Accreditation Council for Graduate Medical Education. ACGME program requirements for graduate medical education in psychiatry. https://www.acgme.org/acgmeweb/Portals/0/PFAssets/ProgramRequirements/400_psychiatry_07012007_u04122008.pdf. Published July 1, 2007. Accessed April 8, 2013.

Douglas Mossman, MD
Professor and Program Director, University of Cincinnati Forensic Psychiatry Fellowship, Cincinnati, OH.
Douglas Mossman, MD
Professor and Program Director, University of Cincinnati Forensic Psychiatry Fellowship, Cincinnati, OH.
Douglas Mossman, MD
Professor and Program Director, University of Cincinnati Forensic Psychiatry Fellowship, Cincinnati, OH.
Dear Dr. Mossman:
In my residency program, we cover the psychiatric emergency room (ER) overnight, and we admit, discharge, and make treatment recommendations without calling the attending psychiatrists about every decision. But if something goes wrong—eg, a discharged patient later commits suicide—I’ve heard that the faculty psychiatrist may be held liable despite never having met the patient. Should we awaken our attendings to discuss every major treatment decision?
Submitted by “Dr. R”
Postgraduate medical training programs in all specialties let interns and residents make judgments and decisions outside the direct supervision of board-certified faculty members. Medical education cannot occur unless doctors learn to take independent responsibility for patients. But if poor decisions by physicians-in-training lead to bad outcomes, might their teachers and training institutions share the blame—and the legal liability for damages?
The answer is “yes.” To understand why, and to learn about how Dr. R’s residency program should address this possibility, we’ll cover:
• the theory of respondeat superior
• factors affecting potential vicarious liability
• how postgraduate training balances supervision needs with letting residents get real-world treatment experience.
Vicarious liability
In general, if Person A injures Person B, Person B may initiate a tort action against Person A to seek monetary compensation. If the injury occurred while Person A was working for Person C, then under a legal doctrine called respondeat superior (Latin for “let the master answer”), courts may allow Person B to sue Person C, too, even if Person C wasn’t present when the injury occurred and did nothing that harmed Person B directly.
Respondeat superior imposes vicarious liability on an employer for negligent acts by employees who are “performing work assigned by the employer or engaging in a course of conduct subject to the employer’s control.”1 The doctrine extends back to 17th-century English courts and originated under the theory that, during a servant’s employment, one may presume that the servant acted by his master’s authority.2
Modern authors state that the justification for imposing vicarious liability “is largely one of public or social policy under which it has been determined that, irrespective of fault, a party should be held to respond for the acts of another.”3 Employers usually have more resources to pay damages than their employees do,4 and “in hard fact, the reason for the employers’ liability is the damages are taken from a deep pocket.”5
Determining potential responsibility
In Dr. R’s scenario, an adverse event follows the actions of a psychiatry resident who is performing a training activity at a hospital ER. Whether an attorney acting on behalf of an injured client can bring a claim of respondeat superior against the hospital, the resident’s academic institution, or the attending psychiatrist will depend on the nature of the relationships among these parties. This often becomes a complex legal matter that involves examining the residency program’s educational arrangements, official training documents (eg, affiliation agreements between a university and a hospital), employment contracts, and supervisory policies. In addition, statutes and legal precedents governing vicarious liability vary from state to state. Although an initial malpractice filing may name several individuals and institutions as defendants, courts eventually must apply their jurisdictions’ rules governing vicarious liability to determine which parties can lawfully bear potential liability.
Some courts have held that a private hospital generally is not responsible for negligent actions by attending physicians because the hospital does not control patient care decisions and physicians are not the hospital’s employees.6-8 Physicians in training, however, usually are employees of hospitals or their training institutions. Residents and attending physicians in many psychiatry training programs work at hospitals where patients reasonably believe that the doctors function as part of the hospital’s larger service enterprise. In some jurisdictions, this makes the hospitals potentially liable for their doctors’ acts,9 even when the doctors, as public employees, may have statutory immunity from being sued as individuals.10
Reuter11 has suggested that other agency theories may allow a resident’s error to create liability for an attending physician or medical school. The resident may be viewed as a “borrowed servant” such that, although a hospital was the resident’s general employer, the attending physician still exercised sufficient control with respect to the faulty act in question. A medical school faculty physician also may be liable along with the hospital under a joint employment theory based upon the faculty member’s “right to control” how the resident cares for the attending’s patient.11
Taking into account recent cases and trends in public expectations, Kachalia and Studdert12 suggest that potential liability of attending physicians rests on 2 factors: whether the treatment context and structure of supervisory obligations establishes a patient-physician relationship between the attending physician and the injured patient, and whether the attending physician has provided adequate supervision. Details of these 2 factors appear in Table 1.12-14
Independence vs oversight
Potential malpractice liability is one of many factors that postgraduate psychiatry programs consider when titrating the amount and intensity of supervision against letting residents make independent decisions and take on clinical responsibility for patients. Patients deserve good care and protection from mistakes that inexperienced physicians may make. At the same time, society recognizes that educating future physicians requires allowing residents to get real-world experiences in evaluating and treating patients.
These ideas are expressed in the “Program Requirements” for psychiatry residencies promulgated by the Accreditation Council for Graduate Medical Education (ACGME).15 According to the ACGME, the “essential learning activity” that teaches physicians how to provide medical care is “interaction with patients under the guidance and supervision of faculty members” who let residents “exercise those skills with greater independence.”15
Psychiatry residencies must fashion learning experiences and supervisory schemes that give residents “graded and progressive responsibility” for providing care. Although each patient should have “an identifiable, appropriately-credentialed and privileged attending physician,” residents may provide substantial services under various levels of supervision described in Table 2.16
Deciding when and what kinds of patient care may be delegated to residents is the responsibility of residency program directors, who should base their judgments on explicit, prespecified criteria using information provided by supervising faculty members. Before letting first-year residents see patients on their own, psychiatry programs must determine that the residents can:
• take a history accurately
• do emergency psychiatric assessments
• present findings and data accurately to supervisors.
Physicians at all levels need to recognize when they should ask for help. The most important ACGME criterion for allowing a psychiatry resident to work under less stringent supervision is that the resident has demonstrated an “ability and willingness to ask for help when indicated.”16
Getting specifics
One way to respond Dr. R’s questions is to ask, “Do you know when you need help, and will you ask for it?” But her concerns deserve a more detailed (and more thoughtful) response that inquires about details of her training program and its specific educational experiences. Although it would be impossible to list everything to consider, some possible topics include:
• At what level of experience and training do residents assume this coverage responsibility?
• What kind of preparation do residents receive?
• What range of problems and conditions do the patients present?
• What level of clinical support is available on site—eg, experienced psychiatric nurses, other mental health staff, or other medical specialists?
• What has the program’s experience shown about residents’ actual readiness to handle these coverage duties?
• What guidelines have faculty members provided about when to call an attending physician or request a faculty member’s presence? Do these guidelines seem sound, given the above considerations?
Bottom Line
Psychiatry residents have supervisee relationships that create potential vicarious liability for institutions and faculty members. Residency training programs address these concerns by implementing adequate preparation for advanced responsibility, developing evaluative criteria and supervisory guidelines, and making sure that residents will ask for help when they need it.
Related Resources
- Regan JJ, Regan WM. Medical malpractice and respondeat superior. South Med J. 2002;95(5):545-548.
- Winrow B, Winrow AR. Personal protection: vicarious liability as applied to the various business structures. J Midwifery Womens Health. 2008;53(2):146-149.
- Pozgar GD. Legal aspects of health care administration. 11th edition. Sudbury, MA: Jones & Bartlett Learning, LLC; 2012.
Disclosure
Dr. Mossman reports no financial relationship with any company whose products are mentioned in this article or with manufacturers of competing products.
References
1. Restatement of the law of agency. 3rd ed. §7.07(2). Philadelphia, PA: American Law Institute; 2006.
2. Baty T. Vicarious liability: a short history of the liability of employers, principals, partners, associations and trade-union members. Oxford, England: Clarendon Press; 1916.
3. Dessauer v Memorial General Hosp, 628 P.2d 337 (N.M. 1981).
4. Firestone MH. Agency. In: Sandbar SS, Firestone MH, eds. Legal medicine. 7th ed. Philadelphia, PA: Mosby Elsevier; 2007:43-47.
5. Dobbs D, Keeton RE, Owen DG. Prosser and Keaton on torts. 5th ed. St. Paul, MN: West Publishing Co; 1984.
6. Austin v Litvak, 682 P.2d 41 (Colo. 1984).
7. Kirk v Michael Reese Hospital and Medical Center, 513 N.E.2d 387 (Ill. 1987).
8. Gregg v National Medical Health Care Services, Inc., 499 P.2d 925 (Ariz. App. 1985).
9. Adamski v Tacoma General Hospital, 579 P.2d 970 (Wash. App. 1978).
10. Johnson v LeBonheur Children’s Medical Center, 74 S.W.3d 338 (Tenn. 2002).
11. Reuter SR. Professional liability in postgraduate medical education. Who is liable for resident negligence? J Leg Med. 1994;15(4):485-531.
12. Kachalia A, Studdert DM. Professional liability issues in graduate medical education. JAMA. 2004;292(9):1051-1056.
13. Lownsbury v VanBuren, 762 N.E.2d 354 (Ohio 2002).
14. Sterling v Johns Hopkins Hospital, 802 A.2d 440 (Md Ct Spec App 2002).
15. Accreditation Council for Graduate Medical Education. Program and institutional guidelines. https://www.acgme.org/acgmeweb/tabid/147/ProgramandInstitutional Guidelines/MedicalAccreditation/Psychiatry.aspx. Accessed April 8, 2013.
16. Accreditation Council for Graduate Medical Education. ACGME program requirements for graduate medical education in psychiatry. https://www.acgme.org/acgmeweb/Portals/0/PFAssets/ProgramRequirements/400_psychiatry_07012007_u04122008.pdf. Published July 1, 2007. Accessed April 8, 2013.
STOP performing dilation and curettage for the evaluation of abnormal uterine bleeding
CASE: In-office hysteroscopy spies previously missed polyp
A 51-year-old woman with a history of breast cancer completed 5 years of tamoxifen. During her treatment she had a 3-year history of abnormal vaginal bleeding. Results from consecutive pelvic ultrasounds indicated that the patient had progressively thickening endometrium (from 1.4 cm to 2.5 cm to 4.7 cm). In-office biopsy was negative for endometrial pathology. An ultimate dilation and curettage (D&C) was performed with negative histologic diagnosis. The patient is seen in consultation, and the ultrasound images are reviewed (FIGURE).
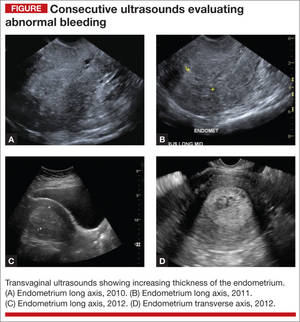
These images show an increasing thickness of the ednometrium with definitive intracavitary pathology that was missed with the prevous clinical evaluation with enodmetrial biopsy and D&C. An in-office hysteroscopy is performed, and a large 5 x 4 x 7 cm cystic and fibrous polyp is identified with normal endometrium (VIDEO 1).
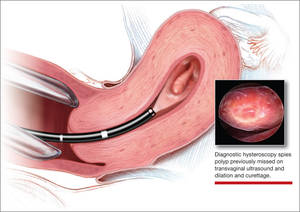
Hysteroscopy reveals massive polyp extending into a dilated lower uterine segment
Abnormal uterine bleeding
The evaluation of abnormal uterine bleeding. (AUB), as described in this clinical scenario, is quite common. As a consequence, many patients have a missed or inaccurate diagnosis and undergo unnecessary invasive procedures under general anesthesia.
AUB is one of the primary indications for a gynecologic consultation, accounting for approximately 33% of all gynecology visits, and for 69% of visits among postmenopausal women.1 Confirming the etiology and planning appropriate intervention is important in the clinical management of AUB because accurate diagnosis may result in avoiding major gynecologic surgery in favor of minimally invasive hysteroscopic management.
Diagnostic hysteroscopy is proven in AUB evaluation
Drawbacks of other diagnostic tools. It is generally accepted that the initial evaluation of women with AUB is performed with noninvasive transvaginal ultrasound (TVUS).1-3 As illustrated by the opening case, however, the accuracy of TVUS is limited in the diagnosis of focal endometrial lesions, and further investigation of the uterine cavity is warranted.
Evaluation of the uterine cavity with sonohysterography (SH)—vaginal ultrasound with the instillation of saline into the uterine cavity—is more accurate than TVUS alone. Yet, diagnostic hysteroscopy (DH) has proven to be superior to either modality for the accurate evaluation of intracavitary pathology.1-3
Evidence of DH superiority. Farquhar and colleagues reported results of a systematic review of studies published from 1980 to July 2001 that examined TVUS versus SH and DH for the investigation of AUB in premenopausal women. The researchers found that TVUS had a higher rate of false negatives for detecting intrauterine pathology, compared with SH and DH. They also found that DH was superior to SH in diagnosing submucous myomas.2
In 2010, results of a prospective comparison of TVUS, SH, and DH for detecting endometrial pathology, showed that DH had a significantly better diagnostic performance than SH and TVUS and that hysteroscopy was significantly more precise in the diagnosis of intracavitary masses.3
Again, in 2012, a prospective comparison of TVUS, SH, and DH in the diagnosis of AUB revealed that hysteroscopy provided the most accurate diagnosis.1
In a systematic review and meta-analysis, van Dongen found the accuracy of DH to be estimated at 96.9%.4
Hysteroscopy is also considered to be more comfortable for patients than SH.2
blinded sampling missed intracavitary lesions such as polyps and myomas that accounted for bleeding abnormalities.5
A procedure performed “blind” limits its usefulness in AUB evaluation
This statement is not a new realization. As far back as 1989, Loffer showed that blind D&C was less accurate for diagnosing AUB than was hysteroscopy with visually directed biopsy. The sensitivity of diagnosing the etiology of AUB with D&C was 65%, compared to a sensitivity of 98% with hysteroscopy with directed biopsy. Hysteroscopy was shown to be better because blinded sampling missed intracavitary lesions such as polyps and myomas that accounted for bleeding abnormalities.5
The limitations of D&C are evident in the opening case, as the D&C performed in the operating room under general anesthesia, without visualization of the uterine cavity, failed to identify the patient’s intrauterine pathology. D&C is seldom necessary to evaluate AUB and has significant surgical risks beyond general anesthesia, including cervical or uterine trauma that can occur with cervical dilation and instrumentation of the uterus.
As with D&C, endometrial biopsy has limitations in diagnosing abnormalities within the uterine cavity. In a 2008 prospective comparative study of hysteroscopy versus blind biopsy with a suction biopsy curette, Angioni and colleagues showed a significant difference in the capability of these two procedures to accurately diagnose the etiology of bleeding for menopausal women. Blinded biopsy had a sensitivity for diagnosing polyps, myomas, and hyperplasia of 11%, 13%, and 25%, respectively. The sensitivity of hysteroscopy to diagnose the same intracavitary pathology was 89%, 100%, and 74%, respectively.6
This does not mean, however, that the endometrial biopsy is not beneficial in the evaluation of AUB. Several authors recommend that in a clinically relevant situation, endometrial biopsy with a small suction curette should be performed concomitantly with hysteroscopy to improve the sensitivity of the overall evaluation with histology.7,8 And, as Loffer showed, the hysteroscopic evaluation with a visually directed biopsy is extremely accurate (VIDEO 2, VIDEO 3).5
The bottom line for D&C use in AUB evaluation
Sometimes a D&C is needed. For instance, when more tissue is needed for histologic evaluation than can be obtained with small suction curette at endometrial biopsy. However, there are several shortcomings of D&C for the evaluation of AUB:
- Most clinicians perform D&C in the operating room under general anesthesia.
- It is often done without concomitant hysteroscopy.
- There is significant potential to miss pathology, such as polyps or myomas.
- There is risk of uterine perforation with cervical dilation and uterine instrumentation.
- Hysteroscopy with visually directed biopsy provides a method that offers a more accurate diagnosis, and the procedure can be performed in the office.
In-office AUB evaluation using hysteroscopy is possible and advantageous
Hysteroscopy not only has increased accuracy for identifying the etiology of AUB, compared with D&C, but also offers the possibility of in-office use. Newer hysteroscopes with small diameters and decreasing costs of hysteroscopic equipment allow gynecologists to perform hysteroscopy economically and safely in the office.
Office evaluation of the uterine cavity and preoperative decision-making before a patient is taken to the operating room (OR) improve the likelihood that the appropriate procedure will be performed. They also provide an opportunity for the patient to see inside her own uterine cavity and for the surgeon to discuss management options with her (VIDEO 4: Diagnostic hysteroscopy with fundal myoma, VIDEO 5: Diagnostic hysteroscopy in a menopausal patient with atypical hyperplasia, VIDEO 6: Diagnostic hysteroscopy in a menopausal patient with polyps). If pathology is noted, there is a potential to treat abnormalities such as endometrial polyps at the same time, thus avoiding the OR altogether (VIDEO 7).
The small diameter of the hysteroscope allows evaluation in most menopausal and nulliparous patients comfortably without first having to dilate or soften the cervix. Paracervical placement of local anesthetic can be used as needed for patient comfort (VIDEO 8).9 A vaginoscopic approach will eliminate the discomfort of having to place a speculum (VIDEO 9).
It offers:
- a familiar and comfortable environment for the procedure
- saved time for patient and physician
- saved money for the patient with a large deductible or coinsurance
- no requirement for general anesthesia
- local anesthesia can be used but is not necessary
- immediate visual affirmation for the patient and physician
- a see and treat possibility
- possibility of preoperative decision-making
- saved trip to the OR if significant precancer or cancer is identified
- use in menopausal and nulliparous patients with no cervical preparation necessary when a small-diameter hysteroscope or flexible hysteroscope is used
- minimized discomfort from a speculum with the vaginoscopic approach for awake patients
- possibility of cervical access when needed (VIDEO 10).
My clinical recommendation
Use office hysteroscopy with endometrial biopsy as needed with the opportunity to perform a directed biopsy.
Coding for in-office hysteroscopy
Some procedures now can be performed in the office setting. Among these is operative hysteroscopy, for things such as abnormal uterine bleeding (AUB), foreign body removal, and tubal occlusion. When performing hysteroscopic evaluation of AUB, the Current Procedural Terminology (CPT) code 58558 (Hysteroscopy, surgical; with sampling (biopsy) of endometrium and/or polypectomy, with or without D&C) should be reported. This code is reported whether polyp(s) are removed or a sampling of the uterine lining or a full D&C is performed.
Under the Resource-Based Relative Value System (RBRVS), used by the majority of payers for reimbursement, there is a payment differential for site of service. In other words, when performed in the office setting, reimbursement will be higher than in the hospital setting to offset the increased practice expenses incurred. In the office setting, 58558 has 11.93 relative value units. In comparison, a D&C performed without hysteroscopy has 7.75 relative value units in the office setting. Keep in mind, however, that all supplies used in performing this procedure are included in the reimbursement amount.
Some payers will reimburse separately for administering a regional anesthetic, but a local anesthetic is considered integral to the procedure. Under CPT rules, you may bill separately for regional anesthesia. When performing office hysteroscopy, the most common regional anesthesia would be a paracervical nerve block (CPT code 66435—Injection, anesthetic agent; paracervical [uterine] nerve). Under CPT rules, coding should go in as 58558-47, 64435-51. The modifier -47 lets the payer know that the physician performed the regional block, and the modifier -51 identifies the regional block as a multiple procedure.
Medicare, however, will never reimburse separately for regional anesthesia performed by the operating physician, and because of this, Medicare’s Correct Coding Initiative (CCI) permanently bundles 64435 when billed with 58558. Medicare will not permit a modifier to be used to bypass this bundling edit, and separate payment is never allowed. If your payer has adopted this Medicare policy, separate payment will also not be made.
—Melanie Witt, RN, CPC, COBGC, MA
Ms. Witt is an independent coding and documentation consultant and former program manager, department of coding and nomenclature, American Congress of Obstetricians and Gynecologists
- Soguktas S, Cogendez E, Kayatas SE, Asoglu MR, Selcuk S, Ertekin A. Comparison of saline infusion sonohysterography and hysteroscopy in diagnosis of premenopausal women with abnormal uterine bleeding. Eur J Obstet Gynecol Repro Biol. 2012;161(1):66−70.
- Farquhar C, Ekeroma A, Furness S, Arroll B. A systematic review of transvaginal ultrasonography, sonohysterography and hysteroscopy for the investigation of abnormal uterine bleeding in premenopausal bleeding. Acta Obstet Gynecol Scand. 2003;82(6):493–504.
- Grimbizis GF, Tsolakidis D, Mikos T, et al. A prospective comparison of transvaginal ultrasound, saline infusion sonohysterography, and diagnostic hysteroscopy in the evaluation of endometrial pathology. Fertil Steril. 2010;94(7):2721−2725.
- van Dongen H, de Kroon CD, Jacobi CE, Trimbos JB, Jansen FW. Diagnostic hysteroscopy in abnormal uterine bleeding: a systematic review and meta-analysis. BJOG. 2007;114(6):664–75.
- Loffer FD. Hysteroscopy with selective endometrial sampling compared with D & C for abnormal uterine bleeding: the value of a negative hysteroscopic view. Obstet Gynecol. 1989;73(1):16–20.
- Angioni S, Loddo A, Milano F, Piras B, Minerba L, Melis GB. Detection of benign intracavitary lesions in postmenopausal women with abnormal uterine bleeding: a prospective comparative study on outpatient hysteroscopy and blind biopsy. J Minim Invasive Gynecol. 2008;15(1):87–91.
- Lo KY, Yuen PM. The role of outpatient diagnostic hysteroscopy in identifying anatomic pathology and histopathology in the endometrial cavity. J Am Assoc Gynecol Laparosc. 2000;7(3):381–385.
- Garuti G, Sambruni I, Colonneli M, Luerti M. Accuracy of hysteroscopy in predicting histopathology of endometrium in 1500 women. J Am Assoc Gynecol Laparosc. 2001;8(2):207–213.
- Munro MG, Brooks PG. Use of local anesthesia for office diagnostic and operative hysteroscopy. J Minim Invasive Gynecol. 2010;17(6):709–718.

Dr. Garcia is Director, Center for Women’s Surgery and Garcia Institute for Hysteroscopic Training, Albuquerque, and Clinical Assistant Professor, Department of Obstetrics and Gynecology, University of New Mexico School of Medicine, Albuquerque. Dr. Garcia serves on the OBG Management Board of Editors.
Dr. Garcia is Director, Center for Women’s Surgery and Garcia Institute for Hysteroscopic Training, Albuquerque, and Clinical Assistant Professor, Department of Obstetrics and Gynecology, University of New Mexico School of Medicine, Albuquerque. Dr. Garcia serves on the OBG Management Board of Editors.
Dr. Garcia is Director, Center for Women’s Surgery and Garcia Institute for Hysteroscopic Training, Albuquerque, and Clinical Assistant Professor, Department of Obstetrics and Gynecology, University of New Mexico School of Medicine, Albuquerque. Dr. Garcia serves on the OBG Management Board of Editors.
CASE: In-office hysteroscopy spies previously missed polyp
A 51-year-old woman with a history of breast cancer completed 5 years of tamoxifen. During her treatment she had a 3-year history of abnormal vaginal bleeding. Results from consecutive pelvic ultrasounds indicated that the patient had progressively thickening endometrium (from 1.4 cm to 2.5 cm to 4.7 cm). In-office biopsy was negative for endometrial pathology. An ultimate dilation and curettage (D&C) was performed with negative histologic diagnosis. The patient is seen in consultation, and the ultrasound images are reviewed (FIGURE).
These images show an increasing thickness of the ednometrium with definitive intracavitary pathology that was missed with the prevous clinical evaluation with enodmetrial biopsy and D&C. An in-office hysteroscopy is performed, and a large 5 x 4 x 7 cm cystic and fibrous polyp is identified with normal endometrium (VIDEO 1).
Hysteroscopy reveals massive polyp extending into a dilated lower uterine segment
Abnormal uterine bleeding
The evaluation of abnormal uterine bleeding. (AUB), as described in this clinical scenario, is quite common. As a consequence, many patients have a missed or inaccurate diagnosis and undergo unnecessary invasive procedures under general anesthesia.
AUB is one of the primary indications for a gynecologic consultation, accounting for approximately 33% of all gynecology visits, and for 69% of visits among postmenopausal women.1 Confirming the etiology and planning appropriate intervention is important in the clinical management of AUB because accurate diagnosis may result in avoiding major gynecologic surgery in favor of minimally invasive hysteroscopic management.
Diagnostic hysteroscopy is proven in AUB evaluation
Drawbacks of other diagnostic tools. It is generally accepted that the initial evaluation of women with AUB is performed with noninvasive transvaginal ultrasound (TVUS).1-3 As illustrated by the opening case, however, the accuracy of TVUS is limited in the diagnosis of focal endometrial lesions, and further investigation of the uterine cavity is warranted.
Evaluation of the uterine cavity with sonohysterography (SH)—vaginal ultrasound with the instillation of saline into the uterine cavity—is more accurate than TVUS alone. Yet, diagnostic hysteroscopy (DH) has proven to be superior to either modality for the accurate evaluation of intracavitary pathology.1-3
Evidence of DH superiority. Farquhar and colleagues reported results of a systematic review of studies published from 1980 to July 2001 that examined TVUS versus SH and DH for the investigation of AUB in premenopausal women. The researchers found that TVUS had a higher rate of false negatives for detecting intrauterine pathology, compared with SH and DH. They also found that DH was superior to SH in diagnosing submucous myomas.2
In 2010, results of a prospective comparison of TVUS, SH, and DH for detecting endometrial pathology, showed that DH had a significantly better diagnostic performance than SH and TVUS and that hysteroscopy was significantly more precise in the diagnosis of intracavitary masses.3
Again, in 2012, a prospective comparison of TVUS, SH, and DH in the diagnosis of AUB revealed that hysteroscopy provided the most accurate diagnosis.1
In a systematic review and meta-analysis, van Dongen found the accuracy of DH to be estimated at 96.9%.4
Hysteroscopy is also considered to be more comfortable for patients than SH.2
blinded sampling missed intracavitary lesions such as polyps and myomas that accounted for bleeding abnormalities.5
A procedure performed “blind” limits its usefulness in AUB evaluation
This statement is not a new realization. As far back as 1989, Loffer showed that blind D&C was less accurate for diagnosing AUB than was hysteroscopy with visually directed biopsy. The sensitivity of diagnosing the etiology of AUB with D&C was 65%, compared to a sensitivity of 98% with hysteroscopy with directed biopsy. Hysteroscopy was shown to be better because blinded sampling missed intracavitary lesions such as polyps and myomas that accounted for bleeding abnormalities.5
The limitations of D&C are evident in the opening case, as the D&C performed in the operating room under general anesthesia, without visualization of the uterine cavity, failed to identify the patient’s intrauterine pathology. D&C is seldom necessary to evaluate AUB and has significant surgical risks beyond general anesthesia, including cervical or uterine trauma that can occur with cervical dilation and instrumentation of the uterus.
As with D&C, endometrial biopsy has limitations in diagnosing abnormalities within the uterine cavity. In a 2008 prospective comparative study of hysteroscopy versus blind biopsy with a suction biopsy curette, Angioni and colleagues showed a significant difference in the capability of these two procedures to accurately diagnose the etiology of bleeding for menopausal women. Blinded biopsy had a sensitivity for diagnosing polyps, myomas, and hyperplasia of 11%, 13%, and 25%, respectively. The sensitivity of hysteroscopy to diagnose the same intracavitary pathology was 89%, 100%, and 74%, respectively.6
This does not mean, however, that the endometrial biopsy is not beneficial in the evaluation of AUB. Several authors recommend that in a clinically relevant situation, endometrial biopsy with a small suction curette should be performed concomitantly with hysteroscopy to improve the sensitivity of the overall evaluation with histology.7,8 And, as Loffer showed, the hysteroscopic evaluation with a visually directed biopsy is extremely accurate (VIDEO 2, VIDEO 3).5
The bottom line for D&C use in AUB evaluation
Sometimes a D&C is needed. For instance, when more tissue is needed for histologic evaluation than can be obtained with small suction curette at endometrial biopsy. However, there are several shortcomings of D&C for the evaluation of AUB:
- Most clinicians perform D&C in the operating room under general anesthesia.
- It is often done without concomitant hysteroscopy.
- There is significant potential to miss pathology, such as polyps or myomas.
- There is risk of uterine perforation with cervical dilation and uterine instrumentation.
- Hysteroscopy with visually directed biopsy provides a method that offers a more accurate diagnosis, and the procedure can be performed in the office.
In-office AUB evaluation using hysteroscopy is possible and advantageous
Hysteroscopy not only has increased accuracy for identifying the etiology of AUB, compared with D&C, but also offers the possibility of in-office use. Newer hysteroscopes with small diameters and decreasing costs of hysteroscopic equipment allow gynecologists to perform hysteroscopy economically and safely in the office.
Office evaluation of the uterine cavity and preoperative decision-making before a patient is taken to the operating room (OR) improve the likelihood that the appropriate procedure will be performed. They also provide an opportunity for the patient to see inside her own uterine cavity and for the surgeon to discuss management options with her (VIDEO 4: Diagnostic hysteroscopy with fundal myoma, VIDEO 5: Diagnostic hysteroscopy in a menopausal patient with atypical hyperplasia, VIDEO 6: Diagnostic hysteroscopy in a menopausal patient with polyps). If pathology is noted, there is a potential to treat abnormalities such as endometrial polyps at the same time, thus avoiding the OR altogether (VIDEO 7).
The small diameter of the hysteroscope allows evaluation in most menopausal and nulliparous patients comfortably without first having to dilate or soften the cervix. Paracervical placement of local anesthetic can be used as needed for patient comfort (VIDEO 8).9 A vaginoscopic approach will eliminate the discomfort of having to place a speculum (VIDEO 9).
It offers:
- a familiar and comfortable environment for the procedure
- saved time for patient and physician
- saved money for the patient with a large deductible or coinsurance
- no requirement for general anesthesia
- local anesthesia can be used but is not necessary
- immediate visual affirmation for the patient and physician
- a see and treat possibility
- possibility of preoperative decision-making
- saved trip to the OR if significant precancer or cancer is identified
- use in menopausal and nulliparous patients with no cervical preparation necessary when a small-diameter hysteroscope or flexible hysteroscope is used
- minimized discomfort from a speculum with the vaginoscopic approach for awake patients
- possibility of cervical access when needed (VIDEO 10).
My clinical recommendation
Use office hysteroscopy with endometrial biopsy as needed with the opportunity to perform a directed biopsy.
Coding for in-office hysteroscopy
Some procedures now can be performed in the office setting. Among these is operative hysteroscopy, for things such as abnormal uterine bleeding (AUB), foreign body removal, and tubal occlusion. When performing hysteroscopic evaluation of AUB, the Current Procedural Terminology (CPT) code 58558 (Hysteroscopy, surgical; with sampling (biopsy) of endometrium and/or polypectomy, with or without D&C) should be reported. This code is reported whether polyp(s) are removed or a sampling of the uterine lining or a full D&C is performed.
Under the Resource-Based Relative Value System (RBRVS), used by the majority of payers for reimbursement, there is a payment differential for site of service. In other words, when performed in the office setting, reimbursement will be higher than in the hospital setting to offset the increased practice expenses incurred. In the office setting, 58558 has 11.93 relative value units. In comparison, a D&C performed without hysteroscopy has 7.75 relative value units in the office setting. Keep in mind, however, that all supplies used in performing this procedure are included in the reimbursement amount.
Some payers will reimburse separately for administering a regional anesthetic, but a local anesthetic is considered integral to the procedure. Under CPT rules, you may bill separately for regional anesthesia. When performing office hysteroscopy, the most common regional anesthesia would be a paracervical nerve block (CPT code 66435—Injection, anesthetic agent; paracervical [uterine] nerve). Under CPT rules, coding should go in as 58558-47, 64435-51. The modifier -47 lets the payer know that the physician performed the regional block, and the modifier -51 identifies the regional block as a multiple procedure.
Medicare, however, will never reimburse separately for regional anesthesia performed by the operating physician, and because of this, Medicare’s Correct Coding Initiative (CCI) permanently bundles 64435 when billed with 58558. Medicare will not permit a modifier to be used to bypass this bundling edit, and separate payment is never allowed. If your payer has adopted this Medicare policy, separate payment will also not be made.
—Melanie Witt, RN, CPC, COBGC, MA
Ms. Witt is an independent coding and documentation consultant and former program manager, department of coding and nomenclature, American Congress of Obstetricians and Gynecologists
- Soguktas S, Cogendez E, Kayatas SE, Asoglu MR, Selcuk S, Ertekin A. Comparison of saline infusion sonohysterography and hysteroscopy in diagnosis of premenopausal women with abnormal uterine bleeding. Eur J Obstet Gynecol Repro Biol. 2012;161(1):66−70.
- Farquhar C, Ekeroma A, Furness S, Arroll B. A systematic review of transvaginal ultrasonography, sonohysterography and hysteroscopy for the investigation of abnormal uterine bleeding in premenopausal bleeding. Acta Obstet Gynecol Scand. 2003;82(6):493–504.
- Grimbizis GF, Tsolakidis D, Mikos T, et al. A prospective comparison of transvaginal ultrasound, saline infusion sonohysterography, and diagnostic hysteroscopy in the evaluation of endometrial pathology. Fertil Steril. 2010;94(7):2721−2725.
- van Dongen H, de Kroon CD, Jacobi CE, Trimbos JB, Jansen FW. Diagnostic hysteroscopy in abnormal uterine bleeding: a systematic review and meta-analysis. BJOG. 2007;114(6):664–75.
- Loffer FD. Hysteroscopy with selective endometrial sampling compared with D & C for abnormal uterine bleeding: the value of a negative hysteroscopic view. Obstet Gynecol. 1989;73(1):16–20.
- Angioni S, Loddo A, Milano F, Piras B, Minerba L, Melis GB. Detection of benign intracavitary lesions in postmenopausal women with abnormal uterine bleeding: a prospective comparative study on outpatient hysteroscopy and blind biopsy. J Minim Invasive Gynecol. 2008;15(1):87–91.
- Lo KY, Yuen PM. The role of outpatient diagnostic hysteroscopy in identifying anatomic pathology and histopathology in the endometrial cavity. J Am Assoc Gynecol Laparosc. 2000;7(3):381–385.
- Garuti G, Sambruni I, Colonneli M, Luerti M. Accuracy of hysteroscopy in predicting histopathology of endometrium in 1500 women. J Am Assoc Gynecol Laparosc. 2001;8(2):207–213.
- Munro MG, Brooks PG. Use of local anesthesia for office diagnostic and operative hysteroscopy. J Minim Invasive Gynecol. 2010;17(6):709–718.
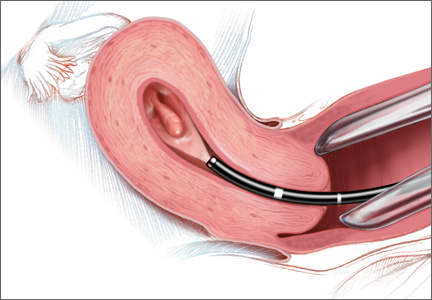
Is Shared Decision-Making Bad for the Bottom Line?
A new study shows that hospitalized patients who were more engaged in their own care produced higher costs and longer lengths of stay (LOS).
The report, "Association of Patient Preferences for Participation in Decision Making With Length of Stay and Costs Among Hospitalized Patients," published in JAMA Internal Medicine, used a survey of 21,754 patients in one academic setting to determine their preferences on shared decision-making. The information was later linked to administrative data.
Patients who said they preferred to participate in decision-making with their physicians had a 0.26-day (95% CI, 0.06-0.47 day) longer LOS (P=0.01) and incurred an average of $865 (95% CI, $155-$1,575) in higher total hospitalization costs (P=0.02). Patients with higher education levels and private health insurance were more likely than others to want to participate in decision-making with doctors, the authors noted.
Lead author Hyo Jung Tak, PhD, of the department of medicine at the University of Chicago says that while the results don't mean that patient-centered care directly drives up costs, it is important not to accept at face value that engaged patients lead to reduced health-care-delivery costs.
“These days,” she adds, “many researchers and policymakers expect that patient-centered care could help to reduce medical utilization as it could prevent costly interventions that patients may not want, but I think people should be more careful in terms of how it really applies in the clinical setting.”
Dr. Tak cautions that many variables could affect how a similar study would work at other hospitals, including an institution’s payor mix and the socioeconomic status of its service area. She said a potentially larger issue is why some patients strongly disagree with the idea of leaving medical decisions up to their physicians.
“If we can find that answer, that could help to improve patient-centered care in the future,” Dr. Tak adds. “That could be the ultimate question in this study.”
Visit our website for more information on patient-centered care.