User login
Diabetes and alcohol use: Detecting at-risk drinking
• Ask a question such as “How many drinks containing alcohol did you have on a typical day when you were drinking in the last year?” to ascertain a patient’s quantity of alcohol use. A
• Apply elements of the FRAMES approach to help patients curtail at-risk drinking—eg, use elevated HbA1c levels as evidence of a need to change behavior. A
Strength of recommendation (SOR)
A Good-quality patient-oriented evidence
B Inconsistent or limited-quality patient-oriented evidence
C Consensus, usual practice, opinion, disease-oriented evidence, case series
There are enough challenges in controlling diabetes mellitus without the hindrance of undetected problematic alcohol use. The good news is that asking a single nonthreatening question can help you detect at-risk drinking—defined by the National Institute on Alcohol Abuse and Alcoholism (NIAAA) as 5 or more drinks on one occasion or more than 14 drinks per week for men; and 4 or more drinks on one occasion or more than 7 drinks per week for women.1,2 And, for patients who may be compromising their diabetes care and overall health through problem drinking, brief intervention techniques used in the office can enable them to reduce alcohol consumption significantly.
When alcohol becomes a problem in diabetes care
Several studies have explored the long-term benefits of moderate alcohol use on glycemic control—with mixed results. A 2007 study found that diabetes patients who drink 1 glass of wine per day exhibited a lower fasting glucose level than abstainers after 3 months.3 There was no difference, however, on postprandial glucose levels. A 2008 study found that individuals who drank one to 2 glasses of wine per day for a month had lower fasting serum insulin levels relative to when they have abstained for a month,4 although levels of fasting plasma cholesterol, HDL cholesterol, glucose, and hemoglobin A1c (HbA1c) remained unchanged relative to periods of abstinence.4
Furthermore, rates of coronary heart disease and CHD mortality in a meta-analysis were significantly lower in 3 categories of alcohol consumption (<6 g/d, 6 to <18 g/d, and ≥18 g/d) compared with abstinence.5 Nondrinkers also had a greater risk of total mortality compared with the lightest drinking group. Notably, however, the lower limit of the highest drinking category was only 1.5 drinks per day.
How big is the problem? In a study of insulin-treated patients seen for severe hypoglycemia, 17% had been drinking before the episode.6 In a primary care sample, 28% of randomly selected patients with type 2 diabetes met Diagnostic and Statistical Manual of Mental Disorders-IV criteria for a lifetime incidence of alcohol abuse and 13% met either current or lifetime criteria for alcohol dependence.7 Another study of primary care patients with diabetes8 found that 13.4% met NIAAA criteria for at-risk drinking; 11.1% of these at-risk drinkers met criteria for current alcohol dependence. (According to the NIAAA, the rate of at-risk/heavy drinking among US adults is 30%, and about one in 4 heavy drinkers meets the criteria for alcohol abuse or dependence.1)
Detrimental effects with immoderate drinking. Individuals who engage in at-risk drinking, as defined by the NIAAA, are at increased risk for alcohol dependence9 and associated complications such as diabetic neuropathy and retinopathy,10 atherosclerosis,11 and total and CHD mortality.3,12 Heavy drinking also interferes with neuroendocrine, gastrointestinal, and sexual function,13 and its interaction with diabetes increases the risk for hepatocellular carcinoma after controlling for hepatitis B and C serology.14
Interference with diabetes control. Research examining the short-term effect of alcohol use has produced contradictory results, partly due to differences among studies, such as whether alcohol is administered with a meal and whether a fasting glucose level is measured.15 However, alcohol affects glycemic control and, when used excessively, can impair glucose production.16,17 Alcohol may induce hypoglycemia,10,18 and even small amounts may jeopardize diabetes control.13 In a study of patients with insulin-treated diabetes, alcohol use in the presence of mild hypoglycemia increased diastolic blood pressure or exacerbated hypoglycemia-related cognitive deficits.19 Another concern—in both the short and long term—is that alcohol interacts negatively with certain diabetes medications. It is more likely to induce hypoglycemia in the presence of sulfonylurea medications.10 Chlorpropamide decreases the rate of ethanol elimination from the blood.20 And, in those taking metformin, excessive alcohol use elevates risk for lactic acidosis. 21
Diminished self-care. Alcohol use can interfere with self-care,22,23 which is a crucial component of diabetes treatment.24 It may lead to reduced eating16 or to decreased willingness to adhere to prescribed dietary regimens.13 It also impairs other self-care behaviors13,15,25 such as self-monitoring blood glucose and showing up for medical appointments.26 In a large, diverse sample of patients with diabetes,24 heavy drinkers had the highest rates of morbidity. Importantly, alcohol and diabetes self-care behavior were significantly negatively associated. Studies of ethnic minority samples have yielded comparable results.27
Assessing alcohol use: Obstacles and solutions
Although alcohol use can be readily evaluated during routine primary care appointments, it is often neglected, perhaps due to a lack of awareness about its impact on diabetes.15 Those who are most often assessed tend to have a psychiatric diagnosis or other condition raising a red flag for physicians.28 When internists, general practitioners, and psychiatrists were questioned in a study regarding patients’ alcohol and drug use, all 3 groups were misinformed about which substance-use treatments were empirically supported29 and did not believe that treatment for alcohol abuse held much promise. Another study showed that physicians can be reluctant to screen for alcohol use because of the difficulty in recognizing a problem, the perceived unimportance of alcohol use as a health risk, a supposed lack of adequate intervention tools, and a fear of stigmatizing patients.30 Physicians are more likely to discuss alcohol use under certain extreme conditions such as when a patient smells of alcohol.
Multiple opportunities to ask in the VA system. In the Veterans Health Administration, primary care VA providers have reported that prompts for alcohol screening embedded in computerized progress notes, clinical reminder lists, and annual health evaluation forms encourage them to assess alcohol use. Other useful materials include manual checklists and reference cards.31 These providers also report that education, feedback on rates of alcohol screening, and increased supervision facilitate assessment. Finally, providers indicate that asking nurses or clerical staff to administer the screen improves completion rates.
Ask a simple question
“How often have you had a drink containing alcohol in the last year?” or “How many drinks containing alcohol did you have on a typical day when you were drinking in the last year?” are questions that can help you compare a patient’s alcohol use to the at-risk drinking cutoffs established by the NIAAA.1,2
Recent research has also validated the use of a single question in identifying NIAAA-defined at-risk drinking.32 Simply ask patients, “How many times in the past year have you had X or more drinks in a day?” (X=5 for men or 4 for women). The screen is positive when a patient acknowledges having done so at least once in the past year. This question was 81.8% sensitive and 79.3% specific for unhealthy alcohol use, and 87.9% sensitive and 66.8% specific for current alcohol abuse or dependence.32 Advantages of this method are its brevity, ease of scoring, validity in the primary care setting,32 and ease of recollection for treatment providers (TABLE 1).1,2
TABLE 1
Ask these simple questions to assess alcohol use1,2
| To assess… | Ask… |
|---|---|
| Frequency of alcohol use | “How often do you drink alcohol (including beer or wine)?” or “How often have you had a drink containing alcohol in the last year?” |
| Quantity of alcohol use | “When you do drink alcohol, how many standard* drinks do you have?” or “How many drinks containing alcohol did you have on a typical day when you were drinking in the last year?” |
| Binge drinking | For men: “How often do you have 5 or more standard* drinks on one occasion?” For women: “How often do you have 4 or more standard* drinks on one occasion?” |
| Alcohol use with the NIAAA single-question screen | “How many times in the past year have you had X or more drinks in a day?” (X = 5 for men and X = 4 for women; positive response ≥1) |
| *A standard drink is equal to 12 oz. of regular beer, 8 to 9 oz. of malt liquor, 5 oz. of wine, or 1.5 oz. of 80-proof spirits.1 NIAAA, National Institute on Alcohol Abuse and Alcoholism. | |
Brief intervention works in primary care
Brief interventions for drinking have strong empirical support. In a review of treatments for alcohol abuse and dependence,33 brief intervention was one of only 2 “efficacious” treatments.
Although some individual studies of brief alcohol interventions in primary care have not shown favorable results, several systematic reviews have demonstrated the efficacy of such interventions in this setting. General practitioner–delivered brief interventions led to significantly better patient outcomes compared with standard care, and “very brief advice” resulted in reductions in alcohol consumption overall and in the percentage of “excessive drinkers.”34 In a review of health behavior interventions,35 brief interventions reduced risky or harmful drinking. In one of 2 meta-analyses that support this finding, brief interventions with primary care patients not seeking treatment for alcohol abuse yielded small-to-medium effect sizes relative to control conditions.36 In the other study, brief interventions significantly reduced longer term alcohol use in primary care patients.37
The US Preventive Services Task Force conducted a systematic review of behavioral counseling interventions and recommends screening and brief interventions for unhealthy drinking in primary care.38,39 Its findings indicate that alcohol use declines significantly after brief interventions containing at least 2 of the following elements: feedback regarding drinking, advice to reduce drinking, or goal setting.
Brief advice is a form of intervention that shows considerable promise in primary care.40-42 Two 10- to 15-minute sessions have led to significant reductions in the mean number of drinks and frequency of excessive drinking in the 7 days before a follow-up interview, as well as a reduction in binge drinking episodes in the previous 30 days.41,42
One study produced positive results with just a 5- to 10-minute counseling session involving advice for drinking goals delivered by primary care providers as part of a routine medical visit.43 This intervention led to significant decreases in alcohol use at a 6-month follow-up for high-risk drinkers compared with controls.43 Brief interventions additionally work within the time constraints of a busy primary care practice and are cost effective.
Some primary care providers think a specialist should conduct interventions and suggest that having a specialist immediately available would enable intervention.31 In fact, some research has supported the idea of special training. In a European study, primary care providers reported that more practical training, information about brief intervention studies, personal training, and lectures would facilitate interventions.44
Applying brief alcohol interventions to diabetes patients
Newer research has tested the efficacy of alcohol interventions with diabetes patients in the primary care setting. In one study,45 brief advice was given in 2 15-minute sessions and 2 5-minute follow-up telephone calls. Compared with controls, significantly more participants who received the intervention reduced heavy drinking from baseline to follow-up. One caveat is that patients with hypertension were included in the sample, making it difficult to determine the impact of the intervention on diabetes patients specifically.
In a small study of patients with diabetes exhibiting at-risk drinking,8 a single-session intervention based on motivational interviewing (MI) principles46 gave participants personalized feedback in relation to sex-based norms of drinking rates and HbA1c and triglyceride laboratory results. Patients were given information on the physiologic effects of alcohol on diabetes, the potential interactions between alcohol and diabetes medications, and the effect of alcohol on diabetes self-care behavior. They were asked to identify pros and cons of their drinking and to develop personal change goals. One of 2 PhD-level clinical psychologists trained in MI administered the single 50-minute intervention. By 1 month and continuing through to the 6-month follow-up, participants had reduced the proportion of drinking days, mean number of daily drinks, and proportion of heavy drinking days.
Ramsey and colleagues47 extended this work by comparatively examining a group of patients exhibiting at-risk drinking who received no intervention. The results favored the intervention group, with a medium-to-large effect size for the proportion of drinking days, a medium effect size for the reduction of mean number of daily drinks, and a small-to-medium effect size in the reduction of heavy drinking days. Furthermore, in the intervention group there was a trend toward better diabetes adherence behavior.
Implementing brief intervention in practice. Despite differences among interventions, the elements of brief interventions tend to be similar.48 Incorporating these elements in the primary care setting provides a useful framework that will likely prove beneficial. Specifically, brief interventions typically contain elements of the FRAMES (TABLE 2)46 acronym:
- Feedback about one’s drinking relative to others
- Responsibility for deciding to change
- Advice to change drinking
- Menu of options for implementing a change strategy
- Empathic listening
- Self-efficacy enhancement.
Decision-making models indicate that expectations about the effects of behavior change play a significant role in determining whether a decision to change is made.49 The perceived costs and benefits of changing drinking50,51 and positive52 and negative alcohol expectancies53,54 predict future alcohol use. For patients with diabetes who are at-risk drinkers, primary care appointments may provide “teachable moments” in which brief advice can have a significant impact—particularly when patients are told laboratory test results; advised about the sugar and carbohydrate content of alcohol; or given information regarding the effect of alcohol on diabetes, medications, and self-care behavior. Finally, primary care providers will also likely have knowledge of a patient’s comorbid conditions (eg, depression) that may relate to diabetes or alcohol use.
TABLE 2
How to implement the FRAMES approach in brief interventions46
| FRAMES elements | Sample statements |
|---|---|
| Feedback about one’s drinking relative to others | “Based on what you told me, you are drinking an average of 21 drinks per week, which puts you above the cutoff for at-risk drinking” or “According to what you told me, it looks like you are drinking more than 88% of men (or women) in the United States.” |
| Responsibility for deciding to change | “You’re in the best position to decide how you would like to make a change” or “Although reducing your drinking would be good for your health, it’s up to you to decide when you’re ready to make a change.” |
| Advice to change drinking | “Your test results indicate your HbA1c, an important measure of blood sugar, is elevated; making a change in your drinking will likely improve your blood sugar” or “I am concerned about the effect on your health of drinking alcohol while taking your diabetes medications. Making a change in your drinking is likely to protect you from complications.” |
| Menu of options for implementing a change strategy | “If it’s okay with you, I can share what has worked for others whose drinking is similar to yours. Some people alternate a drink containing alcohol with water or diet soda. Others will bring only a certain amount of money with them when they go to a bar.” |
| Empathic listening | “It sounds like this has been a concern" or "I know that change can be difficult.” |
| Self-efficacy enhancement | “I wonder if you could use some of the same strategies you used to lose 10 pounds last year?” or “It sounds like you have some ideas for how to make this happen.” |
CORRESPONDENCE Patricia A. Engler, PhD, DGIM, 111 Plain Street Building, Providence, RI 02903; [email protected]
1. National Institute on Alcohol Abuse and Alcoholism. Helping patients who drink too much: a clinician’s guide. 2005. Available at: http://pubs.niaaa.nih.gov/publications/Practitioner/CliniciansGuide2005/guide.pdf. Accessed November 8, 2011.
2. Bradley KA, Kivlahan DR, Williams E. Brief approaches to alcohol screening: practical alternatives for primary care. J Gen Intern Med 2009;24:881-883.
3. Shai I, Fraser D, Wainstein J, et al. Glycemic effects of moderate alcohol intake among patients with type 2 diabetes. Diabetes Care 2007;30:3011-3016.
4. Bantle AE, Tomas W, Bantle JP. Metabolic effects of alcohol in the form of wine in persons with type 2 diabetes mellitus. Metabolism 2008;57:241-245.
5. Koppes LLJ, Dekker JM, Hendriks HFJ, et al. Meta-analysis of the relationship between alcohol consumption and coronary heart disease and mortality in type 2 diabetic patients. Diabetologia 2006;49:648-652.
6. Pedersen-Bjergaard U, Reubsaet JLE, Nielsen SL, et al. Psychoactive drugs, alcohol, and severe hypoglycemia in insulin-treated diabetes: analysis of 141 cases. Am J Med 2005;118:307-310.
7. Fleming M, Mundt M. Carbohydrate-deficient transferrin: validity of a new alcohol biomarker in a sample of patients with diabetes and hypertension. J Am Board Fam Pract 2004;17:247-255.
8. Engler PA, Ramsey SE, Stein MD. Brief alcohol intervention among diabetic patients: a pilot study. Presented at: Annual Meeting of the Society for Behavioral Medicine; March 26–29, 2008; San Diego, CA.
9. Saha TD, Stinson FS, Grant BF. The role of alcohol consumption in future classifications of alcohol use disorders. Drug Alcohol Depend 2007;89:82-92.
10. Shai I, Rimm EB, Schulze MB, et al. Moderate alcohol intake and markers of inflammation and endothelial dysfunction among diabetic men. Diabetologia 2004;14:1760-1767.
11. Wakabayashi I, Kobaba-Wakabayashi R, Masuda H. Relation of drinking alcohol to atherosclerotic risk in type 2 diabetes. Diabetes Care 2002;25:1223-1228.
12. Diem M, Deplazes M, Fajfr R, et al. Effects of alcohol consumption on mortality in patients with type 2 diabetes mellitus. Diabetologia 2003;46:1581-1585.
13. Cox WM, Blount JP, Crowe PA, et al. Diabetic patients’ alcohol use and quality of life: relationships with prescribed treatment compliance among older males. Alcohol Clin Exp Res 1996;20:327-331.
14. Yuan JM, Govindarajan S, Arakawa K, et al. Synergism of alcohol, diabetes, and viral hepatitis on the risk of hepatocellular carcinoma in blacks and whites in the U.S. Cancer 2004;101:1009-1017.
15. Howard AA, Arnsten JH, Gourevitch MN. Effect of alcohol consumption on diabetes mellitus. Ann Intern Med 2004;140:211-219.
16. Glasgow AM, Tynan D, Schwartz R, et al. Alcohol and drug use in teenagers with diabetes mellitus. J Adolesc Health 1991;12:11-14.
17. Turner BC, Jenkins E, Kerr D, et al. The effect of evening alcohol consumption on next-morning glucose control in type 1 diabetes. Diabetes Care 2001;24:1888-1893.
18. Richardson T, Weiss M, Thomas P, et al. Day after the night before. Influence of evening alcohol on risk of hypoglycemia in patients with type 1 diabetes. Diabetes Care. 2005;28:1801-1802.
19. Cheyne EH, Sherwin RS, Lunt MJ, et al. Influence of alcohol on cognitive performance during mild hypoglycaemia: implications for type 1 diabetes. Diabet Med 2004;21:230-237.
20. Lao B, Czyzyk A, Szutowski M, et al. Alcohol tolerance in patients with non-insulin-dependent (type 2) diabetes treated with sulphonylurea derivatives. Arzneimittelforschung 1994;44:727-734.
21. PDR Staff Physicians’ Desk Reference 2003. 57th ed. Montvale, NJ: Medical Economics Company; 2003.
22. Ramchandani N, Cantey-Kiser JM, Alter CA, et al. Self-reported factors that affect glycemic control in college students with type 1 diabetes. Diabetes Educ 2000;26:656-666.
23. Kyngas H. Compliance of adolescents with chronic disease. J Clin Nurs 2000;9:549-556.
24. Ahmed AT, Karter AJ, Liu J. Alcohol consumption is inversely associated with adherence to diabetes self-care behaviours. Diabet Med 2006;23:795-802.
25. Karter AJ, Ferrara A, Darbinian JA, et al. Self-monitoring of blood glucose. Diabetes Care 2004;23:477-483.
26. Chew LD, Nelson KM, Young BA, et al. Association between alcohol consumption and diabetes preventative practices. Fam Med 2005;37:589-594.
27. Johnson KH, Bazargan M, Bing E. Alcohol consumption and compliance among inner-city minority patients with type 2 diabetes mellitus. Arch Fam Med 2000;9:964-970.
28. D’Amico EJ, Paddock SM, Burnam A, et al. Identification of and guidance for problem drinking by general medical providers. Med Care 2005;43:229-236.
29. Roche AM, Parle MD, Stubbs JM, et al. Management and treatment efficacy of drug and alcohol problems: what do doctors believe? Addiction. 1995;90:1357-1366.
30. Aira M, Kauhanen J, Larivaara P, et al. Differences in brief interventions on excessive drinking and smoking by primary care physicians: qualitative study. Prev Med 2004;38:473-478.
31. Barry KL, Blow FC, Willenbring M, et al. Use of alcohol screening and brief interventions in primary care settings: implementation and barriers. Subst Abus 2004;25:27-36.
32. Smith PC, Schmidt SM, Allensworth-Davies D, et al. Primary care validation of a single-question alcohol screening test. J Gen Intern Med 2009;24:783-788.
33. McCrady BS. Alcohol use disorders and the Division 12 Task Force of the American Psychological Association. Psychol Addict Behav 2000;14:267-276.
34. Richmond RL, Anderson P. Research in general practice for smokers and excessive drinkers in Australia and the UK. I. Interpretation of results. Addiction 1994;89:35-40.
35. Goldstein MG, Whitlock EP, DePue J. Multiple behavioral risk factor interventions in primary care. Am J Prev Med 2004;27:61-79.
36. Moyer A, Finney JW, Swearingen CE, et al. Brief interventions for alcohol problems: a meta-analytic review of controlled investigations in treatment-seeking and non-treatment-seeking populations. Addiction 2002;97:279-292.
37. Bertholet N, Daeppen JB, Wietlisbach V, et al. Reduction of alcohol consumption by brief alcohol intervention in primary care: a systematic review and meta-analysis. Arch Intern Med 2005;165:986-995.
38. Whitlock EP, Polen MR, Green CA, et al. Behavioral counseling interventions in primary care to reduce risky/harmful alcohol use by adults: a summary of the evidence for the U.S. Preventive Services Task Force. Ann Intern Med 2004;140:557-568.
39. U. S. Preventive Services Task Force. Screening for problem drinking. In: DiGuiseppi C, Atkins D, Woolf SH, Kamerow DB, eds. Guide to Clinical Preventive Services. 2nd ed. Alexandria, VA: International Medical Services; 1996;567-582.
40. Anderson P, Scott E. The effect of general practitioners’ advice to heavy drinking men. Br J Addict 1992;87:891-900.
41. Fleming MF, Mundt MP, French MT, et al. Brief physician advice for problem drinkers: long-term efficacy and benefit-cost analysis. Alcohol Clin Exp Res 2002;26:36-43.
42. Fleming MF, Barry KL, Manwell LB, et al. Brief physician advice for problem alcohol drinkers. JAMA 1997;277:1039-1045.
43. Ockene JK, Adams A, Hurley TG, et al. Brief physician- and nurse practitioner-delivered counseling for high-risk drinkers. Arch Intern Med 1999;159:2198-2205.
44. Aalto M, Pekuri P, Seppa K. Primary health care nurses’ and physicians’ attitudes, knowledge and beliefs regarding brief intervention for heavy drinkers. Addiction 2001;96:305-311.
45. Fleming M, Brown R, Brown D. The efficacy of a brief alcohol intervention combined with %CDT feedback in patients being treated for type 2 diabetes and/or hypertension. J Stud Alcohol 2004;65:631-637.
46. Miller WR, Rollnick S. Motivational Interviewing: Preparing People for Change. New York: Guilford Press; 2002.
47. Ramsey SE, Engler PA, Harrington M, et al. A brief alcohol intervention with at-risk drinking diabetics. Subst Abus 2010;4:1-8.
48. Bien TH, Miller WR, Tonigan JS. Brief interventions for alcohol problems: a review. Addiction 1993;88:315-335.
49. Sutton S. Social-psychological approaches to understanding addictive behaviours: attitude-behaviour and decision-making models. Br J Addict 1987;82:355-370.
50. Cunningham JA, Sobell LC, Gavin DR, et al. Assessing motivation for change: preliminary development and evaluation of a scale measuring the costs and benefits of changing alcohol or drug use. Psychol Addict Behav 1997;11:107-114.
51. Rollnick S, Morgan M, Heather N. The development of a brief scale to measure outcome expectations of reduced consumption among excessive drinkers. Addict Behav 1996;21:377-387.
52. Brown SA. Reinforcement expectancies and alcoholism treatment outcome after a one-year follow-up. J Stud Alcohol 1985;46:304-308.
53. Jones BT, McMahon J. Negative alcohol expectancy predicts post-treatment abstinence survivorship: the whether, when and why of relapse to a first drink. Addiction 1994;89:1653-1665.
54. Jones BT, McMahon J. Negative and positive alcohol expectancies as predictors of abstinence after discharge from a residential treatment program: a one-month and three-month follow-up study in men. J Stud Alcohol 1994;55:543-548.
• Ask a question such as “How many drinks containing alcohol did you have on a typical day when you were drinking in the last year?” to ascertain a patient’s quantity of alcohol use. A
• Apply elements of the FRAMES approach to help patients curtail at-risk drinking—eg, use elevated HbA1c levels as evidence of a need to change behavior. A
Strength of recommendation (SOR)
A Good-quality patient-oriented evidence
B Inconsistent or limited-quality patient-oriented evidence
C Consensus, usual practice, opinion, disease-oriented evidence, case series
There are enough challenges in controlling diabetes mellitus without the hindrance of undetected problematic alcohol use. The good news is that asking a single nonthreatening question can help you detect at-risk drinking—defined by the National Institute on Alcohol Abuse and Alcoholism (NIAAA) as 5 or more drinks on one occasion or more than 14 drinks per week for men; and 4 or more drinks on one occasion or more than 7 drinks per week for women.1,2 And, for patients who may be compromising their diabetes care and overall health through problem drinking, brief intervention techniques used in the office can enable them to reduce alcohol consumption significantly.
When alcohol becomes a problem in diabetes care
Several studies have explored the long-term benefits of moderate alcohol use on glycemic control—with mixed results. A 2007 study found that diabetes patients who drink 1 glass of wine per day exhibited a lower fasting glucose level than abstainers after 3 months.3 There was no difference, however, on postprandial glucose levels. A 2008 study found that individuals who drank one to 2 glasses of wine per day for a month had lower fasting serum insulin levels relative to when they have abstained for a month,4 although levels of fasting plasma cholesterol, HDL cholesterol, glucose, and hemoglobin A1c (HbA1c) remained unchanged relative to periods of abstinence.4
Furthermore, rates of coronary heart disease and CHD mortality in a meta-analysis were significantly lower in 3 categories of alcohol consumption (<6 g/d, 6 to <18 g/d, and ≥18 g/d) compared with abstinence.5 Nondrinkers also had a greater risk of total mortality compared with the lightest drinking group. Notably, however, the lower limit of the highest drinking category was only 1.5 drinks per day.
How big is the problem? In a study of insulin-treated patients seen for severe hypoglycemia, 17% had been drinking before the episode.6 In a primary care sample, 28% of randomly selected patients with type 2 diabetes met Diagnostic and Statistical Manual of Mental Disorders-IV criteria for a lifetime incidence of alcohol abuse and 13% met either current or lifetime criteria for alcohol dependence.7 Another study of primary care patients with diabetes8 found that 13.4% met NIAAA criteria for at-risk drinking; 11.1% of these at-risk drinkers met criteria for current alcohol dependence. (According to the NIAAA, the rate of at-risk/heavy drinking among US adults is 30%, and about one in 4 heavy drinkers meets the criteria for alcohol abuse or dependence.1)
Detrimental effects with immoderate drinking. Individuals who engage in at-risk drinking, as defined by the NIAAA, are at increased risk for alcohol dependence9 and associated complications such as diabetic neuropathy and retinopathy,10 atherosclerosis,11 and total and CHD mortality.3,12 Heavy drinking also interferes with neuroendocrine, gastrointestinal, and sexual function,13 and its interaction with diabetes increases the risk for hepatocellular carcinoma after controlling for hepatitis B and C serology.14
Interference with diabetes control. Research examining the short-term effect of alcohol use has produced contradictory results, partly due to differences among studies, such as whether alcohol is administered with a meal and whether a fasting glucose level is measured.15 However, alcohol affects glycemic control and, when used excessively, can impair glucose production.16,17 Alcohol may induce hypoglycemia,10,18 and even small amounts may jeopardize diabetes control.13 In a study of patients with insulin-treated diabetes, alcohol use in the presence of mild hypoglycemia increased diastolic blood pressure or exacerbated hypoglycemia-related cognitive deficits.19 Another concern—in both the short and long term—is that alcohol interacts negatively with certain diabetes medications. It is more likely to induce hypoglycemia in the presence of sulfonylurea medications.10 Chlorpropamide decreases the rate of ethanol elimination from the blood.20 And, in those taking metformin, excessive alcohol use elevates risk for lactic acidosis. 21
Diminished self-care. Alcohol use can interfere with self-care,22,23 which is a crucial component of diabetes treatment.24 It may lead to reduced eating16 or to decreased willingness to adhere to prescribed dietary regimens.13 It also impairs other self-care behaviors13,15,25 such as self-monitoring blood glucose and showing up for medical appointments.26 In a large, diverse sample of patients with diabetes,24 heavy drinkers had the highest rates of morbidity. Importantly, alcohol and diabetes self-care behavior were significantly negatively associated. Studies of ethnic minority samples have yielded comparable results.27
Assessing alcohol use: Obstacles and solutions
Although alcohol use can be readily evaluated during routine primary care appointments, it is often neglected, perhaps due to a lack of awareness about its impact on diabetes.15 Those who are most often assessed tend to have a psychiatric diagnosis or other condition raising a red flag for physicians.28 When internists, general practitioners, and psychiatrists were questioned in a study regarding patients’ alcohol and drug use, all 3 groups were misinformed about which substance-use treatments were empirically supported29 and did not believe that treatment for alcohol abuse held much promise. Another study showed that physicians can be reluctant to screen for alcohol use because of the difficulty in recognizing a problem, the perceived unimportance of alcohol use as a health risk, a supposed lack of adequate intervention tools, and a fear of stigmatizing patients.30 Physicians are more likely to discuss alcohol use under certain extreme conditions such as when a patient smells of alcohol.
Multiple opportunities to ask in the VA system. In the Veterans Health Administration, primary care VA providers have reported that prompts for alcohol screening embedded in computerized progress notes, clinical reminder lists, and annual health evaluation forms encourage them to assess alcohol use. Other useful materials include manual checklists and reference cards.31 These providers also report that education, feedback on rates of alcohol screening, and increased supervision facilitate assessment. Finally, providers indicate that asking nurses or clerical staff to administer the screen improves completion rates.
Ask a simple question
“How often have you had a drink containing alcohol in the last year?” or “How many drinks containing alcohol did you have on a typical day when you were drinking in the last year?” are questions that can help you compare a patient’s alcohol use to the at-risk drinking cutoffs established by the NIAAA.1,2
Recent research has also validated the use of a single question in identifying NIAAA-defined at-risk drinking.32 Simply ask patients, “How many times in the past year have you had X or more drinks in a day?” (X=5 for men or 4 for women). The screen is positive when a patient acknowledges having done so at least once in the past year. This question was 81.8% sensitive and 79.3% specific for unhealthy alcohol use, and 87.9% sensitive and 66.8% specific for current alcohol abuse or dependence.32 Advantages of this method are its brevity, ease of scoring, validity in the primary care setting,32 and ease of recollection for treatment providers (TABLE 1).1,2
TABLE 1
Ask these simple questions to assess alcohol use1,2
| To assess… | Ask… |
|---|---|
| Frequency of alcohol use | “How often do you drink alcohol (including beer or wine)?” or “How often have you had a drink containing alcohol in the last year?” |
| Quantity of alcohol use | “When you do drink alcohol, how many standard* drinks do you have?” or “How many drinks containing alcohol did you have on a typical day when you were drinking in the last year?” |
| Binge drinking | For men: “How often do you have 5 or more standard* drinks on one occasion?” For women: “How often do you have 4 or more standard* drinks on one occasion?” |
| Alcohol use with the NIAAA single-question screen | “How many times in the past year have you had X or more drinks in a day?” (X = 5 for men and X = 4 for women; positive response ≥1) |
| *A standard drink is equal to 12 oz. of regular beer, 8 to 9 oz. of malt liquor, 5 oz. of wine, or 1.5 oz. of 80-proof spirits.1 NIAAA, National Institute on Alcohol Abuse and Alcoholism. | |
Brief intervention works in primary care
Brief interventions for drinking have strong empirical support. In a review of treatments for alcohol abuse and dependence,33 brief intervention was one of only 2 “efficacious” treatments.
Although some individual studies of brief alcohol interventions in primary care have not shown favorable results, several systematic reviews have demonstrated the efficacy of such interventions in this setting. General practitioner–delivered brief interventions led to significantly better patient outcomes compared with standard care, and “very brief advice” resulted in reductions in alcohol consumption overall and in the percentage of “excessive drinkers.”34 In a review of health behavior interventions,35 brief interventions reduced risky or harmful drinking. In one of 2 meta-analyses that support this finding, brief interventions with primary care patients not seeking treatment for alcohol abuse yielded small-to-medium effect sizes relative to control conditions.36 In the other study, brief interventions significantly reduced longer term alcohol use in primary care patients.37
The US Preventive Services Task Force conducted a systematic review of behavioral counseling interventions and recommends screening and brief interventions for unhealthy drinking in primary care.38,39 Its findings indicate that alcohol use declines significantly after brief interventions containing at least 2 of the following elements: feedback regarding drinking, advice to reduce drinking, or goal setting.
Brief advice is a form of intervention that shows considerable promise in primary care.40-42 Two 10- to 15-minute sessions have led to significant reductions in the mean number of drinks and frequency of excessive drinking in the 7 days before a follow-up interview, as well as a reduction in binge drinking episodes in the previous 30 days.41,42
One study produced positive results with just a 5- to 10-minute counseling session involving advice for drinking goals delivered by primary care providers as part of a routine medical visit.43 This intervention led to significant decreases in alcohol use at a 6-month follow-up for high-risk drinkers compared with controls.43 Brief interventions additionally work within the time constraints of a busy primary care practice and are cost effective.
Some primary care providers think a specialist should conduct interventions and suggest that having a specialist immediately available would enable intervention.31 In fact, some research has supported the idea of special training. In a European study, primary care providers reported that more practical training, information about brief intervention studies, personal training, and lectures would facilitate interventions.44
Applying brief alcohol interventions to diabetes patients
Newer research has tested the efficacy of alcohol interventions with diabetes patients in the primary care setting. In one study,45 brief advice was given in 2 15-minute sessions and 2 5-minute follow-up telephone calls. Compared with controls, significantly more participants who received the intervention reduced heavy drinking from baseline to follow-up. One caveat is that patients with hypertension were included in the sample, making it difficult to determine the impact of the intervention on diabetes patients specifically.
In a small study of patients with diabetes exhibiting at-risk drinking,8 a single-session intervention based on motivational interviewing (MI) principles46 gave participants personalized feedback in relation to sex-based norms of drinking rates and HbA1c and triglyceride laboratory results. Patients were given information on the physiologic effects of alcohol on diabetes, the potential interactions between alcohol and diabetes medications, and the effect of alcohol on diabetes self-care behavior. They were asked to identify pros and cons of their drinking and to develop personal change goals. One of 2 PhD-level clinical psychologists trained in MI administered the single 50-minute intervention. By 1 month and continuing through to the 6-month follow-up, participants had reduced the proportion of drinking days, mean number of daily drinks, and proportion of heavy drinking days.
Ramsey and colleagues47 extended this work by comparatively examining a group of patients exhibiting at-risk drinking who received no intervention. The results favored the intervention group, with a medium-to-large effect size for the proportion of drinking days, a medium effect size for the reduction of mean number of daily drinks, and a small-to-medium effect size in the reduction of heavy drinking days. Furthermore, in the intervention group there was a trend toward better diabetes adherence behavior.
Implementing brief intervention in practice. Despite differences among interventions, the elements of brief interventions tend to be similar.48 Incorporating these elements in the primary care setting provides a useful framework that will likely prove beneficial. Specifically, brief interventions typically contain elements of the FRAMES (TABLE 2)46 acronym:
- Feedback about one’s drinking relative to others
- Responsibility for deciding to change
- Advice to change drinking
- Menu of options for implementing a change strategy
- Empathic listening
- Self-efficacy enhancement.
Decision-making models indicate that expectations about the effects of behavior change play a significant role in determining whether a decision to change is made.49 The perceived costs and benefits of changing drinking50,51 and positive52 and negative alcohol expectancies53,54 predict future alcohol use. For patients with diabetes who are at-risk drinkers, primary care appointments may provide “teachable moments” in which brief advice can have a significant impact—particularly when patients are told laboratory test results; advised about the sugar and carbohydrate content of alcohol; or given information regarding the effect of alcohol on diabetes, medications, and self-care behavior. Finally, primary care providers will also likely have knowledge of a patient’s comorbid conditions (eg, depression) that may relate to diabetes or alcohol use.
TABLE 2
How to implement the FRAMES approach in brief interventions46
| FRAMES elements | Sample statements |
|---|---|
| Feedback about one’s drinking relative to others | “Based on what you told me, you are drinking an average of 21 drinks per week, which puts you above the cutoff for at-risk drinking” or “According to what you told me, it looks like you are drinking more than 88% of men (or women) in the United States.” |
| Responsibility for deciding to change | “You’re in the best position to decide how you would like to make a change” or “Although reducing your drinking would be good for your health, it’s up to you to decide when you’re ready to make a change.” |
| Advice to change drinking | “Your test results indicate your HbA1c, an important measure of blood sugar, is elevated; making a change in your drinking will likely improve your blood sugar” or “I am concerned about the effect on your health of drinking alcohol while taking your diabetes medications. Making a change in your drinking is likely to protect you from complications.” |
| Menu of options for implementing a change strategy | “If it’s okay with you, I can share what has worked for others whose drinking is similar to yours. Some people alternate a drink containing alcohol with water or diet soda. Others will bring only a certain amount of money with them when they go to a bar.” |
| Empathic listening | “It sounds like this has been a concern" or "I know that change can be difficult.” |
| Self-efficacy enhancement | “I wonder if you could use some of the same strategies you used to lose 10 pounds last year?” or “It sounds like you have some ideas for how to make this happen.” |
CORRESPONDENCE Patricia A. Engler, PhD, DGIM, 111 Plain Street Building, Providence, RI 02903; [email protected]
1. National Institute on Alcohol Abuse and Alcoholism. Helping patients who drink too much: a clinician’s guide. 2005. Available at: http://pubs.niaaa.nih.gov/publications/Practitioner/CliniciansGuide2005/guide.pdf. Accessed November 8, 2011.
2. Bradley KA, Kivlahan DR, Williams E. Brief approaches to alcohol screening: practical alternatives for primary care. J Gen Intern Med 2009;24:881-883.
3. Shai I, Fraser D, Wainstein J, et al. Glycemic effects of moderate alcohol intake among patients with type 2 diabetes. Diabetes Care 2007;30:3011-3016.
4. Bantle AE, Tomas W, Bantle JP. Metabolic effects of alcohol in the form of wine in persons with type 2 diabetes mellitus. Metabolism 2008;57:241-245.
5. Koppes LLJ, Dekker JM, Hendriks HFJ, et al. Meta-analysis of the relationship between alcohol consumption and coronary heart disease and mortality in type 2 diabetic patients. Diabetologia 2006;49:648-652.
6. Pedersen-Bjergaard U, Reubsaet JLE, Nielsen SL, et al. Psychoactive drugs, alcohol, and severe hypoglycemia in insulin-treated diabetes: analysis of 141 cases. Am J Med 2005;118:307-310.
7. Fleming M, Mundt M. Carbohydrate-deficient transferrin: validity of a new alcohol biomarker in a sample of patients with diabetes and hypertension. J Am Board Fam Pract 2004;17:247-255.
8. Engler PA, Ramsey SE, Stein MD. Brief alcohol intervention among diabetic patients: a pilot study. Presented at: Annual Meeting of the Society for Behavioral Medicine; March 26–29, 2008; San Diego, CA.
9. Saha TD, Stinson FS, Grant BF. The role of alcohol consumption in future classifications of alcohol use disorders. Drug Alcohol Depend 2007;89:82-92.
10. Shai I, Rimm EB, Schulze MB, et al. Moderate alcohol intake and markers of inflammation and endothelial dysfunction among diabetic men. Diabetologia 2004;14:1760-1767.
11. Wakabayashi I, Kobaba-Wakabayashi R, Masuda H. Relation of drinking alcohol to atherosclerotic risk in type 2 diabetes. Diabetes Care 2002;25:1223-1228.
12. Diem M, Deplazes M, Fajfr R, et al. Effects of alcohol consumption on mortality in patients with type 2 diabetes mellitus. Diabetologia 2003;46:1581-1585.
13. Cox WM, Blount JP, Crowe PA, et al. Diabetic patients’ alcohol use and quality of life: relationships with prescribed treatment compliance among older males. Alcohol Clin Exp Res 1996;20:327-331.
14. Yuan JM, Govindarajan S, Arakawa K, et al. Synergism of alcohol, diabetes, and viral hepatitis on the risk of hepatocellular carcinoma in blacks and whites in the U.S. Cancer 2004;101:1009-1017.
15. Howard AA, Arnsten JH, Gourevitch MN. Effect of alcohol consumption on diabetes mellitus. Ann Intern Med 2004;140:211-219.
16. Glasgow AM, Tynan D, Schwartz R, et al. Alcohol and drug use in teenagers with diabetes mellitus. J Adolesc Health 1991;12:11-14.
17. Turner BC, Jenkins E, Kerr D, et al. The effect of evening alcohol consumption on next-morning glucose control in type 1 diabetes. Diabetes Care 2001;24:1888-1893.
18. Richardson T, Weiss M, Thomas P, et al. Day after the night before. Influence of evening alcohol on risk of hypoglycemia in patients with type 1 diabetes. Diabetes Care. 2005;28:1801-1802.
19. Cheyne EH, Sherwin RS, Lunt MJ, et al. Influence of alcohol on cognitive performance during mild hypoglycaemia: implications for type 1 diabetes. Diabet Med 2004;21:230-237.
20. Lao B, Czyzyk A, Szutowski M, et al. Alcohol tolerance in patients with non-insulin-dependent (type 2) diabetes treated with sulphonylurea derivatives. Arzneimittelforschung 1994;44:727-734.
21. PDR Staff Physicians’ Desk Reference 2003. 57th ed. Montvale, NJ: Medical Economics Company; 2003.
22. Ramchandani N, Cantey-Kiser JM, Alter CA, et al. Self-reported factors that affect glycemic control in college students with type 1 diabetes. Diabetes Educ 2000;26:656-666.
23. Kyngas H. Compliance of adolescents with chronic disease. J Clin Nurs 2000;9:549-556.
24. Ahmed AT, Karter AJ, Liu J. Alcohol consumption is inversely associated with adherence to diabetes self-care behaviours. Diabet Med 2006;23:795-802.
25. Karter AJ, Ferrara A, Darbinian JA, et al. Self-monitoring of blood glucose. Diabetes Care 2004;23:477-483.
26. Chew LD, Nelson KM, Young BA, et al. Association between alcohol consumption and diabetes preventative practices. Fam Med 2005;37:589-594.
27. Johnson KH, Bazargan M, Bing E. Alcohol consumption and compliance among inner-city minority patients with type 2 diabetes mellitus. Arch Fam Med 2000;9:964-970.
28. D’Amico EJ, Paddock SM, Burnam A, et al. Identification of and guidance for problem drinking by general medical providers. Med Care 2005;43:229-236.
29. Roche AM, Parle MD, Stubbs JM, et al. Management and treatment efficacy of drug and alcohol problems: what do doctors believe? Addiction. 1995;90:1357-1366.
30. Aira M, Kauhanen J, Larivaara P, et al. Differences in brief interventions on excessive drinking and smoking by primary care physicians: qualitative study. Prev Med 2004;38:473-478.
31. Barry KL, Blow FC, Willenbring M, et al. Use of alcohol screening and brief interventions in primary care settings: implementation and barriers. Subst Abus 2004;25:27-36.
32. Smith PC, Schmidt SM, Allensworth-Davies D, et al. Primary care validation of a single-question alcohol screening test. J Gen Intern Med 2009;24:783-788.
33. McCrady BS. Alcohol use disorders and the Division 12 Task Force of the American Psychological Association. Psychol Addict Behav 2000;14:267-276.
34. Richmond RL, Anderson P. Research in general practice for smokers and excessive drinkers in Australia and the UK. I. Interpretation of results. Addiction 1994;89:35-40.
35. Goldstein MG, Whitlock EP, DePue J. Multiple behavioral risk factor interventions in primary care. Am J Prev Med 2004;27:61-79.
36. Moyer A, Finney JW, Swearingen CE, et al. Brief interventions for alcohol problems: a meta-analytic review of controlled investigations in treatment-seeking and non-treatment-seeking populations. Addiction 2002;97:279-292.
37. Bertholet N, Daeppen JB, Wietlisbach V, et al. Reduction of alcohol consumption by brief alcohol intervention in primary care: a systematic review and meta-analysis. Arch Intern Med 2005;165:986-995.
38. Whitlock EP, Polen MR, Green CA, et al. Behavioral counseling interventions in primary care to reduce risky/harmful alcohol use by adults: a summary of the evidence for the U.S. Preventive Services Task Force. Ann Intern Med 2004;140:557-568.
39. U. S. Preventive Services Task Force. Screening for problem drinking. In: DiGuiseppi C, Atkins D, Woolf SH, Kamerow DB, eds. Guide to Clinical Preventive Services. 2nd ed. Alexandria, VA: International Medical Services; 1996;567-582.
40. Anderson P, Scott E. The effect of general practitioners’ advice to heavy drinking men. Br J Addict 1992;87:891-900.
41. Fleming MF, Mundt MP, French MT, et al. Brief physician advice for problem drinkers: long-term efficacy and benefit-cost analysis. Alcohol Clin Exp Res 2002;26:36-43.
42. Fleming MF, Barry KL, Manwell LB, et al. Brief physician advice for problem alcohol drinkers. JAMA 1997;277:1039-1045.
43. Ockene JK, Adams A, Hurley TG, et al. Brief physician- and nurse practitioner-delivered counseling for high-risk drinkers. Arch Intern Med 1999;159:2198-2205.
44. Aalto M, Pekuri P, Seppa K. Primary health care nurses’ and physicians’ attitudes, knowledge and beliefs regarding brief intervention for heavy drinkers. Addiction 2001;96:305-311.
45. Fleming M, Brown R, Brown D. The efficacy of a brief alcohol intervention combined with %CDT feedback in patients being treated for type 2 diabetes and/or hypertension. J Stud Alcohol 2004;65:631-637.
46. Miller WR, Rollnick S. Motivational Interviewing: Preparing People for Change. New York: Guilford Press; 2002.
47. Ramsey SE, Engler PA, Harrington M, et al. A brief alcohol intervention with at-risk drinking diabetics. Subst Abus 2010;4:1-8.
48. Bien TH, Miller WR, Tonigan JS. Brief interventions for alcohol problems: a review. Addiction 1993;88:315-335.
49. Sutton S. Social-psychological approaches to understanding addictive behaviours: attitude-behaviour and decision-making models. Br J Addict 1987;82:355-370.
50. Cunningham JA, Sobell LC, Gavin DR, et al. Assessing motivation for change: preliminary development and evaluation of a scale measuring the costs and benefits of changing alcohol or drug use. Psychol Addict Behav 1997;11:107-114.
51. Rollnick S, Morgan M, Heather N. The development of a brief scale to measure outcome expectations of reduced consumption among excessive drinkers. Addict Behav 1996;21:377-387.
52. Brown SA. Reinforcement expectancies and alcoholism treatment outcome after a one-year follow-up. J Stud Alcohol 1985;46:304-308.
53. Jones BT, McMahon J. Negative alcohol expectancy predicts post-treatment abstinence survivorship: the whether, when and why of relapse to a first drink. Addiction 1994;89:1653-1665.
54. Jones BT, McMahon J. Negative and positive alcohol expectancies as predictors of abstinence after discharge from a residential treatment program: a one-month and three-month follow-up study in men. J Stud Alcohol 1994;55:543-548.
CDC update on gonorrhea: Expand treatment to limit resistance
Public health efforts have decreased the incidence of gonorrhea over the past several decades, but this progress is threatened by emergent bacteria resistance to the few remaining antibiotics available to treat it.
Gonococcal resistance to penicillin and tetracycline began in the 1970s and was widespread by the 1980s. Resistance to fluoroquinolones developed during the last decade and led the Centers for Disease Control and Prevention (CDC) in 2007 to stop recommending this class of antibiotics for treatment of gonorrhea.1 (See “The decline of gonorrhea: A success story now threatened by antibiotic resistance”.)
Given the speed with which gonococci developed resistance to fluoroquinolones, the CDC sees as inevitable the eventual development of resistance to cephalosporins—the currently favored agents for gonorrhea.2 This is the main reason behind the new recommendations for treating all cases of gonorrhea with both a cephalosporin and azithromycin, whether or not co-infection with Chlamydia trachomatis is documented or suspected.3
The reported rate of gonorrhea rose steadily from the early 1960s until the mid-1970s, when it was close to 500 cases per 100,000. With implementation of the national gonorrhea control program, the annual rate began to fall, and by the mid-1990s it had declined by 74%. Between 1996 and 2006, the rate remained at about 115 cases per 100,000. Between 2006 and 2009, it decreased to the lowest rate since national reporting began, but increased 2.8% between 2009 and 2010 (FIGURE 1).
The highest rates of gonorrhea are in the South (FIGURE 2) and in women ages 15 to 24 and men ages 20 to 24 (FIGURE 3). Rates are highest among blacks (432.5 cases per 100,000), followed by American Indians/Alaska natives (105.7) and Hispanics (49.9). Between 2009 and 2010, gonorrhea rates increased among American Indians/Alaska natives (21.5%), Asians/Pacific Islanders (13.1%), Hispanics (11.9%), whites (9.0%), and blacks (0.3%).
Recent trends in Gonococcus susceptibility to cephalosporins have the CDC concerned. While cephalosporin resistance remains rare, the proportion of Gonococcus isolates that have shown elevated minimum inhibitory concentrations to cephalosporins has increased.
Gonorrhea control depends in part on appropriate screening of individuals at risk (TABLE). Risk factors for gonorrhea include a history of previous gonorrhea infection, other sexually transmitted infections, new or multiple sexual partners, inconsistent condom use, sex work, and drug use. Risk factors for pregnant women are the same as for nonpregnant women. Prevalence of gonorrhea infection varies widely among communities and patient populations.
Source: Centers for Disease Control and Prevention. Sexually transmitted disease surveillance 2010. Available at: http://www.cdc.gov/std/stats10/surv2010.pdf. Accessed November 17, 2011.
FIGURE 1
A decline in gonorrhea that began in the mid-1970s*
*The initiation of a national gonorrhea control program reaped immediate benefits that have continued through the present.
Source: Centers for Disease Control and Prevention. Sexually transmitted disease surveillance 2010. Gonorrhea—rates, United States, 1941-2010. Available at: http://www.cdc.gov/std/stats10/surv2010.pdf. Accessed November 17, 2011.
FIGURE 2
Gonorrhea prevalence, 2010
Source: Centers for Disease Control and Prevention. Sexually transmitted disease surveillance 2010. Gonorrhea—rates by state, United States and outlying areas, 2010. Available at: http://www.cdc.gov/std/10/surv2010.pdf. Accessed November 17, 2011.
FIGURE 3
Gonorrhea prevalence by age and sex, 2010
Source: Centers for Disease Control and Prevention. Sexually transmitted disease surveillance 2010. Gonorrhea—rates by age and sex, United States, 2010. Available at: http://www.cdc.gov/std/stats10/surv2010.pdf. Accessed November 17, 2011.
Augment therapy, follow up thoroughly
Family physicians can assist with public health efforts to control gonorrhea and delay the development of cephalosporin resistance by screening for and detecting the infection, diagnosing those with symptoms, and treating according to newer recommendations. It’s also essential to report cases to local public health departments, assist with finding and treating sexual contacts of infected individuals, and immediately report suspected treatment failures.
A 2-drug regimen is imperative. The latest recommendation for treating gonorrhea is ceftriaxone 250 mg IM in a single dose and azithromycin 1 g orally in a single dose. Until 2010, the dose of ceftriaxone had been 125 mg. This dual drug regimen is recommended for several reasons: As with using multiple drugs to treat tuberculosis, it is hoped dual drug therapy will slow development of resistance to both cephalosporins and azithromycin; co-infection with C trachomatis remains a significant problem; and the combination may be more effective against pharyngeal gonorrhea, which is hard to detect.
Alternative regimens. Cefixime 400 mg orally as a single dose is an option in lieu of ceftriaxone, but is not preferred because of the higher number of reported failures of treatment with oral cephalosporins and less efficacy against pharyngeal disease.3 Other injectable cephalosporins are also an option, but less is known about their effectiveness in treating pharyngeal infection. Injectable options include ceftizoxime 500 mg IM, cefoxitin 2 g IM with probenecid 1 g orally, and cefotaxime 500 mg IM.
Regardless of the cephalosporin chosen, always administer azithromycin. If necessary, an alternative to azithromycin is doxycycline 100 mg orally twice a day. But doxycycline is not preferred because it has a multiple daily dosing requirement and higher levels of gonococcal resistance than is seen with azithromycin.
Necessary follow-up. Although routine testing for cure is not advocated for those treated with a recommended antibiotic regimen, a gonococcal culture and testing for antibiotic susceptibility should be done for any patient whose symptoms persist after treatment. Rapid tests using nucleic acid amplification are unsuitable for testing antibiotic susceptibility. The CDC does recommend retesting patients 3 months after treatment is completed because of a high prevalence of reinfection.3 If cephalosporin resistance becomes prevalent, routine tests of cure might become a recommended standard.
Report all patients with gonorrhea to the local public health department so that sexual contacts within the past 60 days can be notified, tested, and treated presumptively with the dual drug regimen. Recommend simultaneous treatment for all current sex partners, and discourage sexual intercourse until symptoms have resolved. Promptly report any patient with suspected treatment failure to the local health department, and consult the local or state health department for recommendations on subsequent treatment regimens.
The US Preventive Services Task Force (USPSTF) recommends routine screening for asymptomatic infection in women at risk, as per the details in the TABLE.4 While the USPSTF found insufficient evidence to recommend screening of high-risk men, physicians might still consider screening men who have sex with multiple male partners.
TABLE
USPSTF recommendations on screening for gonorrhea4
|
|
|
|
| USPSTF, US Preventive Services Task Force. *For more on the USPSTF’s grade definitions, see: http://www.uspreventiveservicestaskforce.org/uspstf/gradespre.htm#brec. |
Doing our best in the face of uncertainty
Although evidence is lacking that dual drug therapy will delay the progression of resistance, the strategy makes empirical sense. If gonorrhea develops resistance to cephalosporins, it will seriously challenge public health efforts to control this infection. Family physicians have an important role in controlling this sexually transmitted infection and helping to prevent drug resistance.
1. Centers for Disease Control and Prevention. Update to CDC’s sexually transmitted disease treatment guidelines, 2006: fluoroquinolones no longer recommended for treatment of gonococcal infections. MMWR Morb Mortal Wkly Rep. 2007;56:332-336.
2. Centers for Disease Control and Prevention. Cephalosporin susceptibility among Neisseria gonorrhoeae isolates—United States 2000-2010. MMWR Morb Mortal Wkly Rep. 2011;60:873-877.
3. Workowski KA, Berman S. Centers for Disease Control and Prevention (CDC). Sexually transmitted diseases treatment guidelines, 2010. MMWR Recomm Rep. 2010;59(RR-12):1-110.
4. US Preventive Services Task Force. Screening for gonorrhea. Available at: http://www.uspreventiveservicestaskforce.org/uspstf/uspsgono.htm. Accessed September 26, 2011.
Public health efforts have decreased the incidence of gonorrhea over the past several decades, but this progress is threatened by emergent bacteria resistance to the few remaining antibiotics available to treat it.
Gonococcal resistance to penicillin and tetracycline began in the 1970s and was widespread by the 1980s. Resistance to fluoroquinolones developed during the last decade and led the Centers for Disease Control and Prevention (CDC) in 2007 to stop recommending this class of antibiotics for treatment of gonorrhea.1 (See “The decline of gonorrhea: A success story now threatened by antibiotic resistance”.)
Given the speed with which gonococci developed resistance to fluoroquinolones, the CDC sees as inevitable the eventual development of resistance to cephalosporins—the currently favored agents for gonorrhea.2 This is the main reason behind the new recommendations for treating all cases of gonorrhea with both a cephalosporin and azithromycin, whether or not co-infection with Chlamydia trachomatis is documented or suspected.3
The reported rate of gonorrhea rose steadily from the early 1960s until the mid-1970s, when it was close to 500 cases per 100,000. With implementation of the national gonorrhea control program, the annual rate began to fall, and by the mid-1990s it had declined by 74%. Between 1996 and 2006, the rate remained at about 115 cases per 100,000. Between 2006 and 2009, it decreased to the lowest rate since national reporting began, but increased 2.8% between 2009 and 2010 (FIGURE 1).
The highest rates of gonorrhea are in the South (FIGURE 2) and in women ages 15 to 24 and men ages 20 to 24 (FIGURE 3). Rates are highest among blacks (432.5 cases per 100,000), followed by American Indians/Alaska natives (105.7) and Hispanics (49.9). Between 2009 and 2010, gonorrhea rates increased among American Indians/Alaska natives (21.5%), Asians/Pacific Islanders (13.1%), Hispanics (11.9%), whites (9.0%), and blacks (0.3%).
Recent trends in Gonococcus susceptibility to cephalosporins have the CDC concerned. While cephalosporin resistance remains rare, the proportion of Gonococcus isolates that have shown elevated minimum inhibitory concentrations to cephalosporins has increased.
Gonorrhea control depends in part on appropriate screening of individuals at risk (TABLE). Risk factors for gonorrhea include a history of previous gonorrhea infection, other sexually transmitted infections, new or multiple sexual partners, inconsistent condom use, sex work, and drug use. Risk factors for pregnant women are the same as for nonpregnant women. Prevalence of gonorrhea infection varies widely among communities and patient populations.
Source: Centers for Disease Control and Prevention. Sexually transmitted disease surveillance 2010. Available at: http://www.cdc.gov/std/stats10/surv2010.pdf. Accessed November 17, 2011.
FIGURE 1
A decline in gonorrhea that began in the mid-1970s*
*The initiation of a national gonorrhea control program reaped immediate benefits that have continued through the present.
Source: Centers for Disease Control and Prevention. Sexually transmitted disease surveillance 2010. Gonorrhea—rates, United States, 1941-2010. Available at: http://www.cdc.gov/std/stats10/surv2010.pdf. Accessed November 17, 2011.
FIGURE 2
Gonorrhea prevalence, 2010
Source: Centers for Disease Control and Prevention. Sexually transmitted disease surveillance 2010. Gonorrhea—rates by state, United States and outlying areas, 2010. Available at: http://www.cdc.gov/std/10/surv2010.pdf. Accessed November 17, 2011.
FIGURE 3
Gonorrhea prevalence by age and sex, 2010
Source: Centers for Disease Control and Prevention. Sexually transmitted disease surveillance 2010. Gonorrhea—rates by age and sex, United States, 2010. Available at: http://www.cdc.gov/std/stats10/surv2010.pdf. Accessed November 17, 2011.
Augment therapy, follow up thoroughly
Family physicians can assist with public health efforts to control gonorrhea and delay the development of cephalosporin resistance by screening for and detecting the infection, diagnosing those with symptoms, and treating according to newer recommendations. It’s also essential to report cases to local public health departments, assist with finding and treating sexual contacts of infected individuals, and immediately report suspected treatment failures.
A 2-drug regimen is imperative. The latest recommendation for treating gonorrhea is ceftriaxone 250 mg IM in a single dose and azithromycin 1 g orally in a single dose. Until 2010, the dose of ceftriaxone had been 125 mg. This dual drug regimen is recommended for several reasons: As with using multiple drugs to treat tuberculosis, it is hoped dual drug therapy will slow development of resistance to both cephalosporins and azithromycin; co-infection with C trachomatis remains a significant problem; and the combination may be more effective against pharyngeal gonorrhea, which is hard to detect.
Alternative regimens. Cefixime 400 mg orally as a single dose is an option in lieu of ceftriaxone, but is not preferred because of the higher number of reported failures of treatment with oral cephalosporins and less efficacy against pharyngeal disease.3 Other injectable cephalosporins are also an option, but less is known about their effectiveness in treating pharyngeal infection. Injectable options include ceftizoxime 500 mg IM, cefoxitin 2 g IM with probenecid 1 g orally, and cefotaxime 500 mg IM.
Regardless of the cephalosporin chosen, always administer azithromycin. If necessary, an alternative to azithromycin is doxycycline 100 mg orally twice a day. But doxycycline is not preferred because it has a multiple daily dosing requirement and higher levels of gonococcal resistance than is seen with azithromycin.
Necessary follow-up. Although routine testing for cure is not advocated for those treated with a recommended antibiotic regimen, a gonococcal culture and testing for antibiotic susceptibility should be done for any patient whose symptoms persist after treatment. Rapid tests using nucleic acid amplification are unsuitable for testing antibiotic susceptibility. The CDC does recommend retesting patients 3 months after treatment is completed because of a high prevalence of reinfection.3 If cephalosporin resistance becomes prevalent, routine tests of cure might become a recommended standard.
Report all patients with gonorrhea to the local public health department so that sexual contacts within the past 60 days can be notified, tested, and treated presumptively with the dual drug regimen. Recommend simultaneous treatment for all current sex partners, and discourage sexual intercourse until symptoms have resolved. Promptly report any patient with suspected treatment failure to the local health department, and consult the local or state health department for recommendations on subsequent treatment regimens.
The US Preventive Services Task Force (USPSTF) recommends routine screening for asymptomatic infection in women at risk, as per the details in the TABLE.4 While the USPSTF found insufficient evidence to recommend screening of high-risk men, physicians might still consider screening men who have sex with multiple male partners.
TABLE
USPSTF recommendations on screening for gonorrhea4
|
|
|
|
| USPSTF, US Preventive Services Task Force. *For more on the USPSTF’s grade definitions, see: http://www.uspreventiveservicestaskforce.org/uspstf/gradespre.htm#brec. |
Doing our best in the face of uncertainty
Although evidence is lacking that dual drug therapy will delay the progression of resistance, the strategy makes empirical sense. If gonorrhea develops resistance to cephalosporins, it will seriously challenge public health efforts to control this infection. Family physicians have an important role in controlling this sexually transmitted infection and helping to prevent drug resistance.
1. Centers for Disease Control and Prevention. Update to CDC’s sexually transmitted disease treatment guidelines, 2006: fluoroquinolones no longer recommended for treatment of gonococcal infections. MMWR Morb Mortal Wkly Rep. 2007;56:332-336.
2. Centers for Disease Control and Prevention. Cephalosporin susceptibility among Neisseria gonorrhoeae isolates—United States 2000-2010. MMWR Morb Mortal Wkly Rep. 2011;60:873-877.
3. Workowski KA, Berman S. Centers for Disease Control and Prevention (CDC). Sexually transmitted diseases treatment guidelines, 2010. MMWR Recomm Rep. 2010;59(RR-12):1-110.
4. US Preventive Services Task Force. Screening for gonorrhea. Available at: http://www.uspreventiveservicestaskforce.org/uspstf/uspsgono.htm. Accessed September 26, 2011.
Detecting and treating delirium—key interventions you may be missing
• Nonpharmacologic interventions are the mainstay of treatment for delirium. B
• When medication is needed, atypical antipsychotics are as effective as typical antipsychotics for treating delirium in elderly patients, and have fewer side effects. B
• Benzodiazepines should be avoided in elderly patients with delirium that is not associated with alcohol withdrawal. A
Strength of recommendation (SOR)
A Good-quality patient-oriented evidence
B Inconsistent or limited-quality patient-oriented evidence
C Consensus, usual practice, opinion, disease-oriented evidence, case series
CASE Mr. D, a 75-year-old patient with a history of hypertension and congestive heart failure, sustained a femoral neck fracture and was admitted to the hospital for surgery. He underwent open reduction and internal fixation and was doing well postoperatively, until Day 2—when his primary care physician made morning rounds and noted that Mr. D was somnolent. The nurse on duty assured the physician that Mr. D was fine and “was awake and alert earlier,” and attributed his somnolence to the oxycodone (10 mg) the patient was taking for pain. The physician ordered a reduction in dosage.
If Mr. D had been your patient, would you have considered other possible causes of his somnolence? Or do you think the physician’s action was sufficient?
Derived from Latin, the word delirium literally means “off the [ploughed] track.”1 Dozens of terms have been used to describe delirium, with acute confusion state, organic brain syndrome, acute brain syndrome, and toxic psychosis among them.
Delirium has been reported to occur in 15% to 30% of patients on general medical units,2 about 40% of postoperative patients, and up to 70% of terminally ill patients.3 The true prevalence is hard to determine, as up to 66% of cases may be missed.4
Delirium is being diagnosed more frequently, however—a likely result of a growing geriatric population, increased longevity, and greater awareness of the condition. Each year, an estimated 2.3 million US residents are affected, leading to prolonged hospitalization; poor functional outcomes; the development or worsening of dementia; increased nursing home placement; and a significant burden for families and the US health care system.5
Delirium is also associated with an increase in mortality.6,7 The mortality rate among hospitalized patients who develop delirium is reported to be 18%, rising to an estimated 47% within the first 3 months after discharge.6 Greater awareness of risk factors, rapid recognition of signs and symptoms of delirium, and early intervention—detailed in the text and tables that follow—will lead to better outcomes.
Assessing risk, evaluating mental status
In addition to advanced age, risk factors for delirium (TABLE 1)8-14 include alcohol use, brain dysfunction, comorbidities, hypertension, malignancy, anticholinergic medications, anemia, metabolic abnormalities, and male sex. In patients who, like Mr. D, have numerous risk factors, early—and frequent—evaluation of mental status is needed. One way to do this is to treat mental status as a vital sign, to be included in the assessment of every elderly patient.15
The Confusion Assessment Method, a quick and easy-to-use delirium screening tool (TABLE 2), has a sensitivity of 94% to 100% and a specificity of 90% to 95%.16,17 There are a number of other screening tools, including the widely used Mini-Mental State Exam (MMSE), as well as the Delirium Rating Scale, Delirium Symptom Interview, and Delirium Severity Scale.
TABLE 1
Risk factors for delirium8-14
Advanced age Alcohol use Brain dysfunction (dementia, epilepsy) Hypertension Male sex Malignancy Medications (mainly anticholinergic) Metabolic abnormalities:
Old age Preoperative anemia Preoperative metabolic abnormalities |
| BUN, blood urea nitrogen; Cr, creatinine; Na, sodium. |
TABLE 2
Screening for delirium: The Confusion Assessment Method*16,17
| Criteria | Evidence Yes to questions 1, 2, and 3 plus 4 or 5 (or both) suggests a delirium diagnosis |
|---|---|
| 1. Acute onset | Is there evidence of an acute change in mental status from the patient’s baseline? |
| 2. Fluctuating course | Did the abnormal behavior fluctuate during the day—ie, tend to come and go or increase and decrease in severity? |
| 3. Inattention | Did the patient have difficulty focusing attention, eg, being easily distractible or having difficulty keeping track of what was being said? |
| PLUS | |
| 4. Disorganized thinking | Was the patient’s thinking disorganized or incoherent, such as rambling or irrelevant conversation, unclear or illogical flow of ideas, or unpredictable switching from subject to subject? |
| 5. Altered level of consciousness | Would you rate the patient’s level of consciousness as (any of the following): – Vigilant (hyperalert) – Lethargic (drowsy, easily aroused) – Stupor (difficult to arouse) – Coma (unarousable) |
| *CAM shortened version worksheet. Adapted from: Inouye SK et al. Clarifying confusion: the Confusion Assessment Method. A new method for detection of delirium. Ann Intern Med. 1990;113:941-948; Inouye SK. Confusion Assessment Method (CAM): Training Manual and Coding Guide. Copyright 2003, Hospital Elder Life Program, LLC. | |
Arriving at a delirium diagnosis
The clinical presentation of delirium is characterized by acute—and reversible—impairment of cognition, attention, orientation, and memory, and disruption of the normal sleep/wake cycle. The Diagnostic and Statistical Manual of Mental Disorders (DSM-IV-TR) criteria for a delirium diagnosis include all of the following:
- disturbance of consciousness, with a reduced ability to focus, sustain, or shift attention
- change in cognition, or a perceptual disturbance, that is not accounted for by a preexisting or developing dementia
- rapid onset of cognitive impairment, with fluctuation likely during the course of the day
- evidence from the history, physical exam, or laboratory findings that the disturbed consciousness is a direct physiological consequence of a general medical condition.17
There are 3 basic types of delirium, each associated with a different psychomotor disturbance.
- Hyperactive delirium—the least common—is characterized by restlessness and agitation, and is therefore the easiest to diagnose.
- Hypoactive delirium is characterized by psychomotor retardation and hypoalertness. It is often misdiagnosed as depression, and has the poorest prognosis.
- Mixed delirium—the most common—is characterized by symptoms that fluctuate between hyper- and hypoactivity.18
CASE By lunchtime, Mr. D had awakened; however, he needed help with his meal. After eating, he slept for the rest of the day. At night, a nurse paged the resident to report that the patient’s blood pressure was 82/60 mm Hg and his heart rate was 115. The physician ordered an intravenous fluid bolus, which corrected the patient’s hypotension, but only temporarily.
The fluctuating nature of delirium—most notably, in patients’ level of alertness—is helpful in establishing a diagnosis. The history and physical exam are the gold standard tools, both for diagnosing delirium and identifying the underlying cause (TABLE 3).19,20 A review of the patient’s medications should be a key component of the medical history, as drugs—particularly those with anticholinergic properties—are often associated with delirium. Environmental shifts, including hospitalization and a disruption of the normal sleep/wake cycle, endocrine disorders, infection, and nutritional deficiencies are also potential causes of delirium, among others.
If history and physical exam fail to identify the underlying cause, laboratory testing, including complete blood count, complete metabolic profile, and urinalysis, should be done. Brain imaging is usually not needed for individuals with symptoms of delirium, but computed tomography (CT) may be indicated if a patient’s condition continues to deteriorate while the underlying cause remains unidentified.21 Electroencephalography (EEG) may be used to confirm a delirium diagnosis that’s uncertain, in a patient with underlying dementia, for instance. (In more than 16% of cases of delirium, the cause is unknown.22)
The most common structural abnormalities found in patients with delirium are brain atrophy and increased white matter lesions, as well as basal ganglia lesions.23 Single-photon emission CT (SPECT) shows a reduction of regional cerebral perfusion by 50%,24 while EEG shows slowing of the posterior dominant rhythm and increased generalized slow-wave activity.25
TABLE 3
A DELIRIUM mnemonic to get to the heart of the problem19,20
| Cause | Comment |
|---|---|
| Drugs | Drug classes: Anesthesia, anticholinergics, anticonvulsants, antiemetics, antihistamines, antihypertensives, antimicrobials, antipsychotics, benzodiazepines, corticosteroids, hypnotics, H2 blockers, muscle relaxants, NSAIDs, opioids, SSRIs, tricyclic antidepressants Drugs: digoxin, levodopa, lithium, theophylline OTCs: henbane, Jimson weed, mandrake, Atropa belladonna extract |
| Environmental | Change of environment, sensory deprivation, sleep deprivation |
| Endocrine | Hyperparathyroidism, hyper-/hypothyroidism |
| Low perfusion | MI, pulmonary embolism, CVA |
| Infection | Pneumonia, sepsis, systemic infection, UTI |
| Retention | Fecal impaction, urinary retention |
| Intoxication | Alcohol, illegal drugs/drug overdose |
| Undernutrition | Malnutrition, thiamin deficiency, vitamin B12 deficiency |
| Metabolic | Acid-base disturbances, fluid and electrolyte abnormalities, hepatic or uremic encephalopathy, hypercarbia, hyper-/hypoglycemia, hyperosmolality, hypoxia |
| Subdural | History of falls |
| CVA, cerebrovascular accident; MI, myocardial infarction; NSAIDs, nonsteroidal anti-inflammatory drugs; OTCs, over-the-counter agents; SSRIs, selective serotonin reuptake inhibitors; UTI, urinary tract infection. | |
Treating (or preventing) delirium: Start with these steps
Nonpharmacologic interventions are the mainstay of treatment for patients with delirium, and may also help to prevent the development of delirium in patients at risk. One key measure is to correct, or avoid, disruptions in the patient’s normal sleep/wake cycle—eg, restoring circadian rhythm by avoiding,
to the extent possible, awakening the patient at night for medication or vital signs. Preventing sensory deprivation, by ensuring that the patient’s eyeglasses and hearing aid are nearby and that there is a clock and calendar nearby and adequate light, is also helpful. Other key interventions (TABLE 4)26-28 include:
- limiting medications associated with delirium (and eliminating any nonessential medication)
- improving nutrition and ambulation
- correcting electrolyte and fluid disturbances
- treating infection
- involving family members in patient care
- ensuring that patients receive adequate pain management
- avoiding transfers (if the patient is hospitalized) and trying to secure a single room.
Several studies have evaluated the effectiveness of nonpharmacologic interventions in preventing or lowering the incidence of delirium. A large multicomponent delirium prevention study of patients >70 years on general medical units focused on managing risk factors. The interventions studied included (1) avoidance of sensory deprivation, (2) early mobilization, (3) treating dehydration, (4) implementing noise reduction strategies and sleep enhancement programs, and (5) avoiding the use of sleep medications. These interventions proved to be effective not only in lowering the incidence of delirium, but in shortening the duration of delirium in affected patients (NNT=20).27
One study found that proactively using a geriatric consultation model (ie, implementing standardized protocols for the management of 6 risk factors) for elderly hospitalized patients led to a reduction in the incidence of delirium by more than a third.26 Admission to a specialized geriatric unit is associated with a lower incidence of delirium compared with being hospitalized on a general medical unit.29
Reducing the incidence of postoperative delirium. Bright light therapy (a light intensity of 5000 lux with a distance from the light source of 100 cm), implemented postoperatively, may play a role in reducing the incidence of delirium, research suggests.30 Music may be helpful, as well. An RCT involving patients (>65 years) undergoing elective knee or hip surgery found that those who listened to classical music postoperatively had a lower incidence of delirium.31 Similarly, playing music in nursing homes has been shown to decrease aggressive behavior and agitation.32
TABLE 4
Helpful interventions in the hospital or at home26-28
|
When medication is needed, proceed with caution
None of the medications currently used to treat delirium are approved by the US Food and Drug Administration for this indication, and many of them have substantial side effects. Nonetheless, palliative or symptomatic treatment requires some form of sedation for agitated patients with delirium. Thus, it is necessary to strike a balance in order to manage the symptoms of delirium and avoid potential side effects (primarily, sedation). Overly sedating patients can confuse the clinical picture of delirium and make it difficult to differentiate between ongoing delirium and medication side effects. Medication should be started at a low, but frequent, dose to achieve an effective therapeutic level, after which a lower maintenance dose can be used until the cause of delirium is resolved.
Antipsychotics are the cornerstone of drug treatment
Haloperidol has traditionally been used to treat delirium33 and has proven effectiveness. However, it is associated with increased risk of extrapyramidal manifestations compared with atypical antipsychotics.
Atypical antipsychotics (olanzapine, risperidone, quetiapine) are increasingly being used to treat delirium because they have fewer extrapyramidal side effects.34 With the exception of olanzapine (available in intramuscular and oral disintegrating form), atypical antipsychotics are available only in oral form, which may limit their usefulness as a treatment for agitated, delirious patients.
Risperidone (at a dose ranging from 0.25 to 1 mg/d) and olanzapine (1.25 to 2.5 mg/d) have shown similar efficacy to haloperidol (0.75 to 1.5 mg/d) in both the prevention and treatment of delirium, but with fewer extrapyramidal side effects.35-39 Quetiapine, a second-generation antipsychotic, is widely used to treat inpatient delirium, although there are no large RCTs comparing it with placebo. One pilot study and another open-label trial found the drug to be beneficial for patients with delirium, with fewer extrapyramidal side effects than haloperidol.40,41
Do a risk-benefit analysis. The use of antipsychotics in elderly patients with delirium has been associated with increased morbidity and mortality. The incidence of stroke and death were higher for community-dwelling patients (NNH=100) and patients in long-term care (N=67) who received typical or atypical antipsychotics for 6 months compared with that of patients who did not receive any antipsychotics.42,43 Thus, a risk-benefit analysis should be done before prescribing antipsychotics for elderly patients. Both typical and atypical antipsychotics carry black box warnings of increased mortality rates in the elderly.
Other drugs for delirium? More research is needed
Cholinesterase inhibitors. Procholinergic agents would be expected to be helpful in treating delirium, as cholinergic deficiency has been implicated as a predisposing factor for delirium and medications with anticholinergic effects have been shown to induce delirium. However, several studies of cholinesterase inhibitors have not found this to be the case.44-47
Benzodiazepines. There is no evidence to support the use of benzodiazepines in the treatment of delirium, except when the delirium is related to alcohol withdrawal.48 When indicated, the use of a short-acting benzodiazepine such as lorazepam is preferred for elderly patients (vs long-acting agents like diazepam) because of its shorter half-life and better side effect profile.2 Drowsiness, ataxia, and disinhibition are common side effects of benzodiazepines.
Gabapentin. A pilot study conducted to assess the efficacy of gabapentin (900 mg/d) for the prevention of postoperative delirium found a significantly lower incidence of delirium among patients who received gabapentin compared with placebo. This may be associated with gabapentin’s opioid-sparing effect.49 Larger studies are needed to recommend for or against the use of gabapentin in patients receiving opiates.
Further study of the pathophysiology of delirium is needed, as well, to increase our ability to prevent and treat it.
CASE After receiving the IV fluid bolus, Mr. D became increasingly short of breath and required more oxygen to keep his oxygen saturation in the 90s. Labs were ordered during morning rounds, and the patient was found to have urosepsis. He was admitted to the ICU in septic shock, and was intubated and died several days later.
In retrospect, it was determined that Mr. D had developed hypoactive delirium brought on by the infection—and that his somnolence on the second postoperative day was not a sign of overmedication. Had this been recognized early on through the use of an appropriate screening tool, the outcome would likely have been more favorable.
CORRESPONDENCE Abdulraouf Ghandour, MD, Green Meadows Clinic University Physicians, 3217 Providence Road, Columbia, MO 65203; [email protected]
1. Casselman WG. Dictionary of Medical Derivations. The Real Meaning of Medical Terms. New York, NY: Informa Healthcare; 1998.
2. Kiely DK, Bergmann MA, Murphy KM, et al. Delirium among newly admitted postacute facility patients, prevalence, symptoms, and severity. J Gerontol Biol Sci Med Sci. 2003;58:M441-M445.
3. Inouye SK, Charpentier PA. Precipitating factors for delirium in hospitalized elderly persons. Predictive model and interrelationship with baseline vulnerability. JAMA. 1996;275:852-857.
4. Inouye SK. The dilemma of delirium: clinical and research controversies regarding diagnosis and evaluation of delirium in hospitalized elderly medical patients. Am J Med. 1994;97:278-288.
5. Pompei P, Foreman M, Rudberg M, et al. Delirium in hospitalized older persons: outcomes and predictors. J Am Geriatr Soc. 1994;42:809-815.
6. Kolbeinsson H, Jonsson A. Delirium and dementia in acute medical admissions of elderly patients in Iceland. Acta Psychiatr Scand. 1993;87:123-127.
7. Cole MG, Primeau FJ. Prognosis of delirium in elderly hospital patients. CMAJ. 1993;149:41-46.
8. Rahkonen T, Eloniemi-Sulkava U, Halonen P, et al. Delirium in the non-demented oldest old in the general population: risk factors and prognosis. Int J Geriatr Psychiatry. 2001;16:415-421.
9. Edlund A, Lundstrom M, Brannstrom B, et al. Delirium before and after operation for femoral neck fracture. J Am Geriatr Soc. 2001;49:1335-1340.
10. Andersson EM, Gustafson L, Hallberg IR. Acute confusional state in elderly orthopaedic patients: factors of importance for detection in nursing care. Int J Geriatr Psychiatry. 2001;16:7-17.
11. Inouye SK, Viscoli CM, Horwitz RI, et al. A predictive model for delirium in hospitalized elderly medical patients based on admission characteristics. Ann Intern Med. 1993;119:474-481.
12. Marcantonio ER, Juarez G, Goldman L, et al. The relationship of postoperative delirium with psychoactive medications. JAMA. 1994;272:1518-1522.
13. Marcantonio ER, Goldman L, Orav EJ, et al. The association of intraoperative factors with the development of postoperative delirium. Am J Med. 1998;105:380-384.
14. Tune L, Carr S, Hoag E, et al. Anticholinergic effects of drugs commonly prescribed for the elderly: potential means for assessing risk of delirium. Am J Psychiatry. 1992;149:1393-1394.
15. Flaherty JH, Shay K, Weir C, et al. The development of a mental status vital sign for use across the spectrum of care . J Am Med Dir Assoc. 2009;10:379-380.
16. Inouye SK, Van Dyck CH, Alessi CA, et al. Clarifying confusion: the Confusion Assessment Method. A new method for detection of delirium. Ann Intern Med. 1990;113:941-948.
17. Inouye SK. Confusion Assessment Method (CAM): Training Manual and Coding Guide. New Haven, Conn: Yale University School of Medicine; 2003.
18. Halter J, Ouslander J, Tinetti M, et al. Hazzard’s Geriatric Medicine and Gerontology. 6th ed. New York, NY: McGraw-Hill; 2009;648-658.
19. Eriksson S. Social and environmental contributants to delirium in the elderly. Dement Geriatr Cogn Disord. 1999;10:350-352.
20. Francis J, Martin D, Kapoor WN. A prospective study of delirium in hospitalized elderly. JAMA. 1990;263:1097-1101.
21. Francis J, Hilko EM, Kapoor WN. Acute mental change: when are head scans needed? Clin Res. 1991;39:103.-
22. Rudberg MA, Pompei P, Foreman MD, et al. The natural history of delirium in older hospitalized patients: a syndrome of heterogeneity. Age Ageing. 1997;26:169-174.
23. Soiza RL, Sharma V, Ferguson K, et al. Neuroimaging studies of delirium: a systematic review. J Psychosom Res. 2008;65:239-248.
24. Fong TG, Bogardus ST Jr, Daftary A, et al. Cerebral perfusion changes in older delirious patients using 99mTc HMPAO SPECT. J Gerontol A Biol Sci Med Sci. 2006;61:1294-1299.
25. Jacobson SA, Leuchter AF, Walter DO. Conventional and quantitative EEG in the diagnosis of delirium among the elderly. J Neurol Neurosurg Psychiatry. 1993;56:153-158.
26. Marcantonio ER, Flacker JM, Wright RJ, et al. Reducing delirium after hip fracture: a randomized trial. J Am Geriatr Soc. 2001;49:516-522.
27. Inouye SK, Bogardus ST Jr, Charpentier PA, et al. A multicomponent intervention to prevent delirium in hospitalized older patients. N Engl J Med. 1999;340:669-676.
28. Weber JB, Coverdale JH, Kunik ME. Delirium: current trends in prevention and treatment. Intern Med J. 2004;34:115-121.
29. Bo M, Martini B, Ruatta C, et al. Geriatric ward hospitalization reduced incidence delirium among older medical inpatients. Am J Geriatr Psychiatry. 2009;17:760-768.
30. Taguchi T, Yano M, Kido Y. Influence of bright light therapy on postoperative patients: a pilot study. Intensive Crit Care Nurs. 2007;23:289-297.
31. McCaffrey R, Locsin R. The effect of music listening on acute confusion and delirium in elders undergoing elective hip and knee surgery. J Clin Nurs. 2004;13:91-96.
32. Remington R. Calming music and hand massage with agitated elderly. Nurs Res. 2004;51:317-323.
33. Seitz DP, Gill SS, van Zyl LT. Antipsychotics in the treatment of delirium: a systematic review. J Clin Psychiatry. 2007;68:11-21.
34. Schwartz T, Masand PS. The role of atypical antipsychotics in the treatment of delirium. Psychosomatics. 2002;43:171-174.
35. Lonergan E, Britton AM, Luxenberg J, et al. Antipsychotics for delirium. Cochrane Database Syst Rev. 2007;(2):CD005594.-
36. Hu H, Deng W, Yang H. A prospective random control study comparison of olanzapine and haloperidol in senile delirium. Chongqing Med J. 2004;8:1234-1237.
37. Han CS, Kim YK. A double-blind trial of risperidone and haloperidol for the treatment of delirium. Psychosomatics. 2004;45:297-301.
38. Kim SW, Yoo JA, Lee SY, et al. Risperidone versus olanzapine for the treatment of delirium. Hum Psychopharmacol. 2010;25:298-302.
39. Prakanrattana U, Prapaitrakool S. Efficacy of risperidone for prevention of postoperative delirium in cardiac surgery. Anaesth Intensive Care. 2007;35:714-719.
40. Maneeton B, Maneeton N, Srisurapanont M. An open-label study of quetiapine for delirium. J Med Assoc Thai. 2007;90:2158-2163.
41. Devlin JW, Roberts RJ, Fong JJ, et al. Efficacy and safety of quetiapine in critically ill patients with delirium: a prospective, multicenter, randomized, double-blind, placebo-controlled pilot study. Crit Care Med. 2010;38:419-427.
42. Gill SS, Bronskill SE, Normand SL, et al. Antipsychotic drug use and mortality in older adults with dementia. Ann Intern Med. 2007;146:775-786.
43. Wang PS, Schneeweiss S, Avorn J, et al. Death in elderly users of conventional vs. atypical antipsychotic medications. N Engl J Med. 2005;353:2335-2341.
44. Liptzin B, Laki A, Garb JL, et al. Donepezil in the prevention and treatment of post-surgical delirium. Am J Geriatr Psychiatry. 2005;13:1100-1106.
45. Sampson EL, Raven PR, Ndhlovu PN, et al. A randomized, double-blind, placebo-controlled trial of donepezil hydrochloride (Aricept) for reducing the incidence of postoperative delirium after elective total hip replacement. Int J Geriatr Psychiatry. 2007;22:343-349.
46. Gamberini M, Bolliger D, Lurati Buse GA, et al. Rivastigmine for the prevention of postoperative delirium in elderly patients undergoing elective cardiac surgery—a randomized controlled trial. Crit Care Med. 2009;37:1762-1768.
47. Overshott R, Vernon M, Morris J, et al. Rivastigmine in the treatment of delirium in older people: a pilot study. Int Psychogeriatr. 2010;22:812-818.
48. Lonergan E, Luxenberg J, Areosa Sastre A. Benzodiazepines for delirium. Cochrane Database Syst Rev. 2009;(4):CD006379.-
49. Leung JM, Sands LP, Rico M, et al. Pilot clinical trial of gabapentin to decrease postoperative delirium in older patients. Neurology. 2006;67:1251-1253.
• Nonpharmacologic interventions are the mainstay of treatment for delirium. B
• When medication is needed, atypical antipsychotics are as effective as typical antipsychotics for treating delirium in elderly patients, and have fewer side effects. B
• Benzodiazepines should be avoided in elderly patients with delirium that is not associated with alcohol withdrawal. A
Strength of recommendation (SOR)
A Good-quality patient-oriented evidence
B Inconsistent or limited-quality patient-oriented evidence
C Consensus, usual practice, opinion, disease-oriented evidence, case series
CASE Mr. D, a 75-year-old patient with a history of hypertension and congestive heart failure, sustained a femoral neck fracture and was admitted to the hospital for surgery. He underwent open reduction and internal fixation and was doing well postoperatively, until Day 2—when his primary care physician made morning rounds and noted that Mr. D was somnolent. The nurse on duty assured the physician that Mr. D was fine and “was awake and alert earlier,” and attributed his somnolence to the oxycodone (10 mg) the patient was taking for pain. The physician ordered a reduction in dosage.
If Mr. D had been your patient, would you have considered other possible causes of his somnolence? Or do you think the physician’s action was sufficient?
Derived from Latin, the word delirium literally means “off the [ploughed] track.”1 Dozens of terms have been used to describe delirium, with acute confusion state, organic brain syndrome, acute brain syndrome, and toxic psychosis among them.
Delirium has been reported to occur in 15% to 30% of patients on general medical units,2 about 40% of postoperative patients, and up to 70% of terminally ill patients.3 The true prevalence is hard to determine, as up to 66% of cases may be missed.4
Delirium is being diagnosed more frequently, however—a likely result of a growing geriatric population, increased longevity, and greater awareness of the condition. Each year, an estimated 2.3 million US residents are affected, leading to prolonged hospitalization; poor functional outcomes; the development or worsening of dementia; increased nursing home placement; and a significant burden for families and the US health care system.5
Delirium is also associated with an increase in mortality.6,7 The mortality rate among hospitalized patients who develop delirium is reported to be 18%, rising to an estimated 47% within the first 3 months after discharge.6 Greater awareness of risk factors, rapid recognition of signs and symptoms of delirium, and early intervention—detailed in the text and tables that follow—will lead to better outcomes.
Assessing risk, evaluating mental status
In addition to advanced age, risk factors for delirium (TABLE 1)8-14 include alcohol use, brain dysfunction, comorbidities, hypertension, malignancy, anticholinergic medications, anemia, metabolic abnormalities, and male sex. In patients who, like Mr. D, have numerous risk factors, early—and frequent—evaluation of mental status is needed. One way to do this is to treat mental status as a vital sign, to be included in the assessment of every elderly patient.15
The Confusion Assessment Method, a quick and easy-to-use delirium screening tool (TABLE 2), has a sensitivity of 94% to 100% and a specificity of 90% to 95%.16,17 There are a number of other screening tools, including the widely used Mini-Mental State Exam (MMSE), as well as the Delirium Rating Scale, Delirium Symptom Interview, and Delirium Severity Scale.
TABLE 1
Risk factors for delirium8-14
Advanced age Alcohol use Brain dysfunction (dementia, epilepsy) Hypertension Male sex Malignancy Medications (mainly anticholinergic) Metabolic abnormalities:
Old age Preoperative anemia Preoperative metabolic abnormalities |
| BUN, blood urea nitrogen; Cr, creatinine; Na, sodium. |
TABLE 2
Screening for delirium: The Confusion Assessment Method*16,17
| Criteria | Evidence Yes to questions 1, 2, and 3 plus 4 or 5 (or both) suggests a delirium diagnosis |
|---|---|
| 1. Acute onset | Is there evidence of an acute change in mental status from the patient’s baseline? |
| 2. Fluctuating course | Did the abnormal behavior fluctuate during the day—ie, tend to come and go or increase and decrease in severity? |
| 3. Inattention | Did the patient have difficulty focusing attention, eg, being easily distractible or having difficulty keeping track of what was being said? |
| PLUS | |
| 4. Disorganized thinking | Was the patient’s thinking disorganized or incoherent, such as rambling or irrelevant conversation, unclear or illogical flow of ideas, or unpredictable switching from subject to subject? |
| 5. Altered level of consciousness | Would you rate the patient’s level of consciousness as (any of the following): – Vigilant (hyperalert) – Lethargic (drowsy, easily aroused) – Stupor (difficult to arouse) – Coma (unarousable) |
| *CAM shortened version worksheet. Adapted from: Inouye SK et al. Clarifying confusion: the Confusion Assessment Method. A new method for detection of delirium. Ann Intern Med. 1990;113:941-948; Inouye SK. Confusion Assessment Method (CAM): Training Manual and Coding Guide. Copyright 2003, Hospital Elder Life Program, LLC. | |
Arriving at a delirium diagnosis
The clinical presentation of delirium is characterized by acute—and reversible—impairment of cognition, attention, orientation, and memory, and disruption of the normal sleep/wake cycle. The Diagnostic and Statistical Manual of Mental Disorders (DSM-IV-TR) criteria for a delirium diagnosis include all of the following:
- disturbance of consciousness, with a reduced ability to focus, sustain, or shift attention
- change in cognition, or a perceptual disturbance, that is not accounted for by a preexisting or developing dementia
- rapid onset of cognitive impairment, with fluctuation likely during the course of the day
- evidence from the history, physical exam, or laboratory findings that the disturbed consciousness is a direct physiological consequence of a general medical condition.17
There are 3 basic types of delirium, each associated with a different psychomotor disturbance.
- Hyperactive delirium—the least common—is characterized by restlessness and agitation, and is therefore the easiest to diagnose.
- Hypoactive delirium is characterized by psychomotor retardation and hypoalertness. It is often misdiagnosed as depression, and has the poorest prognosis.
- Mixed delirium—the most common—is characterized by symptoms that fluctuate between hyper- and hypoactivity.18
CASE By lunchtime, Mr. D had awakened; however, he needed help with his meal. After eating, he slept for the rest of the day. At night, a nurse paged the resident to report that the patient’s blood pressure was 82/60 mm Hg and his heart rate was 115. The physician ordered an intravenous fluid bolus, which corrected the patient’s hypotension, but only temporarily.
The fluctuating nature of delirium—most notably, in patients’ level of alertness—is helpful in establishing a diagnosis. The history and physical exam are the gold standard tools, both for diagnosing delirium and identifying the underlying cause (TABLE 3).19,20 A review of the patient’s medications should be a key component of the medical history, as drugs—particularly those with anticholinergic properties—are often associated with delirium. Environmental shifts, including hospitalization and a disruption of the normal sleep/wake cycle, endocrine disorders, infection, and nutritional deficiencies are also potential causes of delirium, among others.
If history and physical exam fail to identify the underlying cause, laboratory testing, including complete blood count, complete metabolic profile, and urinalysis, should be done. Brain imaging is usually not needed for individuals with symptoms of delirium, but computed tomography (CT) may be indicated if a patient’s condition continues to deteriorate while the underlying cause remains unidentified.21 Electroencephalography (EEG) may be used to confirm a delirium diagnosis that’s uncertain, in a patient with underlying dementia, for instance. (In more than 16% of cases of delirium, the cause is unknown.22)
The most common structural abnormalities found in patients with delirium are brain atrophy and increased white matter lesions, as well as basal ganglia lesions.23 Single-photon emission CT (SPECT) shows a reduction of regional cerebral perfusion by 50%,24 while EEG shows slowing of the posterior dominant rhythm and increased generalized slow-wave activity.25
TABLE 3
A DELIRIUM mnemonic to get to the heart of the problem19,20
| Cause | Comment |
|---|---|
| Drugs | Drug classes: Anesthesia, anticholinergics, anticonvulsants, antiemetics, antihistamines, antihypertensives, antimicrobials, antipsychotics, benzodiazepines, corticosteroids, hypnotics, H2 blockers, muscle relaxants, NSAIDs, opioids, SSRIs, tricyclic antidepressants Drugs: digoxin, levodopa, lithium, theophylline OTCs: henbane, Jimson weed, mandrake, Atropa belladonna extract |
| Environmental | Change of environment, sensory deprivation, sleep deprivation |
| Endocrine | Hyperparathyroidism, hyper-/hypothyroidism |
| Low perfusion | MI, pulmonary embolism, CVA |
| Infection | Pneumonia, sepsis, systemic infection, UTI |
| Retention | Fecal impaction, urinary retention |
| Intoxication | Alcohol, illegal drugs/drug overdose |
| Undernutrition | Malnutrition, thiamin deficiency, vitamin B12 deficiency |
| Metabolic | Acid-base disturbances, fluid and electrolyte abnormalities, hepatic or uremic encephalopathy, hypercarbia, hyper-/hypoglycemia, hyperosmolality, hypoxia |
| Subdural | History of falls |
| CVA, cerebrovascular accident; MI, myocardial infarction; NSAIDs, nonsteroidal anti-inflammatory drugs; OTCs, over-the-counter agents; SSRIs, selective serotonin reuptake inhibitors; UTI, urinary tract infection. | |
Treating (or preventing) delirium: Start with these steps
Nonpharmacologic interventions are the mainstay of treatment for patients with delirium, and may also help to prevent the development of delirium in patients at risk. One key measure is to correct, or avoid, disruptions in the patient’s normal sleep/wake cycle—eg, restoring circadian rhythm by avoiding,
to the extent possible, awakening the patient at night for medication or vital signs. Preventing sensory deprivation, by ensuring that the patient’s eyeglasses and hearing aid are nearby and that there is a clock and calendar nearby and adequate light, is also helpful. Other key interventions (TABLE 4)26-28 include:
- limiting medications associated with delirium (and eliminating any nonessential medication)
- improving nutrition and ambulation
- correcting electrolyte and fluid disturbances
- treating infection
- involving family members in patient care
- ensuring that patients receive adequate pain management
- avoiding transfers (if the patient is hospitalized) and trying to secure a single room.
Several studies have evaluated the effectiveness of nonpharmacologic interventions in preventing or lowering the incidence of delirium. A large multicomponent delirium prevention study of patients >70 years on general medical units focused on managing risk factors. The interventions studied included (1) avoidance of sensory deprivation, (2) early mobilization, (3) treating dehydration, (4) implementing noise reduction strategies and sleep enhancement programs, and (5) avoiding the use of sleep medications. These interventions proved to be effective not only in lowering the incidence of delirium, but in shortening the duration of delirium in affected patients (NNT=20).27
One study found that proactively using a geriatric consultation model (ie, implementing standardized protocols for the management of 6 risk factors) for elderly hospitalized patients led to a reduction in the incidence of delirium by more than a third.26 Admission to a specialized geriatric unit is associated with a lower incidence of delirium compared with being hospitalized on a general medical unit.29
Reducing the incidence of postoperative delirium. Bright light therapy (a light intensity of 5000 lux with a distance from the light source of 100 cm), implemented postoperatively, may play a role in reducing the incidence of delirium, research suggests.30 Music may be helpful, as well. An RCT involving patients (>65 years) undergoing elective knee or hip surgery found that those who listened to classical music postoperatively had a lower incidence of delirium.31 Similarly, playing music in nursing homes has been shown to decrease aggressive behavior and agitation.32
TABLE 4
Helpful interventions in the hospital or at home26-28
|
When medication is needed, proceed with caution
None of the medications currently used to treat delirium are approved by the US Food and Drug Administration for this indication, and many of them have substantial side effects. Nonetheless, palliative or symptomatic treatment requires some form of sedation for agitated patients with delirium. Thus, it is necessary to strike a balance in order to manage the symptoms of delirium and avoid potential side effects (primarily, sedation). Overly sedating patients can confuse the clinical picture of delirium and make it difficult to differentiate between ongoing delirium and medication side effects. Medication should be started at a low, but frequent, dose to achieve an effective therapeutic level, after which a lower maintenance dose can be used until the cause of delirium is resolved.
Antipsychotics are the cornerstone of drug treatment
Haloperidol has traditionally been used to treat delirium33 and has proven effectiveness. However, it is associated with increased risk of extrapyramidal manifestations compared with atypical antipsychotics.
Atypical antipsychotics (olanzapine, risperidone, quetiapine) are increasingly being used to treat delirium because they have fewer extrapyramidal side effects.34 With the exception of olanzapine (available in intramuscular and oral disintegrating form), atypical antipsychotics are available only in oral form, which may limit their usefulness as a treatment for agitated, delirious patients.
Risperidone (at a dose ranging from 0.25 to 1 mg/d) and olanzapine (1.25 to 2.5 mg/d) have shown similar efficacy to haloperidol (0.75 to 1.5 mg/d) in both the prevention and treatment of delirium, but with fewer extrapyramidal side effects.35-39 Quetiapine, a second-generation antipsychotic, is widely used to treat inpatient delirium, although there are no large RCTs comparing it with placebo. One pilot study and another open-label trial found the drug to be beneficial for patients with delirium, with fewer extrapyramidal side effects than haloperidol.40,41
Do a risk-benefit analysis. The use of antipsychotics in elderly patients with delirium has been associated with increased morbidity and mortality. The incidence of stroke and death were higher for community-dwelling patients (NNH=100) and patients in long-term care (N=67) who received typical or atypical antipsychotics for 6 months compared with that of patients who did not receive any antipsychotics.42,43 Thus, a risk-benefit analysis should be done before prescribing antipsychotics for elderly patients. Both typical and atypical antipsychotics carry black box warnings of increased mortality rates in the elderly.
Other drugs for delirium? More research is needed
Cholinesterase inhibitors. Procholinergic agents would be expected to be helpful in treating delirium, as cholinergic deficiency has been implicated as a predisposing factor for delirium and medications with anticholinergic effects have been shown to induce delirium. However, several studies of cholinesterase inhibitors have not found this to be the case.44-47
Benzodiazepines. There is no evidence to support the use of benzodiazepines in the treatment of delirium, except when the delirium is related to alcohol withdrawal.48 When indicated, the use of a short-acting benzodiazepine such as lorazepam is preferred for elderly patients (vs long-acting agents like diazepam) because of its shorter half-life and better side effect profile.2 Drowsiness, ataxia, and disinhibition are common side effects of benzodiazepines.
Gabapentin. A pilot study conducted to assess the efficacy of gabapentin (900 mg/d) for the prevention of postoperative delirium found a significantly lower incidence of delirium among patients who received gabapentin compared with placebo. This may be associated with gabapentin’s opioid-sparing effect.49 Larger studies are needed to recommend for or against the use of gabapentin in patients receiving opiates.
Further study of the pathophysiology of delirium is needed, as well, to increase our ability to prevent and treat it.
CASE After receiving the IV fluid bolus, Mr. D became increasingly short of breath and required more oxygen to keep his oxygen saturation in the 90s. Labs were ordered during morning rounds, and the patient was found to have urosepsis. He was admitted to the ICU in septic shock, and was intubated and died several days later.
In retrospect, it was determined that Mr. D had developed hypoactive delirium brought on by the infection—and that his somnolence on the second postoperative day was not a sign of overmedication. Had this been recognized early on through the use of an appropriate screening tool, the outcome would likely have been more favorable.
CORRESPONDENCE Abdulraouf Ghandour, MD, Green Meadows Clinic University Physicians, 3217 Providence Road, Columbia, MO 65203; [email protected]
1. Casselman WG. Dictionary of Medical Derivations. The Real Meaning of Medical Terms. New York, NY: Informa Healthcare; 1998.
2. Kiely DK, Bergmann MA, Murphy KM, et al. Delirium among newly admitted postacute facility patients, prevalence, symptoms, and severity. J Gerontol Biol Sci Med Sci. 2003;58:M441-M445.
3. Inouye SK, Charpentier PA. Precipitating factors for delirium in hospitalized elderly persons. Predictive model and interrelationship with baseline vulnerability. JAMA. 1996;275:852-857.
4. Inouye SK. The dilemma of delirium: clinical and research controversies regarding diagnosis and evaluation of delirium in hospitalized elderly medical patients. Am J Med. 1994;97:278-288.
5. Pompei P, Foreman M, Rudberg M, et al. Delirium in hospitalized older persons: outcomes and predictors. J Am Geriatr Soc. 1994;42:809-815.
6. Kolbeinsson H, Jonsson A. Delirium and dementia in acute medical admissions of elderly patients in Iceland. Acta Psychiatr Scand. 1993;87:123-127.
7. Cole MG, Primeau FJ. Prognosis of delirium in elderly hospital patients. CMAJ. 1993;149:41-46.
8. Rahkonen T, Eloniemi-Sulkava U, Halonen P, et al. Delirium in the non-demented oldest old in the general population: risk factors and prognosis. Int J Geriatr Psychiatry. 2001;16:415-421.
9. Edlund A, Lundstrom M, Brannstrom B, et al. Delirium before and after operation for femoral neck fracture. J Am Geriatr Soc. 2001;49:1335-1340.
10. Andersson EM, Gustafson L, Hallberg IR. Acute confusional state in elderly orthopaedic patients: factors of importance for detection in nursing care. Int J Geriatr Psychiatry. 2001;16:7-17.
11. Inouye SK, Viscoli CM, Horwitz RI, et al. A predictive model for delirium in hospitalized elderly medical patients based on admission characteristics. Ann Intern Med. 1993;119:474-481.
12. Marcantonio ER, Juarez G, Goldman L, et al. The relationship of postoperative delirium with psychoactive medications. JAMA. 1994;272:1518-1522.
13. Marcantonio ER, Goldman L, Orav EJ, et al. The association of intraoperative factors with the development of postoperative delirium. Am J Med. 1998;105:380-384.
14. Tune L, Carr S, Hoag E, et al. Anticholinergic effects of drugs commonly prescribed for the elderly: potential means for assessing risk of delirium. Am J Psychiatry. 1992;149:1393-1394.
15. Flaherty JH, Shay K, Weir C, et al. The development of a mental status vital sign for use across the spectrum of care . J Am Med Dir Assoc. 2009;10:379-380.
16. Inouye SK, Van Dyck CH, Alessi CA, et al. Clarifying confusion: the Confusion Assessment Method. A new method for detection of delirium. Ann Intern Med. 1990;113:941-948.
17. Inouye SK. Confusion Assessment Method (CAM): Training Manual and Coding Guide. New Haven, Conn: Yale University School of Medicine; 2003.
18. Halter J, Ouslander J, Tinetti M, et al. Hazzard’s Geriatric Medicine and Gerontology. 6th ed. New York, NY: McGraw-Hill; 2009;648-658.
19. Eriksson S. Social and environmental contributants to delirium in the elderly. Dement Geriatr Cogn Disord. 1999;10:350-352.
20. Francis J, Martin D, Kapoor WN. A prospective study of delirium in hospitalized elderly. JAMA. 1990;263:1097-1101.
21. Francis J, Hilko EM, Kapoor WN. Acute mental change: when are head scans needed? Clin Res. 1991;39:103.-
22. Rudberg MA, Pompei P, Foreman MD, et al. The natural history of delirium in older hospitalized patients: a syndrome of heterogeneity. Age Ageing. 1997;26:169-174.
23. Soiza RL, Sharma V, Ferguson K, et al. Neuroimaging studies of delirium: a systematic review. J Psychosom Res. 2008;65:239-248.
24. Fong TG, Bogardus ST Jr, Daftary A, et al. Cerebral perfusion changes in older delirious patients using 99mTc HMPAO SPECT. J Gerontol A Biol Sci Med Sci. 2006;61:1294-1299.
25. Jacobson SA, Leuchter AF, Walter DO. Conventional and quantitative EEG in the diagnosis of delirium among the elderly. J Neurol Neurosurg Psychiatry. 1993;56:153-158.
26. Marcantonio ER, Flacker JM, Wright RJ, et al. Reducing delirium after hip fracture: a randomized trial. J Am Geriatr Soc. 2001;49:516-522.
27. Inouye SK, Bogardus ST Jr, Charpentier PA, et al. A multicomponent intervention to prevent delirium in hospitalized older patients. N Engl J Med. 1999;340:669-676.
28. Weber JB, Coverdale JH, Kunik ME. Delirium: current trends in prevention and treatment. Intern Med J. 2004;34:115-121.
29. Bo M, Martini B, Ruatta C, et al. Geriatric ward hospitalization reduced incidence delirium among older medical inpatients. Am J Geriatr Psychiatry. 2009;17:760-768.
30. Taguchi T, Yano M, Kido Y. Influence of bright light therapy on postoperative patients: a pilot study. Intensive Crit Care Nurs. 2007;23:289-297.
31. McCaffrey R, Locsin R. The effect of music listening on acute confusion and delirium in elders undergoing elective hip and knee surgery. J Clin Nurs. 2004;13:91-96.
32. Remington R. Calming music and hand massage with agitated elderly. Nurs Res. 2004;51:317-323.
33. Seitz DP, Gill SS, van Zyl LT. Antipsychotics in the treatment of delirium: a systematic review. J Clin Psychiatry. 2007;68:11-21.
34. Schwartz T, Masand PS. The role of atypical antipsychotics in the treatment of delirium. Psychosomatics. 2002;43:171-174.
35. Lonergan E, Britton AM, Luxenberg J, et al. Antipsychotics for delirium. Cochrane Database Syst Rev. 2007;(2):CD005594.-
36. Hu H, Deng W, Yang H. A prospective random control study comparison of olanzapine and haloperidol in senile delirium. Chongqing Med J. 2004;8:1234-1237.
37. Han CS, Kim YK. A double-blind trial of risperidone and haloperidol for the treatment of delirium. Psychosomatics. 2004;45:297-301.
38. Kim SW, Yoo JA, Lee SY, et al. Risperidone versus olanzapine for the treatment of delirium. Hum Psychopharmacol. 2010;25:298-302.
39. Prakanrattana U, Prapaitrakool S. Efficacy of risperidone for prevention of postoperative delirium in cardiac surgery. Anaesth Intensive Care. 2007;35:714-719.
40. Maneeton B, Maneeton N, Srisurapanont M. An open-label study of quetiapine for delirium. J Med Assoc Thai. 2007;90:2158-2163.
41. Devlin JW, Roberts RJ, Fong JJ, et al. Efficacy and safety of quetiapine in critically ill patients with delirium: a prospective, multicenter, randomized, double-blind, placebo-controlled pilot study. Crit Care Med. 2010;38:419-427.
42. Gill SS, Bronskill SE, Normand SL, et al. Antipsychotic drug use and mortality in older adults with dementia. Ann Intern Med. 2007;146:775-786.
43. Wang PS, Schneeweiss S, Avorn J, et al. Death in elderly users of conventional vs. atypical antipsychotic medications. N Engl J Med. 2005;353:2335-2341.
44. Liptzin B, Laki A, Garb JL, et al. Donepezil in the prevention and treatment of post-surgical delirium. Am J Geriatr Psychiatry. 2005;13:1100-1106.
45. Sampson EL, Raven PR, Ndhlovu PN, et al. A randomized, double-blind, placebo-controlled trial of donepezil hydrochloride (Aricept) for reducing the incidence of postoperative delirium after elective total hip replacement. Int J Geriatr Psychiatry. 2007;22:343-349.
46. Gamberini M, Bolliger D, Lurati Buse GA, et al. Rivastigmine for the prevention of postoperative delirium in elderly patients undergoing elective cardiac surgery—a randomized controlled trial. Crit Care Med. 2009;37:1762-1768.
47. Overshott R, Vernon M, Morris J, et al. Rivastigmine in the treatment of delirium in older people: a pilot study. Int Psychogeriatr. 2010;22:812-818.
48. Lonergan E, Luxenberg J, Areosa Sastre A. Benzodiazepines for delirium. Cochrane Database Syst Rev. 2009;(4):CD006379.-
49. Leung JM, Sands LP, Rico M, et al. Pilot clinical trial of gabapentin to decrease postoperative delirium in older patients. Neurology. 2006;67:1251-1253.
How best to address these common movement disorders
• Initiate neuroprotective therapy with a monoamine oxidase B inhibitor to slow the progression of Parkinson’s disease. With onset of functional impairment, give levodopa at the lowest effective dose. A
• Give propranolol for essential tremor causing a patient distress, starting at 20 to 40 mg twice daily and increasing the dose (to a maximum of 320 mg/d) until relief is achieved. B
• Consider giving a dopamine receptor blocker for Tourette syndrome or other tic disorder; alternative agents are clonidine or a newer agent, tetrabenazine. B
Strength of recommendation (SOR)
A Good-quality patient-oriented evidence
B Inconsistent or limited-quality patient-oriented evidence
C Consensus, usual practice, opinion, disease-oriented evidence, case series
Movement disorders often require consultation with a neurologist, and a working knowledge of established and novel treatments can set the stage for optimal long-term cooperative management.1 In this article, we review therapeutic options for common movement disorders, including hypokinetic, hyperkinetic, and dyskinetic disturbances.
Parkinson’s disease treatment: MAO-B inhibitor, levodopa are mainstays
Parkinson’s disease, the most common hypokinetic movement disorder, is a chronic, progressive, neurodegenerative disease. It affects 1% of individuals older than 65 years and 4% to 5% of individuals older than 85 years. Its cardinal symptoms are resting tremor, bradykinesia, rigidity, a flexed posture, and loss of postural reflexes. Resting tremor, referred to as “pill rolling” tremor, is 4 to 6 Hz and usually begins unilaterally.2,3 Associated symptoms can include dystonia, dementia, psychiatric disorders, sleep disorders, and autonomic symptoms.
Neuroprotective therapy is used to slow the progression of the disease, particularly in its early stage. The monoamine oxidase B (MAO-B) inhibitor selegiline has proven effective in this regard2 (strength of recommendation [SOR]: A). In randomized controlled studies, selegiline has delayed the need for levodopa for 9 to 12 months4 (SOR: A). Another MAO-B inhibitor, rasagiline, has demonstrated neuroprotective effects as well5 (SOR: B). These medications may also be used with levodopa for symptom control and as adjuvant therapy in patients with motor fluctuations.2 A conventional dose of selegiline is 10 mg/d (5 mg at breakfast; 5 mg at lunch). Rasagiline is given at 1 mg/d. Concomitant use of ciprofloxacin or other CYP1A2 inhibitors limits its effectiveness.6,7
Symptomatic therapy is indicated at the onset of functional impairment. The dopamine precursor levodopa is the most widely used and effective drug for Parkinson’s disease symptoms, especially bradykinesia and rigidity. Use the lowest possible dose to control symptoms (eg, 100 mg twice daily) and protect against motor complications of the drug7-9 (SOR: A). To prevent conversion of levodopa to dopamine outside the blood-brain barrier, combine it with the decarboxylase inhibitor carbidopa. Dietary restriction of proteins may be needed, because amino acids can interfere with the absorption of levodopa.
Especially with prolonged use, levodopa can cause disturbing adverse effects, such as nausea, vomiting, psychosis, cardiac arrhythmia, and orthostatic hypotension. Dyskinesias and motor fluctuations are complications of long-term treatment and are irreversible. Adding a cathecol-O-methyltransferase (COMT) inhibitor, such as entacapone, to increase levodopa’s effectiveness has been shown to reduce motor fluctuations2,3,10 (SOR: B). Dopamine agonists such as bromocriptine, ropinirole, and pramipexole used in early Parkinson’s disease can also reduce dyskinesias and motor fluctuations. Dopamine agonists may be preferred to levodopa in early Parkinson’s disease because they are better tolerated and cause fewer adverse effects. Or they may be used as adjuncts for patients whose response to levodopa is deteriorating or fluctuating3,7,8 (SOR: B). In advanced disease, motor complications can also be managed by augmenting levodopa therapy with a dopamine agonist, MAO-B inhibitor, or COMT inhibitor7,8 (SOR: A).
Anticholinergics, mainly benztropine and trihexyphenidyl, may be used as symptomatic treatment, especially in young people with early Parkinson’s disease and severe tremor. However, they are not the first drugs of choice due to limited efficacy and the potential for neuropsychiatric side effects8 (SOR: C). Amantadine can reduce dyskinesia in people with advanced Parkinson’s disease8 (SOR: C). For patients who have Parkinson’s disease with severe motor complications, intermittent apomorphine injections can help reduce “off time” periods in the daily treatment cycle when the efficacy of drugs wanes9 (SOR: B).
Deep brain stimulation of the subthalamic nucleus has only SOR C support for reducing dyskinesias and off time.9
Treating nonmotor symptoms of Parkinson’s disease can be challenging. For dementia in these patients, consider cholinesterase inhibitors6,8 (SOR: C). For depression, selective serotonin reuptake inhibitors are effective6,8,9 (SOR: C). For psychosis, preferred agents are low-dose clozapine or quetiapine6,8-10 (SOR: C). Plan for supportive and symptomatic management of constipation, dysphagia, sialorrhea, orthostatic hypotension, sleep disturbances, and urinary urgency.2,3
Tremor
Tremor is a common form of hyperkinesia, presenting either as a primary disorder or as a symptom of another condition.11 By definition, it is a rhythmical, involuntary, oscillatory movement of 1 or more body parts. Tremors are classified as rest or action tremors, with the latter being further categorized as postural (occurring while the patient maintains a position against gravity) or kinetic (occurring during voluntary movement).2,10
Physiologic tremor: Pharmacologic Tx is usually not needed
Physiologic tremor is benign, high frequency (8-12 Hz), low amplitude, and postural. An exaggerated form of this tremor may result from anxiety, hyperthyroidism, pheochromocytoma, hypoglycemia, excessive caffeine consumption, fever, withdrawal from opioids and sedatives, and some medications. No drug treatment is necessary unless symptoms become bothersome. Correct the underlying cause or have the patient avoid the triggering factor, and offer reassurance that the condition is not pathological or progressive.2,12 For anxiety, consider cognitive-behavioral/relaxation therapy or benzodiazepines (if tremor did not result from withdrawal of benzodiazepines) or beta-adrenergic antagonists (eg, propranolol).12,13
Essential tremor: Try propranolol or primidone first
Essential tremor (ET) is the most common movement disorder. It often results in functional disability and leads to many physical and emotional difficulties. ET is bilateral, usually symmetric (although mild asymmetry is possible), and postural or kinetic, typically affecting hands and forearms. The frequency of ET is 4 to 12 Hz. Cranial musculature may be involved in 30% of cases, affecting the head and voice.3 Prevalence ranges from 4 to 40 cases per 1000 people. The age-adjusted incidence is 17.5/100,000 per year; it peaks during the teen years and the fifth decade.2,3
Autosomal dominant type of inheritance is common, and a family history of ET is often present, particularly with younger patients. The differential diagnosis includes Parkinson’s disease tremor; dystonic, cerebellar, rubral, and psychogenic tremors; and asterixis.3 Unlike ET, many of these disorders have associated neurologic, psychiatric, or systemic signs.
Treatment with propranolol or primidone is indicated if ET causes functional impairment or social or emotional problems for the patient.2,3,10,13 Both propranolol and primidone reduce limb tremor2,10,13 (SOR: B), but only propranolol is approved by the US Food and Drug Administration (FDA) for treatment of ET. Propranolol is more effective for hand and forearm tremor than for head and voice tremor. Start propranolol at 20 to 40 mg twice a day and increase the dose as needed to achieve symptom relief.14
A maintenance dose of 240 to 320 mg/d may be needed. Major adverse effects are fatigue, sedation, depression, and erectile dysfunction. Contraindications to propranolol include asthma, second-degree atrioventricular block, and insulin-dependent diabetes.
If starting with primidone alone, prescribe at a dose <25 mg at bedtime and increase the dose slowly over several weeks to prevent onset of nausea, vomiting, sedation, confusion, or ataxia. The maximum allowable dose is 750 mg/d in 3 divided doses.10 Primidone and propranolol may be used in combination to treat limb tremor when monotherapy is insufficient (SOR: B).13
Thirty percent of patients with ET will not respond to propranolol or primidone. An alternative choice is the anticonvulsant gabapentin10,12-14 (SOR: C). However, clinical experience with it is limited. Lethargy, fatigue, decreased libido, dizziness, nervousness, and shortness of breath are adverse effects of gabapentin; they are usually mild and tolerable.13 Topiramate is another option that seems to be as effective as gabapentin10,13 (SOR: C), but studies of long-term outcomes are lacking. Topiramate’s side effects include weight loss and paresthesias. Additionally, alprazolam, clonazepam, clozapine, olanzapine, atenolol, sotalol, nadolol, and nimodipine may reduce limb tremor2 (SOR: C). Alcohol reduces tremor amplitude in 50% to 90% of patients, but tremor may worsen after the effect of alcohol has worn off.15
For patients with essential hand tremor that fails to respond to oral agents, consider botulinum toxin A16 (SOR: B). However, it is also associated with dose-dependent hand weakness16 (SOR: C). Botulinum toxin may reduce head and voice tremor16 (SOR: C), but hoarseness and swallowing difficulties may occur after use for voice tremor.16
Invasive therapies may benefit patients with refractory tremor. Deep brain stimulation and thalamotomy are highly effective in reducing limb tremor13 (SOR: C). Each carries a small risk of major complications. Some deep brain stimulation adverse events may resolve with time. Other adverse events may resolve with adjustment of stimulator settings. No evidence exists for surgical treatment for voice and head tremor or for gamma-knife thalamotomy.13
Drug-induced tremor
Drugs with the potential to cause postural tremor, intention tremor, or rest tremor include the following: 15
- alcohol (chronic)
- amiodarone
- amphetamines
- beta-adrenergic agonists
- caffeine
- calcitonin
- carbamazepine
- cocaine
- cyclosporine
- dopamine
- lithium
- metoclopramide
- neuroleptics
- procainamide
- steroids
- theophylline
- thyroid hormones
- tricyclic antidepressants
- trifluoperazine
- valproic acid
With drug-induced tremor, carefully evaluate a patient’s need for the drug. Discontinue the offending agent if possible, or try lowering the dose.
Psychogenic tremor: A history of somatization is a clue
Psychogenic tremor can occur at rest or during postural or kinetic movement. Clinical features include an abrupt onset, a static course, spontaneous remission, and unclassifiable tremors.17 Psychogenic tremor increases under direct observation and decreases with distraction. Patients with psychogenic tremor often have a history of somatization.18 Electrophysiologic testing can help confirm the diagnosis. If remission does not occur spontaneously, patients may find relief with psychotherapy or placebo.19
Tic disorders: Opt for dopamine receptor blockers
Tics are involuntary or semivoluntary movements or sounds that are sudden, brief, intermittent, repetitive, nonrhythmic, unpredictable, and purposeless. Tics can occur in any part of the body.20
The most common tic disorder is Tourette syndrome—a combination of motor and phonic tics with onset before age 21. It affects approximately 5 to 10 children out of 10,000. Boys are more commonly affected than girls. Attention deficit hyperactivity disorder frequently accompanies this syndrome.2
The goal of treatment with any tic disorder is to improve social functioning, self-esteem, and quality of life. Education and support of patients is important. Tic disorders, including Tourette, rarely require drugs. But if tics become too distressing, first-line treatment would be a dopamine modulator, tetrabenazine, or clonidine. Randomized controlled trials with various neuroleptics have revealed dramatic reductions in tic severity. However, many patients do not tolerate the acute adverse effects (most commonly sedation, weight gain, depression, lethargy, and akathisia), and prolonged treatment confers a small risk of tardive dyskinesia. Behavioral therapy is an important part of management.20
Dopamine-receptor blocking drugs such as haloperidol, pimozide, and fluphenazine are the most effective treatment for tics20 (SOR: B). Tetrabenazine is a promising new dopamine-depleting drug; controlled trials are ongoing2,20 (SOR: B). Clonidine, an alpha 2-adrenergic agonist, is useful in treating patients with Tourette syndrome, helping to improve sleep and attention2,21 (SOR: C). Medically refractory motor and disabling phonic tics such as coprolalia can be ameliorated by botulinum toxin injections21 (SOR: B). Deep brain stimulation is being used at an increasing rate for medically refractory tics in Tourette syndrome21 (SOR: B).
Restless legs syndrome: Dopamine agonists are preferred
Restless legs syndrome (RLS) is a disorder characterized by sensory symptoms and motor disturbances of the legs, mainly during rest. Treatment may not be necessary for patients with mild or sporadic symptoms. For moderate to severe RLS with significant impairment, dopamine agonists are the preferred agents22 (SOR: A). RLS can also occur secondary to such conditions as iron deficiency and uremia, and correction of the underlying disorder is the goal. Prescribe iron replacement for patients with a ferritin level <50 ng/mL22 (SOR: C). Medications known to cause or exacerbate the symptoms of RLS are anti-dopaminergic agents (such as neuroleptics), diphenhydramine, tricyclic antidepressants, alcohol, caffeine, lithium, and beta-blockers. If a patient is taking medications that exacerbate symptoms of RLS, discontinue them and use appropriate substitutes22 (SOR: C).
Myoclonus: Clonazepam for essential disorder
Myoclonus is a brief, sudden, shock-like movement caused by involuntary muscle contractions or lapse of muscle contraction (asterixis). Given the complex origins of myoclonus, multiple drugs may be needed. Essential myoclonus is disabling and can be treated with clonazepam. Start with 0.25 mg orally twice daily, and increase the dosage over 3 days to 1 mg/d23 (SOR: C). Most cases of myoclonus are secondary due to drugs such as lithium, toxins, advanced liver disease, infections including human immunodeficiency virus, dementia, and brain lesions. Treatment should also address the underlying disorder.2,23
Chorea
Chorea is an abnormal involuntary movement disorder described as “a state of excessive, spontaneous movements, irregularly timed, nonrepetitive, randomly distributed, and abrupt in character.”24
Treatment of chorea is symptomatic, aiming to reduce morbidity and prevent complications. Haloperidol and fluphenazine are effective but can impair voluntary movements2,10,25 (SOR: C). The dopamine-depleting drugs reserpine and tetrabenazine are also effective2,10,25 (SOR: C). GABAergic drugs, such as clonazepam, gabapentin, and valproate, can be used adjunctively.10,25
Dystonia
Dystonia is a syndrome involving sustained contractions of opposing muscles that cause twisting, repetitive movements and abnormal postures. Primary dystonia can be treated successfully with high doses of trihexyphenidyl alone, starting with 1 mg orally per day and increasing gradually to 6 to 80 mg/d until symptoms are controlled; or in combination with baclofen, starting with 10 mg orally once daily and increasing to a maximum dose of 30 to 120 mg/d1,2 (SOR: C).
Consider botulinum neurotoxin injection for focal upper extremity dystonia and adductor spasmodic dysphonia16 (SOR: B).
Ataxia
Ataxia is an unsteady gait associated with cerebellar dysfunction, proprioceptive defects, or both. Ataxia may be primary (Friedreich ataxia and spinocerebellar ataxia) or secondary to stroke, trauma, alcoholic degeneration, multiple sclerosis, vitamin B12 deficiency, and hydrocephalus. Treatment, when possible, should target the underlying cause.1,2
CORRESPONDENCE Hakan Yaman, MD, Akdeniz University, Department of Family Medicine, Antalya, Turkey 07058; [email protected]
1. Deuschl G, Bain P, Brin M. Consensus statement of the Movement Disorder Society on Tremor. Ad Hoc Scientific Committee. Mov Disord. 1998;13(suppl 3):2-23.
2. Yaman A, Yaman H, Rao G. Tremors and other movement disorders. In: Mengel MB, et al, eds. Family Medicine Ambulatory Care and Prevention. 5th ed. New York: McGraw-Hill; 2009:400–407.
3. Harris MK, Shneyder N, Borazanci A, et al. Movement disorders. Med Clin North Am. 2009;93:371-388.
4. Palhagen S, Heinonen E, Hagglund J, et al. Selegiline slows the progression of the symptoms of Parkinson disease. Neurology. 2006;66:1200-1206.
5. Olanow CW, Rascol O, Hauser R, et al. A double-blind, delayed-start trial of rasagiline in Parkinson’s disease. N Engl J Med. 2009;361:1268-1278.
6. Zesiewicz TA, Sullivan KL, Arnulf I, et al. Treatment of nonmotor symptoms of Parkinson disease. Neurology. 2010;74:924-931.
7. Suchowersky O, Reich S, Perlmutter J, et al. Practice parameter: diagnosis and prognosis of new onset Parkinson disease (an evidence-based review). Neurology. 2006;66:968-975.
8. Rao SS, Hofmann LA, Shakil A. Parkinson’s disease: diagnosis and treatment. Am Fam Physician. 2006;74:2046-2054.
9. The National Collaborating Centre for Chronic Conditions Parkinson’s Disease. National Clinical Guideline for Diagnosis and Management in Primary and Secondary Care. 2006. Available at: http://www.nice.org.uk/nicemedia/live/10984/30087/30087.pdf. Accessed May 12, 2010.
10. Jankovic J. Treatment of hyperkinetic movement disorders. Lancet Neurol. 2009;8:844-856.
11. Kerlsberg G, Rubenstein C, St Anna L, et al. Differential diagnosis of tremor. Am Fam Physician. 2008;77:1305-1306.
12. Burke DA, Hauser RA, McClain T. Essential tremor. Available at: http://emedicine.medscape.com/article/1150290-overview. Accessed May 12, 2010.
13. Zesiewicz TA, Elble R, Louis ED, et al. Practice parameter: therapies for essential tremor. Neurology. 2005;64:2008-2020.
14. Elble RJ. Tremor: clinical features, pathophysiology, and treatment. Neurol Clin. 2009;27:679-695.
15. Smaga S. Tremor. Am Fam Physician. 2003;68:1545-1552.
16. Use of botulinum neurotoxin for the treatment of movement disorders. AAN summary of evidence-based guidelines for clinicians. 2008. Available at: http://www.aan.com/practice/guideline/uploads/280.pdf. Accessed May 25, 2010.
17. Redondo L, Morgado Y, Durán E. Psychogenic tremor: a positive diagnosis [ in Spanish]. Neurología. 2010;25:51-57.
18. Schwingenschuh P, Katschnig P, Seiler S, et al. Moving toward ‘‘laboratory-supported’’ criteria for psychogenic tremor. Mov Disord. 2011;Sep 28. [Epub ahead of print].
19. McKeon A, Ahlskog JE, Bower JH, et al. Psychogenic tremor: long-term prognosis in patients with electrophysiologically confirmed disease. Mov Disord. 2009;24:72-76.
20. Shprecher D, Kurlan R. The management of tics. Mov Disord. 2009;24:15-24.
21. Kenney C, Kuo SH, Jimenez-Shahed J. Tourette’s syndrome. Am Fam Physician. 2008;77:651-658.
22. Bayard M, Avonda T, Wadzinsky J. Restless legs syndrome. Am Fam Physician. 2008;78:235-240.
23. Caviness JN. Pathophysiology and treatment of myoclonus. Neurol Clin. 2009;27:757-777.
24. Barbeau A, Duvoisin RC, Gerstenbrand F, et al. Classification of extrapyramidal disorders. J Neurol Sci. 1981;51:311-327.
25. Vertrees SM, Berman SA. Chorea in adults: treatment & management. Available at: http://emedicine.medscape.com/article/1149854-treatment. Accessed February 12, 2010.
• Initiate neuroprotective therapy with a monoamine oxidase B inhibitor to slow the progression of Parkinson’s disease. With onset of functional impairment, give levodopa at the lowest effective dose. A
• Give propranolol for essential tremor causing a patient distress, starting at 20 to 40 mg twice daily and increasing the dose (to a maximum of 320 mg/d) until relief is achieved. B
• Consider giving a dopamine receptor blocker for Tourette syndrome or other tic disorder; alternative agents are clonidine or a newer agent, tetrabenazine. B
Strength of recommendation (SOR)
A Good-quality patient-oriented evidence
B Inconsistent or limited-quality patient-oriented evidence
C Consensus, usual practice, opinion, disease-oriented evidence, case series
Movement disorders often require consultation with a neurologist, and a working knowledge of established and novel treatments can set the stage for optimal long-term cooperative management.1 In this article, we review therapeutic options for common movement disorders, including hypokinetic, hyperkinetic, and dyskinetic disturbances.
Parkinson’s disease treatment: MAO-B inhibitor, levodopa are mainstays
Parkinson’s disease, the most common hypokinetic movement disorder, is a chronic, progressive, neurodegenerative disease. It affects 1% of individuals older than 65 years and 4% to 5% of individuals older than 85 years. Its cardinal symptoms are resting tremor, bradykinesia, rigidity, a flexed posture, and loss of postural reflexes. Resting tremor, referred to as “pill rolling” tremor, is 4 to 6 Hz and usually begins unilaterally.2,3 Associated symptoms can include dystonia, dementia, psychiatric disorders, sleep disorders, and autonomic symptoms.
Neuroprotective therapy is used to slow the progression of the disease, particularly in its early stage. The monoamine oxidase B (MAO-B) inhibitor selegiline has proven effective in this regard2 (strength of recommendation [SOR]: A). In randomized controlled studies, selegiline has delayed the need for levodopa for 9 to 12 months4 (SOR: A). Another MAO-B inhibitor, rasagiline, has demonstrated neuroprotective effects as well5 (SOR: B). These medications may also be used with levodopa for symptom control and as adjuvant therapy in patients with motor fluctuations.2 A conventional dose of selegiline is 10 mg/d (5 mg at breakfast; 5 mg at lunch). Rasagiline is given at 1 mg/d. Concomitant use of ciprofloxacin or other CYP1A2 inhibitors limits its effectiveness.6,7
Symptomatic therapy is indicated at the onset of functional impairment. The dopamine precursor levodopa is the most widely used and effective drug for Parkinson’s disease symptoms, especially bradykinesia and rigidity. Use the lowest possible dose to control symptoms (eg, 100 mg twice daily) and protect against motor complications of the drug7-9 (SOR: A). To prevent conversion of levodopa to dopamine outside the blood-brain barrier, combine it with the decarboxylase inhibitor carbidopa. Dietary restriction of proteins may be needed, because amino acids can interfere with the absorption of levodopa.
Especially with prolonged use, levodopa can cause disturbing adverse effects, such as nausea, vomiting, psychosis, cardiac arrhythmia, and orthostatic hypotension. Dyskinesias and motor fluctuations are complications of long-term treatment and are irreversible. Adding a cathecol-O-methyltransferase (COMT) inhibitor, such as entacapone, to increase levodopa’s effectiveness has been shown to reduce motor fluctuations2,3,10 (SOR: B). Dopamine agonists such as bromocriptine, ropinirole, and pramipexole used in early Parkinson’s disease can also reduce dyskinesias and motor fluctuations. Dopamine agonists may be preferred to levodopa in early Parkinson’s disease because they are better tolerated and cause fewer adverse effects. Or they may be used as adjuncts for patients whose response to levodopa is deteriorating or fluctuating3,7,8 (SOR: B). In advanced disease, motor complications can also be managed by augmenting levodopa therapy with a dopamine agonist, MAO-B inhibitor, or COMT inhibitor7,8 (SOR: A).
Anticholinergics, mainly benztropine and trihexyphenidyl, may be used as symptomatic treatment, especially in young people with early Parkinson’s disease and severe tremor. However, they are not the first drugs of choice due to limited efficacy and the potential for neuropsychiatric side effects8 (SOR: C). Amantadine can reduce dyskinesia in people with advanced Parkinson’s disease8 (SOR: C). For patients who have Parkinson’s disease with severe motor complications, intermittent apomorphine injections can help reduce “off time” periods in the daily treatment cycle when the efficacy of drugs wanes9 (SOR: B).
Deep brain stimulation of the subthalamic nucleus has only SOR C support for reducing dyskinesias and off time.9
Treating nonmotor symptoms of Parkinson’s disease can be challenging. For dementia in these patients, consider cholinesterase inhibitors6,8 (SOR: C). For depression, selective serotonin reuptake inhibitors are effective6,8,9 (SOR: C). For psychosis, preferred agents are low-dose clozapine or quetiapine6,8-10 (SOR: C). Plan for supportive and symptomatic management of constipation, dysphagia, sialorrhea, orthostatic hypotension, sleep disturbances, and urinary urgency.2,3
Tremor
Tremor is a common form of hyperkinesia, presenting either as a primary disorder or as a symptom of another condition.11 By definition, it is a rhythmical, involuntary, oscillatory movement of 1 or more body parts. Tremors are classified as rest or action tremors, with the latter being further categorized as postural (occurring while the patient maintains a position against gravity) or kinetic (occurring during voluntary movement).2,10
Physiologic tremor: Pharmacologic Tx is usually not needed
Physiologic tremor is benign, high frequency (8-12 Hz), low amplitude, and postural. An exaggerated form of this tremor may result from anxiety, hyperthyroidism, pheochromocytoma, hypoglycemia, excessive caffeine consumption, fever, withdrawal from opioids and sedatives, and some medications. No drug treatment is necessary unless symptoms become bothersome. Correct the underlying cause or have the patient avoid the triggering factor, and offer reassurance that the condition is not pathological or progressive.2,12 For anxiety, consider cognitive-behavioral/relaxation therapy or benzodiazepines (if tremor did not result from withdrawal of benzodiazepines) or beta-adrenergic antagonists (eg, propranolol).12,13
Essential tremor: Try propranolol or primidone first
Essential tremor (ET) is the most common movement disorder. It often results in functional disability and leads to many physical and emotional difficulties. ET is bilateral, usually symmetric (although mild asymmetry is possible), and postural or kinetic, typically affecting hands and forearms. The frequency of ET is 4 to 12 Hz. Cranial musculature may be involved in 30% of cases, affecting the head and voice.3 Prevalence ranges from 4 to 40 cases per 1000 people. The age-adjusted incidence is 17.5/100,000 per year; it peaks during the teen years and the fifth decade.2,3
Autosomal dominant type of inheritance is common, and a family history of ET is often present, particularly with younger patients. The differential diagnosis includes Parkinson’s disease tremor; dystonic, cerebellar, rubral, and psychogenic tremors; and asterixis.3 Unlike ET, many of these disorders have associated neurologic, psychiatric, or systemic signs.
Treatment with propranolol or primidone is indicated if ET causes functional impairment or social or emotional problems for the patient.2,3,10,13 Both propranolol and primidone reduce limb tremor2,10,13 (SOR: B), but only propranolol is approved by the US Food and Drug Administration (FDA) for treatment of ET. Propranolol is more effective for hand and forearm tremor than for head and voice tremor. Start propranolol at 20 to 40 mg twice a day and increase the dose as needed to achieve symptom relief.14
A maintenance dose of 240 to 320 mg/d may be needed. Major adverse effects are fatigue, sedation, depression, and erectile dysfunction. Contraindications to propranolol include asthma, second-degree atrioventricular block, and insulin-dependent diabetes.
If starting with primidone alone, prescribe at a dose <25 mg at bedtime and increase the dose slowly over several weeks to prevent onset of nausea, vomiting, sedation, confusion, or ataxia. The maximum allowable dose is 750 mg/d in 3 divided doses.10 Primidone and propranolol may be used in combination to treat limb tremor when monotherapy is insufficient (SOR: B).13
Thirty percent of patients with ET will not respond to propranolol or primidone. An alternative choice is the anticonvulsant gabapentin10,12-14 (SOR: C). However, clinical experience with it is limited. Lethargy, fatigue, decreased libido, dizziness, nervousness, and shortness of breath are adverse effects of gabapentin; they are usually mild and tolerable.13 Topiramate is another option that seems to be as effective as gabapentin10,13 (SOR: C), but studies of long-term outcomes are lacking. Topiramate’s side effects include weight loss and paresthesias. Additionally, alprazolam, clonazepam, clozapine, olanzapine, atenolol, sotalol, nadolol, and nimodipine may reduce limb tremor2 (SOR: C). Alcohol reduces tremor amplitude in 50% to 90% of patients, but tremor may worsen after the effect of alcohol has worn off.15
For patients with essential hand tremor that fails to respond to oral agents, consider botulinum toxin A16 (SOR: B). However, it is also associated with dose-dependent hand weakness16 (SOR: C). Botulinum toxin may reduce head and voice tremor16 (SOR: C), but hoarseness and swallowing difficulties may occur after use for voice tremor.16
Invasive therapies may benefit patients with refractory tremor. Deep brain stimulation and thalamotomy are highly effective in reducing limb tremor13 (SOR: C). Each carries a small risk of major complications. Some deep brain stimulation adverse events may resolve with time. Other adverse events may resolve with adjustment of stimulator settings. No evidence exists for surgical treatment for voice and head tremor or for gamma-knife thalamotomy.13
Drug-induced tremor
Drugs with the potential to cause postural tremor, intention tremor, or rest tremor include the following: 15
- alcohol (chronic)
- amiodarone
- amphetamines
- beta-adrenergic agonists
- caffeine
- calcitonin
- carbamazepine
- cocaine
- cyclosporine
- dopamine
- lithium
- metoclopramide
- neuroleptics
- procainamide
- steroids
- theophylline
- thyroid hormones
- tricyclic antidepressants
- trifluoperazine
- valproic acid
With drug-induced tremor, carefully evaluate a patient’s need for the drug. Discontinue the offending agent if possible, or try lowering the dose.
Psychogenic tremor: A history of somatization is a clue
Psychogenic tremor can occur at rest or during postural or kinetic movement. Clinical features include an abrupt onset, a static course, spontaneous remission, and unclassifiable tremors.17 Psychogenic tremor increases under direct observation and decreases with distraction. Patients with psychogenic tremor often have a history of somatization.18 Electrophysiologic testing can help confirm the diagnosis. If remission does not occur spontaneously, patients may find relief with psychotherapy or placebo.19
Tic disorders: Opt for dopamine receptor blockers
Tics are involuntary or semivoluntary movements or sounds that are sudden, brief, intermittent, repetitive, nonrhythmic, unpredictable, and purposeless. Tics can occur in any part of the body.20
The most common tic disorder is Tourette syndrome—a combination of motor and phonic tics with onset before age 21. It affects approximately 5 to 10 children out of 10,000. Boys are more commonly affected than girls. Attention deficit hyperactivity disorder frequently accompanies this syndrome.2
The goal of treatment with any tic disorder is to improve social functioning, self-esteem, and quality of life. Education and support of patients is important. Tic disorders, including Tourette, rarely require drugs. But if tics become too distressing, first-line treatment would be a dopamine modulator, tetrabenazine, or clonidine. Randomized controlled trials with various neuroleptics have revealed dramatic reductions in tic severity. However, many patients do not tolerate the acute adverse effects (most commonly sedation, weight gain, depression, lethargy, and akathisia), and prolonged treatment confers a small risk of tardive dyskinesia. Behavioral therapy is an important part of management.20
Dopamine-receptor blocking drugs such as haloperidol, pimozide, and fluphenazine are the most effective treatment for tics20 (SOR: B). Tetrabenazine is a promising new dopamine-depleting drug; controlled trials are ongoing2,20 (SOR: B). Clonidine, an alpha 2-adrenergic agonist, is useful in treating patients with Tourette syndrome, helping to improve sleep and attention2,21 (SOR: C). Medically refractory motor and disabling phonic tics such as coprolalia can be ameliorated by botulinum toxin injections21 (SOR: B). Deep brain stimulation is being used at an increasing rate for medically refractory tics in Tourette syndrome21 (SOR: B).
Restless legs syndrome: Dopamine agonists are preferred
Restless legs syndrome (RLS) is a disorder characterized by sensory symptoms and motor disturbances of the legs, mainly during rest. Treatment may not be necessary for patients with mild or sporadic symptoms. For moderate to severe RLS with significant impairment, dopamine agonists are the preferred agents22 (SOR: A). RLS can also occur secondary to such conditions as iron deficiency and uremia, and correction of the underlying disorder is the goal. Prescribe iron replacement for patients with a ferritin level <50 ng/mL22 (SOR: C). Medications known to cause or exacerbate the symptoms of RLS are anti-dopaminergic agents (such as neuroleptics), diphenhydramine, tricyclic antidepressants, alcohol, caffeine, lithium, and beta-blockers. If a patient is taking medications that exacerbate symptoms of RLS, discontinue them and use appropriate substitutes22 (SOR: C).
Myoclonus: Clonazepam for essential disorder
Myoclonus is a brief, sudden, shock-like movement caused by involuntary muscle contractions or lapse of muscle contraction (asterixis). Given the complex origins of myoclonus, multiple drugs may be needed. Essential myoclonus is disabling and can be treated with clonazepam. Start with 0.25 mg orally twice daily, and increase the dosage over 3 days to 1 mg/d23 (SOR: C). Most cases of myoclonus are secondary due to drugs such as lithium, toxins, advanced liver disease, infections including human immunodeficiency virus, dementia, and brain lesions. Treatment should also address the underlying disorder.2,23
Chorea
Chorea is an abnormal involuntary movement disorder described as “a state of excessive, spontaneous movements, irregularly timed, nonrepetitive, randomly distributed, and abrupt in character.”24
Treatment of chorea is symptomatic, aiming to reduce morbidity and prevent complications. Haloperidol and fluphenazine are effective but can impair voluntary movements2,10,25 (SOR: C). The dopamine-depleting drugs reserpine and tetrabenazine are also effective2,10,25 (SOR: C). GABAergic drugs, such as clonazepam, gabapentin, and valproate, can be used adjunctively.10,25
Dystonia
Dystonia is a syndrome involving sustained contractions of opposing muscles that cause twisting, repetitive movements and abnormal postures. Primary dystonia can be treated successfully with high doses of trihexyphenidyl alone, starting with 1 mg orally per day and increasing gradually to 6 to 80 mg/d until symptoms are controlled; or in combination with baclofen, starting with 10 mg orally once daily and increasing to a maximum dose of 30 to 120 mg/d1,2 (SOR: C).
Consider botulinum neurotoxin injection for focal upper extremity dystonia and adductor spasmodic dysphonia16 (SOR: B).
Ataxia
Ataxia is an unsteady gait associated with cerebellar dysfunction, proprioceptive defects, or both. Ataxia may be primary (Friedreich ataxia and spinocerebellar ataxia) or secondary to stroke, trauma, alcoholic degeneration, multiple sclerosis, vitamin B12 deficiency, and hydrocephalus. Treatment, when possible, should target the underlying cause.1,2
CORRESPONDENCE Hakan Yaman, MD, Akdeniz University, Department of Family Medicine, Antalya, Turkey 07058; [email protected]
1. Deuschl G, Bain P, Brin M. Consensus statement of the Movement Disorder Society on Tremor. Ad Hoc Scientific Committee. Mov Disord. 1998;13(suppl 3):2-23.
2. Yaman A, Yaman H, Rao G. Tremors and other movement disorders. In: Mengel MB, et al, eds. Family Medicine Ambulatory Care and Prevention. 5th ed. New York: McGraw-Hill; 2009:400–407.
3. Harris MK, Shneyder N, Borazanci A, et al. Movement disorders. Med Clin North Am. 2009;93:371-388.
4. Palhagen S, Heinonen E, Hagglund J, et al. Selegiline slows the progression of the symptoms of Parkinson disease. Neurology. 2006;66:1200-1206.
5. Olanow CW, Rascol O, Hauser R, et al. A double-blind, delayed-start trial of rasagiline in Parkinson’s disease. N Engl J Med. 2009;361:1268-1278.
6. Zesiewicz TA, Sullivan KL, Arnulf I, et al. Treatment of nonmotor symptoms of Parkinson disease. Neurology. 2010;74:924-931.
7. Suchowersky O, Reich S, Perlmutter J, et al. Practice parameter: diagnosis and prognosis of new onset Parkinson disease (an evidence-based review). Neurology. 2006;66:968-975.
8. Rao SS, Hofmann LA, Shakil A. Parkinson’s disease: diagnosis and treatment. Am Fam Physician. 2006;74:2046-2054.
9. The National Collaborating Centre for Chronic Conditions Parkinson’s Disease. National Clinical Guideline for Diagnosis and Management in Primary and Secondary Care. 2006. Available at: http://www.nice.org.uk/nicemedia/live/10984/30087/30087.pdf. Accessed May 12, 2010.
10. Jankovic J. Treatment of hyperkinetic movement disorders. Lancet Neurol. 2009;8:844-856.
11. Kerlsberg G, Rubenstein C, St Anna L, et al. Differential diagnosis of tremor. Am Fam Physician. 2008;77:1305-1306.
12. Burke DA, Hauser RA, McClain T. Essential tremor. Available at: http://emedicine.medscape.com/article/1150290-overview. Accessed May 12, 2010.
13. Zesiewicz TA, Elble R, Louis ED, et al. Practice parameter: therapies for essential tremor. Neurology. 2005;64:2008-2020.
14. Elble RJ. Tremor: clinical features, pathophysiology, and treatment. Neurol Clin. 2009;27:679-695.
15. Smaga S. Tremor. Am Fam Physician. 2003;68:1545-1552.
16. Use of botulinum neurotoxin for the treatment of movement disorders. AAN summary of evidence-based guidelines for clinicians. 2008. Available at: http://www.aan.com/practice/guideline/uploads/280.pdf. Accessed May 25, 2010.
17. Redondo L, Morgado Y, Durán E. Psychogenic tremor: a positive diagnosis [ in Spanish]. Neurología. 2010;25:51-57.
18. Schwingenschuh P, Katschnig P, Seiler S, et al. Moving toward ‘‘laboratory-supported’’ criteria for psychogenic tremor. Mov Disord. 2011;Sep 28. [Epub ahead of print].
19. McKeon A, Ahlskog JE, Bower JH, et al. Psychogenic tremor: long-term prognosis in patients with electrophysiologically confirmed disease. Mov Disord. 2009;24:72-76.
20. Shprecher D, Kurlan R. The management of tics. Mov Disord. 2009;24:15-24.
21. Kenney C, Kuo SH, Jimenez-Shahed J. Tourette’s syndrome. Am Fam Physician. 2008;77:651-658.
22. Bayard M, Avonda T, Wadzinsky J. Restless legs syndrome. Am Fam Physician. 2008;78:235-240.
23. Caviness JN. Pathophysiology and treatment of myoclonus. Neurol Clin. 2009;27:757-777.
24. Barbeau A, Duvoisin RC, Gerstenbrand F, et al. Classification of extrapyramidal disorders. J Neurol Sci. 1981;51:311-327.
25. Vertrees SM, Berman SA. Chorea in adults: treatment & management. Available at: http://emedicine.medscape.com/article/1149854-treatment. Accessed February 12, 2010.
Inhalation therapy: Help patients avoid these mistakes
• Stress the importance of exhaling gently for a few seconds before inhaling (deeply and slowly for a metered dose inhaler, and deeply and rapidly for most dry powder inhalers). C
• Observe the inhaler technique of every patient receiving inhalation therapy on more than one occasion. C
• Don’t rely on self-reports regarding inhaler technique; despite claims of proficiency, most patients make at least one mistake. C
Strength of recommendation (SOR)
A Good-quality patient-oriented evidence
B Inconsistent or limited-quality patient-oriented evidence
C Consensus, usual practice, opinion, disease-oriented evidence, case series
For patients with asthma or chronic obstructive pulmonary disease (COPD), inhalation therapy is the foundation of treatment. Yet all too often, patients don’t get the full value of their inhaled medications because they use their inhaler incorrectly. When technique is markedly flawed, suboptimal outcomes typically result.
Given the number of Americans with asthma (at least 22 million)1 and COPD (more than 13 million adults),2 faulty inhaler technique is a major public health problem. In fact, the number of people suffering from COPD may be even larger: Close to 24 million US adults are believed to have impaired lung function.3,4 For patients with asthma or COPD—many of whom are treated by family physicians—comprehensive education with a focus on correct use of an inhaler is essential.
In this review, we present evidence of frequent inhaler errors (from clinical studies) and highlight some of the more common mistakes (based on our clinical experience [TABLE]5). Finally, we offer ‘‘time-efficient’’ solutions to inhaler problems—steps that physicians in busy primary care practices can take to ensure that patients with asthma or COPD get the maximum benefit from inhalation therapy.
TABLE
Caution patients about these device-specific mistakes*
| Metered dose inhaler |
|---|
|
| Metered dose inhaler plus spacer/VHC |
|
| Dry powder inhaler |
|
| *These are examples based on the experience of the authors; other errors are possible. †Timing is not as crucial as it is for an MDI without a spacer, but the drug is still lost if inhalation is delayed. ‡Correct use varies by type of product (see product literature for specifics). DPI, dry powder inhaler; MDI, metered dose inhaler; VHC, valved holding chamber. Source: Adapted with permission from Self TH, et al. Consultant. 2003.5 |
Inhaler error is well documented
Since 1965, when it was first reported that many patients used metered dose inhalers (MDIs) incorrectly,6 evidence has accumulated supporting the magnitude of the problem.7-12 (Studies conducted in family practice settings are described in “Researchers look at inhaler problems in primary care” and in TABLE W1.13-20)
A number of studies of various sizes (from 41 to 3955 patients) have assessed inhaler technique in patients being treated by clinicians in primary care. The researchers used a variety of scoring methods, as well. Among them were a simple 4-step (0-4) rating system, a 9-step system, a standardized inhaler-specific checklist, and a system that tracked the number of omissions patients made.13-20 All found significant problems with inhaler technique. (You’ll find a detailed look at the studies in TABLE W1 at jfponline.com.)
In one study of 422 patients,13 including young children, adolescents, and adults, participants received one point for correctly performing each of the following steps:
- Adequate preparation (shaking well for those using a metered dose inhaler [MDI]; loading correctly for patients using a dry powder inhaler [DPI])
- Adequate expiration, correct head position
- Adequate inspiratory technique
- Holding breath afterwards.
The researchers found that 25% of the patients had inadequate technique (≤2 on a 0-4 point scale). In this study, as in others that included patients using various types of devices, use of an MDI was associated with a higher rate of incorrect technique.
Another much-smaller study14 used the same 4-step system to assess the technique of 50 patients, all of whom had the same type of DPI and had received extensive training in the correct use of the device. Despite the training, 27% of the patients received scores of ≤2 (inadequate technique). Sixty-eight percent received a score of 3 (adequate); only 5% received a score of 4 (good).
The 2 largest studies—one including 3955 patients using MDIs20 and the other looking at 3811 patients using various kinds of devices18—found high levels of errors, as well. In the latter study, 76% of patients with MDIs made at least one error vs 49% to 55% of patients using DPIs.18 The results convinced a large majority of the physicians caring for these patients of the need to check inhaler technique more frequently. In the study of MDI users alone, 71% of the patients made at least one mistake.20 inhaler misuse was associated with higher asthma instability scores, this study showed.
More recently, a researcher assessed the effects of an integrated primary care model on the management of asthma and/or COPD in middle-aged and elderly patients, in a study of 260 patients in 44 family practices.19 The study included an evaluation of inhaler technique.
Participants were divided into an intervention group—137 patients who received education regarding inhaler use from a nurse—and a usual care group (123 patients). After 2 years, correct inhaler technique among those in the intervention group went from 41% at baseline to 54%. At the same time, the proportion of those in the usual care group with correct technique fell from 47% to 29%.19
Error rates vary widely from one clinical trial to another, depending on study criteria, type of device, and extent of patient education, among other factors. Nonetheless, several studies (spanning 3 decades) found the error rate to be close to, or greater than, 90%.7,10,21
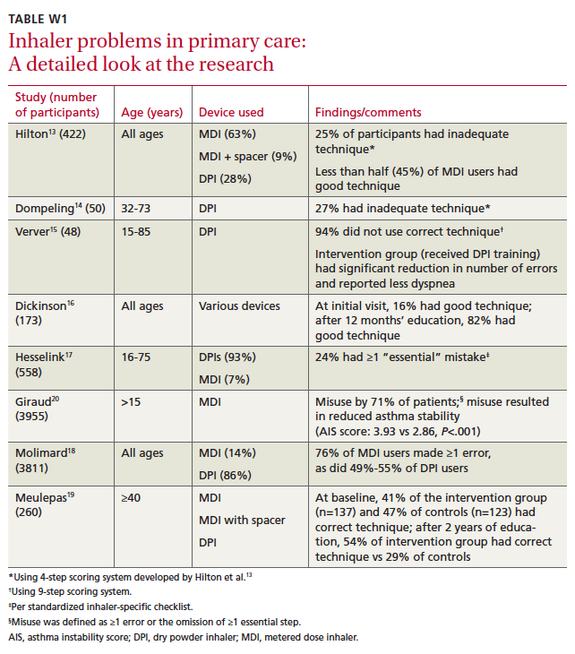
The most recent of these, published in 2009,21 was based on observation of the inhaler technique used by patients with asthma or COPD directly following appointments in an outpatient clinic. The authors found that, although >98% of the study participants claimed to know how to use their inhalers, 94% committed at least one error. In this study and a number of others, user error was more likely in patients using MDIs.13,18,21,22
Adding a spacer (eg, a valved holding chamber such as the AeroChamber) can be helpful, as the spacer affords the patient more time to inhale the medication. But patients who use an MDI with a spacer often make mistakes, too, and patient education is essential.23-26
Breath-activated dry powder inhalers (DPIs)—such as the Flexhaler, HandiHaler, Aerolizer, and Diskus—also reduce the likelihood of error. DPIs eliminate a step that MDI users often struggle with: the need to simultaneously press down on the canister and begin a slow, deep inhalation.
What’s more, DPIs do not have to be shaken before use. Nonetheless, using a DPI still involves a series of actions. For the HandiHaler and Aerolizer, patients must load the dose, and some patients fail to read the directions and swallow the capsule instead of loading it into the device. Patients must remember to exhale away from the device (ie, not into the dry powder) before inhaling, then hold their breath for approximately 10 seconds. There is potential for error at each step.
Stress the need to exhale before using the inhaler
Forgetting to exhale before inhaling is a common, and significant, mistake regardless of the type of device. It is paramount to stress the need to exhale gently for a few seconds before inhaling (slowly and deeply for patients using an MDI, rapidly and deeply with most DPIs). For MDI users, poor timing, described earlier, is another common and serious mistake. Patients using an MDI with a valved holding chamber sometimes inhale for too long before pressing down on the inhaler, then are unable to continue inhaling although the aerosol is still in the chamber. A common error made by patients using multidose DPIs is simply to forget to load the dose.
Physicians need to brush up on their skills, too
It’s not just patients who lack proficiency in inhaler technique. Numerous studies have demonstrated poor skill among physicians and other health care professionals.27-34 Evidence also shows that targeted education results in substantial improvement.32,35
In one study undertaken to evaluate family medicine residents’ proficiency in using asthma inhalers, participants (an intervention group at one clinic and a control group at another) all were given a pretest. The intervention group then received educational materials and a tutorial, as well as the opportunity for hands-on practice, after which both groups were given a post-test. The residents who received the training had a 170% jump, on average, in proficiency score, vs a 55% increase for the control group (P<.001).35
Inhaled Medication Instructional Videos
Courtesy of: National Jewish Health
Go to http://www.nationaljewish.org/healthinfo/medications/lung-diseases/devices/instructional-videos
Another study—this one involving first-year interns—looked at level of improvement based on the type of education provided. Initially, only 5% of the interns could use an MDI without error. After a lecture and demonstration, 13% had an error-free technique. But when each intern participated in an intensive one-on-one session, the error-free rate reached 73%. The researchers’ conclusion: Lectures are relatively ineffective in teaching interns inhaler technique compared with a one-on-one approach.32
The Chicago Breathe Project,36 a new program aimed at improving education in the use of asthma inhalers for physicians and minority patients, provides further evidence of the value of clinician education. After a series of workshops for residents at 5 academic institutions, the physicians’ knowledge of proper use of inhalers rose dramatically—from just 5% preprogram to 91% postprogram (P<.001). Six months after the educational activity, the residents (n=161) were more likely (44% vs 11% preprogram) to assess patients’ inhaler technique.36
Teaching patients when time is tight
National and international guidelines stress the need to teach patients correct use of asthma and COPD inhalers.1,37,38 Providing the requisite education includes observation of each patient’s inhaler technique with proper use demonstrated, as needed.
The problem, of course, is how to provide that level of patient education within the time constraints of a busy family practice. We recommend these time-efficient solutions:
Enlist the help of other clinicians. While it is important that someone in your office be well trained and able to instruct patients in the proper use of inhalers, that individual need not be you. The National Institutes of Health recommends that the “principal clinician” introduce key educational messages, which can be reinforced and expanded on by other members of the health care team.1
After you advise patients that it is crucial for them to be trained in and adhere to proper inhaler technique, another health care professional—often a clinic nurse or pharmacist who has had special training—can provide the hands-on education. Studies have shown that when pharmacists who are competent in asthma management, including inhaler technique, work with physicians to optimize the education and overall management of patients with asthma, better outcomes often result, including a reduction in both emergency department visits and hospitalizations.1,39,40
Use videos to demonstrate correct technique. Videos are an effective teaching tool,9 and many of them are device-specific. National Jewish Health, which is world renowned for its asthma care, has a set of instructional videos posted on You-Tube and accessible from its Web site (http://www.nationaljewish.org/healthinfo/medications/lung-diseases/devices/instructional-videos). In addition to videos that demonstrate the use of an MDI alone and an MDI plus a valved holding chamber, the site has links to 6 DPI videos, each covering a different device.
Use intermittent observation. After the patient views the appropriate video, you or a member of your staff will still need to observe the patient’s inhaler technique to ensure correct use. Ideally, this should occur at every visit.1,37 When that’s not possible, use intermittent observation, starting with the first 2 or 3 visits after the introduction of inhalation therapy and then switching to periodic observation to ensure that the patient is maintaining good technique.
In determining how often observation is necessary, keep in mind that simply asking patients whether they are having inhaler problems is not sufficient.1 Patients tend to say they have little or no trouble when, in fact, most struggle, at times, with the devices. What’s more, good technique tends to decrease over time, and repetitive education is important.
To motivate patients, try this communication technique
Motivational interviewing, a technique that has been used to help patients battle obesity, quit smoking, and control hypertension,41-43 among other health problems, can help you identify inhaler problems that need to be addressed. It involves the use of open-ended questions (eg, “What worries you most about your asthma?”), affirmations (“You’ve done a great job testing your peak flow level every morning”), reflective listening (“You’re tired of taking medicine every day”), and summary statements (“You know you should take your medicine every day but you’re having trouble remembering it. Is that right?”).
A pilot study44 showed that when this technique was incorporated into an asthma education session, patient motivation increased. The ratio of perceived advantages vs disadvantages of taking asthma medication correctly improved, as well. Another study45 found that when motivational interviewing was used during home visits to inner-city African American adolescents for asthma care, the patients’ motivation, readiness to adhere to treatment, and asthma-related quality of life improved, although self-reported adherence to asthma medication did not. Further studies involving patients with asthma are under way (www.clinicaltrials.gov/ct2/results?term=asthma).
It is important to note that the use of motivational interviewing does not require a lengthy visit. One study found that on average, visits in which primary care physicians used this communication technique lasted less than 10 minutes.46
CORRESPONDENCE Timothy H. Self, PharmD, University of Tennessee Health Science Center, 881 Madison Avenue, Room 235, Memphis, TN 38163; [email protected]
1. National Heart, Lung, and Blood Institute; National Asthma Education and Prevention Program Expert Panel Report 3: Guidelines for the Diagnosis and Management of Asthma. Bethesda, MD: National Institutes of Health; 2007.
2. Centers for Disease Control and Prevention. National Center for Health Statistics: National health interview survey raw data, 2008. Analysis performed by American Lung Association Research and Program Services.
3. American Lung Association. COPD—Helping the missing millions. February 24, 2010. Available at: http://www.lungusa.org/about-us/our-impact/top-stories/copd-helping-the-missing.html. Accessed November 9, 2011.
4. Centers for Disease Control and Prevention. Chronic obstructive pulmonary disease surveillance—United States, 1971-2000. MMWR Surveill Summ. 2002;51(6):1-16.
5. Self TH, Kilgore KE, Shelton V. MDIs, spacers, and dry powder inhalers: what patients are likely to do wrong. Consultant. 2003;49:702-705.
6. Saunders KB. Misuse of inhaled bronchodilator agents. Br Med J. 1965;1:1037-1038.
7. Epstein SW, Manning CPR, Ashley MJ, et al. Survey of the clinical uses of pressurized aerosol inhalers. Can Med Assoc J. 1979;120:813-816.
8. Shim C, Williams MH. The adequacy of inhalation of aerosol from canister nebulizers. Am J Med. 1980;69:891-894.
9. Self TH, Brooks JB, Lieberman P, et al. The value of demonstration and role of the pharmacist in teaching the correct use of pressurized bronchodilators. Can Med Assoc J. 1983;128:129-131.
10. Hartert TV, Windom HH, Peeples RS, et al. Inadequate outpatient medical therapy for patients with asthma admitted to two urban hospitals. Am J Med. 1996;100:386-394.
11. Goodman DE, Israel E, Rosenberg M, et al. The influence of age, diagnosis, and gender on proper use of metered-dose inhalers. Am J Respir Crit Care Med. 1994;150:1256-1261.
12. Newman SP, Pavia D, Clarke SW. How should a pressurized beta-adrenergic bronchodilator be inhaled? Eur J Respir Dis. 1981;62:3-21.
13. Hilton S. An audit of inhaler technique among asthma patients of 34 general practitioners. Br J Gen Pract. 1990;40:505-506.
14. Dompeling E, Van Grunsven PM, Van Schayck GP, et al. Treatment with inhaled steroids in asthma and chronic bronchitis: long-term compliance and inhaler technique. Fam Pract. 1992;9:161-166.
15. Verver S, Poelman M, Bogels A, et al. Effects of instruction by practice assistants on inhaler technique and respiratory symptoms of patients. A controlled randomized videotaped intervention study. Fam Pract. 1996;13:35-40.
16. Dickinson J, Hutton S, Atkin A, et al. Reducing asthma morbidity in the community: the effect of a targeted nurse-run asthma clinic in an English general practice. Respir Med. 1997;91:634-640.
17. Hesselink AE, Penninx BW, Wijnhoven HA, et al. Determinants of an incorrect inhalation technique in patients with asthma or COPD. Scand J Prim Health Care. 2001;19:255-260.
18. Molimard M, Raherison C, Lignot S, et al. Assessment of handling of inhaler devices in real life: An observational study in 3811 patients in primary care. J Aerosol Med. 2003;16:249-254.
19. Meulepas MA, Jacobs JE, Smeenk FW, et al. Effect of an integrated primary care model on the management of middle-aged and old patients with obstructive lung diseases. Scand J Prim Health Care. 2007;25:186-192.
20. Giraud V, Roche N. Misuse of corticosteroid metered-dose inhaler is associated with decreased asthma stability. Eur Respir J. 2002;19:246-251.
21. Souza ML, Meneghini AC, Ferraz E, et al. Knowledge of and technique for using inhalation devices among asthma patients and COPD patients. J Bras Pneumol. 2009;35:824-831.
22. Rootmensen GN, van Keimpema AR, Jansen HM, et al. Predictors of incorrect inhalation technique in patients with asthma or COPD: a study using a validated videotaped scoring method. J Aerosol Med Pulm Drug Deliv. 2010;23:323-328.
23. Rachelefsky GS, Rohr AS, Wo J, et al. Use of a tube spacer to improve the efficacy of a metered dose inhaler in asthmatic children. Am J Dis Child. 1986;140:1191-1193.
24. Demirkan K, Tolley E, Mastin T, et al. Salmeterol administration by metered-dose inhaler alone vs metered-dose inhaler plus valved holding chamber. Chest. 2000;117:1314-1318.
25. Pedersen S, Ostergaard PA. Nasal inhalation as a cause of inefficient pulmonal aerosol inhalation technique in children. Allergy. 1983;38:191-194.
26. Dolovich MD, Ahrens RS, Hess DR, et al. Device selection an outcomes of aerosol therapy: evidence-based guidelines: American College of Chest Physicians/American College of Asthma, Allergy, and Immunology. Chest. 2005;127:335-371.
27. Interiano B, Guntupalli KK. Metered-dose inhalers: do health care providers know what to teach? Arch Intern Med. 1993;153:81-85.
28. Hanania NA, Wittman R, Kesten S, et al. Medical personnel’s knowledge of and ability to use inhaling devices. Metered-dose inhalers, spacing chambers, and breath-actuated dry powder inhalers. Chest. 1994;105:111-116.
29. Amirav I, Goren A, Pawlowski NA. What do pediatricians in training know about the correct use of inhalers and spacer devices? J Allergy Clin Immunol. 1994;94:669-675.
30. Chopra N, Oprescu N, Fask A, et al. Does introduction of new “easy to use” inhalational devices improve medical personnel’s knowledge of their proper use? Ann Allergy Asthma Immunol. 2002;88:395-400.
31. Self TH, Arnold LB, Czosnowski LM, et al. Inadequate skill of healthcare professionals in using asthma inhalation devices. J Asthma. 2007;44:593-598.
32. Lee-Wong M, Mayo PH. Results of a programme to improve house staff use of metered dose inhalers and spacers. Postgrad Med J. 2003;79:221-225.
33. Muchao FP, Pern SL, Rodriques JC, et al. Evaluation of the knowledge of health professionals at a pediatric hospital regarding the use of metered dose inhalers. J Bras Pneumol. 2008;34:4-12.
34. Kim SH, Kwak HJ, Kim TB, et al. Inappropriate techniques used by internal medicine residents with three kinds of inhalers (a metered dose inhaler, Diskus, and Turbuhaler): changes after a single teaching session. J Asthma. 2009;46:944-950.
35. Kelcher S, Brownoff R. Teaching residents to use asthma devices. Assessing family residents’ skill and a brief intervention. Can Fam Physician. 1994;40:2090-2095.
36. Press VG, Pincayage AT, Pappalardo AA, et al. The Chicago Breathe Project: a regional approach to improving education on asthma inhalers for resident physicians and minority patients. J Natl Med Assoc. 2010;102:548-555.
37. Global Initiative for Asthma (GINA). Global strategy for asthma management and prevention. 2010. Available at: www.ginasthma.org. Accessed November 9, 2011.
38. Executive Summary: global strategy on the diagnosis and management and prevention of chronic obstructive pulmonary disease. NHLBI/WHO Workshop Report, 2009. Available at: www.goldcopd.com. Accessed November 9, 2011.
39. Self TH, Chrisman CR, Mason DL, et al. Reducing emergency department visits and hospitalizations in African American and Hispanic patients: a 15-year review. J Asthma. 2005;42:807-812.
40. Armour C, Bosnic-Anticevich S, Brillant M, et al. Pharmacy asthma care program (PACP) improves outcomes for patients in the community. Thorax. 2007;62:496-502.
41. DiLillo V, Nicole J, West DS. Incorporating motivational interviewing into behavioral obesity treatment. Cogn Behav Pract. 2003;10:120-130.
42. Borrelli B, Novak S, Hecht J, et al. Home health care nurses as a new channel for smoking cessation treatment: outcomes from project CARES (Community-nurse Assisted Research and Education on Smoking). Prev Med. 2005;41:815-821.
43. Woollard L, Beilin L, Lord T, et al. A controlled trial of nurse counselling on lifestyle change for hypertensives treated in general practice: preliminary results. Clin Exp Pharmacol Physiol. 1995;22:466-468.
44. Schmaling K, Blume A, Afari N. A randomized controlled pilot study of motivational interviewing to change attitudes about adherence to medications for asthma. J Clin Psych Med Settings. 2001;8:167-172.
45. Riekert KA, Borrelli B, Bilderback A, et al. The development of a motivational interviewing intervention to promote medication adherence among inner-city, African-American adolescents with asthma. Patient Educ Couns. 2011;82:117-122.
46. Butler C, Rollnick S, Cohen D, et al. Motivational consulting versus brief advice for smokers in general practice: a randomized trial. Br J Gen Pract. 1999;49:611-616.
• Stress the importance of exhaling gently for a few seconds before inhaling (deeply and slowly for a metered dose inhaler, and deeply and rapidly for most dry powder inhalers). C
• Observe the inhaler technique of every patient receiving inhalation therapy on more than one occasion. C
• Don’t rely on self-reports regarding inhaler technique; despite claims of proficiency, most patients make at least one mistake. C
Strength of recommendation (SOR)
A Good-quality patient-oriented evidence
B Inconsistent or limited-quality patient-oriented evidence
C Consensus, usual practice, opinion, disease-oriented evidence, case series
For patients with asthma or chronic obstructive pulmonary disease (COPD), inhalation therapy is the foundation of treatment. Yet all too often, patients don’t get the full value of their inhaled medications because they use their inhaler incorrectly. When technique is markedly flawed, suboptimal outcomes typically result.
Given the number of Americans with asthma (at least 22 million)1 and COPD (more than 13 million adults),2 faulty inhaler technique is a major public health problem. In fact, the number of people suffering from COPD may be even larger: Close to 24 million US adults are believed to have impaired lung function.3,4 For patients with asthma or COPD—many of whom are treated by family physicians—comprehensive education with a focus on correct use of an inhaler is essential.
In this review, we present evidence of frequent inhaler errors (from clinical studies) and highlight some of the more common mistakes (based on our clinical experience [TABLE]5). Finally, we offer ‘‘time-efficient’’ solutions to inhaler problems—steps that physicians in busy primary care practices can take to ensure that patients with asthma or COPD get the maximum benefit from inhalation therapy.
TABLE
Caution patients about these device-specific mistakes*
| Metered dose inhaler |
|---|
|
| Metered dose inhaler plus spacer/VHC |
|
| Dry powder inhaler |
|
| *These are examples based on the experience of the authors; other errors are possible. †Timing is not as crucial as it is for an MDI without a spacer, but the drug is still lost if inhalation is delayed. ‡Correct use varies by type of product (see product literature for specifics). DPI, dry powder inhaler; MDI, metered dose inhaler; VHC, valved holding chamber. Source: Adapted with permission from Self TH, et al. Consultant. 2003.5 |
Inhaler error is well documented
Since 1965, when it was first reported that many patients used metered dose inhalers (MDIs) incorrectly,6 evidence has accumulated supporting the magnitude of the problem.7-12 (Studies conducted in family practice settings are described in “Researchers look at inhaler problems in primary care” and in TABLE W1.13-20)
A number of studies of various sizes (from 41 to 3955 patients) have assessed inhaler technique in patients being treated by clinicians in primary care. The researchers used a variety of scoring methods, as well. Among them were a simple 4-step (0-4) rating system, a 9-step system, a standardized inhaler-specific checklist, and a system that tracked the number of omissions patients made.13-20 All found significant problems with inhaler technique. (You’ll find a detailed look at the studies in TABLE W1 at jfponline.com.)
In one study of 422 patients,13 including young children, adolescents, and adults, participants received one point for correctly performing each of the following steps:
- Adequate preparation (shaking well for those using a metered dose inhaler [MDI]; loading correctly for patients using a dry powder inhaler [DPI])
- Adequate expiration, correct head position
- Adequate inspiratory technique
- Holding breath afterwards.
The researchers found that 25% of the patients had inadequate technique (≤2 on a 0-4 point scale). In this study, as in others that included patients using various types of devices, use of an MDI was associated with a higher rate of incorrect technique.
Another much-smaller study14 used the same 4-step system to assess the technique of 50 patients, all of whom had the same type of DPI and had received extensive training in the correct use of the device. Despite the training, 27% of the patients received scores of ≤2 (inadequate technique). Sixty-eight percent received a score of 3 (adequate); only 5% received a score of 4 (good).
The 2 largest studies—one including 3955 patients using MDIs20 and the other looking at 3811 patients using various kinds of devices18—found high levels of errors, as well. In the latter study, 76% of patients with MDIs made at least one error vs 49% to 55% of patients using DPIs.18 The results convinced a large majority of the physicians caring for these patients of the need to check inhaler technique more frequently. In the study of MDI users alone, 71% of the patients made at least one mistake.20 inhaler misuse was associated with higher asthma instability scores, this study showed.
More recently, a researcher assessed the effects of an integrated primary care model on the management of asthma and/or COPD in middle-aged and elderly patients, in a study of 260 patients in 44 family practices.19 The study included an evaluation of inhaler technique.
Participants were divided into an intervention group—137 patients who received education regarding inhaler use from a nurse—and a usual care group (123 patients). After 2 years, correct inhaler technique among those in the intervention group went from 41% at baseline to 54%. At the same time, the proportion of those in the usual care group with correct technique fell from 47% to 29%.19
Error rates vary widely from one clinical trial to another, depending on study criteria, type of device, and extent of patient education, among other factors. Nonetheless, several studies (spanning 3 decades) found the error rate to be close to, or greater than, 90%.7,10,21
The most recent of these, published in 2009,21 was based on observation of the inhaler technique used by patients with asthma or COPD directly following appointments in an outpatient clinic. The authors found that, although >98% of the study participants claimed to know how to use their inhalers, 94% committed at least one error. In this study and a number of others, user error was more likely in patients using MDIs.13,18,21,22
Adding a spacer (eg, a valved holding chamber such as the AeroChamber) can be helpful, as the spacer affords the patient more time to inhale the medication. But patients who use an MDI with a spacer often make mistakes, too, and patient education is essential.23-26
Breath-activated dry powder inhalers (DPIs)—such as the Flexhaler, HandiHaler, Aerolizer, and Diskus—also reduce the likelihood of error. DPIs eliminate a step that MDI users often struggle with: the need to simultaneously press down on the canister and begin a slow, deep inhalation.
What’s more, DPIs do not have to be shaken before use. Nonetheless, using a DPI still involves a series of actions. For the HandiHaler and Aerolizer, patients must load the dose, and some patients fail to read the directions and swallow the capsule instead of loading it into the device. Patients must remember to exhale away from the device (ie, not into the dry powder) before inhaling, then hold their breath for approximately 10 seconds. There is potential for error at each step.
Stress the need to exhale before using the inhaler
Forgetting to exhale before inhaling is a common, and significant, mistake regardless of the type of device. It is paramount to stress the need to exhale gently for a few seconds before inhaling (slowly and deeply for patients using an MDI, rapidly and deeply with most DPIs). For MDI users, poor timing, described earlier, is another common and serious mistake. Patients using an MDI with a valved holding chamber sometimes inhale for too long before pressing down on the inhaler, then are unable to continue inhaling although the aerosol is still in the chamber. A common error made by patients using multidose DPIs is simply to forget to load the dose.
Physicians need to brush up on their skills, too
It’s not just patients who lack proficiency in inhaler technique. Numerous studies have demonstrated poor skill among physicians and other health care professionals.27-34 Evidence also shows that targeted education results in substantial improvement.32,35
In one study undertaken to evaluate family medicine residents’ proficiency in using asthma inhalers, participants (an intervention group at one clinic and a control group at another) all were given a pretest. The intervention group then received educational materials and a tutorial, as well as the opportunity for hands-on practice, after which both groups were given a post-test. The residents who received the training had a 170% jump, on average, in proficiency score, vs a 55% increase for the control group (P<.001).35
Inhaled Medication Instructional Videos
Courtesy of: National Jewish Health
Go to http://www.nationaljewish.org/healthinfo/medications/lung-diseases/devices/instructional-videos
Another study—this one involving first-year interns—looked at level of improvement based on the type of education provided. Initially, only 5% of the interns could use an MDI without error. After a lecture and demonstration, 13% had an error-free technique. But when each intern participated in an intensive one-on-one session, the error-free rate reached 73%. The researchers’ conclusion: Lectures are relatively ineffective in teaching interns inhaler technique compared with a one-on-one approach.32
The Chicago Breathe Project,36 a new program aimed at improving education in the use of asthma inhalers for physicians and minority patients, provides further evidence of the value of clinician education. After a series of workshops for residents at 5 academic institutions, the physicians’ knowledge of proper use of inhalers rose dramatically—from just 5% preprogram to 91% postprogram (P<.001). Six months after the educational activity, the residents (n=161) were more likely (44% vs 11% preprogram) to assess patients’ inhaler technique.36
Teaching patients when time is tight
National and international guidelines stress the need to teach patients correct use of asthma and COPD inhalers.1,37,38 Providing the requisite education includes observation of each patient’s inhaler technique with proper use demonstrated, as needed.
The problem, of course, is how to provide that level of patient education within the time constraints of a busy family practice. We recommend these time-efficient solutions:
Enlist the help of other clinicians. While it is important that someone in your office be well trained and able to instruct patients in the proper use of inhalers, that individual need not be you. The National Institutes of Health recommends that the “principal clinician” introduce key educational messages, which can be reinforced and expanded on by other members of the health care team.1
After you advise patients that it is crucial for them to be trained in and adhere to proper inhaler technique, another health care professional—often a clinic nurse or pharmacist who has had special training—can provide the hands-on education. Studies have shown that when pharmacists who are competent in asthma management, including inhaler technique, work with physicians to optimize the education and overall management of patients with asthma, better outcomes often result, including a reduction in both emergency department visits and hospitalizations.1,39,40
Use videos to demonstrate correct technique. Videos are an effective teaching tool,9 and many of them are device-specific. National Jewish Health, which is world renowned for its asthma care, has a set of instructional videos posted on You-Tube and accessible from its Web site (http://www.nationaljewish.org/healthinfo/medications/lung-diseases/devices/instructional-videos). In addition to videos that demonstrate the use of an MDI alone and an MDI plus a valved holding chamber, the site has links to 6 DPI videos, each covering a different device.
Use intermittent observation. After the patient views the appropriate video, you or a member of your staff will still need to observe the patient’s inhaler technique to ensure correct use. Ideally, this should occur at every visit.1,37 When that’s not possible, use intermittent observation, starting with the first 2 or 3 visits after the introduction of inhalation therapy and then switching to periodic observation to ensure that the patient is maintaining good technique.
In determining how often observation is necessary, keep in mind that simply asking patients whether they are having inhaler problems is not sufficient.1 Patients tend to say they have little or no trouble when, in fact, most struggle, at times, with the devices. What’s more, good technique tends to decrease over time, and repetitive education is important.
To motivate patients, try this communication technique
Motivational interviewing, a technique that has been used to help patients battle obesity, quit smoking, and control hypertension,41-43 among other health problems, can help you identify inhaler problems that need to be addressed. It involves the use of open-ended questions (eg, “What worries you most about your asthma?”), affirmations (“You’ve done a great job testing your peak flow level every morning”), reflective listening (“You’re tired of taking medicine every day”), and summary statements (“You know you should take your medicine every day but you’re having trouble remembering it. Is that right?”).
A pilot study44 showed that when this technique was incorporated into an asthma education session, patient motivation increased. The ratio of perceived advantages vs disadvantages of taking asthma medication correctly improved, as well. Another study45 found that when motivational interviewing was used during home visits to inner-city African American adolescents for asthma care, the patients’ motivation, readiness to adhere to treatment, and asthma-related quality of life improved, although self-reported adherence to asthma medication did not. Further studies involving patients with asthma are under way (www.clinicaltrials.gov/ct2/results?term=asthma).
It is important to note that the use of motivational interviewing does not require a lengthy visit. One study found that on average, visits in which primary care physicians used this communication technique lasted less than 10 minutes.46
CORRESPONDENCE Timothy H. Self, PharmD, University of Tennessee Health Science Center, 881 Madison Avenue, Room 235, Memphis, TN 38163; [email protected]
1. National Heart, Lung, and Blood Institute; National Asthma Education and Prevention Program Expert Panel Report 3: Guidelines for the Diagnosis and Management of Asthma. Bethesda, MD: National Institutes of Health; 2007.
2. Centers for Disease Control and Prevention. National Center for Health Statistics: National health interview survey raw data, 2008. Analysis performed by American Lung Association Research and Program Services.
3. American Lung Association. COPD—Helping the missing millions. February 24, 2010. Available at: http://www.lungusa.org/about-us/our-impact/top-stories/copd-helping-the-missing.html. Accessed November 9, 2011.
4. Centers for Disease Control and Prevention. Chronic obstructive pulmonary disease surveillance—United States, 1971-2000. MMWR Surveill Summ. 2002;51(6):1-16.
5. Self TH, Kilgore KE, Shelton V. MDIs, spacers, and dry powder inhalers: what patients are likely to do wrong. Consultant. 2003;49:702-705.
6. Saunders KB. Misuse of inhaled bronchodilator agents. Br Med J. 1965;1:1037-1038.
7. Epstein SW, Manning CPR, Ashley MJ, et al. Survey of the clinical uses of pressurized aerosol inhalers. Can Med Assoc J. 1979;120:813-816.
8. Shim C, Williams MH. The adequacy of inhalation of aerosol from canister nebulizers. Am J Med. 1980;69:891-894.
9. Self TH, Brooks JB, Lieberman P, et al. The value of demonstration and role of the pharmacist in teaching the correct use of pressurized bronchodilators. Can Med Assoc J. 1983;128:129-131.
10. Hartert TV, Windom HH, Peeples RS, et al. Inadequate outpatient medical therapy for patients with asthma admitted to two urban hospitals. Am J Med. 1996;100:386-394.
11. Goodman DE, Israel E, Rosenberg M, et al. The influence of age, diagnosis, and gender on proper use of metered-dose inhalers. Am J Respir Crit Care Med. 1994;150:1256-1261.
12. Newman SP, Pavia D, Clarke SW. How should a pressurized beta-adrenergic bronchodilator be inhaled? Eur J Respir Dis. 1981;62:3-21.
13. Hilton S. An audit of inhaler technique among asthma patients of 34 general practitioners. Br J Gen Pract. 1990;40:505-506.
14. Dompeling E, Van Grunsven PM, Van Schayck GP, et al. Treatment with inhaled steroids in asthma and chronic bronchitis: long-term compliance and inhaler technique. Fam Pract. 1992;9:161-166.
15. Verver S, Poelman M, Bogels A, et al. Effects of instruction by practice assistants on inhaler technique and respiratory symptoms of patients. A controlled randomized videotaped intervention study. Fam Pract. 1996;13:35-40.
16. Dickinson J, Hutton S, Atkin A, et al. Reducing asthma morbidity in the community: the effect of a targeted nurse-run asthma clinic in an English general practice. Respir Med. 1997;91:634-640.
17. Hesselink AE, Penninx BW, Wijnhoven HA, et al. Determinants of an incorrect inhalation technique in patients with asthma or COPD. Scand J Prim Health Care. 2001;19:255-260.
18. Molimard M, Raherison C, Lignot S, et al. Assessment of handling of inhaler devices in real life: An observational study in 3811 patients in primary care. J Aerosol Med. 2003;16:249-254.
19. Meulepas MA, Jacobs JE, Smeenk FW, et al. Effect of an integrated primary care model on the management of middle-aged and old patients with obstructive lung diseases. Scand J Prim Health Care. 2007;25:186-192.
20. Giraud V, Roche N. Misuse of corticosteroid metered-dose inhaler is associated with decreased asthma stability. Eur Respir J. 2002;19:246-251.
21. Souza ML, Meneghini AC, Ferraz E, et al. Knowledge of and technique for using inhalation devices among asthma patients and COPD patients. J Bras Pneumol. 2009;35:824-831.
22. Rootmensen GN, van Keimpema AR, Jansen HM, et al. Predictors of incorrect inhalation technique in patients with asthma or COPD: a study using a validated videotaped scoring method. J Aerosol Med Pulm Drug Deliv. 2010;23:323-328.
23. Rachelefsky GS, Rohr AS, Wo J, et al. Use of a tube spacer to improve the efficacy of a metered dose inhaler in asthmatic children. Am J Dis Child. 1986;140:1191-1193.
24. Demirkan K, Tolley E, Mastin T, et al. Salmeterol administration by metered-dose inhaler alone vs metered-dose inhaler plus valved holding chamber. Chest. 2000;117:1314-1318.
25. Pedersen S, Ostergaard PA. Nasal inhalation as a cause of inefficient pulmonal aerosol inhalation technique in children. Allergy. 1983;38:191-194.
26. Dolovich MD, Ahrens RS, Hess DR, et al. Device selection an outcomes of aerosol therapy: evidence-based guidelines: American College of Chest Physicians/American College of Asthma, Allergy, and Immunology. Chest. 2005;127:335-371.
27. Interiano B, Guntupalli KK. Metered-dose inhalers: do health care providers know what to teach? Arch Intern Med. 1993;153:81-85.
28. Hanania NA, Wittman R, Kesten S, et al. Medical personnel’s knowledge of and ability to use inhaling devices. Metered-dose inhalers, spacing chambers, and breath-actuated dry powder inhalers. Chest. 1994;105:111-116.
29. Amirav I, Goren A, Pawlowski NA. What do pediatricians in training know about the correct use of inhalers and spacer devices? J Allergy Clin Immunol. 1994;94:669-675.
30. Chopra N, Oprescu N, Fask A, et al. Does introduction of new “easy to use” inhalational devices improve medical personnel’s knowledge of their proper use? Ann Allergy Asthma Immunol. 2002;88:395-400.
31. Self TH, Arnold LB, Czosnowski LM, et al. Inadequate skill of healthcare professionals in using asthma inhalation devices. J Asthma. 2007;44:593-598.
32. Lee-Wong M, Mayo PH. Results of a programme to improve house staff use of metered dose inhalers and spacers. Postgrad Med J. 2003;79:221-225.
33. Muchao FP, Pern SL, Rodriques JC, et al. Evaluation of the knowledge of health professionals at a pediatric hospital regarding the use of metered dose inhalers. J Bras Pneumol. 2008;34:4-12.
34. Kim SH, Kwak HJ, Kim TB, et al. Inappropriate techniques used by internal medicine residents with three kinds of inhalers (a metered dose inhaler, Diskus, and Turbuhaler): changes after a single teaching session. J Asthma. 2009;46:944-950.
35. Kelcher S, Brownoff R. Teaching residents to use asthma devices. Assessing family residents’ skill and a brief intervention. Can Fam Physician. 1994;40:2090-2095.
36. Press VG, Pincayage AT, Pappalardo AA, et al. The Chicago Breathe Project: a regional approach to improving education on asthma inhalers for resident physicians and minority patients. J Natl Med Assoc. 2010;102:548-555.
37. Global Initiative for Asthma (GINA). Global strategy for asthma management and prevention. 2010. Available at: www.ginasthma.org. Accessed November 9, 2011.
38. Executive Summary: global strategy on the diagnosis and management and prevention of chronic obstructive pulmonary disease. NHLBI/WHO Workshop Report, 2009. Available at: www.goldcopd.com. Accessed November 9, 2011.
39. Self TH, Chrisman CR, Mason DL, et al. Reducing emergency department visits and hospitalizations in African American and Hispanic patients: a 15-year review. J Asthma. 2005;42:807-812.
40. Armour C, Bosnic-Anticevich S, Brillant M, et al. Pharmacy asthma care program (PACP) improves outcomes for patients in the community. Thorax. 2007;62:496-502.
41. DiLillo V, Nicole J, West DS. Incorporating motivational interviewing into behavioral obesity treatment. Cogn Behav Pract. 2003;10:120-130.
42. Borrelli B, Novak S, Hecht J, et al. Home health care nurses as a new channel for smoking cessation treatment: outcomes from project CARES (Community-nurse Assisted Research and Education on Smoking). Prev Med. 2005;41:815-821.
43. Woollard L, Beilin L, Lord T, et al. A controlled trial of nurse counselling on lifestyle change for hypertensives treated in general practice: preliminary results. Clin Exp Pharmacol Physiol. 1995;22:466-468.
44. Schmaling K, Blume A, Afari N. A randomized controlled pilot study of motivational interviewing to change attitudes about adherence to medications for asthma. J Clin Psych Med Settings. 2001;8:167-172.
45. Riekert KA, Borrelli B, Bilderback A, et al. The development of a motivational interviewing intervention to promote medication adherence among inner-city, African-American adolescents with asthma. Patient Educ Couns. 2011;82:117-122.
46. Butler C, Rollnick S, Cohen D, et al. Motivational consulting versus brief advice for smokers in general practice: a randomized trial. Br J Gen Pract. 1999;49:611-616.
Bullying HURTs! Assessing and managing the bullied child
Technological developments—most notably, the increasing popularity of social networking sites such as Facebook—have led to a resurgence in the prevalence of bullying.1,2 The unlimited reach and anonymity of “cyber” bullying has introduced new challenges for pediatricians and child psychiatrists. Traditional bullying—defined as a specific form of aggression that is intentional, repeated, and involves a disparity of power between the victim and perpetrators—remains more common, with 54% of middle school students reporting verbal bullying, compared with 14% reporting at least 1 episode of electronic bullying over 2 months.2 Compared with students who weren’t bullied, middle and high school students who were bullied were 3 times more likely to report seriously considering suicide, engaging in intentional self-harm, being physically hurt by a family member, and witnessing violence in their families.3
Although bullying occurs frequently and is closely associated with several psychiatric conditions, including attention-deficit/hyperactivity disorder,4 depression,1 and anxiety,1 clinicians often don’t thoroughly assess patients to determine if they’ve been bullied and rarely intervene. The mnemonic HURT may aid in the clinical assessment and management of bullied children.
Help empower the child who is being bullied by encouraging him or her to find appropriate help from teachers, school counselors, or other resources, which may decrease the likelihood of psychological and physical consequences.
Understand the risk factors for being bullied, including less parental support,2 violent family encounters,3 and obesity,3 that may contribute to a child’s emotional experiences or behavior in ways that make him or her an easy target for bullying.2
Recognize a child who is at risk for being bullied and ask about his or her peer relations at school and use of online social networks. At-risk children warrant further evaluation for depression, anxiety, loneliness, and low self-esteem.
Teach the child why others engage in bullying so he or she may avoid actions and words that instigate or provoke a bully, and discuss techniques for dealing with confrontations.
Disclosures
Dr. Madaan is a consultant for The NOW Coalition for Bipolar Disorder and Avanir Pharmaceuticals and has pending research support from Merck and Otsuka.
Ms. Kepple reports no financial relationship with any company whose products are mentioned in this article or with manufacturers of competing products.
Acknowledgement
The authors would like to thank Sara Kepple for her assistance with this article.
1. Kowalski RM. Cyber bullying: recognizing and treating victim and aggressor. Psychiatric Times. October 1, 2008.
2. Wang J, Iannotti RJ, Nansel TR. School bullying among adolescents in the United States: physical, verbal, relational, and cyber. J Adolesc Health. 2009;45(4):368-375.
3. Centers for Disease Control and Prevention. Bullying among middle school and high school students—Massachusetts, 2009. MMWR Morb Mortal Wkly Rep. 2011;60(15):465-471.
4. Holmberg K. The association of bullying and health complaints in children with attention-deficit/hyperactivity disorder. Postgrad Med. 2010;122(5):62-68.
Technological developments—most notably, the increasing popularity of social networking sites such as Facebook—have led to a resurgence in the prevalence of bullying.1,2 The unlimited reach and anonymity of “cyber” bullying has introduced new challenges for pediatricians and child psychiatrists. Traditional bullying—defined as a specific form of aggression that is intentional, repeated, and involves a disparity of power between the victim and perpetrators—remains more common, with 54% of middle school students reporting verbal bullying, compared with 14% reporting at least 1 episode of electronic bullying over 2 months.2 Compared with students who weren’t bullied, middle and high school students who were bullied were 3 times more likely to report seriously considering suicide, engaging in intentional self-harm, being physically hurt by a family member, and witnessing violence in their families.3
Although bullying occurs frequently and is closely associated with several psychiatric conditions, including attention-deficit/hyperactivity disorder,4 depression,1 and anxiety,1 clinicians often don’t thoroughly assess patients to determine if they’ve been bullied and rarely intervene. The mnemonic HURT may aid in the clinical assessment and management of bullied children.
Help empower the child who is being bullied by encouraging him or her to find appropriate help from teachers, school counselors, or other resources, which may decrease the likelihood of psychological and physical consequences.
Understand the risk factors for being bullied, including less parental support,2 violent family encounters,3 and obesity,3 that may contribute to a child’s emotional experiences or behavior in ways that make him or her an easy target for bullying.2
Recognize a child who is at risk for being bullied and ask about his or her peer relations at school and use of online social networks. At-risk children warrant further evaluation for depression, anxiety, loneliness, and low self-esteem.
Teach the child why others engage in bullying so he or she may avoid actions and words that instigate or provoke a bully, and discuss techniques for dealing with confrontations.
Disclosures
Dr. Madaan is a consultant for The NOW Coalition for Bipolar Disorder and Avanir Pharmaceuticals and has pending research support from Merck and Otsuka.
Ms. Kepple reports no financial relationship with any company whose products are mentioned in this article or with manufacturers of competing products.
Acknowledgement
The authors would like to thank Sara Kepple for her assistance with this article.
1. Kowalski RM. Cyber bullying: recognizing and treating victim and aggressor. Psychiatric Times. October 1, 2008.
2. Wang J, Iannotti RJ, Nansel TR. School bullying among adolescents in the United States: physical, verbal, relational, and cyber. J Adolesc Health. 2009;45(4):368-375.
3. Centers for Disease Control and Prevention. Bullying among middle school and high school students—Massachusetts, 2009. MMWR Morb Mortal Wkly Rep. 2011;60(15):465-471.
4. Holmberg K. The association of bullying and health complaints in children with attention-deficit/hyperactivity disorder. Postgrad Med. 2010;122(5):62-68.
Psychotropic-induced dry mouth: Don’t overlook this potentially serious side effect
Discuss this article at www.facebook.com/CurrentPsychiatry
Xerostomia, commonly known as “dry mouth,” is a reported side effect of >1,800 drugs from >80 classes.1 This condition often goes unrecognized and untreated, but it can significantly affect patients’ quality of life and cause oral and medical health problems.2,3 Although psychotropic medications are not the only offenders, they comprise a large portion of the agents that can cause dry mouth. Antidepressants, anticonvulsants, anxiolytics, antipsychotics, anticholinergics, and alpha agonists can cause xerostomia.4 The risk of salivary hypofunction increases with polypharmacy and may be especially likely when ≥3 drugs are taken per day.5
Among all reported side effects of antidepressants and antipsychotics, dry mouth often is the most prevalent complaint. For example, in a study of 5 antidepressants 35% to 46% of patients reported dry mouth.6 Rates are similar in users of various antipsychotics. Patients with severe, persistent mental illness often cite side effects as the primary reason for psychotropic noncompliance.7-9
Few psychiatrists routinely screen patients for xerostomia, and if a patient reports this side effect, they may be unlikely to address it or understand its implications because of more pressing concerns such as psychosis or risk of suicide. Historically, education in general medical training about the effects of oral health on a patient’s overall health has been limited. It is crucial for psychiatrists to be aware of potential problems related to dry mouth and the impact it can have on their patients. In this article, we:
- describe how dry mouth can impact a patient’s oral, medical, and psychiatric health
- provide psychiatrists with an understanding of pathology related to xerostomia
- explain how psychiatrists can screen for xerostomia
- discuss the benefits patients may receive when psychiatrists collaborate with dental clinicians to manage this condition.
Implications of xerostomia
Saliva provides a protective function. It is an antimicrobial, buffering, and lubricating agent that aids cleansing and removal of food debris within the mouth. It also helps maintain oral mucosa and remineralizing of tooth structure.10
Psychotropics can affect the amount of saliva secreted and may alter the composition of saliva via their receptor affects on the dual sympathetic and parasympathetic innervations of the salivary glands.11 When the protective environment produced by saliva is altered, patients may start to develop oral problems before experiencing dryness. A 50% reduction in saliva flow may occur before they become aware of the problem.12,13
Patients may not taste food properly, experience cracked lips, or have trouble eating, oral pain, or dentures that no longer fit well.14 Additionally, oral diseases such as dental decay and periodontal disease (Photos 1 and 2), inflamed soft tissue, and candidiasis (Photo 3) also may occur.10,15 Patients may begin to notice dry mouth when they wake at night, which could disrupt sleep. Patients with xerostomia can accumulate excessive amounts of plaque on their teeth and the dorsum of the tongue. The increased bacterial count and release of volatile sulfide gases that occur with dry mouth may explain some cases of halitosis.16,17 Patients also may have difficulty swallowing or speaking and be unaware of the oral health destruction occurring as a result of reduced saliva. Some experts report oral bacteria levels can skyrocket as much as 10-fold in people who take medications that cause dry mouth.18
Infections of the mouth can create havoc elsewhere in the body. The evidence base that establishes an association between periodontal disease and other chronic inflammatory conditions such as diabetes, cardiovascular disease, cancer, and rheumatoid arthritis is steadily growing.19-22 Periodontal disease also is a risk factor for preeclampsia and other illnesses that can negatively affect neonatal health.23,24
Failure to recognize xerostomia caused by psychotropic medications may lead to an increase in cavities, periodontal disease, and chronic systemic inflammatory conditions that can shorten a patient’s life span. Recognizing and treating causes of xerostomia is vital because doing so may halt this chain of events.

Photo 1
This patient complained of dry mouth and exhibits decay (a) and evidence of periodontal disease. Plaque and calculus is present (b), along with gingival recession from the loss of attachment and bone (c). This patient was taking venlafaxine, zolpidem, and alprazolam
Photo 2
Dental cavities were restored with tooth-colored restorations (arrows) on this patient, who has xerostomia. Every effort must be made to manage this patient’s dry mouth or the restorations may fail due to recurrent decay
Photo 3
This partial denture wearer, who complained of dry mouth, has evidence of palatal irritation and sores as a result of xerostomia and use of a partial denture. This patient was taking bupropion, esomeprazole, and tolterodine
Psychiatric patients’ oral health
Psychiatric patients’ oral health status often is poor. Several studies found that compared with the general population, patients who have severe, persistent mental illness are at higher risk to be missing teeth, schedule fewer visits to the dentist, and neglect oral hygiene.25-28 Periodontal disease also could be a problem in these patients.29 Although some evidence suggests mental illness may make patients less likely to go to the dentist, psychotropic medications also may contribute to their dental difficulties.
Screening for xerostomia
Simply advising patients of the problems related to xerostomia and asking several questions may help prevent pain and deterioration in function within the oral cavity (Table 1).14,30
You can perform a simple in-office assessment of the oral cavity by visual inspection and by placing a dry tongue blade against the inside of the cheek mucosa. If the blade sticks to the mucosa and a gentle tug is needed to lift it away, xerostomia may be present.30 Conversely, a healthy mouth will have a collection of saliva on the floor of the oral cavity, and pulling a tongue blade away from the inside of the cheek will not require any effort (Photos 4 and 5).
Table 1
Screening questions for xerostomia
| Does the amount of saliva in your mouth seem to have decreased? |
| Do you have any trouble swallowing, speaking, or eating dry foods? |
| Do you sip liquids more often to help you swallow? |
| Do you notice any dryness or cracking of your lips? |
| Do you have mouth sores or a burning feeling in the mouth? |
| When was the last time you saw your dentist? (Patients with xerostomia may need to see their dentist more frequently) |
| Are you aware of any halitosis (ie, mouth odor)? |
| Source: Reference 14 |
Photo 4
The arrow shows the normal appearance of saliva collecting on the floor of the mouth
Photo 5
This patient complained of dry mouth. Note the floor of the mouth is free of saliva (a). Decay is present (b), and the patient is missing posterior teeth (c). This patient was taking clonidine, metoprolol, hydrochlorothiazide, amlodipine, and irbesartan
Treatment options
Patients who have reduced salivary flow as a result of a medication may become so affected by dryness that their drug regimen may need to be changed. However, the greatest concern is for deteriorating oral health among patients who may be unaware xerostomia is occurring.31
Counsel patients who take medications that can affect their salivary function about the importance of seeing a dentist regularly, and provide referrals when appropriate. Depending upon the patient’s oral health, dentists recommend patients with xerostomia have their teeth cleaned/examined 3 or 4 times per year, rather than the 2 times per year allowed by third-party payers (ie, insurance companies). Also advise patients to be diligent in their oral hygiene practices, including flossing and brushing the teeth and tongue, and to avoid foods that are sticky and/or have high sucrose content (Table 2). Recommend using a toothpaste containing fluoride—preferably one free of sodium lauryl sulfate, which could contribute to mouth sores14—and drinking fluoridated water. Explain to patients that their dentist may recommend in-office high-fluoride applications, high-fluoride prescription toothpaste, and/or “mouth trays” that contain high fluoride gel. Tell patients to avoid cigarettes and caffeinated beverages, which can increase dryness. Alcohol use should be minimized and mouth rinses containing alcohol should not be used.
Many over-the-counter products are available to address xerostomia, including toothpastes, mouth rinses, and gels. Salivary substitutes—which are available as sprays, liquids, tablets, and swab sticks—imitate saliva and may provide a temporary reprieve from dryness. Although none of these products will cure dry mouth, they may help manage the condition. Advise patients to eat foods that stimulate saliva production, such as carrots, apples, and celery, and to chew sugarless gum and candies, which also will stimulate salivary flow.
The FDA has approved 2 prescription drugs for treating xerostomia: cevimeline and pilocarpine. Cevimeline is approved for treating dry mouth associated with Sjögren’s syndrome and pilocarpine is approved for treating dry mouth caused by head and neck radiation therapy; however, these medications’ role in treating dry mouth in psychiatric patients has not been investigated. Both agents are contraindicated in patients with narrow-angle glaucoma, uncontrolled asthma, or liver disease, and should be prescribed with caution for patients with cardiovascular disease, chronic respiratory conditions, or kidney disease.32
Acupuncture and electrostimulation are being studied as a treatment for xerostomia. Trials have found acupuncture improves symptoms of xerostomia,33,34 and 1 study found electrostimulation improved xerostomia in patients with Sjögren’s syndrome.35 Both approaches require more study to confirm their effectiveness.33-35
Table 2
Managing dry mouth: What to tell patients
| Oral hygiene. Tell patients to be diligent in their oral hygiene practices, including brushing and flossing. They should use a toothpaste containing fluoride—preferably one free of sodium lauryl sulfate—and schedule regular dental visits, where they can receive high-fluoride applications or be prescribed high-fluoride prescription toothpastes |
| Diet. Advise patients to avoid foods high in sucrose content, rinse their mouth with water soon after eating, and drink fluoridated water regularly. Tell them that they may be able to stimulate saliva flow with sugarless gum, candies, and foods such as celery and carrots |
| Drying agents. Instruct patients to avoid cigarettes, caffeinated beverages, and mouth rinses that contain alcohol. Explain that some patients may benefit from sleeping in a room with a cool air humidifier |
| Over-the-counter products. Suggest patients try salivary substitutes, which are dispensed in spray bottles, rinses, swish bottles, or oral swab sticks. In addition, products such as dry-mouth toothpaste and moisturizing gels also may help relieve their symptoms |
- Persson K, Axtelius B, Söderfeldt B, et al. Monitoring oral health and dental attendance in an outpatient psychiatric population. J Psychiatr Ment Health Nurs. 2009;16(3):263-271.
- Keene JJ Jr, Galasko GT, Land MF. Antidepressant use in psychiatry and medicine: importance for dental practice. J Am Dent Assoc. 2003;134(1):71-79.
Drug Brand Names
- Alprazolam • Xanax
- Amlodipine • Norvasc
- Bupropion • Wellbutrin, Zyban
- Cevimeline • Evoxac
- Clonidine • Catapres, Kapvay, others
- Esomeprazole • Nexium
- Irbesartan • Avapro
- Metoprolol • Lopressor, Toprol
- Pilocarpine • Salagen
- Tolterodine • Detrol
- Venlafaxine • Effexor
- Zolpidem • Ambien
Disclosure
The authors report no financial relationship with any company whose products are mentioned in this article or with manufacturers of competing products.
1. Drymouth.info. Overview of drugs and dry mouth. http://drymouth.info/practitioner/overview.asp. Accessed September 2, 2011.
2. Stewart CM, Berg KM, Cha S, et al. Salivary dysfunction and quality of life in Sjögren syndrome: a critical oral-systemic connection. J Am Dent Assoc. 2008;139(3):291-299.
3. Friedman PK. Xerostomia: The invisible oral health condition. http://www.dentistryiq.com/index/display/article-display/295922/articles/woman-dentist-journal/health/xerostomia-the-invisible-oral-health-condition.html. Accessed September 6, 2011.
4. Physician Desk Reference. Montvale NJ: PDR Network LLC.; 2011.
5. Bardow A, Lagerlof F, Nauntofte B, et al. The role of saliva. In: Fejerskov O, Kidd E, eds. Dental caries: the disease and its clinical management. Oxford, United Kingdom: Blackwell Munksgaard; 2008:195.
6. Vanderkooy JD, Kennedy SH, Bagby RM. Antidepressant side effects in depression patients treated in a naturalistic setting: a study of bupropion moclobemide, paroxetine, sertraline, and venlafaxine. Can J Psychiatry. 2002;47(2):174-180.
7. Löffler W, Kilian R, Toumi M, et al. Schizophrenic patients’ subjective reasons for compliance and noncompliance with neuroleptic treatment. Pharmacopsychiatry. 2003;36(3):105-112.
8. Lambert M, Conus P, Eide P, et al. Impact of present and past antipsychotic side effects on attitude toward typical antipsychotic treatment and adherence. Eur Psychiatry. 2004;19(7):415-422.
9. Rettenbacher MA, Hofer A, Eder U, et al. Compliance in schizophrenia: psychopathology, side effects, and patients’ attitudes toward the illness and medication. J Clin Psychiatry. 2004;65(9):1211-1218.
10. Bulkacz J, Carranza FA. Defense mechanisms of the gingiva. In: Newman MG, Takei HH, Klokkevold PR, et al, eds. Carranza’s clinical periodontology. St. Louis, MO: Elsevier Saunders; 2011:69–70.
11. Szabadi E, Tavernor S. Hypo-and hyper-salivation induced by psychoactive drugs. CNS Drugs. 1999;11(6):449-466.
12. Guggenheimer J, Moore PA. Xerostomia: etiology recognition and treatment. J Am Dent Assoc. 2003;134(1):61-69.
13. Dawes C. Physiological factors affecting salivary flow rate oral sugar clearance, and the sensation of dry mouth in man. J Dent Res. 1987;66:648-653.
14. Bartels CL. Xerostomia information for dentists. http://www.homesteadschools.com/dental/courses/Xerostomia/Course.htm. Accessed August 15, 2011.
15. Sitheeque MA, Samaranayake LP. Chronic hyperplastic candidosis/candidiasis (candidal leukoplakia). Crit Rev Oral Biol Med. 2003;14(4):253-267.
16. Porter SR, Scully C. Oral malodour (halitosis). BMJ. 2006;333(7569):632-635.
17. Quirynen M, Van den Veide S, Vanderkerckhove B, et al. Oral malodor. In: Newman MG, Takei HH, Klokkevold PR, et al, eds. Carranza’s clinical periodontology. St. Louis, MO: Elsevier Saunders; 2011:333.
18. Papas A. Dry mouth from drugs: more than just an annoying side effect. Tufts University Heath and Nutrition Letter. 2000;3.-
19. American Academy of Periodontology. Gum disease information from the American Academy of Periodontology http://perio.org. Accessed August 12, 2011.
20. Geismar K, Stoltze K, Sigurd B, et al. Periodontal disease and coronary heart disease. J Periodontol. 2006;77(9):1547-1554.
21. Lee HJ, Garcia RI, Janket SJ, et al. The association between cumulative periodontal disease and stroke history in older adults. J Periodontol. 2006;77(10):1744-1754.
22. Friedewald VE, Kornman KS, Beck JD, et al. The American Journal of Cardiology and Journal of Periodontology editors’ consensus: periodontitis and atherosclerotic cardiovascular disease. J Periodontol. 2009;80(7):1021-1032.
23. Contreras A, Herrera JA, Soto JE, et al. Periodontitis is associated with preeclampsia in pregnant women. J Periodontol. 2006;77(2):182-188.
24. Dasanayake AP, Li Y, Wiener H, et al. Salivary Actinomyces naeslundii genospecies 2 and Lactobacillus casei levels predict pregnancy outcomes. J Periodontol. 2005;76(2):171-177.
25. McCreadie RG, Stevens H, Henderson J, et al. The dental health of people with schizophrenia. Acta Psychiatr Scand. 2004;110(4):306-310.
26. Anttila S, Knuuttila M, Ylöstalo P, et al. Symptoms of depression and anxiety in relation to dental health behavior and self-perceived dental treatment need. Eur J Oral Sci. 2006;114(2):109-114.
27. Sjögren R, Nordström G. Oral health status of psychiatric patients. J Clin Nurs. 2000;9(4):632-638.
28. Ramon T, Grinshpoon A, Zusman SP, et al. Oral health and treatment needs of institutionalized chronic psychiatric patients in Israel. Eur Psychiatry. 2003;18(3):101-105.
29. Portilla MI, Mafla AC, Arteaga JJ. Periodontal status in female psychiatric patients. Colomb Med. 2009;40(2):167-176.
30. Navazesh M. ADA Council on Scientific Affairs and Division of Science. How can oral health care providers determine if patients have dry mouth? J Am Dent Assoc. 2003;134(5):613-620.
31. Mignogna MD, Fedele S, Lo Russo L, et al. Sjögren’s syndrome: the diagnostic potential of early oral manifestations preceding hyposalivation/xerostomia. J Oral Pathol Med. 2005;34(1):1-6.
32. Spolarich AE. Managing the side effects of medications. J Dent Hyg. 2000;74(1):57-69.
33. Johnstone PA, Niemtzow RC, Riffenburgh RH. Acupuncture for xerostomia: clinical update. Cancer. 2002;94(4):1151-1156.
34. Garcia MK, Chiang JS, Cohen L, et al. Acupuncture for radiation-induced xerostomia in patients with cancer: a pilot study. Head Neck. 2009;31(10):1360-1368.
35. Strietzel FP, Lafaurie GI, Mendoza GR, et al. Efficacy and safety of an intraoral electrostimulation device for xerostomia relief: a multicenter, randomized trial. Arthritis Rheum. 2011;63(1):180-190.
Discuss this article at www.facebook.com/CurrentPsychiatry
Xerostomia, commonly known as “dry mouth,” is a reported side effect of >1,800 drugs from >80 classes.1 This condition often goes unrecognized and untreated, but it can significantly affect patients’ quality of life and cause oral and medical health problems.2,3 Although psychotropic medications are not the only offenders, they comprise a large portion of the agents that can cause dry mouth. Antidepressants, anticonvulsants, anxiolytics, antipsychotics, anticholinergics, and alpha agonists can cause xerostomia.4 The risk of salivary hypofunction increases with polypharmacy and may be especially likely when ≥3 drugs are taken per day.5
Among all reported side effects of antidepressants and antipsychotics, dry mouth often is the most prevalent complaint. For example, in a study of 5 antidepressants 35% to 46% of patients reported dry mouth.6 Rates are similar in users of various antipsychotics. Patients with severe, persistent mental illness often cite side effects as the primary reason for psychotropic noncompliance.7-9
Few psychiatrists routinely screen patients for xerostomia, and if a patient reports this side effect, they may be unlikely to address it or understand its implications because of more pressing concerns such as psychosis or risk of suicide. Historically, education in general medical training about the effects of oral health on a patient’s overall health has been limited. It is crucial for psychiatrists to be aware of potential problems related to dry mouth and the impact it can have on their patients. In this article, we:
- describe how dry mouth can impact a patient’s oral, medical, and psychiatric health
- provide psychiatrists with an understanding of pathology related to xerostomia
- explain how psychiatrists can screen for xerostomia
- discuss the benefits patients may receive when psychiatrists collaborate with dental clinicians to manage this condition.
Implications of xerostomia
Saliva provides a protective function. It is an antimicrobial, buffering, and lubricating agent that aids cleansing and removal of food debris within the mouth. It also helps maintain oral mucosa and remineralizing of tooth structure.10
Psychotropics can affect the amount of saliva secreted and may alter the composition of saliva via their receptor affects on the dual sympathetic and parasympathetic innervations of the salivary glands.11 When the protective environment produced by saliva is altered, patients may start to develop oral problems before experiencing dryness. A 50% reduction in saliva flow may occur before they become aware of the problem.12,13
Patients may not taste food properly, experience cracked lips, or have trouble eating, oral pain, or dentures that no longer fit well.14 Additionally, oral diseases such as dental decay and periodontal disease (Photos 1 and 2), inflamed soft tissue, and candidiasis (Photo 3) also may occur.10,15 Patients may begin to notice dry mouth when they wake at night, which could disrupt sleep. Patients with xerostomia can accumulate excessive amounts of plaque on their teeth and the dorsum of the tongue. The increased bacterial count and release of volatile sulfide gases that occur with dry mouth may explain some cases of halitosis.16,17 Patients also may have difficulty swallowing or speaking and be unaware of the oral health destruction occurring as a result of reduced saliva. Some experts report oral bacteria levels can skyrocket as much as 10-fold in people who take medications that cause dry mouth.18
Infections of the mouth can create havoc elsewhere in the body. The evidence base that establishes an association between periodontal disease and other chronic inflammatory conditions such as diabetes, cardiovascular disease, cancer, and rheumatoid arthritis is steadily growing.19-22 Periodontal disease also is a risk factor for preeclampsia and other illnesses that can negatively affect neonatal health.23,24
Failure to recognize xerostomia caused by psychotropic medications may lead to an increase in cavities, periodontal disease, and chronic systemic inflammatory conditions that can shorten a patient’s life span. Recognizing and treating causes of xerostomia is vital because doing so may halt this chain of events.
Photo 1
This patient complained of dry mouth and exhibits decay (a) and evidence of periodontal disease. Plaque and calculus is present (b), along with gingival recession from the loss of attachment and bone (c). This patient was taking venlafaxine, zolpidem, and alprazolam
Photo 2
Dental cavities were restored with tooth-colored restorations (arrows) on this patient, who has xerostomia. Every effort must be made to manage this patient’s dry mouth or the restorations may fail due to recurrent decay
Photo 3
This partial denture wearer, who complained of dry mouth, has evidence of palatal irritation and sores as a result of xerostomia and use of a partial denture. This patient was taking bupropion, esomeprazole, and tolterodine
Psychiatric patients’ oral health
Psychiatric patients’ oral health status often is poor. Several studies found that compared with the general population, patients who have severe, persistent mental illness are at higher risk to be missing teeth, schedule fewer visits to the dentist, and neglect oral hygiene.25-28 Periodontal disease also could be a problem in these patients.29 Although some evidence suggests mental illness may make patients less likely to go to the dentist, psychotropic medications also may contribute to their dental difficulties.
Screening for xerostomia
Simply advising patients of the problems related to xerostomia and asking several questions may help prevent pain and deterioration in function within the oral cavity (Table 1).14,30
You can perform a simple in-office assessment of the oral cavity by visual inspection and by placing a dry tongue blade against the inside of the cheek mucosa. If the blade sticks to the mucosa and a gentle tug is needed to lift it away, xerostomia may be present.30 Conversely, a healthy mouth will have a collection of saliva on the floor of the oral cavity, and pulling a tongue blade away from the inside of the cheek will not require any effort (Photos 4 and 5).
Table 1
Screening questions for xerostomia
| Does the amount of saliva in your mouth seem to have decreased? |
| Do you have any trouble swallowing, speaking, or eating dry foods? |
| Do you sip liquids more often to help you swallow? |
| Do you notice any dryness or cracking of your lips? |
| Do you have mouth sores or a burning feeling in the mouth? |
| When was the last time you saw your dentist? (Patients with xerostomia may need to see their dentist more frequently) |
| Are you aware of any halitosis (ie, mouth odor)? |
| Source: Reference 14 |
Photo 4
The arrow shows the normal appearance of saliva collecting on the floor of the mouth
Photo 5
This patient complained of dry mouth. Note the floor of the mouth is free of saliva (a). Decay is present (b), and the patient is missing posterior teeth (c). This patient was taking clonidine, metoprolol, hydrochlorothiazide, amlodipine, and irbesartan
Treatment options
Patients who have reduced salivary flow as a result of a medication may become so affected by dryness that their drug regimen may need to be changed. However, the greatest concern is for deteriorating oral health among patients who may be unaware xerostomia is occurring.31
Counsel patients who take medications that can affect their salivary function about the importance of seeing a dentist regularly, and provide referrals when appropriate. Depending upon the patient’s oral health, dentists recommend patients with xerostomia have their teeth cleaned/examined 3 or 4 times per year, rather than the 2 times per year allowed by third-party payers (ie, insurance companies). Also advise patients to be diligent in their oral hygiene practices, including flossing and brushing the teeth and tongue, and to avoid foods that are sticky and/or have high sucrose content (Table 2). Recommend using a toothpaste containing fluoride—preferably one free of sodium lauryl sulfate, which could contribute to mouth sores14—and drinking fluoridated water. Explain to patients that their dentist may recommend in-office high-fluoride applications, high-fluoride prescription toothpaste, and/or “mouth trays” that contain high fluoride gel. Tell patients to avoid cigarettes and caffeinated beverages, which can increase dryness. Alcohol use should be minimized and mouth rinses containing alcohol should not be used.
Many over-the-counter products are available to address xerostomia, including toothpastes, mouth rinses, and gels. Salivary substitutes—which are available as sprays, liquids, tablets, and swab sticks—imitate saliva and may provide a temporary reprieve from dryness. Although none of these products will cure dry mouth, they may help manage the condition. Advise patients to eat foods that stimulate saliva production, such as carrots, apples, and celery, and to chew sugarless gum and candies, which also will stimulate salivary flow.
The FDA has approved 2 prescription drugs for treating xerostomia: cevimeline and pilocarpine. Cevimeline is approved for treating dry mouth associated with Sjögren’s syndrome and pilocarpine is approved for treating dry mouth caused by head and neck radiation therapy; however, these medications’ role in treating dry mouth in psychiatric patients has not been investigated. Both agents are contraindicated in patients with narrow-angle glaucoma, uncontrolled asthma, or liver disease, and should be prescribed with caution for patients with cardiovascular disease, chronic respiratory conditions, or kidney disease.32
Acupuncture and electrostimulation are being studied as a treatment for xerostomia. Trials have found acupuncture improves symptoms of xerostomia,33,34 and 1 study found electrostimulation improved xerostomia in patients with Sjögren’s syndrome.35 Both approaches require more study to confirm their effectiveness.33-35
Table 2
Managing dry mouth: What to tell patients
| Oral hygiene. Tell patients to be diligent in their oral hygiene practices, including brushing and flossing. They should use a toothpaste containing fluoride—preferably one free of sodium lauryl sulfate—and schedule regular dental visits, where they can receive high-fluoride applications or be prescribed high-fluoride prescription toothpastes |
| Diet. Advise patients to avoid foods high in sucrose content, rinse their mouth with water soon after eating, and drink fluoridated water regularly. Tell them that they may be able to stimulate saliva flow with sugarless gum, candies, and foods such as celery and carrots |
| Drying agents. Instruct patients to avoid cigarettes, caffeinated beverages, and mouth rinses that contain alcohol. Explain that some patients may benefit from sleeping in a room with a cool air humidifier |
| Over-the-counter products. Suggest patients try salivary substitutes, which are dispensed in spray bottles, rinses, swish bottles, or oral swab sticks. In addition, products such as dry-mouth toothpaste and moisturizing gels also may help relieve their symptoms |
- Persson K, Axtelius B, Söderfeldt B, et al. Monitoring oral health and dental attendance in an outpatient psychiatric population. J Psychiatr Ment Health Nurs. 2009;16(3):263-271.
- Keene JJ Jr, Galasko GT, Land MF. Antidepressant use in psychiatry and medicine: importance for dental practice. J Am Dent Assoc. 2003;134(1):71-79.
Drug Brand Names
- Alprazolam • Xanax
- Amlodipine • Norvasc
- Bupropion • Wellbutrin, Zyban
- Cevimeline • Evoxac
- Clonidine • Catapres, Kapvay, others
- Esomeprazole • Nexium
- Irbesartan • Avapro
- Metoprolol • Lopressor, Toprol
- Pilocarpine • Salagen
- Tolterodine • Detrol
- Venlafaxine • Effexor
- Zolpidem • Ambien
Disclosure
The authors report no financial relationship with any company whose products are mentioned in this article or with manufacturers of competing products.
1. Drymouth.info. Overview of drugs and dry mouth. http://drymouth.info/practitioner/overview.asp. Accessed September 2, 2011.
2. Stewart CM, Berg KM, Cha S, et al. Salivary dysfunction and quality of life in Sjögren syndrome: a critical oral-systemic connection. J Am Dent Assoc. 2008;139(3):291-299.
3. Friedman PK. Xerostomia: The invisible oral health condition. http://www.dentistryiq.com/index/display/article-display/295922/articles/woman-dentist-journal/health/xerostomia-the-invisible-oral-health-condition.html. Accessed September 6, 2011.
4. Physician Desk Reference. Montvale NJ: PDR Network LLC.; 2011.
5. Bardow A, Lagerlof F, Nauntofte B, et al. The role of saliva. In: Fejerskov O, Kidd E, eds. Dental caries: the disease and its clinical management. Oxford, United Kingdom: Blackwell Munksgaard; 2008:195.
6. Vanderkooy JD, Kennedy SH, Bagby RM. Antidepressant side effects in depression patients treated in a naturalistic setting: a study of bupropion moclobemide, paroxetine, sertraline, and venlafaxine. Can J Psychiatry. 2002;47(2):174-180.
7. Löffler W, Kilian R, Toumi M, et al. Schizophrenic patients’ subjective reasons for compliance and noncompliance with neuroleptic treatment. Pharmacopsychiatry. 2003;36(3):105-112.
8. Lambert M, Conus P, Eide P, et al. Impact of present and past antipsychotic side effects on attitude toward typical antipsychotic treatment and adherence. Eur Psychiatry. 2004;19(7):415-422.
9. Rettenbacher MA, Hofer A, Eder U, et al. Compliance in schizophrenia: psychopathology, side effects, and patients’ attitudes toward the illness and medication. J Clin Psychiatry. 2004;65(9):1211-1218.
10. Bulkacz J, Carranza FA. Defense mechanisms of the gingiva. In: Newman MG, Takei HH, Klokkevold PR, et al, eds. Carranza’s clinical periodontology. St. Louis, MO: Elsevier Saunders; 2011:69–70.
11. Szabadi E, Tavernor S. Hypo-and hyper-salivation induced by psychoactive drugs. CNS Drugs. 1999;11(6):449-466.
12. Guggenheimer J, Moore PA. Xerostomia: etiology recognition and treatment. J Am Dent Assoc. 2003;134(1):61-69.
13. Dawes C. Physiological factors affecting salivary flow rate oral sugar clearance, and the sensation of dry mouth in man. J Dent Res. 1987;66:648-653.
14. Bartels CL. Xerostomia information for dentists. http://www.homesteadschools.com/dental/courses/Xerostomia/Course.htm. Accessed August 15, 2011.
15. Sitheeque MA, Samaranayake LP. Chronic hyperplastic candidosis/candidiasis (candidal leukoplakia). Crit Rev Oral Biol Med. 2003;14(4):253-267.
16. Porter SR, Scully C. Oral malodour (halitosis). BMJ. 2006;333(7569):632-635.
17. Quirynen M, Van den Veide S, Vanderkerckhove B, et al. Oral malodor. In: Newman MG, Takei HH, Klokkevold PR, et al, eds. Carranza’s clinical periodontology. St. Louis, MO: Elsevier Saunders; 2011:333.
18. Papas A. Dry mouth from drugs: more than just an annoying side effect. Tufts University Heath and Nutrition Letter. 2000;3.-
19. American Academy of Periodontology. Gum disease information from the American Academy of Periodontology http://perio.org. Accessed August 12, 2011.
20. Geismar K, Stoltze K, Sigurd B, et al. Periodontal disease and coronary heart disease. J Periodontol. 2006;77(9):1547-1554.
21. Lee HJ, Garcia RI, Janket SJ, et al. The association between cumulative periodontal disease and stroke history in older adults. J Periodontol. 2006;77(10):1744-1754.
22. Friedewald VE, Kornman KS, Beck JD, et al. The American Journal of Cardiology and Journal of Periodontology editors’ consensus: periodontitis and atherosclerotic cardiovascular disease. J Periodontol. 2009;80(7):1021-1032.
23. Contreras A, Herrera JA, Soto JE, et al. Periodontitis is associated with preeclampsia in pregnant women. J Periodontol. 2006;77(2):182-188.
24. Dasanayake AP, Li Y, Wiener H, et al. Salivary Actinomyces naeslundii genospecies 2 and Lactobacillus casei levels predict pregnancy outcomes. J Periodontol. 2005;76(2):171-177.
25. McCreadie RG, Stevens H, Henderson J, et al. The dental health of people with schizophrenia. Acta Psychiatr Scand. 2004;110(4):306-310.
26. Anttila S, Knuuttila M, Ylöstalo P, et al. Symptoms of depression and anxiety in relation to dental health behavior and self-perceived dental treatment need. Eur J Oral Sci. 2006;114(2):109-114.
27. Sjögren R, Nordström G. Oral health status of psychiatric patients. J Clin Nurs. 2000;9(4):632-638.
28. Ramon T, Grinshpoon A, Zusman SP, et al. Oral health and treatment needs of institutionalized chronic psychiatric patients in Israel. Eur Psychiatry. 2003;18(3):101-105.
29. Portilla MI, Mafla AC, Arteaga JJ. Periodontal status in female psychiatric patients. Colomb Med. 2009;40(2):167-176.
30. Navazesh M. ADA Council on Scientific Affairs and Division of Science. How can oral health care providers determine if patients have dry mouth? J Am Dent Assoc. 2003;134(5):613-620.
31. Mignogna MD, Fedele S, Lo Russo L, et al. Sjögren’s syndrome: the diagnostic potential of early oral manifestations preceding hyposalivation/xerostomia. J Oral Pathol Med. 2005;34(1):1-6.
32. Spolarich AE. Managing the side effects of medications. J Dent Hyg. 2000;74(1):57-69.
33. Johnstone PA, Niemtzow RC, Riffenburgh RH. Acupuncture for xerostomia: clinical update. Cancer. 2002;94(4):1151-1156.
34. Garcia MK, Chiang JS, Cohen L, et al. Acupuncture for radiation-induced xerostomia in patients with cancer: a pilot study. Head Neck. 2009;31(10):1360-1368.
35. Strietzel FP, Lafaurie GI, Mendoza GR, et al. Efficacy and safety of an intraoral electrostimulation device for xerostomia relief: a multicenter, randomized trial. Arthritis Rheum. 2011;63(1):180-190.
Practicing psychiatry via Skype: Medicolegal considerations
Dear Dr. Mossman:
I practice in a region with few psychiatrists and very little public transportation. For many patients, coming to my office is inconvenient, expensive, or time-consuming. Sometimes, their emotional problems make it hard for them to travel, and sometimes, bad weather makes travel difficult. I am considering providing remote treatment via Skype. Is this a reasonable idea? What are the risks of using this technology in my practice? — Submitted by “Dr. A”
Diagnosing and treating patients without a face-to-face encounter is not new. Doctors have provided “remote treatment” since shortly after telephones were invented.1 Until recently, however, forensic psychiatrists advised colleagues not to diagnose patients or start treatment based on phone contact alone.2
The Internet has revolutionized our attitudes about many things. Communication technologies that seemed miraculous a generation ago have become commonplace and have transformed standards for ordinary and “acceptable” human contact. A quick Internet search of “telephone psychotherapy” turns up hundreds of mental health professionals who offer remote treatment services to patients via computers and Web cams.
Physicians in many specialties practice telemedicine, often with the support and encouragement of state governments and third-party payers. To decide whether to include telepsychiatry in your psychiatric practice, you should know:
- what “telemedicine” means and includes
- the possible advantages of offering remote health care
- potential risks and ambiguity about legal matters.
Defining telemedicine
Studies of remote, closed-circuit “telediagnosis” extend back more than 4 decades, closely following mid-20th century advancements in audio and video relay technologies that made space broadcasts possible.3 Then as now, “telemedicine” simply means conveying health-related information from 1 site to another for diagnostic or treatment purposes.4 It’s an adaptation of available technology to deliver care more easily, with the goal of improving patients’ access to care and health status.
Telemedicine usage accelerated as the Internet and related technologies developed. Telemedicine programs in the United States increased by 1,500% from 1993 to 1998.4 Telemedicine use has grown 10% annually in recent years and has become a $4 billion per year industry in the United States.5 Recently enacted federal legislation is likely to extend health care coverage to 36 million Americans and require coverage of pre-existing conditions. To make these changes affordable, health care delivery will need to exploit new, efficiency-enhancing technologies.6
Advantages of telemedicine
State governments and some third-party payers have recognized that telemedicine can overcome geographic and cost barriers to health services and patient education.5,7-9 Although closed-circuit video transmission has served this purpose for some time, Skype—free software that allows individuals to make video phone calls over the Internet using their computers—is an option that doctors are using to treat patients.10-12
Research suggests that telepsychiatry may provide huge benefits to medically underserved areas while reducing health care costs.4 Telepsychiatry can reduce travel time and expenses for professionals and patients, and it also may lower wait times and “no-show” rates (Table 1).4 Telepsychiatry lets patients see caregivers when winter weather makes roads unsafe. It may allow geriatric patients who can no longer drive to access psychiatric care and it lowers health care’s “carbon footprint,” making it “eco-friendly.”13
Social media strategies are playing an expanding role in medical education,14,15 and this probably will help practitioners feel more at ease about incorporating the underlying technologies into work with patients. Increased use of laptops and mobile phones lends itself well to telepsychiatry applications,13 and studies have examined the feasibility of psychotherapies delivered via remote communication devices.16 Smartphone apps are being designed to assist mental health professionals17 and consumers.18
Table 1
Potential benefits of telemedicine
| Category | Benefit(s) |
|---|---|
| Access | Patients can see specialists more readily Addresses regional doctor shortages Reduces health care disparities between urban and rural areas |
| Urgent care | Facilitates information transfer for rapid interventions |
| Productivity | Provides a conduit for clinicians to share skills and expertise Facilitates remote monitoring and home care |
| Cost | No travel costs Alternative revenue stream for health care organizations that offer more broadly delivered medical services |
| Patient-centric care | Care is taken to the patient Translator services are more readily available |
| Source: Reference 4 | |
Potential pitfalls and drawbacks
Although convenience, access, cost, and fossil fuel savings may favor video-chat doctor visits, telemedicine has downsides, some of which apply specifically to psychiatry. First, no current technology provides psychiatrists with “the rich multidimensional aspects of a person-to-person encounter,”19 and remote communication may change what patients tell us, how they feel when they tell us things, and how they feel when we respond. Often, an inherent awkwardness affects many forms of Internet communication.20
Also uncertain is whether Skype is compliant with the Health Insurance Portability and Accountability Act and protects doctor-patient privacy well enough to satisfy ethical standards—although it probably is far better than e-mail in this regard. Third-party payers often will not reimburse for telephone calls and may balk at paying for Skype-based therapy, even in states that require insurers to reimburse for telemedicine.
Psychiatrists typically have limited physical contact with patients, but we often check weight and vital signs when we prescribe certain psychotropic medications. Results from home- and drugstore-based blood pressure monitors may not be accurate enough for treatment purposes. Remote communication also reduces the quality of visual information,20 which can be crucial—for example, when good lighting and visual resolution is needed to decide whether a skin rash might be drug-induced.
Telemedicine raises concerns about licensure and meeting adequate standards of care. Medical care usually is deemed to have occurred in the state where the patient is located. For example, only physicians licensed to practice medicine in California are legally permitted to treat patients in California. As is the case with any treatment, care delivered via telemedicine must include appropriate patient examination and diagnosis.21
Help and guidance
Despite these potential drawbacks, many state agencies recognize the promise of telemedicine, and have developed networks to promote it (Table 2).7-9,22,23 These networks have various goals but share a common pattern of establishing infrastructure, policies, and organized results. In the future, states may adopt laws or regulations that address conflicts in malpractice standards and liability coverage, licensing, accreditation, reimbursement, privacy, and data protection policies that now may impede or inhibit use of telepsychiatric services across jurisdictional boundaries. Last year, Ohio produced regulations to guide psychiatrists in prescribing medication remotely without an in-person examination. The University of Hawaii suggested steps that its state legislature might take to help providers predict the potential legal ramifications of telemedicine.6
Further help for telepsychiatry practitioners may be found in practice standards and guidelines developed by the American Telemedicine Association.24,25 These documents gave guidance and support for the practice of telemedicine and for providing appropriate telepsychiatry health services.
Table 2
Telemedicine services available in different states
| State/Network | Description |
|---|---|
| Arizona www.narbha.org7 | The Northern Arizona Regional Behavioral Health Authority manages a comprehensive telemental health network (NARBHAnet) that uses 2-way videoconferencing to connect mental health experts and patients. It has provided >50,000 clinical psychiatric sessions |
| Kansas www.kumc.edu8 | The University of Kansas Medical Center provides specialty services (including telepsychiatry) through 14 clinical sites in rural Kansas. Cost-sharing helps the telepsychiatric application be successful |
| Montana www.emtn.org9 | Eastern Montana Telemedicine Network is a consortium of not-for-profit facilities that link health care providers and their patients in Montana and Wyoming. This telemental health network includes shared sites for all physicians practicing in the network and has yielded large out-of-pocket savings for patients |
| Oregon www.ortelehealth.org22 | The Telehealth Alliance of Oregon, which began in 2001 as a committee of the Oregon Telecommunications Coordinating Council, was created by the legislature and has served as advisors to the governor and the legislature regarding telecommunications in Oregon |
| Texas www.jsahealthmd.com23 | The Burke Center provides services to people in 12 counties in East Texas. It uses telepsychiatry services to conduct emergency evaluations, therefore keeping people in mental health crises out of emergency rooms |
What should Dr. A do?
In answer to Dr. A’s question, many factors favor including telepsychiatry in her practice. Yet we know little about the accuracy and reliability of psychiatric assessments made solely via Skype or other remote video technology in ordinary practice. Legislation and legal rules about acceptable practices are ambiguous, although in the absence of clear guidance, psychiatrists should assume that all usual professional standards and expectations about adequate care apply to treatment via Skype or other remote communication methods.
Related Resources
- Skype. www.skype.com.
- American Telemedicine Association. www.americantelemed.org.
1. Lipman M. The doctor will Skype you now. Consum Rep. 2011;76(8):12.-
2. Simon RI. Clinical psychiatry and the law. 2nd ed. Washington DC: American Psychiatric Press; 1992.
3. Murphy RL, Jr, Bird KT. Telediagnosis: a new community health resource. Observations on the feasibility of telediagnosis based on 1000 patient transactions. Am J Public Health. 1974;64(2):113-119.
4. Hilty DM, Yellowlees PM, Cobb HC, et al. Models of telepsychiatric consultation—liaison service to rural primary care. Psychosomatics. 2006;47(2):152-157.
5. Freudenheim M. The doctor will see you now. Please log on. New York Times. May 29 2010:BU1.
6. University of Hawai’i. Report to the 2009 legislature: preliminary report by the John A. Burns School of Medicine on the current practices of Hawai’i telemedicine system for 2009. http://www.hawaii.edu/offices/eaur/govrel/reports/2009. Published November 2008. Accessed September 27 2011.
7. Northern Arizona Regional Behavioral Health Authority. http://www.narbha.org. Accessed September 27 2011.
8. University of Kansas Medical Center. http://www.kumc.edu. Accessed September 27 2011.
9. Eastern Montana Telemedicine Network. http://www.emtn.org. Accessed September 27 2011.
10. Ciccia AH, Whitford B, Krumm M, et al. Improving the access of young urban children to speech, language and hearing screening via telehealth. J Telemed Telecare. 2011;17(5):240-244.
11. Hori M, Kubota M, Ando K, et al. The effect of videophone communication (with skype and webcam) for elderly patients with dementia and their caregivers [in Japanese]. Gan To Kagaku Ryoho. 2009;36(suppl 1):36-38.
12. Klock C, Gomes Rde P. Web conferencing systems: Skype and MSN in telepathology. Diagn Pathol. 2008;3(suppl 1):S13.-
13. Luo J. VoIP: The right call for your practice? Current Psychiatry. 2005;4(10):24-27.
14. George DR, Dellasega C. Use of social media in graduate-level medical humanities education: two pilot studies from Penn State College of Medicine. Med Teach. 2011;33(8):e429-434.
15. Lillis S, Gibbons V, Lawrenson R. The experience of final year medical students undertaking a general practice run with a distance education component. Rural Remote Health. 2010;10(1):1268.-
16. Bee PE, Bower P, Lovell K, et al. Psychotherapy mediated by remote communication technologies: a meta-analytic review. BMC Psychiatry. 2008;8:60.-
17. Maheu MM. iPhone app reviews for psychologists and mental health professionals. http://telehealth.net/blog/554. Accessed September 27 2011.
18. Maheu MM. iPhone apps reviews for mental health psychology and personal growth consumers. http://telehealth.net/blog/557. Accessed September 27, 2011.
19. Eckardt MH. The use of the telephone to extend our therapeutic availability. J Am Acad Psychoanal Dyn Psychiatry. 2011;39(1):151-153.
20. Hoffman J. When your therapist is only a click away. New York Times. September 23 2011:ST1.
21. Medical Board of California. Practicing medicine through telemedicine technology. http://www.mbc.ca.gov/licensee/telemedicine.html. Accessed September 27 2011.
22. Telehealth Alliance of Oregon. http://www.ortelehealth.org. Accessed October 31 2011.
23. JSA Health Telepsychiatry. http://jsahealthmd.com. Accessed September 27 2011.
24. American Telemedicine Association. Telemental standards and guidelines. http://www.americantelemed.org/i4a/pages/index.cfm?pageID=3311. Accessed September 27 2011.
25. American Telemedicine Association. Evidence-based practice for telemental health. http://www.americantelemed.org/i4a/forms/form.cfm?id=25&pageid=3718&showTitle=1. Accessed September 27 2011.
Helen M. Farrell, MD
Dr. Farrell is an instructor at Harvard Medical School and a staff psychiatrist at Beth Israel Deaconess Medical Center, Boston, MA
Douglas Mossman, MD
Dr. Mossman is administrative director, Glenn M. Weaver Institute of Law and Psychiatry, University of Cincinnati College of Law, and Adjunct Professor of Clinical Psychiatry and Training Director for the University of Cincinnati Forensic Psychiatry Fellowship, Cincinnati, OH
Disclosure
The authors report no financial relationship with any company whose products are mentioned in this article or with manufacturers of competing products.
Dear Dr. Mossman:
I practice in a region with few psychiatrists and very little public transportation. For many patients, coming to my office is inconvenient, expensive, or time-consuming. Sometimes, their emotional problems make it hard for them to travel, and sometimes, bad weather makes travel difficult. I am considering providing remote treatment via Skype. Is this a reasonable idea? What are the risks of using this technology in my practice? — Submitted by “Dr. A”
Diagnosing and treating patients without a face-to-face encounter is not new. Doctors have provided “remote treatment” since shortly after telephones were invented.1 Until recently, however, forensic psychiatrists advised colleagues not to diagnose patients or start treatment based on phone contact alone.2
The Internet has revolutionized our attitudes about many things. Communication technologies that seemed miraculous a generation ago have become commonplace and have transformed standards for ordinary and “acceptable” human contact. A quick Internet search of “telephone psychotherapy” turns up hundreds of mental health professionals who offer remote treatment services to patients via computers and Web cams.
Physicians in many specialties practice telemedicine, often with the support and encouragement of state governments and third-party payers. To decide whether to include telepsychiatry in your psychiatric practice, you should know:
- what “telemedicine” means and includes
- the possible advantages of offering remote health care
- potential risks and ambiguity about legal matters.
Defining telemedicine
Studies of remote, closed-circuit “telediagnosis” extend back more than 4 decades, closely following mid-20th century advancements in audio and video relay technologies that made space broadcasts possible.3 Then as now, “telemedicine” simply means conveying health-related information from 1 site to another for diagnostic or treatment purposes.4 It’s an adaptation of available technology to deliver care more easily, with the goal of improving patients’ access to care and health status.
Telemedicine usage accelerated as the Internet and related technologies developed. Telemedicine programs in the United States increased by 1,500% from 1993 to 1998.4 Telemedicine use has grown 10% annually in recent years and has become a $4 billion per year industry in the United States.5 Recently enacted federal legislation is likely to extend health care coverage to 36 million Americans and require coverage of pre-existing conditions. To make these changes affordable, health care delivery will need to exploit new, efficiency-enhancing technologies.6
Advantages of telemedicine
State governments and some third-party payers have recognized that telemedicine can overcome geographic and cost barriers to health services and patient education.5,7-9 Although closed-circuit video transmission has served this purpose for some time, Skype—free software that allows individuals to make video phone calls over the Internet using their computers—is an option that doctors are using to treat patients.10-12
Research suggests that telepsychiatry may provide huge benefits to medically underserved areas while reducing health care costs.4 Telepsychiatry can reduce travel time and expenses for professionals and patients, and it also may lower wait times and “no-show” rates (Table 1).4 Telepsychiatry lets patients see caregivers when winter weather makes roads unsafe. It may allow geriatric patients who can no longer drive to access psychiatric care and it lowers health care’s “carbon footprint,” making it “eco-friendly.”13
Social media strategies are playing an expanding role in medical education,14,15 and this probably will help practitioners feel more at ease about incorporating the underlying technologies into work with patients. Increased use of laptops and mobile phones lends itself well to telepsychiatry applications,13 and studies have examined the feasibility of psychotherapies delivered via remote communication devices.16 Smartphone apps are being designed to assist mental health professionals17 and consumers.18
Table 1
Potential benefits of telemedicine
| Category | Benefit(s) |
|---|---|
| Access | Patients can see specialists more readily Addresses regional doctor shortages Reduces health care disparities between urban and rural areas |
| Urgent care | Facilitates information transfer for rapid interventions |
| Productivity | Provides a conduit for clinicians to share skills and expertise Facilitates remote monitoring and home care |
| Cost | No travel costs Alternative revenue stream for health care organizations that offer more broadly delivered medical services |
| Patient-centric care | Care is taken to the patient Translator services are more readily available |
| Source: Reference 4 | |
Potential pitfalls and drawbacks
Although convenience, access, cost, and fossil fuel savings may favor video-chat doctor visits, telemedicine has downsides, some of which apply specifically to psychiatry. First, no current technology provides psychiatrists with “the rich multidimensional aspects of a person-to-person encounter,”19 and remote communication may change what patients tell us, how they feel when they tell us things, and how they feel when we respond. Often, an inherent awkwardness affects many forms of Internet communication.20
Also uncertain is whether Skype is compliant with the Health Insurance Portability and Accountability Act and protects doctor-patient privacy well enough to satisfy ethical standards—although it probably is far better than e-mail in this regard. Third-party payers often will not reimburse for telephone calls and may balk at paying for Skype-based therapy, even in states that require insurers to reimburse for telemedicine.
Psychiatrists typically have limited physical contact with patients, but we often check weight and vital signs when we prescribe certain psychotropic medications. Results from home- and drugstore-based blood pressure monitors may not be accurate enough for treatment purposes. Remote communication also reduces the quality of visual information,20 which can be crucial—for example, when good lighting and visual resolution is needed to decide whether a skin rash might be drug-induced.
Telemedicine raises concerns about licensure and meeting adequate standards of care. Medical care usually is deemed to have occurred in the state where the patient is located. For example, only physicians licensed to practice medicine in California are legally permitted to treat patients in California. As is the case with any treatment, care delivered via telemedicine must include appropriate patient examination and diagnosis.21
Help and guidance
Despite these potential drawbacks, many state agencies recognize the promise of telemedicine, and have developed networks to promote it (Table 2).7-9,22,23 These networks have various goals but share a common pattern of establishing infrastructure, policies, and organized results. In the future, states may adopt laws or regulations that address conflicts in malpractice standards and liability coverage, licensing, accreditation, reimbursement, privacy, and data protection policies that now may impede or inhibit use of telepsychiatric services across jurisdictional boundaries. Last year, Ohio produced regulations to guide psychiatrists in prescribing medication remotely without an in-person examination. The University of Hawaii suggested steps that its state legislature might take to help providers predict the potential legal ramifications of telemedicine.6
Further help for telepsychiatry practitioners may be found in practice standards and guidelines developed by the American Telemedicine Association.24,25 These documents gave guidance and support for the practice of telemedicine and for providing appropriate telepsychiatry health services.
Table 2
Telemedicine services available in different states
| State/Network | Description |
|---|---|
| Arizona www.narbha.org7 | The Northern Arizona Regional Behavioral Health Authority manages a comprehensive telemental health network (NARBHAnet) that uses 2-way videoconferencing to connect mental health experts and patients. It has provided >50,000 clinical psychiatric sessions |
| Kansas www.kumc.edu8 | The University of Kansas Medical Center provides specialty services (including telepsychiatry) through 14 clinical sites in rural Kansas. Cost-sharing helps the telepsychiatric application be successful |
| Montana www.emtn.org9 | Eastern Montana Telemedicine Network is a consortium of not-for-profit facilities that link health care providers and their patients in Montana and Wyoming. This telemental health network includes shared sites for all physicians practicing in the network and has yielded large out-of-pocket savings for patients |
| Oregon www.ortelehealth.org22 | The Telehealth Alliance of Oregon, which began in 2001 as a committee of the Oregon Telecommunications Coordinating Council, was created by the legislature and has served as advisors to the governor and the legislature regarding telecommunications in Oregon |
| Texas www.jsahealthmd.com23 | The Burke Center provides services to people in 12 counties in East Texas. It uses telepsychiatry services to conduct emergency evaluations, therefore keeping people in mental health crises out of emergency rooms |
What should Dr. A do?
In answer to Dr. A’s question, many factors favor including telepsychiatry in her practice. Yet we know little about the accuracy and reliability of psychiatric assessments made solely via Skype or other remote video technology in ordinary practice. Legislation and legal rules about acceptable practices are ambiguous, although in the absence of clear guidance, psychiatrists should assume that all usual professional standards and expectations about adequate care apply to treatment via Skype or other remote communication methods.
Related Resources
- Skype. www.skype.com.
- American Telemedicine Association. www.americantelemed.org.
1. Lipman M. The doctor will Skype you now. Consum Rep. 2011;76(8):12.-
2. Simon RI. Clinical psychiatry and the law. 2nd ed. Washington DC: American Psychiatric Press; 1992.
3. Murphy RL, Jr, Bird KT. Telediagnosis: a new community health resource. Observations on the feasibility of telediagnosis based on 1000 patient transactions. Am J Public Health. 1974;64(2):113-119.
4. Hilty DM, Yellowlees PM, Cobb HC, et al. Models of telepsychiatric consultation—liaison service to rural primary care. Psychosomatics. 2006;47(2):152-157.
5. Freudenheim M. The doctor will see you now. Please log on. New York Times. May 29 2010:BU1.
6. University of Hawai’i. Report to the 2009 legislature: preliminary report by the John A. Burns School of Medicine on the current practices of Hawai’i telemedicine system for 2009. http://www.hawaii.edu/offices/eaur/govrel/reports/2009. Published November 2008. Accessed September 27 2011.
7. Northern Arizona Regional Behavioral Health Authority. http://www.narbha.org. Accessed September 27 2011.
8. University of Kansas Medical Center. http://www.kumc.edu. Accessed September 27 2011.
9. Eastern Montana Telemedicine Network. http://www.emtn.org. Accessed September 27 2011.
10. Ciccia AH, Whitford B, Krumm M, et al. Improving the access of young urban children to speech, language and hearing screening via telehealth. J Telemed Telecare. 2011;17(5):240-244.
11. Hori M, Kubota M, Ando K, et al. The effect of videophone communication (with skype and webcam) for elderly patients with dementia and their caregivers [in Japanese]. Gan To Kagaku Ryoho. 2009;36(suppl 1):36-38.
12. Klock C, Gomes Rde P. Web conferencing systems: Skype and MSN in telepathology. Diagn Pathol. 2008;3(suppl 1):S13.-
13. Luo J. VoIP: The right call for your practice? Current Psychiatry. 2005;4(10):24-27.
14. George DR, Dellasega C. Use of social media in graduate-level medical humanities education: two pilot studies from Penn State College of Medicine. Med Teach. 2011;33(8):e429-434.
15. Lillis S, Gibbons V, Lawrenson R. The experience of final year medical students undertaking a general practice run with a distance education component. Rural Remote Health. 2010;10(1):1268.-
16. Bee PE, Bower P, Lovell K, et al. Psychotherapy mediated by remote communication technologies: a meta-analytic review. BMC Psychiatry. 2008;8:60.-
17. Maheu MM. iPhone app reviews for psychologists and mental health professionals. http://telehealth.net/blog/554. Accessed September 27 2011.
18. Maheu MM. iPhone apps reviews for mental health psychology and personal growth consumers. http://telehealth.net/blog/557. Accessed September 27, 2011.
19. Eckardt MH. The use of the telephone to extend our therapeutic availability. J Am Acad Psychoanal Dyn Psychiatry. 2011;39(1):151-153.
20. Hoffman J. When your therapist is only a click away. New York Times. September 23 2011:ST1.
21. Medical Board of California. Practicing medicine through telemedicine technology. http://www.mbc.ca.gov/licensee/telemedicine.html. Accessed September 27 2011.
22. Telehealth Alliance of Oregon. http://www.ortelehealth.org. Accessed October 31 2011.
23. JSA Health Telepsychiatry. http://jsahealthmd.com. Accessed September 27 2011.
24. American Telemedicine Association. Telemental standards and guidelines. http://www.americantelemed.org/i4a/pages/index.cfm?pageID=3311. Accessed September 27 2011.
25. American Telemedicine Association. Evidence-based practice for telemental health. http://www.americantelemed.org/i4a/forms/form.cfm?id=25&pageid=3718&showTitle=1. Accessed September 27 2011.
The Buck Starts Here
Some of the best companies in America started in a garage or a basement with an individual who had a great idea and the ability to grow it into a progressively larger business.
“It takes a leader with different capabilities to take a company to the next level,” says Martin Buser, MPH, FACHE, a partner with Hospitalist Management Resources LLC in San Diego, which has helped more than 350 HM programs nationwide in the past 15 years. “It’s an attitude of never stop learning, an ability to look at issues from 30,000 feet instead of ground zero so you can see the whole picture.”
Similarly, the most important predictor of an HM program’s success is its director, Buser says. If directors know how to communicate, innovate, facilitate, problem-solve, and inspire, they are much more likely to run a high-performing hospitalist program, says David Lee, MD, MBA, FACP, FHM, vice chairman of the Hospital Medicine Department at Ochsner Health System in New Orleans.
If group directors lack the skills and fail to adapt to change, the program’s outlook is far from certain. “We unfortunately get involved with these programs,” Buser says. “It’s painful to see.” Bad behavior is nothing new to the hospital setting, and HM is not immune to poor management. The following are common examples of bad behaviors and how groups can avoid the mishaps.
Scenario No. 1 : Great Clinician, Nice Person, Weak Advocate

—Martin Buser, MPH, FACHE, partner, Hospitalist Management Resources LLC, San Diego
The case: Earlier this year, medical center administrators asked the hospitalist program to do more with less, explaining the hospital was having a bad financial year. Administration approached the HM director, an exceptional, gregarious clinician who was named to the position years ago to help the program gain acceptance. The director agreed to indefinitely postpone two much-needed hirings, deciding it was better to share in the sacrifice than protest the cuts to the program’s budget. Hospitalists have since been working more shifts without a pay increase, and burnout symptoms have emerged with no signs of a thaw in the hiring freeze.
Expert advice: Buser says the “weak advocate” is a common issue among hospitalist groups, many of which he says are “going to hell” when he gets a rescue call. When a hospital is facing financial hardship, it is imperative that the HM director stand up for the program by explaining in detail the ramifications of each level of budget cuts. That’s because administrators might not realize the long-term damage that would result from such actions, he says. Being a strong, savvy advocate is even more important now since the financial future of many hospitals is ominous.
“With all of our hospitalist clients, we ask the CFO what is happening in the future…and the numbers are phenomenal,” says Buser. “They are seeing reductions of $10 million to $30 million off their bottom line.”
Administrators’ knee-jerk reaction is to cut costs. But there is another option: Grow the hospital out of its financial difficulties. It is up to the HM director to show administrators how the HM group has strategically gained them market share and how it will continue to do so. Good directors are in near constant contact with administrators, demonstrating the value their hospitalist program brings to the hospital, Buser says.
“You’re having regular meetings with the administrator, you’re producing the dashboard on a regular basis, you’re giving him trends that are going on,” he explains. “Show that you understand the hospital’s issues. Certain things you want to compromise on, but other things you have to say, ‘If we do that, the ramifications are such that it’s just not going to work.’”
Scenario No. 2 : Recruiting Roulette

—David Friar, MD, SFHM, CEO, Hospitalists of Northern Michigan, Traverse City
The case: The HM director felt pressure to hire. The program’s hospitalists were seeing two to three patients a day more than they should have been, and hospital administrators were worried the program was losing ground to the other hospitalist group in the community. Using an outside recruiter, the director hired two adept physicians with stellar CVs after an expedited review process that included a background check, a few phone interviews, and day of in-person interviews with some administrators and a hospitalist on the team. Now, nearly a year later, one of the physicians is about to leave because her family doesn’t like the community, and the other new hire’s abrasive personality has caused considerable damage to the team’s cohesion.
Expert advice: A big part of an HM program’s value is how it practices as a unified team, and directors need to recognize how vital the “team fit” is to hospitalists, says David Friar, MD, SFHM, CEO of Hospitalists of Northern Michigan in Traverse City.
“A bad team fit is often worse than being short-staffed because it can literally destroy the team spirit,” he says.
Directors should have a standardized recruitment process that includes a comprehensive background screening where references are closely checked, a round of interviews by people outside the HM program (nurses and referring physicians), and substantial time spent with hospitalists in the program, says Bryce Gartland, MD, FHM, associate director of the hospital medicine division and medical director of care coordination at Emory Healthcare in Atlanta.
“We put [candidates] with one of our physicians to actually go around the hospital,” he says. “It’s amazing to me the number of things you can pick up by that broader exposure that you may not pick up sitting in a room with a candidate across the table for an hour.”
If a recruitment service is used, the director must describe the HM program in detail to the recruiter and even have them meet hospitalists on the staff, Dr. Friar says.
“Sending them a memo saying ‘We need three new hospitalists ASAP’ isn’t helping them find you the perfect candidate,” he says. “Even the best recruiter can only do a great job for you if they really know your team and what it is you need in a candidate.”
A director also is well served to make recruiting a family event where spouses and even children are part of the interview process.
“By including the entire family and then supporting them after the move, we are much more likely to recruit providers that will stay good members of our team for years to come,” Dr. Friar says.
Scenario No. 3 : Amitte Diem

—John Bulger, DO, FACP, FHM, chief quality officer, director, hospital medicine service line, Geisinger Health System, Danville, Pa.
The case: For months, the medical center has been receiving an increased number of referrals from outlying hospitals, and no end is in sight. The extra patient load, much of it involving complex cases, has agitated the medical center’s staff, particularly the specialists, and they’ve begun to complain to hospital administrators. Seeking an ally, the specialists reach out to the HM director to present their case. Without doing independent analysis, the HM director sides with the specialists. Hospital administrators, facing growing resistance, work to decrease the referrals and are successful.
Expert advice: Consider working in the opposite direction, one that might turn a referral challenge into a profitable opportunity, Buser says. One of his firm’s clients, after thorough research, established a transfer center and set up an activation fee for the specialists who took the referrals. Hospitalists admitted about 90% of the cases, called consults, and named specialists so they received full fee-for-service at Medicare rates if they saw uninsured patients.
“That hospital is now making about $78 million a year, and the medical staff is saying, ‘How can we grow this?’” Buser says. “Here’s an example of how the hospital medicine director was key to turning the bad into something good.”
Because physicians tend to be reticent to change, it’s critical for hospitalist directors who want to seize an opportunity to thoroughly plan out how the change will occur and to prepare for potential obstacles along the way, says John Bulger, DO, FACP, FHM, chief quality officer and director of the hospital medicine service line for Geisinger Health System in Danville, Pa.
“You really need to be prepared with your rationale of why you’re doing it, if there’s data behind why you’re doing it, what the data is that’s driving it, and really what you hope to do with that change,” he says. “If you don’t get buy in from your staff, the change is doomed to fail from the beginning.”
Directors must embrace being a change agent if they want their HM programs to continue to be successful. In the minds of many hospital administrators, a program is only as good as its last achievement.
“It’s kind of like, ‘What have you done for me lately?’” Buser says. “You want to stay ahead of the curve and be alert to what’s going on and not be caught keeping your eyes off the ball and, as a result, not moving your program forward.”
Scenario No. 4 : Fumbling the Handoff

—Daniel Cusator, MD, MBA, vice president, Camden Group, El Segundo, Calif.
The case: The medical center’s monthly data for the past year has shown that hospitalists are taking care of their patients efficiently and getting them out of the hospital more quickly. However, mixed in with the positive numbers is a stubbornly high 30-day readmission rate. Indeed, some primary care groups and referring geriatricians have begun to grouse to the HM director about the discharge notes, complaining they aren’t as comprehensive as they would like.
Plus, the notes always arrive via office fax, which makes them more likely to get misplaced and harder to receive when doctors are out of the office.
Expert advice: Handoffs from discharge to pickup are where a lot of complications, errors, and safety issues arise, and poor handoffs are one of the largest drivers of readmission rates, especially in the elderly patient population, says Daniel Cusator, MD, MBA, vice president of the Camden Group, a healthcare consulting firm in El Segundo, Calif.
If the hospitalist director doesn’t provide the leadership and resources to help the HM team better coordinate with patients’ regular doctors, handoffs won’t be a priority throughout the group.
The HM director must recognize that the term “discharge note” is a misnomer.
What referring physicians really want is a care plan, which includes information about testing done in the hospital, testing that might be needed in the outpatient setting, medications the patient is on, complications the patient had in the hospital, potential problems to monitor, and any necessary follow-up, says Dr. Cusator, formerly the chief medical officer of clinical integration at Providence Health & Services in Southern California.
PCPs also want the care plan transmitted in their preferred method, whether that is text messaging, HIPAA-compliant email messaging, secure messaging, or fax.
“What I’ve seen some hospitalist groups do is create a menu capability for each of the physicians to choose their preferred method of notification of discharge of their patient,” Dr. Cusator says. Results suggest such a menu leads to improved physician satisfaction and reduced patient complications after discharge, he adds.
With today’s technological innovations, HM directors are unlimited in their ability to improve handoffs between their team and patients’ PCPs and specialists, Dr. Cusator says. Some HM directors, for example, are leading efforts to link electronic medical records systems to hospital-based health information exchange hubs that are accessible to physicians in the community.
“Notes and clinical information are submitted to this health information exchange and made available to any of the physicians who are caring for the patient almost immediately upon dictation and notation,” he says.
Scenario No. 5 : Protect Your Assets

—David Lee, MD, MBA, FACP, FHM, vice chairman, Hospital Medicine Department, Ochsner Health System, New Orleans.
The case: A physician isn’t sure she wants a career in hospital medicine. She finds the specialty rewarding but is looking for a different challenge, something beyond exclusively seeing patients. The HM director notices the physician has an aptitude for finding ways to do tasks more efficiently.
The director privately thinks the physician would be a good fit for a quality improvement project that’s about to start but doesn’t pursue it. The HM team just added a primary care group, and its patient census is quickly rising, requiring the hospitalists to devote their entire shifts to patient care. Within the year, the physician leaves the team for a fellowship program outside hospital medicine.
Expert advice: There are three communities in hospital medicine, Dr. Bulger says: people who want to be hospitalists, people who are passing through on their way to something else, and people who sit somewhere in the middle.
HM directors, he says, should do everything they can to develop not only the career hospitalists but also those on the fence.
“A lot of them you can turn into people who are going to be hospitalists if they are doing something that is rewarding for them,” Dr. Bulger says. “Many times rewarding for them is being involved more in the leadership of the group, being involved in quality improvement projects, really seeing how they can impact the care for populations of patients—and not just the patient who happens to be sitting in front of them.”
It’s incumbent on HM group leaders to link hospitalists with mentors and help them find a niche, Dr. Lee says. It keeps people interested and makes them feel part of a group.
“They need to feel they belong,” he says. “There has to be a cohesiveness in order for your department to excel. You have to protect your assets in the group, which is your physicians.”
Sending hospitalists to professional development training, such as SHM’s Leadership Academy (see “Leadership Academy Adds ‘Women in HM Issues’ to Schedule,” p. 9) or QI-focused webinars offered by SHM or the Institute of Healthcare Improvement, and following up with day-to-day coaching is a solid physician-development strategy, Dr. Gartland says. By virtue of their job, hospitalists are expected to lead and manage people in interactions with the ED, primary care, non-physician providers, nursing staff, and beyond, he says.
Directors also have to stop assuming that competent physicians are competent managers. “A lot of physicians don’t have those core skill sets, and we’ve got to pay conscious attention toward spending time dedicated to developing those,” Dr. Gartland says.
If directors don’t make professional development a priority or provide hospitalists with the flexibility to do non-clinical activities, retention may become an issue, Dr. Bulger says. “They could leave and go somewhere else,” he says, yet perhaps the more significant danger is losing hospitalists to programs and specialties outside hospital medicine.
Lisa Ryan is a freelance writer based in New Jersey.
THE FUNDAMENTALS

As hospitals position themselves for healthcare reform, they increasingly will turn to HM for strategies on how to provide high-quality patient care at a lower cost, Buser says. To meet hospitals’ needs and enhance the value of their programs, hospitalist directors should consider adopting these strategies recommended by HM leaders:
- Align compensation with the HM program’s goals. For example, if quality improvement is the priority, directors should financially reward hospitalists on quality performance, Dr. Lee says.
- Boost support staff and functions. For example, directors should ensure their team has access to the hospital’s case managers, who can handle discharge logistics so the hospitalist can focus on clinical issues, Dr. Cusator says.
- Control program growth. To borrow a popular line from the movie Field of Dreams: “If you build it, they will come.” Directors should be deliberate with group expansion and ensure enough staff is in place before adding to their referral base or adding a new service line, Dr. Bulger says. This reduces hospitalist burnout and preserves the group’s quality of patient care.
- Define two to three targets for success in the upcoming year and concentrate on accomplishing them. Start by consolidating what your team is working on, says Steven Deitelzweig, MD, SFHM, chairman of the Department of Hospital Medicine at Ochsner Health System in New Orleans. Pick too many things to master, and you end up excelling in none, he adds.
- Evaluate performance beyond a scorecard. Using constructive criticism grounded with examples, HM directors should provide feedback about what a physician is doing well and what can be done better so they can improve, Dr. Gartland says.
- Foster creative problem solving by including hospitalists in decisions. Directors should encourage the expression of different opinions and ideas, which helps the program avoid “group think” and allows innovation to occur, Dr. Lee says.
- Galvanize the new generation. To retain young physicians and make them feel part of the program, directors should learn how they communicate, how they work, and how they view work, Dr. Lee says.
- Help your hospital accurately measure reimbursement and mortality rates. Directors should make coding a priority and provide hospitalists with the tools they need to capture correct ICD-9 and CPT codes for their patients, Dr. Cusator says.
- Identify missing core capabilities and dedicate resources for it. For example, if HM programs have a high census of chronically ill and end-of-life patients, directors should assist the hospital in establishing a palliative care or hospice program, Dr. Cusator says.
Some of the best companies in America started in a garage or a basement with an individual who had a great idea and the ability to grow it into a progressively larger business.
“It takes a leader with different capabilities to take a company to the next level,” says Martin Buser, MPH, FACHE, a partner with Hospitalist Management Resources LLC in San Diego, which has helped more than 350 HM programs nationwide in the past 15 years. “It’s an attitude of never stop learning, an ability to look at issues from 30,000 feet instead of ground zero so you can see the whole picture.”
Similarly, the most important predictor of an HM program’s success is its director, Buser says. If directors know how to communicate, innovate, facilitate, problem-solve, and inspire, they are much more likely to run a high-performing hospitalist program, says David Lee, MD, MBA, FACP, FHM, vice chairman of the Hospital Medicine Department at Ochsner Health System in New Orleans.
If group directors lack the skills and fail to adapt to change, the program’s outlook is far from certain. “We unfortunately get involved with these programs,” Buser says. “It’s painful to see.” Bad behavior is nothing new to the hospital setting, and HM is not immune to poor management. The following are common examples of bad behaviors and how groups can avoid the mishaps.
Scenario No. 1 : Great Clinician, Nice Person, Weak Advocate
—Martin Buser, MPH, FACHE, partner, Hospitalist Management Resources LLC, San Diego
The case: Earlier this year, medical center administrators asked the hospitalist program to do more with less, explaining the hospital was having a bad financial year. Administration approached the HM director, an exceptional, gregarious clinician who was named to the position years ago to help the program gain acceptance. The director agreed to indefinitely postpone two much-needed hirings, deciding it was better to share in the sacrifice than protest the cuts to the program’s budget. Hospitalists have since been working more shifts without a pay increase, and burnout symptoms have emerged with no signs of a thaw in the hiring freeze.
Expert advice: Buser says the “weak advocate” is a common issue among hospitalist groups, many of which he says are “going to hell” when he gets a rescue call. When a hospital is facing financial hardship, it is imperative that the HM director stand up for the program by explaining in detail the ramifications of each level of budget cuts. That’s because administrators might not realize the long-term damage that would result from such actions, he says. Being a strong, savvy advocate is even more important now since the financial future of many hospitals is ominous.
“With all of our hospitalist clients, we ask the CFO what is happening in the future…and the numbers are phenomenal,” says Buser. “They are seeing reductions of $10 million to $30 million off their bottom line.”
Administrators’ knee-jerk reaction is to cut costs. But there is another option: Grow the hospital out of its financial difficulties. It is up to the HM director to show administrators how the HM group has strategically gained them market share and how it will continue to do so. Good directors are in near constant contact with administrators, demonstrating the value their hospitalist program brings to the hospital, Buser says.
“You’re having regular meetings with the administrator, you’re producing the dashboard on a regular basis, you’re giving him trends that are going on,” he explains. “Show that you understand the hospital’s issues. Certain things you want to compromise on, but other things you have to say, ‘If we do that, the ramifications are such that it’s just not going to work.’”
Scenario No. 2 : Recruiting Roulette
—David Friar, MD, SFHM, CEO, Hospitalists of Northern Michigan, Traverse City
The case: The HM director felt pressure to hire. The program’s hospitalists were seeing two to three patients a day more than they should have been, and hospital administrators were worried the program was losing ground to the other hospitalist group in the community. Using an outside recruiter, the director hired two adept physicians with stellar CVs after an expedited review process that included a background check, a few phone interviews, and day of in-person interviews with some administrators and a hospitalist on the team. Now, nearly a year later, one of the physicians is about to leave because her family doesn’t like the community, and the other new hire’s abrasive personality has caused considerable damage to the team’s cohesion.
Expert advice: A big part of an HM program’s value is how it practices as a unified team, and directors need to recognize how vital the “team fit” is to hospitalists, says David Friar, MD, SFHM, CEO of Hospitalists of Northern Michigan in Traverse City.
“A bad team fit is often worse than being short-staffed because it can literally destroy the team spirit,” he says.
Directors should have a standardized recruitment process that includes a comprehensive background screening where references are closely checked, a round of interviews by people outside the HM program (nurses and referring physicians), and substantial time spent with hospitalists in the program, says Bryce Gartland, MD, FHM, associate director of the hospital medicine division and medical director of care coordination at Emory Healthcare in Atlanta.
“We put [candidates] with one of our physicians to actually go around the hospital,” he says. “It’s amazing to me the number of things you can pick up by that broader exposure that you may not pick up sitting in a room with a candidate across the table for an hour.”
If a recruitment service is used, the director must describe the HM program in detail to the recruiter and even have them meet hospitalists on the staff, Dr. Friar says.
“Sending them a memo saying ‘We need three new hospitalists ASAP’ isn’t helping them find you the perfect candidate,” he says. “Even the best recruiter can only do a great job for you if they really know your team and what it is you need in a candidate.”
A director also is well served to make recruiting a family event where spouses and even children are part of the interview process.
“By including the entire family and then supporting them after the move, we are much more likely to recruit providers that will stay good members of our team for years to come,” Dr. Friar says.
Scenario No. 3 : Amitte Diem
—John Bulger, DO, FACP, FHM, chief quality officer, director, hospital medicine service line, Geisinger Health System, Danville, Pa.
The case: For months, the medical center has been receiving an increased number of referrals from outlying hospitals, and no end is in sight. The extra patient load, much of it involving complex cases, has agitated the medical center’s staff, particularly the specialists, and they’ve begun to complain to hospital administrators. Seeking an ally, the specialists reach out to the HM director to present their case. Without doing independent analysis, the HM director sides with the specialists. Hospital administrators, facing growing resistance, work to decrease the referrals and are successful.
Expert advice: Consider working in the opposite direction, one that might turn a referral challenge into a profitable opportunity, Buser says. One of his firm’s clients, after thorough research, established a transfer center and set up an activation fee for the specialists who took the referrals. Hospitalists admitted about 90% of the cases, called consults, and named specialists so they received full fee-for-service at Medicare rates if they saw uninsured patients.
“That hospital is now making about $78 million a year, and the medical staff is saying, ‘How can we grow this?’” Buser says. “Here’s an example of how the hospital medicine director was key to turning the bad into something good.”
Because physicians tend to be reticent to change, it’s critical for hospitalist directors who want to seize an opportunity to thoroughly plan out how the change will occur and to prepare for potential obstacles along the way, says John Bulger, DO, FACP, FHM, chief quality officer and director of the hospital medicine service line for Geisinger Health System in Danville, Pa.
“You really need to be prepared with your rationale of why you’re doing it, if there’s data behind why you’re doing it, what the data is that’s driving it, and really what you hope to do with that change,” he says. “If you don’t get buy in from your staff, the change is doomed to fail from the beginning.”
Directors must embrace being a change agent if they want their HM programs to continue to be successful. In the minds of many hospital administrators, a program is only as good as its last achievement.
“It’s kind of like, ‘What have you done for me lately?’” Buser says. “You want to stay ahead of the curve and be alert to what’s going on and not be caught keeping your eyes off the ball and, as a result, not moving your program forward.”
Scenario No. 4 : Fumbling the Handoff
—Daniel Cusator, MD, MBA, vice president, Camden Group, El Segundo, Calif.
The case: The medical center’s monthly data for the past year has shown that hospitalists are taking care of their patients efficiently and getting them out of the hospital more quickly. However, mixed in with the positive numbers is a stubbornly high 30-day readmission rate. Indeed, some primary care groups and referring geriatricians have begun to grouse to the HM director about the discharge notes, complaining they aren’t as comprehensive as they would like.
Plus, the notes always arrive via office fax, which makes them more likely to get misplaced and harder to receive when doctors are out of the office.
Expert advice: Handoffs from discharge to pickup are where a lot of complications, errors, and safety issues arise, and poor handoffs are one of the largest drivers of readmission rates, especially in the elderly patient population, says Daniel Cusator, MD, MBA, vice president of the Camden Group, a healthcare consulting firm in El Segundo, Calif.
If the hospitalist director doesn’t provide the leadership and resources to help the HM team better coordinate with patients’ regular doctors, handoffs won’t be a priority throughout the group.
The HM director must recognize that the term “discharge note” is a misnomer.
What referring physicians really want is a care plan, which includes information about testing done in the hospital, testing that might be needed in the outpatient setting, medications the patient is on, complications the patient had in the hospital, potential problems to monitor, and any necessary follow-up, says Dr. Cusator, formerly the chief medical officer of clinical integration at Providence Health & Services in Southern California.
PCPs also want the care plan transmitted in their preferred method, whether that is text messaging, HIPAA-compliant email messaging, secure messaging, or fax.
“What I’ve seen some hospitalist groups do is create a menu capability for each of the physicians to choose their preferred method of notification of discharge of their patient,” Dr. Cusator says. Results suggest such a menu leads to improved physician satisfaction and reduced patient complications after discharge, he adds.
With today’s technological innovations, HM directors are unlimited in their ability to improve handoffs between their team and patients’ PCPs and specialists, Dr. Cusator says. Some HM directors, for example, are leading efforts to link electronic medical records systems to hospital-based health information exchange hubs that are accessible to physicians in the community.
“Notes and clinical information are submitted to this health information exchange and made available to any of the physicians who are caring for the patient almost immediately upon dictation and notation,” he says.
Scenario No. 5 : Protect Your Assets
—David Lee, MD, MBA, FACP, FHM, vice chairman, Hospital Medicine Department, Ochsner Health System, New Orleans.
The case: A physician isn’t sure she wants a career in hospital medicine. She finds the specialty rewarding but is looking for a different challenge, something beyond exclusively seeing patients. The HM director notices the physician has an aptitude for finding ways to do tasks more efficiently.
The director privately thinks the physician would be a good fit for a quality improvement project that’s about to start but doesn’t pursue it. The HM team just added a primary care group, and its patient census is quickly rising, requiring the hospitalists to devote their entire shifts to patient care. Within the year, the physician leaves the team for a fellowship program outside hospital medicine.
Expert advice: There are three communities in hospital medicine, Dr. Bulger says: people who want to be hospitalists, people who are passing through on their way to something else, and people who sit somewhere in the middle.
HM directors, he says, should do everything they can to develop not only the career hospitalists but also those on the fence.
“A lot of them you can turn into people who are going to be hospitalists if they are doing something that is rewarding for them,” Dr. Bulger says. “Many times rewarding for them is being involved more in the leadership of the group, being involved in quality improvement projects, really seeing how they can impact the care for populations of patients—and not just the patient who happens to be sitting in front of them.”
It’s incumbent on HM group leaders to link hospitalists with mentors and help them find a niche, Dr. Lee says. It keeps people interested and makes them feel part of a group.
“They need to feel they belong,” he says. “There has to be a cohesiveness in order for your department to excel. You have to protect your assets in the group, which is your physicians.”
Sending hospitalists to professional development training, such as SHM’s Leadership Academy (see “Leadership Academy Adds ‘Women in HM Issues’ to Schedule,” p. 9) or QI-focused webinars offered by SHM or the Institute of Healthcare Improvement, and following up with day-to-day coaching is a solid physician-development strategy, Dr. Gartland says. By virtue of their job, hospitalists are expected to lead and manage people in interactions with the ED, primary care, non-physician providers, nursing staff, and beyond, he says.
Directors also have to stop assuming that competent physicians are competent managers. “A lot of physicians don’t have those core skill sets, and we’ve got to pay conscious attention toward spending time dedicated to developing those,” Dr. Gartland says.
If directors don’t make professional development a priority or provide hospitalists with the flexibility to do non-clinical activities, retention may become an issue, Dr. Bulger says. “They could leave and go somewhere else,” he says, yet perhaps the more significant danger is losing hospitalists to programs and specialties outside hospital medicine.
Lisa Ryan is a freelance writer based in New Jersey.
THE FUNDAMENTALS
As hospitals position themselves for healthcare reform, they increasingly will turn to HM for strategies on how to provide high-quality patient care at a lower cost, Buser says. To meet hospitals’ needs and enhance the value of their programs, hospitalist directors should consider adopting these strategies recommended by HM leaders:
- Align compensation with the HM program’s goals. For example, if quality improvement is the priority, directors should financially reward hospitalists on quality performance, Dr. Lee says.
- Boost support staff and functions. For example, directors should ensure their team has access to the hospital’s case managers, who can handle discharge logistics so the hospitalist can focus on clinical issues, Dr. Cusator says.
- Control program growth. To borrow a popular line from the movie Field of Dreams: “If you build it, they will come.” Directors should be deliberate with group expansion and ensure enough staff is in place before adding to their referral base or adding a new service line, Dr. Bulger says. This reduces hospitalist burnout and preserves the group’s quality of patient care.
- Define two to three targets for success in the upcoming year and concentrate on accomplishing them. Start by consolidating what your team is working on, says Steven Deitelzweig, MD, SFHM, chairman of the Department of Hospital Medicine at Ochsner Health System in New Orleans. Pick too many things to master, and you end up excelling in none, he adds.
- Evaluate performance beyond a scorecard. Using constructive criticism grounded with examples, HM directors should provide feedback about what a physician is doing well and what can be done better so they can improve, Dr. Gartland says.
- Foster creative problem solving by including hospitalists in decisions. Directors should encourage the expression of different opinions and ideas, which helps the program avoid “group think” and allows innovation to occur, Dr. Lee says.
- Galvanize the new generation. To retain young physicians and make them feel part of the program, directors should learn how they communicate, how they work, and how they view work, Dr. Lee says.
- Help your hospital accurately measure reimbursement and mortality rates. Directors should make coding a priority and provide hospitalists with the tools they need to capture correct ICD-9 and CPT codes for their patients, Dr. Cusator says.
- Identify missing core capabilities and dedicate resources for it. For example, if HM programs have a high census of chronically ill and end-of-life patients, directors should assist the hospital in establishing a palliative care or hospice program, Dr. Cusator says.
Dr. Shen Responds to Kernicterus Letters
I sincerely appreciate the responses to my review of an article (“Incidence Rates of Kernicterus Remain Unchanged,” The Hospitalist, October 2011, p. 12) that raised questions regarding a “resurgence” of kernicterus in the 1990s. Kernicterus is a devastating illness, and family members bear an unquestionable burden from this disease. Because phototherapy appears to limit the burden of disease, evidence-based guidelines for appropriate treatment of hyperbilirubinemia are paramount to decreasing the incidence of kernicterus. True rates of kernicterus have been difficult to calculate for a variety of reasons, yet we must get a handle on “who” gets kernicterus if we are to appropriately decide which infants receive phototherapy. Thus, I would strongly agree that using the California database is a limitation of the study reviewed.
The mission of the monthly “Pediatric HM” literature review is to regularly summarize articles that might be of interest in the field of pediatric HM. The letters to the editor we received highlight a critical need to delve deeper into the epidemiology of kernicterus, a journey that must begin with accurate reporting of this disease. We appreciate the opportunity to raise awareness of family-centered concerns surrounding the interpretation and analysis of scientific evidence.
As a final note, Mr. Spencer Brown’s letter states that “nearly half of all babies born (44,000 out of every 100,000) have hyperbilirubinemia” based on an incidence of 0.44 per 100,000 mentioned in my review. I would clarify that 0.44 per 100,000 is a rate of kernicterus and is not a percentage. Thus, 0.44 out of 100,000 children (or 4.4 per million) will develop kernicterus, not 44,000 per 100,000.
Mark Shen, MD, FHM, director of hospital medicine, Dell Children’s Medical Center, Austin, Texas, pediatric physician editor, The Hospitalist