User login
The latest research you need to know
Literature at a Glance
- ICU management by critical care physicians may increase the odds of hospital mortality
- Iatrogenic drug overdose common among patients with renal insufficiency
- An educational effort lowers hospital mortality for severe sepsis and septic shock
- SSRI and problem-solving therapy prevents post-stroke depression
- Stop orders for Foley catheters reduce the duration of inappropriate urinary catheterization
- No thromboembolism risk with interrupting anticoagulation in atrial fibrillation patients undergoing surgery
- Obese patients may be initially under-dosed with vancomycin
- Antipsychotic therapy is associated with short-term serious events in older adults with dementia
- Cardiac troponin is associated with worse outcome in acute heart failure
Does management of ICU patients by critical care physicians reduce mortality?
Background: There is variation in the extent of involvement by critical care physicians in managing patients in ICUs. Several small studies have demonstrated improved outcomes when patients are managed by critical care physicians. This study expanded these findings by examining a national database of multiple ICUs.
Study design: Retrospective database analysis.
Setting: 123 ICUs in 100 U.S. hospitals
Synopsis: Using a national database of ICU patients, 101,832 admissions were analyzed. Controlling for ICU characteristics, patient demographics, and severity of illness (SOI), the impact of critical care management (CCM) on the primary outcome of hospital mortality was analyzed. Patients who received CCM had higher SOI, received more procedures, and had higher mortality rates than those who did not receive CCM. After adjustment for these variables, hospital mortality rates were higher for those patients who received CCM.
Because this was a retrospective analysis, it is not possible to state there was a causal relationship between care by a critical care physician and worse outcome. Other unmeasured clinical differences between the patients receiving CCM and those that did not may have existed that resulted in the higher mortality. Additionally, although the database identified management by a critical care physician, it did not differentiate whether the management was by a full-time intensivist. Therefore, conclusions cannot be made regarding the value of full-time, on-site intensivist management.
Bottom line: Additional analysis is required to determine the value of intensivists in the management of critically ill patients.
Citation: Levy MM, Rapoport J, Lemeshow S, Chalfin DB, Phillips G, Danis M. Association between critical care physician management and patient mortality in the intensive care unit. Ann Int Med 2008; 148: 801-809.
What is the frequency of iatrogenic drug overdose in patients with renal insufficiency?
Background: The Institute of Medicine Report, “To Err is Human” suggested 7,000 deaths occur annually because of medication errors. Renal insufficiency is relatively common in hospitalized patients. Previous studies have suggested overdose of medications is frequent in patients with renal insufficiency. There is a lack of large-scale studies identifying the most commonly overdosed medications and the predictive physician factors for these errors.
Study design: Retrospective observational study.
Setting: A single 1,080-bed tertiary teaching hospital
Synopsis: A clinical data mart was constructed that contained 48 months of prescription data, serum creatinine levels, along with physician characteristics. 28,954 patients with renal insufficiency had 431,119 prescription orders to analyze. 3.5% of drug doses were found excessive. The overdose rate in patients with moderate to severe renal insufficiency was 28.2%. 10 drugs accounted for 85.4% of the overdoses. There was a negative correlation between physician clinical experience and overdose rate.
Study results are limited by the study’s retrospective nature. Further, the prescribed dose was presumed to be the dose actually administered, and there were no data on the actual doses given to patients. The study was limited to a single institution and may not be generalizable.
Bottom line: Iatrogenic drug overdose is quite common among inpatients with renal insufficiency. Only a few drugs are commonly responsible. The physicians’ clinical experience, workload of prescriptions, and patients’ renal function correlated with overdose.
Citation: Sheen SS, Choi JE, Park RW, Kim EY, Lee YH, Kang UG. Overdoser rate of drugs requiring renal dose adjustment: data analysis of 4 years prescriptions at a tertiary teaching hospital. J Gen Intern Med 2007;23(4):423-8
Will a national education program based on the “Surviving Sepsis Campaign” guidelines improve survival and processes of care?
Background: Sepsis is one of the most prevalent diseases and one of the main causes of death among hospitalized patients. Several single-center studies have suggested quality improvement efforts based on the Surviving Sepsis Guidelines were associated with better outcomes.
Study design: Prospective multicenter before-and-after study design.
Setting: 59 medical and surgical ICUs throughout Spain.
Synopsis: 854 patients with severe sepsis were enrolled in the pre–intervention group. The intervention consisted of education on the use of bundles of care. The treatment was organized into two bundles: a resuscitation bundle (six tasks to be performed within six hours) and a management bundle (four tasks to be completed within 24 hours). 1,465 patients were enrolled in the post-training period. Hospital mortality, adherence to the bundles, ICU mortality, 28-day mortality, hospital and ICU length of stay were measured.
Patients in the post-intervention group had lower mortality (44.0% vs. 39.5% P=0.04) and better compliance with the bundles improved. No other outcomes improved. One year later, mortality gains persisted but compliance with the resuscitation bundle had lapsed.
This study did not employ a control group, making it difficult to ascribe the improvement in compliance solely to the training given (some improvement in processes may have occurred independent of the training).
Bottom line: A national education effort to promote bundles of care for severe sepsis and septic shock was associated with improved guideline compliance and lower hospital mortality.
Citation: Ferrer R, Artigas A, Levy MM, et al. Improvement in process of care and outcomes after a multicenter severe sepsis educational program in Spain. JAMA 2008;299(19):2294-2303.
Can SSRI and problem-solving therapy reduce the incidence of depression in non-depressed patients with a recent stroke?
Background: Depression occurs in more than half of previously non-depressed patients after a stroke. Post-stroke depression is associated with impaired recovery and increased mortality.
Study design: A multicenter randomized controlled trial.
Setting: Two urban university-affiliated hospitals and a suburban rehabilitation hospital in the U.S.
Synopsis: 178 patients age 50 to 90 were enrolled within three months of an index stroke in a 12-month trial. The patients were randomized into three groups of a double-blind placebo control comparison of escitalopram with placebo, and non-blinded problem-solving therapy group.
During the period of the trial, patients on escitalopram experienced significant reductions in the incidence of depression versus placebo (23.1% vs. 34.5%). Problem-solving therapy did not result in significant benefit over the placebo.
The study results were limited by several factors. The study did not include all patients with acute stroke, employed a relatively small sample size, used a non-blinded psychological problem-solving therapy group, and had a high drop out rate.
Bottom line: Consider SSRI use to prevent depression in post-stroke patients.
Citation: Robinson RG, Jorge RE, Moser DJ, et. al. Escitalopram and problem-solving therapy for prevention of post stroke depression: a randomized controlled trial. JAMA 2008;299 (20):2391-2400
Do stop orders for indwelling urinary catheters reduce the duration of inappropriate urinary catheterization and incidence of urinary tract infection?
Background: About 25% of hospitalized patients have an indwelling urinary catheter inserted, and in 30% to 50% of these patients, urinary catheters are not indicated. Approximately 50% of patients with a catheter inserted for five days or more will develop bacteriuria with about 80% of hospital-acquired urinary tract infections occurring in patients with a urinary catheter.
Study design: A randomized controlled study.
Setting: Three tertiary care hospitals in Ontario, Canada.
Synopsis: 692 patients with indwelling urinary catheters admitted to seven general medical units in three tertiary care hospitals from January 2004 to June 2006 were randomized into two groups: 269 in the stop-order group, and 252 in the usual care group. Patients in the stop-order group had fewer days of inappropriate and total urinary catheter used (2.20 days) compared with the usual care group (3.89 days). There was no difference in the incidence of urinary tract infection between both groups.
Study results were limited by several factors, including a lack of control for exposure of participants to antimicrobials, missing urine cultures, and lack of evaluation of the effect of reducing urinary catheter use on mobility and quality of life. The 1.34-day reduction in the duration of catheterization may not be sufficient to significantly reduce bacteriuria.
Bottom line: Consider using stop orders in all patients with indwelling urinary catheters.
Citation: Loeb M, Hunt D, O’Halloran K, et. al. Stop orders to reduce inappropriate urinary catheterization in hospitalized patients: a randomized control trial. J Gen Intern Med 2008;23(6):816-820.
Does interrupting anticoagulation in patients with atrial fibrillation undergoing surgery cause an increased rate of thromboembolism?
Background: There is a known risk of thromboembolism (between 0.5% and 20% annually) in patients with atrial fibrillation. Studies are limited regarding the risk of thromboembolism with holding anticoagulation in the perioperative period for nonvalvular atrial fibrillation. This study attempted to answer this question.
Study design: Prospective cohort.
Setting: Thromboembolism clinic of the Mayo Clinic.
Synopsis: 345 patients with nonvalvular atrial fibrillation whose anticoagulation was perioperatively held were monitored for three months after surgery for thromboembolic events. Warfarin therapy was held for 5.3 days +/- three days before surgery and restarted 1.3 days +/- 3.4 days after surgery. Bridging heparin therapy was used for 204/386 procedures.
Four patients suffered six thromboembolic events; two patients while receiving bridging heparin therapy and two without heparin. The total incidence of thromboembolic events was 1.1%. This is compared with an expected incidence of 0.09% to 2.07% for patients with atrial fibrillation on warfarin. Bleeding complications rates were also low.
The authors recognized a possible selection bias and the fact patients who received bridging heparin therapy were not randomized. Despite these potential flaws, there seems to be minimal risk of holding anticoagulation in the perioperative period. Bridging heparin therapy added no additional benefit.
Bottom line: There is no increased risk of thromboembolism if anticoagulation is interrupted without bridging therapy in nonvalvular atrial fibrillation patients undergoing surgery.
Citation: Wysokinski WE, McBane RD, Daniels PR, et al. Periprocedural anticoagulation management of patients with nonvalvular atrial fibrillation. Mayo Clinic Proceedings 2008;83(6):639-645.
Are obese patients under-dosed when prescribed intravenous vancomycin?
Background: Weight-based vancomycin dosing has been recommended by the Infectious Diseases Society of America, yet flat dosing is still commonly employed. Flat dosing has the potential of increasing resistance and having adverse clinical effects.
Study design: Retrospective cohort.
Setting: Two tertiary care medical centers without pharmacy-guided vancomycin dosing programs.
Synopsis: A retrospective review was done of pharmacy prescription files at two tertiary care medical centers that did not have pharmacy-guided vancomycin programs. Patients were divided into cohorts based on their body mass index: underweight (<18.5 kg/sqm) normal weight (18.5-24.9 kg/sqm) overweight (25.0-29.9 kg/sqm) and obese (>29.9 kg/sqm). Each class was studied for rates of adequate vancomycin dosing which was defined as >10 mg/kg/dose. A total of 421 patients were included. There were no other dissimilar baseline characteristics. Total daily dose was similar for all groups with adequate initial dosing achieved in 100%, 99.0%, 93.9% and 27.7% for underweight, normal weight, overweight and obese patients, respectively.
Bottom line: Use weight-based dosing of vancomycin to limit the possibility of under-dosing in obese patients.
Citation: Hall RG, Payne KD, Bain AB, et al. Multicenter evaluation of vancomycin dosing: emphasis on obesity. Am J of Med. 2008;121:515-518.
What is the rate of adverse events with short-term antipsychotic therapy in elderly demented patients?
Study design: Population-based retrospective cohort study.
Setting: Community-dwelling cohort and nursing home cohort.
Synopsis: A cohort of patients from Ontario age 66 and older with the diagnosis of dementia and a prescription for an anti-psychotic drug between April 1, 1997, and March 31, 2004, were divided into two groups by where they lived (community or nursing home). Each cohort was further divided into three groups based on antipsychotic exposure of none, atypical, or conventional.
All serious adverse events (defined as extra-pyramidal symptoms (EPS), cerebrovascular events, and acute care hospital admission or death) were evaluated within 30 days of initiating therapy. In the community group, individuals who received conventional antipsychotic therapy were 3.8 times more likely to have an adverse event compared with the group taking no antipsychotics. The patients prescribed an atypical antipsychotic medicine were 3.2 times more likely to experience an adverse event. In the nursing home group, patients who received conventional and atypical antipsychotic therapy were 2.4 and 1.9 times more likely to have a serious adverse event, respectively.
Bottom line: Serious events are frequent following the short-term use of antipsychotic therapy in older adults with dementia. Serious adverse events were more common among those who received a prescription for conventional rather than atypical antipsychotic drugs.
Citation: Rochon PA, Normand SL, Gomes T, et al. Antipsychotic therapy and short-term serious events in older adults with dementia. Arch Intern Med. 2008;168(10):1090-1096
What is the association between troponin levels and adverse events in hospitalized patients with acute decompensated heart failure?
Background: There were more than 1 million hospitalizations for heart failure in 2007, making it the most costly medical condition based on diagnosis and treatment. Evidence suggests an initial risk stratification process allows for earlier implementation of aggressive therapy, which can affect hospital utilization.
Study design: Retrospective analysis of Acute Decompensated Heart Failure National Registry (ADHERE).
Setting: Hospitalization records from 274 hospitals from October 2001 to January 2004.
Synopsis: Evaluation of the data from ADHERE for outcomes associated with elevated troponin levels in patients with acute decompensated heart failure (ADHF). Patients who had a creatinine level above 2.0 mg per deciliter were excluded.
Cardiac troponin I was measured in 61,379 patients and cardiac troponin T in 7880 patients. Overall, 4,240 patients (6.2%) had an elevated troponin level. Troponin positive patients had a higher rate of in-hospital mortality than troponin negative patients (8.0% vs. 2.7%, P<0.001). The adjusted odds ratio for death among patients with a positive troponin test was 2.55. Ischemic heart failure was present in 53% of the troponin positive patients and was not a useful predictor of troponin status or mortality.
Bottom line: Measurement of troponin is an important prognostic indicator in the initial evaluation of patients with ADHF. This early assessment of risk should be factored into medical decisions with respect to triage and medical management.
Citation: Peacock FW, De Marco T, Fonarow GC, et al. Cardiac troponin and outcome in acute heart failure. N Engl J Med 2008;358:2117-26
Behind the Scenes

In the last year, SHM has made great strides in improving the user experience at www. hospitalmedicine.org. Now it’s easier than ever to keep up with the latest news from the fastest-growing specialty in the history of modern healthcare. In an effort to bring as much energy as possible to this cutting-edge specialty, SHM strives to expand our online tools by offering our members the latest resources in education, events and publications over the newest mediums available. Like hospital medicine, Web 2.0 is a trend on the rise. From blogs to podcasts to our new RSS feeds, you will notice many new applications throughout SHM’s site.
hospitalmedicine.org: New and Improved
The first step in setting this new approach into motion was a complete overhaul of SHM’s Web site. This major renovation set the stage for a variety of new features, including seven resource rooms focused on Quality Improvement and supplemental clinical tools, as well as the introduction of online discussion forums and the SHM Career Center.
New Event Sites
Following our Web site expansion, we introduced several specialty sites for our most popular products, including SHM’s “2007-2008 State of the Hospital Medicine Movement” survey, as well as SHM’s Leadership Academy, Annual Meeting, and (coming soon) SHM’s One Day University.
These sites offer inside information about product news, meeting topics, curricula, and exclusive member offers. This year’s Hospital Medicine 2009 (HM09) site features more than 40 presentations from Hospital Medicine 2008 (HM08) for users to view such topics as quality improvement, operations, and clinical. With year-round access to resources, information from past meetings isn’t lost. It can be retrieved daily for practicing hospitalists.
Blogs
SHM first introduced blogs to our members in 2007 with the launch of “Wachter’s World” (www.wachtersworld.org), as well as the HM07 blog, which featured an inside look at the goings-on at the annual meeting. Blogs create an interactive forum to discuss relevant issues on a daily basis and introduce readers to the perspectives of some of the most reputable hospitalists in the specialty today.
This year, we expanded our blogs to reflect on past events, offering participants a chance to share highlights and feedback from our annual meetings. Not only does this help our members keep current on hospital medicine news, but it also provides an outlet to voice opinions and help influence the direction of the society.

Podcasts
For those of you who enjoy auditory learning, you will find podcasts attached to event pages and CME listings. Our podcast library features guests, such as featured keynote speakers, industry specialists, SHM board members, and event attendees. Be on the lookout for SHM team members at upcoming events, as you may have the opportunity for a podcast interview of your own!
RSS Feeds
In June 2008 SHM created its own RSS feed, offering biweekly updates. Subscribers to SHM’s RSS feed receive up-to-the minute news streaming to their e-mail/PDAs, with updates ranging from SHM’s organizational growth and development to relative changes in legislation/public policy and anything relating to hospital medicine. Subscribe today so that you don’t miss the most current updates to hospitalmedicine.org.
Social Networking
Networking always has been one of the most important benefits of SHM membership. From communicating with local hospitalists at chapter meetings, to national and international colleagues at our annual meeting, there is a sense of community among those in the hospital medicine field. SHM recognizes the importance of building this community and has taken networking to a new level through participation in social networking sites such as Facebook and LinkedIn. If you currently are a user of these sites, join the SHM group and get connected!
All of these resources are at your fingertips. Visit us online at www.hospitalmedicine.org to try out one or all of these new features and upgrade your SHM experience. TH
In the last year, SHM has made great strides in improving the user experience at www. hospitalmedicine.org. Now it’s easier than ever to keep up with the latest news from the fastest-growing specialty in the history of modern healthcare. In an effort to bring as much energy as possible to this cutting-edge specialty, SHM strives to expand our online tools by offering our members the latest resources in education, events and publications over the newest mediums available. Like hospital medicine, Web 2.0 is a trend on the rise. From blogs to podcasts to our new RSS feeds, you will notice many new applications throughout SHM’s site.
hospitalmedicine.org: New and Improved
The first step in setting this new approach into motion was a complete overhaul of SHM’s Web site. This major renovation set the stage for a variety of new features, including seven resource rooms focused on Quality Improvement and supplemental clinical tools, as well as the introduction of online discussion forums and the SHM Career Center.
New Event Sites
Following our Web site expansion, we introduced several specialty sites for our most popular products, including SHM’s “2007-2008 State of the Hospital Medicine Movement” survey, as well as SHM’s Leadership Academy, Annual Meeting, and (coming soon) SHM’s One Day University.
These sites offer inside information about product news, meeting topics, curricula, and exclusive member offers. This year’s Hospital Medicine 2009 (HM09) site features more than 40 presentations from Hospital Medicine 2008 (HM08) for users to view such topics as quality improvement, operations, and clinical. With year-round access to resources, information from past meetings isn’t lost. It can be retrieved daily for practicing hospitalists.
Blogs
SHM first introduced blogs to our members in 2007 with the launch of “Wachter’s World” (www.wachtersworld.org), as well as the HM07 blog, which featured an inside look at the goings-on at the annual meeting. Blogs create an interactive forum to discuss relevant issues on a daily basis and introduce readers to the perspectives of some of the most reputable hospitalists in the specialty today.
This year, we expanded our blogs to reflect on past events, offering participants a chance to share highlights and feedback from our annual meetings. Not only does this help our members keep current on hospital medicine news, but it also provides an outlet to voice opinions and help influence the direction of the society.
Podcasts
For those of you who enjoy auditory learning, you will find podcasts attached to event pages and CME listings. Our podcast library features guests, such as featured keynote speakers, industry specialists, SHM board members, and event attendees. Be on the lookout for SHM team members at upcoming events, as you may have the opportunity for a podcast interview of your own!
RSS Feeds
In June 2008 SHM created its own RSS feed, offering biweekly updates. Subscribers to SHM’s RSS feed receive up-to-the minute news streaming to their e-mail/PDAs, with updates ranging from SHM’s organizational growth and development to relative changes in legislation/public policy and anything relating to hospital medicine. Subscribe today so that you don’t miss the most current updates to hospitalmedicine.org.
Social Networking
Networking always has been one of the most important benefits of SHM membership. From communicating with local hospitalists at chapter meetings, to national and international colleagues at our annual meeting, there is a sense of community among those in the hospital medicine field. SHM recognizes the importance of building this community and has taken networking to a new level through participation in social networking sites such as Facebook and LinkedIn. If you currently are a user of these sites, join the SHM group and get connected!
All of these resources are at your fingertips. Visit us online at www.hospitalmedicine.org to try out one or all of these new features and upgrade your SHM experience. TH
Mixed Messages Called Out
I am a hospitalist outsider. A traditional internist, I cared for my patients in and out of the hospital, provided ICU and unassigned ED call, and later transitioned to hospital-only work. Our group developed a hospitalist program and has, hopefully, run an above-average system growing with our community. Even performing full-time hospital work, it took me a year to get over being referred to as a “hospitalist.” It seemed a confining label.
I also feel like an outsider while reading hospitalist literature’s divergent messages to hospitalists. On one hand, I hear great things about how hospitalists will revolutionize healthcare, spearheading improvements in safety, efficiency, and satisfaction, and filling administrative roles. I then see articles about negotiating out of working nights and weekends, about how the productivity of hospitalists remains stagnant but subsidy demands increase, and about how to limit caseloads. I see articles about hospitalist groups becoming privately held corporations, sending revenue that physicians generate (and hospitals subsidize) into the pockets of private investors.
There are two growing hospitalist camps. The first is filled with strategic thinkers driven to fix inefficient hospital care and save each of those 100,000 Institute of Medicine lives. These are the chief residents of yesterday, academically oriented problem solvers with IT savvy and a propensity for coffee-fueled all-nighters. You know them within your hospitalist groups and medical staffs.
The second camp consists of the lifestyle hospitalists; those for whom salary and 16 shifts a month are the goals that supersede professional loyalty to any particular group. These are the physicians who can help meet various metrics but want nothing to do with designing them.
These two groups read the literature with different eyes and career aspirations. As this division spreads, I strain to hear a drowning voice regarding another physician role: our responsibility to our patients. Drowning because both camps are swimming away from the patient, one toward a desk job, the other to a defined shift schedule.
Caring for patients is why we are in medicine in the first place. Most hospitalists came from primary care residencies, so the rewards of lifestyle and money must have been less important than direct patient contact. Primary care graduates entered traditional practices, promptly encountering the headaches of running a practice. Then suddenly a plum job with higher compensation and limited work hours was born, and, unsurprisingly, the primary care fields lost physicians to the hospitalist movement.
For new hospitalists exiting residency, there is no institutional knowledge of the old ways, and while they are not perfect, there are some noble qualities. Dedication to the profession is one, as is an enduring responsibility to one’s patient. Medicine required an occasional need to interrupt personal interests to help a sick human being—a patient—through a difficult time. For those physicians with traditional experience, can you recall articles suggesting negotiating for no nights and weekends? I’m not sure who we expect to provide this care to our patients if we can negotiate out of working.
There are certainly drawbacks to the traditional system: strained family relationships, substance abuse, and poor work-life balance—but don’t throw the baby out with the bathwater. These values elevated medicine to the position it holds today: a respected and well-compensated profession. I fear this young hospitalist specialty may not live up to its hype or responsibilities if hospitalists are motivated to focus on their “job” rather that their duties as the “doctor.” So what to do?
I think this can be a specialty that identifies members as physicians first and hospitalists second through the expectations of our peers in our own groups, medical staffs, and physician societies. We need to grow our groups with physicians dedicated not just to their partners, but the physician community at large; with those who want to improve care not just by meeting myocardial infarction guidelines, but with those who work with other physicians to help the patient manage their heart disease for 30 years; with physicians who ask about quality, teamwork, and the local community during the job interview and don’t begin with salary, patient caps, and weekend limitations.
Hospitalist group leaders need to expect these traits from their physicians. Otherwise practicing hospitalists will forever remain glorified residents and not leaders.
SHM needs to promote and recognize the values of being a physician in this field, instead of patting itself on the back for how trailblazing hospitalists could be while simultaneously ignoring what we are. TH
Edward Norman, MD, Internist/Hospitalist, Loveland, Colo.
Canadian Hospitalists: Time to Stand Up
In late June 2006, hospitalists in British Columbia (B.C.) were on the verge of walking out of their regions’ hospitals in protest over payment and workload. The strike was narrowly averted (see “Tough Negotiations Avert B.C. Hospitalist Walkout,” August 2006, p. 1), and chief negotiators for the B.C. hospitalists signed an interim agreement that left the door open for future pay hikes and an examination of workload among other issues.
Two years later, some progress in providing pay increases and adjusting workloads has happened, according to some B.C. hospitalists. David Wilton, MD, is one of the directors of the Vancouver Hospitalist Society, a nonprofit organization that contracts with Vancouver General Hospital and the University of British Columbia Hospital (both overseen by the Vancouver Coastal Health Authority). Although Dr. Wilton reports “things have been working at a snail’s pace,” he and his colleagues have made important inroads in developing more collegial relations with the British Columbia Medical Association (BCMA) and the Canadian College of Family Physicians (CCFP). By taking guidance from SHM, Canadian hospitalists are strengthening their own association by increasing awareness of the value of hospital medicine in Canada.
Where the Trouble Began
BC is divided into six regional health authorities—five of which have active hospitalist programs. Hospitals are administered by the health authorities, whose administrators have come to appreciate hospitalists’ value in increasing patient flow and thus reducing emergency room crowding. However, the health authority administrators do not determine hospitalists’ salaries. All B.C. physicians’ compensation is established through periodic negotiations between the BCMA and the province’s Ministry of Health (MOH).
A Letter of Agreement signed by the two sides in April 2006 revealed serious problems for the hospitalists. The association, dominated by establishment physicians, had (for purposes of the Letter of Agreement) placed hospitalists lower on the pay scale grid than community-based family physicians. Even though hospitalists in Canada predominantly are from a family practice background (the opposite of the United States, where the majority of hospitalists come from internal medicine backgrounds) the BCMA’s under-appreciation of hospitalists’ workloads led to a low base rate for calculating salary increases.
Subsequently, the B.C. hospitalists realized they needed to be proactive about their own interests and hired an attorney to attend meetings with the ministry. Although the ministry never agreed this second, public round of talks were negotiations, an agreement to re-examine contracts was reached.
—Wayne DeMott, MD, hospitalist at Royal Jubilee Hospital in Victoria, B.C.
The contract (signed in June 2006) stipulated timelines for a wind-down provision if there were no satisfactory outcomes with the alternate payments committee or the newly established tripartite Hospitalist Workload Model Working Group, comprised of MOH, local health authority, and hospitalist representatives. An interim contract was signed in September 2007 (retroactive to March 2007) and is again up for renewal since it is now past the April 1, 2008 deadline. The strategy for the near-term is to renew the compensation contract for shorter time periods and wait until the BCMA re-opens negotiations with the MOH in 2010 for an updated Letter of Agreement.
Repairing the Divide
In the meantime, B.C. hospitalists have delved into multiple initiatives they believe eventually will bear fruit. Chief among these is establishment of a hospitalist section within the BCMA. In 2006, the situation was “somewhat antagonistic” between hospitalists and the BCMA, says Geoff Appleton, MD, the current BCMA president.
“There has been friction between GPs and hospitalists because GPs have felt themselves pushed out of the hospital sector,” he says, “and they felt that hospitalists were getting paid more for hospital work than they were.”
Hospitalists, on the other hand, contend GPs were abandoning hospital-based practice, which created a new opportunity for those specializing in inpatient service delivery.
“Hospitalists did not feel they were represented as well as they should have been with the last round of [MOH] negotiations,” Dr. Appleton says. “They feel that they have been undervalued from a BCMA point of view, we don’t like to see that kind of conflict. I think once hospitalists help their colleagues understand the services that they are providing, then some of that resistance can go away. I’m hoping that they’re happier with what we’ve been doing and that their sectional status has improved things for them.”
Others in British Columbia agree with Dr. Appleton’s prognosis. “I think we’ve got optimism,” says Wayne DeMott, MD, a hospitalist at Royal Jubilee Hospital in Victoria, B.C. and chief negotiator for the BCMA’s Section of Hospitalist Medicine. “I think we’re trying to seek a much better representation of our issues from our parent organization that has struggled with figuring out what the heck to do with hospitalists. I do sense that they are trying to accommodate us a bit better and that they’re going to look at how they will represent us in the future.”
Understandably, though, Dr. DeMott also expresses wariness: “We had to go on a pretty tough journey in 2006 and we still haven’t forgotten how we were treated two years ago. We’re definitely going to continue to advocate strongly for ourselves.”
U.S.-Canadian Similarities, Differences
As U.S. hospitalists observe the growing pains of hospitalists in the Canadian healthcare system, it might look like deja vu all over again.
“In many ways, Canadian hospitalists are following a similar arc [as our U.S. HM colleagues] in carving out their niche,” says Dr. Wilton. The void created when family practice physicians abandoned hospital care in the late 1980s and early ’90s has turned into an opportunity for hospitalists. In turn, family practice physicians who at first were resistant have become accepting as they begin to appreciate the service hospitalists provide.
Even though U.S. and Canadian healthcare delivery and reimbursement systems differ, hospitalists “have a similar scope of practice” in the two countries, says Echo- Marie Enns, MD, CCFP, a hospitalist in Calgary, Alberta, and the first president of the Canadian chapter of SHM. John Nelson, MD, medical director of the Hospitalist Practice at Overlake Hospital in Bellevue, WA, a consultant for hospitalist practices with Nelson/Flores Associates, and co-founder and past president of SHM, agrees. “Eighty to ninety percent of the issues with hospitalists would apply to both settings,” he says. “There are ways in which they differ, but in broad strokes, they’re almost identical.”
Hospitalists’ situations and reimbursement agreements do vary from province to province, Dr. Enns notes. She was the lead hospitalist when the Calgary program started in 1998. She also worked in B.C. for a time and noticed that the MOH can be adversarial toward physicians at times. On the other hand, hospitalists in Alberta say they are “very well treated,” and have reported high satisfaction levels overall.
“The hospitalists here admit greater than fifty percent of the patients to medical beds in the region. So, we are the admitting force for the hospital,” she says. “We have a very cooperative relationship with the administration and have been able to initiate a lot of excellent initiatives to improve patient flow in moving patients to the most appropriate bed at the right time. As a result, we’re also getting to be more well known amongst the public.”
More Developments
Currently, the Hospitalist Workload Model Working Group awaits money to hire an external consultant to study hospitalists’ workloads across the province. B.C. hospitalists also are forging a new partnership with the Canadian College of Family Physicians (CCFP). Family practice physicians formerly were wedded to the “mantra of the full-service family physician who did everything—patients, obstetrics, pediatrics—and now they are recognizing that practice patterns are changing,” explains Dr. Wilton. “In order to remain relevant, they need to acknowledge hospital medicine, embrace it and regulate it, to make sure that it is done well.”
The CCFP is now partnering with hospitalists to establish a hospital medicine certification process. Another positive step: the University of Toronto is beginning a new one-year hospital medicine fellowship program. (www.sunnybrook.ca/education/Hospitalist).
Hospitalists across Canada are “in the middle stages” of forming their HM society, reports Dr. Wilton, who has led efforts to build a national database and to launch a survey of Canadian hospitalists. Dr. Enns, who initiated the first Canadian SHM chapter in 2000, thinks opportunities abound for increased collaborations across the border. For instance, she says, having Canadian hospitals involved in multicenter trials of DVT prophylaxis or diabetes initiatives could prove fruitful.
Dr. Nelson also agrees SHM and Canadian hospitalists should continue to consult and work with each other. “There are a number of Canadians who are active in SHM and I think that should continue,” he says. “We have a lot to learn from one another because for most of the issues we face the solutions are going to be the same.”
Drs. Wilton and DeMott invite their U.S. colleagues to attend the 6th annual Canadian Hospitalist Conference from Sept. 27-28, at the Morris J. Wosk Centre for Dialogue in Vancouver, BC. SHM CEO Larry Wellikson, MD, will be the keynote speaker. To register visit www.cpdkt.ubc.ca.
Stay Optimistic
Dr. Wilton notes that despite the slow rate of change for hospitalists, there are positive aspects to their work. “We all know—fundamentally—that we are essential to the functioning of the hospitals,” he says. “We know we’re needed and valued on the frontlines. The [government] bureaucracy and the medical establishment are slow to change, but they eventually will.”
Dr. DeMott considers the future of BCMA hopeful. “We’re going to have a bigger role at the BCMA. They’re going to come to completely appreciate us, and things will hopefully be less acrimonious in the future.”
Both physicians agree the crisis of June 2006 served to heighten awareness of hospitalists’ value.
“It was the hospitalists’ time to make people recognize what we do and that we need to be adequately compensated for it,” Dr. Wilton says. TH
Gretchen Henkel is a medical writer based in California.
Hitting the Big Time
No matter how big a hospital medicine group is, the leader is likely to say “but we need a couple more.” As the fastest-growing medical specialty in the history of American medicine, there never seem to be enough hospitalists (see Figure 1, p. 28).
“The programs are getting larger and larger, ranging anywhere from 20 to 100 physicians in a hospitalist group,” says Jeffrey Hay, MD, senior vice president of medical operations for Lakeside Systems Inc. in Los Angeles.
Because of this rapid growth, two questions become apparent:
1. How is a big hospitalist group defined?
2. What does it take to manage a big group well?
How Big is Big?
Although what constitutes a big hospitalist group is relative, Leslie Flores and her partner, John Nelson, MD, of Nelson/Flores Associates, LLC, La Quinta, Calif., estimate with about 20-30 hospitalists, the role of the medical director becomes a different job than for the typical-sized practice of 10-15 hospitalists.
According to SHM Executive Advisor to the CEO Joseph Miller, this year’s “Society of Hospital Medicine 2007-08 Survey: The Authoritative Source on the State of the Hospitalist Movement” revealed only eight groups with more than 40 hospitalists (excluding the multistate hospitalist management companies). In the approximate 2,200 hospitalist groups in the U.S., Miller estimates there are perhaps 40 groups with 40 or more physicians compared with two in the previous 2005-06 survey.
Medical directors of hospital medicine groups (HMGs) ranging from 22-100 people offer varied insights about how the role of medical director changes as groups grow from big to bigger to biggest.
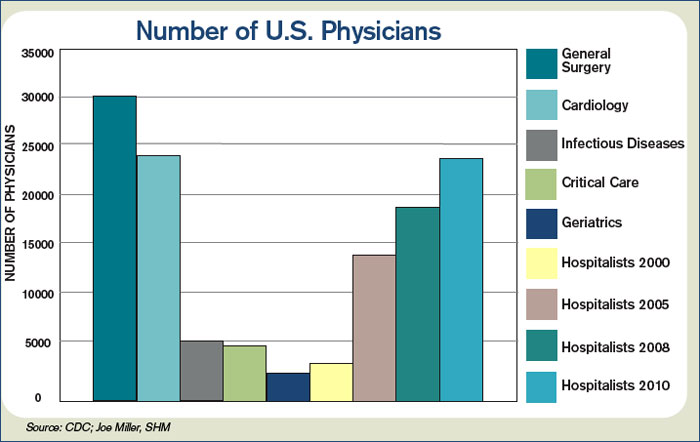
Big
Jeffery Kin, MD, medical director of the private-practice group Fredericks Hospitalist Group PC, manages 22 hospitalists, and about 130-140 inpatients and 45 admissions a day at Mary Washington Hospital in Fredericksburg, Va. They began as a team of three in 2000 as the outgrowth of a hospital house-doctor program.
“The medical director’s role changes and evolves with the growth of the group,” says Dr. Kin. He and other medical directors of larger groups find it more difficult to retain the informal shift arrival or departure and lunches together that were possible when the HMG was smaller. “Now that we are bigger it is more ‘protocolized,’” Dr. Kin says, “but we try to maintain a family-like atmosphere because I think it makes physicians want to stay with the group long term and not move on with every little problem or challenge that inevitably arises in the changing filed of hospital medicine.”
William Ford, MD, program medical director for Cogent Healthcare and the chief of hospital medicine at Temple University in Philadelphia, considers his group of 28 hospitalists to be a “small” big group. Dr. Ford’s group, which covers three of the four hospitals in the university health systems, grew from five hospitalists in September 2006. He devotes about half his time on personnel issues, including recruitment, retention, and staff development.
As groups grow, so does diversity, requiring more flexibility to manage leaves of absence, scheduling, and day-to-day practice. “In a large group we tend to bring on new measures,” Dr. Ford says. “We change like the wind, so if you aren’t ready for that, you will have a lot of turnover.”
Bigger
Jasen W. Gundersen, MD, MBA, division chief, hospital medicine, University of Massachusetts Memorial Medical Center, Worcester, grew his HMG from 3.6 FTEs three years ago to the 47.5 FTEs (40 physician FTEs and 7.5 FTEs nurse practitioners) they now employ. The group, which covers four hospitals ranging from a 30-bed community hospital to a 770-bed academic hospital, is the biggest HMG in New England. “Our budget numbers for charges and volume are 2.19 times what we projected in the budget,” he says.
With an average of 185 billable patient encounters per day, Dr. Gundersen attributes his successes to a management style based on a financial business model and a revision of the compensation plan. By increasing effectiveness, they reward their doctors with more free time and subsequently improved physician retention.
As the group, the budget, and the financial impact all expand, formal training becomes more important for leaders. While few HMG leaders have a background in the strategic processes of running a company, Dr. Gundersen earned his MBA and believes his training made it easier to talk to administrators, meet clients, track data, effect change, and better handle the politics inherent to the job. “The role is a lot more political than people are aware of because you are such a big presence to the hospital,” he says. “Everybody wants something from you.”
Part of that phenomenon, coined “medical creep” by one hospitalist, can best be defined as the gradual increase in workload shifted to HMGs without a proportional shift in resources to do the work. Work previously done by either surgical specialists or medical subspecialists must be shifted as they more narrowly define their workload; what is left over (more general medical care, phone calls, after-hours work, and paperwork) goes to “co-managing” hospitalists.
Asked about this phenomenon, Tom Lorence, MD, chief of hospitalist medicine for the Northwest Kaiser Permanente region, Portland, Ore., says: “The larger the hospitalist groups become, the bigger a target we are for this shifting. Most try to justify it by saying, ‘It is only a little more work.’ ”
Dr. Lorence and two colleagues began his HMG in 1990; he now manages 55 hospitalists at three facilities. “Administrators have to be convinced that it is worth the money to reshift their priorities and give more resources to the hospital medicine groups,” he says.
Mark V. Williams, MD, FACP, professor and chief, division of hospital medicine, Northwestern University Feinberg School of Medicine, Chicago, moved to his current post last September. Northwestern Memorial Hospital almost doubled its hospitalists to 42 in one year. The initial challenges at Northwestern primarily include assimilating new faculty and establishing a culture of thriving on change, says Dr. Williams, who is also editor in chief of the Journal of Hospital Medicine.
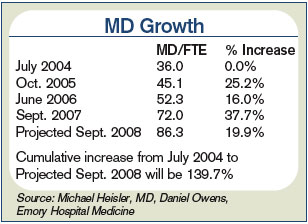
Biggest
The distinction between academic and non-academic programs is an important one says Michael B. Heisler, MD, MPH, who became the interim medical director of Emory Healthcare, Atlanta, in March 2007 when Dr. Williams moved to Northwestern. Generally, the Emory group has increased in size by 20% each of the past five years. Beginning with nine hospitalists in 1999, it now exceeds 80 (see Figure 2, p. 28).
Academic hospitals have additional stakeholders and deliverables expected by those to whom the medical director reports. Whereas community hospital medicine programs are driven by patient encounters/RVUs, quality improvement, and the bottom line, academic groups also must engage in scholarly activities.
Dr. Heisler and his group have just completed a three-year strategic plan that emphasizes medical education and research and a plateau to the group’s growth.
“We can’t be the premier academic program with growth going through the roof,” Dr. Heisler says. “With some limits we are not going to increase services within our institutions and will not entertain requests to grow into any other facilities through 2010. You can’t develop faculty, define protected time, and invest in scholarly work when you are constantly in growth mode.”
Strategic planning has a different tone for Tyler Jung, MD, director of inpatient services of the multi-specialty group HealthCare Partners, who took over that position three years ago when Dr. Hay left. About 100 hospitalists are employed under the HealthCare Partners umbrella; approximately 85 are on the payroll, and 15 work in a strategic alliance. The HMG covers 14 community hospitals in Southern California, about 14 hospitals in Las Vegas, Nevada, and about five hospitals in the Tampa/Orlando area of Florida.
The full-risk California medical model drives a lot of the metrics. “We look at [relative value unit] goals for our hospitalists, but mostly to ensure proper staffing,” Dr. Jung says. “We are satisfied when our docs have 12 to 14 encounters a day. In the service market you’d go broke with that, but I’d rather have our hospitalists see our patients twice a day because it drives quality and it turns out to be more cost effective.”
Some of the outcomes Dr. Jung regularly reviews include patient utilization per membership (admit rates, readmit data, and length of stay), and these metrics are largely unchanged as they have grown. “Additionally, maintaining high patient satisfaction can be overlooked, but is critical with the growth of any program,” he says (see Figure 3, p. 28).
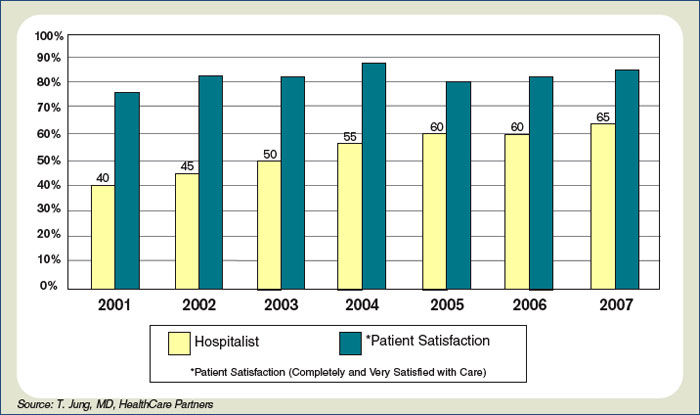
Dr. Williams, who began the hospitalist group at Emory Healthcare, says the primary challenges he faced as that program grew were finding capable physicians willing to join a new or expanding program; managing the different cultures at different hospitals and working to ensure they all felt a part of the whole; having sufficient administrative support time to manage recruitment and credentialing; and keeping up constant communications with individuals and leadership at all sites. He found it helpful to occasionally rotate hospitalists, especially the more senior physicians, so they could appreciate the workload and issues at different sites.
Dr. Williams, who trained in internal medicine but later became board certified in emergency medicine, is not surprised Dr. Jung has some background in critical care, as does Dr. Heisler. He surmises they also all have well-honed administrative skills. “The experience I had in running a 65,000-visit-a-year emergency room and a 45,000-visit-a-year urgent-care center gave me the skills to run a large hospital medicine program,” Dr. Williams says. TH
Andrea M. Sattinger is a medical writer based in North Carolina.
No matter how big a hospital medicine group is, the leader is likely to say “but we need a couple more.” As the fastest-growing medical specialty in the history of American medicine, there never seem to be enough hospitalists (see Figure 1, p. 28).
“The programs are getting larger and larger, ranging anywhere from 20 to 100 physicians in a hospitalist group,” says Jeffrey Hay, MD, senior vice president of medical operations for Lakeside Systems Inc. in Los Angeles.
Because of this rapid growth, two questions become apparent:
1. How is a big hospitalist group defined?
2. What does it take to manage a big group well?
How Big is Big?
Although what constitutes a big hospitalist group is relative, Leslie Flores and her partner, John Nelson, MD, of Nelson/Flores Associates, LLC, La Quinta, Calif., estimate with about 20-30 hospitalists, the role of the medical director becomes a different job than for the typical-sized practice of 10-15 hospitalists.
According to SHM Executive Advisor to the CEO Joseph Miller, this year’s “Society of Hospital Medicine 2007-08 Survey: The Authoritative Source on the State of the Hospitalist Movement” revealed only eight groups with more than 40 hospitalists (excluding the multistate hospitalist management companies). In the approximate 2,200 hospitalist groups in the U.S., Miller estimates there are perhaps 40 groups with 40 or more physicians compared with two in the previous 2005-06 survey.
Medical directors of hospital medicine groups (HMGs) ranging from 22-100 people offer varied insights about how the role of medical director changes as groups grow from big to bigger to biggest.
Big
Jeffery Kin, MD, medical director of the private-practice group Fredericks Hospitalist Group PC, manages 22 hospitalists, and about 130-140 inpatients and 45 admissions a day at Mary Washington Hospital in Fredericksburg, Va. They began as a team of three in 2000 as the outgrowth of a hospital house-doctor program.
“The medical director’s role changes and evolves with the growth of the group,” says Dr. Kin. He and other medical directors of larger groups find it more difficult to retain the informal shift arrival or departure and lunches together that were possible when the HMG was smaller. “Now that we are bigger it is more ‘protocolized,’” Dr. Kin says, “but we try to maintain a family-like atmosphere because I think it makes physicians want to stay with the group long term and not move on with every little problem or challenge that inevitably arises in the changing filed of hospital medicine.”
William Ford, MD, program medical director for Cogent Healthcare and the chief of hospital medicine at Temple University in Philadelphia, considers his group of 28 hospitalists to be a “small” big group. Dr. Ford’s group, which covers three of the four hospitals in the university health systems, grew from five hospitalists in September 2006. He devotes about half his time on personnel issues, including recruitment, retention, and staff development.
As groups grow, so does diversity, requiring more flexibility to manage leaves of absence, scheduling, and day-to-day practice. “In a large group we tend to bring on new measures,” Dr. Ford says. “We change like the wind, so if you aren’t ready for that, you will have a lot of turnover.”
Bigger
Jasen W. Gundersen, MD, MBA, division chief, hospital medicine, University of Massachusetts Memorial Medical Center, Worcester, grew his HMG from 3.6 FTEs three years ago to the 47.5 FTEs (40 physician FTEs and 7.5 FTEs nurse practitioners) they now employ. The group, which covers four hospitals ranging from a 30-bed community hospital to a 770-bed academic hospital, is the biggest HMG in New England. “Our budget numbers for charges and volume are 2.19 times what we projected in the budget,” he says.
With an average of 185 billable patient encounters per day, Dr. Gundersen attributes his successes to a management style based on a financial business model and a revision of the compensation plan. By increasing effectiveness, they reward their doctors with more free time and subsequently improved physician retention.
As the group, the budget, and the financial impact all expand, formal training becomes more important for leaders. While few HMG leaders have a background in the strategic processes of running a company, Dr. Gundersen earned his MBA and believes his training made it easier to talk to administrators, meet clients, track data, effect change, and better handle the politics inherent to the job. “The role is a lot more political than people are aware of because you are such a big presence to the hospital,” he says. “Everybody wants something from you.”
Part of that phenomenon, coined “medical creep” by one hospitalist, can best be defined as the gradual increase in workload shifted to HMGs without a proportional shift in resources to do the work. Work previously done by either surgical specialists or medical subspecialists must be shifted as they more narrowly define their workload; what is left over (more general medical care, phone calls, after-hours work, and paperwork) goes to “co-managing” hospitalists.
Asked about this phenomenon, Tom Lorence, MD, chief of hospitalist medicine for the Northwest Kaiser Permanente region, Portland, Ore., says: “The larger the hospitalist groups become, the bigger a target we are for this shifting. Most try to justify it by saying, ‘It is only a little more work.’ ”
Dr. Lorence and two colleagues began his HMG in 1990; he now manages 55 hospitalists at three facilities. “Administrators have to be convinced that it is worth the money to reshift their priorities and give more resources to the hospital medicine groups,” he says.
Mark V. Williams, MD, FACP, professor and chief, division of hospital medicine, Northwestern University Feinberg School of Medicine, Chicago, moved to his current post last September. Northwestern Memorial Hospital almost doubled its hospitalists to 42 in one year. The initial challenges at Northwestern primarily include assimilating new faculty and establishing a culture of thriving on change, says Dr. Williams, who is also editor in chief of the Journal of Hospital Medicine.
Biggest
The distinction between academic and non-academic programs is an important one says Michael B. Heisler, MD, MPH, who became the interim medical director of Emory Healthcare, Atlanta, in March 2007 when Dr. Williams moved to Northwestern. Generally, the Emory group has increased in size by 20% each of the past five years. Beginning with nine hospitalists in 1999, it now exceeds 80 (see Figure 2, p. 28).
Academic hospitals have additional stakeholders and deliverables expected by those to whom the medical director reports. Whereas community hospital medicine programs are driven by patient encounters/RVUs, quality improvement, and the bottom line, academic groups also must engage in scholarly activities.
Dr. Heisler and his group have just completed a three-year strategic plan that emphasizes medical education and research and a plateau to the group’s growth.
“We can’t be the premier academic program with growth going through the roof,” Dr. Heisler says. “With some limits we are not going to increase services within our institutions and will not entertain requests to grow into any other facilities through 2010. You can’t develop faculty, define protected time, and invest in scholarly work when you are constantly in growth mode.”
Strategic planning has a different tone for Tyler Jung, MD, director of inpatient services of the multi-specialty group HealthCare Partners, who took over that position three years ago when Dr. Hay left. About 100 hospitalists are employed under the HealthCare Partners umbrella; approximately 85 are on the payroll, and 15 work in a strategic alliance. The HMG covers 14 community hospitals in Southern California, about 14 hospitals in Las Vegas, Nevada, and about five hospitals in the Tampa/Orlando area of Florida.
The full-risk California medical model drives a lot of the metrics. “We look at [relative value unit] goals for our hospitalists, but mostly to ensure proper staffing,” Dr. Jung says. “We are satisfied when our docs have 12 to 14 encounters a day. In the service market you’d go broke with that, but I’d rather have our hospitalists see our patients twice a day because it drives quality and it turns out to be more cost effective.”
Some of the outcomes Dr. Jung regularly reviews include patient utilization per membership (admit rates, readmit data, and length of stay), and these metrics are largely unchanged as they have grown. “Additionally, maintaining high patient satisfaction can be overlooked, but is critical with the growth of any program,” he says (see Figure 3, p. 28).
Dr. Williams, who began the hospitalist group at Emory Healthcare, says the primary challenges he faced as that program grew were finding capable physicians willing to join a new or expanding program; managing the different cultures at different hospitals and working to ensure they all felt a part of the whole; having sufficient administrative support time to manage recruitment and credentialing; and keeping up constant communications with individuals and leadership at all sites. He found it helpful to occasionally rotate hospitalists, especially the more senior physicians, so they could appreciate the workload and issues at different sites.
Dr. Williams, who trained in internal medicine but later became board certified in emergency medicine, is not surprised Dr. Jung has some background in critical care, as does Dr. Heisler. He surmises they also all have well-honed administrative skills. “The experience I had in running a 65,000-visit-a-year emergency room and a 45,000-visit-a-year urgent-care center gave me the skills to run a large hospital medicine program,” Dr. Williams says. TH
Andrea M. Sattinger is a medical writer based in North Carolina.
What is the proper workup of a patient with hypertension?
How extensive a workup does a patient with high blood pressure need?
On one hand, we would not want to start therapy on the basis of a single elevated reading, as blood pressure fluctuates considerably during the day, and even experienced physicians often make errors in taking blood pressure that tend to falsely elevate the patient’s readings. Similarly, we would not want to miss the diagnosis of a potentially curable cause of hypertension or of a condition that increases a patient’s risk of cardiovascular disease. But considering that nearly one-third of adults in the United States have hypertension and that another one-fourth have prehypertension (formerly called high-normal blood pressure),1 if we were to launch an intensive workup for every patient with high blood pressure, the cost and effort would be enormous.
Fortunately, for most patients, it is enough to measure blood pressure accurately and repeatedly, perform a focused history and physical examination, and obtain the results of a few basic laboratory tests and an electrocardiogram, with additional tests in special cases.
In this review we address four fundamental questions in the evaluation of patients with a high blood pressure reading, and how to answer them.
ANSWERING FOUR QUESTIONS
The goal of the hypertension evaluation is to answer four questions:
- Does the patient have sustained hypertension? And if so—
- Is the hypertension primary or secondary?
- Does the patient have other cardiovascular risk factors?
- Does he or she have evidence of target organ damage?
DOES THE PATIENT HAVE SUSTAINED HYPERTENSION?
It is important to measure blood pressure accurately, for several reasons. A diagnosis of hypertension has a measurable impact on the patient’s quality of life.2 Furthermore, we want to avoid undertaking a full evaluation of hypertension if the patient doesn’t actually have high blood pressure, ie, systolic blood pressure greater than 140 mm Hg or diastolic pressure greater than 90 mm Hg. However, many people have blood pressures in the prehypertensive range (ie, 120–139 mm Hg systolic; 80–89 mm Hg diastolic). Many people in this latter group can expect to develop hypertension in time, as the prevalence of hypertension increases steadily with age unless effective preventive measures are implemented, such as losing weight, exercising regularly, and avoiding excessive consumption of sodium and alcohol.
The best position to use is sitting, as the Framingham Heart Study and most randomized clinical trials that established the value of treating hypertension used this position for diagnosis and follow-up.6
Proper patient positioning, the correct cuff size, calibrated equipment, and good inflation and deflation technique will yield the best assessment of blood pressure levels. But even if your technique is perfect, blood pressure is a dynamic vital sign, so it is necessary to repeat the measurement, average the values for any particular day, and keep in mind that the pressure is higher (or lower) on some days than on others, so that the running average is more important than individual readings. This leads to two final points about blood pressure measurement:
- Take it right, at least two times on any occasion
- Take it on at least two (preferably three) separate days.
Following up on blood pressure
After measuring the blood pressure, it is necessary to plan for follow-up readings, guided by both the blood pressure levels (Table 2) and your clinical judgment.
If the systolic and diastolic blood pressures fall into different categories, you should follow the recommendations for the shorter follow-up time.
IS THE HYPERTENSION PRIMARY OR SECONDARY?
Most patients with hypertension have primary (“essential”) hypertension and are likely to remain hypertensive for life. However, some have secondary hypertension, ie, high blood pressure due to an identifiable cause. Some of these conditions (and the hypertension that they cause) can be cured. For example, pheochromocytoma can be cured if found and removed. Other causes of secondary hypertension, such as parenchymal renal disease, are infrequently cured, and the goal is usually to control the blood pressure with drugs.
The sudden onset of severe hypertension in a patient previously known to have had normal blood pressure raises the suspicion of a secondary form of hypertension, as does the onset of hypertension in a young person (< 25 years) or an older person (> 55 years). However, these ages are arbitrary; with the increasing body mass index in young people, essential hypertension is now more commonly diagnosed in the third decade. And since systolic pressure increases throughout life, we can expect many older patients to develop essential hypertension.7 Indeed, current guidelines are urging us to pay more attention to systolic pressure than in the past.
WHAT IS THE PATIENT’S CARDIOVASCULAR RISK?
The relationship between blood pressure and risk of cardiovascular disease is linear, continuous, and independent of (though additive to) other risk factors.1 For people 40 to 70 years old, each increment of either 20 mm Hg in systolic blood pressure or 10 mm Hg in diastolic blood pressure doubles the risk of cardiovascular disease across the entire range from 115/75 to 185/115 mm Hg.1 If the patient smokes or has elevated cholesterol, other cardiovascular risk factors, or the metabolic syndrome, the risk is even higher.8
The usual goal of antihypertensive treatment is systolic pressure less than 140 mm Hg and diastolic pressure less than 90 mm Hg. However, the target is lower—less than 130/80 mm Hg—for those with diabetes9 or target organ damage such as heart failure or renal disease.1,10 Thus, it is important to try to detect these conditions in the evaluation of the hypertensive patient.
Another reason it is important is that reducing such risk sometimes calls for using (or avoiding) antihypertensive drugs that are likely to alter these factors. For example, the use of beta-blockers in patients with a low level of high-density lipoprotein cholesterol (HDL-C) can lower HDL-C further.11
DOES THE PATIENT HAVE TARGET ORGAN DAMAGE?
Target organ damage is very important to detect because it changes the goal of treatment from primary prevention of adverse target organ outcomes into the more challenging realm of secondary prevention. For example, if a patient has had a stroke, his or her chance of having another stroke in the next 5 years is about 20%. This is much higher than the risk in an average hypertensive patient without such a history. For such patients, the current guidelines1 recommend the combination of a diuretic and an angiotensin-converting enzyme inhibitor, a combination shown to reduce the risk of a second stroke.12 Thus, we need to discover whether the patient had a stroke in the first place.
HISTORY
- The duration (if known) and severity of the hypertension
- The degree of blood pressure fluctuation
- Concomitant medical conditions, especially cardiovascular or renal problems
- Dietary habits
- Alcohol consumption
- Tobacco use
- Level of physical activity
- A family history of hypertension, renal disease, cardiovascular problems, or diabetes mellitus
- Past medications, with particular attention to their side effects and their efficacy in controlling blood pressure
- Current medications, including over-the-counter preparations. One reason: non-steroidal anti-inflammatory drugs other than aspirin can decrease the efficacy of antihypertensive drugs, presumably through mechanisms that inhibit the effects of vasodilatory and natriuretic prostaglandins and potentiate those of angiotensin II.13
PHYSICAL EXAMINATION
The physical examination starts with measurement of height, weight, waist circumference, and blood pressure—in both arms and the leg if coarctation of the aorta is suspected. Measurements with the patient supine, sitting, and standing are usually taken at the first visit, though such an approach is more suited to a hypertension specialty clinic than a primary care setting, in which time constraints usually limit the blood pressure readings to two or three seated values. Most prospective data on the benefits of hypertension treatment are based on a seated blood pressure, so we favor that measurement for follow-up.
Special attention in the physical examination is directed to:
The retina (to assess the vascular impact of the high blood pressure). Look for arteriolar narrowing (grade 1), arteriovenous compression (grade 2), hemorrhages or exudates (grade 3), and papilledema.2 Such findings not only relate to severity (higher grade = more severe blood pressure) but also predict future cardiovascular disease.14
The blood vessels. Bruits in the neck may indicate carotid stenosis, bruits in the abdomen may indicate renovascular disease, and femoral bruits are a sign of general atherosclerosis. Bruits also signal vascular stenosis and irregularity and may be a clue to vascular damage or future loss of target organ function. However, bruits may simply result from vascular tortuosity, particularly with significant flow in the vessel.
Also check the femoral pulses: poor or delayed femoral pulses are a sign of aortic coarctation. The radial artery is about as far away from the heart as the femoral artery; consequently, when palpating both sites simultaneously the pulse should arrive at about the same moment. In aortic coarctation, a palpable delay in the arrival of the femoral pulse may occur, and an interscapular murmur may be heard during auscultation of the back. In these instances, a low leg blood pressure (usually measured by placing a thigh-sized adult cuff on the patient’s thigh and listening over the popliteal area with the patient prone) may confirm the presence of aortic obstruction. When taking a leg blood pressure, the large cuff and the amount of pressure necessary to occlude the artery may be uncomfortable, and one should warn the patient about the discomfort before taking the measurement.
Poor or absent pedal pulses are a sign of peripheral arterial disease.
The heart (to detect gallops, enlargement, or both). Palpation may reveal a displaced apical impulse, which can indicate left ventricular enlargement. A sustained apical impulse may indicate left ventricular hypertrophy. Listen for a fourth heart sound (S4), one of the earliest physical findings of hypertension when physical findings are present. An S4 indicates that the left atrium is working hard to overcome the stiffness of the left ventricle. An S3 indicates an impairment in left ventricular function and is usually a harbinger of underlying heart disease. In some cases, lung rales can also be heard, though the combination of an S3 gallop and rales is an unusual office presentation in the early management of the hypertensive patient.
The lungs. Listen for rales (see above).
The lower extremities should be examined for peripheral arterial pulsations and edema. The loss of pedal pulses is a common finding, particularly in smokers, and is a clue to increased cardiovascular risk.
Strength, gait, and cognition. Perform a brief neurologic examination for evidence of remote stroke. We usually observe our patients’ gait as they enter or leave the examination room, test their bilateral grip strength, and assess their judgment, speech, and memory during the history and physical examination.
A great deal of research has linked high blood pressure to future loss of cognitive function,15 and it is useful to know that impairment is present before beginning treatment, since some patients will complain of memory loss after starting antihypertensive drug treatment.
LABORATORY EVALUATION
Routine tests
The routine evaluation of hypertensive patients should include, at a minimum:
- A hemoglobin or hematocrit measurement
- Urinalysis with microscopic examination
- Serum electrolyte concentrations

- Serum glucose concentration
- A fasting lipid profile
- A 12-lead electrocardiogram (Table 5).
Nonroutine tests
In some cases, other studies may be appropriate, depending on the clinical situation, eg:
- Serum uric acid in those with a history of gout, since some antihypertensive drugs (eg, diuretics) may increase serum uric acid and predispose to further episodes of gout
- Serum calcium in those with a personal or family history of kidney stones, to detect subtle parathyroid excess
- Thyroid-stimulating hormone or other thyroid studies if the history suggests thyroid excess, or if a thyroid nodule is discovered
- Limited echocardiography, which is more sensitive than electrocardiography for detecting left ventricular hypertrophy.
We sometimes use echocardiography if the patient is overweight but seems motivated to lose weight. In these cases we might not start drug therapy right away, choosing rather to wait and see if the patient can lose some weight (which might lower the blood pressure and make drug therapy unnecessary)—but only if the echocardiogram shows that he or she does not have left ventricular hypertrophy.
We also use echocardiography in patients with white-coat hypertension (see below), in whom office pressures are consistently high but whom we have elected to either not treat or not alter treatment. In these cases the echocardiogram serves as a “second opinion” about the merits of not altering therapy and supports this decision when the left ventricular wall thicknesses are normal (and remain so during long-term follow-up). In cases of suspected white-coat hypertension, home or ambulatory blood pressure monitoring is valuable to establish or exclude this diagnosis.1
Urinary albumin excretion. Microalbuminuria is an early manifestation of diabetic nephropathy and hypertension. Although routine urine screening for microalbuminuria is typically done in the management of diabetes, it is still not considered a standard of care, though the growing literature on its role as a cardiovascular risk predictor16–18 and its value as a therapeutic target in diabetes19,20 make it an attractive aid in the overall assessment of patients with hypertension.
Plasma renin activity and serum aldosterone concentrations are useful in screening for aldosterone excess, but are usually reserved as follow-up tests in patients with either hypokalemia or failure to achieve blood pressure control on a three-drug regimen in which at least one drug is a diuretic.1,21
Of note, primary aldosteronism is not as rare as previously thought. In a study of patients referred to hypertension centers, 11% had primary aldosteronism according to prospective diagnostic criteria, almost 5% had curable aldosterone-producing adenomas, and 6% had idiopathic hyperaldosteronism.22
If secondary hypertension is suspected
A search for secondary forms of hypertension is usually considered in patients with moderate or severe hypertension that does not respond to antihypertensive agents. Another situation is in hypertensive patients younger than 25 years, since curable forms of hypertension are more common in this age group. In older patients, the prevalence of secondary hypertension is lower and does not justify the costs and effort of routine elaborate workups unless there is evidence from the history, physical examination, or routine laboratory work for suspecting its presence. An exception to this rule is the need to exclude atherosclerotic renovascular hypertension in an elderly patient. This cause of secondary hypertension is common in the elderly and may be amenable to therapeutic intervention.26
WHEN TO CONSIDER HOME OR AMBULATORY MONITORING
Suspected white-coat hypertension
Blood pressure can be influenced by an environment such as an office or hospital clinic. This has led to the development of ambulatory blood pressure monitors and more use of self-measurement of blood pressure in the home. Blood pressure readings with these techniques are generally lower than those measured in an office or hospital clinic. These methods make it possible to screen for white-coat hypertension. In 10% to 20% of people with hypertensive readings, the blood pressure may be elevated persistently only in the presence of a physician.28 When measured elsewhere, including at work, the blood pressure is not elevated in those with the white-coat effect. Although this response may become less prominent with repeated measurements, it occasionally persists in the office setting, sometimes for years in our experience.
Suspected nocturnal hypertension (’nondipping’ status)
Ambulatory blood pressure is also helpful to screen for nocturnal hypertension. Evidence is accumulating to suggest that hypertensive patients whose pressure remains relatively high at night (“nondippers,” ie, those with less than a 10% reduction at night compared with daytime blood pressure readings) are at greater risk of cardiovascular morbidity than “dippers” (those whose blood pressure is at least 10% lower at night than during the day).29
An early morning surge
Ambulatory monitoring can also detect morning surges in systolic blood pressure,30 a marker of cerebrovascular risk. Generally, these patients have an increase of more than 55 mm Hg in systolic pressure between their sleeping and early-hour waking values, and we may wish to start or alter treatment specifically to address these high morning systolic values.31
‘PIPESTEM’ VESSELS AND PSEUDOHYPERTENSION
Occasionally, one encounters patients with vessels that are stiff and difficult to compress. If the pressure required to compress the brachial artery and stop audible blood flow with a standard blood pressure cuff is greater than the actual blood pressure within the artery as measured invasively, the condition is called pseudohypertension. The stiffness is thought to be due to calcification of the arterial wall.
A way to check for this condition is to inflate the cuff to at least 30 mm Hg above the palpable systolic pressure and then try to “roll” the brachial or radial artery underneath your fingertips, a procedure known as Osler’s maneuver.32 If you feel something that resembles a stiff tube reminiscent of the stem of a tobacco smoker’s pipe (healthy arteries are not palpable when empty), the patient may have pseudohypertension. However, the specificity of Osler’s maneuver has been questioned, particularly in hospitalized elderly patients.33
Pseudohypertension is important because the patients in whom it occurs, usually the elderly or the chronically ill (with diabetes or chronic kidney disease), are prone to orthostatic or postural hypotension, which may be aggravated by increasing their antihypertensive treatment on the basis of a cuff pressure that is actually much higher than the real blood pressure.33
- Chobanian AV, Bakris GL, Black HR, et al. Seventh report of the Joint National Committee on Prevention, Detection, Evaluation, and Treatment of High Blood Pressure. Hypertension 2003; 42:1206–1252.
- Wenger NK. Quality of life issues in hypertension: consequences of diagnosis and considerations in management. Am Heart J 1988; 116:628–632.
- McFadden CB, Townsend RR. Blood pressure measurement: common pitfalls and how to avoid them. Consultant 2003; 43:161–165.
- Pickering TG, Hall JE, Appel LJ, et al. Recommendations for blood pressure measurement in humans and experimental animals: part 1: blood pressure measurement in humans: a statement for professionals from the Subcommittee of Professional and Public Education of the American Heart Association Council on High Blood Pressure Research. Circulation 2005; 111:697–716.
- Myers MG. Automated blood pressure measurement in routine clinical practice. Blood Press Monit 2006; 11:59–62.
- Mosenkis A, Townsend RR. Sitting on the evidence: what is the proper patient position for the office measurement of blood pressure? J Clin Hypertens (Greenwich) 2005; 7:365–366.
- Vasan RS, Beiser A, Seshadri S, et al. Residual lifetime risk for developing hypertension in middle-aged women and men: The Framingham Heart Study. JAMA 2002; 287:1003–1010.
- Grundy SM, Cleeman JI, Merz CN, et al. Implications of recent clinical trials for the National Cholesterol Education Program Adult Treatment Panel III Guidelines. J Am Coll Cardiol 2004; 44:720–732.
- American Diabetes Association. Treatment of hypertension in adults with diabetes. Diabetes Care 2002; 25:199–201.
- Rosendorff C, Black HR, Cannon CP, et al. Treatment of hypertension in the prevention and management of ischemic heart disease: a scientific statement from the American Heart Association Council for High Blood Pressure Research and the Councils on Clinical Cardiology and Epidemiology and Prevention. Circulation 2007; 115:2761–2788.
- Papadakis JA, Mikhailidis DP, Vrentzos GE, Kalikaki A, Kazakou I, Ganotakis ES. Effect of antihypertensive treatment on plasma fibrinogen and serum HDL levels in patients with essential hypertension. Clin Appl Thromb Hemost 2005; 11:139–146.
- PROGRESS Collaborative Group. Randomised trial of a perindopril-based blood-pressure-lowering regimen among 6,105 individuals with previous stroke or transient ischaemic attack. Lancet 2001; 358:1033–1041.
- Fierro-Carrion GA, Ram CV. Nonsteroidal anti-inflammatory drugs (NSAIDs) and blood pressure. Am J Cardiol 1997; 80:775–776.
- Wong TY, McIntosh R. Hypertensive retinopathy signs as risk indicators of cardiovascular morbidity and mortality. Br Med Bull 2005; 73–74:57–70.
- Forette F, Boller F. Hypertension and the risk of dementia in the elderly. Am J Med 1991; 90:14S–19S.
- Schrader J, Luders S, Kulschewski A, et al. Microalbuminuria and tubular proteinuria as risk predictors of cardiovascular morbidity and mortality in essential hypertension: final results of a prospective long-term study (MARPLE Study). J Hypertens 2006; 24:541–548.
- Luque M, de Rivas B, Alvarez B, Garcia G, Fernandez C, Martell N. Influence of target organ lesion detection (assessment of microalbuminuria and echocardiogram) in cardiovascular risk stratification and treatment of untreated hypertensive patients. J Hum Hypertens 2006; 20:187–192.
- Pontremoli R, Leoncini G, Viazzi F, et al. Role of microalbuminuria in the assessment of cardiovascular risk in essential hypertension. J Am Soc Nephrol 2005; 16 suppl 1:S39–S41.
- Erdmann E. Microalbuminuria as a marker of cardiovascular risk in patients with type 2 diabetes. Int J Cardiol 2006; 107:147–153.
- Bakris GL, Sowers JR. Microalbuminuria in diabetes: focus on cardiovascular and renal risk reduction. Curr Diab Rep 2002; 2:258–262.
- Gallay BJ, Ahmad S, Xu L, Toivola B, Davidson RC. Screening for primary aldosteronism without discontinuing hypertensive medications: plasma aldosteronerenin ratio. Am J Kidney Dis 2001; 37:699–705.
- Rossi GP, Bernini G, Caliumi C, et al. A prospective study of the prevalence of primary aldosteronism in 1,125 hypertensive patients. J Am Coll Cardiol 2006; 48:2293–2300.
- Onusko E. Diagnosing secondary hypertension. Am Fam Physician 2003; 67:67–74.
- Aurell M. Screening for secondary hypertension. Curr Hypertens Rep 1999; 1:461.
- Garovic VD, Kane GC, Schwartz GL. Renovascular hypertension: balancing the controversies in diagnosis and treatment. Cleve Clin J Med 2005; 72:1135–1137.
- Textor SC. Renovascular hypertension in 2007: where are we now? Curr Cardiol Rep 2007; 9:453–461.
- Pickering TG, Shimbo D, Haas D. Ambulatory blood-pressure monitoring. N Engl J Med 2006; 354:2368–2374.
- Angeli F, Verdecchia P, Gattobigio R, Sardone M, Reboldi G. White-coat hypertension in adults. Blood Press Monit 2005; 10:301–305.
- Cicconetti P, Morelli S, De Serra C, et al. Left ventricular mass in dippers and nondippers with newly diagnosed hypertension. Angiology 2003; 54:661–669.
- Kario K, Pickering TG, Umeda Y, et al. Morning surge in blood pressure as a predictor of silent and clinical cerebrovascular disease in elderly hypertensives: a prospective study. Circulation 2003; 107:1401–1406.
- Katakam R, Townsend RR. Morning surges in blood pressure. J Clin Hypertens 2006; 8:450–451.
- Messerli FH. Osler’s maneuver, pseudohypertension, and true hypertension in the elderly. Am J Med 1986; 80:906–910.
- Belmin J, Visintin JM, Salvatore R, Sebban C, Moulias R. Osler’s maneuver: absence of usefulness for the detection of pseudohypertension in an elderly population. Am J Med 1995; 98:42–49.
- Messerli FH, Ventura HO, Amodeo C. Osler’s maneuver and pseudohypertension. N Engl J Med 1985; 312:1548–1551.
How extensive a workup does a patient with high blood pressure need?
On one hand, we would not want to start therapy on the basis of a single elevated reading, as blood pressure fluctuates considerably during the day, and even experienced physicians often make errors in taking blood pressure that tend to falsely elevate the patient’s readings. Similarly, we would not want to miss the diagnosis of a potentially curable cause of hypertension or of a condition that increases a patient’s risk of cardiovascular disease. But considering that nearly one-third of adults in the United States have hypertension and that another one-fourth have prehypertension (formerly called high-normal blood pressure),1 if we were to launch an intensive workup for every patient with high blood pressure, the cost and effort would be enormous.
Fortunately, for most patients, it is enough to measure blood pressure accurately and repeatedly, perform a focused history and physical examination, and obtain the results of a few basic laboratory tests and an electrocardiogram, with additional tests in special cases.
In this review we address four fundamental questions in the evaluation of patients with a high blood pressure reading, and how to answer them.
ANSWERING FOUR QUESTIONS
The goal of the hypertension evaluation is to answer four questions:
- Does the patient have sustained hypertension? And if so—
- Is the hypertension primary or secondary?
- Does the patient have other cardiovascular risk factors?
- Does he or she have evidence of target organ damage?
DOES THE PATIENT HAVE SUSTAINED HYPERTENSION?
It is important to measure blood pressure accurately, for several reasons. A diagnosis of hypertension has a measurable impact on the patient’s quality of life.2 Furthermore, we want to avoid undertaking a full evaluation of hypertension if the patient doesn’t actually have high blood pressure, ie, systolic blood pressure greater than 140 mm Hg or diastolic pressure greater than 90 mm Hg. However, many people have blood pressures in the prehypertensive range (ie, 120–139 mm Hg systolic; 80–89 mm Hg diastolic). Many people in this latter group can expect to develop hypertension in time, as the prevalence of hypertension increases steadily with age unless effective preventive measures are implemented, such as losing weight, exercising regularly, and avoiding excessive consumption of sodium and alcohol.
The best position to use is sitting, as the Framingham Heart Study and most randomized clinical trials that established the value of treating hypertension used this position for diagnosis and follow-up.6
Proper patient positioning, the correct cuff size, calibrated equipment, and good inflation and deflation technique will yield the best assessment of blood pressure levels. But even if your technique is perfect, blood pressure is a dynamic vital sign, so it is necessary to repeat the measurement, average the values for any particular day, and keep in mind that the pressure is higher (or lower) on some days than on others, so that the running average is more important than individual readings. This leads to two final points about blood pressure measurement:
- Take it right, at least two times on any occasion
- Take it on at least two (preferably three) separate days.
Following up on blood pressure
After measuring the blood pressure, it is necessary to plan for follow-up readings, guided by both the blood pressure levels (Table 2) and your clinical judgment.
If the systolic and diastolic blood pressures fall into different categories, you should follow the recommendations for the shorter follow-up time.
IS THE HYPERTENSION PRIMARY OR SECONDARY?
Most patients with hypertension have primary (“essential”) hypertension and are likely to remain hypertensive for life. However, some have secondary hypertension, ie, high blood pressure due to an identifiable cause. Some of these conditions (and the hypertension that they cause) can be cured. For example, pheochromocytoma can be cured if found and removed. Other causes of secondary hypertension, such as parenchymal renal disease, are infrequently cured, and the goal is usually to control the blood pressure with drugs.
The sudden onset of severe hypertension in a patient previously known to have had normal blood pressure raises the suspicion of a secondary form of hypertension, as does the onset of hypertension in a young person (< 25 years) or an older person (> 55 years). However, these ages are arbitrary; with the increasing body mass index in young people, essential hypertension is now more commonly diagnosed in the third decade. And since systolic pressure increases throughout life, we can expect many older patients to develop essential hypertension.7 Indeed, current guidelines are urging us to pay more attention to systolic pressure than in the past.
WHAT IS THE PATIENT’S CARDIOVASCULAR RISK?
The relationship between blood pressure and risk of cardiovascular disease is linear, continuous, and independent of (though additive to) other risk factors.1 For people 40 to 70 years old, each increment of either 20 mm Hg in systolic blood pressure or 10 mm Hg in diastolic blood pressure doubles the risk of cardiovascular disease across the entire range from 115/75 to 185/115 mm Hg.1 If the patient smokes or has elevated cholesterol, other cardiovascular risk factors, or the metabolic syndrome, the risk is even higher.8
The usual goal of antihypertensive treatment is systolic pressure less than 140 mm Hg and diastolic pressure less than 90 mm Hg. However, the target is lower—less than 130/80 mm Hg—for those with diabetes9 or target organ damage such as heart failure or renal disease.1,10 Thus, it is important to try to detect these conditions in the evaluation of the hypertensive patient.
Another reason it is important is that reducing such risk sometimes calls for using (or avoiding) antihypertensive drugs that are likely to alter these factors. For example, the use of beta-blockers in patients with a low level of high-density lipoprotein cholesterol (HDL-C) can lower HDL-C further.11
DOES THE PATIENT HAVE TARGET ORGAN DAMAGE?
Target organ damage is very important to detect because it changes the goal of treatment from primary prevention of adverse target organ outcomes into the more challenging realm of secondary prevention. For example, if a patient has had a stroke, his or her chance of having another stroke in the next 5 years is about 20%. This is much higher than the risk in an average hypertensive patient without such a history. For such patients, the current guidelines1 recommend the combination of a diuretic and an angiotensin-converting enzyme inhibitor, a combination shown to reduce the risk of a second stroke.12 Thus, we need to discover whether the patient had a stroke in the first place.
HISTORY
- The duration (if known) and severity of the hypertension
- The degree of blood pressure fluctuation
- Concomitant medical conditions, especially cardiovascular or renal problems
- Dietary habits
- Alcohol consumption
- Tobacco use
- Level of physical activity
- A family history of hypertension, renal disease, cardiovascular problems, or diabetes mellitus
- Past medications, with particular attention to their side effects and their efficacy in controlling blood pressure
- Current medications, including over-the-counter preparations. One reason: non-steroidal anti-inflammatory drugs other than aspirin can decrease the efficacy of antihypertensive drugs, presumably through mechanisms that inhibit the effects of vasodilatory and natriuretic prostaglandins and potentiate those of angiotensin II.13
PHYSICAL EXAMINATION
The physical examination starts with measurement of height, weight, waist circumference, and blood pressure—in both arms and the leg if coarctation of the aorta is suspected. Measurements with the patient supine, sitting, and standing are usually taken at the first visit, though such an approach is more suited to a hypertension specialty clinic than a primary care setting, in which time constraints usually limit the blood pressure readings to two or three seated values. Most prospective data on the benefits of hypertension treatment are based on a seated blood pressure, so we favor that measurement for follow-up.
Special attention in the physical examination is directed to:
The retina (to assess the vascular impact of the high blood pressure). Look for arteriolar narrowing (grade 1), arteriovenous compression (grade 2), hemorrhages or exudates (grade 3), and papilledema.2 Such findings not only relate to severity (higher grade = more severe blood pressure) but also predict future cardiovascular disease.14
The blood vessels. Bruits in the neck may indicate carotid stenosis, bruits in the abdomen may indicate renovascular disease, and femoral bruits are a sign of general atherosclerosis. Bruits also signal vascular stenosis and irregularity and may be a clue to vascular damage or future loss of target organ function. However, bruits may simply result from vascular tortuosity, particularly with significant flow in the vessel.
Also check the femoral pulses: poor or delayed femoral pulses are a sign of aortic coarctation. The radial artery is about as far away from the heart as the femoral artery; consequently, when palpating both sites simultaneously the pulse should arrive at about the same moment. In aortic coarctation, a palpable delay in the arrival of the femoral pulse may occur, and an interscapular murmur may be heard during auscultation of the back. In these instances, a low leg blood pressure (usually measured by placing a thigh-sized adult cuff on the patient’s thigh and listening over the popliteal area with the patient prone) may confirm the presence of aortic obstruction. When taking a leg blood pressure, the large cuff and the amount of pressure necessary to occlude the artery may be uncomfortable, and one should warn the patient about the discomfort before taking the measurement.
Poor or absent pedal pulses are a sign of peripheral arterial disease.
The heart (to detect gallops, enlargement, or both). Palpation may reveal a displaced apical impulse, which can indicate left ventricular enlargement. A sustained apical impulse may indicate left ventricular hypertrophy. Listen for a fourth heart sound (S4), one of the earliest physical findings of hypertension when physical findings are present. An S4 indicates that the left atrium is working hard to overcome the stiffness of the left ventricle. An S3 indicates an impairment in left ventricular function and is usually a harbinger of underlying heart disease. In some cases, lung rales can also be heard, though the combination of an S3 gallop and rales is an unusual office presentation in the early management of the hypertensive patient.
The lungs. Listen for rales (see above).
The lower extremities should be examined for peripheral arterial pulsations and edema. The loss of pedal pulses is a common finding, particularly in smokers, and is a clue to increased cardiovascular risk.
Strength, gait, and cognition. Perform a brief neurologic examination for evidence of remote stroke. We usually observe our patients’ gait as they enter or leave the examination room, test their bilateral grip strength, and assess their judgment, speech, and memory during the history and physical examination.
A great deal of research has linked high blood pressure to future loss of cognitive function,15 and it is useful to know that impairment is present before beginning treatment, since some patients will complain of memory loss after starting antihypertensive drug treatment.
LABORATORY EVALUATION
Routine tests
The routine evaluation of hypertensive patients should include, at a minimum:
- A hemoglobin or hematocrit measurement
- Urinalysis with microscopic examination
- Serum electrolyte concentrations
- Serum glucose concentration
- A fasting lipid profile
- A 12-lead electrocardiogram (Table 5).
Nonroutine tests
In some cases, other studies may be appropriate, depending on the clinical situation, eg:
- Serum uric acid in those with a history of gout, since some antihypertensive drugs (eg, diuretics) may increase serum uric acid and predispose to further episodes of gout
- Serum calcium in those with a personal or family history of kidney stones, to detect subtle parathyroid excess
- Thyroid-stimulating hormone or other thyroid studies if the history suggests thyroid excess, or if a thyroid nodule is discovered
- Limited echocardiography, which is more sensitive than electrocardiography for detecting left ventricular hypertrophy.
We sometimes use echocardiography if the patient is overweight but seems motivated to lose weight. In these cases we might not start drug therapy right away, choosing rather to wait and see if the patient can lose some weight (which might lower the blood pressure and make drug therapy unnecessary)—but only if the echocardiogram shows that he or she does not have left ventricular hypertrophy.
We also use echocardiography in patients with white-coat hypertension (see below), in whom office pressures are consistently high but whom we have elected to either not treat or not alter treatment. In these cases the echocardiogram serves as a “second opinion” about the merits of not altering therapy and supports this decision when the left ventricular wall thicknesses are normal (and remain so during long-term follow-up). In cases of suspected white-coat hypertension, home or ambulatory blood pressure monitoring is valuable to establish or exclude this diagnosis.1
Urinary albumin excretion. Microalbuminuria is an early manifestation of diabetic nephropathy and hypertension. Although routine urine screening for microalbuminuria is typically done in the management of diabetes, it is still not considered a standard of care, though the growing literature on its role as a cardiovascular risk predictor16–18 and its value as a therapeutic target in diabetes19,20 make it an attractive aid in the overall assessment of patients with hypertension.
Plasma renin activity and serum aldosterone concentrations are useful in screening for aldosterone excess, but are usually reserved as follow-up tests in patients with either hypokalemia or failure to achieve blood pressure control on a three-drug regimen in which at least one drug is a diuretic.1,21
Of note, primary aldosteronism is not as rare as previously thought. In a study of patients referred to hypertension centers, 11% had primary aldosteronism according to prospective diagnostic criteria, almost 5% had curable aldosterone-producing adenomas, and 6% had idiopathic hyperaldosteronism.22
If secondary hypertension is suspected
A search for secondary forms of hypertension is usually considered in patients with moderate or severe hypertension that does not respond to antihypertensive agents. Another situation is in hypertensive patients younger than 25 years, since curable forms of hypertension are more common in this age group. In older patients, the prevalence of secondary hypertension is lower and does not justify the costs and effort of routine elaborate workups unless there is evidence from the history, physical examination, or routine laboratory work for suspecting its presence. An exception to this rule is the need to exclude atherosclerotic renovascular hypertension in an elderly patient. This cause of secondary hypertension is common in the elderly and may be amenable to therapeutic intervention.26
WHEN TO CONSIDER HOME OR AMBULATORY MONITORING
Suspected white-coat hypertension
Blood pressure can be influenced by an environment such as an office or hospital clinic. This has led to the development of ambulatory blood pressure monitors and more use of self-measurement of blood pressure in the home. Blood pressure readings with these techniques are generally lower than those measured in an office or hospital clinic. These methods make it possible to screen for white-coat hypertension. In 10% to 20% of people with hypertensive readings, the blood pressure may be elevated persistently only in the presence of a physician.28 When measured elsewhere, including at work, the blood pressure is not elevated in those with the white-coat effect. Although this response may become less prominent with repeated measurements, it occasionally persists in the office setting, sometimes for years in our experience.
Suspected nocturnal hypertension (’nondipping’ status)
Ambulatory blood pressure is also helpful to screen for nocturnal hypertension. Evidence is accumulating to suggest that hypertensive patients whose pressure remains relatively high at night (“nondippers,” ie, those with less than a 10% reduction at night compared with daytime blood pressure readings) are at greater risk of cardiovascular morbidity than “dippers” (those whose blood pressure is at least 10% lower at night than during the day).29
An early morning surge
Ambulatory monitoring can also detect morning surges in systolic blood pressure,30 a marker of cerebrovascular risk. Generally, these patients have an increase of more than 55 mm Hg in systolic pressure between their sleeping and early-hour waking values, and we may wish to start or alter treatment specifically to address these high morning systolic values.31
‘PIPESTEM’ VESSELS AND PSEUDOHYPERTENSION
Occasionally, one encounters patients with vessels that are stiff and difficult to compress. If the pressure required to compress the brachial artery and stop audible blood flow with a standard blood pressure cuff is greater than the actual blood pressure within the artery as measured invasively, the condition is called pseudohypertension. The stiffness is thought to be due to calcification of the arterial wall.
A way to check for this condition is to inflate the cuff to at least 30 mm Hg above the palpable systolic pressure and then try to “roll” the brachial or radial artery underneath your fingertips, a procedure known as Osler’s maneuver.32 If you feel something that resembles a stiff tube reminiscent of the stem of a tobacco smoker’s pipe (healthy arteries are not palpable when empty), the patient may have pseudohypertension. However, the specificity of Osler’s maneuver has been questioned, particularly in hospitalized elderly patients.33
Pseudohypertension is important because the patients in whom it occurs, usually the elderly or the chronically ill (with diabetes or chronic kidney disease), are prone to orthostatic or postural hypotension, which may be aggravated by increasing their antihypertensive treatment on the basis of a cuff pressure that is actually much higher than the real blood pressure.33
- Chobanian AV, Bakris GL, Black HR, et al. Seventh report of the Joint National Committee on Prevention, Detection, Evaluation, and Treatment of High Blood Pressure. Hypertension 2003; 42:1206–1252.
- Wenger NK. Quality of life issues in hypertension: consequences of diagnosis and considerations in management. Am Heart J 1988; 116:628–632.
- McFadden CB, Townsend RR. Blood pressure measurement: common pitfalls and how to avoid them. Consultant 2003; 43:161–165.
- Pickering TG, Hall JE, Appel LJ, et al. Recommendations for blood pressure measurement in humans and experimental animals: part 1: blood pressure measurement in humans: a statement for professionals from the Subcommittee of Professional and Public Education of the American Heart Association Council on High Blood Pressure Research. Circulation 2005; 111:697–716.
- Myers MG. Automated blood pressure measurement in routine clinical practice. Blood Press Monit 2006; 11:59–62.
- Mosenkis A, Townsend RR. Sitting on the evidence: what is the proper patient position for the office measurement of blood pressure? J Clin Hypertens (Greenwich) 2005; 7:365–366.
- Vasan RS, Beiser A, Seshadri S, et al. Residual lifetime risk for developing hypertension in middle-aged women and men: The Framingham Heart Study. JAMA 2002; 287:1003–1010.
- Grundy SM, Cleeman JI, Merz CN, et al. Implications of recent clinical trials for the National Cholesterol Education Program Adult Treatment Panel III Guidelines. J Am Coll Cardiol 2004; 44:720–732.
- American Diabetes Association. Treatment of hypertension in adults with diabetes. Diabetes Care 2002; 25:199–201.
- Rosendorff C, Black HR, Cannon CP, et al. Treatment of hypertension in the prevention and management of ischemic heart disease: a scientific statement from the American Heart Association Council for High Blood Pressure Research and the Councils on Clinical Cardiology and Epidemiology and Prevention. Circulation 2007; 115:2761–2788.
- Papadakis JA, Mikhailidis DP, Vrentzos GE, Kalikaki A, Kazakou I, Ganotakis ES. Effect of antihypertensive treatment on plasma fibrinogen and serum HDL levels in patients with essential hypertension. Clin Appl Thromb Hemost 2005; 11:139–146.
- PROGRESS Collaborative Group. Randomised trial of a perindopril-based blood-pressure-lowering regimen among 6,105 individuals with previous stroke or transient ischaemic attack. Lancet 2001; 358:1033–1041.
- Fierro-Carrion GA, Ram CV. Nonsteroidal anti-inflammatory drugs (NSAIDs) and blood pressure. Am J Cardiol 1997; 80:775–776.
- Wong TY, McIntosh R. Hypertensive retinopathy signs as risk indicators of cardiovascular morbidity and mortality. Br Med Bull 2005; 73–74:57–70.
- Forette F, Boller F. Hypertension and the risk of dementia in the elderly. Am J Med 1991; 90:14S–19S.
- Schrader J, Luders S, Kulschewski A, et al. Microalbuminuria and tubular proteinuria as risk predictors of cardiovascular morbidity and mortality in essential hypertension: final results of a prospective long-term study (MARPLE Study). J Hypertens 2006; 24:541–548.
- Luque M, de Rivas B, Alvarez B, Garcia G, Fernandez C, Martell N. Influence of target organ lesion detection (assessment of microalbuminuria and echocardiogram) in cardiovascular risk stratification and treatment of untreated hypertensive patients. J Hum Hypertens 2006; 20:187–192.
- Pontremoli R, Leoncini G, Viazzi F, et al. Role of microalbuminuria in the assessment of cardiovascular risk in essential hypertension. J Am Soc Nephrol 2005; 16 suppl 1:S39–S41.
- Erdmann E. Microalbuminuria as a marker of cardiovascular risk in patients with type 2 diabetes. Int J Cardiol 2006; 107:147–153.
- Bakris GL, Sowers JR. Microalbuminuria in diabetes: focus on cardiovascular and renal risk reduction. Curr Diab Rep 2002; 2:258–262.
- Gallay BJ, Ahmad S, Xu L, Toivola B, Davidson RC. Screening for primary aldosteronism without discontinuing hypertensive medications: plasma aldosteronerenin ratio. Am J Kidney Dis 2001; 37:699–705.
- Rossi GP, Bernini G, Caliumi C, et al. A prospective study of the prevalence of primary aldosteronism in 1,125 hypertensive patients. J Am Coll Cardiol 2006; 48:2293–2300.
- Onusko E. Diagnosing secondary hypertension. Am Fam Physician 2003; 67:67–74.
- Aurell M. Screening for secondary hypertension. Curr Hypertens Rep 1999; 1:461.
- Garovic VD, Kane GC, Schwartz GL. Renovascular hypertension: balancing the controversies in diagnosis and treatment. Cleve Clin J Med 2005; 72:1135–1137.
- Textor SC. Renovascular hypertension in 2007: where are we now? Curr Cardiol Rep 2007; 9:453–461.
- Pickering TG, Shimbo D, Haas D. Ambulatory blood-pressure monitoring. N Engl J Med 2006; 354:2368–2374.
- Angeli F, Verdecchia P, Gattobigio R, Sardone M, Reboldi G. White-coat hypertension in adults. Blood Press Monit 2005; 10:301–305.
- Cicconetti P, Morelli S, De Serra C, et al. Left ventricular mass in dippers and nondippers with newly diagnosed hypertension. Angiology 2003; 54:661–669.
- Kario K, Pickering TG, Umeda Y, et al. Morning surge in blood pressure as a predictor of silent and clinical cerebrovascular disease in elderly hypertensives: a prospective study. Circulation 2003; 107:1401–1406.
- Katakam R, Townsend RR. Morning surges in blood pressure. J Clin Hypertens 2006; 8:450–451.
- Messerli FH. Osler’s maneuver, pseudohypertension, and true hypertension in the elderly. Am J Med 1986; 80:906–910.
- Belmin J, Visintin JM, Salvatore R, Sebban C, Moulias R. Osler’s maneuver: absence of usefulness for the detection of pseudohypertension in an elderly population. Am J Med 1995; 98:42–49.
- Messerli FH, Ventura HO, Amodeo C. Osler’s maneuver and pseudohypertension. N Engl J Med 1985; 312:1548–1551.
KEY POINTS
- To confirm the diagnosis of hypertension, multiple readings should be taken at various times.
- Proper technique is important in measuring blood pressure, including using the correct cuff size, having the patient sit quietly for 5 minutes before taking the pressure, and supporting the arm at the level of the heart.
- If white-coat hypertension is suspected, one can consider ambulatory or home blood pressure measurements to confirm that the hypertension is sustained.
Perioperative statins: More than lipid-lowering?
Soon, the checklist for internists seeing patients about to undergo surgery may include prescribing one of the lipid-lowering hydroxymethylglutaryl-CoA reductase inhibitors, also called statins.
Statins? Not long ago, we were debating whether patients who take statins should stop taking them before surgery, based on the manufacturers’ recommendations.1 The discussion, however, has changed to whether patients who have never received a statin should be started on one before surgery to provide immediate prophylaxis against cardiac morbidity, and how much harm long-term statin users face if these drugs are withheld perioperatively.
The evidence is still very preliminary and based mostly on studies in animals and retrospective studies in people. However, an expanding body of indirect evidence suggests that these drugs are beneficial in this situation.
In this review, we discuss the mechanisms by which statins may protect the heart in the short term, drawing on data from animal and human studies of acute myocardial infarction, and we review the current (albeit limited) data from the perioperative setting.
FEW INTERVENTIONS DECREASE RISK
Each year, approximately 50,000 patients suffer a perioperative cardiovascular event; the incidence of myocardial infarction during or after noncardiac surgery is 2% to 3%.2 The primary goal of preoperative cardiovascular risk assessment is to predict and avert these events.
But short of canceling surgery, few interventions have been found to reduce a patient’s risk. For example, a landmark study in 2004 cast doubt on the efficacy of preoperative coronary revascularization.3 Similarly, although early studies of beta-blockers were promising4,5 and although most internists prescribe these drugs before surgery, more recent studies have cast doubt on their efficacy, particularly in patients at low risk undergoing intermediate-risk (rather than vascular) surgery.6–8
This changing clinical landscape has prompted a search for new strategies for perioperative risk-reduction. Several recent studies have placed statins in the spotlight.
POTENTIAL MECHANISMS OF SHORT-TERM BENEFIT
Statins have been proven to save lives when used long-term, but how could this class of drugs, designed to prevent the accumulation of arterial plaques by lowering low-density lipoprotein cholesterol (LDL-C) levels, have any short-term impact on operative outcomes? Although LDL-C reduction is the principal mechanism of action of statins, not all of the benefit can be ascribed to this mechanism.9 The answer may lie in their “pleiotropic” effects—ie, actions other than LDL-C reduction.
The more immediate pleiotropic effects of statins in the proinflammatory and prothrombotic environment of the perioperative period are thought to include improved endothelial function (both antithrombotic function and vasomotor function in response to ischemic stress), enhanced stability of atherosclerotic plaques, decreased oxidative stress, and decreased vascular inflammation.10–12
EVIDENCE FROM ANIMAL STUDIES
Experiments in animals suggest that statins, given shortly before or after a cardiovascular event, confer benefit before any changes in LDL-C are measurable.
Lefer et al13 found that simvastatin (Zocor), given 18 hours before an ischemic episode in rats, blunted the inflammatory response in cardiac reperfusion injury. Not only was reperfusion injury significantly less in the hearts of the rats that received simvastatin than in the saline control group, but the simvastatin-treated hearts also expressed fewer neutrophil adhesion molecules such as P-selectin, and they had more basal release of nitric oxide, the potent endothelial-derived vasodilator with antithrombotic, anti-inflammatory, and antiproliferative effects.14 These results suggest that statins may improve endothelial function acutely, particularly during ischemic stress.
Osborne et al15 fed rabbits a cholesterol-rich diet plus either lovastatin (Mevacor) or placebo. After 2 weeks, the rabbits underwent either surgery to induce a myocardial infarction or a sham procedure. Regardless of the pretreatment, biopsies of the aorta did not reveal any atherosclerosis; yet the lovastatin-treated rabbits sustained less myocardial ischemic damage and they had more endothelium-mediated vasodilatation.
Statin therapy also may improve cerebral ischemia outcomes in animal models.14,16
Sironi et al16 induced strokes in rats by occluding the middle cerebral artery. The rats received either simvastatin or vehicle for 3 days before the stroke or immediately afterwards. Even though simvastatin did not have enough time to affect the total cholesterol level, rats treated with simvastatin had smaller infarcts (as measured by magnetic resonance imaging) and produced more nitric oxide.
Comment. Taken together, these studies offer tantalizing evidence that statins have short-term, beneficial nonlipid effects and may reduce not only the likelihood of an ischemic event, but—should one occur—the degree of tissue damage that ensues.
EFFECTS OF STATINS IN ACUTE CORONARY SYNDROME
The National Registry of Myocardial Infarction17 is a prospective, observational database of all patients with acute myocardial infarction admitted to 1,230 participating hospitals throughout the United States. In an analysis from this cohort, patients were divided into four groups: those receiving statins before and after admission, those receiving statins only before admission, those receiving statins only after admission, and those who never received statins.
Compared with those who never received statins, fewer patients who received them both before and after admission died while in the hospital (unadjusted odds ratio 0.23, 95% confidence interval [CI] 0.22–0.25), and the odds ratio for those who received statins for the first time was 0.31 (95% CI 0.29–0.33). Patients who stopped receiving a statin on admission were more likely to die than were patients who never received statins (odds ratio 1.09, 95% CI 1.03–1.15). These trends held true even when adjustments were made for potential confounding factors.
Comment. Unmeasured confounding factors (such as the inability to take pills due to altered mental status or the different practice styles of the providers who chose to discontinue statins) might have affected the results. Nevertheless, these results suggest that the protective effects of statins stop almost immediately when these drugs are discontinued, and that there may even be an adverse “rebound” effect when patients who have been taking these drugs for a long time stop taking them temporarily.
The Platelet Receptor Inhibition in Ischemic Syndrome Management trial,18 in a subgroup analysis, had nearly identical findings. In the main part of this trial, patients with coronary artery disease and chest pain at rest or accelerating pain in the last 24 hours were randomized to receive tirofiban (Aggrastat) or heparin. Complete data on statin use were available for 1,616 (50%) of the 3,232 patients in this trial, and the rate of the primary end point (death, myocardial infarction, or recurrent ischemia) was analyzed on the basis of statin therapy in this subgroup.
Comment. Together, these data lead to the conclusion that, when admitted for either acute myocardial infarction or acute coronary syndrome, patients already receiving statins should not have them stopped, and those who had not been receiving statins should receive them immediately. The safety of these medications in the acute setting appears excellent: in the Myocardial Ischemia Reduction With Acute Cholesterol Lowering (MIRACL)12 and the Pravastatin or Atorvastatin Evaluation and Infection Therapy (PROVE-IT)11 trials, fewer than 5% of statin-treated patients had transient elevations in transaminase levels, and no cases of rhabdomyolysis were reported.
PERIOPERATIVE STATIN STUDIES
The data on perioperative statin use are mostly observational and retrospective and fall into essentially four surgical categories: coronary artery bypass grafting (CABG), carotid endarterectomy,19,20 noncardiac vascular surgery, and major noncardiac surgery. Two meta-analyses have also evaluated the data.21,22 The only randomized controlled trial (performed by Durazzo et al23) was small and was carried out at a single center in vascular surgery patients, and the event rate was low.
Current recommendations from the National Cholesterol Education Program (NCEP)24 say that patients who need CABG, have peripheral arterial disease, have an abdominal aortic aneurysm, or have cerebrovascular disease should already be on a statin to achieve an LDL-C goal level of less than 100 mg/dL, with an optional goal of less than 70 mg/dL, independent of surgery.
Since not all patients who should be on statins are actually on them, questions arise:
- Is it important (and safe) to start statin treatment preoperatively?
- Will patients with cardiovascular risk factors but without known cardiovascular disease benefit from statins perioperatively?
Noncardiac vascular surgery
Multiple retrospective studies have evaluated the effect of statins in patients undergoing major noncardiac vascular surgery.25–32
Kertai et al25 evaluated 570 patients in Holland who underwent elective open surgery for infrarenal abdominal aortic aneurysms between 1991 and 2001, looking for an association between statin use and the incidence of perioperative death from myocardial infarction. Only 162 of the 570 patients had been on long-term statin therapy before the surgery. The use of statins was only one of many known baseline characteristics that were significantly different between the two groups, including age, body mass index, known coronary artery disease, and use of angiotensin-converting enzyme inhibitors and beta-blockers. In univariate analysis, statins appeared to be protective: 6 (3.7%) of the patients in the statin group died of a myocardial infarction, compared with 45 (11%) of those in the nostatin group. A multivariate analysis yielded similar findings, with an odds ratio of 0.24 (95% CI 0.11–0.54).
Ward et al27 performed a very similar retrospective study, with similar findings. In 446 patients who underwent surgery for infrarenal abdominal aortic aneurysm, statin therapy was associated with a significantly lower incidence of the combined end point of death, myocardial infarction, stroke, and major peripheral vascular complications, with an adjusted odds ratio of 0.36 (95% CI 0.14–0.93).
Poldermans et al26 noted similar findings in a case-control study of noncardiac vascular surgery patients. Statin users had a much lower perioperative risk of death than did nonusers, with an adjusted odds ratio of 0.22 (95% CI 0.10–0.47).
O’Neil-Callahan et al,28 in a cohort study, found that statin users had fewer perioperative cardiac complications, with an adjusted odds ratio of 0.49 (95% CI 0.28–0.84, P = .009).
Dogma of withdrawing statins before major surgery is challenged
Le Manach et al33 reviewed the outcomes for all patients of a single hospital in Paris who underwent nonemergency infrarenal aortic procedures between January 2001 and December 2004. In January 2004, the hospital instituted guidelines to ensure that patients on statins continue taking them up to the evening before surgery and that statins be restarted on the first postoperative day (via nasogastric tube if necessary). Before 2004, there had been no specific guidelines, and patients on statins did not receive them for a median of 4 days postoperatively. Types of procedures were similar during the two time periods, as were the rates of beta-blocker use, preoperative revascularization, venous thromboembolism prophylaxis, and perioperative blood pressure control. After surgery, topononin I levels were measured in all patients as surveillance for cardiac events, and were defined as elevated when greater than 0.2 ng/mL.
Compared with patients not on statins at all, those treated with statins continuously throughout the perioperative period (after January 2004) had a lower rate of elevated troponin (relative risk 0.38). In contrast, those who had their statins transiently discontinued perioperatively (prior to 2004) had troponin elevations more often than those who had never been treated (relative risk 2.1). This suggested an over fivefold risk reduction (P < .001) conferred by not discontinuing statins in the immediate postoperative period. This finding was maintained after multivariate adjustment: statin withdrawal was associated with a 2.9-fold (95% CI 1.6–5.5) increase in the risk of cardiac enzyme elevations postoperatively. No fewer deaths were noted, but the study was not powered to detect a mortality difference.
Comment. Although secular trends cannot be entirely discounted as contributing to these findings, the prompt increase in cardiac events after just 4 days of statin withdrawal adds to the growing body of evidence suggesting that statin discontinuation can have harmful acute effects. It also brings up the question: Can starting statins benefit patients in the same time period?
Should statins be started before vascular surgery?
Schouten et al32 evaluated the effects of newly started or continued statin treatment in patients undergoing major elective vascular surgery. Patients were screened before surgery and started on statins if they were not already receiving them and their total cholesterol levels were elevated; new users received the medication for about 40 days before surgery. Of the 981 screened patients, 44 (5%) were newly started on statins and 182 (19%) were continued on their therapy. Perioperative death or myocardial infarction occurred in 22 (8.8%) of the statin users and 111 (14.7%) of the nonusers, a statistically significant difference. Temporary discontinuation (median 1 day) of statins in this study due to the inability to take an oral medication did not appear to affect the likelihood of a myocardial infarction.
Durazzo et al23 performed a single-center, randomized, prospective, placebo-controlled, double-blind clinical trial of atorvastatin (Lipitor) 20 mg daily vs placebo in 100 patients undergoing noncardiac arterial vascular surgery. Patients were excluded if they had previously used medications to treat dyslipidemia, recently had a cardiovascular event, or had contraindications to statin treatment such as a baseline creatinine level greater than 2.0 mg/dL or severe hepatic disease. The intervention group received atorvastatin starting at least 2 weeks before surgery for a total of 45 days. Patients were then continued or started on a statin after surgery if their LDL-C level was greater than 100 mg/dL. Beta-blocker use was recommended “on the basis of current guidelines.”
One month after surgery, the LDL-C level was statistically significantly lower in the atorvastatin group. Since most patients did not continue or start statin therapy after the 45-day treatment period, the LDL-C levels were not statistically different at 3 and 6 months after surgery.
At 6 months, the rate of the primary end point (death from cardiovascular causes, nonfatal acute myocardial infarction, ischemic stroke, or unstable angina) was 26.0% in the placebo group and 8.0% in the atorvastatin group, a statistically significant difference. Three patients in the atorvastatin group had cardiac events in the first 10 days after surgery, compared with 11 patients in the placebo group. Thirteen of the 17 total cardiac events took place within 10 days after surgery.
One of the atorvastatin patients developed rhabdomyolysis and elevated aminotransferase levels.
Major noncardiac surgery
Lindenauer et al2 performed a retrospective cohort study of surgical patients who were at least 18 years old and survived beyond the second hospital day. Patients were divided into a group receiving any form of lipid-lowering treatment (of whom more than 90% were taking statins) and a group that had never never received a lipid-lowering drug or only started one on the third day of the hospitalization or later. The period of study was from January 1, 2000, to December 31, 2001.
In all, 780,591 patients from 329 hospitals throughout the United States were included, of whom only 77,082 (9.9%) received lipid-lowering therapy. Eight percent of the patients underwent vascular surgery. Not surprisingly, the treated patients were more likely to have a history of hypertension, diabetes, ischemic heart disease, or hyperlipidemia. They also were more likely to have a vascular procedure performed, to have two or more cardiac risk factors (high-risk surgery, ischemic heart disease, congestive heart failure, cerebrovascular disease, renal insufficiency, or diabetes mellitus), and to be treated with beta-blockers and angiotensin-converting enzyme inhibitors, but they were less likely to have high-risk and emergency surgery performed.
The primary end point, perioperative death, occurred in 2.13% of the treated patients and 3.05% of the nontreated group. Compared with the rate in a propensity-matched cohort, the odds ratio adjusted for unbalanced covariates was 0.62 (95% CI 0.58–0.67) in favor of lipid treatment. Stratification by cardiac risk index revealed a number needed to treat of 186 for those with no risk factors, 60 for those with two risk factors, and 30 for those with four or more risk factors.
Unfortunately, this analysis was not able to take into account whether and for how long patients were receiving lipid-lowering therapy before hospitalization. It therefore does not answer the questions of whether starting lipid-lowering therapy before surgery is beneficial or whether stopping it is harmful. It also does not shed light on whether perioperative lipid-lowering increases the risk of rhabdomyolysis or liver disease.
Carotid endarterectomy
Two recent retrospective cohort studies evaluated the outcomes in patients undergoing carotid endarterectomy.19,20
Kennedy et al19 found that patients on a statin at the time of admission who had symptomatic carotid disease had lower rates of inhospital death (adjusted odds ratio 0.24, 95% CI 0.06–0.91) and ischemic stroke or death (adjusted odds ratio 0.55, 95% CI 0.31–0.97). However, cardiac outcomes among these symptomatic patients were not significantly improved (odds ratio 0.82, 95% CI 0.45–1.50), nor was there benefit for asymptomatic patients, raising the possibility that the positive findings were due to chance or that patients at lower baseline risk for vascular events may have less benefit.
McGirt et al20 performed a similar study; they did not, however, distinguish whether patients had symptomatic vs asymptomatic carotid disease. The 30-day risk of perioperative stroke was lower in patients treated with a statin, with an odds ratio of 0.41 (95% CI 0.18–0.93); the odds ratio for death was 0.21 (95% CI 0.05–0.96). Cardiac outcomes were not significantly affected.
Coronary artery bypass graft surgery
According to the NCEP recommendations, nearly all patients undergoing CABG should already be on a statin before surgery since they all have known coronary artery disease. Multiple observational studies have offered confirmatory evidence that statins are beneficial in this setting.34–38
Liakopoulos et al39 evaluated whether the anti-inflammatory effects of statins may, in part, account for their beneficial effect in the perioperative period. The authors prospectively matched 18 patients who were taking statins and were referred for elective CABG with 18 patients who were not prescribed statins previously. The only major measured baseline characteristic that differed between the two groups was a statistically significantly lower LDL-C level in the statin group. The operative characteristics did not differ, and cytokine levels at baseline were similar.
Tumor necrosis factor alpha levels increased significantly in the control group but did not change significantly in the statin group. Interleukin 8 increased in both groups by a similar amount. Interleukin 6 (the major inducer of C-reactive protein) increased from baseline in both groups but did not increase nearly as much in the statin group as in the control group; the intergroup difference was statistically significant. The anti-inflammatory cytokine interleukin 10 increased minimally from baseline in the control group, while the statin group’s levels increased significantly above baseline and those of the control group.
Christenson40 also found that inflammatory markers were improved with pre-CABG statin treatment in a small randomized trial in which patients received simvastatin 20 mg 4 weeks prior to CABG surgery vs no statin. Interestingly, far fewer statin-treated patients developed thrombocytosis (platelet count > 400 × 109/L) than did control patients (3% vs 81%, P < .0001).
RISKS OF PERIOPERATIVE STATINS
The risks associated with statin therapy in general appear low, but specific perioperative risks have not been well studied.
Baigent et al,41 in a meta-analysis of randomized trials of nonperioperative statin therapy, found that rhabdomyolysis occurred in 9 (0.023%) of 39,884 patients receiving statins vs 6 (0.015%) of the 39,817 controls, with a number needed to harm of 12,500. Moreover, the rates of nonvascular death and cancer did not increase. It is plausible that the risk is somewhat greater in the perioperative setting but is likely not enough to outweigh the potential benefits, especially since the risk of ischemic vascular events is particularly high then.
Some of the perioperative studies cited above specifically addressed potential risks. For example, in the study by Schouten et al,32 mild creatine kinase elevations were more common in the statin-treated group, but the incidence of moderate and severe creatine kinase elevations did not differ significantly. No case of rhabdomyolysis occurred, and length of surgery was the only predictor of myopathy. MIRACL and PROVE-IT revealed similar safety profiles; aminotransferase levels normalized when statins were stopped, and no cases of rhabdomyolysis occurred.11,12 In the vascular surgery study by Durazzo et al,23 1 (2%) of the 50 atorvastatin-treated patients developed both rhabdomyolysis and elevated aminotransferase levels that prompted discontinuation of the statin.
Overall, the observational studies do not indicate that statin continuation or treatment is harmful in perioperative patients. However, these studies did not specifically evaluate patients with acute insults from surgery such as sepsis, renal failure, or hepatitis. It is unknown what effect statin therapy would have in those patients and whether statins should be selectively discontinued in patients who develop major hepatic, musculoskeletal, or renal complications after surgery.
OUR RECOMMENDATIONS
Before CABG or vascular surgery
Given the NCEP recommendations, existing primary and secondary prevention studies, observational studies of CABG and noncardiac vascular surgery patients, and the one randomized trial of vascular surgery patients, data support the use of statins in nearly all patients undergoing cardiac or vascular surgery. We advocate starting statins in the perioperative period to take advantage of their rapid-acting pleiotropic effects, and continuing them long-term to take advantage of their lipid-lowering effects. This recommendation is in line with the recently released American College of Cardiology/American Heart Association (ACC/AHA) 2007 perioperative guidelines that state “for patients undergoing vascular surgery with or without clinical risk factors, statin use is reasonable.”42
Although the ideal time to start statins is not certain, the study by Durazzo et al23 suggests that they should be started at least 2 weeks before surgery if possible. Moreover, patients already taking statins should definitely not have their statins discontinued if at all possible.
Before major nonvascular surgery
For patients undergoing major nonvascular (intermediate-risk) surgery, physicians should first ascertain if the patient has an indication for statin therapy based on current nonsurgical lipid level recommendations. However, even if there is no clear indication for statin therapy based on NCEP guidelines, we endorse the recently released ACC/AHA perioperative guidelines that state that statin therapy can be considered in patients with a risk factor who are undergoing intermediate-risk procedures. Moreover, we wholeheartedly support the ACC/AHA’s strongest recommendation that patients who are already receiving statins and are undergoing noncardiac surgery should not have their statins discontinued.
When to discontinue statins?
The risk of harm overall appears to be minimal and certainly less than the likelihood of benefit. It is reasonable to observe patients postoperatively for adverse clinical events that may increase the risk of perioperative statin treatment, such as acute renal failure, hepatic failure, or sepsis, but whether statins should be stopped in patients with these complications remains unknown; we advocate individualizing the decision.
More studies needed
We need more data on whether moderate-risk patients undergoing moderate-risk surgery benefit from perioperative statin therapy, when therapy should be started, whether therapy should be started on the day of surgery if it was not started earlier, which statin and what doses are optimal, how long therapy should be continued, and what degree of risk is associated with perioperative statin therapy.
Fortunately, important data should be forthcoming in the next few years: the Dutch Echocardiographic Cardiac Risk Evaluation Applying Stress Echocardiography (DECREASE-IV) study43 is a 4-year two-by-two factorial placebo-controlled study evaluating the use of fluvastatin (Lescol) and bisoprolol (Zebeta, a beta-blocker) separately and together in patients who are older than 40 years, are undergoing elective noncardiac surgery, have an estimated risk of cardiovascular death of more than 1%, have not used statins previously, and do not have elevated cholesterol.
- Grant PJ, Kedia N. Should statins be discontinued preoperatively? IMPACT consults. Proceedings of the 2nd Annual Cleveland Clinic Perioperative Medicine Summit. Cleve Clin J Med 2006; 73 Electronic suppl 1:S9–S10.
- Lindenauer PK, Pekow P, Wang K, Gutierrez B, Benjamin EM. Lipid-lowering therapy and in-hospital mortality following major noncardiac surgery. JAMA 2004; 291:2092–2099.
- McFalls EO, Ward HB, Moritz TE, et al. Coronary-artery revascularization before elective major vascular surgery. N Engl J Med 2004; 351:2795–2804.
- Mangano DT, Layug EL, Wallace A, Tateo I. Effect of atenolol on mortality and cardiovascular morbidity after noncardiac surgery. Multicenter Study of Perioperative Ischemia Research Group. N Engl J Med 1996; 335:1713–1720.
- Poldermans D, Boersma E, Bax JJ, et al. The effect of bisoprolol on perioperative mortality and myocardial infarction in high-risk patients undergoing vascular surgery. Dutch Echocardiographic Cardiac Risk Evaluation Applying Stress Echocardiography Study Group. N Engl J Med 1999; 341:1789–1794.
- Brady AR, Gibbs JS, Greenhalgh RM, Powell JT, Sydes MR. Perioperative beta-blockade (POBBLE) for patients undergoing infrarenal vascular surgery: results of a randomized double-blind controlled trial. J Vasc Surg 2005; 41:602–609.
- Juul AB, Wetterslev J, Gluud C, et al. Effect of perioperative beta blockade in patients with diabetes undergoing major non-cardiac surgery: randomised placebo controlled, blinded multicentre trial. BMJ 2006; 332:1482.
- Yang H, Raymer K, Butler R, Parlow J, Roberts R. The effects of perioperative beta-blockade: results of the Metoprolol after Vascular Surgery (MaVS) study, a randomized controlled trial. Am Heart J 2006; 152:983–990.
- Ridker PM, Cannon CP, Morrow D, et al. C-reactive protein levels and outcomes after statin therapy. N Engl J Med 2005; 352:20–28.
- Ito MK, Talbert RL, Tsimikas S. Statin-associated pleiotropy: possible beneficial effects beyond cholesterol reduction. Pharmacotherapy 2006; 26:85S–97S.
- Cannon CP, Braunwald E, McCabe CH, et al. Intensive versus moderate lipid lowering with statins after acute coronary syndromes. N Engl J Med 2004; 350:1495–1504.
- Schwartz GG, Olsson AG, Ezekowitz MD, et al. Effects of atorvastatin on early recurrent ischemic events in acute coronary syndromes: the MIRACL study: a randomized controlled trial. JAMA 2001; 285:1711–1718.
- Lefer AM, Campbell B, Shin YK, Scalia R, Hayward R, Lefer DJ. Simvastatin preserves the ischemic-reperfused myocardium in normocholesterolemic rat hearts. Circulation 1999; 100:178–184.
- Endres M, Laufs U, Liao JK, Moskowitz MA. Targeting eNOS for stroke protection. Trends Neurosci 2004; 27:283–289.
- Osborne JA, Lento PH, Siegfried MR, Stahl GL, Fusman B, Lefer AM. Cardiovascular effects of acute hypercholesterolemia in rabbits. Reversal with lovastatin treatment. J Clin Invest 1989; 83:465–473.
- Sironi L, Cimino M, Guerrini U, et al. Treatment with statins after induction of focal ischemia in rats reduces the extent of brain damage. Arterioscler Thromb Vasc Biol 2003; 23:322–327.
- Fonarow GC, Wright RS, Spencer FA, et al. Effect of statin use within the first 24 hours of admission for acute myocardial infarction on early morbidity and mortality. Am J Cardiol 2005; 96:611–616.
- Heeschen C, Hamm CW, Laufs U, Snapinn S, Bohm M, White HD. Withdrawal of statins increases event rates in patients with acute coronary syndromes. Circulation 2002; 105:1446–1452.
- Kennedy J, Quan H, Buchan AM, Ghali WA, Feasby TE. Statins are associated with better outcomes after carotid endarterectomy in symptomatic patients. Stroke 2005; 36:2072–2076.
- McGirt MJ, Perler BA, Brooke BS, et al. 3-hydroxy-3-methylglutaryl coenzyme A reductase inhibitors reduce the risk of perioperative stroke and mortality after carotid endarterectomy. J Vasc Surg 2005; 42:829–836.
- Hindler K, Shaw AD, Samuels J, Fulton S, Collard CD, Riedel B. Improved postoperative outcomes associated with preoperative statin therapy. Anesthesiology 2006; 105:1260–1272.
- Kapoor AS, Kanji H, Buckingham J, Devereaux PJ, McAlister FA. Strength of evidence for perioperative use of statins to reduce cardiovascular risk: systematic review of controlled studies. BMJ 2006; 333:1149.
- Durazzo AE, Machado FS, Ikeoka DT, et al. Reduction in cardiovascular events after vascular surgery with atorvastatin: a randomized trial. J Vasc Surg 2004; 39:967–975.
- Grundy SM, Cleeman JI, Merz CN, et al. Implications of recent clinical trials for the National Cholesterol Education Program Adult Treatment Panel III guidelines. Circulation 2004; 110:227–239.
- Kertai MD, Boersma E, Westerhout CM, et al. A combination of statins and beta-blockers is independently associated with a reduction in the incidence of perioperative mortality and nonfatal myocardial infarction in patients undergoing abdominal aortic aneurysm surgery. Eur J Vasc Endovasc Surg 2004; 28:343–352.
- Poldermans D, Bax JJ, Kertai MD, et al. Statins are associated with a reduced incidence of perioperative mortality in patients undergoing major noncardiac vascular surgery. Circulation 2003; 107:1848–1851.
- Ward RP, Leeper NJ, Kirkpatrick JN, Lang RM, Sorrentino MJ, Williams KA. The effect of preoperative statin therapy on cardiovascular outcomes in patients undergoing infrainguinal vascular surgery. Int J Cardiol 2005; 104:264–268.
- O’Neil-Callahan K, Katsimaglis G, Tepper MR, et al. Statins decrease perioperative cardiac complications in patients undergoing non-cardiac vascular surgery: the Statins for Risk Reduction in Surgery (StaRRS) study. J Am Coll Cardiol 2005; 45:336–342.
- Abbruzzese TA, Havens J, Belkin M, et al. Statin therapy is associated with improved patency of autogenous infrainguinal bypass grafts. J Vasc Surg 2004; 39:1178–1185.
- Boersma E, Poldermans D, Bax JJ, et al. Predictors of cardiac events after major vascular surgery: role of clinical characteristics, dobutamine echocardiography, and beta-blocker therapy. JAMA 2001; 285:1865–1873.
- Landesberg G, Mosseri M, Wolf YG, et al. Preoperative thallium scanning, selective coronary revascularization, and long-term survival after major vascular surgery. Circulation 2003; 108:177–183.
- Schouten O, Kertai MD, Bax JJ, et al. Safety of perioperative statin use in high-risk patients undergoing major vascular surgery. Am J Cardiol 2005; 95:658–660.
- Le Manach Y, Godet G, Coriat P, et al. The impact of postoperative discontinuation or continuation of chronic statin therapy on cardiac outcome after major vascular surgery. Anesth Analg 2007; 104:1326–1333.
- Ali IS, Buth KJ. Preoperative statin use and outcomes following cardiac surgery. Int J Cardiol 2005; 103:12–18.
- Clark LL, Ikonomidis JS, Crawford FA, et al. Preoperative statin treatment is associated with reduced postoperative mortality and morbidity in patients undergoing cardiac surgery: an 8-year retrospective cohort study. J Thorac Cardiovasc Surg 2006; 131:679–685.
- Pan W, Pintar T, Anton J, Lee VV, Vaughn WK, Collard CD. Statins are associated with a reduced incidence of perioperative mortality after coronary artery bypass graft surgery. Circulation 2004; 110(suppl 2):II45–II49.
- Pascual DA, Arribas JM, Tornel PL, et al. Preoperative statin therapy and troponin T predict early complications of coronary artery surgery. Ann Thorac Surg 2006; 81:78–83.
- Dotani MI, Elnicki DM, Jain AC, Gibson CM. Effect of preoperative statin therapy and cardiac outcomes after coronary artery bypass grafting. Am J Cardiol 2000; 86:1128–1130.
- Liakopoulos OJ, Dorge H, Schmitto JD, Nagorsnik U, Grabedunkel J, Schoendube FA. Effects of preoperative statin therapy on cytokines after cardiac surgery. Thorac Cardiovasc Surg 2006; 54:250–254.
- Christenson JT. Preoperative lipid-control with simvastatin reduces the risk of postoperative thrombocytosis and thrombotic complications following CABG. Eur J Cardiothorac Surg 1999; 15:394–399.
- Baigent C, Keech A, Kearney PM, et al. Efficacy and safety of cholesterol-lowering treatment: prospective meta-analysis of data from 90,056 participants in 14 randomised trials of statins. Lancet 2005; 366:1267–1278.
- Fleisher LA, Beckman JA, Brown KA, et al. ACC/AHA 2007 Guidelines on Perioperative Cardiovascular Evaluation and Care for Noncardiac Surgery. A Report of the American College of Cardiology/American Heart Association Task Force on Practice Guidelines (Writing Committee to Revise the 2002 Guidelines on Perioperative Cardiovascular Evaluation for Noncardiac Surgery). Circulation 2007; 116:e418–e499.
- Schouten O, Poldermans D, Visser L, et al. Fluvastatin and bisoprolol for the reduction of perioperative cardiac mortality and morbidity in high-risk patients undergoing non-cardiac surgery: rationale and design of the DECREASE-IV study. Am Heart J 2004; 148:1047–1052.
- Amar D, Zhang H, Heerdt PM, Park B, Fleisher M, Thaler HT. Statin use is associated with a reduction in atrial fibrillation after noncardiac thoracic surgery independent of C-reactive protein. Chest 2005; 128:3421–3427.
Soon, the checklist for internists seeing patients about to undergo surgery may include prescribing one of the lipid-lowering hydroxymethylglutaryl-CoA reductase inhibitors, also called statins.
Statins? Not long ago, we were debating whether patients who take statins should stop taking them before surgery, based on the manufacturers’ recommendations.1 The discussion, however, has changed to whether patients who have never received a statin should be started on one before surgery to provide immediate prophylaxis against cardiac morbidity, and how much harm long-term statin users face if these drugs are withheld perioperatively.
The evidence is still very preliminary and based mostly on studies in animals and retrospective studies in people. However, an expanding body of indirect evidence suggests that these drugs are beneficial in this situation.
In this review, we discuss the mechanisms by which statins may protect the heart in the short term, drawing on data from animal and human studies of acute myocardial infarction, and we review the current (albeit limited) data from the perioperative setting.
FEW INTERVENTIONS DECREASE RISK
Each year, approximately 50,000 patients suffer a perioperative cardiovascular event; the incidence of myocardial infarction during or after noncardiac surgery is 2% to 3%.2 The primary goal of preoperative cardiovascular risk assessment is to predict and avert these events.
But short of canceling surgery, few interventions have been found to reduce a patient’s risk. For example, a landmark study in 2004 cast doubt on the efficacy of preoperative coronary revascularization.3 Similarly, although early studies of beta-blockers were promising4,5 and although most internists prescribe these drugs before surgery, more recent studies have cast doubt on their efficacy, particularly in patients at low risk undergoing intermediate-risk (rather than vascular) surgery.6–8
This changing clinical landscape has prompted a search for new strategies for perioperative risk-reduction. Several recent studies have placed statins in the spotlight.
POTENTIAL MECHANISMS OF SHORT-TERM BENEFIT
Statins have been proven to save lives when used long-term, but how could this class of drugs, designed to prevent the accumulation of arterial plaques by lowering low-density lipoprotein cholesterol (LDL-C) levels, have any short-term impact on operative outcomes? Although LDL-C reduction is the principal mechanism of action of statins, not all of the benefit can be ascribed to this mechanism.9 The answer may lie in their “pleiotropic” effects—ie, actions other than LDL-C reduction.
The more immediate pleiotropic effects of statins in the proinflammatory and prothrombotic environment of the perioperative period are thought to include improved endothelial function (both antithrombotic function and vasomotor function in response to ischemic stress), enhanced stability of atherosclerotic plaques, decreased oxidative stress, and decreased vascular inflammation.10–12
EVIDENCE FROM ANIMAL STUDIES
Experiments in animals suggest that statins, given shortly before or after a cardiovascular event, confer benefit before any changes in LDL-C are measurable.
Lefer et al13 found that simvastatin (Zocor), given 18 hours before an ischemic episode in rats, blunted the inflammatory response in cardiac reperfusion injury. Not only was reperfusion injury significantly less in the hearts of the rats that received simvastatin than in the saline control group, but the simvastatin-treated hearts also expressed fewer neutrophil adhesion molecules such as P-selectin, and they had more basal release of nitric oxide, the potent endothelial-derived vasodilator with antithrombotic, anti-inflammatory, and antiproliferative effects.14 These results suggest that statins may improve endothelial function acutely, particularly during ischemic stress.
Osborne et al15 fed rabbits a cholesterol-rich diet plus either lovastatin (Mevacor) or placebo. After 2 weeks, the rabbits underwent either surgery to induce a myocardial infarction or a sham procedure. Regardless of the pretreatment, biopsies of the aorta did not reveal any atherosclerosis; yet the lovastatin-treated rabbits sustained less myocardial ischemic damage and they had more endothelium-mediated vasodilatation.
Statin therapy also may improve cerebral ischemia outcomes in animal models.14,16
Sironi et al16 induced strokes in rats by occluding the middle cerebral artery. The rats received either simvastatin or vehicle for 3 days before the stroke or immediately afterwards. Even though simvastatin did not have enough time to affect the total cholesterol level, rats treated with simvastatin had smaller infarcts (as measured by magnetic resonance imaging) and produced more nitric oxide.
Comment. Taken together, these studies offer tantalizing evidence that statins have short-term, beneficial nonlipid effects and may reduce not only the likelihood of an ischemic event, but—should one occur—the degree of tissue damage that ensues.
EFFECTS OF STATINS IN ACUTE CORONARY SYNDROME
The National Registry of Myocardial Infarction17 is a prospective, observational database of all patients with acute myocardial infarction admitted to 1,230 participating hospitals throughout the United States. In an analysis from this cohort, patients were divided into four groups: those receiving statins before and after admission, those receiving statins only before admission, those receiving statins only after admission, and those who never received statins.
Compared with those who never received statins, fewer patients who received them both before and after admission died while in the hospital (unadjusted odds ratio 0.23, 95% confidence interval [CI] 0.22–0.25), and the odds ratio for those who received statins for the first time was 0.31 (95% CI 0.29–0.33). Patients who stopped receiving a statin on admission were more likely to die than were patients who never received statins (odds ratio 1.09, 95% CI 1.03–1.15). These trends held true even when adjustments were made for potential confounding factors.
Comment. Unmeasured confounding factors (such as the inability to take pills due to altered mental status or the different practice styles of the providers who chose to discontinue statins) might have affected the results. Nevertheless, these results suggest that the protective effects of statins stop almost immediately when these drugs are discontinued, and that there may even be an adverse “rebound” effect when patients who have been taking these drugs for a long time stop taking them temporarily.
The Platelet Receptor Inhibition in Ischemic Syndrome Management trial,18 in a subgroup analysis, had nearly identical findings. In the main part of this trial, patients with coronary artery disease and chest pain at rest or accelerating pain in the last 24 hours were randomized to receive tirofiban (Aggrastat) or heparin. Complete data on statin use were available for 1,616 (50%) of the 3,232 patients in this trial, and the rate of the primary end point (death, myocardial infarction, or recurrent ischemia) was analyzed on the basis of statin therapy in this subgroup.
Comment. Together, these data lead to the conclusion that, when admitted for either acute myocardial infarction or acute coronary syndrome, patients already receiving statins should not have them stopped, and those who had not been receiving statins should receive them immediately. The safety of these medications in the acute setting appears excellent: in the Myocardial Ischemia Reduction With Acute Cholesterol Lowering (MIRACL)12 and the Pravastatin or Atorvastatin Evaluation and Infection Therapy (PROVE-IT)11 trials, fewer than 5% of statin-treated patients had transient elevations in transaminase levels, and no cases of rhabdomyolysis were reported.
PERIOPERATIVE STATIN STUDIES
The data on perioperative statin use are mostly observational and retrospective and fall into essentially four surgical categories: coronary artery bypass grafting (CABG), carotid endarterectomy,19,20 noncardiac vascular surgery, and major noncardiac surgery. Two meta-analyses have also evaluated the data.21,22 The only randomized controlled trial (performed by Durazzo et al23) was small and was carried out at a single center in vascular surgery patients, and the event rate was low.
Current recommendations from the National Cholesterol Education Program (NCEP)24 say that patients who need CABG, have peripheral arterial disease, have an abdominal aortic aneurysm, or have cerebrovascular disease should already be on a statin to achieve an LDL-C goal level of less than 100 mg/dL, with an optional goal of less than 70 mg/dL, independent of surgery.
Since not all patients who should be on statins are actually on them, questions arise:
- Is it important (and safe) to start statin treatment preoperatively?
- Will patients with cardiovascular risk factors but without known cardiovascular disease benefit from statins perioperatively?
Noncardiac vascular surgery
Multiple retrospective studies have evaluated the effect of statins in patients undergoing major noncardiac vascular surgery.25–32
Kertai et al25 evaluated 570 patients in Holland who underwent elective open surgery for infrarenal abdominal aortic aneurysms between 1991 and 2001, looking for an association between statin use and the incidence of perioperative death from myocardial infarction. Only 162 of the 570 patients had been on long-term statin therapy before the surgery. The use of statins was only one of many known baseline characteristics that were significantly different between the two groups, including age, body mass index, known coronary artery disease, and use of angiotensin-converting enzyme inhibitors and beta-blockers. In univariate analysis, statins appeared to be protective: 6 (3.7%) of the patients in the statin group died of a myocardial infarction, compared with 45 (11%) of those in the nostatin group. A multivariate analysis yielded similar findings, with an odds ratio of 0.24 (95% CI 0.11–0.54).
Ward et al27 performed a very similar retrospective study, with similar findings. In 446 patients who underwent surgery for infrarenal abdominal aortic aneurysm, statin therapy was associated with a significantly lower incidence of the combined end point of death, myocardial infarction, stroke, and major peripheral vascular complications, with an adjusted odds ratio of 0.36 (95% CI 0.14–0.93).
Poldermans et al26 noted similar findings in a case-control study of noncardiac vascular surgery patients. Statin users had a much lower perioperative risk of death than did nonusers, with an adjusted odds ratio of 0.22 (95% CI 0.10–0.47).
O’Neil-Callahan et al,28 in a cohort study, found that statin users had fewer perioperative cardiac complications, with an adjusted odds ratio of 0.49 (95% CI 0.28–0.84, P = .009).
Dogma of withdrawing statins before major surgery is challenged
Le Manach et al33 reviewed the outcomes for all patients of a single hospital in Paris who underwent nonemergency infrarenal aortic procedures between January 2001 and December 2004. In January 2004, the hospital instituted guidelines to ensure that patients on statins continue taking them up to the evening before surgery and that statins be restarted on the first postoperative day (via nasogastric tube if necessary). Before 2004, there had been no specific guidelines, and patients on statins did not receive them for a median of 4 days postoperatively. Types of procedures were similar during the two time periods, as were the rates of beta-blocker use, preoperative revascularization, venous thromboembolism prophylaxis, and perioperative blood pressure control. After surgery, topononin I levels were measured in all patients as surveillance for cardiac events, and were defined as elevated when greater than 0.2 ng/mL.
Compared with patients not on statins at all, those treated with statins continuously throughout the perioperative period (after January 2004) had a lower rate of elevated troponin (relative risk 0.38). In contrast, those who had their statins transiently discontinued perioperatively (prior to 2004) had troponin elevations more often than those who had never been treated (relative risk 2.1). This suggested an over fivefold risk reduction (P < .001) conferred by not discontinuing statins in the immediate postoperative period. This finding was maintained after multivariate adjustment: statin withdrawal was associated with a 2.9-fold (95% CI 1.6–5.5) increase in the risk of cardiac enzyme elevations postoperatively. No fewer deaths were noted, but the study was not powered to detect a mortality difference.
Comment. Although secular trends cannot be entirely discounted as contributing to these findings, the prompt increase in cardiac events after just 4 days of statin withdrawal adds to the growing body of evidence suggesting that statin discontinuation can have harmful acute effects. It also brings up the question: Can starting statins benefit patients in the same time period?
Should statins be started before vascular surgery?
Schouten et al32 evaluated the effects of newly started or continued statin treatment in patients undergoing major elective vascular surgery. Patients were screened before surgery and started on statins if they were not already receiving them and their total cholesterol levels were elevated; new users received the medication for about 40 days before surgery. Of the 981 screened patients, 44 (5%) were newly started on statins and 182 (19%) were continued on their therapy. Perioperative death or myocardial infarction occurred in 22 (8.8%) of the statin users and 111 (14.7%) of the nonusers, a statistically significant difference. Temporary discontinuation (median 1 day) of statins in this study due to the inability to take an oral medication did not appear to affect the likelihood of a myocardial infarction.
Durazzo et al23 performed a single-center, randomized, prospective, placebo-controlled, double-blind clinical trial of atorvastatin (Lipitor) 20 mg daily vs placebo in 100 patients undergoing noncardiac arterial vascular surgery. Patients were excluded if they had previously used medications to treat dyslipidemia, recently had a cardiovascular event, or had contraindications to statin treatment such as a baseline creatinine level greater than 2.0 mg/dL or severe hepatic disease. The intervention group received atorvastatin starting at least 2 weeks before surgery for a total of 45 days. Patients were then continued or started on a statin after surgery if their LDL-C level was greater than 100 mg/dL. Beta-blocker use was recommended “on the basis of current guidelines.”
One month after surgery, the LDL-C level was statistically significantly lower in the atorvastatin group. Since most patients did not continue or start statin therapy after the 45-day treatment period, the LDL-C levels were not statistically different at 3 and 6 months after surgery.
At 6 months, the rate of the primary end point (death from cardiovascular causes, nonfatal acute myocardial infarction, ischemic stroke, or unstable angina) was 26.0% in the placebo group and 8.0% in the atorvastatin group, a statistically significant difference. Three patients in the atorvastatin group had cardiac events in the first 10 days after surgery, compared with 11 patients in the placebo group. Thirteen of the 17 total cardiac events took place within 10 days after surgery.
One of the atorvastatin patients developed rhabdomyolysis and elevated aminotransferase levels.
Major noncardiac surgery
Lindenauer et al2 performed a retrospective cohort study of surgical patients who were at least 18 years old and survived beyond the second hospital day. Patients were divided into a group receiving any form of lipid-lowering treatment (of whom more than 90% were taking statins) and a group that had never never received a lipid-lowering drug or only started one on the third day of the hospitalization or later. The period of study was from January 1, 2000, to December 31, 2001.
In all, 780,591 patients from 329 hospitals throughout the United States were included, of whom only 77,082 (9.9%) received lipid-lowering therapy. Eight percent of the patients underwent vascular surgery. Not surprisingly, the treated patients were more likely to have a history of hypertension, diabetes, ischemic heart disease, or hyperlipidemia. They also were more likely to have a vascular procedure performed, to have two or more cardiac risk factors (high-risk surgery, ischemic heart disease, congestive heart failure, cerebrovascular disease, renal insufficiency, or diabetes mellitus), and to be treated with beta-blockers and angiotensin-converting enzyme inhibitors, but they were less likely to have high-risk and emergency surgery performed.
The primary end point, perioperative death, occurred in 2.13% of the treated patients and 3.05% of the nontreated group. Compared with the rate in a propensity-matched cohort, the odds ratio adjusted for unbalanced covariates was 0.62 (95% CI 0.58–0.67) in favor of lipid treatment. Stratification by cardiac risk index revealed a number needed to treat of 186 for those with no risk factors, 60 for those with two risk factors, and 30 for those with four or more risk factors.
Unfortunately, this analysis was not able to take into account whether and for how long patients were receiving lipid-lowering therapy before hospitalization. It therefore does not answer the questions of whether starting lipid-lowering therapy before surgery is beneficial or whether stopping it is harmful. It also does not shed light on whether perioperative lipid-lowering increases the risk of rhabdomyolysis or liver disease.
Carotid endarterectomy
Two recent retrospective cohort studies evaluated the outcomes in patients undergoing carotid endarterectomy.19,20
Kennedy et al19 found that patients on a statin at the time of admission who had symptomatic carotid disease had lower rates of inhospital death (adjusted odds ratio 0.24, 95% CI 0.06–0.91) and ischemic stroke or death (adjusted odds ratio 0.55, 95% CI 0.31–0.97). However, cardiac outcomes among these symptomatic patients were not significantly improved (odds ratio 0.82, 95% CI 0.45–1.50), nor was there benefit for asymptomatic patients, raising the possibility that the positive findings were due to chance or that patients at lower baseline risk for vascular events may have less benefit.
McGirt et al20 performed a similar study; they did not, however, distinguish whether patients had symptomatic vs asymptomatic carotid disease. The 30-day risk of perioperative stroke was lower in patients treated with a statin, with an odds ratio of 0.41 (95% CI 0.18–0.93); the odds ratio for death was 0.21 (95% CI 0.05–0.96). Cardiac outcomes were not significantly affected.
Coronary artery bypass graft surgery
According to the NCEP recommendations, nearly all patients undergoing CABG should already be on a statin before surgery since they all have known coronary artery disease. Multiple observational studies have offered confirmatory evidence that statins are beneficial in this setting.34–38
Liakopoulos et al39 evaluated whether the anti-inflammatory effects of statins may, in part, account for their beneficial effect in the perioperative period. The authors prospectively matched 18 patients who were taking statins and were referred for elective CABG with 18 patients who were not prescribed statins previously. The only major measured baseline characteristic that differed between the two groups was a statistically significantly lower LDL-C level in the statin group. The operative characteristics did not differ, and cytokine levels at baseline were similar.
Tumor necrosis factor alpha levels increased significantly in the control group but did not change significantly in the statin group. Interleukin 8 increased in both groups by a similar amount. Interleukin 6 (the major inducer of C-reactive protein) increased from baseline in both groups but did not increase nearly as much in the statin group as in the control group; the intergroup difference was statistically significant. The anti-inflammatory cytokine interleukin 10 increased minimally from baseline in the control group, while the statin group’s levels increased significantly above baseline and those of the control group.
Christenson40 also found that inflammatory markers were improved with pre-CABG statin treatment in a small randomized trial in which patients received simvastatin 20 mg 4 weeks prior to CABG surgery vs no statin. Interestingly, far fewer statin-treated patients developed thrombocytosis (platelet count > 400 × 109/L) than did control patients (3% vs 81%, P < .0001).
RISKS OF PERIOPERATIVE STATINS
The risks associated with statin therapy in general appear low, but specific perioperative risks have not been well studied.
Baigent et al,41 in a meta-analysis of randomized trials of nonperioperative statin therapy, found that rhabdomyolysis occurred in 9 (0.023%) of 39,884 patients receiving statins vs 6 (0.015%) of the 39,817 controls, with a number needed to harm of 12,500. Moreover, the rates of nonvascular death and cancer did not increase. It is plausible that the risk is somewhat greater in the perioperative setting but is likely not enough to outweigh the potential benefits, especially since the risk of ischemic vascular events is particularly high then.
Some of the perioperative studies cited above specifically addressed potential risks. For example, in the study by Schouten et al,32 mild creatine kinase elevations were more common in the statin-treated group, but the incidence of moderate and severe creatine kinase elevations did not differ significantly. No case of rhabdomyolysis occurred, and length of surgery was the only predictor of myopathy. MIRACL and PROVE-IT revealed similar safety profiles; aminotransferase levels normalized when statins were stopped, and no cases of rhabdomyolysis occurred.11,12 In the vascular surgery study by Durazzo et al,23 1 (2%) of the 50 atorvastatin-treated patients developed both rhabdomyolysis and elevated aminotransferase levels that prompted discontinuation of the statin.
Overall, the observational studies do not indicate that statin continuation or treatment is harmful in perioperative patients. However, these studies did not specifically evaluate patients with acute insults from surgery such as sepsis, renal failure, or hepatitis. It is unknown what effect statin therapy would have in those patients and whether statins should be selectively discontinued in patients who develop major hepatic, musculoskeletal, or renal complications after surgery.
OUR RECOMMENDATIONS
Before CABG or vascular surgery
Given the NCEP recommendations, existing primary and secondary prevention studies, observational studies of CABG and noncardiac vascular surgery patients, and the one randomized trial of vascular surgery patients, data support the use of statins in nearly all patients undergoing cardiac or vascular surgery. We advocate starting statins in the perioperative period to take advantage of their rapid-acting pleiotropic effects, and continuing them long-term to take advantage of their lipid-lowering effects. This recommendation is in line with the recently released American College of Cardiology/American Heart Association (ACC/AHA) 2007 perioperative guidelines that state “for patients undergoing vascular surgery with or without clinical risk factors, statin use is reasonable.”42
Although the ideal time to start statins is not certain, the study by Durazzo et al23 suggests that they should be started at least 2 weeks before surgery if possible. Moreover, patients already taking statins should definitely not have their statins discontinued if at all possible.
Before major nonvascular surgery
For patients undergoing major nonvascular (intermediate-risk) surgery, physicians should first ascertain if the patient has an indication for statin therapy based on current nonsurgical lipid level recommendations. However, even if there is no clear indication for statin therapy based on NCEP guidelines, we endorse the recently released ACC/AHA perioperative guidelines that state that statin therapy can be considered in patients with a risk factor who are undergoing intermediate-risk procedures. Moreover, we wholeheartedly support the ACC/AHA’s strongest recommendation that patients who are already receiving statins and are undergoing noncardiac surgery should not have their statins discontinued.
When to discontinue statins?
The risk of harm overall appears to be minimal and certainly less than the likelihood of benefit. It is reasonable to observe patients postoperatively for adverse clinical events that may increase the risk of perioperative statin treatment, such as acute renal failure, hepatic failure, or sepsis, but whether statins should be stopped in patients with these complications remains unknown; we advocate individualizing the decision.
More studies needed
We need more data on whether moderate-risk patients undergoing moderate-risk surgery benefit from perioperative statin therapy, when therapy should be started, whether therapy should be started on the day of surgery if it was not started earlier, which statin and what doses are optimal, how long therapy should be continued, and what degree of risk is associated with perioperative statin therapy.
Fortunately, important data should be forthcoming in the next few years: the Dutch Echocardiographic Cardiac Risk Evaluation Applying Stress Echocardiography (DECREASE-IV) study43 is a 4-year two-by-two factorial placebo-controlled study evaluating the use of fluvastatin (Lescol) and bisoprolol (Zebeta, a beta-blocker) separately and together in patients who are older than 40 years, are undergoing elective noncardiac surgery, have an estimated risk of cardiovascular death of more than 1%, have not used statins previously, and do not have elevated cholesterol.
- Grant PJ, Kedia N. Should statins be discontinued preoperatively? IMPACT consults. Proceedings of the 2nd Annual Cleveland Clinic Perioperative Medicine Summit. Cleve Clin J Med 2006; 73 Electronic suppl 1:S9–S10.
- Lindenauer PK, Pekow P, Wang K, Gutierrez B, Benjamin EM. Lipid-lowering therapy and in-hospital mortality following major noncardiac surgery. JAMA 2004; 291:2092–2099.
- McFalls EO, Ward HB, Moritz TE, et al. Coronary-artery revascularization before elective major vascular surgery. N Engl J Med 2004; 351:2795–2804.
- Mangano DT, Layug EL, Wallace A, Tateo I. Effect of atenolol on mortality and cardiovascular morbidity after noncardiac surgery. Multicenter Study of Perioperative Ischemia Research Group. N Engl J Med 1996; 335:1713–1720.
- Poldermans D, Boersma E, Bax JJ, et al. The effect of bisoprolol on perioperative mortality and myocardial infarction in high-risk patients undergoing vascular surgery. Dutch Echocardiographic Cardiac Risk Evaluation Applying Stress Echocardiography Study Group. N Engl J Med 1999; 341:1789–1794.
- Brady AR, Gibbs JS, Greenhalgh RM, Powell JT, Sydes MR. Perioperative beta-blockade (POBBLE) for patients undergoing infrarenal vascular surgery: results of a randomized double-blind controlled trial. J Vasc Surg 2005; 41:602–609.
- Juul AB, Wetterslev J, Gluud C, et al. Effect of perioperative beta blockade in patients with diabetes undergoing major non-cardiac surgery: randomised placebo controlled, blinded multicentre trial. BMJ 2006; 332:1482.
- Yang H, Raymer K, Butler R, Parlow J, Roberts R. The effects of perioperative beta-blockade: results of the Metoprolol after Vascular Surgery (MaVS) study, a randomized controlled trial. Am Heart J 2006; 152:983–990.
- Ridker PM, Cannon CP, Morrow D, et al. C-reactive protein levels and outcomes after statin therapy. N Engl J Med 2005; 352:20–28.
- Ito MK, Talbert RL, Tsimikas S. Statin-associated pleiotropy: possible beneficial effects beyond cholesterol reduction. Pharmacotherapy 2006; 26:85S–97S.
- Cannon CP, Braunwald E, McCabe CH, et al. Intensive versus moderate lipid lowering with statins after acute coronary syndromes. N Engl J Med 2004; 350:1495–1504.
- Schwartz GG, Olsson AG, Ezekowitz MD, et al. Effects of atorvastatin on early recurrent ischemic events in acute coronary syndromes: the MIRACL study: a randomized controlled trial. JAMA 2001; 285:1711–1718.
- Lefer AM, Campbell B, Shin YK, Scalia R, Hayward R, Lefer DJ. Simvastatin preserves the ischemic-reperfused myocardium in normocholesterolemic rat hearts. Circulation 1999; 100:178–184.
- Endres M, Laufs U, Liao JK, Moskowitz MA. Targeting eNOS for stroke protection. Trends Neurosci 2004; 27:283–289.
- Osborne JA, Lento PH, Siegfried MR, Stahl GL, Fusman B, Lefer AM. Cardiovascular effects of acute hypercholesterolemia in rabbits. Reversal with lovastatin treatment. J Clin Invest 1989; 83:465–473.
- Sironi L, Cimino M, Guerrini U, et al. Treatment with statins after induction of focal ischemia in rats reduces the extent of brain damage. Arterioscler Thromb Vasc Biol 2003; 23:322–327.
- Fonarow GC, Wright RS, Spencer FA, et al. Effect of statin use within the first 24 hours of admission for acute myocardial infarction on early morbidity and mortality. Am J Cardiol 2005; 96:611–616.
- Heeschen C, Hamm CW, Laufs U, Snapinn S, Bohm M, White HD. Withdrawal of statins increases event rates in patients with acute coronary syndromes. Circulation 2002; 105:1446–1452.
- Kennedy J, Quan H, Buchan AM, Ghali WA, Feasby TE. Statins are associated with better outcomes after carotid endarterectomy in symptomatic patients. Stroke 2005; 36:2072–2076.
- McGirt MJ, Perler BA, Brooke BS, et al. 3-hydroxy-3-methylglutaryl coenzyme A reductase inhibitors reduce the risk of perioperative stroke and mortality after carotid endarterectomy. J Vasc Surg 2005; 42:829–836.
- Hindler K, Shaw AD, Samuels J, Fulton S, Collard CD, Riedel B. Improved postoperative outcomes associated with preoperative statin therapy. Anesthesiology 2006; 105:1260–1272.
- Kapoor AS, Kanji H, Buckingham J, Devereaux PJ, McAlister FA. Strength of evidence for perioperative use of statins to reduce cardiovascular risk: systematic review of controlled studies. BMJ 2006; 333:1149.
- Durazzo AE, Machado FS, Ikeoka DT, et al. Reduction in cardiovascular events after vascular surgery with atorvastatin: a randomized trial. J Vasc Surg 2004; 39:967–975.
- Grundy SM, Cleeman JI, Merz CN, et al. Implications of recent clinical trials for the National Cholesterol Education Program Adult Treatment Panel III guidelines. Circulation 2004; 110:227–239.
- Kertai MD, Boersma E, Westerhout CM, et al. A combination of statins and beta-blockers is independently associated with a reduction in the incidence of perioperative mortality and nonfatal myocardial infarction in patients undergoing abdominal aortic aneurysm surgery. Eur J Vasc Endovasc Surg 2004; 28:343–352.
- Poldermans D, Bax JJ, Kertai MD, et al. Statins are associated with a reduced incidence of perioperative mortality in patients undergoing major noncardiac vascular surgery. Circulation 2003; 107:1848–1851.
- Ward RP, Leeper NJ, Kirkpatrick JN, Lang RM, Sorrentino MJ, Williams KA. The effect of preoperative statin therapy on cardiovascular outcomes in patients undergoing infrainguinal vascular surgery. Int J Cardiol 2005; 104:264–268.
- O’Neil-Callahan K, Katsimaglis G, Tepper MR, et al. Statins decrease perioperative cardiac complications in patients undergoing non-cardiac vascular surgery: the Statins for Risk Reduction in Surgery (StaRRS) study. J Am Coll Cardiol 2005; 45:336–342.
- Abbruzzese TA, Havens J, Belkin M, et al. Statin therapy is associated with improved patency of autogenous infrainguinal bypass grafts. J Vasc Surg 2004; 39:1178–1185.
- Boersma E, Poldermans D, Bax JJ, et al. Predictors of cardiac events after major vascular surgery: role of clinical characteristics, dobutamine echocardiography, and beta-blocker therapy. JAMA 2001; 285:1865–1873.
- Landesberg G, Mosseri M, Wolf YG, et al. Preoperative thallium scanning, selective coronary revascularization, and long-term survival after major vascular surgery. Circulation 2003; 108:177–183.
- Schouten O, Kertai MD, Bax JJ, et al. Safety of perioperative statin use in high-risk patients undergoing major vascular surgery. Am J Cardiol 2005; 95:658–660.
- Le Manach Y, Godet G, Coriat P, et al. The impact of postoperative discontinuation or continuation of chronic statin therapy on cardiac outcome after major vascular surgery. Anesth Analg 2007; 104:1326–1333.
- Ali IS, Buth KJ. Preoperative statin use and outcomes following cardiac surgery. Int J Cardiol 2005; 103:12–18.
- Clark LL, Ikonomidis JS, Crawford FA, et al. Preoperative statin treatment is associated with reduced postoperative mortality and morbidity in patients undergoing cardiac surgery: an 8-year retrospective cohort study. J Thorac Cardiovasc Surg 2006; 131:679–685.
- Pan W, Pintar T, Anton J, Lee VV, Vaughn WK, Collard CD. Statins are associated with a reduced incidence of perioperative mortality after coronary artery bypass graft surgery. Circulation 2004; 110(suppl 2):II45–II49.
- Pascual DA, Arribas JM, Tornel PL, et al. Preoperative statin therapy and troponin T predict early complications of coronary artery surgery. Ann Thorac Surg 2006; 81:78–83.
- Dotani MI, Elnicki DM, Jain AC, Gibson CM. Effect of preoperative statin therapy and cardiac outcomes after coronary artery bypass grafting. Am J Cardiol 2000; 86:1128–1130.
- Liakopoulos OJ, Dorge H, Schmitto JD, Nagorsnik U, Grabedunkel J, Schoendube FA. Effects of preoperative statin therapy on cytokines after cardiac surgery. Thorac Cardiovasc Surg 2006; 54:250–254.
- Christenson JT. Preoperative lipid-control with simvastatin reduces the risk of postoperative thrombocytosis and thrombotic complications following CABG. Eur J Cardiothorac Surg 1999; 15:394–399.
- Baigent C, Keech A, Kearney PM, et al. Efficacy and safety of cholesterol-lowering treatment: prospective meta-analysis of data from 90,056 participants in 14 randomised trials of statins. Lancet 2005; 366:1267–1278.
- Fleisher LA, Beckman JA, Brown KA, et al. ACC/AHA 2007 Guidelines on Perioperative Cardiovascular Evaluation and Care for Noncardiac Surgery. A Report of the American College of Cardiology/American Heart Association Task Force on Practice Guidelines (Writing Committee to Revise the 2002 Guidelines on Perioperative Cardiovascular Evaluation for Noncardiac Surgery). Circulation 2007; 116:e418–e499.
- Schouten O, Poldermans D, Visser L, et al. Fluvastatin and bisoprolol for the reduction of perioperative cardiac mortality and morbidity in high-risk patients undergoing non-cardiac surgery: rationale and design of the DECREASE-IV study. Am Heart J 2004; 148:1047–1052.
- Amar D, Zhang H, Heerdt PM, Park B, Fleisher M, Thaler HT. Statin use is associated with a reduction in atrial fibrillation after noncardiac thoracic surgery independent of C-reactive protein. Chest 2005; 128:3421–3427.
KEY POINTS
- Experiments in animals suggest that statins, given shortly before or after a cardiovascular event, confer benefit before any changes in lipids are measurable.
- Retrospective and prospective studies indicate that patients with either acute myocardial infarction or acute coronary syndrome who are already receiving statins should not have them stopped, and those who had not been receiving statins should receive them immediately.
- Most patients undergoing coronary artery bypass grafting or noncardiac vascular surgery should already be receiving a statin. These drugs can also be considered in patients undergoing intermediate-risk nonvascular surgery. Patients who have been receiving statins prior to surgery should not have them stopped for surgery.
And then there were none? An internist’s reflections

I observe with sadness the decreasing number of our brightest medical students entering into internal medicine careers and other “cognitive” subspecialties. Much effort has been spent on many fronts to understand and reverse this trend, with limited success.
At the other end of their careers, physicians seem to be looking for ways to retire earlier or to withdraw from their usual and customary practice of internal medicine. Hearing these senior physicians’ reasons for withdrawing from clinical practice evokes an even stronger response in me, especially when the physician is a really good one, a role model for the next generation of our internists currently in training.
In an essay in this issue, Dr. Thomas Lansdale, internist and former chairman of medicine at a community teaching hospital, eloquently expresses a common theme: medicine just isn’t that much fun anymore. We don’t generally run this type of article in the Journal. But Dr. Lansdale’s words reflect an undercurrent that is changing the landscape of American medicine. We would like to hear responses from our readers, but not to simply agree or disagree with Dr. Lansdale. Rather, we’d like to hear some solutions, which we hope to print in a future issue.
I have known Dr. Lansdale for over 20 years; we trained together as residents at the University of Pennsylvania. He was a year or so behind me, and over the years I have had the opportunity to follow his clinical career from afar and occasionally to discuss patient care and education issues. He was (and is) a thoughtful and extremely insightful internist, devoted and capable of delivering the highest quality of care to his patients. He has always approached medicine, his trainees, and his patients in a serious and respectful manner. His words should prompt some serious self-reflection.
Send your comments to [email protected]. Please note that sending your comments constitutes permission to publish them, and also that we cannot respond to or publish all submissions.
A case of refractory diarrhea
A 68-year-old white woman with irritable bowel syndrome has had worsening symptoms of right-sided abdominal pain, excessive bloating, and loose stools. Her bowel movements have increased from one a day to two or three a day. She has not noted any mucus or blood in the stool. She cannot identify any alleviating or aggravating factors, and the pain is not related to eating.
She consumes a normal diet, including meat and dairy. Over-the-counter antidiarrheal medications do not relieve the symptoms. She has had no fevers, chills, or night sweats, and she has not lost weight over the past year.
Her medical history includes breast cancer (in remission), alcohol abuse (in remission), and hypothyroidism, osteoporosis, and supraventricular tachycardia, all controlled with treatment as noted below. She has never undergone abdominal surgery.
A general review of systems is normal. Her current medications include oxybutynin (available as Ditropan, others), calcium polycarbophil (FiberCon, others), risedronate (Actonel), levothyroxine (Synthroid, others), simethicone (Maalox Anti-Gas, others), atenolol (Tenormin), trazodone (Desyrel), a calcium supplement, and aspirin. She began taking duloxetine (Cymbalta) 18 months ago, and the dose was increased from 60 mg to 90 mg 1 week before this visit.
She has never smoked, and she has abstained from alcohol for 10 years. She has no family history of colon cancer, celiac disease, or inflammatory bowel disease. She has not traveled outside the country in the past several years, and she notes no change in her source of drinking water.
On physical examination, she does not appear to be in acute distress. Her pulse is 64 and her blood pressure is 112/78 mm Hg. The cardiopulmonary examination is normal. Her abdomen is soft, symmetrical, nondistended, and nontender. Bowel sounds are normal. No abdominal masses, palpable organomegaly, or abdominal bruits are noted.
Results of basic laboratory tests, including thyroid-stimulating hormone (TSH), complete blood count, blood chemistries, renal function, and liver function, are normal. Colonoscopy shows normal mucosa as far as the cecum.
DIFFERENTIAL DIAGNOSIS
1. In addition to irritable bowel syndrome, which of these can explain her symptoms?
- Ulcerative colitis
- Celiac disease
- Microscopic colitis
- Hyperthyroidism
- Lactase deficiency
Ulcerative colitis typically presents with blood and mucus in the stool and gross abnormalities on colonoscopy, none of which is present in this patient.
Hyperthyroidism can be ruled out by the normal TSH level.
Lactase deficiency or lactose intolerance is unlikely because it is present in only 15% of people of northern European descent (compared with 80% of blacks and Hispanics and up to 100% of Native Americans and Asians).1 Furthermore, her pain is apparently not related to consuming dairy products.
The hydrogen breath test can aid in the diagnosis of lactase deficiency. This test relies on the breakdown of malabsorbed lactose by colonic flora. This is the most widely used test for this deficiency, but its high false-negative rate of 25% means that a negative result does not exclude the diagnosis and should not be relied on in working up a patient with chronic diarrhea.2 Simply noting whether symptoms develop after ingesting 50 g of lactose is clinically useful when lactase deficiency is suspected.
Based on the information so far, it is reasonable in this patient to evaluate for celiac disease and for microscopic colitis.
Celiac disease, also called gluten-sensitive enteropathy, has a varied presentation that includes nonspecific symptoms such as those in this patient. Classically, it causes diarrhea, but patients may present with a single nutrient deficiency and no diarrhea.
This patient lacks the elevated alkaline phosphatase or evidence of vitamin deficiencies characteristic of malabsorption in celiac disease (ie, vitamins A, B12, D, K, and folate)3. She also lacks evidence of malnutrition, such as iron deficiency anemia, weight loss, or low serum albumin. Finally, she does not have the dermatitis herpetiformis rash to suggest autoimmune gluten-sensitive enteropathy, nor does she have evidence of follicular hyperplasia or petechiae due to vitamin malabsorption.3
Because no single serologic test is ideal for diagnosing gluten-sensitive enteropathy, several tests are typically used: immunoglobulin A (IgA) antigliadin antibody, IgG antigliadin antibody, IgA antitransglutaminase antibody, and IgA antiendomysial antibody. IgA antitransglutaminase antibody is 92% to 98% sensitive and 91% to 100% specific for celiac disease. IgG antigliadin antibody is 92% to 97% sensitive and 99% specific. The positive predictive value of the IgA and IgG antigliadin antibody tests is less than 2% in the general population, whereas the positive predictive value for antiendomysial antibody and antitransglutaminase antibody are 15.7% and 21.8%, respectively.4 A positive serologic test for antiendomysial antibody is nearly 100% specific.
Our patient’s entire celiac antibody panel is negative, and thus celiac disease is unlikely.
Case continued: Features of microscopic colitis
In our patient, colonic biopsy reveals a mildly expanded lamina propria, intraepithelial lymphocytes, and a patchy but prominent thickening of the subepithelial collagen table. This set of features is consistent with collagenous colitis, a variant of microscopic colitis. Histologic signs on biopsy specimens are fairly specific for the disease.5
Chronic, intermittent, secretory diarrhea without bleeding is the hallmark of microscopic colitis. Associated symptoms may include abdominal pain, weight loss, and fatigue. If biopsies are not taken at the time of the initial evaluation, and the colonic pathology is overlooked, patients with collagenous colitis may be diagnosed with irritable bowel syndrome with diarrhea.6 The sedimentation rate is often elevated, and the antinuclear antibody test can be positive.7 Steatorrhea or protein-losing enteropathy can occur, and fecal leukocytes are present in more than 50% of patients.8
This patient fits well the demographics of the typical collagenous colitis patient: ie, a middle-aged woman in her 6th decade in otherwise good general health. The female-to-male ratio is 15:1 overall, although the relative frequency of collagenous colitis in women is greater than that of lymphocytic colitis.9 In a population-based study, the incidence of collagenous colitis was 5.1 per 100,000 per year, with a prevalence of 36 per 100,000; the incidence of lymphocytic colitis was 9.8 per 100,000 per year, with a prevalence of 64 per 100,000.10
Symptoms are typically vague and range from an annoyance to more than 20 non-bloody stools per day. The course of the disease also varies. Case series have reported a spontaneous remission rate of 15% to 20%,11 though flare-ups are common. Microscopic colitis is largely a benign disease. It does not increase a person’s risk of colon cancer.
CAUSES OF COLLAGENOUS COLITIS
2. What causes of collagenous colitis have been identified?
- Alcohol abuse
- Previous gastrointestinal surgery
- Drug-induced injury to colon
Neither alcohol use nor previous gastrointestinal surgery has been associated with the development of collagenous colitis.
Collagenous colitis has, however, been linked to several causes. Abnormal collagen metabolism has been demonstrated in patients as a result of increased expression of procollagen I and metalloproteinase inhibitor TIMP-1.12 Bacterial toxins and a bile-acid malabsorption defect in the terminal ileum and subsequent exposure of the colon to high concentrations of bile acids have also been linked to the development of collagenous colitis.
Many drugs have been linked to the development of collagenous colitis. Damage to the large intestine related to the use of non-steroidal anti-inflammatory drugs has been attributed to the blockage of prostaglandin synthesis.13 Simvastatin (Zocor), lansoprazole (Prilosec), and ticlopidine (Ticlid) have been linked to collagenous colitis; ticlopidine, flutamide (Eulexin), gold salts, lansoprazole, and sertraline (Zoloft) have been linked to the development of lymphocytic colitis.14 In one small series, patients developed colitis after switching from omeprazole (Prevacid) to lansoprazole. All patients had their symptoms and biopsy findings resolve within 1 week of stopping the drug.15
WHICH DRUG IS BEST?
3. Which drug is best for microscopic colitis, based on the current evidence?
- Bismuth (eg, Kaopectate, Pepto-Bismol)
- Sulfasalazine (Sulfazine)
- Budesonide (Entocort)
- Prednisolone
Studies have evaluated bismuth subsalicylate, Boswellia serrata extract, probiotics, prednisolone, budesonide, and other drugs for treating collagenous colitis.16
Bismuth trials have been small. In an open-label study of bismuth,17 symptoms improved in 11 of 12 patients.
Prednisolone recipients had a trend towards clinical response with treatment vs placebo, but it was not statistically significant, and there was incomplete remission of disease.18
Boswellia serrataextract19 and probiotics20 showed no clinical improvement.
Cholestyramine has been shown to be helpful when used in conjunction with an anti-inflammatory agent,21 and it may be helpful when used alone.
Aminosalicylate compounds have not been tested in prospective randomized trials, even though they are the cornerstone of treatment for ulcerative colitis. Retrospective trials have been equivocal.22
Budesonide currently has the best evidence of efficacy in collagenous colitis,23,24 and some evidence suggests it is also effective for other variants of microscopic colitis.
A total of 94 patients were enrolled in three placebo-controlled trials of budesonide at 9 mg daily or on a tapering schedule for 6 to 8 weeks. The pooled odds ratio for clinical response to treatment with budesonide was 12.32 (95% confidence interval 5.53–27.46), with a number needed to treat of 1.58. Significant histologic improvement with treatment was noted in all three trials.23
Quality of life has also been studied in patients with microscopic colitis who take budesonide. Symptoms, emotional functioning, and physical functioning are improved. Budesonide also improved stool consistency and significantly reduced the mean stool frequency compared with placebo.24
Compared with cortisol, budesonide has a 200 times greater affinity for the glucocorticoid receptor, and a 1,000 times greater topical anti-inflammatory potency. It is also well absorbed in the gastrointestinal tract but is substantially modified into very weak metabolites as a result of first-pass metabolism in the liver.25 This localized effect further supports the use of budesonide in patients with any form of microscopic colitis.
Although studies have shown budesonide to be effective, not every patient with a histologic diagnosis of microscopic colitis needs it. It is reasonable to try antidiarrheal agents, bismuth, or both as a first step because they are inexpensive and have few side effects. If budesonide is used, it should be given for 6 to 8 weeks, then stopped, and the patient should then be monitored for symptom recurrence. If a flare does occur, budesonide can be restarted and continued as maintenance therapy.
KEY CONSIDERATIONS
Microscopic colitis is diagnosed histologically, while irritable bowel syndrome is a clinical diagnosis. In population-based cohorts of histologically confirmed microscopic colitis, 50% to 70% met symptom-based Rome criteria for the diagnosis of irritable bowel syndrome. The clinical symptom-based criteria for irritable bowel syndrome are not specific enough to rule out the diagnosis of microscopic colitis. Therefore, patients with suspected diarrhea-predominant irritable bowel syndrome should undergo colonoscopy with biopsy to investigate microscopic colitis if symptoms are not well controlled by antidiarrheal therapy.26 The patient’s management may be very different depending on whether colonoscopy is done.
Management of microscopic colitis should include stopping any drugs associated with it. Simple antidiarrheal agents should be tried first to manage symptoms. If symptoms persist, patients can be treated with budesonide (Entocort EC) 9 mg by mouth daily for 8 weeks to induce remission, or 6 mg by mouth daily for 3 months as maintenance therapy.
OUR PATIENT’S COURSE
Our patient’s medication list includes duloxetine, a serotonin-norepinephrine reuptake inhibitor related to drugs that have been associated with the development of microscopic colitis. We tapered the duloxetine, and her symptoms improved by 50%. Her symptoms were eventually controlled after an 8-week course of oral budesonide 9 mg and ongoing intermittent use of loperamide (Imodium).
- Swagerty DL, Walling AD, Klein RM. Lactose intolerance. Am Fam Physician 2002; 65:1845–1856.
- Thomas PD, Forbes A, Green J, et al. Guidelines for the investigation of chronic diarrhea, 2nd edition. Gut 2003; 52(suppl 5):1–5.
- Nelsen DA. Gluten-sensitive enteropathy (celiac disease): more common than you think. Am Fam Physician 2002; 66:2259–2266.
- Bardella MT, Trovato C, Cesana BM, Pagliari C, Gebbia C, Peracchi M. Serological markers for coeliac disease: is it time to change? Dig Liver Dis 2001; 33:426–431.
- Barta Z, Mekkel G, Csipo I, et al. Micropscopic colitis: a retrospective study of clinical presentation in 53 patients. World J Gastroenterol 2005; 11:1351–1355.
- Tremaine WJ. Diagnosing collagenous colitis: does it make a difference? Eur J Gastroenterol Hepatol 1999; 11:477–479.
- Bohr J, Tysk C, Yang P, Danielsson D, Järnerot G. Autoantibodies and immunoglobulins in collagenous colitis. Gut 1996; 39:77–81.
- Zins BJ, Tremaine WJ, Carpenter HA. Collagenous colitis: mucosal biopsies and association with fecal leukocytes. Mayo Clin Proc 1995; 70:430–433.
- Olsen M, Eriksson S, Bohr J, Järnerot G, Tysk C. Lymphocytic colitis: a retrospective clinical study of 199 Swedish patients. Gut 2004; 53:536–541.
- Pardi DS. Microscopic colitis: an update. Inflamm Bowel Dis 2004; 10:860–870.
- Fernandez-Banares F, Salas A, Esteve M, Espinos J, Forne M, Viver JM. Collagenous and lymphocytic colitis: evaluation of clinical and histological features, response to treatment, and long-term follow-up. Am J Gastroenterol 2003; 98:340–347.
- Aignet T, Neureiter D, Müller S, Küspert G, Belke J, Kirchner T. Extracellular matrix composition and gene expression in collagenous colitis. Gastroenterology 1997; 113:136–143.
- Parfitt JR, Driman DK. Pathological effects of drugs on the gastrointestinal tract: a review. Hum Pathol 2007; 38:527–536.
- Fernández-Bañares F, Esteve M, Espinós JC, et al. Drug consumption and the risk of microscopic colitis. Am J Gastroenterol 2007; 102:324–330.
- Thomson RD, Lestine LS, Bensen SP, et al. Lansoprazole-associated microscopic colitis: a case series. Am J Gastroenterol 2002; 97:2908–2913.
- Chande N, McDonald JWD, MacDonald JK. Cochrane Inflammatory Bowel Disease and Functional Bowel Disorders Group. Interventions for treating collagenous colitis. Cochrane Database Syst Rev 2007 Jan 24;(1):CD006096.
- Fine K, Lee E. Efficacy of open-label bismuth subsalicylate for the treatment of microscopic colitis. Gastroenterology 1998; 114:29–36.
- Munck LK, Kjeldsen J, Philipsen E, Fscher Hansen B. Incomplete remission with short-term prednisolone treatment in collagenous colitis: a randomized study. Scand J Gastroenterol 2003; 38:606–610.
- Madisch A, Miehlke S, Eichele E, et al. Boswellia serrata extract for the treatment of collagenous colitis: a randomized, double-blind, placebo-controlled, multicenter trial. Int J Colorectal Dis 2007; 22:1445–1451.
- Wildt S, Munck LK, Vinter-Jensen L, et al. Probiotic treatment of collagenous colitis: a randomized, double-blind, placebo-controlled trial with Lactobacillus acidophilus and Bifidobacterium animalis subsp. lactis. Inflamm Bowel Dis 2006; 12:395–401.
- Calabrese C, Fabbri A, Areni A, Zahlane D, Scialpi C, Di Febo G. Mesalazine with or without cholestyramine in the treatment of microscopic colitis: randomized controlled trial. J Gastroenterol Hepatol 2007; 22:809–814.
- Wall GC, Schirmer LL, Page MJ. Pharmacotherapy for microscopic colitis. Pharmacotherapy 2007; 27:425–433.
- Feyen B, Wall GC, Finnerty EP, DeWitt JE, Reyes RS. Meta-analysis: budesonide treatment for collagenous colitis. Aliment Pharmacol Ther 2004; 20:745–749.
- Madisch A, Heymer P, Voss C, et al. Oral budesonide therapy improves quality of life in patients with collagenous colitis. Int J Colorectal Dis 2005; 20:312–316.
- Craig CR, editor. Modern Pharmacology With Clinical Application. 6th edition. Philadelphia: Lippincott Williams and Wilkins, 2003:481.
- Limsui D, Pardi DS, Camilleri M, et al. Symptomatic overlap between irritable bowel syndrome and microscopic colitis. Inflamm Bowel Dis 2007; 13:175–181.
A 68-year-old white woman with irritable bowel syndrome has had worsening symptoms of right-sided abdominal pain, excessive bloating, and loose stools. Her bowel movements have increased from one a day to two or three a day. She has not noted any mucus or blood in the stool. She cannot identify any alleviating or aggravating factors, and the pain is not related to eating.
She consumes a normal diet, including meat and dairy. Over-the-counter antidiarrheal medications do not relieve the symptoms. She has had no fevers, chills, or night sweats, and she has not lost weight over the past year.
Her medical history includes breast cancer (in remission), alcohol abuse (in remission), and hypothyroidism, osteoporosis, and supraventricular tachycardia, all controlled with treatment as noted below. She has never undergone abdominal surgery.
A general review of systems is normal. Her current medications include oxybutynin (available as Ditropan, others), calcium polycarbophil (FiberCon, others), risedronate (Actonel), levothyroxine (Synthroid, others), simethicone (Maalox Anti-Gas, others), atenolol (Tenormin), trazodone (Desyrel), a calcium supplement, and aspirin. She began taking duloxetine (Cymbalta) 18 months ago, and the dose was increased from 60 mg to 90 mg 1 week before this visit.
She has never smoked, and she has abstained from alcohol for 10 years. She has no family history of colon cancer, celiac disease, or inflammatory bowel disease. She has not traveled outside the country in the past several years, and she notes no change in her source of drinking water.
On physical examination, she does not appear to be in acute distress. Her pulse is 64 and her blood pressure is 112/78 mm Hg. The cardiopulmonary examination is normal. Her abdomen is soft, symmetrical, nondistended, and nontender. Bowel sounds are normal. No abdominal masses, palpable organomegaly, or abdominal bruits are noted.
Results of basic laboratory tests, including thyroid-stimulating hormone (TSH), complete blood count, blood chemistries, renal function, and liver function, are normal. Colonoscopy shows normal mucosa as far as the cecum.
DIFFERENTIAL DIAGNOSIS
1. In addition to irritable bowel syndrome, which of these can explain her symptoms?
- Ulcerative colitis
- Celiac disease
- Microscopic colitis
- Hyperthyroidism
- Lactase deficiency
Ulcerative colitis typically presents with blood and mucus in the stool and gross abnormalities on colonoscopy, none of which is present in this patient.
Hyperthyroidism can be ruled out by the normal TSH level.
Lactase deficiency or lactose intolerance is unlikely because it is present in only 15% of people of northern European descent (compared with 80% of blacks and Hispanics and up to 100% of Native Americans and Asians).1 Furthermore, her pain is apparently not related to consuming dairy products.
The hydrogen breath test can aid in the diagnosis of lactase deficiency. This test relies on the breakdown of malabsorbed lactose by colonic flora. This is the most widely used test for this deficiency, but its high false-negative rate of 25% means that a negative result does not exclude the diagnosis and should not be relied on in working up a patient with chronic diarrhea.2 Simply noting whether symptoms develop after ingesting 50 g of lactose is clinically useful when lactase deficiency is suspected.
Based on the information so far, it is reasonable in this patient to evaluate for celiac disease and for microscopic colitis.
Celiac disease, also called gluten-sensitive enteropathy, has a varied presentation that includes nonspecific symptoms such as those in this patient. Classically, it causes diarrhea, but patients may present with a single nutrient deficiency and no diarrhea.
This patient lacks the elevated alkaline phosphatase or evidence of vitamin deficiencies characteristic of malabsorption in celiac disease (ie, vitamins A, B12, D, K, and folate)3. She also lacks evidence of malnutrition, such as iron deficiency anemia, weight loss, or low serum albumin. Finally, she does not have the dermatitis herpetiformis rash to suggest autoimmune gluten-sensitive enteropathy, nor does she have evidence of follicular hyperplasia or petechiae due to vitamin malabsorption.3
Because no single serologic test is ideal for diagnosing gluten-sensitive enteropathy, several tests are typically used: immunoglobulin A (IgA) antigliadin antibody, IgG antigliadin antibody, IgA antitransglutaminase antibody, and IgA antiendomysial antibody. IgA antitransglutaminase antibody is 92% to 98% sensitive and 91% to 100% specific for celiac disease. IgG antigliadin antibody is 92% to 97% sensitive and 99% specific. The positive predictive value of the IgA and IgG antigliadin antibody tests is less than 2% in the general population, whereas the positive predictive value for antiendomysial antibody and antitransglutaminase antibody are 15.7% and 21.8%, respectively.4 A positive serologic test for antiendomysial antibody is nearly 100% specific.
Our patient’s entire celiac antibody panel is negative, and thus celiac disease is unlikely.
Case continued: Features of microscopic colitis
In our patient, colonic biopsy reveals a mildly expanded lamina propria, intraepithelial lymphocytes, and a patchy but prominent thickening of the subepithelial collagen table. This set of features is consistent with collagenous colitis, a variant of microscopic colitis. Histologic signs on biopsy specimens are fairly specific for the disease.5
Chronic, intermittent, secretory diarrhea without bleeding is the hallmark of microscopic colitis. Associated symptoms may include abdominal pain, weight loss, and fatigue. If biopsies are not taken at the time of the initial evaluation, and the colonic pathology is overlooked, patients with collagenous colitis may be diagnosed with irritable bowel syndrome with diarrhea.6 The sedimentation rate is often elevated, and the antinuclear antibody test can be positive.7 Steatorrhea or protein-losing enteropathy can occur, and fecal leukocytes are present in more than 50% of patients.8
This patient fits well the demographics of the typical collagenous colitis patient: ie, a middle-aged woman in her 6th decade in otherwise good general health. The female-to-male ratio is 15:1 overall, although the relative frequency of collagenous colitis in women is greater than that of lymphocytic colitis.9 In a population-based study, the incidence of collagenous colitis was 5.1 per 100,000 per year, with a prevalence of 36 per 100,000; the incidence of lymphocytic colitis was 9.8 per 100,000 per year, with a prevalence of 64 per 100,000.10
Symptoms are typically vague and range from an annoyance to more than 20 non-bloody stools per day. The course of the disease also varies. Case series have reported a spontaneous remission rate of 15% to 20%,11 though flare-ups are common. Microscopic colitis is largely a benign disease. It does not increase a person’s risk of colon cancer.
CAUSES OF COLLAGENOUS COLITIS
2. What causes of collagenous colitis have been identified?
- Alcohol abuse
- Previous gastrointestinal surgery
- Drug-induced injury to colon
Neither alcohol use nor previous gastrointestinal surgery has been associated with the development of collagenous colitis.
Collagenous colitis has, however, been linked to several causes. Abnormal collagen metabolism has been demonstrated in patients as a result of increased expression of procollagen I and metalloproteinase inhibitor TIMP-1.12 Bacterial toxins and a bile-acid malabsorption defect in the terminal ileum and subsequent exposure of the colon to high concentrations of bile acids have also been linked to the development of collagenous colitis.
Many drugs have been linked to the development of collagenous colitis. Damage to the large intestine related to the use of non-steroidal anti-inflammatory drugs has been attributed to the blockage of prostaglandin synthesis.13 Simvastatin (Zocor), lansoprazole (Prilosec), and ticlopidine (Ticlid) have been linked to collagenous colitis; ticlopidine, flutamide (Eulexin), gold salts, lansoprazole, and sertraline (Zoloft) have been linked to the development of lymphocytic colitis.14 In one small series, patients developed colitis after switching from omeprazole (Prevacid) to lansoprazole. All patients had their symptoms and biopsy findings resolve within 1 week of stopping the drug.15
WHICH DRUG IS BEST?
3. Which drug is best for microscopic colitis, based on the current evidence?
- Bismuth (eg, Kaopectate, Pepto-Bismol)
- Sulfasalazine (Sulfazine)
- Budesonide (Entocort)
- Prednisolone
Studies have evaluated bismuth subsalicylate, Boswellia serrata extract, probiotics, prednisolone, budesonide, and other drugs for treating collagenous colitis.16
Bismuth trials have been small. In an open-label study of bismuth,17 symptoms improved in 11 of 12 patients.
Prednisolone recipients had a trend towards clinical response with treatment vs placebo, but it was not statistically significant, and there was incomplete remission of disease.18
Boswellia serrataextract19 and probiotics20 showed no clinical improvement.
Cholestyramine has been shown to be helpful when used in conjunction with an anti-inflammatory agent,21 and it may be helpful when used alone.
Aminosalicylate compounds have not been tested in prospective randomized trials, even though they are the cornerstone of treatment for ulcerative colitis. Retrospective trials have been equivocal.22
Budesonide currently has the best evidence of efficacy in collagenous colitis,23,24 and some evidence suggests it is also effective for other variants of microscopic colitis.
A total of 94 patients were enrolled in three placebo-controlled trials of budesonide at 9 mg daily or on a tapering schedule for 6 to 8 weeks. The pooled odds ratio for clinical response to treatment with budesonide was 12.32 (95% confidence interval 5.53–27.46), with a number needed to treat of 1.58. Significant histologic improvement with treatment was noted in all three trials.23
Quality of life has also been studied in patients with microscopic colitis who take budesonide. Symptoms, emotional functioning, and physical functioning are improved. Budesonide also improved stool consistency and significantly reduced the mean stool frequency compared with placebo.24
Compared with cortisol, budesonide has a 200 times greater affinity for the glucocorticoid receptor, and a 1,000 times greater topical anti-inflammatory potency. It is also well absorbed in the gastrointestinal tract but is substantially modified into very weak metabolites as a result of first-pass metabolism in the liver.25 This localized effect further supports the use of budesonide in patients with any form of microscopic colitis.
Although studies have shown budesonide to be effective, not every patient with a histologic diagnosis of microscopic colitis needs it. It is reasonable to try antidiarrheal agents, bismuth, or both as a first step because they are inexpensive and have few side effects. If budesonide is used, it should be given for 6 to 8 weeks, then stopped, and the patient should then be monitored for symptom recurrence. If a flare does occur, budesonide can be restarted and continued as maintenance therapy.
KEY CONSIDERATIONS
Microscopic colitis is diagnosed histologically, while irritable bowel syndrome is a clinical diagnosis. In population-based cohorts of histologically confirmed microscopic colitis, 50% to 70% met symptom-based Rome criteria for the diagnosis of irritable bowel syndrome. The clinical symptom-based criteria for irritable bowel syndrome are not specific enough to rule out the diagnosis of microscopic colitis. Therefore, patients with suspected diarrhea-predominant irritable bowel syndrome should undergo colonoscopy with biopsy to investigate microscopic colitis if symptoms are not well controlled by antidiarrheal therapy.26 The patient’s management may be very different depending on whether colonoscopy is done.
Management of microscopic colitis should include stopping any drugs associated with it. Simple antidiarrheal agents should be tried first to manage symptoms. If symptoms persist, patients can be treated with budesonide (Entocort EC) 9 mg by mouth daily for 8 weeks to induce remission, or 6 mg by mouth daily for 3 months as maintenance therapy.
OUR PATIENT’S COURSE
Our patient’s medication list includes duloxetine, a serotonin-norepinephrine reuptake inhibitor related to drugs that have been associated with the development of microscopic colitis. We tapered the duloxetine, and her symptoms improved by 50%. Her symptoms were eventually controlled after an 8-week course of oral budesonide 9 mg and ongoing intermittent use of loperamide (Imodium).
- Swagerty DL, Walling AD, Klein RM. Lactose intolerance. Am Fam Physician 2002; 65:1845–1856.
- Thomas PD, Forbes A, Green J, et al. Guidelines for the investigation of chronic diarrhea, 2nd edition. Gut 2003; 52(suppl 5):1–5.
- Nelsen DA. Gluten-sensitive enteropathy (celiac disease): more common than you think. Am Fam Physician 2002; 66:2259–2266.
- Bardella MT, Trovato C, Cesana BM, Pagliari C, Gebbia C, Peracchi M. Serological markers for coeliac disease: is it time to change? Dig Liver Dis 2001; 33:426–431.
- Barta Z, Mekkel G, Csipo I, et al. Micropscopic colitis: a retrospective study of clinical presentation in 53 patients. World J Gastroenterol 2005; 11:1351–1355.
- Tremaine WJ. Diagnosing collagenous colitis: does it make a difference? Eur J Gastroenterol Hepatol 1999; 11:477–479.
- Bohr J, Tysk C, Yang P, Danielsson D, Järnerot G. Autoantibodies and immunoglobulins in collagenous colitis. Gut 1996; 39:77–81.
- Zins BJ, Tremaine WJ, Carpenter HA. Collagenous colitis: mucosal biopsies and association with fecal leukocytes. Mayo Clin Proc 1995; 70:430–433.
- Olsen M, Eriksson S, Bohr J, Järnerot G, Tysk C. Lymphocytic colitis: a retrospective clinical study of 199 Swedish patients. Gut 2004; 53:536–541.
- Pardi DS. Microscopic colitis: an update. Inflamm Bowel Dis 2004; 10:860–870.
- Fernandez-Banares F, Salas A, Esteve M, Espinos J, Forne M, Viver JM. Collagenous and lymphocytic colitis: evaluation of clinical and histological features, response to treatment, and long-term follow-up. Am J Gastroenterol 2003; 98:340–347.
- Aignet T, Neureiter D, Müller S, Küspert G, Belke J, Kirchner T. Extracellular matrix composition and gene expression in collagenous colitis. Gastroenterology 1997; 113:136–143.
- Parfitt JR, Driman DK. Pathological effects of drugs on the gastrointestinal tract: a review. Hum Pathol 2007; 38:527–536.
- Fernández-Bañares F, Esteve M, Espinós JC, et al. Drug consumption and the risk of microscopic colitis. Am J Gastroenterol 2007; 102:324–330.
- Thomson RD, Lestine LS, Bensen SP, et al. Lansoprazole-associated microscopic colitis: a case series. Am J Gastroenterol 2002; 97:2908–2913.
- Chande N, McDonald JWD, MacDonald JK. Cochrane Inflammatory Bowel Disease and Functional Bowel Disorders Group. Interventions for treating collagenous colitis. Cochrane Database Syst Rev 2007 Jan 24;(1):CD006096.
- Fine K, Lee E. Efficacy of open-label bismuth subsalicylate for the treatment of microscopic colitis. Gastroenterology 1998; 114:29–36.
- Munck LK, Kjeldsen J, Philipsen E, Fscher Hansen B. Incomplete remission with short-term prednisolone treatment in collagenous colitis: a randomized study. Scand J Gastroenterol 2003; 38:606–610.
- Madisch A, Miehlke S, Eichele E, et al. Boswellia serrata extract for the treatment of collagenous colitis: a randomized, double-blind, placebo-controlled, multicenter trial. Int J Colorectal Dis 2007; 22:1445–1451.
- Wildt S, Munck LK, Vinter-Jensen L, et al. Probiotic treatment of collagenous colitis: a randomized, double-blind, placebo-controlled trial with Lactobacillus acidophilus and Bifidobacterium animalis subsp. lactis. Inflamm Bowel Dis 2006; 12:395–401.
- Calabrese C, Fabbri A, Areni A, Zahlane D, Scialpi C, Di Febo G. Mesalazine with or without cholestyramine in the treatment of microscopic colitis: randomized controlled trial. J Gastroenterol Hepatol 2007; 22:809–814.
- Wall GC, Schirmer LL, Page MJ. Pharmacotherapy for microscopic colitis. Pharmacotherapy 2007; 27:425–433.
- Feyen B, Wall GC, Finnerty EP, DeWitt JE, Reyes RS. Meta-analysis: budesonide treatment for collagenous colitis. Aliment Pharmacol Ther 2004; 20:745–749.
- Madisch A, Heymer P, Voss C, et al. Oral budesonide therapy improves quality of life in patients with collagenous colitis. Int J Colorectal Dis 2005; 20:312–316.
- Craig CR, editor. Modern Pharmacology With Clinical Application. 6th edition. Philadelphia: Lippincott Williams and Wilkins, 2003:481.
- Limsui D, Pardi DS, Camilleri M, et al. Symptomatic overlap between irritable bowel syndrome and microscopic colitis. Inflamm Bowel Dis 2007; 13:175–181.
A medical center is not a hospital
Editor’s note: We are interested in your thoughts on this article. See the Editor-in-Chief’s comments.
I use to be a hospital guy. I was only a few days into my third-year medicine clerkship in medical school nearly three decades ago when I fell in love with the hospital and knew I was going to be an internist. The hospital wasn’t called a medical center back then. It was a fascinating and magical place, where internists were fired in the furnace of rounds, night call, and morning report. I loved the association with the great case, the flush of excitement that accompanied the difficult diagnosis, the hard-earned annual promotion through the hierarchy of trainees seeking the rarefied air of the attending physicians. We bonded as fellow house officers more tightly than with friends outside the hospital. We prowled the wards, intensive care units, emergency room, and laboratories and never slept. The hospital was the most exclusive of clubs, and our training granted us lifelong membership.
A humming beehive of academic activity, the hospital was also a web of powerful social relationships. Everybody knew everybody, from the hospital CEO to the night security officer. The nurses called you by your first name and worked with you for weeks at a time, fostering mutual respect and sometimes even affection. In those days, nurses actually nursed their patients, spoon-feeding them broth with their medications, washing them in bed and bathroom, holding their hands and heads. Patients came to the hospital to be diagnosed and treated until they recovered from whatever illness had felled them. They stayed long enough so that you knew them and their families as well as you knew your own.
I have been a general internist and clinician-educator for 23 years, working in two university hospitals and one community hospital. That’s more than seven generations of house staff with whom I’ve toiled and learned. Somewhere along the way, I became increasingly aware that teaching clinical medicine to students, interns, and residents was getting harder and harder. The patients were sicker and stayed only 3.2 days in the hospital. What we were teaching wasn’t how to diagnose and treat diseases, but how to manage only their most serious complications—the respiratory distress from pneumonia, the ketosis of uncontrolled diabetes, the septic shock from infections. The wards became intensive care units, and the critical care units the province of “intensivists” who were more adept than we were at taming all the machinery and technology. We struggled to keep up with the unending deluge of arcane demands from the accreditation organizations watchdogging our teaching efforts. We pretended that we somehow distinguished teaching rounds from working rounds, and documented the silliness in computer files. Medical education slowly slipped from being a calling to folks like me, finally succumbing to bureaucratic lunacy. The pace of teaching and caring for acutely ill patients became intolerable. Rounds went from the bedside to the classroom to the cell phone. The house staff were getting cheated out of the whole point of residency—the miracle of turning medical students into attending physicians in a little over a thousand days.
Worse, though, was the ebbing of the lifeblood of the hospital. Now the medical center, riddled with “centers of excellence” instead of departments, answered only to administrators who cared nothing about medical education, except for the Medicare dollars they would lose if they cut the training programs. They spent enormous amounts of money marketing the centers of excellence, and they cut everything else to manipulate the bottom line.
The biggest casualty, of course, was the nursing staff. Underpaid, depleted of leadership and morale, they simply disappeared. They were replaced by agency nurses who worked their shifts and didn’t know the doctors or the patients. The complex bedside care of increasingly sick, old, and vulnerable patients was delegated to people with high school equivalency degrees. Nurses now cared for their patients by managing their own support staff, and spent much of their time entering useless information in the computer. The doctor-nurse collaboration I grew up with as a trainee and young attending didn’t exist any-more, and patients suffered as a result.
In 2000, the Institute of Medicine informed the public and the medical community that being a patient in an American hospital was dangerous.1 We were told that at least 44,000 and perhaps as many as 98,000 patients die annually in US hospitals as the result of preventable medical mishaps, more deaths than are attributable yearly to motor vehicle accidents, breast cancer, or AIDS.1 Although there has been an emerging body of literature pertaining to this epidemic, not much has changed, at least not in my hospital. We remain absurdly complacent about rising iatrogenic infection rates, knowing all too well that we are allowing immunocompromised patients to die unnecessarily in our intensive care units. There are alcohol-based hand-washing gels everywhere, but no police or policy with teeth in it to enforce handwashing. We lurch toward physician computer order entry, clinging to the false belief that software programs will prevent adverse drug reactions and delivery of the wrong dangerous drug to the wrong patient. We understaff our pharmacies so that they can’t get the medications to the patients on time or alert us to our own prescribing errors. We burn out our nurses despite years of loyal service. And worst of all, we capitulate to the for-profit insurance industry that informs us they won’t pay for day 4 of Mr. Jones’ hospitalization because he has failed to meet some arbitrary criteria in their manual.
I stepped down as chairman of my department 3 years ago because I couldn’t stand it any longer. I couldn’t stand the management retreats in which we obsessed about “customer service” while the waiting time in the emergency department ballooned to 12 hours because there were “no beds.” There were plenty of beds, but no nurses to staff them. I was marginalized when I protested the budget cycles bleeding out support of medical education in favor of the annual purchase of new scanners and surgical gizmos. I couldn’t get anybody fired up about patient safety.
Retreating to the privacy of clinical medicine, I realized the other day that my real job is not to diagnose, treat, and teach about diseases anymore. My real job is to do everything in my power to keep my patients out of the medical center. I walk the halls now and don’t recognize the institution I grew up in and came to love. Everywhere I look, I see not magic and promise, but dirt and danger.
I’m not a hospital guy anymore.
- Kohn LT, Corrigan JM, Donaldson MS, editors. To Err is Human: Building a Safer Health System. Washington, DC: National Academy Press, 2000.
Editor’s note: We are interested in your thoughts on this article. See the Editor-in-Chief’s comments.
I use to be a hospital guy. I was only a few days into my third-year medicine clerkship in medical school nearly three decades ago when I fell in love with the hospital and knew I was going to be an internist. The hospital wasn’t called a medical center back then. It was a fascinating and magical place, where internists were fired in the furnace of rounds, night call, and morning report. I loved the association with the great case, the flush of excitement that accompanied the difficult diagnosis, the hard-earned annual promotion through the hierarchy of trainees seeking the rarefied air of the attending physicians. We bonded as fellow house officers more tightly than with friends outside the hospital. We prowled the wards, intensive care units, emergency room, and laboratories and never slept. The hospital was the most exclusive of clubs, and our training granted us lifelong membership.
A humming beehive of academic activity, the hospital was also a web of powerful social relationships. Everybody knew everybody, from the hospital CEO to the night security officer. The nurses called you by your first name and worked with you for weeks at a time, fostering mutual respect and sometimes even affection. In those days, nurses actually nursed their patients, spoon-feeding them broth with their medications, washing them in bed and bathroom, holding their hands and heads. Patients came to the hospital to be diagnosed and treated until they recovered from whatever illness had felled them. They stayed long enough so that you knew them and their families as well as you knew your own.
I have been a general internist and clinician-educator for 23 years, working in two university hospitals and one community hospital. That’s more than seven generations of house staff with whom I’ve toiled and learned. Somewhere along the way, I became increasingly aware that teaching clinical medicine to students, interns, and residents was getting harder and harder. The patients were sicker and stayed only 3.2 days in the hospital. What we were teaching wasn’t how to diagnose and treat diseases, but how to manage only their most serious complications—the respiratory distress from pneumonia, the ketosis of uncontrolled diabetes, the septic shock from infections. The wards became intensive care units, and the critical care units the province of “intensivists” who were more adept than we were at taming all the machinery and technology. We struggled to keep up with the unending deluge of arcane demands from the accreditation organizations watchdogging our teaching efforts. We pretended that we somehow distinguished teaching rounds from working rounds, and documented the silliness in computer files. Medical education slowly slipped from being a calling to folks like me, finally succumbing to bureaucratic lunacy. The pace of teaching and caring for acutely ill patients became intolerable. Rounds went from the bedside to the classroom to the cell phone. The house staff were getting cheated out of the whole point of residency—the miracle of turning medical students into attending physicians in a little over a thousand days.
Worse, though, was the ebbing of the lifeblood of the hospital. Now the medical center, riddled with “centers of excellence” instead of departments, answered only to administrators who cared nothing about medical education, except for the Medicare dollars they would lose if they cut the training programs. They spent enormous amounts of money marketing the centers of excellence, and they cut everything else to manipulate the bottom line.
The biggest casualty, of course, was the nursing staff. Underpaid, depleted of leadership and morale, they simply disappeared. They were replaced by agency nurses who worked their shifts and didn’t know the doctors or the patients. The complex bedside care of increasingly sick, old, and vulnerable patients was delegated to people with high school equivalency degrees. Nurses now cared for their patients by managing their own support staff, and spent much of their time entering useless information in the computer. The doctor-nurse collaboration I grew up with as a trainee and young attending didn’t exist any-more, and patients suffered as a result.
In 2000, the Institute of Medicine informed the public and the medical community that being a patient in an American hospital was dangerous.1 We were told that at least 44,000 and perhaps as many as 98,000 patients die annually in US hospitals as the result of preventable medical mishaps, more deaths than are attributable yearly to motor vehicle accidents, breast cancer, or AIDS.1 Although there has been an emerging body of literature pertaining to this epidemic, not much has changed, at least not in my hospital. We remain absurdly complacent about rising iatrogenic infection rates, knowing all too well that we are allowing immunocompromised patients to die unnecessarily in our intensive care units. There are alcohol-based hand-washing gels everywhere, but no police or policy with teeth in it to enforce handwashing. We lurch toward physician computer order entry, clinging to the false belief that software programs will prevent adverse drug reactions and delivery of the wrong dangerous drug to the wrong patient. We understaff our pharmacies so that they can’t get the medications to the patients on time or alert us to our own prescribing errors. We burn out our nurses despite years of loyal service. And worst of all, we capitulate to the for-profit insurance industry that informs us they won’t pay for day 4 of Mr. Jones’ hospitalization because he has failed to meet some arbitrary criteria in their manual.
I stepped down as chairman of my department 3 years ago because I couldn’t stand it any longer. I couldn’t stand the management retreats in which we obsessed about “customer service” while the waiting time in the emergency department ballooned to 12 hours because there were “no beds.” There were plenty of beds, but no nurses to staff them. I was marginalized when I protested the budget cycles bleeding out support of medical education in favor of the annual purchase of new scanners and surgical gizmos. I couldn’t get anybody fired up about patient safety.
Retreating to the privacy of clinical medicine, I realized the other day that my real job is not to diagnose, treat, and teach about diseases anymore. My real job is to do everything in my power to keep my patients out of the medical center. I walk the halls now and don’t recognize the institution I grew up in and came to love. Everywhere I look, I see not magic and promise, but dirt and danger.
I’m not a hospital guy anymore.
- Kohn LT, Corrigan JM, Donaldson MS, editors. To Err is Human: Building a Safer Health System. Washington, DC: National Academy Press, 2000.
- Kohn LT, Corrigan JM, Donaldson MS, editors. To Err is Human: Building a Safer Health System. Washington, DC: National Academy Press, 2000.