User login
Rivaroxaban or aspirin for extended treatment of VTE
TITLE: Low-dose or full-dose rivaroxaban is superior to aspirin for long-term anticoagulation
CLINICAL QUESTION: Is full or lower intensity rivaroxaban better for extended treatment of venous thromboembolism (VTE) as compared to aspirin?
STUDY DESIGN: Multicenter randomized double-blinded phase III trial.
SETTING: 230 Medical centers worldwide in 20 countries.
SYNOPSIS: 3,365 patients with a history of VTE who had undergone 6-12 months of initial anticoagulation therapy and in whom continuation of therapy was thought to be beneficial were enrolled. Patients were randomly assigned to daily high-dose rivaroxaban (20 mg) or daily low-dose rivaroxaban (10 mg) or aspirin (100 mg). After a median of 351 days, symptomatic recurrent VTE or unexplained death occurred in 17 of the 1,107 patients (1.5%) who were assigned to the high-dose group, in 13 of 1,127 patients (1.2%) who were assigned to the low-dose group, and in 50 of 1,131 patients (4.4%) who were assigned to aspirin. Bleeding rates were not significantly different between the three groups (2%-3%). The major limitation of this study is the short duration of follow-up and the lack of power to demonstrate noninferiority of the low-dose as compared to the high-dose regimen for rivaroxaban.
BOTTOM LINE: In patients with a history of VTE, in whom prolonged anticoagulation could be beneficial, low or high-dose rivaroxaban is superior to aspirin in preventing recurrent VTE without increasing bleeding risk.
CITATION: Weitz JI, Lensing MH, Prins R, et al. Rivaroxaban or aspirin for extended treatment of venous thromboembolism. N Engl J Med. 2017; 376:1211-22.
Dr. Mayasy is assistant professor in the department of hospital medicine at the University of New Mexico.
Corticosteroid therapy in Kawasaki disease
Clinical Question
What is the efficacy of corticosteroid therapy in Kawasaki disease?
Background
First described in 1967 in Japan, Kawasaki disease (KD), or mucocutaneous lymph node syndrome, is an acute systemic vasculitis of unclear etiology which primarily affects infants and children. Of significant clinical concern, 30%-50% of untreated patients develop acute coronary artery dilatation, and about one fourth progress to serious coronary artery abnormalities (CAA) such as aneurysm and ectasia.1,2 These patients have a higher risk of long-term complications, such as coronary artery thrombus, myocardial infarction, and sudden death.3 KD is typically treated with a combination of intravenous immunoglobulin (IVIG) and aspirin, which reduces the risk of CAA.1 However, more than 20% of cases are resistant to this conventional therapy and have higher risk of CAA than nonresistant patients.4 Corticosteroids have been suggested as therapy in KD, as the anti-inflammatory effect is useful for many other vasculitides, but studies to date have had conflicting results. This study was performed to comprehensively evaluate the effect of corticosteroids in KD as initial or rescue therapy (after failure to respond to IVIG).
Study design
Systematic review and meta-analysis.
Synopsis
The population of interest was children diagnosed with KD. The intervention of interest was treatment with adjunctive corticosteroids either as initial or rescue therapy. Comparisons were made between the corticosteroids group and the conventional therapy (IVIG) group. Outcome measurements included the incidence of CAA (primary outcome), duration until defervescence, and adverse events. IVIG resistance was defined as persistent or recurrent fever lasting (or relapsed within) 24-48 hours after the initial IVIG treatment.
A total of 681 articles were initially retrieved, and after exclusions, 16 comparative studies were enrolled for meta-analysis. In these studies, a total of 2,746 cases were involved, with 861 in the corticosteroid group and 1,885 in the IVIG group. Ten studies used corticosteroids as initial treatment (comparing this plus IVIG versus IVIG therapy alone), and six used steroids as rescue treatment after initial IVIG failure (comparing corticosteroids with additional IVIG therapy). Four studies enrolled patients with KD who were predicted to have high risk of IVIG resistance, based on published scoring systems. All patients in the studies received oral aspirin.

Overall, this meta-analysis found that adding corticosteroid therapy was associated with a relative risk reduction of 58% in CAA (odds ratio, 0.424; 95% confidence interval, 0.270-0.665; P less than .001). Further analysis showed that the longer the duration of illness prior to corticosteroids, the less of a treatment effect was noticed. The studies using steroids as initial adjunctive therapy had duration of illness 4.7 days prior to treatment, and showed an advantage, compared with IVIG alone, while studies using steroids as rescue therapy had a longer duration of illness prior to steroid therapy (7.2 days), and did not show significant benefit, compared with additional IVIG. In analyzing patients predicted to be at high risk of IVIG resistance at baseline, addition of corticosteroids with IVIG as initial therapy showed a significantly lower risk of CAA development (relative risk reduction of 76%) versus IVIG alone (OR, 0.240; 95% CI, 0.123-0.467; P less than .001). As a secondary outcome, the use of adjunctive corticosteroid therapy was associated with a quicker resolution of fever, compared with IVIG alone (0.66 days vs. 2.18 days). There was no significant difference in adverse events between the two groups.
Although this is the most comprehensive study of corticosteroids in KD, there are some limitations. High-risk patients were found to receive the greatest benefit, but the predictive ability of published scoring systems have not been optimized or generalized to all populations. Most of the studies included in this review were conducted in Japan, so it is uncertain if the results are applicable to other regions. Also, the selection of corticosteroids and treatment regimens were not consistent between studies.
Bottom line
This study suggests that corticosteroids combined with IVIG as initial therapy for KD showed a more protective effect against CAA, compared with conventional IVIG therapy, and the efficacy was more pronounced in the high-risk patient group.
Citation
Chen S, Dong Y, Kiuchi MG, et al. Coronary Artery Complication in Kawasaki Disease and the Importance of Early Intervention: A Systematic Review and Meta-analysis. JAMA Pediatr. 2016;170(12):1156-1163.
References
1. Newburger JW, Takahashi M, Gerber MA, et al. Committee on Rheumatic Fever, Endocarditis and Kawasaki Disease. Council on Cardiovascular Disease in the Young; American Heart Association; American Academy of Pediatrics: diagnosis, treatment, and long-term management of Kawasaki disease. Circulation. 2004;110:2747-71.
2. Daniels LB, Tjajadi MS, Walford HH, et al. Prevalence of Kawasaki disease in young adults with suspected myocardial ischemia. Circulation. 2012;125(20):2447-53.
3. Gordon JB, Kahn AM, Burns JC. When children with Kawasaki disease grow up: myocardial and vascular complications in adulthood. J Am Coll Cardiol. 2009;54(21):1911-20.
4. Tremoulet AH, Best BM, Song S, et al. Resistance to intravenous immunoglobulin in children with Kawasaki disease. J Pediatr. 2008;153(1):117-21.
Dr. Galloway is a pediatric hospitalist at Sanford Children’s Hospital in Sioux Falls, S.D., assistant professor of pediatrics at the University of South Dakota Sanford School of Medicine, and vice chief of the division of hospital pediatrics at USD SSOM and Sanford Children’s Hospital.
Clinical Question
What is the efficacy of corticosteroid therapy in Kawasaki disease?
Background
First described in 1967 in Japan, Kawasaki disease (KD), or mucocutaneous lymph node syndrome, is an acute systemic vasculitis of unclear etiology which primarily affects infants and children. Of significant clinical concern, 30%-50% of untreated patients develop acute coronary artery dilatation, and about one fourth progress to serious coronary artery abnormalities (CAA) such as aneurysm and ectasia.1,2 These patients have a higher risk of long-term complications, such as coronary artery thrombus, myocardial infarction, and sudden death.3 KD is typically treated with a combination of intravenous immunoglobulin (IVIG) and aspirin, which reduces the risk of CAA.1 However, more than 20% of cases are resistant to this conventional therapy and have higher risk of CAA than nonresistant patients.4 Corticosteroids have been suggested as therapy in KD, as the anti-inflammatory effect is useful for many other vasculitides, but studies to date have had conflicting results. This study was performed to comprehensively evaluate the effect of corticosteroids in KD as initial or rescue therapy (after failure to respond to IVIG).
Study design
Systematic review and meta-analysis.
Synopsis
The population of interest was children diagnosed with KD. The intervention of interest was treatment with adjunctive corticosteroids either as initial or rescue therapy. Comparisons were made between the corticosteroids group and the conventional therapy (IVIG) group. Outcome measurements included the incidence of CAA (primary outcome), duration until defervescence, and adverse events. IVIG resistance was defined as persistent or recurrent fever lasting (or relapsed within) 24-48 hours after the initial IVIG treatment.
A total of 681 articles were initially retrieved, and after exclusions, 16 comparative studies were enrolled for meta-analysis. In these studies, a total of 2,746 cases were involved, with 861 in the corticosteroid group and 1,885 in the IVIG group. Ten studies used corticosteroids as initial treatment (comparing this plus IVIG versus IVIG therapy alone), and six used steroids as rescue treatment after initial IVIG failure (comparing corticosteroids with additional IVIG therapy). Four studies enrolled patients with KD who were predicted to have high risk of IVIG resistance, based on published scoring systems. All patients in the studies received oral aspirin.
Overall, this meta-analysis found that adding corticosteroid therapy was associated with a relative risk reduction of 58% in CAA (odds ratio, 0.424; 95% confidence interval, 0.270-0.665; P less than .001). Further analysis showed that the longer the duration of illness prior to corticosteroids, the less of a treatment effect was noticed. The studies using steroids as initial adjunctive therapy had duration of illness 4.7 days prior to treatment, and showed an advantage, compared with IVIG alone, while studies using steroids as rescue therapy had a longer duration of illness prior to steroid therapy (7.2 days), and did not show significant benefit, compared with additional IVIG. In analyzing patients predicted to be at high risk of IVIG resistance at baseline, addition of corticosteroids with IVIG as initial therapy showed a significantly lower risk of CAA development (relative risk reduction of 76%) versus IVIG alone (OR, 0.240; 95% CI, 0.123-0.467; P less than .001). As a secondary outcome, the use of adjunctive corticosteroid therapy was associated with a quicker resolution of fever, compared with IVIG alone (0.66 days vs. 2.18 days). There was no significant difference in adverse events between the two groups.
Although this is the most comprehensive study of corticosteroids in KD, there are some limitations. High-risk patients were found to receive the greatest benefit, but the predictive ability of published scoring systems have not been optimized or generalized to all populations. Most of the studies included in this review were conducted in Japan, so it is uncertain if the results are applicable to other regions. Also, the selection of corticosteroids and treatment regimens were not consistent between studies.
Bottom line
This study suggests that corticosteroids combined with IVIG as initial therapy for KD showed a more protective effect against CAA, compared with conventional IVIG therapy, and the efficacy was more pronounced in the high-risk patient group.
Citation
Chen S, Dong Y, Kiuchi MG, et al. Coronary Artery Complication in Kawasaki Disease and the Importance of Early Intervention: A Systematic Review and Meta-analysis. JAMA Pediatr. 2016;170(12):1156-1163.
References
1. Newburger JW, Takahashi M, Gerber MA, et al. Committee on Rheumatic Fever, Endocarditis and Kawasaki Disease. Council on Cardiovascular Disease in the Young; American Heart Association; American Academy of Pediatrics: diagnosis, treatment, and long-term management of Kawasaki disease. Circulation. 2004;110:2747-71.
2. Daniels LB, Tjajadi MS, Walford HH, et al. Prevalence of Kawasaki disease in young adults with suspected myocardial ischemia. Circulation. 2012;125(20):2447-53.
3. Gordon JB, Kahn AM, Burns JC. When children with Kawasaki disease grow up: myocardial and vascular complications in adulthood. J Am Coll Cardiol. 2009;54(21):1911-20.
4. Tremoulet AH, Best BM, Song S, et al. Resistance to intravenous immunoglobulin in children with Kawasaki disease. J Pediatr. 2008;153(1):117-21.
Dr. Galloway is a pediatric hospitalist at Sanford Children’s Hospital in Sioux Falls, S.D., assistant professor of pediatrics at the University of South Dakota Sanford School of Medicine, and vice chief of the division of hospital pediatrics at USD SSOM and Sanford Children’s Hospital.
Pediatric hospital medicine marches toward subspecialty recognition
Pediatric hospital medicine is moving quickly toward recognition as a board-certified, fellowship-trained medical subspecialty, joining 14 other pediatric subspecialties now certified by the American Board of Pediatrics (ABP).
It was approved as a subspecialty by the American Board of Medical Specialties (ABMS) at its October 2016 board meeting in Chicago in response to a petition from the ABP. Following years of discussion within the field,1 it will take 2 more years to describe pediatric hospital medicine’s specialized knowledge base and write test questions for biannual board exams that are projected to commence in the fall of 2019.

Eventually, starting in 2025, pediatric hospitalists will need to complete a fellowship of 2 years or more if they wish to sit for the exam and become board-certified in the field. But for the next 7 years, hospitalists in current practice will be able to qualify based on their work experience. Maintenance of certification requirements likely will be similar to those in other subspecialties, and doctors certified in pediatric hospital medicine won’t be required to maintain general pediatric certification, Dr. Rauch said.
Formal eligibility criteria have not been set, but likely will include working half-time overall in pediatric-related activities, and quarter-time in clinical practice in pediatric hospital medicine for 4 years prior to qualifying for the exam. How the hours might break down between clinical and other hospital responsibilities, and between pediatric or adult patients, still needs to be determined, Dr. Rauch said. He added that the experiential pathway is likely to be defined broadly, with latitude for determinations based on percentages of time worked, rather than absolute number of hours worked. Local pediatric institutions will be granted latitude to determine how that “plays out” in real world situations, he said, “and an ABP credentialing committee will be available to hear appeals for people who have complicated life circumstances.”

“I was part of a committee that explored these issues. We were an independent group of hospitalists who decided that board certification was a good way to advance the field,” Dr. Quinonez said. “We’ve seen what subspecialty certification has done, for example, for pediatric emergency medicine and pediatric critical care medicine – advancing them tremendously from a research standpoint and helping to develop a distinct body of knowledge reflecting increased severity of illness in hospitalized children.”
Discrepancy between practicing hospitalists, fellowships
An estimated 4,000 pediatric hospitalists now practice in the United States, and 2,100 of those belong to the American Academy of Pediatrics’ Section on Hospital Medicine. There are 40 pediatric hospital medicine fellowship programs listed on the website of AAP’s Section on Hospital Medicine (http://phmfellows.org/phm-programs/), although formal training assessment criteria will be needed for the American College of Graduate Medical Education to recognize programs that qualify their fellows to sit for the PHM exam. A wide gap is anticipated between the demand for pediatric hospitalists and currently available fellowship training slots to generate new candidates for board certification, although Dr. Rauch projects that fellowship slots will double in coming years.
“My message to the field is that historically, board certification has been the launching point for further development of the field,” Dr. Rauch said. “It leads to standardization of who is a subspecialist. Right now, who is a pediatric hospitalist is subject to wide variation. We need to standardize training and to create for this field the same distinction and stature as other medical subspecialties,” he said, noting that subspecialty status also has ramifications for academic settings, and for career advancement and career satisfaction for the individuals who choose to pursue it.
“I know there has been some hue and cry about this in the field, but in most cases certification will not change a pediatric hospitalist’s ability to obtain a job,” he said. “Already, you can’t become a division leader at a children’s hospital without additional training. This isn’t going to change that reality. But for people who don’t want to follow an academic career path, there will never be enough board-certified or fellowship-trained pediatric hospitalists to fill all of the pediatric positions in all the hospitals in the country. Community hospitals aren’t going to say: We won’t hire you unless you are board certified.”
Is the fellowship good for the field?
The subspecialty development process clearly is moving forward. Those in favor believe it will increase scholarship, research, and recognition for the subspecialty by the public for its specialized body of knowledge. But not everyone in the field agrees. Last fall The Hospitalist published3 an opinion piece questioning the need for fellowship-based board certification in pediatric hospital medicine. The author recommended instead retaining the current voluntary approach to fellowships and establishing a pediatric “focused practice” incorporated into residency training, much as the American Board of Internal Medicine and the American Board of Family Medicine have done for hospitalists in adult medicine.

“Will it lead to uncertainty among those currently in residency programs? If you are a pediatric resident and you want to become a board-certified pediatric hospitalist, you’ll need at least 2 years more of training. Is that going to deter qualified individuals?” Dr. Chang said. “The people this decision will impact the most are med-peds doctors – who complete a combined internal medicine and pediatrics residency – and part-timers. They may find themselves in a difficult position if the number of hours don’t add up for them to sit for the boards. For the most part, we’ll have to wait and see for answers to these questions.”
Brian Alverson, MD, FAAP, current chair of the AAP’s Section on Hospital Medicine and associate professor of pediatrics at Brown University, Providence, R.I., says he can see both sides of the debate.

But at the same time, there is a significant opportunity cost for doing 2 more years of fellowship training, Dr. Alverson said.
“We don’t know how much the board certification test will improve actual care,” he noted. “Does it truly identify higher quality doctors, or just doctors who are good at taking multiple choice exams? There are a number of people in pediatrics who do a lot of different things in their jobs, and it’s important that they not lose their ability to practice in the field. Two-thirds of our work force is in community hospitals, not academic medical centers. They work hard to provide the backbone of hospital care for young patients, and many of them are unlikely to ever do a fellowship.”
Nonetheless, Dr. Alverson believes pediatric hospitalists needn’t worry. “You still have plenty of time to figure out what’s going to happen in your hospital,” he said.
References
1. Section on Hospital Medicine. Guiding principles for pediatric hospital medicine program. Pediatrics; 2013; 132:782-786.
2. Stucky E. The Pediatric Hospital Medicine Core Competencies. Wiley-Blackwell; 2010.
3. Feldman LS, Monash B, Eniasivam A. Why required pediatric hospital medicine fellowships are unnecessary. The Hospitalist Magazine, October 8, 2016.
Pediatric hospital medicine is moving quickly toward recognition as a board-certified, fellowship-trained medical subspecialty, joining 14 other pediatric subspecialties now certified by the American Board of Pediatrics (ABP).
It was approved as a subspecialty by the American Board of Medical Specialties (ABMS) at its October 2016 board meeting in Chicago in response to a petition from the ABP. Following years of discussion within the field,1 it will take 2 more years to describe pediatric hospital medicine’s specialized knowledge base and write test questions for biannual board exams that are projected to commence in the fall of 2019.
Eventually, starting in 2025, pediatric hospitalists will need to complete a fellowship of 2 years or more if they wish to sit for the exam and become board-certified in the field. But for the next 7 years, hospitalists in current practice will be able to qualify based on their work experience. Maintenance of certification requirements likely will be similar to those in other subspecialties, and doctors certified in pediatric hospital medicine won’t be required to maintain general pediatric certification, Dr. Rauch said.
Formal eligibility criteria have not been set, but likely will include working half-time overall in pediatric-related activities, and quarter-time in clinical practice in pediatric hospital medicine for 4 years prior to qualifying for the exam. How the hours might break down between clinical and other hospital responsibilities, and between pediatric or adult patients, still needs to be determined, Dr. Rauch said. He added that the experiential pathway is likely to be defined broadly, with latitude for determinations based on percentages of time worked, rather than absolute number of hours worked. Local pediatric institutions will be granted latitude to determine how that “plays out” in real world situations, he said, “and an ABP credentialing committee will be available to hear appeals for people who have complicated life circumstances.”
“I was part of a committee that explored these issues. We were an independent group of hospitalists who decided that board certification was a good way to advance the field,” Dr. Quinonez said. “We’ve seen what subspecialty certification has done, for example, for pediatric emergency medicine and pediatric critical care medicine – advancing them tremendously from a research standpoint and helping to develop a distinct body of knowledge reflecting increased severity of illness in hospitalized children.”
Discrepancy between practicing hospitalists, fellowships
An estimated 4,000 pediatric hospitalists now practice in the United States, and 2,100 of those belong to the American Academy of Pediatrics’ Section on Hospital Medicine. There are 40 pediatric hospital medicine fellowship programs listed on the website of AAP’s Section on Hospital Medicine (http://phmfellows.org/phm-programs/), although formal training assessment criteria will be needed for the American College of Graduate Medical Education to recognize programs that qualify their fellows to sit for the PHM exam. A wide gap is anticipated between the demand for pediatric hospitalists and currently available fellowship training slots to generate new candidates for board certification, although Dr. Rauch projects that fellowship slots will double in coming years.
“My message to the field is that historically, board certification has been the launching point for further development of the field,” Dr. Rauch said. “It leads to standardization of who is a subspecialist. Right now, who is a pediatric hospitalist is subject to wide variation. We need to standardize training and to create for this field the same distinction and stature as other medical subspecialties,” he said, noting that subspecialty status also has ramifications for academic settings, and for career advancement and career satisfaction for the individuals who choose to pursue it.
“I know there has been some hue and cry about this in the field, but in most cases certification will not change a pediatric hospitalist’s ability to obtain a job,” he said. “Already, you can’t become a division leader at a children’s hospital without additional training. This isn’t going to change that reality. But for people who don’t want to follow an academic career path, there will never be enough board-certified or fellowship-trained pediatric hospitalists to fill all of the pediatric positions in all the hospitals in the country. Community hospitals aren’t going to say: We won’t hire you unless you are board certified.”
Is the fellowship good for the field?
The subspecialty development process clearly is moving forward. Those in favor believe it will increase scholarship, research, and recognition for the subspecialty by the public for its specialized body of knowledge. But not everyone in the field agrees. Last fall The Hospitalist published3 an opinion piece questioning the need for fellowship-based board certification in pediatric hospital medicine. The author recommended instead retaining the current voluntary approach to fellowships and establishing a pediatric “focused practice” incorporated into residency training, much as the American Board of Internal Medicine and the American Board of Family Medicine have done for hospitalists in adult medicine.
“Will it lead to uncertainty among those currently in residency programs? If you are a pediatric resident and you want to become a board-certified pediatric hospitalist, you’ll need at least 2 years more of training. Is that going to deter qualified individuals?” Dr. Chang said. “The people this decision will impact the most are med-peds doctors – who complete a combined internal medicine and pediatrics residency – and part-timers. They may find themselves in a difficult position if the number of hours don’t add up for them to sit for the boards. For the most part, we’ll have to wait and see for answers to these questions.”
Brian Alverson, MD, FAAP, current chair of the AAP’s Section on Hospital Medicine and associate professor of pediatrics at Brown University, Providence, R.I., says he can see both sides of the debate.
But at the same time, there is a significant opportunity cost for doing 2 more years of fellowship training, Dr. Alverson said.
“We don’t know how much the board certification test will improve actual care,” he noted. “Does it truly identify higher quality doctors, or just doctors who are good at taking multiple choice exams? There are a number of people in pediatrics who do a lot of different things in their jobs, and it’s important that they not lose their ability to practice in the field. Two-thirds of our work force is in community hospitals, not academic medical centers. They work hard to provide the backbone of hospital care for young patients, and many of them are unlikely to ever do a fellowship.”
Nonetheless, Dr. Alverson believes pediatric hospitalists needn’t worry. “You still have plenty of time to figure out what’s going to happen in your hospital,” he said.
References
1. Section on Hospital Medicine. Guiding principles for pediatric hospital medicine program. Pediatrics; 2013; 132:782-786.
2. Stucky E. The Pediatric Hospital Medicine Core Competencies. Wiley-Blackwell; 2010.
3. Feldman LS, Monash B, Eniasivam A. Why required pediatric hospital medicine fellowships are unnecessary. The Hospitalist Magazine, October 8, 2016.
Hospitalizations may speed up cognitive decline in older adults
LONDON – Older adult patients who already had cognitive decline when they were admitted to a hospital often left with a significantly accelerated rate of decline, according to findings from a large longitudinal cohort study.
The study found up to a 62% acceleration of prehospital cognitive decline after any hospitalization. Urgent or emergency hospitalizations exacted the biggest toll on cognitive health, Bryan James, PhD, said at the Alzheimer’s Association International Conference.
Cognitive decline after hospitalization in older patients is a common occurrence but still poorly understood, he said. “Some data suggest this could actually be seen as a public health crisis since 40% of all hospitalized patients in the U.S. are older than 65, and the risk of past-hospitalization cognitive impairment rises with age.
“Given the risk to cognitive health, older patients, families, and physicians require information on when to admit to the hospital,” Dr. James said. “We wondered if those who decline rapidly after the hospital admission were already declining before. Our second question was whether elective hospital admissions are associated with the same negative cognitive outcomes as nonelective (emergent or urgent) admissions.”
To examine this, Dr. James and his colleagues used patient data from the Rush Memory and Aging Project, which provides each participant with an annual cognitive assessment consisting of 19 neuropsychological tests. They linked these data to each patient’s Medicare claims record, allowing them to assess cognitive function both before and after the index hospitalization.
The cohort comprised 930 patients who were followed for a mean of 5 years. Hospitalized patients were older (81 vs. 79 years). Most patients in both groups had at least one medical condition, such as hypertension, heart disease, diabetes, cancer, thyroid disease, head injury, or stroke. Cognition was already impaired in many of the hospitalized patients; 62% had mild cognitive impairment (MCI) and 35% had dementia. Among the nonhospitalized subjects, 49% had MCI and 24% had dementia.
Of the cohort, 66% experienced a hospitalization during follow-up. Most hospitalizations (57%) were either for urgent or emergency problems. The rest were elective admissions. The main outcome was change in global cognition – an averaged z-score of all 19 tests of working memory, episodic memory, semantic memory, visuospatial processing, and perceptual speed.
Elective admissions were mostly planned surgeries (94%), and unplanned surgeries occurred in 64% of the nonelective admissions. Most of the elective admissions (81%) involved anesthesia, compared with 32% of the nonelective admissions. About 40% of each group required a stay in the intensive care unit. Around 11% in each group had a critical illness – a stroke, hemorrhage, or brain trauma in about 6% of each group.
A multivariate analysis looked at the change in cognition during two time points: 2 years before the index hospitalization and up to 8 years after it. As could be expected of aged subjects in a memory study cohort, most patients experienced a decline in cognition over the study period. However, nonhospitalized patients continued on a smooth linear slope of decline. Hospitalized patients experienced a significant 62% increased rate of decline, even after controlling for age, education, comorbidities, depression, Activities of Daily Living disability, and physical activity.
Visuospatial processing was the only domain not significantly affected by a hospital admission. All of the memory domains, as well as perceptual speed, declined significantly faster after hospitalization than before.
The second analysis examined which type of admission was most dangerous for cognitive health. This controlled for even more potential confounding factors, including length of stay, surgery and anesthesia, Charlson comorbidity index, critical illness, brain injury, and number of hospitalizations during the follow-up period.
Urgent and emergency admissions drove virtually all of the increase in decline, Dr. James said, with a 60% increase in the rate of decline, compared with the prehospitalization rate. Patients who had elective admissions showed no variance from their baseline rate of decline, and, in fact, followed the same slope as nonhospitalized patients. Again, change was seen in the global score and in all the memory domains and perceptual speed. Only visuospatial processing was unaffected.
“It’s unclear why the urgent and emergent admissions drove this finding, even after we controlled for illness and injury severity and other factors,” Dr. James said. “Obviously, we need more research in this area.”
He had no financial disclosures.
[email protected]
On Twitter @alz_gal
AT AAIC 2017
Key clinical point:
Major finding: Urgent or emergency admissions accelerated the rate of cognitive decline by 60%, compared with the prehospitalization rate. Elective admissions did not change the rate of cognitive decline.
Data source: The 930 patients were drawn from the Rush Memory and Aging Project.
Disclosures: The presenter had no financial disclosures.
New tool predicts antimicrobial resistance in sepsis
Use of a clinical decision tree predicted antibiotic resistance in sepsis patients infected with gram-negative bacteria, based on data from 1,618 patients.
Increasing rates of bacterial resistance have “contributed to the unwarranted empiric administration of broad-spectrum antibiotics, further promoting resistance emergence across microbial species,” said M. Cristina Vazquez Guillamet, MD, of the University of New Mexico, Albuquerque, and her colleagues (Clin Infect Dis. cix612. 2017 Jul 10. doi: 10.1093/cid/cix612).
The researchers identified adults with sepsis or septic shock caused by bloodstream infections who were treated at a single center between 2008 and 2015. They developed clinical decision trees using the CHAID algorithm (Chi squared Automatic Interaction Detection) to analyze risk factors for resistance associated with three antibiotics: piperacillin-tazobactam (PT), cefepime (CE), and meropenem (ME).
Overall, resistance rates to PT, CE, and ME were 29%, 22%, and 9%, respectively, and 6.6% of the isolates were resistant to all three antibiotics.
Factors associated with increased resistance risk included residence in a nursing home, transfer from an outside hospital, and prior antibiotics use. Resistance to ME was associated with infection with Pseudomonas or Acinetobacter spp, the researchers noted, and resistance to PT was associated with central nervous system and central venous catheter infections.
Clinical decision trees were able to separate patients at low risk for resistance to PT and CE, as well as those with a risk greater than 30% of resistance to PT, CE, or ME. “We also found good overall agreement between the accuracies of the [multivariable logistic regression] models and the decision tree analyses for predicting antibiotic resistance,” the researchers said.
The findings were limited by several factors, including the use of data from a single center and incomplete reporting of previous antibiotic exposure, the researchers noted. However, the results “provide a framework for how empiric antibiotics can be tailored according to decision tree patient clusters,” they said.
Combining user-friendly clinical decision trees and multivariable logistic regression models may offer the best opportunities for hospitals to derive local models to help with antimicrobial prescription.
The researchers had no financial conflicts to disclose.
FROM CLINICAL INFECTIOUS DISEASES
Key clinical point:
Major finding: The model found prevalence rates for resistance to piperacillin-tazobactam, cefepime, and meropenem of 28.6%, 21.8%, and 8.5%, respectively.
Data source: A review of 1,618 adults with sepsis.
Disclosures: The researchers had no financial conflicts to disclose.
Study: No increased mortality with ACA-prompted readmission declines
Concerns that efforts to reduce 30-day hospital readmission rates under the Affordable Care Act’s Hospital Readmission Reduction Program might lead to unintended increases in mortality rates appear to be unfounded, according to a review of more than 6.7 million hospitalizations for heart failure, acute myocardial infarction, or pneumonia between 2008 and 2014.
In fact, reductions in 30-day readmission rates among Medicare fee-for-service beneficiaries are weakly but significantly correlated with reductions in hospital 30-day mortality rates after discharge, according to Kumar Dharmarajan, MD, of Yale New Haven (Conn.) Health, and colleagues (JAMA 2017 Jul 18;318[3]:270-8. doi: 10.1001/jama.2017.8444).
From 2008 to 2014, the RARRs declined in aggregate across hospitals (–0.053% for heart failure, –0.044% for acute MI, and –0.033% for pneumonia).
“In contrast, monthly aggregate trends across hospitals in 30-day risk-adjusted mortality rates after discharge varied by admitting condition” the investigators said.
For heart failure, acute MI, and pneumonia, there was an increase of 0.008%, a decrease of 0.003%, and an increase of 0.001%, respectively, they said. However, paired monthly trends in 30-day RARRs and 30-day RAMRs after discharge “identified concomitant reduction in readmission and mortality rates within hospitals.”
Correlation coefficients of the paired monthly trends for heart failure, acute MI, and pneumonia in 2008-2014 were 0.066, 0.067, and 0.108, respectively.
“Paired trends in hospital 30-day risk-adjusted readmission rates and both 90-day risk-adjusted mortality rates after discharge and 90-day risk-adjusted mortality rates after the admission date also identified concomitant reductions in readmission and mortality rates within hospitals,” the authors wrote.
The findings “do not support increasing postdischarge mortality related to reducing hospital readmissions,” they concluded.
The authors work under contract with the Centers for Medicare & Medicaid Services to develop and maintain performance measures. Dr. Dharmarajan reported serving as a consultant and scientific advisory board member for Clover Health at the time this research was performed. He is supported by grants from the National Institute on Aging and the American Federation for Aging Research, and the Yale Claude D. Pepper Older Americans Independence Center.
The findings by Dharmarajan and colleagues are “certainly good news,” Karen E. Joynt Maddox, MD, wrote in an editorial.
The study provides support for strategies that hospitals are using to reduce readmissions, and also underscores the importance of evaluating unintended consequences of policy changes such as the Affordable Care Act’s Hospital Readmissions Reduction Program (HRRP), she said (JAMA. 2017 Jul 18;318[3]:243-4).
The study did not address the possibility that attention to reducing readmissions has taken priority over reducing mortality, which could have the unintended consequence of slowing improvements in mortality, she noted, suggesting that for this and other reasons it may be “time to reexamine and reengineer the HRRP to avoid unintended consequences and to ensure that its incentives are fully aligned with the ultimate goal of improving the health outcomes of patients.
“Only with full knowledge of the advantages and disadvantages of a particular policy decision can policy makers and advocates work to craft statutes and rules that maximize benefits while minimizing harms,” she wrote.
Dr. Joynt Maddox is with Brigham and Women’s Hospital, Boston. She is supported by a grant from the National Heart, Lung, and Blood Institute.
Concerns that efforts to reduce 30-day hospital readmission rates under the Affordable Care Act’s Hospital Readmission Reduction Program might lead to unintended increases in mortality rates appear to be unfounded, according to a review of more than 6.7 million hospitalizations for heart failure, acute myocardial infarction, or pneumonia between 2008 and 2014.
In fact, reductions in 30-day readmission rates among Medicare fee-for-service beneficiaries are weakly but significantly correlated with reductions in hospital 30-day mortality rates after discharge, according to Kumar Dharmarajan, MD, of Yale New Haven (Conn.) Health, and colleagues (JAMA 2017 Jul 18;318[3]:270-8. doi: 10.1001/jama.2017.8444).
From 2008 to 2014, the RARRs declined in aggregate across hospitals (–0.053% for heart failure, –0.044% for acute MI, and –0.033% for pneumonia).
“In contrast, monthly aggregate trends across hospitals in 30-day risk-adjusted mortality rates after discharge varied by admitting condition” the investigators said.
For heart failure, acute MI, and pneumonia, there was an increase of 0.008%, a decrease of 0.003%, and an increase of 0.001%, respectively, they said. However, paired monthly trends in 30-day RARRs and 30-day RAMRs after discharge “identified concomitant reduction in readmission and mortality rates within hospitals.”
Correlation coefficients of the paired monthly trends for heart failure, acute MI, and pneumonia in 2008-2014 were 0.066, 0.067, and 0.108, respectively.
“Paired trends in hospital 30-day risk-adjusted readmission rates and both 90-day risk-adjusted mortality rates after discharge and 90-day risk-adjusted mortality rates after the admission date also identified concomitant reductions in readmission and mortality rates within hospitals,” the authors wrote.
The findings “do not support increasing postdischarge mortality related to reducing hospital readmissions,” they concluded.
The authors work under contract with the Centers for Medicare & Medicaid Services to develop and maintain performance measures. Dr. Dharmarajan reported serving as a consultant and scientific advisory board member for Clover Health at the time this research was performed. He is supported by grants from the National Institute on Aging and the American Federation for Aging Research, and the Yale Claude D. Pepper Older Americans Independence Center.
FROM JAMA
Key clinical point:
Major finding: Correlation coefficients of the paired monthly trends for heart failure, acute myocardial infarction, and pneumonia in 2008-2014 were 0.066, 0.067, and 0.108, respectively.
Data source: A retrospective review of more than 6.7 million hospitalized Medicare fee-for-service beneficiaries.
Disclosures: The authors work under contract with the Centers for Medicare & Medicaid Services to develop and maintain performance measures. Dr. Dharmarajan reported serving as a consultant and scientific advisory board member for Clover Health at the time this research was performed. He is supported by grants from the National Institute on Aging and the American Federation for Aging Research, and the Yale Claude D. Pepper Older Americans Independence Center.
High Value Care curriculum reduced echocardiogram ordering
Study Title
The impact of a High Value Care curriculum on rate of repeat of trans-thoracic echocardiogram ordering among medical residents
Background
There is little data to confirm the impact of a High Value Care curriculum on echocardiogram ordering practices in a residency training program. We sought to evaluate the rate of performance of repeat transthoracic echocardiograms (TTE) before and after implementation of a High Vale Care curriculum.
Methods
A High Value Care curriculum was developed for the medical residents at Griffin Hospital, a community hospital, in 2015. The curriculum included a series of lectures aimed at promoting cost-conscious care while maintaining high quality. It also involved house staff in different quality improvement (QI) projects aimed at promoting high value care.
A group of residents decided to work on an initiative to reduce repeat echocardiograms. Repeat echocardiograms were defined as those performed within 6 months of a previous echocardiogram on the same patient. Only results in our EHR reflecting in-patient echocardiograms were utilized.
We retrospectively examined the rates of repeat echocardiograms performed in a 6 month period in 2014 before the High Vale Care curriculum was initiated. We assessed data from a 5 month period in 2016 to determine the rate of repeat electrocardiograms ordered at our institution.
Results
A total of 1,709 echocardiograms were reviewed in both time periods. Of these, 275 were considered repeat. At baseline, or before the implementation of a High Value Care curriculum, we examined 908 echocardiograms that were ordered, of which 21% were repeats.
After the implementation of a High Vale Care curriculum, 801 echocardiograms were ordered. Only 11% of these were repeats. This corresponds to a 52% reduction in the rate of repeated ordering of echocardiograms.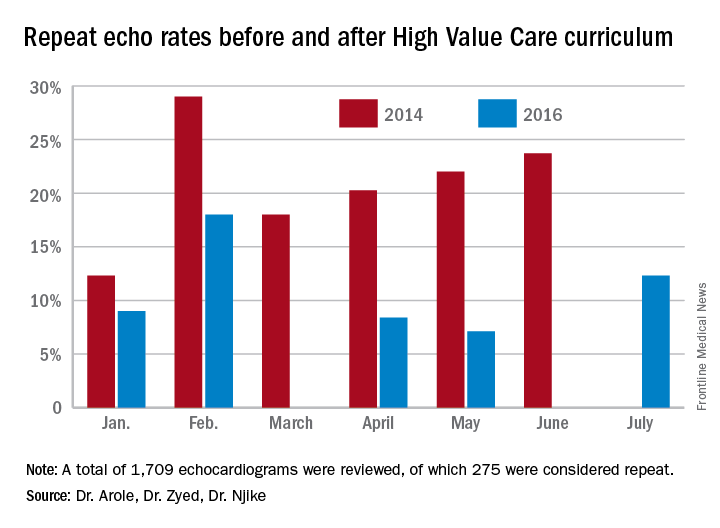
Discussion
The significant improvement in the rate of repeat echocardiograms was noted without any initiative directed specifically at echocardiogram ordering practices. During the planning phases of the proposed QI initiative to reduce repeat echocardiograms, house staff noted that their colleagues were already being more selective in their echocardiogram ordering practices because of the impact of the-cost conscious care lectures they had attended, as well as hospital-wide attention on the first resident-driven QI initiative that was aimed at reducing repetitive daily labs.
As part of the reducing repetitive labs QI, house staff had to provide clear rationale for why they were ordering daily labs. The received regular updates about their lab ordering practices and direct feedback if they consistently did not provide clear rationale for ordering daily labs.

Conclusion
Our study clearly showed a greater than 50% reduction in the ordering of repeat echocardiograms because of a High Value Care curriculum in our residency training program.
The improvement was brought on by increased awareness by house staff regarding provision of high quality care while being cognizant of the costs involved. The reduction in repeat echocardiograms resulted in more efficient use of a limited hospital resource.
Dr. Arole is chief of hospital medicine at Griffin Hospital, Derby, Conn. Dr. Zyed is in the department of internal medicine at Griffin Hospital. Dr. Njike is with the Yale University Prevention Research Center at Griffin Hospital.
Study Title
The impact of a High Value Care curriculum on rate of repeat of trans-thoracic echocardiogram ordering among medical residents
Background
There is little data to confirm the impact of a High Value Care curriculum on echocardiogram ordering practices in a residency training program. We sought to evaluate the rate of performance of repeat transthoracic echocardiograms (TTE) before and after implementation of a High Vale Care curriculum.
Methods
A High Value Care curriculum was developed for the medical residents at Griffin Hospital, a community hospital, in 2015. The curriculum included a series of lectures aimed at promoting cost-conscious care while maintaining high quality. It also involved house staff in different quality improvement (QI) projects aimed at promoting high value care.
A group of residents decided to work on an initiative to reduce repeat echocardiograms. Repeat echocardiograms were defined as those performed within 6 months of a previous echocardiogram on the same patient. Only results in our EHR reflecting in-patient echocardiograms were utilized.
We retrospectively examined the rates of repeat echocardiograms performed in a 6 month period in 2014 before the High Vale Care curriculum was initiated. We assessed data from a 5 month period in 2016 to determine the rate of repeat electrocardiograms ordered at our institution.
Results
A total of 1,709 echocardiograms were reviewed in both time periods. Of these, 275 were considered repeat. At baseline, or before the implementation of a High Value Care curriculum, we examined 908 echocardiograms that were ordered, of which 21% were repeats.
After the implementation of a High Vale Care curriculum, 801 echocardiograms were ordered. Only 11% of these were repeats. This corresponds to a 52% reduction in the rate of repeated ordering of echocardiograms.
Discussion
The significant improvement in the rate of repeat echocardiograms was noted without any initiative directed specifically at echocardiogram ordering practices. During the planning phases of the proposed QI initiative to reduce repeat echocardiograms, house staff noted that their colleagues were already being more selective in their echocardiogram ordering practices because of the impact of the-cost conscious care lectures they had attended, as well as hospital-wide attention on the first resident-driven QI initiative that was aimed at reducing repetitive daily labs.
As part of the reducing repetitive labs QI, house staff had to provide clear rationale for why they were ordering daily labs. The received regular updates about their lab ordering practices and direct feedback if they consistently did not provide clear rationale for ordering daily labs.
Conclusion
Our study clearly showed a greater than 50% reduction in the ordering of repeat echocardiograms because of a High Value Care curriculum in our residency training program.
The improvement was brought on by increased awareness by house staff regarding provision of high quality care while being cognizant of the costs involved. The reduction in repeat echocardiograms resulted in more efficient use of a limited hospital resource.
Dr. Arole is chief of hospital medicine at Griffin Hospital, Derby, Conn. Dr. Zyed is in the department of internal medicine at Griffin Hospital. Dr. Njike is with the Yale University Prevention Research Center at Griffin Hospital.
What is the best approach for managing CIED infections?
The case
A 72-year-old man with ischemic cardiomyopathy and left-ventricular ejection fraction of 15% had an cardioverter-defibrillator implanted five years ago for primary prevention of sudden cardiac death. He was brought to the emergency department by his daughter who noticed erythema and swelling over the generator pocket site. His temperature is 100.1° F. Vital signs are otherwise normal and stable.
What are the best initial and definitive management strategies for this patient?

When should a cardiac implanted electronic device (CIED) infection be suspected?
CIED infections generally present in one of two ways: as a local generator pocket infection or as a systemic illness.1 Around 70% of CIED infections present with findings related to the generator pocket site. Findings in such cases include pain, swelling, erythema, induration, and ulceration. Systemic findings range from vague constitutional symptoms to overt sepsis. It is important to note that systemic signs of infection are only present in the minority of cases. Their absence does not rule out a CIED infection.1,2 As such, hospitalists must maintain a high index of suspicion in order to avoid missing the diagnosis.
Unfortunately, it can be difficult to distinguish between a CIED infection and less severe postimplantation complications such as surgical site infections, superficial pocket site infections, and noninfected hematoma.2
What are the risk factors for CIED infections?
The risk factors for CIED infection fit into three broad categories: procedure, patient, and pathogen.
Procedural factors that increase risk of infection include lack of periprocedural antimicrobial prophylaxis, inexperienced physician operator, multiple revision procedures, hematoma formation at the pocket site, and increased amount of hardware.1
Patient factors center on medical comorbidities, including congestive heart failure, diabetes mellitus, chronic kidney disease, immunosuppression, and ongoing oral anticoagulation.1
The specific pathogen also plays a role in infection risk. In one cohort study of 1,524 patients with CIEDs, patients with Staphylococcus aureus bacteremia ended up having confirmed or suspected CIED infections in 54.6% of cases, compared with just 12.0% of patients who had bacteremia with gram-negative bacilli.3
Which bacteria cause most CIED infections?
The vast majority of CIED infections are caused by gram-positive bacteria.1,4 An Italian study of 1,204 patients with CIED infection reported that pathogens isolated from extracted leads were gram-positive bacteria in 92.5% of infections.4 Staph species are the most common pathogens. Coagulase-negative staphylococcus and Staphylococcus aureus accounted for 69% and 13.8% of all isolates, respectively. Of note, 33% of CoNS isolates and 13% of S. aureus isolates were resistant to oxacillin in that study.4
Which initial diagnostic tests should be performed?
Patients should have two sets of blood cultures drawn from two separate sites, prior to administration of antibiotics.1 Current guidelines recommend against aspiration of a suspected infected pocket site because the sensitivity for identifying the causal pathogen is low while the risk of introducing infection to the generator pocket is substantial.1 In the event of CIED removal, pocket tissue and lead tips should be sent for gram stain and culture.1
Do all patients require a transesophageal echocardiogram?
Guidelines recommend a transesophageal echocardiogram (TEE) if suspicion for CIED infection is high based on positive blood cultures, antibiotic initiation prior to culture collection, ongoing systemic illness, or other suggestive signs.1,2 Positive transthoracic echocardiogram findings (for example, a valve vegetation) do not obviate the need for TEE because of the possibility of other relevant complications (including endocarditis and perivalvular extension) for which TEE has a greater sensitivity.1
What is the approach to antimicrobial therapy?
Since most infections involve staphylococcus species, initial empiric antimicrobial therapy should cover both oxacillin-sensitive and oxacillin-resistant strains. Thus, intravenous vancomycin is an appropriate initial choice.1 Culture and sensitivity results should then guide specific therapy decisions.1 Table 1 provides a summary of strategies for antimicrobial selection and duration.
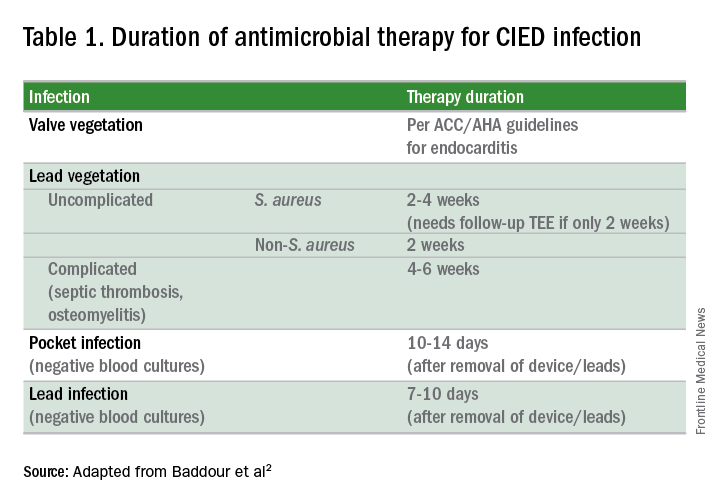
Should all patients undergo complete device removal?
All patients with CIED infection require complete device removal, even if the infection is suspected to be confined to the generator pocket and blood cultures remain negative.2 Patients with superficial or surgical site infections without CIED infection do not require complete device removal. Rather, those cases can be managed with a 7- to 10-day course of oral antimicrobials.1
After device removal, what is the appropriate timing for installing a new device?
The decision to implant a replacement device is often made with input from infectious disease and cardiac electrophysiology experts. The decision must consider both infection and device-related concerns. Importantly, repeat blood cultures must be negative, and any infection in the pocket site should be controlled prior to installing a new device.2
Should all patients with a CIED receive antimicrobial prophylaxis prior to invasive dental, urologic, or endoscopic procedures?
No. Merely having a CIED is not considered an indication for antimicrobial prophylaxis.2
Back to the case
Two sets of blood cultures are drawn, and vancomycin is started as empiric therapy. The culture results show CoNS species, and antimicrobial resistance testing shows oxacillin-resistance.
TEE shows a vegetation on one of the leads but no vegetation on any of the heart valves. Cardiac electrophysiology is consulted and performs a percutaneous extraction of the entire device (generator and leads). Starting on the day of extraction, the patient undergoes two weeks of intravenous antimicrobial therapy with vancomycin. The patient, his family, and the electrophysiology team discuss the patient’s wishes, indications, and potential burdens related to device replacement.
He ultimately decides to have a replacement device installed. An infectious disease specialist is consulted to help define appropriate timing of the new device installation procedure.
Bottom line
The patient clearly had a CIED infection which required TEE, extraction of his CIED, and prolonged antimicrobial therapy.
Dr. Davisson is a primary care physician at Community Health Network in Indianapolis, Ind. Dr. Lockwood is a hospitalist at the Lexington VA Medical Center. Dr. Sweigart is a hospitalist at the University of Kentucky, Lexington, and the Lexington VA Medical Center.
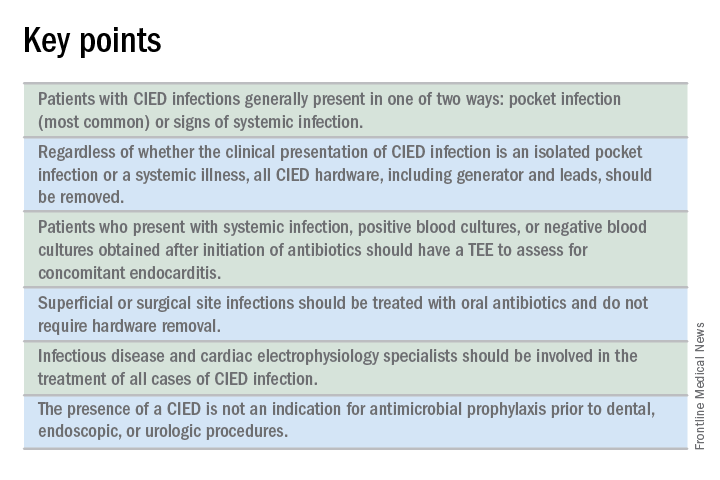
References
1. Baddour LM, Epstein AE, Erickson CC, et al. Update on Cardiovascular Implantable Electronic Device Infections and Their Management: A Scientific Statement From the American Heart Association. Circulation. 2010;121(3):458-77.
2. Baddour LM, Cha YM, Wilson WR. Infections of Cardiovascular Implantable Electronic Devices. N Engl J Med. 2012;367(9):842-9.
3. Uslan DZ, Sohail MR, St. Sauver JL, et al. Permanent Pacemaker and Implantable Cardioverter Defibrillator Infection: A Population-Based Study. Arch Intern Med. 2007;167(7):669-75.
4. Bongiorni MG, Tascini C, Tagliaferri E, et al. Microbiology of Cardiac Implantable Electronic Device Infections. Europace. 2012;14(9):1334-9.
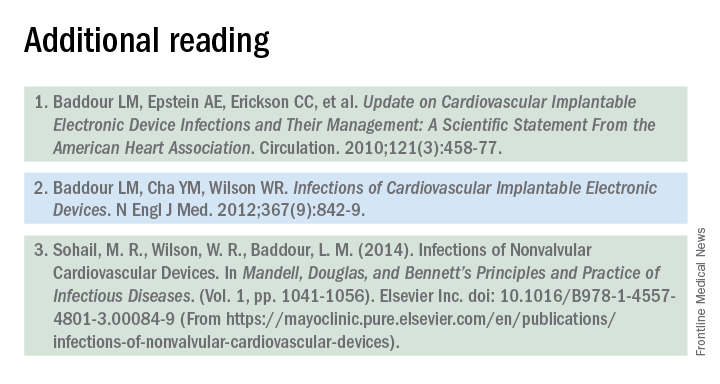
The case
A 72-year-old man with ischemic cardiomyopathy and left-ventricular ejection fraction of 15% had an cardioverter-defibrillator implanted five years ago for primary prevention of sudden cardiac death. He was brought to the emergency department by his daughter who noticed erythema and swelling over the generator pocket site. His temperature is 100.1° F. Vital signs are otherwise normal and stable.
What are the best initial and definitive management strategies for this patient?
When should a cardiac implanted electronic device (CIED) infection be suspected?
CIED infections generally present in one of two ways: as a local generator pocket infection or as a systemic illness.1 Around 70% of CIED infections present with findings related to the generator pocket site. Findings in such cases include pain, swelling, erythema, induration, and ulceration. Systemic findings range from vague constitutional symptoms to overt sepsis. It is important to note that systemic signs of infection are only present in the minority of cases. Their absence does not rule out a CIED infection.1,2 As such, hospitalists must maintain a high index of suspicion in order to avoid missing the diagnosis.
Unfortunately, it can be difficult to distinguish between a CIED infection and less severe postimplantation complications such as surgical site infections, superficial pocket site infections, and noninfected hematoma.2
What are the risk factors for CIED infections?
The risk factors for CIED infection fit into three broad categories: procedure, patient, and pathogen.
Procedural factors that increase risk of infection include lack of periprocedural antimicrobial prophylaxis, inexperienced physician operator, multiple revision procedures, hematoma formation at the pocket site, and increased amount of hardware.1
Patient factors center on medical comorbidities, including congestive heart failure, diabetes mellitus, chronic kidney disease, immunosuppression, and ongoing oral anticoagulation.1
The specific pathogen also plays a role in infection risk. In one cohort study of 1,524 patients with CIEDs, patients with Staphylococcus aureus bacteremia ended up having confirmed or suspected CIED infections in 54.6% of cases, compared with just 12.0% of patients who had bacteremia with gram-negative bacilli.3
Which bacteria cause most CIED infections?
The vast majority of CIED infections are caused by gram-positive bacteria.1,4 An Italian study of 1,204 patients with CIED infection reported that pathogens isolated from extracted leads were gram-positive bacteria in 92.5% of infections.4 Staph species are the most common pathogens. Coagulase-negative staphylococcus and Staphylococcus aureus accounted for 69% and 13.8% of all isolates, respectively. Of note, 33% of CoNS isolates and 13% of S. aureus isolates were resistant to oxacillin in that study.4
Which initial diagnostic tests should be performed?
Patients should have two sets of blood cultures drawn from two separate sites, prior to administration of antibiotics.1 Current guidelines recommend against aspiration of a suspected infected pocket site because the sensitivity for identifying the causal pathogen is low while the risk of introducing infection to the generator pocket is substantial.1 In the event of CIED removal, pocket tissue and lead tips should be sent for gram stain and culture.1
Do all patients require a transesophageal echocardiogram?
Guidelines recommend a transesophageal echocardiogram (TEE) if suspicion for CIED infection is high based on positive blood cultures, antibiotic initiation prior to culture collection, ongoing systemic illness, or other suggestive signs.1,2 Positive transthoracic echocardiogram findings (for example, a valve vegetation) do not obviate the need for TEE because of the possibility of other relevant complications (including endocarditis and perivalvular extension) for which TEE has a greater sensitivity.1
What is the approach to antimicrobial therapy?
Since most infections involve staphylococcus species, initial empiric antimicrobial therapy should cover both oxacillin-sensitive and oxacillin-resistant strains. Thus, intravenous vancomycin is an appropriate initial choice.1 Culture and sensitivity results should then guide specific therapy decisions.1 Table 1 provides a summary of strategies for antimicrobial selection and duration.
Should all patients undergo complete device removal?
All patients with CIED infection require complete device removal, even if the infection is suspected to be confined to the generator pocket and blood cultures remain negative.2 Patients with superficial or surgical site infections without CIED infection do not require complete device removal. Rather, those cases can be managed with a 7- to 10-day course of oral antimicrobials.1
After device removal, what is the appropriate timing for installing a new device?
The decision to implant a replacement device is often made with input from infectious disease and cardiac electrophysiology experts. The decision must consider both infection and device-related concerns. Importantly, repeat blood cultures must be negative, and any infection in the pocket site should be controlled prior to installing a new device.2
Should all patients with a CIED receive antimicrobial prophylaxis prior to invasive dental, urologic, or endoscopic procedures?
No. Merely having a CIED is not considered an indication for antimicrobial prophylaxis.2
Back to the case
Two sets of blood cultures are drawn, and vancomycin is started as empiric therapy. The culture results show CoNS species, and antimicrobial resistance testing shows oxacillin-resistance.
TEE shows a vegetation on one of the leads but no vegetation on any of the heart valves. Cardiac electrophysiology is consulted and performs a percutaneous extraction of the entire device (generator and leads). Starting on the day of extraction, the patient undergoes two weeks of intravenous antimicrobial therapy with vancomycin. The patient, his family, and the electrophysiology team discuss the patient’s wishes, indications, and potential burdens related to device replacement.
He ultimately decides to have a replacement device installed. An infectious disease specialist is consulted to help define appropriate timing of the new device installation procedure.
Bottom line
The patient clearly had a CIED infection which required TEE, extraction of his CIED, and prolonged antimicrobial therapy.
Dr. Davisson is a primary care physician at Community Health Network in Indianapolis, Ind. Dr. Lockwood is a hospitalist at the Lexington VA Medical Center. Dr. Sweigart is a hospitalist at the University of Kentucky, Lexington, and the Lexington VA Medical Center.
References
1. Baddour LM, Epstein AE, Erickson CC, et al. Update on Cardiovascular Implantable Electronic Device Infections and Their Management: A Scientific Statement From the American Heart Association. Circulation. 2010;121(3):458-77.
2. Baddour LM, Cha YM, Wilson WR. Infections of Cardiovascular Implantable Electronic Devices. N Engl J Med. 2012;367(9):842-9.
3. Uslan DZ, Sohail MR, St. Sauver JL, et al. Permanent Pacemaker and Implantable Cardioverter Defibrillator Infection: A Population-Based Study. Arch Intern Med. 2007;167(7):669-75.
4. Bongiorni MG, Tascini C, Tagliaferri E, et al. Microbiology of Cardiac Implantable Electronic Device Infections. Europace. 2012;14(9):1334-9.
Plasma biomarker distinguishes ARDS, acute heart failure
WASHINGTON – Plasma levels of an interleukin-33 receptor that’s involved in inflammation regulation appeared able to discriminate between acute respiratory distress syndrome and acute decompensated heart failure in an analysis with 72 patients.
In a second study, high plasma levels of the same interleukin-33 receptor, known as soluble suppressor of tumorgenicity 2 (sST2), identified acute respiratory distress syndrome (ARDS) patients who were sicker and more responsive to conservative fluid management, Sean D. Levy, MD, said at an international conference of the American Thoracic Society.
In order to assess the ability of sST2 to reliably distinguish patients with ARDS from those with acute decompensated heart failure, he and his associates selected 72 patients seen at the Massachusetts General Hospital in Boston with an initial diagnosis of acute decompensated heart failure accompanied by bilateral lung infiltrates and acute hypoxemia respiratory failure requiring endotracheal intubation and mechanical ventilation. The investigators measured the sST2 level in a plasma specimen from each patient. In addition, after each patient either left the hospital or died, their case underwent review by two critical care physicians who retrospectively rediagnosed the patients as either having ARDS or acute decompensated heart failure. This divided the cohort into 30 patients with ARDS and 42 with true acute heart failure. The two subgroups matched up fairly closely for most clinical measures and comorbidities, but APACHE III (Acute Physiology and Chronic Health Evaluation III) scores averaged significantly higher in the ARDS patients.
The plasma levels of sST2 showed a dramatic split between the two subgroups. The 30 patients retrospectively diagnosed with ARDS had an average level of 386 ng/mL with an interquartile range of 318-611 ng/mL. The 42 acute decompensated heart failure patients averaged a sST2 level of 148 ng/mL, with an interquartile range of 84-225 ng/mL. The area under the receiver operator curve for discriminating between ARDS and acute heart failure using a cutpoint of 271 mg/mL was 0.86, showing “good” discrimination, Dr. Levy said. This cutpoint had a sensitivity of 83% and specificity of 88% for correctly distinguishing between ARDS and acute heart failure.
In a second analysis, Dr. Levy and his associates looked at the ability of sST2 levels to separate out patients with acute lung injury who had a more robust response to either the conservative or liberal fluid-management strategies tested in the Fluid and Catheter Treatment Trial (FACTT), run by the National Heart, Lung, and Blood Institute’s ARDS Clinical Trials Network. The primary outcome of FACTT was death from any cause 60 days after entry, and this showed no significant difference between conservative (restricted fluids and increased urine output) and liberal (the reverse) fluid management strategies in acute lung injury patients (N Engl J Med. 2006 Jun 15;354[14]:2564-75). From among the 1,001 patients enrolled in FACTT, 826 had specimens available for measuring sST2 (Crit Care Med. 2013 Nov;41[11]:2521-31),
The researchers applied the sST2 cut point they derived in the first analysis to the FACTT cohort and identified 133 (16%) patients with a low sST2 level and 693 (84%) with a high level. The patients with high sST2 were sicker, with significantly higher APACHE III scores, worse acidemia, and worse renal function.
Patients with high sST2 levels had a significant increase in ventilator-free days on conservative fluid management, compared with liberal management, while the two management strategies produced virtually identical results in the patients with low levels of sST2. Patients with high sST2 also had a significantly quicker time to extubation on a conservative strategy compared with the liberal strategy, and again this correlation did not exist among patients with low sST2. However, as in the overall trial a conservative strategy had no discernible impact on 60-day mortality, compared with the liberal strategy, even in the subgroup with high sST2.
Dr. Levy had no disclosures.
[email protected]
On Twitter @mitchelzoler
AT ATS 2017
Key clinical point:
Major finding: An sST2 cutpoint of 271 ng/mL discriminated between ARDS and acute heart failure with 83% sensitivity and 88% specificity.
Data source: Review of 72 patients admitted for acute decompensated heart failure at one U.S. center.
Disclosures: Dr. Levy had no disclosures.
The role of NPs and PAs in hospital medicine programs
Background and growth
Hospitalist nurse practitioner (NP) and physician assistant (PA) providers have been a growing and evolving part of the inpatient medical workforce, seemingly since the inception of hospital medicine. Given the growth of these disciplines within hospital medicine, at this juncture it is helpful to look at this journey, to see what roles these providers have been serving, and to consider newer and novel trends in how NPs and PAs are being weaved into hospital medicine programs.
The drivers for growth in this provider population are not unlike those of physician hospitalists. The same milieu that provided inroads for physicians in hospital-based care have led the way for increased use of NP/PA providers. An aging physician workforce, residency work hour reforms, increasing complexity of patients and systems on the inpatient side, and the recognition that caring for inpatients is a specialty vastly different from the role of internist in primary care have all impacted the numbers of NPs and PAs in this arena.

• 2007 Today’s Hospitalist article: “Midlevels make a rocky entrance into hospital medicine”1
• 2009 ACP Hospitalist article: “When hiring midlevels, proceed with caution”2
These titles reflect the uncertainty at the time in how best to utilize NP/PA providers in hospital medicine (as well as an unfashionable vocabulary). The numbers at the time tell a similar story. In the Society of Hospital Medicine survey in 2007-2008, about 29% and 21% of hospital medicine practices utilized NPs and PAs, respectively. However, by 2014 about 50% of Veterans Affairs inpatient medical services deployed NP/PA providers, and most recent data from the Society of Hospital Medicine reveal that about 63% of groups use these advanced practice providers (APPs), with higher numbers in pediatric programs. Clearly there is evolving growth and enthusiasm for NP/PAs in hospital medicine.
Program models
Determining how best to use NP/PAs in hospital medicine programs has had a similar evolution. Reviewing past articles addressing these issues, one can see that there has been clear migration; initially NP/PAs were primarily hired to assist with late-afternoon admission surges, with about 60% of the APP workload being utilized to admit in 2007. Their role has continued to grow and change, much as hospitalist practices have; current program models consist of a few major types, with some novel models coming to the fore.

Another model is use of an NP/PA in an observation unit or with lower acuity observation patients. The majority of the management of the patients is completed and billed by the APP, with the physician available for backup. This hits the “sweet spot,” utilizing the right provider with the right skill set for the right patient. The program has to account for some reimbursement or compensation for the physician oversight time, but it is a very efficient use of APPs.
The third major deployment of APPs is with admissions. Many groups use APPs to admit into the late afternoon and evening, getting patients “tucked in,” including starting diagnostic work-ups and treatment plans. The physician hospitalist then evaluates the patient the next day and often bills for the admission. This model works in situations where the patient work-up is dependent on lab testing, imaging, or other diagnostic testing to understand and plan for the “arc” of the hospitalization; or in situations where the diagnosis is clear, but the patient needs time with treatment to determine response. The downside of this model is long-term job satisfaction for the APP (although some programs have them rotate through such a model at intervals).
Another area where APPs have made strong inroads is that of comanagement services. The NP or PA develops a long-term relationship with a surgical comanagement team, and is often highly engaged and extremely appreciated for managing chronic conditions such as hypertension and diabetes. This can be a very satisfying model for both teams. The NP/PA usually bills independently for these encounters.
APPS are also used in cross coverage and triage roles, allowing the day teams to focus on their primary patients. In a triage role, they can interface with the emergency department, providing a semi-neutral “mediator” for patient disposition.
On the more novel end of the spectrum, there is growth in more independent roles for APP hospitalists. Some groups are having success at using the paired rounding or dyad model, but having the physician see the patient every third day. This is most successful where there is strong onboarding and deep clarity for when to contact the backup physician. There are some data to support the effectiveness of this model, most recently in the Journal of Clinical Outcomes Management.3
Critical access hospitals are also having success in deploying APPs in a very independent role, staffing these hospitals at night. Smaller, rural hospitals with aging medical staff have learned to maximize the scope of practice of their APPs to remain viable and provide care for inpatients. This can be a very successful model for APPs working at the maximum scope of their practice. In addition, the use of telemedicine has been implemented to allow for remote physician backup. This may be a rapidly growing arm to hospital medicine practices in the future.
Ongoing barriers
There are many barriers to maximizing the scope of practice and efficiency of APPs in hospital medicine. They range from the “macro” to the “micro.”
On the larger stage, Medicare requires that home care orders be signed by an attending physician, which can be inefficient and difficult to accomplish. Other payers may have somewhat arcane statutes that limit billing practices, and state practice limitations vary widely. Although 22 states now allow for independent practice for NPs, other states may have a very restrictive practice environment that can impede creative care delivery models. But regardless of how liberal a practice the state allows, a hospital’s medical bylaws can still restrict the day-to-day practice of APPs. And those restrictive bylaws are emblematic of a more constant and corporeal barrier to APP practice, that of medical staff culture.
If there are physicians on the staff who fear that utilization of NP/PA providers will lead to a decay in the quality of care, or who feel threatened by the use of APPs, that can create a local stopgap to maximizing utilization of APPs. In addition, hospitalist physicians and leaders may lack knowledge or experience in APP practice. APPs take more time to successfully onboard than physicians; without clear expectations or road maps to accomplish this onboarding, leaders may feel that APP integration doesn’t work. And one bad experience can create long-term barriers for future practices.
Other barriers are the lack of standardized rigor and vigor in graduate education programs (in both educational and clinical experiences). This results in variation in the quality of NP/PA providers at graduation. Knowledge gaps may be perceived as incompetence, rather than just a lack of experience. There is a certificate for added qualification in hospital medicine for PA providers (which includes a specialty exam), and there is an acute care focus for NPs in training; however, there is no standardized licensure to ensure hospital medicine competency, creating a quagmire for hospitalist leaders who desire demonstrable competence of these providers.
Another barrier for some programs is financial; physicians may not want to give up their RVUs to an NP/PA provider. This can really inhibit a more independent role for the APP. It is important that financial incentives align with all members of the practice working at maximum scope.
Summary and future
In summary, the role of PA/NP in hospital medicine has continued to grow and evolve, to meet the needs of the industry. This includes an increase in the scope and independence of APPs, including the use of telehealth for required oversight. As a specialty, it is imperative that we continue to research APP model effectiveness, embrace innovative delivery models, and support effective onboarding and career development opportunities for our NP/PA providers.
Dr. Scheurer is a hospitalist and chief quality officer at the Medical University of South Carolina in Charleston. She is physician editor of The Hospitalist. Ms. Cardin is vice president, Advanced Practice Providers, at Sound Physicians, and is a member of SHM’s Board of Directors.
References
1. “Midlevels make a rocky entrance into hospital medicine,” by Bonnie Darves, Today’s Hospitalist, January 2007.
2. “When hiring midlevels, proceed with caution,” by Jessica Berthold, ACP Hospitalist, April 2009.
3. “A Comparison of Conventional and Expanded Physician Assistant Hospitalist Staffing Models at a Community Hospital,” J Clin Outcomes Manag. 2016 Oct 1;23[10]:455-61.
Background and growth
Hospitalist nurse practitioner (NP) and physician assistant (PA) providers have been a growing and evolving part of the inpatient medical workforce, seemingly since the inception of hospital medicine. Given the growth of these disciplines within hospital medicine, at this juncture it is helpful to look at this journey, to see what roles these providers have been serving, and to consider newer and novel trends in how NPs and PAs are being weaved into hospital medicine programs.
The drivers for growth in this provider population are not unlike those of physician hospitalists. The same milieu that provided inroads for physicians in hospital-based care have led the way for increased use of NP/PA providers. An aging physician workforce, residency work hour reforms, increasing complexity of patients and systems on the inpatient side, and the recognition that caring for inpatients is a specialty vastly different from the role of internist in primary care have all impacted the numbers of NPs and PAs in this arena.
• 2007 Today’s Hospitalist article: “Midlevels make a rocky entrance into hospital medicine”1
• 2009 ACP Hospitalist article: “When hiring midlevels, proceed with caution”2
These titles reflect the uncertainty at the time in how best to utilize NP/PA providers in hospital medicine (as well as an unfashionable vocabulary). The numbers at the time tell a similar story. In the Society of Hospital Medicine survey in 2007-2008, about 29% and 21% of hospital medicine practices utilized NPs and PAs, respectively. However, by 2014 about 50% of Veterans Affairs inpatient medical services deployed NP/PA providers, and most recent data from the Society of Hospital Medicine reveal that about 63% of groups use these advanced practice providers (APPs), with higher numbers in pediatric programs. Clearly there is evolving growth and enthusiasm for NP/PAs in hospital medicine.
Program models
Determining how best to use NP/PAs in hospital medicine programs has had a similar evolution. Reviewing past articles addressing these issues, one can see that there has been clear migration; initially NP/PAs were primarily hired to assist with late-afternoon admission surges, with about 60% of the APP workload being utilized to admit in 2007. Their role has continued to grow and change, much as hospitalist practices have; current program models consist of a few major types, with some novel models coming to the fore.
Another model is use of an NP/PA in an observation unit or with lower acuity observation patients. The majority of the management of the patients is completed and billed by the APP, with the physician available for backup. This hits the “sweet spot,” utilizing the right provider with the right skill set for the right patient. The program has to account for some reimbursement or compensation for the physician oversight time, but it is a very efficient use of APPs.
The third major deployment of APPs is with admissions. Many groups use APPs to admit into the late afternoon and evening, getting patients “tucked in,” including starting diagnostic work-ups and treatment plans. The physician hospitalist then evaluates the patient the next day and often bills for the admission. This model works in situations where the patient work-up is dependent on lab testing, imaging, or other diagnostic testing to understand and plan for the “arc” of the hospitalization; or in situations where the diagnosis is clear, but the patient needs time with treatment to determine response. The downside of this model is long-term job satisfaction for the APP (although some programs have them rotate through such a model at intervals).
Another area where APPs have made strong inroads is that of comanagement services. The NP or PA develops a long-term relationship with a surgical comanagement team, and is often highly engaged and extremely appreciated for managing chronic conditions such as hypertension and diabetes. This can be a very satisfying model for both teams. The NP/PA usually bills independently for these encounters.
APPS are also used in cross coverage and triage roles, allowing the day teams to focus on their primary patients. In a triage role, they can interface with the emergency department, providing a semi-neutral “mediator” for patient disposition.
On the more novel end of the spectrum, there is growth in more independent roles for APP hospitalists. Some groups are having success at using the paired rounding or dyad model, but having the physician see the patient every third day. This is most successful where there is strong onboarding and deep clarity for when to contact the backup physician. There are some data to support the effectiveness of this model, most recently in the Journal of Clinical Outcomes Management.3
Critical access hospitals are also having success in deploying APPs in a very independent role, staffing these hospitals at night. Smaller, rural hospitals with aging medical staff have learned to maximize the scope of practice of their APPs to remain viable and provide care for inpatients. This can be a very successful model for APPs working at the maximum scope of their practice. In addition, the use of telemedicine has been implemented to allow for remote physician backup. This may be a rapidly growing arm to hospital medicine practices in the future.
Ongoing barriers
There are many barriers to maximizing the scope of practice and efficiency of APPs in hospital medicine. They range from the “macro” to the “micro.”
On the larger stage, Medicare requires that home care orders be signed by an attending physician, which can be inefficient and difficult to accomplish. Other payers may have somewhat arcane statutes that limit billing practices, and state practice limitations vary widely. Although 22 states now allow for independent practice for NPs, other states may have a very restrictive practice environment that can impede creative care delivery models. But regardless of how liberal a practice the state allows, a hospital’s medical bylaws can still restrict the day-to-day practice of APPs. And those restrictive bylaws are emblematic of a more constant and corporeal barrier to APP practice, that of medical staff culture.
If there are physicians on the staff who fear that utilization of NP/PA providers will lead to a decay in the quality of care, or who feel threatened by the use of APPs, that can create a local stopgap to maximizing utilization of APPs. In addition, hospitalist physicians and leaders may lack knowledge or experience in APP practice. APPs take more time to successfully onboard than physicians; without clear expectations or road maps to accomplish this onboarding, leaders may feel that APP integration doesn’t work. And one bad experience can create long-term barriers for future practices.
Other barriers are the lack of standardized rigor and vigor in graduate education programs (in both educational and clinical experiences). This results in variation in the quality of NP/PA providers at graduation. Knowledge gaps may be perceived as incompetence, rather than just a lack of experience. There is a certificate for added qualification in hospital medicine for PA providers (which includes a specialty exam), and there is an acute care focus for NPs in training; however, there is no standardized licensure to ensure hospital medicine competency, creating a quagmire for hospitalist leaders who desire demonstrable competence of these providers.
Another barrier for some programs is financial; physicians may not want to give up their RVUs to an NP/PA provider. This can really inhibit a more independent role for the APP. It is important that financial incentives align with all members of the practice working at maximum scope.
Summary and future
In summary, the role of PA/NP in hospital medicine has continued to grow and evolve, to meet the needs of the industry. This includes an increase in the scope and independence of APPs, including the use of telehealth for required oversight. As a specialty, it is imperative that we continue to research APP model effectiveness, embrace innovative delivery models, and support effective onboarding and career development opportunities for our NP/PA providers.
Dr. Scheurer is a hospitalist and chief quality officer at the Medical University of South Carolina in Charleston. She is physician editor of The Hospitalist. Ms. Cardin is vice president, Advanced Practice Providers, at Sound Physicians, and is a member of SHM’s Board of Directors.
References
1. “Midlevels make a rocky entrance into hospital medicine,” by Bonnie Darves, Today’s Hospitalist, January 2007.
2. “When hiring midlevels, proceed with caution,” by Jessica Berthold, ACP Hospitalist, April 2009.
3. “A Comparison of Conventional and Expanded Physician Assistant Hospitalist Staffing Models at a Community Hospital,” J Clin Outcomes Manag. 2016 Oct 1;23[10]:455-61.