User login
Win Whitcomb: Hospitalists Must Grin and Bear the Hospital-Acquired Conditions Program

The Inpatient Prospective Payment System FY2013 Final Rule charts a different future: By fiscal-year 2015 (October 2014), it will morph into a set of measures that are vetted by the National Quality Forum. Hopefully, this will be an improvement.
In recent years, hospitalists have been deluged with rules about documentation, being asked to use medical vocabulary in ways that were foreign to many of us during our training years. Much of the focus on documentation has been propelled by hospitals’ quest to optimize (“maximize” is a forbidden term) reimbursement, which is purely a function of what is written by “licensed providers” (doctors, physician assistants, and nurse practitioners) in the medical chart.
But another powerful driver of documentation practices of late is the hospital-acquired conditions (HAC) program developed by the Centers for Medicare & Medicaid Services (CMS) and enacted in 2009.
Origins of the HAC List
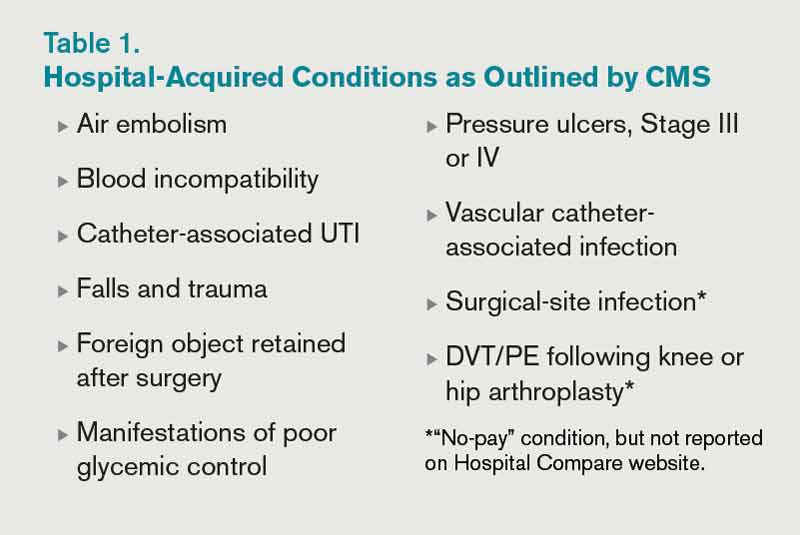
CMS disliked the fact that they were paying for conditions acquired in the hospital that were “reasonably preventable” if evidence-based—or at least “best”—practice was applied. After all, who likes to pay for a punctured gas tank when you brought the minivan in for an oil change? CMS worked with stakeholder groups, including SHM, to create a list of conditions known as hospital-acquired conditions (see Table 1, right).
(As an aside, SHM was supportive of CMS. In fact, we provided direct input into the final rule, recognizing some of the drawbacks of the CMS approach but understanding the larger objective of reengineering a flawed incentive system.)
The idea was that if a hospital submitted a bill to CMS that contained one of these conditions, the hospital would not be paid the amount by which that condition increased total reimbursement for that hospitalization. Note that if you’ve been told your hospital isn’t getting paid at all for patients with one of these conditions, that is not quite correct. Instead, your hospital may not get paid the added amount that is derived from having one of the diagnoses on the list submitted in your hospital’s bill to CMS for a given patient. At the end of the day, this might be a few hundred dollars each time one of these is documented—or $0, if your hospital biller can add another diagnosis in its place to capture the higher payment.
How big a hit to a hospital’s bottom line is this? Meddings and colleagues recently reported that a measly 0.003% of all hospitalizations in Michigan in 2009 saw payments lowered as a result of hospital-acquired catheter-associated UTI, one of the list’s HACs (Ann Int Med. 2012;157:305-312). When all the HACs are added together, one can extrapolate that they haven’t exactly had a big impact on hospital payments.
If the specter of nonpayment for one of these is not enough of a motivator (and it shouldn’t be, given the paltry financial stakes), the rate of HACs are now reported for all hospitals on the Hospital Compare website (www.hospitalcompare.hhs.gov). If a small poke to the pocketbook doesn’t work, maybe public humiliation will.
The Problem with HACs
Although CMS’ intent in creating the HAC program—to eliminate payment for “reasonably preventable” hospital-acquired conditions, thereby improving patient safety—was good, in practice, the program has turned out to be as much about documentation as it is about providing good care. For example, if I forget to write that a Stage III pressure ulcer was present on admission, it gets coded as hospital-acquired and my hospital gets dinged.
It’s important to note that HACs as quality measures were never endorsed by the National Quality Forum (NQF), and without such an endorsement, a quality measure suffers from Rodney Dangerfield syndrome: It don’t get no respect.
Finally, it is disquieting that Meddings et al showed that hospital-acquired catheter-associated UTI rates derived from chart documentation for HACs were but a small fraction of rates determined from rigorous epidemiologic studies, demonstrating that using claims data for determining rates for that specific HAC is flawed. We can only wonder how divergent reported vs. actual rates for the other HACs are.
The Future of the HAC Program
The Affordable Care Act specifies that the lowest-performing quartile of U.S. hospitals for HAC rates will see a 1% Medicare reimbursement reduction beginning in fiscal-year 2015. That’s right: Hospitals facing possible readmissions penalties and losses under value-based purchasing also will face a HAC penalty.
Thankfully, the recently released Inpatient Prospective Payment System FY2013 Final Rule, CMS’ annual update of how hospitals are paid, specifies that the HAC measures are to be removed from public reporting on the Hospital Compare website effective Oct. 1, 2014. They will be replaced by a new set of measures that will (hopefully) be more methodologically sound, because they will require the scrutiny required for endorsement by the NQF. Exactly how these measures will look is not certain, as the rule-making has not yet occurred.
We do know that the three infection measures—catheter-associated UTI, surgical-site infection, and vascular catheter infection—will be generated from clinical data and, therefore, more methodologically sound under the Centers for Disease Control and Prevention’s (CDC) National Healthcare Safety Network. The derivation of the other measures will have to wait until the rule is written next year.
So, until further notice, pay attention to the queries of your hospital’s documentation experts when they approach you about a potential HAC!
Dr. Whitcomb is medical director of healthcare quality at Baystate Medical Center in Springfield, Mass. He is a co-founder and past president of SHM. Email him at [email protected].
The View From
SHM is involved in influencing HAC definitions and the methods in which those definitions are used, in an attempt to “keep it real.” It is important for hospitalists to understand how the HACs can influence care, reimbursement, and their medical center’s strategic priorities. SHM has provided input to CMS, the CDC, and the NQF on the critical role hospitalists have in reducing or preventing HACs. SHM also has played a national role by leading an effort to reduce catheter-associated UTIs through the Partnership for Patients program, a national campaign with a goal of reducing hospital-acquired infections by 40% by the end of 2013.
SHM offers a variety of resources and programs related to reducing HACs, allowing hospitalists to improve patient safety and provide value to their hospital’s leadership. These include:
- Step-by-step implementation guides for reducing hospital-acquired VTE and hyper- and hypoglycemia;
- VTE and glycemic control mentored implementation programs that offer physician experts for tailored coaching on implementing best practices; and
- A fully functioning data repository and reporting engine for glycemic control parameters and hypoglycemia rates and management (eQUIPS).
The Inpatient Prospective Payment System FY2013 Final Rule charts a different future: By fiscal-year 2015 (October 2014), it will morph into a set of measures that are vetted by the National Quality Forum. Hopefully, this will be an improvement.
In recent years, hospitalists have been deluged with rules about documentation, being asked to use medical vocabulary in ways that were foreign to many of us during our training years. Much of the focus on documentation has been propelled by hospitals’ quest to optimize (“maximize” is a forbidden term) reimbursement, which is purely a function of what is written by “licensed providers” (doctors, physician assistants, and nurse practitioners) in the medical chart.
But another powerful driver of documentation practices of late is the hospital-acquired conditions (HAC) program developed by the Centers for Medicare & Medicaid Services (CMS) and enacted in 2009.
Origins of the HAC List
CMS disliked the fact that they were paying for conditions acquired in the hospital that were “reasonably preventable” if evidence-based—or at least “best”—practice was applied. After all, who likes to pay for a punctured gas tank when you brought the minivan in for an oil change? CMS worked with stakeholder groups, including SHM, to create a list of conditions known as hospital-acquired conditions (see Table 1, right).
(As an aside, SHM was supportive of CMS. In fact, we provided direct input into the final rule, recognizing some of the drawbacks of the CMS approach but understanding the larger objective of reengineering a flawed incentive system.)
The idea was that if a hospital submitted a bill to CMS that contained one of these conditions, the hospital would not be paid the amount by which that condition increased total reimbursement for that hospitalization. Note that if you’ve been told your hospital isn’t getting paid at all for patients with one of these conditions, that is not quite correct. Instead, your hospital may not get paid the added amount that is derived from having one of the diagnoses on the list submitted in your hospital’s bill to CMS for a given patient. At the end of the day, this might be a few hundred dollars each time one of these is documented—or $0, if your hospital biller can add another diagnosis in its place to capture the higher payment.
How big a hit to a hospital’s bottom line is this? Meddings and colleagues recently reported that a measly 0.003% of all hospitalizations in Michigan in 2009 saw payments lowered as a result of hospital-acquired catheter-associated UTI, one of the list’s HACs (Ann Int Med. 2012;157:305-312). When all the HACs are added together, one can extrapolate that they haven’t exactly had a big impact on hospital payments.
If the specter of nonpayment for one of these is not enough of a motivator (and it shouldn’t be, given the paltry financial stakes), the rate of HACs are now reported for all hospitals on the Hospital Compare website (www.hospitalcompare.hhs.gov). If a small poke to the pocketbook doesn’t work, maybe public humiliation will.
The Problem with HACs
Although CMS’ intent in creating the HAC program—to eliminate payment for “reasonably preventable” hospital-acquired conditions, thereby improving patient safety—was good, in practice, the program has turned out to be as much about documentation as it is about providing good care. For example, if I forget to write that a Stage III pressure ulcer was present on admission, it gets coded as hospital-acquired and my hospital gets dinged.
It’s important to note that HACs as quality measures were never endorsed by the National Quality Forum (NQF), and without such an endorsement, a quality measure suffers from Rodney Dangerfield syndrome: It don’t get no respect.
Finally, it is disquieting that Meddings et al showed that hospital-acquired catheter-associated UTI rates derived from chart documentation for HACs were but a small fraction of rates determined from rigorous epidemiologic studies, demonstrating that using claims data for determining rates for that specific HAC is flawed. We can only wonder how divergent reported vs. actual rates for the other HACs are.
The Future of the HAC Program
The Affordable Care Act specifies that the lowest-performing quartile of U.S. hospitals for HAC rates will see a 1% Medicare reimbursement reduction beginning in fiscal-year 2015. That’s right: Hospitals facing possible readmissions penalties and losses under value-based purchasing also will face a HAC penalty.
Thankfully, the recently released Inpatient Prospective Payment System FY2013 Final Rule, CMS’ annual update of how hospitals are paid, specifies that the HAC measures are to be removed from public reporting on the Hospital Compare website effective Oct. 1, 2014. They will be replaced by a new set of measures that will (hopefully) be more methodologically sound, because they will require the scrutiny required for endorsement by the NQF. Exactly how these measures will look is not certain, as the rule-making has not yet occurred.
We do know that the three infection measures—catheter-associated UTI, surgical-site infection, and vascular catheter infection—will be generated from clinical data and, therefore, more methodologically sound under the Centers for Disease Control and Prevention’s (CDC) National Healthcare Safety Network. The derivation of the other measures will have to wait until the rule is written next year.
So, until further notice, pay attention to the queries of your hospital’s documentation experts when they approach you about a potential HAC!
Dr. Whitcomb is medical director of healthcare quality at Baystate Medical Center in Springfield, Mass. He is a co-founder and past president of SHM. Email him at [email protected].
The View From
SHM is involved in influencing HAC definitions and the methods in which those definitions are used, in an attempt to “keep it real.” It is important for hospitalists to understand how the HACs can influence care, reimbursement, and their medical center’s strategic priorities. SHM has provided input to CMS, the CDC, and the NQF on the critical role hospitalists have in reducing or preventing HACs. SHM also has played a national role by leading an effort to reduce catheter-associated UTIs through the Partnership for Patients program, a national campaign with a goal of reducing hospital-acquired infections by 40% by the end of 2013.
SHM offers a variety of resources and programs related to reducing HACs, allowing hospitalists to improve patient safety and provide value to their hospital’s leadership. These include:
- Step-by-step implementation guides for reducing hospital-acquired VTE and hyper- and hypoglycemia;
- VTE and glycemic control mentored implementation programs that offer physician experts for tailored coaching on implementing best practices; and
- A fully functioning data repository and reporting engine for glycemic control parameters and hypoglycemia rates and management (eQUIPS).
John Nelson: Learning CPT Coding and Documentation Tricky for Hospitalists

There is a lot to learn when it comes to proper coding and the documentation requirements that go with it. It can even be tricky for a new residency grad to keep the difference in CPT and ICD-9 coding straight, to say nothing of the difference between documentation requirements for physician reimbursement versus hospital reimbursement. This column addresses only physician CPT coding (I’ll save documentation to support hospital billing for another column).
Although I believe that devoting the large number of brain cells required to keep this stuff straight gets in the way of maintaining necessary clinical knowledge, physicians have no real choice but to do it. (One could argue that having a professional coder read charts to determine proper CPT codes relieves a doctor of the burden of documentation and coding headaches. But this is only partially true. The doctor still needs to ensure that the documentation accurately reflects what was done for the coder to be able to select the appropriate codes, so he still needs to know a lot about this topic.)
All providers have a duty to reasonably ensure that submitted claims (bills) are true and accurate. Failing to document and code correctly risks anything from you or your employer having to return money, potentially with a penalty and interest, to being accused of criminal fraud.
Medicare and other payors generally categorize inaccurate claims as follows:
- Erroneous claims include inadvertent mistakes, innocent errors, or even negligence but still require payments associated with the error to be returned.
- Fraudulent claims are ones judged to be intentionally or recklessly false, and are subject to administrative or civil penalties, such as fines.
- Claims associated with criminal intent to defraud are subject to criminal penalties, which could include jail time.
While I haven’t heard of any hospitalists being accused of fraud, I know of several who have undergone audits and been required to return money. Whether your employer would refund the money or you would have to write a personal check to refund the money depends on your employment situation. For example, in most cases, the hospital would be liable to make the repayment for hospitalists it employs. If you’re an independent contractor, there is a good chance you could be stuck making the repayment yourself.
Trend: Increased Use of Higher-Level Codes
You might have missed it, but there was a recent study of Medicare Part B claims data from 2001 to 2010 showing that “physicians increased their billing of higher-level E/M codes in all types of E/M services.”1 For example, the report showed a steady decrease in use of the 99231 code, the lowest of the three subsequent inpatient hospital care codes, and an increase in the highest level code, 99233 (see Figure 1, below).
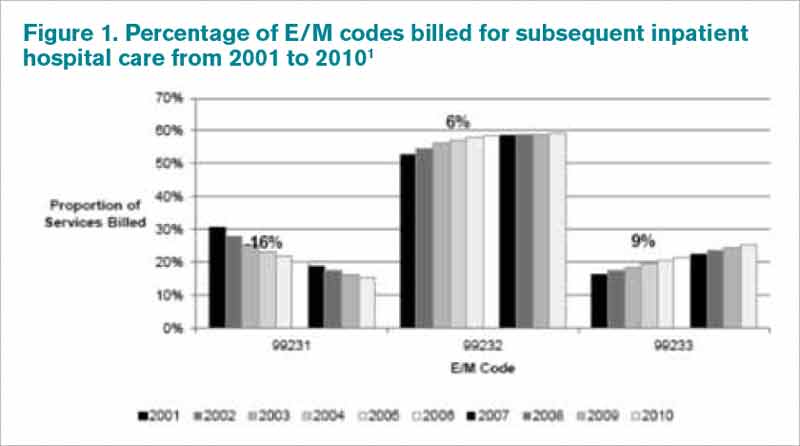
I can think of two reasons hospitalists might be increasing the use of higher codes. One, less-sick patients just aren’t seen in the hospital as often as they used to be, so the remaining patients require more intensive services, which could lead to the appropriate use of higher-level codes. Two, doctors have over the past 10 to 15 years invested more energy in learning appropriate documentation and coding, which might have led to correcting historical overuse of lower-level codes.
Did I tell you who conducted the study showing increased use of higher-level codes? It was the federal Office of Inspector General (OIG), which is responsible for preventing and detecting fraud and waste. Although the OIG might agree that the sicker patients and correction of historical undercoding might explain some of the trend, it’s a pretty safe bet they’re also concerned that a significant portion is inappropriate or fraudulent. Some portion of it probably is.
“CMS concurred with [OIG’s] recommendations to (1) continue to educate physicians on proper billing for E/M services and (2) encourage its contractor to review physicians’ billing for E/M services. CMS partially concurred with [OIG’s] third recommendation, to review physicians who bill higher-level E/M codes for appropriate action,” the OIG report noted.1
Plan for Education, Compliance
My sense is that most hospitalists employed by a large entity, such as a hospital or large medical group, have access to a certified coder to perform documentation and coding audits, as well as educational feedback when needed. If your practice doesn’t have access to a certified coder, you should consider photocopying some chart notes (e.g. 10 notes from each of your docs) and send them to an outside coder for an audit. Though they are very valuable, audits usually are not enough to ensure good performance.
In my March 2007 column, I described a reasonably simple chart audit allowing each doctor to compare his or her CPT coding pattern to everyone else in the group. You can compare your own coding to national coding patterns via SHM’s 2012 State of Hospital Medicine Report (www.hospitalmedicine.org/survey) or data from the CMS website, and the Medical Group Management Association (MGMA) will have data in future surveys. Such comparisons might help uncover unusual patterns that are worthy of a closer look.
Other strategies to promote proper documentation and coding include online educational programs, such as:
- SHM’s CODE-H webinars (www.hospitalmedicine.org/codeh), which are available on demand for a fee;
- American Association of Professional Coders Evaluation and Management Online Training (http://www.aapc.com/training/evaluation-management-coding-training.aspx); and
- The American Health Information Management Association’s (AHIMA) Coding Basics Program (www.ahima.org/continuinged/campus/courseinfo/cb.aspx).
If you prefer, an Internet search can turn up in-person courses to learn documentation and coding. Additionally, your in-house or external coding auditors can provide training.
To address tricky issues that come up only occasionally, several in our practice have compiled a “coding manual” by distilling guidance from our certified coders and compliance people on issues as they came up. Some issues would stump all of us, and we’d have to go to the Internet for help. All hospitalists are provided with a copy of the manual during orientation, and an electronic copy is available on the hospital’s Intranet. Topics addressed in the manual include things like how to bill the first inpatient day when a patient has changed from observation status, how to bill initial consult visits for various payors (an issue since Medicare eliminated consult codes a few years ago), how to bill when a patient is seen and discharged from the ED, etc.
Lastly, I suggest someone in your group talk with your hospital’s compliance department about its own coding and billing compliance plan. This could lead to ideas or help develop a compliance plan for your group.
Dr. Nelson has been a practicing hospitalist since 1988. He is co-founder and past president of SHM, and principal in Nelson Flores Hospital Medicine Consultants. He is course co-director for SHM’s “Best Practices in Managing a Hospital Medicine Program” course. Write to him at [email protected].
Reference
There is a lot to learn when it comes to proper coding and the documentation requirements that go with it. It can even be tricky for a new residency grad to keep the difference in CPT and ICD-9 coding straight, to say nothing of the difference between documentation requirements for physician reimbursement versus hospital reimbursement. This column addresses only physician CPT coding (I’ll save documentation to support hospital billing for another column).
Although I believe that devoting the large number of brain cells required to keep this stuff straight gets in the way of maintaining necessary clinical knowledge, physicians have no real choice but to do it. (One could argue that having a professional coder read charts to determine proper CPT codes relieves a doctor of the burden of documentation and coding headaches. But this is only partially true. The doctor still needs to ensure that the documentation accurately reflects what was done for the coder to be able to select the appropriate codes, so he still needs to know a lot about this topic.)
All providers have a duty to reasonably ensure that submitted claims (bills) are true and accurate. Failing to document and code correctly risks anything from you or your employer having to return money, potentially with a penalty and interest, to being accused of criminal fraud.
Medicare and other payors generally categorize inaccurate claims as follows:
- Erroneous claims include inadvertent mistakes, innocent errors, or even negligence but still require payments associated with the error to be returned.
- Fraudulent claims are ones judged to be intentionally or recklessly false, and are subject to administrative or civil penalties, such as fines.
- Claims associated with criminal intent to defraud are subject to criminal penalties, which could include jail time.
While I haven’t heard of any hospitalists being accused of fraud, I know of several who have undergone audits and been required to return money. Whether your employer would refund the money or you would have to write a personal check to refund the money depends on your employment situation. For example, in most cases, the hospital would be liable to make the repayment for hospitalists it employs. If you’re an independent contractor, there is a good chance you could be stuck making the repayment yourself.
Trend: Increased Use of Higher-Level Codes
You might have missed it, but there was a recent study of Medicare Part B claims data from 2001 to 2010 showing that “physicians increased their billing of higher-level E/M codes in all types of E/M services.”1 For example, the report showed a steady decrease in use of the 99231 code, the lowest of the three subsequent inpatient hospital care codes, and an increase in the highest level code, 99233 (see Figure 1, below).
I can think of two reasons hospitalists might be increasing the use of higher codes. One, less-sick patients just aren’t seen in the hospital as often as they used to be, so the remaining patients require more intensive services, which could lead to the appropriate use of higher-level codes. Two, doctors have over the past 10 to 15 years invested more energy in learning appropriate documentation and coding, which might have led to correcting historical overuse of lower-level codes.
Did I tell you who conducted the study showing increased use of higher-level codes? It was the federal Office of Inspector General (OIG), which is responsible for preventing and detecting fraud and waste. Although the OIG might agree that the sicker patients and correction of historical undercoding might explain some of the trend, it’s a pretty safe bet they’re also concerned that a significant portion is inappropriate or fraudulent. Some portion of it probably is.
“CMS concurred with [OIG’s] recommendations to (1) continue to educate physicians on proper billing for E/M services and (2) encourage its contractor to review physicians’ billing for E/M services. CMS partially concurred with [OIG’s] third recommendation, to review physicians who bill higher-level E/M codes for appropriate action,” the OIG report noted.1
Plan for Education, Compliance
My sense is that most hospitalists employed by a large entity, such as a hospital or large medical group, have access to a certified coder to perform documentation and coding audits, as well as educational feedback when needed. If your practice doesn’t have access to a certified coder, you should consider photocopying some chart notes (e.g. 10 notes from each of your docs) and send them to an outside coder for an audit. Though they are very valuable, audits usually are not enough to ensure good performance.
In my March 2007 column, I described a reasonably simple chart audit allowing each doctor to compare his or her CPT coding pattern to everyone else in the group. You can compare your own coding to national coding patterns via SHM’s 2012 State of Hospital Medicine Report (www.hospitalmedicine.org/survey) or data from the CMS website, and the Medical Group Management Association (MGMA) will have data in future surveys. Such comparisons might help uncover unusual patterns that are worthy of a closer look.
Other strategies to promote proper documentation and coding include online educational programs, such as:
- SHM’s CODE-H webinars (www.hospitalmedicine.org/codeh), which are available on demand for a fee;
- American Association of Professional Coders Evaluation and Management Online Training (http://www.aapc.com/training/evaluation-management-coding-training.aspx); and
- The American Health Information Management Association’s (AHIMA) Coding Basics Program (www.ahima.org/continuinged/campus/courseinfo/cb.aspx).
If you prefer, an Internet search can turn up in-person courses to learn documentation and coding. Additionally, your in-house or external coding auditors can provide training.
To address tricky issues that come up only occasionally, several in our practice have compiled a “coding manual” by distilling guidance from our certified coders and compliance people on issues as they came up. Some issues would stump all of us, and we’d have to go to the Internet for help. All hospitalists are provided with a copy of the manual during orientation, and an electronic copy is available on the hospital’s Intranet. Topics addressed in the manual include things like how to bill the first inpatient day when a patient has changed from observation status, how to bill initial consult visits for various payors (an issue since Medicare eliminated consult codes a few years ago), how to bill when a patient is seen and discharged from the ED, etc.
Lastly, I suggest someone in your group talk with your hospital’s compliance department about its own coding and billing compliance plan. This could lead to ideas or help develop a compliance plan for your group.
Dr. Nelson has been a practicing hospitalist since 1988. He is co-founder and past president of SHM, and principal in Nelson Flores Hospital Medicine Consultants. He is course co-director for SHM’s “Best Practices in Managing a Hospital Medicine Program” course. Write to him at [email protected].
Reference
John Nelson: Heavy Workloads
Now that HM is moving (or has moved?) from infancy to adolescence or even maturity, you might think that we would have reached some sort of consensus on what a reasonable workload—or patient volume—for a hospitalist is. My sense is that conventional wisdom says a reasonable average daily workload for a daytime rounding/admitting hospitalist is in the range of 12 to 17 billed encounters. And to average this volume, the doctor will have a number of days with more or fewer patients.
After thinking about average workload, the next question is: What is a reasonable upper limit for patient volume on a single day? Here, opinion seems to be a little fuzzier, but I think most would say a hospitalist should be expected to see more than 20 patients in a single day only on rare occasions and on, say, no more than 10 days annually. Keep in mind that a hospitalist who has 22 patients today still has a pretty good chance they will have 20 or more tomorrow, and the day after. High volumes are not a single-day phenomenon, either, because it usually takes a number of days for those patients to reach discharge—and the doctor to realize a decline in workload.
But these numbers are only conventional wisdom. There are little research data to guide our thinking about patient volumes, and thoughtful people sometimes arrive at very different conclusions. As I’ve written in this space previously, I think each individual hospitalist should have significant influence or autonomy to decide the appropriate or optimal patient volume for themselves or their group. This usually requires that doctors are connected to the economic and quality-of-care effects of their patient volume choices, something many hospitalists resist.
Divergence of Opinion
But given lots of autonomy, some hospitalists could make poor choices. I have had the experience of working with hospitalists in three practices around the country who are confident that, at least for themselves, very high patient volumes are safe and reasonable. These high-energy hospitalists see as many as 30 or 40 patients per day, day after day.
At one of these practices, I sat down with the doctors on duty that day at 1 p.m. and talked uninterrupted by pager or patient-care issues for nearly three hours. It was only at the end of the meeting that they explained each of them was seeing around 30 patients that day but had nearly finished rounds before our meeting started. I was stunned. (I probably wouldn’t stop for lunch, to say nothing of a three-hour meeting, to see just 20 patients in a day.)
So I asked just what they saw as an excessive daily patient volume. One of them seemed to deliberate carefully and said, “I probably need help when I have more than 35 patients to see in a day, but I’m OK with anything less than that.”
But the record goes to a really nice, spirited hospitalist who told me that, in addition to his usual workload, he occasionally covered weekends for an internal-medicine group. On a recent weekend, he had 88 patients to see each day, he said. Yes, you read that correctly: 88! (Fortunately, he did see that as a problem and was working to decrease the number.)
Potential Risks
I want to be clear that my own opinion is that the volumes above are unacceptable and dangerous. I think that, in most settings, routinely seeing more than 20 patients in a day probably degrades performance and increases the risk of burnout. While I think most knowledgeable people in our field share this opinion, none of us can point to compelling, generalizable research data to support our opinion.
The way I see it, excessively high workloads risk:
- Adverse patient outcomes due to increased potential for clinical errors and accompanying poor documentation;
- Failure of hospitalists to meet performance and citizenship expectations, such as length of stay (LOS), resource utilization, use of standardized order sets, attention to early discharge times, etc.;
- Lack of any excess capacity to handle transient increases in workload;
- Recruiting and/or retention challenges for hospitalists who might not want to work so hard;
- High risk of hospitalist stress and burnout, which over time could negatively impact a person’s well-being, as well as their attitudes and interactions with other members of the patient care team;
- Overdependence on a few very-hard-working doctors; if one doctor gets sick or has to stop working for a period of time, the hospital must find the equivalent of one-and-a-half doctors to replace him or her; and
- Increased malpractice risk.
Limited Data
There is some research to guide the thinking about workload. I recall one or two abstracts presented at past SHM annual meetings in which doctors in a single practice showed that LOS increased when their patient volume was high. And some sharp hospitalist researchers at Christiana Care Health System in Wilmington, Del., conducted a more robust retrospective cohort study of thousands of non-ICU adult admissions to their 1,100-bed hospital over a three-year period. Their data, which they intend to publish, showed LOS rises as hospitalist workload increases.
Others have assessed the connection between workload and well-being or burnout. Surprisingly, it has been hard to document in the peer-reviewed literature that increasing workloads are associated with increased burnout. Studies of hospitalists published in 2001 and 2011 failed to show a connection between self-reported workload and burnout.1,2 A 2009 systemic review of literature on all physician specialties concluded that “an imbalance between expected and experienced … workload is moderately associated with dissatisfaction, but there is less evidence of a significant association with objective workload.”3 (Emphasis mine.)
Rather than workload, both of the hospitalist studies found that such attributes as organizational solidarity, climate, and fairness; the feeling of being valued by the whole healthcare team; personal time; and compensation were more tightly correlated with whether hospitalists would thrive than workload.
Unfortunately, I’m not aware of any robust studies showing the relationship between hospitalist workload and quality of care (please email me if you know of any). I think the burden of proof is on those who support high workloads to show they don’t adversely affect patient incomes.
If you’d like to discuss workload further, I’ll be moderating a session titled “Who Says 15 is the Right Number?” during HM13, May 17-19, 2013, in Washington, D.C. (www.hospitalmedicine2013.org). I hope to see you there.
Dr. Nelson has been a practicing hospitalist since 1988. He is co-founder and past president of SHM, and principal in Nelson Flores Hospital Medicine Consultants. He is course co-director for SHM’s “Best Practices in Managing a Hospital Medicine Program” course. Write to him at [email protected].
References
2. Hinami K, Whelan CT, Wolosin RJ, Miller JA, Wetterneck TB. Worklife and satisfaction of hospitalists: toward flourishing careers. J Gen Intern Med. 2012;27(1):28-36.
3. Scheurer D, McKean S, Miller J, Wetterneck T. U.S. physician satisfaction: a systematic review. J Hosp Med. 2009;4(9):560-568.
Is the rate of progress the same for induced and spontaneous labors?
Induction of labor is warranted when the benefits of delivery (for the mother or fetus) outweigh the advantages of continuing the pregnancy. Common indications include membrane rupture, gestational hypertension, nonreassuring fetal status, and various maternal medical or fetal conditions.
Induction involves the stimulation of contractions in the absence of spontaneous labor (with or without ruptured membranes), whereas augmentation refers to stimulation of preexisting spontaneous contractions that are considered inadequate because of failed or inadequate cervical dilation and fetal descent.
Women who undergo induction of labor—particularly if nulliparous—are more likely to require cesarean delivery than those who enter labor spontaneously. As the authors of this study point out, it is unclear why induction of labor is associated with an increased risk of cesarean delivery, but it may be related, in part, to the way induced labors are managed.
The incidence of labor induction in the United States more than doubled over the past 20 years. In 2007, more than 20% of all labors were induced in the United States.1 When augmented labors are added to the equation, the sum likely represents half of all pregnancies, so this subject is important to us all.
Details of the study
Enter Harper and colleagues, who focused on women who 1) carried a singleton pregnancy in vertex presentation, 2) reached 10 cm of dilation, and 3) had an umbilical cord gas obtained at delivery. The women were admitted for labor from July 2004 to June 2008 at Washington University Medical Center in St. Louis, Missouri. They had a minimum gestational age of 37 weeks and reached the second stage of labor. Labor and delivery records included information on medications, type of labor, times of cervical examination, extent of cervical dilation, station, duration and curves of the first stage of labor, length of the stages of labor, mode of delivery, and postpartum status.
Of 5,388 women in the cohort, 2,021 entered labor spontaneously, 1,720 had labor augmented, and 1,647 had labor induced. After adjustments for race, obesity, macrosomia, and Bishop score, women who underwent induction of labor spent a significantly longer total time in labor than did women who entered labor spontaneously.
Among nulliparous women, the median (95th percentile) time to progress from 4 cm to 10 cm was 5.5 (16.8) hours when labor was induced versus 3.8 (11.8) hours for spontaneous labors. Among multiparous women, the figures were 4.4 (16.2) hours and 2.4 (8.8) hours, respectively.
The time it took for dilation to increase 1 cm in latent labor (<6 cm dilation) was significantly longer in induced labors, compared with spontaneous labors. However, the time it took for dilation to increase 1 cm in active labor (≥6 cm dilation) was similar between groups.
Strengths and weaknesses of the trial
Induced labor in this cohort was significantly slower than currently accepted definitions of protraction (dilation <1 cm/hr for 4 hr) and arrest disorders (no cervical dilation for 2 hr). And the active phase of labor (defined as an increased rate of cervical dilation) began at 6 cm in this study, much later than previously accepted definitions of 3 to 4 cm.2 If the traditional definitions of active-phase arrest are applied to women whose labors are induced, a significant number of cesarean deliveries may be performed prematurely for arrest disorders.
A strength of this investigation is the large size of the cohort. Patient-level data, including patient characteristics and medication details, enabled the investigators to reconstruct labor curves while adjusting for relevant confounding variables. Methods of cervical ripening (prostaglandins, Foley balloon) were documented, as were indications for induction, making this study generalizable to a wide population.
Harper and colleagues did not stratify their findings by favorability of the cervix at the time of induction. Women who required cervical ripening had a slower labor than did women in spontaneous labor until they reached 6 cm, at which point labor patterns converged. Of interest, women who had a favorable cervix at the time of induction had a faster labor than did women in spontaneous labor, largely as a result of shorter times to reach 6 cm.
As for the women who underwent labor augmentation, the progress of labor before 6 cm was very similar to progress among those whose labor was induced. This finding may reflect misclassification of women between the induction and augmentation groups, or misdiagnosis of labor at the time of admission.
Women were excluded from this study if they did not reach the second stage of labor, because investigators were interested in examining the normal course of labor rather than the need for cesarean delivery. However, this exclusion could have caused selection bias.
Analysis did not begin until women reached 3 cm of dilation, largely because women in spontaneous labor were typically admitted when their cervix had dilated at least 3 cm. The period before 3 cm of dilation seems to be longest when induction of labor occurs in the presence of an unfavorable cervix.
Harper and colleagues confirm a commonly held perception that women undergoing induction of labor spend a longer total time in labor than women who enter labor spontaneously.3,4 Before 6 cm, women undergoing induction of labor may take as long as 10 hours to achieve each centimeter of dilation. This pattern suggests that a diagnosis of arrest of labor before 6 cm of dilation needs to be scrutinized carefully to prevent unnecessary cesarean delivery.
William F. Rayburn, MD, MBA
We want to hear from you! Tell us what you think.
ON OBSTETRICS?
Does maternal exposure to magnesium sulfate affect fetal heart-rate patterns?
John M. Thorp, Jr, MD (October 2012)
Is elective delivery at 37 weeks’ gestation safe in uncomplicated twin pregnancies?
Steven T. Chasen, MD (September 2012)
Does mediolateral episiotomy reduce the risk of anal sphincter injury in operative vaginal delivery?
Errol T. Norwitz, MD, PhD (August 2012)
When macrosomia is suspected at term, does induction of labor lower the risk of cesarean delivery?
Jennifer T. Ahn, MD (May 2012)
Does vaginal progesterone reduce preterm delivery among asymptomatic women who have a short cervix in the midtrimester?
John T. Repke, MD (April 2012)
1. Induction of labor. ACOG Practice Bulletin #107. August 2009. Obstet Gynecol. 2009;114(2 Pt 1):386-397.
2. Dystocia and augmentation of labor. ACOG Practice Bulletin #49. December 2003. Obstet Gynecol. 2003;102(6):1445-1454.
3. Rinehart BK, Terrone DA, Hudson C, Isler CM, Larmon JE, Perry KG, Jr. Lack of utility of standard labor curves in the prediction of progression during labor induction. Am J Obstet Gynecol. 2000;182(6):1520-1526.
4. Cheng YW, Delaney SS, Hopkins LM, Caughey AB. The association between the length of first stage of labor, mode of delivery, and perinatal outcomes in women undergoing induction of labor. Am J Obstet Gynecol. 2009;201(5):477.e1-e7.
Induction of labor is warranted when the benefits of delivery (for the mother or fetus) outweigh the advantages of continuing the pregnancy. Common indications include membrane rupture, gestational hypertension, nonreassuring fetal status, and various maternal medical or fetal conditions.
Induction involves the stimulation of contractions in the absence of spontaneous labor (with or without ruptured membranes), whereas augmentation refers to stimulation of preexisting spontaneous contractions that are considered inadequate because of failed or inadequate cervical dilation and fetal descent.
Women who undergo induction of labor—particularly if nulliparous—are more likely to require cesarean delivery than those who enter labor spontaneously. As the authors of this study point out, it is unclear why induction of labor is associated with an increased risk of cesarean delivery, but it may be related, in part, to the way induced labors are managed.
The incidence of labor induction in the United States more than doubled over the past 20 years. In 2007, more than 20% of all labors were induced in the United States.1 When augmented labors are added to the equation, the sum likely represents half of all pregnancies, so this subject is important to us all.
Details of the study
Enter Harper and colleagues, who focused on women who 1) carried a singleton pregnancy in vertex presentation, 2) reached 10 cm of dilation, and 3) had an umbilical cord gas obtained at delivery. The women were admitted for labor from July 2004 to June 2008 at Washington University Medical Center in St. Louis, Missouri. They had a minimum gestational age of 37 weeks and reached the second stage of labor. Labor and delivery records included information on medications, type of labor, times of cervical examination, extent of cervical dilation, station, duration and curves of the first stage of labor, length of the stages of labor, mode of delivery, and postpartum status.
Of 5,388 women in the cohort, 2,021 entered labor spontaneously, 1,720 had labor augmented, and 1,647 had labor induced. After adjustments for race, obesity, macrosomia, and Bishop score, women who underwent induction of labor spent a significantly longer total time in labor than did women who entered labor spontaneously.
Among nulliparous women, the median (95th percentile) time to progress from 4 cm to 10 cm was 5.5 (16.8) hours when labor was induced versus 3.8 (11.8) hours for spontaneous labors. Among multiparous women, the figures were 4.4 (16.2) hours and 2.4 (8.8) hours, respectively.
The time it took for dilation to increase 1 cm in latent labor (<6 cm dilation) was significantly longer in induced labors, compared with spontaneous labors. However, the time it took for dilation to increase 1 cm in active labor (≥6 cm dilation) was similar between groups.
Strengths and weaknesses of the trial
Induced labor in this cohort was significantly slower than currently accepted definitions of protraction (dilation <1 cm/hr for 4 hr) and arrest disorders (no cervical dilation for 2 hr). And the active phase of labor (defined as an increased rate of cervical dilation) began at 6 cm in this study, much later than previously accepted definitions of 3 to 4 cm.2 If the traditional definitions of active-phase arrest are applied to women whose labors are induced, a significant number of cesarean deliveries may be performed prematurely for arrest disorders.
A strength of this investigation is the large size of the cohort. Patient-level data, including patient characteristics and medication details, enabled the investigators to reconstruct labor curves while adjusting for relevant confounding variables. Methods of cervical ripening (prostaglandins, Foley balloon) were documented, as were indications for induction, making this study generalizable to a wide population.
Harper and colleagues did not stratify their findings by favorability of the cervix at the time of induction. Women who required cervical ripening had a slower labor than did women in spontaneous labor until they reached 6 cm, at which point labor patterns converged. Of interest, women who had a favorable cervix at the time of induction had a faster labor than did women in spontaneous labor, largely as a result of shorter times to reach 6 cm.
As for the women who underwent labor augmentation, the progress of labor before 6 cm was very similar to progress among those whose labor was induced. This finding may reflect misclassification of women between the induction and augmentation groups, or misdiagnosis of labor at the time of admission.
Women were excluded from this study if they did not reach the second stage of labor, because investigators were interested in examining the normal course of labor rather than the need for cesarean delivery. However, this exclusion could have caused selection bias.
Analysis did not begin until women reached 3 cm of dilation, largely because women in spontaneous labor were typically admitted when their cervix had dilated at least 3 cm. The period before 3 cm of dilation seems to be longest when induction of labor occurs in the presence of an unfavorable cervix.
Harper and colleagues confirm a commonly held perception that women undergoing induction of labor spend a longer total time in labor than women who enter labor spontaneously.3,4 Before 6 cm, women undergoing induction of labor may take as long as 10 hours to achieve each centimeter of dilation. This pattern suggests that a diagnosis of arrest of labor before 6 cm of dilation needs to be scrutinized carefully to prevent unnecessary cesarean delivery.
William F. Rayburn, MD, MBA
We want to hear from you! Tell us what you think.
ON OBSTETRICS?
Does maternal exposure to magnesium sulfate affect fetal heart-rate patterns?
John M. Thorp, Jr, MD (October 2012)
Is elective delivery at 37 weeks’ gestation safe in uncomplicated twin pregnancies?
Steven T. Chasen, MD (September 2012)
Does mediolateral episiotomy reduce the risk of anal sphincter injury in operative vaginal delivery?
Errol T. Norwitz, MD, PhD (August 2012)
When macrosomia is suspected at term, does induction of labor lower the risk of cesarean delivery?
Jennifer T. Ahn, MD (May 2012)
Does vaginal progesterone reduce preterm delivery among asymptomatic women who have a short cervix in the midtrimester?
John T. Repke, MD (April 2012)
1. Induction of labor. ACOG Practice Bulletin #107. August 2009. Obstet Gynecol. 2009;114(2 Pt 1):386-397.
2. Dystocia and augmentation of labor. ACOG Practice Bulletin #49. December 2003. Obstet Gynecol. 2003;102(6):1445-1454.
3. Rinehart BK, Terrone DA, Hudson C, Isler CM, Larmon JE, Perry KG, Jr. Lack of utility of standard labor curves in the prediction of progression during labor induction. Am J Obstet Gynecol. 2000;182(6):1520-1526.
4. Cheng YW, Delaney SS, Hopkins LM, Caughey AB. The association between the length of first stage of labor, mode of delivery, and perinatal outcomes in women undergoing induction of labor. Am J Obstet Gynecol. 2009;201(5):477.e1-e7.
Are hospital claims about the robotic approach to gynecologic surgery based on reliable data—or mostly hype?
Although robotic gynecologic surgery has been approved by the US Food and Drug Administration, evidence of its effectiveness is limited. Of the studies that have been conducted, many found no benefit or only slight benefit for the robot, compared with laparoscopic surgery. Nevertheless, the use of the robot in gynecologic surgery has spread rapidly, accounting for more than 200,000 operations in 2009.
In the United States, many patients derive information on the robot from hospital Web sites. In this study, Schiavone and colleagues analyzed the content of these sites for quality and accuracy of information.
Details of the study
Investigators focused on hospitals that had more than 200 beds, settling on 432 institutions in New York, Pennsylvania, Illinois, Georgia, and California. Of these hospitals, 192 (44.4%) featured information about robotic gynecologic surgery on their Web sites.
Manufacturer-based images and text and robot brand names were found in 64.1%, 24.0%, and 32.3% of Web sites, respectively. Of the 192 hospitals with information about the robot on their Web sites, more than 75% reported that robotic surgery is associated with less pain (88.0% of Web sites), a shorter recovery (91.2%), and less blood loss (76.0%). A reduced incidence of scarring (75.0% of Web sites) and infection (58.3%) were also mentioned frequently.
Robotic surgery was described as better overall or as the most effective surgical approach in 41.2% and 26.0% of Web sites, respectively. However, fewer than 50% of Web sites identified the comparison group (laparoscopic or open surgery). The percentage of sites that featured evidence-based data, the cost of the robotic approach, and operative times was 14.6%, 3.7%, and 2.7%, respectively.
Randomized trials paint a different picture
Results from randomized trials of gynecologic surgery have indicated that the benefits of the robotic approach are limited, whereas cost and operative times are increased. For example, in a single-center, blinded, randomized trial of 78 patients undergoing sacrocolpopexy for vaginal prolapse, Paraiso and colleagues found a longer operating time for robotic surgery (a difference of 67 minutes between robotic and laparoscopic sacrocolpopexy; 95% confidence interval [CI], 43–89; P <.001), as well as greater postoperative pain (necessitating use of nonsteroidal anti-inflammatory drugs for a median of 20 days vs 11 days; P <.005) and higher cost (a difference of $1,936; 95% CI, $417–$3,454; P = .008). The groups had equivalent outcomes 1 year after surgery.1
In a randomized, controlled trial of 95 women undergoing hysterectomy, the robotic approach was associated with a longer mean operative time than the laparoscopic approach (106 vs 75 minutes), but produced similar results in other measures (blood loss, complications, analgesic use, and return to activity).2
Although most patients trust the health information provided by hospitals, this study indicates that much of the Web-based information on robotic gynecologic surgery is not backed by sound evidence and is influenced by the manufacturer. This approach to promoting the robot drives up the cost of health care and misleads patients.
When a patient asks about robotic surgery, it may be useful to first point out that laparoscopic (nonrobotic) surgery is minimally invasive, avoiding large abdominal incisions. Reviewing risks and benefits of robotic versus alternative approaches, based on solid evidence from well-conducted trials, allows the patient to make a well-informed decision as she pursues surgical treatment.
Andrew M. Kaunitz, MD
We want to hear from you! Tell us what you think.
ON GYNECOLOGY?
Does treatment of cervical intraepithelial neoplasia always increase the risk of preterm birth in subsequent gestations?
Andrew M. Kaunitz, MD (October 2012)
What is the optimal interval for osteoporosis screening in postmenopausal women before fracture occurrence and osteoporosis treatment initiation?
Steven R. Goldstein, MD (August 2012)
Does long-acting reversible contraception prevent unintended pregnancy better than OCs, transdermal patch, and vaginal ring—regardless of a patient’s age?
Andrew M. Kaunitz, MD (July 2012)
In women who have stress incontinence and intrinsic sphincter deficiency, which midurethral sling produces the best long-term results?
Ladin A. Yurteri-Kaplan, MD; Amy J. Park, MD (June 2012)
1. Paraiso MF, Jelovsek JE, Frick A, Chen CC, Barber MD. Laparoscopic compared with robotic sacrocolpopexy for vaginal prolapse: a randomized controlled trial. Obstet Gynecol. 2011;118(5):1005-1013.
2. Sarlos D, Kots L, Stevanovic N, von Felton S, Schaer G. Robotic compared with conventional laparoscopic hysterectomy: a randomized controlled trial. Obstet Gynecol. 2012;120(3):604-611.
Although robotic gynecologic surgery has been approved by the US Food and Drug Administration, evidence of its effectiveness is limited. Of the studies that have been conducted, many found no benefit or only slight benefit for the robot, compared with laparoscopic surgery. Nevertheless, the use of the robot in gynecologic surgery has spread rapidly, accounting for more than 200,000 operations in 2009.
In the United States, many patients derive information on the robot from hospital Web sites. In this study, Schiavone and colleagues analyzed the content of these sites for quality and accuracy of information.
Details of the study
Investigators focused on hospitals that had more than 200 beds, settling on 432 institutions in New York, Pennsylvania, Illinois, Georgia, and California. Of these hospitals, 192 (44.4%) featured information about robotic gynecologic surgery on their Web sites.
Manufacturer-based images and text and robot brand names were found in 64.1%, 24.0%, and 32.3% of Web sites, respectively. Of the 192 hospitals with information about the robot on their Web sites, more than 75% reported that robotic surgery is associated with less pain (88.0% of Web sites), a shorter recovery (91.2%), and less blood loss (76.0%). A reduced incidence of scarring (75.0% of Web sites) and infection (58.3%) were also mentioned frequently.
Robotic surgery was described as better overall or as the most effective surgical approach in 41.2% and 26.0% of Web sites, respectively. However, fewer than 50% of Web sites identified the comparison group (laparoscopic or open surgery). The percentage of sites that featured evidence-based data, the cost of the robotic approach, and operative times was 14.6%, 3.7%, and 2.7%, respectively.
Randomized trials paint a different picture
Results from randomized trials of gynecologic surgery have indicated that the benefits of the robotic approach are limited, whereas cost and operative times are increased. For example, in a single-center, blinded, randomized trial of 78 patients undergoing sacrocolpopexy for vaginal prolapse, Paraiso and colleagues found a longer operating time for robotic surgery (a difference of 67 minutes between robotic and laparoscopic sacrocolpopexy; 95% confidence interval [CI], 43–89; P <.001), as well as greater postoperative pain (necessitating use of nonsteroidal anti-inflammatory drugs for a median of 20 days vs 11 days; P <.005) and higher cost (a difference of $1,936; 95% CI, $417–$3,454; P = .008). The groups had equivalent outcomes 1 year after surgery.1
In a randomized, controlled trial of 95 women undergoing hysterectomy, the robotic approach was associated with a longer mean operative time than the laparoscopic approach (106 vs 75 minutes), but produced similar results in other measures (blood loss, complications, analgesic use, and return to activity).2
Although most patients trust the health information provided by hospitals, this study indicates that much of the Web-based information on robotic gynecologic surgery is not backed by sound evidence and is influenced by the manufacturer. This approach to promoting the robot drives up the cost of health care and misleads patients.
When a patient asks about robotic surgery, it may be useful to first point out that laparoscopic (nonrobotic) surgery is minimally invasive, avoiding large abdominal incisions. Reviewing risks and benefits of robotic versus alternative approaches, based on solid evidence from well-conducted trials, allows the patient to make a well-informed decision as she pursues surgical treatment.
Andrew M. Kaunitz, MD
We want to hear from you! Tell us what you think.
ON GYNECOLOGY?
Does treatment of cervical intraepithelial neoplasia always increase the risk of preterm birth in subsequent gestations?
Andrew M. Kaunitz, MD (October 2012)
What is the optimal interval for osteoporosis screening in postmenopausal women before fracture occurrence and osteoporosis treatment initiation?
Steven R. Goldstein, MD (August 2012)
Does long-acting reversible contraception prevent unintended pregnancy better than OCs, transdermal patch, and vaginal ring—regardless of a patient’s age?
Andrew M. Kaunitz, MD (July 2012)
In women who have stress incontinence and intrinsic sphincter deficiency, which midurethral sling produces the best long-term results?
Ladin A. Yurteri-Kaplan, MD; Amy J. Park, MD (June 2012)
1. Paraiso MF, Jelovsek JE, Frick A, Chen CC, Barber MD. Laparoscopic compared with robotic sacrocolpopexy for vaginal prolapse: a randomized controlled trial. Obstet Gynecol. 2011;118(5):1005-1013.
2. Sarlos D, Kots L, Stevanovic N, von Felton S, Schaer G. Robotic compared with conventional laparoscopic hysterectomy: a randomized controlled trial. Obstet Gynecol. 2012;120(3):604-611.
Synthetic full-length midurethral slings remain the standard of care for SUI surgery
When and how to place an autologous rectus fascia pubovaginal sling
Mickey Karram, MD; Dani Zoorob, MD (Surgical Techniques, November 2012)
The current surgical options for managing stress urinary incontinence (SUI) include:
These options—specifically MUS, which are the predominant SUI surgical procedure and the clear standard of care—remain in the surgeon’s armamentarium after the July 2011, FDA safety warning.1
Confusion persists
A common misunderstanding is that full-length MUS were included in the FDA warning; however, the warning was about transvaginal mesh for prolapse and was titled, “Urogynecologic Surgical Mesh: Update on the Safety and Effectiveness of Vaginal Placement for Pelvic Organ Prolapse.”1 In this document, it was explicitly stated: “The FDA continues to evaluate the effects of using surgical mesh for the treatment of SUI and will report about that usage at a later date.” In early 2012, when the FDA sent letters to industry for postmarketing approval study requests,2 full-length MUS (but not single-incision mini-slings), were excluded from further study.
On page 24 of this issue, the technique for a pubovaginal sling is very well described by Drs. Karram and Zoorob in their article, “When and how to place an autologous rectus fascia pubovaginal sling.” There may be a place for this pubovaginal sling procedure for women with previous urethral surgery or radiation, but studies are needed to determine if repeat MUS or pubovaginal slings are the best procedure for recurrent incontinence. You should not get the impression that the current mesh controversy justifies abandoning the full-length MUS for a pubovaginal sling.
Unfortunately, television ads by law firms trawling for potential clients with any mesh in their vagina have created confusion among patients that synthetic MUS for incontinence is the same as transvaginal mesh for prolapse. In most clinical scenarios, rather than validating the patients’ concerns about the safety of synthetic mesh and performing a pubovaginal sling procedure, the most appropriate course of action is detailed, evidence-based patient education about MUS safety and efficacy to counter the patient’s misperceptions of safety concerns.
A bit of history on MUS
The first retropubic MUS was the tension-free vaginal tape (TVT) procedure published by Ulmsten in 1996.3 This minimally invasive outpatient procedure using a 1-cm wide strip of polypropylene mesh has revolutionized the management of SUI and has been the most studied surgical procedure in all of gynecology. A PubMed search of “tension- free vaginal tape” reveals more than 2,000 publications.
MUS vs pubovaginal slings. In a recent updated systematic review of 39 randomized controlled trials comparing different SUI procedures, midurethral slings and pubovaginal slings had similar cure rates. Pubovaginal slings, however, had more postoperative lower urinary tract symptoms and a higher reoperation rate.4
Pubovaginal slings require an 8-cm lower-abdominal incision, general or regional anesthesia, and hospitalization (usually). They also have higher risks of intraoperative bleeding and wound complications (including incisional hernias) than MUS. By contrast, MUS require 3 small 1-cm incisions and can be performed on an outpatient basis with local anesthesia and sedation. Postoperative recovery is significantly easier and shorter with MUS than with pubovaginal slings. Pubovaginal slings performed with human cadaveric material and porcine material have inferior outcomes to autologous material.5
Modifications to MUS included transobturator approaches, which have comparable efficacy to the retropubic approach.6 In this century, the full-length MUS procedures are the predominant SUI surgical procedure and the clear standard of care.
In a recent study involving 53 urologists and urogynecologists (of whom >90% were fellowship-trained), use of full-length MUS was the preferred procedure in 93% of primary stress incontinence surgical procedures.7 In fact, full-length MUS have been so successful and safe that extrapolation of a small ribbon of mesh under the midurethra to larger sheets of mesh for the entire vagina is what produced our current transvaginal mesh controversy. The vaginal erosion rates of 10% that have been seen with much larger pieces of transvaginal mesh are only 1% with MUS.8 Studies have not demonstrated common or significant vaginal pain or pain with intercourse after MUS.
Let’s educate our patients
In my clinical practice, I have found that educating patients about the safety and efficacy of synthetic MUS is extremely successful. I urge you to not replace on a widespread basis the most studied, safe, and successful treatment for SUI with a procedure that is considerably more invasive and complicated and can be more painful and require a longer recovery. We all must do our best to clear up the confusion created by misleading television advertisements by law firms. Full-length synthetic midurethral slings remain the current standard of care for stress incontinence surgery.
The July 2011 FDA safety warning urged patients to ask their surgeons about the benefits and risks of mesh use before going forward with surgery involving synthetic mesh. The American Urogynecologic Society developed the AUGS Transvaginal Mesh Informed Consent Toolkit to aid surgeons in answering patients’ questions. This toolkit is available online (www.augs.org/informedconsent). Among other resources, you will find guidance on answering the following questions:
- Why do you think I am a good candidate for mesh?
- Why are you choosing surgical mesh for my repair?
- How likely is it that my repair could be successfully performed without using surgical mesh?
- What results have other patients had with this product?
- Which specific side effects should I report to you after surgery?
INSTANT POLL. How do you educate your patients on the use of surgical mesh? Click here
1. Center for Devices and Radiological Health, Food and Drug Administration. Urogynecologic Surgical Mesh: Update on the Safety and Effectiveness of Vaginal Placement for Pelvic Organ Prolapse. Silver Spring, MD: Food and Drug Administration; July 2011. www.fda.gov/downloads/medcaldevices/safety/…/UCM262760.pdf. Accessed October 15, 2012.
2. Urogynecologic Surgical Mesh Implants. FDA Web site. http://www.fda.gov/MedicalDevices/ProductsandMedicalProcedures/ImplantsandProsthetics/UroGynSurgicalMesh/default.htm. Updated January 4, 2012. Accessed October 15, 2012.
3. Ulmsten U, Henriksson L, Johnson P, Varhos G. An ambulatory surgical procedure under local anesthesia for treatment of female urinary incontinence. Int Urogynecol J Pelvic Floor Dysfunct. 1996;7(2):81-55.
4. Novara G, Artibani W, Barber MD, et al. Updated systematic review and meta-analysis of the comparative data on colposuspensions, pubovaginal slings, and midurethral tapes in the surgical treatment of female stress urinary incontinence. Eur Urol. 2010;58(2):218-238.
5. Simsiman AJ, Powell CR, Stratford RR, Menefee SA. Suburethral sling materials: best outcome with autologous tissue. Am J Obstet Gynecol. 2005;193(6):2112-2116.
6. Richter HE, Albo ME, Zyczynski HM, et al. Urinary Incontinence Treatment Network. Retropubic versus transobturator midurethral slings for stress incontinence. N Engl J Med. 2010;362(22):2066-2076.
7. Nager CW, Brubaker L, Litman HJ, et al. Urinary Incontinence Treatment Network A randomized trial of urodynamic testing before stress-incontinence surgery. N Engl J Med. 2012;366(21):1987-1997.
8. Novara G, Galfano A, Boscolo-Berto R, et al. Complication rates of tension- free midurethral slings in the treatement of female stress urinary incontinence: a systematic review and meta-analysis of randomized controlled trials comparing tension-free midurethral tapes to other surgical procedures and different devices. European Urology. 2008;53(2):288-308.

Charles W. Nager, MD
Dr. Nager is Professor of Clinical Reproductive Medicine, and Director, Division of Female Pelvic Medicine and Reconstructive Surgery at University of California San Diego Health Care System.
Dr. Nager reports no financial relationships relevant to this article.
Charles W. Nager, MD
Dr. Nager is Professor of Clinical Reproductive Medicine, and Director, Division of Female Pelvic Medicine and Reconstructive Surgery at University of California San Diego Health Care System.
Dr. Nager reports no financial relationships relevant to this article.
Charles W. Nager, MD
Dr. Nager is Professor of Clinical Reproductive Medicine, and Director, Division of Female Pelvic Medicine and Reconstructive Surgery at University of California San Diego Health Care System.
Dr. Nager reports no financial relationships relevant to this article.
When and how to place an autologous rectus fascia pubovaginal sling
Mickey Karram, MD; Dani Zoorob, MD (Surgical Techniques, November 2012)
The current surgical options for managing stress urinary incontinence (SUI) include:
These options—specifically MUS, which are the predominant SUI surgical procedure and the clear standard of care—remain in the surgeon’s armamentarium after the July 2011, FDA safety warning.1
Confusion persists
A common misunderstanding is that full-length MUS were included in the FDA warning; however, the warning was about transvaginal mesh for prolapse and was titled, “Urogynecologic Surgical Mesh: Update on the Safety and Effectiveness of Vaginal Placement for Pelvic Organ Prolapse.”1 In this document, it was explicitly stated: “The FDA continues to evaluate the effects of using surgical mesh for the treatment of SUI and will report about that usage at a later date.” In early 2012, when the FDA sent letters to industry for postmarketing approval study requests,2 full-length MUS (but not single-incision mini-slings), were excluded from further study.
On page 24 of this issue, the technique for a pubovaginal sling is very well described by Drs. Karram and Zoorob in their article, “When and how to place an autologous rectus fascia pubovaginal sling.” There may be a place for this pubovaginal sling procedure for women with previous urethral surgery or radiation, but studies are needed to determine if repeat MUS or pubovaginal slings are the best procedure for recurrent incontinence. You should not get the impression that the current mesh controversy justifies abandoning the full-length MUS for a pubovaginal sling.
Unfortunately, television ads by law firms trawling for potential clients with any mesh in their vagina have created confusion among patients that synthetic MUS for incontinence is the same as transvaginal mesh for prolapse. In most clinical scenarios, rather than validating the patients’ concerns about the safety of synthetic mesh and performing a pubovaginal sling procedure, the most appropriate course of action is detailed, evidence-based patient education about MUS safety and efficacy to counter the patient’s misperceptions of safety concerns.
A bit of history on MUS
The first retropubic MUS was the tension-free vaginal tape (TVT) procedure published by Ulmsten in 1996.3 This minimally invasive outpatient procedure using a 1-cm wide strip of polypropylene mesh has revolutionized the management of SUI and has been the most studied surgical procedure in all of gynecology. A PubMed search of “tension- free vaginal tape” reveals more than 2,000 publications.
MUS vs pubovaginal slings. In a recent updated systematic review of 39 randomized controlled trials comparing different SUI procedures, midurethral slings and pubovaginal slings had similar cure rates. Pubovaginal slings, however, had more postoperative lower urinary tract symptoms and a higher reoperation rate.4
Pubovaginal slings require an 8-cm lower-abdominal incision, general or regional anesthesia, and hospitalization (usually). They also have higher risks of intraoperative bleeding and wound complications (including incisional hernias) than MUS. By contrast, MUS require 3 small 1-cm incisions and can be performed on an outpatient basis with local anesthesia and sedation. Postoperative recovery is significantly easier and shorter with MUS than with pubovaginal slings. Pubovaginal slings performed with human cadaveric material and porcine material have inferior outcomes to autologous material.5
Modifications to MUS included transobturator approaches, which have comparable efficacy to the retropubic approach.6 In this century, the full-length MUS procedures are the predominant SUI surgical procedure and the clear standard of care.
In a recent study involving 53 urologists and urogynecologists (of whom >90% were fellowship-trained), use of full-length MUS was the preferred procedure in 93% of primary stress incontinence surgical procedures.7 In fact, full-length MUS have been so successful and safe that extrapolation of a small ribbon of mesh under the midurethra to larger sheets of mesh for the entire vagina is what produced our current transvaginal mesh controversy. The vaginal erosion rates of 10% that have been seen with much larger pieces of transvaginal mesh are only 1% with MUS.8 Studies have not demonstrated common or significant vaginal pain or pain with intercourse after MUS.
Let’s educate our patients
In my clinical practice, I have found that educating patients about the safety and efficacy of synthetic MUS is extremely successful. I urge you to not replace on a widespread basis the most studied, safe, and successful treatment for SUI with a procedure that is considerably more invasive and complicated and can be more painful and require a longer recovery. We all must do our best to clear up the confusion created by misleading television advertisements by law firms. Full-length synthetic midurethral slings remain the current standard of care for stress incontinence surgery.
The July 2011 FDA safety warning urged patients to ask their surgeons about the benefits and risks of mesh use before going forward with surgery involving synthetic mesh. The American Urogynecologic Society developed the AUGS Transvaginal Mesh Informed Consent Toolkit to aid surgeons in answering patients’ questions. This toolkit is available online (www.augs.org/informedconsent). Among other resources, you will find guidance on answering the following questions:
- Why do you think I am a good candidate for mesh?
- Why are you choosing surgical mesh for my repair?
- How likely is it that my repair could be successfully performed without using surgical mesh?
- What results have other patients had with this product?
- Which specific side effects should I report to you after surgery?
INSTANT POLL. How do you educate your patients on the use of surgical mesh? Click here
1. Center for Devices and Radiological Health, Food and Drug Administration. Urogynecologic Surgical Mesh: Update on the Safety and Effectiveness of Vaginal Placement for Pelvic Organ Prolapse. Silver Spring, MD: Food and Drug Administration; July 2011. www.fda.gov/downloads/medcaldevices/safety/…/UCM262760.pdf. Accessed October 15, 2012.
2. Urogynecologic Surgical Mesh Implants. FDA Web site. http://www.fda.gov/MedicalDevices/ProductsandMedicalProcedures/ImplantsandProsthetics/UroGynSurgicalMesh/default.htm. Updated January 4, 2012. Accessed October 15, 2012.
3. Ulmsten U, Henriksson L, Johnson P, Varhos G. An ambulatory surgical procedure under local anesthesia for treatment of female urinary incontinence. Int Urogynecol J Pelvic Floor Dysfunct. 1996;7(2):81-55.
4. Novara G, Artibani W, Barber MD, et al. Updated systematic review and meta-analysis of the comparative data on colposuspensions, pubovaginal slings, and midurethral tapes in the surgical treatment of female stress urinary incontinence. Eur Urol. 2010;58(2):218-238.
5. Simsiman AJ, Powell CR, Stratford RR, Menefee SA. Suburethral sling materials: best outcome with autologous tissue. Am J Obstet Gynecol. 2005;193(6):2112-2116.
6. Richter HE, Albo ME, Zyczynski HM, et al. Urinary Incontinence Treatment Network. Retropubic versus transobturator midurethral slings for stress incontinence. N Engl J Med. 2010;362(22):2066-2076.
7. Nager CW, Brubaker L, Litman HJ, et al. Urinary Incontinence Treatment Network A randomized trial of urodynamic testing before stress-incontinence surgery. N Engl J Med. 2012;366(21):1987-1997.
8. Novara G, Galfano A, Boscolo-Berto R, et al. Complication rates of tension- free midurethral slings in the treatement of female stress urinary incontinence: a systematic review and meta-analysis of randomized controlled trials comparing tension-free midurethral tapes to other surgical procedures and different devices. European Urology. 2008;53(2):288-308.
Win Whitcomb: Hospital Readmissions Penalties Start Now

The uproar and confusion over readmissions penalties has consumed umpteen hours of senior leaders’ time (especially that of CFOs), not to mention that of front-line nurses, case managers, quality-improvement (QI) coordinators, hospitalists, and others involved in discharge planning and ensuring a safe transition for patients out of the hospital. For many, the math is fuzzy, and for most, the return on investment is even fuzzier. After all, avoided readmissions are lost revenue to those who are running a business known as an acute-care hospital.
Let me start with the conclusion: Eliminating avoidable readmissions is the right thing to do, period. But the financial downside to doing so is probably greater than any upside realized through avoidance of the penalties that began affecting hospital payments on Oct. 1—at least in the fee-for-service world we live in. At some point in the future, when most patients are under a global payment, the math might be clearer, but today, penalties probably won’t offset lost revenue from reduced readmissions added to the cost of paying lots of people to work in meetings (and at the bedside) to devise better care transitions. (Caveat: If your hospital is bursting at the seams with full occupancy, reducing readmissions and replacing them with higher-reimbursing patients, such as those undergoing elective major surgery, likely will be a net financial gain for your hospital.)
Part of the Affordable Care Act (ACA), the Hospital Readmissions Reduction Program (HRRP) will reduce total Medicare DRG reimbursement for hospitals beginning in fiscal-year 2013 based on actual 30-day readmission rates for myocardial infarction (MI), heart failure (HF), and pneumonia that are in excess of risk-adjusted expected rates. The reduction is capped at 1% in 2013, 2% in 2014, and 3% in 2015 and beyond. Hospital readmission rates are based on calculated baseline rates using Medicare data from July 1, 2008, to June 30, 2011.
Cost of a Readmissions-Reduction Program
How much does it cost for a hospital to implement a care-transitions program—such as SHM’s Project BOOST—to reduce readmissions? Last year, I interviewed a dozen hospitals that successfully implemented SHM’s formal mentored implementation program. The result? In the first year of the program, hospitals spent about $170,000 on training and staff time devoted to the project.
Lost Revenue
Let’s look at a sample penalty calculation, then examine a scenario sizing up how revenue is lost when a hospital is successful in reducing readmissions. The ACA defines the payments for excess readmissions as:
The number of patients with the applicable condition (HF, MI, or pneumonia) multiplied by the base DRG payment made for those patients multiplied by the percentage of readmissions beyond the expected.
As an example, let’s take a hospital that treats 500 pneumonia patients (# with the applicable condition), has a base DRG payment for pneumonia of $5,000, and a readmission rate that is 4% higher than expected (in this example, the actual rate is 25% and the expected rate is 24%; 1/25=4%). The penalty is 500 X $5,000 X .04, or $100,000. We’ll assume that the readmission rate for myocardial infarction and heart failure are less than expected, so the total penalty is $100,000.

Let’s say the hospital works hard to decrease pneumonia readmissions from 25% to 20% and avoids the penalty. As outlined in Table 1, the hospital will lose $100,000 in revenue (admittedly, reducing readmissions to 20% from 25% represents a big jump, but this is for illustration purposes—we haven’t added in lost revenue from reduced readmissions for other conditions). What’s the final cost of avoiding the $100,000 readmission penalty? Lost revenue of $100,000 plus the cost of implementing the readmission reduction program of $170,000=$270,000.
Why Are We Doing This?
I see the value in care transitions and readmissions-reduction programs, such as Project BOOST, first and foremost as a way to improve patient safety; as such, if implemented effectively, they are likely worth the investment. Second, their value lies in the preparation all hospitals and health systems should be undergoing to remain market-competitive and solvent under global payment systems. Because the penalties in the HRRP might come with lost revenues and the costs of program implementation, be clear about your team’s motivation for reducing readmissions. Your CFO will see to it if I don’t.
Dr. Whitcomb is medical director of healthcare quality at Baystate Medical Center in Springfield, Mass. He is a co-founder and past president of SHM. Email him at [email protected].
The View From

SHM is an advocate for the move toward more global payment systems, as well as payment methodologies that reward good outcomes and processes over volume. System improvements require leadership and front-line physicians who are able to implement and evaluate new care-delivery models. SHM offers resources and tools to support the HM community in this era of change through leadership training (www.hospitalmedicine.com/leadership), professional development and mentoring in QI programs (www.hospitalmedicine.org/QI), and other practical tools, such as the value-based purchasing toolkit (www.hospitalmedicine.org/HVBP).
Additionally, the Project BOOST toolkit (www.hospitalmedicine.org/BOOST) includes a return-on-investment calculator to use in your institution’s efforts in reducing readmissions. The calculator is built both for fee-for-service and accountable-care-organization payment models, and it can serve as an adjunct to estimates provided to your hospital of penalties for excess readmissions under HRRP.
The uproar and confusion over readmissions penalties has consumed umpteen hours of senior leaders’ time (especially that of CFOs), not to mention that of front-line nurses, case managers, quality-improvement (QI) coordinators, hospitalists, and others involved in discharge planning and ensuring a safe transition for patients out of the hospital. For many, the math is fuzzy, and for most, the return on investment is even fuzzier. After all, avoided readmissions are lost revenue to those who are running a business known as an acute-care hospital.
Let me start with the conclusion: Eliminating avoidable readmissions is the right thing to do, period. But the financial downside to doing so is probably greater than any upside realized through avoidance of the penalties that began affecting hospital payments on Oct. 1—at least in the fee-for-service world we live in. At some point in the future, when most patients are under a global payment, the math might be clearer, but today, penalties probably won’t offset lost revenue from reduced readmissions added to the cost of paying lots of people to work in meetings (and at the bedside) to devise better care transitions. (Caveat: If your hospital is bursting at the seams with full occupancy, reducing readmissions and replacing them with higher-reimbursing patients, such as those undergoing elective major surgery, likely will be a net financial gain for your hospital.)
Part of the Affordable Care Act (ACA), the Hospital Readmissions Reduction Program (HRRP) will reduce total Medicare DRG reimbursement for hospitals beginning in fiscal-year 2013 based on actual 30-day readmission rates for myocardial infarction (MI), heart failure (HF), and pneumonia that are in excess of risk-adjusted expected rates. The reduction is capped at 1% in 2013, 2% in 2014, and 3% in 2015 and beyond. Hospital readmission rates are based on calculated baseline rates using Medicare data from July 1, 2008, to June 30, 2011.
Cost of a Readmissions-Reduction Program
How much does it cost for a hospital to implement a care-transitions program—such as SHM’s Project BOOST—to reduce readmissions? Last year, I interviewed a dozen hospitals that successfully implemented SHM’s formal mentored implementation program. The result? In the first year of the program, hospitals spent about $170,000 on training and staff time devoted to the project.
Lost Revenue
Let’s look at a sample penalty calculation, then examine a scenario sizing up how revenue is lost when a hospital is successful in reducing readmissions. The ACA defines the payments for excess readmissions as:
The number of patients with the applicable condition (HF, MI, or pneumonia) multiplied by the base DRG payment made for those patients multiplied by the percentage of readmissions beyond the expected.
As an example, let’s take a hospital that treats 500 pneumonia patients (# with the applicable condition), has a base DRG payment for pneumonia of $5,000, and a readmission rate that is 4% higher than expected (in this example, the actual rate is 25% and the expected rate is 24%; 1/25=4%). The penalty is 500 X $5,000 X .04, or $100,000. We’ll assume that the readmission rate for myocardial infarction and heart failure are less than expected, so the total penalty is $100,000.
Let’s say the hospital works hard to decrease pneumonia readmissions from 25% to 20% and avoids the penalty. As outlined in Table 1, the hospital will lose $100,000 in revenue (admittedly, reducing readmissions to 20% from 25% represents a big jump, but this is for illustration purposes—we haven’t added in lost revenue from reduced readmissions for other conditions). What’s the final cost of avoiding the $100,000 readmission penalty? Lost revenue of $100,000 plus the cost of implementing the readmission reduction program of $170,000=$270,000.
Why Are We Doing This?
I see the value in care transitions and readmissions-reduction programs, such as Project BOOST, first and foremost as a way to improve patient safety; as such, if implemented effectively, they are likely worth the investment. Second, their value lies in the preparation all hospitals and health systems should be undergoing to remain market-competitive and solvent under global payment systems. Because the penalties in the HRRP might come with lost revenues and the costs of program implementation, be clear about your team’s motivation for reducing readmissions. Your CFO will see to it if I don’t.
Dr. Whitcomb is medical director of healthcare quality at Baystate Medical Center in Springfield, Mass. He is a co-founder and past president of SHM. Email him at [email protected].
The View From
SHM is an advocate for the move toward more global payment systems, as well as payment methodologies that reward good outcomes and processes over volume. System improvements require leadership and front-line physicians who are able to implement and evaluate new care-delivery models. SHM offers resources and tools to support the HM community in this era of change through leadership training (www.hospitalmedicine.com/leadership), professional development and mentoring in QI programs (www.hospitalmedicine.org/QI), and other practical tools, such as the value-based purchasing toolkit (www.hospitalmedicine.org/HVBP).
Additionally, the Project BOOST toolkit (www.hospitalmedicine.org/BOOST) includes a return-on-investment calculator to use in your institution’s efforts in reducing readmissions. The calculator is built both for fee-for-service and accountable-care-organization payment models, and it can serve as an adjunct to estimates provided to your hospital of penalties for excess readmissions under HRRP.
Does maternal exposure to magnesium sulfate affect fetal heart-rate patterns?
In contemporary obstetrics, electronic fetal monitoring (EFM) is used almost universally, and magnesium sulfate often is administered for seizure prophylaxis, tocolysis, or preterm neuroprotection. Given that magnesium crosses the placenta and is known to have both neurologic and cardiac effects and toxicities, it has been speculated that magnesium sulfate may change various characteristics of the fetal heart rate (FHR). Previous studies in small animals have failed to answer this common clinical question.
Details of the study
In this retrospective study from Washington University in St. Louis, Duffy and colleagues analyzed FHR tracings from 248 women who were exposed to magnesium sulfate, focusing on the 30 minutes just prior to delivery. These tracings were compared with those of 5,139 women who were not exposed to magnesium at all during the study.
All women in the study reached the second stage of labor, had at least 10 minutes of EFM recorded in the 30 minutes preceding delivery, and delivered at or beyond 37 weeks’ gestation. The groups were similar in regard to maternal race, mode of delivery, and tobacco and alcohol use. However, women exposed to magnesium were younger, had a higher body mass index and lower gravidity, and were more likely to be nulliparous and to have pregestational diabetes or gestational diabetes. In addition, women exposed to magnesium had a lower gestational age at delivery (38.4 [SD, 1.2] weeks vs 39.0 [SD, 1.2]weeks; P<.01), although no infants were born before 37 weeks.
Magnesium was given in accordance with the institution’s treatment guidelines for severe preeclampsia: a 6-g loading dose followed by a maintenance infusion of 2 g/hr, with monitoring for signs and symptoms of magnesium toxicity. (Magnesium was not given to women with mild preeclampsia.)
Two research nurses blinded to all exposure and outcome data used National Institute of Child Health and Human Development (NICHD) nomenclature to categorize FHR tracings. Magnesium exposure was associated with:
- a mean 3-beat difference in baseline FHR
- an increased likelihood of baseline FHR below 120 bpm
- greater likelihood that FHR variability was reduced or diminished.
The presence or number of accelerations or decelerations did not differ significantly between groups, but magnesium exposure was associated with fewer prolonged decelerations. These associations remained after excluding women who had adverse neonatal outcomes.
Fetal tachycardia was strongly associated with fetal acidemia and adverse neonatal outcomes in both groups. And prolonged decelerations were associated with an increased risk of fetal acidemia in women not exposed to magnesium and were present in all cases of fetal acidemia in exposed women.
The authors concluded that magnesium may mask signs of fetal distress.
Findings have little clinical utility
Despite the large numbers of women in this study and the rigorous methods utilized, the findings will be of little help to clinicians interpreting EFM tracings from fetuses whose mothers are receiving magnesium. The differences between groups were small, and the overwhelming majority of changes fell within the normal range.
More important than FHR changes is actual newborn condition. In a secondary analysis from the Beneficial Effects of Antenatal Magnesium trial from the Maternal-Fetal Medicine Units Network, Johnson and colleagues demonstrated that cord-blood magnesium levels did not predict the need for delivery room resuscitation.1 In this trial, pediatricians were blinded as to whether the mother was receiving magnesium or placebo. These results cast real doubt on the hypothesis that maternal magnesium exposure alters the condition of the fetus or newborn in a clinically meaningful way.
Be very cautious in attributing pathologic FHR changes (NICHD Category II or III) to magnesium sulfate exposure, and do not alter management decisions based on that attribution.
JOHN M. THORP, JR., MD
We want to hear from you! Tell us what you think.
ON OBSTETRICS?
Is elective delivery at 37 weeks’ gestation safe in uncomplicated twin pregnancies?
Steven T. Chasen, MD (September 2012)
Does mediolateral episiotomy reduce the risk of anal sphincter injury in operative vaginal delivery?
Errol T. Norwitz, MD, PhD (August 2012)
When macrosomia is suspected at term, does induction of labor lower the risk of cesarean delivery?
Jennifer T. Ahn, MD (May 2012)
Does vaginal progesterone reduce preterm delivery among asymptomatic women who have a short cervix in the midtrimester?
John T. Repke, MD (April 2012)
Reference
1. Johnson LH, Mapp DC, Rouse DJ, et al. Eunice Kennedy Shriver National Institute of Child Health and Human Development Maternal-Fetal Medicine Units Network. Association of cord blood magnesium concentration and neonatal resuscitation [published online ahead of print November 4, 2011]. J Pediatr. 2012;160 (4):573-577.e1.
In contemporary obstetrics, electronic fetal monitoring (EFM) is used almost universally, and magnesium sulfate often is administered for seizure prophylaxis, tocolysis, or preterm neuroprotection. Given that magnesium crosses the placenta and is known to have both neurologic and cardiac effects and toxicities, it has been speculated that magnesium sulfate may change various characteristics of the fetal heart rate (FHR). Previous studies in small animals have failed to answer this common clinical question.
Details of the study
In this retrospective study from Washington University in St. Louis, Duffy and colleagues analyzed FHR tracings from 248 women who were exposed to magnesium sulfate, focusing on the 30 minutes just prior to delivery. These tracings were compared with those of 5,139 women who were not exposed to magnesium at all during the study.
All women in the study reached the second stage of labor, had at least 10 minutes of EFM recorded in the 30 minutes preceding delivery, and delivered at or beyond 37 weeks’ gestation. The groups were similar in regard to maternal race, mode of delivery, and tobacco and alcohol use. However, women exposed to magnesium were younger, had a higher body mass index and lower gravidity, and were more likely to be nulliparous and to have pregestational diabetes or gestational diabetes. In addition, women exposed to magnesium had a lower gestational age at delivery (38.4 [SD, 1.2] weeks vs 39.0 [SD, 1.2]weeks; P<.01), although no infants were born before 37 weeks.
Magnesium was given in accordance with the institution’s treatment guidelines for severe preeclampsia: a 6-g loading dose followed by a maintenance infusion of 2 g/hr, with monitoring for signs and symptoms of magnesium toxicity. (Magnesium was not given to women with mild preeclampsia.)
Two research nurses blinded to all exposure and outcome data used National Institute of Child Health and Human Development (NICHD) nomenclature to categorize FHR tracings. Magnesium exposure was associated with:
- a mean 3-beat difference in baseline FHR
- an increased likelihood of baseline FHR below 120 bpm
- greater likelihood that FHR variability was reduced or diminished.
The presence or number of accelerations or decelerations did not differ significantly between groups, but magnesium exposure was associated with fewer prolonged decelerations. These associations remained after excluding women who had adverse neonatal outcomes.
Fetal tachycardia was strongly associated with fetal acidemia and adverse neonatal outcomes in both groups. And prolonged decelerations were associated with an increased risk of fetal acidemia in women not exposed to magnesium and were present in all cases of fetal acidemia in exposed women.
The authors concluded that magnesium may mask signs of fetal distress.
Findings have little clinical utility
Despite the large numbers of women in this study and the rigorous methods utilized, the findings will be of little help to clinicians interpreting EFM tracings from fetuses whose mothers are receiving magnesium. The differences between groups were small, and the overwhelming majority of changes fell within the normal range.
More important than FHR changes is actual newborn condition. In a secondary analysis from the Beneficial Effects of Antenatal Magnesium trial from the Maternal-Fetal Medicine Units Network, Johnson and colleagues demonstrated that cord-blood magnesium levels did not predict the need for delivery room resuscitation.1 In this trial, pediatricians were blinded as to whether the mother was receiving magnesium or placebo. These results cast real doubt on the hypothesis that maternal magnesium exposure alters the condition of the fetus or newborn in a clinically meaningful way.
Be very cautious in attributing pathologic FHR changes (NICHD Category II or III) to magnesium sulfate exposure, and do not alter management decisions based on that attribution.
JOHN M. THORP, JR., MD
We want to hear from you! Tell us what you think.
ON OBSTETRICS?
Is elective delivery at 37 weeks’ gestation safe in uncomplicated twin pregnancies?
Steven T. Chasen, MD (September 2012)
Does mediolateral episiotomy reduce the risk of anal sphincter injury in operative vaginal delivery?
Errol T. Norwitz, MD, PhD (August 2012)
When macrosomia is suspected at term, does induction of labor lower the risk of cesarean delivery?
Jennifer T. Ahn, MD (May 2012)
Does vaginal progesterone reduce preterm delivery among asymptomatic women who have a short cervix in the midtrimester?
John T. Repke, MD (April 2012)
Reference
1. Johnson LH, Mapp DC, Rouse DJ, et al. Eunice Kennedy Shriver National Institute of Child Health and Human Development Maternal-Fetal Medicine Units Network. Association of cord blood magnesium concentration and neonatal resuscitation [published online ahead of print November 4, 2011]. J Pediatr. 2012;160 (4):573-577.e1.
Does treatment of cervical intraepithelial neoplasia always increase the risk of preterm birth in subsequent gestations?
Several studies have suggested that the risk of preterm birth increases after treatment for CIN. For example, a meta-analysis of 27 studies found a relative risk (RR) of preterm delivery of 1.70 after treatment for CIN (95% confidence interval [CI], 1.24–2.35).1 Later studies from Nordic countries estimated the RR at 1.8 to 2.8.2,3
In the United Kingdom, women who have abnormal findings at the time of cervical cancer screening are referred to clinics that specialize in the assessment and management of CIN. At these clinics, colposcopy and punch cervical biopsy are used to evaluate patients. When treatment is warranted, loop electrosurgical excision procedures (LEEP) are the most common intervention.
Details of the study
Investigators focused on two groups of women referred to large colposcopy clinics (more than 550 new patients annually) between 1987 and 2009:
- untreated group: those who underwent punch biopsy only
- treatment group: those who had an excisional procedure.
Women were followed both retrospectively (previous births) and prospectively (subsequent births) to assess gestational age at delivery. The risk of preterm birth (<37 weeks) was compared between groups.
Among women who delivered after colposcopy, the risk of preterm birth was significantly higher in the treatment group than in the untreated group (adjusted RR, 1.19; P<.05). However, when investigators focused on births prior to colposcopy, the risk of preterm delivery was significantly higher in women who were subsequently treated than in those who were untreated (RR, 1.31; P<.05).
Among untreated women who had a birth prior to evaluation for CIN, the risk of preterm delivery in the subsequent pregnancy was marginally, though significantly, higher than the risk associated with the delivery prior to biopsy (RR, 1.14; P<.05). However, among treated women, the risk of preterm delivery was marginally lower after treatment, compared with their risk in the pregnancy before treatment (RR, 0.94; P>.05).
Expertise of the physician may play a role
in the risk of preterm birth
This study’s finding of a higher risk of preterm birth after treatment, compared with before treatment, would seem to support earlier studies that show an increased risk of preterm birth after LEEP. However, the finding that women destined to undergo treatment of CIN had a higher rate of preterm delivery before that treatment is surprising. And the fact that women who gave birth both before and after treatment had no elevated risk of preterm delivery in the later pregnancy is even more startling.
So what are we to make of these data? They suggest that, at least among women receiving care at high-volume specialty clinics in England, the treatment of CIN does not increase the risk of preterm delivery. Castanon and colleagues hypothesize that the clinicians who work in these clinics may remove less tissue during treatment than other clinicians do, minimizing the risk of later preterm delivery.
A cervical cancer screening expert weighs in
Tom Cox, MD, is past president of ASCCP, the Society for Lower Genital Tract Disease, and a widely published expert on cervical cancer screening. He is also an OBG Management Contributing Editor. When asked for his take on the conclusions of Castanon and colleagues, he agreed that the data are highly credible.
“The findings are different than most of the world literature on this subject,” he continued, “and it may be indeed, as the authors suggest, due to less tissue being removed during surgical excision procedures in England, compared with other countries. If that is true, it may be because colposcopists in the United Kingdom receive a higher level of training and are subject to more rigorous quality control than we have in the United States and in other countries—although most of the studies demonstrating odds ratios of 2 to 3 for preterm birth following treatment have been conducted in Scandinavian countries known for their high-quality medical care.”
Castanon and colleagues are at work on Phase 2 of this study, and Dr. Cox anticipates that its findings will help determine why CIN treatment did not increase the risk of preterm delivery.
“Although colposcopy training is far less rigorous in the United States, and quality control is virtually lacking, it has been thought that, in general, the size of cervical excisions in the United States are likely to have been smaller than in the United Kingdom, where large loop excision of the T-zone (LLETZ), using larger loops than with LEEP, has been common. So it will be interesting to see the authors’ promised Phase 2 article, which compares the size of the excision with outcomes.
These important findings should inform decisions about who should treat CIN and how they should treat it. Practitioners who manage a high volume of lower genital tract disease and take care to minimize tissue excision and destruction at the time of treatment are likely those whose patients have the best obstetric outcomes following treatment for CIN.
ANDREW M. KAUNITZ, MD
We want to hear from you! Tell us what you think.
ON GYNECOLOGY?
What is the optimal interval for osteoporosis screening in postmenopausal women before fracture occurrence and osteoporosis treatment initiation?
Steven R. Goldstein, MD (August 2012)
Does long-acting reversible contraception prevent unintended pregnancy better than OCs, transdermal patch, and vaginal ring-regardless of a patient’s age?
Andrew M. Kaunitz, MD (July 2012)
In women who have stress incontinence and intrinsic sphincter deficiency, which midurethral sling produces the best long-term results?
Ladin A. Yurteri-Kaplan, MD; Amy J. Park, MD (June 2012)
1. Kyrgiou M, Koliopoulos G, Martin-Hirsch P, Arbyn M, Prendville W, Paraskevaidis E. Obstetric outcomes after conservative treatment for intraepithelial or early invasive cervical lesions: systematic review and meta-analysis. Lancet. 2006;367(9509):489-498.
2. Albrechtsen S, Rasmussen S, Thoresen S, Irgens LM, Iversen OE. Pregnancy outcome in women before and after cervical conisation: population-based cohort study. BMJ. 2008;337:a1343.-doi: 10.1136/bmj.a1343.
3. Jakobsson M, Gissler M, Paavonen J, Tapper AM. Loop electrosurgical excision procedure and the risk for preterm birth. Obstet Gynecol. 2009;114(3):504-510.
Several studies have suggested that the risk of preterm birth increases after treatment for CIN. For example, a meta-analysis of 27 studies found a relative risk (RR) of preterm delivery of 1.70 after treatment for CIN (95% confidence interval [CI], 1.24–2.35).1 Later studies from Nordic countries estimated the RR at 1.8 to 2.8.2,3
In the United Kingdom, women who have abnormal findings at the time of cervical cancer screening are referred to clinics that specialize in the assessment and management of CIN. At these clinics, colposcopy and punch cervical biopsy are used to evaluate patients. When treatment is warranted, loop electrosurgical excision procedures (LEEP) are the most common intervention.
Details of the study
Investigators focused on two groups of women referred to large colposcopy clinics (more than 550 new patients annually) between 1987 and 2009:
- untreated group: those who underwent punch biopsy only
- treatment group: those who had an excisional procedure.
Women were followed both retrospectively (previous births) and prospectively (subsequent births) to assess gestational age at delivery. The risk of preterm birth (<37 weeks) was compared between groups.
Among women who delivered after colposcopy, the risk of preterm birth was significantly higher in the treatment group than in the untreated group (adjusted RR, 1.19; P<.05). However, when investigators focused on births prior to colposcopy, the risk of preterm delivery was significantly higher in women who were subsequently treated than in those who were untreated (RR, 1.31; P<.05).
Among untreated women who had a birth prior to evaluation for CIN, the risk of preterm delivery in the subsequent pregnancy was marginally, though significantly, higher than the risk associated with the delivery prior to biopsy (RR, 1.14; P<.05). However, among treated women, the risk of preterm delivery was marginally lower after treatment, compared with their risk in the pregnancy before treatment (RR, 0.94; P>.05).
Expertise of the physician may play a role
in the risk of preterm birth
This study’s finding of a higher risk of preterm birth after treatment, compared with before treatment, would seem to support earlier studies that show an increased risk of preterm birth after LEEP. However, the finding that women destined to undergo treatment of CIN had a higher rate of preterm delivery before that treatment is surprising. And the fact that women who gave birth both before and after treatment had no elevated risk of preterm delivery in the later pregnancy is even more startling.
So what are we to make of these data? They suggest that, at least among women receiving care at high-volume specialty clinics in England, the treatment of CIN does not increase the risk of preterm delivery. Castanon and colleagues hypothesize that the clinicians who work in these clinics may remove less tissue during treatment than other clinicians do, minimizing the risk of later preterm delivery.
A cervical cancer screening expert weighs in
Tom Cox, MD, is past president of ASCCP, the Society for Lower Genital Tract Disease, and a widely published expert on cervical cancer screening. He is also an OBG Management Contributing Editor. When asked for his take on the conclusions of Castanon and colleagues, he agreed that the data are highly credible.
“The findings are different than most of the world literature on this subject,” he continued, “and it may be indeed, as the authors suggest, due to less tissue being removed during surgical excision procedures in England, compared with other countries. If that is true, it may be because colposcopists in the United Kingdom receive a higher level of training and are subject to more rigorous quality control than we have in the United States and in other countries—although most of the studies demonstrating odds ratios of 2 to 3 for preterm birth following treatment have been conducted in Scandinavian countries known for their high-quality medical care.”
Castanon and colleagues are at work on Phase 2 of this study, and Dr. Cox anticipates that its findings will help determine why CIN treatment did not increase the risk of preterm delivery.
“Although colposcopy training is far less rigorous in the United States, and quality control is virtually lacking, it has been thought that, in general, the size of cervical excisions in the United States are likely to have been smaller than in the United Kingdom, where large loop excision of the T-zone (LLETZ), using larger loops than with LEEP, has been common. So it will be interesting to see the authors’ promised Phase 2 article, which compares the size of the excision with outcomes.
These important findings should inform decisions about who should treat CIN and how they should treat it. Practitioners who manage a high volume of lower genital tract disease and take care to minimize tissue excision and destruction at the time of treatment are likely those whose patients have the best obstetric outcomes following treatment for CIN.
ANDREW M. KAUNITZ, MD
We want to hear from you! Tell us what you think.
ON GYNECOLOGY?
What is the optimal interval for osteoporosis screening in postmenopausal women before fracture occurrence and osteoporosis treatment initiation?
Steven R. Goldstein, MD (August 2012)
Does long-acting reversible contraception prevent unintended pregnancy better than OCs, transdermal patch, and vaginal ring-regardless of a patient’s age?
Andrew M. Kaunitz, MD (July 2012)
In women who have stress incontinence and intrinsic sphincter deficiency, which midurethral sling produces the best long-term results?
Ladin A. Yurteri-Kaplan, MD; Amy J. Park, MD (June 2012)
1. Kyrgiou M, Koliopoulos G, Martin-Hirsch P, Arbyn M, Prendville W, Paraskevaidis E. Obstetric outcomes after conservative treatment for intraepithelial or early invasive cervical lesions: systematic review and meta-analysis. Lancet. 2006;367(9509):489-498.
2. Albrechtsen S, Rasmussen S, Thoresen S, Irgens LM, Iversen OE. Pregnancy outcome in women before and after cervical conisation: population-based cohort study. BMJ. 2008;337:a1343.-doi: 10.1136/bmj.a1343.
3. Jakobsson M, Gissler M, Paavonen J, Tapper AM. Loop electrosurgical excision procedure and the risk for preterm birth. Obstet Gynecol. 2009;114(3):504-510.
Does the risk of unplanned pregnancy outweigh the risk of VTE from hormonal contraception?
Let’s increase our use of IUDs and improve contraceptive effectiveness in this country
Robert L. Barbieri, MD (Editorial, August 2012)
Let’s increase our use of implants and DMPA and improve contraceptive effectiveness in this country
Robert L. Barbieri, MD (Editorial, September 2012)
It is well established that combined hormonal contraception increases the risk of venous thromboembolism (VTE), both deep venous thrombosis (DVT) and pulmonary embolism (PE).1 Concerns exist that drospirenone-containing combined oral contraceptives (OCs), the norelgestromin patch, and the etonogestrel vaginal ring may increase the risk of VTE, compared with second-generation OCs, although results from studies evaluating the thromboembolic risk of these products are conflicting.1,2
An April 2012 safety communication from the US Food and Drug Administration (FDA) reported that “drospirenone-containing birth control pills may be associated with a higher risk for blood clots than other progestin-containing pills.”3 These pills now carry revised drug labels stating that epidemiologic studies that compared the risk of VTE reported that the risk ranged from no increase to a three-fold increase.3
Together, these studies and the FDA warning have garnered a lot of publicity and caused confusion and concern, leading both patients and providers to ask, “Are these specific products really safe?”
What is the baseline risk?
For nonusers of hormonal contraception, the baseline risk of VTE is 1 to 5 events per 10,000 woman-years.1,3-5 Variables that increase a woman’s risk of VTE include1:
- advanced age
- obesity
- immobility
- hematologic disorders
- pregnancy.
Estrogen-containing OCs with second-generation progestins (levonorgestrel, norgestimate, and norethindrone) have a risk of VTE of approximately 3 to 9 events per 10,000 woman-years.1,3-5
When study results conflict
The relative risk of VTE associated with drospirenone-containing OCs, compared with second-generation pills, ranges from 0.9 to 3.3. The relative risk is 1.2 to 2.2 for the norelgestromin patch, and 1.6 to 1.9 for the etonogestrel ring.1-4
All of the studies addressing the increased risk of VTE with drospirenone, the patch, and the ring have some limitations, such as the use of retrospective data, selection bias, study design, or inclusion of multiple pill regimens. However, most of the studies that found no association between these methods and VTE were industry-funded.2 Criticisms of these studies have led to disagreement about the risk; it is unclear whether a definitive study ever can be designed and performed.2
Worst-case scenario. Using data from only those studies that show an increased risk of VTE, the increased number of VTE events above that conferred by a second-generation progestin would be approximately2:
- ring: 3–5/10,000 woman-years
- patch: 3–8/10,000 woman-years
- drospirenone pill: 5–10/10,000 woman-years (risk may be highest in the first year of use3).
Adding perspective
The risks of hormonal contraception must be weighed against the consequences of using no contraception: 43 million women in the United States are sexually active but do not wish to become pregnant. Without contraception, 85% will be pregnant within 1 year.6 The risk of mortality during pregnancy in the United States is 1.8 deaths per 10,000 live births (5.5 deaths per 10,000 live births for women older than 39 years).7The prevalence of VTE during pregnancy is 5 to 29 events per 10,000 women; during the postpartum period, the prevalence is 40 to 65 events per 10,000 women (although some quote the VTE risk during the postpartum period to be as high as 200 to 400 events per 10,000 women).3,5,8
An unplanned pregnancy is more likely than a planned pregnancy to have a poor perinatal outcome or to end in abortion. The socioeconomic benefits of planning pregnancies must also be considered.

Hormonal contraception confers benefits beyond the prevention of pregnancy. In addition to a 50% reduction in the rate of endometrial cancer and a 27% reduction in the rate of ovarian cancer (and an even greater reduction for women who take OCs longer than 5 years), there are other benefits to hormonal contraception, such as reduced acne, dysmenorrhea, and menorrhagia.9
Individualize your care
When choosing a method of contraception, it is important not only to consider thromboembolic risk but also:
- previous contraceptive experiences
- previous pregnancies
- patient preference
- efficacy
- individual health factors
- cost.
For instance, even though the risk of VTE may be slightly increased among women using the norelgestromin patch, compliance rates are higher with the patch than with the pill.10 A woman with two unplanned pregnancies while taking the pill who reports having difficulty adhering to a daily regimen is a different patch candidate than a woman who has successfully planned two pregnancies using OCs.
For many women, a weekly or monthly reversible contraceptive is the most desirable method. In addition to these more quantifiable factors, some women prefer a specific brand of pill or delivery method—and satisfaction is a key component of contraception adherence.
Educate your patient
I favor the approach of providing as much data as possible. Patients may read the black box warning in the package inserts for drospirenone-containing pills or the norelgestromin patch, find news sources that inaccurately report risk to garner the most compelling headline, or stumble across plaintiff’s lawyers advertising lawsuits for drospirenone-containing pills, the contraceptive ring, and the patch. I can best counter confusion or misinformation by providing accurate information and putting possible risks into perspective up front. I now explain that the risk for VTE may be higher with certain pills, the ring, and the patch, but there just aren’t enough high-quality data to be certain. I also explain that risk may mean different things for different patients, based on medical history and previous experiences. I have found that my patients appreciate the full disclosure.
Overall, the benefits of combined hormonal contraception with all methods outweigh the risk of VTE. In addition, issues related to switching contraceptive methods may increase the risk of an unplanned pregnancy. In 1995, when the United Kingdom warned that desogestrel pills carried an increased risk of VTE but were still “safe,” the incidence of unplanned pregnancies and abortions increased.2,11 The data regarding the risk of VTE associated with drospirenone, the patch, and the ring should not be an impetus for sweeping generalizations, but rather an opportunity to educate our patients (and ourselves) and to further individualize care.
Do you agree that the benefits of combined hormonal contraception with all methods outweigh the VTE risk? Why or why not? What do you do in your practice? Click here
Click here to find additional articles on contraception published in OBG Management
in 2012.
1. Lidegaard Ø, Milsom I, Geirsson R, Skjeldestad F. Hormonal contraception and venous thromboembolism. Acta Obstet Gynecol Scand. 2012;91(7):769-778.
2. Raymond EG, Burke AE, Espey E. Combined hormonal contraceptives and venous thromboembolism: putting the risks into perspective. Obstet Gynecol. 2012;119(5):1039-1044.
3. US Food and Drug Administration. Safety Announcement. Updated information about the risk of blood clots in women taking birth control pills containing drospirenone. http://www.fda.gov/Drugs/DrugSafety/ucm299305.htm. Published April 10 2012. Accessed September 11, 2012.
4. Lidegaard Ø, Nielsen L, Skovlund C, Løkkegaard E. Venous thrombosis in users of non-oral hormonal contraception: follow-up study Denmark 2001-10 [published online ahead of print May 10, 2012]. BMJ. 2012:344-353:e2990. doi: 10.1136 /bmj.e2990.
5. Oral contraceptives and the risk of thromboembolism: an update. Clinical practice Guideline No. 252. Society of Obstetricians and Gynaecologists of Canada. 2010;252. http://www.sogc.org/guidelines/documents/gui252CPG1012E.pdf. Accessed September 5, 2012.
6. Fact Sheet Contraceptive use in the United States. Guttmacher Institute. http://www.guttmacher.org/pubs/fb_contr_use.html. Published July 2012. Accessed September 5 2012.
7. Berg CJ, Callaghan WM, Syverson C, Henderson Z. Pregnancy related mortality in the United States 1998 to 2005. Obstet Gynecol. 2010;116(6):1302-1309.
8. James A. Committee on Practice Bulletins-Obstetrics. ACOG Practice Bulletin No. 123. Thromboembolism in pregnancy. Obstet Gynecol. 2011;118(3):718-729.
9. Committee on Practice Bulletins-Gynecology. ACOG Practice Bulletin No. 110. Noncontraceptive uses of hormonal contraception. Obstet Gynecol. 2010;115(1):206-218.
10. Archer DF, Bigrigg A, Smallwood GH, Shangold GA, Creasy GW, Fisher AC. Assessment of compliance with a weekly contraceptive patch (OrthoEvra/Evra) among North American women. Fertil Steril. 2002;77(2 suppl 2):S27-S31.
11. Furedi A. The public health implications of the 1995 ‘pill scare.’ Hum Reprod Update. 1999;5(6):621-626.

Jennifer Gunter, MD
Dr. Gunter is an ObGyn in San Francisco. She is the author of The Preemie Primer: A Complete Guide for Parents of Premature Babies—from Birth through the Toddler Years and Beyond (Da Capo Press, 2010). Dr. Gunter blogs at http://www.drjengunter.com, and you can find her on Twitter at @DrJenGunter. Dr. Gunter is an OBG Management Contributing Editor.
Dr. Gunter reports no financial relationships relevant to this article.
Let’s increase our use of IUDs and improve contraceptive effectiveness in this country
Robert L. Barbieri, MD (Editorial, August 2012)
Let’s increase our use of implants and DMPA and improve contraceptive effectiveness in this country
Robert L. Barbieri, MD (Editorial, September 2012)
It is well established that combined hormonal contraception increases the risk of venous thromboembolism (VTE), both deep venous thrombosis (DVT) and pulmonary embolism (PE).1 Concerns exist that drospirenone-containing combined oral contraceptives (OCs), the norelgestromin patch, and the etonogestrel vaginal ring may increase the risk of VTE, compared with second-generation OCs, although results from studies evaluating the thromboembolic risk of these products are conflicting.1,2
An April 2012 safety communication from the US Food and Drug Administration (FDA) reported that “drospirenone-containing birth control pills may be associated with a higher risk for blood clots than other progestin-containing pills.”3 These pills now carry revised drug labels stating that epidemiologic studies that compared the risk of VTE reported that the risk ranged from no increase to a three-fold increase.3
Together, these studies and the FDA warning have garnered a lot of publicity and caused confusion and concern, leading both patients and providers to ask, “Are these specific products really safe?”
What is the baseline risk?
For nonusers of hormonal contraception, the baseline risk of VTE is 1 to 5 events per 10,000 woman-years.1,3-5 Variables that increase a woman’s risk of VTE include1:
- advanced age
- obesity
- immobility
- hematologic disorders
- pregnancy.
Estrogen-containing OCs with second-generation progestins (levonorgestrel, norgestimate, and norethindrone) have a risk of VTE of approximately 3 to 9 events per 10,000 woman-years.1,3-5
When study results conflict
The relative risk of VTE associated with drospirenone-containing OCs, compared with second-generation pills, ranges from 0.9 to 3.3. The relative risk is 1.2 to 2.2 for the norelgestromin patch, and 1.6 to 1.9 for the etonogestrel ring.1-4
All of the studies addressing the increased risk of VTE with drospirenone, the patch, and the ring have some limitations, such as the use of retrospective data, selection bias, study design, or inclusion of multiple pill regimens. However, most of the studies that found no association between these methods and VTE were industry-funded.2 Criticisms of these studies have led to disagreement about the risk; it is unclear whether a definitive study ever can be designed and performed.2
Worst-case scenario. Using data from only those studies that show an increased risk of VTE, the increased number of VTE events above that conferred by a second-generation progestin would be approximately2:
- ring: 3–5/10,000 woman-years
- patch: 3–8/10,000 woman-years
- drospirenone pill: 5–10/10,000 woman-years (risk may be highest in the first year of use3).
Adding perspective
The risks of hormonal contraception must be weighed against the consequences of using no contraception: 43 million women in the United States are sexually active but do not wish to become pregnant. Without contraception, 85% will be pregnant within 1 year.6 The risk of mortality during pregnancy in the United States is 1.8 deaths per 10,000 live births (5.5 deaths per 10,000 live births for women older than 39 years).7The prevalence of VTE during pregnancy is 5 to 29 events per 10,000 women; during the postpartum period, the prevalence is 40 to 65 events per 10,000 women (although some quote the VTE risk during the postpartum period to be as high as 200 to 400 events per 10,000 women).3,5,8
An unplanned pregnancy is more likely than a planned pregnancy to have a poor perinatal outcome or to end in abortion. The socioeconomic benefits of planning pregnancies must also be considered.
Hormonal contraception confers benefits beyond the prevention of pregnancy. In addition to a 50% reduction in the rate of endometrial cancer and a 27% reduction in the rate of ovarian cancer (and an even greater reduction for women who take OCs longer than 5 years), there are other benefits to hormonal contraception, such as reduced acne, dysmenorrhea, and menorrhagia.9
Individualize your care
When choosing a method of contraception, it is important not only to consider thromboembolic risk but also:
- previous contraceptive experiences
- previous pregnancies
- patient preference
- efficacy
- individual health factors
- cost.
For instance, even though the risk of VTE may be slightly increased among women using the norelgestromin patch, compliance rates are higher with the patch than with the pill.10 A woman with two unplanned pregnancies while taking the pill who reports having difficulty adhering to a daily regimen is a different patch candidate than a woman who has successfully planned two pregnancies using OCs.
For many women, a weekly or monthly reversible contraceptive is the most desirable method. In addition to these more quantifiable factors, some women prefer a specific brand of pill or delivery method—and satisfaction is a key component of contraception adherence.
Educate your patient
I favor the approach of providing as much data as possible. Patients may read the black box warning in the package inserts for drospirenone-containing pills or the norelgestromin patch, find news sources that inaccurately report risk to garner the most compelling headline, or stumble across plaintiff’s lawyers advertising lawsuits for drospirenone-containing pills, the contraceptive ring, and the patch. I can best counter confusion or misinformation by providing accurate information and putting possible risks into perspective up front. I now explain that the risk for VTE may be higher with certain pills, the ring, and the patch, but there just aren’t enough high-quality data to be certain. I also explain that risk may mean different things for different patients, based on medical history and previous experiences. I have found that my patients appreciate the full disclosure.
Overall, the benefits of combined hormonal contraception with all methods outweigh the risk of VTE. In addition, issues related to switching contraceptive methods may increase the risk of an unplanned pregnancy. In 1995, when the United Kingdom warned that desogestrel pills carried an increased risk of VTE but were still “safe,” the incidence of unplanned pregnancies and abortions increased.2,11 The data regarding the risk of VTE associated with drospirenone, the patch, and the ring should not be an impetus for sweeping generalizations, but rather an opportunity to educate our patients (and ourselves) and to further individualize care.
Do you agree that the benefits of combined hormonal contraception with all methods outweigh the VTE risk? Why or why not? What do you do in your practice? Click here
Click here to find additional articles on contraception published in OBG Management
in 2012.
1. Lidegaard Ø, Milsom I, Geirsson R, Skjeldestad F. Hormonal contraception and venous thromboembolism. Acta Obstet Gynecol Scand. 2012;91(7):769-778.
2. Raymond EG, Burke AE, Espey E. Combined hormonal contraceptives and venous thromboembolism: putting the risks into perspective. Obstet Gynecol. 2012;119(5):1039-1044.
3. US Food and Drug Administration. Safety Announcement. Updated information about the risk of blood clots in women taking birth control pills containing drospirenone. http://www.fda.gov/Drugs/DrugSafety/ucm299305.htm. Published April 10 2012. Accessed September 11, 2012.
4. Lidegaard Ø, Nielsen L, Skovlund C, Løkkegaard E. Venous thrombosis in users of non-oral hormonal contraception: follow-up study Denmark 2001-10 [published online ahead of print May 10, 2012]. BMJ. 2012:344-353:e2990. doi: 10.1136 /bmj.e2990.
5. Oral contraceptives and the risk of thromboembolism: an update. Clinical practice Guideline No. 252. Society of Obstetricians and Gynaecologists of Canada. 2010;252. http://www.sogc.org/guidelines/documents/gui252CPG1012E.pdf. Accessed September 5, 2012.
6. Fact Sheet Contraceptive use in the United States. Guttmacher Institute. http://www.guttmacher.org/pubs/fb_contr_use.html. Published July 2012. Accessed September 5 2012.
7. Berg CJ, Callaghan WM, Syverson C, Henderson Z. Pregnancy related mortality in the United States 1998 to 2005. Obstet Gynecol. 2010;116(6):1302-1309.
8. James A. Committee on Practice Bulletins-Obstetrics. ACOG Practice Bulletin No. 123. Thromboembolism in pregnancy. Obstet Gynecol. 2011;118(3):718-729.
9. Committee on Practice Bulletins-Gynecology. ACOG Practice Bulletin No. 110. Noncontraceptive uses of hormonal contraception. Obstet Gynecol. 2010;115(1):206-218.
10. Archer DF, Bigrigg A, Smallwood GH, Shangold GA, Creasy GW, Fisher AC. Assessment of compliance with a weekly contraceptive patch (OrthoEvra/Evra) among North American women. Fertil Steril. 2002;77(2 suppl 2):S27-S31.
11. Furedi A. The public health implications of the 1995 ‘pill scare.’ Hum Reprod Update. 1999;5(6):621-626.