User login
Clozapine interrupted: APA, others seek FDA forum on REMS
In a Feb. 14 letter, the groups asked the FDA to reconsider its new risk evaluation and mitigation strategy (REMS) for clozapine because of concerns it had the potential to cause abrupt discontinuation of the medication.
The groups cite an Institute for Safe Medication Practices (ISMP) report of a 40-year-old woman who was a long-time clozapine user, had a cardiac arrest, and died after she stopped taking the drug because her psychiatrist was unable to register for the updated version of the REMS.
“It is unacceptable for a REMS with unproven effectiveness at meeting its goal to carry risks of interruptions that can result in rehospitalization, acute exacerbation of psychosis, increased risk of suicide, and potentially fatal orthostatic hypotension/bradycardic syndromes associated with incorrect restarts,” the groups said in the letter.
“We feel certain that this case reported in the literature is not the only serious adverse outcome from the REMS and the transition,” they added.
The letter was signed by the American Psychiatric Association, the American Association for Community Psychiatry, the American Psychiatric Nurses Association, the College of Psychiatric and Neurologic Pharmacists, the National Alliance on Mental Illness, the National Association of State Mental Health Program Directors, and the National Council for Mental Wellbeing.
Clozapine can decrease the neutrophil count, which can lead to severe neutropenia, serious infection, and death. Consequently, the FDA put additional safety measures in place governing clozapine prescribing.
In 2015, a centralized clozapine REMS replaced separate prescribing registries that the drug manufacturers maintained. There were technical issues with the 2015 start-up of that website, including data migration problems and long call wait times, the FDA said.
Subsequently, the drug’s manufacturers then decided to change the REMS platform, which created new issues that led to high call volume and long wait times for clinicians and pharmacists who were trying to enroll.
Maintaining access
In November 2021, the FDA announced it would put some aspects of a planned switch on hold. A month later, the agency made further modifications to its plan.
The FDA said it would exercise “enforcement discretion” to try to maintain access to clozapine amid hitches with the REMS transition efforts. The agency also said at the time that it would not object if pharmacists dispensed clozapine without the usual authorization. In addition, wholesalers could ship the drug to pharmacies and health care settings without confirming REMS enrollment.
The FDA also held two December meetings to allow various stakeholders to air concerns.
In their letter, the APA and other groups asked if the FDA intends to continue with accommodations, such as allowing pharmacies to order clozapine from wholesalers without restriction.
“We do not feel the issues are resolved,” the groups said.
A version of this article first appeared on Medscape.com.
Children and COVID: New cases down to pre-Omicron level
New cases of COVID-19 in U.S. children dropped for the fifth consecutive week, but the rate of decline slowed considerably, according to the American Academy of Pediatrics and the Children’s Hospital Association.
The national count of new cases has now fallen for five straight weeks since peaking Jan. 14-20, and this week’s figure is the lowest since the pre-Omicron days of mid-November, based on data collected by the AAP and CHA from 49 states (excluding New York), the District of Columbia, New York City, Puerto Rico, and Guam.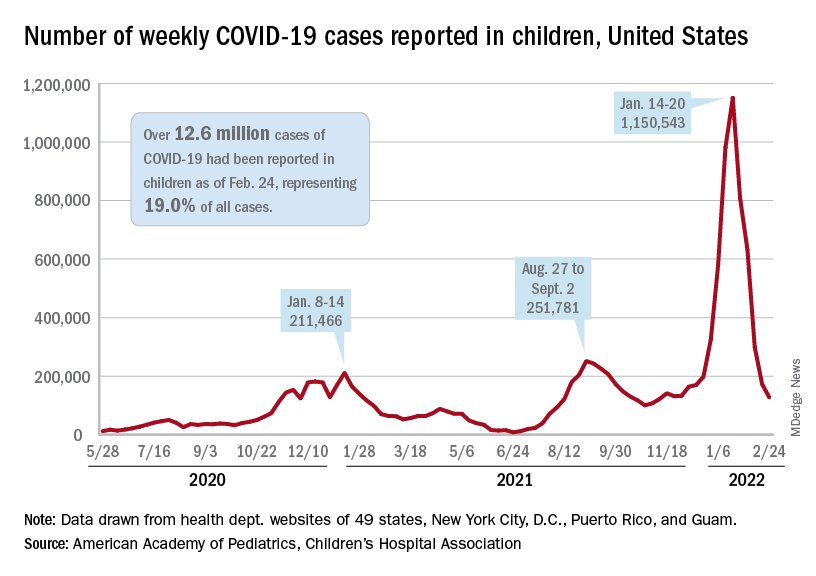
Over 12.6 million pediatric cases have been reported by those jurisdictions since the start of the pandemic, representing 19.0% of all cases in the United States, the AAP and CHA said in their weekly COVID report.
The highest cumulative rate among the states, 27.5%, can be found in Vermont, followed by New Hampshire (26.7%) and Alaska (26.6%). Alabama’s 12.1% is lower than any other jurisdiction, but the state stopped reporting during the summer of 2021, just as the Delta surge was beginning. The next two lowest states, Florida (12.8%) and Utah (13.9%), both define children as those aged 0-14 years, so the state with the lowest rate and no qualifiers is Idaho at 14.3%, the AAP/CHA data show.
The downward trend in new cases is reflected in other national measures. The daily rate of new hospital admissions for children aged 0-17 years was 0.32 per 100,000 population on Feb. 26, which is a drop of 75% since admissions peaked at 1.25 per 100,000 on Jan. 15, according to the Centers for Disease Control and Prevention.
The most recent 7-day average (Feb. 20-26) for child admissions with confirmed COVID-19 was 237 per day, compared with 914 per day during the peak week of Jan. 10-16. Emergency department visits with diagnosed COVID, measured as a percentage of all ED visits by age group, are down even more. The 7-day average was 1.2% on Feb. 25 for children aged 0-11 years, compared with a peak of 13.9% in mid-January, the CDC said on its COVID Data Tracker. The current rates for older children are even lower.
The decline of the Omicron surge over the last few weeks is allowing states to end mask mandates in schools around the country. The governors of California, Oregon, and Washington just announced that their states will be lifting their mask requirements on March 11, and New York State will end its mandate on March 2, while New York City is scheduled to go mask-free as of March 7, according to District Administration.
Those types of government moves, however, do not seem to be entirely supported by the public. In a survey conducted Feb. 9-21 by the Kaiser Family Foundation, 43% of the 1,502 respondents said that all students and staff should be required to wear masks in schools, while 40% said that there should be no mask requirements at all.
Legionnaires’ disease shows steady increase in U.S. over 15+ years
Legionnaires’ disease (LD) in the United States appears to be on an upswing that started in 2003, according to a study from the Centers for Disease Control and Prevention.
The reasons for this increased incidence are unclear, the researchers write in Emerging Infectious Diseases.
“The findings revealed a rising national trend in cases, widening racial disparities between Black or African American persons and White persons, and an increasing geographic focus in the Middle Atlantic, the East North Central, and New England,” lead author Albert E. Barskey, MPH, an epidemiologist in CDC’s Division of Bacterial Diseases, Atlanta, said in an email.
“Legionnaires’ disease cannot be diagnosed based on clinical features alone, and studies estimate that it is underdiagnosed, perhaps by 50%,” he added. “Our findings may serve to heighten clinicians’ awareness of this severe pneumonia’s etiology, so with an earlier correct diagnosis, appropriate treatment can be rendered sooner.”
Mr. Barskey and his coauthors at CDC – mathematical statistician Gordana Derado, PhD, and epidemiologist Chris Edens, PhD – used surveillance data to investigate the incidence of LD in the U.S. over time. They compared LD incidence in 2018 with average incidence between 1992 and 2002. The incidence data, from over 80,000 LD cases, were age-standardized using the 2005 U.S. standard population as the reference.
The researchers analyzed LD data reported to CDC by the 50 states, New York City, and Washington, D.C., through the National Notifiable Diseases Surveillance System. They performed regression analysis to identify the optimal year when population parameters changed, and for most analyses, they compared 1992-2002 data with 2003-2018 data.
Legionnaires’ disease up in various groups
- The overall age-standardized average incidence grew from 0.48 per 100,000 people during 1992-2002 to 2.71 per 100,000 in 2018 (incidence risk ratio, 5.67; 95% confidence interval, 5.52-5.83).
- LD incidence more than quintupled for people over 34 years of age, with the largest relative increase in those over 85 (RR, 6.50; 95% CI, 5.82-7.27).
- Incidence in men increased slightly more (RR, 5.86; 95% CI, 5.67-6.05) than in women (RR, 5.29; 95% CI, 5.06-5.53).
- Over the years, the racial disparity in incidence grew markedly. Incidence in Black persons increased from 0.47 to 5.21 per 100,000 (RR, 11.04; 95% CI, 10.39-11.73), compared with an increase from 0.37 to 1.99 per 100,000 in White persons (RR, 5.30; 95% CI, 5.12-5.49).
- The relative increase in incidence was highest in the Northeast (RR, 7.04; 95% CI, 6.70-7.40), followed by the Midwest (RR, 6.13; 95% CI, 5.85-6.42), the South (RR, 5.97; 95% CI, 5.67-6.29), and the West (RR, 3.39; 95% CI, 3.11-3.68).
Most LD cases occurred in summer or fall, and the seasonal pattern became more pronounced over time. The average of 57.8% of cases between June and November during 1992-2002 grew to 68.9% in 2003-2018.
Although the study “was hindered by incomplete race and ethnicity data,” Mr. Barskey said, “its breadth was a strength.”
Consider legionella in your diagnosis
In an interview, Paul G. Auwaerter, MD, a professor of medicine and the clinical director of the Division of Infectious Diseases at Johns Hopkins University School of Medicine, Baltimore, said he was not surprised by the results. “CDC has been reporting increased incidence of Legionnaires’ disease from water source outbreaks over the years. As a clinician, I very much depend on epidemiologic trends to help me understand the patient in front of me.
“The key point is that there’s more of it around, so consider it in your diagnosis,” he advised.
“Physicians are increasingly beginning to consider Legionella. Because LD is difficult to diagnose by traditional methods such as culture, they may use a PCR test,” said Dr. Auwaerter, who was not involved in the study. “Legionella needs antibiotics that differ a bit from traditional antibiotics used to treat bacterial pneumonia, so a correct diagnosis can inform a more directed therapy.”
“Why the incidence is increasing is the big question, and the authors nicely outline a litany of things,” he said.
The authors and Dr. Auwaerter proposed a number of possible contributing factors to the increased incidence:
- an aging population
- aging municipal and residential water sources that may harbor more organisms
- racial disparities and poverty
- underlying conditions, including diabetes, end-stage renal disease, and some cancers
- occupations in transportation, repair, cleaning services, and construction
- weather patterns
- improved surveillance and reporting
“Why Legionella appears in some locations more than others has not been explained,” Dr. Auwaerter added. “For example, Pittsburgh always seemed to have much more Legionella than Baltimore.”
Mr. Barskey and his team are planning further research into racial disparities and links between weather and climate and Legionnaires’ disease.
The authors are employees of CDC. Dr. Auwaerter has disclosed no relevant financial realtionships.
A version of this article first appeared on Medscape.com.
FDA OKs first condom for anal sex
specifically designed for use during anal sex has gained Food and Drug Administration approval.
Anal intercourse is considered to be much riskier than vaginal sex for the transmission of infections such as HIV and HPV, a risk factor for anal cancer, agency officials said in a statement Feb. 23 announcing the decision. And though the Centers for Disease Control and Prevention has long encouraged the use of a condom during anal intercourse, the FDA had not until now deemed this practice safe.
The latex ONE Male Condom, from prophylactic maker Global Protection Corp. of Boston, has already been available for vaginal sex. The FDA action now allows the company to market the product for anal intercourse.
“This authorization helps us accomplish our priority to advance health equity through the development of safe and effective products that meet the needs of diverse populations,” Courtney Lias, PhD, the director of the FDA’s Office of GastroRenal, ObGyn, General Hospital, and Urology Devices, said in a statement.
The FDA said it relied on an Emory University clinical study of condom safety of more than 500 men. Those who took part in the study were evenly divided between men who have sex with men and men who have sex with women. The condom failure rate, meaning that a condom either broke or slipped, was less than 1% during anal sex. The failure rate was 3 times higher during vaginal intercourse.
The Emory researchers also found that roughly 70% of men who have sex with men would be more likely to use condoms marked as safe for anal sex, according to a survey of 10,000 people.
ONE Male Condoms sell for between $3.48 for a three-pack and $14.48 for a 24-pack, according to Milla Impola, Global Protection’s director of marketing and communications. The FDA said the condom should be used with a condom-compatible lubricant when used during anal sex.
A version of this article first appeared on WebMD.com.
Children and COVID: The Omicron surge has become a retreat
The Omicron decline continued for a fourth consecutive week as new cases of COVID-19 in children fell by 42% from the week before, according to a report from the American Academy of Pediatrics and the Children’s Hospital Association.
That 42% represents a drop from the 299,000 new cases reported for Feb. 4-10 down to 174,000 for the most recent week, Feb. 11-17. 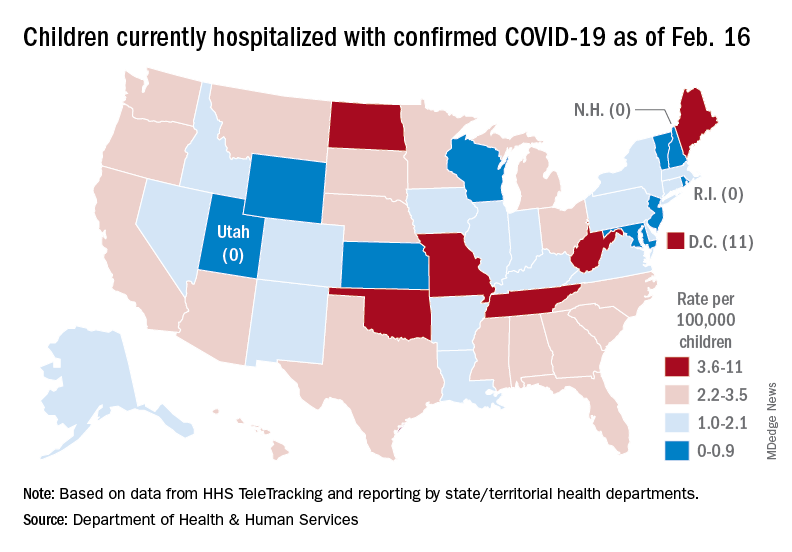
The overall count of COVID-19 cases in children is 12.5 million over the course of the pandemic, and that represents 19% of cases reported among all ages, the AAP and CHA said based on data collected from 49 states (excluding New York), the District of Columbia, New York City, Puerto Rico, and Guam.
Hospital admissions also continued to fall, with the rate for children aged 0-17 at 0.43 per 100,000 population as of Feb. 20, down by almost 66% from the peak of 1.25 per 100,000 reached on Jan. 16, the Centers for Disease Control and Prevention reported.
A snapshot of the hospitalization situation shows that 1,687 children were occupying inpatient beds on Feb. 16, compared with 4,070 on Jan. 19, which appears to be the peak of the Omicron surge, according to data from the Department of Health & Human Services.
The state with the highest rate – 5.6 per 100,000 children – on Feb. 16 was North Dakota, although the District of Columbia came in at 11.0 per 100,000. They were followed by Oklahoma (5.3), Missouri (5.2), and West Virginia (4.1). There were three states – New Hampshire, Rhode Island, and Utah – with no children in the hospital on that date, the HHS said.
New vaccinations in children aged 5-11 years, which declined in mid- and late January, even as Omicron surged, continued to decline, as did vaccine completions. Vaccinations also fell among children aged 12-17 for the latest reporting week, Feb. 10-16, the AAP said in a separate report.
As more states and school districts drop mask mandates, data from the CDC indicate that 32.5% of 5- to 11-year olds and 67.4% of 12- to 17-year-olds have gotten at least one dose of the COVID-19 vaccine and that 25.1% and 57.3%, respectively, are fully vaccinated. Meanwhile, 20.5% of those fully vaccinated 12- to 17-year-olds have gotten a booster dose, the CDC said.
The Omicron decline continued for a fourth consecutive week as new cases of COVID-19 in children fell by 42% from the week before, according to a report from the American Academy of Pediatrics and the Children’s Hospital Association.
That 42% represents a drop from the 299,000 new cases reported for Feb. 4-10 down to 174,000 for the most recent week, Feb. 11-17.
The overall count of COVID-19 cases in children is 12.5 million over the course of the pandemic, and that represents 19% of cases reported among all ages, the AAP and CHA said based on data collected from 49 states (excluding New York), the District of Columbia, New York City, Puerto Rico, and Guam.
Hospital admissions also continued to fall, with the rate for children aged 0-17 at 0.43 per 100,000 population as of Feb. 20, down by almost 66% from the peak of 1.25 per 100,000 reached on Jan. 16, the Centers for Disease Control and Prevention reported.
A snapshot of the hospitalization situation shows that 1,687 children were occupying inpatient beds on Feb. 16, compared with 4,070 on Jan. 19, which appears to be the peak of the Omicron surge, according to data from the Department of Health & Human Services.
The state with the highest rate – 5.6 per 100,000 children – on Feb. 16 was North Dakota, although the District of Columbia came in at 11.0 per 100,000. They were followed by Oklahoma (5.3), Missouri (5.2), and West Virginia (4.1). There were three states – New Hampshire, Rhode Island, and Utah – with no children in the hospital on that date, the HHS said.
New vaccinations in children aged 5-11 years, which declined in mid- and late January, even as Omicron surged, continued to decline, as did vaccine completions. Vaccinations also fell among children aged 12-17 for the latest reporting week, Feb. 10-16, the AAP said in a separate report.
As more states and school districts drop mask mandates, data from the CDC indicate that 32.5% of 5- to 11-year olds and 67.4% of 12- to 17-year-olds have gotten at least one dose of the COVID-19 vaccine and that 25.1% and 57.3%, respectively, are fully vaccinated. Meanwhile, 20.5% of those fully vaccinated 12- to 17-year-olds have gotten a booster dose, the CDC said.
Babies better protected from COVID if mother vaccinated during pregnancy: study
In a first of its kind study, researchers found women who received two mRNA COVID vaccine doses during pregnancy were 61% less likely to have a baby hospitalized for COVID-19 during the first 6 months of life.
In addition, two doses of the Pfizer/BioNTech or Moderna COVID vaccine later in a pregnancy were linked to an even higher level of protection, 80%, compared with 32% when given before 20 weeks’ gestation.
This finding suggests a greater transfer of maternal antibodies closer to birth, but more research is needed, cautioned senior study author Manish Patel, MD, during a Tuesday media telebriefing held by the Centers for Disease Control and Prevention.
Unanswered questions include how the babies got infected or if there is any protection afforded to babies for women vaccinated before pregnancy.
“We cannot be sure about the source of the infection,” said Dr. Patel, a medical epidemiologist with the CDC COVID-19 Emergency Response Team.
Dana Meaney-Delman, MD, MPH, agreed, but added that “perinatal transmission of the virus is very rare” with SARS-CoV-2. She is a practicing obstetrician and gynecologist and chief of the CDC Infant Outcomes Monitoring Research and Prevention Branch.
The study numbers were too small to show if a booster shot during pregnancy or breastfeeding could provide even greater protection for babies, Dr. Patel said.
The early release study was published online Feb. 15 in the CDC’s Morbidity and Mortality Weekly Report (MMWR).
Many previous studies looking at COVID-19 immunization during pregnancy focused on maternal health and “have clearly shown that receiving an mRNA COVID-19 vaccine during pregnancy reduces the risk for severe illness,” Dr. Meaney-Delman said.
Some dual protection suggested
Now there is evidence for a potential benefit to babies as well when a pregnant woman gets vaccinated. The study “provides real-world evidence that getting COVID-19 vaccination during pregnancy might help protect infants less than 6 months [of age],” Dr. Meaney-Delman said.
“These findings continue to emphasize the importance of COVID-19 vaccination during pregnancy to protect people who are pregnant and also to protect their babies,” she said.
Dr. Patel and colleagues studied 379 infants younger than 6 months hospitalized between July 1, 2021 and Jan. 17 of this year. Delta and then the Omicron variant predominated during this time.
The infants were admitted to one of 20 children’s hospitals in 17 states. The researchers compared 176 infants admitted with a positive COVID-19 PCR test to another 203 infants with a negative PCR test who served as controls.
Half as many mothers of infants admitted with COVID-19 were vaccinated during pregnancy, 16%, versus 32% of mothers of the control infants.
Vaccination with two doses of mRNA vaccine during pregnancy was 61% effective (95% confidence interval, 31%-78%) at preventing hospitalization among these infants. Because the study was epidemiological, the lower risk was an association, not a cause-and-effect finding, Dr. Patel said.
Babies admitted to the hospital positive for COVID-19 were more likely to be non-Hispanic Black, 18%, versus 9% of control group babies; and more likely to be Hispanic, 34% versus 28%, respectively.
A total 24% of infants with COVID-19 were admitted to the ICU, including the baby of an unvaccinated mother who required extracorporeal membrane oxygenation (ECMO). Another baby of an unvaccinated mother was the only infant death during the study.
Maternal vaccination trends
A reporter pointed out that COVID-19 vaccination rates tend to be low among pregnant women. “So there is some exciting news,” Dr. Meaney-Delman said, referring to a steady increase in the percentages of pregnant women in the U.S. choosing to get vaccinated, according to the CDC Data Tracker website.
“The numbers are encouraging, [but] they’re not quite where we need them to be, and they do differ by race and ethnicity,” she added.
A version of this article first appeared on Medscape.com.
Children and COVID: Weekly cases down by more than half
A third consecutive week of declines in new COVID-19 cases among children has brought the weekly count down by 74% since the Omicron surge peaked in mid-January, based on data from the American Academy of Pediatrics and the Children’s Hospital Association.
and by 74% from the peak of 1.15 million cases recorded for the week of Jan. 14-20, the AAP and CHA said in their weekly COVID report. They also noted that the weekly tally was still higher than anything seen during the Delta surge.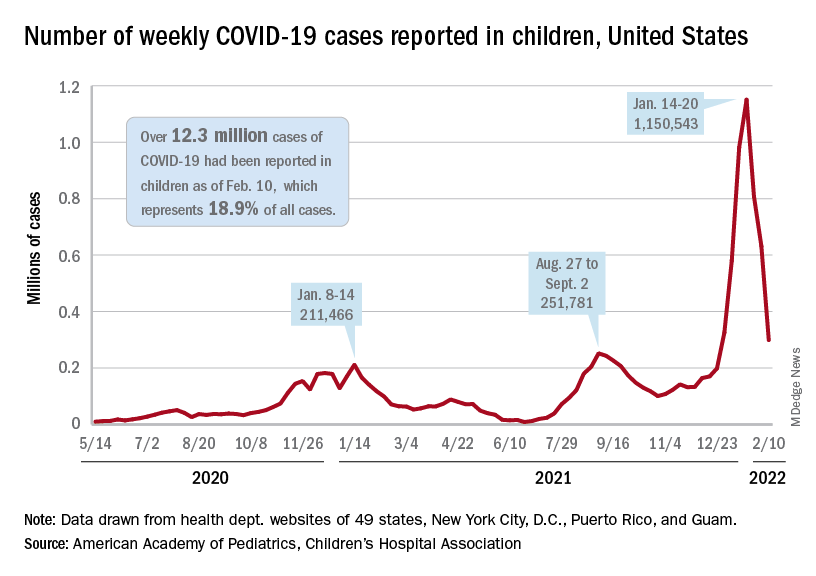
The total number of pediatric cases was over 12.3 million as of Feb. 10, with children representing 18.9% of cases in all ages, according to the AAP/CHA report. The Centers for Disease Control and Prevention puts the two measures at 10.4 million and 17.3% on its COVID Data Tracker, based on availability of age data for 59.6 million total cases as of Feb. 14. The CDC also reported that 1,282 children have died from COVID-19 so far, which is about 0.17% of all deaths with age data available.
The AAP and CHA have been collecting data from state and territorial health departments, which have not always been consistently available over the course of the pandemic. Also, the CDC defines children as those under age 18 years, but that upper boundary varies from 14 to 20 among the states.
The decline of the Omicron variant also can be seen in new admissions of children with confirmed COVID-19, which continued to drop. The 7-day average of 435 admissions per day for the week of Feb. 6-12 was less than half of the peak seen in mid-January, when it reached 914 per day. The daily admission rate on Feb. 12 was 0.60 per 100,000 children aged 0-17 years – again, less than half the peak rate of 1.25 reported on Jan. 16, CDC data show.
The fading threat of Omicron also seems to be reflected in recent vaccination trends. Both initial doses and completions declined for the fourth consecutive week (Feb. 3-9) among children aged 5-11 years, while initiations held steady for 12- to 17-year-olds but completions declined for the third straight week, the AAP said in its separate vaccination report, which is based on data from the CDC.
As of Feb. 14, almost 32% of children aged 5-11 – that’s almost 9.2 million individuals – had received at least one dose of the COVID-19 vaccine and just over 24% (6.9 million) were fully vaccinated, the CDC reported. For children aged 12-17, the corresponding figures are 67% (16.9 million) and 57% (14.4 million). Newly available data from the CDC also indicate that 19.5% (2.8 million) of children aged 12-17 have received a booster dose.
Small group of higher-volume antibiotic prescribers identified
“Higher-volume prescribers prescribed antibiotics to a larger share of their patient panel and their prescribing rate was 60% higher than that of lower-volume prescribers, indicating that their prescribing practices might be independent of the number of beneficiaries under their care,” Katryna A. Gouin, MPH, and associates wrote in the Morbidity and Mortality Weekly Report.
In 2019, 41% of all Part D antibiotics – that’s 24.4 million prescriptions – were prescribed by 69,835 higher-volume prescribers. The other 59% of all antibiotics were prescribed by the 627,000 lower-volume health care providers included in the analysis (those who prescribed fewer than 11 antibiotics were excluded), Ms. Gouin of Chenega in Anchorage, Alaska, and associates noted.
The analysis involved the Medicare Part D Prescribers by Provider data set and defined the highest-volume prescribers “as those in the highest 10th percentile of prescriber-level antibiotic volume (number of antibiotic prescriptions filled) across all Medicare providers nationwide,” the investigators explained.
The antibiotic-prescribing rate for the higher-volume prescribers was 680 prescriptions per 1,000 beneficiaries, which was 60% higher than the 426 prescriptions per 1,000 among the lower 90% of prescribers. Another way to look at it: The top 10% of health care providers “wrote a median of 284 antibiotic prescriptions, compared with a median of 41 among lower-volume prescribers,” the investigators said.
Physicians in internal medicine and family practice, the two largest medical specialties, were the most likely to be 10-percenters, accounting for 24.6% and 27.5%, respectively, of the higher-volume group. They were followed by nurse practitioners (14.1%) and physician assistants (7.4%), who were classified as specialists for the purposes of the study, Ms. Gouin and associates said.
The only other group of physicians among the top six specialties were urologists, who represented 6.8% of high-volume prescribers but only 1% of all prescribers, they noted.
The highest antibiotic prescription rate in the six largest groups of providers occurred among dentists, whose highest-prescribing practitioners wrote 1,271 prescriptions per 1,000 beneficiaries. Even the lower-prescribing 90% of dentists prescribed more antibiotics (1,068 per 1,000) than did the higher-prescribing family physicians (611 per 1,000) and internists (590 per 1,000), the researchers said.
The prescribing rates for all the other specialties that were not included separately also were higher than the family physicians’ and internists’. These rates were 850 per 1,000 beneficiaries for the higher-prescribers and 360 per 1,000 for the lower-prescribers, the researchers wrote.
The considerable differences in prescribing practices between specialties and even among those of the same specialty present “opportunities for improved prescribing through antibiotic stewardship activities focusing on these higher-volume prescribers, independent of specialty,” Ms. Gouin and associates wrote.
FROM THE MMWR
Children and COVID: New cases down again, but still ‘extremely high’
The indication of an Omicron decline has become a trend: New cases of COVID-19 in children were down for a second consecutive week in the United States, according to the American Academy of Pediatrics and the Children’s Hospital Association.
but the nearly 632,000 cases reported were down by 22% from the previous week and by 45% from what appears to be the peak of the Omicron surge during the week of Jan. 14-20, the AAP/CHA data show.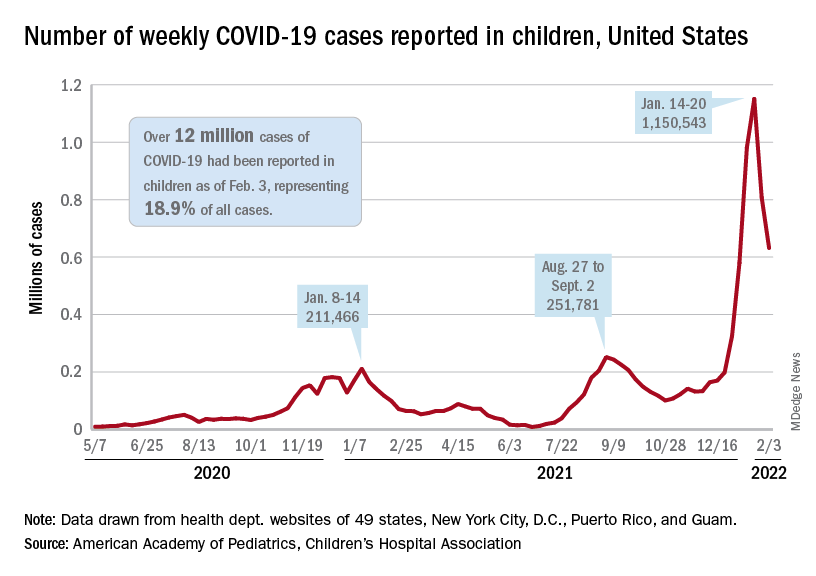
To put the effect of the Delta and Omicron variants into some sort of perspective, the total number of COVID-19 cases among children passed 5 million at the beginning of September 2021, about a year and a half into the pandemic. In the last 5 months, the cumulative count has more than doubled and now stands at 12 million, the AAP and CHA said in their weekly COVID report.
Hospital admissions and emergency department visits followed the same downward trend over the last week. The rate of new hospitalizations fell to 0.81 per 100,000 children aged 0-17 years as of Feb. 2 (down from a peak of 1.25 per 100,000 on Jan. 15), and ED visits with diagnosed COVID-19 dropped to 1.8% (peak was 14.1%), 1.9% (peak was 14.3%), and 3.4% (peak was 14%) of all visits for children aged 16-17, 12-15, and 0-11 years, respectively, the Centers for Disease Control and Prevention reported.
The vaccination response
The surge of infections brought about by the Omicron variant, however, did not translate into increased vaccination, at least for the youngest eligible children. Vaccine initiation rose slightly among children aged 5-11 in early and mid-January but, by early February, new vaccinations had declined to their lowest point since approval in early November of 2021, the AAP said in its weekly COVID vaccination report.
As a result, the 5- to 11-year-olds are well behind the pace set by those aged 12-15 for the first 3 months of their vaccination experience. Through the first 13 weeks after the COVID vaccine was approved for children aged 12-15 in early May, 44.5% had received at least one dose and 32.3% were fully vaccinated. Among children aged 5-11, the corresponding figures through 13 weeks were 31% and 22.5%, according to CDC data.
The vaccination reaction to Omicron was somewhat more robust for children aged 12-17, compared with the younger group, but initiations dropped at the same time that new cases began to decline. In terms of total volume, the response among 12- to 17-year-olds was much smaller than that seen in July and August of 2021 as the Delta surge was hitting the United States, the AAP vaccination report shows.
All those vaccinations add up to this: Over 16.8 million children aged 12-17 and almost 9 million aged 5-11 had received at least one dose of vaccine as of Feb. 7, which works out to 66.6% of the older group and 31.2% of the younger cohort. Almost 14.3 million (56.4%) of those aged 12-17 are fully vaccinated, as are 6.6 million (22.9%) of the 5- to 11-year-olds, the CDC said on its COVID Data Tracker.
Children and COVID-19: The Omicron tide may have turned
The Omicron-fueled surge appears to have peaked as new cases of COVID-19 in U.S. children dropped for the first time since late November 2021, dipping back below the 1 million mark for the week, according to the American Academy of Pediatrics and the Children’s Hospital Association.
The total number of cases in children was up to 11.4 million as of Jan. 27, with children representing 18.6% of all cases reported since the pandemic started, the AAP and CHA said in their weekly COVID-19 report.
As children remain the largest reservoir of unvaccinated Americans, their share of the COVID case load continues to rise quickly. Just 2 weeks ago, children made up 17.8% of the cumulative number of cases, and at the end of December it was 17.4%, the AAP/CHA data show.
The latest data from the Centers for Disease Control and Prevention show that trends for admissions and emergency department visits reflect the decline in new cases. New admissions of children aged 0-17 years with diagnosed COVID-19 peaked at 1.25 per 100,000 population on Jan. 15 and were down to 0.95 per 100,000 on Jan. 29.
Daily ED visits for COVID-19, measured as a percentage of all ED visits, peaked at 13.9% on Jan. 14 for children aged 0-11 years and on Jan. 9 for both 12- to 15-year-olds (14.1%) and 16- to 17-year-olds (13.8%). By Jan. 28, the rates were down to 5.6% (0-11), 3.1% (12-15), and 3.3% (16-17), the CDC reported based on data from the National Syndromic Surveillance Program.
Trends involving more severe illness support observations that Omicron is milder than earlier variants. Children hospitalized with COVID-19 were less likely to be admitted to an intensive care unit over the last 2 months than during the Delta surge in the late summer and early fall or during the winter of 2020-2021, the CDC said based on data from the BD Insights Research Database, which includes 229,000 patients and 267 hospitals.
Those data show that the highest monthly rate occurred early on, in May of 2020, when 27.8% of children with COVID-19 ended up in the ICU. The rates for December 2021 and January 2022, by comparison, were 11.0% and 11.3%, respectively, the CDC said.
Vaccination lags in younger children
As reports surface about Pfizer-BioNTech filing an emergency use request to extend vaccine coverage to children aged 6 months to 5 years, it does appear that prevention efforts could use the proverbial shot in the arm.
As of Jan. 30, just 30.4% of children aged 5-11 have received at least one dose of the COVID-19 vaccine, and only 21.6% are fully vaccinated. At a comparable point in their timeline – just short of 3 months after approval – the respective numbers for children aged 12-15 were about 42% and 31%, CDC data show.
In the younger group, both initial doses and completions rose slightly in the first 2 weeks of January but then dropped in each of the last 2 weeks. There was a more significant surge in interest among the 12- to 17-year-olds in mid-January, but the last full week of the month brought declines of more than 50% in both measures, according to a separate AAP analysis.