User login
Corrective Cosmetics Are Effective for Women With Facial Pigmentary Disorders
Rapid Resolution of Cellulitis in Patients Managed With Combination Antibiotic and Anti-inflammatory Therapy
Non-consented IUD placement reported by Mexican immigrants: A caution for caregivers in the US?
Published reports of non-consented contraceptive practices in Mexico,1-3 including intrauterine device (IUD) placement, have been largely anecdotal and have not been systematically validated. The Family Planning Clinic of the Maricopa County Department of Public Health predominantly serves a Mexican immigrant population. Providers in the clinic have also reported hearing about non-consented IUD placement. To investigate this issue, 466 women between July 1, 2000, and July 1, 2002, were recruited to answer a survey. This sample of convenience represented 29% of new clients during this period. Informed consent was obtained from each participant and no woman refused to participate. The study was IRB-approved. The survey was translated into Spanish and delivered orally by bilingual interviewers.
The mean age of the participants was 27.2 years, and the mean number of prior pregnancies was 2.6. One hundred eighty-eight women (40%) reported receiving gynecologic health care in Mexico from 1 month to 20 years previously (mean of 6.1 years). One hundred four women reported having an IUD placed at some time, including 85 of those who had received care in Mexico (46%). Of these, 23 women reported having an IUD inserted without their knowledge or consent. All 23 reported that the IUD had been placed while receiving care in Mexico, representing 27 % of those who had received an IUD there. Twenty-one of the 23 women said the IUD had been placed immediately after they had given birth, and 2 while seeking family planning services. Sixteen reported that the IUD insertion occurred at a hospital, while 4 said it happened at a clinic; 3 did not respond to this question.
Five of the women realized within days that an IUD had been placed; 3 within weeks, 4 within months, and 9 did not find out for a year or more; 5 did not respond. Three felt a string, 3 said the IUD fell out, 7 reported that a second healthcare worker discovered it, 2 were informed later by the person who placed the IUD, and 4 had adverse symptoms (2 from infection). Of 19 responding, 2 said they had the IUD taken out the same day it was discovered, 4 about a month later, 5 about a year later, 5 one to five years later, 1 five to ten years later, and 2 still had the IUD in place. Sixteen provinces in Mexico were listed as the location where the IUD placement occurred.
A significant percentage of women of reproductive age from Mexico served by this border area family planning clinic reported that they had an IUD placed without their knowledge or consent in Mexico. It is possible that these women were actually informed about the procedure, and just did not fully understand it. We were not able to investigate if this practice occurs in other countries or if it affects women of all socioeconomic classes in Mexico.
It is not clear if the women who did not have the IUD removed chose to keep it as their contraceptive method of choice or because they lacked access to health care to have it removed. It is possible that many of them would have chosen an IUD had the option been presented to them.
Since our sample was one of convenience in a busy public clinic, the possibility for selection bias exists. Therefore these findings are very preliminary and need to be verified in larger, better controlled studies. However, all those who provide healthcare services to women immigrants from Mexico should add the possibility of complications from an unrecognized IUD to the differential diagnosis if patients present with pelvic or abdominal pain, pelvic infections, or infertility.
Corresponding author
Doug Campos-Outcalt, MD, MPA, 4001 North 3rd Street, Phoenix, AZ 85012. E-mail: [email protected].
1. Kirsch JD, Cedeño MA. Informed consent for family planning for poor women in Chiapas, Mexico. Lancet 1999;354 (9176):419-420.
2. Diebel L. Mexico’s Indians target of sterilization ‘sweep’. The Toronto Star Latin America Bureau. Toronto Star, March 26, 2000. [cited 2002, Dec 14]; [6 screens]. Available at: www.thestar.com/thestar/back_issues/fsED20000326/news/20000326NEW01c_FO-DIEBEL.html. Accessed on February 8, 2005.
3. Dirección general de salud maternoinfantil, la mujer adolescente adulta, anciana y su salud. Mexico City: Secretaria de Salud, 1992.
Published reports of non-consented contraceptive practices in Mexico,1-3 including intrauterine device (IUD) placement, have been largely anecdotal and have not been systematically validated. The Family Planning Clinic of the Maricopa County Department of Public Health predominantly serves a Mexican immigrant population. Providers in the clinic have also reported hearing about non-consented IUD placement. To investigate this issue, 466 women between July 1, 2000, and July 1, 2002, were recruited to answer a survey. This sample of convenience represented 29% of new clients during this period. Informed consent was obtained from each participant and no woman refused to participate. The study was IRB-approved. The survey was translated into Spanish and delivered orally by bilingual interviewers.
The mean age of the participants was 27.2 years, and the mean number of prior pregnancies was 2.6. One hundred eighty-eight women (40%) reported receiving gynecologic health care in Mexico from 1 month to 20 years previously (mean of 6.1 years). One hundred four women reported having an IUD placed at some time, including 85 of those who had received care in Mexico (46%). Of these, 23 women reported having an IUD inserted without their knowledge or consent. All 23 reported that the IUD had been placed while receiving care in Mexico, representing 27 % of those who had received an IUD there. Twenty-one of the 23 women said the IUD had been placed immediately after they had given birth, and 2 while seeking family planning services. Sixteen reported that the IUD insertion occurred at a hospital, while 4 said it happened at a clinic; 3 did not respond to this question.
Five of the women realized within days that an IUD had been placed; 3 within weeks, 4 within months, and 9 did not find out for a year or more; 5 did not respond. Three felt a string, 3 said the IUD fell out, 7 reported that a second healthcare worker discovered it, 2 were informed later by the person who placed the IUD, and 4 had adverse symptoms (2 from infection). Of 19 responding, 2 said they had the IUD taken out the same day it was discovered, 4 about a month later, 5 about a year later, 5 one to five years later, 1 five to ten years later, and 2 still had the IUD in place. Sixteen provinces in Mexico were listed as the location where the IUD placement occurred.
A significant percentage of women of reproductive age from Mexico served by this border area family planning clinic reported that they had an IUD placed without their knowledge or consent in Mexico. It is possible that these women were actually informed about the procedure, and just did not fully understand it. We were not able to investigate if this practice occurs in other countries or if it affects women of all socioeconomic classes in Mexico.
It is not clear if the women who did not have the IUD removed chose to keep it as their contraceptive method of choice or because they lacked access to health care to have it removed. It is possible that many of them would have chosen an IUD had the option been presented to them.
Since our sample was one of convenience in a busy public clinic, the possibility for selection bias exists. Therefore these findings are very preliminary and need to be verified in larger, better controlled studies. However, all those who provide healthcare services to women immigrants from Mexico should add the possibility of complications from an unrecognized IUD to the differential diagnosis if patients present with pelvic or abdominal pain, pelvic infections, or infertility.
Corresponding author
Doug Campos-Outcalt, MD, MPA, 4001 North 3rd Street, Phoenix, AZ 85012. E-mail: [email protected].
1. Kirsch JD, Cedeño MA. Informed consent for family planning for poor women in Chiapas, Mexico. Lancet 1999;354 (9176):419-420.
2. Diebel L. Mexico’s Indians target of sterilization ‘sweep’. The Toronto Star Latin America Bureau. Toronto Star, March 26, 2000. [cited 2002, Dec 14]; [6 screens]. Available at: www.thestar.com/thestar/back_issues/fsED20000326/news/20000326NEW01c_FO-DIEBEL.html. Accessed on February 8, 2005.
3. Dirección general de salud maternoinfantil, la mujer adolescente adulta, anciana y su salud. Mexico City: Secretaria de Salud, 1992.
Hydrocortisone Butyrate 0.1% Cream in the Treatment of Chronic Dermatitis
Using the likelihood ratio
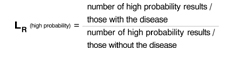
Like sensitivity and specificity, a likelihood ratio (LR) can be used to express the usefulness of diagnostic tests. A likelihood ratio is a ratio of 2 proportions: the subset of people with a particular test result among all those who have a specific disease, divided by the subset of people with the same test result among all those without the disease. The mathematical expression of this is:
![]()
What ratio results mean
Consider a study to assess the usefulness of a new blood test for colon cancer. Results of the blood test are reported as high probability of cancer, intermediate probability, or low probability.
All patients in the study undergo the blood test and colonoscopy, the gold standard for identifying colon cancer. The likelihood ratio of a “high probability” result is calculated thus:
LRs greater than 1 tell us a test result is more likely to occur among patients with the disease than among those without the disease; LRs less than 1 tell us a result is less likely to occur among patients with the disease than among patients without the disease. LRs of 10 or more usually “rule in” disease; LRs of 0.1 or less usually “rule out” disease. An LR of 1 is completely useless in ruling disease in or out.
In the example above, if LR(high probability) is 10, this means that a high probability result is 10 times more likely to occur among people with the disease than among people without it.
Advantages of the likelihood ratio. Sensitivity and specificity can be used only with test results reported as positive or negative (dichotomous results). Likelihood ratios can be used with tests that have any number of outcomes. They can also be used in one form of Bayes’ theorem, as illustrated below, which has application to the Applied Evidence article on open-angle glaucoma in this issue.
Applying the likelihood ratio in this issue
On page 119 of this issue, Aref and Schmidt discuss the risk factors and diagnosis of open-angle glaucoma (OAG). Consider a 70-year-old African American woman who has difficulty seeing in the dark and has lost some peripheral vision in both eyes. Her sister has recently received a diagnosis of OAG. The patient’s risk factors and family history make a diagnosis of OAG likely.
How can a likelihood ratio help here? Direct ophthalmoscopy is warranted to determine if the patient has an elevated cup-disc ratio (>0.6). How useful would such an examination be in this case? In general, Bayes’ theorem tells us that new information should be interpreted in light of what is already known. The form of Bayes’ theorem applicable to diagnostic tests is the following:
Posttest odds of disease = Pretest odds of disease × likelihood ratio
First, calculate pretest odds. The relationship of odds to probability is fairly simple. Let’s assume, based on the patient’s history alone, we believe there is a 33% chance she has OAG. In other words, her pretest probability of OAG is 33%. We convert this probability to odds: Odds = probability/ 1 − probability = 0.33/ 1 − 0.33 = 1/2
Her odds of disease is therefore “1 in favor to 2 against.”
Next, find posttest odds. Now let’s assume that ophthalmoscopy reveals a cup-disc ratio of 0.8. According to Aref and Schmidt’s article, a cup-disc ratio of >0.6 (ie, a “positive” ophthalmoscopic examination) has an LR+ of 16; a cup-disc ratio of <0.6 has an LR− of 0.375 (or 3/8). Since the patient has a “positive” test result, we obtain:
Posttest odds of OAG = 1/2 × 16 = 16/2 = 8/1
Translating back to probability. To make things easier, we can convert this posttest odds of 8/1 to a probability:
Probability = odds in favor/odds in favor + odds against = 8/8+1 = 0.89 (or 89%).
After combining our ophthalmoscopic examination with the history, we can conclude that the patient has an 89% chance of having OAG.
If the result of the ophthalmoscopic examination was negative,
Posttest odds of OAG = 1/2 × 3/8 = 3/16.
The corresponding probability is roughly 0.16 (or 16%).
When likelihood ratios are most useful
In general, diagnostic tests of any kind are most useful for patients like the one described— those who have an intermediate pre-test probability of disease (usually 20%–60%). Very high or very low pretest probabilities of disease are less likely to influence post-test probability of disease.
You may be concerned that the value of pretest probability we chose is subjective. Bear in mind that much of our thinking in medicine is subjective, but based upon clinical experience and knowledge. Evidence-based medicine is a complement to, not a substitute for, clinical experience. Combining the objectivity of likelihood ratios with subjective pretest probabilities using Bayes’ theorem is consistent with the principles of evidence-based medicine.
Corresponding author
Goutham Rao, MD. E-mail: [email protected].
Are antibiotics beneficial for patients with sinusitis complaints?
- If the goal of treating sinusitis with antibiotics is to cure purulent nasal discharge, we are likely over-treating; as our study showed, after 2 weeks most patients in the treatment and placebo groups still had nasal symptoms (A).
- Persons with higher scores on the clinical prediction rule for sinusitis are no more likely to improve with antibiotic treatment than are those with lower scores (A).
- Among those who did improve on antibiotics, a subgroup that could not be clinically characterized improved at a much quicker rate than the others. Until further clinical trials can describe this favorable clinical profile, routine prescribing of antibiotics for sinusitis should be avoided (A).
Background: Sinusitis is the fifth most common reason for patients to visit primary care physicians, yet clinical outcomes relevant to patients are seldom studied.
Objective To determine whether patients with purulent rhinitis, “sinusitis-type symptoms,” improved with antibiotics. Second, to examine a clinical prediction rule to provide preliminary validation data.
Methods: Prospective clinical trial, with double-blinded placebo controlled randomization. The setting was a suburb of Washington, DC, from Oct 1, 2001, to March 31, 2003. All participants were 18 years or older, presenting to a family practice clinic with a complaint of sinusitis and with pus in the nasal cavity, facial pressure, or nasal discharge lasting longer than 7 days. The main outcome measures were resolution of symptoms within a 14-day follow-up period and the time to improvement (days).
Results: After exclusion criteria, 135 patients were randomized to either placebo (n=68) or amoxicillin (n=67) for 10 days. Intention-to-treat analyses showed that 32 (48%) of the amoxicillin group vs 25 (37%) of the placebo group (P=.26) showed complete improvement by the end of the 2-week follow-up period (relative risk=1.3; 95% confidence interval [CI], 0.87–1.94]). Although the rates of improvement were not statistically significantly different at the end of 2 weeks, the amoxicillin group improved significantly earlier, in the course of treatment, a median of 8 vs 12 days, than did the placebo group (P=.039).
Conclusion: For most patients with sinusitis-type complaints, no improvement was seen with antibiotics over placebo. For those who did improve, data suggested there is a subgroup of patients who may benefit from antibiotics.
It is estimated that adults have 2 to 3 colds a year, of which just 0.5% to 2% are complicated by bacterial sinusitis. However, primary care physicians treat over half of these colds with antibiotics.1 Sinusitis is the fifth most common diagnosis for which antibiotics are prescribed in the outpatient setting, with more than $6 billion spent annually in the United States on prescription and over-the-counter medications.1-3 Can we know with greater certainty when antibiotics are indicated for sinusitis?
A meta-analysis of randomized controlled studies has shown that the likelihood of bacterial sinusitis is increased (sensitivity 76%, specificity 79%) and antibiotics are helpful when a patient exhibits at least 3 of 4 cardinal clinical features: 1) purulent nasal discharge predominating on one side; 2) local facial pain predominating on one side; 3) purulent nasal discharge on both sides; and 4) pus in the nasal cavity.2 Although use of these criteria is encouraged, they are based on studies that recruited patients from subspecialty clinics and measured disease-oriented outcomes such as findings on sinus radiographs, CT scans, and sinus puncture with culture.4-12 Most cases of sinusitis, however, are treated in primary care settings where measuring such outcomes is impractical.
Given the lack of epidemiologic evidence as to which patients would benefit from treatment of sinusitis, primary care physicians face the dilemma of deciding during office encounters which patients should receive antibiotics and which have a viral infection for which symptomatic treatment is indicated.13
Our goal was to study the type of patient for whom this dilemma arises and to use clinical improvement as our primary outcome. We randomly assigned patients presenting with sinusitis complaints to receive amoxicillin or placebo, and compared the rates of improvement, time to improvement, and patient’s self-rating of sickness at the end of 2 weeks. We also tested the clinical prediction rule to see if participants with 3 or 4 signs and symptoms had different clinical outcomes than the others.
Methods
Setting
We conducted a randomized double-blind clinical trial of amoxicillin vs placebo. All patients were recruited from a suburban primary care office. Two physicians and one nurse practitioner enrolled and treated all patients over an 18-month period (Oct 1, 2001 to March 31, 2003). The clinicians involved in the study were trained to identify purulent discharge in the nasal cavity. Institutional Review Board approval was obtained from Georgetown University prior to the study. Written informed consent was obtained from all participating patients.
Patients
Patients were eligible to participate if they were 18 years or older; had at least 1 cardinal feature described by the clinical prediction rule: 1) purulent nasal discharge predominating on one side, 2) local facial pain predominating on one side, 3) purulent nasal discharge on both sides, or 4) pus in the nasal cavity; and had symptoms for at least 7 days. Patients were excluded if their histories included antibiotic treatment within the past month, allergy to penicillin, sinus surgery, compromised immunity, pneumonia, or streptococcal pharyngitis.
Randomization
Permuted block randomization stratified for the 3 participating clinicians was used to determine treatment assignment. Patients were given an envelope containing 40 capsules, either a placebo medicine taken twice daily for 10 days or 1000 mg of amoxicillin (500 mg pills) taken twice daily for 10 days. The envelopes were opaque, and each had 40 identical-appearing pills (to ensure allocation concealment). The participating clinicians were naive to the treatment assignments.
Assessment of outcomes
Trained personnel, masked to treatment assignment, conducted follow-up telephone interviews on days 3, 7, and 14 following patients’ visits for sinusitis, to assess clinical improvement. Twelve follow-up questions were asked.
Sample size
The primary outcome used to determine sample size was dichotomous—either “improved” or “not improved” by the end of 2 weeks. Thus, patients were asked, “what day were you entirely improved.” The sample sizes obtained per group (67 for amoxicillin and 68 for placebo) provided 80% power for detecting a change of 25% in rates of improvement.
Statistical analysis
Basic descriptive statistics were used to describe the groups. Baseline characteristics were compared between the 2 groups using chi-square test and Fisher’s exact test for categorical variables. For continuous variables, the Student’s t-test was used; the Wilcoxon Rank Sum test was used for ordinal or skewed variables. Similar statistical tests were used to compare baseline characteristics between the providers and also at the conclusion of the study between the responders for each group.
For the outcome variables, we hypothesized no difference between the groups either in the rates of improvement, times to improvement, or in patients’ self-rating of sickness. The actual proportions improving between the 2 groups were compared using the chi-square test. Relative risk estimates and 95% confidence intervals were calculated to provide measures of risk and precision. Multiple logistic regression was used to compare the rates of improvement adjusting for the number of signs or symptoms classified as either 1, 2, or 3–4, obtained from the clinical prediction rule (Table 1).
The Kaplan-Meier method was used to construct the curves showing the time until patient improvement for each treatment group. The Wilcoxon test was then used to test the statistical significance in these curves (Figure). Cox’s Proportional Hazards regression was used to test for differences in the time to improvement between the groups adjusting for the number of signs or symptoms.
Additionally, a univariate repeated measures analysis of variance model was constructed to compare the 10-point Likert scale scores for the question, “How sick do you feel today?” In this model, the number of signs and symptoms was entered as a covariate in the analysis. Orthogonal contrasts were used as post-hoc tests to compare the difference between the groups within each time point (Table 2 ).
For the subgroup of patients who improved, analysis of covariance was used to compare the mean number of days to improvement between the groups. In this case the number of signs and symptoms was used as the covariate (Table 3). The Kaplan-Meier method and the Wilcoxon test were used to compare the cumulative rates of improvement (Figure). Unadjusted P-values are reported.
Primary analyses were performed using the intention-to-treat principle. All statistical analyses were performed using JMP Software (Product of SAS Institute Inc, Cary, NC). Statistical significance was set at 0.05 and exact P-values are reported.
TABLE 1
Baseline characteristics for amoxicillin and placebo groups
| Characteristic | Placebo (n=68) | Amoxicillin (n=67) |
|---|---|---|
| Purulent nasal discharge predominating on 1 side (%) | 28 (41) | 33 (49) |
| Local facial pain predominating on 1 side (%) | 25 (37) | 28 (42) |
| Purulent nasal discharge on both sides (%) | 45 (66) | 49 (73) |
| Pus in the nasal cavity assessed by provider (%) | 20 (29) | 23 (34) |
| Number of symptoms (%) | ||
| 1 | 34 (50) | 29 (43) |
| 2 | 17 (25) | 11 (17) |
| 3–4 | 17 (25) | 27 (40) |
| Female (%) | 49 (73) | 44 (66) |
| Tobacco use (%) | 6 (9) | 2 (3) |
| Over-the-counter medicines used for sinusitis (%) | 55 (89) | 58 (91) |
| Age mean (SD) | 32.6 (9.5) | 35.1 (10.1) |
| Length of symptoms prior to enrollment in mean days (SD) | 11.7 (6.3) | 10.7 (5.0) |
| Temperature in Fahrenheit mean (SD) | 97.9 (.8) | 97.9 (1.0) |
| Self-rating of health* mean (SD) | 3.1 (2.6) | 3.1 (2.4) |
| Self-rating of severity of cough* mean (SD) | 5.8 (2.5) | 5.1 (2.7) |
| Self-rating of how sick patient feels at enrollment* mean (SD) | 6.3 (1.9) | 6.2 (2.0) |
| Self-rating of severity of headache* mean (SD) | 5.3 (3.1) | 5.6 (2.8) |
| Percentages not always equal to 100%, due to missing data. All P <.05 | ||
| Represents Likert scale from 1 to 10; 1 being perfect to 10 being absolute worst case. | ||
Figure
Kaplan-Meier curve for improvement—amoxicillin (n=67) vs placebo (n=68)*

TABLE 2
Comparison of mean Likert scores by group across follow-up time points Question asked at each time point:
| “On a scale of 1 to 10, How sick do you feel today?”* | |||
|---|---|---|---|
| Time† | Amoxicillin (n=67) | Placebo (n=68) | P value |
| Day 0 (SD) | 6.10 (2.0) | 6.30 (1.9) | NS |
| Day 3 (SD) | 4.33 (1.8) | 4.73 (1.9) | NS |
| Day 7 (SD) | 3.15 (2.1) | 3.30 (2.0) | NS |
| Day 14 (SD) | 2.30 (1.9) | 2.80 (2.5) | NS |
| Likert score of 1 represents “perfect health” to 10 representing “worst condition.” | |||
| * Statistical tests—Orthogonal contrasts. | |||
| † Data shown represent mean and standard deviation (SD). | |||
TABLE 3
Mean number of days to improvement by group and number of signs and symptoms (at baseline) for patients who improved
| Number of signs and symptoms | Amoxicillin (n=32) | Placebo (n=25) |
|---|---|---|
| (1) Mean (n, SD) | 7.8 days (16, 3.7) | 11.0 days (10, 2.6) |
| (2) Mean (n, SD) | 7.8 days (5, 3.7) | 10.3 days (6, 3.2) |
| (3–4) Mean (n, SD) | 8.6 days (11, 3.6) | 10.6 days (9, 3.0) |
| Signs and symptoms are: purulent (yellow, thick) nasal discharge predominating on 1 side, local facial pain predominating on 1 side, purulent nasal discharge on both sides, and pus in the nasal cavity. | ||
Results
During the 18-month enrollment period, the 3 providers recorded all patients aged >18 years who had at least 1 cardinal feature described by the clinical prediction rule and had symptoms for a minimum of 7 days. Thus, initially 308 patients were approached for enrollment; 173 patients did not qualify after the exclusion criteria were applied, leaving 135 patients for randomization. Sixty-seven received amoxicillin and 68 received placebo. For 11 patients in the amoxicillin arm and 8 in the placebo arm, only baseline data were collected. These patients were then considered as lost to follow-up and were counted as “not improved” in the intention-to-treat analysis.
There were no significant differences (P >.05) in baseline characteristics of the treatment groups (Table 1). Additionally, there were no significant differences in the baseline characteristics between the providers (data not shown).
In the amoxicillin group 32 (48%) had completely improved compared with 25 (37%) in the placebo group (P=.26) after 2 weeks (relative risk of treatment failure=1.3; 95% CI, 0.87–1.94). However, individuals in the amoxicillin group did improve significantly earlier, as the Kaplan-Meier curve demonstrates (Figure). The first person in the amoxicillin group improved on day 3, compared with day 7 in the placebo group. This earlier improvement continued throughout the study (P=.039).
Subgroup analysis of the 57 who demonstrated complete recovery shows the amoxicillin group improved earlier as does the Kaplan-Meier curves in the Figure. In the amoxicillin group, the median day to any improvement was day 8 compared with day 12 for the placebo group (P=.005), while the mean day to improvement for the amoxicillin group was 8.1 days vs 10.7 days for placebo group.
When patients were asked “How sick do you feel today,” the average Likert scores decreased from 6. 1 (day 0) to 2.3 (day 14), and 6.3 (day 0) to 2.8 (day 14), in the amoxicillin and placebo groups, respectively. At each time point, there were no significant clinical or statistical differences between the 2 groups in how they rated their improvement (Table 2). Furthermore, examining only those who reported total improvement within 14 days showed no differences among groups.
No statistically significant differences were observed between the treatment groups that entailed the clinical prediction rule. However, in the patients who were improved at 14 days, the average number of days to improvement was consistently between 2 to 2.5 days shorter in the amoxicillin group compared with placebo (Table 3).
Side effects
No patients dropped out of the study due to adverse side effects (Table 4). There were no serious or unexpected side effects, with the majority related to gastrointestinal problems, such as diarrhea and abdominal pain.
TABLE 4
A Frequency of reported side effects by group
| Amoxicillin Adverse effects | Placebo (n=57) | (n=59) |
|---|---|---|
| Total number of patients with any side effects | 13 | 7 |
| Diarrhea | 4 | 1 |
| Nausea | 4 | 5 |
| Emesis | 1 | 0 |
| Abdominal pain | 2 | 1 |
| Rash | 2 | 0 |
| Hot flashes | 0 | 1 |
| Jittery | 0 | 1 |
| Dizziness | 3 | 0 |
| Dry mouth | 1 | 0 |
| Vaginal infection | 2 | 0 |
| Multiple events per patient are possible. | ||
Discussion
With respect to the patient-oriented outcome of clinical improvement, amoxicillin provided no significant benefit over placebo in the treatment of patients presenting with sinusitis complaints. On average our patients who had symptoms for 11 days prior to enrollment and are typical of patients that are often recommended for treatment with antibiotics.14,15
Our findings are consistent with others in which the overall benefit of antibiotics was minimal or nonexistent.16,18 But among individuals who did improve, those who received amoxicillin improved much earlier, both clinically and statistically. Unfortunately we were not able to specify those who are likely to improve. Clearly, further patient-oriented outcome studies are needed to help primary care physicians decide which patients may benefit from antibiotic treatment.
Antibiotics have not been shown to prevent the sequelae of acute sinusitis. One of the major difficulties in treating sinusitis is the lack of agreement about which outcomes are desired.19,20 Nearly 66% of patients diagnosed with sinusitis will get better without treatment, though nearly two thirds of patients will continue to have such symptoms as cough and nasal discharge for up to 3 weeks.21,22 Thus, we believe that to give antibiotics only to individuals who would truly benefit from them, policy makers, primary care physicians, and patients need to reassess clinically what constitutes sinusitis, and what outcomes are most desired. If the goal is to cure purulent nasal discharge, we are likely over-treating with antibiotics; as our study showed, after 2 weeks most patients in both groups still had nasal symptoms.
Our pilot of the clinical prediction rule failed to predict a proper response to antibiotics or the time to improvement. Although our numbers were not large, no trend was observed towards improvement in individuals with a higher score on the clinical prediction rule.
Our study has some important limitations. Interestingly we found different results when we used the dichotomous outcome of totally improved versus the 10-point Likert scale. A priori we decided our primary outcome was the dichotomous improvement, but which measure is more important and should be used is open to varying interpretations. Additionally, our study office unexpectedly closed and thus we could not recruit the number of patients we initially had planned. This limited our power to find differences between groups based on the number of cardinal clinical features. We encountered noncompliance with follow-up, as expected with the study design. We also arbitrarily stopped follow-up at 14 days, and cases that had not entirely improved were considered clinical failures in all but the Likert scale analysis. It is possible our results may have differed if we had continued to follow patients at 21 or 28 days, or if we had conducted the study at more than one office.
Methodologically, we conducted a rigorous study and showed that patients diagnosed with clinical sinusitis fared no better with amoxicillin or placebo, when measuring the patient-oriented outcome of complete improvement. But a subgroup of patients who were given antibiotics did improve at a much quicker rate. The difficulty is in clinically identifying this group and treating them with antibiotics. Conversely, using antibiotics in patients unnecessarily would only cause potential individual and societal harm. More clinically oriented studies need to be conducted to address this issue and elucidate what signs and symptoms these patients exhibit, to help clarify who should be treated with antibiotics.
ACKNOWLEDGMENTS
When this article was prepared, Dan Merenstein was an assistant professor of Family Medicine and Pediatrics at Georgetown University. This study was part of the Capricorn Research Network of Georgetown University. This projectwas supported by a grant from the American Academy ofFamily Physicians and the American Academy of FamilyPhysicians Foundation “Joint AAFP/F-AAFP Grant AwardsProgram” (JGAP). Support was also provided by the CapitolArea Primary Care Research Network. Research presentedat NAPRCG 2003, Banff, Canada.
We thank Joel Merenstein for insightful feedback and intelligent comments about study design and input with manuscript. We thank Goutham Rao and Traci Reisner for editorial help. We thank Community Drug Compounding Center of Pittsburgh and pharmacist Susan Freedenberg for drug development.
Corresponding author
Dan Merenstein, MD, Robert Wood Johnson Clinical Scholar, The Johns Hopkins Hospital, 600 North Wolfe St., Carnegie 291, Baltimore, MD 21287-6220. E-mail: [email protected].
1. Leggett JE. Acute sinusitis. When—and when not—to prescribe antibiotics. Postgrad Med 2004;115(1):13-19.
2. Lau J, et al. Diagnosis and treatment of acute bacterial rhinosinusitis. Evidence Report #9. Rockville, Md: Agency for Health Care Policy and Research; 1999.
3. Brooks I, Gooch WM, 3rd, Jenkins SG, et al. Medical management of acute bacterial sinusitis. Recommendations of a clinical advisory committee on pediatric and adult sinusitis. Ann Otol Rhinol Laryngol Suppl 2000;182:2-20.
4. Williams JW, Jr, Holleman DR, Jr, Samsa GP, Simel DL. Randomized controlled trial of 3 vs 10 days of trimethoprim/sulfamethoxazole for acute maxillary sinusitis. JAMA 1995;273:1015-1021.
5. Williams JW, Jr, Simel DL. Does this patient have sinusitis? Diagnosing acute sinusitis by history and physical examination. JAMA 1993;270:1242-1246.
6. Williams JW, Jr, Simel DL, Roberts L, Samsa GP. Clinical evaluation for sinusitis. Making the diagnosis by history and physical examination. Ann Intern Med 1992;117:705-710.
7. Wald ER, Chiponis D, Ledesma-Medina J. Comparative effectiveness of amoxicillin and amoxicillin-clavulanate potassium in acute paranasal sinus infections in children: a double-blind, placebo-controlled trial. Pediatrics 1986;77:795-800.
8. van Duijn NP, Brouwer HJ, Lamberts H. Use of symptoms and signs to diagnose maxillary sinusitis in general practice: comparison with ultrasonography. BMJ 1992;305:684-687.
9. Alho OP, Ylitalo K, Jokinen K, et al. The common cold in patients with a history of recurrent sinusitis: increased symptoms and radiologic sinusitislike findings. J Fam Pract 2001;50:26-31.
10. Berg O, Carenfelt C. Analysis of symptoms and clinical signs in the maxillary sinus empyema. Acta Otolaryngol 1988;105:343-349.
11. Okuyemi KS, Tsue TT. Radiologic imaging in the management of sinusitis. Am Fam Physician 2002;66:1882-1886.
12. Engels EA, Terrin N, Barza M, Lau J. Meta-analysis of diagnostic tests for acute sinusitis. J Clin Epidemiol 2000;53:852-862.
13. Poole MD. A focus on acute sinusitis in adults: changes in disease management. Am J Med 1999;106:38S-47S;discussion 48S-52S.
14. Desrosiers M, Frankiel S, Hamid QA, et al. Acute bacterial sinusitis in adults: management in the primary care setting. J Otolaryngol 2002;31 Suppl 2:2S2-14.
15. Lindbaek M. Acute sinusitis: guide to selection of anti-bacterial therapy. Drugs 2004;64:805-819.
16. De Sutter AI, De Meyere MJ, Christiaens TC, Van Driel ML, Peersman W, De Maeseneer JM. Does amoxicillin improve outcomes in patients with purulent rhinorrhea? J Fam Pract 2002;51:317-323.
17. Bucher HC, Tschudi P, Young J, et al. BASINUS (Basel Sinusitis Study) Investigators Effect of amoxicillin-clavulanate in clinically diagnosed acute rhinosinusitis: a placebo-controlled, double-blind, randomized trial in general practice. Arch Intern Med 2003;163:1793-1798.
18. Varonen H, Kunnamo I, Savolainen S, et al. Treatment of acute rhinosinusitis diagnosed by clinical criteria or ultrasound in primary care. A placebo-controlled randomised trial. Scand J Prim Health Care 2003;21:121-126.
19. Linder JA, Singer DE, Ancker M, Atlas SJ. Measures of health-related quality of life for adults with acute sinusitis. A systematic review. J Gen Intern Med 2003;18:390-401.
20. Theis J, Oubichon T. Are antibiotics helpful for acute maxillary sinusitis? J Fam Pract 2003;52:490-492;discussion 491.-
21. de Ferranti SD, Ioannidis JP, Lau J, Anninger WV, Barza M. Are amoxycillin and folate inhibitors as effective as other antibiotics for acute sinusitis? A meta-analysis. BMJ 1998;317:632-637.
22. Scott J, Orzano AJ. Evaluation and treatment of the patient with acute undifferentiated respiratory tract infection. J Fam Pract 2001;50:1070-1077.
- If the goal of treating sinusitis with antibiotics is to cure purulent nasal discharge, we are likely over-treating; as our study showed, after 2 weeks most patients in the treatment and placebo groups still had nasal symptoms (A).
- Persons with higher scores on the clinical prediction rule for sinusitis are no more likely to improve with antibiotic treatment than are those with lower scores (A).
- Among those who did improve on antibiotics, a subgroup that could not be clinically characterized improved at a much quicker rate than the others. Until further clinical trials can describe this favorable clinical profile, routine prescribing of antibiotics for sinusitis should be avoided (A).
Background: Sinusitis is the fifth most common reason for patients to visit primary care physicians, yet clinical outcomes relevant to patients are seldom studied.
Objective To determine whether patients with purulent rhinitis, “sinusitis-type symptoms,” improved with antibiotics. Second, to examine a clinical prediction rule to provide preliminary validation data.
Methods: Prospective clinical trial, with double-blinded placebo controlled randomization. The setting was a suburb of Washington, DC, from Oct 1, 2001, to March 31, 2003. All participants were 18 years or older, presenting to a family practice clinic with a complaint of sinusitis and with pus in the nasal cavity, facial pressure, or nasal discharge lasting longer than 7 days. The main outcome measures were resolution of symptoms within a 14-day follow-up period and the time to improvement (days).
Results: After exclusion criteria, 135 patients were randomized to either placebo (n=68) or amoxicillin (n=67) for 10 days. Intention-to-treat analyses showed that 32 (48%) of the amoxicillin group vs 25 (37%) of the placebo group (P=.26) showed complete improvement by the end of the 2-week follow-up period (relative risk=1.3; 95% confidence interval [CI], 0.87–1.94]). Although the rates of improvement were not statistically significantly different at the end of 2 weeks, the amoxicillin group improved significantly earlier, in the course of treatment, a median of 8 vs 12 days, than did the placebo group (P=.039).
Conclusion: For most patients with sinusitis-type complaints, no improvement was seen with antibiotics over placebo. For those who did improve, data suggested there is a subgroup of patients who may benefit from antibiotics.
It is estimated that adults have 2 to 3 colds a year, of which just 0.5% to 2% are complicated by bacterial sinusitis. However, primary care physicians treat over half of these colds with antibiotics.1 Sinusitis is the fifth most common diagnosis for which antibiotics are prescribed in the outpatient setting, with more than $6 billion spent annually in the United States on prescription and over-the-counter medications.1-3 Can we know with greater certainty when antibiotics are indicated for sinusitis?
A meta-analysis of randomized controlled studies has shown that the likelihood of bacterial sinusitis is increased (sensitivity 76%, specificity 79%) and antibiotics are helpful when a patient exhibits at least 3 of 4 cardinal clinical features: 1) purulent nasal discharge predominating on one side; 2) local facial pain predominating on one side; 3) purulent nasal discharge on both sides; and 4) pus in the nasal cavity.2 Although use of these criteria is encouraged, they are based on studies that recruited patients from subspecialty clinics and measured disease-oriented outcomes such as findings on sinus radiographs, CT scans, and sinus puncture with culture.4-12 Most cases of sinusitis, however, are treated in primary care settings where measuring such outcomes is impractical.
Given the lack of epidemiologic evidence as to which patients would benefit from treatment of sinusitis, primary care physicians face the dilemma of deciding during office encounters which patients should receive antibiotics and which have a viral infection for which symptomatic treatment is indicated.13
Our goal was to study the type of patient for whom this dilemma arises and to use clinical improvement as our primary outcome. We randomly assigned patients presenting with sinusitis complaints to receive amoxicillin or placebo, and compared the rates of improvement, time to improvement, and patient’s self-rating of sickness at the end of 2 weeks. We also tested the clinical prediction rule to see if participants with 3 or 4 signs and symptoms had different clinical outcomes than the others.
Methods
Setting
We conducted a randomized double-blind clinical trial of amoxicillin vs placebo. All patients were recruited from a suburban primary care office. Two physicians and one nurse practitioner enrolled and treated all patients over an 18-month period (Oct 1, 2001 to March 31, 2003). The clinicians involved in the study were trained to identify purulent discharge in the nasal cavity. Institutional Review Board approval was obtained from Georgetown University prior to the study. Written informed consent was obtained from all participating patients.
Patients
Patients were eligible to participate if they were 18 years or older; had at least 1 cardinal feature described by the clinical prediction rule: 1) purulent nasal discharge predominating on one side, 2) local facial pain predominating on one side, 3) purulent nasal discharge on both sides, or 4) pus in the nasal cavity; and had symptoms for at least 7 days. Patients were excluded if their histories included antibiotic treatment within the past month, allergy to penicillin, sinus surgery, compromised immunity, pneumonia, or streptococcal pharyngitis.
Randomization
Permuted block randomization stratified for the 3 participating clinicians was used to determine treatment assignment. Patients were given an envelope containing 40 capsules, either a placebo medicine taken twice daily for 10 days or 1000 mg of amoxicillin (500 mg pills) taken twice daily for 10 days. The envelopes were opaque, and each had 40 identical-appearing pills (to ensure allocation concealment). The participating clinicians were naive to the treatment assignments.
Assessment of outcomes
Trained personnel, masked to treatment assignment, conducted follow-up telephone interviews on days 3, 7, and 14 following patients’ visits for sinusitis, to assess clinical improvement. Twelve follow-up questions were asked.
Sample size
The primary outcome used to determine sample size was dichotomous—either “improved” or “not improved” by the end of 2 weeks. Thus, patients were asked, “what day were you entirely improved.” The sample sizes obtained per group (67 for amoxicillin and 68 for placebo) provided 80% power for detecting a change of 25% in rates of improvement.
Statistical analysis
Basic descriptive statistics were used to describe the groups. Baseline characteristics were compared between the 2 groups using chi-square test and Fisher’s exact test for categorical variables. For continuous variables, the Student’s t-test was used; the Wilcoxon Rank Sum test was used for ordinal or skewed variables. Similar statistical tests were used to compare baseline characteristics between the providers and also at the conclusion of the study between the responders for each group.
For the outcome variables, we hypothesized no difference between the groups either in the rates of improvement, times to improvement, or in patients’ self-rating of sickness. The actual proportions improving between the 2 groups were compared using the chi-square test. Relative risk estimates and 95% confidence intervals were calculated to provide measures of risk and precision. Multiple logistic regression was used to compare the rates of improvement adjusting for the number of signs or symptoms classified as either 1, 2, or 3–4, obtained from the clinical prediction rule (Table 1).
The Kaplan-Meier method was used to construct the curves showing the time until patient improvement for each treatment group. The Wilcoxon test was then used to test the statistical significance in these curves (Figure). Cox’s Proportional Hazards regression was used to test for differences in the time to improvement between the groups adjusting for the number of signs or symptoms.
Additionally, a univariate repeated measures analysis of variance model was constructed to compare the 10-point Likert scale scores for the question, “How sick do you feel today?” In this model, the number of signs and symptoms was entered as a covariate in the analysis. Orthogonal contrasts were used as post-hoc tests to compare the difference between the groups within each time point (Table 2 ).
For the subgroup of patients who improved, analysis of covariance was used to compare the mean number of days to improvement between the groups. In this case the number of signs and symptoms was used as the covariate (Table 3). The Kaplan-Meier method and the Wilcoxon test were used to compare the cumulative rates of improvement (Figure). Unadjusted P-values are reported.
Primary analyses were performed using the intention-to-treat principle. All statistical analyses were performed using JMP Software (Product of SAS Institute Inc, Cary, NC). Statistical significance was set at 0.05 and exact P-values are reported.
TABLE 1
Baseline characteristics for amoxicillin and placebo groups
| Characteristic | Placebo (n=68) | Amoxicillin (n=67) |
|---|---|---|
| Purulent nasal discharge predominating on 1 side (%) | 28 (41) | 33 (49) |
| Local facial pain predominating on 1 side (%) | 25 (37) | 28 (42) |
| Purulent nasal discharge on both sides (%) | 45 (66) | 49 (73) |
| Pus in the nasal cavity assessed by provider (%) | 20 (29) | 23 (34) |
| Number of symptoms (%) | ||
| 1 | 34 (50) | 29 (43) |
| 2 | 17 (25) | 11 (17) |
| 3–4 | 17 (25) | 27 (40) |
| Female (%) | 49 (73) | 44 (66) |
| Tobacco use (%) | 6 (9) | 2 (3) |
| Over-the-counter medicines used for sinusitis (%) | 55 (89) | 58 (91) |
| Age mean (SD) | 32.6 (9.5) | 35.1 (10.1) |
| Length of symptoms prior to enrollment in mean days (SD) | 11.7 (6.3) | 10.7 (5.0) |
| Temperature in Fahrenheit mean (SD) | 97.9 (.8) | 97.9 (1.0) |
| Self-rating of health* mean (SD) | 3.1 (2.6) | 3.1 (2.4) |
| Self-rating of severity of cough* mean (SD) | 5.8 (2.5) | 5.1 (2.7) |
| Self-rating of how sick patient feels at enrollment* mean (SD) | 6.3 (1.9) | 6.2 (2.0) |
| Self-rating of severity of headache* mean (SD) | 5.3 (3.1) | 5.6 (2.8) |
| Percentages not always equal to 100%, due to missing data. All P <.05 | ||
| Represents Likert scale from 1 to 10; 1 being perfect to 10 being absolute worst case. | ||
Figure
Kaplan-Meier curve for improvement—amoxicillin (n=67) vs placebo (n=68)*
TABLE 2
Comparison of mean Likert scores by group across follow-up time points Question asked at each time point:
| “On a scale of 1 to 10, How sick do you feel today?”* | |||
|---|---|---|---|
| Time† | Amoxicillin (n=67) | Placebo (n=68) | P value |
| Day 0 (SD) | 6.10 (2.0) | 6.30 (1.9) | NS |
| Day 3 (SD) | 4.33 (1.8) | 4.73 (1.9) | NS |
| Day 7 (SD) | 3.15 (2.1) | 3.30 (2.0) | NS |
| Day 14 (SD) | 2.30 (1.9) | 2.80 (2.5) | NS |
| Likert score of 1 represents “perfect health” to 10 representing “worst condition.” | |||
| * Statistical tests—Orthogonal contrasts. | |||
| † Data shown represent mean and standard deviation (SD). | |||
TABLE 3
Mean number of days to improvement by group and number of signs and symptoms (at baseline) for patients who improved
| Number of signs and symptoms | Amoxicillin (n=32) | Placebo (n=25) |
|---|---|---|
| (1) Mean (n, SD) | 7.8 days (16, 3.7) | 11.0 days (10, 2.6) |
| (2) Mean (n, SD) | 7.8 days (5, 3.7) | 10.3 days (6, 3.2) |
| (3–4) Mean (n, SD) | 8.6 days (11, 3.6) | 10.6 days (9, 3.0) |
| Signs and symptoms are: purulent (yellow, thick) nasal discharge predominating on 1 side, local facial pain predominating on 1 side, purulent nasal discharge on both sides, and pus in the nasal cavity. | ||
Results
During the 18-month enrollment period, the 3 providers recorded all patients aged >18 years who had at least 1 cardinal feature described by the clinical prediction rule and had symptoms for a minimum of 7 days. Thus, initially 308 patients were approached for enrollment; 173 patients did not qualify after the exclusion criteria were applied, leaving 135 patients for randomization. Sixty-seven received amoxicillin and 68 received placebo. For 11 patients in the amoxicillin arm and 8 in the placebo arm, only baseline data were collected. These patients were then considered as lost to follow-up and were counted as “not improved” in the intention-to-treat analysis.
There were no significant differences (P >.05) in baseline characteristics of the treatment groups (Table 1). Additionally, there were no significant differences in the baseline characteristics between the providers (data not shown).
In the amoxicillin group 32 (48%) had completely improved compared with 25 (37%) in the placebo group (P=.26) after 2 weeks (relative risk of treatment failure=1.3; 95% CI, 0.87–1.94). However, individuals in the amoxicillin group did improve significantly earlier, as the Kaplan-Meier curve demonstrates (Figure). The first person in the amoxicillin group improved on day 3, compared with day 7 in the placebo group. This earlier improvement continued throughout the study (P=.039).
Subgroup analysis of the 57 who demonstrated complete recovery shows the amoxicillin group improved earlier as does the Kaplan-Meier curves in the Figure. In the amoxicillin group, the median day to any improvement was day 8 compared with day 12 for the placebo group (P=.005), while the mean day to improvement for the amoxicillin group was 8.1 days vs 10.7 days for placebo group.
When patients were asked “How sick do you feel today,” the average Likert scores decreased from 6. 1 (day 0) to 2.3 (day 14), and 6.3 (day 0) to 2.8 (day 14), in the amoxicillin and placebo groups, respectively. At each time point, there were no significant clinical or statistical differences between the 2 groups in how they rated their improvement (Table 2). Furthermore, examining only those who reported total improvement within 14 days showed no differences among groups.
No statistically significant differences were observed between the treatment groups that entailed the clinical prediction rule. However, in the patients who were improved at 14 days, the average number of days to improvement was consistently between 2 to 2.5 days shorter in the amoxicillin group compared with placebo (Table 3).
Side effects
No patients dropped out of the study due to adverse side effects (Table 4). There were no serious or unexpected side effects, with the majority related to gastrointestinal problems, such as diarrhea and abdominal pain.
TABLE 4
A Frequency of reported side effects by group
| Amoxicillin Adverse effects | Placebo (n=57) | (n=59) |
|---|---|---|
| Total number of patients with any side effects | 13 | 7 |
| Diarrhea | 4 | 1 |
| Nausea | 4 | 5 |
| Emesis | 1 | 0 |
| Abdominal pain | 2 | 1 |
| Rash | 2 | 0 |
| Hot flashes | 0 | 1 |
| Jittery | 0 | 1 |
| Dizziness | 3 | 0 |
| Dry mouth | 1 | 0 |
| Vaginal infection | 2 | 0 |
| Multiple events per patient are possible. | ||
Discussion
With respect to the patient-oriented outcome of clinical improvement, amoxicillin provided no significant benefit over placebo in the treatment of patients presenting with sinusitis complaints. On average our patients who had symptoms for 11 days prior to enrollment and are typical of patients that are often recommended for treatment with antibiotics.14,15
Our findings are consistent with others in which the overall benefit of antibiotics was minimal or nonexistent.16,18 But among individuals who did improve, those who received amoxicillin improved much earlier, both clinically and statistically. Unfortunately we were not able to specify those who are likely to improve. Clearly, further patient-oriented outcome studies are needed to help primary care physicians decide which patients may benefit from antibiotic treatment.
Antibiotics have not been shown to prevent the sequelae of acute sinusitis. One of the major difficulties in treating sinusitis is the lack of agreement about which outcomes are desired.19,20 Nearly 66% of patients diagnosed with sinusitis will get better without treatment, though nearly two thirds of patients will continue to have such symptoms as cough and nasal discharge for up to 3 weeks.21,22 Thus, we believe that to give antibiotics only to individuals who would truly benefit from them, policy makers, primary care physicians, and patients need to reassess clinically what constitutes sinusitis, and what outcomes are most desired. If the goal is to cure purulent nasal discharge, we are likely over-treating with antibiotics; as our study showed, after 2 weeks most patients in both groups still had nasal symptoms.
Our pilot of the clinical prediction rule failed to predict a proper response to antibiotics or the time to improvement. Although our numbers were not large, no trend was observed towards improvement in individuals with a higher score on the clinical prediction rule.
Our study has some important limitations. Interestingly we found different results when we used the dichotomous outcome of totally improved versus the 10-point Likert scale. A priori we decided our primary outcome was the dichotomous improvement, but which measure is more important and should be used is open to varying interpretations. Additionally, our study office unexpectedly closed and thus we could not recruit the number of patients we initially had planned. This limited our power to find differences between groups based on the number of cardinal clinical features. We encountered noncompliance with follow-up, as expected with the study design. We also arbitrarily stopped follow-up at 14 days, and cases that had not entirely improved were considered clinical failures in all but the Likert scale analysis. It is possible our results may have differed if we had continued to follow patients at 21 or 28 days, or if we had conducted the study at more than one office.
Methodologically, we conducted a rigorous study and showed that patients diagnosed with clinical sinusitis fared no better with amoxicillin or placebo, when measuring the patient-oriented outcome of complete improvement. But a subgroup of patients who were given antibiotics did improve at a much quicker rate. The difficulty is in clinically identifying this group and treating them with antibiotics. Conversely, using antibiotics in patients unnecessarily would only cause potential individual and societal harm. More clinically oriented studies need to be conducted to address this issue and elucidate what signs and symptoms these patients exhibit, to help clarify who should be treated with antibiotics.
ACKNOWLEDGMENTS
When this article was prepared, Dan Merenstein was an assistant professor of Family Medicine and Pediatrics at Georgetown University. This study was part of the Capricorn Research Network of Georgetown University. This projectwas supported by a grant from the American Academy ofFamily Physicians and the American Academy of FamilyPhysicians Foundation “Joint AAFP/F-AAFP Grant AwardsProgram” (JGAP). Support was also provided by the CapitolArea Primary Care Research Network. Research presentedat NAPRCG 2003, Banff, Canada.
We thank Joel Merenstein for insightful feedback and intelligent comments about study design and input with manuscript. We thank Goutham Rao and Traci Reisner for editorial help. We thank Community Drug Compounding Center of Pittsburgh and pharmacist Susan Freedenberg for drug development.
Corresponding author
Dan Merenstein, MD, Robert Wood Johnson Clinical Scholar, The Johns Hopkins Hospital, 600 North Wolfe St., Carnegie 291, Baltimore, MD 21287-6220. E-mail: [email protected].
1. Leggett JE. Acute sinusitis. When—and when not—to prescribe antibiotics. Postgrad Med 2004;115(1):13-19.
2. Lau J, et al. Diagnosis and treatment of acute bacterial rhinosinusitis. Evidence Report #9. Rockville, Md: Agency for Health Care Policy and Research; 1999.
3. Brooks I, Gooch WM, 3rd, Jenkins SG, et al. Medical management of acute bacterial sinusitis. Recommendations of a clinical advisory committee on pediatric and adult sinusitis. Ann Otol Rhinol Laryngol Suppl 2000;182:2-20.
4. Williams JW, Jr, Holleman DR, Jr, Samsa GP, Simel DL. Randomized controlled trial of 3 vs 10 days of trimethoprim/sulfamethoxazole for acute maxillary sinusitis. JAMA 1995;273:1015-1021.
5. Williams JW, Jr, Simel DL. Does this patient have sinusitis? Diagnosing acute sinusitis by history and physical examination. JAMA 1993;270:1242-1246.
6. Williams JW, Jr, Simel DL, Roberts L, Samsa GP. Clinical evaluation for sinusitis. Making the diagnosis by history and physical examination. Ann Intern Med 1992;117:705-710.
7. Wald ER, Chiponis D, Ledesma-Medina J. Comparative effectiveness of amoxicillin and amoxicillin-clavulanate potassium in acute paranasal sinus infections in children: a double-blind, placebo-controlled trial. Pediatrics 1986;77:795-800.
8. van Duijn NP, Brouwer HJ, Lamberts H. Use of symptoms and signs to diagnose maxillary sinusitis in general practice: comparison with ultrasonography. BMJ 1992;305:684-687.
9. Alho OP, Ylitalo K, Jokinen K, et al. The common cold in patients with a history of recurrent sinusitis: increased symptoms and radiologic sinusitislike findings. J Fam Pract 2001;50:26-31.
10. Berg O, Carenfelt C. Analysis of symptoms and clinical signs in the maxillary sinus empyema. Acta Otolaryngol 1988;105:343-349.
11. Okuyemi KS, Tsue TT. Radiologic imaging in the management of sinusitis. Am Fam Physician 2002;66:1882-1886.
12. Engels EA, Terrin N, Barza M, Lau J. Meta-analysis of diagnostic tests for acute sinusitis. J Clin Epidemiol 2000;53:852-862.
13. Poole MD. A focus on acute sinusitis in adults: changes in disease management. Am J Med 1999;106:38S-47S;discussion 48S-52S.
14. Desrosiers M, Frankiel S, Hamid QA, et al. Acute bacterial sinusitis in adults: management in the primary care setting. J Otolaryngol 2002;31 Suppl 2:2S2-14.
15. Lindbaek M. Acute sinusitis: guide to selection of anti-bacterial therapy. Drugs 2004;64:805-819.
16. De Sutter AI, De Meyere MJ, Christiaens TC, Van Driel ML, Peersman W, De Maeseneer JM. Does amoxicillin improve outcomes in patients with purulent rhinorrhea? J Fam Pract 2002;51:317-323.
17. Bucher HC, Tschudi P, Young J, et al. BASINUS (Basel Sinusitis Study) Investigators Effect of amoxicillin-clavulanate in clinically diagnosed acute rhinosinusitis: a placebo-controlled, double-blind, randomized trial in general practice. Arch Intern Med 2003;163:1793-1798.
18. Varonen H, Kunnamo I, Savolainen S, et al. Treatment of acute rhinosinusitis diagnosed by clinical criteria or ultrasound in primary care. A placebo-controlled randomised trial. Scand J Prim Health Care 2003;21:121-126.
19. Linder JA, Singer DE, Ancker M, Atlas SJ. Measures of health-related quality of life for adults with acute sinusitis. A systematic review. J Gen Intern Med 2003;18:390-401.
20. Theis J, Oubichon T. Are antibiotics helpful for acute maxillary sinusitis? J Fam Pract 2003;52:490-492;discussion 491.-
21. de Ferranti SD, Ioannidis JP, Lau J, Anninger WV, Barza M. Are amoxycillin and folate inhibitors as effective as other antibiotics for acute sinusitis? A meta-analysis. BMJ 1998;317:632-637.
22. Scott J, Orzano AJ. Evaluation and treatment of the patient with acute undifferentiated respiratory tract infection. J Fam Pract 2001;50:1070-1077.
Second thoughts on integrative medicine
Integrative medicine is a new concept of healthcare.1,2 Confusingly, the term has 2 definitions. The first definition is a healthcare system “that selectively incorporates elements of complementary and alternative medicine (CAM) into comprehensive treatment plans….”1 The second definition is an approach that emphasizes “health and healing rather than disease and treatment. It views patients as whole people with minds and spirits as well as bodies….”1
I would argue that the whole-person concept has always been at the core of good medicine, particularly primary care, and that coining a new name for an old value is counterproductive. If we can agree that the whole-person concept needs no other name, we can greatly simplify matters by letting integrative medicine stand for just one thing—incorporating elements of CAM into routine health care. Let’s consider the implications of this thinking.
The arguments for integrative medicine
Proponents of integrating CAM into routine medical care point to its increasing popularity3 and to the satisfaction of most CAM users.4 They also argue that CAM has largely been a privilege of the affluent class,3 and, to achieve equity in health care, we should integrate CAM across all of society. This line of argument seems logical and well intentioned. But is it convincing?
Just because the affluent are the primary recipients of CAM does not necessarily recommend it to everyone. Their lifestyle choices also put them at greater risk for cancer and gout, and they undergo liposuction more often. That the affluent can afford to pay for CAM does not mean it’s good for them.
The evidence for benefits vs risks
The assumption we should really mistrust is that satisfaction with CAM services is the same as a demonstration of efficacy. The missing link in the logic of integrated medicine is the evidence that CAM does more good than harm. Integrating therapies with uncertain risk-benefit profiles (eg, upper spinal manipulation) or modalities that are pleasant but of dubious value (eg, aromatherapy) would render health care less evidence-based and more expensive but not necessarily more effective.
Of course, not all CAM is ineffective or unsafe.5 CAM interventions that demonstrably do more good than harm should be integrated; those that don’t should not be. Research into CAM is in its infancy, and the area of uncertainty remains huge. For most forms of CAM, we simply cannot be sure about the balance of risk and benefit. To integrate such CAM would be counterproductive. To integrate those therapies that are supported by good data is not integrative medicine but simply evidence-based medicine.
Patient choice and responsible decisions
And what about patient choice? This concept is well-founded in our legal system. As physicians, we are just advisors trying to guide patient choice. Creating a new type of medicine that stands for incorporation of unproven practices into medical routine would, however, be a violation of our duty to be responsible advisors to patients. Responsible advice has to be based on evidence, not on ideology. Decision-makers rightly insist on data, not anecdote.6
In conclusion, the term integrative medicine is superfluous since it stands either for whole-person medicine (a concept already a part of primary care) or for the promotion of integrating well-documented CAM modalities (already being done with evidence-based medicine). The danger of integrative medicine lies in creating a smokescreen behind which dubious practices are pushed into routine healthcare. I believe this would be a serious disservice to all involved—not least, to our patients.
Correspondence
Edzard Ernst, MD, PhD, FRCP, FRCPEd, Complementary Medicine, Peninsula Medical School, Universities of Exeter & Plymouth, 25 Victoria Park Road, Exeter EX2 4NT UK. E-mail: [email protected].
1. Rees L, Weil A. Integrated medicine. BMJ 2001;322:119-120.
2. Caspi O, Bell IR, Rychener D, Gaudet TW, Weil A. The tower of Babel: communication and medicine - an essay on medical education and complementary/alternative medicine. Arch Intern Med 2000;160:3193-3195
3. Eisenberg DM, David RB, Ettner SL, et al. Trends in alternative medicine use in the United States. JAMA 1998;280:1569-1575.
4. Mahady GB, Parrot J, Lee C, Yun GS, Dan A. Botanical dietary supplement use in peri- and postmenopausal women. Menopause 2003;10:65-72.
5. Ernst E, Pittler MH, Stevinson C, White AR. The Desktop Guide to Complementary and Alternative Medicine. Edinburgh: Mosby; 2001.
6. Van Haselen R, Fisher P. Evidence influencing British Health Authorities decisions in purchasing complementary medicine. JAMA 1998;290:1564.-
Integrative medicine is a new concept of healthcare.1,2 Confusingly, the term has 2 definitions. The first definition is a healthcare system “that selectively incorporates elements of complementary and alternative medicine (CAM) into comprehensive treatment plans….”1 The second definition is an approach that emphasizes “health and healing rather than disease and treatment. It views patients as whole people with minds and spirits as well as bodies….”1
I would argue that the whole-person concept has always been at the core of good medicine, particularly primary care, and that coining a new name for an old value is counterproductive. If we can agree that the whole-person concept needs no other name, we can greatly simplify matters by letting integrative medicine stand for just one thing—incorporating elements of CAM into routine health care. Let’s consider the implications of this thinking.
The arguments for integrative medicine
Proponents of integrating CAM into routine medical care point to its increasing popularity3 and to the satisfaction of most CAM users.4 They also argue that CAM has largely been a privilege of the affluent class,3 and, to achieve equity in health care, we should integrate CAM across all of society. This line of argument seems logical and well intentioned. But is it convincing?
Just because the affluent are the primary recipients of CAM does not necessarily recommend it to everyone. Their lifestyle choices also put them at greater risk for cancer and gout, and they undergo liposuction more often. That the affluent can afford to pay for CAM does not mean it’s good for them.
The evidence for benefits vs risks
The assumption we should really mistrust is that satisfaction with CAM services is the same as a demonstration of efficacy. The missing link in the logic of integrated medicine is the evidence that CAM does more good than harm. Integrating therapies with uncertain risk-benefit profiles (eg, upper spinal manipulation) or modalities that are pleasant but of dubious value (eg, aromatherapy) would render health care less evidence-based and more expensive but not necessarily more effective.
Of course, not all CAM is ineffective or unsafe.5 CAM interventions that demonstrably do more good than harm should be integrated; those that don’t should not be. Research into CAM is in its infancy, and the area of uncertainty remains huge. For most forms of CAM, we simply cannot be sure about the balance of risk and benefit. To integrate such CAM would be counterproductive. To integrate those therapies that are supported by good data is not integrative medicine but simply evidence-based medicine.
Patient choice and responsible decisions
And what about patient choice? This concept is well-founded in our legal system. As physicians, we are just advisors trying to guide patient choice. Creating a new type of medicine that stands for incorporation of unproven practices into medical routine would, however, be a violation of our duty to be responsible advisors to patients. Responsible advice has to be based on evidence, not on ideology. Decision-makers rightly insist on data, not anecdote.6
In conclusion, the term integrative medicine is superfluous since it stands either for whole-person medicine (a concept already a part of primary care) or for the promotion of integrating well-documented CAM modalities (already being done with evidence-based medicine). The danger of integrative medicine lies in creating a smokescreen behind which dubious practices are pushed into routine healthcare. I believe this would be a serious disservice to all involved—not least, to our patients.
Correspondence
Edzard Ernst, MD, PhD, FRCP, FRCPEd, Complementary Medicine, Peninsula Medical School, Universities of Exeter & Plymouth, 25 Victoria Park Road, Exeter EX2 4NT UK. E-mail: [email protected].
1. Rees L, Weil A. Integrated medicine. BMJ 2001;322:119-120.
2. Caspi O, Bell IR, Rychener D, Gaudet TW, Weil A. The tower of Babel: communication and medicine - an essay on medical education and complementary/alternative medicine. Arch Intern Med 2000;160:3193-3195
3. Eisenberg DM, David RB, Ettner SL, et al. Trends in alternative medicine use in the United States. JAMA 1998;280:1569-1575.
4. Mahady GB, Parrot J, Lee C, Yun GS, Dan A. Botanical dietary supplement use in peri- and postmenopausal women. Menopause 2003;10:65-72.
5. Ernst E, Pittler MH, Stevinson C, White AR. The Desktop Guide to Complementary and Alternative Medicine. Edinburgh: Mosby; 2001.
6. Van Haselen R, Fisher P. Evidence influencing British Health Authorities decisions in purchasing complementary medicine. JAMA 1998;290:1564.-
Group medical visits and lifestyle modification
Group visits are a fairly new approach to medical treatment. Most frequently, group visits have been used to treat a specific, chronic condition such as non-insulin-dependent diabetes. At the Sastun Center of Integrative Health Care in Mission, Kansas, we created a group medical visit program for all disease states requiring lifestyle modification.
Methods. Our group met monthly for 75 minutes. The first half of the meeting consisted of activities typical of a traditional medical visit. When patients arrived, a nurse measured vital signs and weight, including a body mass index, fat mass, and so forth. The group met around a table. After collecting signed confidentiality agreements from each patient, the physician went around the table and spent time with each patient discussing current medical problems. Unlike a typical office visit, in the group format all members listen and discuss each patient’s situation.
The second half was spent discussing a new topic. A guest speaker or another practitioner at the Sastun Center usually conducted this part of the session. Examples of discussion topics were movement for people with arthritis, yoga stretches and breathing, nutrition with a dietician, a special “dysglycemic” diet, handling holiday stress, and stress-related eating. All patients attending had 1 or more of these health problems: obesity, hypertension, type 2 diabetes, or hyperlipidemia.
Results. Five patients attended at least 4 sessions in 6 months. Other patients attended but not consistently. All members of the study and control groups were female, though this was not intentional. A majority of patients at the Sastun Center are female, so this was not surprising. The average age was 60 years (range, 52–66) for the active group and 50 years (range, 45–60) for the control group.
Overall, participants in the group medical visits exhibited greater improvements in weight loss and in cholesterol, triglyceride, and LDL-C reductions when compared with a control group of other patients from the Sastun Center with similar demographics. The active group had an average weight loss of 10.6 pounds (4.2%) compared with 1.8 pounds (0.9%) for the control group. The total cholesterol for the active group decreased an average of 12.3 mg/dL (6%), while the control group had an average increase of 13 mg/dL (5.7%). Similarly, there was an average decrease in triglycerides of 20 mg/dL (11.2%) for the active group and an average increase of 40.8 mg/dL (27.8%) for the control group. The LDL levels for the active and control groups changed –4 mg/dL (–4.1%) and +3.4 mg/dL (–0.16%), respectively. The HDL levels overall did not change for the active or control groups.
Conclusion. Though our study used very small patient numbers, it appears the patients participating in the group medical visits had greater improvement compared with similar patients not participating in the group. Group medical visits may be a successful method for helping patients who need lifestyle modifications.
Corresponding author: Jane L. Murray, MD, Medical Director, Sastun Center of Integrative Health Care, 5509 Foxridge Drive, Mission, KS 66212. E-mail: [email protected].
Group visits are a fairly new approach to medical treatment. Most frequently, group visits have been used to treat a specific, chronic condition such as non-insulin-dependent diabetes. At the Sastun Center of Integrative Health Care in Mission, Kansas, we created a group medical visit program for all disease states requiring lifestyle modification.
Methods. Our group met monthly for 75 minutes. The first half of the meeting consisted of activities typical of a traditional medical visit. When patients arrived, a nurse measured vital signs and weight, including a body mass index, fat mass, and so forth. The group met around a table. After collecting signed confidentiality agreements from each patient, the physician went around the table and spent time with each patient discussing current medical problems. Unlike a typical office visit, in the group format all members listen and discuss each patient’s situation.
The second half was spent discussing a new topic. A guest speaker or another practitioner at the Sastun Center usually conducted this part of the session. Examples of discussion topics were movement for people with arthritis, yoga stretches and breathing, nutrition with a dietician, a special “dysglycemic” diet, handling holiday stress, and stress-related eating. All patients attending had 1 or more of these health problems: obesity, hypertension, type 2 diabetes, or hyperlipidemia.
Results. Five patients attended at least 4 sessions in 6 months. Other patients attended but not consistently. All members of the study and control groups were female, though this was not intentional. A majority of patients at the Sastun Center are female, so this was not surprising. The average age was 60 years (range, 52–66) for the active group and 50 years (range, 45–60) for the control group.
Overall, participants in the group medical visits exhibited greater improvements in weight loss and in cholesterol, triglyceride, and LDL-C reductions when compared with a control group of other patients from the Sastun Center with similar demographics. The active group had an average weight loss of 10.6 pounds (4.2%) compared with 1.8 pounds (0.9%) for the control group. The total cholesterol for the active group decreased an average of 12.3 mg/dL (6%), while the control group had an average increase of 13 mg/dL (5.7%). Similarly, there was an average decrease in triglycerides of 20 mg/dL (11.2%) for the active group and an average increase of 40.8 mg/dL (27.8%) for the control group. The LDL levels for the active and control groups changed –4 mg/dL (–4.1%) and +3.4 mg/dL (–0.16%), respectively. The HDL levels overall did not change for the active or control groups.
Conclusion. Though our study used very small patient numbers, it appears the patients participating in the group medical visits had greater improvement compared with similar patients not participating in the group. Group medical visits may be a successful method for helping patients who need lifestyle modifications.
Corresponding author: Jane L. Murray, MD, Medical Director, Sastun Center of Integrative Health Care, 5509 Foxridge Drive, Mission, KS 66212. E-mail: [email protected].
Corresponding author: Jane L. Murray, MD, Medical Director, Sastun Center of Integrative Health Care, 5509 Foxridge Drive, Mission, KS 66212. E-mail: [email protected].
Hydroquinone 4%, Tretinoin 0.05%, Fluocinolone Acetonide 0.01%: A Safe and Efficacious 12-Month Treatment for Melasma
Time requirements for diabetes self-management: Too much for many?
- The care physicians commonly recommend may be too time-consuming for many patients. Find out how much time is available and ask about the pressures on that time.
- If time requirements are onerous, help patients set priorities to maximize health.
Background: In Crossing the Quality Chasm, the Institute of Medicine laid out principles to improve quality of care and identified chronic diseases as a starting point. One of those principles was the wise use of patient time, but current recommendations for chronic conditions do not consider time spent on self-care or its impact on patients’ lives.
Objective: To estimate the time required for recommended diabetes self-care.
Methods: A convenience sample of 8 certified diabetes educators derived consensus-based estimates of the time required for all self-care tasks recommended by the American Diabetes Association.
Results: For experienced patients with type 2 diabetes controlled by oral agents, recommended self-care would require more than 2 extra hours daily. Elderly patients and those with newly diagnosed disease, or those with physical limitations, would need more time. Exercise and diet, required for self-care of many chronic conditions, are the most time-consuming tasks.
Conclusion: The time required by recommended self-care is substantial. Crossing the Quality Chasm suggests how clinicians and guideline developers can help patients make the best use of their self-care time: elicit the patient’s perspective; develop evidence on the health consequences of self-care tasks; and respect patients’ time.
To what extent does the time needed to perform diabetes self care diminish patients’ willingness to follow recommendations? Are there means of making self care more acceptable? Consider the following observations about chronic disease in general.
The Institute of Medicine has highlighted the extent to which medical care falls short of its potential. Crossing the Quality Chasm recommended 10 principles to reorient health systems; among them:
- shared information and decision-making to better reflect patient preferences
- evidence-based decision making
- continuous decrease in waste of “resources or patient time.”
Chronic conditions were identified as “a starting point” for applying these recommendations since they are “the leading cause of illness, disability, and death in the United States, affecting almost half of the population and accounting for the majority of health care resources used.”1
Self-care, or self-management, is essential to good care of diabetes, one of the most common chronic conditions. Funnell and Anderson noted that “[m]ore than 95% of diabetes care is done by the patient.”2 Physicians offer instruction, but day-to-day implementation depends on patients themselves, who care for their diabetes “within the context of the other goals, priorities, health issues, family demands, and other personal concerns that make up their lives,”2 When their advice is not followed, and patients’ health suffers, physicians are frustrated by what can seem their patients’ refusal to do the best for their condition.
Researchers have examined a broad range of potential reasons for noncompliance with diabetes self-care recommendations, from patients’ attitudes and beliefs, to health motivation, readiness to change, language barriers, medication regimens, and trust in the medical profession.3-9 Although self-management programs have become more patient-centered,10-15 a review of patient-centered approaches in diabetes noted that “it is apparent that factors other than knowledge are needed to achieve long-term behavioral change.”16 A review of medication compliance concluded that “current methods of improving medication adherence for chronic health problems are mostly complex, labor-intensive, and not predictably effective.”17 Something crucial to success has yet to be identified.
An important missing link may be the time demands of self-care. Evaluations have considered program design and outcomes, but not how the length of diabetes self-care regimens affects patient outcomes. Indeed, scant attention has been paid to time requirements18 and little is known about how much time current recommendations take. To begin to draw attention to time requirements as a potential barrier to good self-management, we present estimates of the time required by recommended diabetes self-care.
Methods
Certified diabetes educators (CDEs) teach self-care skills and evaluate adherence. Their training is based on the American Diabetes Association’s (ADA) Clinical Practice Recommendations,19 which represent the standard of care for diabetes. The guidelines of the American Association of Diabetes Educators20 cover additional self-care elements, such as stress management and social support. We assembled a convenience sample of 8 CDEs, all registered dietitians or registered nurses, from a large teaching hospital and the nearby community. They averaged 13 years of experience as CDEs and 90 patients/month (range, 30–150). An experienced moderator led the meeting; proceedings were tape-recorded and transcribed.
We identified each self-care task in the ADA’s 2002 recommendations; the selections were confirmed by a practicing nurse clinician. We asked the CDEs to add other tasks they considered necessary for the best self-care. Since the focus was on extra time needed for self-care of diabetes, we excluded self-care that most people already do, such as tooth brushing, but retained care that most people should do but generally do not (exercising or preparing healthy foods).21-24
Table 1 details our assumptions and definitions. Table 2 lists self-care tasks. We asked the CDEs to consider a typical patient with type 2 diabetes in a stable phase of care, taking oral hypoglycemic agents, and self-testing blood glucose once daily. They reached consensus on the average time required by this patient for each task, in minutes per day, including preparation and cleanup time. Discussion of other patient types and of circumstances that would change estimated times were encouraged by the moderator.
TABLE 1
Diabetes self care: Assumptions about patients, and definitions of tasks
| Patient characteristics | The CDEs were asked to consider a typical patient with type 2 diabetes, in a stable phase of care, on oral hypoglycemic agents and self-testing blood glucose once daily. These estimates are shown in Table 2. Type 2 diabetes accounts for 90–95% of diabetes in the U.S.25 |
| To provide a basis for considering the variability of time requirements (see text), they also made estimates for other types of patients, ranging from those whose diabetes is controlled by diet alone to elderly patients with multiple chronic conditions. | |
| Task definitions | Time, in minutes per day, represents extra tasks required by diabetes self-care, or extra time for usual tasks. All estimates include time for preparation and cleanup. |
| Taking oral medications (2 min/episode of medication taken) includes time to organize pills for the day or week. All patients are assumed to take aspirin. | |
| Problem solving includes time to make decisions about changes in medication or diet in response to blood sugar values and symptoms, and time for general tasks such as remembering to carry medications, snacks, etc. | |
| Shopping time is the additional time required to read nutrition labels for carbohydrate counting and to make extra trips for perishable fresh produce. Transportation time for extra trips is included. | |
| Exercise includes time to change clothes, shoes, etc. Since most adults do not exercise (see text) the full time required for exercise is included. | |
| Support groups include internet groups, family support, reading groups, supportive group settings, formal diabetes support groups, and church. | |
| Scheduling appointments does not include the time required by the appointments themselves. |
TABLE 2
Estimated time required for recommended care*
| Task | Minutes/day |
|---|---|
| ADA recommendations | |
| Home glucose monitoring | 3 |
| Record keeping | 5 |
| Taking oral medication | 4 |
| Foot care | 10 |
| Oral hygiene, flossing | 1 |
| Problem solving | 12 |
| Meal planning | 10 |
| Shopping | 17 |
| Preparing meals | 30 |
| Exercise | 30 |
| ADA SUBTOTAL | 122 |
| Other desirable self-care | |
| Monitoring blood pressure | 3 |
| Stress management | 10 |
| Support group | 2 |
| Administrative tasks | |
| Phoning educators, doctors | 1 |
| Scheduling appointments | 1 |
| Insurance dealings | 2 |
| Obtaining supplies | 2 |
| TOTAL TIME | 143 |
| *Estimates for patients with stable diabetes who are taking oral agents and self-monitoring blood glucose once | |
Results
Table 2 presents estimated times for a stable patient with type 2 diabetes on oral hypoglycemic agents. The ADA’s recommendations would take this patient 122 minutes per day, more than 2 hours; other tasks bring the total to 143 minutes per day. The first 4 elements, which are unique to diabetes, take only 22 minutes per day. Activities related to exercise or diet, recommended for many chronic conditions, account for most of the time.
The CDEs estimated that patients with newly diagnosed diabetes would take 25% to 30% longer for all tasks. Older and more infirm patients (eg, persons with neurological disorders/stroke, neuropathy, visual impairments, or depression) could require twice as long for most tasks and might also need the help of a caregiver. They might not be able to carry out some tasks, such as exercise. Patients taking insulin need only a few more minutes per day.
Discussion
Estimates by CDEs suggest that recommended diabetes self-care requires more than 2 hours daily. For infirm patients or those with newly diagnosed disease, even more time is required, and some tasks involve the help (and time) of caregivers. These estimates raise an important issue: the care physicians commonly recommend may be too time-consuming for many patients.
In one study, persons with diabetes reported spending a median of 48 minutes daily on self-care tasks.18 Only a few spent no time, but a third to a half skipped specific elements of self-care completely. When asked “What is the biggest obstacle for you in effectively managing your diabetes?” more than a fifth answered “not enough time.”
When patients choose which tasks to undertake, their choices may not optimize health. Although little evidence is currently available to help clinicians and patients prioritize self-care tasks, some tasks are surely more important for certain patients than others. Younger, more mobile patients may benefit more from exercise education than wheelchair-bound patients with advanced disease. Foot care is more important for patients with sensory neuropathy than for those with normal sensation. In the absence of evidence, physicians’ clinical experience can be an important guide to maximizing the benefits of self-care time.
The principles in Crossing the Quality Chasm suggest ways to develop care interactions and guidelines that deal with these realities while keeping the goal of better health front and center.
(1) The report calls for ”recognizing the patient as the source of control and customizing care based on patient needs and values.” Clinicians need to discuss time with patients, to find out how much time is available and the pressures on that time. Such discussions are consistent with the Chronic Care Model, which recommends clinicians “elicit and review data concerning patients’ perspectives” and “help patients to set goals and solve problems.”15
(2) The report calls for evidence-based care and recommends that patients “have unfettered access to their own medical information and to clinical knowledge.” Research is needed to identify the tasks that yield the most improvement in symptoms and health for particular patients. Such “time-effectiveness studies” would show which tasks make the best use of self-care time for patients with specific symptoms and complications. Until such data are available, physicians must rely on clinical experience to help guide patients.
(3) The report calls for “continuous decrease in waste” noting that “the health system should not waste resources or patient time” (italics added). When self-management requires a lot of time, that time deserves to be used carefully and well. We suggest that self-care guidelines consider time requirements. Where they are onerous, ways should be found to reduce them or to help patients set priorities.
Diabetes self-management is an essential component of good care. The time patients devote to self-care deserves serious attention in efforts to improve the quality of care.
Acknowledgements
The authors thank Ann Marie DeLisi, Patricia Prata, Dorothy Caputo, Christine Bazzarre, Ruth Ann Petzinger, Lee Ann Redfern, Carol Salas, and Carolyn Swither, the certified diabetes educators who participated in our focus group.
Corresponding author
Monika M. Safford, MD, MT 643, 1717 11th Avenue South, Birmingham, AL 35294-4410. Email: [email protected].
1. Institute of Medicine Crossing the Quality Chasm: A New Health System for the 21st Century. Washington, DC: National Academy Press; 2001:61-62, 89.
2. Funnell MM, Anderson RM. The problem with compliance in diabetes. JAMA 2000;13:1709.-
3. Kart CS, Engler CA. Predisposition to self-health care: Who does what for themselves and why? J Gerontol 1994;49:S301-S308.
4. Cox RH, Carpenter JP, Bruce FA, et al. Characteristics of low-income African-American and Caucasian adults that are important in self-management of type 2 diabetes. J Community Health 2004;29:155-170.
5. Glasgow RE, Boles SM, McKay HG, et al. The D-Net diabetes self-management program: long-term implementation, outcomes, and generalization results. Prev Med 2003;36:410-419.
6. Peterson KA, Hughes M. Readiness to change and clinical success in a diabetes educational program. J Am Board Fam Pract 2002;15:266-271.
7. Karter AJ, Ferrara A, Darbinian JA, et al. Self-monitoring of blood glucose: Language and financial barriers in a managed care population with diabetes. Diabetes Care 2000;23:477-483.
8. Grant RW, Devita NG, Singer DE, Meigs JB. Polypharmacy and medication adherence in patients with type 2 diabetes. Diabetes Care 2003;26:1408-1412.
9. Vik SA, Maxwell CJ, Hogan DB. Measurement, correlates, and health outcomes of medication adherence among seniors. Ann Pharmacother 2004;38:303-312.
10. Weir MR, Maibach EW, Bakris GL, et al. Implications of a healthy lifestyle and medication analysis for improving hypertension control. Arch Intern Med 2000;160:481-490.
11. Mosley-Williams A, Lumley MA, Gillis M, et al. Barriers to treatment adherence among african american and white women with systemic lupus erythematosus. Arthritis Rheumatol 2002;47:630-638.
12. Safran DG, Taira DA, Rogers WH, et al. Linking primary care performance to outcomes of care. J Fam Pract 1998;47:213-220.
13. Luft FC, Morris CD, Weinberger MH. Compliance to a low-salt diet. Am J Clin Nutr 1997;65:698S-703S.
14. Barr RG, Somers SC, Speizer FE, Camargo CA, Jr. for The National Asthma Education and Prevention Program (NAEPP). Patient factors and medication guideline adherence among older women with asthma. Arch Intern Med 2002;162:1761-1768.
15. Wagner EH, Austin BT, Davis C, et al. Improving chronic illness care: Translating evidence into action. Health Aff 2001;20:64-78.
16. Norris SL, Engelgau MM, Narayan KMV. Effectiveness of self-management training in type 2 diabetes: A systematic review of randomized controlled trials. Diabetes Care 2001;24:561-587.
17. McDonald HP, Garg AX, Haynes RB. Interventions to enhance patient adherence to medication prescriptions: Scientific review. JAMA 2002;288:2868-2879.
18. Safford MM, Russell LB, Suh D. How much time do patients spend on diabetes self-care? [Abstract.] J Gen Intern Med 2003;18(S1)::155.-
19. American Diabetes Association. Clinical Practice Recommendations 2002. Diabetes Care 2002;25:S3-S147.
20. American Association of Diabetes Educators. The 1999 Scope of Practice for Diabetes Educators and the Standards of Practice for Diabetes Educators. Available at: www.aadenet.org. Accessed on June 6, 2002.
21. Lang WP, Farghaly MM, Ronis MM. The relation of preventive dental behaviors to periodontal health status. J Clin Periodontol 1994;21:194-198.
22. White CC, Powell KE, Hogelin GC, et al. The behavioral risk factor surveys: IV. The descriptive epidemiology of exercise. Am J Prev Med 1987;3:304-310.
23. Mokdad AH, Bowman BA, Ford ES, et al. The continuing epidemics of obesity and diabetes in the United States. JAMA 2001;286:1195-1200.
24. American Heart Association. Available at:www.american-heart.org/presenter.jhtml. Accessed on July 29, 2002.
25. National Institutes of Health. Diabetes in America. 2nd ed. Harris MI, Cowie CC, Stern MP, et al., eds. Washington DC: US Government Printing Office, NIH publ. no. 95-1468, 1995.
- The care physicians commonly recommend may be too time-consuming for many patients. Find out how much time is available and ask about the pressures on that time.
- If time requirements are onerous, help patients set priorities to maximize health.
Background: In Crossing the Quality Chasm, the Institute of Medicine laid out principles to improve quality of care and identified chronic diseases as a starting point. One of those principles was the wise use of patient time, but current recommendations for chronic conditions do not consider time spent on self-care or its impact on patients’ lives.
Objective: To estimate the time required for recommended diabetes self-care.
Methods: A convenience sample of 8 certified diabetes educators derived consensus-based estimates of the time required for all self-care tasks recommended by the American Diabetes Association.
Results: For experienced patients with type 2 diabetes controlled by oral agents, recommended self-care would require more than 2 extra hours daily. Elderly patients and those with newly diagnosed disease, or those with physical limitations, would need more time. Exercise and diet, required for self-care of many chronic conditions, are the most time-consuming tasks.
Conclusion: The time required by recommended self-care is substantial. Crossing the Quality Chasm suggests how clinicians and guideline developers can help patients make the best use of their self-care time: elicit the patient’s perspective; develop evidence on the health consequences of self-care tasks; and respect patients’ time.
To what extent does the time needed to perform diabetes self care diminish patients’ willingness to follow recommendations? Are there means of making self care more acceptable? Consider the following observations about chronic disease in general.
The Institute of Medicine has highlighted the extent to which medical care falls short of its potential. Crossing the Quality Chasm recommended 10 principles to reorient health systems; among them:
- shared information and decision-making to better reflect patient preferences
- evidence-based decision making
- continuous decrease in waste of “resources or patient time.”
Chronic conditions were identified as “a starting point” for applying these recommendations since they are “the leading cause of illness, disability, and death in the United States, affecting almost half of the population and accounting for the majority of health care resources used.”1
Self-care, or self-management, is essential to good care of diabetes, one of the most common chronic conditions. Funnell and Anderson noted that “[m]ore than 95% of diabetes care is done by the patient.”2 Physicians offer instruction, but day-to-day implementation depends on patients themselves, who care for their diabetes “within the context of the other goals, priorities, health issues, family demands, and other personal concerns that make up their lives,”2 When their advice is not followed, and patients’ health suffers, physicians are frustrated by what can seem their patients’ refusal to do the best for their condition.
Researchers have examined a broad range of potential reasons for noncompliance with diabetes self-care recommendations, from patients’ attitudes and beliefs, to health motivation, readiness to change, language barriers, medication regimens, and trust in the medical profession.3-9 Although self-management programs have become more patient-centered,10-15 a review of patient-centered approaches in diabetes noted that “it is apparent that factors other than knowledge are needed to achieve long-term behavioral change.”16 A review of medication compliance concluded that “current methods of improving medication adherence for chronic health problems are mostly complex, labor-intensive, and not predictably effective.”17 Something crucial to success has yet to be identified.
An important missing link may be the time demands of self-care. Evaluations have considered program design and outcomes, but not how the length of diabetes self-care regimens affects patient outcomes. Indeed, scant attention has been paid to time requirements18 and little is known about how much time current recommendations take. To begin to draw attention to time requirements as a potential barrier to good self-management, we present estimates of the time required by recommended diabetes self-care.
Methods
Certified diabetes educators (CDEs) teach self-care skills and evaluate adherence. Their training is based on the American Diabetes Association’s (ADA) Clinical Practice Recommendations,19 which represent the standard of care for diabetes. The guidelines of the American Association of Diabetes Educators20 cover additional self-care elements, such as stress management and social support. We assembled a convenience sample of 8 CDEs, all registered dietitians or registered nurses, from a large teaching hospital and the nearby community. They averaged 13 years of experience as CDEs and 90 patients/month (range, 30–150). An experienced moderator led the meeting; proceedings were tape-recorded and transcribed.
We identified each self-care task in the ADA’s 2002 recommendations; the selections were confirmed by a practicing nurse clinician. We asked the CDEs to add other tasks they considered necessary for the best self-care. Since the focus was on extra time needed for self-care of diabetes, we excluded self-care that most people already do, such as tooth brushing, but retained care that most people should do but generally do not (exercising or preparing healthy foods).21-24
Table 1 details our assumptions and definitions. Table 2 lists self-care tasks. We asked the CDEs to consider a typical patient with type 2 diabetes in a stable phase of care, taking oral hypoglycemic agents, and self-testing blood glucose once daily. They reached consensus on the average time required by this patient for each task, in minutes per day, including preparation and cleanup time. Discussion of other patient types and of circumstances that would change estimated times were encouraged by the moderator.
TABLE 1
Diabetes self care: Assumptions about patients, and definitions of tasks
| Patient characteristics | The CDEs were asked to consider a typical patient with type 2 diabetes, in a stable phase of care, on oral hypoglycemic agents and self-testing blood glucose once daily. These estimates are shown in Table 2. Type 2 diabetes accounts for 90–95% of diabetes in the U.S.25 |
| To provide a basis for considering the variability of time requirements (see text), they also made estimates for other types of patients, ranging from those whose diabetes is controlled by diet alone to elderly patients with multiple chronic conditions. | |
| Task definitions | Time, in minutes per day, represents extra tasks required by diabetes self-care, or extra time for usual tasks. All estimates include time for preparation and cleanup. |
| Taking oral medications (2 min/episode of medication taken) includes time to organize pills for the day or week. All patients are assumed to take aspirin. | |
| Problem solving includes time to make decisions about changes in medication or diet in response to blood sugar values and symptoms, and time for general tasks such as remembering to carry medications, snacks, etc. | |
| Shopping time is the additional time required to read nutrition labels for carbohydrate counting and to make extra trips for perishable fresh produce. Transportation time for extra trips is included. | |
| Exercise includes time to change clothes, shoes, etc. Since most adults do not exercise (see text) the full time required for exercise is included. | |
| Support groups include internet groups, family support, reading groups, supportive group settings, formal diabetes support groups, and church. | |
| Scheduling appointments does not include the time required by the appointments themselves. |
TABLE 2
Estimated time required for recommended care*
| Task | Minutes/day |
|---|---|
| ADA recommendations | |
| Home glucose monitoring | 3 |
| Record keeping | 5 |
| Taking oral medication | 4 |
| Foot care | 10 |
| Oral hygiene, flossing | 1 |
| Problem solving | 12 |
| Meal planning | 10 |
| Shopping | 17 |
| Preparing meals | 30 |
| Exercise | 30 |
| ADA SUBTOTAL | 122 |
| Other desirable self-care | |
| Monitoring blood pressure | 3 |
| Stress management | 10 |
| Support group | 2 |
| Administrative tasks | |
| Phoning educators, doctors | 1 |
| Scheduling appointments | 1 |
| Insurance dealings | 2 |
| Obtaining supplies | 2 |
| TOTAL TIME | 143 |
| *Estimates for patients with stable diabetes who are taking oral agents and self-monitoring blood glucose once | |
Results
Table 2 presents estimated times for a stable patient with type 2 diabetes on oral hypoglycemic agents. The ADA’s recommendations would take this patient 122 minutes per day, more than 2 hours; other tasks bring the total to 143 minutes per day. The first 4 elements, which are unique to diabetes, take only 22 minutes per day. Activities related to exercise or diet, recommended for many chronic conditions, account for most of the time.
The CDEs estimated that patients with newly diagnosed diabetes would take 25% to 30% longer for all tasks. Older and more infirm patients (eg, persons with neurological disorders/stroke, neuropathy, visual impairments, or depression) could require twice as long for most tasks and might also need the help of a caregiver. They might not be able to carry out some tasks, such as exercise. Patients taking insulin need only a few more minutes per day.
Discussion
Estimates by CDEs suggest that recommended diabetes self-care requires more than 2 hours daily. For infirm patients or those with newly diagnosed disease, even more time is required, and some tasks involve the help (and time) of caregivers. These estimates raise an important issue: the care physicians commonly recommend may be too time-consuming for many patients.
In one study, persons with diabetes reported spending a median of 48 minutes daily on self-care tasks.18 Only a few spent no time, but a third to a half skipped specific elements of self-care completely. When asked “What is the biggest obstacle for you in effectively managing your diabetes?” more than a fifth answered “not enough time.”
When patients choose which tasks to undertake, their choices may not optimize health. Although little evidence is currently available to help clinicians and patients prioritize self-care tasks, some tasks are surely more important for certain patients than others. Younger, more mobile patients may benefit more from exercise education than wheelchair-bound patients with advanced disease. Foot care is more important for patients with sensory neuropathy than for those with normal sensation. In the absence of evidence, physicians’ clinical experience can be an important guide to maximizing the benefits of self-care time.
The principles in Crossing the Quality Chasm suggest ways to develop care interactions and guidelines that deal with these realities while keeping the goal of better health front and center.
(1) The report calls for ”recognizing the patient as the source of control and customizing care based on patient needs and values.” Clinicians need to discuss time with patients, to find out how much time is available and the pressures on that time. Such discussions are consistent with the Chronic Care Model, which recommends clinicians “elicit and review data concerning patients’ perspectives” and “help patients to set goals and solve problems.”15
(2) The report calls for evidence-based care and recommends that patients “have unfettered access to their own medical information and to clinical knowledge.” Research is needed to identify the tasks that yield the most improvement in symptoms and health for particular patients. Such “time-effectiveness studies” would show which tasks make the best use of self-care time for patients with specific symptoms and complications. Until such data are available, physicians must rely on clinical experience to help guide patients.
(3) The report calls for “continuous decrease in waste” noting that “the health system should not waste resources or patient time” (italics added). When self-management requires a lot of time, that time deserves to be used carefully and well. We suggest that self-care guidelines consider time requirements. Where they are onerous, ways should be found to reduce them or to help patients set priorities.
Diabetes self-management is an essential component of good care. The time patients devote to self-care deserves serious attention in efforts to improve the quality of care.
Acknowledgements
The authors thank Ann Marie DeLisi, Patricia Prata, Dorothy Caputo, Christine Bazzarre, Ruth Ann Petzinger, Lee Ann Redfern, Carol Salas, and Carolyn Swither, the certified diabetes educators who participated in our focus group.
Corresponding author
Monika M. Safford, MD, MT 643, 1717 11th Avenue South, Birmingham, AL 35294-4410. Email: [email protected].
1. Institute of Medicine Crossing the Quality Chasm: A New Health System for the 21st Century. Washington, DC: National Academy Press; 2001:61-62, 89.
2. Funnell MM, Anderson RM. The problem with compliance in diabetes. JAMA 2000;13:1709.-
3. Kart CS, Engler CA. Predisposition to self-health care: Who does what for themselves and why? J Gerontol 1994;49:S301-S308.
4. Cox RH, Carpenter JP, Bruce FA, et al. Characteristics of low-income African-American and Caucasian adults that are important in self-management of type 2 diabetes. J Community Health 2004;29:155-170.
5. Glasgow RE, Boles SM, McKay HG, et al. The D-Net diabetes self-management program: long-term implementation, outcomes, and generalization results. Prev Med 2003;36:410-419.
6. Peterson KA, Hughes M. Readiness to change and clinical success in a diabetes educational program. J Am Board Fam Pract 2002;15:266-271.
7. Karter AJ, Ferrara A, Darbinian JA, et al. Self-monitoring of blood glucose: Language and financial barriers in a managed care population with diabetes. Diabetes Care 2000;23:477-483.
8. Grant RW, Devita NG, Singer DE, Meigs JB. Polypharmacy and medication adherence in patients with type 2 diabetes. Diabetes Care 2003;26:1408-1412.
9. Vik SA, Maxwell CJ, Hogan DB. Measurement, correlates, and health outcomes of medication adherence among seniors. Ann Pharmacother 2004;38:303-312.
10. Weir MR, Maibach EW, Bakris GL, et al. Implications of a healthy lifestyle and medication analysis for improving hypertension control. Arch Intern Med 2000;160:481-490.
11. Mosley-Williams A, Lumley MA, Gillis M, et al. Barriers to treatment adherence among african american and white women with systemic lupus erythematosus. Arthritis Rheumatol 2002;47:630-638.
12. Safran DG, Taira DA, Rogers WH, et al. Linking primary care performance to outcomes of care. J Fam Pract 1998;47:213-220.
13. Luft FC, Morris CD, Weinberger MH. Compliance to a low-salt diet. Am J Clin Nutr 1997;65:698S-703S.
14. Barr RG, Somers SC, Speizer FE, Camargo CA, Jr. for The National Asthma Education and Prevention Program (NAEPP). Patient factors and medication guideline adherence among older women with asthma. Arch Intern Med 2002;162:1761-1768.
15. Wagner EH, Austin BT, Davis C, et al. Improving chronic illness care: Translating evidence into action. Health Aff 2001;20:64-78.
16. Norris SL, Engelgau MM, Narayan KMV. Effectiveness of self-management training in type 2 diabetes: A systematic review of randomized controlled trials. Diabetes Care 2001;24:561-587.
17. McDonald HP, Garg AX, Haynes RB. Interventions to enhance patient adherence to medication prescriptions: Scientific review. JAMA 2002;288:2868-2879.
18. Safford MM, Russell LB, Suh D. How much time do patients spend on diabetes self-care? [Abstract.] J Gen Intern Med 2003;18(S1)::155.-
19. American Diabetes Association. Clinical Practice Recommendations 2002. Diabetes Care 2002;25:S3-S147.
20. American Association of Diabetes Educators. The 1999 Scope of Practice for Diabetes Educators and the Standards of Practice for Diabetes Educators. Available at: www.aadenet.org. Accessed on June 6, 2002.
21. Lang WP, Farghaly MM, Ronis MM. The relation of preventive dental behaviors to periodontal health status. J Clin Periodontol 1994;21:194-198.
22. White CC, Powell KE, Hogelin GC, et al. The behavioral risk factor surveys: IV. The descriptive epidemiology of exercise. Am J Prev Med 1987;3:304-310.
23. Mokdad AH, Bowman BA, Ford ES, et al. The continuing epidemics of obesity and diabetes in the United States. JAMA 2001;286:1195-1200.
24. American Heart Association. Available at:www.american-heart.org/presenter.jhtml. Accessed on July 29, 2002.
25. National Institutes of Health. Diabetes in America. 2nd ed. Harris MI, Cowie CC, Stern MP, et al., eds. Washington DC: US Government Printing Office, NIH publ. no. 95-1468, 1995.