User login
Cell culture–based flu vaccine maintains immunogenicity
WASHINGTON – Influenza vaccines that substitute flu grown in cell-culture for the standard formulation of flu grown in eggs recently came onto the U.S. market, and new evidence confirmed that cell-grown flu works at least as well as its egg-grown counterpart for triggering immune responses.

Results from a randomized study with 148 evaluable subjects that directly compared the immune response of individuals aged 4-20 years old to the 2018-2019 commercial formulation of a mostly cell-based influenza vaccine with a commercially marketed, fully egg-based vaccine from the same vintage showed “no difference” between the two vaccines for inducing serologic titers on both the hemagluttination inhibition assay and by microneutralization, Richard K. Zimmerman, MD, said at an annual scientific meeting on infectious diseases.
The question addressed by the study was whether the primarily cell culture–grown vaccine would perform differently in children than a standard, egg-grown vaccine. “We thought that we might find something different, but we didn’t,” said Dr. Zimmerman, a professor of family medicine at the University of Pittsburgh who studies vaccines. The finding gave further support to using flu vaccines made without eggs because of their advantages over egg-based vaccines, he said in an interview.
Dr. Zimmerman cited two major, potential problems with egg-grown influenza vaccines. First, they require a big supply of eggs to manufacture, which can pose logistical challenges that are absent with cell culture–grown vaccine once the bioreactor capacity exists to produce the necessary amount of cells. This means that egg-free vaccine production can ramp up faster when a pandemic starts, he noted.
Second, over time, egg-grown vaccine strains of influenza have become increasingly adapted to grow in eggs with the result that “in some years the egg-grown virus is so different as to not work as well [Proc Natl Acad Sci. 2017 Nov;114[44]:12578-83]. With cell culture you bypass” issues of glycosylation mismatch or other antigenic problems caused by egg passage, he explained.
Dr. Zimmerman feels so strongly about the superiority of the cell-culture vaccine that “I am personally going to get a vaccine that’s not egg based,” and he advised the University of Pittsburgh Medical Center to focus its 2019-2020 flu vaccine purchase primarily on formulations made by cell culture. For the 2019-2020 season, that specifically is Flucelvax, an inactivated influenza vaccine licensed for people aged at least 4 years old, and Flublok, a recombinant flu vaccine also produced entirely in cell culture and licensed for people aged at least 18 years old. The 2019-2020 season is the first one during which the quadravalent Flucelvax vaccine has all four component strains (one H1N1, one H3N2, and two B strains) grown in cell culture.
The study run by Dr. Zimmerman and associates at the start of the 2018-2019 season used that season’s formulation of Flucelvax, which had only three of its four component strains grown in cell culture plus one strain (H1N1) grown in eggs. The Pittsburgh researchers randomized 168 individuals to receive the 2018-2019 Flucelvax vaccine or Fluzone, an entirely egg-made quadravelent vaccine, and they had analyzable results from 148 of the enrolled participants, more than 85% of whom were 9-20 years old. The study’s primary endpoint was the extent of seropositivity and seroconversion 28 days after immunization measured with both a hemagglutination inhibition assay and by a microneutralization assay. The results showed similar rates in the 75 children who received Flucelvax and the 73 who received Fluzone. For example, seropositivity against B Victoria lineage strains by the hemagglutination inhibition assay 28 days after vaccination was 76% in children who received Flucelvax, and it was 79% among those who got Fluzone, with a seroconversion rate of 34% in each of the two study subgroups.
“These findings do not say that egg-free is better, but it was certainly no worse. My guess is that in some years vaccines that are egg-free will make a big difference. In other years it may not. But you don’t know ahead of time,” Dr. Zimmerman said.
The study received no commercial funding but received free Fluzone vaccine from Sanofi Pasteur. Dr. Zimmerman had no disclosures.
WASHINGTON – Influenza vaccines that substitute flu grown in cell-culture for the standard formulation of flu grown in eggs recently came onto the U.S. market, and new evidence confirmed that cell-grown flu works at least as well as its egg-grown counterpart for triggering immune responses.
Results from a randomized study with 148 evaluable subjects that directly compared the immune response of individuals aged 4-20 years old to the 2018-2019 commercial formulation of a mostly cell-based influenza vaccine with a commercially marketed, fully egg-based vaccine from the same vintage showed “no difference” between the two vaccines for inducing serologic titers on both the hemagluttination inhibition assay and by microneutralization, Richard K. Zimmerman, MD, said at an annual scientific meeting on infectious diseases.
The question addressed by the study was whether the primarily cell culture–grown vaccine would perform differently in children than a standard, egg-grown vaccine. “We thought that we might find something different, but we didn’t,” said Dr. Zimmerman, a professor of family medicine at the University of Pittsburgh who studies vaccines. The finding gave further support to using flu vaccines made without eggs because of their advantages over egg-based vaccines, he said in an interview.
Dr. Zimmerman cited two major, potential problems with egg-grown influenza vaccines. First, they require a big supply of eggs to manufacture, which can pose logistical challenges that are absent with cell culture–grown vaccine once the bioreactor capacity exists to produce the necessary amount of cells. This means that egg-free vaccine production can ramp up faster when a pandemic starts, he noted.
Second, over time, egg-grown vaccine strains of influenza have become increasingly adapted to grow in eggs with the result that “in some years the egg-grown virus is so different as to not work as well [Proc Natl Acad Sci. 2017 Nov;114[44]:12578-83]. With cell culture you bypass” issues of glycosylation mismatch or other antigenic problems caused by egg passage, he explained.
Dr. Zimmerman feels so strongly about the superiority of the cell-culture vaccine that “I am personally going to get a vaccine that’s not egg based,” and he advised the University of Pittsburgh Medical Center to focus its 2019-2020 flu vaccine purchase primarily on formulations made by cell culture. For the 2019-2020 season, that specifically is Flucelvax, an inactivated influenza vaccine licensed for people aged at least 4 years old, and Flublok, a recombinant flu vaccine also produced entirely in cell culture and licensed for people aged at least 18 years old. The 2019-2020 season is the first one during which the quadravalent Flucelvax vaccine has all four component strains (one H1N1, one H3N2, and two B strains) grown in cell culture.
The study run by Dr. Zimmerman and associates at the start of the 2018-2019 season used that season’s formulation of Flucelvax, which had only three of its four component strains grown in cell culture plus one strain (H1N1) grown in eggs. The Pittsburgh researchers randomized 168 individuals to receive the 2018-2019 Flucelvax vaccine or Fluzone, an entirely egg-made quadravelent vaccine, and they had analyzable results from 148 of the enrolled participants, more than 85% of whom were 9-20 years old. The study’s primary endpoint was the extent of seropositivity and seroconversion 28 days after immunization measured with both a hemagglutination inhibition assay and by a microneutralization assay. The results showed similar rates in the 75 children who received Flucelvax and the 73 who received Fluzone. For example, seropositivity against B Victoria lineage strains by the hemagglutination inhibition assay 28 days after vaccination was 76% in children who received Flucelvax, and it was 79% among those who got Fluzone, with a seroconversion rate of 34% in each of the two study subgroups.
“These findings do not say that egg-free is better, but it was certainly no worse. My guess is that in some years vaccines that are egg-free will make a big difference. In other years it may not. But you don’t know ahead of time,” Dr. Zimmerman said.
The study received no commercial funding but received free Fluzone vaccine from Sanofi Pasteur. Dr. Zimmerman had no disclosures.
REPORTING FROM ID WEEK 2019
Vaccination rates generally high in U.S. children in 2018
Vaccination rates among kindergartners during the 2018-2019 school year and children aged 24 months during 2016-2018 remained high, but several gaps in coverage remained, new research found.

The national vaccination rate for the almost 4 million kindergartners reported as enrolled in 2018-2019 was 94.9% for DTaP, 94.7% for 2 doses of MMR, and 94.8% for state-required doses of varicella. The MMR vaccination rate fell just short of the recommended 95% vaccination rate threshold, according to Ranee Seither, MPH, of the immunization services division at the National Center for Immunization and Respiratory Diseases (NCIRD), and associates.
By state, Mississippi had the highest vaccination rate, achieving at least 99.2% coverage for DTaP, MMR, and varicella. Colorado had the lowest vaccination rate for MMR and varicella at 87.4% and 86.5%, respectively; Idaho had the lowest DTaP vaccination rate at 88.8%.
A total of 20 states had at least 95% MMR coverage while 2 had under 90%, 21 states had at least 95% DTaP coverage with only Idaho having below 90%, and 20 states had at least 95% varicella coverage with 4 states having below 90%.
The investigators noted that, if all nonexempt kindergartners were vaccinated in accordance with local and state vaccination policies, nearly all states could achieve the 95% MMR vaccination threshold.
“Recent measles outbreaks in states with high overall MMR coverage, such as New York, highlight the need for assessing vaccination coverage at the local level. [The Centers for Disease Control and Prevention] encourage programs to use their local-level school assessment data to identify populations of undervaccinated students and to partner with schools and providers to reduce barriers to vaccination and improve coverage,” Dr. Seither and associates wrote.
In a study published in the same issue of the Morbidity and Mortality Weekly Report, Holly A. Hill, MD, PhD, and associates from the immunization services division at NCIRD, found that, according to data collected from 25,059 participants in the National Immunization Survey–Child, national vaccination coverage in children aged 24 months was generally strong and stable.
The vaccines with coverage of at least 90% were poliovirus (92.7%), MMR (90.4%), hepatitis B (91%), and varicella (90%). Complete hepatitis A (74%), rotavirus (72.4%), influenza (53%), and combined seven-vaccine series (68.4%) rates were below 80%. Only 1.3% of children received no vaccinations.
In general, the highest rates of coverage were seen in children with private insurance, followed by those with other insurance, those with Medicaid, and finally those without insurance. Disparities also were seen depending on race/ethnicity, poverty level, and rural/urban location. Vaccination rates also varied by state; for example, 20 states had vaccination coverage for one dose of MMR below 90%, with 6 having coverage above 94% (Arkansas, Maine, Massachusetts, Mississippi, Rhode Island, Wisconsin).
“Improvements in childhood vaccination coverage will require that parents and other caregivers have access to vaccination providers and believe in the safety and effectiveness of vaccines. Increased opportunity for vaccination can be facilitated through expanded access to health insurance, greater promotion of available vaccines through the Vaccines for Children program, and solutions to logistical challenges such as transportation, child care, and time off from work. Providers can improve vaccination coverage overall and reduce disparities by administering all recommended vaccines during office visits,” Dr. Hill and associates wrote.
No conflicts of interest were reported by the investigators of either study.
SOURCES: Seither R et al. MMWR Morb Mortal Wkly Rep 2019;68:905-12; Hill HA et al. MMWR Morb Mortal Wkly Rep 2019;68:913-8.
Vaccination rates among kindergartners during the 2018-2019 school year and children aged 24 months during 2016-2018 remained high, but several gaps in coverage remained, new research found.
The national vaccination rate for the almost 4 million kindergartners reported as enrolled in 2018-2019 was 94.9% for DTaP, 94.7% for 2 doses of MMR, and 94.8% for state-required doses of varicella. The MMR vaccination rate fell just short of the recommended 95% vaccination rate threshold, according to Ranee Seither, MPH, of the immunization services division at the National Center for Immunization and Respiratory Diseases (NCIRD), and associates.
By state, Mississippi had the highest vaccination rate, achieving at least 99.2% coverage for DTaP, MMR, and varicella. Colorado had the lowest vaccination rate for MMR and varicella at 87.4% and 86.5%, respectively; Idaho had the lowest DTaP vaccination rate at 88.8%.
A total of 20 states had at least 95% MMR coverage while 2 had under 90%, 21 states had at least 95% DTaP coverage with only Idaho having below 90%, and 20 states had at least 95% varicella coverage with 4 states having below 90%.
The investigators noted that, if all nonexempt kindergartners were vaccinated in accordance with local and state vaccination policies, nearly all states could achieve the 95% MMR vaccination threshold.
“Recent measles outbreaks in states with high overall MMR coverage, such as New York, highlight the need for assessing vaccination coverage at the local level. [The Centers for Disease Control and Prevention] encourage programs to use their local-level school assessment data to identify populations of undervaccinated students and to partner with schools and providers to reduce barriers to vaccination and improve coverage,” Dr. Seither and associates wrote.
In a study published in the same issue of the Morbidity and Mortality Weekly Report, Holly A. Hill, MD, PhD, and associates from the immunization services division at NCIRD, found that, according to data collected from 25,059 participants in the National Immunization Survey–Child, national vaccination coverage in children aged 24 months was generally strong and stable.
The vaccines with coverage of at least 90% were poliovirus (92.7%), MMR (90.4%), hepatitis B (91%), and varicella (90%). Complete hepatitis A (74%), rotavirus (72.4%), influenza (53%), and combined seven-vaccine series (68.4%) rates were below 80%. Only 1.3% of children received no vaccinations.
In general, the highest rates of coverage were seen in children with private insurance, followed by those with other insurance, those with Medicaid, and finally those without insurance. Disparities also were seen depending on race/ethnicity, poverty level, and rural/urban location. Vaccination rates also varied by state; for example, 20 states had vaccination coverage for one dose of MMR below 90%, with 6 having coverage above 94% (Arkansas, Maine, Massachusetts, Mississippi, Rhode Island, Wisconsin).
“Improvements in childhood vaccination coverage will require that parents and other caregivers have access to vaccination providers and believe in the safety and effectiveness of vaccines. Increased opportunity for vaccination can be facilitated through expanded access to health insurance, greater promotion of available vaccines through the Vaccines for Children program, and solutions to logistical challenges such as transportation, child care, and time off from work. Providers can improve vaccination coverage overall and reduce disparities by administering all recommended vaccines during office visits,” Dr. Hill and associates wrote.
No conflicts of interest were reported by the investigators of either study.
SOURCES: Seither R et al. MMWR Morb Mortal Wkly Rep 2019;68:905-12; Hill HA et al. MMWR Morb Mortal Wkly Rep 2019;68:913-8.
FROM THE MMWR
Influenza: U.S. activity was low this summer
Influenza activity in the United States was typically low over the summer months, with influenza A(H3N2) viruses predominating, according to the Centers for Disease Control and Prevention.
From May 19 to Sept. 28, 2019, weekly flu activity – measured by the percentage of outpatient visits to health care professionals for influenza-like illness (ILI) – was below the national baseline of 2.2%, ranging from 0.7% to 1.4%. Since mid-August, however, when the rate was last 0.7%, it has been climbing slowly but steadily and was up to 1.3% for the week ending Sept. 28, CDC data show.
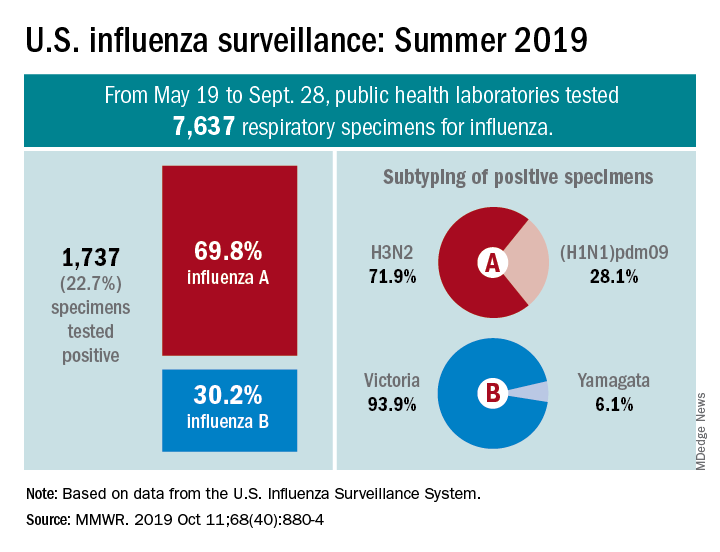
The various public health laboratories of the U.S. Influenza Surveillance System tested over 7,600 respiratory samples from May 19 to Sept. 28, and 22.7% were positive for influenza viruses, Scott Epperson, DVM, and associates at the CDC’s influenza division said Oct. 10 in the MMWR.
Of the 1,737 samples found to be positive, 69.8% were influenza A and 30.2% were influenza B. The subtype split among specimens positive for Influenza A was 71.9% A(H3N2) and 28.1% A(H1N1)pdm09, while the samples positive for influenza B went 93.9% B/Victoria and 6.1% B/Yamagata, they reported.
Over the same time period in the Southern Hemisphere, “seasonal influenza viruses circulated widely, with influenza A(H3) predominating in many regions; however, influenza A(H1N1)pdm09 and influenza B viruses were predominant in some countries,” the CDC investigators noted.
They also reported the World Health Organization recommendations for the Southern Hemisphere’s 2020 flu vaccines. Components of the egg-based trivalent vaccine are an A/Brisbane/02/2018(H1N1)pdm09-like virus, an A/South Australia/34/2019(H3N2)-like virus, and a B/Washington/02/2019-like virus(B/Victoria lineage). The recommended quadrivalent vaccine adds a B/Phuket/3073/2013-like virus(B/Yamagata lineage), they wrote.
“It is too early in the season to know which viruses will circulate in the United States later this fall and winter or how severe the season might be; however, regardless of what is circulating, the best protection against influenza is an influenza vaccination,” Dr. Epperson and associates wrote.
SOURCE: Epperson S et al. MMWR. 2019 Oct 11;68(40):880-4.
Influenza activity in the United States was typically low over the summer months, with influenza A(H3N2) viruses predominating, according to the Centers for Disease Control and Prevention.
From May 19 to Sept. 28, 2019, weekly flu activity – measured by the percentage of outpatient visits to health care professionals for influenza-like illness (ILI) – was below the national baseline of 2.2%, ranging from 0.7% to 1.4%. Since mid-August, however, when the rate was last 0.7%, it has been climbing slowly but steadily and was up to 1.3% for the week ending Sept. 28, CDC data show.
The various public health laboratories of the U.S. Influenza Surveillance System tested over 7,600 respiratory samples from May 19 to Sept. 28, and 22.7% were positive for influenza viruses, Scott Epperson, DVM, and associates at the CDC’s influenza division said Oct. 10 in the MMWR.
Of the 1,737 samples found to be positive, 69.8% were influenza A and 30.2% were influenza B. The subtype split among specimens positive for Influenza A was 71.9% A(H3N2) and 28.1% A(H1N1)pdm09, while the samples positive for influenza B went 93.9% B/Victoria and 6.1% B/Yamagata, they reported.
Over the same time period in the Southern Hemisphere, “seasonal influenza viruses circulated widely, with influenza A(H3) predominating in many regions; however, influenza A(H1N1)pdm09 and influenza B viruses were predominant in some countries,” the CDC investigators noted.
They also reported the World Health Organization recommendations for the Southern Hemisphere’s 2020 flu vaccines. Components of the egg-based trivalent vaccine are an A/Brisbane/02/2018(H1N1)pdm09-like virus, an A/South Australia/34/2019(H3N2)-like virus, and a B/Washington/02/2019-like virus(B/Victoria lineage). The recommended quadrivalent vaccine adds a B/Phuket/3073/2013-like virus(B/Yamagata lineage), they wrote.
“It is too early in the season to know which viruses will circulate in the United States later this fall and winter or how severe the season might be; however, regardless of what is circulating, the best protection against influenza is an influenza vaccination,” Dr. Epperson and associates wrote.
SOURCE: Epperson S et al. MMWR. 2019 Oct 11;68(40):880-4.
FROM MMWR
Influenza vaccination modestly reduces risk of hospitalizations in patients with COPD
(COPD), according to data published in the Journal of Infectious Diseases.
“To the best of our knowledge, this is the first large, real-world population study to examine vaccine effectiveness in people with COPD using the test-negative design and influenza-specific study outcomes,” wrote Andrea S. Gershon, MD, of Sunnybrook Health Sciences Center in Toronto and colleagues. “These findings emphasize the need for more effective influenza vaccines for older COPD patients and other preventive strategies.”
A test-negative study design
Data suggest that 70% of COPD exacerbations are caused by infection, and influenza often is identified as the cause. Although all major COPD practice guidelines recommend seasonal influenza vaccination, the evidence indicating that vaccination reduces hospitalizations and death is limited. The inherent or corticosteroid-induced decrease in immune response to vaccination and respiratory infection among patients with COPD may reduce the effectiveness of influenza vaccination, wrote Dr. Gershon and colleagues.
The investigators used a test-negative design to evaluate how effectively influenza vaccination prevents laboratory-confirmed influenza–associated hospitalizations in community-dwelling older patients with COPD. They chose this design because it attenuates biases resulting from misclassification of infection and from differences in health care–seeking behavior between vaccinated and unvaccinated patients.
Dr. Gershon and colleagues examined health care administrative data and respiratory specimens collected from patients who had been tested for influenza during the 2010-2011 to 2015-2016 influenza seasons. Eligible patients were aged 66 years or older, had physician-diagnosed COPD, and had been tested for influenza within 3 days before and during an acute care hospitalization. The researchers determined influenza vaccination status using physician and pharmacist billing claims. They obtained demographic information through linkage with the provincial health insurance database. Multivariable logistic regression allowed Dr. Gershon and colleagues to estimate the adjusted odds ratio of influenza vaccination in people with laboratory-confirmed influenza, compared with those without.
Effectiveness did not vary by demographic factors
The investigators included 21,748 patients in their analysis. Of this population, 3,636 (16.7%) patients tested positive for influenza. Vaccinated patients were less likely than unvaccinated patients to test positive for influenza (15.3% vs. 18.6%). Vaccinated patients also were more likely to be older; live in an urban area; live in a higher income neighborhood; have had more outpatient visits with a physician in the previous year; have received a prescription for a COPD medication in the previous 6 months; have diabetes, asthma, or immunocompromising conditions; have a longer duration of COPD; and have had an outpatient COPD exacerbation in the previous year.
The overall unadjusted estimate of vaccine effectiveness against laboratory-confirmed influenza–associated hospitalizations was 21%. Multivariable adjustment yielded an effectiveness of 22%. When Dr. Gershon and colleagues corrected for misclassification of vaccination status among people with COPD, the effectiveness was estimated to be 43%. Vaccine effectiveness did not vary significantly according to influenza season, nor did it vary significantly by patient-specific factors such as age, sex, influenza subtype, codiagnosis of asthma, duration of COPD, previous outpatient COPD exacerbations, previous COPD hospitalization, previous receipt of inhaled corticosteroids, and previous pneumonia.
One limitation of the study was the possibility that COPD was misclassified because not all participants underwent pulmonary function testing. In addition, the estimates of vaccine effectiveness in the present study are specific to the outcome of influenza hospitalization and may not be generalizable to vaccine effectiveness estimates of outpatient outcomes, said the investigators. Finally, Dr. Gershon and colleagues could not identify the type of vaccine received.
“Given that a large pragmatic randomized controlled trial evaluating influenza vaccination would be unethical, this is likely the most robust estimate of vaccine effectiveness for hospitalizations in the COPD population to guide influenza vaccine recommendations for patients with COPD,” wrote Dr. Gershon and colleagues.
An Ontario Ministry of Health and Long-Term Care Health Systems Research Fund Capacity Grant and a Canadian Institutes of Health Research operating grant funded this research. One investigator received grants from the Canadian Institutes of Health Research during the study, and others received grants from pharmaceutical companies that were unrelated to this study.
SOURCE: Gershon AS et al. J Infect Dis. 2019 Sep 24. doi: 10.1093/infdis/jiz419.
FROM JOURNAL OF INFECTIOUS DISEASES
Too few pregnant women receive both influenza and Tdap vaccines
according to a Morbidity and Mortality Weekly Report published by the Centers for Disease Control and Prevention.
The CDC recommends that all pregnant women receive the Tdap vaccine, preferably between 27 and 36 weeks’ gestation. The flu vaccine is recommended for all women at any point in pregnancy if the pregnancy falls within flu season. Women do not need a second flu shot if they received the vaccine before pregnancy in the same influenza season. Both vaccines provide protection to infants after birth.
“Clinicians caring for women who are pregnant have a huge role in helping women understand risks and benefits and the value of vaccines,” Anne Schuchat, MD, principal deputy director of the CDC, Atlanta, said in a telebriefing about the new report. “A lot of women are worried about taking any extra medicine or getting shots during pregnancy, and clinicians can let them know about the large data available showing the safety of the vaccine as well as the effectiveness. We also think it’s important to let people know about the risk of not vaccinating.”
Pregnant women are at higher risk for influenza complications and represent a disproportionate number of flu-related hospitalizations. From the 2010-2011 to 2017-2018 influenza seasons, 24%-34% of influenza hospitalizations each season were pregnant women aged 15-44, yet only 9% of women in this age group are pregnant at any point each year, according to the report.
Similarly, infants under 6 months have the greatest risk of hospitalization from influenza, and half of pertussis hospitalizations and 69% of pertussis deaths occur in infants under 2 months old. But a fetus receives protective maternal antibodies from flu and pertussis vaccines about 2 weeks after the mother is vaccinated.
Influenza hospitalization is 40% lower among pregnant women vaccinated against flu and 72% lower in infants under 6 months who received maternal influenza antibodies during gestation. Similarly, Tdap vaccination during the third trimester of pregnancy reduces pertussis infection risk by 78% and pertussis hospitalization by 91% in infants under 2 months.
“Infant protection can motivate pregnant women to receive recommended vaccines, and intention to vaccinate is higher among women who perceive more serious consequences of influenza or pertussis disease for their own or their infant’s health,” Megan C. Lindley, MPH, of the CDC’s Immunization Services Division, and colleagues wrote in the MMWR report.
In March-April 2019, Ms. Lindley and associates conducted an Internet survey about flu and Tdap immunizations among women aged 18-49 who had been pregnant at any point since August 1, 2018. A total of 2,626 women completed the survey of 2,762 invitations (95% response rate).
Among 817 women who knew their Tdap status during pregnancy, 55% received the Tdap vaccine. Among 2,097 women who reported a pregnancy between October 2018 and January 2019, 54% received the flu vaccine before or during pregnancy.
But many women received one vaccine without the other: 65% of women surveyed had not received both vaccines during pregnancy. Higher immunization rates occurred among women whose clinicians recommended the vaccines: 66% received a flu shot and 71% received Tdap.
“We’re learning a lot about improved communication between clinicians and patients. One thing we suggest is to begin the conversations early.” Dr Schuchat said. “If you begin talking early in the pregnancy about the things you’ll be looking forward to and provide information, by the time it is flu season or it is that third trimester, they’re prepared to make a good choice.”
Most women surveyed (75%) said their providers did offer a flu or Tdap vaccine in the office or a referral for one. Yet more than 30% of these women did not get the recommended vaccine.
The most common reason for not getting the Tdap during pregnancy, cited by 38% of women who didn’t receive it, was not knowing about the recommendation. Those who did not receive flu vaccination, however, cited concerns about effectiveness (18%) or safety for the baby (16%). A similar proportion of women cited safety concerns for not getting the Tdap (17%).
Sharing information early and engaging respectfully with patients are key to successful provider recommendations, Dr Schuchat said.
“It’s really important for clinicians to begin by listening to women, asking, ‘Can I answer your questions? What are the concerns that you have?’ ” she said. “We find that, when a clinician validates a patient’s concerns and really shows that they’re listening, they can build trust and respect.”
Providers’ sharing their personal experience can help as well, Dr Schuchat added. Clinicians can let patients know if they themselves, or their partner, received the vaccines during pregnancy.
Rates for turning down vaccines were higher for black women: 47% received the flu vaccine after a recommendation, compared with 69% of white women. Among those receiving a Tdap recommendation, 53% of black women accepted it, compared with 77% of white women and 66% of Latina women. The authors noted a past study showing black adults had a higher distrust of flu vaccination, their doctor, and CDC information than white adults.
“Differential effects of provider vaccination offers or referrals might also be explained by less patient-centered provider communication with black patients,” Ms. Lindley and associates wrote.
SOURCE: Lindley MC. MMWR Morb Mortal Wkly Rep. 2019 Oct 8. doi: 10.15585/mmwr.mm6840e1.
FROM MMWR TELEBRIEFING
Interventions significantly improve NICU immunization rates
according to a study in Pediatrics.
Investigators led by Raymond C. Stetson, MD, of the Mayo Clinic in Rochester, Minn., identified three root causes of underimmunization in a NICU at Mayo Clinic: providers’ lack of knowledge about recommended immunization schedules; immunizations not being ordered when they were due; and parental hesitancy toward vaccination. They addressed these causes with the following five phases of intervention: an intranet resource educating providers about vaccine schedules and dosing intervals; a spreadsheet-based checklist to track and flag immunization status; an intranet resource aimed at discussion with vaccine-hesitant parents; education about safety in providing immunization and review of material from the first three interventions; and education about documentation, including parental consent.
Over the project period, 1,242 infants were discharged or transferred from the NICU. The study included a 6-month “improve phase,” during which interventions were implemented, and a “control phase,” during which the ongoing effects after implementation were observed. At baseline, the rate of fully immunized infants in the NICU was only 56% by time of discharge or transfer, but during the combined improve and control phases, it was 93% with a P value of less than .001.
One of the limitations of the study is that the first three interventions were introduced simultaneously, which makes it hard to determine how much effect each might have had.
“Infants treated in NICUs represent a vulnerable population with the potential for high morbidity and mortality from vaccine-preventable infections,” the investigators wrote. “Our [quality improvement] effort, and others, demonstrate that this population is at risk for underimmunization and that immunization rates can be improved with a small number of interventions. Additionally, we were able to significantly decrease the number of days that immunizations were delayed compared to the routine infant vaccination schedule.”
There was no external funding for the study. One of the coauthors is on safety committees of vaccine studies for Merck. The other authors have no relevant financial disclosures.
SOURCE: Stetson R et al. Pediatr. 2019. doi: 10.1542/peds.2019-0337.
FROM PEDIATRICS
New York declares end to 2018 measles outbreak
New York State has reported the end of all active measles cases related to the initial outbreak in 2018, but the state is now responding to new, unrelated cases in four counties, according to the Centers for Disease Control and Prevention.
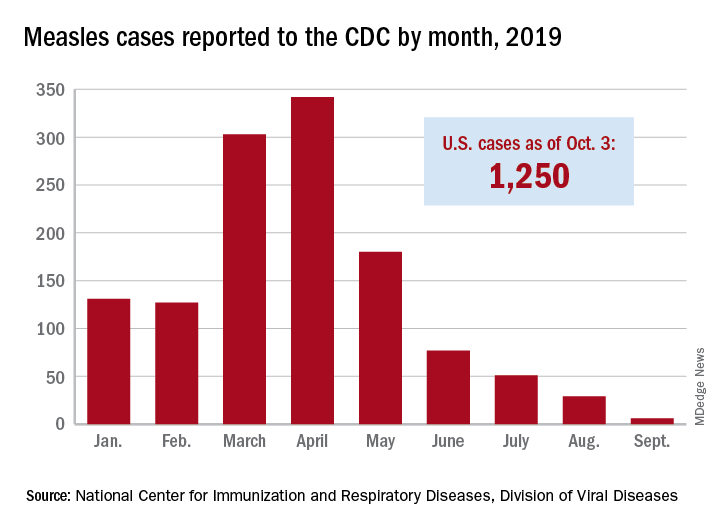
The new cases – two in Nassau County and one each in Monroe, Putnam, and Rockland counties – are “related to measles exposures from international travel but not affiliated with the 2018 outbreak,” the New York State Department of Health said in a written statement. Officials in Rockland County had declared its 2018 measles outbreak, which involved 312 cases in 2018 and 2019, over on Sept. 25.
. Of those cases, 1,163 (93%) were associated with 22 outbreaks, with the two largest occurring in New York City and Rockland County. “These two almost year-long outbreaks placed the United States at risk for losing measles elimination status,” the CDC said in a separate report, but “robust responses … ended transmission before the 1-year mark.”
New York State has reported the end of all active measles cases related to the initial outbreak in 2018, but the state is now responding to new, unrelated cases in four counties, according to the Centers for Disease Control and Prevention.
The new cases – two in Nassau County and one each in Monroe, Putnam, and Rockland counties – are “related to measles exposures from international travel but not affiliated with the 2018 outbreak,” the New York State Department of Health said in a written statement. Officials in Rockland County had declared its 2018 measles outbreak, which involved 312 cases in 2018 and 2019, over on Sept. 25.
. Of those cases, 1,163 (93%) were associated with 22 outbreaks, with the two largest occurring in New York City and Rockland County. “These two almost year-long outbreaks placed the United States at risk for losing measles elimination status,” the CDC said in a separate report, but “robust responses … ended transmission before the 1-year mark.”
Influenza update
2018-2019 season retrospective
Last year’s influenza season was longer than usual. Infections, as measured by the percentage of outpatient visits due to influenza-like illness, increased in early November 2018, peaked in early February to mid-March of 2019, and remained above baseline levels through mid-May.1,2 Ninety six percent of influenza-positive samples were influenza A,1 and 57% of those were H1N1.2 In the second half of the season, H3N2 became the predominant circulating virus and there was a genetic shift in this strain that caused a decrease in the effectiveness of influenza vaccines (FIGURE).1 The influenza-confirmed hospitalization rate was 65.3/100,000, with the highest rate (221.7/100,000) occurring among those 65 years of age and older.2 Of those hospitalized with influenza, 93% of adults and 55% of children had an underlying medical condition and 29% of women of childbearing age were pregnant.2

Morbidity and mortality from influenza during the 2018-2019 influenza season were moderate compared with previous years. Pneumonia and influenza mortality reached close to 8% of all deaths during the peak of the season (considered a modest peak), but stayed above the epidemic threshold for 10 weeks.2 There were 119 pediatric deaths.1 Overall, in the United States, there were an estimated 37 to 43 million influenza-related illnesses, 17 to 20 million flu-related medical visits, 531,000 to 647,000 flu-related hospitalizations, and 36,400 to 61,200 deaths.1
Influenza viral resistance to oseltamivir remained very low throughout the season for both A and B viruses.2
Vaccine effectiveness was subpar
The effectiveness of influenza vaccine last season was disappointing. When assessed using laboratory-confirmed medically attended influenza, the vaccine was 29% effective; when assessed by age group, the confidence intervals included 0 in ages 9 to 17 years and 50 years and older.3 In the age group 6 months to 8 years, the vaccine was 49% effective.3 The vaccine was not effective against the predominant H3N2 strain circulating. It was 25% effective in preventing hospitalization, with a lack of benefit seen in individuals ages 18 to 49 years and those 65 and older.3
Vaccination was associated with increased rates of hospitalizations from infections cause by H3N2. It is not known if this finding was due to chance, unstable results from small numbers, an unknown bias, or some biological cause not yet understood. This is a topic of ongoing research.
Effectiveness in preventing pediatric hospitalizations was estimated at 31%, again with no effectiveness against H3N2.3 The estimate of vaccine effectiveness in the United States was similar to that in Canada.2
While these results are much lower than desired, influenza vaccine did prevent an estimated 40,000 to 90,000 hospitalizations and decreased influenza-like illnesses by 44%.3
Continue to: A look at vaccine safety
A look at vaccine safety
Numerous studies of influenza vaccine safety were presented at the June 2019 meeting of the Advisory Committee on Immunization Practices (ACIP).4 These studies included assessments using the Vaccine Adverse Events Reporting System; the Vaccine Safety Datalink (VSD), which conducts ongoing rapid analysis of adverse events throughout the influenza season; and Food and Drug Administration (FDA)-sponsored studies of Medicare patients. These vaccine safety monitoring systems have been described in a prior Practice Alert.5
Possible vaccine reactions studied included Guillain-Barre Syndrome (GBS), anaphylaxis, encephalitis, Bell’s palsy, febrile seizures, and pregnancy-related adverse events such as miscarriage and congenital anomalies. While preliminary safety signals were detected for anaphylaxis, Bell’s palsy, febrile seizures, and GBS, a more in-depth investigation found no association of any adverse events with vaccination except for febrile seizures, with an attributable risk of 4.24/100,000 doses in children ages 6 to 23 months and 1.8/100,000 in those ages 24 to 59 months.4 The incidence of febrile seizures was similar to that of previous seasons and primarily occurred when the vaccine was administered in conjunction with another vaccine. A preliminary FDA analysis found a small elevated risk of GBS with high-dose trivalent inactivated vaccine, with an attributable risk of 0.98 per million doses, but this was not confirmed by the VSD analysis.4
What you need to know about the upcoming season
ACIP recommendations on influenza vaccines for 2019 to 2020 are essentially unchanged from last year.6 All individuals ages 6 months and older, who do not have a contraindication, should receive a flu vaccine in the fall of 2019. The composition of this season’s vaccine contains new H1N1 and H3N2 variants to more closely match the circulating strains. ACIP has updated or clarified 4 logistical issues in this year’s recommendations:
- Four inactivated-influenza vaccines are now available for children ages 6 to 35 months. Dose volumes are not the same for all 4 (TABLE).7
- Vaccination is now encouraged for September or later for those requiring only 1 dose of vaccine. Earlier administration can result in waning immunity by the end of the flu season, especially in older adults.7
- Children ages 6 months to 8 years may require 2 doses if they haven’t received any previous influenza vaccine, and the second dose should be given even if the child turns 9 between doses 1 and 2.7
- One adjuvanted influenza vaccine containing MF59—the trivalent inactivated influenza vaccine, Fluad—is approved for those ages 65 years and older. One note of caution is that licensed vaccines for other conditions also contain new nonaluminum adjuvants and there are few data on the safety and effectiveness of simultaneous or sequential administration of Fluad with the 2 novel nonaluminum adjuvant-containing vaccines. These vaccines are the recombinant zoster subunit vaccine (Shingrix), which contains the liposome-based adjuvant ASO1, and the recombinant hepatitis B surface antigen vaccine (Heplisav-B), which contains cytosine phosphoguanine oligodeoxynucleotide. Given the lack of data and the availability of other influenza vaccine options, ACIP advises that selecting a nonadjuvanted influenza vaccine may be the best option when an older adult needs both an influenza vaccine and either Shingrix or Heplisav-B. However, do not delay giving any vaccine if a specific alternate product is unavailable.7

All recommendations concerning the use of influenza vaccine for the 2019-2020 influenza season and a listing of all available influenza vaccine products can be found on the ACIP Web site (cdc.gov/vaccines/acip/index.html) or in the Morbidity and Mortality Weekly Report.8
1. Brammer L. Influenza Surveillance Update. Presented to the ACIP June 27, 2019. https://www.cdc.gov/vaccines/acip/meetings/downloads/slides-2019-06/flu-2-Brammer-508.pdf. Accessed August 21, 2019.
2. Hammond A, Hundal K, Laurenson-Shafer H, et al. Review of the 2018–2019 influenza season in the northern hemisphere. WHO Wkly Epidemiol Record. 2019;94:345-364.
3. Flannery B, Chung J, Ferdinands J, et al. Preliminary estimates of the 2018-2019 seasonal influenza vaccine effectiveness against medically attended influenza from three U.S. networks. Presented to ACIP June 27, 2019. https://www.cdc.gov/vaccines/acip/meetings/downloads/slides-2019-06/flu-3-flannery-508.pdf. Accessed August 21, 2019.
4. Shimabukuro T. End-of-season update: 2018-2019 influenza vaccine safety monitoring. Presented to the ACIP meeting June 27, 2019. https://www.cdc.gov/vaccines/acip/meetings/downloads/slides-2019-06/flu-4-Shimabukuro-508.pdf. Accessed August 21, 2019.
5. Campos-Outcalt D. Facts to help you keep pace with the vaccine conversation. J Fam Pract. 2019;68:341-346.
6. Campos-Outcalt D. CDC recommendations for the 2018-2019 influenza season. J Fam Pract. 2018;67:550-553.
7. Grohskopf L. Influenza work group considerations and proposed 2019-2020 season recommendations. Presented to the ACIP June 27, 2019. https://www.cdc.gov/vaccines/acip/meetings/downloads/slides-2019-06/flu-5-grohskopf-508.pdf. Accessed August 21, 2019.
8. Grohskopf LA, Alyanak E, Broder KR, et al. Prevention and control of seasonal influenza with vaccines: recommendations of the Advisory Committee on Immunization Practices —United States, 2019-20 influenza season. MMWR Recomm Rep. 2019;68:1-21.
2018-2019 season retrospective
Last year’s influenza season was longer than usual. Infections, as measured by the percentage of outpatient visits due to influenza-like illness, increased in early November 2018, peaked in early February to mid-March of 2019, and remained above baseline levels through mid-May.1,2 Ninety six percent of influenza-positive samples were influenza A,1 and 57% of those were H1N1.2 In the second half of the season, H3N2 became the predominant circulating virus and there was a genetic shift in this strain that caused a decrease in the effectiveness of influenza vaccines (FIGURE).1 The influenza-confirmed hospitalization rate was 65.3/100,000, with the highest rate (221.7/100,000) occurring among those 65 years of age and older.2 Of those hospitalized with influenza, 93% of adults and 55% of children had an underlying medical condition and 29% of women of childbearing age were pregnant.2
Morbidity and mortality from influenza during the 2018-2019 influenza season were moderate compared with previous years. Pneumonia and influenza mortality reached close to 8% of all deaths during the peak of the season (considered a modest peak), but stayed above the epidemic threshold for 10 weeks.2 There were 119 pediatric deaths.1 Overall, in the United States, there were an estimated 37 to 43 million influenza-related illnesses, 17 to 20 million flu-related medical visits, 531,000 to 647,000 flu-related hospitalizations, and 36,400 to 61,200 deaths.1
Influenza viral resistance to oseltamivir remained very low throughout the season for both A and B viruses.2
Vaccine effectiveness was subpar
The effectiveness of influenza vaccine last season was disappointing. When assessed using laboratory-confirmed medically attended influenza, the vaccine was 29% effective; when assessed by age group, the confidence intervals included 0 in ages 9 to 17 years and 50 years and older.3 In the age group 6 months to 8 years, the vaccine was 49% effective.3 The vaccine was not effective against the predominant H3N2 strain circulating. It was 25% effective in preventing hospitalization, with a lack of benefit seen in individuals ages 18 to 49 years and those 65 and older.3
Vaccination was associated with increased rates of hospitalizations from infections cause by H3N2. It is not known if this finding was due to chance, unstable results from small numbers, an unknown bias, or some biological cause not yet understood. This is a topic of ongoing research.
Effectiveness in preventing pediatric hospitalizations was estimated at 31%, again with no effectiveness against H3N2.3 The estimate of vaccine effectiveness in the United States was similar to that in Canada.2
While these results are much lower than desired, influenza vaccine did prevent an estimated 40,000 to 90,000 hospitalizations and decreased influenza-like illnesses by 44%.3
Continue to: A look at vaccine safety
A look at vaccine safety
Numerous studies of influenza vaccine safety were presented at the June 2019 meeting of the Advisory Committee on Immunization Practices (ACIP).4 These studies included assessments using the Vaccine Adverse Events Reporting System; the Vaccine Safety Datalink (VSD), which conducts ongoing rapid analysis of adverse events throughout the influenza season; and Food and Drug Administration (FDA)-sponsored studies of Medicare patients. These vaccine safety monitoring systems have been described in a prior Practice Alert.5
Possible vaccine reactions studied included Guillain-Barre Syndrome (GBS), anaphylaxis, encephalitis, Bell’s palsy, febrile seizures, and pregnancy-related adverse events such as miscarriage and congenital anomalies. While preliminary safety signals were detected for anaphylaxis, Bell’s palsy, febrile seizures, and GBS, a more in-depth investigation found no association of any adverse events with vaccination except for febrile seizures, with an attributable risk of 4.24/100,000 doses in children ages 6 to 23 months and 1.8/100,000 in those ages 24 to 59 months.4 The incidence of febrile seizures was similar to that of previous seasons and primarily occurred when the vaccine was administered in conjunction with another vaccine. A preliminary FDA analysis found a small elevated risk of GBS with high-dose trivalent inactivated vaccine, with an attributable risk of 0.98 per million doses, but this was not confirmed by the VSD analysis.4
What you need to know about the upcoming season
ACIP recommendations on influenza vaccines for 2019 to 2020 are essentially unchanged from last year.6 All individuals ages 6 months and older, who do not have a contraindication, should receive a flu vaccine in the fall of 2019. The composition of this season’s vaccine contains new H1N1 and H3N2 variants to more closely match the circulating strains. ACIP has updated or clarified 4 logistical issues in this year’s recommendations:
- Four inactivated-influenza vaccines are now available for children ages 6 to 35 months. Dose volumes are not the same for all 4 (TABLE).7
- Vaccination is now encouraged for September or later for those requiring only 1 dose of vaccine. Earlier administration can result in waning immunity by the end of the flu season, especially in older adults.7
- Children ages 6 months to 8 years may require 2 doses if they haven’t received any previous influenza vaccine, and the second dose should be given even if the child turns 9 between doses 1 and 2.7
- One adjuvanted influenza vaccine containing MF59—the trivalent inactivated influenza vaccine, Fluad—is approved for those ages 65 years and older. One note of caution is that licensed vaccines for other conditions also contain new nonaluminum adjuvants and there are few data on the safety and effectiveness of simultaneous or sequential administration of Fluad with the 2 novel nonaluminum adjuvant-containing vaccines. These vaccines are the recombinant zoster subunit vaccine (Shingrix), which contains the liposome-based adjuvant ASO1, and the recombinant hepatitis B surface antigen vaccine (Heplisav-B), which contains cytosine phosphoguanine oligodeoxynucleotide. Given the lack of data and the availability of other influenza vaccine options, ACIP advises that selecting a nonadjuvanted influenza vaccine may be the best option when an older adult needs both an influenza vaccine and either Shingrix or Heplisav-B. However, do not delay giving any vaccine if a specific alternate product is unavailable.7
All recommendations concerning the use of influenza vaccine for the 2019-2020 influenza season and a listing of all available influenza vaccine products can be found on the ACIP Web site (cdc.gov/vaccines/acip/index.html) or in the Morbidity and Mortality Weekly Report.8
1. Brammer L. Influenza Surveillance Update. Presented to the ACIP June 27, 2019. https://www.cdc.gov/vaccines/acip/meetings/downloads/slides-2019-06/flu-2-Brammer-508.pdf. Accessed August 21, 2019.
2. Hammond A, Hundal K, Laurenson-Shafer H, et al. Review of the 2018–2019 influenza season in the northern hemisphere. WHO Wkly Epidemiol Record. 2019;94:345-364.
3. Flannery B, Chung J, Ferdinands J, et al. Preliminary estimates of the 2018-2019 seasonal influenza vaccine effectiveness against medically attended influenza from three U.S. networks. Presented to ACIP June 27, 2019. https://www.cdc.gov/vaccines/acip/meetings/downloads/slides-2019-06/flu-3-flannery-508.pdf. Accessed August 21, 2019.
4. Shimabukuro T. End-of-season update: 2018-2019 influenza vaccine safety monitoring. Presented to the ACIP meeting June 27, 2019. https://www.cdc.gov/vaccines/acip/meetings/downloads/slides-2019-06/flu-4-Shimabukuro-508.pdf. Accessed August 21, 2019.
5. Campos-Outcalt D. Facts to help you keep pace with the vaccine conversation. J Fam Pract. 2019;68:341-346.
6. Campos-Outcalt D. CDC recommendations for the 2018-2019 influenza season. J Fam Pract. 2018;67:550-553.
7. Grohskopf L. Influenza work group considerations and proposed 2019-2020 season recommendations. Presented to the ACIP June 27, 2019. https://www.cdc.gov/vaccines/acip/meetings/downloads/slides-2019-06/flu-5-grohskopf-508.pdf. Accessed August 21, 2019.
8. Grohskopf LA, Alyanak E, Broder KR, et al. Prevention and control of seasonal influenza with vaccines: recommendations of the Advisory Committee on Immunization Practices —United States, 2019-20 influenza season. MMWR Recomm Rep. 2019;68:1-21.

Measles 2019: Most cases occurred in close-knit, undervaccinated communities

While 22 outbreaks were reported in 17 states during 2019, the majority of measles cases occurred in a pair of outbreaks that started in late 2018, one in New York City and the other in New York state. Theses two outbreaks, which occurred in underimmunized, close-knit communities, accounted for 934 (75%) of the 2019 total. An additional six outbreaks in similar communities accounted for nearly half of the remaining reported cases.
The overall median patient age was 6 years, with 31% being children aged 1-4 years, 27% being school-age children aged 5-17 years, and 29% were adults aged at least 18 years. However, when excluding the New York City (NYC) and New York state outbreaks, the median patient age was 19 years. Outbreak length also differed significantly between the NYC and New York state outbreaks, compared with all other outbreaks; the NYC outbreak lasted for 9.5 months, involving 702 patients from start to finish, the New York state outbreak lasted for 10.5 months and involved 412 cases.
The rate of patients who were either unvaccinated or had unknown vaccination status was similar in the New York outbreaks and in the other U.S. outbreaks, ranging from 87% to 91%. A total of 119 patients were hospitalized, 20% of whom were younger than 1 year; no deaths were reported. A total of 81 cases were internationally imported; the rate of patients who were unvaccinated or had unknown status in this group was 90%.
While most outbreaks in 2019 were similar to those previously seen, the outbreaks in NYC and New York state were more sustained for three reasons, the CDC investigators said: pockets of low vaccination coverage and variable vaccine acceptance, relatively high population density and closed social nature of the community, and repeated importations of measles cases among unvaccinated persons traveling internationally and returning to or visiting the affected communities.
“Public health authorities need to identify pockets of undervaccinated persons to prevent these outbreaks, which require substantial resources to control. A preventive strategy to build vaccine confidence is important, especially one that uses culturally appropriate communication strategies to offset misinformation and disseminate accurate information about the safety and importance of vaccination in advance of outbreaks,” the CDC investigators concluded.
The CDC investigators reported that they had no conflicts of interest.
[email protected]
SOURCE: Patel M et al. MMWR Morb Mortal Wkly Rep. 2019 Oct 4. doi: 10.15585/mmwr.mm6840e2.
FROM THE MMWR
Massachusetts tops state vaccination rankings
according to a new analysis from personal finance website WalletHub.
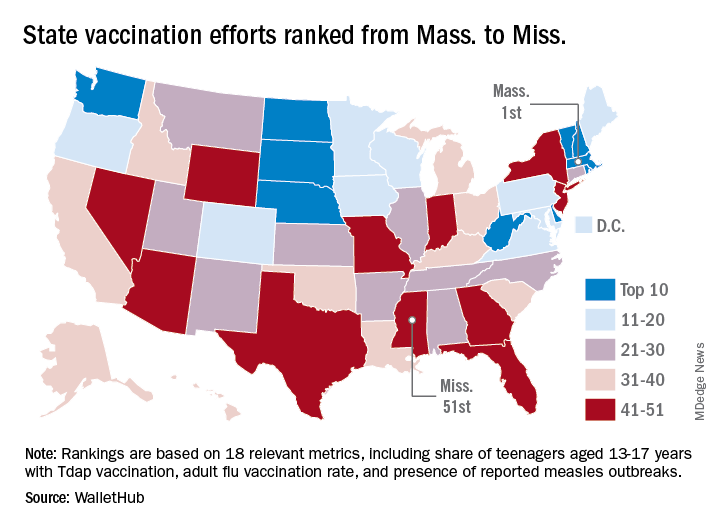
The Bay State’s top finish in the “children and teenagers immunization rates” category moved it ahead of Vermont in the overall rankings, which had the highest score in each of the other two broad categories – “adult and elderly vaccination rates” and “immunization uptake disparities and influencing factors” – but only finished 15th in child/teen immunization, Wallethub reported.
The state that ranked 51st in child/teen immunization – Mississippi – also finished 51st overall, behind every other state and Washington, D.C. The rest of the bottom five consisted of Texas (50th); Florida (49th), which ranked last in the adult/elderly category; Georgia (48th); and Indiana (47th). New Mexico, however, managed to show that last is not always least by earning a mid-pack overall rank of 30 despite its last-place showing in the disparities/influencing factors category, the WalletHub analysis showed.
Scores for the three broad categories were determined using 18 relevant metrics, including influenza vaccination rate in children aged 6 months to 17 years (1st, Rhode Island; 51st, Wyoming), share of adults aged 60 years and older with zoster vaccination (1st, Vermont; 51st, Mississippi), and share of population without health insurance coverage (1st, Massachusetts; 51st, Texas), WalletHub said.
“Each state should tailor its vaccines policy to its need, with an understanding that those needs may change,” Dorit Rubinstein Reiss of the University of California Hastings College of the Law, San Francisco, told WalletHub. When parents refuse to have their children vaccinated, it’s important to remember that “the state is not denying these children schooling. It is requiring that they be protected from disease first.”
according to a new analysis from personal finance website WalletHub.
The Bay State’s top finish in the “children and teenagers immunization rates” category moved it ahead of Vermont in the overall rankings, which had the highest score in each of the other two broad categories – “adult and elderly vaccination rates” and “immunization uptake disparities and influencing factors” – but only finished 15th in child/teen immunization, Wallethub reported.
The state that ranked 51st in child/teen immunization – Mississippi – also finished 51st overall, behind every other state and Washington, D.C. The rest of the bottom five consisted of Texas (50th); Florida (49th), which ranked last in the adult/elderly category; Georgia (48th); and Indiana (47th). New Mexico, however, managed to show that last is not always least by earning a mid-pack overall rank of 30 despite its last-place showing in the disparities/influencing factors category, the WalletHub analysis showed.
Scores for the three broad categories were determined using 18 relevant metrics, including influenza vaccination rate in children aged 6 months to 17 years (1st, Rhode Island; 51st, Wyoming), share of adults aged 60 years and older with zoster vaccination (1st, Vermont; 51st, Mississippi), and share of population without health insurance coverage (1st, Massachusetts; 51st, Texas), WalletHub said.
“Each state should tailor its vaccines policy to its need, with an understanding that those needs may change,” Dorit Rubinstein Reiss of the University of California Hastings College of the Law, San Francisco, told WalletHub. When parents refuse to have their children vaccinated, it’s important to remember that “the state is not denying these children schooling. It is requiring that they be protected from disease first.”